
QCV Pty Ltd Accommodation Village Sarina, Queensland · Page 2 of 25 EXECUTIVE SUMMARY QCV Pty Ltd...
118
Page 1 of 25 Alpha Concepts Pty Ltd ACN: 108 153 242 Process Engineering, Process Management, Project Management and Environmental Management Solutions PO Box 2055, Gladstone Qld 4680 Telephone: 07 4979 4001 Facsimile: 07 4979 3009 QCV Pty Ltd Accommodation Village Sarina, Queensland On-Site Wastewater Assessment: Development Approval By: Darrin Marxsen BE (Chem), Grad Dip Mgt, Grad Cert Env Mgt, MProject Mment (Trans) MIEAust CPEng, CEnv CSci CEng MIChemE, RPEQ 6953 Principal Resource Alpha Concepts Pty Ltd Document No: DA/QCVS/0512/1 Tuesday, 25 September 2012
-
Upload
nguyenhanh -
Category
Documents
-
view
218 -
download
0
Transcript of QCV Pty Ltd Accommodation Village Sarina, Queensland · Page 2 of 25 EXECUTIVE SUMMARY QCV Pty Ltd...

Page 1 of 25
Alpha Concepts Pty Ltd ACN: 108 153 242
Process Engineering, Process Management, Project Management and Environmental Management Solutions
PO Box 2055, Gladstone Qld 4680 Telephone: 07 4979 4001 Facsimile: 07 4979 3009
QCV Pty Ltd
Accommodation Village Sarina, Queensland
On-Site Wastewater Assessment: Development Approval
By: Darrin Marxsen
BE (Chem), Grad Dip Mgt, Grad Cert Env Mgt, MProject Mment (Trans) MIEAust CPEng, CEnv CSci CEng MIChemE, RPEQ 6953
Principal Resource Alpha Concepts Pty Ltd Document No: DA/QCVS/0512/1 Tuesday, 25 September 2012
megana
Received (Manual Date)
Page 2 of 25
EXECUTIVE SUMMARY QCV Pty Ltd is seeking a Development Approval for a Workers Accommodation Village and Site Offices at Armstrong Road, Sarina. The proposed development is via two stages, with the final site development incorporating accommodation for 600 people and offices viewed as sustaining up to 140 persons. As the site is not serviced by a sewer, there is the requirement for operation under an Environmental Relevant Activity, associated with on-site Sewage Treatment, having a peak design of greater than 100 Equivalent Person and less than 1500 Equivalent Persons; ERA 63 2(b). The site was previously utilised for workers accommodation in 2008 with incorporation of a site Dam used for collection and storage of Class B treated water for irrigation of the Sarina Golf Course. This proposal also includes the use of the existing Dam for treated water storage and irrigation of Sarina Golf Course. Recommendations have also been made in regards to the irrigation of treated effluent so as to conform to current accepted practices. The proposed treatment plant is rated at 165,000 litres per day peak capacity, at a treated water quality analogous to Class A. This capacity exceeds the maximum calculated wastewater generation rate for the site. MEDLI analysis has yielded the requirement for 8 ha of land application area to sustainably irrigate the site’s production of treated water. As Sarina Golf course exceeds 19.5 ha in area, the impact on the land is viewed as being further reduced. The additional irrigation rate required by the Golf course relative to the treated wastewater addition to the Dam is likely to maintain the Dam’s level low minimising the frequency of overtopping events As the ground water condition associated with the Dam’s operation is unknown a proposal has been raised to incorporate site monitoring of ground water via analysis for the appropriate water characteristics from three monitoring bores. A suitable testing regime has been proposed for the ongoing performance analysis of the sewage treatment plant. Based on the level of commitment given, it is recommended that approval be granted for the development proposed by QCV Pty Ltd.

Page 3 of 25
Table of Contents Contents Page Number Executive Summary 2 1.0 Introduction 5 2.0 Project Description 5 3.0 Previous Site Approval and Activity 8 4.0 Site Wastewater Treatment 8 4.1 Wastewater Hydraulic Rates 8 4.2 Current Treatment Plant Capability 9 4.3 Wet Weather Storage and Management 10 4.4 Sludge and Waste Disposal 11 4.5 Plant Alarming 12 4.6 Treated Water Standard and Monitoring 13 4.7 Operator Training 14 4.8 Operation and Maintenance 14 4.9 Sewage Treatment Plant Layout 15 4.10 Storm Water Management and Process Containment 18 5.0 Land Application and MEDLI analysis 19 5.1 MEDLI analysis 19 5.2 Land Application and Treated Effluent 22 6.0 Environmental Monitoring 23 7.0 Conclusions and Recommendations 24 Appendix 1 – Treatment Plant Details Appendix 2 – STP Layout Drawings Appendix 3 – MEDLI Input and Output Summaries Appendix 4 – Site Soil Analysis
Page 4 of 25
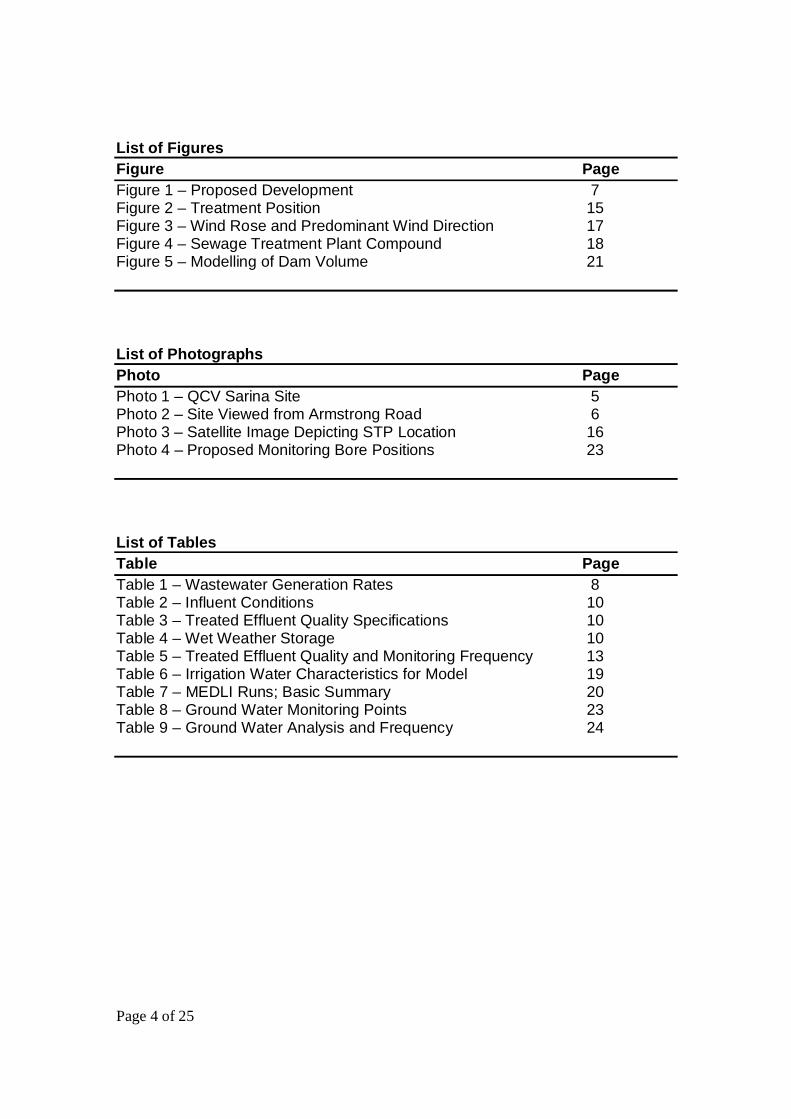
List of Figures Figure Page Figure 1 – Proposed Development 7 Figure 2 – Treatment Position 15 Figure 3 – Wind Rose and Predominant Wind Direction 17 Figure 4 – Sewage Treatment Plant Compound 18 Figure 5 – Modelling of Dam Volume 21 List of Photographs Photo Page Photo 1 – QCV Sarina Site 5 Photo 2 – Site Viewed from Armstrong Road 6 Photo 3 – Satellite Image Depicting STP Location 16 Photo 4 – Proposed Monitoring Bore Positions 23 List of Tables Table Page Table 1 – Wastewater Generation Rates 8 Table 2 – Influent Conditions 10 Table 3 – Treated Effluent Quality Specifications 10 Table 4 – Wet Weather Storage 10 Table 5 – Treated Effluent Quality and Monitoring Frequency 13 Table 6 – Irrigation Water Characteristics for Model 19 Table 7 – MEDLI Runs; Basic Summary 20 Table 8 – Ground Water Monitoring Points 23 Table 9 – Ground Water Analysis and Frequency 24

Page 5 of 25
1.0 Introduction QCV Pty Ltd has enlisted the services of Alpha Concepts Pty Ltd to compile information so as to facilitate the Development Approval for an accommodation and offices site at Sarina, Queensland. As the site is unsewered and requires the operation of an onsite wastewater treatment facility, application is made in regards to an Environmentally Relevant Activity, ERA 63 2(b). It is to this respect that QCV Pty Ltd wishes to demonstrate that it is adhering to the requirements of DERM and Mackay Regional Council in respect to the management and operation of the site relating to the proposed development and this environmental activity. This document details information regarding the Site’s wastewater treatment operation and compliance with the Environmental Protection Act, Environmental Guidelines and Regulations, and Local Government Guidelines and Regulations. 2.0 Project Description The location of the development proposed by QCV Pty Ltd is the Armstrong Road Site, neighbouring the Sarina Golf Course, Sarina; identified as Lot 1, RP 726644. The site is approximated in the following satellite image.
Photo 1 – QCV Sarina Site
The satellite image indicates that the site was previously utilised for workers accommodation, however, the site is currently not in use. The following photograph depicts the site devoid of activity.

Page 6 of 25
Photo 2 – Site viewed from Armstrong Road, looking north
The project involves a two stage development with the first stage being a peak accommodation occupancy level of 402 persons. Stage 1 involves 49 blocks of 2 x 3 bed accommodation buildings and nine blocks of buildings with 4 x 3 accommodation sites. Stage 1 development is also inclusive of an Office Block and ancillary facilities such as kitchen and dining, laundry and recreational facilities. Stage 2 of the project proposal involves expansion of the Stage 1 infrastructure to include a an addition of 198 rooms consisting of a single 2 x 3 Bed accommodation buildings and 16 buildings with 4 x 3 accommodation sites. Although the infrastructure and wastewater generation rate will be via two stages of development, the wastewater treatment and treated water handling will be developed for the full stage loading, that is Stage 1 and Stage 2 combined. The basis of wastewater treatment system design will be accommodation for 600 persons and the wastewater load generated by the site Offices, estimated at a peak of 140 persons. The following figure depicts the proposed site development.

Page 7 of 25
ARMSTRONG BEACH ROAD
EM
ERGEN
CY
VEH
ICLE
ACCESS
ROAD
EM
ER
GE
NC
Y
VE
HI C
LE
A
CC
ES
S
RO
AD
1.5m
WID
E
CO
VER
ED
PATH
1.5m
WID
E
COVER
ED
PATH
1.5m
WID
E
COVER
ED
PATH
1.5m
WID
E
CO
VERED
PATH
1.5m
WID
E
COVER
ED
PATH
1.5m
WID
E
COVER
ED
PATH
1.5m
WID
E
CO
VERED
PATH
1.5m
WID
E
COVERED
PATH
1.5m
WID
E
COVERED
PATH
1. 5
m
WID
E
COVER
ED
PAT
H
1. 5
m
WID
E
COVER
ED
PAT
H
1.5m
WID
E
COVERED
PATH
1.5m
WID
E
CO
VER
ED
PAT
H
1. 5
m
WID
E
COVERE
D
PAT
H
1.5m WIDE COVERED PATH
T-A
T-A
T-A
T-A
T-B
T-B
T-A
T-AT-B
T-B
T-B
T-B
T-B
T-A
T-A
T-A
T-A
T-B
T-B
T-A
T-A
T-A
T-A
T-A
T-A
T-A
T-A
T-A
T-A
T-A
T-A T-A
T-A
T-A
T-A T-A
T-A
T-A
T-A T-A
T-A
T-A
T-AT-A
T-AT-A
T-A
T-A
T-A
T-A
T-A
T-A
T-AT-A
T-A
T-A
T-A
T-A
DIN
ING
DIN
ING
RECHALL
GYM
ADMIN
LD
RY
LD
RY
LDRY
KITCHEN/DINING
OFFICE BUILDINGT-BT-BT-BT-B
T-B T-B T-B T-B
T-BT-BT-BT-B
T-A T-B T-B T-B T-BDINING
RECHALLL
DR
Y
LD
RY
LDRY
LDRY
LDRY4
0
PA
RK
ING
B
AY
S
40
PA
RK
ING
B
AY
S
40
PA
RK
ING
B
AY
S
40
PA
RK
ING
B
AY
S74 PARKING
BAY62 PARKING BAY
17 PARKING BAY
ARMSTRONG
BEACH
ROAD
1173
6 m
8 000
m
33525 m
6000 m6000 m
6000 m
BEET
1034
7 m
BU
S
ZO
NE
STP
Figure 1 – Proposed Development

Page 8 of 25
3.0 Previous Site Approval and Activity The Dam that is featured in the lot has been utilised for the storage of treated water from the previous accommodation site and has been utilised for the storage of treated water from the Sarina’s Municipal Wastewater Treatment Plant. The previous site activity was covered by a Certificate of Registration number ENRE00776108 which was inclusive of the Environmentally Relevant Activity 63 2(b). The permit covering this ERA, numbered IPDE00965508 set the treated wastewater standards analogous to that of Class B, with total Nitrogen and total Phosphorous concentrations of 30mg/l and 15 mg/l respectively. As will be indicated in the following sections of this document, the proposed treated wastewater standard for the site will be analogous to that of Class A. The site Dam is utilised and maintained by the Sarina Golf Club as the source of irrigation water for the Golf Course. It is proposed that the use of treated water from the Dam continue as per current practice. 4.0 Site Wastewater Treatment The following sections depict the calculation of wastewater generation rates, sizing of Sewage Treatment Plant (STP), proposed treated water quality, plant operation, maintenance and monitoring. 4.1 Wastewater Hydraulic Rates As described earlier, the proposed development involves two stages; the following table depicts the wastewater generation rate for the different contributors whether that is the accommodation levels for each stage or the wastewater load generated by the Site Offices. Table 1 – Wastewater Generation Rates
Wastewater Source
Maximum Number
of persons
Peak Wastewater Generation
(l/person/day)
Average Wastewater Generation
(l/person/day)
Peak Wastewater Generation
(litres / day)
Average Wastewater Generation
(litres / day)
Stage 1 Accommodation 402 250 200 100500 80400 Stage 2 Accommodation 198 250 200 49500 39600
Site Offices 140 60 30 8400 4200 Total 740 158400 124200
The Site Office wastewater generation rate per person is lower than that for the accommodation sites as this wastewater generation is due to non-resident occupancy.

Page 9 of 25
The Stage 1 development would incorporate both the Stage 1 accommodation and the Site Offices wastewater generation. This yields a peak wastewater generation rate for Stage 1 of 108,900 litres per day and an average wastewater generation rate of 84,600 litres per day. Stage 2 wastewater generation rates have been calculated at a peak rate of 158,400 litres per day and at an average rate of 124,200 litres per day. It should be noted that the peak and average wastewater generation rates have been calculated at 100% occupancy, which in practice is expected to be lower at a more realistic occupancy rate of 75%. The specified design for the site Sewage Treatment Plant has been set at a Peak Capacity of 165,000 litres per day. 4.2 Sewage Treatment Plant Although Stage 1 will be implemented immediately and Stage 2 may follow some time after, the commitment has been made by QCV Pty Ltd to immediately install the 165,000 litres per day Class A treatment plant. Appendix 1 represents the proposed Ozzi-Kleen Sewage Treatment Plant. It should be noted that alternate treatment plant suppliers maybe utilised at the time of construction; however, commitment is made that the treatment plant installed will meet with peak hydraulic flow and treated water specifications. For the purpose of this assessment the Ozzi-Kleen Sewage Treatment Plant will be utilised as the basis. In summary, the Ozzi-Kleen process is a batch style activated sludge process utilising aeration, settling and decanting within the major process vessels. The batch activated sludge process or SBR (Sequence Batch Reactor) utilises settling time and associated system oxygen level changes and sludge age to facilitate denitrification. Phosphate levels in the treated water are controlled via biological assimilation and chemical dosing. To moderate the influent flow the proposed sewage treatment plant utilises a Balance Tank. Appendix 1 also indicates a more detailed process description of the treatment system. The fat oil and grease loading of the treatment system is to be managed by the installation of grease interceptors fitted to the kitchen waste. These grease interceptors will be cleaned out by a licence contractor at the required frequency to maintain STP influent fat, oil and grease levels within the specifications given in Table 2. The primary disinfection for the treatment system is via chlorination.

Page 10 of 25
The process generates sludge that requires wasting, which will be removed from site via a licensed contractor. Sludge handling and wasting is discussed in greater detail in a following section. The influent conditions are set in Table 2, as follows. Table 2 – Influent Conditions
Influent Parameter Units Value BOD mg/l < 400
Total Suspended Solids mg/l < 350 Total Nitrogen mg/l < 110
Total Phosphorous mg/l < 25 Fats Oil and Grease mg/l < 75
pH pH units 6 to 8.5 Table 3 represents the treated water quality of the proposed treatment plant to be implemented at site, for a peak hydraulic loading of 165,000 litres per day. Table 3– Treated Effluent Quality Specification
Treated Effluent Parameter
Units Value
BOD mg/l < 10 Total Suspended Solids mg/l < 10
Total Nitrogen mg/l < 10 Total Phosphorous mg/l < 3 Fats Oil and Grease mg/l < 5
pH pH units 6.5 to 8.5 Thermotolerant Coliforms Cfu/100 ml <10
Conductivity µS/cm <1500 Free Chlorine mg/l 0.5 to 2.0
As it is proposed that the irrigation of treated effluent be managed with appropriate distribution to the Golf Course and the halting of irrigation during rainfall, it is proposed that current dam be utilised for wet weather storage. 4.3 Wet Weather Storage and Management The wet weather storage volume is calculated based on a dam surface area of 1.9 ha and an average operational depth of 1 meter. This yields and operating volume of about 19 ML. Table 4 indicates average and peak storage times based on the estimated Dam volume. Table 4 – Wet Weather Storage
Development Stage Stage 1 Stage 2 Storage Capacity at Average Flow Condition 225 days 153 days
Storage Capacity at Peak Flow Condition 174 days 120 days

Page 11 of 25
It is proposed that the wet weather storage be operated with a freeboard of 0.5 m. As the dam’s surface area increases with increase in depth of storage it is calculated that the full dam including freeboard allowance is of the order of 29 ML. It should be noted that the volumes calculated are based on external dam characteristics and that actual volumes have not been accurately determined. The calculated volumes indicate significant storage times, well in excess of the typical allowance for wet weather storage. It has been stated that the Municipality’s addition to the Dam is to be stopped and that the only addition to the dam will be from the proposed STP, inundation and surface run-off. As current water use from the dam from the Golf Course exceeds net inputs and that the addition of treated water from the STP will be less than historical Municipality additions, it is expected that the dam’s inventory will decrease over time. The MEDLI analysis performed within this assessment has included the modelling of the Wet Weather Storage Dam. The recommended practice to be imposed on the Golf course is to cease irrigation during rain events of greater than 1 mm/d and to use the Dam as wet weather storage. 4.4 Sludge and Waste Disposal The activated sludge process produces waste sludge and as a result needs to be disposed of as an operational function. In the proposed plant, sludge is waste to a dedicated holding tank. Sludge generation rates are dependant on the site’s wastewater hydraulic rate, influent BOD and nutrient concentrations. At full plant capability it is estimated that a sludge bleed rate of between 200 and 1000 litres per day would be required. Commitment is given that all sludge collected will be disposed of via a licensed contractor and that all disposal certificates will be kept for site records. Other than sludge disposal, the only other specific waste from the treatment system is the large solids that are collected via the system’s inlet screen. This material will be collected, bagged and disposed of via a licensed contractor.

Page 12 of 25
4.5 Plant Alarming and Control The Ozzi-Kleen Plant comes fitted with its own PLC control and alarm system to ensure system functionality. One of two options will be implemented to provide protection against a loss of power event and loss of alarm indication. The first option that will be considered is provision for backup power generation to enable function of critical high level alarm systems. The second option will be provision of an alternate uninterruptable power supply for supply of power to critical high level alarm systems. The Critical Alarm Systems that will be covered by alternate power supply in the event of site power loss are as follows:
Influent pumping stations, duplicated high level alarm Balance Tanks duplicated high level alarm STP critical alarms.
In addition to backup power supply to critical alarm systems and plant function, the influent pumping system will have provision for alternate power supply by site generator sufficient to power at least one of the two influent pumps. Redundant pumping is supplied to maintain hydraulic throughput and the following pumping systems have pump duplication:
Influent pumping Treatment Plant Balance Tank pumping Waste Sludge Pumping Filtration pumping Treated Water pumping

Page 13 of 25
4.6 Treated Water Standard and Monitoring As previously stated, the treated water produced by the proposed sewage treatment plant is analogous to Class A at the following quality guidelines. It is proposed that the frequency and type of analysis depicted in Table 5 be adopted for the site: Table 5 – Treated Effluent Quality Specification and Monitoring Frequency
Treated Effluent Parameter
Units Value Monitoring Frequency
BOD mg/l < 10 Fortnightly for first two months then Monthly
Total Suspended Solids mg/l < 10 Fortnightly for first two months then Monthly
Total Nitrogen mg/l < 10 Fortnightly for first two months then Monthly
Total Phosphorous mg/l < 3 Fortnightly for first two months then Monthly
Thermotolerant Coliforms Cfu/100 ml <10 Fortnightly for first two months then Monthly
Dissolved Oxygen mg/l >2 Fortnightly for first two months then Monthly
Fats Oil and Grease mg/l < 5 Monthly pH pH units 6.5 to 8.5 Weekly
Conductivity µS/cm <1500 Weekly Free Chlorine mg/l 0.5 to 2.0 Weekly
The first six anolytes have been set at a monitoring frequency of every fortnight for the first two months, and then reduced in frequency to monthly once the system has demonstrated consistent attainment of treated water quality. If at any time one of the first six analyses listed in Table 5 exceeds specification, analysis frequency will revert to a Fortnightly basis until stable consistent operation is demonstrated. Performance monitoring of treated water quality will be performed on the fortnightly / monthly basis by a suitable qualified, independent party. Water analysis other than site monitoring of pH, Conductivity and Free Chlorine concentration will be performed by an NATA certified laboratory. The analysis of pH, free chlorine and conductivity will be performed by site personnel on a weekly basis. Free chlorine will be analysed using a US EPA approved or similarly certified test method.

Page 14 of 25
4.7 Operator Training A condition of the purchase and installation of the proposed Ozzi-Kleen treatment system is supply of full operating and maintenance information. From the treatment plant operating information and the relating conditions in the approval, a comprehensive training package will be developed. Utilising the site specific training package, training will be conducted with all site personnel involved with the operation of the sewage treatment plant, treated water, and wet weather storage. Commitment is given that any new personnel involved with operation of the site’s wastewater treatment facility will receive appropriate training. All documentation relating to development approval, operation and maintenance of the site’s sewage treatment plant will be made readily available to site Operators. 4.8 Operation and Maintenance The operation of the site Sewage Treatment Plant will be in accordance with the supplier’s specifications. Equipment will be maintained in full functionality as per supplier recommendations. Specific maintenance tasks will be conducted either by the supplier of the treatment facility or a suitably qualified person. Typical maintenance checks performed by Site Operators are envisaged as follows. Detailed check lists and operator log sheets will be developed based on sewage treatment plant supplier recommendations and terms of development approval.
1. No warning lights or alarms are active. 2. All pumps and blowers are functional. 3. Aeration tanks and decant systems are fully functional. 4. No sludge blanketing is evident. 5. Activated sludge concentrations are within acceptable ranges. 6. Treated water analysis is within acceptable ranges. 7. No leaks are evident. 8. Inventory of wet weather storage is recorded. 9. Treated water volumes are recorded.

Page 15 of 25
4.9 Sewage Treatment Plant Layout The Ozzi-Kleen treatment plant has been physically positioned so as to shield the treatment system from view and to mitigate noise and odour generation. The western border of the treatment plant is adjacent to vacant land associated with the Sarina Golf Course. The southern border faces Armstrong Beach Road with a separation distance of more than 130 meters. The following figure and photograph depicts the proposed positioning of the Sewage treatment Plant. The highest noise generator associated with the operation of the treatment plant are the Blowers rated at 78.5 dB (A); however, are enclosed within the Plant yielding further noise reduction. The eastern, western and southern boundaries of the Sewage Treatment Plant compound has been designed with a vegetation screen adding further visual and noise screening. The treatment plant has been located to the west of the site dam, adjacent to the easement access from the Golf Course; as depicted in the following figure and Appendix 2.
N
1RP726644
1 RP8
5263
3
179 deg 46' 10"
144 deg 12' 25"
221 d
eg 10
' 10"
101.2
68
1.9 haSewageTreatmentPlantApproximateLocation
N
Blowers
Sew ageTreat m entP lant
4 m
37 m
135 m
Figure 2 – Treatment Plant Position The following satellite image also depicts the proposed location of the sewage treatment plant compound.
STP

Page 16 of 25
Photo 3 – Satellite Image Depicting STP Location The Sewage Treatment Plant Compound consists of a number of notable aspects listed as follows and as depicted in Appendix 2 and Figure 3:
1. Fenced Compound – A fence line that restricts access of public. A typical fence viewed as acceptable for this function is a chain mesh fence to a height of 2.0 meters.
2. Access Gates – The fence line will require suitable access gates; the figure depicts three gates, one in the north and eastern fence lines for person access and one in the southern fence line to allow truck access for sludge removal and maintenance of large plant items.
3. Stormwater Diversion – Earthen stormwater diversion position from the north down the eastern and western sides.
4. Level area for Sewage Treatment Plant. 5. Vegetation screens of at least 6 meters width on the eastern, western and
southern boundaries of the Sewage Treatment Plant Compound. 6. Safety signage.
In regards to noise emission, the blowers are installed within the containerised arrangement and have a minimum separation distance from the compound perimeter of 16 meters.
STP Location

Page 17 of 25
Under normal conditions the odours released from the proposed sewage treatment plant should be analogous to a non- offensive earthly smell. Upsets in process function can yield odour emission. The regular operation and maintenance of the Sewage Treatment Plant by trained and competent personnel will prevent odour emission. The wind rose for the area indicates the prevailing wind as south to south-east resulting in odour plume release in the direction of the wet weather storage pond or towards the Gulf course. It is expected that there would be significant dilution by the property boundary.
Figure 3 – Wind Rose and Prevailing Wind Direction The following figure represents the concept level design for the Sewage Treatment Plant Compound.
Page 18 of 25
N
Proposed Gate for STPAccessEarthen Road
Access
Earth
en R
oad
Acce
ss
Earthen Road Access
0.5 m height, 1 to 2 meter wide earthen storm water diversion
Level Cut and Fill Level Area
Leve
l Cut
and
Fill
Leve
l Are
a
1meter to 5 meter high vegetation screen
14 m
6 m
8 m
Blowers
Note measurements are an example of proposed installationPhysical installation may vary; however, are to maintain withphilosophy of vegetation screening, fenced compound androad access for sludge removal and repair of STP.
The drawing represents concept level design only
SewageTreatmentPlant
Culvert
Culvert
Pers
onne
l Acc
ess
38 m
33 m
6 m
20 m
4 m
Easment Access to Site Dam
Proposed Gate for STPAccess
Culvert
Culvert
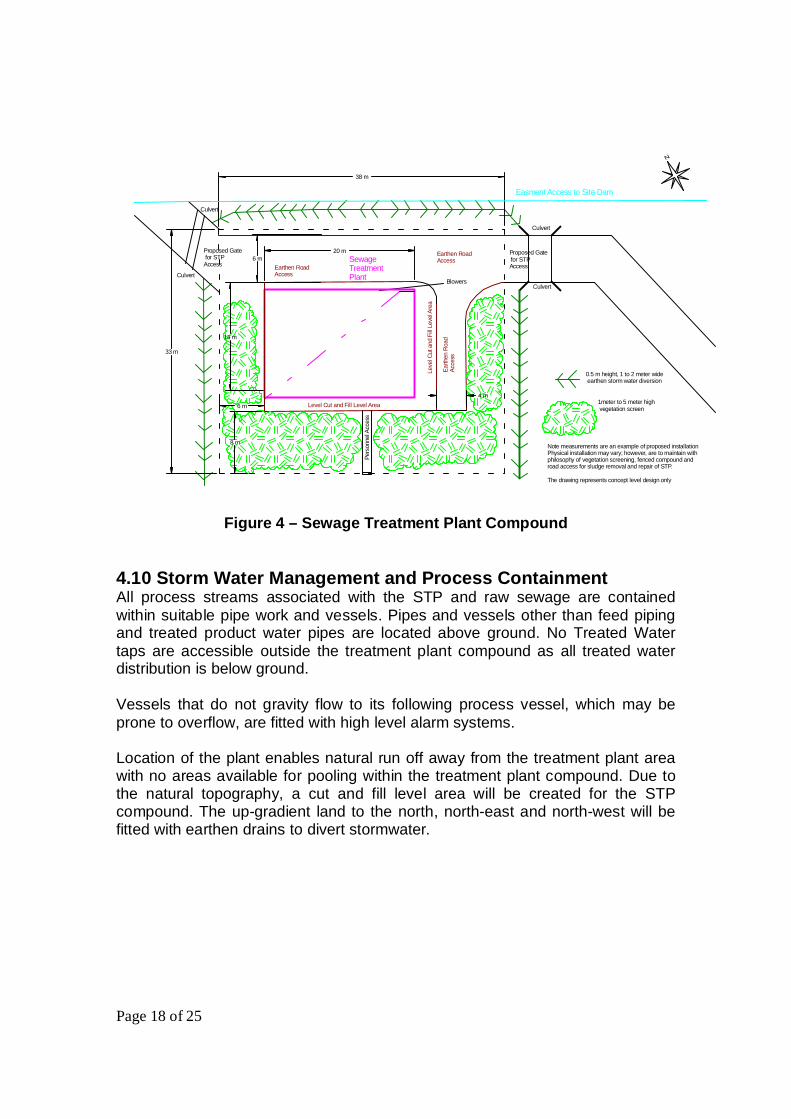
Figure 4 – Sewage Treatment Plant Compound
4.10 Storm Water Management and Process Containment All process streams associated with the STP and raw sewage are contained within suitable pipe work and vessels. Pipes and vessels other than feed piping and treated product water pipes are located above ground. No Treated Water taps are accessible outside the treatment plant compound as all treated water distribution is below ground. Vessels that do not gravity flow to its following process vessel, which may be prone to overflow, are fitted with high level alarm systems. Location of the plant enables natural run off away from the treatment plant area with no areas available for pooling within the treatment plant compound. Due to the natural topography, a cut and fill level area will be created for the STP compound. The up-gradient land to the north, north-east and north-west will be fitted with earthen drains to divert stormwater.
Page 19 of 25
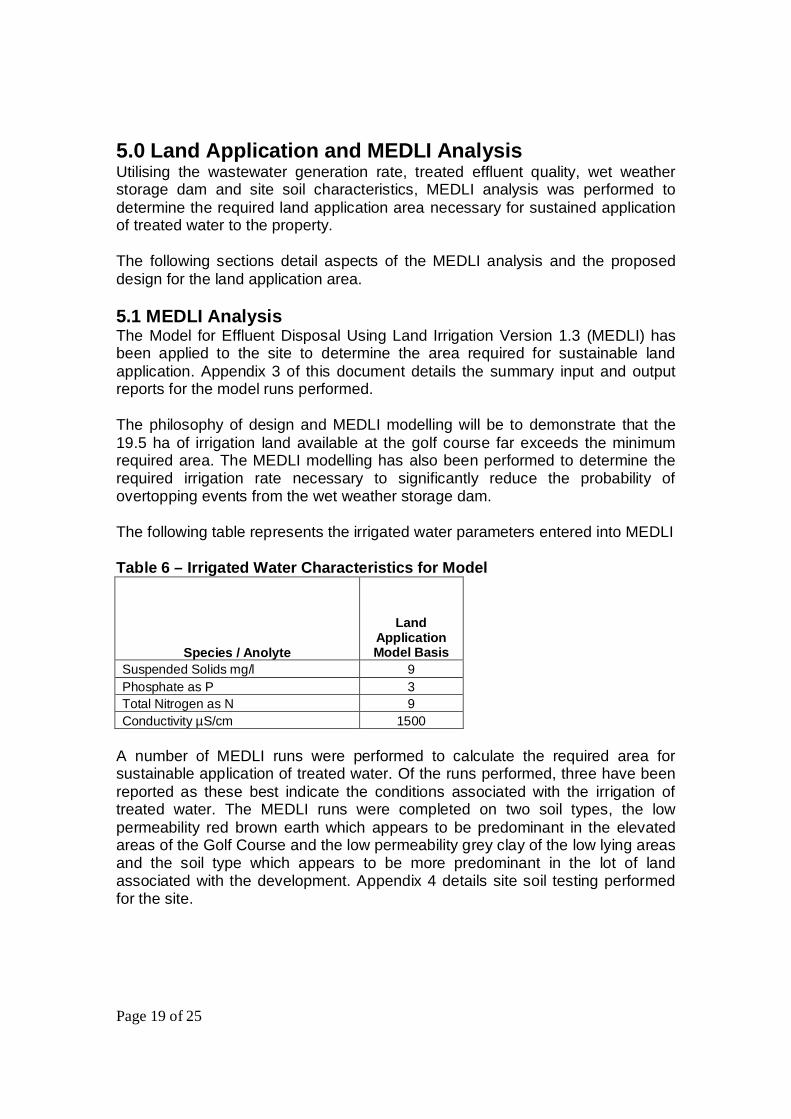
5.0 Land Application and MEDLI Analysis Utilising the wastewater generation rate, treated effluent quality, wet weather storage dam and site soil characteristics, MEDLI analysis was performed to determine the required land application area necessary for sustained application of treated water to the property. The following sections detail aspects of the MEDLI analysis and the proposed design for the land application area. 5.1 MEDLI Analysis The Model for Effluent Disposal Using Land Irrigation Version 1.3 (MEDLI) has been applied to the site to determine the area required for sustainable land application. Appendix 3 of this document details the summary input and output reports for the model runs performed. The philosophy of design and MEDLI modelling will be to demonstrate that the 19.5 ha of irrigation land available at the golf course far exceeds the minimum required area. The MEDLI modelling has also been performed to determine the required irrigation rate necessary to significantly reduce the probability of overtopping events from the wet weather storage dam. The following table represents the irrigated water parameters entered into MEDLI Table 6 – Irrigated Water Characteristics for Model
Species / Anolyte
Land Application Model Basis
Suspended Solids mg/l 9 Phosphate as P 3 Total Nitrogen as N 9 Conductivity µS/cm 1500
A number of MEDLI runs were performed to calculate the required area for sustainable application of treated water. Of the runs performed, three have been reported as these best indicate the conditions associated with the irrigation of treated water. The MEDLI runs were completed on two soil types, the low permeability red brown earth which appears to be predominant in the elevated areas of the Golf Course and the low permeability grey clay of the low lying areas and the soil type which appears to be more predominant in the lot of land associated with the development. Appendix 4 details site soil testing performed for the site.
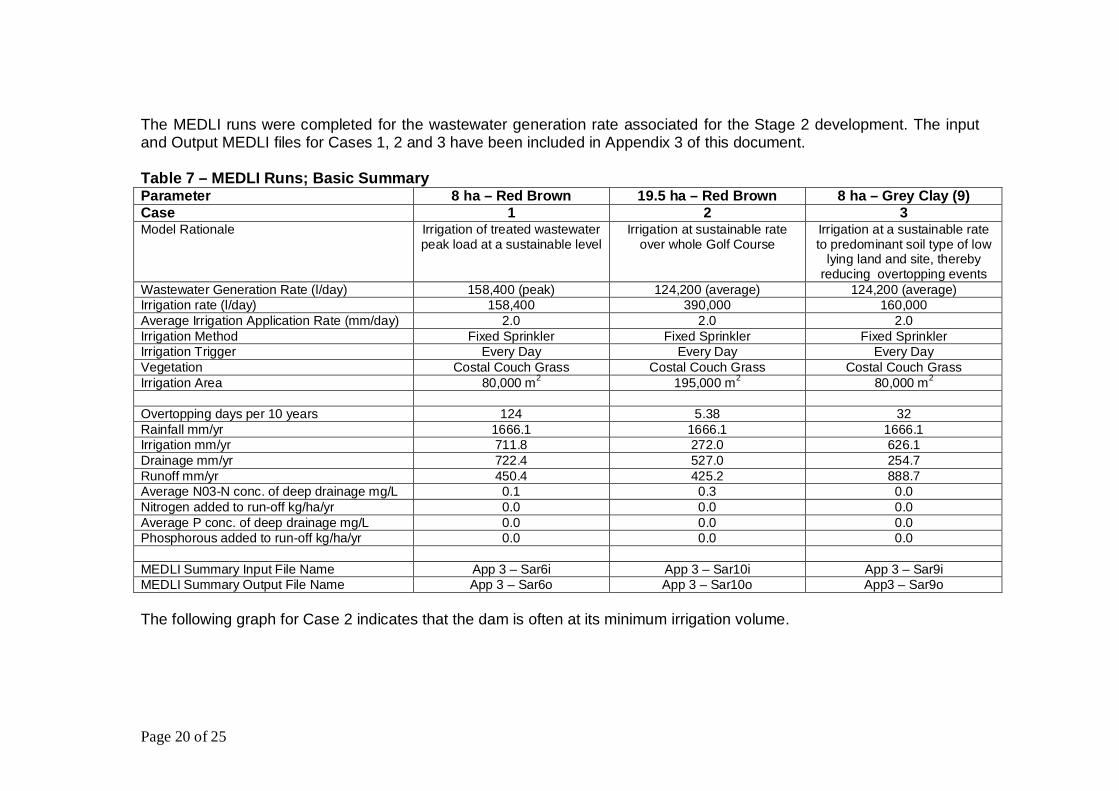
Page 20 of 25
The MEDLI runs were completed for the wastewater generation rate associated for the Stage 2 development. The input and Output MEDLI files for Cases 1, 2 and 3 have been included in Appendix 3 of this document. Table 7 – MEDLI Runs; Basic Summary Parameter 8 ha – Red Brown 19.5 ha – Red Brown 8 ha – Grey Clay (9) Case 1 2 3 Model Rationale Irrigation of treated wastewater
peak load at a sustainable level Irrigation at sustainable rate
over whole Golf Course Irrigation at a sustainable rate to predominant soil type of low
lying land and site, thereby reducing overtopping events
Wastewater Generation Rate (l/day) 158,400 (peak) 124,200 (average) 124,200 (average) Irrigation rate (l/day) 158,400 390,000 160,000 Average Irrigation Application Rate (mm/day) 2.0 2.0 2.0 Irrigation Method Fixed Sprinkler Fixed Sprinkler Fixed Sprinkler Irrigation Trigger Every Day Every Day Every Day Vegetation Costal Couch Grass Costal Couch Grass Costal Couch Grass Irrigation Area 80,000 m2 195,000 m2 80,000 m2
Overtopping days per 10 years 124 5.38 32 Rainfall mm/yr 1666.1 1666.1 1666.1 Irrigation mm/yr 711.8 272.0 626.1 Drainage mm/yr 722.4 527.0 254.7 Runoff mm/yr 450.4 425.2 888.7 Average N03-N conc. of deep drainage mg/L 0.1 0.3 0.0 Nitrogen added to run-off kg/ha/yr 0.0 0.0 0.0 Average P conc. of deep drainage mg/L 0.0 0.0 0.0 Phosphorous added to run-off kg/ha/yr 0.0 0.0 0.0 MEDLI Summary Input File Name App 3 – Sar6i App 3 – Sar10i App 3 – Sar9i MEDLI Summary Output File Name App 3 – Sar6o App 3 – Sar10o App3 – Sar9o The following graph for Case 2 indicates that the dam is often at its minimum irrigation volume.

Page 21 of 25
1960 1968 1976 1984 1992 2000 2008 20160
3.507.00
10.5014.0017.5021.0024.5028.0031.50
Sar10\Pond
Daily ( 1/ 1/1960 - 31/12/2011)Pond
Wat
er -
Volu
me
Pond
2
(m
3x10
00)
Figure 5 – Modelling of Dam Volume

Page 22 of 25
5.2 Land Application of Treated Effluent MEDLI Modelling has indicated that 80,000 m2 of land is required for the application of 158,400 litres per day of treated effluent; equating to an average irrigation rate of 2 mm/day for the peak hydraulic rate for the Stage 2 development level. As the water contained in the wet weather storage pond is used for the Golf Course irrigation, an area of 195,000 m2 the irrigation draw rate from the dam is likely to be more at the order of magnitude of 390,000 litres per day. The elevated draw rate compared with treated wastewater addition overcomes the rainfall and keeps the dam well below the allowed freeboard resulting in a very low modelled count of overtopping events per 10 year period. QCV will not be managing the irrigation of treated water which is already a current practice of Sarina Golf Club. The proposal developed requires Sarina Golf Club to manage the irrigation of treated water in a sustainable means. The following are recommendations in regards to current accepted practices for irrigation of treated water:
1. No irrigation during rain events. 2. No irrigation during high wind periods. 3. Irrigation of water outside the normal operating times of the Golf Course
so as to avoid human contact. 4. No irrigation within 30 meters of creeks and stormwater channels. 5. No irrigation within 100 meters of dams or bores used for human
consumption 6. Minimum set back distance from property boundaries that is suited to the
mode of irrigation method used. The higher the irrigation plume, the greater the irrigation diameter and the smaller the droplet, the larger the separation distance from the edge of the irrigation area.
7. Personnel are to avoid contact with effluent. 8. Sufficient separation distance from roof-rainwater catchment and
buildings. 9. Signage must be installed notifying public that treated water is utilised and
to avoid contact and to not to drink.

Page 23 of 25
6.0 Environmental Monitoring The environmental monitoring that will be actioned for the site is based on ground water monitoring. As the typical fall in the land is to the south, it is believed that hydro – geology profile is likely to follow a similar gradient. As there is no knowledge of ground water condition and to ensure that there are no adverse effects on groundwater it is proposed that three monitoring bores be installed. The proposed locations have been indicated on the following satellite photograph and Table 8.
Photo 3 – Proposed Groundwater Monitoring Positions Table 8 – Ground Water Monitoring Points Bore number Bore type Description Bore location
GW1 Monitoring bore West of Dam Wall 21°26'16.08"S, 149°13'55.96"E
GW2 Monitoring bore South of Dam Wall 21°26'18.09"S, 149°13'58.39"E
GW3 Monitoring bore East of Dam Wall 21°26'17.55"S, 149°14'3.61"E
The proposed sampling and analysis to be performed on the three site monitoring bores are as follows:

Page 24 of 25
Table 9 – Ground Water Analysis and Frequency
Parameter Minimum Monitoring Frequency
Standing Water Level Annually
pH Annually
Electrical Conductivity Annually
Total Nitrogen Annually
Nitrate Annually
Total Phosphorous Annually
Total Coliforms Annually
7.0 Conclusions and Recommendations It is recommended that approval be given for the development application of QCV Pty Ltd for the proposed Workers Accommodation and Offices at Sarina, Queensland. The proposal raised, which QCV Pty Ltd is seeking approval, consists of a two stage development with an ultimate accommodation level of 600 persons and Offices capable of an occupancy level of 140 persons. As the site is unsewered, there is the need to implement an onsite wastewater treatment system and hence the need to raise an ERA for the onsite sewage treatment. A sewage treatment plant of 165 kL/day peak capacity has been sized for the site, which exceeds the maximum wastewater production rate. The proposed treated water quality is analogous to that of Class A. The site has been previously utilised for accommodation in 2008 and has a pre-established dam for the holding of treated effluent. Previously the dam received treated water analogous of Class B quality; this proposal incorporates an improved water quality. Sarina Golf Course utilises water from the dam for irrigation of the Golf course, exceeding 19.5 ha in area. MEDLI modelling has been performed, indicating the requirement of 8 ha of land application area for the highest site loading conditions of Stage 2. As the water produced will be utilised for irrigation of the whole Golf Course area, results in less impact and sustainable land application. Modelling indicates that as the inflow of treated water and rainfall to the holding dam is less than the net irrigation rate and losses from the dam, there is a reduced probability of overtopping. The proposal contained within this document details the frequency and type of analysis utilised for the management of the production of treated water. It has
Page 25 of 25
also been proposed within this document that three monitoring bores be utilised for ground water and environmental monitoring associated with the storage of treated water. The design developed in regards to sewage treatment plant, wet weather storage, land application and monitoring has been developed to prevent environmental harm associated with the processing and handling of wastewater onsite.


The Ozzi Kleen Treatment Process – Sequential Batch Reactor (SBR) Activated Sludge Process Activated sludge is a form of an aerobic biomass living in an oxygen enriched environment through a controlled process. The naturally occurring organisms or bacteria are of a facultative nature and can be manipulated through the process to provide complete digestion of the waste contributed to the system. The mixed liquor or biomass in the aeration tank/ Bioreactor is the activated sludge which digests the incoming nutrients in the sewage breaking down the solids to simple compounds - mainly water, gases and carbon compounds. An activated sludge process is carried out in the Bioreactor, using diffused air for digestion, oxidation and mixing of the contents. The purpose of this process is to reduce the BOD strength (biochemical oxygen demand) of the sewage to low levels acceptable for discharge and re-use. With the Intermittent Decant Cyclic Extended Aeration process as used in this system, removal of nitrogen by means of nitrification and denitrification takes place. The Ozzi Kleen treatment system is a multi-stage treatment plant with the following stages: Raw Sewage Collection and Delivery A typical sewage collection and delivery system in generally consists of a sewer system and pump stations. The raw sewage is collected through the sewer system and flows by gravity into the pump station(s) and then delivered via a rising main to the automatic bar screen in the sewage treatment plant. The sewage collection and delivery system is not included in this proposal except a 5,000 litres Ozzi Kleen SPS4000 pump station with controls as shown in the drawing enclosed. SWWM can provide various sizes additional pump stations if required. Preliminary Treatment Screening: A primary stage treatment being fully automatic bar screen removing the large objects from the raw sewage and collecting the screenings into a wheelie bin for disposal. Flow and Organic loading balancing: A balance tank to conducting the incoming flow of raw sewage for the balancing of both flow and organic loading to a subsequent stage of the process. The excess volume of incoming sewage during the peak hours will be stored in the balance tank for treatment later. Mixing will be provided by a mixing pump to prevent sewage from septic. Secondary Treatment The sewage will then be pumped from the balance tank and treated in the secondary stage treatment “Bioreactors” which is an activated sludge process using Cyclic Extended Aeration processes with intermittent decanting. The sewage is then treated in a series of batch phases within the Bioreactor to achieve the desired effluent quality. The treatment operation in the Bioreactors will be automatically controlled by the PLC system in a pre-determined cycle. The treatment can be operated in different cycle times to

Suncoast Waste Water Management
The Ozzi Kleen SBR Treatment Process 2 of 4 28/08/2008
enable operational flexibility. For normal operation, the operation consists the flowing cycles: (1) Filling & Aeration Cycle Raw sewage is pumped into the bioreactor and mix with the biomass held in the aeration tanks, and aerated and oxygenated by diffused air supplied from an air blower when influent is received into the aeration tanks. Aeration is provided to meet the process oxygen demand for carbonaceous oxidation, nitrification and for mixing. As aeration takes place and continues an ideal aerobic environment is formed for micro organisms and a humus type activated sludge is formed. With the balance aeration and a good healthy activated sludge, digestion and oxidation of the organic waste occurs. A balance of aeration in relation to the organic/hydraulic load is maintained for a good steady reliable treatment process. BOD oxidation and nitrification also occurs during this phase of operation. A dissolved oxygen (DO) sensor is installed for aeration control to maintain appropriate DO level. (2) Settling Cycle During settlement and decant cycles there is no influent to the aeration tanks. Immediately after the aeration, a settling condition is created to provide solids-liquid separation, which allows a quiet period where the biomass has time to settle. As the biomass is settling it acts as a filter blanket trapping all the waste that is in suspension in the mixed liquor of the aerobic biomass and settles it to the floor. This provides for further carbonaceous oxidation (anoxically), clarification, and denitrification. A zone of clear water is generated at the surface of the aeration tank, which is now acting as a clarifier. (3) Decant Cycle After a predetermined settling period a decanting cycle takes place. The floating decanter draws off surface water to a predetermined level from an inverted pipe manifold. During the decanting cycle the anoxic treatment process continues carbonaceous oxidation, clarification, and denitrification, and automatically decants highly treated clarified effluent. The decanting cycle continues drawing off effluent until either the liquid level in the aeration tank reaches the standard operation level or the electronic process-timer control puts the system back into the filling and aeration cycle, which airlocks the decanter stopping decanting cycle. The decanter consists of an air-lock chamber and a fixed draw-off tube connected to the chlorinator, which is connected to the chlorination chamber. On start up of the air blower the decanter is purged of liquid and an air-lock is created in the pipework, thus stopping any flow of water and the decanting procedure. The air-lock is continually primed during the blower on duty period by an adjustable air feed connected with 4 mm tubing.
Ozzi Kleen Model DC80 Floating Decanter

Suncoast Waste Water Management
The Ozzi Kleen SBR Treatment Process 3 of 4 28/08/2008
At the end of each aeration cycle and during the settling cycle the air lock is maintained by the solenoid valve which is normally shut. At the end of the settling period the decanting delay timer opens the solenoid valve and releases the air locked in the Siphon system and decanting of settled effluent starts. The flow of water through the decanter is controlled to a set flow to ensure sufficient chlorine is absorbed. The settling period of approximately 60 minutes is sufficient time for the biomass to settle in the aeration tank before the decanting cycle takes place however this can be adjustable from 15 to 60 minutes if necessary. At the end of the decanting cycle which is the start of the next aeration cycle the blower on timer starts the blower again causing air pressure to purge the liquid from the air-lock system and an air-lock is created in the pipework, thus stopping any flow of water and the decanting procedure. Variable duration for each cycle can be chosen for optimum treatment. There are two aeration cells operated in parallel, each cell contains two aeration tanks operating in series, with one cell open for intake of influent in fill and aeration cycle, while the other cell runs through the remainder of the cycles with the sequences controlled by the PLC as showing in the table below:.
1 2 3 4 5 6 7 8 9 10 11 12 13 14 15 16 17 18 19 20 21 22 23 24
Fill & AerationSettlingDecantFill & AerationSettlingDecant
Cell 1
Cell 2
Elapsed Time (hour)
Automatic Sludge Wasting and Storage Waste sludge is pumped from the bioreactor at the beginning of each aeration cycle by the time controlled sludge pump into the sludge holding tank. The sludge that is wasted from the aeration tanks moves on to digestion in the sludge tank. As sludge is settling and thickening a separation of water and sludge occurs. The concentrated solids (waste sludge) is eventually to be pump out for disposal, and the supernatant from the sludge tank flows into a sump tank then pumped back to the balance tank via a sump pump. The sludge wasting programme will not need to be activated until there is sufficient biomass which would be determined at the time of each service. Basket Strainer The decanted effluent from the aeration tanks will flow through the basket strainer for removing the scums from the decanted effluent for disposal. Chlorination The decanted effluent from the aeration tanks will be disinfected through the chlorinator and chlorine contact tank. Although the effluent is treated, it contains many types of human enteric organisms that are associated with various waterborne diseases. Disinfection can selectively destruct the disease-causing organisms in the sewage effluent. The chlorinator and the chlorine contract tank will be designed to meet the advanced secondary effluent quality. A disinfection process of effluent is with the use of chlorination equipment treating the final water before discharge. The chlorinator uses tablet chlorine (TICA Trichloroisocyanuric

Suncoast Waste Water Management
The Ozzi Kleen SBR Treatment Process 4 of 4 28/08/2008
Acid) and is self-compensating for variations in flow giving a dose rate residual chlorine in effluent of between 0.5-to 2.0 mg/l free chlorine prior to be delivered to the effluent storage tank or irrigation system A chlorine contact time of minimum 30 minutes under the maximum flow is used for the design. After decanting the effluent is disinfected and stored in the chlorine contact compartment (effluent tank) for a short period to ensure the disinfection of pathogenic organisms. Chlorination is done through a tablet chlorinator located along side the chlorination chamber. The bottom tablet is submerged at all times and during periods of low flow sufficient chlorine is released and during periods of high flow the water level in the chlorinator increases and more tablets are exposed to become eroded away and release chlorine in sufficient quantities to ensure disinfection. When the liquid level is sufficient in the effluent tank, the final discharge pump will operate and pump out the now disinfected water to the dredge pond for disposal, or pump out via the effluent camlock for reuse. Tertiary Treatment Sand Filtration: Disinfected effluent from the chlorination contact tank is pumped into the sand filter via the effluent pump, A pressure type rapid sand filter is used for final effluent polishing prior to deliver to the effluent holding tank/irrigation system (by others). The sand filter has a unique automatic backwash feature, which at the time of each service the filter is backwashed cleaning the sand to its original condition. The discharge from the backwashing of the filter is recycled back to the balance tank. The backwash cycle is controlled by a pressure switch located on the sand filter head. The sand filter is constructed in polyethylene and is usually inserted as an integral part of the system. Phosphate Reduction The dosing of Aluminum Sulphate (Alum) at a controlled rate will result in Phosphate removal from the activated sludge. Phosphate removal takes place within the mixed liquor of the aeration tank with the addition of flocculating chemicals (Aluminum Sulphate), which precipitates and binds the element to the sludge and is removed from the treatment cycle through the exercise of sludge wasting.

Suncoast Waste Water Management
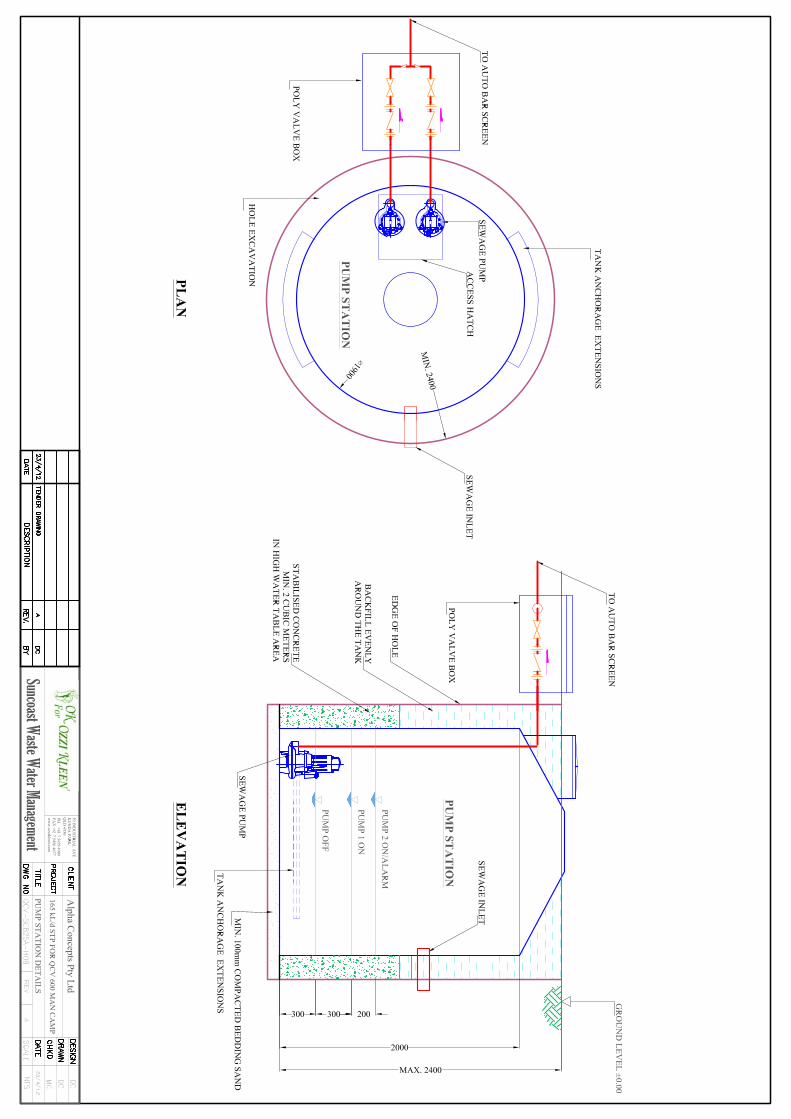
Suncoast Waste Water ManagementSewage treatment Plant Power & Operating Cost EstimatingProject: Alpha Concepts - QCV 600 man campDesign Parameter EP 820Hydraulic flow l/day 164000Blower on time per cycle min 60Settling time per cycle min 30Decant time per cycle min 30Total cycle time min 120Number of cycles per day cycles 12Total decanting time per day min 360Total decanting time per day hr 6.00Total aeration time per day min 720Total aeration time per day hr 12.00Auto Bar Screen l/min 300 BG4828-5 max. 650 l/minSewage Pump l/min 100 Davey DT15K pump stationTransfer/Mixer Pump l/min 250 Davey DT08S balance tankFilter Pump l/min 250 Davey PM350
RAS Pump l/min 50 Mono CP1600
WAS Pump l/min 50 Mono CP1600
Sweeper pump flowrate l/min 100 Davey X201
Effluent Pump l/minDoing Pump l/hr 4 Iwaki EWN-B21VCAR
Air Blower m3/h 550 K10-MS
Power Based on Rated Power Unit Hr/d Energy3 phase 1 phase hr kW
Sewage Pump A - SEPARATE BOARD 1.50 kWSewage Pump B - SEPARATE BOARD 1.50 kWAuto Bar Screen 0.37 kW 1.00 0.37Transfer Pump 1A 0.75 kW 5.47 4.10Transfer Pump 1B 0.75 kWTransfer Pump 2A 0.75 kW 5.47 4.10Transfer Pump 2B 0.75 kWMixer Pump 1 0.75 kW 5.47 4.10Mixer Pump 2 0.75 kW 5.47 4.10Fliter Pump A 1.20 kW 10.93 13.12Fliter Pump B 1.20 kWRAS Pump 1 0.93 kW 12.00 11.16RAS Pump 2 0.93 kW 12.00 11.16WAS Pump 1 0.93 kW 0.20 0.19WAS Pump 2 0.93 kW 0.20 0.19Dosing Pump 1 0.02 kW 5.47 0.11Dosing Pump 2 0.02 kW 5.47 0.11Sweeper Pump 0.70 kW 1.00 0.70Blower 1A 9.20 kW 12.00 110.40Blower 1B 9.20 kWBlower 2A 9.20 kW 12.00 110.40Blower 2B 9.20 kWAir conditioner 2.10 kW 10.00 21.00Control Circuit 0.10 kW 24.00 2.40General Power/Light 0.10 kW 12.00 1.20Total installed Power 50.79 3.04 kW/day 298.9Average Power kW/hr 12.45
Model
Installed Power
QCV Sarina 600 man camp - SC825A STPPower Consumption Operating Cost Estimating 1 of 2
QS-SC825A-POE rev. 123/4/2012
Suncoast Waste Water Management
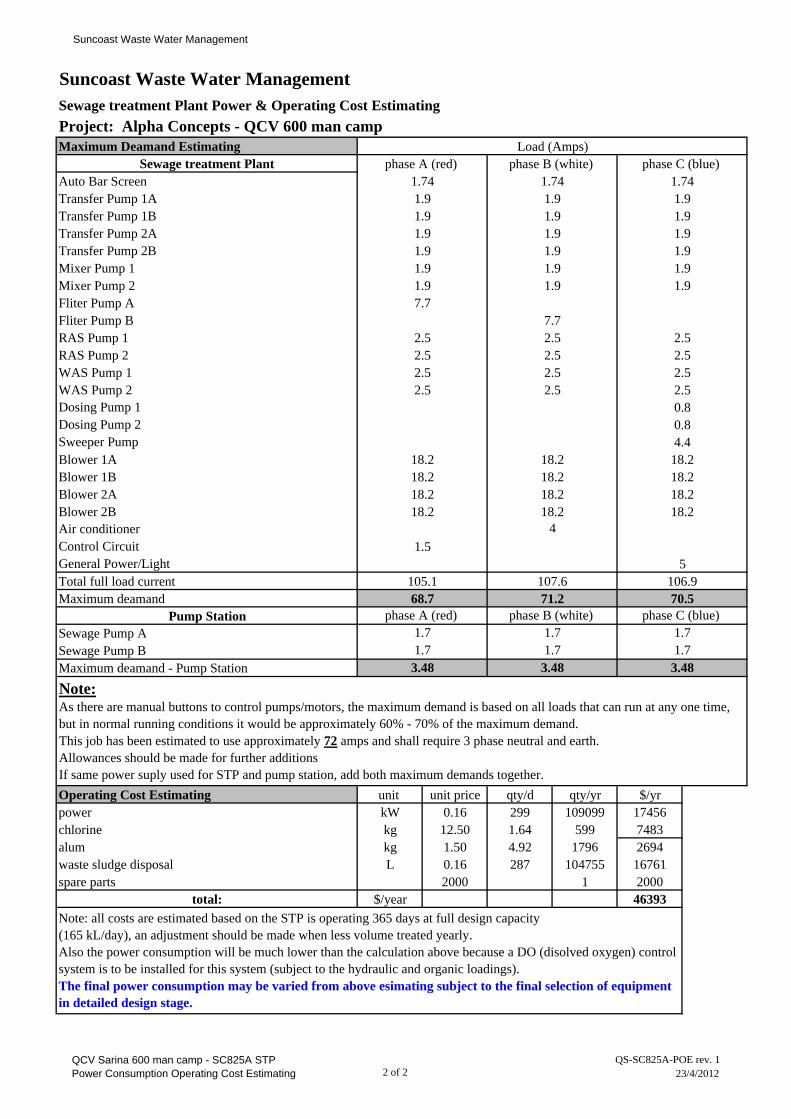
Suncoast Waste Water ManagementSewage treatment Plant Power & Operating Cost EstimatingProject: Alpha Concepts - QCV 600 man campMaximum Deamand Estimating
Sewage treatment PlantAuto Bar ScreenTransfer Pump 1ATransfer Pump 1BTransfer Pump 2ATransfer Pump 2BMixer Pump 1Mixer Pump 2Fliter Pump AFliter Pump BRAS Pump 1RAS Pump 2WAS Pump 1WAS Pump 2Dosing Pump 1Dosing Pump 2Sweeper PumpBlower 1ABlower 1BBlower 2ABlower 2BAir conditionerControl CircuitGeneral Power/LightTotal full load currentMaximum deamand
Pump StationSewage Pump ASewage Pump BMaximum deamand - Pump Station
Operating Cost Estimating unit unit price qty/d qty/yr $/yrpower kW 0.16 299 109099 17456chlorine kg 12.50 1.64 599 7483alum kg 1.50 4.92 1796 2694waste sludge disposal L 0.16 287 104755 16761spare parts 2000 1 2000
total: $/year 46393
4.4
1.5
18.218.2 18.2
18.218.2 18.2
2.5
0.8
1.9
1.9
1.74 1.74 1.741.9 1.9 1.9
2.5
7.77.72.5
1.9 1.9
Load (Amps)phase A (red) phase B (white) phase C (blue)
68.7 71.2 70.5
Note: all costs are estimated based on the STP is operating 365 days at full design capacity(165 kL/day), an adjustment should be made when less volume treated yearly.Also the power consumption will be much lower than the calculation above because a DO (disolved oxygen) controlsystem is to be installed for this system (subject to the hydraulic and organic loadings).The final power consumption may be varied from above esimating subject to the final selection of equipmentin detailed design stage.
phase A (red) phase B (white) phase C (blue) 1.7 1.7 1.7
106.9
2.5
5
18.218.2 18.2
2.5 2.5
1.9 1.9
105.1 107.6
1.9 1.9
18.2 18.2
Note:As there are manual buttons to control pumps/motors, the maximum demand is based on all loads that can run at any one time,but in normal running conditions it would be approximately 60% - 70% of the maximum demand.This job has been estimated to use approximately 72 amps and shall require 3 phase neutral and earth.Allowances should be made for further additionsIf same power suply used for STP and pump station, add both maximum demands together.
1.7 1.7 1.73.48 3.48 3.48
1.9 1.9 1.91.9 1.9 1.9
1.9
0.8
2.5 2.5 2.5
2.5 2.5 2.5
418.2
QCV Sarina 600 man camp - SC825A STPPower Consumption Operating Cost Estimating 2 of 2
QS-SC825A-POE rev. 123/4/2012

Alpha Concepts Pty LtdPO Box 2055 Gladstone Qld 4680
Ph 4979 4001 Fax 4979 3009Mobile 0409 761922
Process Engineering, Process ManagementProject Management, andEnvironmental Management Solutions
Client:
Drawing Description:
1
Private and Confidential
This drawing is the property ofAlpha Concepts Pty Ltd and isnot to be copied or used withoutits written permission
REVDWG NO.SIZE
SHEETSCALE
APPROVEDDATEDESCRIPTIONREV
REVISIONS
N
1RP726644
1 RP
852633
179
deg
46'1
0"
144deg
12' 25"
221
deg
10' 1
0"
101.
268
1.9 ha
0 Development 13/05/12 DM
QCV Pty Ltd
STP Site Plan
2A3
1:2000
QCVS-PLN-001
SewageTreatmentPlantApproximateLocation
1 Revised STP Location 04/09/12 DM
N
Blowers
SewageTreatmentPlant
4 m
37 m
135 m
Revised STP Location 25/09/12 DM2

Alpha Concepts Pty LtdPO Box 2055 Gladstone Qld 4680
Ph 4979 4001 Fax 4979 3009Mobile 0409 761922
Process Engineering, Process ManagementProject Management, andEnvironmental Management Solutions
Client:
Drawing Description:
1
Private and Confidential
This drawing is the property ofAlpha Concepts Pty Ltd and isnot to be copied or used withoutits written permission
REVDWG NO.SIZE
SHEETSCALE
APPROVEDDATEDESCRIPTIONREV
REVISIONS
N
Proposed Gatefor STPAccessEarthen Road
Access
Eart
hen
Road
Acc
ess
Earthen RoadAccess
0.5 m height, 1 to 2 meter wideearthen storm water diversion
Level Cut and Fill Level Area
Leve
lCutand
Fill
Leve
lAre
a
1meter to 5 meter highvegetation screen
14 m
6 m
8 m
Blowers
Note measurements are an example of proposed installationPhysical installation may vary; however, are to maintain withphilosophy of vegetation screening, fenced compound androad access for sludge removal and repair of STP.
The drawing represents concept level design only
SewageTreatmentPlant
QCVS-PLN-002
1:200
STP Compound Concept Plan
QCV Pty Ltd
A3 20 Development 13/05/12 DM
Culvert
Culvert
1 Modified Layout 04/09/12 DM
Pers
onnelA
ccess
38 m
33 m
6 m
20 m
4 m
2 Increase Plant Footprint 25/09/12 DM
Easement Access to Site Dam
Proposed Gatefor STPAccess
Culvert
Culvert

file:///C|/Documents%20and%20Settings/megana/Desktop/Appendix%203a%20-%20Modelling%20data%20-%20Sar6i.txt-.txt[9/10/2012 3:55:35 PM]
Version 1.30 : GENERAL INFORMATION - CONTROL.PRMQCVSSarina DevelopmentQCV Pty LtdAlpha ConceptsThu May 10 10:53:36 2012[no entry]Sar6-Version 1.30 : ITER.PRM~Grid Type (1=full grid,2=selected), Increm (side 1) ,Increm (side 2)1 5 5~Grid range (if full, max[area, vol], if not, co-ords for corners A[area,vol], B[area,vol], C[area,vol} x0y0, x1y1, x2y2)0 0~Costings Fixed, Units/ML, Units/ha0 10 70~Append results? (0 = no, other = yes)0---------------------------------------Version 1.30 : CLIMATE.PRM^Site nameSarina^Latitude (°S)21.5^Longitude (°E)149.2^Climate station sari^Run start date^ Run end date 1 1 1960 31 12 2011^Report start date^ Report end date 1 1 1960 1 1 1960---------------------------------------Version 1.30 : CROP.PRM - PASTURE OPTION^Pan coefficient1^Model option (1=monthly covers, 2=pasture, 3=crop, 4=seasonal rotation)2^SpeciesCoastal couch grass (Cynodon dactylon)^Salt tolerancetolerantGROWTH:^Max. crop coefficient^Max.root depth(mm)^Radiation use efficiency(kg/Ha)/(MJ/m2)^min Yield for Full Cover (kg/ha)0.8 800 3.5 3e+03^Max. shoot nitrogen(%dwt)^max. shoot phosphorus(%dwt)5.4 0.5HARVEST:^Residual green cover(%)^Residual dead cover(%)^Residual shoot biomass(kg/ha)^Harvest trigger yield (kg/ha)80 20 1.4e+03 2.8e+03^Leaf water interception store(mm)0.5TEMPERATURE:^Ct0(°C)^Ct1(°C)^Ct2(°C)^Ct3(°C)^Ct4(°C)^TT(degree days)

file:///C|/Documents%20and%20Settings/megana/Desktop/Appendix%203a%20-%20Modelling%20data%20-%20Sar6i.txt-.txt[9/10/2012 3:55:35 PM]
-2 15 21 27 49 300NITROGEN:^BN1 cover(%dwt)^BN2 cover(%dwt)^BN1 growth(%dwt)^BN2 growth(%dwt)0.1 2 0.3 2SALINITY: ^salinity threshold(dS/m saturated ext.)^Yield reduction rate(% per dS/m)^No. years for averaging6.9 6.4 5______________________________________________Version 1.30 : GROUNDWATER.PRMspare linespare line^Distance from irrigation area to property boundary in direction of ground water flow (m) N.B. Minimum distance = 2*radius of (circular) irrigation area400^Aquifer thickness(m)^Depth between aquifer and surface (m)10 3^Specific flux (mm/hr)^Porosity of aquifer (mm/mm)^Longitudinal dispersion coefficient (m2/d)^Lateral dispersion coefficient (m2/d)^Adsorption retardation (m2/d)0.4 0.1 100 0.1 1---------------------------------------Version 1.30 : IRRIGATION.PRM^Irrigation area (ha)8.0000^Irrigation methodFixed Sprinkler^Maximum Irrigation Option (1=ML/ha/d, 2= ML/d, 3 = full requirement) ^ rate3 0.09000^Minimum Irrigation Option (1=ML/ha/d, 2= ML/d, 3 = full requirement) ^ rate3 0.000000^Irrigation Trigger Option (1=%PAWC, 2= mm SWD, 3 = every X days) ^ irrTrigValue3 1.0^Irrigation Application Option (1=up to FC + x (mm), 2= mm, 3 = % USL) ^ irrAppValue2 2.0^Minimum number of days skipped between irrigation events0^Apply annual fresh (or bore) water allocation(0=FALSE; 1= TRUE)0---------------------------------------Version 1.30 : NITROGEN.PRM^Soil profile typeLow Perm Red Brown EarthKinetic rate coefficients (%/day @ 35°C):^Ammonium adsorption^Ammonium desorption^Ammonification of organic N^Immobilisation of ammonium^Denitrification0.00 0.00 0.000350 0.00 0.10^Initial Nitrate N (mg/kg)^Initial Organic N (mg/kg)2.5 800.0---------------------------------------Version 1.30 : PHOSPHORUS.PRM^Soil profile typeLow Perm Red Brown Earth^Freundlich Ads. Coeff.^Freundlich ads. exponent^Freundlich Desorp. Exp.^Initial Soil Solution P (mg/L)Layer 1114.0 0.32 0.13 0.100Layer 2150.0 0.25 0.10 0.100Layer 3

file:///C|/Documents%20and%20Settings/megana/Desktop/Appendix%203a%20-%20Modelling%20data%20-%20Sar6i.txt-.txt[9/10/2012 3:55:35 PM]
310.0 0.21 0.06 0.100Layer 4310.0 0.21 0.06 0.100---------------------------------------Version 1.30 : SOIL.PRM^Soil profile typeLow Perm Red Brown Earth^No. of layers4^Layer thickness (mm)^Air dry (%v/v)^Lower storage limit (%v/v)^Upper storage limit (%v/v)^Sat. water capacity (%v/v)^Sat.Hyd.Conductivity (mm/hr)^Bulk density (g/cm3) 100 4.3 8.6 25.7 46.0 20.000 1.42 500 0.1 20.1 32.0 43.5 10.000 1.49 600 0.1 25.6 33.9 44.8 2.000 1.45 300 0.1 26.2 32.3 42.8 0.500 1.50^Curve number75Slope of Stage II drying (mm/day^0.5)^Stage I drying max.(mm)4 10Scalars: Lag^Wet day factor^albedo0.73 0.49 0.23---------------------------------------Version 1.30 : Pond parameters for up to 4 ponds.Number of Ponds 2Volume at outlet (m^3): Ponds 1..n600.023438 27999.044922 Max. length of wetted surface (m): Ponds 1..n 11.81 138.12 Max. width of wetted surface (m): Ponds 1..n 11.81 138.12 Max water depth (m): Ponds 1..n 4.3 1.5 Depth of freeboard (m): Ponds 1..n0.5 0.5 Side slope (radians from horizontal): Ponds 1..n (N.B.radians = degrees*11/630)1.571429 0.785714 Leakage rate (mm/day): Ponds 1..n 0 0.1 Evaporation coefficient: Ponds 1..n 0.7 0.7 Classification: Ponds 1..nanaerobic other Drawdown (depth removable for irrigation) (m): Ponds 1..n 0 0.8 N transfer coefficient (aka nitrogen proportionality constant) 0.014 0.014Nitrogen settling fraction: Ponds 1..n 0.01 0 Phosphorus settling fraction: Ponds 1..n 0.01 0 Potassium settling fraction: Ponds 1..n 0.01 0 Required (design) hydraulic retention time (days): Ponds 1..n

file:///C|/Documents%20and%20Settings/megana/Desktop/Appendix%203a%20-%20Modelling%20data%20-%20Sar6i.txt-.txt[9/10/2012 3:55:35 PM]
3 20 Actual hydraulic retention time (days): Ponds 1..n 3.805 177.572 spare linespare lineSludge accumulation rate (m^3/kg TS): Ponds 1..n 0.001 0 Pond efficiency factor (K value of an anaerobic pond in this area)1.14881Maximum design loading rate of Volatile Solids into first pond (kg/m3/day) at K=1.00.067Daily amount drawn from last pond for recirculation (m3)0Starting depth (2=half full,1=full,0=empty) 2 2 Daily non-effluent inflow volume (m3) assuming no recycling occurs^Total dissolved salts (mg/l) in fresh water^total N (mg/L)0 0 0Length/Width ratio: Ponds 1..n 1 1 Desludging protocol option1 Desludge when sludge reaches 40% of total pond volumeDesludge threshold as % total pond volume40Conductivity (1st pond) (dS/m) at which use of recycled flushing water (from last pond) ceases &^resumes (N.B. Input under Piggery Technical Water Details)12 8Recycling Pond2Rain catchment as a % of max surface area: Ponds 1..n 0 100 Area exposed to evaporation as a % of surface area: Ponds 1..n 0 100 User-specified starting pond concentrations (0 = FALSE; 1 = TRUE)1initial [N] mg/L: Ponds 1..n 30 0 initial [P] mg/L: Ponds 1..n 10 0 initial [K] mg/L: Ponds 1..n 2 0 initial [TDS] mg/L: Ponds 1..n 8e+02 0 _______________________________________________________Version 1.30 : Effluent pretreatment parameter fileTreatment typeNoneAmounts Removed (%):^Vol^Nitrogen^Phosphorus^Potassium^TDS^Total Solids^Volatile Solids^E.coli^Salmonella^Virus^Helminth0 0 0 0 0 0 0 0 0 0 0_______________________________________________________INDUSTRY=OTHER dummy line dummy line

file:///C|/Documents%20and%20Settings/megana/Desktop/Appendix%203a%20-%20Modelling%20data%20-%20Sar6i.txt-.txt[9/10/2012 3:55:35 PM]
Nature of IndustryotherNumber of livestock0__________________________________________Version 1.30 : SHANDY.PRM for Shandying waterspare linespare line^Fresh water available (1=YES, other=no)0^Shandying water salinity (dS/m)0.5^Shandying water nitrogen conc.(mg/L)1^Max. allowable salinity of irrigation water (dS/m)0^Max. allowable nitrogen conc. of irrigation water (mg/L)0^Maximum daily supply of shandying water (ML/day)0^Use minimal dilution i.e. shandy primarily for effluent disposal (0=NO;1=YES)0max dam Vol^max dam Depth^dam Coeff^dam Exponent0 0 1 0---------------------------------------Version 1.30 : NBREAKUP.PRMspare linespare lineNitrogen Components in Irrigation Effluent (%):^Nitrate N^Ammonium N^organic N70 20 10 ^Ammonium loss in irrigation (%)20---------------------------------------Version 1.30 : BUGS.PRM^Bug group, ^Bug sp, ^units, ^a coef, ^b coefbact E.coli (countsx10^6Per100mL) 2.60000 1.09000bact Salmonella (countsPer100mL) 1.04000 1.09000viru Virus (countsx10^6Per100mL) 0.08718 0.02840helm Helminth (countsPerLitre) 0.20000 0.50000^Influent temp (oC) (-1 if same as ambient air temp),^ off-set0.0 2.0^Pond Shortcircuiting % (0=none 100=full))0.0 0.0 0.0 0.0^ adjustor (Max No. days daily temperature averaged for pond 1)90.0---------------------------------------Version 1.30 : WASTE.PRM Waste stream parameter fileIndustry Type (Feedlot=1;Piggery=2;Abattoir=3;SewageTP: Leaky = 4 1, Avg = 4 2, non-Leaky = 4 3; Other=5,Dairy=6)5 20 Parameters and units: Daily waste characteristics for calendar leap year (366 days) Effluent TN TP K TDS TS VS E.coli^Salmonella^Virus^Helminth ML mg/L mg/L mg/L mg/L mg/L mg/L (countsx10^6Per100mL) (countsPer100mL)
file:///C|/Documents%20and%20Settings/megana/Desktop/Appendix%203a%20-%20Modelling%20data%20-%20Sar6i.txt-.txt[9/10/2012 3:55:35 PM]
(countsx10^6Per100mL) (countsPerLitre) 0.1580 9.0 3.0 1.0 800.0 9 8 0.0 0 0 0.0 0.1580 9.0 3.0 1.0 800.0 9 8 0.0 0 0 0.0 0.1580 9.0 3.0 1.0 800.0 9 8 0.0 0 0 0.0 0.1580 9.0 3.0 1.0 800.0 9 8 0.0 0 0 0.0 0.1580 9.0 3.0 1.0 800.0 9 8 0.0 0 0 0.0 0.1580 9.0 3.0 1.0 800.0 9 8 0.0 0 0 0.0 0.1580 9.0 3.0 1.0 800.0 9 8 0.0 0 0 0.0 0.1580 9.0 3.0 1.0 800.0 9 8 0.0 0 0 0.0 0.1580 9.0 3.0 1.0 800.0 9 8 0.0 0 0 0.0 0.1580 9.0 3.0 1.0 800.0 9 8 0.0 0 0 0.0 0.1580 9.0 3.0 1.0 800.0 9 8 0.0 0 0 0.0 0.1580 9.0 3.0 1.0 800.0 9 8 0.0 0 0 0.0 0.1580 9.0 3.0 1.0 800.0 9 8 0.0 0 0 0.0 0.1580 9.0 3.0 1.0 800.0 9 8 0.0 0 0 0.0 0.1580 9.0 3.0 1.0 800.0 9 8 0.0 0 0 0.0 0.1580 9.0 3.0 1.0 800.0 9 8 0.0 0 0 0.0 0.1580 9.0 3.0 1.0 800.0 9 8 0.0 0 0 0.0 0.1580 9.0 3.0 1.0 800.0 9 8 0.0 0 0 0.0 0.1580 9.0 3.0 1.0 800.0 9 8 0.0 0 0 0.0 0.1580 9.0 3.0 1.0 800.0 9 8 0.0 0 0 0.0 0.1580 9.0 3.0 1.0 800.0 9 8 0.0 0 0 0.0 0.1580 9.0 3.0 1.0 800.0 9 8 0.0 0 0 0.0 0.1580 9.0 3.0 1.0 800.0 9 8 0.0 0 0 0.0 0.1580 9.0 3.0 1.0 800.0 9 8 0.0 0 0 0.0 0.1580 9.0 3.0 1.0 800.0 9 8 0.0 0 0 0.0 0.1580 9.0 3.0 1.0 800.0 9 8 0.0 0 0 0.0 0.1580 9.0 3.0 1.0 800.0 9 8 0.0 0 0 0.0 0.1580 9.0 3.0 1.0 800.0 9 8 0.0 0 0 0.0 0.1580 9.0 3.0 1.0 800.0 9 8 0.0 0 0 0.0 0.1580 9.0 3.0 1.0 800.0 9 8 0.0 0 0 0.0 0.1580 9.0 3.0 1.0 800.0 9 8 0.0 0 0 0.0 0.1580 9.0 3.0 1.0 800.0 9 8 0.0 0 0 0.0 0.1580 9.0 3.0 1.0 800.0 9 8 0.0 0 0 0.0 0.1580 9.0 3.0 1.0 800.0 9 8 0.0 0 0 0.0 0.1580 9.0 3.0 1.0 800.0 9 8 0.0 0 0 0.0 0.1580 9.0 3.0 1.0 800.0 9 8 0.0 0 0 0.0 0.1580 9.0 3.0 1.0 800.0 9 8 0.0 0 0 0.0 0.1580 9.0 3.0 1.0 800.0 9 8 0.0 0 0 0.0 0.1580 9.0 3.0 1.0 800.0 9 8 0.0 0 0 0.0 0.1580 9.0 3.0 1.0 800.0 9 8 0.0 0 0 0.0 0.1580 9.0 3.0 1.0 800.0 9 8 0.0 0 0 0.0 0.1580 9.0 3.0 1.0 800.0 9 8 0.0 0 0 0.0 0.1580 9.0 3.0 1.0 800.0 9 8 0.0 0 0 0.0 0.1580 9.0 3.0 1.0 800.0 9 8 0.0 0 0 0.0 0.1580 9.0 3.0 1.0 800.0 9 8 0.0 0 0 0.0 0.1580 9.0 3.0 1.0 800.0 9 8 0.0 0 0 0.0 0.1580 9.0 3.0 1.0 800.0 9 8 0.0 0 0 0.0 0.1580 9.0 3.0 1.0 800.0 9 8 0.0 0 0 0.0 0.1580 9.0 3.0 1.0 800.0 9 8 0.0 0 0 0.0 0.1580 9.0 3.0 1.0 800.0 9 8 0.0 0 0 0.0 0.1580 9.0 3.0 1.0 800.0 9 8 0.0 0 0 0.0 0.1580 9.0 3.0 1.0 800.0 9 8 0.0 0 0 0.0 0.1580 9.0 3.0 1.0 800.0 9 8 0.0 0 0 0.0

file:///C|/Documents%20and%20Settings/megana/Desktop/Appendix%203a%20-%20Modelling%20data%20-%20Sar6i.txt-.txt[9/10/2012 3:55:35 PM]
0.1580 9.0 3.0 1.0 800.0 9 8 0.0 0 0 0.0 0.1580 9.0 3.0 1.0 800.0 9 8 0.0 0 0 0.0 0.1580 9.0 3.0 1.0 800.0 9 8 0.0 0 0 0.0 0.1580 9.0 3.0 1.0 800.0 9 8 0.0 0 0 0.0 0.1580 9.0 3.0 1.0 800.0 9 8 0.0 0 0 0.0 0.1580 9.0 3.0 1.0 800.0 9 8 0.0 0 0 0.0 0.1580 9.0 3.0 1.0 800.0 9 8 0.0 0 0 0.0 0.1580 9.0 3.0 1.0 800.0 9 8 0.0 0 0 0.0 0.1580 9.0 3.0 1.0 800.0 9 8 0.0 0 0 0.0 0.1580 9.0 3.0 1.0 800.0 9 8 0.0 0 0 0.0 0.1580 9.0 3.0 1.0 800.0 9 8 0.0 0 0 0.0 0.1580 9.0 3.0 1.0 800.0 9 8 0.0 0 0 0.0 0.1580 9.0 3.0 1.0 800.0 9 8 0.0 0 0 0.0 0.1580 9.0 3.0 1.0 800.0 9 8 0.0 0 0 0.0 0.1580 9.0 3.0 1.0 800.0 9 8 0.0 0 0 0.0 0.1580 9.0 3.0 1.0 800.0 9 8 0.0 0 0 0.0 0.1580 9.0 3.0 1.0 800.0 9 8 0.0 0 0 0.0 0.1580 9.0 3.0 1.0 800.0 9 8 0.0 0 0 0.0 0.1580 9.0 3.0 1.0 800.0 9 8 0.0 0 0 0.0 0.1580 9.0 3.0 1.0 800.0 9 8 0.0 0 0 0.0 0.1580 9.0 3.0 1.0 800.0 9 8 0.0 0 0 0.0 0.1580 9.0 3.0 1.0 800.0 9 8 0.0 0 0 0.0 0.1580 9.0 3.0 1.0 800.0 9 8 0.0 0 0 0.0 0.1580 9.0 3.0 1.0 800.0 9 8 0.0 0 0 0.0 0.1580 9.0 3.0 1.0 800.0 9 8 0.0 0 0 0.0 0.1580 9.0 3.0 1.0 800.0 9 8 0.0 0 0 0.0 0.1580 9.0 3.0 1.0 800.0 9 8 0.0 0 0 0.0 0.1580 9.0 3.0 1.0 800.0 9 8 0.0 0 0 0.0 0.1580 9.0 3.0 1.0 800.0 9 8 0.0 0 0 0.0 0.1580 9.0 3.0 1.0 800.0 9 8 0.0 0 0 0.0 0.1580 9.0 3.0 1.0 800.0 9 8 0.0 0 0 0.0 0.1580 9.0 3.0 1.0 800.0 9 8 0.0 0 0 0.0 0.1580 9.0 3.0 1.0 800.0 9 8 0.0 0 0 0.0 0.1580 9.0 3.0 1.0 800.0 9 8 0.0 0 0 0.0 0.1580 9.0 3.0 1.0 800.0 9 8 0.0 0 0 0.0 0.1580 9.0 3.0 1.0 800.0 9 8 0.0 0 0 0.0 0.1580 9.0 3.0 1.0 800.0 9 8 0.0 0 0 0.0 0.1580 9.0 3.0 1.0 800.0 9 8 0.0 0 0 0.0 0.1580 9.0 3.0 1.0 800.0 9 8 0.0 0 0 0.0 0.1580 9.0 3.0 1.0 800.0 9 8 0.0 0 0 0.0 0.1580 9.0 3.0 1.0 800.0 9 8 0.0 0 0 0.0 0.1580 9.0 3.0 1.0 800.0 9 8 0.0 0 0 0.0 0.1580 9.0 3.0 1.0 800.0 9 8 0.0 0 0 0.0 0.1580 9.0 3.0 1.0 800.0 9 8 0.0 0 0 0.0 0.1580 9.0 3.0 1.0 800.0 9 8 0.0 0 0 0.0 0.1580 9.0 3.0 1.0 800.0 9 8 0.0 0 0 0.0 0.1580 9.0 3.0 1.0 800.0 9 8 0.0 0 0 0.0 0.1580 9.0 3.0 1.0 800.0 9 8 0.0 0 0 0.0 0.1580 9.0 3.0 1.0 800.0 9 8 0.0 0 0 0.0 0.1580 9.0 3.0 1.0 800.0 9 8 0.0 0 0 0.0 0.1580 9.0 3.0 1.0 800.0 9 8 0.0 0 0 0.0 0.1580 9.0 3.0 1.0 800.0 9 8 0.0 0 0 0.0 0.1580 9.0 3.0 1.0 800.0 9 8 0.0 0 0 0.0 0.1580 9.0 3.0 1.0 800.0 9 8 0.0 0 0 0.0

file:///C|/Documents%20and%20Settings/megana/Desktop/Appendix%203a%20-%20Modelling%20data%20-%20Sar6i.txt-.txt[9/10/2012 3:55:35 PM]
0.1580 9.0 3.0 1.0 800.0 9 8 0.0 0 0 0.0 0.1580 9.0 3.0 1.0 800.0 9 8 0.0 0 0 0.0 0.1580 9.0 3.0 1.0 800.0 9 8 0.0 0 0 0.0 0.1580 9.0 3.0 1.0 800.0 9 8 0.0 0 0 0.0 0.1580 9.0 3.0 1.0 800.0 9 8 0.0 0 0 0.0 0.1580 9.0 3.0 1.0 800.0 9 8 0.0 0 0 0.0 0.1580 9.0 3.0 1.0 800.0 9 8 0.0 0 0 0.0 0.1580 9.0 3.0 1.0 800.0 9 8 0.0 0 0 0.0 0.1580 9.0 3.0 1.0 800.0 9 8 0.0 0 0 0.0 0.1580 9.0 3.0 1.0 800.0 9 8 0.0 0 0 0.0 0.1580 9.0 3.0 1.0 800.0 9 8 0.0 0 0 0.0 0.1580 9.0 3.0 1.0 800.0 9 8 0.0 0 0 0.0 0.1580 9.0 3.0 1.0 800.0 9 8 0.0 0 0 0.0 0.1580 9.0 3.0 1.0 800.0 9 8 0.0 0 0 0.0 0.1580 9.0 3.0 1.0 800.0 9 8 0.0 0 0 0.0 0.1580 9.0 3.0 1.0 800.0 9 8 0.0 0 0 0.0 0.1580 9.0 3.0 1.0 800.0 9 8 0.0 0 0 0.0 0.1580 9.0 3.0 1.0 800.0 9 8 0.0 0 0 0.0 0.1580 9.0 3.0 1.0 800.0 9 8 0.0 0 0 0.0 0.1580 9.0 3.0 1.0 800.0 9 8 0.0 0 0 0.0 0.1580 9.0 3.0 1.0 800.0 9 8 0.0 0 0 0.0 0.1580 9.0 3.0 1.0 800.0 9 8 0.0 0 0 0.0 0.1580 9.0 3.0 1.0 800.0 9 8 0.0 0 0 0.0 0.1580 9.0 3.0 1.0 800.0 9 8 0.0 0 0 0.0 0.1580 9.0 3.0 1.0 800.0 9 8 0.0 0 0 0.0 0.1580 9.0 3.0 1.0 800.0 9 8 0.0 0 0 0.0 0.1580 9.0 3.0 1.0 800.0 9 8 0.0 0 0 0.0 0.1580 9.0 3.0 1.0 800.0 9 8 0.0 0 0 0.0 0.1580 9.0 3.0 1.0 800.0 9 8 0.0 0 0 0.0 0.1580 9.0 3.0 1.0 800.0 9 8 0.0 0 0 0.0 0.1580 9.0 3.0 1.0 800.0 9 8 0.0 0 0 0.0 0.1580 9.0 3.0 1.0 800.0 9 8 0.0 0 0 0.0 0.1580 9.0 3.0 1.0 800.0 9 8 0.0 0 0 0.0 0.1580 9.0 3.0 1.0 800.0 9 8 0.0 0 0 0.0 0.1580 9.0 3.0 1.0 800.0 9 8 0.0 0 0 0.0 0.1580 9.0 3.0 1.0 800.0 9 8 0.0 0 0 0.0 0.1580 9.0 3.0 1.0 800.0 9 8 0.0 0 0 0.0 0.1580 9.0 3.0 1.0 800.0 9 8 0.0 0 0 0.0 0.1580 9.0 3.0 1.0 800.0 9 8 0.0 0 0 0.0 0.1580 9.0 3.0 1.0 800.0 9 8 0.0 0 0 0.0 0.1580 9.0 3.0 1.0 800.0 9 8 0.0 0 0 0.0 0.1580 9.0 3.0 1.0 800.0 9 8 0.0 0 0 0.0 0.1580 9.0 3.0 1.0 800.0 9 8 0.0 0 0 0.0Water usage: drinking^hosedown^flushing (L)0 0 0Annual Effluent Volume (ML)57.700001Last entry for workDays.SelectedString7 days/weekLast entry for months.SelectedStringAll yearLast day loaded to screen1_____________________________________________________________

file:///C|/Documents%20and%20Settings/megana/Desktop/Appendix%203b%20-%20Modelling%20data%20-%20Sar6o.txt-.txt[9/10/2012 3:55:33 PM]
***************************************** SUMMARY OUTPUT MEDLI Version 1.30
Data Set: Sar6 Run Date: 10/05/12 Time:11:14:21.13*****************************************
GENERAL INFORMATION*******************Title: QCVS Subject: Sarina Development Client: QCV Pty Ltd User: Alpha Concepts Time: Thu May 10 10:53:36 2012 Comments: [no entry]
RUN PERIOD**********
Starting Date 1/ 1/1960Ending Date 31/12/2011Run Length 52 years 0 days _____________________________________________________________________________________
CLIMATE INFORMATION*******************
Enterprise site: Sarina -21.5 deg S 149.2 deg EWeather station: Sarina_21.400S_149.200E (Interpo
ANNUAL TOTALS 10 Percentile 50 percentile 90 PercentileRainfall mm/year 1013. 1529. 2646.Pan Evap mm/year 1706. 1838. 1972.
MONTHLY Jan Feb Mar Apr May Jun Jul Aug Sep Oct Nov Dec YearRainfall (mm) 313 361 255 127 85 50 33 35 24 48 138 198 1666Pan Evap (mm) 190 158 162 135 112 93 103 126 159 192 200 205 1834Ave Max Temp DegC 30 30 29 27 25 22 22 23 26 28 30 30 26Ave Min Temp DegC 23 23 21 19 16 13 11 13 15 18 21 22 17Rad (MJ/m2/day) 22 20 19 18 15 15 16 19 22 24 24 24 19-------------------------------------------------------------------------------------MONTHLY IRRIGATION******************
Irrigation (mm) 60 56 62 60 62 60 61 61 58 58 55 58 711_____________________________________________________________________________________
SOIL PROPERTIES***************

file:///C|/Documents%20and%20Settings/megana/Desktop/Appendix%203b%20-%20Modelling%20data%20-%20Sar6o.txt-.txt[9/10/2012 3:55:33 PM]
Soil type: Low Perm Red Brown Earth
SOIL WATER PROPERTIES
Layer 1 Layer 2 Layer 3 Layer 4Bulk Density (g/cm3) 1.4 1.5 1.5 1.5Porosity (mm/layer) 46.4 218.9 271.7 130.2Saturated Water Content (mm/layer) 46.0 217.5 268.8 128.4Drained Upper Limit (mm/layer) 25.7 160.0 203.4 96.9Lower Storage Limit (mm/layer) 8.6 100.5 153.6 78.6Air Dry Moisture Content (mm/layer) 4.3Layer Thickness (mm) 100.0 500.0 600.0 300.0
Profile Max RootzoneTotal Saturated Water Content (mm) 660.7 353.1Total Drained Upper Limit (mm) 486.0 253.5Total Lower Storage Limit (mm) 341.3 160.3Total Air Dry Moisture Content (mm) 5.7 5.0Total Depth (mm) 1500.0 800.0
Maximum Plant Available Water Capacity 93.2Saturated Hydraulic Conductivity At Surface (mm/hr) 20.0 Limiting (mm/hr) 0.5
RUNOFF
Runoff curve No II 75.0
SOIL EVAPORATION
CONA (mm/day^0.5) 4.0URITCH (mm) 10.0_____________________________________________________________________________________
AVERAGE WASTE STREAM********************
Other waste stream(All values relate to influent after any screening and recycling, if applicable).
Inflow Volume (ML/year) 57.71Nitrogen (tonne/year) 0.52Phosphorus (tonne/year) 0.17Salinity (tonne/year) 46.17
Nitrogen Concentration (mg/L) 9.00Phosphorus Concentration (mg/L) 3.00Salinity (mg/L) 800.00Salinity (dS/m) 1.25
WASTE STREAM DETAILS (for last inflow event):Nitrogen Concentration (mg/L) 9.00

file:///C|/Documents%20and%20Settings/megana/Desktop/Appendix%203b%20-%20Modelling%20data%20-%20Sar6o.txt-.txt[9/10/2012 3:55:33 PM]
Phosphorus Concentration (mg/L) 3.00TDS Concentration (mg/L) 800.00Salinity (dS/m) 1.25_____________________________________________________________________________________
IRRIGATION WATER****************
Irrigation triggered every 1 daysIrrigating a fixed amount of 2 mm
AREA
Total Irrigation Area (ha) 8.00
VOLUMES
Total Irrigation (ML/year) 56.95Minimum Volume must be full irrig. requiremtMaximum Volume must be full irrig. requiremtMaximum Vol. Available For Shandying (ML/yr) 0.00
IRRIGATION CONCENTRATIONS
Average salinity of Irrigation (dS/m) 1.14Average salinity of Irrigation (mg/L) 732.39Average Nitrogen Conc of Irrigation Before ammonia loss (mg/L) 3.16 After ammonia loss (mg/L) 3.04Average Phosphorus Conc of Irrigation (mg/L) 2.72_____________________________________________________________________________________
FRESH WATER USAGE*****************
Irrigation (shandying) water (ML/yr) 0.00
Avg volume of fresh water used (ML/yr) 0.00
Annual allocation (ML/yr) N/A
POND INFORMATION****************
POND GEOMETRY Pond 1 Pond 2
Final pond volume (ML) 0.60 20.70Final liquid volume (ML) 0.57 20.70Final sludge volume (ML) 0.03 0.00Average pond volume (ML) 0.60 20.92

file:///C|/Documents%20and%20Settings/megana/Desktop/Appendix%203b%20-%20Modelling%20data%20-%20Sar6o.txt-.txt[9/10/2012 3:55:33 PM]
Average active volume (ML) 0.59 20.92Maximum pond volume (ML) 0.60 28.00Minimum allowable pond volume (ML) 0.02 12.91Average pond depth (m) 4.30 1.14Pond depth at outlet (m) 4.30 1.50Maximum water surface area (m2 x1000) 0.14 19.08Pond catchment area (m2 x1000) 0.19 19.63Pond footprint length (m) 13.81 140.12Pond footprint width (m) 13.81 140.12For 1st Pond: Optimal anaerobic pond volume (ML) 0.0 (incl. 10 yrs sludge storage) Required active volume (ML) 0.0 @ VS Loading Rate (kg/m3/d) of 0.077Optimal vol. for subsequent pond(s) (ML) 3.2 (assumes 20 day retention time)Minimum pond volume for irrigation (ML) 12.9 (plus the volume due to sludge)
POND VOLATILE SOLIDS LOAD
Effective VS loading rate * (kg/m3) 0.002* avg VS load/avg active volume
POND WATER BALANCE
Inflow of Effluent to pond system (ML/yr) 57.71Recycle Volume from pond system (ML/yr) 0.00Rain water added to pond system (ML/yr) 32.71Evaporation loss from pond system (ML/yr) 24.22Seepage loss from pond system (ML/yr) 0.69Irrigation from last pond (ML/yr) 56.95Volume of overtopping (ML/yr) 8.43Sludge accumulated (ML/yr) 0.00 Sludge accumulated (t DM/yr) 0.32Sludge removed (ML/yr) 0.00No of desludging events every 10 years 0.00Increase in pond water volume (ML/yr) 0.13
OVERTOPPING EVENTS
Volume of overtopping (ML/yr) 8.43No. of days pond overtops per 10 years 124.04Average Length of overtopping events (days) 3.10% Reuse 86.20No. of overtopping events every 10 years > 0.000 ML 40.00 > 0.019 ML* 38.85 > 1.000 ML 17.69 > 2.000 ML 11.54 > 5.000 ML 4.42 > 10.000 ML 1.73 > 20.000 ML 0.19 > 50.000 ML 0.00* Volume equivalent to 1 mm depth of water
>>> NO-IRRIGATION EVENTS <<<
file:///C|/Documents%20and%20Settings/megana/Desktop/Appendix%203b%20-%20Modelling%20data%20-%20Sar6o.txt-.txt[9/10/2012 3:55:33 PM]
No. periods/year without irrigable effluent 0.00Average Length of such periods (days) 0.00
POND NITROGEN BALANCE
Nitrogen Added by Effluent (tonne/yr) 0.52 Irrig. from pond (ML/yr) 56.9Nitrogen removed by Irrigation (tonne/yr) 0.18Nitrogen removed by Volatilisation(tonne/yr) 0.31Nitrogen removed by Seepage (tonne/yr) 0.00Nitrogen accumulated in Sludge (tonne/yr) 0.01Nitrogen lost by Overtopping (tonne/yr) 0.02Nitrogen involved in Recycling (tonne/yr) 0.00Increase in pond Nitrogen (tonne/yr) 0.00
POND PHOSPHORUS BALANCE
Phosphorus Added by Effluent (tonne/yr) 0.17 Irrig. from pond (ML/yr) 56.9Phosphorus removed by Irrigation (tonne/yr) 0.15Phosphorus removed by Seepage (tonne/yr) 0.00Phosphorus accumulated in Sludge (tonne/yr) 0.00Phosphorus lost by Overtopping (tonne/yr) 0.01Phosphorus involved in Recycling (tonne/yr) 0.00Increase in pond Phosphorus (tonne/yr) 0.00
POND SALINITY BALANCE
Salinity Added by Effluent (tonne/yr) 46.17Salinity removed by Irrigation (tonne/yr) 41.71Salinity removed by Seepage (tonne/yr) 0.51Salinity lost by Overtopping (tonne/yr) 3.64Salinity involved in Recycling (tonne/yr) 0.00Increase in pond Salinity (tonne/yr) 0.31
POND CONCENTRATIONS Pond 1 Pond 2
Average Nitrogen Conc of Pond Liquid (mg/L) 8.8 3.1Average Phosphorus Conc of Pond Liquid(mg/L) 3.0 2.6Average TDS Conc of Pond Liquid (mg/L) 800.0 705.3Average Salinity of Pond Liquid (dS/m) 1.3 1.1Average Potassium Conc of Pond Liquid (mg/L) 1.0 0.9
(On final day of simulation)Nitrogen Conc of Pond Liquid (mg/L) 8.8 3.2Phosphorus Conc of Pond Liquid (mg/L) 3.0 2.8TDS Conc of Pond Liquid (mg/L) 800.0 755.8EC of Pond Liquid (dS/m) 1.3 1.2Potassium Conc of Pond Liquid (mg/L) 1.0 0.9
REMOVED SLUDGE - NUTRIENT & SALT CONCENTRATIONS
Nitrogen in removed Sludge (db) (kg/tonne) 0.00Phosphorus in removed Sludge (db) (kg/tonne) 0.00Salt in removed Sludge (db) (kg/tonne) 0.00

file:///C|/Documents%20and%20Settings/megana/Desktop/Appendix%203b%20-%20Modelling%20data%20-%20Sar6o.txt-.txt[9/10/2012 3:55:33 PM]
Potassium in removed Sludge (db) (kg/tonne) 0.00
REMOVED SLUDGE - NUTRIENT & SALT MASSES
Nitrogen in removed Sludge (tonne/yr) 0.00Phosphorus in removed Sludge (tonne/yr) 0.00Salt in removed Sludge (mass bal.)(tonne/yr) 0.00Salt in removed Sludge (tonne/yr) 0.00Potm. in removed Sludge (mass bal.)(tonne/yr 0.00Potassium in removed Sludge (tonne/yr) 0.00_____________________________________________________________________________________
LAND DISPOSAL AREA******************
WATER BALANCE-------------(Initial soil water assumed to be at field capacity)(Irrigated up to 2.15% of field capacity)Rainfall (mm/year) 1666.1 Irrigation Area (ha) 8.0Irrigation (mm/year) 711.8Soil Evaporation (mm/year) 72.7Transpiration (mm/year) 1131.2Runoff (mm/year) 450.4Drainage (mm/year) 722.4Change in soil moisture (mm/year) 1.2
ANNUAL TOTALS
Year Rain Irrig Sevap Trans Runoff Drain Change (mm) (mm) (mm) (mm) (mm) (mm) (mm) _____________________________________________________________________________ 1960 1913.0 732.0 425.5 832.9 723.6 627.6 35.4 1961 1161.0 714.0 378.2 818.5 116.8 604.2 -42.7 1962 1411.0 710.0 0.0 1159.3 115.9 681.4 164.4 1963 2244.0 730.0 369.1 777.0 1173.3 885.5 -230.9 1964 1228.0 732.0 0.0 1256.2 29.0 632.5 42.2 1965 965.0 638.0 0.0 1159.2 1.6 430.9 11.3 1966 1002.0 676.0 0.0 1253.6 21.8 472.8 -70.2 1967 1575.0 718.0 0.0 1249.3 110.0 735.0 198.7 1968 2049.0 732.0 0.0 1177.3 1054.5 743.6 -194.4 1969 1323.0 712.0 0.0 1266.1 53.3 633.0 82.5 1970 1899.0 730.0 0.0 1359.9 545.0 567.0 157.1 1971 1781.0 730.0 287.1 975.5 297.1 983.5 -32.2 1972 1458.0 710.0 0.0 1138.6 621.7 655.2 -247.6 1973 2026.0 712.0 0.0 1176.7 279.2 1003.4 278.7 1974 3164.0 730.0 342.3 804.7 1893.3 1026.6 -173.0 1975 1938.0 730.0 0.0 1181.0 336.0 970.5 180.5 1976 2049.0 732.0 0.0 1199.5 755.9 926.2 -100.6 1977 1746.0 730.0 281.4 828.8 539.4 902.6 -76.1 1978 1482.0 730.0 0.0 1145.5 310.5 721.4 34.6 1979 3194.0 730.0 0.0 1162.1 1874.8 767.0 120.1 1980 1470.0 732.0 0.0 1235.9 344.3 752.6 -130.8

file:///C|/Documents%20and%20Settings/megana/Desktop/Appendix%203b%20-%20Modelling%20data%20-%20Sar6o.txt-.txt[9/10/2012 3:55:33 PM]
1981 1835.0 730.0 0.0 1100.0 354.6 1120.1 -9.8 1982 1102.0 728.0 314.2 750.6 185.8 670.2 -90.7 1983 1391.0 720.0 3.5 1254.6 160.4 638.3 54.2 1984 910.0 688.0 346.5 826.2 10.4 422.0 -7.2 1985 1662.0 708.0 0.5 1184.6 282.7 893.1 9.1 1986 1119.0 730.0 0.0 1330.2 4.7 562.0 -47.9 1987 1111.0 696.0 0.0 1277.2 0.4 489.6 39.7 1988 2360.0 732.0 0.0 1241.2 659.9 1038.7 152.2 1989 2016.0 730.0 278.2 825.7 506.0 1326.9 -190.7 1990 2741.0 730.0 17.0 1032.7 1411.9 756.7 252.7 1991 2551.0 730.0 0.0 1180.5 1592.4 678.7 -170.6 1992 964.0 684.0 0.0 1226.4 76.0 381.1 -35.6 1993 1254.0 708.0 0.0 1341.4 193.8 422.5 4.3 1994 1153.0 658.0 0.0 1243.5 176.6 410.1 -19.2 1995 1003.0 648.0 0.0 1335.3 4.9 351.9 -41.1 1996 1422.0 728.0 0.0 1335.8 150.0 579.8 84.4 1997 1243.0 718.0 0.0 1196.6 230.9 524.7 8.8 1998 1591.0 730.0 0.0 1220.5 130.8 964.1 5.6 1999 1628.0 730.0 0.0 1199.6 283.4 817.2 57.8 2000 2773.0 732.0 0.0 1162.2 1123.1 1163.5 56.1 2001 1022.0 730.0 0.0 1242.1 95.3 560.0 -145.5 2002 817.0 578.0 0.0 1148.9 39.3 287.9 -81.2 2003 1196.0 662.0 0.0 1227.8 169.6 348.5 112.1 2004 1087.0 658.0 0.0 1280.9 17.1 484.6 -37.6 2005 1105.0 682.0 0.0 1242.4 165.4 472.6 -93.4 2006 1246.0 706.0 0.0 1180.8 24.6 639.2 107.4 2007 1917.0 730.0 354.2 871.0 380.4 911.0 130.3 2008 1949.0 732.0 337.6 827.6 844.1 784.5 -112.8 2009 1720.0 730.0 46.6 1173.1 383.6 768.2 78.5 2010 3377.0 730.0 0.0 1019.4 1543.6 1453.8 90.2 2011 2293.0 730.0 0.0 1186.2 1023.9 920.1 -107.2_____________________________________________________________________________
NUTRIENT BALANCE-----------------
NITROGEN
Total N irrigated from ponds (kg/ha/year) 22.5 % of Total as ammonium 20.0Nitrogn lost by ammonia volat.(kg/ha/year) 0.9 Deep Drainage (mm/year) 722.4Nitrogen added in irrigation (kg/ha/year) 21.6Nitrogen added in seed (kg/ha/year) 0.1Nitrogen removed by crop (kg/ha/year) 86.3Denitrification (kg/ha/year) 1.2Leached NO3-N (kg/ha/year) 0.6Change in soil organic-N (kg/ha/year) -65.3Change in soil solution NH4-N (kg/ha/year) 0.0Change in soil solution NO3-N (kg/ha/year) -1.1Change in adsorbed NH4-N (kg/ha/year) 0.0Initial soil organic-N (kg/ha) 3520.0Final soil organic-N (kg/ha) 124.6Initial soil inorganic-N (kg/ha) 55.2Final soil inorganic-N (kg/ha) 0.1

file:///C|/Documents%20and%20Settings/megana/Desktop/Appendix%203b%20-%20Modelling%20data%20-%20Sar6o.txt-.txt[9/10/2012 3:55:33 PM]
Average N03-N conc in the root zone (mg/L) 0.3Average N03-N conc below root zone (mg/L) 0.2Average N03-N conc of deep drainage (mg/L) 0.1
PHOSPHORUS
Phosphorus added in irrigatn (kg/ha/year) 19.4 % of Total as phosphate 100.0Phosphorus added in seed (kg/ha/year) 0.0Phosphorus removed by crop (kg/ha/year) 21.8Leached PO4-P (kg/ha/year) 0.6Change in dissolved PO4-P (kg/ha/year) 0.0Change in adsorbed PO4-P (kg/ha/year) -3.0Average P04-P conc in the root zone (mg/L) 0.0Average P04-P conc below root zone (mg/L) 0.0
SOIL P STORAGE LIFE
Year YearNo. Tot P stored P leached in year kg/ha kg/ha _____________________________________________________________________________ 1960 1 3231.8 0.6 1961 2 3208.8 0.6 1962 3 3193.1 0.7 1963 4 3178.1 0.9 1964 5 3171.8 0.6 1965 6 3146.4 0.4 1966 7 3132.6 0.5 1967 8 3120.1 0.7 1968 9 3113.0 0.7 1969 10 3094.0 0.6 1970 11 3081.6 0.5 1971 12 3073.9 0.9 1972 13 3074.7 0.6 1973 14 3058.4 0.9 1974 15 3048.3 0.9 1975 16 3040.5 0.8 1976 17 3038.8 0.8 1977 18 3024.0 0.8 1978 19 3019.9 0.6 1979 20 3011.6 0.6 1980 21 3011.7 0.6 1981 22 2998.2 0.9 1982 23 2996.1 0.5 1983 24 2998.8 0.5 1984 25 3006.5 0.3 1985 26 2998.9 0.7 1986 27 2995.9 0.4 1987 28 2997.5 0.4 1988 29 3004.5 0.8 1989 30 2993.9 1.0 1990 31 2995.5 0.6 1991 32 2992.5 0.5 1992 33 3001.0 0.3 1993 34 2995.1 0.3

file:///C|/Documents%20and%20Settings/megana/Desktop/Appendix%203b%20-%20Modelling%20data%20-%20Sar6o.txt-.txt[9/10/2012 3:55:33 PM]
1994 35 2998.1 0.3 1995 36 3002.4 0.3 1996 37 3013.4 0.4 1997 38 3009.2 0.4 1998 39 3013.7 0.7 1999 40 3015.8 0.6 2000 41 3026.7 0.8 2001 42 3019.1 0.4 2002 43 3024.9 0.2 2003 44 3031.1 0.2 2004 45 3045.8 0.3 2005 46 3043.4 0.3 2006 47 3049.4 0.4 2007 48 3056.0 0.6 2008 49 3069.0 0.5 2009 50 3065.4 0.5 2010 51 3069.3 1.0 2011 52 3070.3 0.6__________________________________________________________________________________________________________________________________________________________________
PLANT-----
Plant species: Coastal couch grass (Cynodon dac
PLANT WATER USE
Irrigation (mm/year) 712. Totl Irrigation Area(ha) 8.0Pan coefficient (%) 1.0Maximum crop coefficient (%) 0.8Average Plant Cover (%) 81.Average Plant Total Cover (%) 94.Average Plant Rootdepth (mm) 750.Average Plant Available Water Capacity (mm) 92.Average Plant Available Water (mm) 91.Yield produced per unit transp. (kg/ha/mm) 7.
PLANT NUTRIENT UPTAKE
Dry Matter Yield (Shoots) (kg/ha/yr) 7513.Net nitrogen removed by plant (kg/ha/yr) 86. Shoot Concn (%DM) 1.15Net phosphorus removed by plant (kg/ha/yr) 22. Shoot Concn (%DM) 0.29
AVERAGE MONTHLY GROWTH STRESS (0=no stress, 1=full stress)
Month Yield Nitr Temp Water Water kg/ha Defic Logging____________________________________________ 1 748. 0.6 0.0 0.0 0.1 2 618. 0.6 0.0 0.0 0.2 3 721. 0.5 0.0 0.0 0.1

file:///C|/Documents%20and%20Settings/megana/Desktop/Appendix%203b%20-%20Modelling%20data%20-%20Sar6o.txt-.txt[9/10/2012 3:55:33 PM]
4 675. 0.6 0.0 0.0 0.0 5 550. 0.6 0.2 0.0 0.0 6 361. 0.5 0.6 0.0 0.0 7 309. 0.4 0.7 0.0 0.0 8 465. 0.4 0.5 0.0 0.0 9 662. 0.4 0.2 0.0 0.0 10 743. 0.5 0.0 0.1 0.0 11 803. 0.5 0.0 0.1 0.0 12 858. 0.6 0.0 0.1 0.0
>>> NO-PLANT EVENTS <<<
%Days due to temperature stress 0.3%Days due to nitrogen stress 0.0No. of forced harvests per year 0.2No. of normal harvests per year 5.0_____________________________________________________________________________________
SALINITY--------
Salt tolerance - plant species: tolerant
Average EC of Irrigation Water (dS/m) 1.1 Irrigation (mm/year) 711.8Average EC of Rainwater (dS/m x10) 0.3 Rainfall (mm/year) 1666.1Average EC of Infiltrated water (dS/m) 0.5Av. water-upt-weightd rootzone EC(dS/m s.e.) 0.4EC soil soln (FC) at base of rootzone (dS/m) 1.3 Deep Drainage (mm/year) 722.4Reduction in Crop yield due to Salinity (%) 0.0Percentage of yrs that crop yld falls below 90% of potential because of soil salinity 0.0
Period ECrootzone ECbase Rel Yield sat ext in situ (dS/m) (dS/m) (%)____________________________________________ 1960 - 1964 0.38 1.21 100. 1961 - 1965 0.42 1.38 100. 1962 - 1966 0.42 1.43 100. 1963 - 1967 0.41 1.42 100. 1964 - 1968 0.42 1.49 100. 1965 - 1969 0.42 1.48 100. 1966 - 1970 0.40 1.40 100. 1967 - 1971 0.35 1.19 100. 1968 - 1972 0.37 1.19 100. 1969 - 1973 0.34 1.13 100. 1970 - 1974 0.31 0.96 100. 1971 - 1975 0.29 0.87 100. 1972 - 1976 0.28 0.85 100. 1973 - 1977 0.27 0.81 100. 1974 - 1978 0.29 0.86 100. 1975 - 1979 0.29 0.92 100. 1976 - 1980 0.31 0.98 100.

file:///C|/Documents%20and%20Settings/megana/Desktop/Appendix%203b%20-%20Modelling%20data%20-%20Sar6o.txt-.txt[9/10/2012 3:55:33 PM]
1977 - 1981 0.31 0.95 100. 1978 - 1982 0.33 1.02 100. 1979 - 1983 0.34 1.06 100. 1980 - 1984 0.39 1.24 100. 1981 - 1985 0.37 1.19 100. 1982 - 1986 0.42 1.43 100. 1983 - 1987 0.44 1.55 100. 1984 - 1988 0.38 1.31 100. 1985 - 1989 0.32 0.99 100. 1986 - 1990 0.32 1.02 100. 1987 - 1991 0.31 0.95 100. 1988 - 1992 0.31 0.95 100. 1989 - 1993 0.37 1.17 100. 1990 - 1994 0.45 1.63 100. 1991 - 1995 0.51 1.98 100. 1992 - 1996 0.53 2.16 100. 1993 - 1997 0.50 2.02 100. 1994 - 1998 0.44 1.61 100. 1995 - 1999 0.39 1.38 100. 1996 - 2000 0.32 1.06 100. 1997 - 2001 0.33 1.06 100. 1998 - 2002 0.34 1.11 100. 1999 - 2003 0.40 1.35 100. 2000 - 2004 0.44 1.56 100. 2001 - 2005 0.55 2.13 100. 2002 - 2006 0.53 2.06 100. 2003 - 2007 0.44 1.59 100. 2004 - 2008 0.40 1.33 100. 2005 - 2009 0.37 1.20 100. 2006 - 2010 0.29 0.90 100. 2007 - 2011 0.26 0.79 100._____________________________________________________________________________________
GROUNDWATER************
Average Groundwater Recharge (m3/day) 158.2Average Nitrate-N Conc of Recharge (mg/L) 0.1
Thickness of the Aquifer (m) 10.0Distance (m) from Irrigation Area to where Nitrate-N Conc in Groundwater is Calculated 400.0
Concentration of NITRATE-N in Groundwater (mg/L)----------------------------------------------
Year Depth Below Water Table Surface 0.0 m 5.0 m 9.0 m ____________________________________________ 1964 0.1 0.1 0.1 1969 0.1 0.1 0.1 1974 0.1 0.1 0.1 1979 0.1 0.1 0.1 1984 0.1 0.1 0.1
file:///C|/Documents%20and%20Settings/megana/Desktop/Appendix%203b%20-%20Modelling%20data%20-%20Sar6o.txt-.txt[9/10/2012 3:55:33 PM]
1989 0.1 0.1 0.1 1994 0.1 0.1 0.1 1999 0.1 0.1 0.1 2004 0.1 0.1 0.1 2009 0.1 0.1 0.1Last 2011 0.1 0.1 0.1_____________________________________________________________________________________
ACKNOWLEDGMENTS***************This run brought to you courtesy of:
MEDLIEXE.EXE : 1300468 bytes Mon Jun 23 06:20:34 2008
CRCPROJ.EXE : 1286656 bytes Mon Jun 23 06:20:38 2008
GRAPHS.EXE : 439296 bytes Mon Jun 23 06:20:36 2008
__________________________________________OTHER INDUSTRY INPUT PARAMETERS - DATA SUMMARY
Nature of Industry: other__________________________________________ 1 file(s) copied
UNCONDITIONAL FINISH

file:///C|/Documents%20and%20Settings/megana/Desktop/Appendix%203c%20-%20Modelling%20data%20-%20sar9i.txt-.txt[9/10/2012 3:55:36 PM]
Version 1.30 : GENERAL INFORMATION - CONTROL.PRMQCVSSarina DevelopmentQCV Pty LtdAlpha ConceptsThu May 10 12:00:25 2012[no entry]sar9-Version 1.30 : ITER.PRM~Grid Type (1=full grid,2=selected), Increm (side 1) ,Increm (side 2)1 5 5~Grid range (if full, max[area, vol], if not, co-ords for corners A[area,vol], B[area,vol], C[area,vol} x0y0, x1y1, x2y2)0 0~Costings Fixed, Units/ML, Units/ha0 10 70~Append results? (0 = no, other = yes)0---------------------------------------Version 1.30 : CLIMATE.PRM^Site nameSarina^Latitude (°S)21.5^Longitude (°E)149.2^Climate station sari^Run start date^ Run end date 1 1 1960 31 12 2011^Report start date^ Report end date 1 1 1960 1 1 1960---------------------------------------Version 1.30 : CROP.PRM - PASTURE OPTION^Pan coefficient1^Model option (1=monthly covers, 2=pasture, 3=crop, 4=seasonal rotation)2^SpeciesCoastal couch grass (Cynodon dactylon)^Salt tolerancetolerantGROWTH:^Max. crop coefficient^Max.root depth(mm)^Radiation use efficiency(kg/Ha)/(MJ/m2)^min Yield for Full Cover (kg/ha)0.8 800 3.5 3e+03^Max. shoot nitrogen(%dwt)^max. shoot phosphorus(%dwt)5.4 0.5HARVEST:^Residual green cover(%)^Residual dead cover(%)^Residual shoot biomass(kg/ha)^Harvest trigger yield (kg/ha)80 20 1.4e+03 2.8e+03^Leaf water interception store(mm)0.5TEMPERATURE:^Ct0(°C)^Ct1(°C)^Ct2(°C)^Ct3(°C)^Ct4(°C)^TT(degree days)
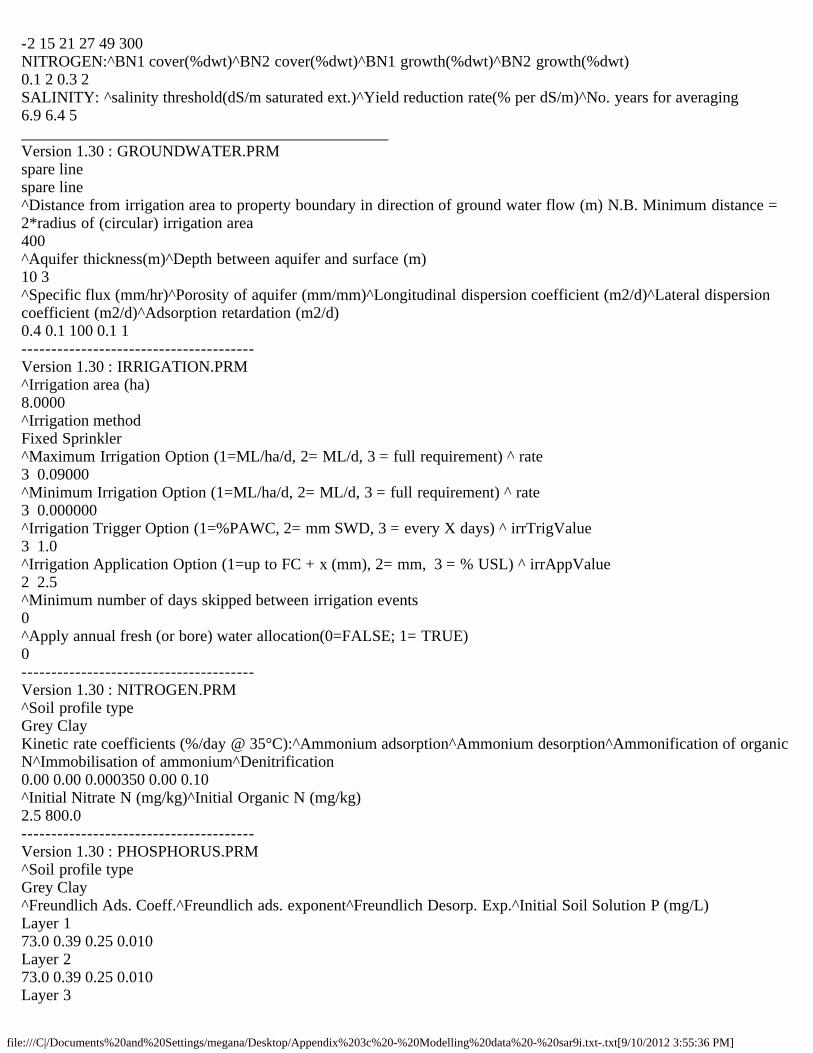
file:///C|/Documents%20and%20Settings/megana/Desktop/Appendix%203c%20-%20Modelling%20data%20-%20sar9i.txt-.txt[9/10/2012 3:55:36 PM]
-2 15 21 27 49 300NITROGEN:^BN1 cover(%dwt)^BN2 cover(%dwt)^BN1 growth(%dwt)^BN2 growth(%dwt)0.1 2 0.3 2SALINITY: ^salinity threshold(dS/m saturated ext.)^Yield reduction rate(% per dS/m)^No. years for averaging6.9 6.4 5______________________________________________Version 1.30 : GROUNDWATER.PRMspare linespare line^Distance from irrigation area to property boundary in direction of ground water flow (m) N.B. Minimum distance = 2*radius of (circular) irrigation area400^Aquifer thickness(m)^Depth between aquifer and surface (m)10 3^Specific flux (mm/hr)^Porosity of aquifer (mm/mm)^Longitudinal dispersion coefficient (m2/d)^Lateral dispersion coefficient (m2/d)^Adsorption retardation (m2/d)0.4 0.1 100 0.1 1---------------------------------------Version 1.30 : IRRIGATION.PRM^Irrigation area (ha)8.0000^Irrigation methodFixed Sprinkler^Maximum Irrigation Option (1=ML/ha/d, 2= ML/d, 3 = full requirement) ^ rate3 0.09000^Minimum Irrigation Option (1=ML/ha/d, 2= ML/d, 3 = full requirement) ^ rate3 0.000000^Irrigation Trigger Option (1=%PAWC, 2= mm SWD, 3 = every X days) ^ irrTrigValue3 1.0^Irrigation Application Option (1=up to FC + x (mm), 2= mm, 3 = % USL) ^ irrAppValue2 2.5^Minimum number of days skipped between irrigation events0^Apply annual fresh (or bore) water allocation(0=FALSE; 1= TRUE)0---------------------------------------Version 1.30 : NITROGEN.PRM^Soil profile typeGrey ClayKinetic rate coefficients (%/day @ 35°C):^Ammonium adsorption^Ammonium desorption^Ammonification of organic N^Immobilisation of ammonium^Denitrification0.00 0.00 0.000350 0.00 0.10^Initial Nitrate N (mg/kg)^Initial Organic N (mg/kg)2.5 800.0---------------------------------------Version 1.30 : PHOSPHORUS.PRM^Soil profile typeGrey Clay^Freundlich Ads. Coeff.^Freundlich ads. exponent^Freundlich Desorp. Exp.^Initial Soil Solution P (mg/L)Layer 173.0 0.39 0.25 0.010Layer 273.0 0.39 0.25 0.010Layer 3
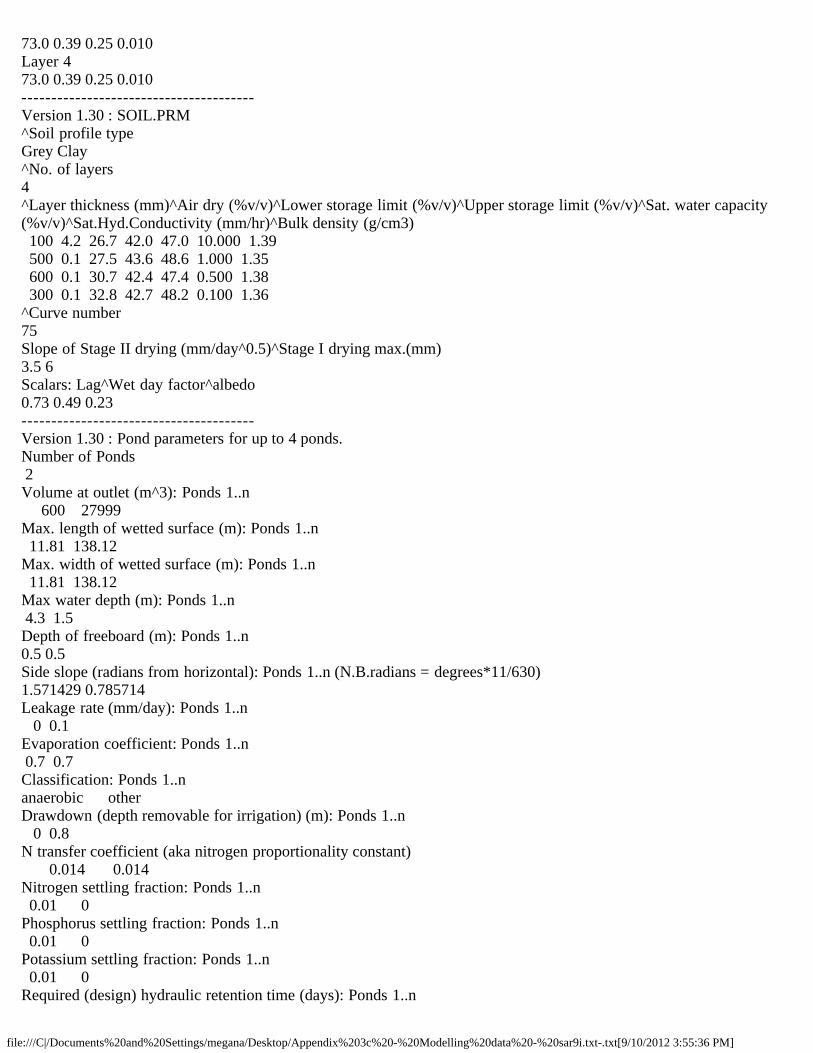
file:///C|/Documents%20and%20Settings/megana/Desktop/Appendix%203c%20-%20Modelling%20data%20-%20sar9i.txt-.txt[9/10/2012 3:55:36 PM]
73.0 0.39 0.25 0.010Layer 473.0 0.39 0.25 0.010---------------------------------------Version 1.30 : SOIL.PRM^Soil profile typeGrey Clay^No. of layers4^Layer thickness (mm)^Air dry (%v/v)^Lower storage limit (%v/v)^Upper storage limit (%v/v)^Sat. water capacity (%v/v)^Sat.Hyd.Conductivity (mm/hr)^Bulk density (g/cm3) 100 4.2 26.7 42.0 47.0 10.000 1.39 500 0.1 27.5 43.6 48.6 1.000 1.35 600 0.1 30.7 42.4 47.4 0.500 1.38 300 0.1 32.8 42.7 48.2 0.100 1.36^Curve number75Slope of Stage II drying (mm/day^0.5)^Stage I drying max.(mm)3.5 6Scalars: Lag^Wet day factor^albedo0.73 0.49 0.23---------------------------------------Version 1.30 : Pond parameters for up to 4 ponds.Number of Ponds 2Volume at outlet (m^3): Ponds 1..n 600 27999 Max. length of wetted surface (m): Ponds 1..n 11.81 138.12 Max. width of wetted surface (m): Ponds 1..n 11.81 138.12 Max water depth (m): Ponds 1..n 4.3 1.5 Depth of freeboard (m): Ponds 1..n0.5 0.5 Side slope (radians from horizontal): Ponds 1..n (N.B.radians = degrees*11/630)1.571429 0.785714 Leakage rate (mm/day): Ponds 1..n 0 0.1 Evaporation coefficient: Ponds 1..n 0.7 0.7 Classification: Ponds 1..nanaerobic other Drawdown (depth removable for irrigation) (m): Ponds 1..n 0 0.8 N transfer coefficient (aka nitrogen proportionality constant) 0.014 0.014Nitrogen settling fraction: Ponds 1..n 0.01 0 Phosphorus settling fraction: Ponds 1..n 0.01 0 Potassium settling fraction: Ponds 1..n 0.01 0 Required (design) hydraulic retention time (days): Ponds 1..n

file:///C|/Documents%20and%20Settings/megana/Desktop/Appendix%203c%20-%20Modelling%20data%20-%20sar9i.txt-.txt[9/10/2012 3:55:36 PM]
3 20 Actual hydraulic retention time (days): Ponds 1..n 4.849 226.262 spare linespare lineSludge accumulation rate (m^3/kg TS): Ponds 1..n 0.001 0 Pond efficiency factor (K value of an anaerobic pond in this area)1.14881Maximum design loading rate of Volatile Solids into first pond (kg/m3/day) at K=1.00.067Daily amount drawn from last pond for recirculation (m3)0Starting depth (2=half full,1=full,0=empty) 2 2 Daily non-effluent inflow volume (m3) assuming no recycling occurs^Total dissolved salts (mg/l) in fresh water^total N (mg/L)0 0 0Length/Width ratio: Ponds 1..n 1 1 Desludging protocol option1 Desludge when sludge reaches 40% of total pond volumeDesludge threshold as % total pond volume40Conductivity (1st pond) (dS/m) at which use of recycled flushing water (from last pond) ceases &^resumes (N.B. Input under Piggery Technical Water Details)12 8Recycling Pond2Rain catchment as a % of max surface area: Ponds 1..n 0 100 Area exposed to evaporation as a % of surface area: Ponds 1..n 0 100 User-specified starting pond concentrations (0 = FALSE; 1 = TRUE)1initial [N] mg/L: Ponds 1..n 30 0 initial [P] mg/L: Ponds 1..n 10 0 initial [K] mg/L: Ponds 1..n 2 0 initial [TDS] mg/L: Ponds 1..n 8e+02 0 _______________________________________________________Version 1.30 : Effluent pretreatment parameter fileTreatment typeNoneAmounts Removed (%):^Vol^Nitrogen^Phosphorus^Potassium^TDS^Total Solids^Volatile Solids^E.coli^Salmonella^Virus^Helminth0 0 0 0 0 0 0 0 0 0 0_______________________________________________________INDUSTRY=OTHER dummy line dummy line

file:///C|/Documents%20and%20Settings/megana/Desktop/Appendix%203c%20-%20Modelling%20data%20-%20sar9i.txt-.txt[9/10/2012 3:55:36 PM]
Nature of IndustryotherNumber of livestock0__________________________________________Version 1.30 : SHANDY.PRM for Shandying waterspare linespare line^Fresh water available (1=YES, other=no)0^Shandying water salinity (dS/m)0.5^Shandying water nitrogen conc.(mg/L)1^Max. allowable salinity of irrigation water (dS/m)0^Max. allowable nitrogen conc. of irrigation water (mg/L)0^Maximum daily supply of shandying water (ML/day)0^Use minimal dilution i.e. shandy primarily for effluent disposal (0=NO;1=YES)0max dam Vol^max dam Depth^dam Coeff^dam Exponent0 0 1 0---------------------------------------Version 1.30 : NBREAKUP.PRMspare linespare lineNitrogen Components in Irrigation Effluent (%):^Nitrate N^Ammonium N^organic N70 20 10 ^Ammonium loss in irrigation (%)20---------------------------------------Version 1.30 : BUGS.PRM^Bug group, ^Bug sp, ^units, ^a coef, ^b coefbact E.coli (countsx10^6Per100mL) 2.60000 1.09000bact Salmonella (countsPer100mL) 1.04000 1.09000viru Virus (countsx10^6Per100mL) 0.08718 0.02840helm Helminth (countsPerLitre) 0.20000 0.50000^Influent temp (oC) (-1 if same as ambient air temp),^ off-set0.0 2.0^Pond Shortcircuiting % (0=none 100=full))0.0 0.0 0.0 0.0^ adjustor (Max No. days daily temperature averaged for pond 1)90.0---------------------------------------Version 1.30 : WASTE.PRM Waste stream parameter fileIndustry Type (Feedlot=1;Piggery=2;Abattoir=3;SewageTP: Leaky = 4 1, Avg = 4 2, non-Leaky = 4 3; Other=5,Dairy=6)5 20 Parameters and units: Daily waste characteristics for calendar leap year (366 days) Effluent TN TP K TDS TS VS E.coli^Salmonella^Virus^Helminth ML mg/L mg/L mg/L mg/L mg/L mg/L (countsx10^6Per100mL) (countsPer100mL)

file:///C|/Documents%20and%20Settings/megana/Desktop/Appendix%203c%20-%20Modelling%20data%20-%20sar9i.txt-.txt[9/10/2012 3:55:36 PM]
(countsx10^6Per100mL) (countsPerLitre) 0.1240 9.0 3.0 1.0 800.0 9 8 0.0 0 0 0.0 0.1240 9.0 3.0 1.0 800.0 9 8 0.0 0 0 0.0 0.1240 9.0 3.0 1.0 800.0 9 8 0.0 0 0 0.0 0.1240 9.0 3.0 1.0 800.0 9 8 0.0 0 0 0.0 0.1240 9.0 3.0 1.0 800.0 9 8 0.0 0 0 0.0 0.1240 9.0 3.0 1.0 800.0 9 8 0.0 0 0 0.0 0.1240 9.0 3.0 1.0 800.0 9 8 0.0 0 0 0.0 0.1240 9.0 3.0 1.0 800.0 9 8 0.0 0 0 0.0 0.1240 9.0 3.0 1.0 800.0 9 8 0.0 0 0 0.0 0.1240 9.0 3.0 1.0 800.0 9 8 0.0 0 0 0.0 0.1240 9.0 3.0 1.0 800.0 9 8 0.0 0 0 0.0 0.1240 9.0 3.0 1.0 800.0 9 8 0.0 0 0 0.0 0.1240 9.0 3.0 1.0 800.0 9 8 0.0 0 0 0.0 0.1240 9.0 3.0 1.0 800.0 9 8 0.0 0 0 0.0 0.1240 9.0 3.0 1.0 800.0 9 8 0.0 0 0 0.0 0.1240 9.0 3.0 1.0 800.0 9 8 0.0 0 0 0.0 0.1240 9.0 3.0 1.0 800.0 9 8 0.0 0 0 0.0 0.1240 9.0 3.0 1.0 800.0 9 8 0.0 0 0 0.0 0.1240 9.0 3.0 1.0 800.0 9 8 0.0 0 0 0.0 0.1240 9.0 3.0 1.0 800.0 9 8 0.0 0 0 0.0 0.1240 9.0 3.0 1.0 800.0 9 8 0.0 0 0 0.0 0.1240 9.0 3.0 1.0 800.0 9 8 0.0 0 0 0.0 0.1240 9.0 3.0 1.0 800.0 9 8 0.0 0 0 0.0 0.1240 9.0 3.0 1.0 800.0 9 8 0.0 0 0 0.0 0.1240 9.0 3.0 1.0 800.0 9 8 0.0 0 0 0.0 0.1240 9.0 3.0 1.0 800.0 9 8 0.0 0 0 0.0 0.1240 9.0 3.0 1.0 800.0 9 8 0.0 0 0 0.0 0.1240 9.0 3.0 1.0 800.0 9 8 0.0 0 0 0.0 0.1240 9.0 3.0 1.0 800.0 9 8 0.0 0 0 0.0 0.1240 9.0 3.0 1.0 800.0 9 8 0.0 0 0 0.0 0.1240 9.0 3.0 1.0 800.0 9 8 0.0 0 0 0.0 0.1240 9.0 3.0 1.0 800.0 9 8 0.0 0 0 0.0 0.1240 9.0 3.0 1.0 800.0 9 8 0.0 0 0 0.0 0.1240 9.0 3.0 1.0 800.0 9 8 0.0 0 0 0.0 0.1240 9.0 3.0 1.0 800.0 9 8 0.0 0 0 0.0 0.1240 9.0 3.0 1.0 800.0 9 8 0.0 0 0 0.0 0.1240 9.0 3.0 1.0 800.0 9 8 0.0 0 0 0.0 0.1240 9.0 3.0 1.0 800.0 9 8 0.0 0 0 0.0 0.1240 9.0 3.0 1.0 800.0 9 8 0.0 0 0 0.0 0.1240 9.0 3.0 1.0 800.0 9 8 0.0 0 0 0.0 0.1240 9.0 3.0 1.0 800.0 9 8 0.0 0 0 0.0 0.1240 9.0 3.0 1.0 800.0 9 8 0.0 0 0 0.0 0.1240 9.0 3.0 1.0 800.0 9 8 0.0 0 0 0.0 0.1240 9.0 3.0 1.0 800.0 9 8 0.0 0 0 0.0 0.1240 9.0 3.0 1.0 800.0 9 8 0.0 0 0 0.0 0.1240 9.0 3.0 1.0 800.0 9 8 0.0 0 0 0.0 0.1240 9.0 3.0 1.0 800.0 9 8 0.0 0 0 0.0 0.1240 9.0 3.0 1.0 800.0 9 8 0.0 0 0 0.0 0.1240 9.0 3.0 1.0 800.0 9 8 0.0 0 0 0.0 0.1240 9.0 3.0 1.0 800.0 9 8 0.0 0 0 0.0 0.1240 9.0 3.0 1.0 800.0 9 8 0.0 0 0 0.0 0.1240 9.0 3.0 1.0 800.0 9 8 0.0 0 0 0.0 0.1240 9.0 3.0 1.0 800.0 9 8 0.0 0 0 0.0

file:///C|/Documents%20and%20Settings/megana/Desktop/Appendix%203c%20-%20Modelling%20data%20-%20sar9i.txt-.txt[9/10/2012 3:55:36 PM]
0.1240 9.0 3.0 1.0 800.0 9 8 0.0 0 0 0.0 0.1240 9.0 3.0 1.0 800.0 9 8 0.0 0 0 0.0 0.1240 9.0 3.0 1.0 800.0 9 8 0.0 0 0 0.0 0.1240 9.0 3.0 1.0 800.0 9 8 0.0 0 0 0.0 0.1240 9.0 3.0 1.0 800.0 9 8 0.0 0 0 0.0 0.1240 9.0 3.0 1.0 800.0 9 8 0.0 0 0 0.0 0.1240 9.0 3.0 1.0 800.0 9 8 0.0 0 0 0.0 0.1240 9.0 3.0 1.0 800.0 9 8 0.0 0 0 0.0 0.1240 9.0 3.0 1.0 800.0 9 8 0.0 0 0 0.0 0.1240 9.0 3.0 1.0 800.0 9 8 0.0 0 0 0.0 0.1240 9.0 3.0 1.0 800.0 9 8 0.0 0 0 0.0 0.1240 9.0 3.0 1.0 800.0 9 8 0.0 0 0 0.0 0.1240 9.0 3.0 1.0 800.0 9 8 0.0 0 0 0.0 0.1240 9.0 3.0 1.0 800.0 9 8 0.0 0 0 0.0 0.1240 9.0 3.0 1.0 800.0 9 8 0.0 0 0 0.0 0.1240 9.0 3.0 1.0 800.0 9 8 0.0 0 0 0.0 0.1240 9.0 3.0 1.0 800.0 9 8 0.0 0 0 0.0 0.1240 9.0 3.0 1.0 800.0 9 8 0.0 0 0 0.0 0.1240 9.0 3.0 1.0 800.0 9 8 0.0 0 0 0.0 0.1240 9.0 3.0 1.0 800.0 9 8 0.0 0 0 0.0 0.1240 9.0 3.0 1.0 800.0 9 8 0.0 0 0 0.0 0.1240 9.0 3.0 1.0 800.0 9 8 0.0 0 0 0.0 0.1240 9.0 3.0 1.0 800.0 9 8 0.0 0 0 0.0 0.1240 9.0 3.0 1.0 800.0 9 8 0.0 0 0 0.0 0.1240 9.0 3.0 1.0 800.0 9 8 0.0 0 0 0.0 0.1240 9.0 3.0 1.0 800.0 9 8 0.0 0 0 0.0 0.1240 9.0 3.0 1.0 800.0 9 8 0.0 0 0 0.0 0.1240 9.0 3.0 1.0 800.0 9 8 0.0 0 0 0.0 0.1240 9.0 3.0 1.0 800.0 9 8 0.0 0 0 0.0 0.1240 9.0 3.0 1.0 800.0 9 8 0.0 0 0 0.0 0.1240 9.0 3.0 1.0 800.0 9 8 0.0 0 0 0.0 0.1240 9.0 3.0 1.0 800.0 9 8 0.0 0 0 0.0 0.1240 9.0 3.0 1.0 800.0 9 8 0.0 0 0 0.0 0.1240 9.0 3.0 1.0 800.0 9 8 0.0 0 0 0.0 0.1240 9.0 3.0 1.0 800.0 9 8 0.0 0 0 0.0 0.1240 9.0 3.0 1.0 800.0 9 8 0.0 0 0 0.0 0.1240 9.0 3.0 1.0 800.0 9 8 0.0 0 0 0.0 0.1240 9.0 3.0 1.0 800.0 9 8 0.0 0 0 0.0 0.1240 9.0 3.0 1.0 800.0 9 8 0.0 0 0 0.0 0.1240 9.0 3.0 1.0 800.0 9 8 0.0 0 0 0.0 0.1240 9.0 3.0 1.0 800.0 9 8 0.0 0 0 0.0 0.1240 9.0 3.0 1.0 800.0 9 8 0.0 0 0 0.0 0.1240 9.0 3.0 1.0 800.0 9 8 0.0 0 0 0.0 0.1240 9.0 3.0 1.0 800.0 9 8 0.0 0 0 0.0 0.1240 9.0 3.0 1.0 800.0 9 8 0.0 0 0 0.0 0.1240 9.0 3.0 1.0 800.0 9 8 0.0 0 0 0.0 0.1240 9.0 3.0 1.0 800.0 9 8 0.0 0 0 0.0 0.1240 9.0 3.0 1.0 800.0 9 8 0.0 0 0 0.0 0.1240 9.0 3.0 1.0 800.0 9 8 0.0 0 0 0.0 0.1240 9.0 3.0 1.0 800.0 9 8 0.0 0 0 0.0 0.1240 9.0 3.0 1.0 800.0 9 8 0.0 0 0 0.0 0.1240 9.0 3.0 1.0 800.0 9 8 0.0 0 0 0.0 0.1240 9.0 3.0 1.0 800.0 9 8 0.0 0 0 0.0 0.1240 9.0 3.0 1.0 800.0 9 8 0.0 0 0 0.0

file:///C|/Documents%20and%20Settings/megana/Desktop/Appendix%203c%20-%20Modelling%20data%20-%20sar9i.txt-.txt[9/10/2012 3:55:36 PM]
0.1240 9.0 3.0 1.0 800.0 9 8 0.0 0 0 0.0 0.1240 9.0 3.0 1.0 800.0 9 8 0.0 0 0 0.0 0.1240 9.0 3.0 1.0 800.0 9 8 0.0 0 0 0.0 0.1240 9.0 3.0 1.0 800.0 9 8 0.0 0 0 0.0 0.1240 9.0 3.0 1.0 800.0 9 8 0.0 0 0 0.0 0.1240 9.0 3.0 1.0 800.0 9 8 0.0 0 0 0.0 0.1240 9.0 3.0 1.0 800.0 9 8 0.0 0 0 0.0 0.1240 9.0 3.0 1.0 800.0 9 8 0.0 0 0 0.0 0.1240 9.0 3.0 1.0 800.0 9 8 0.0 0 0 0.0 0.1240 9.0 3.0 1.0 800.0 9 8 0.0 0 0 0.0 0.1240 9.0 3.0 1.0 800.0 9 8 0.0 0 0 0.0 0.1240 9.0 3.0 1.0 800.0 9 8 0.0 0 0 0.0 0.1240 9.0 3.0 1.0 800.0 9 8 0.0 0 0 0.0 0.1240 9.0 3.0 1.0 800.0 9 8 0.0 0 0 0.0 0.1240 9.0 3.0 1.0 800.0 9 8 0.0 0 0 0.0 0.1240 9.0 3.0 1.0 800.0 9 8 0.0 0 0 0.0 0.1240 9.0 3.0 1.0 800.0 9 8 0.0 0 0 0.0 0.1240 9.0 3.0 1.0 800.0 9 8 0.0 0 0 0.0 0.1240 9.0 3.0 1.0 800.0 9 8 0.0 0 0 0.0 0.1240 9.0 3.0 1.0 800.0 9 8 0.0 0 0 0.0 0.1240 9.0 3.0 1.0 800.0 9 8 0.0 0 0 0.0 0.1240 9.0 3.0 1.0 800.0 9 8 0.0 0 0 0.0 0.1240 9.0 3.0 1.0 800.0 9 8 0.0 0 0 0.0 0.1240 9.0 3.0 1.0 800.0 9 8 0.0 0 0 0.0 0.1240 9.0 3.0 1.0 800.0 9 8 0.0 0 0 0.0 0.1240 9.0 3.0 1.0 800.0 9 8 0.0 0 0 0.0 0.1240 9.0 3.0 1.0 800.0 9 8 0.0 0 0 0.0 0.1240 9.0 3.0 1.0 800.0 9 8 0.0 0 0 0.0 0.1240 9.0 3.0 1.0 800.0 9 8 0.0 0 0 0.0 0.1240 9.0 3.0 1.0 800.0 9 8 0.0 0 0 0.0 0.1240 9.0 3.0 1.0 800.0 9 8 0.0 0 0 0.0 0.1240 9.0 3.0 1.0 800.0 9 8 0.0 0 0 0.0 0.1240 9.0 3.0 1.0 800.0 9 8 0.0 0 0 0.0 0.1240 9.0 3.0 1.0 800.0 9 8 0.0 0 0 0.0 0.1240 9.0 3.0 1.0 800.0 9 8 0.0 0 0 0.0 0.1240 9.0 3.0 1.0 800.0 9 8 0.0 0 0 0.0 0.1240 9.0 3.0 1.0 800.0 9 8 0.0 0 0 0.0 0.1240 9.0 3.0 1.0 800.0 9 8 0.0 0 0 0.0 0.1240 9.0 3.0 1.0 800.0 9 8 0.0 0 0 0.0 0.1240 9.0 3.0 1.0 800.0 9 8 0.0 0 0 0.0 0.1240 9.0 3.0 1.0 800.0 9 8 0.0 0 0 0.0 0.1240 9.0 3.0 1.0 800.0 9 8 0.0 0 0 0.0 0.1240 9.0 3.0 1.0 800.0 9 8 0.0 0 0 0.0Water usage: drinking^hosedown^flushing (L)0 0 0Annual Effluent Volume (ML)45.299999Last entry for workDays.SelectedString7 days/weekLast entry for months.SelectedStringAll yearLast day loaded to screen1_____________________________________________________________

file:///C|/Documents%20and%20Settings/megana/Desktop/Appendix%203d%20-%20Modelling%20data%20-%20Sar9o.txt-.txt[9/10/2012 3:55:33 PM]
***************************************** SUMMARY OUTPUT MEDLI Version 1.30
Data Set: sar9 Run Date: 10/05/12 Time:12:02:06.43*****************************************
GENERAL INFORMATION*******************Title: QCVS Subject: Sarina Development Client: QCV Pty Ltd User: Alpha Concepts Time: Thu May 10 12:00:25 2012 Comments: [no entry]
RUN PERIOD**********
Starting Date 1/ 1/1960Ending Date 31/12/2011Run Length 52 years 0 days _____________________________________________________________________________________
CLIMATE INFORMATION*******************
Enterprise site: Sarina -21.5 deg S 149.2 deg EWeather station: Sarina_21.400S_149.200E (Interpo
ANNUAL TOTALS 10 Percentile 50 percentile 90 PercentileRainfall mm/year 1013. 1529. 2646.Pan Evap mm/year 1706. 1838. 1972.
MONTHLY Jan Feb Mar Apr May Jun Jul Aug Sep Oct Nov Dec YearRainfall (mm) 313 361 255 127 85 50 33 35 24 48 138 198 1666Pan Evap (mm) 190 158 162 135 112 93 103 126 159 192 200 205 1834Ave Max Temp DegC 30 30 29 27 25 22 22 23 26 28 30 30 26Ave Min Temp DegC 23 23 21 19 16 13 11 13 15 18 21 22 17Rad (MJ/m2/day) 22 20 19 18 15 15 16 19 22 24 24 24 19-------------------------------------------------------------------------------------MONTHLY IRRIGATION******************
Irrigation (mm) 59 63 72 67 66 59 54 42 30 29 37 47 626_____________________________________________________________________________________
SOIL PROPERTIES***************
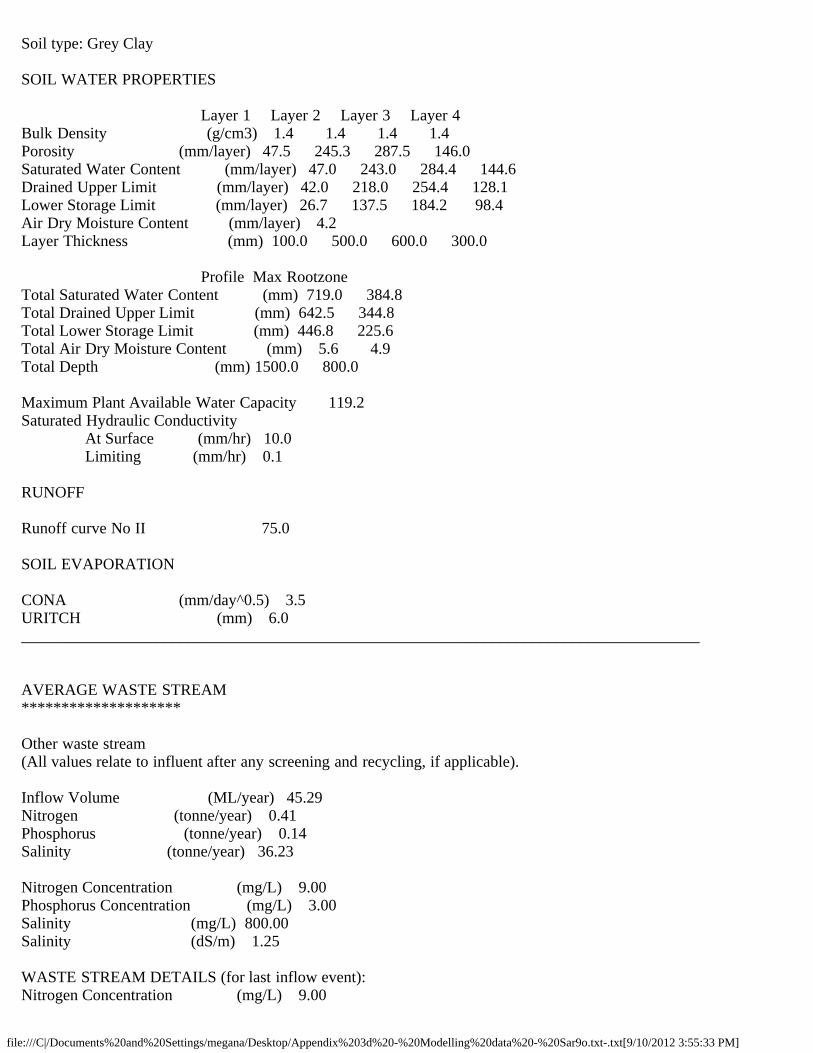
file:///C|/Documents%20and%20Settings/megana/Desktop/Appendix%203d%20-%20Modelling%20data%20-%20Sar9o.txt-.txt[9/10/2012 3:55:33 PM]
Soil type: Grey Clay
SOIL WATER PROPERTIES
Layer 1 Layer 2 Layer 3 Layer 4Bulk Density (g/cm3) 1.4 1.4 1.4 1.4Porosity (mm/layer) 47.5 245.3 287.5 146.0Saturated Water Content (mm/layer) 47.0 243.0 284.4 144.6Drained Upper Limit (mm/layer) 42.0 218.0 254.4 128.1Lower Storage Limit (mm/layer) 26.7 137.5 184.2 98.4Air Dry Moisture Content (mm/layer) 4.2Layer Thickness (mm) 100.0 500.0 600.0 300.0
Profile Max RootzoneTotal Saturated Water Content (mm) 719.0 384.8Total Drained Upper Limit (mm) 642.5 344.8Total Lower Storage Limit (mm) 446.8 225.6Total Air Dry Moisture Content (mm) 5.6 4.9Total Depth (mm) 1500.0 800.0
Maximum Plant Available Water Capacity 119.2Saturated Hydraulic Conductivity At Surface (mm/hr) 10.0 Limiting (mm/hr) 0.1
RUNOFF
Runoff curve No II 75.0
SOIL EVAPORATION
CONA (mm/day^0.5) 3.5URITCH (mm) 6.0_____________________________________________________________________________________
AVERAGE WASTE STREAM********************
Other waste stream(All values relate to influent after any screening and recycling, if applicable).
Inflow Volume (ML/year) 45.29Nitrogen (tonne/year) 0.41Phosphorus (tonne/year) 0.14Salinity (tonne/year) 36.23
Nitrogen Concentration (mg/L) 9.00Phosphorus Concentration (mg/L) 3.00Salinity (mg/L) 800.00Salinity (dS/m) 1.25
WASTE STREAM DETAILS (for last inflow event):Nitrogen Concentration (mg/L) 9.00

file:///C|/Documents%20and%20Settings/megana/Desktop/Appendix%203d%20-%20Modelling%20data%20-%20Sar9o.txt-.txt[9/10/2012 3:55:33 PM]
Phosphorus Concentration (mg/L) 3.00TDS Concentration (mg/L) 800.00Salinity (dS/m) 1.25_____________________________________________________________________________________
IRRIGATION WATER****************
Irrigation triggered every 1 daysIrrigating a fixed amount of 2 mm
AREA
Total Irrigation Area (ha) 8.00
VOLUMES
Total Irrigation (ML/year) 50.09Minimum Volume must be full irrig. requiremtMaximum Volume must be full irrig. requiremtMaximum Vol. Available For Shandying (ML/yr) 0.00
IRRIGATION CONCENTRATIONS
Average salinity of Irrigation (dS/m) 1.08Average salinity of Irrigation (mg/L) 689.75Average Nitrogen Conc of Irrigation Before ammonia loss (mg/L) 2.57 After ammonia loss (mg/L) 2.46Average Phosphorus Conc of Irrigation (mg/L) 2.56_____________________________________________________________________________________
FRESH WATER USAGE*****************
Irrigation (shandying) water (ML/yr) 0.00
Avg volume of fresh water used (ML/yr) 0.00
Annual allocation (ML/yr) N/A
POND INFORMATION****************
POND GEOMETRY Pond 1 Pond 2
Final pond volume (ML) 0.60 14.06Final liquid volume (ML) 0.58 14.06Final sludge volume (ML) 0.02 0.00Average pond volume (ML) 0.60 15.68

file:///C|/Documents%20and%20Settings/megana/Desktop/Appendix%203d%20-%20Modelling%20data%20-%20Sar9o.txt-.txt[9/10/2012 3:55:33 PM]
Average active volume (ML) 0.59 15.68Maximum pond volume (ML) 0.60 28.00Minimum allowable pond volume (ML) 0.01 12.91Average pond depth (m) 4.30 0.86Pond depth at outlet (m) 4.30 1.50Maximum water surface area (m2 x1000) 0.14 19.08Pond catchment area (m2 x1000) 0.19 19.63Pond footprint length (m) 13.81 140.12Pond footprint width (m) 13.81 140.12For 1st Pond: Optimal anaerobic pond volume (ML) 0.0 (incl. 10 yrs sludge storage) Required active volume (ML) 0.0 @ VS Loading Rate (kg/m3/d) of 0.077Optimal vol. for subsequent pond(s) (ML) 2.5 (assumes 20 day retention time)Minimum pond volume for irrigation (ML) 12.9 (plus the volume due to sludge)
POND VOLATILE SOLIDS LOAD
Effective VS loading rate * (kg/m3) 0.002* avg VS load/avg active volume
POND WATER BALANCE
Inflow of Effluent to pond system (ML/yr) 45.29Recycle Volume from pond system (ML/yr) 0.00Rain water added to pond system (ML/yr) 32.71Evaporation loss from pond system (ML/yr) 24.04Seepage loss from pond system (ML/yr) 0.68Irrigation from last pond (ML/yr) 50.09Volume of overtopping (ML/yr) 3.19Sludge accumulated (ML/yr) 0.00 Sludge accumulated (t DM/yr) 0.25Sludge removed (ML/yr) 0.00No of desludging events every 10 years 0.00Increase in pond water volume (ML/yr) 0.01
OVERTOPPING EVENTS
Volume of overtopping (ML/yr) 3.19No. of days pond overtops per 10 years 31.92Average Length of overtopping events (days) 2.96% Reuse 92.83No. of overtopping events every 10 years > 0.000 ML 10.77 > 0.019 ML* 10.58 > 1.000 ML 5.77 > 2.000 ML 4.04 > 5.000 ML 2.12 > 10.000 ML 0.19 > 20.000 ML 0.19 > 50.000 ML 0.00* Volume equivalent to 1 mm depth of water
>>> NO-IRRIGATION EVENTS <<<

file:///C|/Documents%20and%20Settings/megana/Desktop/Appendix%203d%20-%20Modelling%20data%20-%20Sar9o.txt-.txt[9/10/2012 3:55:33 PM]
%Days pond volume below min. vol. for irrig. 0.02No. periods/year without irrigable effluent 0.08Average Length of such periods (days) 1.00
POND NITROGEN BALANCE
Nitrogen Added by Effluent (tonne/yr) 0.41 Irrig. from pond (ML/yr) 50.1Nitrogen removed by Irrigation (tonne/yr) 0.13Nitrogen removed by Volatilisation(tonne/yr) 0.27Nitrogen removed by Seepage (tonne/yr) 0.00Nitrogen accumulated in Sludge (tonne/yr) 0.00Nitrogen lost by Overtopping (tonne/yr) 0.00Nitrogen involved in Recycling (tonne/yr) 0.00Increase in pond Nitrogen (tonne/yr) 0.00
POND PHOSPHORUS BALANCE
Phosphorus Added by Effluent (tonne/yr) 0.14 Irrig. from pond (ML/yr) 50.1Phosphorus removed by Irrigation (tonne/yr) 0.13Phosphorus removed by Seepage (tonne/yr) 0.00Phosphorus accumulated in Sludge (tonne/yr) 0.00Phosphorus lost by Overtopping (tonne/yr) 0.00Phosphorus involved in Recycling (tonne/yr) 0.00Increase in pond Phosphorus (tonne/yr) 0.00
POND SALINITY BALANCE
Salinity Added by Effluent (tonne/yr) 36.23Salinity removed by Irrigation (tonne/yr) 34.55Salinity removed by Seepage (tonne/yr) 0.52Salinity lost by Overtopping (tonne/yr) 0.95Salinity involved in Recycling (tonne/yr) 0.00Increase in pond Salinity (tonne/yr) 0.22
POND CONCENTRATIONS Pond 1 Pond 2
Average Nitrogen Conc of Pond Liquid (mg/L) 8.7 2.6Average Phosphorus Conc of Pond Liquid(mg/L) 3.0 2.7Average TDS Conc of Pond Liquid (mg/L) 800.0 716.7Average Salinity of Pond Liquid (dS/m) 1.3 1.1Average Potassium Conc of Pond Liquid (mg/L) 1.0 0.9
(On final day of simulation)Nitrogen Conc of Pond Liquid (mg/L) 8.7 2.7Phosphorus Conc of Pond Liquid (mg/L) 3.0 2.9TDS Conc of Pond Liquid (mg/L) 800.0 786.4EC of Pond Liquid (dS/m) 1.3 1.2Potassium Conc of Pond Liquid (mg/L) 1.0 1.0
REMOVED SLUDGE - NUTRIENT & SALT CONCENTRATIONS
Nitrogen in removed Sludge (db) (kg/tonne) 0.00Phosphorus in removed Sludge (db) (kg/tonne) 0.00
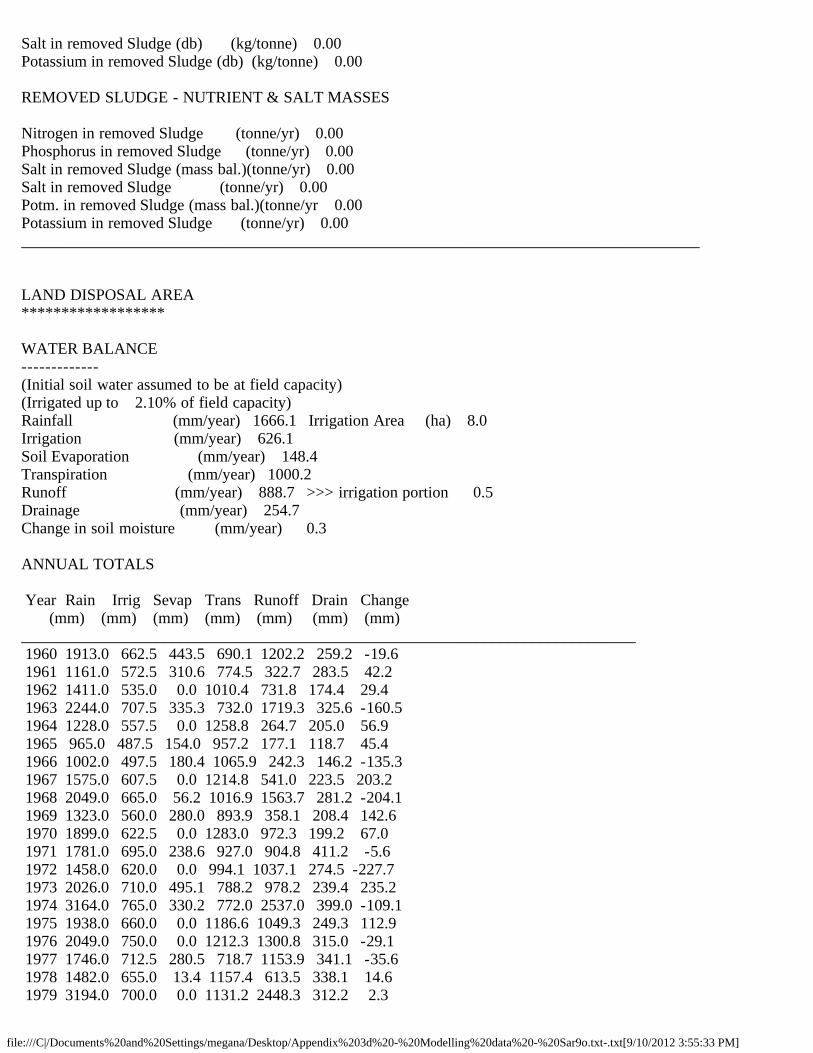
file:///C|/Documents%20and%20Settings/megana/Desktop/Appendix%203d%20-%20Modelling%20data%20-%20Sar9o.txt-.txt[9/10/2012 3:55:33 PM]
Salt in removed Sludge (db) (kg/tonne) 0.00Potassium in removed Sludge (db) (kg/tonne) 0.00
REMOVED SLUDGE - NUTRIENT & SALT MASSES
Nitrogen in removed Sludge (tonne/yr) 0.00Phosphorus in removed Sludge (tonne/yr) 0.00Salt in removed Sludge (mass bal.)(tonne/yr) 0.00Salt in removed Sludge (tonne/yr) 0.00Potm. in removed Sludge (mass bal.)(tonne/yr 0.00Potassium in removed Sludge (tonne/yr) 0.00_____________________________________________________________________________________
LAND DISPOSAL AREA******************
WATER BALANCE-------------(Initial soil water assumed to be at field capacity)(Irrigated up to 2.10% of field capacity)Rainfall (mm/year) 1666.1 Irrigation Area (ha) 8.0Irrigation (mm/year) 626.1Soil Evaporation (mm/year) 148.4Transpiration (mm/year) 1000.2Runoff (mm/year) 888.7 >>> irrigation portion 0.5Drainage (mm/year) 254.7Change in soil moisture (mm/year) 0.3
ANNUAL TOTALS
Year Rain Irrig Sevap Trans Runoff Drain Change (mm) (mm) (mm) (mm) (mm) (mm) (mm) _____________________________________________________________________________ 1960 1913.0 662.5 443.5 690.1 1202.2 259.2 -19.6 1961 1161.0 572.5 310.6 774.5 322.7 283.5 42.2 1962 1411.0 535.0 0.0 1010.4 731.8 174.4 29.4 1963 2244.0 707.5 335.3 732.0 1719.3 325.6 -160.5 1964 1228.0 557.5 0.0 1258.8 264.7 205.0 56.9 1965 965.0 487.5 154.0 957.2 177.1 118.7 45.4 1966 1002.0 497.5 180.4 1065.9 242.3 146.2 -135.3 1967 1575.0 607.5 0.0 1214.8 541.0 223.5 203.2 1968 2049.0 665.0 56.2 1016.9 1563.7 281.2 -204.1 1969 1323.0 560.0 280.0 893.9 358.1 208.4 142.6 1970 1899.0 622.5 0.0 1283.0 972.3 199.2 67.0 1971 1781.0 695.0 238.6 927.0 904.8 411.2 -5.6 1972 1458.0 620.0 0.0 994.1 1037.1 274.5 -227.7 1973 2026.0 710.0 495.1 788.2 978.2 239.4 235.2 1974 3164.0 765.0 330.2 772.0 2537.0 399.0 -109.1 1975 1938.0 660.0 0.0 1186.6 1049.3 249.3 112.9 1976 2049.0 750.0 0.0 1212.3 1300.8 315.0 -29.1 1977 1746.0 712.5 280.5 718.7 1153.9 341.1 -35.6 1978 1482.0 655.0 13.4 1157.4 613.5 338.1 14.6 1979 3194.0 700.0 0.0 1131.2 2448.3 312.2 2.3

file:///C|/Documents%20and%20Settings/megana/Desktop/Appendix%203d%20-%20Modelling%20data%20-%20Sar9o.txt-.txt[9/10/2012 3:55:33 PM]
1980 1470.0 672.5 0.0 1185.8 757.4 273.7 -74.3 1981 1835.0 742.5 0.0 1099.7 1080.3 317.2 80.3 1982 1102.0 525.0 204.9 651.8 582.4 283.8 -95.9 1983 1391.0 605.0 62.8 1182.0 589.5 215.9 -54.3 1984 910.0 502.5 296.6 769.0 117.6 145.7 83.7 1985 1662.0 652.5 5.5 1202.7 790.7 278.9 36.8 1986 1119.0 542.5 0.0 1287.7 284.8 239.4 -150.3 1987 1111.0 505.0 0.0 1182.2 89.7 220.2 123.9 1988 2360.0 810.0 0.0 1251.1 1487.4 344.9 86.7 1989 2016.0 805.0 282.4 790.0 1476.6 398.0 -126.0 1990 2741.0 635.0 757.9 323.8 1987.6 170.9 135.8 1991 2551.0 672.5 415.5 684.9 1924.4 224.0 -25.3 1992 964.0 487.5 129.4 992.7 288.3 177.9 -136.8 1993 1254.0 547.5 244.5 1121.1 300.7 130.7 4.5 1994 1153.0 510.0 0.0 1103.5 411.2 161.9 -13.5 1995 1003.0 487.5 0.0 1299.7 125.7 95.6 -30.6 1996 1422.0 592.5 0.0 1276.1 445.0 248.7 44.6 1997 1243.0 552.5 63.8 996.0 524.5 206.2 5.2 1998 1591.0 675.0 337.1 929.2 526.9 346.2 126.6 1999 1628.0 662.5 0.0 1160.6 825.2 287.3 17.4 2000 2773.0 795.0 0.0 1185.2 1999.8 370.2 12.8 2001 1022.0 627.5 0.0 1095.3 426.3 278.6 -150.7 2002 817.0 415.0 86.8 980.3 168.4 83.2 -86.7 2003 1196.0 517.5 476.3 689.5 311.8 124.5 111.4 2004 1087.0 510.0 0.0 1175.5 286.2 129.8 5.4 2005 1105.0 515.0 0.0 1174.2 293.7 274.1 -122.0 2006 1246.0 555.0 465.8 680.0 347.5 206.8 100.8 2007 1917.0 695.0 315.6 815.5 990.1 360.2 130.5 2008 1949.0 705.0 322.5 735.5 1325.1 315.0 -44.1 2009 1720.0 647.5 129.3 1032.5 964.6 263.1 -22.0 2010 3377.0 895.0 0.0 1034.5 2727.9 432.4 77.2 2011 2293.0 752.5 0.0 1136.8 1634.5 336.6 -62.4_____________________________________________________________________________
NUTRIENT BALANCE-----------------
NITROGEN
Total N irrigated from ponds (kg/ha/year) 16.1 % of Total as ammonium 20.0Nitrogn lost by ammonia volat.(kg/ha/year) 0.6 Deep Drainage (mm/year) 254.7Nitrogen irrigated (kg/ha/year) 15.4Nitrogen added to runoff (kg/ha/year) 0.0Nitrogen added in irrigation (kg/ha/year) 15.4Nitrogen added in seed (kg/ha/year) 0.3Nitrogen removed by crop (kg/ha/year) 73.8Denitrification (kg/ha/year) 3.5Leached NO3-N (kg/ha/year) 0.1Change in soil organic-N (kg/ha/year) -60.7Change in soil solution NH4-N (kg/ha/year) 0.0Change in soil solution NO3-N (kg/ha/year) -1.0Change in adsorbed NH4-N (kg/ha/year) 0.0Initial soil organic-N (kg/ha) 3272.0
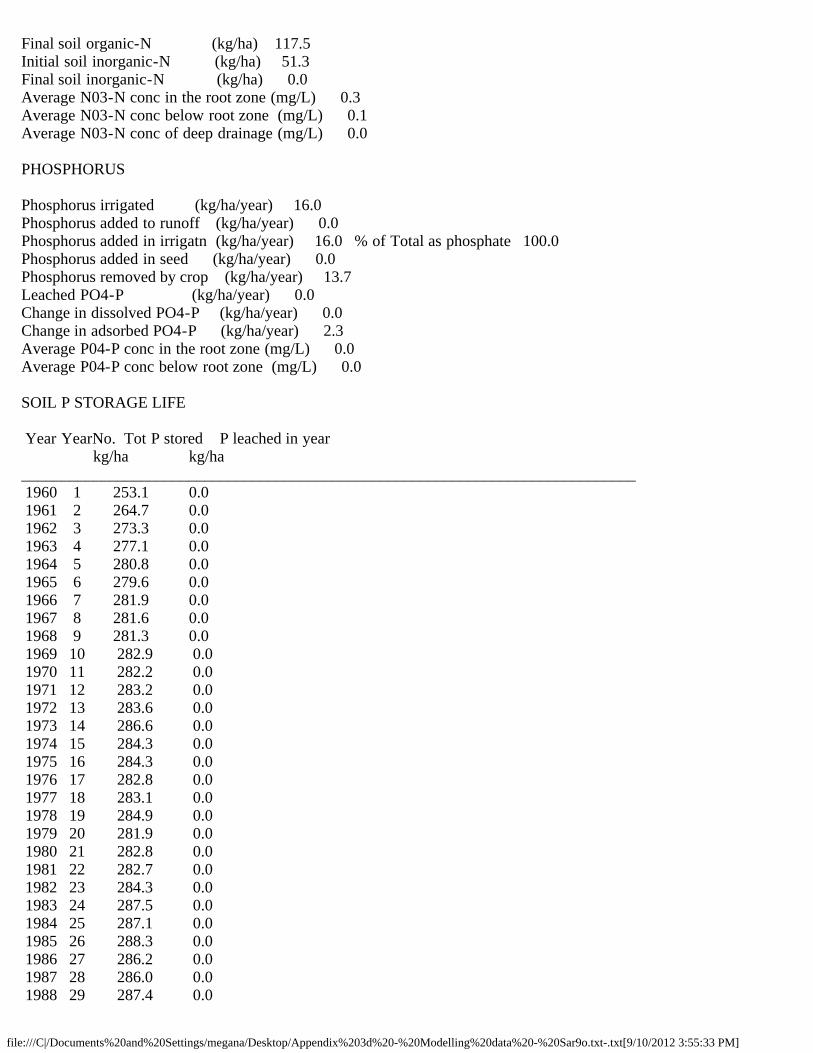
file:///C|/Documents%20and%20Settings/megana/Desktop/Appendix%203d%20-%20Modelling%20data%20-%20Sar9o.txt-.txt[9/10/2012 3:55:33 PM]
Final soil organic-N (kg/ha) 117.5Initial soil inorganic-N (kg/ha) 51.3Final soil inorganic-N (kg/ha) 0.0Average N03-N conc in the root zone (mg/L) 0.3Average N03-N conc below root zone (mg/L) 0.1Average N03-N conc of deep drainage (mg/L) 0.0
PHOSPHORUS
Phosphorus irrigated (kg/ha/year) 16.0Phosphorus added to runoff (kg/ha/year) 0.0Phosphorus added in irrigatn (kg/ha/year) 16.0 % of Total as phosphate 100.0Phosphorus added in seed (kg/ha/year) 0.0Phosphorus removed by crop (kg/ha/year) 13.7Leached PO4-P (kg/ha/year) 0.0Change in dissolved PO4-P (kg/ha/year) 0.0Change in adsorbed PO4-P (kg/ha/year) 2.3Average P04-P conc in the root zone (mg/L) 0.0Average P04-P conc below root zone (mg/L) 0.0
SOIL P STORAGE LIFE
Year YearNo. Tot P stored P leached in year kg/ha kg/ha _____________________________________________________________________________ 1960 1 253.1 0.0 1961 2 264.7 0.0 1962 3 273.3 0.0 1963 4 277.1 0.0 1964 5 280.8 0.0 1965 6 279.6 0.0 1966 7 281.9 0.0 1967 8 281.6 0.0 1968 9 281.3 0.0 1969 10 282.9 0.0 1970 11 282.2 0.0 1971 12 283.2 0.0 1972 13 283.6 0.0 1973 14 286.6 0.0 1974 15 284.3 0.0 1975 16 284.3 0.0 1976 17 282.8 0.0 1977 18 283.1 0.0 1978 19 284.9 0.0 1979 20 281.9 0.0 1980 21 282.8 0.0 1981 22 282.7 0.0 1982 23 284.3 0.0 1983 24 287.5 0.0 1984 25 287.1 0.0 1985 26 288.3 0.0 1986 27 286.2 0.0 1987 28 286.0 0.0 1988 29 287.4 0.0
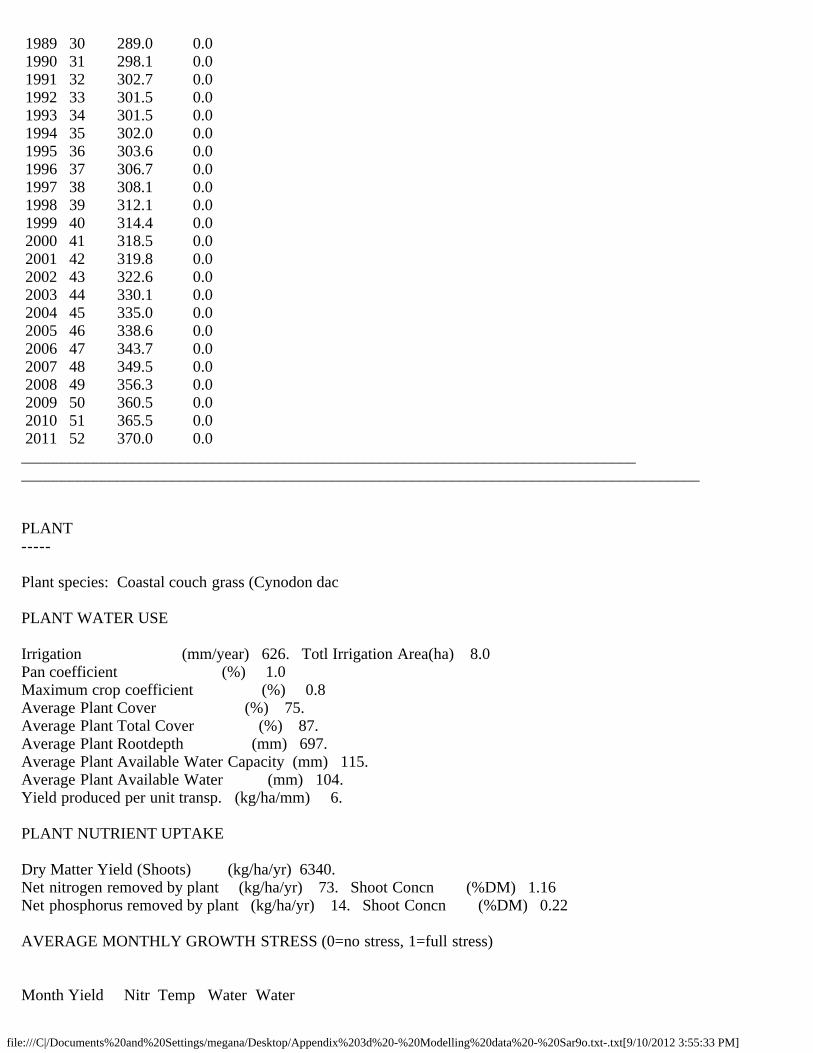
file:///C|/Documents%20and%20Settings/megana/Desktop/Appendix%203d%20-%20Modelling%20data%20-%20Sar9o.txt-.txt[9/10/2012 3:55:33 PM]
1989 30 289.0 0.0 1990 31 298.1 0.0 1991 32 302.7 0.0 1992 33 301.5 0.0 1993 34 301.5 0.0 1994 35 302.0 0.0 1995 36 303.6 0.0 1996 37 306.7 0.0 1997 38 308.1 0.0 1998 39 312.1 0.0 1999 40 314.4 0.0 2000 41 318.5 0.0 2001 42 319.8 0.0 2002 43 322.6 0.0 2003 44 330.1 0.0 2004 45 335.0 0.0 2005 46 338.6 0.0 2006 47 343.7 0.0 2007 48 349.5 0.0 2008 49 356.3 0.0 2009 50 360.5 0.0 2010 51 365.5 0.0 2011 52 370.0 0.0__________________________________________________________________________________________________________________________________________________________________
PLANT-----
Plant species: Coastal couch grass (Cynodon dac
PLANT WATER USE
Irrigation (mm/year) 626. Totl Irrigation Area(ha) 8.0Pan coefficient (%) 1.0Maximum crop coefficient (%) 0.8Average Plant Cover (%) 75.Average Plant Total Cover (%) 87.Average Plant Rootdepth (mm) 697.Average Plant Available Water Capacity (mm) 115.Average Plant Available Water (mm) 104.Yield produced per unit transp. (kg/ha/mm) 6.
PLANT NUTRIENT UPTAKE
Dry Matter Yield (Shoots) (kg/ha/yr) 6340.Net nitrogen removed by plant (kg/ha/yr) 73. Shoot Concn (%DM) 1.16Net phosphorus removed by plant (kg/ha/yr) 14. Shoot Concn (%DM) 0.22
AVERAGE MONTHLY GROWTH STRESS (0=no stress, 1=full stress)
Month Yield Nitr Temp Water Water

file:///C|/Documents%20and%20Settings/megana/Desktop/Appendix%203d%20-%20Modelling%20data%20-%20Sar9o.txt-.txt[9/10/2012 3:55:33 PM]
kg/ha Defic Logging____________________________________________ 1 617. 0.5 0.0 0.1 0.2 2 472. 0.5 0.0 0.0 0.3 3 593. 0.5 0.0 0.0 0.3 4 593. 0.5 0.0 0.0 0.2 5 490. 0.5 0.2 0.0 0.2 6 345. 0.5 0.6 0.0 0.1 7 308. 0.4 0.7 0.0 0.0 8 454. 0.4 0.5 0.0 0.0 9 615. 0.4 0.2 0.1 0.0 10 570. 0.5 0.0 0.3 0.0 11 593. 0.6 0.0 0.2 0.0 12 689. 0.5 0.0 0.2 0.1
>>> NO-PLANT EVENTS <<<
%Days due to temperature stress 0.3%Days due to water stress 0.6%Days due to nitrogen stress 0.0No. of forced harvests per year 0.4No. of normal harvests per year 3.9_____________________________________________________________________________________
SALINITY--------
Salt tolerance - plant species: tolerant
Average EC of Irrigation Water (dS/m) 1.1 Irrigation (mm/year) 626.1Average EC of Rainwater (dS/m x10) 0.3 Rainfall (mm/year) 1666.1Average EC of Infiltrated water (dS/m) 0.5Av. water-upt-weightd rootzone EC(dS/m s.e.) 0.6EC soil soln (FC) at base of rootzone (dS/m) 2.9 Deep Drainage (mm/year) 254.7Reduction in Crop yield due to Salinity (%) 0.0Percentage of yrs that crop yld falls below 90% of potential because of soil salinity 0.0
Period ECrootzone ECbase Rel Yield sat ext in situ (dS/m) (dS/m) (%)____________________________________________ 1960 - 1964 0.57 2.60 100. 1961 - 1965 0.63 3.17 100. 1962 - 1966 0.67 3.60 100. 1963 - 1967 0.64 3.52 100. 1964 - 1968 0.64 3.60 100. 1965 - 1969 0.65 3.60 100. 1966 - 1970 0.60 3.29 100. 1967 - 1971 0.55 2.70 100. 1968 - 1972 0.55 2.51 100. 1969 - 1973 0.57 2.74 100. 1970 - 1974 0.53 2.30 100.
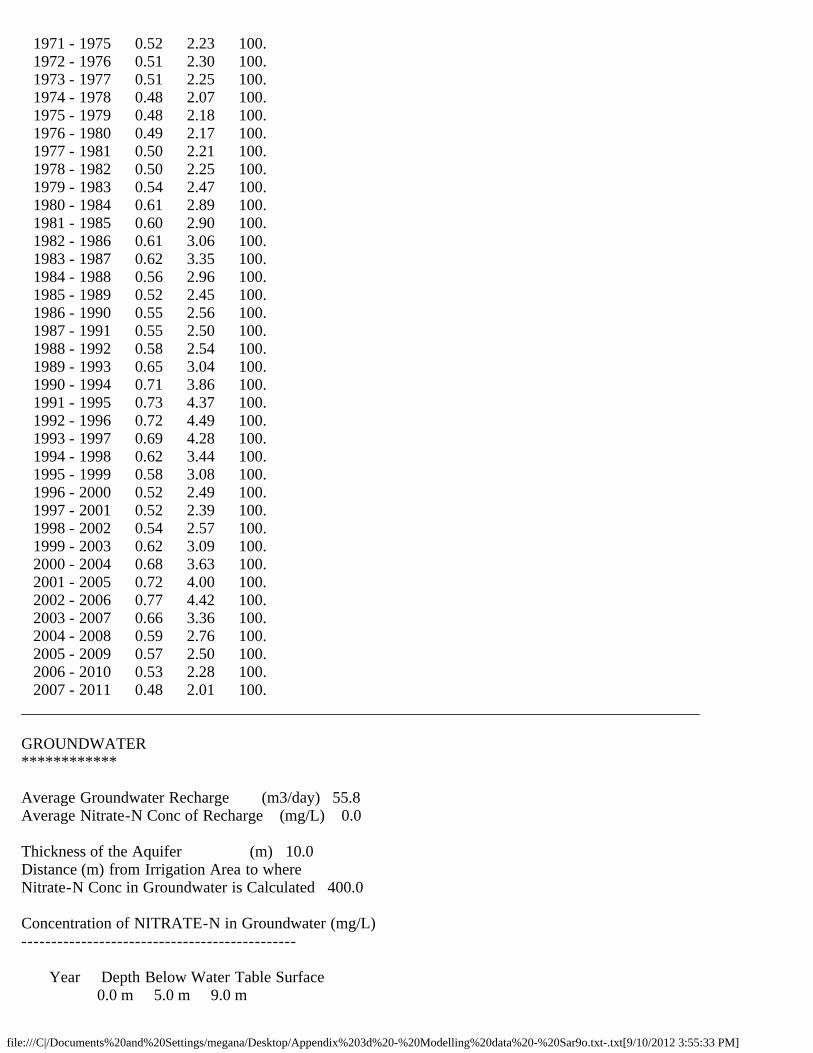
file:///C|/Documents%20and%20Settings/megana/Desktop/Appendix%203d%20-%20Modelling%20data%20-%20Sar9o.txt-.txt[9/10/2012 3:55:33 PM]
1971 - 1975 0.52 2.23 100. 1972 - 1976 0.51 2.30 100. 1973 - 1977 0.51 2.25 100. 1974 - 1978 0.48 2.07 100. 1975 - 1979 0.48 2.18 100. 1976 - 1980 0.49 2.17 100. 1977 - 1981 0.50 2.21 100. 1978 - 1982 0.50 2.25 100. 1979 - 1983 0.54 2.47 100. 1980 - 1984 0.61 2.89 100. 1981 - 1985 0.60 2.90 100. 1982 - 1986 0.61 3.06 100. 1983 - 1987 0.62 3.35 100. 1984 - 1988 0.56 2.96 100. 1985 - 1989 0.52 2.45 100. 1986 - 1990 0.55 2.56 100. 1987 - 1991 0.55 2.50 100. 1988 - 1992 0.58 2.54 100. 1989 - 1993 0.65 3.04 100. 1990 - 1994 0.71 3.86 100. 1991 - 1995 0.73 4.37 100. 1992 - 1996 0.72 4.49 100. 1993 - 1997 0.69 4.28 100. 1994 - 1998 0.62 3.44 100. 1995 - 1999 0.58 3.08 100. 1996 - 2000 0.52 2.49 100. 1997 - 2001 0.52 2.39 100. 1998 - 2002 0.54 2.57 100. 1999 - 2003 0.62 3.09 100. 2000 - 2004 0.68 3.63 100. 2001 - 2005 0.72 4.00 100. 2002 - 2006 0.77 4.42 100. 2003 - 2007 0.66 3.36 100. 2004 - 2008 0.59 2.76 100. 2005 - 2009 0.57 2.50 100. 2006 - 2010 0.53 2.28 100. 2007 - 2011 0.48 2.01 100._____________________________________________________________________________________
GROUNDWATER************
Average Groundwater Recharge (m3/day) 55.8Average Nitrate-N Conc of Recharge (mg/L) 0.0
Thickness of the Aquifer (m) 10.0Distance (m) from Irrigation Area to where Nitrate-N Conc in Groundwater is Calculated 400.0
Concentration of NITRATE-N in Groundwater (mg/L)----------------------------------------------
Year Depth Below Water Table Surface 0.0 m 5.0 m 9.0 m

file:///C|/Documents%20and%20Settings/megana/Desktop/Appendix%203d%20-%20Modelling%20data%20-%20Sar9o.txt-.txt[9/10/2012 3:55:33 PM]
____________________________________________ 1964 0.0 0.0 0.0 1969 0.0 0.0 0.0 1974 0.0 0.0 0.0 1979 0.0 0.0 0.0 1984 0.0 0.0 0.0 1989 0.0 0.0 0.0 1994 0.0 0.0 0.0 1999 0.0 0.0 0.0 2004 0.0 0.0 0.0 2009 0.0 0.0 0.0Last 2011 0.0 0.0 0.0_____________________________________________________________________________________
ACKNOWLEDGMENTS***************This run brought to you courtesy of:
MEDLIEXE.EXE : 1300468 bytes Mon Jun 23 06:20:34 2008
CRCPROJ.EXE : 1286656 bytes Mon Jun 23 06:20:38 2008
GRAPHS.EXE : 439296 bytes Mon Jun 23 06:20:36 2008
__________________________________________OTHER INDUSTRY INPUT PARAMETERS - DATA SUMMARY
Nature of Industry: other__________________________________________ 1 file(s) copied
UNCONDITIONAL FINISH

file:///C|/Documents%20and%20Settings/megana/Desktop/Appendix%203e%20-%20Modelling%20data%20-%20Sar10i.txt-.txt[9/10/2012 3:55:32 PM]
Version 1.30 : GENERAL INFORMATION - CONTROL.PRMQCVSSarina DevelopmentQCV Pty LtdAlpha ConceptsSun May 13 08:14:32 2012[no entry]Sar10-Version 1.30 : ITER.PRM~Grid Type (1=full grid,2=selected), Increm (side 1) ,Increm (side 2)1 5 5~Grid range (if full, max[area, vol], if not, co-ords for corners A[area,vol], B[area,vol], C[area,vol} x0y0, x1y1, x2y2)0 0~Costings Fixed, Units/ML, Units/ha0 10 70~Append results? (0 = no, other = yes)0---------------------------------------Version 1.30 : CLIMATE.PRM^Site nameSarina^Latitude (°S)21.5^Longitude (°E)149.2^Climate station sari^Run start date^ Run end date 1 1 1960 31 12 2011^Report start date^ Report end date 1 1 1960 1 1 1960---------------------------------------Version 1.30 : CROP.PRM - PASTURE OPTION^Pan coefficient1^Model option (1=monthly covers, 2=pasture, 3=crop, 4=seasonal rotation)2^SpeciesCoastal couch grass (Cynodon dactylon)^Salt tolerancetolerantGROWTH:^Max. crop coefficient^Max.root depth(mm)^Radiation use efficiency(kg/Ha)/(MJ/m2)^min Yield for Full Cover (kg/ha)0.8 800 3.5 3e+03^Max. shoot nitrogen(%dwt)^max. shoot phosphorus(%dwt)5.4 0.5HARVEST:^Residual green cover(%)^Residual dead cover(%)^Residual shoot biomass(kg/ha)^Harvest trigger yield (kg/ha)80 20 1.4e+03 2.8e+03^Leaf water interception store(mm)0.5TEMPERATURE:^Ct0(°C)^Ct1(°C)^Ct2(°C)^Ct3(°C)^Ct4(°C)^TT(degree days)

file:///C|/Documents%20and%20Settings/megana/Desktop/Appendix%203e%20-%20Modelling%20data%20-%20Sar10i.txt-.txt[9/10/2012 3:55:32 PM]
-2 15 21 27 49 300NITROGEN:^BN1 cover(%dwt)^BN2 cover(%dwt)^BN1 growth(%dwt)^BN2 growth(%dwt)0.1 2 0.3 2SALINITY: ^salinity threshold(dS/m saturated ext.)^Yield reduction rate(% per dS/m)^No. years for averaging6.9 6.4 5______________________________________________Version 1.30 : GROUNDWATER.PRMspare linespare line^Distance from irrigation area to property boundary in direction of ground water flow (m) N.B. Minimum distance = 2*radius of (circular) irrigation area500^Aquifer thickness(m)^Depth between aquifer and surface (m)10 3^Specific flux (mm/hr)^Porosity of aquifer (mm/mm)^Longitudinal dispersion coefficient (m2/d)^Lateral dispersion coefficient (m2/d)^Adsorption retardation (m2/d)0.4 0.1 100 0.1 1---------------------------------------Version 1.30 : IRRIGATION.PRM^Irrigation area (ha)19.5000^Irrigation methodFixed Sprinkler^Maximum Irrigation Option (1=ML/ha/d, 2= ML/d, 3 = full requirement) ^ rate3 0.09000^Minimum Irrigation Option (1=ML/ha/d, 2= ML/d, 3 = full requirement) ^ rate3 0.000000^Irrigation Trigger Option (1=%PAWC, 2= mm SWD, 3 = every X days) ^ irrTrigValue3 1.0^Irrigation Application Option (1=up to FC + x (mm), 2= mm, 3 = % USL) ^ irrAppValue2 2.0^Minimum number of days skipped between irrigation events0^Apply annual fresh (or bore) water allocation(0=FALSE; 1= TRUE)0---------------------------------------Version 1.30 : NITROGEN.PRM^Soil profile typeLow Perm Red Brown EarthKinetic rate coefficients (%/day @ 35°C):^Ammonium adsorption^Ammonium desorption^Ammonification of organic N^Immobilisation of ammonium^Denitrification0.00 0.00 0.000350 0.00 0.10^Initial Nitrate N (mg/kg)^Initial Organic N (mg/kg)2.5 800.0---------------------------------------Version 1.30 : PHOSPHORUS.PRM^Soil profile typeLow Perm Red Brown Earth^Freundlich Ads. Coeff.^Freundlich ads. exponent^Freundlich Desorp. Exp.^Initial Soil Solution P (mg/L)Layer 1114.0 0.32 0.13 0.100Layer 2150.0 0.25 0.10 0.100Layer 3

file:///C|/Documents%20and%20Settings/megana/Desktop/Appendix%203e%20-%20Modelling%20data%20-%20Sar10i.txt-.txt[9/10/2012 3:55:32 PM]
310.0 0.21 0.06 0.100Layer 4310.0 0.21 0.06 0.100---------------------------------------Version 1.30 : SOIL.PRM^Soil profile typeLow Perm Red Brown Earth^No. of layers4^Layer thickness (mm)^Air dry (%v/v)^Lower storage limit (%v/v)^Upper storage limit (%v/v)^Sat. water capacity (%v/v)^Sat.Hyd.Conductivity (mm/hr)^Bulk density (g/cm3) 100 4.3 8.6 25.7 46.0 20.000 1.42 500 0.1 20.1 32.0 43.5 10.000 1.49 600 0.1 25.6 33.9 44.8 2.000 1.45 300 0.1 26.2 32.3 42.8 0.500 1.50^Curve number75Slope of Stage II drying (mm/day^0.5)^Stage I drying max.(mm)4 10Scalars: Lag^Wet day factor^albedo0.73 0.49 0.23---------------------------------------Version 1.30 : Pond parameters for up to 4 ponds.Number of Ponds 2Volume at outlet (m^3): Ponds 1..n600.023438 27999.044922 Max. length of wetted surface (m): Ponds 1..n 11.81 138.12 Max. width of wetted surface (m): Ponds 1..n 11.81 138.12 Max water depth (m): Ponds 1..n 4.3 1.5 Depth of freeboard (m): Ponds 1..n0.5 0.5 Side slope (radians from horizontal): Ponds 1..n (N.B.radians = degrees*11/630)1.571429 0.785714 Leakage rate (mm/day): Ponds 1..n 0 0.1 Evaporation coefficient: Ponds 1..n 0.7 0.7 Classification: Ponds 1..nanaerobic other Drawdown (depth removable for irrigation) (m): Ponds 1..n 0 1.1 N transfer coefficient (aka nitrogen proportionality constant) 0.014 0.014Nitrogen settling fraction: Ponds 1..n 0.01 0 Phosphorus settling fraction: Ponds 1..n 0.01 0 Potassium settling fraction: Ponds 1..n 0.01 0 Required (design) hydraulic retention time (days): Ponds 1..n
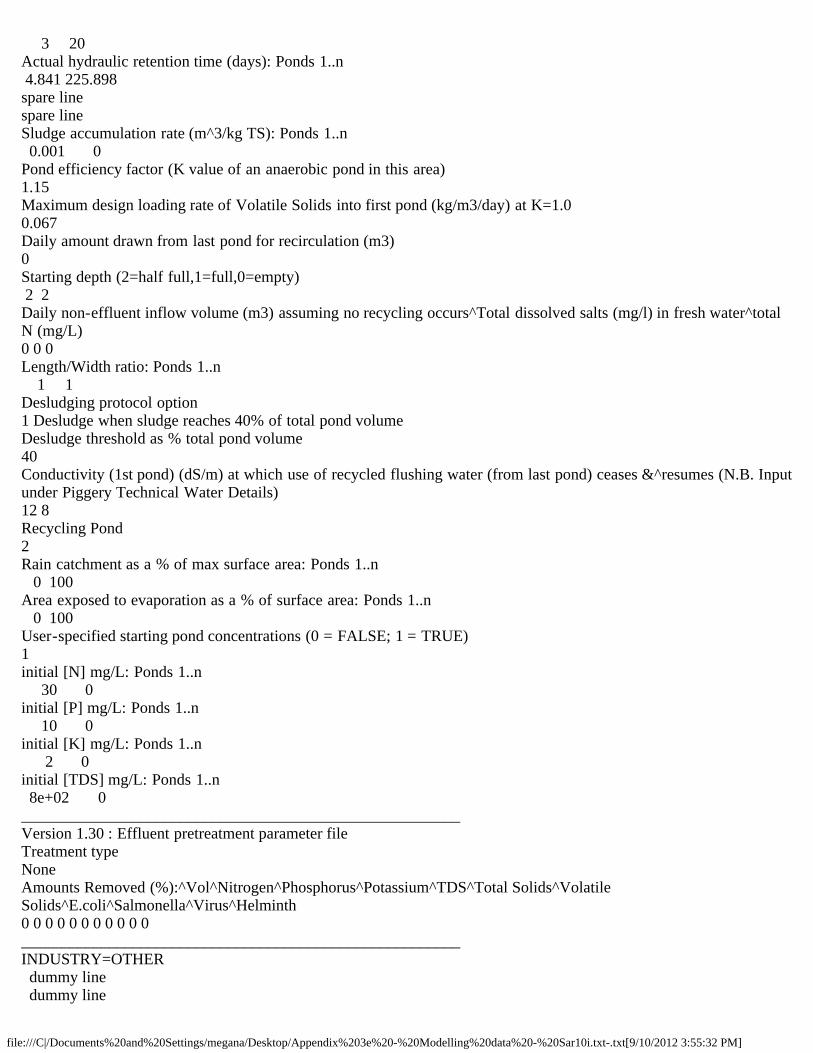
file:///C|/Documents%20and%20Settings/megana/Desktop/Appendix%203e%20-%20Modelling%20data%20-%20Sar10i.txt-.txt[9/10/2012 3:55:32 PM]
3 20 Actual hydraulic retention time (days): Ponds 1..n 4.841 225.898 spare linespare lineSludge accumulation rate (m^3/kg TS): Ponds 1..n 0.001 0 Pond efficiency factor (K value of an anaerobic pond in this area)1.15Maximum design loading rate of Volatile Solids into first pond (kg/m3/day) at K=1.00.067Daily amount drawn from last pond for recirculation (m3)0Starting depth (2=half full,1=full,0=empty) 2 2 Daily non-effluent inflow volume (m3) assuming no recycling occurs^Total dissolved salts (mg/l) in fresh water^total N (mg/L)0 0 0Length/Width ratio: Ponds 1..n 1 1 Desludging protocol option1 Desludge when sludge reaches 40% of total pond volumeDesludge threshold as % total pond volume40Conductivity (1st pond) (dS/m) at which use of recycled flushing water (from last pond) ceases &^resumes (N.B. Input under Piggery Technical Water Details)12 8Recycling Pond2Rain catchment as a % of max surface area: Ponds 1..n 0 100 Area exposed to evaporation as a % of surface area: Ponds 1..n 0 100 User-specified starting pond concentrations (0 = FALSE; 1 = TRUE)1initial [N] mg/L: Ponds 1..n 30 0 initial [P] mg/L: Ponds 1..n 10 0 initial [K] mg/L: Ponds 1..n 2 0 initial [TDS] mg/L: Ponds 1..n 8e+02 0 _______________________________________________________Version 1.30 : Effluent pretreatment parameter fileTreatment typeNoneAmounts Removed (%):^Vol^Nitrogen^Phosphorus^Potassium^TDS^Total Solids^Volatile Solids^E.coli^Salmonella^Virus^Helminth0 0 0 0 0 0 0 0 0 0 0_______________________________________________________INDUSTRY=OTHER dummy line dummy line
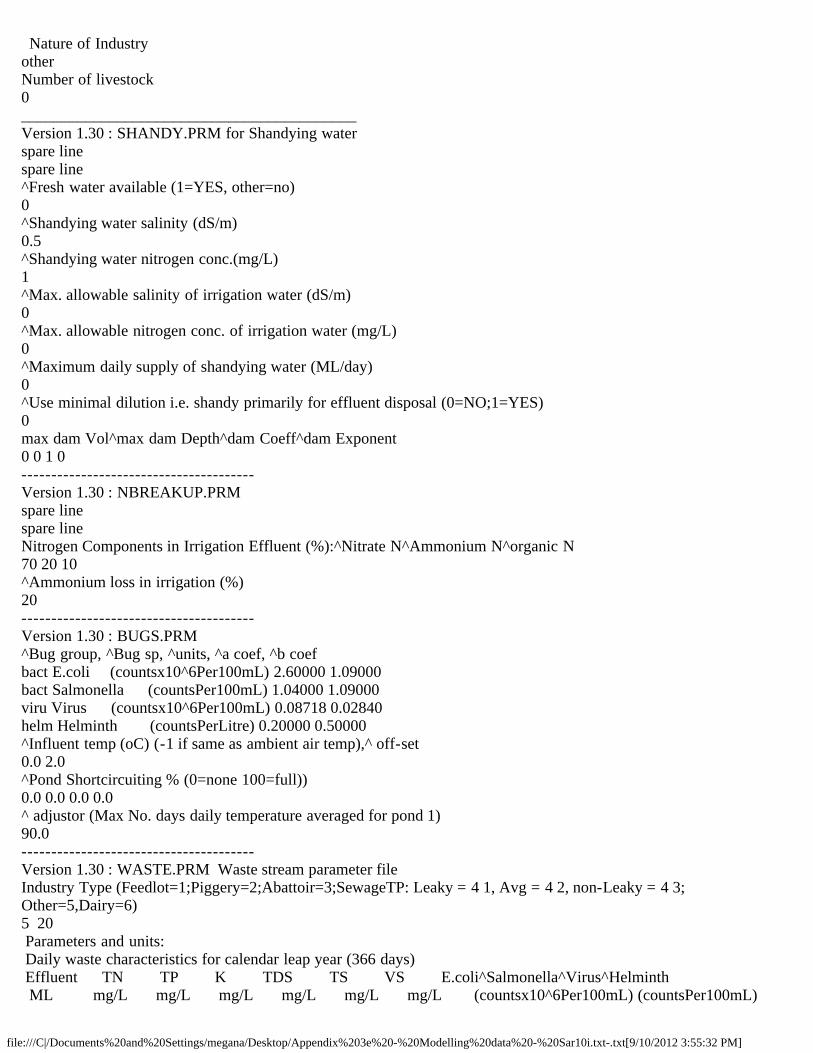
file:///C|/Documents%20and%20Settings/megana/Desktop/Appendix%203e%20-%20Modelling%20data%20-%20Sar10i.txt-.txt[9/10/2012 3:55:32 PM]
Nature of IndustryotherNumber of livestock0__________________________________________Version 1.30 : SHANDY.PRM for Shandying waterspare linespare line^Fresh water available (1=YES, other=no)0^Shandying water salinity (dS/m)0.5^Shandying water nitrogen conc.(mg/L)1^Max. allowable salinity of irrigation water (dS/m)0^Max. allowable nitrogen conc. of irrigation water (mg/L)0^Maximum daily supply of shandying water (ML/day)0^Use minimal dilution i.e. shandy primarily for effluent disposal (0=NO;1=YES)0max dam Vol^max dam Depth^dam Coeff^dam Exponent0 0 1 0---------------------------------------Version 1.30 : NBREAKUP.PRMspare linespare lineNitrogen Components in Irrigation Effluent (%):^Nitrate N^Ammonium N^organic N70 20 10 ^Ammonium loss in irrigation (%)20---------------------------------------Version 1.30 : BUGS.PRM^Bug group, ^Bug sp, ^units, ^a coef, ^b coefbact E.coli (countsx10^6Per100mL) 2.60000 1.09000bact Salmonella (countsPer100mL) 1.04000 1.09000viru Virus (countsx10^6Per100mL) 0.08718 0.02840helm Helminth (countsPerLitre) 0.20000 0.50000^Influent temp (oC) (-1 if same as ambient air temp),^ off-set0.0 2.0^Pond Shortcircuiting % (0=none 100=full))0.0 0.0 0.0 0.0^ adjustor (Max No. days daily temperature averaged for pond 1)90.0---------------------------------------Version 1.30 : WASTE.PRM Waste stream parameter fileIndustry Type (Feedlot=1;Piggery=2;Abattoir=3;SewageTP: Leaky = 4 1, Avg = 4 2, non-Leaky = 4 3; Other=5,Dairy=6)5 20 Parameters and units: Daily waste characteristics for calendar leap year (366 days) Effluent TN TP K TDS TS VS E.coli^Salmonella^Virus^Helminth ML mg/L mg/L mg/L mg/L mg/L mg/L (countsx10^6Per100mL) (countsPer100mL)
file:///C|/Documents%20and%20Settings/megana/Desktop/Appendix%203e%20-%20Modelling%20data%20-%20Sar10i.txt-.txt[9/10/2012 3:55:32 PM]
(countsx10^6Per100mL) (countsPerLitre) 0.1242 9.0 3.0 1.0 800.0 9 8 0.0 0 0 0.0 0.1242 9.0 3.0 1.0 800.0 9 8 0.0 0 0 0.0 0.1242 9.0 3.0 1.0 800.0 9 8 0.0 0 0 0.0 0.1242 9.0 3.0 1.0 800.0 9 8 0.0 0 0 0.0 0.1242 9.0 3.0 1.0 800.0 9 8 0.0 0 0 0.0 0.1242 9.0 3.0 1.0 800.0 9 8 0.0 0 0 0.0 0.1242 9.0 3.0 1.0 800.0 9 8 0.0 0 0 0.0 0.1242 9.0 3.0 1.0 800.0 9 8 0.0 0 0 0.0 0.1242 9.0 3.0 1.0 800.0 9 8 0.0 0 0 0.0 0.1242 9.0 3.0 1.0 800.0 9 8 0.0 0 0 0.0 0.1242 9.0 3.0 1.0 800.0 9 8 0.0 0 0 0.0 0.1242 9.0 3.0 1.0 800.0 9 8 0.0 0 0 0.0 0.1242 9.0 3.0 1.0 800.0 9 8 0.0 0 0 0.0 0.1242 9.0 3.0 1.0 800.0 9 8 0.0 0 0 0.0 0.1242 9.0 3.0 1.0 800.0 9 8 0.0 0 0 0.0 0.1242 9.0 3.0 1.0 800.0 9 8 0.0 0 0 0.0 0.1242 9.0 3.0 1.0 800.0 9 8 0.0 0 0 0.0 0.1242 9.0 3.0 1.0 800.0 9 8 0.0 0 0 0.0 0.1242 9.0 3.0 1.0 800.0 9 8 0.0 0 0 0.0 0.1242 9.0 3.0 1.0 800.0 9 8 0.0 0 0 0.0 0.1242 9.0 3.0 1.0 800.0 9 8 0.0 0 0 0.0 0.1242 9.0 3.0 1.0 800.0 9 8 0.0 0 0 0.0 0.1242 9.0 3.0 1.0 800.0 9 8 0.0 0 0 0.0 0.1242 9.0 3.0 1.0 800.0 9 8 0.0 0 0 0.0 0.1242 9.0 3.0 1.0 800.0 9 8 0.0 0 0 0.0 0.1242 9.0 3.0 1.0 800.0 9 8 0.0 0 0 0.0 0.1242 9.0 3.0 1.0 800.0 9 8 0.0 0 0 0.0 0.1242 9.0 3.0 1.0 800.0 9 8 0.0 0 0 0.0 0.1242 9.0 3.0 1.0 800.0 9 8 0.0 0 0 0.0 0.1242 9.0 3.0 1.0 800.0 9 8 0.0 0 0 0.0 0.1242 9.0 3.0 1.0 800.0 9 8 0.0 0 0 0.0 0.1242 9.0 3.0 1.0 800.0 9 8 0.0 0 0 0.0 0.1242 9.0 3.0 1.0 800.0 9 8 0.0 0 0 0.0 0.1242 9.0 3.0 1.0 800.0 9 8 0.0 0 0 0.0 0.1242 9.0 3.0 1.0 800.0 9 8 0.0 0 0 0.0 0.1242 9.0 3.0 1.0 800.0 9 8 0.0 0 0 0.0 0.1242 9.0 3.0 1.0 800.0 9 8 0.0 0 0 0.0 0.1242 9.0 3.0 1.0 800.0 9 8 0.0 0 0 0.0 0.1242 9.0 3.0 1.0 800.0 9 8 0.0 0 0 0.0 0.1242 9.0 3.0 1.0 800.0 9 8 0.0 0 0 0.0 0.1242 9.0 3.0 1.0 800.0 9 8 0.0 0 0 0.0 0.1242 9.0 3.0 1.0 800.0 9 8 0.0 0 0 0.0 0.1242 9.0 3.0 1.0 800.0 9 8 0.0 0 0 0.0 0.1242 9.0 3.0 1.0 800.0 9 8 0.0 0 0 0.0 0.1242 9.0 3.0 1.0 800.0 9 8 0.0 0 0 0.0 0.1242 9.0 3.0 1.0 800.0 9 8 0.0 0 0 0.0 0.1242 9.0 3.0 1.0 800.0 9 8 0.0 0 0 0.0 0.1242 9.0 3.0 1.0 800.0 9 8 0.0 0 0 0.0 0.1242 9.0 3.0 1.0 800.0 9 8 0.0 0 0 0.0 0.1242 9.0 3.0 1.0 800.0 9 8 0.0 0 0 0.0 0.1242 9.0 3.0 1.0 800.0 9 8 0.0 0 0 0.0 0.1242 9.0 3.0 1.0 800.0 9 8 0.0 0 0 0.0 0.1242 9.0 3.0 1.0 800.0 9 8 0.0 0 0 0.0

file:///C|/Documents%20and%20Settings/megana/Desktop/Appendix%203e%20-%20Modelling%20data%20-%20Sar10i.txt-.txt[9/10/2012 3:55:32 PM]
0.1242 9.0 3.0 1.0 800.0 9 8 0.0 0 0 0.0 0.1242 9.0 3.0 1.0 800.0 9 8 0.0 0 0 0.0 0.1242 9.0 3.0 1.0 800.0 9 8 0.0 0 0 0.0 0.1242 9.0 3.0 1.0 800.0 9 8 0.0 0 0 0.0 0.1242 9.0 3.0 1.0 800.0 9 8 0.0 0 0 0.0 0.1242 9.0 3.0 1.0 800.0 9 8 0.0 0 0 0.0 0.1242 9.0 3.0 1.0 800.0 9 8 0.0 0 0 0.0 0.1242 9.0 3.0 1.0 800.0 9 8 0.0 0 0 0.0 0.1242 9.0 3.0 1.0 800.0 9 8 0.0 0 0 0.0 0.1242 9.0 3.0 1.0 800.0 9 8 0.0 0 0 0.0 0.1242 9.0 3.0 1.0 800.0 9 8 0.0 0 0 0.0 0.1242 9.0 3.0 1.0 800.0 9 8 0.0 0 0 0.0 0.1242 9.0 3.0 1.0 800.0 9 8 0.0 0 0 0.0 0.1242 9.0 3.0 1.0 800.0 9 8 0.0 0 0 0.0 0.1242 9.0 3.0 1.0 800.0 9 8 0.0 0 0 0.0 0.1242 9.0 3.0 1.0 800.0 9 8 0.0 0 0 0.0 0.1242 9.0 3.0 1.0 800.0 9 8 0.0 0 0 0.0 0.1242 9.0 3.0 1.0 800.0 9 8 0.0 0 0 0.0 0.1242 9.0 3.0 1.0 800.0 9 8 0.0 0 0 0.0 0.1242 9.0 3.0 1.0 800.0 9 8 0.0 0 0 0.0 0.1242 9.0 3.0 1.0 800.0 9 8 0.0 0 0 0.0 0.1242 9.0 3.0 1.0 800.0 9 8 0.0 0 0 0.0 0.1242 9.0 3.0 1.0 800.0 9 8 0.0 0 0 0.0 0.1242 9.0 3.0 1.0 800.0 9 8 0.0 0 0 0.0 0.1242 9.0 3.0 1.0 800.0 9 8 0.0 0 0 0.0 0.1242 9.0 3.0 1.0 800.0 9 8 0.0 0 0 0.0 0.1242 9.0 3.0 1.0 800.0 9 8 0.0 0 0 0.0 0.1242 9.0 3.0 1.0 800.0 9 8 0.0 0 0 0.0 0.1242 9.0 3.0 1.0 800.0 9 8 0.0 0 0 0.0 0.1242 9.0 3.0 1.0 800.0 9 8 0.0 0 0 0.0 0.1242 9.0 3.0 1.0 800.0 9 8 0.0 0 0 0.0 0.1242 9.0 3.0 1.0 800.0 9 8 0.0 0 0 0.0 0.1242 9.0 3.0 1.0 800.0 9 8 0.0 0 0 0.0 0.1242 9.0 3.0 1.0 800.0 9 8 0.0 0 0 0.0 0.1242 9.0 3.0 1.0 800.0 9 8 0.0 0 0 0.0 0.1242 9.0 3.0 1.0 800.0 9 8 0.0 0 0 0.0 0.1242 9.0 3.0 1.0 800.0 9 8 0.0 0 0 0.0 0.1242 9.0 3.0 1.0 800.0 9 8 0.0 0 0 0.0 0.1242 9.0 3.0 1.0 800.0 9 8 0.0 0 0 0.0 0.1242 9.0 3.0 1.0 800.0 9 8 0.0 0 0 0.0 0.1242 9.0 3.0 1.0 800.0 9 8 0.0 0 0 0.0 0.1242 9.0 3.0 1.0 800.0 9 8 0.0 0 0 0.0 0.1242 9.0 3.0 1.0 800.0 9 8 0.0 0 0 0.0 0.1242 9.0 3.0 1.0 800.0 9 8 0.0 0 0 0.0 0.1242 9.0 3.0 1.0 800.0 9 8 0.0 0 0 0.0 0.1242 9.0 3.0 1.0 800.0 9 8 0.0 0 0 0.0 0.1242 9.0 3.0 1.0 800.0 9 8 0.0 0 0 0.0 0.1242 9.0 3.0 1.0 800.0 9 8 0.0 0 0 0.0 0.1242 9.0 3.0 1.0 800.0 9 8 0.0 0 0 0.0 0.1242 9.0 3.0 1.0 800.0 9 8 0.0 0 0 0.0 0.1242 9.0 3.0 1.0 800.0 9 8 0.0 0 0 0.0 0.1242 9.0 3.0 1.0 800.0 9 8 0.0 0 0 0.0 0.1242 9.0 3.0 1.0 800.0 9 8 0.0 0 0 0.0 0.1242 9.0 3.0 1.0 800.0 9 8 0.0 0 0 0.0

file:///C|/Documents%20and%20Settings/megana/Desktop/Appendix%203e%20-%20Modelling%20data%20-%20Sar10i.txt-.txt[9/10/2012 3:55:32 PM]
0.1242 9.0 3.0 1.0 800.0 9 8 0.0 0 0 0.0 0.1242 9.0 3.0 1.0 800.0 9 8 0.0 0 0 0.0 0.1242 9.0 3.0 1.0 800.0 9 8 0.0 0 0 0.0 0.1242 9.0 3.0 1.0 800.0 9 8 0.0 0 0 0.0 0.1242 9.0 3.0 1.0 800.0 9 8 0.0 0 0 0.0 0.1242 9.0 3.0 1.0 800.0 9 8 0.0 0 0 0.0 0.1242 9.0 3.0 1.0 800.0 9 8 0.0 0 0 0.0 0.1242 9.0 3.0 1.0 800.0 9 8 0.0 0 0 0.0 0.1242 9.0 3.0 1.0 800.0 9 8 0.0 0 0 0.0 0.1242 9.0 3.0 1.0 800.0 9 8 0.0 0 0 0.0 0.1242 9.0 3.0 1.0 800.0 9 8 0.0 0 0 0.0 0.1242 9.0 3.0 1.0 800.0 9 8 0.0 0 0 0.0 0.1242 9.0 3.0 1.0 800.0 9 8 0.0 0 0 0.0 0.1242 9.0 3.0 1.0 800.0 9 8 0.0 0 0 0.0 0.1242 9.0 3.0 1.0 800.0 9 8 0.0 0 0 0.0 0.1242 9.0 3.0 1.0 800.0 9 8 0.0 0 0 0.0 0.1242 9.0 3.0 1.0 800.0 9 8 0.0 0 0 0.0 0.1242 9.0 3.0 1.0 800.0 9 8 0.0 0 0 0.0 0.1242 9.0 3.0 1.0 800.0 9 8 0.0 0 0 0.0 0.1242 9.0 3.0 1.0 800.0 9 8 0.0 0 0 0.0 0.1242 9.0 3.0 1.0 800.0 9 8 0.0 0 0 0.0 0.1242 9.0 3.0 1.0 800.0 9 8 0.0 0 0 0.0 0.1242 9.0 3.0 1.0 800.0 9 8 0.0 0 0 0.0 0.1242 9.0 3.0 1.0 800.0 9 8 0.0 0 0 0.0 0.1242 9.0 3.0 1.0 800.0 9 8 0.0 0 0 0.0 0.1242 9.0 3.0 1.0 800.0 9 8 0.0 0 0 0.0 0.1242 9.0 3.0 1.0 800.0 9 8 0.0 0 0 0.0 0.1242 9.0 3.0 1.0 800.0 9 8 0.0 0 0 0.0 0.1242 9.0 3.0 1.0 800.0 9 8 0.0 0 0 0.0 0.1242 9.0 3.0 1.0 800.0 9 8 0.0 0 0 0.0 0.1242 9.0 3.0 1.0 800.0 9 8 0.0 0 0 0.0 0.1242 9.0 3.0 1.0 800.0 9 8 0.0 0 0 0.0 0.1242 9.0 3.0 1.0 800.0 9 8 0.0 0 0 0.0 0.1242 9.0 3.0 1.0 800.0 9 8 0.0 0 0 0.0 0.1242 9.0 3.0 1.0 800.0 9 8 0.0 0 0 0.0 0.1242 9.0 3.0 1.0 800.0 9 8 0.0 0 0 0.0 0.1242 9.0 3.0 1.0 800.0 9 8 0.0 0 0 0.0 0.1242 9.0 3.0 1.0 800.0 9 8 0.0 0 0 0.0 0.1242 9.0 3.0 1.0 800.0 9 8 0.0 0 0 0.0 0.1242 9.0 3.0 1.0 800.0 9 8 0.0 0 0 0.0 0.1242 9.0 3.0 1.0 800.0 9 8 0.0 0 0 0.0 0.1242 9.0 3.0 1.0 800.0 9 8 0.0 0 0 0.0 0.1242 9.0 3.0 1.0 800.0 9 8 0.0 0 0 0.0Water usage: drinking^hosedown^flushing (L)0 0 0Annual Effluent Volume (ML)45.400002Last entry for workDays.SelectedString7 days/weekLast entry for months.SelectedStringAll yearLast day loaded to screen1_____________________________________________________________
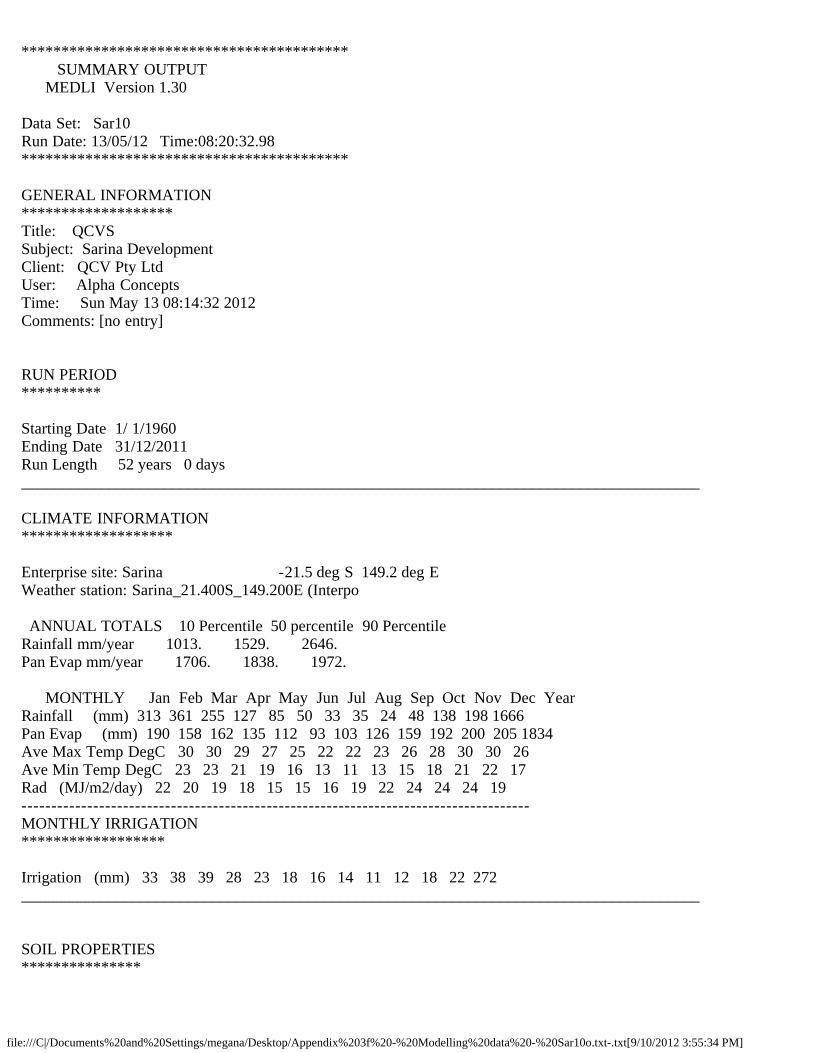
file:///C|/Documents%20and%20Settings/megana/Desktop/Appendix%203f%20-%20Modelling%20data%20-%20Sar10o.txt-.txt[9/10/2012 3:55:34 PM]
***************************************** SUMMARY OUTPUT MEDLI Version 1.30
Data Set: Sar10 Run Date: 13/05/12 Time:08:20:32.98*****************************************
GENERAL INFORMATION*******************Title: QCVS Subject: Sarina Development Client: QCV Pty Ltd User: Alpha Concepts Time: Sun May 13 08:14:32 2012 Comments: [no entry]
RUN PERIOD**********
Starting Date 1/ 1/1960Ending Date 31/12/2011Run Length 52 years 0 days _____________________________________________________________________________________
CLIMATE INFORMATION*******************
Enterprise site: Sarina -21.5 deg S 149.2 deg EWeather station: Sarina_21.400S_149.200E (Interpo
ANNUAL TOTALS 10 Percentile 50 percentile 90 PercentileRainfall mm/year 1013. 1529. 2646.Pan Evap mm/year 1706. 1838. 1972.
MONTHLY Jan Feb Mar Apr May Jun Jul Aug Sep Oct Nov Dec YearRainfall (mm) 313 361 255 127 85 50 33 35 24 48 138 198 1666Pan Evap (mm) 190 158 162 135 112 93 103 126 159 192 200 205 1834Ave Max Temp DegC 30 30 29 27 25 22 22 23 26 28 30 30 26Ave Min Temp DegC 23 23 21 19 16 13 11 13 15 18 21 22 17Rad (MJ/m2/day) 22 20 19 18 15 15 16 19 22 24 24 24 19-------------------------------------------------------------------------------------MONTHLY IRRIGATION******************
Irrigation (mm) 33 38 39 28 23 18 16 14 11 12 18 22 272_____________________________________________________________________________________
SOIL PROPERTIES***************

file:///C|/Documents%20and%20Settings/megana/Desktop/Appendix%203f%20-%20Modelling%20data%20-%20Sar10o.txt-.txt[9/10/2012 3:55:34 PM]
Soil type: Low Perm Red Brown Earth
SOIL WATER PROPERTIES
Layer 1 Layer 2 Layer 3 Layer 4Bulk Density (g/cm3) 1.4 1.5 1.5 1.5Porosity (mm/layer) 46.4 218.9 271.7 130.2Saturated Water Content (mm/layer) 46.0 217.5 268.8 128.4Drained Upper Limit (mm/layer) 25.7 160.0 203.4 96.9Lower Storage Limit (mm/layer) 8.6 100.5 153.6 78.6Air Dry Moisture Content (mm/layer) 4.3Layer Thickness (mm) 100.0 500.0 600.0 300.0
Profile Max RootzoneTotal Saturated Water Content (mm) 660.7 353.1Total Drained Upper Limit (mm) 486.0 253.5Total Lower Storage Limit (mm) 341.3 160.3Total Air Dry Moisture Content (mm) 5.7 5.0Total Depth (mm) 1500.0 800.0
Maximum Plant Available Water Capacity 93.2Saturated Hydraulic Conductivity At Surface (mm/hr) 20.0 Limiting (mm/hr) 0.5
RUNOFF
Runoff curve No II 75.0
SOIL EVAPORATION
CONA (mm/day^0.5) 4.0URITCH (mm) 10.0_____________________________________________________________________________________
AVERAGE WASTE STREAM********************
Other waste stream(All values relate to influent after any screening and recycling, if applicable).
Inflow Volume (ML/year) 45.36Nitrogen (tonne/year) 0.41Phosphorus (tonne/year) 0.14Salinity (tonne/year) 36.29
Nitrogen Concentration (mg/L) 9.00Phosphorus Concentration (mg/L) 3.00Salinity (mg/L) 800.00Salinity (dS/m) 1.25
WASTE STREAM DETAILS (for last inflow event):Nitrogen Concentration (mg/L) 9.00

file:///C|/Documents%20and%20Settings/megana/Desktop/Appendix%203f%20-%20Modelling%20data%20-%20Sar10o.txt-.txt[9/10/2012 3:55:34 PM]
Phosphorus Concentration (mg/L) 3.00TDS Concentration (mg/L) 800.00Salinity (dS/m) 1.25_____________________________________________________________________________________
IRRIGATION WATER****************
Irrigation triggered every 1 daysIrrigating a fixed amount of 2 mm
AREA
Total Irrigation Area (ha) 19.50
VOLUMES
Total Irrigation (ML/year) 53.05Minimum Volume must be full irrig. requiremtMaximum Volume must be full irrig. requiremtMaximum Vol. Available For Shandying (ML/yr) 0.00
IRRIGATION CONCENTRATIONS
Average salinity of Irrigation (dS/m) 1.04Average salinity of Irrigation (mg/L) 668.49Average Nitrogen Conc of Irrigation Before ammonia loss (mg/L) 2.43 After ammonia loss (mg/L) 2.34Average Phosphorus Conc of Irrigation (mg/L) 2.48_____________________________________________________________________________________
FRESH WATER USAGE*****************
Irrigation (shandying) water (ML/yr) 0.00
Avg volume of fresh water used (ML/yr) 0.00
Annual allocation (ML/yr) N/A
POND INFORMATION****************
POND GEOMETRY Pond 1 Pond 2
Final pond volume (ML) 0.60 7.98Final liquid volume (ML) 0.58 7.98Final sludge volume (ML) 0.02 0.00Average pond volume (ML) 0.60 8.26

file:///C|/Documents%20and%20Settings/megana/Desktop/Appendix%203f%20-%20Modelling%20data%20-%20Sar10o.txt-.txt[9/10/2012 3:55:34 PM]
Average active volume (ML) 0.59 8.26Maximum pond volume (ML) 0.60 28.00Minimum allowable pond volume (ML) 0.01 7.35Average pond depth (m) 4.30 0.46Pond depth at outlet (m) 4.30 1.50Maximum water surface area (m2 x1000) 0.14 19.08Pond catchment area (m2 x1000) 0.19 19.63Pond footprint length (m) 13.81 140.12Pond footprint width (m) 13.81 140.12For 1st Pond: Optimal anaerobic pond volume (ML) 0.0 (incl. 10 yrs sludge storage) Required active volume (ML) 0.0 @ VS Loading Rate (kg/m3/d) of 0.077Optimal vol. for subsequent pond(s) (ML) 2.5 (assumes 20 day retention time)Minimum pond volume for irrigation (ML) 7.3 (plus the volume due to sludge)
POND VOLATILE SOLIDS LOAD
Effective VS loading rate * (kg/m3) 0.002* avg VS load/avg active volume
POND WATER BALANCE
Inflow of Effluent to pond system (ML/yr) 45.36Recycle Volume from pond system (ML/yr) 0.00Rain water added to pond system (ML/yr) 32.71Evaporation loss from pond system (ML/yr) 23.77Seepage loss from pond system (ML/yr) 0.68Irrigation from last pond (ML/yr) 53.05Volume of overtopping (ML/yr) 0.70Sludge accumulated (ML/yr) 0.00 Sludge accumulated (t DM/yr) 0.25Sludge removed (ML/yr) 0.00No of desludging events every 10 years 0.00Increase in pond water volume (ML/yr) -0.11
OVERTOPPING EVENTS
Volume of overtopping (ML/yr) 0.70No. of days pond overtops per 10 years 5.38Average Length of overtopping events (days) 3.50% Reuse 97.48No. of overtopping events every 10 years > 0.000 ML 1.54 > 0.019 ML* 1.54 > 1.000 ML 0.96 > 2.000 ML 0.77 > 5.000 ML 0.38 > 10.000 ML 0.19 > 20.000 ML 0.00 > 50.000 ML 0.00* Volume equivalent to 1 mm depth of water
>>> NO-IRRIGATION EVENTS <<<
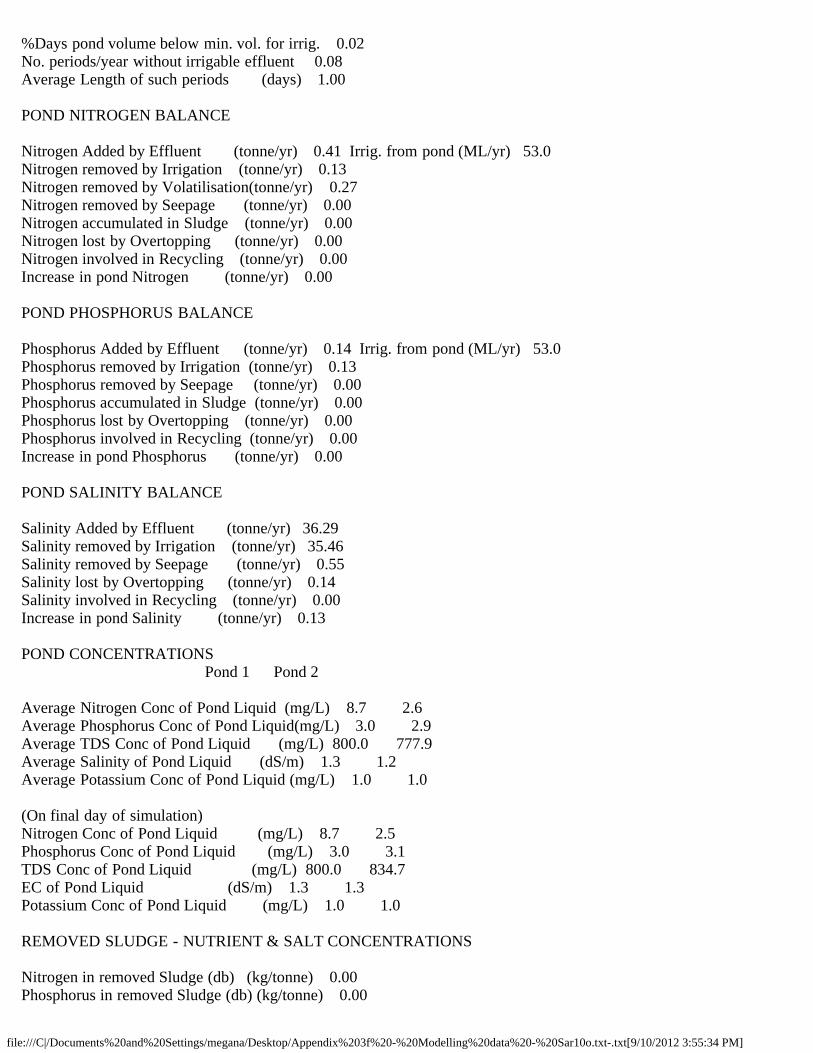
file:///C|/Documents%20and%20Settings/megana/Desktop/Appendix%203f%20-%20Modelling%20data%20-%20Sar10o.txt-.txt[9/10/2012 3:55:34 PM]
%Days pond volume below min. vol. for irrig. 0.02No. periods/year without irrigable effluent 0.08Average Length of such periods (days) 1.00
POND NITROGEN BALANCE
Nitrogen Added by Effluent (tonne/yr) 0.41 Irrig. from pond (ML/yr) 53.0Nitrogen removed by Irrigation (tonne/yr) 0.13Nitrogen removed by Volatilisation(tonne/yr) 0.27Nitrogen removed by Seepage (tonne/yr) 0.00Nitrogen accumulated in Sludge (tonne/yr) 0.00Nitrogen lost by Overtopping (tonne/yr) 0.00Nitrogen involved in Recycling (tonne/yr) 0.00Increase in pond Nitrogen (tonne/yr) 0.00
POND PHOSPHORUS BALANCE
Phosphorus Added by Effluent (tonne/yr) 0.14 Irrig. from pond (ML/yr) 53.0Phosphorus removed by Irrigation (tonne/yr) 0.13Phosphorus removed by Seepage (tonne/yr) 0.00Phosphorus accumulated in Sludge (tonne/yr) 0.00Phosphorus lost by Overtopping (tonne/yr) 0.00Phosphorus involved in Recycling (tonne/yr) 0.00Increase in pond Phosphorus (tonne/yr) 0.00
POND SALINITY BALANCE
Salinity Added by Effluent (tonne/yr) 36.29Salinity removed by Irrigation (tonne/yr) 35.46Salinity removed by Seepage (tonne/yr) 0.55Salinity lost by Overtopping (tonne/yr) 0.14Salinity involved in Recycling (tonne/yr) 0.00Increase in pond Salinity (tonne/yr) 0.13
POND CONCENTRATIONS Pond 1 Pond 2
Average Nitrogen Conc of Pond Liquid (mg/L) 8.7 2.6Average Phosphorus Conc of Pond Liquid(mg/L) 3.0 2.9Average TDS Conc of Pond Liquid (mg/L) 800.0 777.9Average Salinity of Pond Liquid (dS/m) 1.3 1.2Average Potassium Conc of Pond Liquid (mg/L) 1.0 1.0
(On final day of simulation)Nitrogen Conc of Pond Liquid (mg/L) 8.7 2.5Phosphorus Conc of Pond Liquid (mg/L) 3.0 3.1TDS Conc of Pond Liquid (mg/L) 800.0 834.7EC of Pond Liquid (dS/m) 1.3 1.3Potassium Conc of Pond Liquid (mg/L) 1.0 1.0
REMOVED SLUDGE - NUTRIENT & SALT CONCENTRATIONS
Nitrogen in removed Sludge (db) (kg/tonne) 0.00Phosphorus in removed Sludge (db) (kg/tonne) 0.00

file:///C|/Documents%20and%20Settings/megana/Desktop/Appendix%203f%20-%20Modelling%20data%20-%20Sar10o.txt-.txt[9/10/2012 3:55:34 PM]
Salt in removed Sludge (db) (kg/tonne) 0.00Potassium in removed Sludge (db) (kg/tonne) 0.00
REMOVED SLUDGE - NUTRIENT & SALT MASSES
Nitrogen in removed Sludge (tonne/yr) 0.00Phosphorus in removed Sludge (tonne/yr) 0.00Salt in removed Sludge (mass bal.)(tonne/yr) 0.00Salt in removed Sludge (tonne/yr) 0.00Potm. in removed Sludge (mass bal.)(tonne/yr 0.00Potassium in removed Sludge (tonne/yr) 0.00_____________________________________________________________________________________
LAND DISPOSAL AREA******************
WATER BALANCE-------------(Initial soil water assumed to be at field capacity)(Irrigated up to 2.15% of field capacity)Rainfall (mm/year) 1666.1 Irrigation Area (ha) 19.5Irrigation (mm/year) 272.0Soil Evaporation (mm/year) 268.7Transpiration (mm/year) 717.0Runoff (mm/year) 425.2Drainage (mm/year) 527.0Change in soil moisture (mm/year) 0.3
ANNUAL TOTALS
Year Rain Irrig Sevap Trans Runoff Drain Change (mm) (mm) (mm) (mm) (mm) (mm) (mm) _____________________________________________________________________________ 1960 1913.0 324.0 534.1 387.0 733.8 570.6 11.6 1961 1161.0 230.0 463.9 550.2 116.0 317.5 -56.7 1962 1411.0 232.0 142.5 669.4 151.2 546.2 133.7 1963 2244.0 352.0 520.6 492.5 1019.3 768.5 -204.8 1964 1228.0 232.0 3.5 1124.8 24.5 267.4 39.9 1965 965.0 202.0 155.2 778.2 5.9 173.8 53.8 1966 1002.0 204.0 343.7 634.6 37.8 261.0 -71.0 1967 1575.0 264.0 157.5 952.7 63.9 506.0 158.9 1968 2049.0 312.0 57.9 793.1 999.9 689.6 -179.5 1969 1323.0 236.0 428.3 521.4 59.4 460.0 89.9 1970 1899.0 262.0 287.0 689.6 514.8 518.6 151.0 1971 1781.0 288.0 319.0 818.5 248.2 725.3 -42.1 1972 1458.0 262.0 77.3 698.4 580.1 560.3 -196.0 1973 2026.0 312.0 202.9 990.8 224.1 656.1 264.1 1974 3164.0 422.0 271.8 705.6 1900.1 894.2 -185.7 1975 1938.0 288.0 7.0 1078.0 244.8 704.9 191.3 1976 2049.0 342.0 0.0 1056.9 752.2 742.2 -160.2 1977 1746.0 290.0 222.3 602.1 508.0 715.0 -11.5 1978 1482.0 266.0 140.7 977.3 308.8 346.0 -24.8 1979 3194.0 368.0 0.0 986.9 1850.3 589.5 135.3

file:///C|/Documents%20and%20Settings/megana/Desktop/Appendix%203f%20-%20Modelling%20data%20-%20Sar10o.txt-.txt[9/10/2012 3:55:34 PM]
1980 1470.0 274.0 176.6 784.2 309.6 577.5 -104.0 1981 1835.0 308.0 344.9 624.9 304.8 886.1 -17.8 1982 1102.0 214.0 284.9 479.7 102.3 519.6 -70.6 1983 1391.0 250.0 221.0 765.7 144.7 528.2 -18.7 1984 910.0 208.0 267.8 692.7 6.3 123.0 28.3 1985 1662.0 280.0 22.0 1001.4 177.7 718.3 22.5 1986 1119.0 214.0 0.0 1119.3 2.0 274.3 -62.6 1987 1111.0 210.0 587.9 435.4 26.6 171.7 99.4 1988 2360.0 346.0 401.3 809.6 600.6 824.0 70.5 1989 2016.0 320.0 333.5 593.0 407.5 1094.8 -92.8 1990 2741.0 268.0 536.1 96.2 1443.0 717.0 216.7 1991 2551.0 358.0 555.6 323.7 1632.1 587.4 -189.8 1992 964.0 198.0 258.8 670.6 40.5 234.7 -42.6 1993 1254.0 224.0 281.3 822.4 163.3 237.4 -26.4 1994 1153.0 212.0 157.0 732.2 144.9 294.9 36.0 1995 1003.0 202.0 184.2 914.0 10.3 166.1 -69.7 1996 1422.0 244.0 114.5 935.8 142.3 375.5 97.9 1997 1243.0 232.0 342.7 583.5 183.6 377.3 -12.1 1998 1591.0 274.0 344.5 857.2 69.2 574.0 20.1 1999 1628.0 278.0 212.5 770.8 259.0 609.0 54.7 2000 2773.0 386.0 243.2 799.8 1022.5 1018.0 75.5 2001 1022.0 210.0 0.0 868.1 89.0 430.1 -155.2 2002 817.0 170.0 89.1 770.1 34.2 180.8 -87.2 2003 1196.0 216.0 659.0 244.1 165.0 241.1 102.9 2004 1087.0 208.0 475.5 498.2 37.1 296.4 -12.2 2005 1105.0 214.0 313.1 739.7 156.7 165.0 -55.4 2006 1246.0 232.0 381.9 637.1 44.4 350.3 64.3 2007 1917.0 292.0 707.3 361.7 357.3 642.5 140.2 2008 1949.0 320.0 398.8 594.8 823.5 573.9 -122.0 2009 1720.0 270.0 395.3 489.2 400.2 594.7 110.6 2010 3377.0 450.0 344.6 775.5 1454.6 1183.0 69.2 2011 2293.0 376.0 0.0 985.2 1011.0 822.3 -149.6_____________________________________________________________________________
NUTRIENT BALANCE-----------------
NITROGEN
Total N irrigated from ponds (kg/ha/year) 6.6 % of Total as ammonium 20.0Nitrogn lost by ammonia volat.(kg/ha/year) 0.3 Deep Drainage (mm/year) 527.0Nitrogen added in irrigation (kg/ha/year) 6.4Nitrogen added in seed (kg/ha/year) 0.6Nitrogen removed by crop (kg/ha/year) 68.1Denitrification (kg/ha/year) 3.6Leached NO3-N (kg/ha/year) 1.6Change in soil organic-N (kg/ha/year) -65.3Change in soil solution NH4-N (kg/ha/year) 0.0Change in soil solution NO3-N (kg/ha/year) -1.1Change in adsorbed NH4-N (kg/ha/year) 0.0Initial soil organic-N (kg/ha) 3520.0Final soil organic-N (kg/ha) 123.3Initial soil inorganic-N (kg/ha) 55.2

file:///C|/Documents%20and%20Settings/megana/Desktop/Appendix%203f%20-%20Modelling%20data%20-%20Sar10o.txt-.txt[9/10/2012 3:55:34 PM]
Final soil inorganic-N (kg/ha) 0.0Average N03-N conc in the root zone (mg/L) 0.6Average N03-N conc below root zone (mg/L) 0.4Average N03-N conc of deep drainage (mg/L) 0.3
PHOSPHORUS
Phosphorus added in irrigatn (kg/ha/year) 6.8 % of Total as phosphate 100.0Phosphorus added in seed (kg/ha/year) 0.1Phosphorus removed by crop (kg/ha/year) 12.7Leached PO4-P (kg/ha/year) 0.4Change in dissolved PO4-P (kg/ha/year) 0.0Change in adsorbed PO4-P (kg/ha/year) -6.3Average P04-P conc in the root zone (mg/L) 0.0Average P04-P conc below root zone (mg/L) 0.0
SOIL P STORAGE LIFE
Year YearNo. Tot P stored P leached in year kg/ha kg/ha _____________________________________________________________________________ 1960 1 3232.3 0.6 1961 2 3214.3 0.3 1962 3 3189.3 0.5 1963 4 3179.2 0.8 1964 5 3165.2 0.3 1965 6 3131.0 0.2 1966 7 3119.5 0.3 1967 8 3104.8 0.5 1968 9 3090.5 0.7 1969 10 3073.1 0.4 1970 11 3057.9 0.5 1971 12 3045.6 0.7 1972 13 3039.1 0.5 1973 14 3021.8 0.6 1974 15 3006.1 0.8 1975 16 2995.6 0.6 1976 17 2990.6 0.6 1977 18 2973.5 0.6 1978 19 2968.9 0.3 1979 20 2958.2 0.5 1980 21 2959.7 0.5 1981 22 2947.5 0.7 1982 23 2945.0 0.4 1983 24 2943.7 0.4 1984 25 2947.6 0.1 1985 26 2936.5 0.6 1986 27 2930.6 0.2 1987 28 2930.2 0.1 1988 29 2935.6 0.7 1989 30 2923.2 0.9 1990 31 2924.9 0.6 1991 32 2926.8 0.5 1992 33 2933.6 0.2

file:///C|/Documents%20and%20Settings/megana/Desktop/Appendix%203f%20-%20Modelling%20data%20-%20Sar10o.txt-.txt[9/10/2012 3:55:34 PM]
1993 34 2924.3 0.2 1994 35 2921.2 0.2 1995 36 2921.0 0.1 1996 37 2925.6 0.3 1997 38 2916.2 0.3 1998 39 2916.1 0.4 1999 40 2911.2 0.5 2000 41 2917.9 0.8 2001 42 2906.8 0.3 2002 43 2907.0 0.1 2003 44 2910.4 0.2 2004 45 2919.4 0.2 2005 46 2910.6 0.1 2006 47 2908.7 0.3 2007 48 2908.4 0.5 2008 49 2914.7 0.4 2009 50 2905.8 0.4 2010 51 2905.4 0.8 2011 52 2901.8 0.6__________________________________________________________________________________________________________________________________________________________________
PLANT-----
Plant species: Coastal couch grass (Cynodon dac
PLANT WATER USE
Irrigation (mm/year) 272. Totl Irrigation Area(ha) 19.5Pan coefficient (%) 1.0Maximum crop coefficient (%) 0.8Average Plant Cover (%) 64.Average Plant Total Cover (%) 75.Average Plant Rootdepth (mm) 596.Average Plant Available Water Capacity (mm) 87.Average Plant Available Water (mm) 59.Yield produced per unit transp. (kg/ha/mm) 8.
PLANT NUTRIENT UPTAKE
Dry Matter Yield (Shoots) (kg/ha/yr) 5564.Net nitrogen removed by plant (kg/ha/yr) 68. Shoot Concn (%DM) 1.21Net phosphorus removed by plant (kg/ha/yr) 13. Shoot Concn (%DM) 0.23
AVERAGE MONTHLY GROWTH STRESS (0=no stress, 1=full stress)
Month Yield Nitr Temp Water Water kg/ha Defic Logging____________________________________________ 1 515. 0.3 0.0 0.1 0.1 2 571. 0.3 0.0 0.1 0.1

file:///C|/Documents%20and%20Settings/megana/Desktop/Appendix%203f%20-%20Modelling%20data%20-%20Sar10o.txt-.txt[9/10/2012 3:55:34 PM]
3 768. 0.4 0.0 0.0 0.1 4 712. 0.5 0.0 0.1 0.0 5 554. 0.5 0.2 0.0 0.0 6 350. 0.5 0.6 0.0 0.0 7 283. 0.5 0.7 0.1 0.0 8 352. 0.4 0.5 0.3 0.0 9 368. 0.5 0.2 0.5 0.0 10 295. 0.4 0.0 0.5 0.0 11 332. 0.3 0.0 0.3 0.0 12 464. 0.3 0.0 0.2 0.0
>>> NO-PLANT EVENTS <<<
%Days due to temperature stress 0.3%Days due to water stress 4.0%Days due to nitrogen stress 0.0No. of forced harvests per year 0.9No. of normal harvests per year 2.9_____________________________________________________________________________________
SALINITY--------
Salt tolerance - plant species: tolerant
Average EC of Irrigation Water (dS/m) 1.0 Irrigation (mm/year) 272.0Average EC of Rainwater (dS/m x10) 0.3 Rainfall (mm/year) 1666.1Average EC of Infiltrated water (dS/m) 0.2Av. water-upt-weightd rootzone EC(dS/m s.e.) 0.2EC soil soln (FC) at base of rootzone (dS/m) 0.7 Deep Drainage (mm/year) 527.0Reduction in Crop yield due to Salinity (%) 0.0Percentage of yrs that crop yld falls below 90% of potential because of soil salinity 0.0
Period ECrootzone ECbase Rel Yield sat ext in situ (dS/m) (dS/m) (%)____________________________________________ 1960 - 1964 0.19 0.63 100. 1961 - 1965 0.22 0.78 100. 1962 - 1966 0.22 0.78 100. 1963 - 1967 0.23 0.82 100. 1964 - 1968 0.22 0.84 100. 1965 - 1969 0.22 0.77 100. 1966 - 1970 0.19 0.65 100. 1967 - 1971 0.17 0.57 100. 1968 - 1972 0.17 0.53 100. 1969 - 1973 0.17 0.57 100. 1970 - 1974 0.16 0.49 100. 1971 - 1975 0.15 0.47 100. 1972 - 1976 0.15 0.46 100. 1973 - 1977 0.15 0.45 100. 1974 - 1978 0.15 0.48 100.

file:///C|/Documents%20and%20Settings/megana/Desktop/Appendix%203f%20-%20Modelling%20data%20-%20Sar10o.txt-.txt[9/10/2012 3:55:34 PM]
1975 - 1979 0.16 0.52 100. 1976 - 1980 0.17 0.54 100. 1977 - 1981 0.16 0.52 100. 1978 - 1982 0.17 0.54 100. 1979 - 1983 0.17 0.51 100. 1980 - 1984 0.19 0.61 100. 1981 - 1985 0.18 0.59 100. 1982 - 1986 0.21 0.73 100. 1983 - 1987 0.23 0.90 100. 1984 - 1988 0.21 0.77 100. 1985 - 1989 0.16 0.53 100. 1986 - 1990 0.16 0.52 100. 1987 - 1991 0.16 0.48 100. 1988 - 1992 0.16 0.45 100. 1989 - 1993 0.18 0.54 100. 1990 - 1994 0.22 0.74 100. 1991 - 1995 0.28 1.04 100. 1992 - 1996 0.28 1.21 100. 1993 - 1997 0.27 1.10 100. 1994 - 1998 0.24 0.91 100. 1995 - 1999 0.21 0.77 100. 1996 - 2000 0.17 0.56 100. 1997 - 2001 0.17 0.54 100. 1998 - 2002 0.17 0.57 100. 1999 - 2003 0.20 0.64 100. 2000 - 2004 0.22 0.74 100. 2001 - 2005 0.30 1.18 100. 2002 - 2006 0.31 1.29 100. 2003 - 2007 0.25 0.96 100. 2004 - 2008 0.23 0.79 100. 2005 - 2009 0.20 0.69 100. 2006 - 2010 0.16 0.51 100. 2007 - 2011 0.15 0.44 100._____________________________________________________________________________________
GROUNDWATER************
Average Groundwater Recharge (m3/day) 281.3Average Nitrate-N Conc of Recharge (mg/L) 0.3
Thickness of the Aquifer (m) 10.0Distance (m) from Irrigation Area to where Nitrate-N Conc in Groundwater is Calculated 500.0
Concentration of NITRATE-N in Groundwater (mg/L)----------------------------------------------
Year Depth Below Water Table Surface 0.0 m 5.0 m 9.0 m ____________________________________________ 1964 0.2 0.2 0.2 1969 0.2 0.2 0.2 1974 0.3 0.3 0.3

file:///C|/Documents%20and%20Settings/megana/Desktop/Appendix%203f%20-%20Modelling%20data%20-%20Sar10o.txt-.txt[9/10/2012 3:55:34 PM]
1979 0.3 0.3 0.3 1984 0.3 0.3 0.3 1989 0.3 0.3 0.3 1994 0.3 0.3 0.3 1999 0.3 0.3 0.3 2004 0.3 0.3 0.3 2009 0.3 0.3 0.3Last 2011 0.3 0.3 0.3_____________________________________________________________________________________
ACKNOWLEDGMENTS***************This run brought to you courtesy of:
MEDLIEXE.EXE : 1300468 bytes Mon Jun 23 06:20:34 2008
CRCPROJ.EXE : 1286656 bytes Mon Jun 23 06:20:38 2008
GRAPHS.EXE : 439296 bytes Mon Jun 23 06:20:36 2008
__________________________________________OTHER INDUSTRY INPUT PARAMETERS - DATA SUMMARY
Nature of Industry: other__________________________________________ 1 file(s) copied
UNCONDITIONAL FINISH

Alpha Concepts – Soil Test for Wastewater Treatment Page 1 of 4
Alpha Concepts Pty Ltd ACN: 108 153 242
Process Engineering, Process Management, Project Management and Environmental Management Solutions
PO Box 2055, Gladstone Qld 4680 Telephone: 07 4979 4001 Facsimile: 07 4979 3009 SOIL PERMEABILITY TEST FOR PROPOSED WASTE WATER SYSTEM Test performed to guidelines set out in: AS/NZS 1547:2000 - “Onsite Domestic Wastewater Management” Client QCV Pty Ltd Client Job Number WWT/QCVS/0512/0 Site of test Lot 1 Plan RP726644, Armstrong
Beach Road, Sarina GPS coordinates S 210 26.317’ E1490 14.032’ Survey Plan Details Lot 1 Plan RP 726644 General description of location Refer to Diagram
North of access gate, south of wastewater dam.
Date of Test 23rd February 2012 Time of Test 10:00 hours Performed by Darrin Marxsen Vegetation of test site
Cleared, Grassed
General comment on site Previously disturbed site, evidence of modification to ground.
Soil moisture at time of digging Damp, rain in previous 48 hours. Comment on Soil Significant biological pores and roots Drainage Comment Well drained to south Site exposure Good Flood Potential Very Remote Nearest water course / Bore Site Wastewater dam, natural
watercourse over 500 m Permeability* 0.2 m/day Soil Category (6) Medium to heavy clay
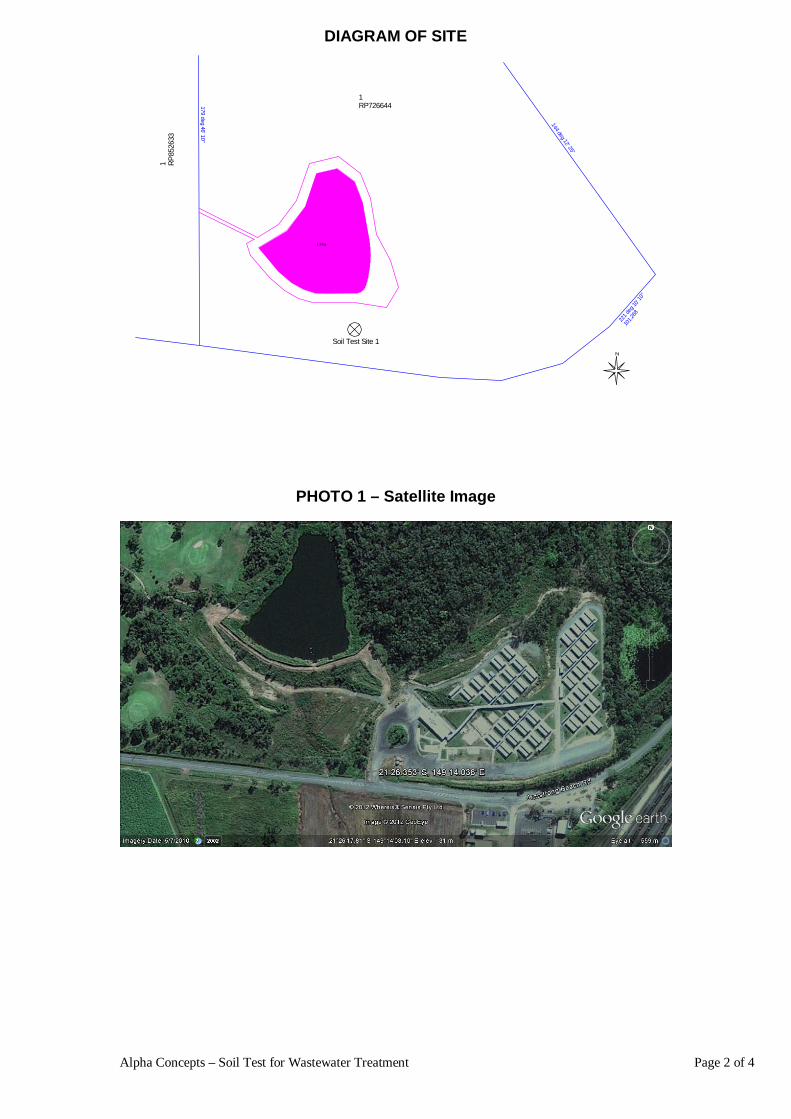
Alpha Concepts – Soil Test for Wastewater Treatment Page 2 of 4
DIAGRAM OF SITE
N
1RP726644
1 RP85
2633
179 deg 46' 10"
144 deg 12' 25"
221 d
eg 10
' 10"
101.2
68
1.9 ha
Soil Test Site 1
PHOTO 1 – Satellite Image

Alpha Concepts – Soil Test for Wastewater Treatment Page 3 of 4
PHOTO 2 – Soil Test Site # 1
PHOTO 3 – Site Wastewater Dam

Alpha Concepts – Soil Test for Wastewater Treatment Page 4 of 4
PHOTO 4 – Looking North from Soil Test Site 1
PHOTO 5 – Red Brown Heavy Clay of Soil Test Site 2 – Golf Course
Test Performed by: Darrin Marxsen BE (Chem), Grad Dip Mgt, Grad Cert Env Mgt MProject Mment MIEAust CPEng, CEnv CEng MIChemE Principal Resource Alpha Concepts Pty Ltd Reported: Thursday, 10 May 2012

LOGSHEET
Project QCV SarinaLocation Amstrong Beach Road
Date 23/02/2012Test Site 1
ParameterAuger Depth 40 cm AD
Water Depth 20 cm HAverage radius of Auger Hole 10 cm r
Depth to impermeable Layer >100 cm S
Vegetation at test site Cleared - grassed
Time elapsed between firstfilling and start of measurement 20 mins
Soil moisture at time of digging DampGeneral comment (waterlogged? Soil structure?
biological pores?) Biological pores and roots
Location Description centre of block, north of gate, south of wastewater dam

Parameter Description
H Depth of Water in Testhole 20 cm Measurement Time intervals (decimal mins) Difference Flow Rate
S Depth to underlying impermeable layer >100 cm 1085 mm 0.00r Radius of test hole 10 cm 1070 mm 2.00 2.000000 13.88 cm3/min 13.87799
AD Auger Depth 40 cm 1055 mm 4.00 2.000000 13.88 cm3/min 13.877991040 mm 6.00 2.000000 13.88 cm3/min 13.87799
Q Water loss 12.85 cm3/min 1028 mm 8.00 2.000000 11.10 cm3/min 11.10239
D Permeater Internal Diameter 50 mm 1016 mm 10.00 2.000000 11.10 cm3/min 11.10239d Vent tube external diameter 12 mm 1003 mm 12.00 2.000000 12.03 cm3/min 12.02759
A Permeater internal area 0.001963 m2 986 mm 14.00 2.000000 15.73 cm3/min 15.72838a Vent tube external area 0.000113 m2 971 mm 16.00 2.000000 13.88 cm3/min 13.87799
At Permeater Area 0.00185 m2 960 mm 18.00 2.000000 10.18 cm3/min 10.1771918.50398 cm2
Average 12.85
4.4Q 56.53994112
H/2r 1 Measurement Time (10 min intervals) Difference Flow Rater/H^2 0.025 mm
r/H 0.5 mm 0.000000 #DIV/0! cm3/min #DIV/0!2piH^2 2513.274123 mm 0.000000 #DIV/0! cm3/min #DIV/0!
mm 0.000000 #DIV/0! cm3/min #DIV/0!Ksat 0.01 cm/min mm 0.000000 #DIV/0! cm3/min #DIV/0!
0.15 mm/min mm 0.000000 #DIV/0! cm3/min #DIV/0!
215.65 mm/day mm 0.000000 #DIV/0! cm3/min #DIV/0!0.2 m/day mm 0.000000 #DIV/0! cm3/min #DIV/0!
mm 0.000000 #DIV/0! cm3/min #DIV/0!mm 0.000000 #DIV/0! cm3/min #DIV/0!
Average #DIV/0!

SOIL CATEGORY DETERMINATION
Category Soil texture Structure Ksat m/d Drainage Class Note
1 Gravels and sands Structureless (Massive) >3.0 Rapidly drained2 sandy loam weakly structured >3.0 well drained
Massive 1.4 - 3.03 Loams High / moderately structured 1.5 - 3.0 Moderately well drained
weakly structured or massive 0.5 - 1.5
4 Clay loams High / moderately structured 0.5 - 1.5 Imperfectly drainedweakly sructured 0.12 - 0.5
Massive 0.06 - 0.12
5 Light Clays Strongly structured 0.12 - 0.5 Poorly Drained
For clay dominated soils having dispersive (sodic) or shrink / swellbehaviour, specialist soil advice and specialist design techniques will
be required to enable their utilisation for land application systems
Moderate structured 0.06 - 0.12Weak structured or massive < 0.06
6 Medium to heavy clays Strongly structured 0.06 - 0.5 Very poorly drained
For clay dominated soils having dispersive (sodic) or shrink / swell
behaviour, specialist soil advice and specialist design techniques willbe required to enable their utilisation for land application systems
Moderate structured < 0.06Weak structured or massive <0.06
SOIL CHARECTERISTICS
Depth 0 to 150 150 to 400
Colour black yellow brown
% Clay 40% 60% 5% = sands, 10% = sandy loams, 10-25% Loams, 25-35 Clay Loams, 35-40% Light Clay, >50% heavy Clay
% Coarse Fragments 2 to 10% 2 to 10% <2% = very few, 2-10%few, 10-20%=common, 20-50%=Many, 50-90% Abundant, >90% Profuse
Size of fragments mm 6 - 20 mm 6 - 20 mm 2-6 = fine gravel, 6-20, medium gravel, 20-60 coarse gravel, 60-200= cobble, >600 = bolders
Degree of Structure Strong Strong Massive, single grained = sandy soils, Weak, 30% < 100 mm, Moderate 30-60% < 100 mm, > 60% peds <100 mm


Smart eDA (http://www.smarteda.qld.gov.au) Page of 1 1 October 09, 2012, 10:01 AM
99 ARMSTRONG BEACH RD, SARINA 473710 matters requiring further investigation.
Department of Environment and Resource Management
Department of Transport and Main Roads
Ergon
Smart eDA
Smart eDA ID: 1349742000664
State assessments
Acid Sulfate SoilsAcid Sulfate Soil Administration Boundaries Yes, MACKAYCoastal ManagementErosion Prone Areas Not available. Contact agencyContaminated Land
Contaminated Land Not available. Search DERMRegister
Native VegetationAssessable Vegetation Not available. Contact agencyWaterSub Artesian Water Management Areas Yes, A3-104870WetlandsMap of referable wetlands YesWild RiversDeclared Wild River High Preservation Area Service down. Check later
Maritime SafetyTidal Work Not available. Contact agency
EasementsErgon High Voltage Cables 132kV Service down. Check laterErgon High Voltage Lines 132kV Service down. Check later