Q4 2017 presentation - crayon.com · Investor Relations 3 For IR-related requests: Magnus Hofshagen...
36
1 Carnegie and DNB Markets (Joint Global Coordinators) 20 February 2018 Q4 2017 presentation
Transcript of Q4 2017 presentation - crayon.com · Investor Relations 3 For IR-related requests: Magnus Hofshagen...

1
Carnegie and DNB Markets (Joint Global Coordinators)20 February 2018
Q4 2017 presentation

Disclaimer
2
These materials may contain statements about future events and expectations that are forward-looking statements. Any statement in these materials that is not a statement ofhistorical fact including, without limitation, those regarding Crayon Group Holding ASA’s (the "Company") financial position, business strategy, plans and objectives of managementfor future operations is a forward-looking statement that involves known and unknown risks, uncertainties and other factors which may cause the actual results, performance orachievements of the Company to be materially different from any future results, performance or achievements expressed or implied by such forward-looking statements. Suchforward-looking statements are based on numerous assumptions regarding the Company’s present and future business strategies and the environment in which the Company willoperate in the future. Although management believes that the expectations reflected in these forward-looking statements are reasonable, it can give no assurances that they willmaterialise or prove to be correct. Because these statements are based on assumptions or estimates and are subject to risks and uncertainties, the actual results or outcome coulddiffer materially from those set out in the forward-looking statements as a result of many factors, including, among others competition from Nordic and international companies inthe markets in which the Company operates, changes in the demand for IT services and software licensing, changes in international, national and local economic, political, business,industry and tax conditions, the Company's ability to realise backlog as operating revenue, the Company's ability to correctly assess costs, pricing and other terms of its contracts,the Company's ability to manage an increasingly complex business, political and administrative decisions that may affect the Company's public customer group contracts, theCompany's ability to retain or replace key personnel and manage employee turnover and other labour costs, unplanned events affecting the Group's operations or equipment, theCompany's ability to grow the business organically, changes regarding the Company's brand reputation and brand image, fluctuations in the price of goods, the value of the NOK andexchange and interest rates, the Company's ability to manage its international operations, changes in the legal and regulatory environment and in the Company's compliance withlaws and regulations, increases to the Company's effective tax rate or other harm to its business as a result of changes in tax laws, changes in the Company's business strategy,development and investment plans, other factors referenced in this report and the Company's success in identifying other risks to its business and managing the risks of theaforementioned factors. Should one or more of these risks or uncertainties materialise, or should any underlying estimates or assumptions prove to be inappropriate or incorrect,our actual financial condition, cash flows or results of operations could differ materially from what is expressed or implied herein. The Company assumes no obligations to updatethe forward-looking statements contained herein to reflect actual results, changes in assumptions or changes in factors affecting these statements.
This presentation does not constitute or form part of, and is not prepared or made in connection with, an offer or invitation to sell, or any solicitation of any offer to subscribe for orpurchase any securities and nothing contained herein shall form the basis of any contract or commitment whatsoever. No reliance may be placed for any purposes whatsoever onthe information contained in this presentation or on its completeness, accuracy or fairness. The information in this presentation is subject to verification, completion and change.The contents of this presentation have not been independently verified. The Company's securities have not been and will not be registered under the US Securities Act of 1933, asamended (the "US Securities Act”), and are offered and sold only outside the United States in accordance with an exemption from registration provided by Regulation S of the USSecurities Act. This presentation should not form the basis of any investment decision. Investors and prospective investors in securities of any issuer mentioned herein are requiredto make their own independent investigation and appraisal of the business and financial condition of such company and the nature of the securities.

Investor Relations
3
For IR-related requests: Magnus Hofshagen (+47 48 49 91 95)
[email protected] / [email protected]
Update
▪ Main communications channels ▪ Crayon IR webpages (https://www.crayon.com/en/about-us/investor-relations/)
▪ Group fact & figures ▪ Reports & Presentations ▪ Share and bond information
▪ Newsweb
▪ Financial calendar 2018:▪ 08.05.2018 - Annual General Meeting▪ 15.05.2018 - Quarterly Report - Q1▪ 22.08.2018 - Half-yearly Report▪ 13.11.2018 - Quarterly Report - Q3 ▪ 12.02.2019 - Quarterly Report - Q4
▪ Quarterly Report - Q4
“Communicating with current and future shareholders,
both in Norway and abroad, is a high priority for
Crayon Group Holding ASA”

4
Crayon is assisting its clients to address key IT challenges
…that Crayon helps to addressClients faced with key questions…
Crayon’s business tailored to address the challenges:Organizations facing 3 main challenges within IT:
How to optimize/reduce total IT spending while ensuring compliance?
How to utilize software and technology to maximize value and ensure that new layers of technology works end-to-end?
How to simplify ordering, provisioning, billing andadministration of software licenses?
Cloud & Solution Consulting
Software
Software Asset Management (SAM)
▪ Experts in cloud and predictive analytics, assisting clients through all phases of digital transformation
▪ Global software expert supporting clients’ with license advisory and transactional fulfilment
▪ Global software distributor for ~2,700 channel partners, enabling automated provisioning and administration
▪ Leading global specialist in managing software complexity & optimizing clients’ IT spend
▪ Own software helping customers stay compliant
2
3
1
Services
Software

NUMBERS
- AT A GLANCE -
~1100 teammates 21 countries
0
8,000
6,000
4,000
2,000
+29%
4,688
2,0473,045
20162013
6,015
20152012
3,732
2014
Revenue (NOKm)
7,302
2017
~30% revenue CAGR
~80% global market coverage
BUSINESS 51%49%SERVICES SOFTWARE% of gross profit1
5
MARKET
Underlying megatrend:
Digital Transformation• Exponential growth in
software spending and complexity
• Global market – customers facing same challenges everywhere
Internet of Things (IoT)
Artificial Intelligence (AI)
Mobility
Big Data
Cyber Security
Cloud Computing
1) Based on 2017 gross profit, excl. admin & eliminations
Software Asset Management (SAM)
Cloud Consulting & Solutions
Software Direct
Software Indirect
93%
35%
43%
Cloud revenue growth
~2%
2020
~10%
20152000
~5%
SW spend as % of total opex
SW spend is becoming a strategic
consideration

6
Operational highlights Q4 2017
1) Microsoft strategic partners; Cloud Revenue Metrics includes Public Cloud + Hybrid Cloud (SPLA & System Center)2) General Data Protection Regulation
Crayon’s annual Nordic Infrastructure Conference (NIC) in Oslo Spektum, 29 Jan – 2 Feb 2018; 1,300 IT practitioners & 30 vendors attending 100 session with 65 speakers
• Continued strong commercial momentum across all business areas and market clusters
Revenue and GP growth of 25% and 9% (YoY), respectively EBITDA improved across market clusters, except the Nordics
• Best-in-class growth & cloud mix within Software Division Cloud mix of 54%, 17 pps higher than global benchmark group1
Fastest growing licensing partner with ~24% YoY growth1
• First GDPR2 services successfully delivered to customers, and several new material SAM deals secured
• Accelerating customer growth on own IP (Cloud-iQ & SAM-iQ) Cloud-iQ: ~300 new partners & customers onboarded (total 1,800) SAM-iQ: ~40 new customer subscriptions
• 10+ SAM projects delivered through own IP (Elevate) Standardized delivery platform improving efficiency by 30-50% Project deliveries doubled compared to previous quarter (Q3)
• Certain unexpected partner incentive changes within Software Indirect resulting in a negative short term profitability impact
“Double digit” like-for-like EBITDA impact (vs Q4 2016) Positive long term impact driven by continued cloud transition

Adj. EBITDA1
Operating revenue
Gross profit
Financial highlights Q4 2017
Q4 2017
2,292
Q4 2016
1,827
NOKm
1) Adjusted EBITDA is reported EBITDA adjusted for other income & expenses. Other income & expenses are included as a separate line item and adjusted for in HQ/admin, hence not reflected on Market Cluster / Business Area level
2) Trade working capital = Accounts receivable (AR) + inventory – Accounts payable (AP)
3) The Company reports its cash balance net of drawdown on its revolving credit facility (“RCF”)
• Revenue growth driven by Software Division which grew 24% (or NOK 401m) from Q4 2016 to Q4 2017
• The strong growth primarily driven by;
• New contract wins in less established markets
• Increased share of direct billing
• Gross profit growth fueled by Software Division which grew 9% YoY
• Software growth driven by contract wins within Growth Markets and Start-Ups
• Software Direct grew 8% YoY and strategically important Software Indirect grew 16% YoY
• Services Division grew 7% YoY; Both SAM (+4% YoY) and Consulting (+9% YoY) had healthy growth
• All market clusters, with the exception of USA, had positive growth YoY
• Profitability in Q4 2017 shows YoY decline of NOK -5.9m, explained by the Nordics;
• The Nordics effected by changes in incentive programs and framework agreements, resulting in a negative YoY development. Partially offset by EBITDA from less established markets and Growth Markets showing continued positive development in Q4 2017 YoY
• Adj. EBITDA relative to gross profit declined from 19.1% (Q4 2016) to 16.0% (Q4 2017)
Net cash flow
• Strong cash flow from operating activities in Q4 2017(NOK 350m), resulting in a FY 2017 cash conversion ratio of 117% (operating cash flow as percentage of adjusted EBITDA)
• Increase in cash from operating activities (NOK +127m YoY) driven by trade working capital2
release (NOK +100m YoY). Increase in cash flow from financing activities (NOK +190m YoY) due to proceedings from IPO and deleveraging CRAYON02
• Cash and cash equivalents was NOK 368m as of Q4 2017, compared to NOK 228m in Q4 20163
NOKm
NOKm
NOKm
332 362
Q4 2016 Q4 2017
5864
Q4 2017Q4 2016
-5.9m
+8.8%
+25.4%
495
204
Q4 2017Q4 2016
+291.2m
7

SW Indirect: Partner incentive changes impacting profitability
8
Incentive background Incentive changes and profitability impact
• Crayon monetizes business through “front-
end” margin and “back-end” margin;
Front-end: Own uplift on cost price Back-end: Incentives from SW vendors
• SW vendors determine and use partner
incentive rates to support their strategy & business priorities
• Historically, partner incentives have been
relatively stable. However, with cloud agenda becoming increasingly important, incentives
are increasingly moved from “traditional” to
cloud workloads
• Crayon, being “best-in-class” on cloud
conversion, will benefit from this. However
there is a timing effect (due to the impact on installed customer base vs net new customers)
ILLUSTRATIVE
x
Q3 2018
Q4 2018
Q2 2018
Q1 2018
Q4 2017
Q3 2017
Non-strategic workloads
Strategic cloud workloads
Unexpected incentive changes in Q4 2017….
…on a steady converting customer base…
…resulting in a “profitability timing shift”
Incentive rate% of sales
Incentive changes favoring cloud
Q3 2018
Q2 2018
Q1 2018
Q4 2017
Q3 2017
Q4 2018
Strategic cloud-mix% of sales
100%
“Cloud customers”
“Non-cloud customers”
Q4 2018
Q1 2018
Q4 2017
Q3 2017
Q3 2018
Q2 2018
Profitability% of sales
Before incentive change
After incentive change
Actions & initiatives to offset short term impact:• Price increases (i.e., improve front-end margins)• Cloud migration team (~30 specialists with centralized
technical capabilites supporting all markets globally)• Cloud support desk in 4 regions (APAC, WE, US & MEA)• Broaden vendor mix (AWS, Facebook, Google etc.)
Situation normalized H2 2018, positive long term impact

Example SW Indirect ( )1: Annualized EBITDA reserve of MNOK +18
969
808
0
1
2
3
4
5
6
7
0
300
500
200
100
400
1,300
1,200
1,000
800
700
1,100
600
900
1,400
1,087
Q2 2017 Q4 2017
1,134
Q3 2017
“ARPU” NOK thousands
Q1 2017
Number of partnersEnd of period
Average monthly gross profit per partner ("ARPU"), NOK 1000
# partners
1 Only including Microsoft software provisioned on Cloud-iQ (i.e., excluding other software vendors such as IBM and AWS)2 December gross profit x 12 months
0
2
4
6
8
10
12
14
16
18
20
0
10
20
30
40
50
60
70
LTM gross profit NOK millions
Q2 2017 Q4 2017
7.5
15.2
9.6
Q3 2017
Quarterly gross profitNOK millions
13.0
Q1 2017
+40%MNOK 18
Commercial Momentum Financial Impact
Gross profit LTM (Last Twelve Months), NOK
Gross profit per quarter, MNOK
Annualized gross profit as of Dec 2017 (MNOK 63.3)2

10
Business review by market clusterEstablished New MarketsMarket Cluster:
EBITDA vintage curves by market cluster, 2016-2017
-80
-70
-60
-50
-40
-30
-20
-10
0
10
20
30
105
0
150
120
90
135
75
15
30
60
45
-10%
Q4 2016
-13%
Adjusted EBITDA LTM; NOK millions
2%
Q2 2016Q4 2015 Q1 2017
EBITDA margin1
LTM; Percent
Q1 2016 Q4 2017
24%
Q3 2017Q2 2017Q3 2016
1 Adjusted EBITDA divided by reported gross profit
EBITDA margin by market cluster
Total adjusted EBITDA
Nordics
Growth Markets
USA
Start-Ups
▪ Nordics: Relatively stable margins
▪ Growth Markets: Positive margin development, yet from small base
▪ USA: Margin set-back in Q4 2017, positive long-term trend
▪ Start-Ups: Continued positive trend
7.8
2.0
1.3
1.0
XEBITDA sensitivity, EBITDA impact by 1pps change in EBITDA margin1, FY 2017; MNOK

Gross profit
Nordic Markets
Revenue EBITDA
3,900
+4%
+12%
2017
3,391
503
2016
3,768
3,261
498
Q4 2017
1,324
1,173
1,186
1,042
Q4 2016
149140
NOKm NOKm NOKm
11
Established New MarketsMarket Cluster:
364
123
373
227
107
117
0%
761
19.5%
Q4 2017
23517.8%
2017
+4%
383
2016
758
20.1%
386
112
Q4 2016
19.1%
204
Q4 2016
-12
-14%
23.8%30.7%
181
2017
-23
2016Q4 2017
7284
-11%
37.0%
27.0%
EBITDA per gross profit (%)EBITDAAdminServices Software
• Services: positive Q4 2017 YoY development driven by Consulting (NOK +5.1m)
• Software: YoY development positive, due to Software Direct (NOK +7.2m)
• Q4 YoY positive growth: Norway (NOK +9.7m), Sweden (NOK +1.4m) and Iceland (NOK +0.4m)
• Q4 YoY negative growth: Finland (NOK -2.6m) and Demark (NOK -0.4m)
• Q4 YoY decrease driven by particularly Finland (NOK -4.6m) and Norway (NOK -3.8m)
• Partially offset by Iceland (NOK +0.7m)
• Q4 YoY Finland decline driven by Software Direct (changes in government framework agreements)
• Q4 YoY Norway decline driven by Software Indirect (temporary effect due to vendor incentive change, ie. less than expected SW Indirect GP contribution)
• Positive development in Q4 2017 due to Contract wins and increased share of direct billing withinSoftware
Admin Gross marginSoftwareServices

Gross profit
Growth Markets
Revenue EBITDA
+53%
+60%
Q4 2017
524
546
1,244
74
21
82
2016
21 1,153
1,902
1,824
341
Q4 2016
318
2017
NOKm NOKm NOKm
12
Established New MarketsMarket Cluster:
AdminServices Software
• Services: Positive Q4 YoY (NOK +0.5m), but negative impacted on SAM due to UK legacy operations (NOK -3.4m).
• Software: Positive Q4 YoY development from SW Direct (NOK +8.5m) and SW Indirect (NOK +1.8m)
• Q4 YoY positive growth: Germany (NOK +7.7m) and Middle East (NOK +4.7m)
• Q4 YoY negative growth: France (NOK -2.9m)
• Q4 YoY increase driven by Germany (NOK +4.5m)and Middle East (NOK +1.6m)
• Partially offset by France (NOK -3.9m) andUK (NOK -0.7m)
• France driven by SW Direct and deals not up for renewal/-or renewed, UK affected by legacy operations
• Q4 2017 growth driven by contract wins and increased direct billing within Software
• Especially positive development in the Middle East and Germany
28
2016Q4 2017
76
10.9%
39
20 9950
20
129
183
14.5%
71
14.7%
59
10.7%
Q4 2016
+19%
+12%
2017
204
AdminSoftwareServices Gross margin (%)
5.6%
3
4
7.3%
Q4 2016 Q4 2017
2.2%
2016
1
5
0.7%
2017
+56%
+2
+252%
+3
EBITDA per gross profit (%)EBITDA

Gross profit
Start-ups
Revenue EBITDA
+34%
+10%
2017
1,193
1,162
30
8
326296
891
866
2016
335
Q4 2016
9304
Q4 2017
24
NOKm NOKm NOKm
13
21
Q4 2016
6
26
71
7.9%
13
7
Q4 2017
79
5028
19
6.1%
20
2016
8.4%
2017
105
8.8%
+49%
+50%
AdminSoftware Gross margin (%)Services
-13,2%-18,8%
+19
-50,8%
-33
2017
+4
-46,7%
Q4 2017 2016
-14
-9
Q4 2016
-5
EBITDA per gross profit (%)EBITDASoftwareServices Admin
Established New MarketsMarket Cluster:
• Services: positive Q4 YoY development from SAM (NOK +1.2m)
• Software: positive Q4 YoY development from SW Indirect (NOK +4.2m) and SW Direct (NOK +3.7m)
• Q4 YoY positive growth: India (NOK +3.8m), Switzerland (NOK +2.5m) and Malaysia (NOK +1.8m)
• No countries with YoY negative growth in Q4 2017
• Q4 YoY increase driven by Malaysia (NOK +1.5m), Switzerland (NOK +1.3m) and India (NOK +1.1m)
• Q4 2017 growth driven by contract wins and increased direct billing within Software
• Especially positive development in India

Gross profit
USA
Revenue EBITDA
117
2016
179
+108%
2017
372
+76%
87
25494
28
53
90
27
Q4 2017Q4 2016
26 67
NOKm NOKm NOKm
14
9
22
109
2016
23
10135.8%
81
31 30
Q4 2016
57.7%
21
Q4 2017
25
32.6%
+32%
133
2017
5
-1%
56.3%
Gross margin (%)Software AdminServices
-10.6%
-3
-13
2016
0
2017
+37
-10.0%
Q4 2017
-4
Q4 2016
-50
-49.8%
-11.8%
EBITDA per gross profit (%)EBITDASoftwareServices Admin
Market Cluster: Established New Markets
• Services: Q4 increase driven by SAM and new contract wins / expanded scope of existing agreements
• Software: Negative development in Q4 due to contracts not renewed in Q4 2017 (exceptional strong Q4 2016)
• Flattish profitability growth with a negative quarterly EBITDA contribution YoY of NOK -0.4m
• 100% of the YoY decrease in Q4 2017 is contributable to Software division
• Q4 2017 growth driven by contract wins and increased direct billing within Software

NOKm 2016 2017 Q4 2016 Q4 2017
Operating revenue 6,015.2 7,301.7 1,827.1 2,291.7
Materials and supplies -4,886.8 -6,085.9 -1,494.6 -1,930.1
Gross profit 1,128.4 1,215.8 332.5 361.7
Payroll and related costs -877.9 -950.6 -231.4 -273.6
Other operating expenses -158.8 -161.4 -39.4 -45.9
Total operating expenses -1,036.7 -1,111.9 -270.8 -319.5
EBITDA 91.7 103.8 61.7 42.1
Depreciation -9.2 -9.7 -3.3 -2.5
Amortization -80.9 -54.3 -28.2 -14.3
Goodwill impairment -8.9 -7.7 -8.9 -6.4
EBIT -7.3 32.2 27.8 19.0
Net financial expense -32.5 -85.8 -14.0 -6.3
Ordinary result before tax -39.8 -53.7 13.8 12.7
Income tax expense on ordinary result 9.6 0.8 19.5 10.7
Net income -30.2 -54.5 -5.7 2.0
Adjusted EBITDA reconciliation
Reported EBITDA 91.7 103.8 61.7 42.1
Other income and expenses 13.5 26.8 1.9 15.6
Adjusted EBITDA 105.2 130.6 63.6 57.7
15
P&L summary and items below EBITDA
P&L Comments
Depreciation and amortization
• Depreciation driven by wrong classification (vs. amortization) in Q3 2016 which was reversed and corrected for in Q4 2016
• Amortizations reduced YoY due to one fully amortized intangible asset arising from Inmeta-Crayon delisting in 2012
• Goodwill impairment related to Software Licences (IP) in Q4 2017 (NOK -6.4m)
Net financial expenses
• Increase due to net other financial expenses
• Increase due to currency effects and refinancing costs
• Currency effects driven by net unrealized FX loss from intercompany funding
Income tax
• Income tax expenses inline with management expectations
Adjusted EBITDA
• Of total other income and expense items in Q4 2017 of NOK 15.6m, NOK 10.5m was related to the IPO in November 2017, and NOK 5.1m was related to extraordinary personnel costs incl. share based compensation (NOK 3.9m)

16
Cash flow development
Cash flow Comments
300
-200
0
100
-100
-300
200
400
223
-104
Q3 ’17Q2 ’17Q3 ’16
161
-210-139
152
Q1 ’16 Q1 ’17Q4 ’16Q2 ’16
-140
350
Q4 ’17
NOKm 2016 2017 Q4 2016 Q4 2017
Net income before tax -40 -54 14 13
Taxes paid -18 -12 -3 2
Depreciation and amortization, incl. write-down
99 72 34 23
Net interest to credit institutions 49 51 10 11
Changes in inventory, AR/AP1 78 33 88 188
Changes in other current assets -29 63 80 113
Net cash flow from operating activities 140 153 223 350
Adj. EBITDA 105 131 64 58
Capex 51 51 12 15
Capex
• Capex in Q4 2017 of NOK 14.8m mainly related to investments in new ERP system and IP (Cloud IQ, Elevate, Catch)
• NOK 12.5m of capex related to intangible assets (vs. NOK 11.0 m in Q4 2016), of which NOK 4.1m are capitalized personnel costs (vs. NOK 6.8m in Q4 2016)
Net working capital and cash
• Two main aspects affecting the Q4 2017 working capital development and cash balance:
1. Starting to see results from intensified efforts on trade working capital management (NOK -33m in Q4 2017 vs. NOK 0.2m in Q4 2016)
2. Public duties payable
Cash flow from operations fluctuations
• Seasonality in line with historical patters and in line with expectations
• Contract renewals are skewed towards Q2 and Q4 driven by year-end campaigns by key software partners (Microsoft's fiscal year ends 30 June, Oracle fiscal year ends 31 May)
• Operational expenses are relatively stable quarter-to-quarter, resulting in seasonality in cash flow from operations
• Seasonal patterns, with strong operational cash flow in Q2 and Q4, expected to continue
1) AR = Accounts Receivable, AP = Accounts Payable
Cash flow from operations (NOKm):

17
Balance sheet and net interest bearing debt
Crayon debt items
• Crayon has a bond of NOK 450m outstanding
• In November Crayon redeemed NOK 150 million of the bond at 102% of par value under an equity claw-back call option allowed for in the bond agreement
• NOK 200m RCF with Danske Bank
• No drawdown as of Q4 2017
Cash balance and net debt
• Cash and cash equivalents was NOK 368m as of Q4 2017, compared to NOK 228m in Q4 2016
• Interest bearing debt was NOK 456m in Q4 2017 vs. 665m Q4 2016
• Corresponding to Net interest bearing debt (corrected for restricted cash) of NOK 106m in Q4 2017 vs. NOK 452m in Q4 2016
• NIBD / LTM Adj. EBITDA ratio of 0.77x as of Q4 2017
1) The Company reports its cash balance net of drawdown on its revolving credit facility (“RCF”)2) Approx. NOK 556m of goodwill as of year-end 2016 relates to the Oslo Stock Exchange delisting of Inmeta-Crayon in 20123) Note that bond transactional costs of around NOK 10m are capitalized , and accretion expensed over the lifetime of the bond, cf. IAS 39
4) Based on estimated total IPO costs of NOK 35m, as communicated in prospectus
Net interest bearing debt - NOKm 2017
Bond loan3 450.0
Other debt 5.6
Net cash and cash equivalents1 -368.4
Restricted cash 18.7
Net interest bearing debt (NIBD) 105.9
NOKm 2016 2017
Assets
Inventory 17.5 26.3
Accounts receivable 1,206.8 1,541.4
Income tax receivable 1.1 0.0
Other receivables 56.1 60.0
Net cash and cash equivalents1 227.9 368.4
Total current assets 1,509.4 1,996.2
Technology, software and R&D 104.3 109.3
Contracts 101.0 83.3
Goodwill2 827.1 831.0
Software licenses (IP) 7.4 1.0
Deferred tax assets 29.6 33.8
Equipment 18.7 20.2
Other receivables 3.2 4.8
Total non-current assets 1,091.4 1,083.5
Total assets 2,600.8 3,079.7
Equity and liabilities
Total equity 272.4 566.0
Short-term debt 661.0 0.0
Trade creditors 1,224.1 1,600.6
Public duties payable 186.9 229.1
Other current liabilities 210.0 194.4
Total current liabilities 2,282.1 2,029.0
Long-term debt 0.0 445.7
Deferred tax liabilities 44.8 31.8
Other long-term liabilities 1.5 7.2
Total long-term liabilities 46.3 484.7
Total liabilities 2,328.4 2,513.7
Total equity & liabilities 2,600.8 3,079.7

18
Geo summary Financial summary
851 940 965826
238171
2015
17
64
2016
1
2014
-4
4
13
2017
-83
175 176 206 186
-42
-17
20172016
-27-28
2014
-22
2015
-21
Total gross profit (NOKm)
Total Adj. EBITDA1 (NOKm)
Financial year 2017 key financial figures and metrics G
ross
pro
fit
Ad
j. E
BIT
DA
1
HQ/Elim.
Less Established Markets2
Established Markets2
1) Adjusted EBITDA is reported EBITDA less other income & expenses items netted under HQ, hence not reflected on Market Cluster / Business Area level
2) Established Markets includes Nordic Markets and Growth Markets. Less Established Markets includes Start-Ups and US3) Cloud mix defined as sales of products/licenses hosted by Microsoft in the cloud
4) MS = Microsoft and figures are based on Crayon MS revenue. Microsoft fiscal year ending 30 June. Microsoft Q1 2017 FY corresponds to Crayon Q3 2017
5) Based on 2016 gross profit from sales reports6) Based on 2016 figures from sales reports. Average repeat customers defined as (1-customer churn in %)
826 915 1,128 1,215
142 114 131105
17.2% 12.4% 9.3% 10.8%
Adj. EBITDA/gross profit
Adj. EBITDA1
Revenue and Gross profit
• Revenue and gross profit growth of 21% and 8% YoY, respectively in 2017, compared to 2016.
• Driven by the less established markets (Start-Ups and USA) (39% YoY growth), and the established markets (Nordics and Growth Markets) (3% YoY growth)
• Highlighting the strong commercial momentum in the business. Gross profit growth slightly below management expectations. Largely explained by partner incentive changes
• Adj. EBITDA growth in 2017 of 24% compared to 2016.
• Driven by the less established markets (Start-Ups and USA) (NOK +56m YoY), partially offset by the established markets (Nordics and Growth Markets) (NOK -20m YoY)
• 2017 Adj. EBITDA as a percentage of gross profit of 11%, compared to 9% in 2016
• Emphasizing management continued focus on profitable growth

19
Software
Software Direct
Gross profit development, NOKm EBITDA development, NOKm
Software Indirect
Gross profit development, NOKm EBITDA development, NOKm
Services SoftwareBusiness Division:
Stable/improving profitability, yet “deal slippage” in Q4 2017 resulting in lower YoY gross profit growth rate (compared to same quarter the previous year)
Positive YoY gross profit growth momentum, yet profitability in Q4 2017 impacted by partner incentive changes
37.5%
0
-1%
2017
50
2016
50
45.5%
111
7.5%
+21%
133
2017
+23
2016
7.7%9.7%
+10%
429
2016
+41
470
2017
10.9% 40.2%
+36%
189
20172016
139
+50
32.4%
0
20
40
60
80
-10
0
10
20
30
Gross profit growthYoY, %
-7%
Q4 2017
23%
8%
Q2 2017 Q3 2017
EBITDA margin1
% of gross profit
47%
8%
56%
Q1 2017
23%
5%
1 EBITDA divided by reported gross profit
Gross profit growth
EBITDA margin
0
20
40
60
80
0
10
20
30
40
50
Gross profit growthYoY, %
11%
Q4 2017
36%
16%
Q2 2017 Q3 2017
EBITDA margin1
% of gross profit
27%37%44%
Q1 2017
42%
21%
Gross profit growth
EBITDA margin

Gross profit development, NOKm EBITDA development, NOKm
20
Services
SAM
Services SoftwareBusiness Division:
Relatively stable YoY gross profit growth and profitability in Q4 2017 compared to same period the previous year. OPEX investments in new services (e.g., GDPR)
282
2017
+20
+8%
2016
90.8%
262
90.0% 13
5.1%
2016
28
+108%
2017
9.9%
+14
Consulting
Gross profit development, NOKm EBITDA development, NOKm
Positive YoY gross profit growth and profitability trend in H2 2017. Weak Q2 2017 impacting FY 2017 figures (restructuring within Cloud Solutions)
2017
+2%
2016
74.7%
306
+5
301
74.0%
-8
-23%
2017
8.4%
26
2016
34
11.1%
-5
0
5
10
15
20
0
5
10
15
2015%
EBITDA margin1
% of gross profit
12%
Q3 2017
4%
Q2 2017
Gross profit growthYoY, %
Q4 2017
17%
-1%
10%
10%
4%
Q1 2017
Gross profit growth
EBITDA margin
1 EBITDA divided by reported gross profit
-5
0
5
10
15
20
-10
-5
0
5
10
Gross profit growthYoY, %
Q4 2017
11%
Q3 2017
EBITDA margin1
% of gross profit
7%
2%
Q2 2017
13%
9%
Q1 2017
-9%
1%
8%
Gross profit growth
EBITDA margin

Financial targets
2017 2018 target
Gross profit • Around 8-10% growth compared to 2017NOK 1,216m
Growth from 2016: 8%
Gross margin • 15-16%16.7%
Depreciation and amortization• Depreciation around 2017 absolute level
• Amortization around NOK ~55-60m1
Depreciation: NOK 9.7m
Amortization: NOK 54.3m1
Total D&A: NOK 64.0m1
Adj. EBITDA % of gross profit • 12-14%10.7%
Capex • Target around NOK 40-45mNOK 50.8m
NWC • Around -20%~-20%2
1) Excluding goodwill impairment2) Average 4 quarter rolling NWC as % of LTM gross profit.
Medium-term target
• Around 8-10% growth
• Around 14-15%
• Depreciation around 2017 absolute level
• Amortization around NOK ~50-55m1
• Gradually increase to 15%
• Target around NOK 40-45m
• Around -15%

22
Carnegie and DNB Markets (Joint Global Coordinators)
Datapack

23
Introduction to key P&L drivers
NOKm 2014 2015 2016 2017
Operating revenue 3,731.8 4,687.9 6,015.2 7,301.7
Growth 25.6% 28.3% 21.4%
Materials and supplies -2,905.5 -3,773.0 -4,886.8 -6,085.9
Gross profit 826.3 914.9 1,128.4 1,215.8
Gross margin 22.1% 19.5% 18.8% 16.7%
Payroll and related costs -586.3 -668.3 -877.9 -940.5
Other operating expenses -102.1 -149.1 -158.8 -144.7
Total operating expenses -688.4 -817.4 -1,036.7 -1,085.2
EBITDA 137.8 97.5 91.7 103.8
EBITDA % of gross profit 16.7% 10.7% 8.1% 8.5%
Exceptional items 4.0 16.3 13.5 26.8
Adjusted EBITDA 141.8 113.7 105.2 130.6
Adj. EBITDA % of gross profit 17.2% 12.4% 9.3% 10.7%
• Payroll and related costs driven by number of FTEs – of which ~15-20% is variable salary
• Other opex driven by size and geographical width of organization• Other opex primarily consisting of rented premises (~25%), professional
services e.g. accounting and legal (~25%), travel (~20%) and IT and office equipment (~15%)
• Adjusted EBITDA as percentage of gross profit a suitable metric for comparison across Market Clusters and Business Areas due to gross margin variation
Source: Annual Report 2015 and 20161) In direct billing, Crayon invoices the customer directly. In indirect billing, the software vendor bills the customer and Crayon receives a fee
from the software vendor
700 807 945#FTEs
• Number of FTEs• Hourly rate / Fixed price agreements• Utilization• Recurring agreements
Services Software
• Number of FTEs• Gross profit per FTE
• Vendor, product, new vs. existing customers etc.
• Revenue will be subject to fluctuations that do not impact absolute gross profit level as customers shift between direct and indirect billing1
Revenue model
Services• 3-5 years managed service agreements
(SAM) • Frame agreements• Hours sold
Software• ~3 year subscription/ARPU model where a
certain percentage is contractually recurring
• Frame agreements• Traditional licensing deals (one-time fee)
1,009

1) Exceptional items are one-off costs mainly related to strategy projects, restructurings, and the acquisition of businesses 24
Income statement
NOKm Q1 2016 Q2 2016 Q3 2016 Q4 2016 2016 Q1 2017 Q2 2017 Q3 2017 Q4 2017 2017
Operating revenue 1,242.2 1,950.5 995.4 1,827.1 6,015.2 1,358.5 2,401.7 1,249.7 2,291.7 7,301.7Growth 28.3% 9.4% 23.1% 25.5% 25.4% 21.4%
Materials and supplies -992.9 -1,619.9 -779.4 -1,494.6 -4,886.8 -1,088.7 -2,045.2 -1,022.0 -1,930.1 -6,085.9Gross profit 249.3 330.6 216.0 332.5 1,128.4 269.8 356.6 227.8 361.7 1,215.8Gross margin 20.1% 16.9% 21.7% 18.2% 18.8% 19.9% 14.8% 18.2% 15.8% 16.7%
Payroll and related costs -221.1 -226.7 -198.6 -231.4 -877.9 -228.4 -244.0 -204.5 -273.6 -950.6Other operating expenses -36.8 -43.3 -39.3 -39.4 -158.8 -36.7 -35.5 -43.3 -45.9 -161.4Total operating expenses -258.0 -270.0 -237.9 -270.8 -1,036.7 -265.2 -279.4 -247.8 -319.5 -1,111.9
EBITDA -8.6 60.6 -21.9 61.7 91.7 4.7 77.1 -20.1 42.1 103.8EBITDA margin -0.7% 3.1% -2.2% 3.4% 1.5% 0.3% 3.2% -1.6% 1.8% 1.4%
Depreciation -3.8 -4.1 -4.6 3.3 -9.2 -2.4 -2.4 -2.4 -2.5 -9.7Amortization -17.4 -18.4 -16.8 -28.2 -80.9 -12.8 -13.4 -13.8 -20.7 -60.7Goodwill impairment 0.0 0.0 0.0 -8.9 -8.9 0.0 -1.3 0.0 0 -1.3EBIT -29.9 38.1 -43.3 27.8 -7.3 -10.6 60.0 -36.2 19.0 32.2EBIT margin -2.4% 2.0% -4.4% 1.5% -0.1% -0.8% 2.5% -2.9% 0.8% 0.4%
Financial income 23.3 17.1 50.5 30.0 35.8 35.0 17.5 27.7 34.0 114.3Financial expense -32.2 -27.5 -49.6 -44.1 -68.3 -51.2 -53.7 -54.9 -40.4 -200.1Net financial expense -8.9 -10.4 0.9 -14.0 -32.5 -16.2 -36.2 -27.2 -6.3 -85.8
Ordinary result before tax -38.8 27.7 -42.5 13.8 -39.8 -26.8 23.8 -63.4 12.7 -53.7
Income tax expense on ordinary result
14.3 -2.5 17.3 -19.5 9.6 5.1 -6.4 11.2 10.7 0.8
Net income -24.5 25.1 -25.1 -5.7 -30.2 -21.7 17.4 -52.2 2.0 -54.5
Adjusted EBITDA reconciliationReported EBITDA -8.6 60.6 -21.9 61.7 91.7 4.7 77.1 -20.1 42.1 103.8Exceptional items1 0.7 0.4 10.5 1.9 13.5 0.3 0.2 10.7 15.6 26.8Adjusted EBITDA -8.0 61.0 -11.4 63.6 105.2 4.9 77.3 -9.3 57.7 130.6Adj. EBITDA % of gross profit -3.2% 18.4% -5.3% 19.1% 9.3% 1.8% 21.7% -4.1% 16.0% 10.7%

25
Balance sheet
NOKm Q1 2016 Q2 2016 Q3 2016 Q4 2016 Q1 2017 Q2 2017 Q3 2017 Q4 2017AssetsInventory 21.9 21.8 16.4 17.5 18.8 24.0 13.6 26.3Accounts receivable 654.1 1,224.9 637.0 1,206.8 722.0 1,573.7 769.8 1,541.4Income tax receivable 3.2 3.7 7.1 2.7 6.1 2.9 1.6 0.0Other receivables 37.8 31.2 35.6 54.4 36.0 45.9 43.4 60.0Net cash and cash equivalents1 68.6 180.2 23.4 227.9 66.5 204.7 -136.4 368.4Total current assets 785.6 1,461.8 719.5 1,509.4 849.4 1,851.2 692.0 1,996.2Technology, software and R&D 97.2 100.8 100.2 104.3 104.4 106.8 104.9 109.3Contracts 142.2 127.9 112.5 101.0 96.1 92.2 85.9 83.3Goodwill2 843.8 843.4 831.8 827.1 829.1 828.4 819.4 831.0Software licenses (IP) 7.4 7.4 7.4 7.4 7.4 7.4 7.4 1.0Deferred tax assets 10.1 19.1 26.0 29.6 33.8 28.7 29.4 33.8Equipment 19.1 18.3 19.1 18.7 19.2 20.4 19.8 20.2Other receivables 3.4 3.4 2.6 3.2 4.1 4.8 3.4 4.8Total non-current assets 1,123.2 1,120.3 1,099.6 1,091.3 1,094.1 1,088.8 1,070.0 1,083.5Total assets 1,908.7 2,582.1 1,819.2 2,600.7 1,943.5 2,940.0 1,762.0 3,079.7Equity and liabilitiesShare capital 52.5 52.5 52.5 52.5 52.5 52.5 52.5 75.4Own shares - - - - - - - -
Share premium reserve 262.3 262.3 262.3 262.3 262.3 262.3 262.3 588.1
Other equity 13.2 20.0 -7.1 -53.6 -69.4 -50.0 -99.0 -105.6
Minority interest -2.7 0.5 -10.6 11.2 7.0 8.9 3.2 8.2
Total equity 325.3 335.3 297.1 272.4 252.4 273.7 219.0 566.0
Short-term debt - - - 661.0 661.1 100.5 - -Trade creditors 503.5 1,111.4 555.0 1,224.1 660.5 1,453.6 628.2 1,600.6Public duties payable 161.3 207.9 102.3 186.9 119.0 254.5 109.6 229.1Other current liabilities 175.9 191.9 178.5 210.0 208.8 227.0 186.0 194.4Total current liabilities 840.7 1,511.2 835.8 2,282.0 1,649.4 2,035.6 923.8 2,029.0Long-term debt 671.7 666.1 656.1 0.0 0.0 591.7 590.3 445.7Deferred tax liabilities 37.3 40.6 27.5 44.8 40.1 37.6 27.4 31.8Other long-term liabilities 33.7 28.9 2.7 1.5 1.6 1.4 1.5 7.2Total long-term liabilities 742.7 735.6 686.3 46.3 41.7 630.7 619.2 484.7Total liabilities 1,583.4 2,246.8 1,522.1 2,328.3 1,691.1 2,666.3 1,543.0 2,513.7Total equity & liabilities 1,908.7 2,582.1 1,819.2 2,600.7 1,943.5 2,940.0 1,762.0 3,079.7
1) The Company reports its cash balance net of drawdown on its revolving credit facility (“RCF”)2) Approx. NOK 556m of goodwill as of year-end 2016 relates to the Oslo Stock Exchange delisting of Inmeta-Crayon in 2012

26
Cash flow statement
NOKm Q1 2016 Q2 2016 Q3 2016 Q4 2016 2016 Q1 2017 Q2 2017 Q3 2017 Q4 2017 2017
Cash flow from operating activitiesNet income before tax -38.8 27.7 -42.5 13.8 -39.8 -26.8 23.8 -63.4 12.7 -53.7 Taxes paid -3.1 -7.1 -4.5 -2.9 -17.6 -9.5 -1.4 -3.3 2.3 -11.9 Depreciation and amortization 21.2 22.5 21.4 33.9 99.0 15.3 17.1 16.2 23.1 71.7 Net interest to credit institutions 13.1 11.7 14.2 10.4 49.4 12.3 15.1 12.4 10.9 50.6 Changes in inventory, accounts receivable/payable -88.3 39.5 38.5 88.0 77.8 -80.1 -63.9 -11.1 188.1 33.1 Changes in other current assets -44.5 66.6 -130.9 79.8 -29.1 -50.4 161.6 -160.7 112.5 63.0 Net cash flow from operating activities -140.4 160.8 -103.7 223.0 139.7 -139.1 152.3 -210.0 349.6 152.8
Cash flow from investing activities
Acquisition of assets -9.2 -18.5 -11.2 -12.2 -51.2 -10.1 -14.5 -11.4 -14.8 -50.8 Acquisition of subsidiaries (cash paid net of cash in acquired entity)
-1.5 -6.7 -21.1 -0.3 -29.6 0.0 0.0 0.0-22.7 -22.7
Divestments 0.1 0.0 0.0 0.0 0.1 0.0 0.0 0.0 - -Net cash flow from investing activities -10.7 -25.2 -32.3 -12.5 -80.7 -10.1 -14.5 -11.4 -37.5 -73.5
Cash flow from financing activities
Net interest paid to credit institutions -12.3 -13.6 -13.6 -11.7 -51.1 -12.7 -14.9 -13.6 -15.7 -57.0
New equity 348.6 348.6 Change in subsidiaries 0.0 0.0 0.0 0.0 0.0 0.0 0.0 0.0 - -Proceeds from issuance of interest bearing debt 0.0 0.0 0.0 0.0 0.0 0.0 591.6 -1.9 - 589.7 Repayment of interest-bearing debt 0.0 -0.1 0.0 0.0 -0.1 0.0 -571.8 -100.5 -155.3 -827.7
Change in other long-term debt -0.3 -4.4 -4.1 5.2 -3.6 0.1 -9.7 0.6 5.6 -3.4 Purchase of own shares 0.0 0.0 0.0 0.0 0.0 0.0 0.0 0.0 - -Net cash (used in) provided by financing activities -12.6 -18.0 -17.7 -6.4 -54.8 -12.6 -4.8 -115.4 183.2 50.3
Net increase (decrease) in cash and cash equivalents -163.8 117.6 -153.7 204.1 4.2 -161.8 133.0 -336.8 495.3 129.7 Cash and cash equivalents at beginning of period 236.3 68.6 180.2 23.4 236.3 227.9 66.5 204.7 -136.4 227.9 Currency translation on cash and cash equivalents -4.0 -6.0 -3.1 0.5 -12.6 0.5 5.2 -4.3 9.6 10.9 Cash and cash equivalents at end of period 68.6 180.2 23.4 227.9 227.9 66.5 204.7 -136.4 368.4 368.4

27
Income statement by market cluster
NOKm Q1 2016 Q2 2016 Q3 2016 Q4 2016 2016 Q1 2017 Q2 2017 Q3 2017 Q4 2017 2017
Revenue
Nordic Markets 907.9 1,054.3 619.9 1,185.9 3,767.9 869.8 1,106.7 600.2 1 323.8 3 900.5
Growth Markets 168.7 529.7 204.3 340.8 1,243.5 230.7 697.8 428.4 545.6 1 902.5
Start-ups 135.8 313.3 137.3 304.4 890.9 202.8 483.3 171.6 334.8 1 192.6
US 33.7 51.8 40.2 53.2 178.8 72.3 139.6 66.3 93.6 371.8
HQ 15.3 22.9 16.0 13.7 67.9 5.8 27.7 19.3 35.0 87.8
Eliminations -19.0 -21.6 -22.2 -71.0 -133.8 -22.9 -53.4 -36.1 -41.0 -153.4
Total revenue 1,242.2 1,950.5 995.4 1,827.1 6,015.2 1,358.5 2,401.7 1,249.7 2 291.7 7 301.7
Gross profit
Nordic Markets 174.5 219.2 137.3 226.7 757.7 175.1 212.2 138.1 235.3 760.6
Growth Markets 40.6 57.1 35.5 49.6 182.8 42.3 68.5 34.0 59.2 204.0
Start-ups 12.9 19.6 19.3 18.7 70.6 18.9 34.7 23.2 28.1 105.0
US 19.7 28.0 22.2 30.7 100.7 32.1 40.5 29.9 30.5 133.0
HQ 14.5 16.4 14.4 8.6 53.9 13.3 13.6 15.0 21.7 63.5
Eliminations -12.9 -9.9 -12.6 -1.7 -37.2 -11.9 -12.9 -12.4 -13.0 -50.2
Total gross profit 249.3 330.6 216.0 332.5 1,128.4 269.8 356.6 227.8 361.7 1 215.8
EBITDA
Nordic Markets 27.1 71.4 22.1 83.8 204.4 29.3 60.9 18.6 72.2 181.0
Growth Markets -2.0 9.9 -9.4 2.8 1.3 -4.2 16.3 -11.9 4.3 4.6
Start-ups -11.1 -6.5 -5.9 -9.5 -33.0 -8.1 4.9 -5.4 -5.3 -13.9
US -16.2 -7.8 -22.8 -3.3 -50.1 -4.1 3.5 -9.0 -3.6 -13.2
HQ -5.6 -5.8 4.1 -10.2 -17.4 -8.0 -8.2 -1.7 -9.9 -27.9
Eliminations -0.2 -0.2 0.4 0.0 0.0 0.0 0.0 0.0 - -
Adjusted EBITDA1 -8.0 61.0 -11.4 63.6 105.2 4.9 77.3 -9.3 57.7 130.6
1) Other income and expense items netted under “HQ”

28
Income statement by business area
NOKm Q1 2016 Q2 2016 Q3 2016 Q4 2016 2016 Q1 2017 Q2 2017 Q3 2017 Q4 2017 2017
Revenue
SAM 65.0 82.9 63.9 79.4 291.2 75.2 85.4 67.6 82.4 310.7
Consulting 97.3 107.4 83.3 115.4 403.4 101.0 101.4 87.5 123.9 413.9
Software (Direct) 748.1 1,398.6 485.8 1,303.2 3,935.7 790.0 1,774.5 694.9 1,597.0 4,856.5
Software (Indirect) 332.2 358.3 365.8 385.0 1,441.2 394.2 473.3 414.7 492.5 1,774.7
Admin 18.7 24.9 18.8 15.1 77.5 21.0 20.4 21.0 36.9 99.4
Eliminations -19.0 -21.6 -22.2 -71.0 -133.8 -22.9 -53.4 -36.1 -41.0 -153.4
Total revenue 1,242.2 1,950.5 995.4 1,827.1 6,015.2 1,358.5 2,401.7 1,249.7 2,291.7 7,301.7
Gross profit
SAM 59.4 73.5 57.0 72.1 262.0 68.4 76.3 62.6 75.0 282.2
Consulting 75.5 82.3 61.2 82.1 301.2 76.3 74.9 65.4 89.5 306.1
Software (Direct) 83.0 135.7 70.1 140.3 429.1 87.5 166.4 65.1 151.4 470.4
Software (Indirect) 26.7 26.1 27.6 30.2 110.5 32.1 35.6 30.6 35.1 133.4
Admin 17.8 22.7 12.7 9.5 62.8 17.3 16.4 16.5 23.7 73.9
Eliminations -12.9 -9.9 -12.6 -1.7 -37.2 -11.9 -12.9 -12.4 -13.0 -50.2
Total gross profit 249.3 330.6 216.0 332.5 1,128.4 269.8 356.6 227.8 361.7 1,215.8
EBITDA
SAM 1.2 10.9 -6.7 7.9 13.4 8.5 12.7 -0.4 7.1 27.9
Consulting 2.2 11.9 7.8 11.6 33.6 5.9 1.2 7.4 11.2 25.8
Software (Direct) 10.2 63.9 5.9 59.2 139.1 19.9 93.5 5.0 70.7 189.0
Software (Indirect) 11.0 12.5 12.6 14.2 50.3 13.5 15.6 11.4 9.5 50.1
Admin -32.5 -38.0 -31.5 -29.2 -131.2 -42.9 -45.6 -32.6 -40.9 -162.1
Eliminations -0.2 -0.2 0.4 0.0 0.0 0.0 0.0 0.0 0.0 0.0
Adjusted EBITDA1 -8.0 61.0 -11.4 63.6 105.2 4.9 77.3 -9.3 57.7 130.6
1) Other income and expense items netted under “Admin”

29
Revenue – Market cluster by business area
NOKm Q1 2016 Q2 2016 Q3 2016 Q4 2016 2016 Q1 2017 Q2 2017 Q3 2017 Q4 2017 2017Nordic MarketsServices 120.1 137.8 100.4 139.7 498.0 126.7 126.7 105.9 144.1 503.4
Software 786.8 913.0 518.9 1,042.3 3,261.0 978.8 978.8 493.8 939.9 3,391.3
Admin 1.0 3.6 0.6 3.8 8.9 1.2 1.2 0.5 2.9 5.8
Nordic Markets revenue 907.9 1,054.3 619.9 1,185.9 3,767.9 1,106.7 1,106.7 600.2 1,086.9 3,900.5
Growth Markets
Services 20.0 21.0 20.0 21.3 82.3 18.1 18.1 15.7 22.6 74.5
Software 147.4 504.7 182.9 317.9 1,152.8 678.6 678.6 411.6 54.7 1,823.5
Admin 1.2 4.1 1.4 1.7 8.4 1.1 1.1 1.0 1.3 4.5
Growth Markets revenue 168.7 529.7 204.3 340.8 1,243.5 697.8 697.8 428.4 78.5 1,902.5
0Start-ups 0Services 4.9 5.6 5.9 8.0 24.5 8.5 8.5 6.7 6.1 29.8
Software 130.1 307.9 131.5 296.4 865.8 474.6 474.6 164.9 48.1 1,162.2
Admin 0.8 -0.2 -0.1 0.1 0.6 0.3 0.3 0.0 -0.1 0.5
Start-ups revenue 135.8 313.3 137.3 304.4 890.9 483.3 483.3 171.6 54.4 1,192.6
US
Services 17.2 25.8 21.0 25.8 89.8 33.6 33.6 26.8 22.8 116.8
Software 16.0 24.9 18.2 27.9 87.0 105.9 105.9 39.3 3 254.1
Admin 0.4 1.1 0.9 -0.5 2.0 0.1 0.1 0.1 0.6 0.9
US revenue 33.7 51.8 40.2 53.2 178.8 139.6 139.6 66.3 26.3 371.8
HQ
Services 0.0 0.0 0.0 -0.0 -0.0 - - 0.0 0.0 0.0
Software -0.0 6.5 -0.0 3.7 10.2 9.9 9.9 -0.0 -19.7 0.1
Admin 15.3 16.4 16.0 10.0 57.7 17.8 17.8 19.3 32.8 87.7
HQ revenue 15.3 22.9 16.0 13.7 67.9 27.7 27.7 19.3 13.1 87.8
Group
Services 162.3 190.2 147.2 194.8 694.6 186.9 186.9 155.2 195.5 724.5
Software 1,080.3 1,756.9 851.6 1,688.1 5,376.9 2,247.8 2,247.8 1,109.6 1,025.9 6,631.1
Admin 18.7 24.9 18.8 15.1 77.5 20.4 20.4 21.0 37.6 99.4
Eliminations -19.0 -21.6 -22.2 -71.0 -133.8 -53.4 -53.4 -36.1 -10.5 -153.4
Group revenue 1,242.2 1,950.5 995.4 1,827.1 6,015.2 2,401.7 2,401.7 1,249.7 1,248.6 7,301.7

30
Gross profit – Market cluster by business area
NOKm Q1 2016 Q2 2016 Q3 2016 Q4 2016 2016 Q1 2017 Q2 2017 Q3 2017 Q4 2017 2017Nordic MarketsServices 95.8 106.3 77.6 106.6 386.3 93.8 95.2 82.1 112 383.1
Software 76.7 109.9 60.9 116.9 364.4 78.6 116.4 55.6 122.5 373.1
Admin 2.0 3.0 -1.3 3.2 6.9 2.7 0.6 0.4 0.8 4.5
Nordic Markets gross profit 174.5 219.2 137.3 226.7 757.7 175.1 212.2 138.1 235.2 760.6
Growth Markets
Services 18.8 20.4 17.0 19.6 75.8 18.2 17.5 14.7 20.1 70.5
Software 21.1 32.6 17.1 28.5 99.2 22.2 49.9 18.3 38.7 129.1
Admin 0.7 4.0 1.4 1.6 7.7 1.9 1.1 1.0 0.3 4.3
Growth Markets gross profit 40.6 57.1 35.5 49.6 182.8 42.3 68.5 34.0 59.2 204.0
Start-ups
Services 4.4 5.1 4.8 5.9 20.2 5.5 7.2 5.9 7.3 25.9
Software 8.0 14.9 14.7 12.7 50.3 13.3 27.3 17.3 20.7 78.6
Admin 0.4 -0.3 -0.2 0.1 0.1 0.2 0.3 0.0 0 0.5
Start-ups gross profit 12.9 19.6 19.3 18.7 70.6 18.9 34.7 23.2 28.2 105.0
US
Services 15.7 24.0 18.9 22.2 80.8 27.3 31.2 25.3 25.1 108.9
Software 3.8 3.2 5.1 8.8 20.9 4.7 9.2 4.6 4.7 23.2
Admin 0.2 0.9 -1.7 -0.3 -1.0 0.2 0.1 0.1 0.5 0.9
US gross profit 19.7 28.0 22.2 30.7 100.7 32.1 40.5 29.9 30.5 133.0
HQ
Services 0.0 0.0 0.0 -0.0 0.0 0.0 0.0 - 0 0.0
Software -0.0 1.3 -0.1 3.7 4.8 0.9 -0.8 -0.0 -0.3 -0.2
Admin 14.5 15.1 14.5 5.0 49.0 12.4 14.4 15.0 21.9 63.7
HQ gross profit 14.5 16.4 14.4 8.6 53.9 13.3 13.6 15.0 21.6 63.5
Group
Services 134.9 155.8 118.3 154.2 563.2 144.8 151.1 128.0 164.4 588.3
Software 109.6 161.9 97.7 170.5 539.6 119.6 201.9 95.7 186.6 603.8
Admin 17.8 22.7 12.7 9.5 62.8 17.3 16.4 16.5 13.5 63.7
Eliminations -12.9 -9.9 -12.6 -1.7 -37.2 -11.9 -12.9 -12.4 -13 -50.2
Group gross profit 249.3 330.6 216.0 332.5 1,128.4 269.8 356.6 227.8 361.6 1,215.8

31
Carnegie and DNB Markets (Joint Global Coordinators)
Appendix

Offering and value proposition
32
Crayon – a fast growing global software and services expert
• Founded in 2002 with headquarters in Oslo, Norway
• Owned by management, PE firm Norvestor Equity and KLP since 2012
• ~1,000 employees and ~8,000 customers of which more than 40% public1
• Strategic partnerships with the largest software vendors globally
• Extensive IP portfolio yielding competitive advantages
• Presence in 21 countries covering 80% of addressable market
• Revenues of NOK 6.0bn with high growth and strong cash conversion
Company at a glance An international growth story with strengthening momentum
981675636
4,688
2014
2,047
20162013
6,015
3,045
2015
3,732
+29%
+22%
20122011
1,098
1,6601,481
20072006 20102008 2009 2017
7,302
• Helps customers to optimize software costs and reduce complexity
• Customers save ~15-30% of software cost
• Customers benefit from Crayon’s global position and value-add end-to-end services along the software value chain
Software
Services
Crayon is a trusted advisor for customers in their digital transformation journey
Revenue, NOKm
Country locations of Crayon customersCrayon HQ (Oslo, Norway)Crayon locations
80%Addressable
software market
1) Based on share of gross profit 2017

33
Services – SAM and Consulting
Consulting – cloud and solutions consulting servicesSAM – IT optimization; Crayon’s customer acquisition tool
• Crayon’s offering seeks to optimize the IT structure of customers by
• improving software ROI
• helping customers stay compliant
• and helping customer to avoid fines
• SAM is the go-to-market model and has been deployed as a customer acquisition tool when Crayon have entered new geographical markets
• SAM comprise both tactical advisory to mid-level management and strategic advice with customer top management as counterparties
• Crayon uses proprietary IP to differentiate from competitors and to build customer stickiness – IP applied in SAM offering comprises Elevate, SAM-IQ and Catch
• With +240 SAM consultants, Crayon is a leading global player on SAM, and has the highest number of SAM consultants in the world1
Gross profit2 (NOKm) KPIs
Repeat buy
Public vs. private mix
Customer concentration
87% (Annual repeat buy3)
20% (Public customers4)
30% (Gross profit of top 10 customers4)
1) Crayon Management estimates based on number of independent SAM consultants (independent SAM consultants meaning consultants working for the customer, not the software vendor)
2) 2014-2016 Source: Crayon Group Holding AS financial accounts. Q3 LTM 2017 Source: Crayon sales report. Note: Payroll expenses are fully classified below gross profit
3) 2016 gross profit repeat buy adjusted for FAST acquisition in the UK for SAM. Repeat buy
is (1-churn). Source: Sales data4) Based on 2016 figures. Source: Crayon sales report5) Gross profit 2016 figures excluding Admin and eliminations
CAGR: +27%
2017
282
2015
179
2014
139
2016
262
• Crayon offers consulting services in principally two areas: Cloud and Solutions
• Cloud Consulting: Generic support and services on universal technology platforms
• Solutions Consulting: Bespoke application development tailored to customers’ needs
• Total of 247 consultants per year end 2016 (FTEs)
• Core offering includes:
• IT infrastructure services (planning and analysis support related to larger IT upgrade projects)
• Cloud Consulting: helping customer migrate to the cloud
• Tailored software solution or application development and the resolving of complex IT problems including on-site support
• Providing value to customer through helping to solve complex problems that customers are unable to solve internally
• 98% of business in the Nordic region5, predominantly in Norway
Gross profit2 (NOKm) KPIs
Repeat buy
Public vs. private mix
Customer concentration
93% (Annual repeat buy3)
45% (Public customers4)
306301
2015
285
2014
303
2017
CAGR: 0%
2016
50% (Cloud)
52% (Solutions)
(Gross profit of top 10 customers4)

34
Software – Direct and Indirect
Indirect – license offering towards channel partnersDirect – license offering directly from vendor to customers
• Focus on standard software that customers use consistently year after year, and which play a key role in their technological platforms and critical commercial processes
• 280 sales and 1st line support employees per year end 2016 (FTEs)
• Clients acquired through SAM approach
• Majority of billing is done through Crayon – meaning Crayon are billing clients directly, strengthening client relationships
• 60% direct billing per 20164
• Solid level of recurring revenues from 3-5 year agreements with customers
• Base for recurring and sticky customer relationships further supported by proprietary IP applied (Navigator)
• License advisory and transactional support related to purchase of 3rd party software
Gross profit1 (NOKm) KPIs
Repeat buy
Public vs. private mix
Customer concentration
96% (Annual repeat buy2)
40% (Public customers3)
14% (Gross profit of top 10 customers3)
1) 2014-2016 Source: Crayon Group Holding AS financial accounts. Q3 LTM 2017 Source: Crayon sales report. Note: Payroll expenses are fully classified below gross profit
2) 2016 gross profit repeat buy. Repeat buy is (1-churn). Source: Sales data
3) Based on 2016 figures. Source: Crayon sales report4) Crayon direct billing of Microsoft’s share of gross profit. Based on 2016 figures. Source:
Crayon sales report
429
20152014
345
CAGR: +13%
20172016
325
470
• Crayon's license offering towards channel partners:
• License advisory / optimization, software license sale and access to Crayon’s reporting portal
• Crayon sells software licenses through a diverse group of leading channel partners:
• Crayon not the customers direct point-of-contact, hence Crayon revenue is generated through channel partner network
• 73 sales and 1st line support employees per year end 2016 (FTEs)
• ~100% recurring revenue driven by multi-year agreements with monthly invoicing
• Proprietary IP applied comprise Cloud-IQ
Gross profit1 (NOKm) KPIs
Repeat buy
Public vs. private mix
Customer concentration
99% (Annual repeat buy2)
0% (Public customers3)
2015
94
60
2014
111
CAGR: +31%
2017
133
20167% (Gross profit of
top 10 customers3)
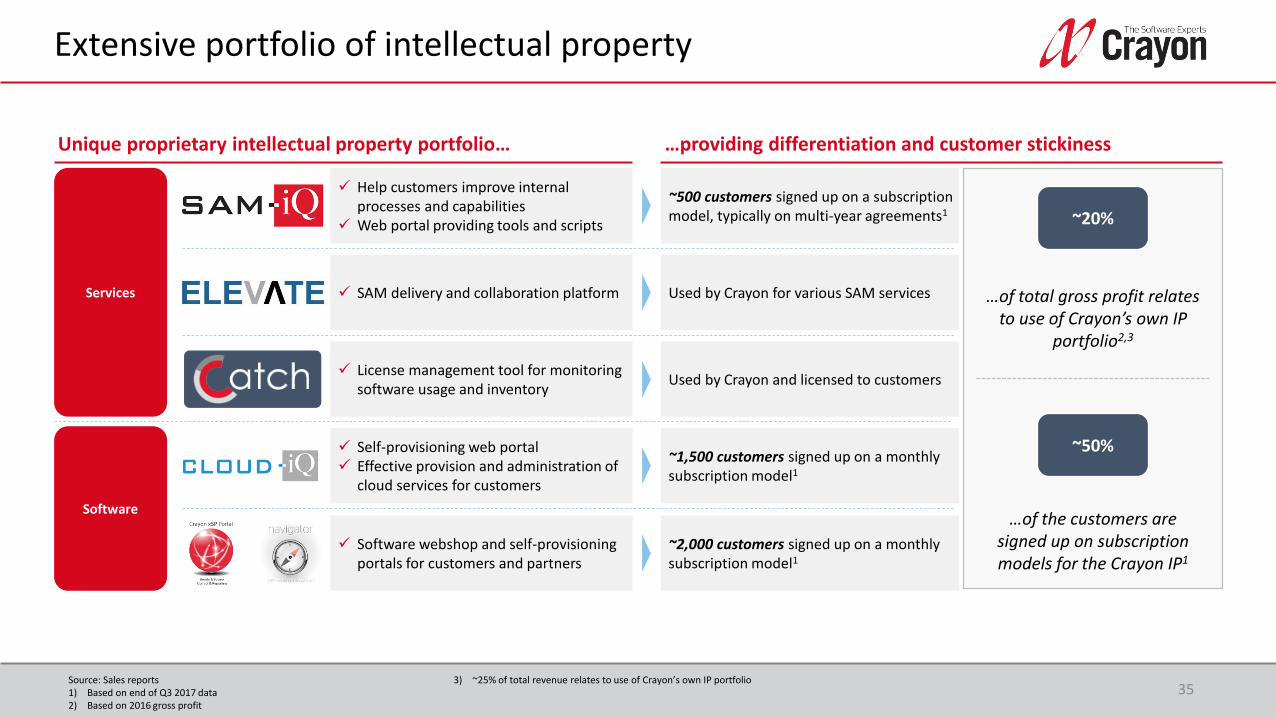
Unique proprietary intellectual property portfolio…
Extensive portfolio of intellectual property
35
Services
Software
✓ Help customers improve internal processes and capabilities
✓ Web portal providing tools and scripts
✓ SAM delivery and collaboration platform
✓ License management tool for monitoring software usage and inventory
✓ Self-provisioning web portal ✓ Effective provision and administration of
cloud services for customers
✓ Software webshop and self-provisioning portals for customers and partners
~500 customers signed up on a subscription model, typically on multi-year agreements1
Used by Crayon for various SAM services
Used by Crayon and licensed to customers
~1,500 customers signed up on a monthly subscription model1
~2,000 customers signed up on a monthly subscription model1
…providing differentiation and customer stickiness
~20%
…of total gross profit relates to use of Crayon’s own IP
portfolio2,3
~50%
…of the customers are signed up on subscription models for the Crayon IP1
Source: Sales reports1) Based on end of Q3 2017 data2) Based on 2016 gross profit
3) ~25% of total revenue relates to use of Crayon’s own IP portfolio

Successful development from being a Norwegian licensing provider to global ambitions
36
Proven execution of international expansion strategy
981675636
249
2002 2005
+29%
CAGR: +22%
3,045
20102008 20162007
4,688
3,732
1,660
201120092006
1,098
6,015
2013
2,047
20142012
1,481
2015
7,302
2017
Norwegian licensingNordic customer driven
expansionEuropean ambition Global ambition
(Merged with
Inmeta)
Revenue, NOKm
Opportunities for price arbitrage
Ability to win global customers
Positioned to be a true strategic partner
Business model applicable across geographies


![VARIO Magnus [e]Magnus](https://static.fdocuments.us/doc/165x107/62e7b22695cddb648811f746/vario-magnus-emagnus.jpg)