Q4 2017 Cat Inc. Release - Final - Caterpillar: Home · (more) Caterpillar Inc. 4Q 2017 Earnings...
29
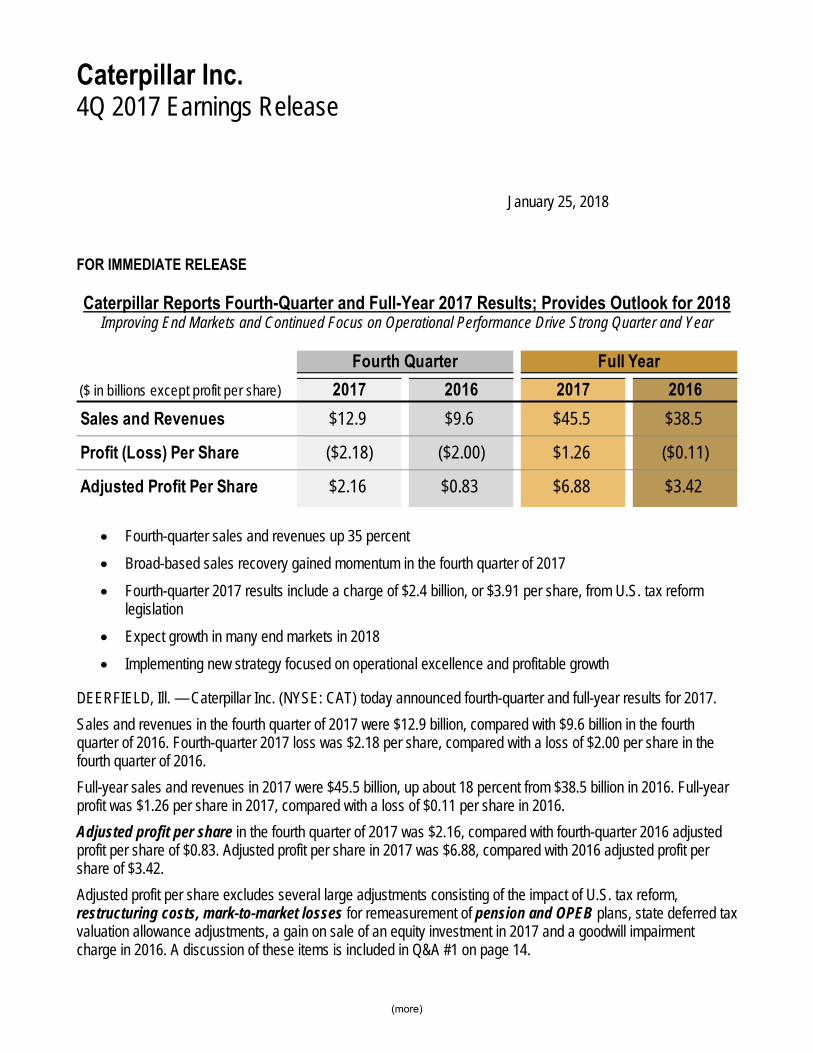
(more) Caterpillar Inc. 4Q 2017 Earnings Release January 25, 2018 FOR IMMEDIATE RELEASE Caterpillar Reports Fourth-Quarter and Full-Year 2017 Results; Provides Outlook for 2018 Improving End Markets and Continued Focus on Operational Performance Drive Strong Quarter and Year DEERFIELD, Ill. — Caterpillar Inc. (NYSE: CAT) today announced fourth-quarter and full-year results for 2017. Sales and revenues in the fourth quarter of 2017 were $12.9 billion, compared with $9.6 billion in the fourth quarter of 2016. Fourth-quarter 2017 loss was $2.18 per share, compared with a loss of $2.00 per share in the fourth quarter of 2016. Full-year sales and revenues in 2017 were $45.5 billion, up about 18 percent from $38.5 billion in 2016. Full-year profit was $1.26 per share in 2017, compared with a loss of $0.11 per share in 2016. Adjusted profit per share in the fourth quarter of 2017 was $2.16, compared with fourth-quarter 2016 adjusted profit per share of $0.83. Adjusted profit per share in 2017 was $6.88, compared with 2016 adjusted profit per share of $3.42. Adjusted profit per share excludes several large adjustments consisting of the impact of U.S. tax reform, restructuring costs, mark-to-market losses for remeasurement of pension and OPEB plans, state deferred tax valuation allowance adjustments, a gain on sale of an equity investment in 2017 and a goodwill impairment charge in 2016. A discussion of these items is included in Q&A #1 on page 14. ($ in billions except profit per share) 2017 2016 2017 2016 Sales and Revenues $12.9 $9.6 $45.5 $38.5 Profit (Loss) Per Share ($2.18) ($2.00) $1.26 ($0.11) Adjusted Profit Per Share $2.16 $0.83 $6.88 $3.42 Full Year Fourth Quarter Fourth-quarter sales and revenues up 35 percent Broad-based sales recovery gained momentum in the fourth quarter of 2017 Fourth-quarter 2017 results include a charge of $2.4 billion, or $3.91 per share, from U.S. tax reform legislation Expect growth in many end markets in 2018 Implementing new strategy focused on operational excellence and profitable growth
Transcript of Q4 2017 Cat Inc. Release - Final - Caterpillar: Home · (more) Caterpillar Inc. 4Q 2017 Earnings...
(more)
Caterpillar Inc. 4Q 2017 Earnings Release
January 25, 2018
FOR IMMEDIATE RELEASE Caterpillar Reports Fourth-Quarter and Full-Year 2017 Results; Provides Outlook for 2018
Improving End Markets and Continued Focus on Operational Performance Drive Strong Quarter and Year
DEERFIELD, Ill. — Caterpillar Inc. (NYSE: CAT) today announced fourth-quarter and full-year results for 2017.
Sales and revenues in the fourth quarter of 2017 were $12.9 billion, compared with $9.6 billion in the fourth quarter of 2016. Fourth-quarter 2017 loss was $2.18 per share, compared with a loss of $2.00 per share in the fourth quarter of 2016.
Full-year sales and revenues in 2017 were $45.5 billion, up about 18 percent from $38.5 billion in 2016. Full-year profit was $1.26 per share in 2017, compared with a loss of $0.11 per share in 2016.
Adjusted profit per share in the fourth quarter of 2017 was $2.16, compared with fourth-quarter 2016 adjusted profit per share of $0.83. Adjusted profit per share in 2017 was $6.88, compared with 2016 adjusted profit per share of $3.42.
Adjusted profit per share excludes several large adjustments consisting of the impact of U.S. tax reform, restructuring costs, mark-to-market losses for remeasurement of pension and OPEB plans, state deferred tax valuation allowance adjustments, a gain on sale of an equity investment in 2017 and a goodwill impairment charge in 2016. A discussion of these items is included in Q&A #1 on page 14.
($ in billions except profit per share) 2017 2016 2017 2016
Sales and Revenues $12.9 $9.6 $45.5 $38.5
Profit (Loss) Per Share ($2.18) ($2.00) $1.26 ($0.11)
Adjusted Profit Per Share $2.16 $0.83 $6.88 $3.42
Full YearFourth Quarter
Fourth-quarter sales and revenues up 35 percent
Broad-based sales recovery gained momentum in the fourth quarter of 2017
Fourth-quarter 2017 results include a charge of $2.4 billion, or $3.91 per share, from U.S. tax reform legislation
Expect growth in many end markets in 2018
Implementing new strategy focused on operational excellence and profitable growth
2
(more)
Caterpillar’s financial position continued to strengthen in the fourth quarter. Machinery, Energy & Transportation (ME&T) operating cash flow was $1.3 billion during the fourth quarter of 2017 and $5.5 billion for the full year of 2017. The ME&T debt-to-capital ratio was 36.7 percent at the end of 2017, compared to 41.0 percent at the end of 2016. The company ended 2017 with an enterprise cash balance of $8.3 billion. In the fourth quarter of 2017, the company made a discretionary contribution to U.S. pension plans of $1.0 billion and a payment for early debt retirement of $958 million.
“After four challenging years, many key markets improved in 2017, and our global team delivered strong results. We remained focused on operational excellence and made early investments in profitable growth initiatives as we began to implement our new strategy,” said Caterpillar CEO Jim Umpleby.
2018 Outlook
Caterpillar is beginning 2018 with strong sales momentum resulting from strong order rates, lean dealer inventories and an increasing backlog. Additionally, there are positive economic indicators across most of the world and in many of the company’s end markets. Caterpillar is preparing its factories and suppliers to be ready for continued growth, while remaining focused on managing with a flexible and competitive cost structure that should enable the company to respond quickly if economic fundamentals change. The company expects 2018 profit per share in a range of $7.75 to $8.75. Excluding restructuring costs of about $400 million, adjusted profit per share is expected in a range of $8.25 to $9.25.
"We are in the early stages of implementing our strategy for profitable growth. In 2018, we expect to make additional investments in the expanded offerings and services important for Caterpillar’s long-term success. We will use our Operating & Execution Model to bias resources to areas that represent the greatest opportunity for return on our investments,” said Umpleby.
“Our focus on operational excellence will not waver as we work to develop a more competitive and flexible cost structure, including implementing lean manufacturing principles. We are positioned to capitalize on continued sales momentum or quickly adjust should conditions change,” added Umpleby.
Following is a summary of the key drivers of sales assumptions included in the outlook:
Construction Industries – The company expects growth in 2018 with some tempering in the latter part of the year, largely due to anticipated seasonality of sales in China. Caterpillar expects improvement in North American residential, non-residential and infrastructure. The outlook does not include any impact from a potential U.S. infrastructure bill. Europe and Asia/Pacific are expected to continue to grow, and the recovery that started in Africa/Middle East and Latin America is expected to extend into 2018.
Resource Industries – The company believes that global economic momentum and increasing commodity prices are restoring miners’ business confidence and financial health. The company anticipates miners’ capital spend to increase as mining businesses invest in equipment replacement cycles. Higher machine utilization levels should support continued strong aftermarket parts opportunities. Strong global demand is expected to be a positive for heavy construction.
Energy & Transportation – Sales into Oil and Gas applications are expected to increase in 2018, led by reciprocating engines for gas compression and well servicing in North America. The current turbines backlog is healthy in support of the midstream pipeline business. The company expects an increase in Transportation primarily from recent acquisitions in rail services, while the locomotive and marine markets are expected to remain challenged. Power Generation sales are forecast to be slightly up after a multi-year downturn. Sales into Industrial applications are expected to be about flat.
Following are key points to help understand the elements of the 2018 profit outlook:
An expected increase in sales volume is the most significant reason for the higher profit outlook, with volume increases forecasted across the three primary segments.
3
(more)
Slightly favorable price realization is expected to be mostly offset by material cost increases due to higher commodity prices.
Period costs excluding short-term incentive compensation expense are expected to increase due to labor inflation and targeted investments in profitable growth initiatives, including expanded offerings and services.
The outlook includes short-term incentive compensation expense of about $900 million.
Financial Products’ segment profit is expected to be lower in 2018 than in 2017, primarily due to the absence of about $100 million of gains on sales of securities in 2017.
The outlook assumes a tax rate of 24 percent, including the company’s current estimate of the impact of U.S. tax reform legislation.
ME&T capital expenditures are expected to be about $1.0 billion to $1.5 billion.
No stock repurchases are assumed in the outlook.
The outlook does not include a mark-to-market gain or loss for remeasurement of pension and OPEB plans or changes to provisional estimates recorded in 2017 for U.S. tax reform.
Notes:
- Glossary of terms is included on pages 17-18; first occurrence of terms shown in bold italics. - Information on non-GAAP financial measures is included on page 19. - Caterpillar will conduct a teleconference and live webcast, with a slide presentation, beginning at 10 a.m. Central Time on
Thursday, January 25, 2018, to discuss its 2017 fourth-quarter and full-year financial results. The accompanying slides will be available before the webcast on the Caterpillar website at http://www.caterpillar.com/investors/events-and-presentations.
About Caterpillar: For more than 90 years, Caterpillar Inc. has been making sustainable progress possible and driving positive change on every continent. Customers turn to Caterpillar to help them develop infrastructure, energy and natural resource assets. With 2017 sales and revenues of $45.462 billion, Caterpillar is the world’s leading manufacturer of construction and mining equipment, diesel and natural gas engines, industrial gas turbines and diesel-electric locomotives. The company principally operates through its three primary segments - Construction Industries, Resource Industries and Energy & Transportation - and also provides financing and related services through its Financial Products segment. For more information, visit caterpillar.com. To connect with us on social media, visit caterpillar.com/social-media. Caterpillar contact: Corrie Scott, 224-551-4133 (Office), 808-351-3865 (Mobile) or [email protected] Forward-Looking Statements Certain statements in this press release relate to future events and expectations and are forward-looking statements within the meaning of the Private Securities Litigation Reform Act of 1995. Words such as “believe,” “estimate,” “will be,” “will,” “would,” “expect,” “anticipate,” “plan,” “project,” “intend,” “could,” “should” or other similar words or expressions often identify forward-looking statements. All statements other than statements of historical fact are forward-looking statements, including, without limitation, statements regarding our outlook, projections, forecasts or trend descriptions. These statements do not guarantee future performance and speak only as of the date they are made, and we do not undertake to update our forward-looking statements. Caterpillar’s actual results may differ materially from those described or implied in our forward-looking statements based on a number of factors, including, but not limited to: (i) global and regional economic conditions and economic conditions in the industries we serve; (ii) commodity price changes, material price increases, fluctuations in demand for our products or significant shortages of material; (iii) government monetary or fiscal policies; (iv) political and economic risks, commercial instability and events beyond our control in the countries in which we operate; (v) our ability to develop, produce and market quality products that meet our customers’ needs; (vi) the impact of the highly competitive environment in which we operate on our sales and pricing; (vii) information technology security threats and computer crime; (viii) additional restructuring costs or a failure to realize anticipated savings or benefits from past or future cost reduction actions; (ix) failure to realize all of the
4
(more)
anticipated benefits from initiatives to increase our productivity, efficiency and cash flow and to reduce costs; (x) inventory management decisions and sourcing practices of our dealers and our OEM customers; (xi) a failure to realize, or a delay in realizing, all of the anticipated benefits of our acquisitions, joint ventures or divestitures; (xii) union disputes or other employee relations issues; (xiii) adverse effects of unexpected events including natural disasters; (xiv) disruptions or volatility in global financial markets limiting our sources of liquidity or the liquidity of our customers, dealers and suppliers; (xv) failure to maintain our credit ratings and potential resulting increases to our cost of borrowing and adverse effects on our cost of funds, liquidity, competitive position and access to capital markets; (xvi) our Financial Products segment’s risks associated with the financial services industry; (xvii) changes in interest rates or market liquidity conditions; (xviii) an increase in delinquencies, repossessions or net losses of Cat Financial’s customers; (xix) currency fluctuations; (xx) our or Cat Financial’s compliance with financial and other restrictive covenants in debt agreements; (xxi) increased pension plan funding obligations; (xxii) alleged or actual violations of trade or anti-corruption laws and regulations; (xxiii) international trade policies and their impact on demand for our products and our competitive position; (xxiv) additional tax expense or exposure, including the impact of U.S. tax reform; (xxv) significant legal proceedings, claims, lawsuits or government investigations; (xxvi) new regulations or changes in financial services regulations; (xxvii) compliance with environmental laws and regulations; and (xxviii) other factors described in more detail in Caterpillar’s Forms 10-Q, 10-K and other filings with the Securities and Exchange Commission.

5
(more)
CONSOLIDATED RESULTS Consolidated Sales and Revenues
The chart above graphically illustrates reasons for the change in Consolidated Sales and Revenues between the fourth quarter of 2016 (at left) and the fourth quarter of 2017 (at right). Items favorably impacting sales and revenues appear as upward stair steps with the corresponding dollar amounts above each bar, while items negatively impacting sales and revenues appear as downward stair steps with dollar amounts reflected in parentheses above each bar. Caterpillar management utilizes these charts internally to visually communicate with the company’s board of directors and employees.
Sales and Revenues
Total sales and revenues were $12.896 billion in the fourth quarter of 2017, an increase of $3.322 billion, or 35 percent, compared with $9.574 billion in the fourth quarter of 2016. The increase was primarily due to higher sales volume, mostly due to improved end-user demand. In addition, favorable changes in dealer inventories contributed to increased sales volume. The improvement in end-user demand was across all regions and most end markets. The favorable change in dealer inventories was primarily due to a decrease in the fourth quarter of 2016, compared to dealer inventories that were about flat in the fourth quarter of 2017. By segment, the largest sales volume increase was in Construction Industries, mostly due to higher end-user demand for construction equipment and the favorable impact of changes in dealer inventories. Energy & Transportation’s sales volume increased due to higher demand across all applications. Sales volume for Resource Industries increased due to higher end-user demand for equipment and aftermarket parts. Favorable price realization, primarily in Construction Industries and Resource Industries, also contributed to the sales improvement. Financial Products’ revenues were about flat.
Sales increased across all regions with the largest increase in North America. Sales improved 46 percent in North America primarily due to higher end-user demand for both equipment and aftermarket parts. Changes in dealer inventories were favorable as dealer inventories decreased in the fourth quarter of 2016 and increased slightly in the fourth quarter of 2017. EAME sales increased 38 percent primarily due to higher end-user demand for equipment and favorable price realization. Asia/Pacific sales increased 22 percent primarily due to higher end-user demand for construction equipment. About half of the sales improvement in Asia/Pacific was in China resulting from increased building construction and infrastructure investment. Sales increased 39 percent in Latin America due to stabilizing economic conditions in several countries in the region that resulted in improved end-user demand from low levels, as well as favorable changes in dealer inventories.
6
(more)
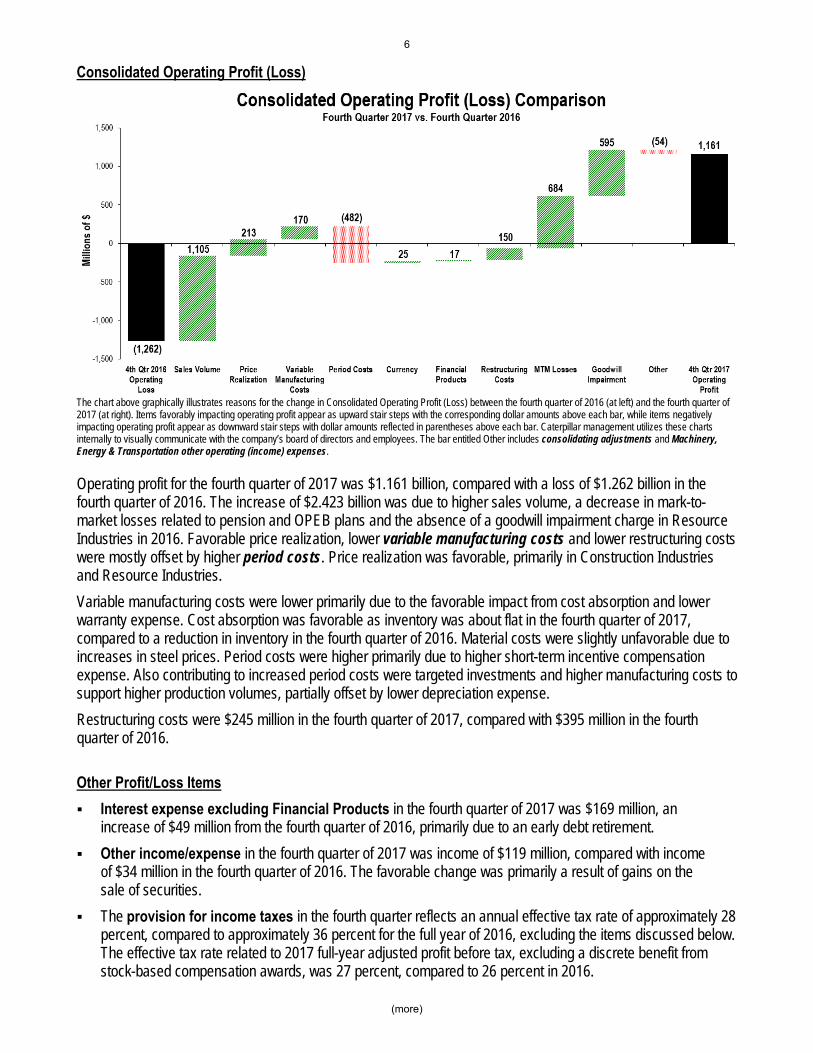
Consolidated Operating Profit (Loss)
The chart above graphically illustrates reasons for the change in Consolidated Operating Profit (Loss) between the fourth quarter of 2016 (at left) and the fourth quarter of 2017 (at right). Items favorably impacting operating profit appear as upward stair steps with the corresponding dollar amounts above each bar, while items negatively impacting operating profit appear as downward stair steps with dollar amounts reflected in parentheses above each bar. Caterpillar management utilizes these charts internally to visually communicate with the company’s board of directors and employees. The bar entitled Other includes consolidating adjustments and Machinery, Energy & Transportation other operating (income) expenses.
Operating profit for the fourth quarter of 2017 was $1.161 billion, compared with a loss of $1.262 billion in the fourth quarter of 2016. The increase of $2.423 billion was due to higher sales volume, a decrease in mark-to-market losses related to pension and OPEB plans and the absence of a goodwill impairment charge in Resource Industries in 2016. Favorable price realization, lower variable manufacturing costs and lower restructuring costs were mostly offset by higher period costs. Price realization was favorable, primarily in Construction Industries and Resource Industries.
Variable manufacturing costs were lower primarily due to the favorable impact from cost absorption and lower warranty expense. Cost absorption was favorable as inventory was about flat in the fourth quarter of 2017, compared to a reduction in inventory in the fourth quarter of 2016. Material costs were slightly unfavorable due to increases in steel prices. Period costs were higher primarily due to higher short-term incentive compensation expense. Also contributing to increased period costs were targeted investments and higher manufacturing costs to support higher production volumes, partially offset by lower depreciation expense.
Restructuring costs were $245 million in the fourth quarter of 2017, compared with $395 million in the fourth quarter of 2016.
Other Profit/Loss Items
Interest expense excluding Financial Products in the fourth quarter of 2017 was $169 million, an increase of $49 million from the fourth quarter of 2016, primarily due to an early debt retirement.
Other income/expense in the fourth quarter of 2017 was income of $119 million, compared with income of $34 million in the fourth quarter of 2016. The favorable change was primarily a result of gains on the sale of securities.
The provision for income taxes in the fourth quarter reflects an annual effective tax rate of approximately 28 percent, compared to approximately 36 percent for the full year of 2016, excluding the items discussed below. The effective tax rate related to 2017 full-year adjusted profit before tax, excluding a discrete benefit from stock-based compensation awards, was 27 percent, compared to 26 percent in 2016.

7
(more)
The provision for income taxes in the fourth quarter of 2017 also includes a charge of $2.371 billion due to the enactment of U.S. tax reform legislation on December 22, 2017. The provisionally estimated charge includes a $596 million write-down of net deferred tax assets to reflect the reduction in the U.S. corporate tax rate from 35 percent to 21 percent beginning January 1, 2018, with the remainder primarily related to the cost of a mandatory deemed repatriation of non-U.S. earnings. Three items partially offset this charge:
A $130 million benefit related to the change from the third-quarter estimated annual tax rate of 32 percent to approximately 28 percent for the full year of 2017, primarily due to a more favorable geographic mix of profits from a tax perspective, including the impact of U.S. pension and OPEB mark-to-market losses taxed at higher U.S. rates.
A non-cash benefit of $111 million, net of U.S. federal tax at 35 percent, from reductions in the valuation allowance against U.S. state deferred tax assets due to improved profits in the United States.
A tax benefit of $19 million for the settlement of stock-based compensation awards with associated tax deductions in excess of cumulative U.S. GAAP compensation expense.
The provision for income taxes in the fourth quarter of 2016 also included a charge of $170 million related to the change from the third quarter of 2016 estimated annual tax rate. In addition, the valuation allowance against U.S. state deferred tax assets was increased in 2016, resulting in a $141 million non-cash charge, net of U.S. federal tax at 35 percent.
Global Workforce
Caterpillar worldwide, full-time employment was about 98,400 at the end of 2017, an increase of about 3,000 full-time employees from the end of 2016, primarily the result of higher production volumes. The flexible workforce increased by about 7,300, also primarily due to higher production volumes. In total, the global workforce increased by about 10,300.
December 31
2017 2016Increase/
(Decrease)
Full-time employment 98,400 95,400 3,000
Flexible workforce 18,300 11,000 7,300
Total 116,700 106,400 10,300
Geographic Summary
U.S. workforce 50,500 45,700 4,800
Non-U.S. workforce 66,200 60,700 5,500
Total 116,700 106,400 10,300
8
(more)
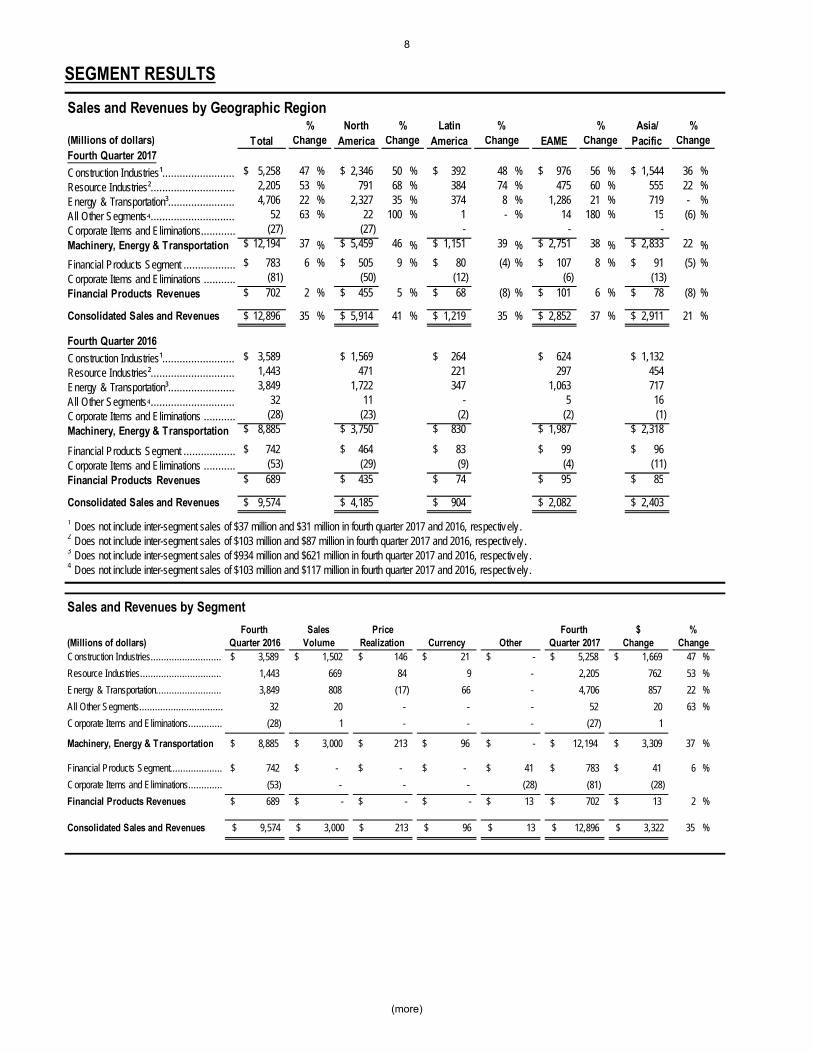
SEGMENT RESULTS
Sales and Revenues by Geographic RegionNorth Latin Asia/
(Millions of dollars) Total America America EAME PacificFourth Quarter 2017
Construction Industries¹......................... 5,258$ 47 % 2,346$ 50 % 392$ 48 % 976$ 56 % 1,544$ 36 %Resource Industries²............................. 2,205 53 % 791 68 % 384 74 % 475 60 % 555 22 %Energy & Transportation³....................... 4,706 22 % 2,327 35 % 374 8 % 1,286 21 % 719 - %All Other Segments⁴............................. 52 63 % 22 100 % 1 - % 14 180 % 15 (6) %Corporate Items and Eliminations............ (27) (27) - - - Machinery, Energy & Transportation 12,194$ 37 % 5,459$ 46 % 1,151$ 39 % 2,751$ 38 % 2,833$ 22 %
Financial Products Segment .................. 783$ 6 % 505$ 9 % 80$ (4) % 107$ 8 % 91$ (5) %Corporate Items and Eliminations ........... (81) (50) (12) (6) (13) Financial Products Revenues 702$ 2 % 455$ 5 % 68$ (8) % 101$ 6 % 78$ (8) %
Consolidated Sales and Revenues 12,896$ 35 % 5,914$ 41 % 1,219$ 35 % 2,852$ 37 % 2,911$ 21 %
Fourth Quarter 2016
Construction Industries¹......................... 3,589$ 1,569$ 264$ 624$ 1,132$ Resource Industries²............................. 1,443 471 221 297 454 Energy & Transportation³....................... 3,849 1,722 347 1,063 717 All Other Segments⁴............................. 32 11 - 5 16 Corporate Items and Eliminations ........... (28) (23) (2) (2) (1) Machinery, Energy & Transportation 8,885$ 3,750$ 830$ 1,987$ 2,318$
Financial Products Segment .................. 742$ 464$ 83$ 99$ 96$ Corporate Items and Eliminations ........... (53) (29) (9) (4) (11) Financial Products Revenues 689$ 435$ 74$ 95$ 85$
Consolidated Sales and Revenues 9,574$ 4,185$ 904$ 2,082$ 2,403$
4 Does not include inter-segment sales of $103 million and $117 million in fourth quarter 2017 and 2016, respectively .
3 Does not include inter-segment sales of $934 million and $621 million in fourth quarter 2017 and 2016, respectively .
2 Does not include inter-segment sales of $103 million and $87 million in fourth quarter 2017 and 2016, respectively.
1 Does not include inter-segment sales of $37 million and $31 million in fourth quarter 2017 and 2016, respectively .
Change Change ChangeChangeChange% % % % %
Sales and Revenues by Segment
Fourth Sales Price Fourth $(Millions of dollars) Quarter 2016 Volume Realization Currency Other Quarter 2017 ChangeConstruction Industries........................... $ 3,589 $ 1,502 $ 146 $ 21 $ - $ 5,258 $ 1,669 47 %
Resource Industries............................... 1,443 669 84 9 - 2,205 762 53 %
Energy & Transportation......................... 3,849 808 (17) 66 - 4,706 857 22 %
All Other Segments................................ 32 20 - - - 52 20 63 %
Corporate Items and Eliminations............. (28) 1 - - - (27) 1
Machinery, Energy & Transportation $ 8,885 $ 3,000 $ 213 $ 96 $ - $ 12,194 $ 3,309 37 %
Financial Products Segment.................... $ 742 $ - $ - $ - $ 41 $ 783 $ 41 6 %
Corporate Items and Eliminations............. (53) - - - (28) (81) (28)
Financial Products Revenues $ 689 $ - $ - $ - $ 13 $ 702 $ 13 2 %
Consolidated Sales and Revenues $ 9,574 $ 3,000 $ 213 $ 96 $ 13 $ 12,896 $ 3,322 35 %
Change%

9
(more)
Profit (Loss) by SegmentFourth Fourth $
(Millions of dollars) Quarter 2017 Quarter 2016 Change
Construction Industries..................................................... 838$ 334$ 504$ 151 %
Resource Industries......................................................... 209 (711) 920 n/a
Energy & Transportation................................................... 881 638 243 38 %
All Other Segments......................................................... (16) (34) 18 53 %
Corporate Items and Eliminations....................................... (821) (1,572) 751
Machinery, Energy & Transportation 1,091$ (1,345)$ 2,436$ n/a
Financial Products Segment.............................................. 233$ 149$ 84$ 56 %
Corporate Items and Eliminations....................................... (77) (9) (68)
Financial Products 156$ 140$ 16$ 11 %
Consolidating Adjustments (86) (57) (29)
Consolidated Operating Profit (Loss) 1,161$ (1,262)$ 2,423$ n/a
Change
%
10
(more)
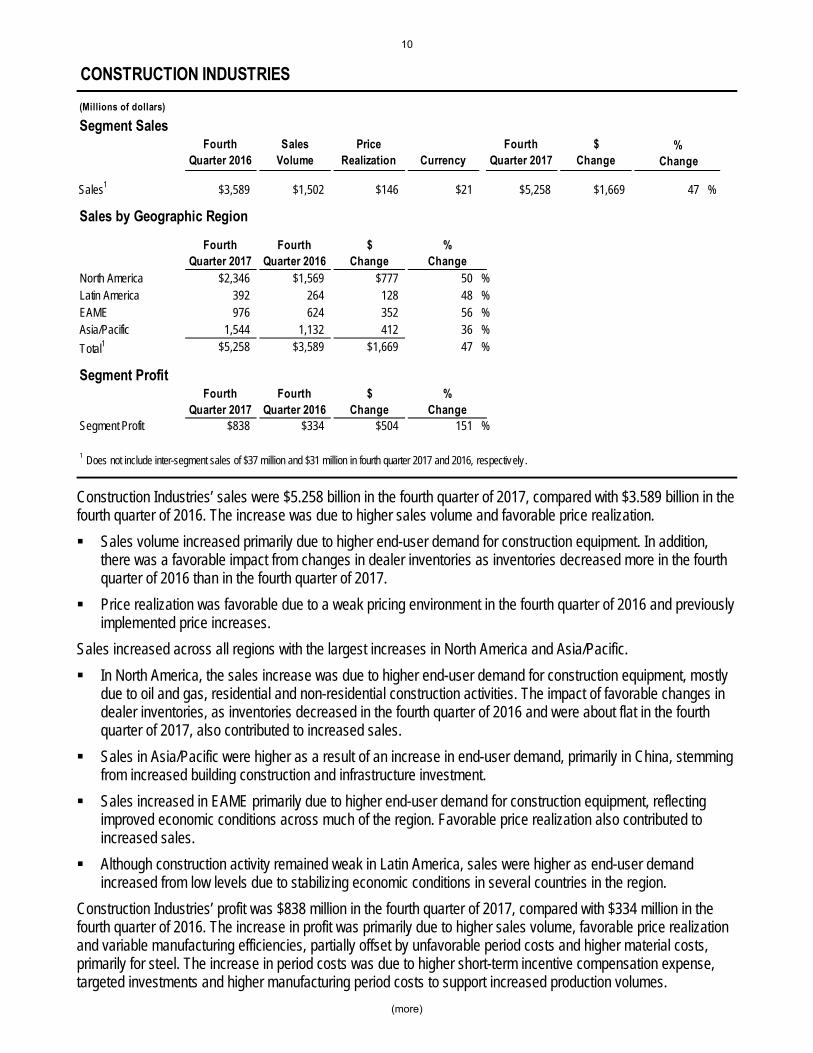
Construction Industries’ sales were $5.258 billion in the fourth quarter of 2017, compared with $3.589 billion in the fourth quarter of 2016. The increase was due to higher sales volume and favorable price realization.
Sales volume increased primarily due to higher end-user demand for construction equipment. In addition, there was a favorable impact from changes in dealer inventories as inventories decreased more in the fourth quarter of 2016 than in the fourth quarter of 2017.
Price realization was favorable due to a weak pricing environment in the fourth quarter of 2016 and previously implemented price increases.
Sales increased across all regions with the largest increases in North America and Asia/Pacific.
In North America, the sales increase was due to higher end-user demand for construction equipment, mostly due to oil and gas, residential and non-residential construction activities. The impact of favorable changes in dealer inventories, as inventories decreased in the fourth quarter of 2016 and were about flat in the fourth quarter of 2017, also contributed to increased sales.
Sales in Asia/Pacific were higher as a result of an increase in end-user demand, primarily in China, stemming from increased building construction and infrastructure investment.
Sales increased in EAME primarily due to higher end-user demand for construction equipment, reflecting improved economic conditions across much of the region. Favorable price realization also contributed to increased sales.
Although construction activity remained weak in Latin America, sales were higher as end-user demand increased from low levels due to stabilizing economic conditions in several countries in the region.
Construction Industries’ profit was $838 million in the fourth quarter of 2017, compared with $334 million in the fourth quarter of 2016. The increase in profit was primarily due to higher sales volume, favorable price realization and variable manufacturing efficiencies, partially offset by unfavorable period costs and higher material costs, primarily for steel. The increase in period costs was due to higher short-term incentive compensation expense, targeted investments and higher manufacturing period costs to support increased production volumes.
CONSTRUCTION INDUSTRIES
(Millions of dollars)
Segment SalesFourth
Quarter 2016Sales
VolumePrice
Realization CurrencyFourth
Quarter 2017$
Change
Sales1 $3,589 $1,502 $146 $21 $5,258 $1,669 47 %
Sales by Geographic Region
Fourth Quarter 2017
Fourth Quarter 2016
$ Change
North America $2,346 $1,569 $777 50 %Latin America 392 264 128 48 %EAME 976 624 352 56 %Asia/Pacific 1,544 1,132 412 36 %
Total1 $5,258 $3,589 $1,669 47 %
Segment ProfitFourth
Quarter 2017Fourth
Quarter 2016$
ChangeSegment Profit $838 $334 $504 151 %
1 Does not include inter-segment sales of $37 million and $31 million in fourth quarter 2017 and 2016, respectively .
% Change
%Change
%Change
11
(more)
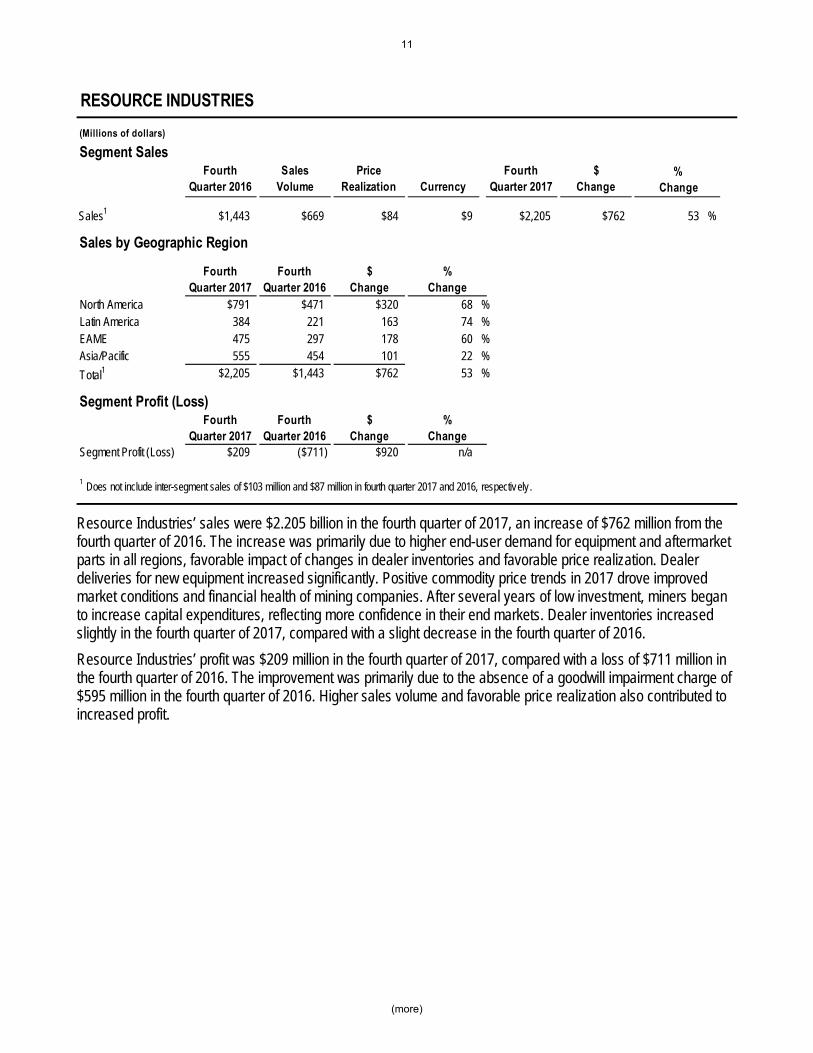
Resource Industries’ sales were $2.205 billion in the fourth quarter of 2017, an increase of $762 million from the fourth quarter of 2016. The increase was primarily due to higher end-user demand for equipment and aftermarket parts in all regions, favorable impact of changes in dealer inventories and favorable price realization. Dealer deliveries for new equipment increased significantly. Positive commodity price trends in 2017 drove improved market conditions and financial health of mining companies. After several years of low investment, miners began to increase capital expenditures, reflecting more confidence in their end markets. Dealer inventories increased slightly in the fourth quarter of 2017, compared with a slight decrease in the fourth quarter of 2016.
Resource Industries’ profit was $209 million in the fourth quarter of 2017, compared with a loss of $711 million in the fourth quarter of 2016. The improvement was primarily due to the absence of a goodwill impairment charge of $595 million in the fourth quarter of 2016. Higher sales volume and favorable price realization also contributed to increased profit.
RESOURCE INDUSTRIES
(Millions of dollars)
Segment SalesFourth
Quarter 2016Sales
VolumePrice
Realization CurrencyFourth
Quarter 2017$
Change
Sales1 $1,443 $669 $84 $9 $2,205 $762 53 %
Sales by Geographic Region
Fourth Quarter 2017
Fourth Quarter 2016
$ Change
North America $791 $471 $320 68 %Latin America 384 221 163 74 %EAME 475 297 178 60 %Asia/Pacific 555 454 101 22 %
Total1 $2,205 $1,443 $762 53 %
Segment Profit (Loss)Fourth
Quarter 2017Fourth
Quarter 2016$
ChangeSegment Profit (Loss) $209 ($711) $920 n/a
% Change
1 Does not include inter-segment sales of $103 million and $87 million in fourth quarter 2017 and 2016, respectively.
%Change
%Change

12
(more)
Energy & Transportation’s sales were $4.706 billion in the fourth quarter of 2017, compared with $3.849 billion in the fourth quarter of 2016. The increase was primarily due to higher sales volume across all applications.
Oil and Gas – Sales increased primarily due to higher demand for equipment used in gas compression and well servicing applications in North America.
Transportation – Sales were higher in North America for rail services, driven by increased rail traffic, and due to additional deliveries of freight locomotives.
Industrial – Sales were higher primarily in EAME due to increased demand for equipment used in electric power and agricultural end-user applications and aftermarket parts.
Power Generation – Sales increased in EAME primarily due to the timing of projects.
Energy & Transportation’s profit was $881 million in the fourth quarter of 2017, compared with $638 million in the fourth quarter of 2016. The increase was primarily due to higher sales volume, partially offset by higher period costs. The increase in period costs was primarily due to higher short-term incentive compensation expense, costs associated with higher production and targeted investments.
ENERGY & TRANSPORTATION
(Millions of dollars)
Segment SalesFourth
Quarter 2016Sales
VolumePrice
Realization CurrencyFourth
Quarter 2017$
Change
Sales1 $3,849 $808 ($17) $66 $4,706 $857 22 %
Sales by Geographic Region
Fourth Quarter 2017
Fourth Quarter 2016
$ Change
North America $2,327 $1,722 $605 35 %Latin America 374 347 27 8 %EAME 1,286 1,063 223 21 %Asia/Pacific 719 717 2 0 %
Total1 $4,706 $3,849 $857 22 %
Segment ProfitFourth
Quarter 2017Fourth
Quarter 2016$
ChangeSegment Profit $881 $638 $243 38 %
% Change
1 Does not include inter-segment sales of $934 million and $621 million in fourth quarter 2017 and 2016, respectively .
%Change
%Change

13
(more)
Financial Products’ segment revenues were $783 million in the fourth quarter of 2017, an increase of $41 million, or 6 percent, from the fourth quarter of 2016. The increase was primarily due to higher average financing rates in North America, higher average earning assets in EAME and Asia/Pacific and a favorable impact from intercompany lending activity in North America. These favorable impacts were partially offset by lower average financing rates in Asia/Pacific.
Financial Products’ segment profit was $233 million in the fourth quarter of 2017, compared with $149 million in the fourth quarter of 2016. The increase was primarily due to higher gains on sales of securities at Insurance Services and an increase in net yield on average earning assets.
At the end of 2017, past dues at Cat Financial were 2.78 percent, compared with 2.38 percent at the end of 2016. Write-offs, net of recoveries, were $114 million for the full year of 2017, compared with $123 million for the full year of 2016.
As of December 31, 2017, Cat Financial's allowance for credit losses totaled $365 million, or 1.33 percent of finance receivables, compared with $343 million, or 1.29 percent of finance receivables at year-end 2016.
Corporate Items and Eliminations
Expense for corporate items and eliminations was $898 million in the fourth quarter of 2017, a decrease of $683 million from the fourth quarter of 2016. Corporate items and eliminations include: restructuring costs; corporate-level expenses; timing differences, as some expenses are reported in segment profit on a cash basis; retirement benefit costs other than service cost; currency differences for ME&T, as segment profit is reported using annual fixed exchange rates; cost of sales methodology differences, as segments use a current cost methodology; and inter-segment eliminations.
The decrease in expense was primarily due to the favorable impact of lower mark-to-market losses related to pension and OPEB plans and lower restructuring costs, partially offset by methodology differences and higher short-term incentive compensation expense. Mark-to-market losses in the fourth quarter of 2017 were $301 million, compared to mark-to-market losses of $985 million in the fourth quarter of 2016.
FINANCIAL PRODUCTS SEGMENT
(Millions of dollars)
Revenues by Geographic RegionFourth
Quarter 2017Fourth
Quarter 2016$
ChangeNorth America $505 $464 $41 9 %Latin America 80 83 (3) (4) %EAME 107 99 8 8 %Asia/Pacific 91 96 (5) (5) %
Total $783 $742 $41 6 %
Segment ProfitFourth
Quarter 2017Fourth
Quarter 2016$
ChangeSegment Profit $233 $149 $84 56 %
%Change
%Change

14
(more)
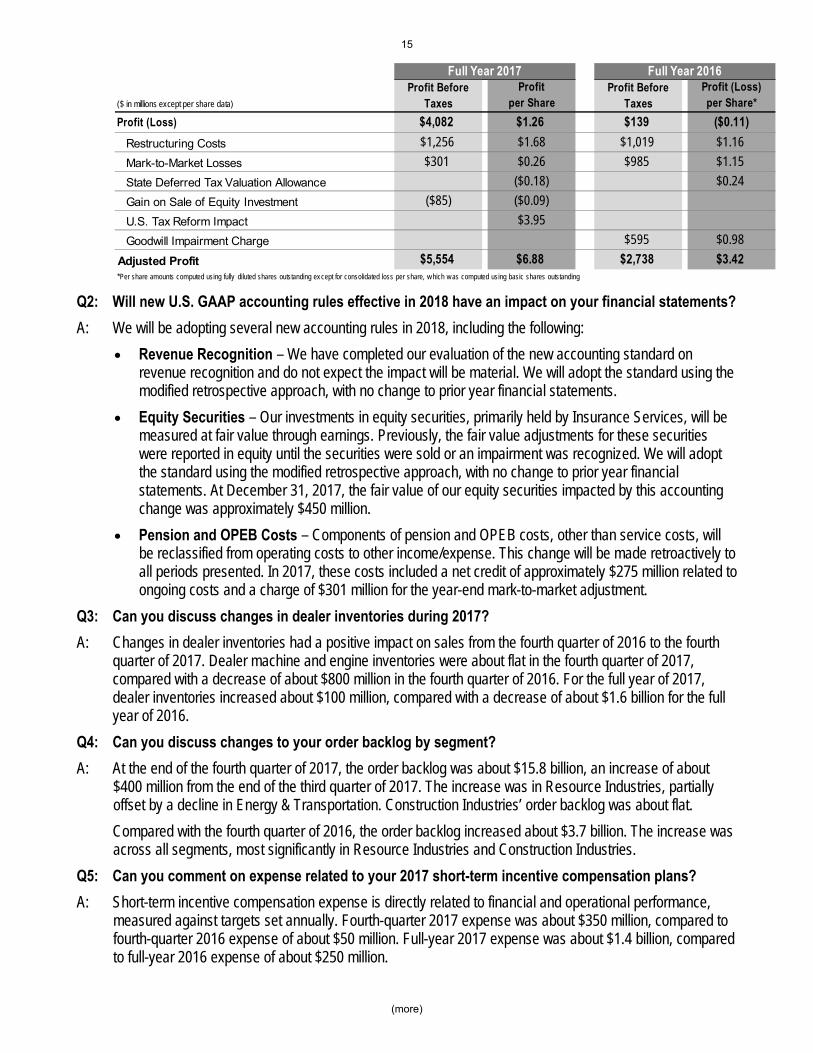
QUESTIONS AND ANSWERS Q1: Can you provide more information on the significant items impacting 2017 and 2016 profit?
A: In order for our results to be more meaningful to our readers, we have separately quantified the impact of several significant items.
Restructuring Costs – In recent years, we have incurred substantial restructuring costs to achieve a flexible and competitive cost structure. During 2017, we incurred $1.256 billion of restructuring costs with about half related to the closure of the facility in Gosselies, Belgium. During 2016, we incurred $1.019 billion of restructuring costs.
Mark-to-Market Losses – Effective January 1, 2016, we made a change in accounting principle related to our pension and OPEB plans. Under this accounting principle, we recognize actuarial gains and losses as a mark-to-market gain or loss when incurred rather than amortizing them to earnings over time. For 2017, the mark-to-market adjustment was a net loss of $301 million, primarily due to lower interest rates and a change in mortality assumptions, partially offset by better than expected returns on plan assets. For 2016, the mark-to-market adjustment was a net loss of $985 million, primarily due to lower interest rates.
State Deferred Tax Valuation Allowance – Based on improved profits in the United States, we reduced the valuation allowance against U.S. state deferred tax assets during the fourth quarter of 2017, resulting in a non-cash benefit of $111 million, net of U.S. federal tax at 35 percent. During the fourth quarter of 2016, the valuation allowance against U.S. state deferred tax assets was increased, resulting in a $141 million non-cash charge, net of U.S. federal tax at 35 percent.
Goodwill Impairment Charge – During the fourth quarter of 2016, we recognized a goodwill impairment charge of $595 million related to Resource Industries. No goodwill impairment charges were recognized during 2017.
U.S. Tax Reform – The fourth-quarter 2017 provision for income taxes includes a charge of $2.371 billion due to the enactment of U.S. tax reform legislation on December 22, 2017. The provisionally estimated charge includes a $596 million write-down of net deferred tax assets to reflect the reduction in the U.S. corporate tax rate from 35 percent to 21 percent, beginning January 1, 2018, with the remainder primarily related to the cost of a mandatory deemed repatriation of non-U.S. earnings. Management believes this charge is a reasonable estimate, as of January 18, 2018, that may change as additional required information is prepared and analyzed, interpretations and assumptions are refined, additional guidance is issued, and due to actions we may take as a result of the legislation.
To help improve the understanding of results for the quarter and the year, the following tables show the impact of these items:
Profit (Loss) Profit (Loss)($ in millions except per share data) per Share* per Share*
Profit (Loss) $1,111 ($2.18) ($1,348) ($2.00)
Restructuring Costs $245 $0.31 $395 $0.45
Mark-to-Market Losses $301 $0.26 $985 $1.14
State Deferred Tax Valuation Allowance ($0.18) $0.24
U.S. Tax Reform Impact $3.91
Goodwill Impairment Charge $595 $0.98
Adjusted Profit $1,657 $2.16 $627 $0.83
Fourth Quarter 2017 Fourth Quarter 2016Profit Before
TaxesProfit (Loss) Before Taxes
15
(more)
Q2: Will new U.S. GAAP accounting rules effective in 2018 have an impact on your financial statements?
A: We will be adopting several new accounting rules in 2018, including the following:
Revenue Recognition – We have completed our evaluation of the new accounting standard on revenue recognition and do not expect the impact will be material. We will adopt the standard using the modified retrospective approach, with no change to prior year financial statements.
Equity Securities – Our investments in equity securities, primarily held by Insurance Services, will be measured at fair value through earnings. Previously, the fair value adjustments for these securities were reported in equity until the securities were sold or an impairment was recognized. We will adopt the standard using the modified retrospective approach, with no change to prior year financial statements. At December 31, 2017, the fair value of our equity securities impacted by this accounting change was approximately $450 million.
Pension and OPEB Costs – Components of pension and OPEB costs, other than service costs, will be reclassified from operating costs to other income/expense. This change will be made retroactively to all periods presented. In 2017, these costs included a net credit of approximately $275 million related to ongoing costs and a charge of $301 million for the year-end mark-to-market adjustment.
Q3: Can you discuss changes in dealer inventories during 2017?
A: Changes in dealer inventories had a positive impact on sales from the fourth quarter of 2016 to the fourth quarter of 2017. Dealer machine and engine inventories were about flat in the fourth quarter of 2017, compared with a decrease of about $800 million in the fourth quarter of 2016. For the full year of 2017, dealer inventories increased about $100 million, compared with a decrease of about $1.6 billion for the full year of 2016.
Q4: Can you discuss changes to your order backlog by segment?
A: At the end of the fourth quarter of 2017, the order backlog was about $15.8 billion, an increase of about $400 million from the end of the third quarter of 2017. The increase was in Resource Industries, partially offset by a decline in Energy & Transportation. Construction Industries’ order backlog was about flat.
Compared with the fourth quarter of 2016, the order backlog increased about $3.7 billion. The increase was across all segments, most significantly in Resource Industries and Construction Industries.
Q5: Can you comment on expense related to your 2017 short-term incentive compensation plans?
A: Short-term incentive compensation expense is directly related to financial and operational performance, measured against targets set annually. Fourth-quarter 2017 expense was about $350 million, compared to fourth-quarter 2016 expense of about $50 million. Full-year 2017 expense was about $1.4 billion, compared to full-year 2016 expense of about $250 million.
Profit Profit (Loss)($ in millions except per share data) per Share per Share*
Profit (Loss) $4,082 $1.26 $139 ($0.11)
Restructuring Costs $1,256 $1.68 $1,019 $1.16
Mark-to-Market Losses $301 $0.26 $985 $1.15
State Deferred Tax Valuation Allowance ($0.18) $0.24
Gain on Sale of Equity Investment ($85) ($0.09)
U.S. Tax Reform Impact $3.95
Goodwill Impairment Charge $595 $0.98
Adjusted Profit $5,554 $6.88 $2,738 $3.42 *Per share amounts computed using fully diluted shares outstanding ex cept for consolidated loss per share, w hich w as computed using basic shares outstanding
Profit Before Taxes
Profit Before Taxes
Full Year 2017 Full Year 2016

16
(more)
Q6: Full-year 2017 sales and revenues were up 18 percent, and the fourth quarter of 2017 was up 35 percent. Is this significant ramp in demand impacting availability and how is the company responding?
A: The sharp increase in demand in 2017, which followed four years of declining sales, led to ramp-up challenges for certain products due to supplier constraints. During 2017, the company worked with our global suppliers to respond to significant increases in demand. Despite improvements in material flows in the second half of 2017, parts and components constraints remain across some products, which could impact the company’s growth potential in 2018 as we continue to ramp up our global suppliers.
Q7: Can you comment on your balance sheet and cash priorities?
A: The ME&T debt-to-capital ratio was 36.7 percent at the end of 2017, compared with 41.0 percent at the end of 2016. The improvement was primarily due to lower debt of $1.2 billion, which included the early debt retirement of about $900 million due in December 2018.
Our cash and liquidity positions remain strong with an enterprise cash balance of $8.3 billion as of year-end 2017. ME&T operating cash flow for the full year of 2017 was $5.5 billion, compared with $3.9 billion in 2016. The increase was primarily due to higher profit offset partially by working capital impacts including increases in inventory during 2017. During the year, ME&T capital expenditures totaled $916 million. Funding for defined benefit pension plans was about $1.4 billion, including a $1.0 billion discretionary U.S. contribution completed in December 2017.
Our priorities for cash deployment have not changed. While our short-term priorities for the use of cash may vary from time to time as business needs and conditions dictate, our long-term cash deployment strategy is focused on the following priorities. Our top priority is to maintain a strong financial position in support of a Mid-A rating. Next, we intend to fund operational requirements and commitments. Then, we intend to fund priorities that profitably grow the company and return capital to shareholders through dividend growth and share repurchases.
17
(more)
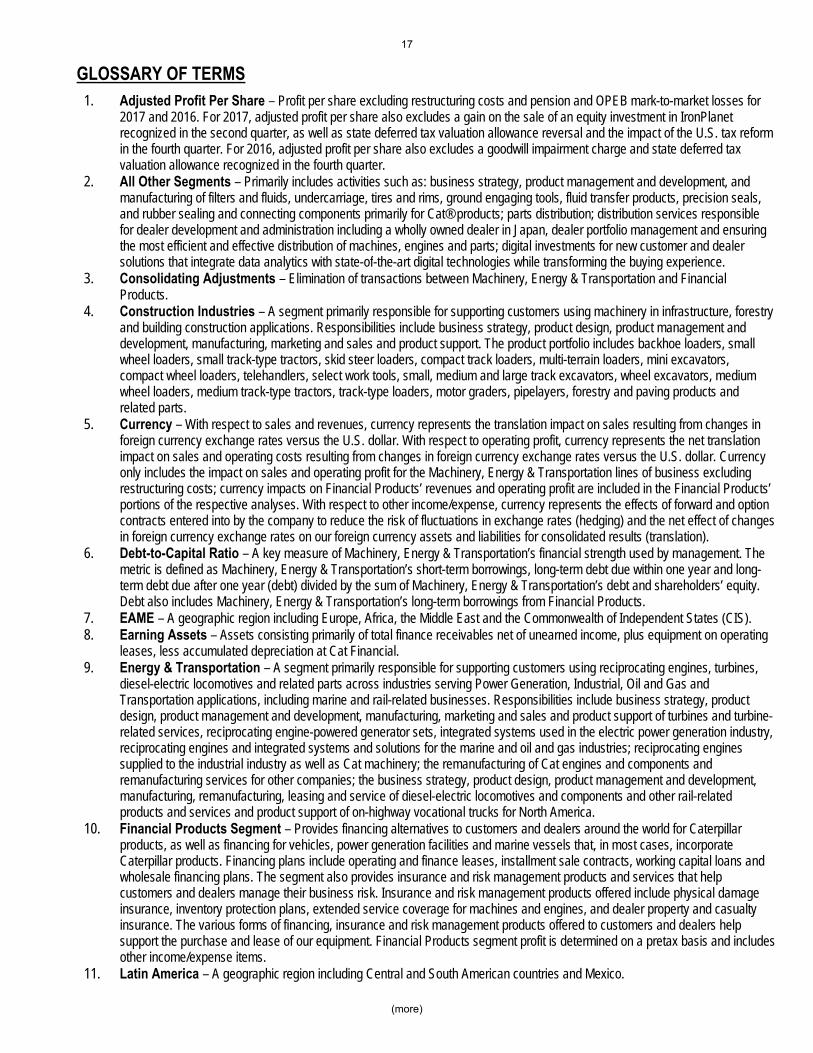
GLOSSARY OF TERMS
1. Adjusted Profit Per Share – Profit per share excluding restructuring costs and pension and OPEB mark-to-market losses for 2017 and 2016. For 2017, adjusted profit per share also excludes a gain on the sale of an equity investment in IronPlanet recognized in the second quarter, as well as state deferred tax valuation allowance reversal and the impact of the U.S. tax reform in the fourth quarter. For 2016, adjusted profit per share also excludes a goodwill impairment charge and state deferred tax valuation allowance recognized in the fourth quarter.
2. All Other Segments – Primarily includes activities such as: business strategy, product management and development, and manufacturing of filters and fluids, undercarriage, tires and rims, ground engaging tools, fluid transfer products, precision seals, and rubber sealing and connecting components primarily for Cat® products; parts distribution; distribution services responsible for dealer development and administration including a wholly owned dealer in Japan, dealer portfolio management and ensuring the most efficient and effective distribution of machines, engines and parts; digital investments for new customer and dealer solutions that integrate data analytics with state-of-the-art digital technologies while transforming the buying experience.
3. Consolidating Adjustments – Elimination of transactions between Machinery, Energy & Transportation and Financial Products.
4. Construction Industries – A segment primarily responsible for supporting customers using machinery in infrastructure, forestry and building construction applications. Responsibilities include business strategy, product design, product management and development, manufacturing, marketing and sales and product support. The product portfolio includes backhoe loaders, small wheel loaders, small track-type tractors, skid steer loaders, compact track loaders, multi-terrain loaders, mini excavators, compact wheel loaders, telehandlers, select work tools, small, medium and large track excavators, wheel excavators, medium wheel loaders, medium track-type tractors, track-type loaders, motor graders, pipelayers, forestry and paving products and related parts.
5. Currency – With respect to sales and revenues, currency represents the translation impact on sales resulting from changes in foreign currency exchange rates versus the U.S. dollar. With respect to operating profit, currency represents the net translation impact on sales and operating costs resulting from changes in foreign currency exchange rates versus the U.S. dollar. Currency only includes the impact on sales and operating profit for the Machinery, Energy & Transportation lines of business excluding restructuring costs; currency impacts on Financial Products’ revenues and operating profit are included in the Financial Products’ portions of the respective analyses. With respect to other income/expense, currency represents the effects of forward and option contracts entered into by the company to reduce the risk of fluctuations in exchange rates (hedging) and the net effect of changes in foreign currency exchange rates on our foreign currency assets and liabilities for consolidated results (translation).
6. Debt-to-Capital Ratio – A key measure of Machinery, Energy & Transportation’s financial strength used by management. The metric is defined as Machinery, Energy & Transportation’s short-term borrowings, long-term debt due within one year and long-term debt due after one year (debt) divided by the sum of Machinery, Energy & Transportation’s debt and shareholders’ equity. Debt also includes Machinery, Energy & Transportation’s long-term borrowings from Financial Products.
7. EAME – A geographic region including Europe, Africa, the Middle East and the Commonwealth of Independent States (CIS). 8. Earning Assets – Assets consisting primarily of total finance receivables net of unearned income, plus equipment on operating
leases, less accumulated depreciation at Cat Financial. 9. Energy & Transportation – A segment primarily responsible for supporting customers using reciprocating engines, turbines,
diesel-electric locomotives and related parts across industries serving Power Generation, Industrial, Oil and Gas and Transportation applications, including marine and rail-related businesses. Responsibilities include business strategy, product design, product management and development, manufacturing, marketing and sales and product support of turbines and turbine-related services, reciprocating engine-powered generator sets, integrated systems used in the electric power generation industry, reciprocating engines and integrated systems and solutions for the marine and oil and gas industries; reciprocating engines supplied to the industrial industry as well as Cat machinery; the remanufacturing of Cat engines and components and remanufacturing services for other companies; the business strategy, product design, product management and development, manufacturing, remanufacturing, leasing and service of diesel-electric locomotives and components and other rail-related products and services and product support of on-highway vocational trucks for North America.
10. Financial Products Segment – Provides financing alternatives to customers and dealers around the world for Caterpillar products, as well as financing for vehicles, power generation facilities and marine vessels that, in most cases, incorporate Caterpillar products. Financing plans include operating and finance leases, installment sale contracts, working capital loans and wholesale financing plans. The segment also provides insurance and risk management products and services that help customers and dealers manage their business risk. Insurance and risk management products offered include physical damage insurance, inventory protection plans, extended service coverage for machines and engines, and dealer property and casualty insurance. The various forms of financing, insurance and risk management products offered to customers and dealers help support the purchase and lease of our equipment. Financial Products segment profit is determined on a pretax basis and includes other income/expense items.
11. Latin America – A geographic region including Central and South American countries and Mexico.

18
(more)
12. Machinery, Energy & Transportation (ME&T) – Represents the aggregate total of Construction Industries, Resource Industries, Energy & Transportation and All Other Segments and related corporate items and eliminations.
13. Machinery, Energy & Transportation Other Operating (Income) Expenses – Comprised primarily of gains/losses on disposal of long-lived assets, gains/losses on divestitures and legal settlements and accruals. Restructuring costs classified as other operating expenses on the Results of Operations are presented separately on the Operating Profit Comparison.
14. Mark-to-market (MTM) gains/losses – Represents the net gain or loss of actual results differing from our assumptions and the effects of changing assumptions for our defined benefit pension and OPEB plans. These gains and losses are immediately recognized through earnings upon the annual remeasurement in the fourth quarter, or on an interim basis as triggering events warrant remeasurement.
15. Pension and Other Postemployment Benefit (OPEB) – The company’s defined benefit pension and postretirement benefit plans.
16. Period Costs – Includes period manufacturing costs, ME&T selling, general and administrative (SG&A) and research and development (R&D) expenses excluding the impact of currency and exit-related costs that are included in restructuring costs (see definition below). Period manufacturing costs support production but are defined as generally not having a direct relationship to short-term changes in volume. Examples include machinery and equipment repair, depreciation on manufacturing assets, facility support, procurement, factory scheduling, manufacturing planning and operations management. SG&A and R&D costs are not linked to the production of goods or services and include marketing, legal and finance services and the development of new and significant improvements in products or processes.
17. Price Realization – The impact of net price changes excluding currency and new product introductions. Price realization includes geographic mix of sales, which is the impact of changes in the relative weighting of sales prices between geographic regions.
18. Resource Industries – A segment primarily responsible for supporting customers using machinery in mining, quarry and aggregates, waste and material handling applications. Responsibilities include business strategy, product design, product management and development, manufacturing, marketing and sales and product support. The product portfolio includes large track-type tractors, large mining trucks, hard rock vehicles, longwall miners, electric rope shovels, draglines, hydraulic shovels, rotary drills, large wheel loaders, off-highway trucks, articulated trucks, wheel tractor scrapers, wheel dozers, landfill compactors, soil compactors, hard rock continuous mining systems, select work tools, machinery components, electronics and control systems and related parts. In addition to equipment, Resource Industries also develops and sells technology products and services to provide customers fleet management, equipment management analytics and autonomous machine capabilities. Resource Industries also manages areas that provide services to other parts of the company, including integrated manufacturing and research and development, as well as global procurement.
19. Restructuring Costs – Primarily costs for employee separation, long-lived asset impairments and contract terminations. These costs are included in Other Operating (Income) Expenses. Restructuring costs also include other exit-related costs primarily for accelerated depreciation, inventory write-downs, equipment relocation and project management costs and also LIFO inventory decrement benefits from inventory liquidations at closed facilities (primarily included in Cost of goods sold).
20. Sales Volume – With respect to sales and revenues, sales volume represents the impact of changes in the quantities sold for Machinery, Energy & Transportation as well as the incremental revenue impact of new product introductions, including emissions-related product updates. With respect to operating profit, sales volume represents the impact of changes in the quantities sold for Machinery, Energy & Transportation combined with product mix as well as the net operating profit impact of new product introductions, including emissions-related product updates. Product mix represents the net operating profit impact of changes in the relative weighting of Machinery, Energy & Transportation sales with respect to total sales. The impact of sales volume on segment profit includes inter-segment sales.
21. Variable Manufacturing Costs – Represents volume-adjusted costs excluding the impact of currency and restructuring costs (see definition above). Variable manufacturing costs are defined as having a direct relationship with the volume of production. This includes material costs, direct labor and other costs that vary directly with production volume such as freight, power to operate machines and supplies that are consumed in the manufacturing process.

19
(more)
NON-GAAP FINANCIAL MEASURES
The following definitions are provided for the non-GAAP financial measures used in this report. These non-GAAP financial measures have no standardized meaning prescribed by U.S. GAAP and therefore are unlikely to be comparable to the calculation of similar measures for other companies. Management does not intend these items to be considered in isolation or as a substitute for the related GAAP measures.
Adjusted Profit
Caterpillar believes it is important to separately quantify the profit impact of several significant items in order for the company’s results to be meaningful to readers. These items consist of (i) restructuring costs, which are incurred in the current year to generate longer-term benefits, (ii) pension and OPEB mark-to-market losses resulting from plan remeasurements, (iii) state deferred tax valuation allowance (reversal), (iv) a gain on the sale of an equity investment, (v) U.S. tax reform impact and (vi) goodwill impairment charges. Caterpillar does not consider these items indicative of earnings from ongoing business activities and believes the non-GAAP measures will provide useful perspective on underlying business results and trends, and a means to assess period-over-period results.
Reconciliations of adjusted profit before taxes to the most directly comparable GAAP measure, consolidated profit (loss) before taxes, are as follows:
Reconciliations of adjusted profit per share to the most directly comparable GAAP measure, diluted profit per share, are as follows:
Machinery, Energy & Transportation
Caterpillar defines Machinery, Energy & Transportation as it is presented in the supplemental data as Caterpillar Inc. and its subsidiaries with Financial Products accounted for on the equity basis. Machinery, Energy & Transportation information relates to the design, manufacture and marketing of Caterpillar products. Financial Products’ information relates to the financing to customers and dealers for the purchase and lease of Caterpillar and other equipment. The nature of these businesses is different, especially with regard to the financial position and cash flow items. Caterpillar management utilizes this presentation internally to highlight these differences. The company also believes this presentation will assist readers in understanding Caterpillar’s business. Pages 21-
(millions of dollars) . 2016 . 2017 2016 . 2017
Profit (Loss) before taxes………………………………………………………… ($1,348) $1,111 $139 $4,082Restructuring costs………………………………………………………………… $395 $245 $1,019 $1,256Mark-to-market losses…………………………………………………………… $985 $301 $985 $301Gain on sale of equity investment………………………………………………… - - - ($85)Goodwill impairment……………………………………………………………… $595 - $595 -Adjusted profit before taxes…………….………………………………………… $627 $1,657 $2,738 $5,554
Fourth Quarter Full Year
Outlook
. 2016 . 2017 2016 . 2017 2018
Profit (Loss) per share…………………………………………………………… ($2.00) ($2.18) ($0.11) $1.26 $7.75-$8.75Per share restructuring costs1…………………………………………………… $0.45 $0.31 $1.16 $1.68 $0.50Per share mark-to-market losses2………………………………………………… $1.14 $0.26 $1.15 $0.26 -Per share state deferred tax valuation allowance (reversal)3………………… $0.24 ($0.18) $0.24 ($0.18) -Per share gain on sale of equity investment2…………………………………… - - - ($0.09) -Per share U.S. tax reform impact………………………………………………… - $3.91 - $3.95 -Per share goodwill impairment4…………………………………………………… $0.98 - $0.98 - -Adjusted profit per share…………….…………………………………………… $0.83 $2.16 $3.42 $6.88 $8.25-$9.25Per share amounts computed using fully diluted shares outstanding ex cept for consolidated loss per share, w hich w as computed using basic shares outstanding.
4Includes a $17 million tax benefit.
3Net of U.S. federal tax at 35 percent.
Fourth Quarter Full Year
2 At statutory tax rates prior to consideration of U.S. tax reform.
1At statutory tax rates. 2016 and 2017 are prior to consideration of U.S. tax reform. Full y ear 2017 also includes $15 million increase to prior y ear tax es related to non-U.S.
restructuring costs.

20
(more)
29 reconcile Machinery, Energy & Transportation with Financial Products on the equity basis to Caterpillar Inc. consolidated financial information.
Caterpillar's latest financial results and outlook are also available via:
Telephone: 800-228-7717 (Inside the United States and Canada) 858-764-9492 (Outside the United States and Canada)
Internet: http://www.caterpillar.com/en/investors.html
http://www.caterpillar.com/en/investors/quarterly-results.html (live broadcast/replays of quarterly conference call)
Caterpillar contact: Corrie Scott, 224-551-4133 (Office), 808-351-3865 (Mobile) or [email protected]
21
(more)
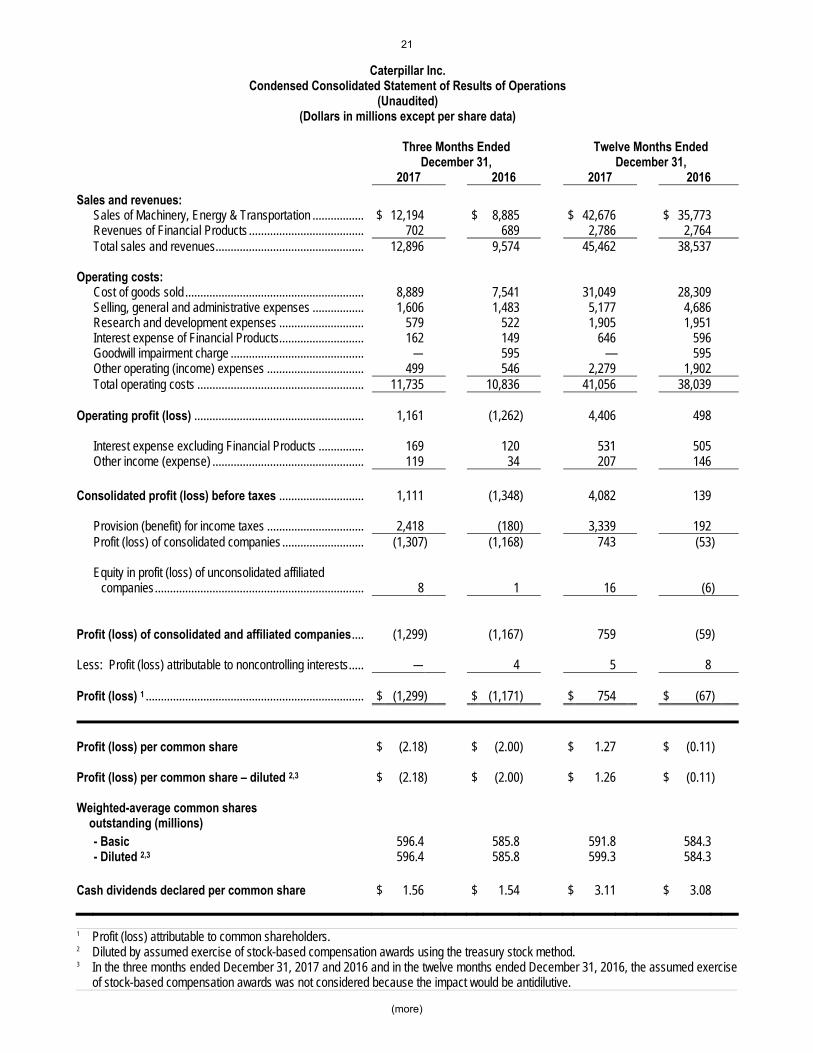
Caterpillar Inc. Condensed Consolidated Statement of Results of Operations
(Unaudited) (Dollars in millions except per share data)
Three Months Ended Twelve Months Ended December 31, December 31, 2017 2016 2017 2016
Sales and revenues: Sales of Machinery, Energy & Transportation ................. $ 12,194 $ 8,885 $ 42,676 $ 35,773 Revenues of Financial Products ...................................... 702 689 2,786 2,764 Total sales and revenues ................................................. 12,896 9,574 45,462 38,537 Operating costs: Cost of goods sold ........................................................... 8,889 7,541 31,049 28,309 Selling, general and administrative expenses ................. 1,606 1,483 5,177 4,686 Research and development expenses ............................ 579 522 1,905 1,951 Interest expense of Financial Products ............................ 162 149 646 596 Goodwill impairment charge ............................................ — 595 — 595 Other operating (income) expenses ................................ 499 546 2,279 1,902 Total operating costs ....................................................... 11,735 10,836 41,056 38,039 Operating profit (loss) ........................................................ 1,161 (1,262) 4,406 498 Interest expense excluding Financial Products ............... 169 120 531 505 Other income (expense) .................................................. 119 34 207 146 Consolidated profit (loss) before taxes ............................ 1,111 (1,348) 4,082 139 Provision (benefit) for income taxes ................................ 2,418 (180) 3,339 192 Profit (loss) of consolidated companies ........................... (1,307) (1,168) 743 (53 )
Equity in profit (loss) of unconsolidated affiliated
companies ..................................................................... 8 1 16 (6 )
Profit (loss) of consolidated and affiliated companies .... (1,299) (1,167) 759 (59 ) Less: Profit (loss) attributable to noncontrolling interests ..... — 4 5 8 Profit (loss) 1 ........................................................................ $ (1,299) $ (1,171) $ 754 $ (67 ) Profit (loss) per common share $ (2.18) $ (2.00) $ 1.27 $ (0.11 ) Profit (loss) per common share – diluted 2,3 $ (2.18) $ (2.00) $ 1.26 $ (0.11 ) Weighted-average common shares
outstanding (millions) - Basic 596.4 585.8 591.8 584.3 - Diluted 2,3 596.4 585.8 599.3 584.3 Cash dividends declared per common share $ 1.56 $ 1.54 $ 3.11 $ 3.08 1 Profit (loss) attributable to common shareholders. 2 Diluted by assumed exercise of stock-based compensation awards using the treasury stock method. 3 In the three months ended December 31, 2017 and 2016 and in the twelve months ended December 31, 2016, the assumed exercise
of stock-based compensation awards was not considered because the impact would be antidilutive.

22
(more)
Caterpillar Inc. Condensed Consolidated Statement of Financial Position
(Unaudited) (Millions of dollars)
December 31, December 31, 2017 2016 Assets Current assets: Cash and short-term investments ....................................................................... $ 8,261 $ 7,168 Receivables - trade and other ............................................................................. 7,436 5,981 Receivables - finance .......................................................................................... 8,757 8,522 Prepaid expenses and other current assets ....................................................... 1,772 1,682 Inventories .......................................................................................................... 10,018 8,614 Total current assets ..................................................................................................... 36,244 31,967 Property, plant and equipment – net ............................................................................ 14,155 15,322 Long-term receivables - trade and other ...................................................................... 990 1,029 Long-term receivables - finance................................................................................... 13,542 13,556 Noncurrent deferred and refundable income taxes...................................................... 1,693 2,790 Intangible assets .......................................................................................................... 2,111 2,349 Goodwill ....................................................................................................................... 6,200 6,020 Other assets ................................................................................................................ 2,027 1,671 Total assets ........................................................................................................................ $ 76,962 $ 74,704 Liabilities Current liabilities: Short-term borrowings: -- Machinery, Energy & Transportation ...................................................... $ 1 $ 209 -- Financial Products .................................................................................. 4,836 7,094 Accounts payable ................................................................................................ 6,487 4,614 Accrued expenses .............................................................................................. 3,220 3,003 Accrued wages, salaries and employee benefits ................................................ 2,559 1,296 Customer advances ............................................................................................ 1,193 1,167 Dividends payable ............................................................................................... 466 452 Other current liabilities ....................................................................................... 1,975 1,635 Long-term debt due within one year: -- Machinery, Energy & Transportation ...................................................... 6 507 -- Financial Products .................................................................................. 6,188 6,155 Total current liabilities .................................................................................................. 26,931 26,132 Long-term debt due after one year: -- Machinery, Energy & Transportation ...................................................... 7,929 8,436 -- Financial Products .................................................................................. 15,918 14,382 Liability for postemployment benefits ........................................................................... 8,365 9,357 Other liabilities ............................................................................................................. 4,053 3,184 Total liabilities .................................................................................................................... 63,196 61,491 Shareholders' equity Common stock ............................................................................................................. 5,593 5,277 . Treasury stock ............................................................................................................. (17,005) (17,478) Profit employed in the business ................................................................................... 26,301 27,377 Accumulated other comprehensive income (loss) ....................................................... (1,192) (2,039) Noncontrolling interests ............................................................................................... 69 76 Total shareholders' equity ................................................................................................. 13,766 13,213 Total liabilities and shareholders' equity ......................................................................... $ 76,962 $ 74,704
23
(more)
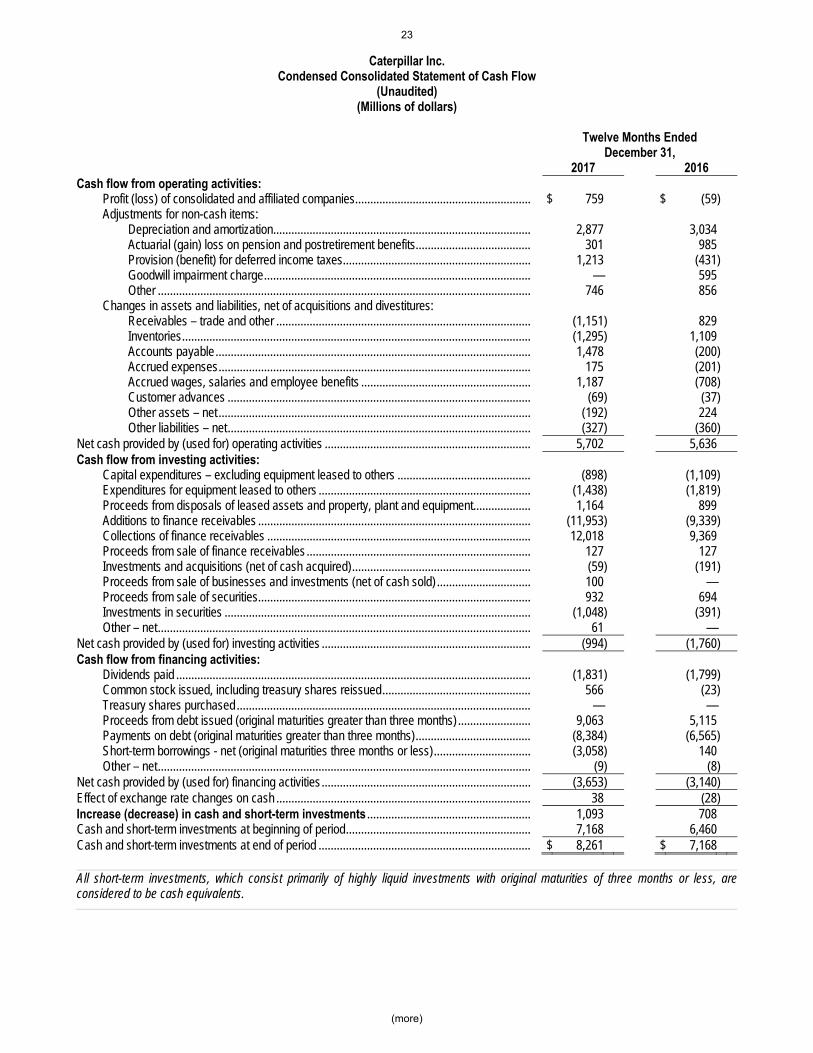
Caterpillar Inc. Condensed Consolidated Statement of Cash Flow
(Unaudited) (Millions of dollars)
Twelve Months Ended December 31, 2017 2016 Cash flow from operating activities: Profit (loss) of consolidated and affiliated companies .......................................................... $ 759 $ (59) Adjustments for non-cash items: Depreciation and amortization ..................................................................................... 2,877 3,034 Actuarial (gain) loss on pension and postretirement benefits ...................................... 301 985 Provision (benefit) for deferred income taxes .............................................................. 1,213 (431) Goodwill impairment charge ........................................................................................ — 595 Other ........................................................................................................................... 746 856 Changes in assets and liabilities, net of acquisitions and divestitures: Receivables – trade and other .................................................................................... (1,151) 829 Inventories ................................................................................................................... (1,295) 1,109 Accounts payable ........................................................................................................ 1,478 (200) Accrued expenses ....................................................................................................... 175 (201) Accrued wages, salaries and employee benefits ........................................................ 1,187 (708) Customer advances .................................................................................................... (69) (37) Other assets – net ....................................................................................................... (192) 224 Other liabilities – net .................................................................................................... (327) (360) Net cash provided by (used for) operating activities .................................................................... 5,702 5,636 Cash flow from investing activities: Capital expenditures – excluding equipment leased to others ............................................ (898) (1,109) Expenditures for equipment leased to others ...................................................................... (1,438) (1,819) Proceeds from disposals of leased assets and property, plant and equipment................... 1,164 899 Additions to finance receivables .......................................................................................... (11,953) (9,339) Collections of finance receivables ....................................................................................... 12,018 9,369 Proceeds from sale of finance receivables .......................................................................... 127 127 Investments and acquisitions (net of cash acquired) ........................................................... (59) (191) Proceeds from sale of businesses and investments (net of cash sold) ............................... 100 — Proceeds from sale of securities.......................................................................................... 932 694 Investments in securities ..................................................................................................... (1,048) (391) Other – net ........................................................................................................................... 61 — Net cash provided by (used for) investing activities ..................................................................... (994) (1,760) Cash flow from financing activities: Dividends paid ..................................................................................................................... (1,831) (1,799) Common stock issued, including treasury shares reissued ................................................. 566 (23) Treasury shares purchased ................................................................................................. — — Proceeds from debt issued (original maturities greater than three months) ........................ 9,063 5,115 Payments on debt (original maturities greater than three months) ...................................... (8,384) (6,565) Short-term borrowings - net (original maturities three months or less) ................................ (3,058) 140 Other – net ........................................................................................................................... (9) (8) Net cash provided by (used for) financing activities ..................................................................... (3,653) (3,140) Effect of exchange rate changes on cash .................................................................................... 38 (28) Increase (decrease) in cash and short-term investments ...................................................... 1,093 708 Cash and short-term investments at beginning of period ............................................................. 7,168 6,460 Cash and short-term investments at end of period ...................................................................... $ 8,261 $ 7,168 All short-term investments, which consist primarily of highly liquid investments with original maturities of three months or less, areconsidered to be cash equivalents.
24
(more)
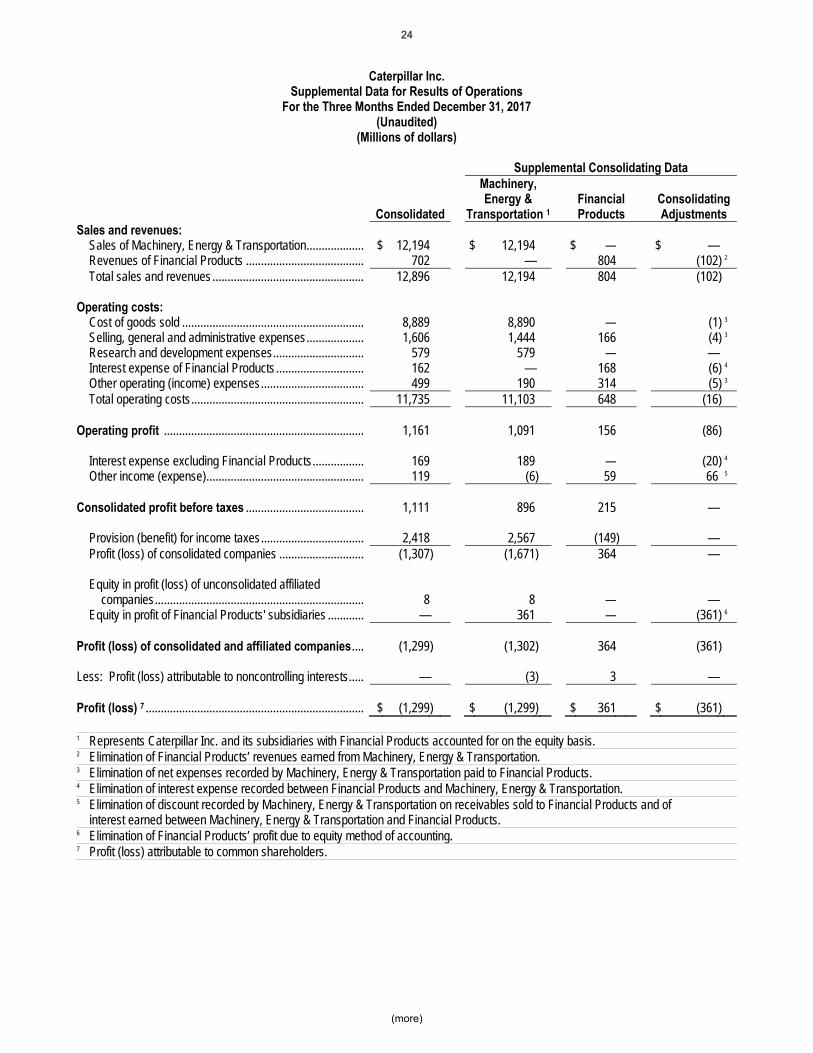
Caterpillar Inc.
Supplemental Data for Results of Operations For the Three Months Ended December 31, 2017
(Unaudited) (Millions of dollars)
Supplemental Consolidating Data Machinery,
Consolidated Energy &
Transportation 1 Financial Products
Consolidating Adjustments
Sales and revenues:
Sales of Machinery, Energy & Transportation ................... $ 12,194 $ 12,194 $ — $ —
Revenues of Financial Products ....................................... 702 — 804 (102) 2
Total sales and revenues .................................................. 12,896 12,194 804 (102)
Operating costs:
Cost of goods sold ............................................................ 8,889 8,890 — (1) 3
Selling, general and administrative expenses ................... 1,606 1,444 166 (4) 3
Research and development expenses .............................. 579 579 — —
Interest expense of Financial Products ............................. 162 — 168 (6) 4
Other operating (income) expenses .................................. 499 190 314 (5) 3
Total operating costs ......................................................... 11,735 11,103 648 (16)
Operating profit .................................................................. 1,161 1,091 156 (86)
Interest expense excluding Financial Products ................. 169 189 — (20) 4
Other income (expense) .................................................... 119 (6) 59 66 5
Consolidated profit before taxes ....................................... 1,111 896 215 —
Provision (benefit) for income taxes .................................. 2,418 2,567 (149) —
Profit (loss) of consolidated companies ............................ (1,307) (1,671) 364 —
Equity in profit (loss) of unconsolidated affiliated
companies ..................................................................... 8 8 — —
Equity in profit of Financial Products' subsidiaries ............ — 361 — (361) 6
Profit (loss) of consolidated and affiliated companies .... (1,299) (1,302) 364 (361)
Less: Profit (loss) attributable to noncontrolling interests ..... — (3) 3 —
Profit (loss) 7 ........................................................................ $ (1,299) $ (1,299) $ 361 $ (361)
1 Represents Caterpillar Inc. and its subsidiaries with Financial Products accounted for on the equity basis. 2 Elimination of Financial Products’ revenues earned from Machinery, Energy & Transportation. 3 Elimination of net expenses recorded by Machinery, Energy & Transportation paid to Financial Products. 4 Elimination of interest expense recorded between Financial Products and Machinery, Energy & Transportation. 5 Elimination of discount recorded by Machinery, Energy & Transportation on receivables sold to Financial Products and of
interest earned between Machinery, Energy & Transportation and Financial Products. 6 Elimination of Financial Products’ profit due to equity method of accounting. 7 Profit (loss) attributable to common shareholders.
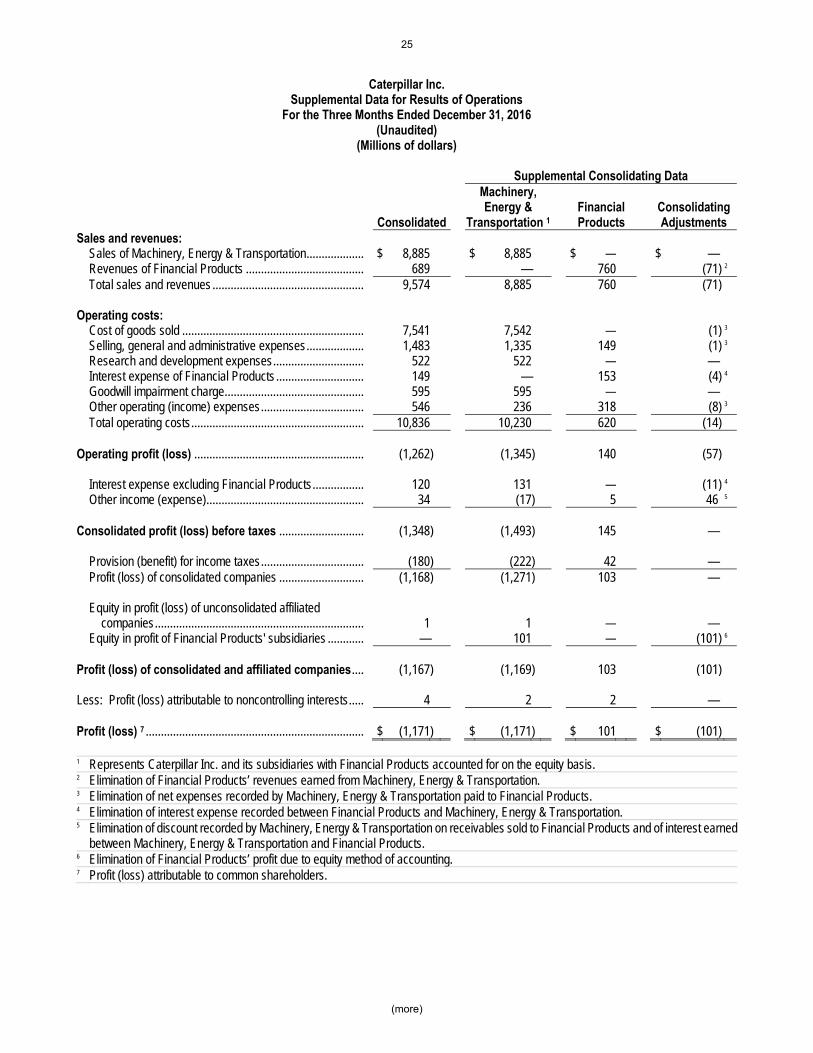
25
(more)
Caterpillar Inc. Supplemental Data for Results of Operations
For the Three Months Ended December 31, 2016 (Unaudited)
(Millions of dollars)
Supplemental Consolidating Data Machinery,
Consolidated Energy &
Transportation 1 Financial Products
Consolidating Adjustments
Sales and revenues:
Sales of Machinery, Energy & Transportation ................... $ 8,885 $ 8,885 $ — $ —
Revenues of Financial Products ....................................... 689 — 760 (71) 2
Total sales and revenues .................................................. 9,574 8,885 760 (71)
Operating costs:
Cost of goods sold ............................................................ 7,541 7,542 — (1) 3
Selling, general and administrative expenses ................... 1,483 1,335 149 (1) 3
Research and development expenses .............................. 522 522 — — Interest expense of Financial Products ............................. 149 — 153 (4) 4
Goodwill impairment charge .............................................. 595 595 — —
Other operating (income) expenses .................................. 546 236 318 (8) 3
Total operating costs ......................................................... 10,836 10,230 620 (14)
Operating profit (loss) ........................................................ (1,262) (1,345) 140 (57)
Interest expense excluding Financial Products ................. 120 131 — (11) 4
Other income (expense) .................................................... 34 (17) 5 46 5
Consolidated profit (loss) before taxes ............................ (1,348) (1,493) 145 —
Provision (benefit) for income taxes .................................. (180) (222) 42 —
Profit (loss) of consolidated companies ............................ (1,168) (1,271) 103 —
Equity in profit (loss) of unconsolidated affiliated
companies ..................................................................... 1 1 — —
Equity in profit of Financial Products' subsidiaries ............ — 101 — (101) 6
Profit (loss) of consolidated and affiliated companies .... (1,167) (1,169) 103 (101)
Less: Profit (loss) attributable to noncontrolling interests ..... 4 2 2 —
Profit (loss) 7 ........................................................................ $ (1,171) $ (1,171) $ 101 $ (101)
1 Represents Caterpillar Inc. and its subsidiaries with Financial Products accounted for on the equity basis. 2 Elimination of Financial Products’ revenues earned from Machinery, Energy & Transportation. 3 Elimination of net expenses recorded by Machinery, Energy & Transportation paid to Financial Products. 4 Elimination of interest expense recorded between Financial Products and Machinery, Energy & Transportation. 5 Elimination of discount recorded by Machinery, Energy & Transportation on receivables sold to Financial Products and of interest earned
between Machinery, Energy & Transportation and Financial Products. 6 Elimination of Financial Products’ profit due to equity method of accounting. 7 Profit (loss) attributable to common shareholders.

26
(more)
Caterpillar Inc. Supplemental Data for Results of Operations
For the Twelve Months Ended December 31, 2017 (Unaudited)
(Millions of dollars)
Supplemental Consolidating Data Machinery,
Consolidated Energy &
Transportation 1 Financial Products
Consolidating Adjustments
Sales and revenues:
Sales of Machinery, Energy & Transportation ................. $ 42,676 $ 42,676 $ — $ —
Revenues of Financial Products ...................................... 2,786 — 3,167 (381 ) 2
Total sales and revenues ................................................ 45,462 42,676 3,167 (381 )
Operating costs: Cost of goods sold ........................................................... 31,049 31,050 — (1 ) 3
Selling, general and administrative expenses ................. 5,177 4,589 604 (16 ) 3
Research and development expenses ............................ 1,905 1,905 — —
Interest expense of Financial Products ........................... 646 — 667 (21 ) 4
Other operating (income) expenses ................................ 2,279 1,080 1,220 (21 ) 3
Total operating costs ....................................................... 41,056 38,624 2,491 (59 )
Operating profit ................................................................... 4,406 4,052 676 (322 )
Interest expense excluding Financial Products ............... 531 622 — (91 ) 4
Other income (expense) .................................................. 207 (116) 92 231 5
Consolidated profit before taxes ....................................... 4,082 3,314 768 —
Provision (benefit) for income taxes ................................ 3,339 3,317 22 —
Profit (loss) of consolidated companies ........................... 743 (3) 746 —
Equity in profit (loss) of unconsolidated affiliated
companies ..................................................................... 16 16 — —
Equity in profit of Financial Products' subsidiaries .......... — 738 — (738 ) 6
Profit of consolidated and affiliated companies .............. 759 751 746 (738 ) Less: Profit (loss) attributable to noncontrolling interests..... 5 (3) 8 — Profit 7 .................................................................................. $ 754 $ 754 $ 738 $ (738 )
1 Represents Caterpillar Inc. and its subsidiaries with Financial Products accounted for on the equity basis. 2 Elimination of Financial Products’ revenues earned from Machinery, Energy & Transportation. 3 Elimination of net expenses recorded by Machinery, Energy & Transportation paid to Financial Products. 4 Elimination of interest expense recorded between Financial Products and Machinery, Energy & Transportation. 5 Elimination of discount recorded by Machinery, Energy & Transportation on receivables sold to Financial Products and of interest earned
between Machinery, Energy & Transportation and Financial Products. 6 Elimination of Financial Products’ profit due to equity method of accounting. 7 Profit attributable to common shareholders.

27
(more)
Caterpillar Inc. Supplemental Data for Results of Operations
For the Twelve Months Ended December 31, 2016 (Unaudited)
(Millions of dollars)
Supplemental Consolidating Data Machinery,
Consolidated Energy &
Transportation 1 Financial Products
Consolidating Adjustments
Sales and revenues:
Sales of Machinery, Energy & Transportation ................... $ 35,773 $ 35,773 $ — $ —
Revenues of Financial Products ....................................... 2,764 — 3,065 (301) 2
Total sales and revenues .................................................. 38,537 35,773 3,065 (301)
Operating costs:
Cost of goods sold ............................................................ 28,309 28,311 — (2) 3
Selling, general and administrative expenses ................... 4,686 4,129 573 (16) 3
Research and development expenses .............................. 1,951 1,951 — —
Interest expense of Financial Products ............................. 596 — 611 (15) 4
Goodwill impairment charge .............................................. 595 595 — —
Other operating (income) expenses .................................. 1,902 698 1,232 (28) 3
Total operating costs ......................................................... 38,039 35,684 2,416 (61)
Operating profit ................................................................... 498 89 649 (240)
Interest expense excluding Financial Products ................. 505 553 — (48) 4
Other income (expense) .................................................... 146 (89) 43 192 5
Consolidated profit (loss) before taxes ............................ 139 (553) 692 —
Provision (benefit) for income taxes .................................. 192 (24) 216 —
Profit (loss) of consolidated companies ............................ (53) (529) 476 —
Equity in profit (loss) of unconsolidated affiliated
companies ..................................................................... (6) (6) — —
Equity in profit of Financial Products' subsidiaries ............ — 470 — (470) 6
Profit (loss) of consolidated and affiliated companies .... (59) (65) 476 (470)
Less: Profit (loss) attributable to noncontrolling interests ..... 8 2 6 —
Profit (loss) 7 ........................................................................ $ (67) $ (67) $ 470 $ (470)
1 Represents Caterpillar Inc. and its subsidiaries with Financial Products accounted for on the equity basis. 2 Elimination of Financial Products’ revenues earned from Machinery, Energy & Transportation. 3 Elimination of net expenses recorded by Machinery, Energy & Transportation paid to Financial Products. 4 Elimination of interest expense recorded between Financial Products and Machinery, Energy & Transportation. 5 Elimination of discount recorded by Machinery, Energy & Transportation on receivables sold to Financial Products and of interest earned
between Machinery, Energy & Transportation and Financial Products. 6 Elimination of Financial Products’ profit due to equity method of accounting. 7 Profit (loss) attributable to common shareholders.
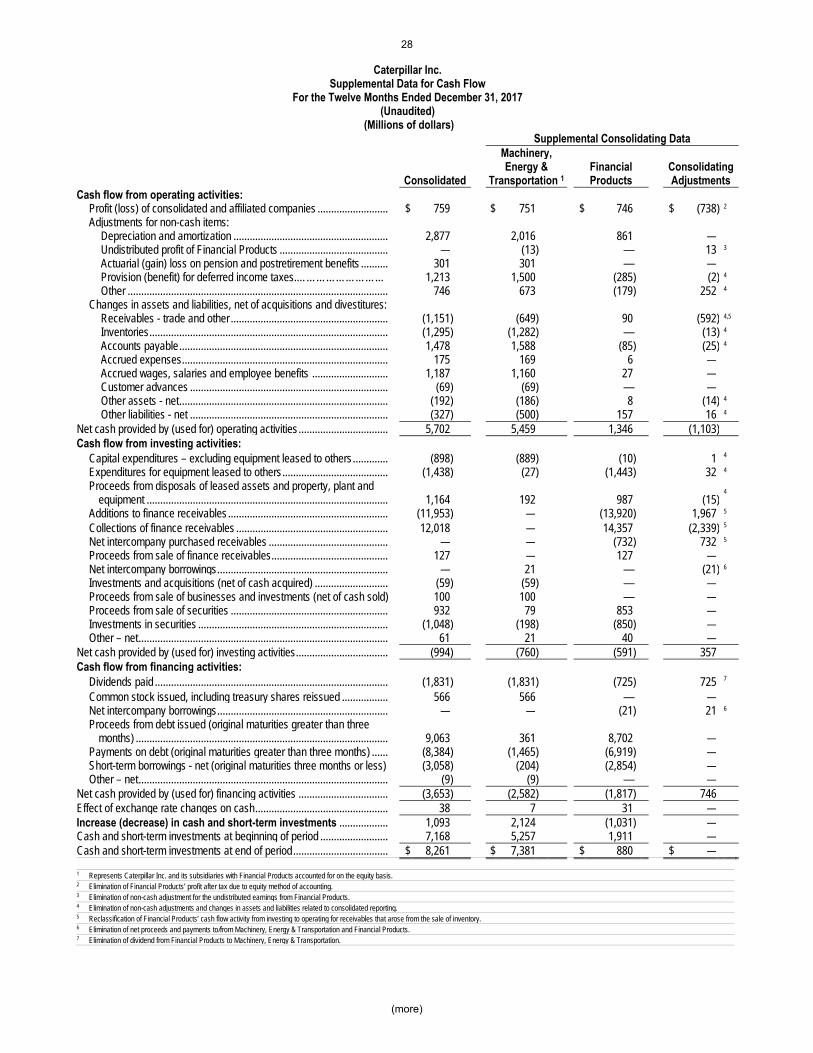
28
(more)
Caterpillar Inc. Supplemental Data for Cash Flow
For the Twelve Months Ended December 31, 2017 (Unaudited)
(Millions of dollars) Supplemental Consolidating Data Machinery,
Consolidated Energy &
Transportation 1 Financial Products
Consolidating Adjustments
Cash flow from operating activities:
Profit (loss) of consolidated and affiliated companies .......................... $ 759 $ 751 $ 746 $ (738) 2
Adjustments for non-cash items:
Depreciation and amortization ......................................................... 2,877 2,016 861 —
Undistributed profit of Financial Products ........................................ — (13) — 13 3
Actuarial (gain) loss on pension and postretirement benefits .......... 301 301 — —
Provision (benefit) for deferred income taxes.……………………… 1,213 1,500 (285) (2) 4
Other ................................................................................................ 746 673 (179) 252 4
Changes in assets and liabilities, net of acquisitions and divestitures:
Receivables - trade and other .......................................................... (1,151) (649) 90 (592) 4,5
Inventories ........................................................................................ (1,295) (1,282) — (13) 4
Accounts payable ............................................................................. 1,478 1,588 (85) (25) 4
Accrued expenses ............................................................................ 175 169 6 —
Accrued wages, salaries and employee benefits ............................ 1,187 1,160 27 —
Customer advances ......................................................................... (69) (69) — —
Other assets - net ............................................................................. (192) (186) 8 (14) 4
Other liabilities - net ......................................................................... (327) (500) 157 16 4
Net cash provided by (used for) operating activities ................................. 5,702 5,459 1,346 (1,103)
Cash flow from investing activities:
Capital expenditures – excluding equipment leased to others ............. (898) (889) (10) 1 4
Expenditures for equipment leased to others ....................................... (1,438) (27) (1,443) 32 4
Proceeds from disposals of leased assets and property, plant and
equipment ......................................................................................... 1,164 192 987 (15) 4
Additions to finance receivables ........................................................... (11,953) — (13,920) 1,967 5
Collections of finance receivables ........................................................ 12,018 — 14,357 (2,339) 5
Net intercompany purchased receivables ............................................ — — (732) 732 5
Proceeds from sale of finance receivables ........................................... 127 — 127 —
Net intercompany borrowings ............................................................... — 21 — (21) 6
Investments and acquisitions (net of cash acquired) ........................... (59) (59) — —
Proceeds from sale of businesses and investments (net of cash sold) 100 100 — —
Proceeds from sale of securities .......................................................... 932 79 853 —
Investments in securities ...................................................................... (1,048) (198) (850) —
Other – net ............................................................................................ 61 21 40 —
Net cash provided by (used for) investing activities .................................. (994) (760) (591) 357
Cash flow from financing activities:
Dividends paid ...................................................................................... (1,831) (1,831) (725) 725 7
Common stock issued, including treasury shares reissued ................. 566 566 — —
Net intercompany borrowings ............................................................... — — (21) 21 6
Proceeds from debt issued (original maturities greater than three
months) ............................................................................................. 9,063 361 8,702 —
Payments on debt (original maturities greater than three months) ...... (8,384) (1,465) (6,919) —
Short-term borrowings - net (original maturities three months or less) (3,058) (204) (2,854) —
Other – net ............................................................................................ (9) (9) — —
Net cash provided by (used for) financing activities ................................. (3,653) (2,582) (1,817) 746
Effect of exchange rate changes on cash ................................................. 38 7 31 —
Increase (decrease) in cash and short-term investments .................. 1,093 2,124 (1,031) —
Cash and short-term investments at beginning of period ......................... 7,168 5,257 1,911 —
Cash and short-term investments at end of period ................................... $ 8,261 $ 7,381 $ 880 $ —
1 Represents Caterpillar Inc. and its subsidiaries with Financial Products accounted for on the equity basis. 2 Elimination of Financial Products’ profit after tax due to equity method of accounting. 3 Elimination of non-cash adjustment for the undistributed earnings from Financial Products. 4 Elimination of non-cash adjustments and changes in assets and liabilities related to consolidated reporting. 5 Reclassification of Financial Products’ cash flow activity from investing to operating for receivables that arose from the sale of inventory. 6 Elimination of net proceeds and payments to/from Machinery, Energy & Transportation and Financial Products. 7 Elimination of dividend from Financial Products to Machinery, Energy & Transportation.

29
#
Caterpillar Inc. Supplemental Data for Cash Flow
For the Twelve Months Ended December 31, 2016 (Unaudited)
(Millions of dollars) Supplemental Consolidating Data Machinery,
Consolidated Energy &
Transportation 1 Financial Products
Consolidating Adjustments
Cash flow from operating activities:
Profit (loss) of consolidated and affiliated companies .......................... $ (59) $ (65) $ 476 $ (470) 2
Adjustments for non-cash items:
Depreciation and amortization ......................................................... 3,034 2,144 890 —
Actuarial (gain) loss on pension and postretirement benefits .......... 985 985 — —
Provision (benefit) for deferred income taxes.……………………… (431) (533) 111 (9) 4
Goodwill impairment charge…………………………………………… 595 595 — —
Other ................................................................................................ 856 687 (36) 205 4
Financial Products’ dividend in excess of profit .................................... — 162 — (162) 3
Changes in assets and liabilities, net of acquisitions and divestitures:
Receivables - trade and other .......................................................... 829 171 (34) 692 4,5
Inventories ........................................................................................ 1,109 1,113 — (4) 4
Accounts payable ............................................................................. (200) (168) 31 (63) 4
Accrued expenses ............................................................................ (201) (142) (59) —
Accrued wages, salaries and employee benefits ............................ (708) (693) (15) —
Customer advances ......................................................................... (37) (37) — —
Other assets - net ............................................................................. 224 77 145 2 4
Other liabilities - net ......................................................................... (360) (411) 44 7 4
Net cash provided by (used for) operating activities ................................. 5,636 3,885 1,553 198
Cash flow from investing activities:
Capital expenditures – excluding equipment leased to others ............. (1,109) (1,099) (11) 1 4
Expenditures for equipment leased to others ....................................... (1,819) (107) (1,760) 48 4
Proceeds from disposals of leased assets and property, plant and
equipment ......................................................................................... 899 125 805 (31) 4
Additions to finance receivables ........................................................... (9,339) — (11,862) 2,523 5
Collections of finance receivables ........................................................ 9,369 — 12,341 (2,972) 5
Net intercompany purchased receivables ............................................ — — 399 (399) 5
Proceeds from sale of finance receivables ........................................... 127 — 127 —
Net intercompany borrowings ............................................................... — (542) 1 541 6
Investments and acquisitions (net of cash acquired) ........................... (191) (191) — —
Proceeds from sale of securities .......................................................... 694 30 664 —
Investments in securities ...................................................................... (391) (24) (367) —
Other – net ............................................................................................ — 31 (38) 7 8
Net cash provided by (used for) investing activities .................................. (1,760) (1,777) 299 (282)
Cash flow from financing activities:
Dividends paid ...................................................................................... (1,799) (1,799) (632) 632 7
Common stock issued, including treasury shares reissued ................. (23) (23) 7 (7) 8
Net intercompany borrowings ............................................................... — (1) 542 (541) 6
Proceeds from debt issued (original maturities greater than three
months) ............................................................................................. 5,115 6 5,109 —
Payments on debt (original maturities greater than three months) ...... (6,565) (533) (6,032) —
Short-term borrowings - net (original maturities three months or less) 140 201 (61) —
Other – net ............................................................................................ (8) (8) — —
Net cash provided by (used for) financing activities ................................. (3,140) (2,157) (1,067) 84
Effect of exchange rate changes on cash ................................................. (28) (34) 6 —
Increase (decrease) in cash and short-term investments .................. 708 (83) 791 —
Cash and short-term investments at beginning of period ......................... 6,460 5,340 1,120 —
Cash and short-term investments at end of period ................................... $ 7,168 $ 5,257 $ 1,911 $ —
1 Represents Caterpillar Inc. and its subsidiaries with Financial Products accounted for on the equity basis. 2 Elimination of Financial Products’ profit after tax due to equity method of accounting. 3 Elimination of Financial Products’ dividend to Machinery, Energy & Transportation in excess of Financial Products’ profit. 4 Elimination of non-cash adjustments and changes in assets and liabilities related to consolidated reporting. 5 Reclassification of Financial Products’ cash flow activity from investing to operating for receivables that arose from the sale of inventory. 6 Elimination of net proceeds and payments to/from Machinery, Energy & Transportation and Financial Products. 7 Elimination of dividend from Financial Products to Machinery, Energy & Transportation. 8 Elimination of change in investment and common stock related to Financial Products.