Q3 Trading Update - cdn.ontex.com · Q3 Trading Update November 5 2015 . 37 50 114 128 202 237 81...
20
Q3 Trading Update November 5 2015
Transcript of Q3 Trading Update - cdn.ontex.com · Q3 Trading Update November 5 2015 . 37 50 114 128 202 237 81...

37
50
114
128
202
237
81
81
81
232
69
131
123
38
131
23
165
162
39
153
214
242
138
7
Q3 Trading Update
November 5 2015

37
50
114
128
202
237
81
81
81
232
69
131
123
38
131
23
165
162
39
153
214
242
138
7 2
Forward Looking Statements
This Presentation may include forward-looking statements. Forward-looking statements are statements regarding or based upon our management’s
current intentions, beliefs or expectations relating to, among other things, Ontex’s future results of operations, financial condition, liquidity, prospects,
growth, strategies or developments in the industry in which we operate. By their nature, forward-looking statements are subject to risks, uncertainties
and assumptions that could cause actual results or future events to differ materially from those expressed or implied thereby. These risks, uncertainties
and assumptions could adversely affect the outcome and financial effects of the plans and events described herein.
Forward-looking statements contained in this Presentation regarding trends or current activities should not be taken as a representation that such trends
or activities will continue in the future. We undertake no obligation to update or revise any forward-looking statements, whether as a result of new
information, future events or otherwise. You should not place undue reliance on any such forward-looking statements, which speak only as of the date of
this Presentation.

37
50
114
128
202
237
81
81
81
232
69
131
123
38
131
23
165
162
39
153
214
242
138
7
Ontex Highlights 04
3
Table of Contents
Trading Review 06
Outlook 15
Q&A 17
Appendix 18

37
50
114
128
202
237
81
81
81
232
69
131
123
38
131
23
165
162
39
153
214
242
138
7
Ontex Highlights

37
50
114
128
202
237
81
81
81
232
69
131
123
38
131
23
165
162
39
153
214
242
138
7
Trading in line with our expectations
Solid LFL revenue growth • Reported Group revenues of €415.9 million for Q3 2015 (€1,268.7 million for 9M)
• Q3 Reported revenue +4.4% (+5.0% in 9M)
• Q3 like-for-like (LFL) revenues1 +6.3% (+5.0 % in 9M)
• Top line performance confirms the strength of our portfolio
5
Further progress in executing our growth strategy,
FY outlook reiterated
Adjusted EBITDA2 margin preserved • Adjusted EBITDA +4.3% to €51.1 million in Q3 2015 (+9.1% to €161.0 million in 9M)
• Adverse currency impact of -€11.4 million in Q3 2015 (-€20.1 million in 9M)
• Adjusted EBITDA margin stable at 12.3% in Q3 2015 (+47 bps to 12.7% in 9M)
• Delivery of efficiency improvements mitigated the impact of FX headwinds
• Continued investing in sustainable, strong organization
Net leverage maintained below 2.5x • Net debt of €508.8 million at end of September 2015
• Net debt/LTM adjusted EBITDA of €209.5 million stood at 2.43x end of September 2015
• Working Capital and Capex in line with our expectations (in % of sales)
Note 1: LFL revenues are defined as revenues at constant currency excluding change in perimeter or M&A
Note 2: Adjusted EBITDA is a non-IFRS measure, defined as EBITDA plus non-recurring expenses and revenues excluding non-recurring depreciation and amortization and
has consistently been applied throughout reporting periods. EBITDA is a non-IFRS measure, defined as earnings before net finance cost, income taxes, depreciation and
amortization. Adjusted EBITDA margin is Adjusted EBITDA divided by revenue.
Net debt/ LTM
Adj. EBITDA
2.43x
Adj. EBITDA2
margin stable
LFL revenues1
+6.3%
Q3 2015
Ontex Highlights

37
50
114
128
202
237
81
81
81
232
69
131
123
38
131
23
165
162
39
153
214
242
138
7
Trading Review

37
50
114
128
202
237
81
81
81
232
69
131
123
38
131
23
165
162
39
153
214
242
138
7 7
Ontex growth model on track Leveraging the strengths of our balanced portfolio
Sales bridge 9M 2015 (€m)
LFL growth progression (%)
1,269
1,208
1,100
1,150
1,200
1,250
1,300
9M 2014 Volume Price/Mix FX 9M 2015
Group revenue review
• Like-for-like revenues up +6.3% in Q3 (+5.0% in 9M)
• Reported revenue up +4.4% in Q3 (+5.0% in 9M)
• Top line performance confirms strength of our portfolio of
geographies and categories
• Strong contribution coming from volume increases and
price/mix
• Following strong FX headwinds in Q3, FX impact for the first
nine months of 2015 is neutral
9.6
7.3
4.9
6.5
5.1 3.6
6.3
Q1 14 Q2 14 Q3 14 Q4 14 Q1 15 Q2 15 Q3 15
Medium-
term LFL
range
6.0%
4.0%
Trading Review

37
50
114
128
202
237
81
81
81
232
69
131
123
38
131
23
165
162
39
153
214
242
138
7
224.4 221.1
670.3 671.4
Q3 14 Q3 15 9M 14 9M 15
8
Mature Market Retail: 54% of Q3 Group Sales Maintaining pricing discipline in challenging conditions
Divisional review
• Decrease in LFL growth in Q3 2015 in the context of slower
market growth and more intense competition
• Q3 2015 revenue higher year on year in Poland and
Southern Europe, partly offsetting a decline in the UK and
Germany
• Continuing to further roll out product innovations and help
leading customers build their retail brands
• Positive currency impact largely due to the British Pound;
reported revenue growth of -0.4%
LFL Revenue (€m) and sales growth
-1.5%
+0.2%
Trading Review

37
50
114
128
202
237
81
81
81
232
69
131
123
38
131
23
165
162
39
153
214
242
138
7
30.7
49.8
90.2
134.8
Q3 14 Q3 15 9M 14 9M 15
9
Growth Markets: 10% of Q3 Group Sales Unique ability to adapt where we play
Divisional review
• Q3 2015 driven by increasing volumes in most markets,
especially in Russia and Central Eastern Europe
• In Russia, industry-wide price adjustments, implemented
earlier this year to offset FX negative impacts, contributed
positively to LFL growth
• Well positioned to support retailers looking to develop their
own retailers brands with high quality, innovative products
• Ability to adjust and tailor our offering to different retailers in
these markets is a unique Ontex strength
• Negative FX impact, mainly due to the Russian Rouble;
reported revenue growth +33.9%
LFL Revenue (€m) and sales growth
+62.2%
+49.5%
Trading Review

37
50
114
128
202
237
81
81
81
232
69
131
123
38
131
23
165
162
39
153
214
242
138
7
38.1 44.8
132.1
142.8
Q3 14 Q3 15 9M 14 9M 15
10
MENA: 10% of Q3 Group Sales
Broad-based growth despite FX headwinds
Divisional review
• MENA sales in Q3 are seasonally lower than the other
quarters
• Q3 2014 had lower revenue in some markets, making for a
softer comparable basis
• LFL growth was broad-based, with most markets generating
higher revenue versus the same period last year
• Ongoing efforts to strengthen our distribution network in
North Africa
• Negative currency impact, mainly due to the Turkish Lira ;
reported revenue growth +11.8%
LFL Revenue (€m) and sales growth
+17.6%
+8.1%
Trading Review

37
50
114
128
202
237
81
81
81
232
69
131
123
38
131
23
165
162
39
153
214
242
138
7
105.2 107.6
315.7 319.5
Q3 14 Q3 15 9M 14 9M 15
11
Healthcare: 26% of Q3 Group Sales
Home delivery driving solid top line performance
Divisional review
• Higher revenue in Italy driven by successful ongoing
developments in home delivery
• Australia and Benelux also had higher revenue this quarter
• With certain contracts being scaled down, as disclosed
previously, revenue in Germany was lower although with a
good performance in home delivery
• Positive FX impact mostly due to the British Pound; reported
revenue growth +3.4%
LFL Revenue (€m) and sales growth
+2.3%
+1.2%
Trading Review
37
50
114
128
202
237
81
81
81
232
69
131
123
38
131
23
165
162
39
153
214
242
138
7
8.4%
6.2%
6.9%
5.3%
-0.8% 0.0%
Q3 9M Q3 9M Q3 9M
Adult Inco Femcare Babycare
Q3
12
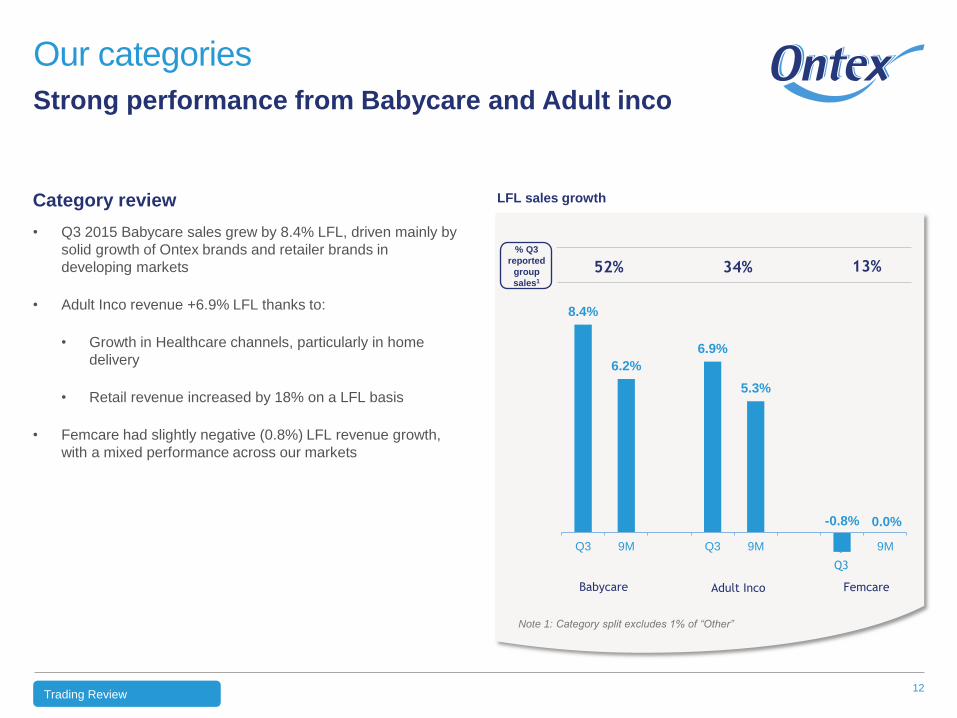
Our categories
Strong performance from Babycare and Adult inco
Category review
• Q3 2015 Babycare sales grew by 8.4% LFL, driven mainly by
solid growth of Ontex brands and retailer brands in
developing markets
• Adult Inco revenue +6.9% LFL thanks to:
• Growth in Healthcare channels, particularly in home
delivery
• Retail revenue increased by 18% on a LFL basis
• Femcare had slightly negative (0.8%) LFL revenue growth,
with a mixed performance across our markets
LFL sales growth
34% 13% 52%
% Q3
reported
group
sales1
Trading Review
Note 1: Category split excludes 1% of “Other”

37
50
114
128
202
237
81
81
81
232
69
131
123
38
131
23
165
162
39
153
214
242
138
7
Adjusted EBITDA Margin
Key margin drivers
Adjusted EBITDA margin stable in Q3 2015 at 12.3%; +47 bps in 9M 2015 to 12.7%
• FX headwinds intensified in Q3 2015
• As previously disclosed, strong positive impact of raw material prices seen in Q2 did not recur in Q3 2015
• Continued investment in line with our ambition to build a stronger consumer- and customer-focussed
organization
• These impacts were offset by our ongoing efficiency program
Negative foreign exchange impact on Adjusted EBITDA in Q3 and 9M 2015:
• Q3 2015: -€11.4 million (9M 2015: -€20.1 million) mainly due to the Russian Rouble and the US Dollar, partly
offset by the British Pound
13
Q3 2015 margin maintained through gains in efficiency
Trading Review

37
50
114
128
202
237
81
81
81
232
69
131
123
38
131
23
165
162
39
153
214
242
138
7
849.2
565.9 585.1
504.7 508.8
4.90x
2.98x 2.98x
2.43x 2.43x
0.00
1.00
2.00
3.00
4.00
5.00
6.00
100
200
300
400
500
600
700
800
900
FY 2013 H1 2014 FY 2014 H1 2015 Q3 2015
Net financial debt
Net financial debt/ LTM Adj EBITDA
31.12.13 (1) 30.06.14 (2) 31.12.14 30.06.15 30.09.15
14
Net debt and Liquidity
Net leverage maintained below 2.5x
Reported debt position and liquidity as of September 30, 2015 LFL Revenue (€m) and sales growth
Net Debt Calculation (€m)
Gross debt 644.5
Cash & cash equivalents (135.7)
Net debt 508.8
Leverage Calculation (€m)
Net debt 508.8
LTM Adjusted EBITDA 209.5
Net debt/LTM Adjusted EBITDA 2.43x
Liquidity (€m)
Cash & cash equivalents 135.7
Credit lines of €100.0m
(of which drawn: €0.0m) 100.0
Available liquidity 235.7 Note 1: Pre-IPO capital structure for Ontex I Group
Note 2: Pro-forma including IPO cost to be paid in July 2014
Trading Review

37
50
114
128
202
237
81
81
81
232
69
131
123
38
131
23
165
162
39
153
214
242
138
7
Outlook

37
50
114
128
202
237
81
81
81
232
69
131
123
38
131
23
165
162
39
153
214
242
138
7 16
Outlook
Strategic progress and priorities
• We continue to focus on delivery of the Ontex model, with growth of both the top and bottom line as
measured by revenue and Adjusted EBITDA margin.
• Our ability to generate revenue increases above an underlying market and category growth of 3% to 4%
continues, based upon developing retailer brands where relevant for customers and consumers, and
Ontex brands elsewhere.
• In spite of expected strong FX headwinds in Q4, we reiterate our FY 2015 outlook of about 30bps of
Adjusted EBITDA margin expansion.
Outlook

37
50
114
128
202
237
81
81
81
232
69
131
123
38
131
23
165
162
39
153
214
242
138
7
Q&A

37
50
114
128
202
237
81
81
81
232
69
131
123
38
131
23
165
162
39
153
214
242
138
7
Appendix

37
50
114
128
202
237
81
81
81
232
69
131
123
38
131
23
165
162
39
153
214
242
138
7 19
Performance overview for Q3 and 9M 2015
In millions of Euro Q3 2015 Q3 2014 % as
reported % LFL 9M 2015 9M 2014
% as
reported % LFL
Per Division
Mature markets retail 223.4 224.4 (0.4%) (1.5%) 684.3 670.3 2.1% 0.2%
Growth markets 41.1 30.7 33.9% 62.2% 114.7 90.1 27.2% 49.5%
Healthcare 108.8 105.2 3.4% 2.3% 324.1 315.7 2.7% 1.2%
MENA 42.6 38.1 11.8% 17.6% 145.6 132.1 10.2% 8.1%
Per Category
Babycare 215.3 204.0 5.5% 8.4% 671.8 632.8 6.2% 6.2%
Femcare 52.9 53.1 (0.4%) (0.8%) 154.5 153.2 0.8% 0.0%
Adult incontinence 142.3 134.7 5.6% 6.9% 424.7 403.7 5.2% 5.3%
Other (Traded goods) 5.4 6.6 (18.2%) (18.2%) 17.7 18.6 (4.8%) (4.2%)
Per Geographic Area
Western Europe 275.4 275.7 (0.1%) (1.7%) 834.9 834.9 0.0% (1.9%)
Eastern Europe 69.4 56.7 22.4% 38.4% 202.8 159.4 27.2% 40.0%
Rest of the world 71.1 66.0 7.7% 11.7% 231.0 214.0 7.9% 5.9%
Appendix
As previously disclosed in the FY 2014 report, following a review of the Group’s customers and countries, a slight modification to the 4 Divisions has been made for which revenue is reported, effective January 1 2015. A limited amount of
activities which represent in aggregate less than 2% of Group revenue have been re-assigned to the Growth Markets Division from Mature Market Retail, Middle East Africa (MEA) which becomes Middle East North Africa (MENA), and
Healthcare. Prior year information has been restated as a basis for comparison in future reporting. Refer to the FY 2014 report for further details.

37
50
114
128
202
237
81
81
81
232
69
131
123
38
131
23
165
162
39
153
214
242
138
7
Thank you