Q3 2019 Financial Statements - Liberty Mutual
24
Liberty Mutual Holding Company Inc. Third Quarter 2019 Consolidated Financial Statements
Transcript of Q3 2019 Financial Statements - Liberty Mutual

Liberty Mutual Holding Company Inc.
Third Quarter 2019
Consolidated Financial Statements

2019 2018 2019 2018
Revenues
Premiums earned 9,821$ 9,622$ 28,990$ 28,270$
Net investment income 630 627 1,995 1,970
Fee and other revenues 307 263 917 780
Net realized gains (losses) 81 (104) 393 (8)
Total revenues 10,839 10,408 32,295 31,012
Claims, Benefits and Expenses
Benefits, claims and claim adjustment expenses 7,259 6,744 20,641 19,516
Operating costs and expenses 1,726 1,806 5,311 5,330
Amortization of deferred policy acquisition costs 1,366 1,338 4,037 3,934
Interest expense 110 110 331 331
Interest credited to policyholders 10 16 28 40
Total claims, benefits and expenses 10,471 10,014 30,348 29,151
Loss on extinguishment of debt - (5) (49) (8)
Ironshore acquisition & integration costs (4) (7) (16) (31)
Restructuring costs (3) (26) (6) (57)
Unit linked life insurance (12) - (89) -
Income from continuing operations before income tax expense and non-controlling interest 349 356 1,787 1,765
Income tax expense 75 73 393 383
Consolidated net income from continuing operations 274 283 1,394 1,382
Discontinued operations (net of income tax benefit (expense) of $0, $0, $13 and $(166) for the
three and nine months ended September 30, 2019 and 2018, respectively) - - (50) 530
Consolidated net income 274 283 1,344 1,912
Less: Net income attributable to non-controlling interest - 1 - 1
Net income attributable to Liberty Mutual Holding Company Inc. 274$ 282$ 1,344$ 1,911$
Other-than-temporary impairment losses (23)$ (282)$ (131)$ (333)$
Other net realized gains 116 178 207 325
Valuation changes on equity investments, derivatives, other (12) - 317 -
Total net realized gains (losses) 81$ (104)$ 393$ (8)$
See accompanying notes to the unaudited consolidated financial statements.
Liberty Mutual Holding Company Inc.
Consolidated Statements of Income
(dollars in millions)
(Unaudited)
2019 2018 2019 2018
Three Months Ended
September 30,
Nine Months Ended
September 30,
111

2019 2018 2019 2018
Consolidated net income $ 274 $ 283 $ 1,344 $ 1,912
Other comprehensive income (loss), net of taxes:
Unrealized gains (losses) on securities 376 (190) 2,148 (2,042)
Reclassification adjustment for (gains)
and losses included in consolidated net income (133) 24 (262) 56
Foreign currency translation and other adjustments (64) 17 13 400
Other comprehensive income (loss), net of taxes 179 (149) 1,899 (1,586)
Comprehensive income 453$ 134$ 3,243$ 326$
See accompanying notes to the unaudited consolidated financial statements.
Liberty Mutual Holding Company Inc.
September 30, September 30,
Three Months Ended Nine Months Ended
(Unaudited)
(dollars in millions)
Consolidated Statements of Comprehensive Income
222
Liberty Mutual Holding Company Inc.
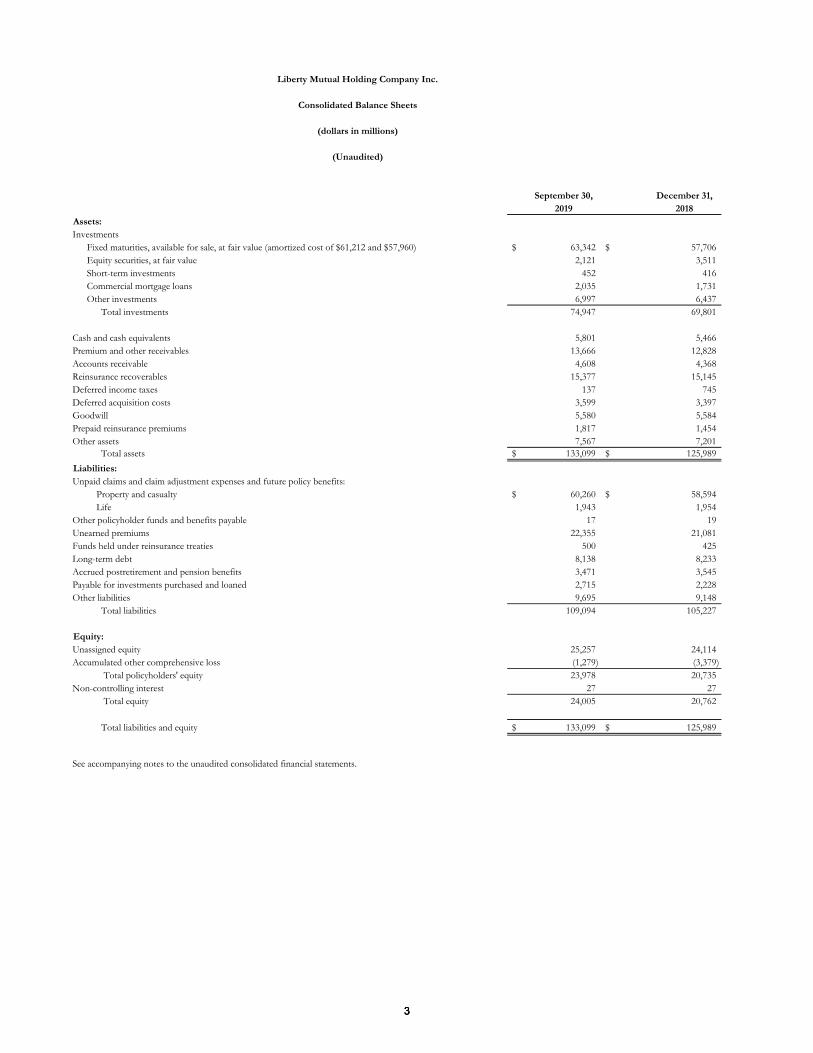
Consolidated Balance Sheets
(dollars in millions)
(Unaudited)
September 30, December 31,
2019 2018
Assets:
Investments
Fixed maturities, available for sale, at fair value (amortized cost of $61,212 and $57,960) $ 63,342 $ 57,706
Equity securities, at fair value 2,121 3,511
Short-term investments 452 416
Commercial mortgage loans 2,035 1,731
Other investments 6,997 6,437
Total investments 74,947 69,801
Cash and cash equivalents 5,801 5,466
Premium and other receivables 13,666 12,828
Accounts receivable 4,608 4,368
Reinsurance recoverables 15,377 15,145
Deferred income taxes 137 745
Deferred acquisition costs 3,599 3,397
Goodwill 5,580 5,584
Prepaid reinsurance premiums 1,817 1,454
Other assets 7,567 7,201
Total assets $ 133,099 $ 125,989
Liabilities:
Unpaid claims and claim adjustment expenses and future policy benefits:
Property and casualty $ 60,260 $ 58,594
Life 1,943 1,954
Other policyholder funds and benefits payable 17 19
Unearned premiums 22,355 21,081
Funds held under reinsurance treaties 500 425
Long-term debt 8,138 8,233
Accrued postretirement and pension benefits 3,471 3,545
Payable for investments purchased and loaned 2,715 2,228
Other liabilities 9,695 9,148
Total liabilities 109,094 105,227
Equity:
Unassigned equity 25,257 24,114
Accumulated other comprehensive loss (1,279) (3,379)
Total policyholders' equity 23,978 20,735
Non-controlling interest 27 27
Total equity 24,005 20,762
Total liabilities and equity $ 133,099 $ 125,989
See accompanying notes to the unaudited consolidated financial statements.
333

2019 2018
Balance at beginning of the year $ 20,762 $ 20,688
Comprehensive income:
Consolidated net income 1,344 1,912
Other comprehensive income (loss), net of taxes 1,899 (1,586)
Total comprehensive income 3,243 326
Balance at end of the period 24,005$ 21,014$
See accompanying notes to the unaudited consolidated financial statements.
September 30,
Liberty Mutual Holding Company Inc.
Consolidated Statements of Changes in Total Equity
(dollars in millions)
(Unaudited)
Nine Months Ended
444

2019 2018
Cash flows from operating activities:
Consolidated net income $ 1,344 $ 1,912
Less - (loss) income from Liberty Life Assurance Company of Boston, net of tax expense (50) 530
Income from operations excluding Liberty Life Assurance Company of Boston discontinued operations 1,394 1,382
Adjustments to reconcile consolidated net income to net cash
provided by operating activities:
Depreciation and amortization 602 631
Realized (gains) losses (393) 8
Undistributed private equity investment gains (478) (557)
Premium, other receivables, and reinsurance recoverables (2,087) (983)
Deferred acquisition costs (236) (237)
Liabilities for insurance reserves 4,047 2,226
Taxes payable, net of deferred 117 451
Pension plan contributions (85) -
Other, net 158 (509)
Total adjustments 1,645 1,030
Net cash provided by operating activities - excluding Liberty Life Assurance Company of Boston discontinued operations 3,039 2,412
Net cash provided by operating activities - Liberty Life Assurance Company of Boston discontinued operations - 227
Net cash provided by operating activities 3,039 2,639
Cash flows from investing activities:
Purchases of investments (52,243) (38,274)
Sales and maturities of investments 50,218 35,241
Property and equipment purchased, net (430) (1,036)
Cash (paid for) provided by acquisitions and disposals (6) 1,639
Other investing activities 378 394
Net cash used in investing activities - excluding Liberty Life Assurance Company of Boston discontinued operations (2,083) (2,036)
Net cash used in investing activities - Liberty Life Assurance Company of Boston discontinued operations - (529)
Net cash used in investing activities (2,083) (2,565)
Cash flows from financing activities:
Net activity in policyholder accounts (32) (5)
Debt financing, net (65) (29)
Net security lending activity and other financing activities (487) 301
Net cash (used in) provided by financing activities - excluding Liberty Life Assurance Company of Boston discontinued operations (584) 267
Net cash used in financing activities - Liberty Life Assurance Company of Boston discontinued operations - (496)
Net cash used in financing activities (584) (229)
Effect of exchange rate changes on cash - excluding Liberty Life Assurance Company of Boston discontinued operations (37) 33
Effect of exchange rate changes on cash - Liberty Life Assurance Company of Boston discontinued operations - -
Effect of exchange rate changes on cash (37) 33
Net increase in cash and cash equivalents - excluding Liberty Life Assurance Company of Boston discontinued operations 335 676
Net decrease in cash and cash equivalents - Liberty Life Assurance Company of Boston discontinued operations - (798)
Net increase (decrease) in cash and cash equivalents 335 (122)
Cash and cash equivalents, beginning of year - excluding Liberty Life Assurance Company of Boston discontinued operations 5,466 4,827
Cash and cash equivalents, beginning of year - Liberty Life Assurance Company of Boston discontinued operations - 798
Cash and cash equivalents, beginning of year 5,466 5,625
Cash and cash equivalents, end of period - excluding Liberty Life Assurance Company of Boston discontinued operations 5,801 5,503
Cash and cash equivalents, end of period - Liberty Life Assurance Company of Boston discontinued operations - -
Cash and cash equivalents, end of period $ 5,801 $ 5,503
See accompanying notes to the unaudited consolidated financial statements.
Nine Months Ended
September 30,
(Unaudited)
(dollars in millions)
Consolidated Statements of Cash Flows
Liberty Mutual Holding Company Inc.
555

Liberty Mutual Holding Company Inc.
Notes to Consolidated Financial Statements
(dollars in millions)
(Unaudited)
(1) SUMMARY OF SIGNIFICANT ACCOUNTING POLICIES
Basis of Presentation The accompanying consolidated financial statements include the accounts of Liberty Mutual Holding Company Inc., entities over which the Company exercises control including majority and wholly owned subsidiaries, and variable interest entities (“VIE”) when the Company is deemed the primary beneficiary (collectively “LMHC” or the “Company”). The minority ownership of consolidated affiliates is represented in equity as non-controlling interest. All material intercompany transactions and balances have been eliminated.
The accompanying consolidated financial statements have been prepared in conformity with U.S. generally accepted accounting principles (“GAAP”). The preparation of financial statements in conformity with GAAP requires management to make estimates and assumptions that affect the reported amounts of assets and liabilities and disclosure of contingent assets and liabilities at the date of the financial statements and the reported amounts of revenues and expenses during the reporting period. The Company’s principal estimates include (1) unpaid claims and claim adjustment expense reserves, including asbestos and environmental liability reserves and loss sensitive premium attributable to prior years, (2) reinsurance recoverables and associated uncollectible allowance, (3) fair value determination and other-than-temporary impairments of the investment portfolio and direct investments in natural resources, (4) recoverability of deferred acquisitioncosts, (5) valuation of goodwill and intangible assets, (6) deferred income tax valuation allowance, and (7) pension and postretirementbenefit obligations. While the amounts included in the consolidated financial statements reflect management’s best estimates andassumptions, these amounts ultimately could vary.
Adoption of Accounting Standards Effective January 1, 2019, the Company adopted the FASB issued ASU 2014-09, Revenue from Contracts with Customers (“ASU 2014-09”). ASU 2014-09 was issued to clarify the principles for recognizing revenue, however, insurance contracts and financial instrument transactions are not within the scope of this guidance. The Company’s principal activities affected by the standard are related to claims servicing contracts. The Company adopted ASU 2014-09 on a modified retrospective basis. The adoption did not impact net income, but included an increase to deferred revenue with a corresponding increase to deferred costs of $40.
Effective January 1, 2019, the Company adopted the FASB issued ASU 2016-01, Financial Instruments—Overall (Subtopic 825-10): Recognition and Measurement of Financial Assets and Financial Liabilities (“ASU 2016-01”). ASU 2016-01 requires equity investments (excluding those accounted for under the equity method or those that result in consolidation) to be measured at fair value, with changes in fair value recognized in net income. The Company adopted ASU 2016-01 on a modified retrospective basis. The adoption of this guidance resulted in the reclassification of $(201) of accumulated unrealized losses related to equity securities from accumulated other comprehensive loss to unassigned equity. The guidance eliminates the available-for-sale balance sheet classification for equity securities and changes in unrealized gains and losses on equity securities are recognized in the statements of income.
Effective January 1, 2019, the Company adopted the FASB issued ASU 2017-07, Compensation – Retirement Benefits (Topic 715): Improving the Presentation of Net Periodic Benefit Costs (“ASU 2017-07”) which amends the guidance to improve the presentation of net periodic pension cost and net periodic postretirement cost (net benefit costs). Net benefit costs comprise several components that reflect different aspects of an employer's financial arrangements as well as the cost of benefits provided to employees. ASU 2017-07 requires that the employer service cost component be reported in the same lines as other employee compensation cost and requires disclosure of the line used to present the other components (non-service costs), if not presented separately and outside of a subtotal of income from operations. ASU 2017-07 also allows only the service cost component to be eligible for capitalization in assets when applicable. The Company adopted the presentation components of ASU 2017-07 retrospectively, and the capitalization of the service cost component prospectively. The adoption did not have a material impact on the Company’s financial statements.
Accounting Standards Not Yet Adopted The Company will adopt the FASB issued ASU 2016-02, Leases (“ASU 2016-02”). The amendments will require a lessee to recognize a right-of-use asset and a lease liability on the balance sheet for leases with terms longer than 12 months. Leases will be classified as either finance or operating, with classification affecting the pattern of expense recognition in the statements of income. The amendments of ASU 2016-02 are effective for nonpublic business entities for fiscal years beginning after December 15, 2019, including interim periods within those fiscal years beginning after December 15, 2019. The Company is currently evaluating the impact of the adoption of ASU 2016-02. The adoption is expected to have a material impact on the Company’s financial statements.
The Company will adopt the FASB issued ASU 2016-13, Financial Instruments – Credit Losses (Topic 326): Measurement of Credit Losses on Financial Instruments (“ASU 2016-13”). ASU 2016-13 replaces the current incurred loss model with an expected credit loss model, which measures credit losses on financial instruments measured at amortized cost, and will require companies to recognize an allowance for expected credit losses. In addition, ASU 2016-13 also amends the credit loss measurement guidance for available-for-sale debt securities and beneficial interests in securitized financial assets. This amendment removes certain factors to consider when determining whether credit losses should be recognized and will require companies to recognize expected credit losses through an allowance. ASU 2016-13 is effective for nonpublic business entities for fiscal years, and interim periods within those fiscal years, beginning after December 15, 2021. The Company is currently
66

Liberty Mutual Holding Company Inc.
Notes to Consolidated Financial Statements
(dollars in millions)
(Unaudited)
evaluating the impact of the adoption of ASU 2016-13. The adoption is expected to have a material impact on the Company’s financial statements.
There are no other accounting standards not yet adopted by the Company that are expected to have a material impact on the consolidated financial statements.
Securities Lending The Company participates in a securities lending program to generate additional income, whereby certain domestic fixed maturity securities and equity securities are loaned for a short period of time from the Company’s portfolio to qualifying third parties via a lending agent. Terms of the agreement are for borrowers of these securities to provide collateral of at least 102% of the market value of the loaned securities. Acceptable collateral may be in the form of cash or permitted securities as outlined in the securities lending agreement. The market value of the loaned securities is monitored and additional collateral is obtained if the market value of the collateral falls below 102% of the market value of the loaned securities. Under the terms of the securities lending program, the lending agent indemnifies the Company against borrower defaults. The loaned securities remain a recorded asset of the Company; however, the Company records a liability for the amount of cash collateral held, representing its obligation to return the collateral related to the loaned securities.
Net Investment Hedge Instruments The Company has designated non-derivative foreign-currency denominated long-term debt and the related accrued interest as hedges of its net investment in certain foreign operations. Accordingly, the foreign currency translation of the debt instrument and accrued interest is recorded in accumulated other comprehensive loss, offsetting the foreign currency translation adjustment of the related net investment that is also recorded in accumulated other comprehensive loss. As of September 30, 2019, the Company had €1,750 million of outstanding long-term debt and approximately €20 million of accrued interest designated as non-derivative hedges of its net investment in certain foreign operations. As of September 30, 2019, the foreign currency translation of the debt instrument and accrued interest recorded in accumulated other comprehensive loss was $(62). (See Note 5 for further discussion.)
Accumulated Other Comprehensive Loss Accumulated other comprehensive loss consists principally of unrealized gains and losses on certain investments in debt securities, foreign currency translation adjustments, and pension and postretirement liability adjustments.
The components of accumulated other comprehensive loss excluding non-controlling interest, net of related deferred acquisition costs and taxes, are as follows:
September 30, 2019 December 31, 2018
Unrealized gains (losses) on securities(1) $1,273 $(814) Foreign currency translation and other adjustments (808) (745) Pension and post retirement liability funded status (1,744) (1,820)
Accumulated other comprehensive loss(1) $(1,279) $(3,379) (1) Components of accumulated other comprehensive loss consist of reclassification of unrealized losses related to equity securities fromaccumulated other comprehensive loss to unassigned equity.(See Note 1 for further discussion.)
The following tables present the consolidated other comprehensive income (loss) reclassification adjustments for the three and nine months ended September 30, 2019 and 2018, respectively.
Three months ended September 30, 2019
Unrealized gains on securities
Change in pension and
post retirement
plans funded status
Foreign currency
translation and other
adjustments Total Unrealized change arising during the period $492 $- $(74) $418
Less: Reclassification adjustments included in consolidated net income 168 (32) - 136 Total other comprehensive income (loss) before income tax expense 324 32 (74) 282Less: Income tax expense 81 7 15 103Total other comprehensive income (loss), net of income tax expense $243 $25 $(89) $179
77

Liberty Mutual Holding Company Inc.
Notes to Consolidated Financial Statements
(dollars in millions)
(Unaudited)
Three months ended September 30, 2018
Unrealized losses on securities
Change in pension and
post retirement
plans funded status
Foreign currency
translation and other
adjustments(1) Total Unrealized change arising during the period $(233) $5 $(10) $(238)
Less: Reclassification adjustments included in consolidated net income (31) (34) - (65)Total other comprehensive (loss) income before income tax (benefit) expense (202) 39 (10) (173)Less: Income tax (benefit) expense (36) 8 4 (24)Total other comprehensive (loss) income, net of income tax (benefit) expense $(166) $31 $(14) (149)
(1) Includes $(1) of non-controlling interest.
Nine months ended September 30, 2019
Unrealized gains on securities
Change in pension and
post retirement
plans funded status
Foreign currency
translation and other
adjustments Total Unrealized change arising during the period $2,743 - $(41) $2,702
Less: Reclassification adjustments included in consolidated net income 331 (96) - 235 Total other comprehensive income (loss) before income tax expense 2,412 96 (41) 2,467Less: Income tax expense 526 20 22 568Total other comprehensive income (loss), net of income tax expense $1,886 $76 $(63) $1,899
Nine months ended September 30, 2018 (1)
Unrealized losses on securities
Change in pension and
post retirement
plans funded status
Foreign currency
translation and other
adjustments(2) Total Unrealized change arising during the period $(2,568) 458 $(61) $(2,171)
Less: Reclassification adjustments included in consolidated net income (71) (127) - (198)Total other comprehensive (loss) income before income tax (benefit) expense (2,497) 585 (61) (1,973)Less: Income tax (benefit) expense (511) 123 1 (387)Total other comprehensive (loss) income, net of income tax (benefit) expense $(1,986) $462 $(62) $(1,586)
(1) Excludes $267 impact of the Act.(2) Includes $(1) of non-controlling interest.
(2) ACQUISITIONS AND DISPOSITIONS
ACQUISITIONS
AmTrust Financial Services On April 15, 2019, the Company entered into an agreement to acquire the global surety and credit reinsurance operations of AmTrust Financial Services, including AmTrust Surety, AmTrust Insurance Spain, Nationale Borg and Nationale Borg Reinsurance. The acquisition of the US Surety business closed on May 31, 2019. The remaining business subject to the agreement is subject to regulatory approval and customary closing conditions.
The Company recognized $47 of intangible assets and $45 of goodwill related to the US Surety business. For the nine months ended September 30, 2019 the Company recognized $5 of amortization expense which is reflected in insurance operating costs and expenses on the consolidated statements of income. Estimated amortization for the years ended December 31, 2019 through 2023 is $9, $8, $2, $2 and $2 respectively.
88

Liberty Mutual Holding Company Inc.
Notes to Consolidated Financial Statements
(dollars in millions)
(Unaudited)
DISPOSITIONS
Venezuela Operations On August 23, 2019 the Company completed the sale of the Venezuelan business, Seguros Caracas de Liberty Mutual, which was previously deconsolidated in 2015.
Pembroke Managing Agency Ltd., Visionary Underwriting Agency Ltd., and Ironshore Europe On March 14, 2019, the Company concluded a strategic review of certain operations and reached an agreement to sell its investment in Pembroke Managing Agency Ltd., Visionary Underwriting Agency Ltd., Ironshore Europe Designated Activity Company, and Ironshore Corporate Capital 3 Ltd. to Hamilton Insurance Group. The transaction closed on August 20, 2019. An immaterial loss has been recorded in realized gains which is reflected in the accompanying consolidated statements of income.
Liberty Sigorta A.S. On January 22, 2018, the Company’s Spanish subsidiary, Liberty Seguros Compania de Seguros y Reaseguros S.A., entered into an agreement to sell its entire 99.44% interest in its Turkish insurance affiliate, Liberty Sigorta A.S., to Talanx International. The transaction closed on May 3, 2018.
Liberty Life Assurance Company of Boston On January 19, 2018, the Company announced the sale of the Liberty Life Assurance Company of Boston (“LLAC”), which provides group disability, group life, individual life and annuity products, to Lincoln Financial Group. The transaction closed on May 1, 2018 resulting in a gain of approximately $412. Accordingly, for the nine months ended September 30, 2018, the results of LLAC have been classified as discontinued operations in the consolidated statements of income.
In connection with the Company’s May 2018 sale of LLAC to Lincoln Financial Group, the Company agreed, pursuant to the master transaction agreement, to indemnify Protective Life Corporation and Protective Life Insurance Company (together with certain of their respective affiliates, “Protective”), Lincoln and other parties against certain liabilities. In late 2018, Protective initiated informal discussions with the Company regarding potential indemnification claims (the “Initial Claims”) and in 2019 the Company began an investigation and evaluation of such Initial Claims. This investigation is ongoing. On April 30, 2019, Protective delivered to the Company a formal demand for indemnification related to the Initial Claims and in addition, demands for indemnification including matters unrelated to the Initial Claims (the “New Claims”). The Company is in the very early stages of investigating the New Claims and whether they have any merit or significant monetary value. Based on the Company’s investigation to date of the claims generally, the Company has accrued a reserve of $52, net of tax, in the first quarter of 2019 presented in discontinued operations in the consolidated statements of income, which is primarily related to the Initial Claims, and may be adjusted up or down as the Company’s investigation of all claims continues. The Company intends to vigorously defend all claims.
At this time, if the Initial Claims and all of the New Claims are ultimately determined to have merit and if the monetary value of those claims were equal to the amount alleged to be due, the aggregate potential liability represented by the claims would not have a material adverse effect on the financial condition of the Company, although such aggregate potential liability may be material relative to the Company’s results of operations for a single reporting period, depending on the facts and circumstances at such time.
In addition, the Company is engaged in the customary process of determining post-closing adjustments to the purchase price for LLAC, however, the final outcome of that process is not expected to materially change the $3,300 initial purchase price agreed in connection with the master transaction agreement.
99
Liberty Mutual Holding Company Inc.
Notes to Consolidated Financial Statements
(dollars in millions)
(Unaudited)
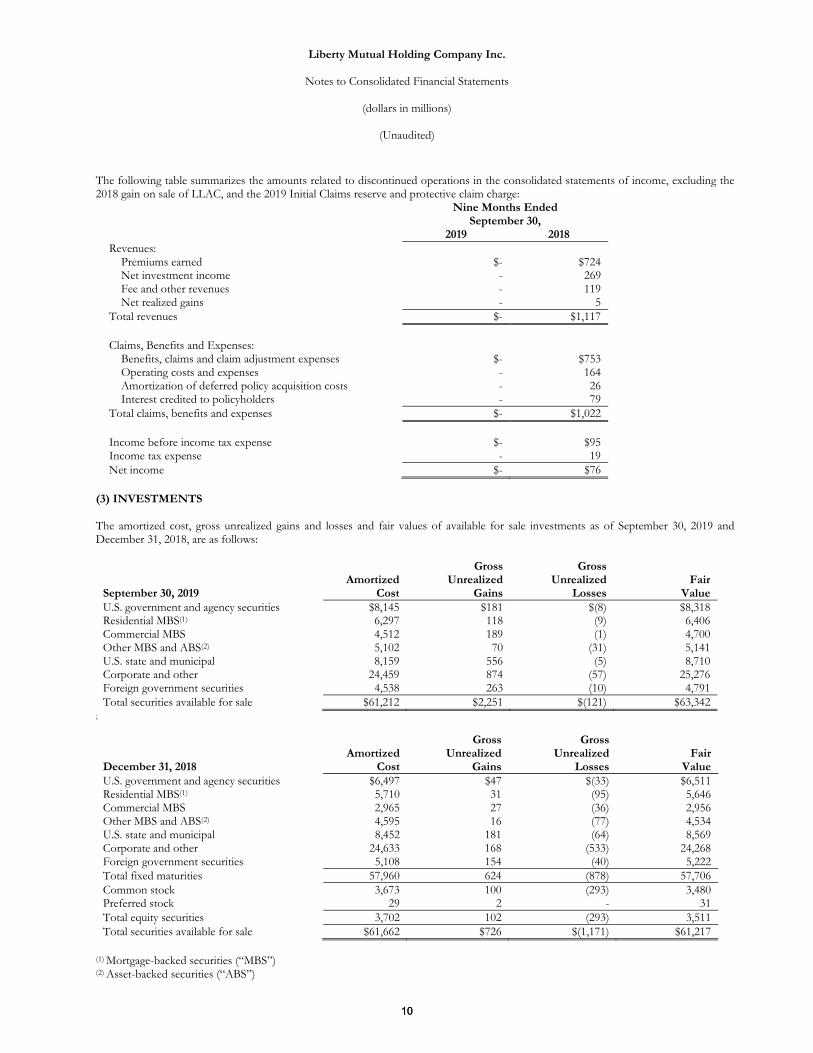
The following table summarizes the amounts related to discontinued operations in the consolidated statements of income, excluding the 2018 gain on sale of LLAC, and the 2019 Initial Claims reserve and protective claim charge:
Nine Months Ended September 30,
2019 2018Revenues:
Premiums earned $- $724 Net investment income - 269 Fee and other revenues - 119 Net realized gains - 5
Total revenues $- $1,117
Claims, Benefits and Expenses: Benefits, claims and claim adjustment expenses $- $753 Operating costs and expenses - 164 Amortization of deferred policy acquisition costs - 26 Interest credited to policyholders - 79
Total claims, benefits and expenses $- $1,022
Income before income tax expense $- $95 Income tax expense - 19Net income $- $76
(3) INVESTMENTS
The amortized cost, gross unrealized gains and losses and fair values of available for sale investments as of September 30, 2019 and December 31, 2018, are as follows:
September 30, 2019Amortized
Cost
Gross Unrealized
Gains
Gross Unrealized
Losses Fair
Value U.S. government and agency securities $8,145 $181 $(8) $8,318 Residential MBS(1) 6,297 118 (9) 6,406Commercial MBS 4,512 189 (1) 4,700Other MBS and ABS(2) 5,102 70 (31) 5,141U.S. state and municipal 8,159 556 (5) 8,710Corporate and other 24,459 874 (57) 25,276Foreign government securities 4,538 263 (10) 4,791Total securities available for sale $61,212 $2,251 $(121) $63,342
;
December 31, 2018Amortized
Cost
Gross Unrealized
Gains
Gross Unrealized
Losses Fair
Value U.S. government and agency securities $6,497 $47 $(33) $6,511 Residential MBS(1) 5,710 31 (95) 5,646Commercial MBS 2,965 27 (36) 2,956Other MBS and ABS(2) 4,595 16 (77) 4,534U.S. state and municipal 8,452 181 (64) 8,569Corporate and other 24,633 168 (533) 24,268Foreign government securities 5,108 154 (40) 5,222Total fixed maturities 57,960 624 (878) 57,706Common stock 3,673 100 (293) 3,480Preferred stock 29 2 - 31Total equity securities 3,702 102 (293) 3,511Total securities available for sale $61,662 $726 $(1,171) $61,217
(1) Mortgage-backed securities (“MBS”)(2) Asset-backed securities (“ABS”)
1010
Liberty Mutual Holding Company Inc.
Notes to Consolidated Financial Statements
(dollars in millions)
(Unaudited)
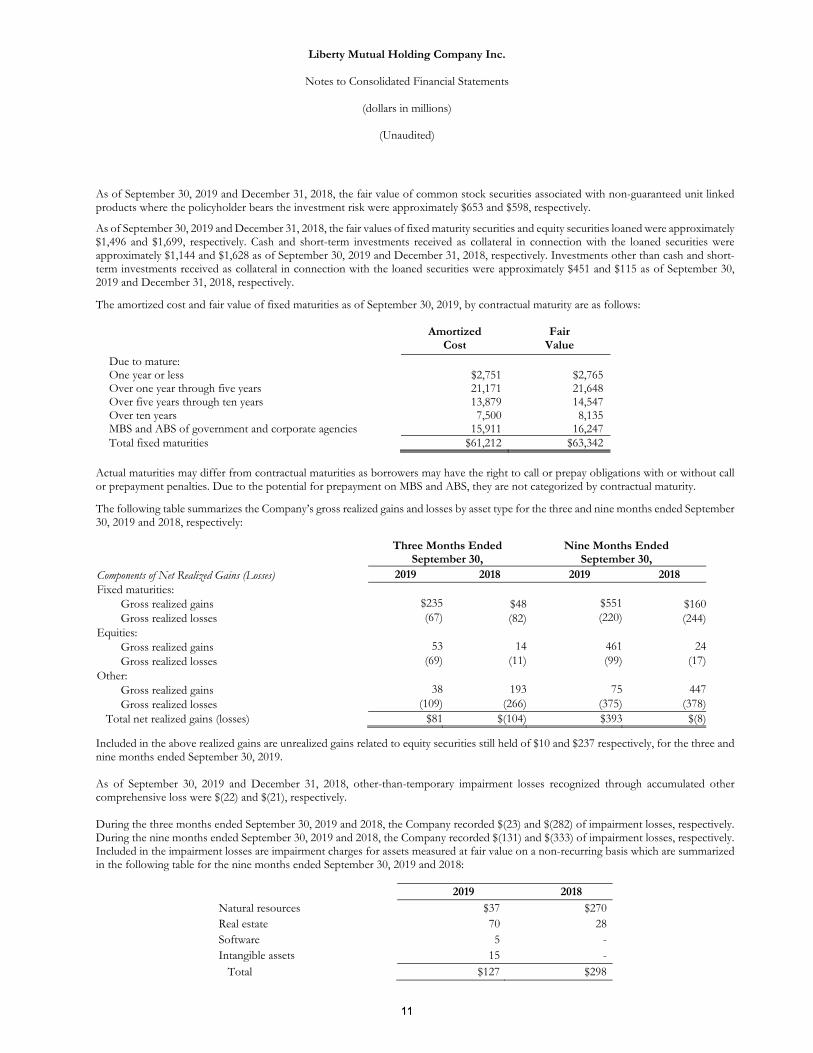
As of September 30, 2019 and December 31, 2018, the fair value of common stock securities associated with non-guaranteed unit linked products where the policyholder bears the investment risk were approximately $653 and $598, respectively.
As of September 30, 2019 and December 31, 2018, the fair values of fixed maturity securities and equity securities loaned were approximately $1,496 and $1,699, respectively. Cash and short-term investments received as collateral in connection with the loaned securities were approximately $1,144 and $1,628 as of September 30, 2019 and December 31, 2018, respectively. Investments other than cash and short-term investments received as collateral in connection with the loaned securities were approximately $451 and $115 as of September 30, 2019 and December 31, 2018, respectively.
The amortized cost and fair value of fixed maturities as of September 30, 2019, by contractual maturity are as follows:
Amortized Cost
Fair Value
Due to mature: One year or less $2,751 $2,765 Over one year through five years 21,171 21,648 Over five years through ten years 13,879 14,547 Over ten years 7,500 8,135 MBS and ABS of government and corporate agencies 15,911 16,247 Total fixed maturities $61,212 $63,342
Actual maturities may differ from contractual maturities as borrowers may have the right to call or prepay obligations with or without call or prepayment penalties. Due to the potential for prepayment on MBS and ABS, they are not categorized by contractual maturity.
The following table summarizes the Company’s gross realized gains and losses by asset type for the three and nine months ended September 30, 2019 and 2018, respectively:
Three Months Ended September 30,
Nine Months Ended September 30,
Components of Net Realized Gains (Losses) 2019 2018 2019 2018Fixed maturities:
Gross realized gains $235 $48 $551 $160Gross realized losses (67) (82) (220) (244)
Equities: Gross realized gains 53 14 461 24Gross realized losses (69) (11) (99) (17)
Other: Gross realized gains 38 193 75 447Gross realized losses (109) (266) (375) (378)
Total net realized gains (losses) $81 $(104) $393 $(8)
Included in the above realized gains are unrealized gains related to equity securities still held of $10 and $237 respectively, for the three and nine months ended September 30, 2019.
As of September 30, 2019 and December 31, 2018, other-than-temporary impairment losses recognized through accumulated other comprehensive loss were $(22) and $(21), respectively.
During the three months ended September 30, 2019 and 2018, the Company recorded $(23) and $(282) of impairment losses, respectively. During the nine months ended September 30, 2019 and 2018, the Company recorded $(131) and $(333) of impairment losses, respectively. Included in the impairment losses are impairment charges for assets measured at fair value on a non-recurring basis which are summarized in the following table for the nine months ended September 30, 2019 and 2018:
2019 2018
Natural resources $37 $270 Real estate 70 28 Software 5 -Intangible assets 15 - Total $127 $298
1111

Liberty Mutual Holding Company Inc.
Notes to Consolidated Financial Statements
(dollars in millions)
(Unaudited)
During the three months ended September 30, 2019 and 2018, proceeds from sales of fixed maturities available for sale were $12,190 and $9,385, respectively. The gross realized gains (losses) on sales of fixed maturities available for sale totaled $227 and $(60) in 2019 and $42 and $(54) in 2018. During the three months ended September 30, 2019 and 2018, proceeds from sales of equities at fair value were $1,057 and $427, respectively. The gross realized gains (losses) on sales of equities at fair value totaled $16 and $(27) in 2019 and $10 and $(8) in 2018.
During the nine months ended September 30, 2019 and 2018, proceeds from sales of fixed maturities available for sale were $41,567 and $27,202, respectively. The gross realized gains (losses) on sales of fixed maturities available for sale totaled $526 and $(205) in 2019 and $145 and $(201) in 2018. During the nine months ended September 30, 2019 and 2018, proceeds from sales of equities at fair value were $3,155 and $639, respectively. The gross realized gains (losses) on sales of equities at fair value totaled $97 and $(73) in 2019 and $20 and $(11) in 2018.
The following tables summarize the gross unrealized losses and fair value of available for sale investments by the length of time that individual securities have been in a continuous unrealized loss position as of September 30, 2019 and December 31, 2018, and that are not deemed to be other-than-temporarily impaired:
September 30, 2019 Less Than 12 Months 12 Months or Longer
Fair Value of Fair Value of
Investments with Investments with
Unrealized Unrealized Unrealized Unrealized
Losses Losses Losses Losses
U.S. government and agency securities $(7) $1,385 $(1) $243Residential MBS (6) 871 (3) 653 Commercial MBS (1) 96 - 87 Other MBS and ABS (21) 796 (10) 490 U.S. state and municipal (4) 531 (1) 14 Corporate and other (33) 1,790 (24) 830 Foreign government securities (9) 294 (1) 211Total Securities Available for Sale $(81) $5,763 $(40) $2,528
December 31, 2018 Less Than 12 Months 12 Months or Longer
Fair Value of Fair Value of Investments with Investments with
Unrealized Unrealized Unrealized UnrealizedLosses Losses Losses Losses
U.S. government and agency securities $(4) $827 $(29) $1,749Residential MBS (12) 738 (83) 3,187Commercial MBS (5) 374 (31) 1,369Other MBS and ABS (38) 1,812 (39) 1,555U.S. state and municipal (4) 472 (60) 2,567Corporate and other (293) 10,771 (240) 6,852Foreign government securities (16) 754 (24) 913Total fixed maturities (372) 15,748 (506) 18,192Common stock (232) 2,184 (61) 881Preferred stock - 4 - - Total equity securities (232) 2,188 (61) 881Total Securities Available for Sale $(604) $17,936 $(567) $19,073
Unrealized losses for fixed maturity securities decreased from $878 as of December 31, 2018 to $121 as of September 30, 2019. Unrealized losses less than 12 months for fixed maturity securities decreased from $372 at December 31, 2018 to $81 as of September 30, 2019. Unrealized losses 12 months or longer for fixed maturity securities decreased from $506 as of December 31, 2018 to $40 as of September 30, 2019. As of September 30, 2019, there were 829 securities that were in an unrealized loss position for 12 months or longer. The Company monitors the difference between the amortized cost and estimated fair value of fixed maturity securities to ascertain whether
1212

Liberty Mutual Holding Company Inc.
Notes to Consolidated Financial Statements
(dollars in millions)
(Unaudited)
declines in value are temporary in nature. The Company currently does not have the intent to sell these securities and has determined it is not more likely than not that it would be required to sell these fixed maturity securities before they recover their fair value.
If the Company believes a decline in the value (including foreign exchange rates) of a particular fixed maturity security is temporary, the decline is recorded as an unrealized loss in policyholders’ equity. If the decline is believed to be other-than-temporary, and the Company believes that it will not be able to collect all cash flows due on its fixed maturity securities, then the carrying value of the investment is written down to the expected cash flow amount and a realized loss is recorded as a credit impairment. A non-credit impairment loss is recognized in other comprehensive income, net of applicable taxes, as the difference between expected cash flows and fair value. The Company has concluded that the remaining gross unrealized losses of fixed maturity securities as of September 30, 2019 are temporary.
The Company reviews fixed maturity securities, equity securities and other investments for impairment on a quarterly basis. These investments are reviewed for both quantitative and qualitative considerations including, but not limited to: (a) the extent of the decline in fair value below book value, (b) the duration of the decline, (c) significant adverse changes in the financial condition or near term prospects of the investment or issuer, (d) significant change in the business climate or credit ratings of the issuer, (e) general market conditions and volatility, (f) industry factors, (g) the past impairment of the security holding or the issuer and (h) impact of foreign exchange rates on foreign currency denominated securities. For fixed maturity securities that the Company does not intend to sell or for which it is more likely than not that the Company would not be required to sell before an anticipated recovery in value, the Company separates impairments into credit loss and non-credit loss components. The determination of the credit loss component of the impairment charge is based on the Company’s best estimate of the present value of the cash flows expected to be collected from the fixed maturity security compared to its amortized cost and is reported as part of net realized gains. The non-credit component, the residual difference between the credit impairment component and the fair value, is recognized in other comprehensive income. The factors considered in making an evaluation for credit versus non-credit other-than-temporary impairment include the following: (a) failure of the issuer of the security to make scheduled interest or principal payments (including the payment structure of the fixed maturity security and the likelihood the issuer will be able to make payments that increase in the future), (b) performance indicators of the underlying assets in the security (including default and delinquency rates), (c) vintage, (d) geographic concentration and (e) industry analyst reports, sector credit ratings, and volatility of the security’s fair value. In addition, the Company’s accounting policy for other-than-temporary impairment recognition requires an other-than-temporary impairment charge be recorded when it is determined the security will be sold or it is more likely than not that the Company will be required to sell the security before recovery of the security’s amortized cost basis (all fixed maturity securities and certain preferred equity securities) or the Company does not have the intent and ability to hold certain equity securities for a period of time that is sufficient to allow for any anticipated recovery in fair value
The Company is required to review its natural resource and other equity method investments when facts and circumstances indicate that carrying values may not be recoverable. In performing a quarterly review, the fair value of the Company’s investment is estimated using indicators including, but not limited to, market comparables and analyses, commodity prices, and discounted cash flows and a realized loss is recognized for the excess, if any, of the investment’s carrying value over its estimated fair value.
The Company is required to review its oil and gas properties when facts and circumstances indicate that net book values may not be recoverable. In performing a quarterly review, an undiscounted cash flow test is performed at the lowest level for which identifiable cash flows are independent of cash flows from other assets. If the sum of the undiscounted future net cash flows is less than the net book value of the property, an impairment loss is recognized for the excess, if any, of the property’s net book value over its estimated fair value.
Variable Interest Entities The Company invests in limited partnerships and other entities subject to VIE analysis under the VIE subsections of ASC 810, Consolidation. The Company analyzes each investment to determine whether it is a VIE, and if so, whether the Company is the primary beneficiary or a significant interest holder based on a qualitative and quantitative assessment. The Company evaluates the design of the entity, the risks to which the entity was designed to expose the variable interest holder and the extent of the Company’s control of and variable interest in the VIE. As of September 30, 2019 and December 31, 2018, the Company has determined that it is not the primary beneficiary of any of its VIEs except for the Company’s investment in its India joint venture, which is deemed immaterial.
The Company has variable interests in VIEs for which it is not the primary beneficiary and accounts for these VIEs under the equity method in accordance with ASC 323, Investments-Equity Method and Joint Ventures. The VIEs are principally private equity limited partnerships in which the Company has invested as a passive limited partner. The partnerships were deemed to be VIEs because the equity holders as a group lack the power to direct the activities that most significantly impact the respective entity’s economic performance. The VIEs generate variability primarily from investment portfolio performance and that variability is passed to equity holders. The net carrying value of non-consolidated VIEs in which the Company has a variable interest was $5,893 and $5,394 as of September 30, 2019 and December 31, 2018, respectively, and the Company’s maximum exposure to loss was $8,468 and $7,689 as of September 30, 2019 and December 31, 2018, respectively. The assets are included in other investments on the accompanying consolidated balance sheets. Maximum exposure to loss includes the carrying value and unfunded commitment of the VIE. The increase in the maximum exposure to loss from December 31, 2018 to September 30, 2019 is primarily related to new commitments to VIEs related to private credit.
1313

Liberty Mutual Holding Company Inc.
Notes to Consolidated Financial Statements
(dollars in millions)
(Unaudited)
(4) REINSURANCE
In the ordinary course of business, the Company assumes reinsurance and also cedes reinsurance to other insurers to reduce overall risk, including exposure to large losses and catastrophic events. The Company is also a member of various involuntary pools and associations and serves as a servicing carrier for residual market organizations. The Company remains contingently liable in the event reinsurers are unable to meet their obligations for paid and unpaid reinsurance recoverables and unearned premiums ceded under reinsurance agreements.
The Company reported reinsurance recoverables of $15,377 and $15,145 as of September 30, 2019 and December 31, 2018, respectively, net of allowance for doubtful accounts of $123 and $204, respectively. Included in these balances are $965 and $937 of paid recoverables and $14,535 and $14,412 of unpaid recoverables (including retroactive reinsurance), respectively.
Amounts recoverable from reinsurers are estimated in a manner consistent with the claim liability associated with the reinsured business. The Company evaluates and monitors the financial condition of its reinsurers under voluntary reinsurance arrangements to minimize its exposure to significant losses from reinsurer insolvencies. The Company reports its reinsurance recoverables net of an allowance for estimated uncollectible reinsurance recoverables. The allowance is based upon the Company’s ongoing review of amounts outstanding, length of collection periods, changes in reinsurer credit standing and other relevant factors. Accordingly, the establishment of reinsurance recoverables and the related allowance for uncollectible reinsurance recoverables is also an inherently uncertain process involving estimates. Changes in these estimates could result in additional charges to the accompanying consolidated statements of income.
In conjunction with the Ironshore acquisition and effective May 1, 2017, the Company entered into a reinsurance transaction with National Indemnity Company (“NICO”), a subsidiary of Berkshire Hathaway Inc., on a combined aggregate excess of loss agreement providing coverage for substantially all of Ironshore’s reserves related to losses occurring prior to January 1, 2017. The first layer of the contract transfers $400 of held reserves at inception, for which the Company established reinsurance recoverables on the consolidated balance sheets. The second layer of the contract provides adverse development coverage for 95% of $500 above a retention equal to $2,991, minus paid losses between January 1, 2017 and May 1, 2017, which retention approximates the total held reserves on the covered business on Ironshore’s opening balance sheet. The Company paid NICO consideration of $550, including interest accrued at the time of the settlement. The contract is accounted for on a prospective basis.
On July 17, 2014, Liberty Mutual Insurance Company (“LMIC”) entered into a reinsurance transaction with NICO on a combined aggregate excess of loss agreement for substantially all of the Company’s U.S. workers compensation, asbestos and environmental liabilities (the “NICO Reinsurance Transaction”), attaching at $12,522 of combined aggregate reserves, with an aggregate limit of $6,500 and sublimits of $3,100 for asbestos and environmental liabilities and $4,507 for certain workers compensation liabilities. At the closing of the NICO Reinsurance Transaction, but effective as of January 1, 2014, the Company ceded $3,320 of existing undiscounted liabilities under this retroactive reinsurance agreement. NICO will provide $3,180 of additional aggregate adverse development reinsurance. The Company paid NICO total consideration of $3,046. With respect to the ceded asbestos and environmental business, NICO has been given authority to handle claims, subject to the Company’s oversight and control. With respect to the ceded workers compensation business, the Company will continue to handle claims. This contract is accounted for on a retroactive basis.
In general terms, the covered business includes post December 31, 2013 development on: (1) asbestos and environmental liabilities arising under policies of insurance and reinsurance with effective dates prior to January 1, 2005; and (2) workers compensation liabilities arising out of policies on the books of the Company’s former Commercial Insurance Strategic Business Unit as of December 31, 2013, as respects injuries or accidents occurring prior to January 1, 2014.
Since the NICO Reinsurance Transaction is accounted for as retroactive reinsurance in the Company’s consolidated financial statements, to the extent there is unfavorable development of losses covered by this reinsurance, an additional reinsurance benefit is recognized in the consolidated statements of income until those benefits exceed the loss on the transaction. Reinsurance benefits will be deferred and are amortized into earnings over the period when underlying claims are settled.
During 2018, the Company had net reserve releases driven by favorable development in workers compensation, partially offset by unfavorable development in asbestos and environmental. The Company reported the net position of the contract as a loss of $207 and $210 as of September 30, 2019 and December 31, 2018, respectively.
The Company reported deferred gain amortization of zero and ($35) at September 30, 2019 and 2018, respectively. As of September 30, 2019 and December 31, 2018, deferred gains were zero.
1414
Liberty Mutual Holding Company Inc.
Notes to Consolidated Financial Statements
(dollars in millions)
(Unaudited)
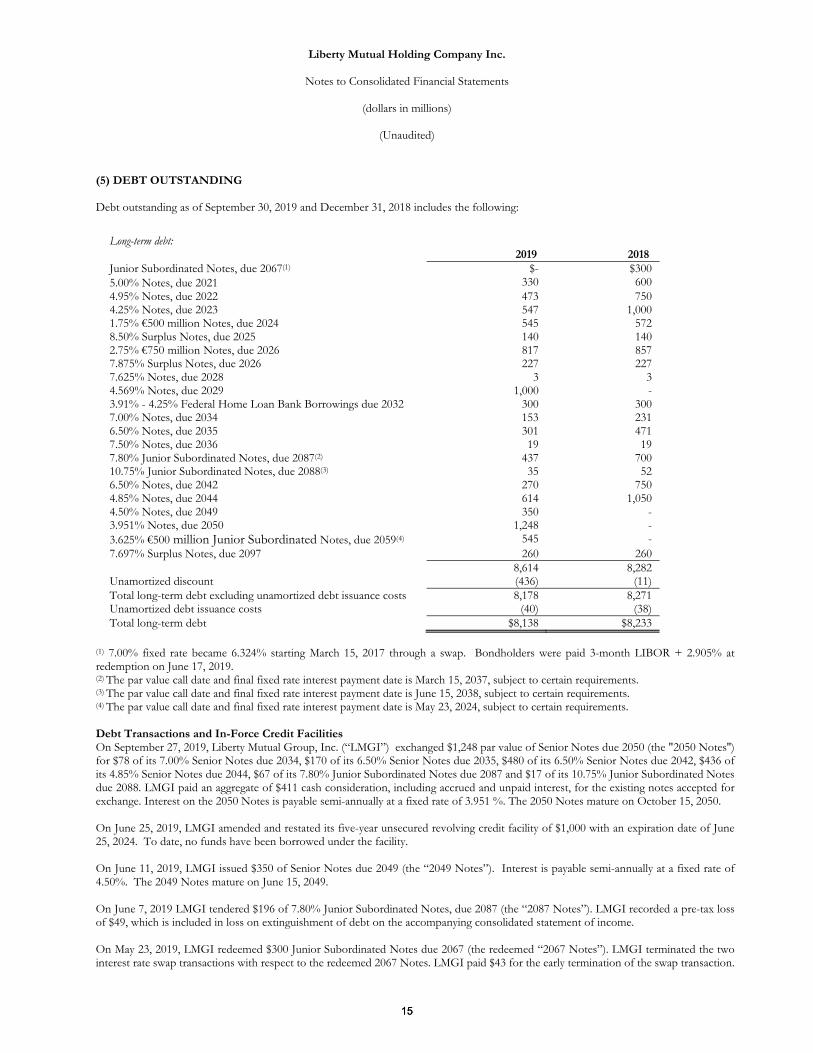
(5) DEBT OUTSTANDING
Debt outstanding as of September 30, 2019 and December 31, 2018 includes the following:
Long-term debt: 2019 2018
Junior Subordinated Notes, due 2067(1) $- $3005.00% Notes, due 2021 330 6004.95% Notes, due 2022 473 750 4.25% Notes, due 2023 547 1,000 1.75% €500 million Notes, due 2024 545 572 8.50% Surplus Notes, due 2025 140 140 2.75% €750 million Notes, due 2026 817 857 7.875% Surplus Notes, due 2026 227 227 7.625% Notes, due 2028 3 3 4.569% Notes, due 2029 1,000 - 3.91% - 4.25% Federal Home Loan Bank Borrowings due 2032 300 300 7.00% Notes, due 2034 153 231 6.50% Notes, due 2035 301 471 7.50% Notes, due 2036 19 19 7.80% Junior Subordinated Notes, due 2087(2) 437 70010.75% Junior Subordinated Notes, due 2088(3) 35 526.50% Notes, due 2042 270 750 4.85% Notes, due 2044 614 1,050 4.50% Notes, due 2049 3.951% Notes, due 2050
350 1,248
- -
3.625% €500 million Junior Subordinated Notes, due 2059(4) 545 -7.697% Surplus Notes, due 2097 260 260
8,614 8,282Unamortized discount (436) (11) Total long-term debt excluding unamortized debt issuance costs 8,178 8,271 Unamortized debt issuance costs (40) (38) Total long-term debt $8,138 $8,233
(1) 7.00% fixed rate became 6.324% starting March 15, 2017 through a swap. Bondholders were paid 3-month LIBOR + 2.905% atredemption on June 17, 2019.(2) The par value call date and final fixed rate interest payment date is March 15, 2037, subject to certain requirements.(3) The par value call date and final fixed rate interest payment date is June 15, 2038, subject to certain requirements.(4) The par value call date and final fixed rate interest payment date is May 23, 2024, subject to certain requirements.
Debt Transactions and In-Force Credit Facilities On September 27, 2019, Liberty Mutual Group, Inc. (“LMGI”) exchanged $1,248 par value of Senior Notes due 2050 (the "2050 Notes'') for $78 of its 7.00% Senior Notes due 2034, $170 of its 6.50% Senior Notes due 2035, $480 of its 6.50% Senior Notes due 2042, $436 of its 4.85% Senior Notes due 2044, $67 of its 7.80% Junior Subordinated Notes due 2087 and $17 of its 10.75% Junior Subordinated Notes due 2088. LMGI paid an aggregate of $411 cash consideration, including accrued and unpaid interest, for the existing notes accepted for exchange. Interest on the 2050 Notes is payable semi-annually at a fixed rate of 3.951 %. The 2050 Notes mature on October 15, 2050.
On June 25, 2019, LMGI amended and restated its five-year unsecured revolving credit facility of $1,000 with an expiration date of June 25, 2024. To date, no funds have been borrowed under the facility.
On June 11, 2019, LMGI issued $350 of Senior Notes due 2049 (the “2049 Notes”). Interest is payable semi-annually at a fixed rate of 4.50%. The 2049 Notes mature on June 15, 2049.
On June 7, 2019 LMGI tendered $196 of 7.80% Junior Subordinated Notes, due 2087 (the “2087 Notes”). LMGI recorded a pre-tax loss of $49, which is included in loss on extinguishment of debt on the accompanying consolidated statement of income.
On May 23, 2019, LMGI redeemed $300 Junior Subordinated Notes due 2067 (the redeemed “2067 Notes”). LMGI terminated the two interest rate swap transactions with respect to the redeemed 2067 Notes. LMGI paid $43 for the early termination of the swap transaction.
1515

Liberty Mutual Holding Company Inc.
Notes to Consolidated Financial Statements
(dollars in millions)
(Unaudited)
On May 23, 2019, LMGI issued €500 million of Series D Junior Subordinated notes (the “Series D Notes”) scheduled for redemption on May 23, 2059. The Series D Notes have a par value call date of May 23, 2024 (the “First Call Date”) and may be redeemed in whole or in part on each date falling on the fifth anniversary thereafter (the “Reset Period”). Interest is payable annually at a fixed rate of 3.625% up to but excluding the first call date. In the event the Series D Notes are not redeemed on the First Call Date, interest will be payable annually at a rate equal to the relevant Euro 5 Year Swap rate plus 3.700% per year (the “Margin”) in respect of the Reset Period commencing on the First Call Date and each subsequent Reset Period, up to but excluding May 23, 2044 (the “Step-up Date”). In the event the Series D Notes are not redeemed on or before the Step-up Date, interest will be payable annually, including the Step-up Date but excluding the stated maturity, in respect of each Reset Period between the Step-up Date and the stated maturity, the relevant Euro 5 Year Swap Rate plus the Margin plus 1.00% per year. LMGI has the right to defer interest payments on the Series D Notes for a period up to ten years. Interest compounds during periods of deferral.
On January 28, 2019, LMGI exchanged $1,000 par value of Senior Notes due 2029 (the “2029 Notes”) for $270 of its 5.00% Notes due 2021, $277 of its 4.95% Notes due 2022 and $453 of its 4.25% Notes due 2023. LMGI paid an aggregate of $40 cash consideration, including accrued and unpaid interest, for the existing notes accepted for exchange. Interest on the 2029 Notes is payable semi-annually at a fixed rate of 4.569%. The 2029 Notes mature on February 1, 2029.
On December 1, 2017, LMIC replaced its $1,000 repurchase agreement with a $250 repurchase agreement for a three-year period, which terminates December 1, 2020. At September 30, 2019, no funds were borrowed under the facility.
On November 24, 2017, LMIC entered into a $250 repurchase agreement with an expiration date of November 24, 2020. At September 30, 2019, no funds were borrowed under the facility.
LMIC, Peerless Insurance Company (“PIC”), Liberty Mutual Fire Insurance Company (“LMFIC”), Employers Insurance Company of Wausau (“EICOW”), Ironshore Specialty Insurance Company (“ISIC”) and Ironshore Indemnity Inc. (“III”) are members of the Federal Home Loan Bank. On March 21, 2012, LMFIC borrowed $150 at a rate of 3.91% with a maturity date of March 22, 2032. On March 23, 2012 and April 2, 2012, LMIC borrowed $127 at a rate of 4.24% with a maturity date of March 23, 2032 and $23 at a rate of 4.25% with a maturity date of April 2, 2032, respectively. As of September 30, 2019, all of the outstanding Federal Home Loan Bank borrowings are fully collateralized.
Payments of interest and principal of the surplus notes are expressly subordinate to all policyholder claims and other obligations of LMIC. Accordingly, interest and principal payments are contingent upon prior approval of the Commissioner of Insurance of the Commonwealth of Massachusetts.
(6) UNPAID CLAIMS AND CLAIM ADJUSTMENT EXPENSES
The Company establishes reserves for payment of claims and claim adjustment expenses that arise from the policies issued. As required by applicable accounting rules, no reserves are established until a loss, including a loss from a catastrophe, occurs. The Company’s reserves are segmented into three major categories: reserves for reported claims (estimates made by claims adjusters); incurred but not reported claims reserves (“IBNR”) representing reserves for unreported claims and supplemental reserves for reported claims; and reserves for the costs to settle claims. The Company establishes its reserves net of salvage and subrogation by line of business or coverage and year in which losses occur.
Establishing loss reserves, including loss reserves for catastrophic events that have occurred, is an estimation process. Many factors can ultimately affect the final settlement of a claim and, therefore, the necessary reserve. Changes in the law, results of litigation, medical costs, the costs of repair materials, and labor rates can all affect ultimate claim costs. In addition, time can be a critical part of reserving determinations since the longer the span between the incidence of a loss and the payment or settlement of the claim, the more variable the ultimate settlement can be. Accordingly, “short-tail” claims, such as property damage claims, tend to be easier to estimate than “long-tail” claims, such as workers compensation or general liability claims.
As information develops that varies from past experience, provides additional data, or augments data that previously was not considered sufficient for use in determining reserves, changes in the Company’s estimate of ultimate liabilities may be required. The effects of these changes are reflected in current operating results.
In order to establish a reserve for IBNR claims, the actuarial teams within each of the strategic business units use their experience and knowledge of the lines of business to estimate the potential future development of the incurred claims. The Company uses a number of actuarial methods and assumptions to develop an estimate of ultimate claim liabilities. Generally, these are a combination of exposure and experience based actuarial methods and review of other pertinent and available information from claims, underwriting, product and finance. Exposure based actuarial methods consider historical loss ratios and adjust for rate changes, premium and loss trends, industry trends and other information. These methods are typically used when developing an actuarial central estimate for more recent policy periods when
1616
Liberty Mutual Holding Company Inc.
Notes to Consolidated Financial Statements
(dollars in millions)
(Unaudited)
claims data is insufficient to produce a reliable indication. As claims data becomes more reliable for a given policy period, more consideration is given to experience methods which review and monitor actual paid and reported development.
A comprehensive actuarial reserve review is performed for each product line at least once a year. The process and methods used for each product line vary depending on the circumstances and include input from claims, underwriting, product and finance. Each quarter the actuarial central estimate for each product line is reviewed and updated based upon development and presented to the reserving committee to conclude on the Company’s best estimate of ultimate claim liabilities.
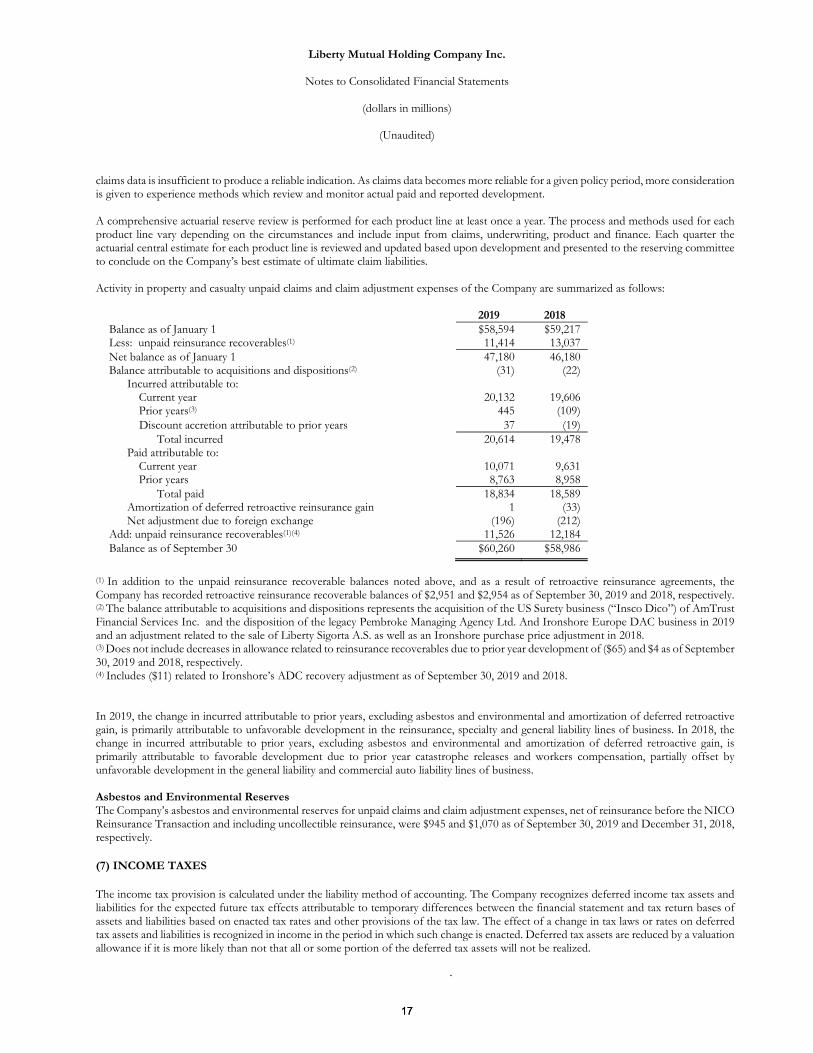
Activity in property and casualty unpaid claims and claim adjustment expenses of the Company are summarized as follows:
2019 2018Balance as of January 1 $58,594 $59,217 Less: unpaid reinsurance recoverables(1) 11,414 13,037Net balance as of January 1 47,180 46,180 Balance attributable to acquisitions and dispositions(2) (31) (22)
Incurred attributable to: Current year 20,132 19,606Prior years(3) 445 (109)
Discount accretion attributable to prior years 37 (19) Total incurred 20,614 19,478
Paid attributable to: Current year 10,071 9,631 Prior years 8,763 8,958
Total paid 18,834 18,589 Amortization of deferred retroactive reinsurance gain 1 (33)
Net adjustment due to foreign exchange (196) (212)Add: unpaid reinsurance recoverables(1)(4) 11,526 12,184Balance as of September 30 $60,260 $58,986
(1) In addition to the unpaid reinsurance recoverable balances noted above, and as a result of retroactive reinsurance agreements, theCompany has recorded retroactive reinsurance recoverable balances of $2,951 and $2,954 as of September 30, 2019 and 2018, respectively.(2) The balance attributable to acquisitions and dispositions represents the acquisition of the US Surety business (“Insco Dico”) of AmTrustFinancial Services Inc. and the disposition of the legacy Pembroke Managing Agency Ltd. And Ironshore Europe DAC business in 2019and an adjustment related to the sale of Liberty Sigorta A.S. as well as an Ironshore purchase price adjustment in 2018.(3) Does not include decreases in allowance related to reinsurance recoverables due to prior year development of ($65) and $4 as of September 30, 2019 and 2018, respectively.(4) Includes ($11) related to Ironshore’s ADC recovery adjustment as of September 30, 2019 and 2018.
In 2019, the change in incurred attributable to prior years, excluding asbestos and environmental and amortization of deferred retroactive gain, is primarily attributable to unfavorable development in the reinsurance, specialty and general liability lines of business. In 2018, the change in incurred attributable to prior years, excluding asbestos and environmental and amortization of deferred retroactive gain, is primarily attributable to favorable development due to prior year catastrophe releases and workers compensation, partially offset by unfavorable development in the general liability and commercial auto liability lines of business.
Asbestos and Environmental Reserves The Company’s asbestos and environmental reserves for unpaid claims and claim adjustment expenses, net of reinsurance before the NICO Reinsurance Transaction and including uncollectible reinsurance, were $945 and $1,070 as of September 30, 2019 and December 31, 2018, respectively.
(7) INCOME TAXES
The income tax provision is calculated under the liability method of accounting. The Company recognizes deferred income tax assets and liabilities for the expected future tax effects attributable to temporary differences between the financial statement and tax return bases of assets and liabilities based on enacted tax rates and other provisions of the tax law. The effect of a change in tax laws or rates on deferred tax assets and liabilities is recognized in income in the period in which such change is enacted. Deferred tax assets are reduced by a valuation allowance if it is more likely than not that all or some portion of the deferred tax assets will not be realized.
1717

Liberty Mutual Holding Company Inc.
Notes to Consolidated Financial Statements
(dollars in millions)
(Unaudited)
The Company’s effective tax rate on continuing operations differs from the U.S. Federal statutory rate of 21% primarily due to the impact of non-U.S. operations partially offset by tax-exempt investment income.
A reconciliation of the beginning and ending amount of unrecognized tax benefits is as follows:
Balance at December 31, 2018 $68 Additions based on tax positions related to current year 1 Additions for tax positions of prior years Reductions for tax positions of prior years Lapse of the statute of limitations Translation
2 -
(3) (3)
Balance at September 30, 2019 $65
Included in the tabular roll forward of unrecognized tax benefits are interest and penalties in the amount of $26 and $28 as of September 30, 2019 and December 31, 2018, respectively.
Included in the balance at September 30, 2019 is $55 related to tax positions that would impact the effective tax rate.
The Company recognizes interest and penalties related to unrecognized tax benefits in U.S. Federal, state, and foreign income tax expense. For the three months ended September 30, 2019 and 2018, the Company recognized $(1) and $0 of interest and penalties, respectively. For the nine months ended September 30, 2019 and 2018, the Company recognized $(1) and $(1) of interest and penalties, respectively. The Company had approximately $25 and $26 of interest and penalties accrued as of September 30, 2019 and December 31, 2018, respectively.
The statute of limitations has expired through the 2015 tax year with the exception of 2013 and 2015 Tax Equity and Fiscal Responsibility Act of 1982 related exams. The Company has foreign entities that are open for examination in their local countries for tax years 2013-2018. Any adjustments that may result from the examinations of these income tax returns are not expected to have a material impact on the financial position, liquidity, or results of operations of the Company.
The Company believes that the balance of unrecognized tax benefits could decrease by $3 within the next twelve months as a result of potential settlements.
(8) BENEFIT PLANS
The net benefit costs for the three and nine months ended September 30, 2019 and 2018, include the following components:
Supplemental Pension Postretirement
Three months ended September 30, Pension Benefits Benefits (1) Benefits2019 2018 2019 2018 2019 2018
Components of net periodic benefit costs: Service costs $36 $36 $1 $1 $5 $4 Interest costs 78 78 4 4 8 9 Expected return on plan assets (129) (127) - - - - Settlement charge/curtailment - - - - - - Amortization of unrecognized:
Net loss 38 40 4 5 1 1 Prior service cost (6) (6) (1) (2) (4) (4)
Net periodic benefit costs(2) $17 $21 $8 $8 $10 $10(1) The Company sponsors non-qualified supplemental pension plans to restore to selected highly compensated employees the pension benefits to whichthey would be entitled under the Company's U.S. tax qualified, defined benefit pension plan had it not been for limits imposed by the Internal RevenueCode. The supplemental plans are unfunded. (2) All components of net periodic benefit costs are reported in operating costs and expenses on the accompanying consolidated statements of income.
1818

Liberty Mutual Holding Company Inc.
Notes to Consolidated Financial Statements
(dollars in millions)
(Unaudited)
Supplemental Pension Postretirement
Nine months ended September 30, Pension Benefits Benefits (1) Benefits2019 2018 2019 2018 2019 2018
Components of net periodic benefit costs: Service costs $108 $113 $4 $4 $13 $14 Interest costs 234 224 12 11 26 25 Expected return on plan assets (386) (379) - - - - Settlement charge/curtailment - (12) - 10 - (8)Amortization of unrecognized:
Net loss 113 143 13 16 1 3Prior service cost (17) (19) (3) (4) (11) (12)
Net periodic benefit costs(2) $52 $70 $26 $37 $29 $22(1) The Company sponsors non-qualified supplemental pension plans to restore to selected highly compensated employees the pension benefits to whichthey would be entitled under the Company's U.S. tax qualified, defined benefit pension plan had it not been for limits imposed by the Internal RevenueCode. The supplemental plans are unfunded. (2) All components of net periodic benefit costs are reported in operating costs and expenses on the accompanying consolidated statements of income.
The settlement charge is due to a Supplemental Pension lump sum payment in excess of the settlement accounting threshold.
The Company has contributed $88 to the qualified plans as of September 30, 2019 and does not expect any additional contributions for 2019.
(9) FAIR VALUE OF FINANCIAL INSTRUMENTS
Fair value is the price that would be received to sell an asset or would be paid to transfer a liability in an orderly transaction between market participants at the measurement date. In determining fair value, the Company primarily uses the market approach, which generally utilizes market transaction data for identical or similar instruments.
The hierarchy level assigned to each security in the Company’s investments portfolio is based on the Company’s assessment of the transparency and reliability of the inputs used in the valuation of each instrument at the measurement date. The highest priority is given to unadjusted quoted prices in active markets for identical assets (Level 1 measurements) and the lowest priority to unobservable inputs (Level 3 measurements). Securities are classified based on the lowest level of input that is significant to the fair value measurement. The Company recognizes transfers between levels at the end of each reporting period. The three hierarchy levels are defined as follows:
• Level 1 — Valuations based on unadjusted quoted market prices in active markets for identical assets or liabilities that the Companyhas the ability to access.
• Level 2 — Valuations based on observable inputs (other than Level 1 prices), such as quoted prices for similar assets or liabilities atthe measurement date, quoted prices in markets that are not active, or other inputs that are observable, either directly or indirectly.
• Level 3 — Valuations based on inputs that are unobservable and significant to the overall fair value measurement and involvemanagement judgment. The unobservable inputs reflect the Company’s estimates of the assumptions that market participants woulduse in valuing the assets and liabilities.
The availability of observable inputs can vary from financial instrument to financial instrument and is affected by a wide variety of factors, including, for example, the type of financial instrument, whether the financial instrument is new and not yet established in the marketplace, and other characteristics particular to the financial instrument. To the extent that valuation is based on models or inputs that are less observable or unobservable in the market, the determination of fair value requires significantly more judgment. Accordingly, the degree of judgment exercised by management in determining fair value is greatest for instruments categorized in Level 3.
The Company is responsible for the determination of fair value and the supporting assumptions and methodologies. The Company gains assurance on the overall reasonableness and consistent application of valuation methodologies and inputs and compliance with accounting standards through the execution of various processes and controls designed to ensure that the Company’s assets and liabilities are appropriately valued. For fair values received from third parties or internally estimated, the Company's processes are designed to determine that the valuation methodologies and inputs are appropriate and consistently applied, the assumptions are reasonable and consistent with the objective of determining fair value, and the fair values are accurately recorded. For example, on a continuing basis, the Company assesses the reasonableness of individual fair values that have stale security prices or that exceed certain thresholds as compared to previous fair values received from valuation service providers or brokers or derived from internal models. The Company performs procedures to understand and assess the methodologies, processes and controls of valuation service providers. In addition, the Company may validate
1919

Liberty Mutual Holding Company Inc.
Notes to Consolidated Financial Statements
(dollars in millions)
(Unaudited)
the reasonableness of fair values by comparing information obtained from valuation service providers or brokers to other third party valuation sources for selected securities.
The Company used the following methods and assumptions in estimating the fair value of its financial instruments as well as the general classification of such financial instruments pursuant to the above fair value hierarchy:
Fixed Maturities At each valuation date, the Company uses various valuation techniques to estimate the fair value of its fixed maturities portfolio. The primary method for valuing the Company’s securities is through independent third-party valuation service providers. For positions where valuations are not available from independent third-party valuation service providers, the Company utilizes broker quotes and internal pricing methods to determine fair values. The Company obtains a single non-binding price quote from a broker familiar with the security who, similar to the Company’s valuation service providers, may consider transactions or activity in similar securities, as applicable, among other information. The brokers providing price quotes are generally from the brokerage divisions of leading financial institutions with market making, underwriting and distribution expertise regarding the security subject to valuation. The evaluation and prioritization of these valuation sources is systematic and predetermined resulting in a single quote or price for each financial instrument. The following describes the techniques generally used to determine the fair value of the Company’s fixed maturities by asset class:
U.S. Government and Agency Securities U.S. government and agency securities consist primarily of bonds issued by the U.S. Treasury and mortgage pass-through agencies such as the Federal Home Loan Bank, the Federal National Mortgage Association and the Federal Home Loan Mortgage Corporation. As the fair values of the Company’s U.S. Treasury securities are based on active markets and unadjusted market prices, they are classified within Level 1. The fair value of U.S. government agency securities is generally determined using observable market inputs that include quoted prices for identical or similar assets in markets that are not active, benchmark yields, reported trades, bids, offers and credit spreads. Accordingly, the fair value of U.S. government agency securities is primarily classified within Level 2.
Mortgage-Backed Securities The Company’s portfolio of residential and commercial MBS is originated by both agencies and non-agencies, the majority of which are pass-through securities issued by U.S. government agencies. The fair value of MBS is generally determined using observable market inputs that include quoted prices for identical or similar assets in markets that are not active, benchmark yields, contractual cash flows, prepayment speeds, collateral performance and credit spreads. Accordingly, the fair value of MBS is primarily classified within Level 2.
Asset-Backed Securities ABS include mostly investment-grade bonds backed by pools of loans with a variety of underlying collateral, including automobile loan receivables, credit card receivables, and collateralized loan obligation securities originated by a variety of financial institutions. The fair value of ABS is generally determined using observable market inputs that include quoted prices for identical or similar assets in markets that are not active, benchmark yields, contractual cash flows, prepayment speeds, collateral performance and credit spreads. Accordingly, the fair value of ABS is primarily classified within Level 2.
Municipal Securities The Company’s municipal portfolio is comprised of bonds issued by U.S. domiciled state and municipal entities. The fair value of municipal securities is generally determined using observable market inputs that include quoted prices for identical or similar assets in markets that are not active, benchmark yields, binding broker quotes, issuer ratings, reported trades and credit spreads. Accordingly, the fair value of municipal securities is primarily classified within Level 2.
Corporate Debt and Other Securities Corporate debt securities consist primarily of investment-grade debt of a wide variety of corporate issuers and industries. The fair value of corporate and other securities is generally determined using observable market inputs that include quoted prices for identical or similar assets in markets that are not active, benchmark yields, new issuances, issuer ratings, reported trades of identical or comparable securities, bids, offers and credit spreads. Accordingly, the fair value of corporate and other securities is primarily classified within Level 2. In the event third-party vendor valuation is not available, prices are determined using non-binding price quotes from a broker familiar with the security. In this instance, the valuation inputs are generally unobservable and the fair value is classified within Level 3.
Foreign Government Securities Foreign government securities include bonds issued or guaranteed by foreign governments. The fair value of foreign government securities is generally determined using observable market inputs that include quoted prices for identical or similar assets in markets that are not active, benchmark yields, binding broker quotes, issuer ratings, reported trades of identical or comparable securities and credit spreads. Accordingly, the fair value of foreign government securities is primarily classified within Level 2. In the event third-party vendor valuation is not available, prices are determined using non-binding price quotes from a broker familiar with the security. In this instance, the valuation inputs are generally unobservable and the fair value is classified within Level 3.
2020

Liberty Mutual Holding Company Inc.
Notes to Consolidated Financial Statements
(dollars in millions)
(Unaudited)
Equity Securities Equity securities include common and preferred stocks. Common stocks with fair values based on quoted market prices in active markets are classified within Level 1. Common stocks with fair values determined using observable market inputs that include quoted prices for identical or similar assets in markets that are not active are classified within Level 2. The fair value of preferred stock is generally determined using observable market inputs that include quoted prices for identical or similar assets in markets that are not active. Accordingly, the fair value of preferred stock is primarily classified within Level 2. Short-Term Investments The fair value of short-term investments is generally determined using observable market inputs that include quoted prices for identical or similar assets in markets that are not active, benchmark yields, new issuances, issuer ratings, reported trades of identical or comparable securities, bids, offers and credit spreads. Accordingly, the fair value of short-term investments is primarily classified within Level 2 of the fair value hierarchy. Other Investments Other investments include primarily foreign cash deposits and equity investments in privately held businesses. Cash deposits are primarily valued using quoted prices for similar instruments in active markets; these assets are categorized within Level 2 of the fair value hierarchy. Equity investments in privately held businesses are valued using internal management estimates; they are categorized within Level 3 of the hierarchy. Loans, limited partnership and other equity method investments, which represent the remainder of the other investment balance on the accompanying consolidated balance sheet are not subject to these disclosures and therefore are excluded from the table in this note. Other Assets and Other Liabilities Other assets primarily consist of fixed maturities, short-term investments, and equity securities of captive companies sponsored by the Company. These assets are measured based on the methodology for individual securities as discussed above. Additionally, other assets and other liabilities classified within Level 2 and Level 3 represent the Company’s derivatives which can be exchange-traded or traded over-the-counter (“OTC”). OTC derivatives are valued using market transactions and other market evidence whenever possible, including market-based inputs to models, model calibration to market clearing transactions, broker or dealer quotations or alternative pricing sources with reasonable levels of price transparency. When models are used, the selection of a particular model to value an OTC derivative depends on the contractual terms of, and specific risks inherent in the instrument, as well as the availability of pricing information in the market. The Company generally uses similar models to value similar instruments. Valuation models require a variety of inputs, including contractual terms, market prices and rates, yield curves, credit curves, measures of volatility, prepayment rates and correlations of such inputs. For OTC derivatives that trade in liquid markets, such as generic forwards, swaps and options, model inputs can generally be corroborated by observable market data by correlation or other means, and model selection does not involve significant management judgment. Life Insurance Obligations Life insurance obligations include certain variable annuity contracts that provide guaranteed minimum income benefits. These benefits are accounted for as embedded derivatives and are bifurcated from the host contract and carried at fair value. The fair value of these embedded derivatives are computed on a recurring basis using assumptions predominately classified as Level 3 (significant unobservable) inputs. While some inputs are observable in the market, such as risk free rates, volatility and historical equity returns, the underlying future policyholder behavior inputs are highly unobservable. The significant policyholder behavior assumptions include lapse and the underlying annuitization rate.
2121
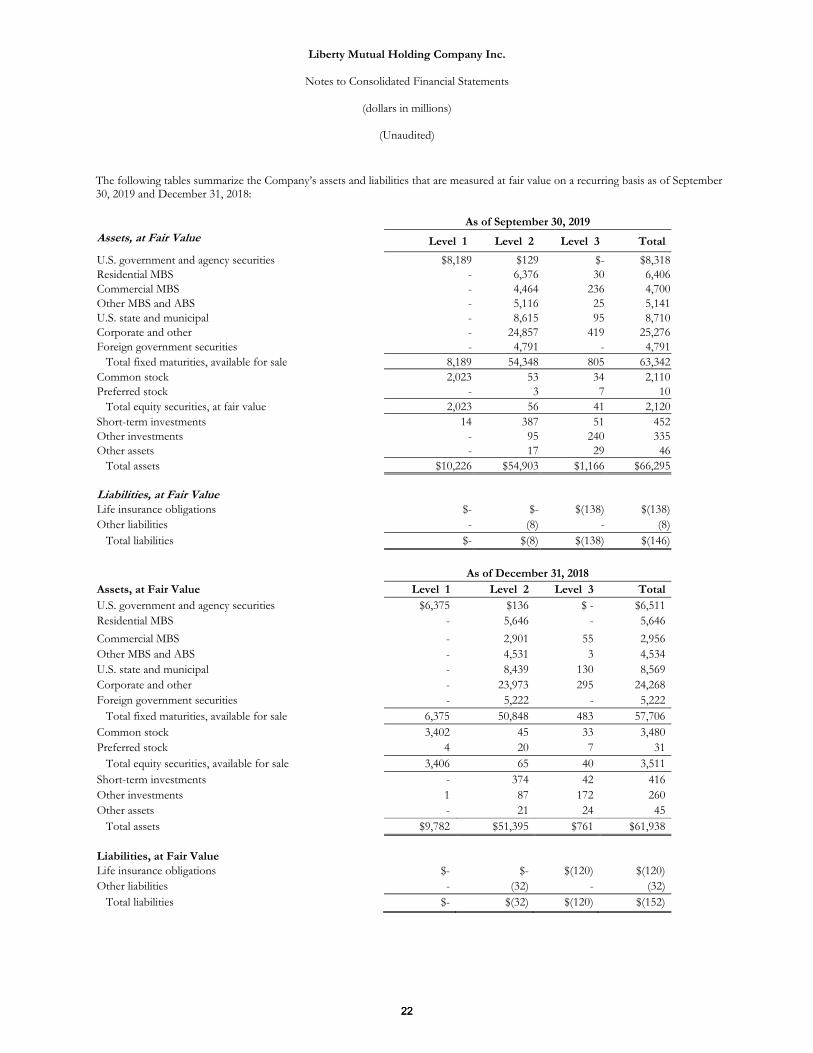
Liberty Mutual Holding Company Inc.
Notes to Consolidated Financial Statements
(dollars in millions)
(Unaudited)
The following tables summarize the Company’s assets and liabilities that are measured at fair value on a recurring basis as of September 30, 2019 and December 31, 2018:
As of September 30, 2019 Assets, at Fair Value Level 1 Level 2 Level 3 Total
U.S. government and agency securities $8,189 $129 $- $8,318 Residential MBS - 6,376 30 6,406 Commercial MBS - 4,464 236 4,700 Other MBS and ABS - 5,116 25 5,141 U.S. state and municipal - 8,615 95 8,710 Corporate and other - 24,857 419 25,276 Foreign government securities - 4,791 - 4,791 Total fixed maturities, available for sale 8,189 54,348 805 63,342 Common stock 2,023 53 34 2,110 Preferred stock - 3 7 10 Total equity securities, at fair value 2,023 56 41 2,120 Short-term investments 14 387 51 452 Other investments - 95 240 335 Other assets - 17 29 46 Total assets $10,226 $54,903 $1,166 $66,295
Liabilities, at Fair Value Life insurance obligations $- $- $(138) $(138) Other liabilities - (8) - (8) Total liabilities $- $(8) $(138) $(146)
As of December 31, 2018 0B0B0BAssets, at Fair Value Level 1 Level 2 Level 3 Total U.S. government and agency securities $6,375 $136 $ - $6,511 Residential MBS - 5,646 - 5,646
Commercial MBS - 2,901 55 2,956Other MBS and ABS - 4,531 3 4,534U.S. state and municipal - 8,439 130 8,569Corporate and other - 23,973 295 24,268Foreign government securities - 5,222 - 5,222 Total fixed maturities, available for sale 6,375 50,848 483 57,706 Common stock 3,402 45 33 3,480 Preferred stock 4 20 7 31 Total equity securities, available for sale 3,406 65 40 3,511 Short-term investments - 374 42 416 Other investments 1 87 172 260 Other assets - 21 24 45
Total assets $9,782 $51,395 $761 $61,938
Liabilities, at Fair Value Life insurance obligations $- $- $(120) $(120) Other liabilities - (32) - (32) Total liabilities $- $(32) $(120) $(152)
2222

Liberty Mutual Holding Company Inc.
Notes to Consolidated Financial Statements
(dollars in millions)
(Unaudited)
The following tables summarize the fair values of assets on a recurring basis classified as Level 3 within the fair value hierarchy:
As of September 30, 2019 As of December 31, 2018
Purchases Transfer in
to Level 3 Transfer out
of Level 3
Purchases Transfer in
to Level 3 Transfer out
of Level 3 Assets, at Fair Value U.S. government and agency securities $ - $ - $ - $- $- $- Residential MBS 94 - (60) 57 - (72) Commercial MBS 711 - (543) 52 - - Other MBS and ABS 40 - (15) 14 - (41) U.S. state and municipal - 13 - 50 - (72) Corporate and other 376 17 - 181 3 - Foreign government securities - - - - - - Total fixed maturities 1,221 30 (618) 354 3 (185) Common stock 9 - (2) 4 - (5) Preferred stock - - - - - - Total equity securities 9 - (2) 4 - (5) Short-term investments 107 - - 189 - - Other investments 75 - - 28 - (1) Other assets - - - 239 - - Total assets $1,412 $30 $(620) $814 $3 $(191) Liabilities, at Fair Value Life insurance obligations $8 $- $- $11 $- $- Total liabilities $8 $- $- $11 $- $-
Transfers into and out of Level 3 were primarily due to changes in the observability of pricing inputs. The Company had no material assets or liabilities that were measured at fair value on a nonrecurring basis during the nine months ended September 30, 2019. The Company has not applied ASC 820 to non-financial assets and liabilities. (10) COMMITMENTS AND CONTINGENT LIABILITIES Various lawsuits against the Company have arisen in the normal course of business. Contingent liabilities arising from litigation, income taxes, and other matters are not considered material in relation to the financial position of the Company. As of September 30, 2019, the Company had unfunded commitments in traditional private equity partnerships, natural resources, real estate, private credit, and other of $1,073, $463 ($298 of which is related to energy investments), $756, $1,015, and $135, respectively. As of September 30, 2019, the Company had commitments to purchase various residential MBS at a cost and fair value of $490 and $492, respectively. (11) SUBSEQUENT EVENTS On October 2, 2019 the Company completed the acquisition of the business and operations of Nationale Borg, Nationale Borg Reinsurance, and AmTrust Insurance Spain. The transaction is not material to the Company. On November 5, 2019, the Company entered into an adverse development cover with National Indemnity Company (“NICO”), a subsidiary of Berkshire Hathaway Inc., providing coverage for up to $1,300 in reinsurance protection across certain U.S. workers compensation, commercial auto, and general liability business, attaching at approximately $8,000 combined aggregate reserves with sublimits on certain claims. The coverage provides immediate cover for $300 in reserves ceded at inception, retention of $400 by the Company and $1,000 of coverage for losses in excess of that retention. The Company paid NICO cash consideration of $462. This contract will be accounted for on a retrospective basis. Management has assessed material subsequent events through November 7, 2019, the date the financial statements were available to be issued.
23
n0303780
Underline