Q3 2016 Financial Results - Kcell · to customers. The migration to Amdocs convergent billing...
22
Q3 2016 Financial Results
Transcript of Q3 2016 Financial Results - Kcell · to customers. The migration to Amdocs convergent billing...

Q3 2016 Financial Results

Progress and challenges in Q3
Q3 2016 Interim Report 2
• Improvement of top line in Q3 vs. Q2 2016, with the support of consumer base growth and new offers
• Stabilisation of market share with net intake of 157,000
• Launch of LTE in 11 cities based on network sharing with Beeline
• Migration to new billing system
• Monetising data
• Introduction of new unlimited LTE tariff plans by competitors
• Customer growth mainly on under-monetised entry level plans; and slow upselling and migration to higher plans.

Key strategic priorities
• Increase in revenues by growing share-of-wallet and ARPU stimulation
• LTE network roll-out
• Increase in B2B solutions’ share of revenue
• Improvement in data network quality
• Regain subscribers and grow customer base
Q3 2016 Interim Report 3

01
02
03
05
06
07
04 08
Q3 2016 Summary
Net sales KZT 36,931m (42,756) Decrease of 13.6% year-on-year
Q3 2016 Interim Report 4
Service revenue KZT 35,032m (39,612)
Decrease of 11.6% year-on-year
Data revenue 10,749m (10,051) Increase of 7.0% year-on-year
EBITDA* KZT 14,238m (19,028) Decrease of 25.2% year-on-year
EBITDA margin 38.6% (44.5) Decrease due to lower revenue and higher interconnect
expenses
Net income KZT 4,378m (15,112) Decrease of 71.0% year-on-year
B2B revenue 2,956m (2,465) Increase of 19.9% year-on-year
Subscribers 9,905m (9,748) Increase by 157,000 during the quarter
*excluding non-recurring items

01
02
03
05
06
07
04 08
9m 2016 Summary
Net sales KZT 108,814m (128,820)
Decrease of 15.5% year-on-year
Q3 2016 Interim Report 5
Service revenue KZT 102,558m (119,447)
Decrease of 14.1% year-on-year
Data revenue 30,481m (29,504) Increase of 3.3% year-on-year
EBITDA* KZT 43,503m (64,725) Decrease of 32.8% year-on-year
EBITDA margin 40.0% (50.2) Decrease due to lower revenue and higher
interconnect expenses
Net income KZT 15,633m (39,666)
Decrease of 60.6% year-on-year
B2B revenue 8,754m (7,008) Increase of 24.9% year-on-year
Subscribers 9,905m (10,780) Decrease by 875,000 year-on-year
*excluding non-recurring items

Kcell Brand - New ‘Prestige’ tariff line
Q3 2016 Interim Report 6
• 5 bundles, monthly fee from KZT 2,590 to 9,590
• Data allowance: from 15GB to 35GB available 24/7
• Unlimited on-net calls, relevant off-net mobile calls
• Packaged with entertainment services: on-line library,
Music and TV streaming
• Comfort usage: monthly fee charged on the first day of
each month, or availability of affordable pay-as-you-go
tariffs
• Launched on 31 August 2016
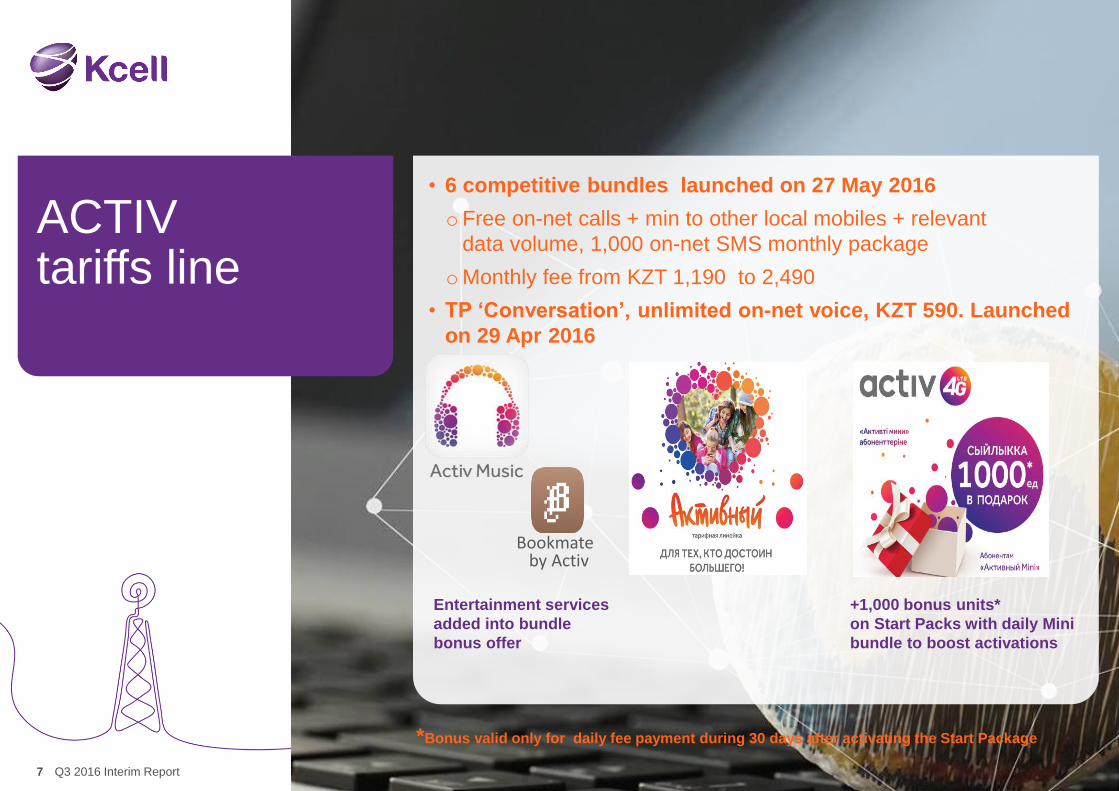
ACTIV tariffs line
Q3 2016 Interim Report 7
Bookmate by Activ
• 6 competitive bundles launched on 27 May 2016
oFree on-net calls + min to other local mobiles + relevant
data volume, 1,000 on-net SMS monthly package
oMonthly fee from KZT 1,190 to 2,490
• TP ‘Conversation’, unlimited on-net voice, KZT 590. Launched
on 29 Apr 2016
Entertainment services
added into bundle
bonus offer
+1,000 bonus units*
on Start Packs with daily Mini
bundle to boost activations
*Bonus valid only for daily fee payment during 30 days after activating the Start Package
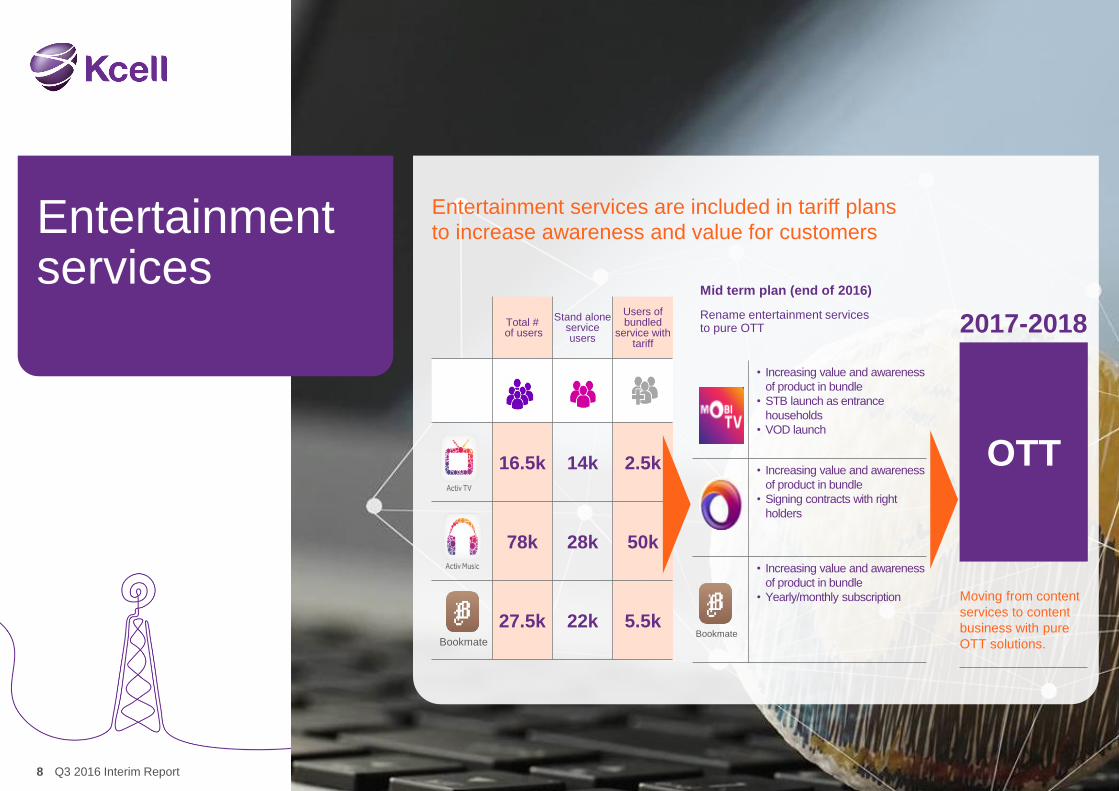
Entertainment services
Q3 2016 Interim Report 8
Entertainment services are included in tariff plans
to increase awareness and value for customers
Total # of users
Stand alone service users
Users of bundled
service with tariff
16.5k 14k 2.5k
78k 28k 50k
27.5k 22k 5.5k Bookmate
Mid term plan (end of 2016)
Rename entertainment services to pure OTT
• Increasing value and awareness
of product in bundle
• STB launch as entrance
households
• VOD launch
• Increasing value and awareness
of product in bundle
• Signing contracts with right
holders
• Increasing value and awareness
of product in bundle
• Yearly/monthly subscription
Bookmate
2017-2018
OTT
Moving from content
services to content
business with pure
OTT solutions.

Revenue trend
Q3 2016 Interim Report 9
Net sales
42,8 39,6
35,5 36,4 36,9
0
10
20
30
40
50
60
Q3 2015 Q4 2015 Q1 2016 Q2 2016 Q3 2016
KZ
T in
bln
-13.6%
B2B revenue
2,47 2,98 2,88 2,92 2,96
–
2,0%
4,0%
6,0%
8,0%
10,0%
0
1
2
3
4
Q3 2015 Q4 2015 Q1 2016 Q2 2016 Q3 2016
B2B Revenue % of total revenues
KZT in bln +19.9%
Service revenue
39,6 37,8 33,5 34,0 35,0
0
10
20
30
40
50
60
Q3 2015 Q4 2015 Q1 2016 Q2 2016 Q3 2016
KZ
T in
bln
-15.1%
+3.0% +1.4%

Data usage and revenues
Q3 2016 Interim Report 10
Smartphone penetration % (network)
Data traffic
Average revenue per MB
Data revenue
8,0
23,0 31,0
41,0 45,0 46,5
0
10
20
30
40
50
2012 2013 2014 2015 Q2 2016 Q3 2016
0,6
0,4 0,4 0,4 0,3
0
Q3 2015 Q4 2015 Q1 2016 Q2 2016 Q3 2016
KZ
T
10,05 9,77
9,49 10,24
10,75
–
10,0%
20,0%
30,0%
40,0%
0
5
10
15
Q3 2015 Q4 2015 Q1 2016 Q2 2016 Q3 2016
Data services % of total revenues
+89.6%
16,2
21,7 25,3 27,7
30,6
0
5
10
15
20
25
30
35
Q3 2015 Q4 2015 Q1 2016 Q2 2016 Q3 2016
Mln
GB
KZ
T in
bln
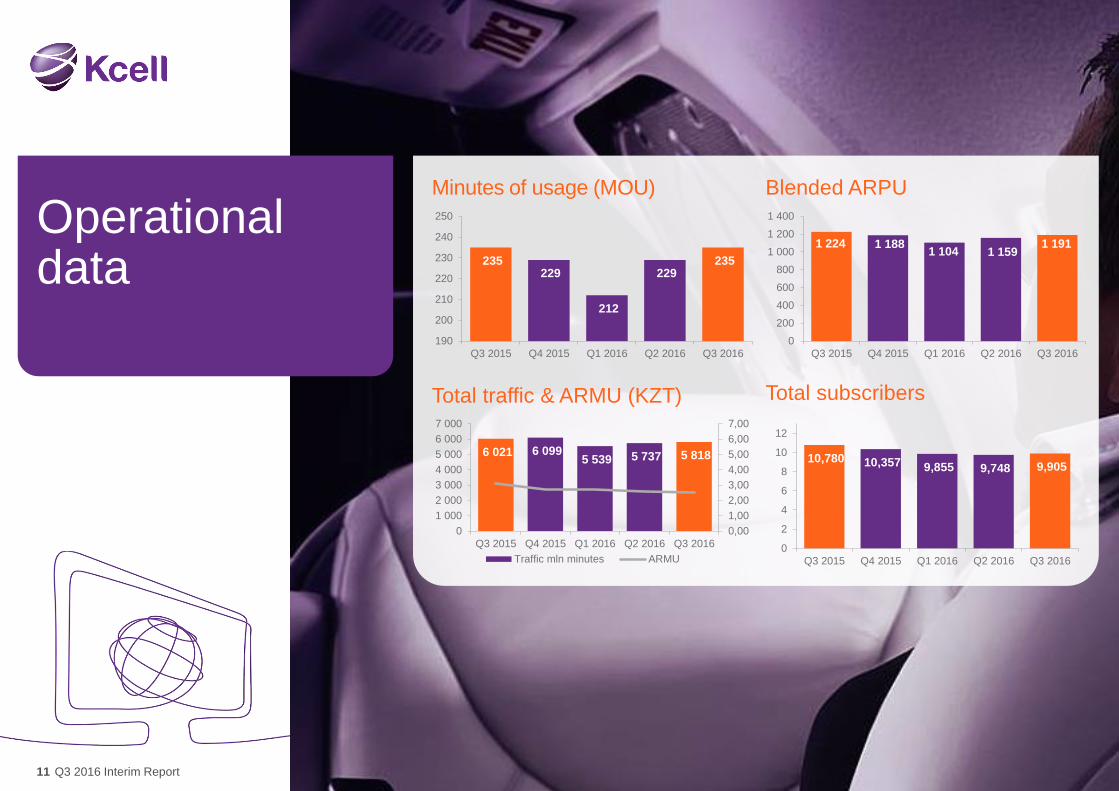
Operational data
Q3 2016 Interim Report 11
Minutes of usage (MOU)
235 229
212
229 235
190
200
210
220
230
240
250
Q3 2015 Q4 2015 Q1 2016 Q2 2016 Q3 2016
Total traffic & ARMU (KZT)
6 021 6 099 5 539 5 737 5 818
0,00
1,00
2,00
3,00
4,00
5,00
6,00
7,00
0
1 000
2 000
3 000
4 000
5 000
6 000
7 000
Q3 2015 Q4 2015 Q1 2016 Q2 2016 Q3 2016
Traffic mln minutes ARMU
Blended ARPU
1 224 1 188 1 104 1 159
1 191
0
200
400
600
800
1 000
1 200
1 400
Q3 2015 Q4 2015 Q1 2016 Q2 2016 Q3 2016
Total subscribers
10,780 10,357 9,855 9,748 9,905
0
2
4
6
8
10
12
Q3 2015 Q4 2015 Q1 2016 Q2 2016 Q3 2016

Financial highlights
Q3 2016 Interim Report 12
KZT in millions, except per share data, number of shares and changes Q3 2016 Q3 2015 Chg (%) 9m 2016 9m 2015 Chg (%)
Net Sales 36,931 42,756 -13.6 108,814 128,820 -15.5
of which service revenue 35,032 39,612 -11.6 102,558 119,447 -14.1
EBITDA* 14,238 19,028 -25.2 43,503 64,725 -32.8
EBITDA margin (%) 38.6 44.5 40.0 50.2
Operating income 7,916 12,849 -38.4 24,775 45,977 -46.1
Operating income* 8,056 12,849 -37.3 25,384 46,304 -45.2
Net income 4,378 15,112 -71.0 15,633 39,666 -60.6
Earnings per share (KZT) 21.9 75.6 -71.0 78.2 198.3 -60.6
CAPEX to sales (%) 27.1 11.5 38.8 8.4
Free cash flow 7,968 12,169 -992 26,579
*excluding non-recurring items

EBITDA performance
Q3 2016 Interim Report 13
EBITDA performance
44,5% 43,1%
41,6% 39,9% 38,6%
20,0%
30,0%
40,0%
50,0%
0
5
10
15
20
25
30
Q3 2015 Q4 2015 Q1 2016 Q2 2016 Q3 2016
% margin
KZT in bln
*excluding non-recurring items

Network priorities
Q3 2016 Interim Report 14
CAPEX-to-sales ratio* LTE launch
• Network sharing agreement with Beeline
• LTE launched in 11 cities
Network modernisation
• Improvement of 2G and 3G network quality and coverage
• Capacity upgrades of 2G and 3G network
• Network Core improvement
Completion of migration
to new convergent
billing system
12,2% 11,2% 11,0%
8,4%
14,9%
0%
20%
FY13 FY14 FY15 9m 15 9m 16
*Capex without LTE licenses

Dividends
Q3 2016 Interim Report 15
• In August 2016, the Company’s paid the annual dividend
of KZT 46,632 million, with the dividend per ordinary share
amounting to KZT 116.58 (each ordinary share representing
one GDR).
• Dividends paid electronically directly into shareholders’
bank accounts who were registered at the record date
of 19 May 2015.

Administrative and legal update
Q3 2016 Interim Report 16
Update on “Daytime Unlimited”
As of 1 October 2016, Kcell has returned KZT 2,467 million
to customers. The migration to Amdocs convergent billing
system started in July 2016.
Recovery of lost profits of Paylink LLP
The Company’s cassation appeal against the Board of
Appeals’ judgment as well as cassation appeal of Paylink
LLP were dismissed by the Supreme Court of the Republic
of Kazakhstan.
Tax audit
The Company is undergoing tax audit that covers the period
of 2011-2015. The results are expected by the end of 2016.

Q&A

Income statement
Q3 2016 Interim Report 18
KZT in millions, except
per share data, number
of shares and changes Q3 2016 Q3 2015 Chg (%) 9m 2016 9m 2015
Chg (%)
Revenues 36,931 42,756 -13.6 108,814 128,820 -15.5
Cost of sales -23,456 -24,418 -3.9 -67,390 -66,989 0.6
Gross profit 13,475 18,337 -26.5 41,424 61,830 -33.0
Selling and marketing expenses -2,701 -2,347 15.1 -7,691 -7,171 7.3
General and administrative
expenses -3,029 -3,028 0.0 -9,355 -8,946 4.6
Other operating income and
expenses, net 170 -113 398 263
Operating income 7,916 12,849 -38.4 24,775 45,977 -46.1
Finance costs and other financial
items, net -2,321 6,638 -4,905 4,951
Income after financial items 5,594 19,487 -71.3 19,869 50,928 -61.0
Income taxes -1,216 -4,375 -72.2 -4,236 -11,262 -62.4
Net income 4,378 15,112 -71.0 15,633 39,666 -60.6
Earnings per share (KZT), basic
and diluted 21.9 75.6 -71.0 78.2 198.3 -60.6

Balance sheet
Q3 2016 Interim Report 19
KZT in millions 30 Sep 2016 31 Dec 2015
Assets
Intangible assets 41,421 16,956
Property, plant and equipment 94,298 94,502
Other non-current assets 87 145
Financial aid - 300
Long-term receivables 928 397
Total non-current assets 136,734 112,301
Inventories 2,488 2,802
Trade and other receivables 25,023 19,336
Cash and cash equivalents 20,747 31,589
Total current assets 48,258 53,726
Total assets 184,992 166,027
Equity and liabilities
Share capital 33,800 33,800
Retained earnings 37,830 46,646
Total equity attributable to owners of the parent company 71,630 80,446
Long term borrowings 8,000 -
Deferred tax liabilities 4,219 5,037
Other long-term liabilities 1,285 1,286
Total non-current liabilities 13,505 6,323
Short-term borrowings 57,352 50,201
Trade payables and other current liabilities 42,506 29,057
Total current liabilities 99,858 79,258
Total equity and liabilities 184,992 166,027

Statement of cash flows
Q3 2016 Interim Report 20
KZT in millions Q3 2016 Q3 2015 9m 2016 9m 2015
Cash flow before change in working capital 13,813 15,229 36,018 52,085
Change in working capital -1,670 2,526 -9,285 -6,199
Cash flow from operating activities 12,143 17,755 26,733 45,886
Cash CAPEX -4,175 -5,586 -27,725 -19,307
Free Cash Flow 7,968 12,169 -992 26,579
Cash flow before financing activities 7,968 12,169 -992 26,579
Cash flow from financing activities -14,316 3,300 -10,501 -15,482
Cash flow for the period -6,348 15,469 -11,493 11,097
Cash and cash equivalents, opening
balance 27,203 15,452 31,589 19,520
Cash flow for the period -6,348 15,469 -11,493 11,097
Exchange rate difference -108 8,037 651 8,341
Cash and cash equivalents, closing balance 20,747 38,958 20,747 38,958

Financial key ratios
Q3 2016 Interim Report 21
*Rolling 12 months
31 Sep 2016 31 Dec 2015
Return on equity* % 29.7 54.1
Return on capital employed* % 34.5 69.6
Equity/assets ratio % 38.7 48.5
Net debt/equity ratio (multiple) 48.1 23.1
Net debt/EBITDA* rate % 0.80 0.24

Forward looking statement
Q3 2016 Interim Report 22
Statements made in this document relating to future status
or circumstances, including future performance and other trend
projections are forward-looking statements. By their nature,
forward-looking statements involve risk and uncertainty because
they relate to events and depend on circumstances that will occur
in the future. There can be no assurance that actual results will
not differ materially from those expressed or implied by these
forward-looking statements due to many factors, many of which
are outside the control of Kcell.