Q1 FY 2017 Results Presentation September 2016 · 2016-09-08 · BOPP in India • Commissioned 2...
15
Q1 FY 2017 Results Presentation September 2016 1
Transcript of Q1 FY 2017 Results Presentation September 2016 · 2016-09-08 · BOPP in India • Commissioned 2...
Q1 FY 2017
Results Presentation
September 2016
1

Q1FY17 Performance Highlights
• Jindal Poly Films (Consolidated):
– Revenue at Rs 1,779 Crores declined by 8% (Q1 FY’16), which more
or less represents price decrease on account of raw material prices
– Operating income at Rs 290 Crores Vs Rs 341 Crores in Q1FY16
• Operating margins at 16.3% Vs 17.7% in Q1FY16
– Total Comprehensive Income (as per IND AS) at Rs 122 Crores
• Jindal Films – US and Europe
– Revenue at USD 176 mn against USD 691 mn in FY16
– Operating Income at USD 30 mn against USD 85 mn in FY16
– PAT at USD 15 mn against USD 34 mn in FY16
• Global Nonwoven
– Revenue at Rs 25.6 Crores
– EBIDTA at Rs 5.12 Crores
• The company has decided to amalgamate its wholly owned subsidiary M/S
Global Nonwovens Limited w.e.f. 1st April‘15
– The Scheme is subject to approval of High Courts2
Operating Revenue Rs Crs
Jindal
Films
65.1%
JPFL
33.5%
Global
Nonwovens
1.4%

Business Evolution
1985 – 1993Polyester Yarn Business
• Commenced manufacturing of Polyester Yarns at Bulandshar, UP
• Backward Integration into manufacturing of polyester chips for captive use
1996 – 2003
Entry – BOPET & BOPP
• Started Manufacturing – BOPET Films at Nasik, Maharashtra
• Diversified into BOPP Films and entered the metallised films segment
• Acquisition of Rexor, France
2004 – 2005Expansion – BOPET & BOPP
• Expansion of BOPP capacity by 32,000 TPA & BOPET capacity by 25,000 TPA
2006 – 2008
Leadership in BOPP
• Yarn production discontinued
• Commissioned 3rd BOPP line of 45,000 TPA, - one of the largest in the world and becomes the largest producer of
BOPP in India
• Commissioned 2 BOPP film lines capacity of 90,000 TPA (4th & 5th Line)
2009 – 2013
Acquired – Exxon Mobil BOPP films Business
• Another 8.7 meter, thin PET film line was installed
• Acquired BOPP films business from Exxon Mobil, with 5 plants, R & D centre and 190 + registered patents.
• Demerged Investments in separate investments company, Jindal Poly Investments and Finance Co.
• 6th BOPP line in Nasik
2014 – 2016
Reorganization
• Merged Manufacturing business of Jindal Photo
• 41,000 TPA new BOPP line commissioned in July 2016
• 14,000 TPA Coater plant commissioned
• Received BRC Packaging and Packaging Materials – Standard Certified at Nasik Facility
• Global Nonwoven commences commercial production from 1st July ‘15
• Increase of Shareholding in Global Nonwoven from 60.4% to 100%
3

Business Structure
JPFL - India
36.6%
Jindal Films
62.6%
Others
0.8%
Jindal Poly Films
Leader in BOPP and
BOPET films in India
Jindal Films
Acquired BOPP films business from
Exxon Mobil in Year 2013
Leader in BOPP films in US and
Europe, specialising in metalized
and coated films
FY 16 Operating Revenues
4

Business Details
5
Our Manufacturing Setup
6
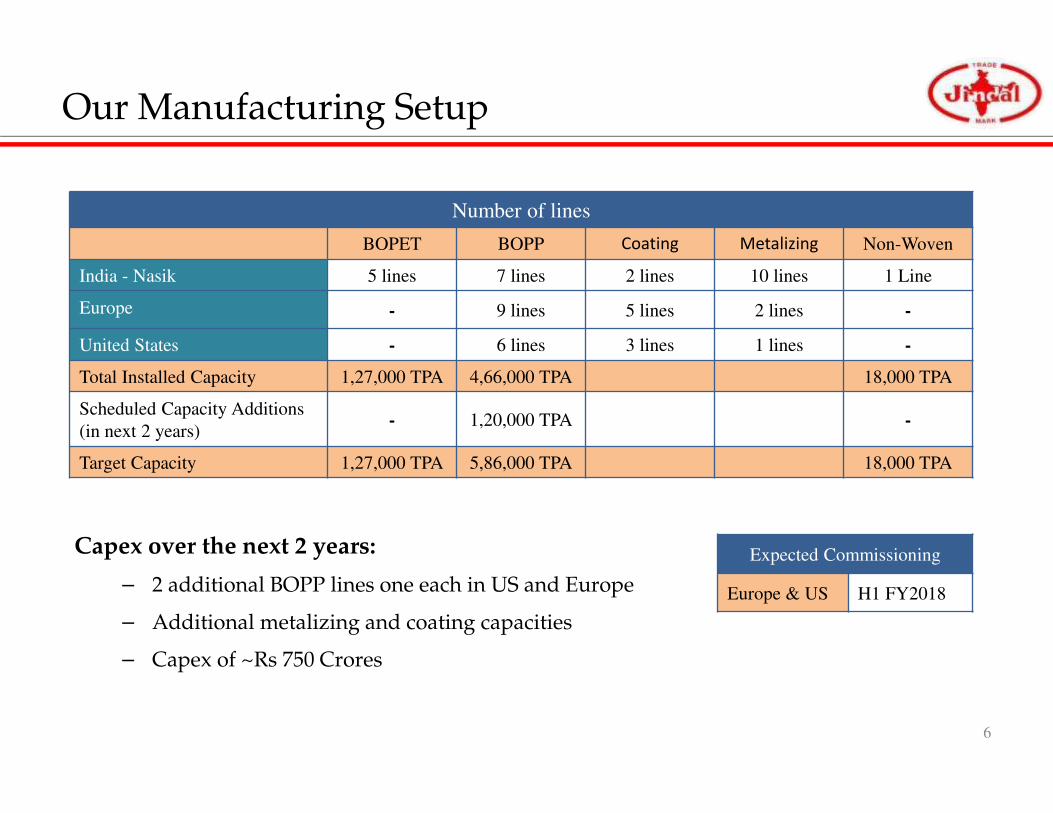
Number of lines
BOPET BOPP Coating Metalizing Non-Woven
India - Nasik 5 lines 7 lines 2 lines 10 lines 1 Line
Europe - 9 lines 5 lines 2 lines -
United States - 6 lines 3 lines 1 lines -
Total Installed Capacity 1,27,000 TPA 4,66,000 TPA 18,000 TPA
Scheduled Capacity Additions
(in next 2 years)- 1,20,000 TPA -
Target Capacity 1,27,000 TPA 5,86,000 TPA 18,000 TPA
Capex over the next 2 years:
– 2 additional BOPP lines one each in US and Europe
– Additional metalizing and coating capacities
– Capex of ~Rs 750 Crores
Expected Commissioning
Europe & US H1 FY2018
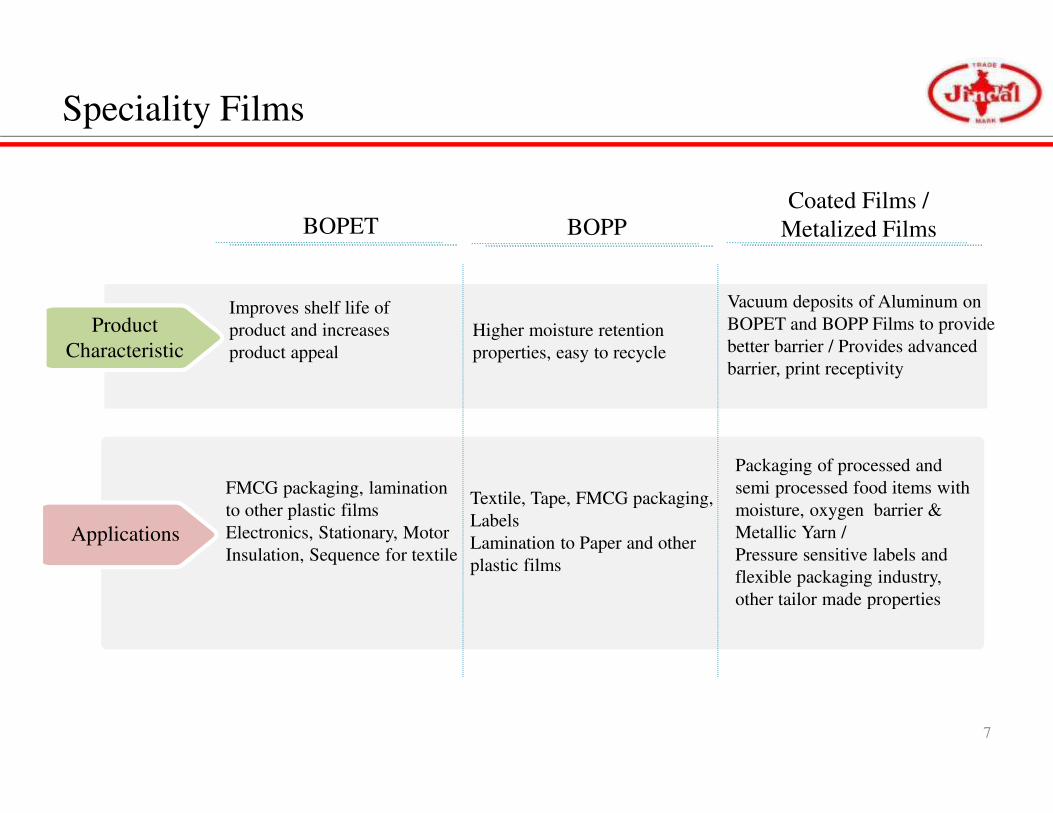
Speciality Films
BOPPCoated Films /
Metalized Films
7
BOPET
Product
Characteristic
Improves shelf life of
product and increases
product appeal
Higher moisture retention
properties, easy to recycle
Vacuum deposits of Aluminum on
BOPET and BOPP Films to provide
better barrier / Provides advanced
barrier, print receptivity
Applications
FMCG packaging, lamination
to other plastic films
Electronics, Stationary, Motor
Insulation, Sequence for textile
Textile, Tape, FMCG packaging,
Labels
Lamination to Paper and other
plastic films
Packaging of processed and
semi processed food items with
moisture, oxygen barrier &
Metallic Yarn /
Pressure sensitive labels and
flexible packaging industry,
other tailor made properties
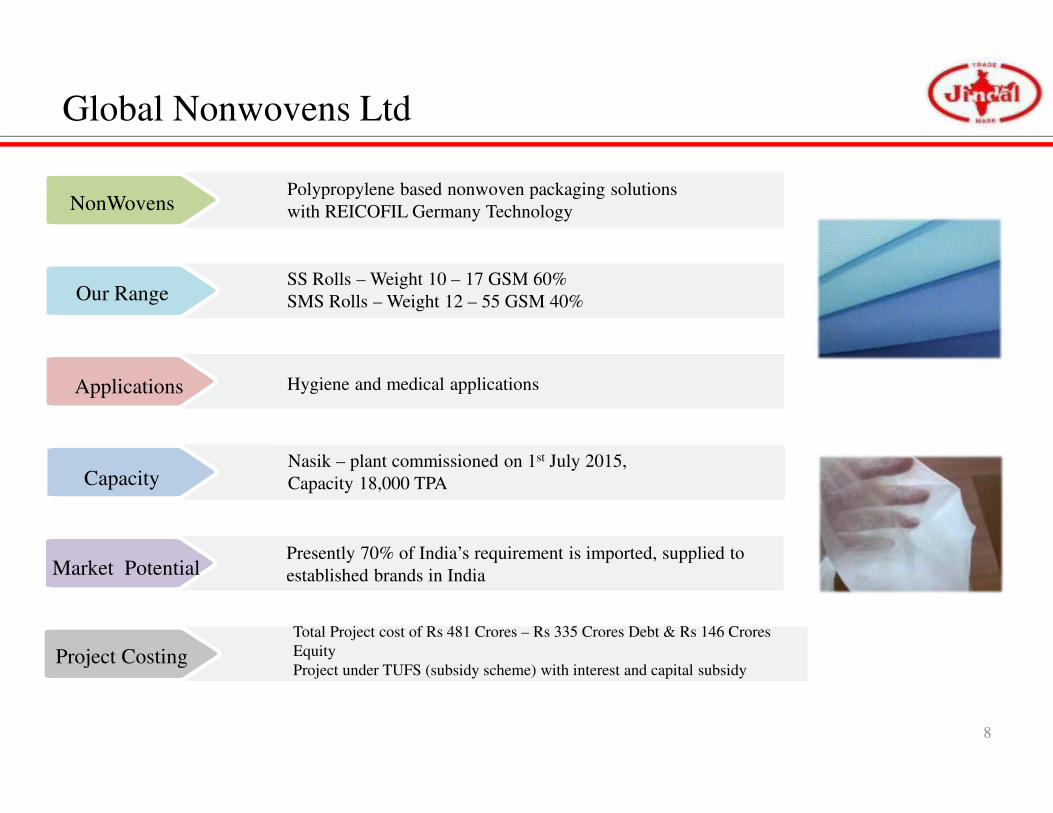
Global Nonwovens Ltd
Our RangeSS Rolls – Weight 10 – 17 GSM 60%
SMS Rolls – Weight 12 – 55 GSM 40%
Applications Hygiene and medical applications
NonWovensPolypropylene based nonwoven packaging solutions
with REICOFIL Germany Technology
CapacityNasik – plant commissioned on 1st July 2015,
Capacity 18,000 TPA
Market PotentialPresently 70% of India’s requirement is imported, supplied to
established brands in India
Project Costing
Total Project cost of Rs 481 Crores – Rs 335 Crores Debt & Rs 146 Crores
Equity
Project under TUFS (subsidy scheme) with interest and capital subsidy
8
Financial & Operating
performance
9

Financials: Q1 FY17 (As per Ind AS)
10
Particulars (Rs. in Crores) Standalone Consolidated
Q1FY17 Q1FY16 YoY % Q1FY17 Q1FY16 YoY %
Revenue 596 760 -22% 1779 1930 -8%
Operating Cost 518 604 1488 1589
Operating Income 78 156 -50% 291 341 -15%
Operating Income Margin 13.2% 20.5% 16.3% 17.7%
Other Income 8 9 9 23
Depreciation 17 14 65 55
Finance Cost 11 10 27 19
PBT 58 141 208 290
Tax Expenses 18 32 58 79
PAT from ordinary activities 40 109 -63% 150 211 -29%
Associate interest - - 1 0
Minority Interest - - 50 48
PAT after Minority Interest 40 109 -63% 99 163 -39%
Other Comprehensive Income - - 23 45
Total Comprehensive Income 40 109 122 208
Total Comprehensive Income Margin 6.8% 14.4% -53% 6.9% 10.8% -39%
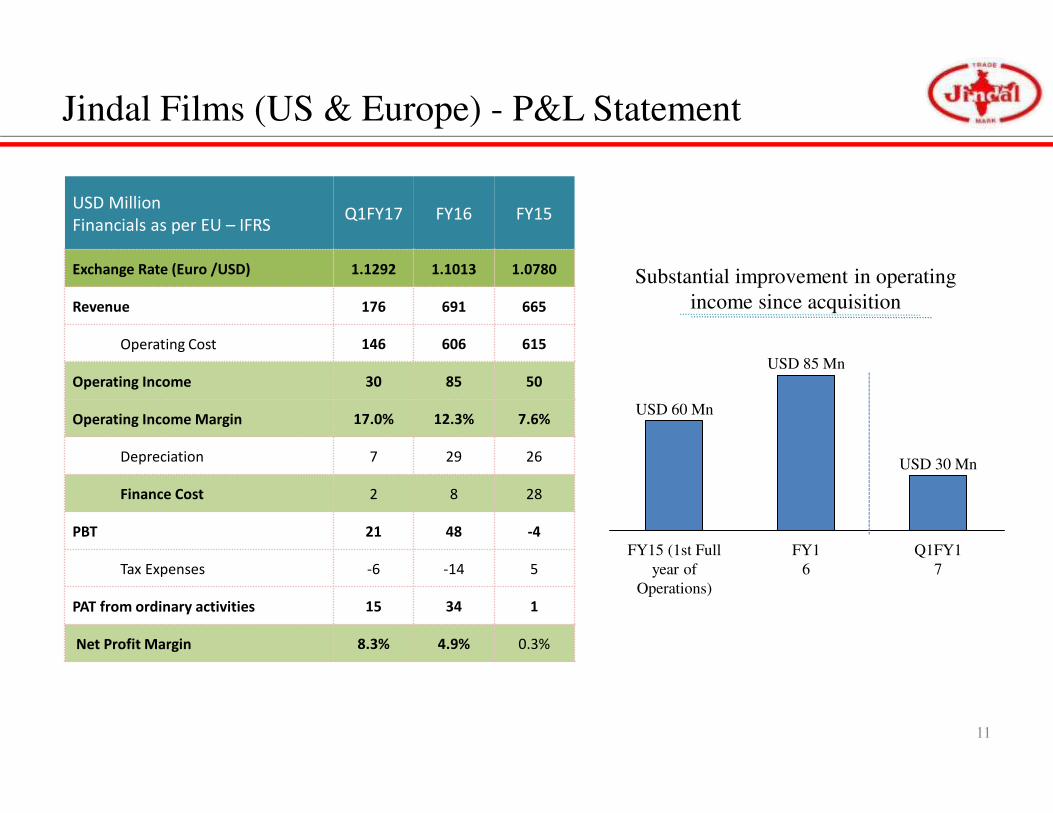
Jindal Films (US & Europe) - P&L Statement
11
USD Million
Financials as per EU – IFRSQ1FY17 FY16 FY15
Exchange Rate (Euro /USD) 1.1292 1.1013 1.0780
Revenue 176 691 665
Operating Cost 146 606 615
Operating Income 30 85 50
Operating Income Margin 17.0% 12.3% 7.6%
Depreciation 7 29 26
Finance Cost 2 8 28
PBT 21 48 -4
Tax Expenses -6 -14 5
PAT from ordinary activities 15 34 1
Net Profit Margin 8.3% 4.9% 0.3%
Substantial improvement in operating
income since acquisition
Q1FY1
7
USD 30 Mn
USD 60 Mn
USD 85 Mn
FY15 (1st Full
year of
Operations)
FY1
6
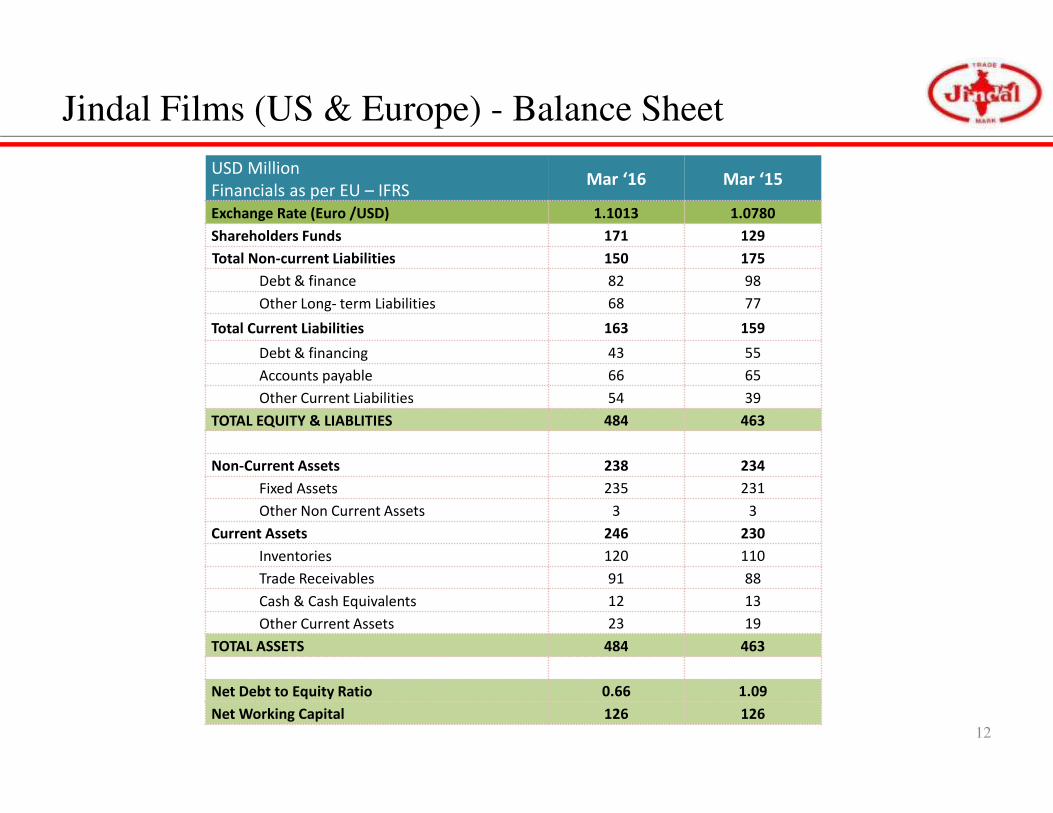
Jindal Films (US & Europe) - Balance Sheet
USD Million
Financials as per EU – IFRSMar ‘16 Mar ‘15
Exchange Rate (Euro /USD) 1.1013 1.0780
Shareholders Funds 171 129
Total Non-current Liabilities 150 175
Debt & finance 82 98
Other Long- term Liabilities 68 77
Total Current Liabilities 163 159
Debt & financing 43 55
Accounts payable 66 65
Other Current Liabilities 54 39
TOTAL EQUITY & LIABLITIES 484 463
Non-Current Assets 238 234
Fixed Assets 235 231
Other Non Current Assets 3 3
Current Assets 246 230
Inventories 120 110
Trade Receivables 91 88
Cash & Cash Equivalents 12 13
Other Current Assets 23 19
TOTAL ASSETS 484 463
Net Debt to Equity Ratio 0.66 1.09
Net Working Capital 126 126
12
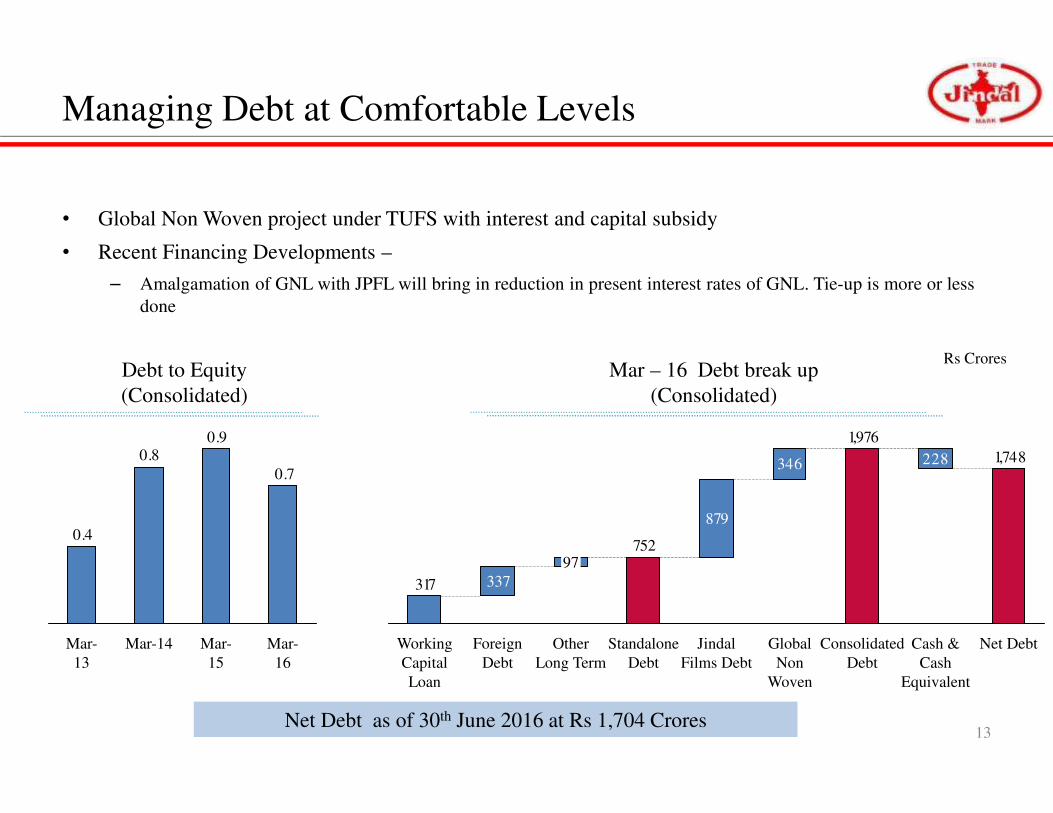
Managing Debt at Comfortable Levels
• Global Non Woven project under TUFS with interest and capital subsidy
• Recent Financing Developments –
– Amalgamation of GNL with JPFL will bring in reduction in present interest rates of GNL. Tie-up is more or less
done
1,748228346
317
1,976
879
752
337
Foreign
Debt
97
Standalone
Debt
Working
Capital
Loan
Jindal
Films Debt
Other
Long Term
Consolidated
Debt
Net DebtCash &
Cash
Equivalent
Global
Non
Woven
Rs CroresMar – 16 Debt break up
(Consolidated)
0.90.8
0.4
0.7
Mar-
16
Mar-14Mar-
13
Mar-
15
Debt to Equity
(Consolidated)
13Net Debt as of 30th June 2016 at Rs 1,704 Crores

Balance Sheet (As per Indian GAAP)
Particulars (Rs. in Crores) Standalone Consolidated
Mar ‘16 Mar ‘15 Mar ’16 Mar ‘15
Shareholders Funds
Net Worth 1,805 1,543 2,395 1,775
Minority Interest 641 468
Total Non-current Liabilities 564 436 1870 1954
Long-term borrowings 370 256 1,249 1,229
Other Long- term Liabilities 193 180 621 725
Total Current Liabilities 642 590 1807 1614
Short Term Borrowings 317 264 532 483
Trade Payables 158 205 616 636
Other Current Liabilities 167 121 659 496
TOTAL EQUITY & LIABLITIES 3,010 2,568 6,713 5,812
Non-Current Assets 2,203 1,686 4,116 3,434
Fixed Assets 1,441 1,199 3,403 2,994
Other Non Current Assets 762 487 713 440
Current Assets 808 883 2597 2378
Current Investment 41 126 69 139
Inventories 275 268 1,109 963
Trade Receivables 121 153 732 703
Cash & Cash Equivalents 53 39 158 125
Other Current Assets 318 296 528 447
TOTAL ASSETS 3,010 2,568 6,713 5,812
Net Debt 657 384 1,748 1,606
Net Debt to Equity Ratio 0.4 0.25 0.7 0.9
Net Working Capital 237 216 1,225 1,03114

Company : Investor Relations Advisors :
Jindal Poly Films Ltd
CIN: L17111UP1974PLC003979
Mr. Manoj Gupta – CFO
Email: [email protected]
www.jindalpoly.com
Strategic Growth Advisors Pvt. Ltd.
CIN: U74140MH2010PTC204285
Ms. Ruchi Rudra
www.sgapl.net
For further information, please contact:
Safe Harbor
This presentation and the accompanying slides (the “Presentation”), which have been prepared by Jindal Poly Films Ltd (the “Company”), have been preparedsolely for information purposes and do not constitute any offer, recommendation or invitation to purchase or subscribe for any securities, and shall not form thebasis or be relied on in connection with any contract or binding commitment whatsoever. No offering of securities of the Company will be made except bymeans of a statutory offering document containing detailed information about the Company.
This Presentation has been prepared by the Company based on information and data which the Company considers reliable, but the Company makes norepresentation or warranty, express or implied, whatsoever, and no reliance shall be placed on, the truth, accuracy, completeness, fairness and reasonablenessof the contents of this Presentation. This Presentation may not be all inclusive and may not contain all of the information that you may consider material. Anyliability in respect of the contents of, or any omission from, this Presentation is expressly excluded.
This presentation contains certain forward looking statements concerning the Company’s future business prospects and business profitability, which are subjectto a number of risks and uncertainties and the actual results could materially differ from those in such forward looking statements. The risks and uncertaintiesrelating to these statements include, but are not limited to, risks and uncertainties regarding fluctuations in earnings, our ability to manage growth, competition(both domestic and international), economic growth in India and abroad, ability to attract and retain highly skilled professionals, time and cost over runs oncontracts, our ability to manage our international operations, government policies and actions regulations, interest and other fiscal costs generally prevailing inthe economy. The company does not undertake to make any announcement in case any of these forward looking statements become materially incorrect infuture or update any forward looking statements made from time to time by or on behalf of the company.
15