Q1 2017 Results PLAY Investor Presentation · Investor Presentation . 2 Disclaimer ... Adjusted...
19
PLAY, May 2017 Q1 2017 Results PLAY Investor Presentation
Transcript of Q1 2017 Results PLAY Investor Presentation · Investor Presentation . 2 Disclaimer ... Adjusted...

PLAY, May 2017
Q1 2017 Results PLAY Investor Presentation
2
Disclaimer
Play
This presentation has been prepared by P4 Sp. z o.o. (“PLAY”). The information contained in this presentation is for information purposes only. This presentation does not constitute or form part of and should not
be construed as an offer to sell or issue or the solicitation of an offer to buy or acquire interests or securities of PLAY or any of its subsidiaries or affiliates in any jurisdiction or an inducement to enter into
investment activity. No part of this presentation, nor the fact of its distribution, should form the basis of, or be relied on in connection with, any contract or commitment or investment decision whatsoever.
Certain financial data included in the presentation are “non-IFRS financial measures.” These non-IFRS financial measures may not be comparable to similarly titled measures presented by other entities, nor should
they be construed as an alternative to other financial measures determined in accordance with International Financial Reporting Standards. Although PLAY believes these non-IFRS financial measures provide useful
information to users in measuring the financial performance and condition of its business, users are cautioned not to place undue reliance on any non-IFRS financial measures and ratios included in this presentation.
Financial data are presented in zloty rounded to the nearest thousand. Therefore, discrepancies in the tables between totals and the sums of the amounts listed may occur due to such rounding.
Forward Looking Statements
This presentation contains forward looking statements. Examples of these forward looking statements include, but are not limited to statements of plans, objectives or goals and statements of assumptions
underlying those statements. Words such as “may”, “will”, “expect”, “intend”, “plan”, “estimate”, “anticipate”, “believe”, “continue”, “probability”, “risk” and other similar words are intended to identify forward looking
statements but are not the exclusive means of identifying those statements. By their very nature, forward looking statements involve inherent risks and uncertainties, both general and specific, and risks exist that
such predictions, forecasts, projections and other forward looking statements will not be achieved. A number of important factors could cause our actual results to differ materially from the plans, objectives,
expectations, estimates and intentions expressed in such forward looking statements. Past performance of PLAY cannot be relied on as a guide to future performance. Forward looking statements speak only as at
the date of this presentation PLAY expressly disclaims any obligations or undertaking to release any update of, or revisions to, any forward looking statements in this presentation. No statement in this presentation is
intended to be a profit forecast. As such, undue reliance should not be placed on any forward looking statement.

Agenda
Business and StrategyJørgen
Bang-JensenCEO
Financial PerformanceHolger Püchert
CFO
3 Play
4
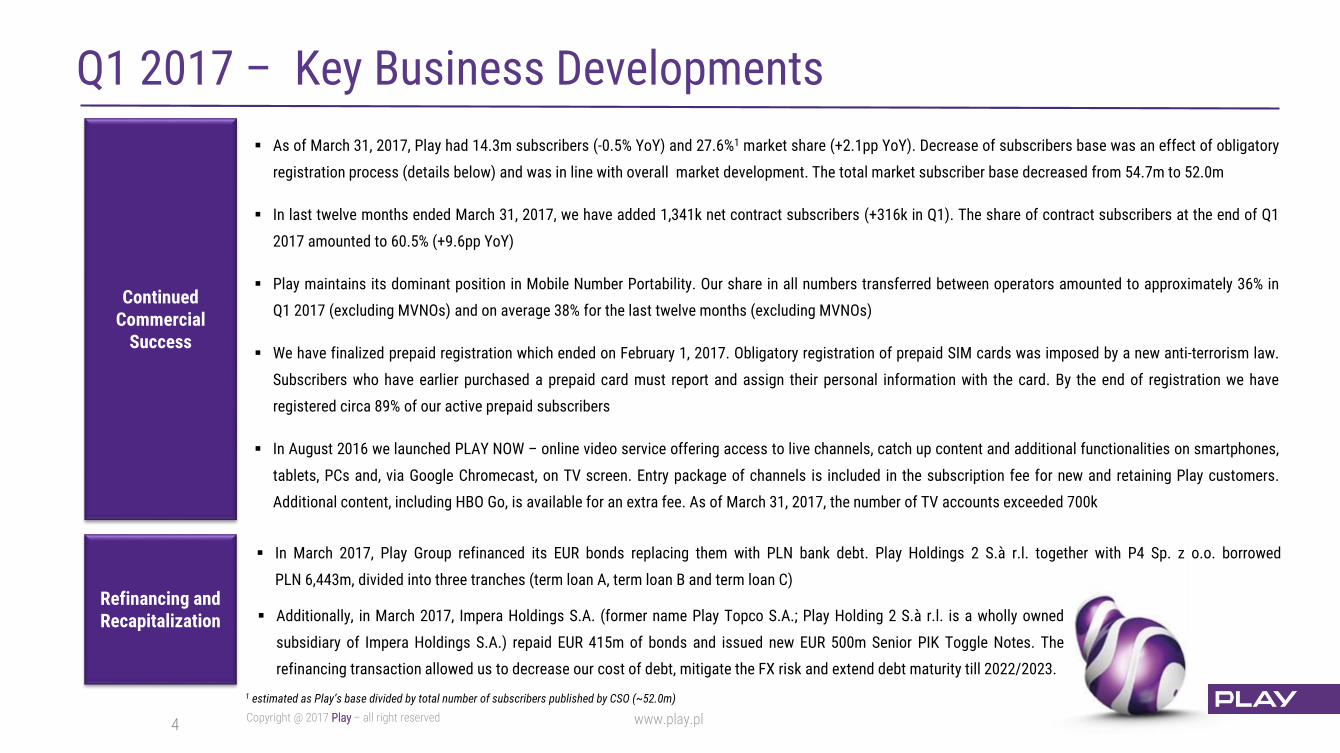
Q1 2017 – Key Business Developments
Play
Continued Commercial
Success
As of March 31, 2017, Play had 14.3m subscribers (-0.5% YoY) and 27.6%1 market share (+2.1pp YoY). Decrease of subscribers base was an effect of obligatory
registration process (details below) and was in line with overall market development. The total market subscriber base decreased from 54.7m to 52.0m
In last twelve months ended March 31, 2017, we have added 1,341k net contract subscribers (+316k in Q1). The share of contract subscribers at the end of Q1
2017 amounted to 60.5% (+9.6pp YoY)
Play maintains its dominant position in Mobile Number Portability. Our share in all numbers transferred between operators amounted to approximately 36% in
Q1 2017 (excluding MVNOs) and on average 38% for the last twelve months (excluding MVNOs)
We have finalized prepaid registration which ended on February 1, 2017. Obligatory registration of prepaid SIM cards was imposed by a new anti-terrorism law.
Subscribers who have earlier purchased a prepaid card must report and assign their personal information with the card. By the end of registration we have
registered circa 89% of our active prepaid subscribers
In August 2016 we launched PLAY NOW – online video service offering access to live channels, catch up content and additional functionalities on smartphones,
tablets, PCs and, via Google Chromecast, on TV screen. Entry package of channels is included in the subscription fee for new and retaining Play customers.
Additional content, including HBO Go, is available for an extra fee. As of March 31, 2017, the number of TV accounts exceeded 700k
Refinancing and Recapitalization
In March 2017, Play Group refinanced its EUR bonds replacing them with PLN bank debt. Play Holdings 2 S.à r.l. together with P4 Sp. z o.o. borrowed
PLN 6,443m, divided into three tranches (term loan A, term loan B and term loan C)
Additionally, in March 2017, Impera Holdings S.A. (former name Play Topco S.A.; Play Holding 2 S.à r.l. is a wholly owned
subsidiary of Impera Holdings S.A.) repaid EUR 415m of bonds and issued new EUR 500m Senior PIK Toggle Notes. The
refinancing transaction allowed us to decrease our cost of debt, mitigate the FX risk and extend debt maturity till 2022/2023.
1 estimated as Play’s base divided by total number of subscribers published by CSO (~52.0m)
5
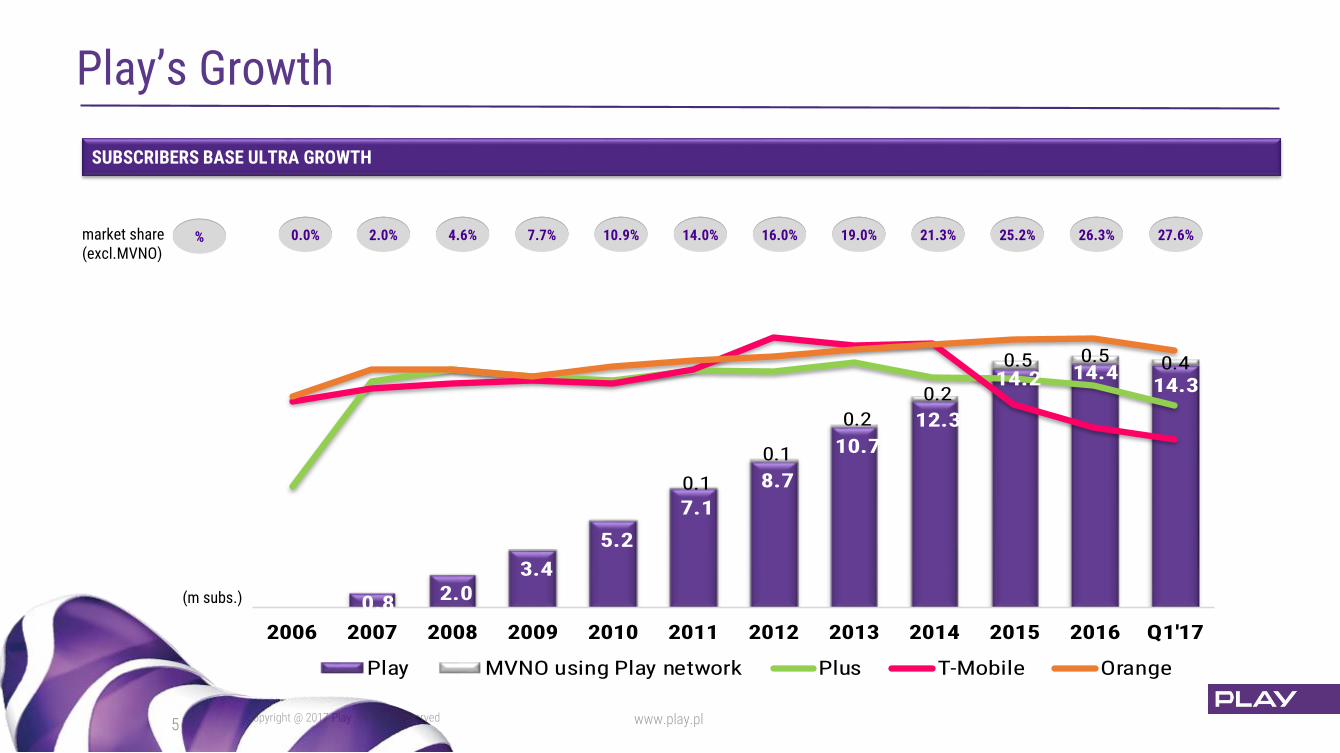
Play’s Growth
Play
0 0.8 2.0 3.4
5.2
7.1
8.7
10.7
12.3
14.2 14.414.3
0.1
0.1
0.2
0.2
0.5 0.5 0.4
2006 2007 2008 2009 2010 2011 2012 2013 2014 2015 2016 Q1'17
Play MVNO using Play network Plus T-Mobile Orange
27.6%26.3%21.3% 25.2%19.0%16.0%14.0%10.9%7.7%4.6%2.0%0.0%%market share(excl.MVNO)
SUBSCRIBERS BASE ULTRA GROWTH
(m subs.)
6
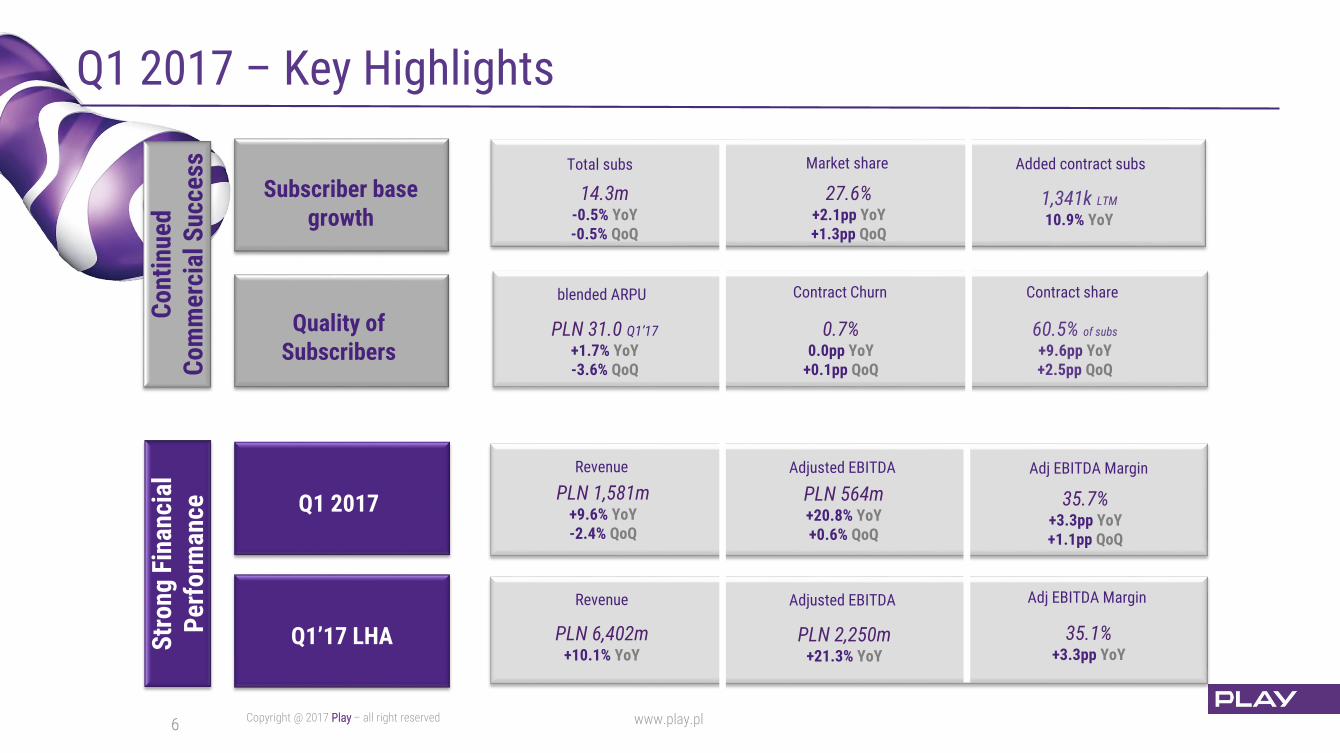
Q1 2017 – Key Highlights
Play
Con
tinu
ed
Com
mer
cial
Suc
cess Total subs Market share
14.3m-0.5% YoY-0.5% QoQ
27.6%+2.1pp YoY+1.3pp QoQ
PLN 31.0 Q1’17
+1.7% YoY-3.6% QoQ
blended ARPU
0.7%0.0pp YoY
+0.1pp QoQ
Contract Churn
60.5% of subs
+9.6pp YoY+2.5pp QoQ
Contract share
Subscriber base growth
Quality of Subscribers
1,341k LTM
10.9% YoY
Added contract subsS
tron
g F
inan
cial
P
erfo
rman
ce Q1 2017PLN 1,581m
+9.6% YoY-2.4% QoQ
Revenue
Q1’17 LHA
PLN 564m+20.8% YoY+0.6% QoQ
Adjusted EBITDA
PLN 6,402m+10.1% YoY
PLN 2,250m+21.3% YoY
Adj EBITDA Margin
35.7%+3.3pp YoY+1.1pp QoQ
35.1%+3.3pp YoY
Revenue Adjusted EBITDA Adj EBITDA Margin
17.1 18.1 17.8 16.3
Q2'16 Q3'16 Q4'16 Q1'17
39.0 39.0 39.4 38.2
Q2'16 Q3'16 Q4'16 Q1'17
7
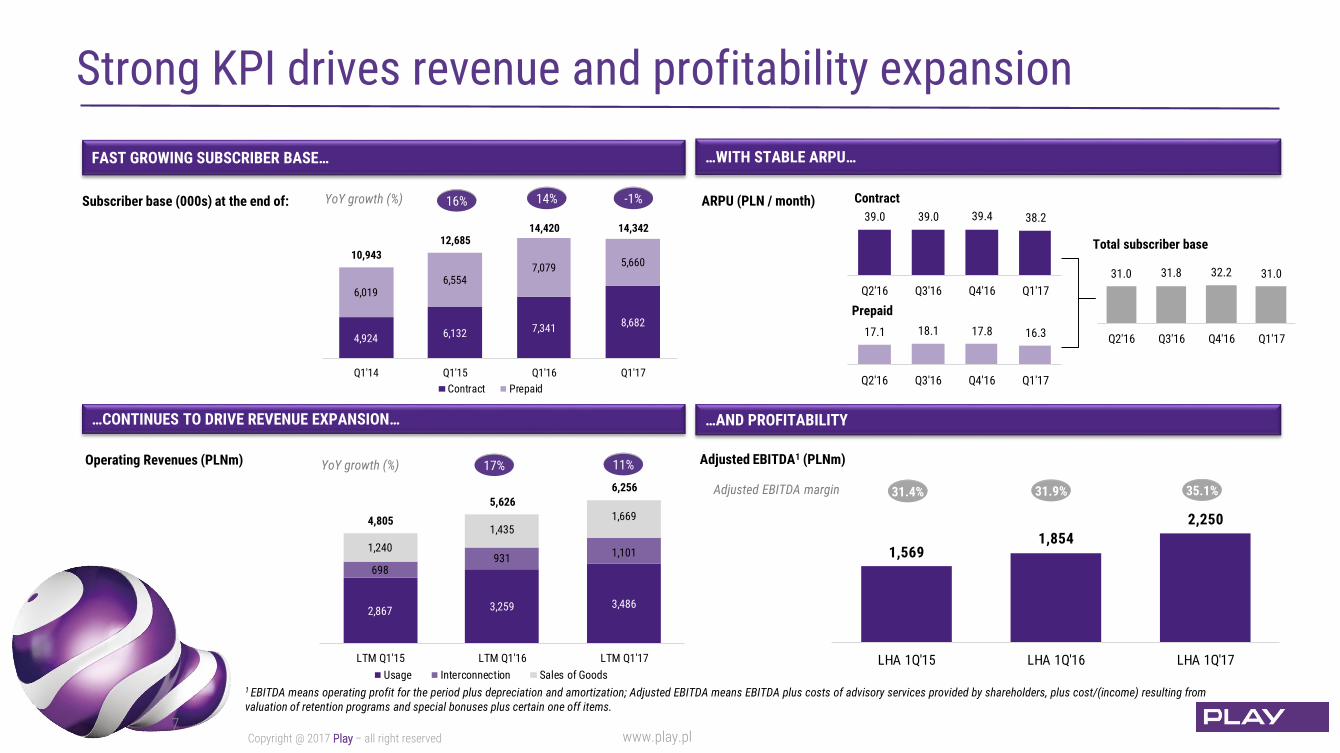
Strong KPI drives revenue and profitability expansion
Play
FAST GROWING SUBSCRIBER BASE… …WITH STABLE ARPU…
Contract
Prepaid
YoY growth (%)
Adjusted EBITDA1 (PLNm)
…CONTINUES TO DRIVE REVENUE EXPANSION… …AND PROFITABILITY
Adjusted EBITDA margin
YoY growth (%)
31.4% 35.1%
Operating Revenues (PLNm)
ARPU (PLN / month)Subscriber base (000s) at the end of:
Total subscriber base
16% 14% -1%
31.9%
17% 11%
1 EBITDA means operating profit for the period plus depreciation and amortization; Adjusted EBITDA means EBITDA plus costs of advisory services provided by shareholders, plus cost/(income) resulting fromvaluation of retention programs and special bonuses plus certain one off items.
4,924 6,132 7,3418,682
6,0196,554
7,079 5,66010,943
12,68514,420 14,342
Q1'14 Q1'15 Q1'16 Q1'17
Contract Prepaid
31.0 31.8 32.2 31.0
Q2'16 Q3'16 Q4'16 Q1'17
1,5691,854
2,250
LHA 1Q'15 LHA 1Q'16 LHA 1Q'17
2,867 3,259 3,486
698931 1,1011,240
1,4351,6694,805
5,626
6,256
LTM Q1'15 LTM Q1'16 LTM Q1'17
Usage Interconnection Sales of Goods
8
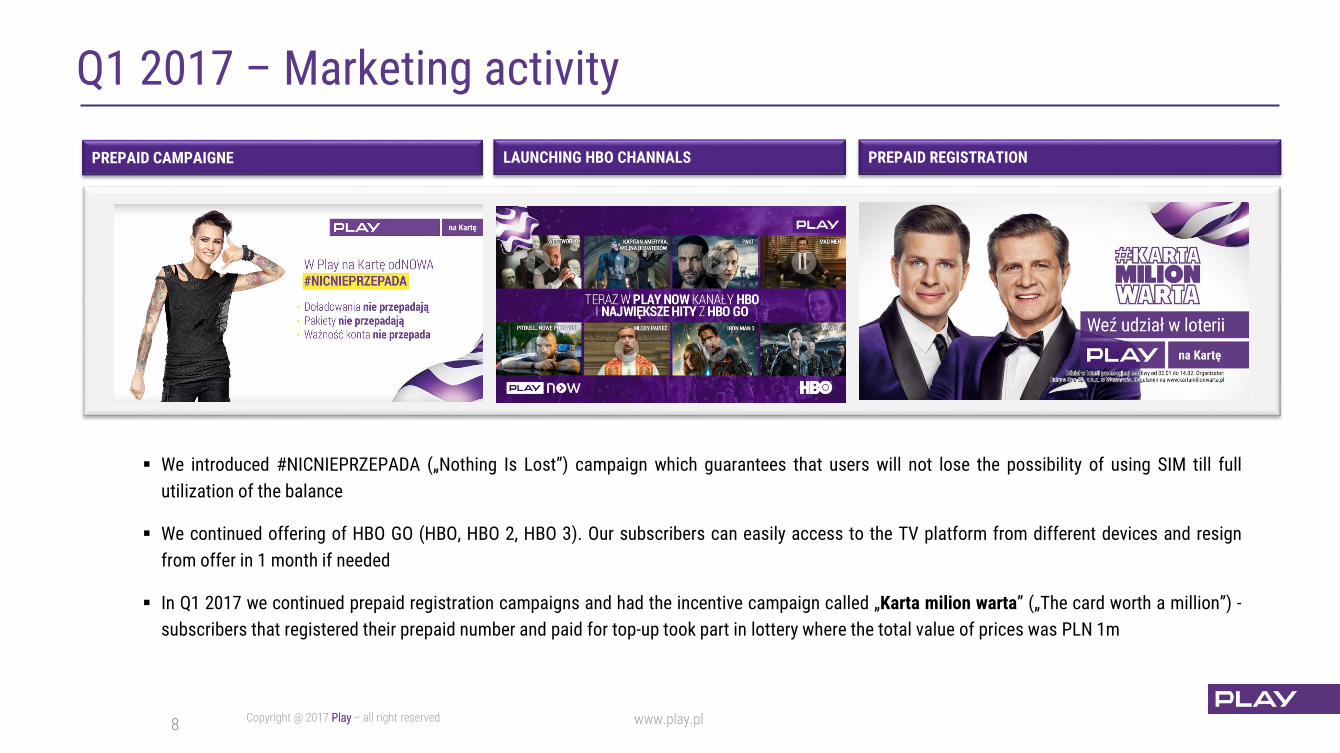
Q1 2017 – Marketing activity
Play
We introduced #NICNIEPRZEPADA („Nothing Is Lost”) campaign which guarantees that users will not lose the possibility of using SIM till full
utilization of the balance
We continued offering of HBO GO (HBO, HBO 2, HBO 3). Our subscribers can easily access to the TV platform from different devices and resign
from offer in 1 month if needed
In Q1 2017 we continued prepaid registration campaigns and had the incentive campaign called „Karta milion warta” („The card worth a million”) -
subscribers that registered their prepaid number and paid for top-up took part in lottery where the total value of prices was PLN 1m
PREPAID CAMPAIGNE LAUNCHING HBO CHANNALS PREPAID REGISTRATION
9
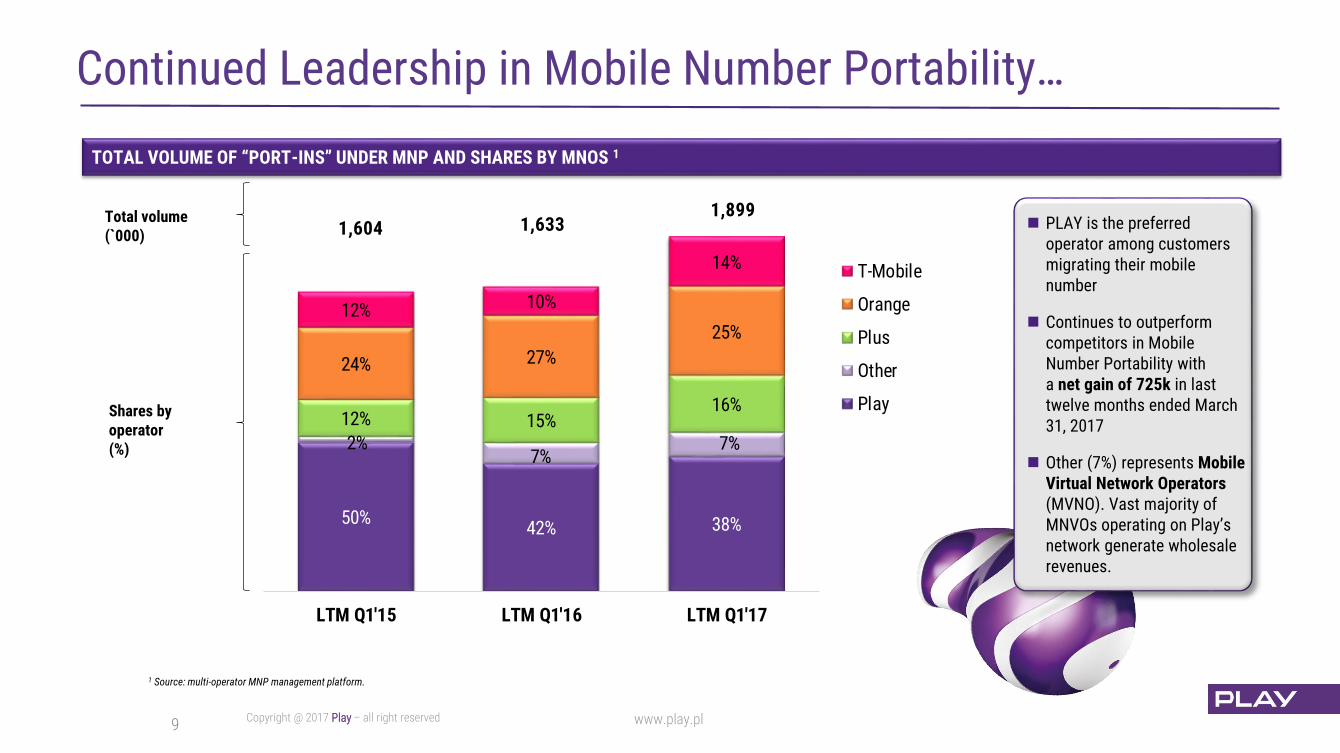
Continued Leadership in Mobile Number Portability…
Play
TOTAL VOLUME OF “PORT-INS” UNDER MNP AND SHARES BY MNOS 1
1 Source: multi-operator MNP management platform.
PLAY is the preferred operator among customers migrating their mobile number
Continues to outperform competitors in Mobile Number Portability with a net gain of 725k in last twelve months ended March31, 2017
Other (7%) represents Mobile Virtual Network Operators (MVNO). Vast majority of MNVOs operating on Play’s network generate wholesale revenues.
Total volume (`000)
Shares by operator (%)
50%42% 38%
2%7%
7%
12% 15%16%
24% 27%
25%12% 10%
14%
1,604 1,6331,899
LTM Q1'15 LTM Q1'16 LTM Q1'17
T-Mobile
Orange
Plus
Other
Play

Agenda
Business and StrategyJørgen
Bang-JensenCEO
Financial PerformanceHolger Püchert
CFO
10 Play
11
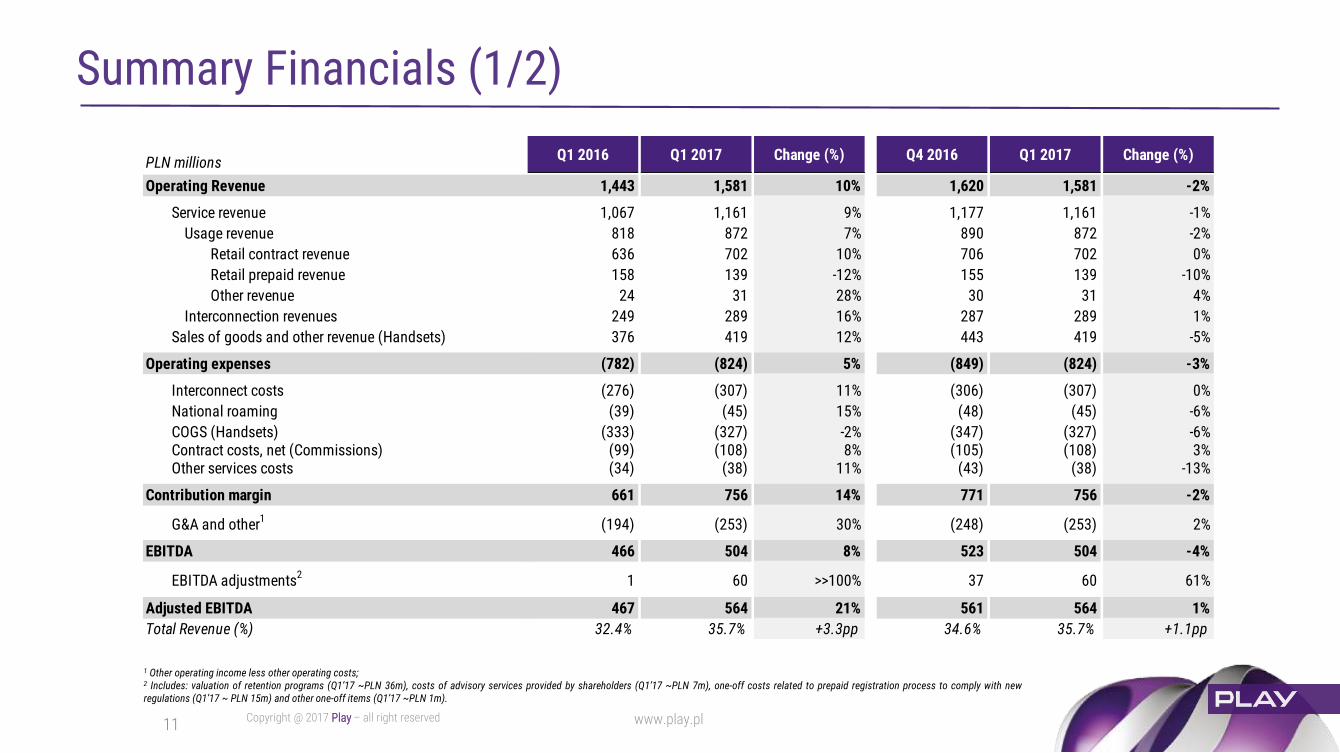
Summary Financials (1/2)
Play
1 Other operating income less other operating costs;2 Includes: valuation of retention programs (Q1’17 ~PLN 36m), costs of advisory services provided by shareholders (Q1’17 ~PLN 7m), one-off costs related to prepaid registration process to comply with newregulations (Q1’17 ~ PLN 15m) and other one-off items (Q1’17 ~PLN 1m).
PLN millionsQ1 2016 Q1 2017 Change (%) Q4 2016 Q1 2017 Change (%)
Operating Revenue 1,443 1,581 10% 1,620 1,581 -2%
Service revenue 1,067 1,161 9% 1,177 1,161 -1%
Usage revenue 818 872 7% 890 872 -2%
Retail contract revenue 636 702 10% 706 702 0%
Retail prepaid revenue 158 139 -12% 155 139 -10%
Other revenue 24 31 28% 30 31 4%
Interconnection revenues 249 289 16% 287 289 1%
Sales of goods and other revenue (Handsets) 376 419 12% 443 419 -5%
Operating expenses (782) (824) 5% (849) (824) -3%
Interconnect costs (276) (307) 11% (306) (307) 0%
National roaming (39) (45) 15% (48) (45) -6%
COGS (Handsets) (333) (327) -2% (347) (327) -6%Contract costs, net (Commissions) (99) (108) 8% (105) (108) 3%Other services costs (34) (38) 11% (43) (38) -13%
Contribution margin 661 756 14% 771 756 -2%
G&A and other1
(194) (253) 30% (248) (253) 2%
EBITDA 466 504 8% 523 504 -4%
EBITDA adjustments2 1 60 >>100% 37 60 61%
Adjusted EBITDA 467 564 21% 561 564 1%
Total Revenue (%) 32.4% 35.7% +3.3pp 34.6% 35.7% +1.1pp
12
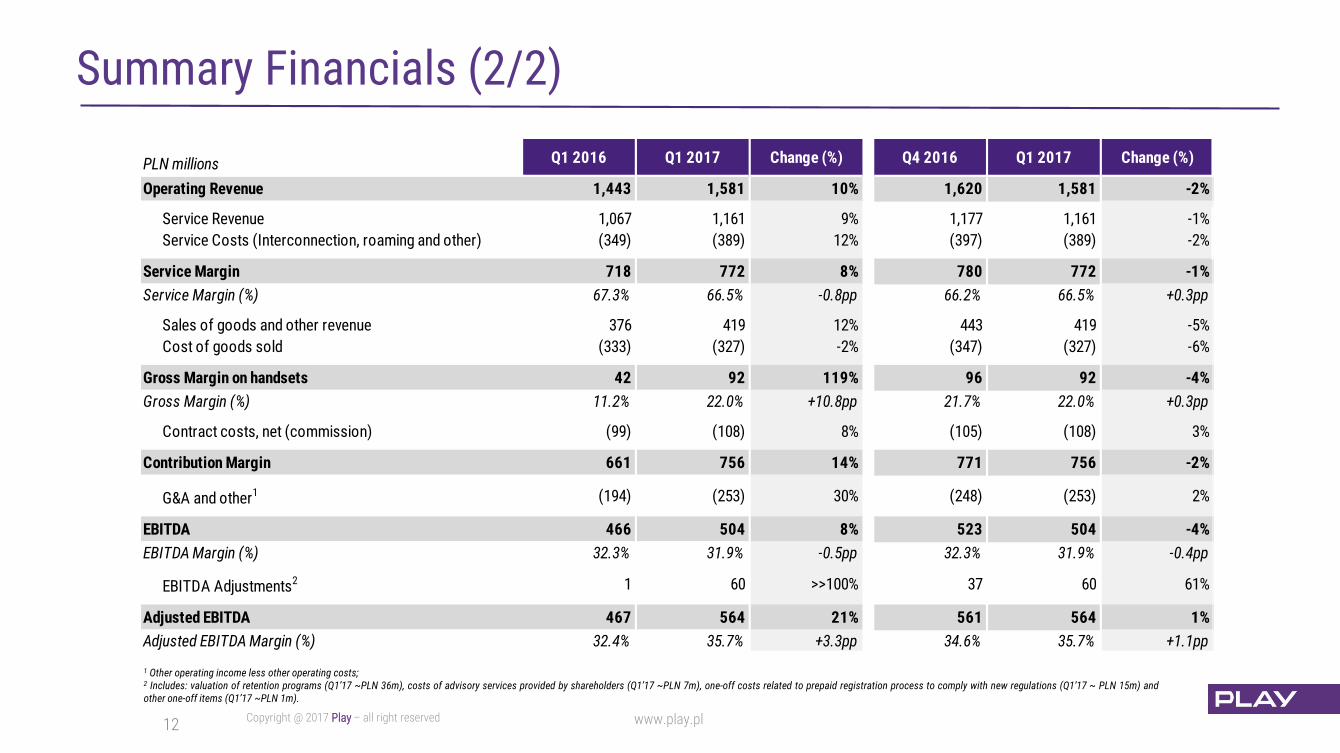
Summary Financials (2/2)
Play
PLN millions Q1 2016 Q1 2017 Change (%) Q4 2016 Q1 2017 Change (%)
Operating Revenue 1,443 1,581 10% 1,620 1,581 -2%
Service Revenue 1,067 1,161 9% 1,177 1,161 -1%
Service Costs (Interconnection, roaming and other) (349) (389) 12% (397) (389) -2%
Service Margin 718 772 8% 780 772 -1%
Service Margin (%) 67.3% 66.5% -0.8pp 66.2% 66.5% +0.3pp
Sales of goods and other revenue 376 419 12% 443 419 -5%
Cost of goods sold (333) (327) -2% (347) (327) -6%
Gross Margin on handsets 42 92 119% 96 92 -4%
Gross Margin (%) 11.2% 22.0% +10.8pp 21.7% 22.0% +0.3pp
Contract costs, net (commission) (99) (108) 8% (105) (108) 3%
Contribution Margin 661 756 14% 771 756 -2%
G&A and other1 (194) (253) 30% (248) (253) 2%
EBITDA 466 504 8% 523 504 -4%
EBITDA Margin (%) 32.3% 31.9% -0.5pp 32.3% 31.9% -0.4pp
EBITDA Adjustments2 1 60 >>100% 37 60 61%
Adjusted EBITDA 467 564 21% 561 564 1%
Adjusted EBITDA Margin (%) 32.4% 35.7% +3.3pp 34.6% 35.7% +1.1pp
1 Other operating income less other operating costs;2 Includes: valuation of retention programs (Q1’17 ~PLN 36m), costs of advisory services provided by shareholders (Q1’17 ~PLN 7m), one-off costs related to prepaid registration process to comply with new regulations (Q1’17 ~ PLN 15m) andother one-off items (Q1’17 ~PLN 1m).
13
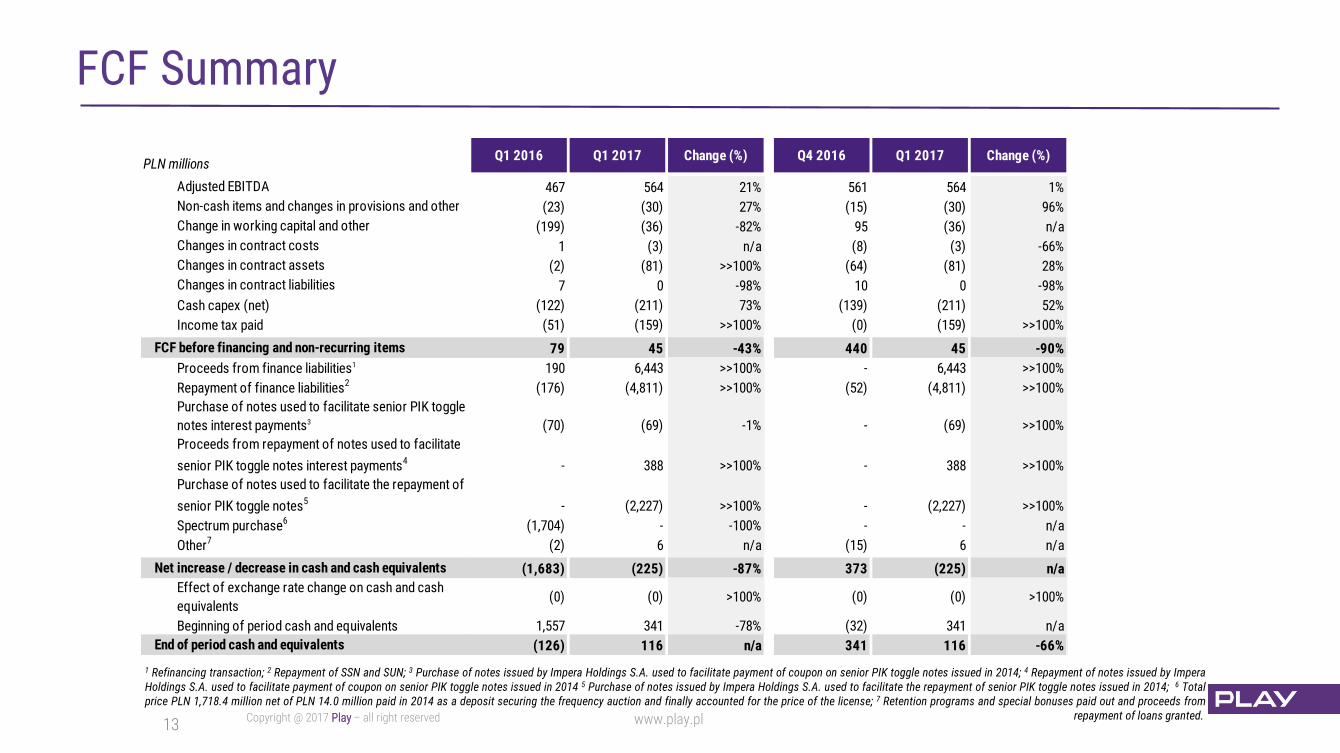
FCF Summary
Play
1 Refinancing transaction; 2 Repayment of SSN and SUN; 3 Purchase of notes issued by Impera Holdings S.A. used to facilitate payment of coupon on senior PIK toggle notes issued in 2014; 4 Repayment of notes issued by ImperaHoldings S.A. used to facilitate payment of coupon on senior PIK toggle notes issued in 2014 5 Purchase of notes issued by Impera Holdings S.A. used to facilitate the repayment of senior PIK toggle notes issued in 2014; 6 Totalprice PLN 1,718.4 million net of PLN 14.0 million paid in 2014 as a deposit securing the frequency auction and finally accounted for the price of the license; 7 Retention programs and special bonuses paid out and proceeds from
repayment of loans granted.
PLN millionsQ1 2016 Q1 2017 Change (%) Q4 2016 Q1 2017 Change (%)
Adjusted EBITDA 467 564 21% 561 564 1%
Non-cash items and changes in provisions and other (23) (30) 27% (15) (30) 96%
Change in working capital and other (199) (36) -82% 95 (36) n/a
Changes in contract costs 1 (3) n/a (8) (3) -66%
Changes in contract assets (2) (81) >>100% (64) (81) 28%
Changes in contract liabilities 7 0 -98% 10 0 -98%
Cash capex (net) (122) (211) 73% (139) (211) 52%
Income tax paid (51) (159) >>100% (0) (159) >>100%0 0 0 0
FCF before financing and non-recurring items 79 45 -43% 440 45 -90%
Proceeds from finance liabilities1 190 6,443 >>100% - 6,443 >>100%
Repayment of finance liabilities2 (176) (4,811) >>100% (52) (4,811) >>100%
Purchase of notes used to facilitate senior PIK toggle
notes interest payments3 (70) (69) -1% - (69) >>100%
Proceeds from repayment of notes used to facilitate
senior PIK toggle notes interest payments4 - 388 >>100% - 388 >>100%
Purchase of notes used to facilitate the repayment of
senior PIK toggle notes5 - (2,227) >>100% - (2,227) >>100%
Spectrum purchase6 (1,704) - -100% - - n/a
Other7 (2) 6 n/a (15) 6 n/a
Net increase / decrease in cash and cash equivalents (1,683) (225) -87% 373 (225) n/a
Effect of exchange rate change on cash and cash
equivalents(0) (0) >100% (0) (0) >100%
Beginning of period cash and equivalents 1,557 341 -78% (32) 341 n/a
End of period cash and equivalents (126) 116 n/a 341 116 -66%
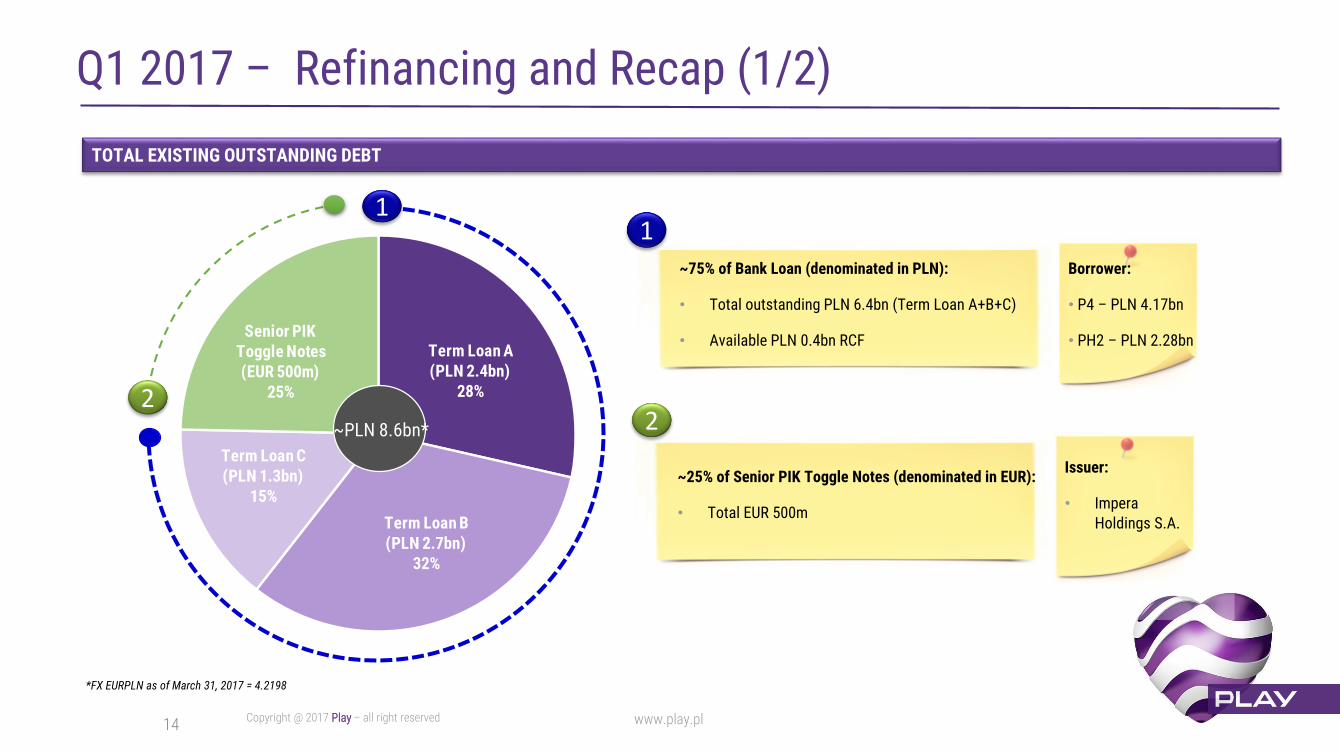
Term Loan A (PLN 2.4bn)
28%
Term Loan B (PLN 2.7bn)
32%
Term Loan C (PLN 1.3bn)
15%
Senior PIK Toggle Notes (EUR 500m)
25%
14
Q1 2017 – Refinancing and Recap (1/2)
Play
TOTAL EXISTING OUTSTANDING DEBT
~PLN 8.6bn*
1
2
~25% of Senior PIK Toggle Notes (denominated in EUR):
• Total EUR 500m
~75% of Bank Loan (denominated in PLN):
• Total outstanding PLN 6.4bn (Term Loan A+B+C)
• Available PLN 0.4bn RCF
Issuer:
• ImperaHoldings S.A.
Borrower:
• P4 – PLN 4.17bn
• PH2 – PLN 2.28bn
2
1
*FX EURPLN as of March 31, 2017 = 4.2198
15
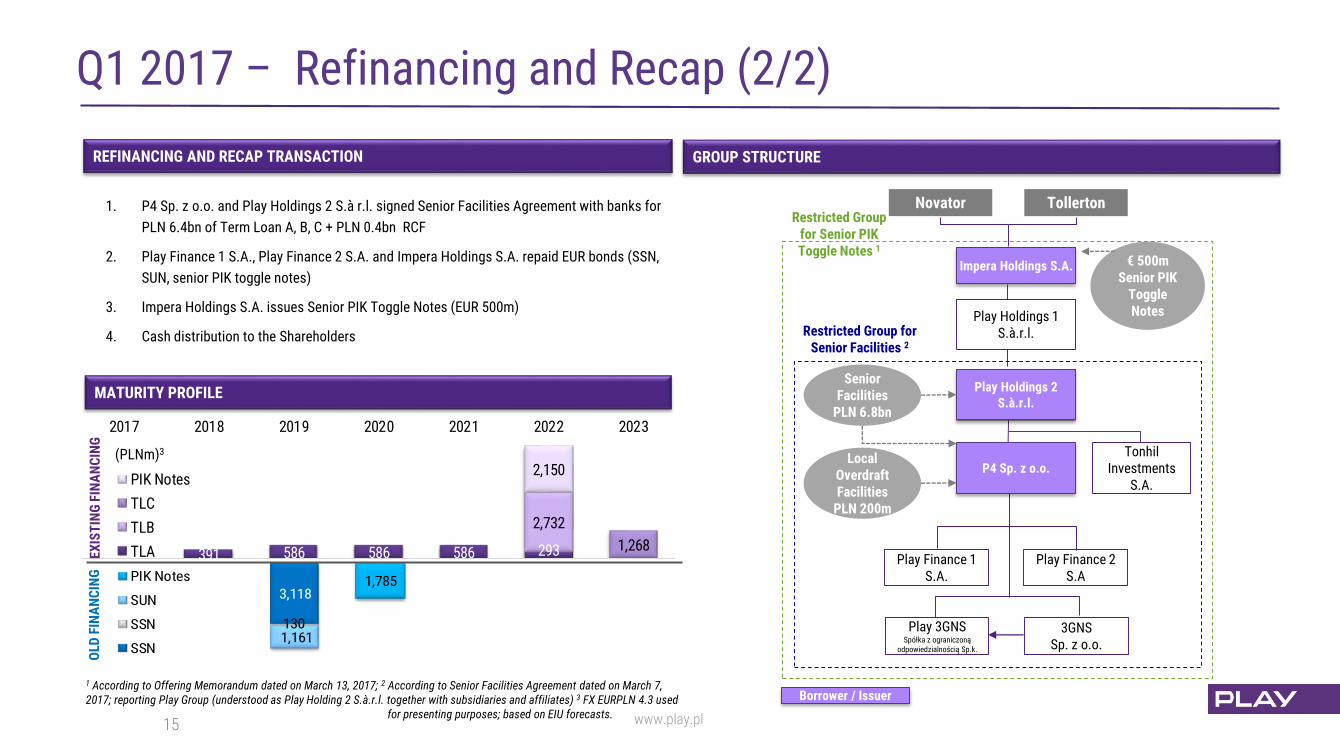
Q1 2017 – Refinancing and Recap (2/2)
Play
REFINANCING AND RECAP TRANSACTION
Novator Tollerton
TonhilInvestments
S.A.
Play Holdings 2 S.à.r.l.
€ 500m Senior PIK
Toggle Notes
Impera Holdings S.A.
Local Overdraft Facilities
PLN 200m
P4 Sp. z o.o.
Play Finance 2 S.A
3GNS Sp. z o.o.
Play 3GNSSpółka z ograniczoną
odpowiedzialnością Sp.k.
Play Holdings 1 S.à.r.l.
Senior Facilities
PLN 6.8bn
Play Finance 1 S.A.
Restricted Group for Senior PIK Toggle Notes 1
Restricted Group for Senior Facilities 2
Borrower / Issuer
GROUP STRUCTURE
1. P4 Sp. z o.o. and Play Holdings 2 S.à r.l. signed Senior Facilities Agreement with banks for
PLN 6.4bn of Term Loan A, B, C + PLN 0.4bn RCF
2. Play Finance 1 S.A., Play Finance 2 S.A. and Impera Holdings S.A. repaid EUR bonds (SSN,
SUN, senior PIK toggle notes)
3. Impera Holdings S.A. issues Senior PIK Toggle Notes (EUR 500m)
4. Cash distribution to the Shareholders
MATURITY PROFILE
391 586 586 586 293
2,732
1,268
2,150
2017 2018 2019 2020 2021 2022 2023
PIK Notes (PlayTopco*)
TLC
TLB
TLA
3,118
1301,161
1,785PIK Notes
SUN
SSN (PLN)
SSN (EUR)
OLD
FIN
AN
CIN
GEX
IST
ING
FIN
AN
CIN
G
15
(PLNm)3
1 According to Offering Memorandum dated on March 13, 2017; 2 According to Senior Facilities Agreement dated on March 7, 2017; reporting Play Group (understood as Play Holding 2 S.à.r.l. together with subsidiaries and affiliates) 3 FX EURPLN 4.3 used
for presenting purposes; based on EIU forecasts.
16
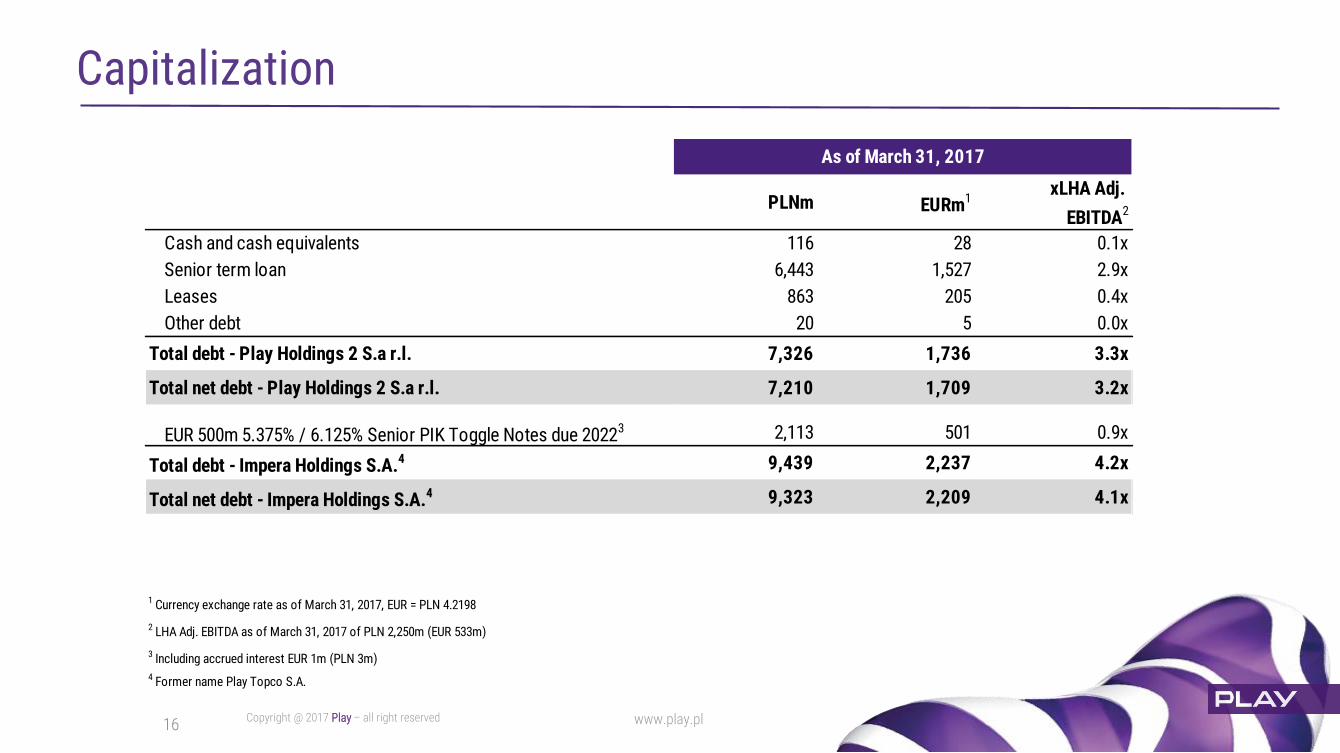
Capitalization
Play
1 Currency exchange rate as of March 31, 2017, EUR = PLN 4.2198
2 LHA Adj. EBITDA as of March 31, 2017 of PLN 2,250m (EUR 533m)
3 Including accrued interest EUR 1m (PLN 3m)
4 Former name Play Topco S.A.
PLNm EURm1xLHA Adj.
EBITDA2
Cash and cash equivalents 116 28 0.1x
Senior term loan 6,443 1,527 2.9x
Leases 863 205 0.4x
Other debt 20 5 0.0x
Total debt - Play Holdings 2 S.a r.l. 7,326 1,736 3.3x
Total net debt - Play Holdings 2 S.a r.l. 7,210 1,709 3.2x
EUR 500m 5.375% / 6.125% Senior PIK Toggle Notes due 20223 2,113 501 0.9x
Total debt - Impera Holdings S.A.4 9,439 2,237 4.2x
Total net debt - Impera Holdings S.A.4 9,323 2,209 4.1x
As of March 31, 2017
17
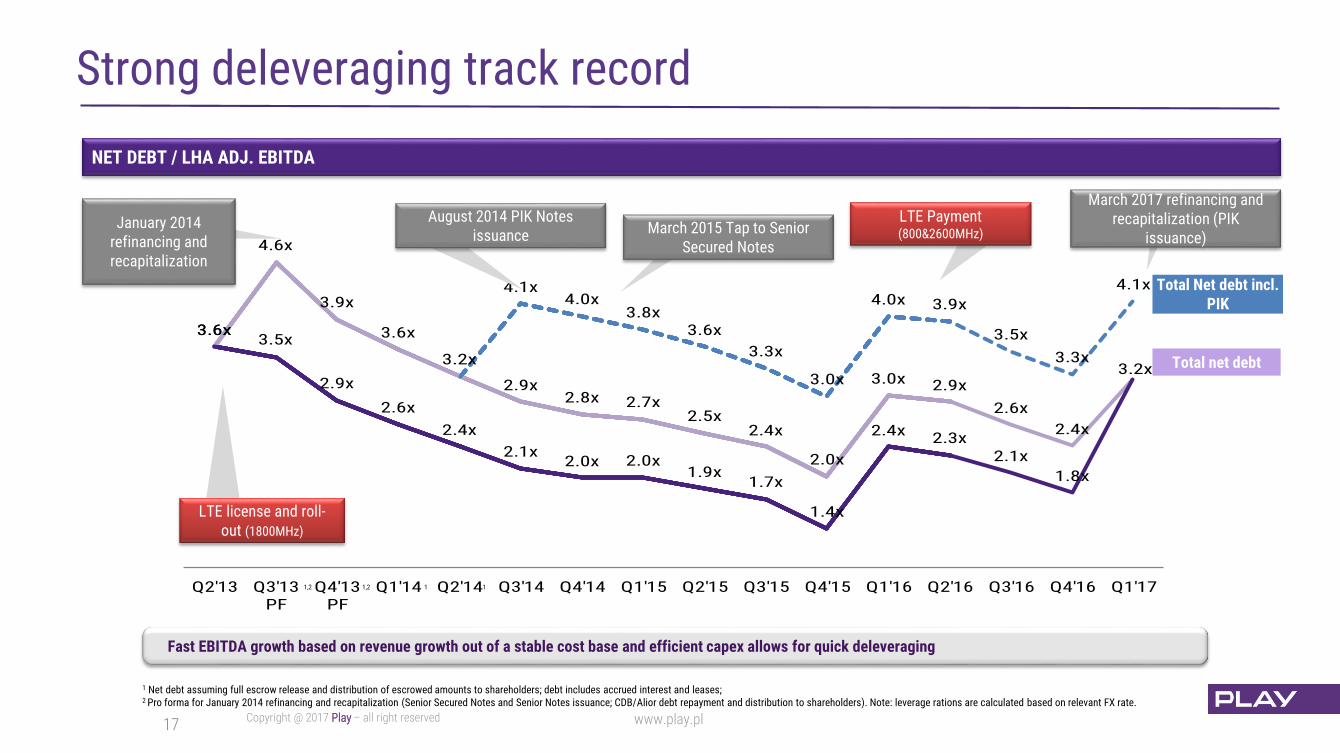
Strong deleveraging track record
Play
1 Net debt assuming full escrow release and distribution of escrowed amounts to shareholders; debt includes accrued interest and leases;2 Pro forma for January 2014 refinancing and recapitalization (Senior Secured Notes and Senior Notes issuance; CDB/Alior debt repayment and distribution to shareholders). Note: leverage rations are calculated based on relevant FX rate.
Fast EBITDA growth based on revenue growth out of a stable cost base and efficient capex allows for quick deleveraging
NET DEBT / LHA ADJ. EBITDA
2.6x
2.4x
2.1x
1.8x
3.2x
3.5x
3.3x
4.1x
3.6x
4.6x
3.9x
3.6x
3.2x
2.9x2.8x 2.7x
2.5x2.4x
2.0x
3.0x 2.9x
3.6x3.5x
2.9x
2.6x
2.4x
2.1x2.0x 2.0x
1.9x1.7x
1.4x
2.4x2.3x
4.1x4.0x
3.8x3.6x
3.3x
3.0x
4.0x 3.9x
Q2'13 Q3'13PF
Q4'13PF
Q1'14 Q2'14 Q3'14 Q4'14 Q1'15 Q2'15 Q3'15 Q4'15 Q1'16 Q2'16 Q3'16 Q4'16 Q1'17
January 2014 refinancing and recapitalization
LTE license and roll-out (1800MHz)
Total net debt
Total Net debt incl. PIK
1,2 1,2 1
March 2015 Tap to Senior Secured Notes
August 2014 PIK Notes issuance
LTE Payment (800&2600MHz)
1
March 2017 refinancing and recapitalization (PIK
issuance)
18
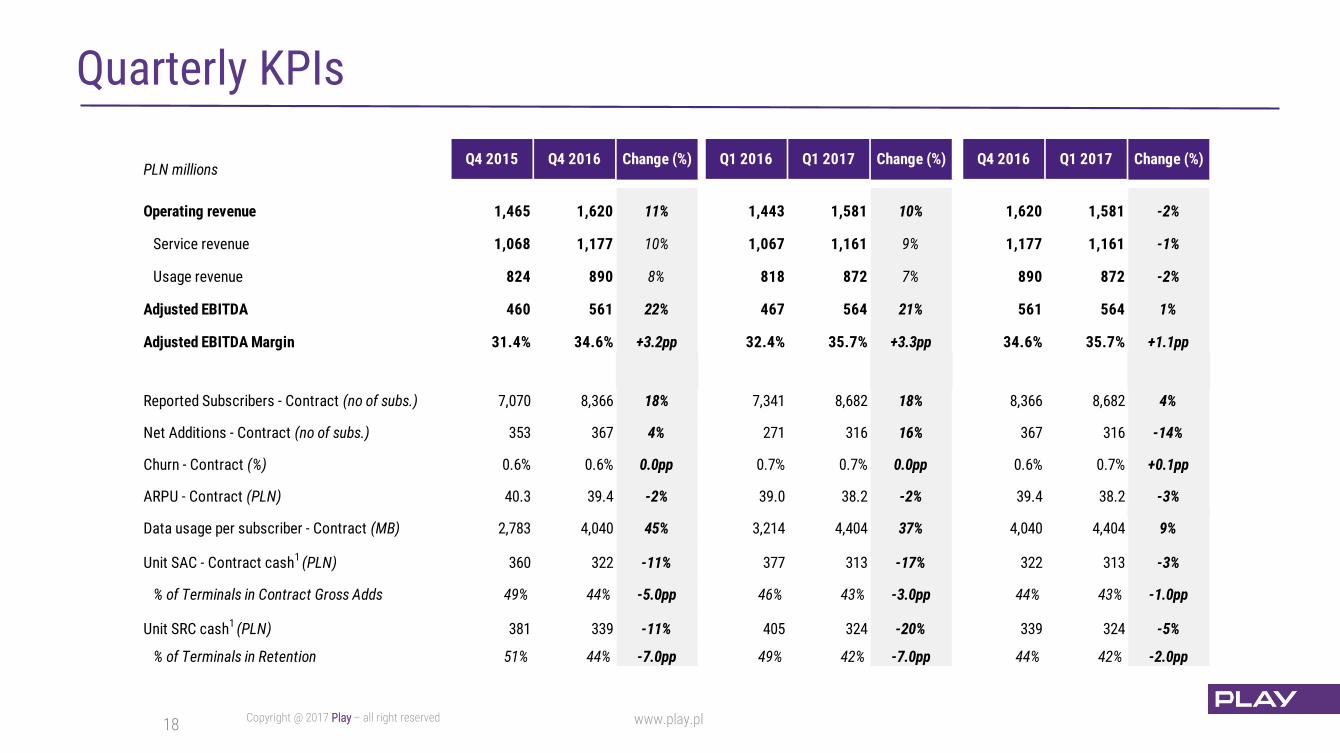
Quarterly KPIs
Play
PLN millionsQ4 2015 Q4 2016 Change (%) Q1 2016 Q1 2017 Change (%) Q4 2016 Q1 2017 Change (%)
Operating revenue 1,465 1,620 11% 1,443 1,581 10% 1,620 1,581 -2%
Service revenue 1,068 1,177 10% 1,067 1,161 9% 1,177 1,161 -1%
Usage revenue 824 890 8% 818 872 7% 890 872 -2%
Adjusted EBITDA 460 561 22% 467 564 21% 561 564 1%
Adjusted EBITDA Margin 31.4% 34.6% +3.2pp 32.4% 35.7% +3.3pp 34.6% 35.7% +1.1pp
Reported Subscribers - Contract (no of subs.) 7,070 8,366 18% 7,341 8,682 18% 8,366 8,682 4%
Net Additions - Contract (no of subs.) 353 367 4% 271 316 16% 367 316 -14%
Churn - Contract (%) 0.6% 0.6% 0.0pp 0.7% 0.7% 0.0pp 0.6% 0.7% +0.1pp
ARPU - Contract (PLN) 40.3 39.4 -2% 39.0 38.2 -2% 39.4 38.2 -3%
Data usage per subscriber - Contract (MB) 2,783 4,040 45% 3,214 4,404 37% 4,040 4,404 9%
Unit SAC - Contract cash1 (PLN) 360 322 -11% 377 313 -17% 322 313 -3%
% of Terminals in Contract Gross Adds 49% 44% -5.0pp 46% 43% -3.0pp 44% 43% -1.0pp
Unit SRC cash1 (PLN) 381 339 -11% 405 324 -20% 339 324 -5%
% of Terminals in Retention 51% 44% -7.0pp 49% 42% -7.0pp 44% 42% -2.0pp
19
Q&A
ask Play
Play