INVESTOR PRESENTATION May 2018 -...
32
@Grupa_Azoty #GrupaAzoty1Q18 INVESTOR PRESENTATION May 2018
Transcript of INVESTOR PRESENTATION May 2018 -...
@Grupa_Azoty
#GrupaAzoty1Q18
INVESTOR PRESENTATION
May 2018
2
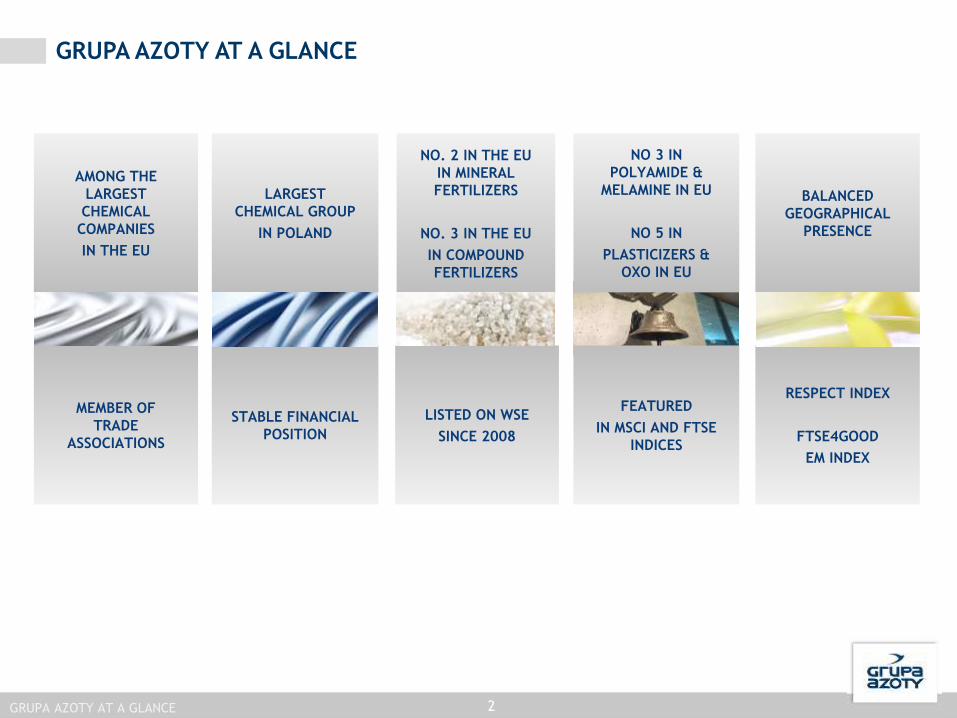
GRUPA AZOTY AT A GLANCE
GRUPA AZOTY AT A GLANCE
NO. 2 IN THE EU
IN MINERAL
FERTILIZERS
NO. 3 IN THE EU
IN COMPOUND
FERTILIZERS
AMONG THE
LARGEST
CHEMICAL
COMPANIES
IN THE EU
LARGEST
CHEMICAL GROUP
IN POLAND
NO 3 IN
POLYAMIDE &
MELAMINE IN EU
NO 5 IN
PLASTICIZERS &
OXO IN EU
BALANCED
GEOGRAPHICAL
PRESENCE
MEMBER OF
TRADE
ASSOCIATIONS
STABLE FINANCIAL
POSITION
LISTED ON WSE
SINCE 2008
FEATURED
IN MSCI AND FTSE
INDICES
RESPECT INDEX
FTSE4GOOD
EM INDEX

3
SHAREHOLDING STRUCTURE
State Treasury33,00%
ING OFE (Open Pension Fund)
9,96%
TFI PZU S.A.8,60%
EBRD2,87%
Others26,10%
Opansa Enterprises
Limited9,50%
Rainbee Holdings Limited9,90%
Norica0,07%
Latest notification – 28th June 2017
GRUPA AZOTY AT A GLANCE
Noricadirectly/indirectly
19,47%
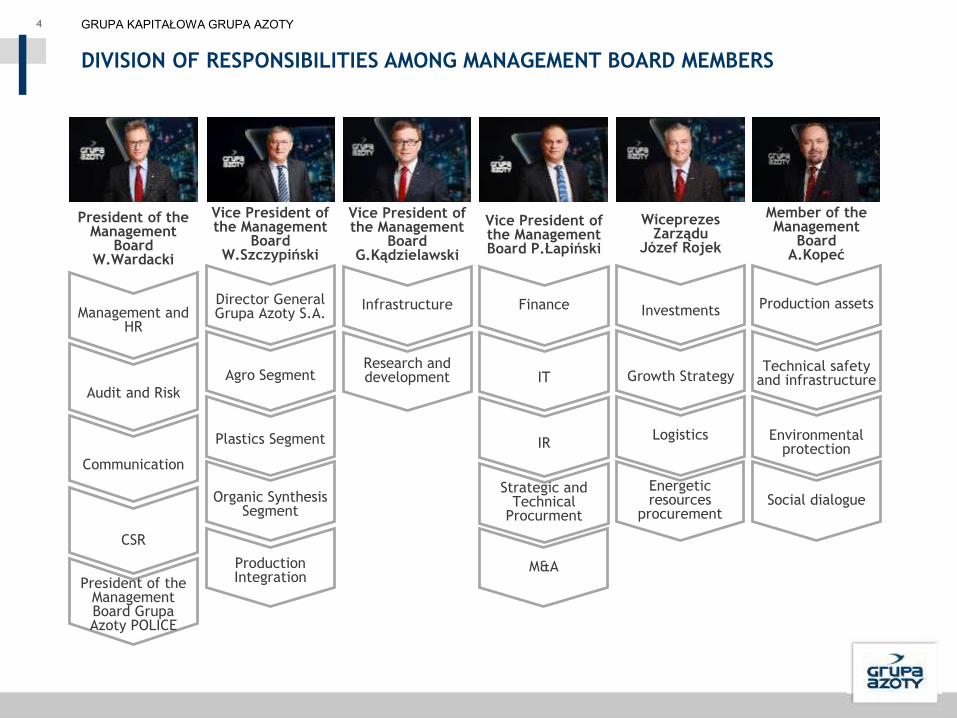
4 GRUPA KAPITAŁOWA GRUPA AZOTY
DIVISION OF RESPONSIBILITIES AMONG MANAGEMENT BOARD MEMBERS
Vice President of the Management
Board W.Szczypiński
Director General Grupa Azoty S.A.
Agro Segment
Plastics Segment
Organic SynthesisSegment
ProductionIntegration
Wiceprezes Zarządu
Józef Rojek
Investments
Growth Strategy
Logistics
M&A
Member of the Management
BoardA.Kopeć
Production assets
Technical safetyand infrastructure
Environmentalprotection
Social dialogue
President of the Management
Board W.Wardacki
Management and HR
Audit and Risk
Communication
CSR
President of the Management Board Grupa Azoty POLICE
Vice President of the Management Board P.Łapiński
Finance
IT
IR
Strategic and Technical
Procurment
Vice President of the Management
Board G.Kądzielawski
Infrastructure
Research and development
Energeticresources
procurement
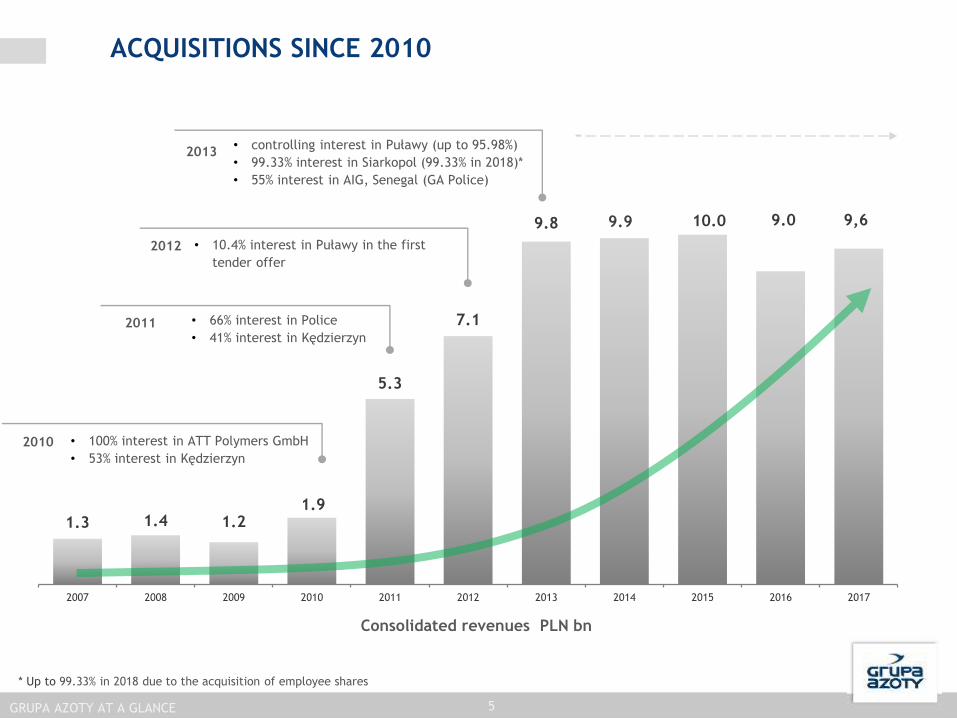
1.3 1.4 1.21.9
5.3
7.1
9.8 9.9 10.0 9.0 9,6
2007 2008 2009 2010 2011 2012 2013 2014 2015 2016 2017
2011 • 66% interest in Police
• 41% interest in Kędzierzyn
• 100% interest in ATT Polymers GmbH
• 53% interest in Kędzierzyn
2010
5
ACQUISITIONS SINCE 2010
Consolidated revenues PLN bn
• controlling interest in Puławy (up to 95.98%)
• 99.33% interest in Siarkopol (99.33% in 2018)*
• 55% interest in AIG, Senegal (GA Police)
2013
• 10.4% interest in Puławy in the first
tender offer
2012
* Up to 99.33% in 2018 due to the acquisition of employee shares
GRUPA AZOTY AT A GLANCE

6
Logistics
Production
ZMPPPort
Grupa Azoty PoliceUrea, NPK, NP, NS, Ammonia, TiO2
BBMTerminal
FosforyNPK, P
Grupa Azoty
ATT PolymersPA 6
Grupa Azoty PuławyAN, UAN, Urea, AS, Melamine, CPL
Grupa Azoty SiarkopolSulfur
Grupa Azoty S.A.AN, CAN, ASN, AS, CPL, PA 6, POM
Compounding
Grupa Azoty KędzierzynAN, CAN, Urea, OXO, UAN
Plasticizers
Z. A. Chorzów S.A.NPK, N, P, K
CORE BUSINESS
GRUPA AZOTY AT A GLANCE
@Grupa_Azoty
#GrupaAzoty1Q18
BUSINESS
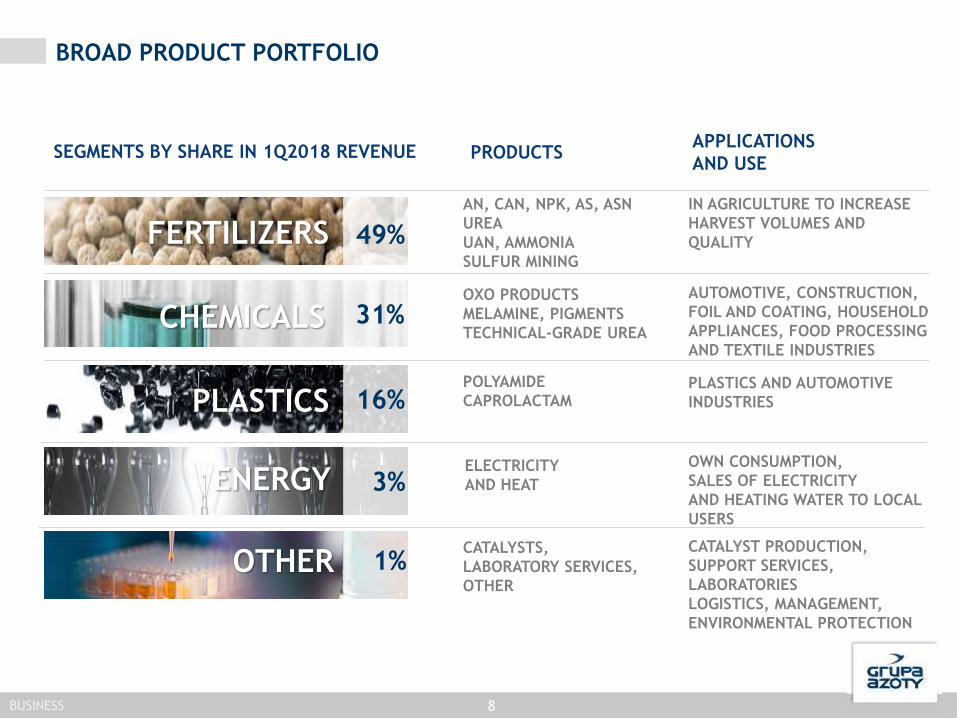
57%FERTILIZERS
8
APPLICATIONS
AND USE
IN AGRICULTURE TO INCREASE
HARVEST VOLUMES AND
QUALITY
PLASTICS AND AUTOMOTIVE
INDUSTRIES
AUTOMOTIVE, CONSTRUCTION,
FOIL AND COATING, HOUSEHOLD
APPLIANCES, FOOD PROCESSING
AND TEXTILE INDUSTRIES
OWN CONSUMPTION,
SALES OF ELECTRICITY
AND HEATING WATER TO LOCAL
USERS
CATALYST PRODUCTION,
SUPPORT SERVICES,
LABORATORIES
LOGISTICS, MANAGEMENT,
ENVIRONMENTAL PROTECTION
OTHER
12%
PLASTICS
31%CHEMICALS
ENERGY
55%
BROAD PRODUCT PORTFOLIO
AN, CAN, NPK, AS, ASN
UREA
UAN, AMMONIA
SULFUR MINING
POLYAMIDE
CAPROLACTAM
OXO PRODUCTS
MELAMINE, PIGMENTS
TECHNICAL-GRADE UREA
ELECTRICITY
AND HEAT
CATALYSTS,
LABORATORY SERVICES,
OTHER
SEGMENTS BY SHARE IN 1Q2018 REVENUE PRODUCTS
49%
16%
3%
1%
BUSINESS
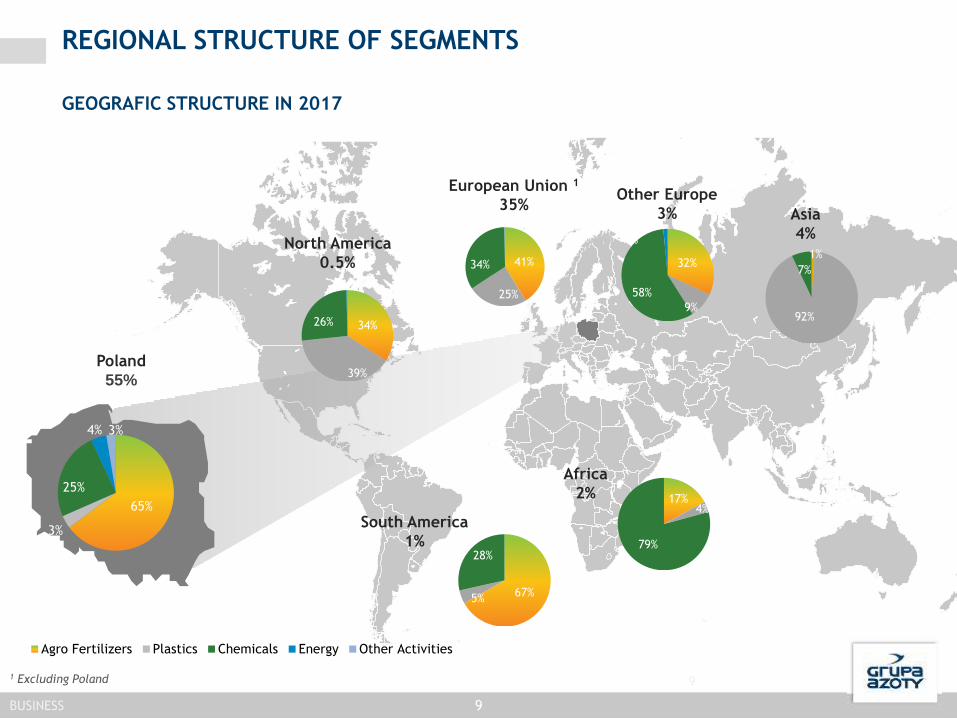
REGIONAL STRUCTURE OF SEGMENTS
GEOGRAFIC STRUCTURE IN 2017
9
South America
1%
Africa
2%
European Union 1
35%Asia
4%
Other Europe
3%
North America
0.5%
9
65%
3%
25%
4% 3%
Agro Fertilizers Plastics Chemicals Energy Other Activities
Poland
55%
34%
39%
26%
1%
67%5%
28%
41%
25%
34%
0% 0%
32%
9%
58%
1%
1%
92%
7%
17%4%
79%
1 Excluding Poland
BUSINESS

COST STRUCTURE
10
RAW MATERIALS
Raw materials4 980 Raw
materials5 487
Services1 039
Services990
Taxes323
Taxes 338
Labour costs1 300
Labour costs 1 399
Depreciation518
Depreciation587Other 171
Other165
2016 2017
BUSINESS
(PLNm)
Gas36%
Other17%
Energy9%
Propylene8%
Potassium chloride
7%Phenol
7%
Phosphate rock6%
Fine coal6%
Benzene4%
11
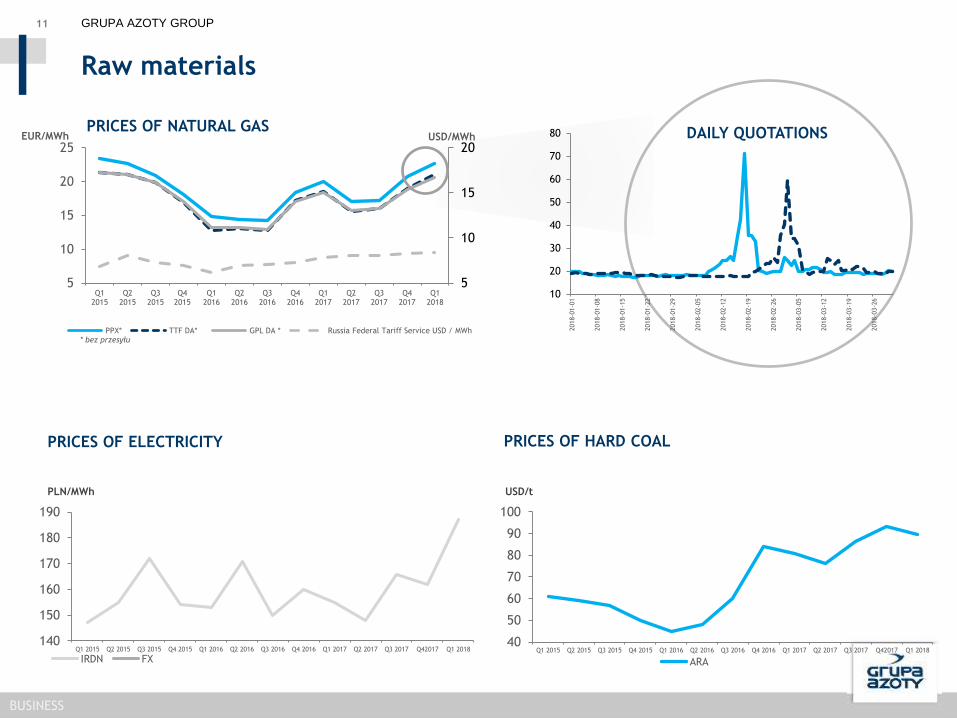
Raw materials
GRUPA AZOTY GROUP
PRICES OF NATURAL GAS DAILY QUOTATIONS EUR/MWh USD/MWh
10
20
30
40
50
60
70
80
2018-0
1-0
1
2018-0
1-0
8
2018-0
1-1
5
2018-0
1-2
2
2018-0
1-2
9
2018-0
2-0
5
2018-0
2-1
2
2018-0
2-1
9
2018-0
2-2
6
2018-0
3-0
5
2018-0
3-1
2
2018-0
3-1
9
2018-0
3-2
6
5
10
15
20
5
10
15
20
25
Q12015
Q22015
Q32015
Q42015
Q12016
Q22016
Q32016
Q42016
Q12017
Q22017
Q32017
Q42017
Q12018
PPX* TTF DA* GPL DA * Russia Federal Tariff Service USD / MWh* bez przesyłu
PRICES OF HARD COALPRICES OF ELECTRICITY
PLN/MWh USD/t
140
150
160
170
180
190
Q1 2015 Q2 2015 Q3 2015 Q4 2015 Q1 2016 Q2 2016 Q3 2016 Q4 2016 Q1 2017 Q2 2017 Q3 2017 Q42017 Q1 2018
IRDN FX
40
50
60
70
80
90
100
Q1 2015 Q2 2015 Q3 2015 Q4 2015 Q1 2016 Q2 2016 Q3 2016 Q4 2016 Q1 2017 Q2 2017 Q3 2017 Q42017 Q1 2018
ARA
BUSINESS
12
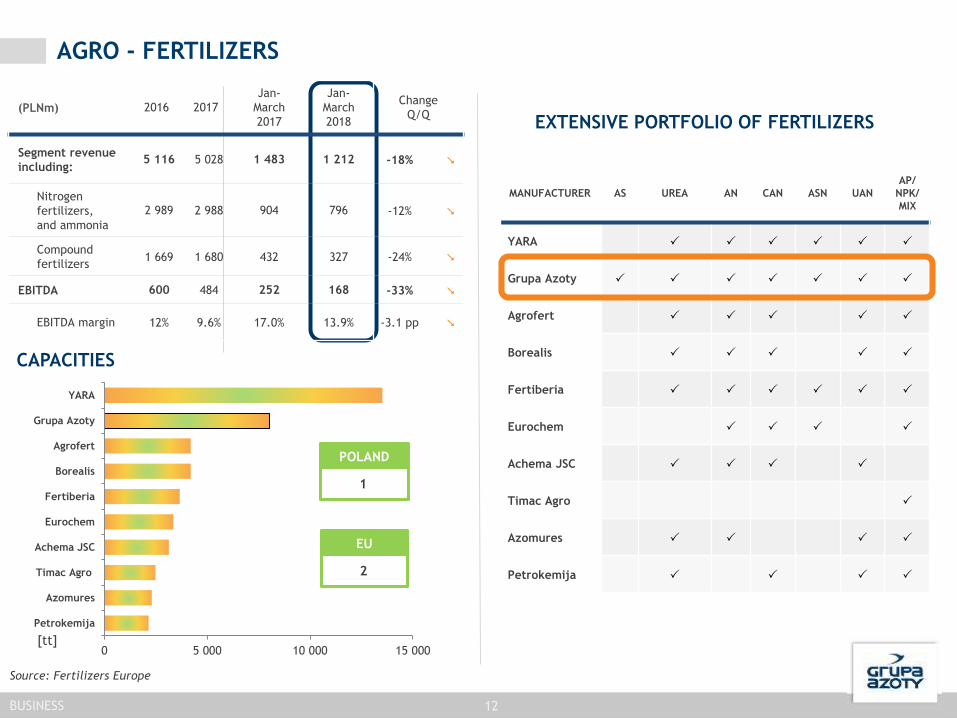
AGRO - FERTILIZERS
EXTENSIVE PORTFOLIO OF FERTILIZERS
[tt]
CAPACITIES
EU
2
POLAND
1
MANUFACTURER AS UREA AN CAN ASN UAN
AP/
NPK/
MIX
YARA
Grupa Azoty
Agrofert
Borealis
Fertiberia
Eurochem
Achema JSC
Timac Agro
Azomures
Petrokemija
0 5 000 10 000 15 000
Petrokemija
Azomures
Timac Agro
Achema JSC
Eurochem
Fertiberia
Borealis
Agrofert
Grupa Azoty
YARA
Source: Fertilizers Europe
BUSINESS
(PLNm) 2016 2017
Jan-
March
2017
Jan-
March
2018
Change
Q/Q
Segment revenue
including:5 116 5 028 1 483 1 212 -18%
Nitrogen
fertilizers,
and ammonia
2 989 2 988 904 796 -12%
Compound
fertilizers1 669 1 680 432 327 -24%
EBITDA 600 484 252 168 -33%
EBITDA margin 12% 9.6% 17.0% 13.9% -3.1 pp
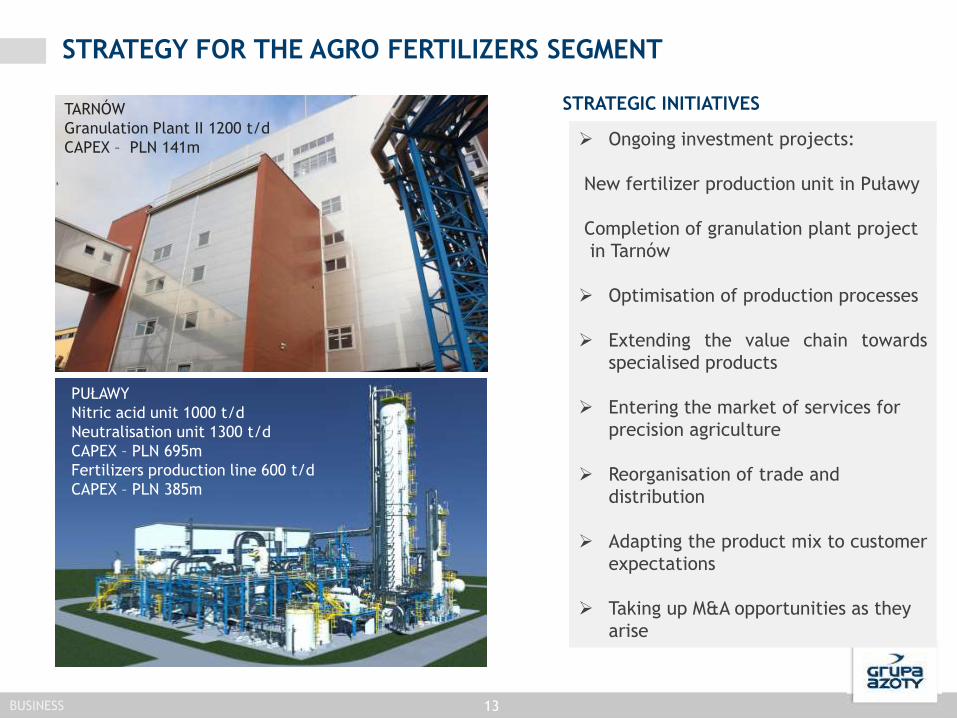
STRATEGY FOR THE AGRO FERTILIZERS SEGMENT
STRATEGIC INITIATIVES
Ongoing investment projects:
New fertilizer production unit in Puławy
Completion of granulation plant project
in Tarnów
Optimisation of production processes
Extending the value chain towards
specialised products
Entering the market of services for
precision agriculture
Reorganisation of trade and
distribution
Adapting the product mix to customer
expectations
Taking up M&A opportunities as they
arise
PUŁAWY
Nitric acid unit 1000 t/d
Neutralisation unit 1300 t/d
CAPEX – PLN 695m
Fertilizers production line 600 t/d
CAPEX – PLN 385m
13BUSINESS
TARNÓW
Granulation Plant II 1200 t/d
CAPEX – PLN 141m
14
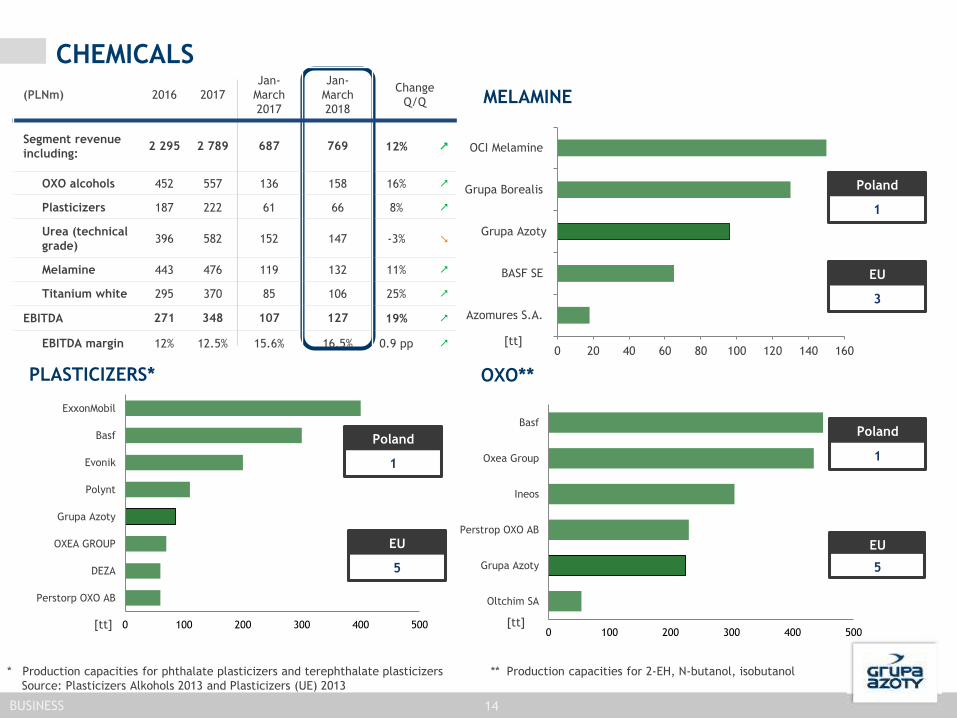
CHEMICALS
MELAMINE
OXO**PLASTICIZERS*
Poland
1
EU
5
Poland
1
EU
5
[tt]
[tt]
[tt]
* Production capacities for phthalate plasticizers and terephthalate plasticizers ** Production capacities for 2-EH, N-butanol, isobutanol
Source: Plasticizers Alkohols 2013 and Plasticizers (UE) 2013
BUSINESS
0 20 40 60 80 100 120 140 160
Azomures S.A.
BASF SE
Grupa Azoty
Grupa Borealis
OCI Melamine
Poland
1
EU
3
0 100 200 300 400 500
Perstorp OXO AB
DEZA
OXEA GROUP
Grupa Azoty
Polynt
Evonik
Basf
ExxonMobil
0 100 200 300 400 500
Oltchim SA
Grupa Azoty
Perstrop OXO AB
Ineos
Oxea Group
Basf
(PLNm) 2016 2017
Jan-
March
2017
Jan-
March
2018
Change
Q/Q
Segment revenue
including:2 295 2 789 687 769 12%
OXO alcohols 452 557 136 158 16%
Plasticizers 187 222 61 66 8%
Urea (technical
grade)396 582 152 147 -3%
Melamine 443 476 119 132 11%
Titanium white 295 370 85 106 25%
EBITDA 271 348 107 127 19%
EBITDA margin 12% 12.5% 15.6% 16.5% 0.9 pp
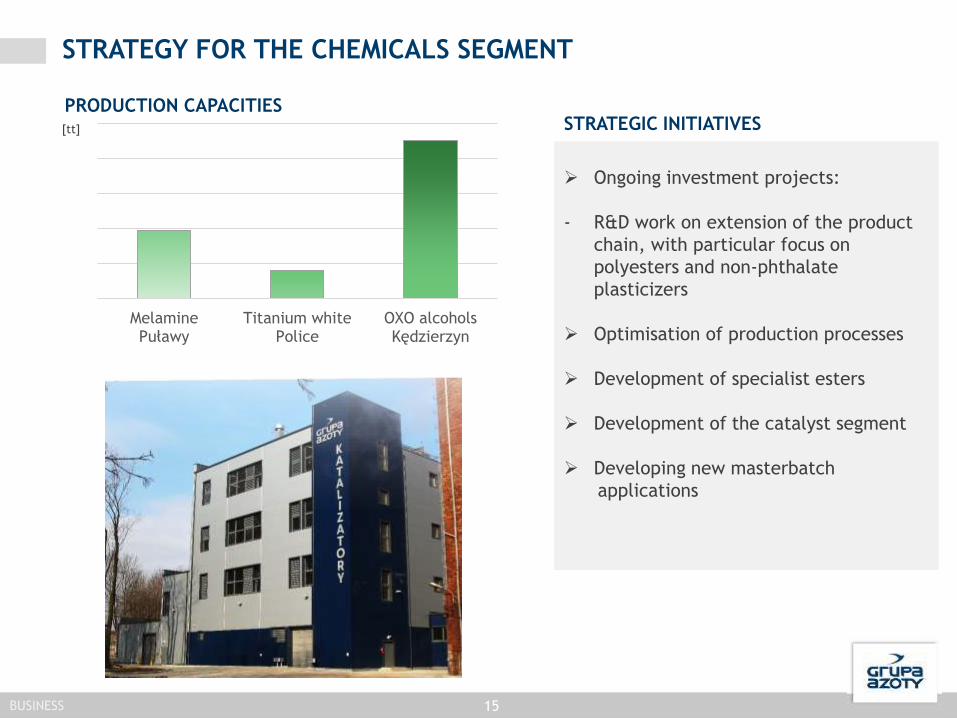
STRATEGY FOR THE CHEMICALS SEGMENT
STRATEGIC INITIATIVES
Ongoing investment projects:
- R&D work on extension of the product
chain, with particular focus on
polyesters and non-phthalate
plasticizers
Optimisation of production processes
Development of specialist esters
Development of the catalyst segment
Developing new masterbatch
applications
PRODUCTION CAPACITIES
MelaminePuławy
Titanium whitePolice
OXO alcoholsKędzierzyn
15BUSINESS
[tt]
0 5 10 15 20 25 30 35 40
Automotive
Films and coatings
Machine building
Electrical and electronicapplications
Consumer goods
Household appliances
Other
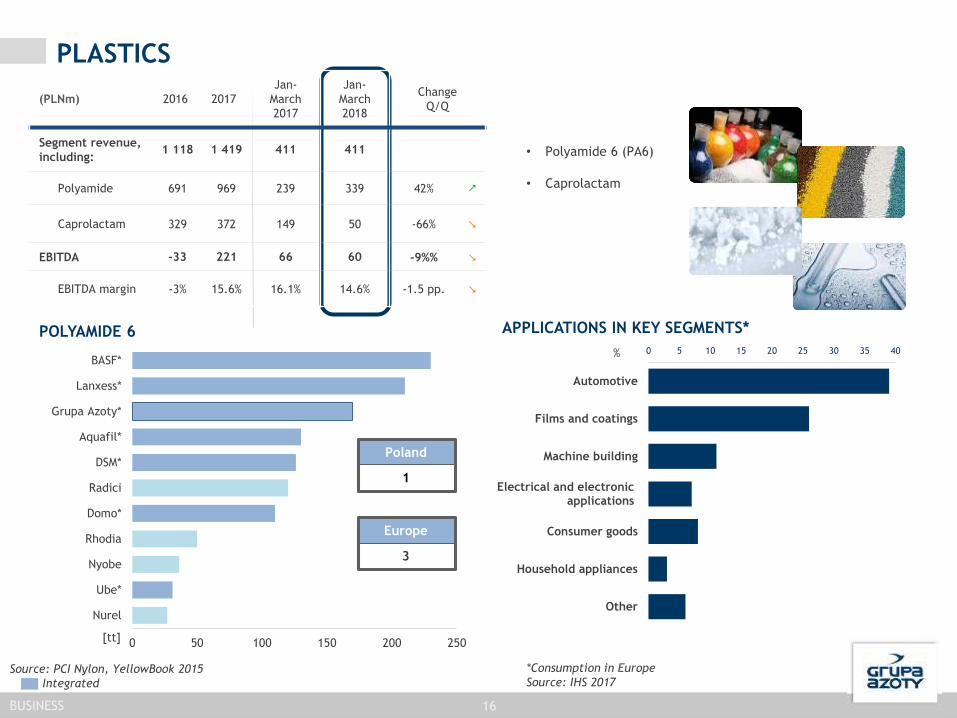
16
PLASTICS
Source: PCI Nylon, YellowBook 2015
Integrated
[tt]
POLYAMIDE 6 APPLICATIONS IN KEY SEGMENTS*
%
• Polyamide 6 (PA6)
• Caprolactam
BUSINESS
*Consumption in Europe
Source: IHS 2017
0 50 100 150 200 250
Nurel
Ube*
Nyobe
Rhodia
Domo*
Radici
DSM*
Aquafil*
Grupa Azoty*
Lanxess*
BASF*
Poland
1
Europe
3
(PLNm) 2016 2017
Jan-
March
2017
Jan-
March
2018
Change
Q/Q
Segment revenue,
including:1 118 1 419 411 411
Polyamide 691 969 239 339 42%
Caprolactam 329 372 149 50 -66%
EBITDA -33 221 66 60 -9%%
EBITDA margin -3% 15.6% 16.1% 14.6% -1.5 pp.
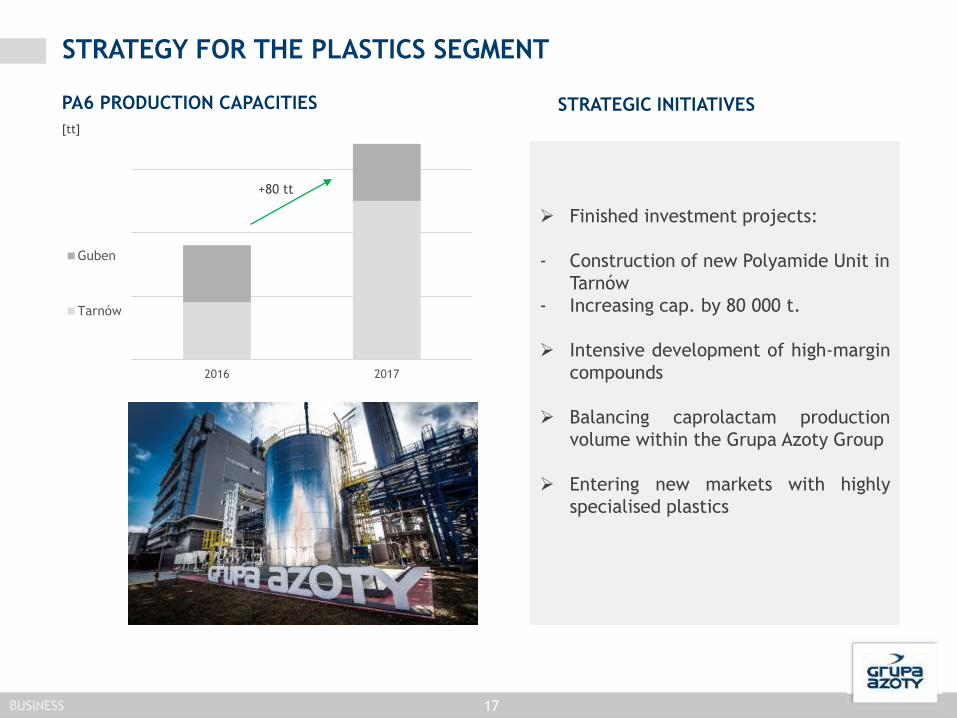
STRATEGY FOR THE PLASTICS SEGMENT
STRATEGIC INITIATIVES
Finished investment projects:
- Construction of new Polyamide Unit in
Tarnów
- Increasing cap. by 80 000 t.
Intensive development of high-margin
compounds
Balancing caprolactam production
volume within the Grupa Azoty Group
Entering new markets with highly
specialised plastics
2016 2017
Guben
Tarnów
PA6 PRODUCTION CAPACITIES
+80 tt
17BUSINESS
[tt]
STRATEGY

Complete the Group
consolidation process
1.
Reinforce leadership
in agricultural
solutions in Europe2.
Strengthen the second
operating pillar by
expanding non-
fertilizer business3.
Develop and
implement innovations
to drive growth of the
chemical industry4.
5
Deploy state-of-the-art and
comprehensive chemical industry
solutions that meet stakeholder
expectations
Create value for the Company and the
national economy by delivering safe,
useful and innovation-driven chemical
products
Our mission
Our vision
STRATEGIC GROWTH DIRECTIONS
STRATEGY

FINANCIAL STRATEGY
ROCE 10%
ROE MARGIN 10%
DIVIDENT PAYOUT <60%
EBIT MARGIN 8%
EBITDA MARGIN 14%
CELE KORPORACYJNE
20STRATEGY
21
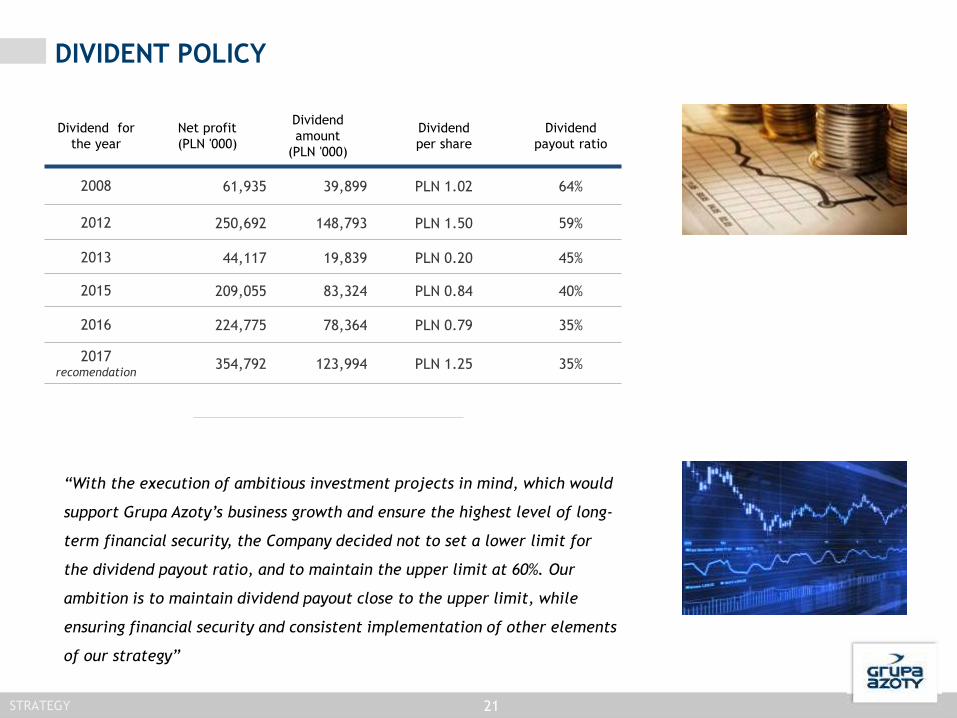
DIVIDENT POLICY
“With the execution of ambitious investment projects in mind, which would
support Grupa Azoty’s business growth and ensure the highest level of long-
term financial security, the Company decided not to set a lower limit for
the dividend payout ratio, and to maintain the upper limit at 60%. Our
ambition is to maintain dividend payout close to the upper limit, while
ensuring financial security and consistent implementation of other elements
of our strategy”
Dividend for
the year
Net profit
(PLN '000)
Dividend
amount
(PLN '000)
Dividend
per share
Dividend
payout ratio
2008 61,935 39,899 PLN 1.02 64%
2012 250,692 148,793 PLN 1.50 59%
2013 44,117 19,839 PLN 0.20 45%
2015 209,055 83,324 PLN 0.84 40%
2016 224,775 78,364 PLN 0.79 35%
2017 recomendation
354,792 123,994 PLN 1.25 35%
STRATEGY
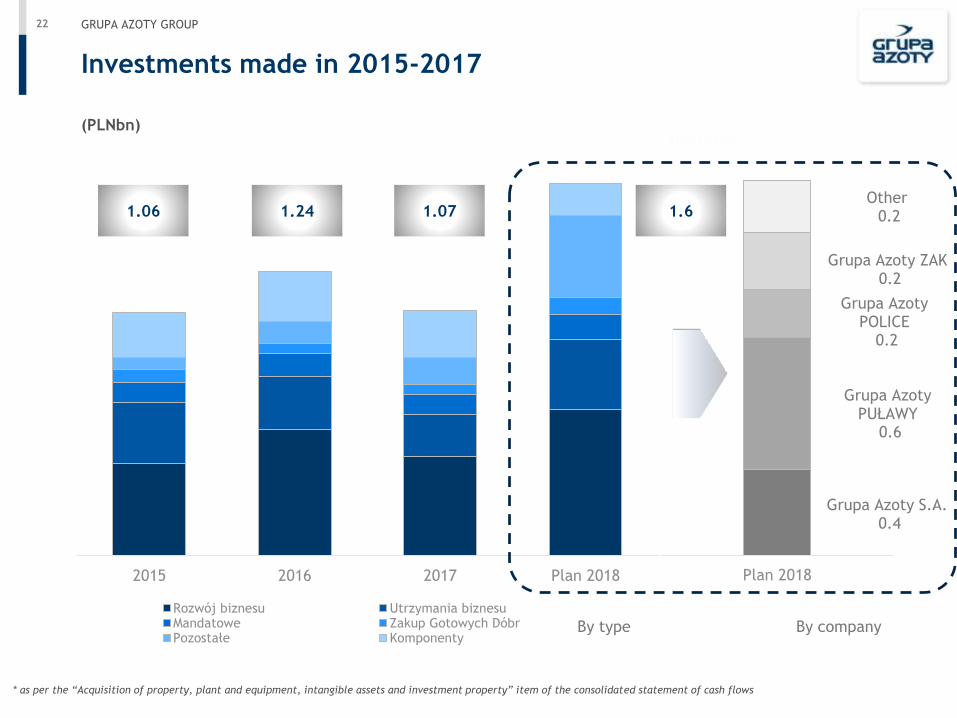
22 GRUPA AZOTY GROUP
Investments made in 2015-2017
2015 2016 2017 Plan 2018
Rozwój biznesu Utrzymania biznesuMandatowe Zakup Gotowych DóbrPozostałe Komponenty
(PLNbn)
Grupa Azoty S.A.0.4
Grupa Azoty PUŁAWY
0.6
Grupa Azoty POLICE
0.2
Grupa Azoty ZAK 0.2
Other0.2
Plan 2018
1.06 1.24 1.07 1.6
By type By company
* as per the “Acquisition of property, plant and equipment, intangible assets and investment property” item of the consolidated statement of cash flows

INVESTMENTSGANIC GROWTH
23INWESTMENTS
Pulgran/PulgranS
at Puławy
Upgrade
of the
ammonia
unit
at Police
New CHP
plant at
Kędzierzyn
– phase 1
Flue Gas Treatment Unit at Tarnów
Co-financed under the Norwegian
Financial Mechanism 2009–2014
Polyamide Unit
at Tarnów

24 GRUPA AZOTY GROUP
Major capex projects in 2018
Plan 2018
Komponenty PozostałeZakup Gotowych Dóbr MandatoweUtrzymania biznesu Rozwój biznesu
(PLN ‘000)
Project name Company
Project
budget in
2018
Upgrade of steam generator to reduce NOx emissions ZAP 44,000
Exhaust gas treatment unit and upgrade of EC II CHP plant ZCH 21,000
Upgrade of synthesis gas compression unit supplying ammonia
plantZAK 50,807
Raw gas compressor (GHH) ZAK 17,678
Upgrade of partial combustion unit at Ammonia Department ZAK 14,000
Facility for production of ammonium nitrate-based granulated
fertilizersZAP 131,280
Chemical Technology and Development Centre ZAT 68,270
Expansion of production capacity of technical-grade nitric acid
unitZAT 58,090
Upgrade of existing and construction of new nitric acid units,
and facilities for neutralisation and production of new nitric
acid-based fertilizers
ZAP 51,290
Special Esters I ZAK 37,505
Change of phosphoric acid production method (DA-HF
technology)ZCH 33,295
Utilisation of purge gases from ammonia synthesis unit ZAT 22,350
Increasing the volumes of and optimising liquid CO2 production ZAP 19,200
Expansion of water demineralisation station ZAP 13,112
Pilot humic acid unit ZAT 11,830
Purchase and installation of synthesis compressor ZAP 10,392
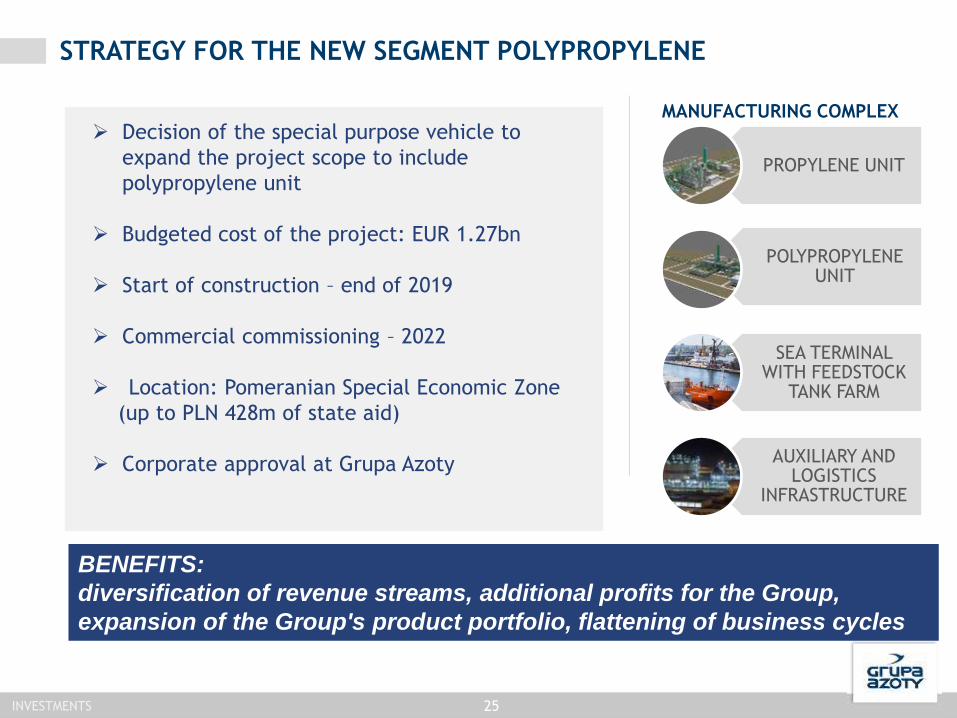
STRATEGY FOR THE NEW SEGMENT POLYPROPYLENE
BENEFITS:
diversification of revenue streams, additional profits for the Group,
expansion of the Group's product portfolio, flattening of business cycles
MANUFACTURING COMPLEX
PROPYLENE UNIT
POLYPROPYLENE UNIT
SEA TERMINAL WITH FEEDSTOCK
TANK FARM
AUXILIARY AND LOGISTICS
INFRASTRUCTURE
Decision of the special purpose vehicle to
expand the project scope to include
polypropylene unit
Budgeted cost of the project: EUR 1.27bn
Start of construction – end of 2019
Commercial commissioning – 2022
Location: Pomeranian Special Economic Zone
(up to PLN 428m of state aid)
Corporate approval at Grupa Azoty
INVESTMENTS 25
@Grupa_Azoty
#GrupaAzoty1Q18
FINANCIAL HIGHLIGHTS

GRUPA AZOTY GROUP: FINANCIAL HIGHLIGHTS
27
(PLNm)
FINANCIAL HIGHLIGHTS
* In 2013 adjusted for gain on bargin purchase of Grupa Azoty PUŁAWY, Grupy Azoty SIARKOPOL, AIG and impairment loss on the polyoxymethylene plant.
In 2014 adjusted for impairment loss on the phthalic anhydride unit recognised.
In 2015 adjusted for impairment loss on the benzene derived c-non production unit, fat processing plant, and carbon disulfide plant
In 2016 adjusted for estimated impairment loss recognised by AIG, impairment loss on the AIG field and fat processing plant. In 2017 - fat processing plant.
** Restated following application of uniform accounting policies across Grupa Azoty (see Section 2.2.c of the Supplementary information to the financial statements)
Jan-March
2017
Jan-
March
2018
Q/Q
2 687 2 497 -7%
314 238 -24%
11.9% 9.5% -2.4
pp.
453 403 -11%
16.9% 16.1% -0.8
pp.
255 188 -26%
2014 2015** 2016 2017
Jan-
March
2018(PLNm)
Revenue 9,898 10,008 8,956 9 617 2 497
EBIT 302 824 486 597 238
EBIT margin 3% 8% 5% 6% 9.5%
EBITDA 822 1,309 1,006 1 187 403
EBITDA margin 8% 13% 11% 12.3% 16.1%
Net profit265 678 375 489 188
453
403
462
16,9%
16,1%
1Q2017 1Q2018
1 246
822
1 309
9481 187
775 862
1 3531 034
1 262
12,7
8,3
13,110,6
12,3
2013 2014 2015 2016 2017
EBITDA
EBITDA(skorygowana)*
Marża EBITDA

28DANE FINANSOWE
(PLNm)
-100
0
100
200
300
400
500
-500
0
500
1 000
1 500
2 000
2 500
Revenue Net profit (right axis)
0
200
400
600
EBITDA
EBITDA
GRUPA AZOTY GROUP REVENUE, QUARTERLY
REVENUE AND NET PROFIT
29 GRUPA AZOTY GROUP
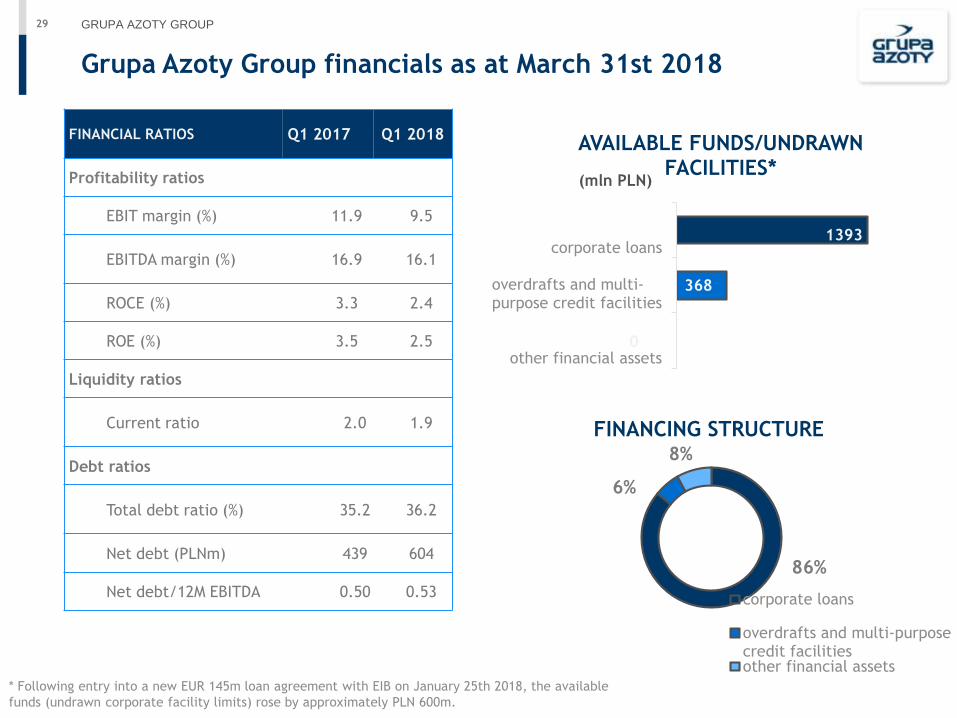
Grupa Azoty Group financials as at March 31st 2018
FINANCIAL RATIOS Q1 2017 Q1 2018
Profitability ratios
EBIT margin (%) 11.9 9.5
EBITDA margin (%) 16.9 16.1
ROCE (%) 3.3 2.4
ROE (%) 3.5 2.5
Liquidity ratios
Current ratio 2.0 1.9
Debt ratios
Total debt ratio (%) 35.2 36.2
Net debt (PLNm) 439 604
Net debt/12M EBITDA 0.50 0.53
0
368
1393
other financial assets
overdrafts and multi-purpose credit facilities
corporate loans
AVAILABLE FUNDS/UNDRAWN FACILITIES*
(mln PLN)
86%
6%
8%
FINANCING STRUCTURE
corporate loans
overdrafts and multi-purposecredit facilitiesother financial assets
* Following entry into a new EUR 145m loan agreement with EIB on January 25th 2018, the available
funds (undrawn corporate facility limits) rose by approximately PLN 600m.
30 Part or section title
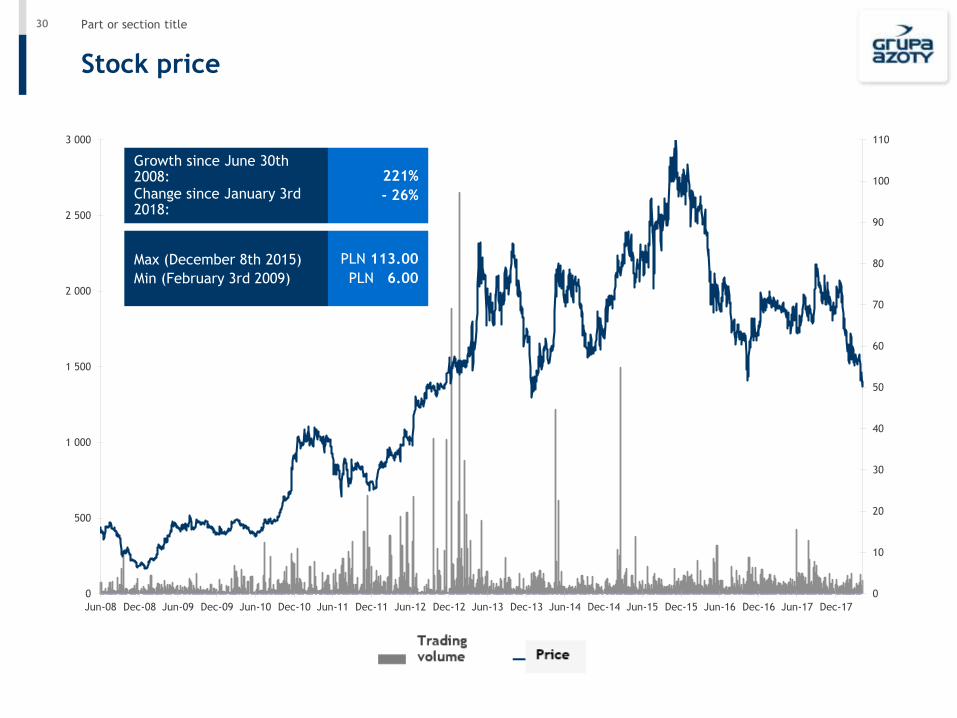
Stock price
0
10
20
30
40
50
60
70
80
90
100
110
0
500
1 000
1 500
2 000
2 500
3 000
Jun-08 Dec-08 Jun-09 Dec-09 Jun-10 Dec-10 Jun-11 Dec-11 Jun-12 Dec-12 Jun-13 Dec-13 Jun-14 Dec-14 Jun-15 Dec-15 Jun-16 Dec-16 Jun-17 Dec-17
Wolumen Cena
Growth since June 30th 2008:Change since January 3rd 2018:
221%
- 26%
PLN 113.00
PLN 6.00
Max (December 8th 2015)
Min (February 3rd 2009)

DISCLAIMER
DISCLAIMER
The information contained herein has been prepared by the Grupa Azoty Group (“the Group”) solely for the purpose of presentation to investors (“the
Presentation”). By participating in the meeting at which this Presentation is given or by referring to this Presentation you agree to the restrictions and disclaimers
presented below.
This Presentation does not constitute, or form any part of, and should not be considered as, an offer to sell or invitation to subscribe for, or as a guarantee of
purchase or other acquisition of any securities of any of the Group companies. Neither this presentation nor any part hereof may form the basis of, or be relied
upon in connection with, any subscription for or acquisition of any securities of the Group companies. Neither this Presentation nor any part hereof may form the
basis of, or be relied upon in connection with, any contract or commitment or investment decision relating to any securities of the Group companies. This
Presentation does not constitute a recommendation regarding any securities of the Group companies.
No statement or assurance, express or implied, has been made by or on behalf of the Group or any of its shareholders, members of its bodies, officers, employees,
agents or advisers or any other person as to the accuracy, completeness or reliability of the information or opinions contained in this Presentation. The discussion
of various subjects in this Presentation may include forward-looking statements. Forward-looking statements are different from statements of historical fact. They
can be identified by the use of such words as "expect", "intend", "plan", "believe", "anticipate", "will", "aim", "can", "would", "could", "continue" or similar
expressions. Forward-looking statements include statements about the financial performance, business strategy, plans and objectives of the Group (including
development plans relating to the Group). All forward-looking statements contained in this Presentation relate to matters involving known and unknown risks,
issues that are impossible to predict, and other factors. Actual results and achievements of the Group may materially differ from those given in past declarations,
and from the Company’s past performance and achievements. Forward-looking statements are made based on various assumptions about future events, including
assumptions regarding the current and future business strategies of the Group and its future business environment. Although the Group believes that its estimates
and assumptions are reasonable, they may prove to be incorrect. The information, opinions and forward-looking statements contained herein are valid only on the
date of this Presentation and are subject to change without notice. Unless required by law, the Group and its advisors are not obliged to publish any updates or
modify any information, data or statements contained in this Presentation in the event of a change to the Group’s strategy or plans or the occurrence of any facts
or circumstances that will have an effect on the Group’s strategy or plans. Please note that the only reliable source of data on the Group's and Group companies’
financial performance, as well as forecasts, events and indicators relating to the Group and the Group companies, are the current and periodic reports released by
the Group companies to comply with the applicable disclosure requirements under Polish law.
Neither the Group nor any of its shareholders, members of its bodies, officers, employees, agents or advisers nor any other person shall be liable for any loss arising
due to the use of this Presentation or its contents, or otherwise in connection with this Presentation.
Neither the Group nor any of its shareholders, members of its bodies, officers, employees, agents or advisers nor any other person is required to provide the
recipients of this Presentation with any additional information or to update this Presentation.
This Presentation contains information on the chemical industry in Poland and abroad, including information on the market share of the Company and some of its
competitors. In each case the source of such information is provided, and such information has not been subject to independent verification by or on behalf of the
Group.
This Presentation is not for distribution to or use by any person or entity in any jurisdiction where such distribution or use would be contrary to local law or would
oblige the Group or any of its affiliates to obtain an authorisation, license or exemption from the registration requirements under applicable laws. Neither this
Presentation nor any part hereof may be copied or transmitted into the United States, and cannot be disseminated, directly or indirectly in the United States.
Failure to comply with this restriction may constitute a violation of US securities laws. Persons who come into possession of this Presentation should observe all the
above limitations. Any securities referred to herein have not been and will not be registered under the US Securities Act of 1933. Any such securities may not be
offered or sold in the United States, except pursuant to an exemption or in a transaction not subject to the registration requirements of the Act.
31
Thank you for your attention
For more information, visit www.grupaazoty.com
Contact: [email protected]