Scholastic Investor - Investor Relations | Scholastic ...
17
FIRST QUARTER FISCAL YEAR 2015 EARNINGS PRESENTATION September 25, 2014
Transcript of Scholastic Investor - Investor Relations | Scholastic ...
FIRST QUARTER FISCAL YEAR 2015 EARNINGS PRESENTATION
September 25, 2014
2
Forward-Looking Statements
This presentation contains certain forward-looking statements,
which are subject to various risks and uncertainties, including the
conditions of the children’s book and educational materials
markets and acceptance of the Company’s products in those
markets and other risks and factors identified from time to time
in the Company’s filings with the Securities and Exchange
Commission. Actual results could differ materially from those
currently anticipated.
3
Regulation G
Today’s comments include references to certain non-GAAP
financial measures as defined in Regulation G. The
reconciliation of these non-GAAP financial measures with the
relevant GAAP financial information and other information
required by Regulation G is provided in the Company’s earnings
release, which is posted on the Company’s investor relations
website at investor.scholastic.com.
4
Dick Robinson
Chief Executive Officer, President and Chairman
First Quarter 2015 Results
5
• Revenues increased +3% to $283.8 million
• Gains in guided reading and classroom book collections
• Higher sales of math products and programs, including MATH 180®
• Top line growth in international channels, school clubs and fairs
• Revenue decline in educational technology programs given tough comparison and large sale of Common Core Code X in prior year
• Operating loss grew by $7.5 million to $53.4 million
• Higher amortization costs related to new educational technology programs
• Slightly higher losses in certain international markets
• Higher amortization of production expenses for new media programming
• Free cash use of $76.9 million vs. use of $93.8 million in prior year
Education Technology and Services:
6
• Comprehensive portfolio of products, including innovative technology programs and professional services, that have proven efficacy, and aligned with broader trends in education
• Continuing to gain traction and build leadership position in math; on track to release MATH 180®
Course 2 in second half of fiscal year
• Global READ 180® revenues stable, including sale to US Department of Defense via international export
• New initiatives to expand user base of core intervention programs, including bolstering regional sales management and marketing teams and new analytics capabilities
Classroom Books and Supplemental Materials:
7
• Increase driven by higher sales of classroom books and guided and leveled reading programs, including Guided Reading Blue 2nd Edition with non-fiction focus
• Renewed concentration on independent reading, as a gateway to improved student motivation and achievement
• Building vocabulary, content knowledge, and higher reading skills
• Scholastic is working with municipalities to significantly expand their customized reading programs for grades K−5
• Q1 results include key sale in Houston, TX
• Strengthening students’ ability to read extensively with stamina and high quality comprehension, accuracy and fluency
International:
8
• Education sales growth driven by new products, including the digital reading assessment program Literacy Pro
• Strength in the UK, Asia and the Middle East
• Strong initial sales of PR1ME Mathematics, our math series published in Singapore
• Significant READ 180® sale to the US Department of Defense in first quarter
• Successful local trade publishing, including The Scarecrows’ Wedding, the bestselling children’s picture book in the UK
Children’s Books:
9
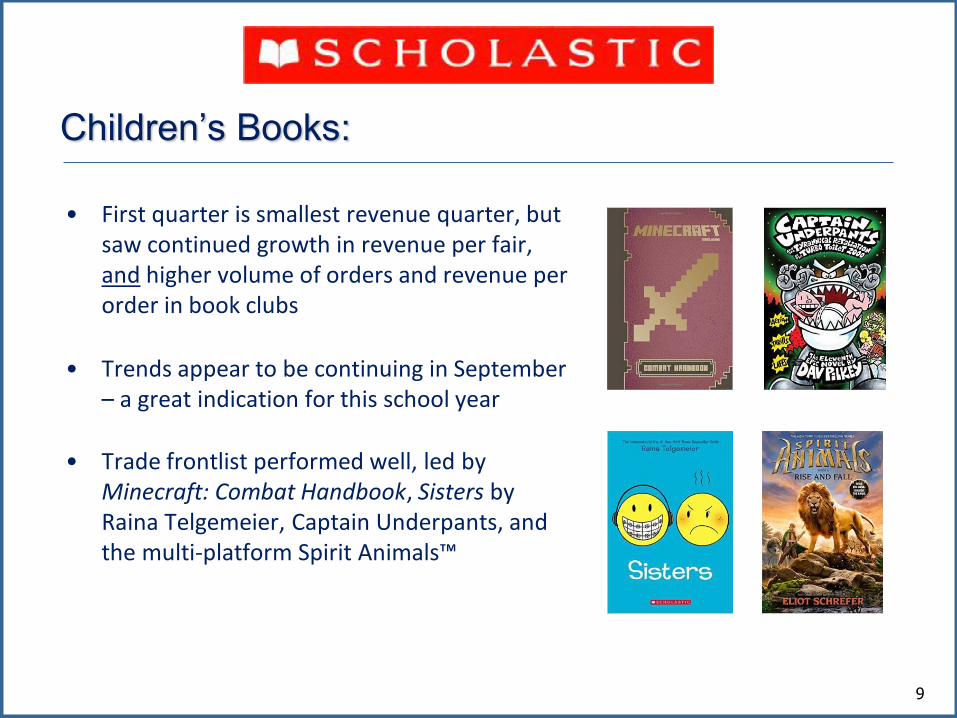
• First quarter is smallest revenue quarter, but saw continued growth in revenue per fair, and higher volume of orders and revenue per order in book clubs
• Trends appear to be continuing in September – a great indication for this school year
• Trade frontlist performed well, led by Minecraft: Combat Handbook, Sisters by Raina Telgemeier, Captain Underpants, and the multi-platform Spirit Animals™
Open a World of Possible:
10
• Launched by Scholastic through all products and channels, as well as through the Company’s network of teachers, librarians, reading and literacy specialists, principals, and parents
• Inspiring young people to make reading important − even central − to their lives
• When children choose their own books, they read more and they develop fluency, confidence and a curiosity about their world
• Expect these initiatives to lead to more club sponsorships, increased traffic at book fairs, and more purchases of classroom book collections
11
Maureen O’Connell
Executive Vice President, Chief Administrative Officer and CFO
12
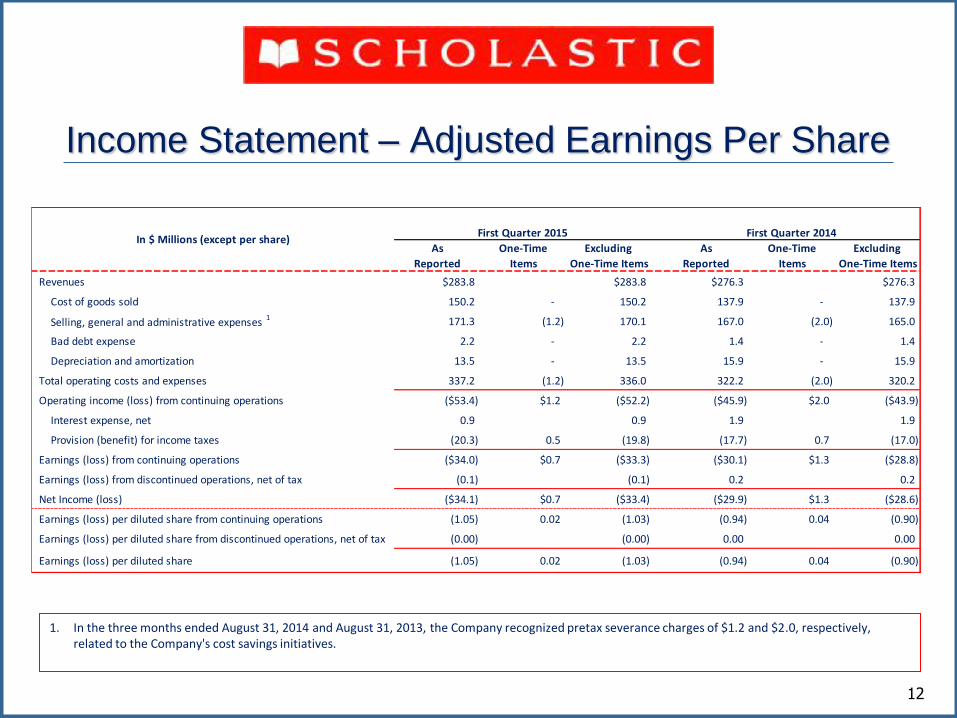
Income Statement – Adjusted Earnings Per Share
1. In the three months ended August 31, 2014 and August 31, 2013, the Company recognized pretax severance charges of $1.2 and $2.0, respectively, related to the Company's cost savings initiatives.
As One-Time Excluding As One-Time Excluding
Reported Items One-Time Items Reported Items One-Time Items
Revenues $283.8 $283.8 $276.3 $276.3
Cost of goods sold 150.2 - 150.2 137.9 - 137.9
Selling, general and administrative expenses 1 171.3 (1.2) 170.1 167.0 (2.0) 165.0
Bad debt expense 2.2 - 2.2 1.4 - 1.4
Depreciation and amortization 13.5 - 13.5 15.9 - 15.9
Total operating costs and expenses 337.2 (1.2) 336.0 322.2 (2.0) 320.2
Operating income (loss) from continuing operations ($53.4) $1.2 ($52.2) ($45.9) $2.0 ($43.9)
Interest expense, net 0.9 0.9 1.9 1.9
Provision (benefit) for income taxes (20.3) 0.5 (19.8) (17.7) 0.7 (17.0)
Earnings (loss) from continuing operations ($34.0) $0.7 ($33.3) ($30.1) $1.3 ($28.8)
Earnings (loss) from discontinued operations, net of tax (0.1) (0.1) 0.2 0.2
Net Income (loss) ($34.1) $0.7 ($33.4) ($29.9) $1.3 ($28.6)
Earnings (loss) per diluted share from continuing operations (1.05) 0.02 (1.03) (0.94) 0.04 (0.90)
Earnings (loss) per diluted share from discontinued operations, net of tax (0.00) (0.00) 0.00 0.00
Earnings (loss) per diluted share (1.05) 0.02 (1.03) (0.94) 0.04 (0.90)
In $ Millions (except per share)First Quarter 2015 First Quarter 2014
13
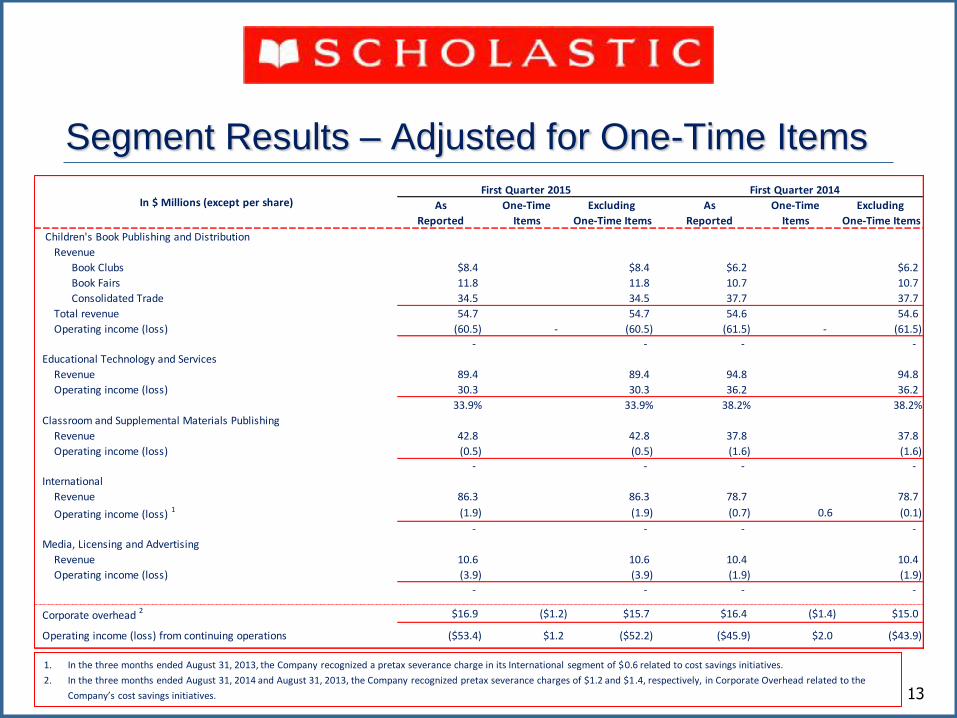
Segment Results – Adjusted for One-Time Items
As One-Time Excluding As One-Time Excluding
Reported Items One-Time Items Reported Items One-Time Items
Children's Book Publishing and Distribution
Revenue
Book Clubs $8.4 $8.4 $6.2 $6.2
Book Fairs 11.8 11.8 10.7 10.7
Consolidated Trade 34.5 34.5 37.7 37.7
Total revenue 54.7 54.7 54.6 54.6
Operating income (loss) (60.5) - (60.5) (61.5) - (61.5) - - - -
Educational Technology and Services
Revenue 89.4 89.4 94.8 94.8
Operating income (loss) 30.3 30.3 36.2 36.2
33.9% 33.9% 38.2% 38.2%
Classroom and Supplemental Materials Publishing
Revenue 42.8 42.8 37.8 37.8
Operating income (loss) (0.5) (0.5) (1.6) (1.6) - - - -
International
Revenue 86.3 86.3 78.7 78.7
Operating income (loss) 1 (1.9) (1.9) (0.7) 0.6 (0.1)
- - - -
Media, Licensing and Advertising
Revenue 10.6 10.6 10.4 10.4
Operating income (loss) (3.9) (3.9) (1.9) (1.9) - - - -
Corporate overhead 2 $16.9 ($1.2) $15.7 $16.4 ($1.4) $15.0
Operating income (loss) from continuing operations ($53.4) $1.2 ($52.2) ($45.9) $2.0 ($43.9)
In $ Millions (except per share)First Quarter 2015 First Quarter 2014
1. In the three months ended August 31, 2013, the Company recognized a pretax severance charge in its International segment of $0.6 related to cost savings initiatives.
2. In the three months ended August 31, 2014 and August 31, 2013, the Company recognized pretax severance charges of $1.2 and $1.4, respectively, in Corporate Overhead related to the
Company’s cost savings initiatives.
14
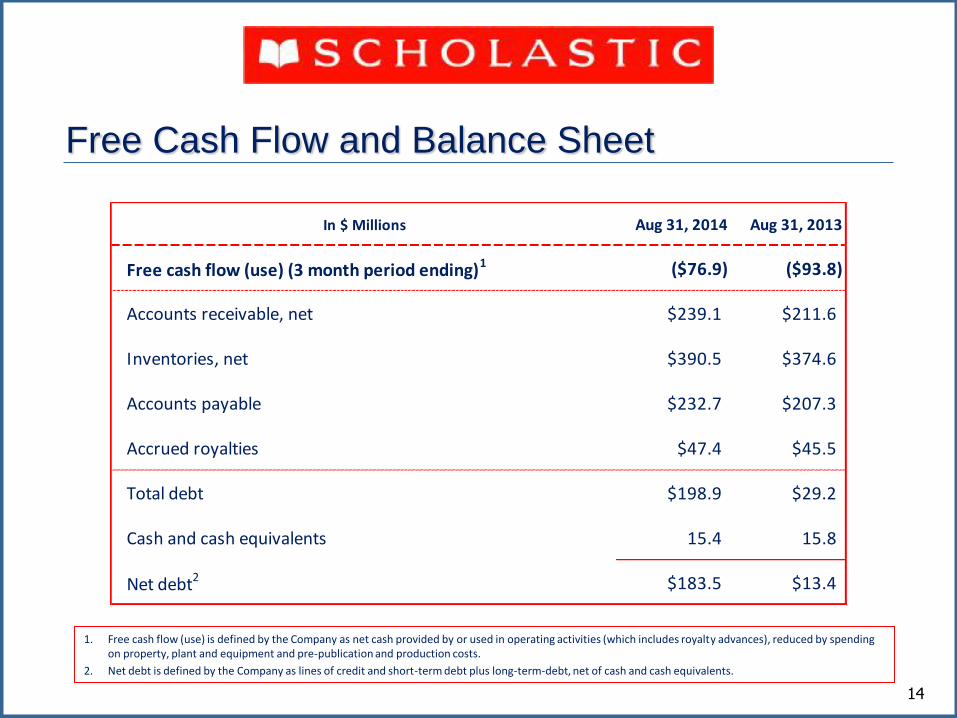
Free Cash Flow and Balance Sheet
In $ Millions Aug 31, 2014 Aug 31, 2013
Free cash flow (use) (3 month period ending)1 ($76.9) ($93.8)
Accounts receivable, net $239.1 $211.6
Inventories, net $390.5 $374.6
Accounts payable $232.7 $207.3
Accrued royalties $47.4 $45.5
Total debt $198.9 $29.2
Cash and cash equivalents 15.4 15.8
Net debt2 $183.5 $13.4
1. Free cash flow (use) is defined by the Company as net cash provided by or used in operating activities (which includes royalty advances), reduced by spending on property, plant and equipment and pre-publication and production costs.
2. Net debt is defined by the Company as lines of credit and short-term debt plus long-term-debt, net of cash and cash equivalents.
15
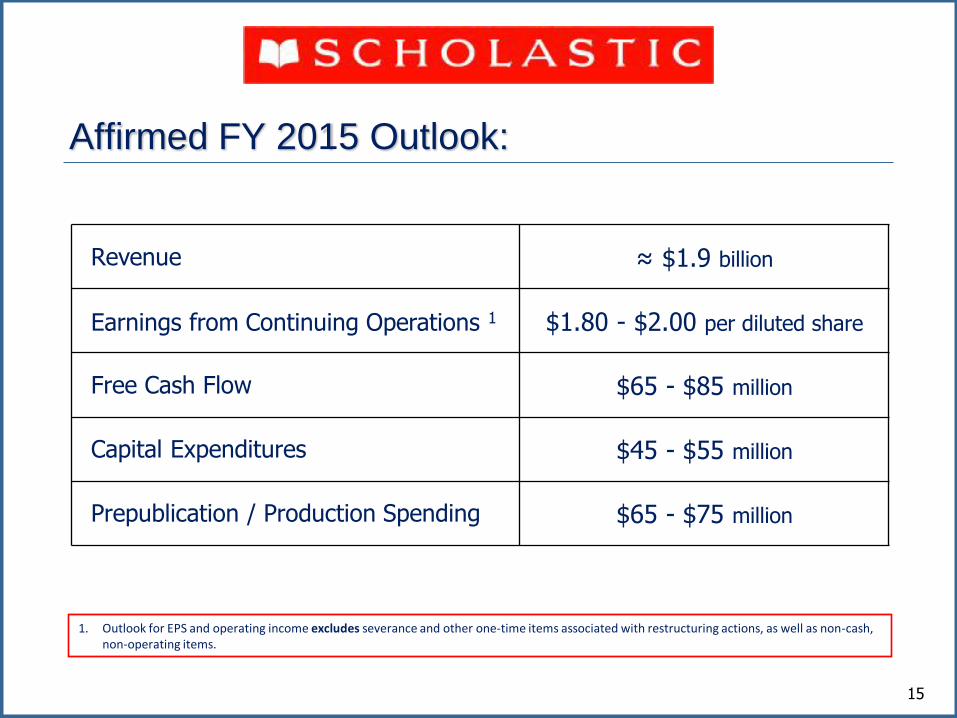
Affirmed FY 2015 Outlook:
Revenue ≈ $1.9 billion
Earnings from Continuing Operations 1 $1.80 - $2.00 per diluted share
Free Cash Flow $65 - $85 million
Capital Expenditures $45 - $55 million
Prepublication / Production Spending $65 - $75 million
1. Outlook for EPS and operating income excludes severance and other one-time items associated with restructuring actions, as well as non-cash, non-operating items.
16
Questions & Answers
Participants
• Richard Robinson
• Maureen O’Connell
• Margery Mayer, Educational Technology & Services
• Judy Newman, School Book Clubs and E-Commerce
17