Q1 2017 - Nalcor Energy
57
Q1 2017 FINANCIAL REPORT
Transcript of Q1 2017 - Nalcor Energy
Q1 2017 FINANCIAL REPORT
Table of Contents
01 Section 1: Corporate Overview 03 Section 2: Financial Highlights and Recent Developments
08 Section 3: Consolidated Financial Results 11 Section 4: Segmented Results and Analysis
19 Section 5: Liquidity and Capital Resources 24 Section 6: Risk Management Process
24 Section 7: Accounting Policies and Significant Accounting Judgments, Estimates and Assumptions 25 Section 8: Non-GAAP Financial Measures 25 Section 9: Related Party Transactions
25 Section 10: Summary of Quarterly Results 26 Section 11: Subsequent Events
27 Section 12: Outlook
Appendix 1
Consolidated Financial Statements – March 31, 2017
HEAD OFFICE
NALCOR ENERGY T. 709.737.1440Hydro Place. 500 Columbus Drive F. 709.737.1800P.O. Box 12800. St. John’s, NL E. [email protected] A1B 0C9 W. nalcorenergy.com
MANAGEMENT’S DISCUSSION & ANALYSIS FOR THE THREE MONTHS ENDED MARCH 31, 2017
SECTION 1: CORPORATE OVERVIEW
Nalcor Energy (Nalcor or the Company) is Newfoundland and Labrador’s energy company. Nalcor is a Crown corporation established in 2007 under a special act of the Legislature of the Province of Newfoundland and Labrador (the Province). The company’s business includes the development, generation, transmission and sale of electricity; the exploration, development, production and sale of oil and gas; industrial fabrication site management; and energy trading.
Focused on sustainable growth, the company is leading the development of the province’s energy resources and has a corporate-wide framework that facilitates the prudent management of its assets while continuing an unwavering focus on the safety of its workers, contractors and the public.
Nalcor’s legal structure as at March 31, 2017 included the entities listed below:
Entity Name Description of Interest Newfoundland and Labrador Hydro (Hydro) Wholly owned subsidiary Nalcor Energy – Oil and Gas Inc. (Oil and Gas) Wholly owned subsidiary Nalcor Energy – Bull Arm Fabrication Inc. (Bull Arm Fabrication) Wholly owned subsidiary Nalcor Energy Marketing Corporation (Energy Marketing) Wholly owned subsidiary Muskrat Falls Corporation (Muskrat Falls) Wholly owned subsidiary Labrador Transmission Corporation (Labrador Transco)1 Wholly owned subsidiary Labrador-Island Link Holding Corporation (LIL Holdco)1 Wholly owned subsidiary Labrador-Island Link General Partner Corporation (LIL GP)1 Wholly owned subsidiary Labrador-Island Link Operating Corporation (LIL OpCo)1 Wholly owned subsidiary Lower Churchill Management Corporation (LCMC)1 Wholly owned subsidiary Churchill Falls (Labrador) Corporation Limited (Churchill Falls) 65.8% owned joint operation of Hydro Twin Falls Power Corporation Limited (Twin Falls) 33.3% owned joint venture of Churchill Falls Labrador-Island Link Limited Partnership (LIL LP)1 Limited partnership in which Nalcor, through LIL Holdco, owns
100% of the 75 Class A limited partnership units Gull Island Power Corporation (GIPCo) Wholly owned subsidiary (inactive) Lower Churchill Development Corporation (LCDC) 51% owned subsidiary of Hydro (inactive) 1These entities comprise the Lower Churchill Project (LCP)
The operating structure as at March 31, 2017 reflects organizational changes that resulted in revised operating segments effective January 1, 2017. The designation of segments is based on a combination of regulatory status and management accountability. Previously reported segmented information has been presented to conform with the current operating structure. The following summary provides a brief overview of the nature of the operations included in each of the Company’s six business segments.
Hydro – is comprised of both regulated and non-regulated activities. • Hydro Regulated activities encompass sales of electricity to customers within the Province that are regulated by the
Newfoundland and Labrador Board of Commissioners of Public Utilities (PUB).• Hydro Non-Regulated activities include the sale of power, purchased from Churchill Falls, to mining operations in Labrador
West as well as costs related to operations that Hydro manages that are not subject to rate regulation by the PUB.
Power Development - includes the development activities of the 824 MW Muskrat Falls hydroelectric generating facility currently under construction in Labrador on the Lower Churchill River. Once construction is complete this asset will become part of the Power Supply segment.
Power Supply - includes Churchill Falls, the Labrador-Island Link and Labrador Transmission Assets (both components of LCP), the Maritime Link (which is owned by Emera, but consolidated by Nalcor), the Menihek Generating Station, and other support activities for the Power Supply business.
• LCP Transmission includes the construction and operation of the Labrador Island Link and Labrador Transmission Assets, whichconsists of transmission lines connecting the Muskrat Falls hydroelectric plant, the Churchill Falls hydroelectric facility, andcertain portions of the transmission system in Labrador to the island of Newfoundland.
NALCOR ENERGY 2017 Q1 FINANCIAL REPORT 1
MANAGEMENT’S DISCUSSION & ANALYSIS FOR THE THREE MONTHS ENDED MARCH 31, 2017
• Churchill Falls owns and operates a hydroelectric generating facility which sells electricity to Hydro-Québec and Hydro.• Other includes costs associated with Nalcor’s operation of the Menihek Generating Station and the related revenues and cost
recoveries from Hydro-Québec, the Maritime Link, administration costs related to Power Supply, and costs associated with themanagement of LCP construction.
Energy Markets - includes energy trading activities and commercial activities related to development of energy markets. • Energy Trading includes the sale of available Recapture to export markets in eastern Canada and the northeastern United
States. Recapture refers to excess energy from the 300 MW block of electricity which Churchill Falls has agreed to sell anddeliver to Hydro to service its residential, commercial and industrial Labrador Interconnected customers.
• Commercial and other includes development costs associated with Gull Island, Phase Two of LCP, and business developmentactivities related to exploring additional markets and sources for future energy generation and transmission.
Offshore Development - includes the Oil and Gas business and the Bull Arm Fabrication business. • Oil and Gas activities include exploration, development, production, transportation and processing sectors of the oil and gas
industry.• Bull Arm Fabrication consists of an industrial fabrication site which is leased for major construction of development projects.
Corporate includes corporate support and shared services functions.
Nalcor maintains appropriate systems of internal control, policies and procedures which provide management with reasonable assurance that assets are safeguarded and its financial information is reliable. The following discussion and analysis includes results as of March 31, 2017 with subsequent event and outlook information updated up to May 9, 2017. The Management’s Discussion and Analysis (MD&A) is the responsibility of management and the Board of Directors carries out its responsibility for review of this disclosure principally through its Audit Committee. This MD&A was reviewed by the Audit Committee and approved by the Board of Directors on May 9, 2017.
This MD&A should be read in conjunction with the unaudited condensed consolidated interim financial statements of Nalcor for the three months ended March 31, 2017 and Nalcor’s annual audited consolidated financial statements for the year ended December 31, 2016.
Basis of Presentation Unless otherwise noted, all financial information has been prepared in accordance with International Financial Reporting Standards (IFRS) as issued by the International Accounting Standards Board.
All financial information is reported in Canadian dollars (CAD), unless otherwise noted.
Non-GAAP Financial Measures Certain financial measures in this MD&A are not prescribed by IFRS as contained within Part I of the Chartered Professional Accountants of Canada Handbook. These non-generally accepted accounting principles (Non-GAAP) financial measures are defined in Section 8 - Non-GAAP Financial Measures.
Forward-Looking Information Certain statements in this MD&A are forward-looking statements, based on Nalcor’s current expectations, estimates, projections and assumptions, which are subject to risks and uncertainties. Statements containing words such as “could”, “expect”, “may”, “anticipate”, “believe”, “intend”, “estimate”, “plan” and similar expressions constitute forward-looking statements. By their nature, forward-looking statements require Management to make assumptions and are subject to important unknown risks and uncertainties, which may cause actual results in future periods to differ materially from forecasted results. While Management considers these assumptions to be reasonable and appropriate based on information currently available, there is a risk that they may not be accurate. Nalcor assumes no obligation to update or revise any forward-looking statements, whether as a result of new information, future events or any other reason.
NALCOR ENERGY 2017 Q1 FINANCIAL REPORT 2
MANAGEMENT’S DISCUSSION & ANALYSIS FOR THE THREE MONTHS ENDED MARCH 31, 2017
SECTION 2: SUMMARY OF FINANCIAL RESULTS AND RECENT DEVELOPMENTS
FINANCIAL HIGHLIGHTS
Key Profit Drivers Key profit drivers vary across each of Nalcor’s business segments as there are a combination of regulated operations, operations with long-term and medium-term supply contracts and operations in markets where revenues are driven entirely by commodity prices (export electricity and oil). In addition to the effect that oil prices have on Oil and Gas’ operations, Oil and Gas may incur impairment expenses and future reversal of such expenses due to changes in projected future cash flows. Certain factors impacting future cash flows include fluctuations in oil price, discount rate and reserves. Any impairment expense or reversal of such expense is reflected in Nalcor’s results, and can lead to large fluctuations in profit or loss between financial reporting periods. Also, in the case of Oil and Gas, cash flow and results of operations are significantly influenced by oil production levels in offshore developments in which Nalcor holds equity interests. As a result, it is necessary to consider the underlying key profit drivers and performance of each business segment to understand Nalcor’s consolidated performance.
Nalcor’s profitability is also impacted by exchange rate fluctuations for a number of foreign currencies, the most significant being the CAD/United States Dollar (USD) exchange rate. Nearly all revenue generated by Oil and Gas, Energy Trading and Bull Arm are denominated in USD. Volatility is partially mitigated through USD hedging. However, in general, any fluctuations in the USD exchange rate have a direct impact on Nalcor’s profit. Various expenses, capital expenditures and Statement of Financial Position balances include amounts denominated in USD, particularly Hydro’s fuel purchases for the Holyrood Thermal Generating Station (HTGS). Cost variances for these fuel purchases as a result of exchange rate fluctuations are captured in the Rate Stabilization Plan (RSP) and do not impact Nalcor’s profit. The average exchange rate for first three months of 2017, before the impact of Nalcor’s foreign exchange hedging program, was $1.33 CAD per USD as compared to $1.37 CAD per USD for the same period in 2016.
Hydro Regulated is entitled to the opportunity to recover, through customer rates, all reasonable and prudent costs incurred in providing electricity service to its customers, in addition to a just and reasonable return on rate base, in accordance with Section 80 of the Public Utilities Act. Failure to obtain rate orders on a timely basis as applied for may adversely affect the profit of Hydro Regulated.
NALCOR ENERGY 2017 Q1 FINANCIAL REPORT 3
MANAGEMENT’S DISCUSSION & ANALYSIS FOR THE THREE MONTHS ENDED MARCH 31, 2017
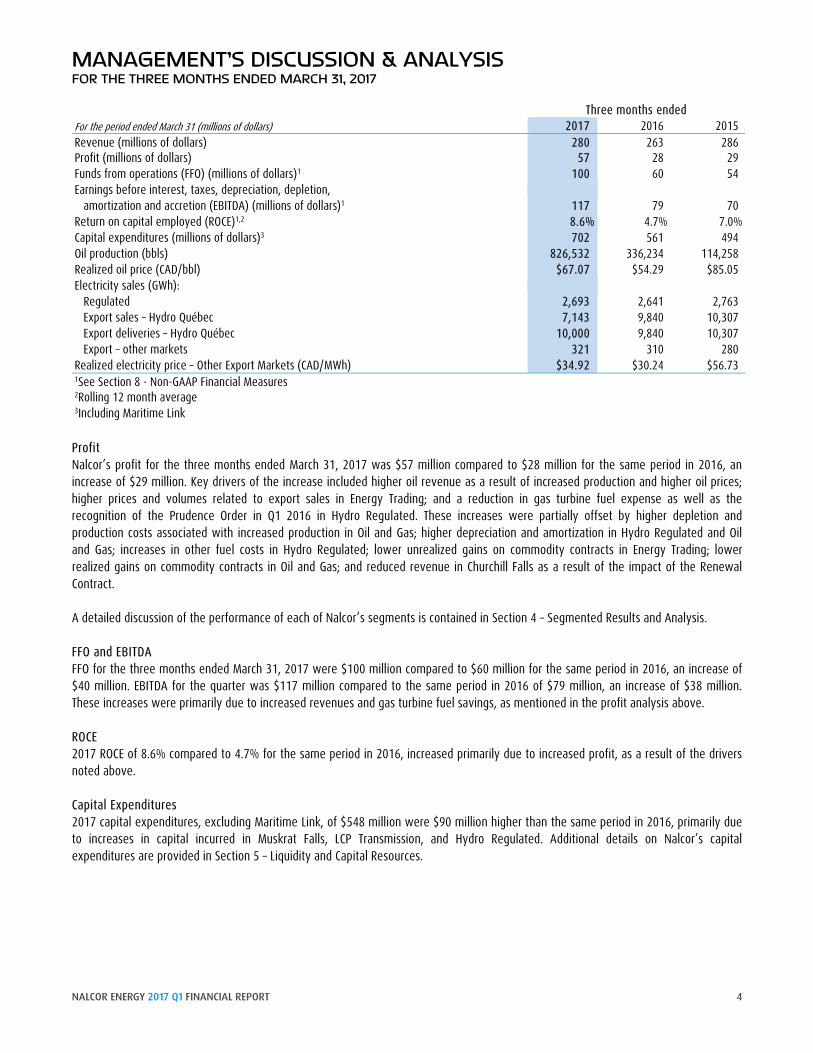
Three months ended For the period ended March 31 (millions of dollars) 2017 2016 2015 Revenue (millions of dollars) 280 263 286 Profit (millions of dollars) 57 28 29 Funds from operations (FFO) (millions of dollars)1 100 60 54 Earnings before interest, taxes, depreciation, depletion,
amortization and accretion (EBITDA) (millions of dollars)1 117 79 70 Return on capital employed (ROCE)1,2 8.6% 4.7% 7.0% Capital expenditures (millions of dollars)3 702 561 494 Oil production (bbls) 826,532 336,234 114,258 Realized oil price (CAD/bbl) $67.07 $54.29 $85.05 Electricity sales (GWh):
Regulated 2,693 2,641 2,763 Export sales – Hydro Québec 7,143 9,840 10,307 Export deliveries – Hydro Québec 10,000 9,840 10,307 Export – other markets 321 310 280
Realized electricity price – Other Export Markets (CAD/MWh) $34.92 $30.24 $56.73 1See Section 8 - Non-GAAP Financial Measures 2Rolling 12 month average 3Including Maritime Link
Profit Nalcor’s profit for the three months ended March 31, 2017 was $57 million compared to $28 million for the same period in 2016, an increase of $29 million. Key drivers of the increase included higher oil revenue as a result of increased production and higher oil prices; higher prices and volumes related to export sales in Energy Trading; and a reduction in gas turbine fuel expense as well as the recognition of the Prudence Order in Q1 2016 in Hydro Regulated. These increases were partially offset by higher depletion and production costs associated with increased production in Oil and Gas; higher depreciation and amortization in Hydro Regulated and Oil and Gas; increases in other fuel costs in Hydro Regulated; lower unrealized gains on commodity contracts in Energy Trading; lower realized gains on commodity contracts in Oil and Gas; and reduced revenue in Churchill Falls as a result of the impact of the Renewal Contract.
A detailed discussion of the performance of each of Nalcor’s segments is contained in Section 4 – Segmented Results and Analysis.
FFO and EBITDA FFO for the three months ended March 31, 2017 were $100 million compared to $60 million for the same period in 2016, an increase of $40 million. EBITDA for the quarter was $117 million compared to the same period in 2016 of $79 million, an increase of $38 million. These increases were primarily due to increased revenues and gas turbine fuel savings, as mentioned in the profit analysis above.
ROCE 2017 ROCE of 8.6% compared to 4.7% for the same period in 2016, increased primarily due to increased profit, as a result of the drivers noted above.
Capital Expenditures 2017 capital expenditures, excluding Maritime Link, of $548 million were $90 million higher than the same period in 2016, primarily due to increases in capital incurred in Muskrat Falls, LCP Transmission, and Hydro Regulated. Additional details on Nalcor’s capital expenditures are provided in Section 5 – Liquidity and Capital Resources.
NALCOR ENERGY 2017 Q1 FINANCIAL REPORT 4
MANAGEMENT’S DISCUSSION & ANALYSIS FOR THE THREE MONTHS ENDED MARCH 31, 2017 Statement of Financial Position
As at (millions of dollars) March 31
2017 December 31
2016 December 31
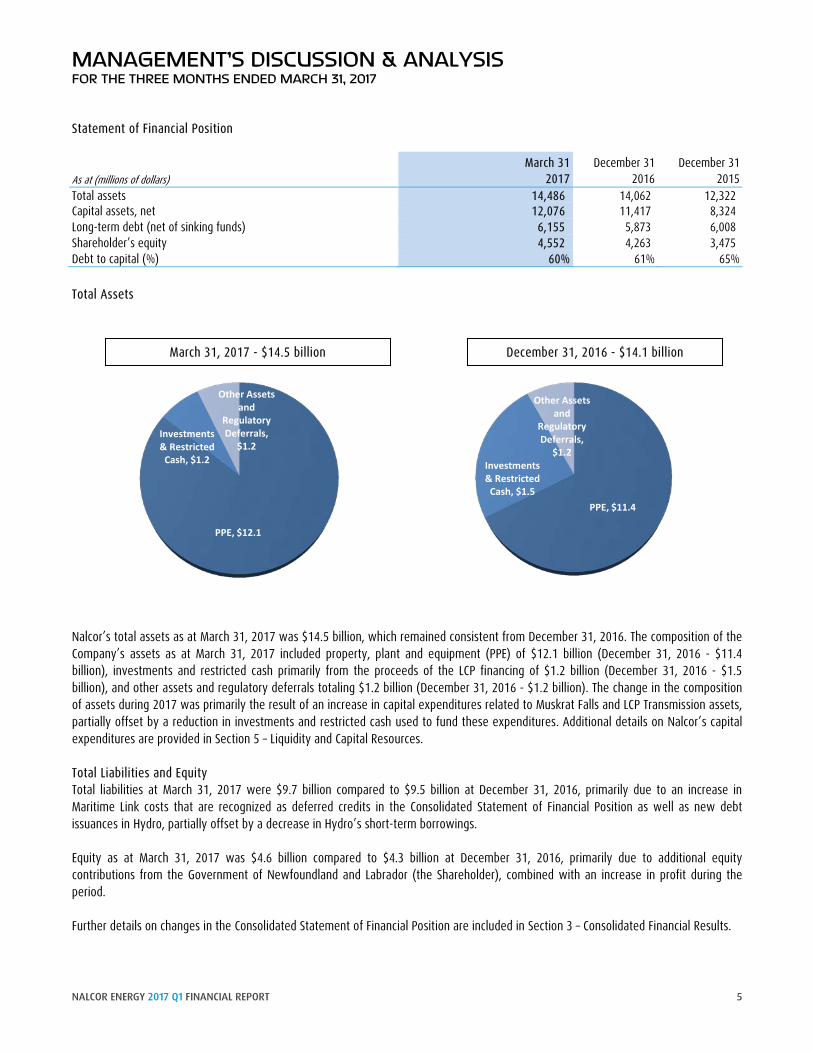
2015 Total assets 14,486 14,062 12,322 Capital assets, net 12,076 11,417 8,324 Long-term debt (net of sinking funds) 6,155 5,873 6,008 Shareholder’s equity 4,552 4,263 3,475 Debt to capital (%) 60% 61% 65% Total Assets
Nalcor’s total assets as at March 31, 2017 was $14.5 billion, which remained consistent from December 31, 2016. The composition of the Company’s assets as at March 31, 2017 included property, plant and equipment (PPE) of $12.1 billion (December 31, 2016 - $11.4 billion), investments and restricted cash primarily from the proceeds of the LCP financing of $1.2 billion (December 31, 2016 - $1.5 billion), and other assets and regulatory deferrals totaling $1.2 billion (December 31, 2016 - $1.2 billion). The change in the composition of assets during 2017 was primarily the result of an increase in capital expenditures related to Muskrat Falls and LCP Transmission assets, partially offset by a reduction in investments and restricted cash used to fund these expenditures. Additional details on Nalcor’s capital expenditures are provided in Section 5 – Liquidity and Capital Resources. Total Liabilities and Equity Total liabilities at March 31, 2017 were $9.7 billion compared to $9.5 billion at December 31, 2016, primarily due to an increase in Maritime Link costs that are recognized as deferred credits in the Consolidated Statement of Financial Position as well as new debt issuances in Hydro, partially offset by a decrease in Hydro’s short-term borrowings. Equity as at March 31, 2017 was $4.6 billion compared to $4.3 billion at December 31, 2016, primarily due to additional equity contributions from the Government of Newfoundland and Labrador (the Shareholder), combined with an increase in profit during the period. Further details on changes in the Consolidated Statement of Financial Position are included in Section 3 – Consolidated Financial Results.
PPE, $12.1
Investments & Restricted
Cash, $1.2
Other Assets and
Regulatory Deferrals,
$1.2
PPE, $11.4
Investments & Restricted
Cash, $1.5
Other Assets and
Regulatory Deferrals,
$1.2
March 31, 2017 - $14.5 billion December 31, 2016 - $14.1 billion
NALCOR ENERGY 2017 Q1 FINANCIAL REPORT 5
MANAGEMENT’S DISCUSSION & ANALYSIS FOR THE THREE MONTHS ENDED MARCH 31, 2017 Debt to Capital Debt to capital decreased slightly to 60% for the period ending March 31, 2017 compared to 61% at December 31, 2016, primarily due to increased shareholder contributions and profit, partially offset by an increase in net debt, primarily associated with new debt issuances in Hydro as well as increased Class B limited partnership unit contributions. RECENT DEVELOPMENTS
HYDRO REGULATED
General Rate Application Hydro filed a General Rate Application (GRA) in July 2013, using a 2013 Test Year, requesting a rate adjustment effective January 1, 2014. Due to the length of time the GRA process required and the delay in obtaining a rate change, in November 2014 Hydro filed an amended GRA based on 2014 and 2015 Test Years. The amended GRA filing requested new rates for Industrial Customers effective January 1, 2015 and the remainder of customer rates effective February 1, 2015. The PUB approved interim rates effective July 1, 2015. The public hearing of Hydro’s GRA concluded in early December 2015 and final arguments were filed at the end of January 2016. Hydro received Board Order No. P.U. 49(2016) (the GRA Order) on December 1, 2016. Hydro has recorded its best estimate of the impact of the GRA Order in its 2016 financial results, based upon Management's interpretation of the Order. In January 2017, Hydro filed an application with the PUB seeking approval of final customer rates in compliance with the GRA Order (the GRA Compliance Application). On May 1, 2017, Hydro received Board Order No. P.U. 14 (2017). In response, Hydro will be filing an additional application to the PUB seeking approval of final customer rates, which are anticipated to be effective July 1st, 2017. Regulatory risk remains around the timing and approval of this application. RSP Surplus Refund In July 2016, Hydro filed an application with the PUB for approval of a plan to refund the balance in the RSP Surplus to Newfoundland Power and Hydro’s Island Interconnected Rural customers. Newfoundland Power also filed an application to refund their portion of the RSP Surplus balance to their customers. The RSP Surplus to be refunded is approximately $140 million. The PUB has approved both applications. Disposition of these funds began in Q1 2017 with Hydro providing approximately $119 million to Newfoundland Power for disposition to their customers. At the end of Q1 2017, Hydro has refunded approximately 80% of the balance due to its customers. Supplemental Capital Hydro has filed six supplemental capital applications in 2017. The largest related to the refurbishment of a penstock at Bay d’Espoir for $9 million. Three of the six applications have been approved with the remaining applications currently under review by the PUB. In March 2017, Hydro identified one unforeseen capital project related to damage sustained on transmission lines TL 201 and TL 212 during the March 2017 windstorm. Hydro used the Allowance for Unforeseen account to initiate this work and has subsequently applied to have the Allowance for Unforeseen replenished to $1 million. This application is currently before the PUB. The Allowance for Unforeseen is intended to permit a utility to act expeditiously to deal with events affecting the electrical system which cannot wait for specific approval by the PUB due to the urgent nature of the work and the serious negative consequences associated with any delays in repairing the electrical system. Other Regulatory Activity The Phase II investigation and hearing into supply issues and power outages on the Island Interconnected System is ongoing. The focus of this proceeding continues to be on the reliability and adequacy of the Island Interconnected System leading up to, and after, the interconnection of Muskrat Falls. The schedule for the proceeding has not yet been finalized and the timing of the hearing has not been determined.
NALCOR ENERGY 2017 Q1 FINANCIAL REPORT 6
MANAGEMENT’S DISCUSSION & ANALYSIS FOR THE THREE MONTHS ENDED MARCH 31, 2017
CHURCHILL FALLS
The initial term of the 1969 Power Contract between Churchill Falls and Hydro-Québec expired in 2016. A Renewal Contract commenced September 1, 2016 and resulted in a decrease in the contract rate from 2.5426 mills per kWh to 2.0 mills per kWh as well as a change in the contract methodology from revenue recognition based upon the energy delivered to Hydro-Québec to revenue recognition based upon an interim Annual Energy Base agreed upon by both parties, which can differ from energy delivered. The Renewal Contract expires on August 31, 2041 and since 2017 will be the first full year of the Renewal Contract, revenue for Churchill Falls will be lower compared to prior year.
In August 2016, Churchill Falls received judgment from the Québec Court of Appeal upholding the 2014 Québec Superior Court ruling on the motion filed by Churchill Falls to address the inequities of the pricing terms of the 1969 Power Contract between Churchill Falls and Hydro-Québec. The Court ruled against Churchill Falls. On April 20, 2017, Churchill Falls was granted leave to appeal the case to the Supreme Court of Canada. A hearing date is anticipated to be scheduled within 12 months.
In addition, Churchill Falls received judgment from the Québec Superior Court regarding a Motion for Declaratory Judgment filed by Hydro-Québec relating to the interpretation of the 1969 Power Contract between Churchill Falls and Hydro-Québec and the associated Renewal Contract. The Court ruled in favour of Hydro-Québec. Churchill Falls has filed a Notice of Appeal with the Québec Court of Appeal. The date of the appeal hearing has not yet been set but it is anticipated that it will be scheduled for some time in 2018.
As a result of the expiration of the sub-lease between Twin Falls and Churchill Falls regarding the right to develop hydroelectric power on the Unknown River, a further sub-lease was signed between Hydro and Churchill Falls, naming Hydro as the lessee of the transmission lines and related assets. The lease term was originally for a six-month period, expiring March 31, 2017, but was extended to October 31, 2017.
MUSKRAT FALLS AND LCP TRANSMISSION On February 14, 2017 Muskrat Falls Corporation and Astaldi Canada finalized the negotiated terms for an agreement to complete construction of the powerhouse and intake civil works for the Muskrat Falls generation facility. The increase in contract value associated with this agreement will result in an increase in the capital cost estimate, before financing costs, for LCP from the $9.1 billion announced in June 2016 to $9.4 billion.
OIL AND GAS As a result of drilling and completion activities at the White Rose (WR) and Hibernia Southern Extension (HSE), combined with the continued use of water injection wells at HSE, production volumes, revenue and depletion increased compared to the same period in 2016. Nalcor and partners continue to evaluate a sanction decision for the White Rose Extension Project, which may materially impact results in future periods.
BULL ARM FABRICATION In preparation for the conclusion of the Hebron project and ExxonMobil Canada Properties exit from the Bull Arm Fabrication site, Bull Arm issued an expression of interest on March 9, 2017 to assess and quantify the opportunities for the site post-Hebron. The deadline for submissions was April 25, 2017 and Management is currently assessing the results.
NALCOR ENERGY 2017 Q1 FINANCIAL REPORT 7
MANAGEMENT’S DISCUSSION & ANALYSIS FOR THE THREE MONTHS ENDED MARCH 31, 2017 SECTION 3: CONSOLIDATED FINANCIAL RESULTS CONSOLIDATED STATEMENT OF PROFIT AND COMPREHENSIVE INCOME Three months ended For the period ended March 31 (millions of dollars) 2017 2016 Variance Revenue 280 263 17 Fuels 84 73 11 Power purchased 19 17 2 Operating costs 53 54 (1) Production, marketing and transportation costs 9 5 4 Transmission rental and market fees 6 5 1 Depreciation, depletion and amortization 41 30 11 Net finance expense 17 19 (2) Other expense (income) 1 (8) 9 230 195 35 Profit before regulatory adjustments 50 68 (18) Regulatory adjustments (7) 40 (47) Profit for the period 57 28 29 Other comprehensive (loss) income for the period (10) 1 (11) Total comprehensive income for the period 47 29 18 Revenue Revenue for the period ended 2017 was $280 million compared to $263 million for the same period in 2016, an increase of $17 million, primarily due to an increase in Oil and Gas revenue resulting from increased HSE production volumes and prices, higher realized export prices and higher volumes of export sales in Energy Trading, higher revenue achieved under the Guaranteed Winter Availability Contract (GWAC), and increased energy and demand sales in Hydro Regulated. These increases were partially offset by a decrease in Hydro Regulated revenue resulting from customer rate reductions associated with the normal operation of the RSP, and a decrease in power sales in Churchill Falls due to changes in the contract rate and methodology on power sales under the Renewal Contract with Hydro-Quebec. The impact of the decreased revenue in Hydro Regulated related to the RSP is largely offset in the regulatory adjustments line. Fuels Fuel costs for the period ended 2017 were $84 million compared to $73 million for the same period in 2016, an increase of $11 million, primarily due to higher prices per barrel of No.6 fuel, partially offset by reduction in fuel consumed by the Holyrood plant combustion turbine. The majority of the variances in No.6 fuel are offset through the RSP in the regulatory adjustments line. Power purchased Power purchases for the period ended 2017 were comparable to the same period in 2016. Operating costs Operating costs for the period ended 2017 were comparable to the same period in 2016. Production, marketing and transportation costs Oil and Gas production, marketing and transportation costs for the period ended 2017 were $9 million compared to $5 million for the same period in 2016, an increase of $4 million, primarily due to increased production volumes at HSE as well as increased project operating costs at WR and HSE. Transmission rental and market fees Transmission rental and market fees for the period ended 2017 were comparable to the same period in 2016.
NALCOR ENERGY 2017 Q1 FINANCIAL REPORT 8
MANAGEMENT’S DISCUSSION & ANALYSIS FOR THE THREE MONTHS ENDED MARCH 31, 2017
Depreciation, depletion and amortization Depreciation, depletion and amortization expenses for the period ended 2017 were $41 million compared to $30 million for the same period in 2016, an increase of $11 million, mainly due to increased depletion resulting from increased production at HSE, increased levels of investment in property, plant and equipment as well as increased amortization of intangible exploration assets.
Net finance expense Net finance expense for the period ended 2017 was comparable to the same period in 2016.
Other expense (income) Other expense for the period ended 2017 was $1 million compared to income of $8 million for the same period in 2016, a decrease of $9 million. The decrease is primarily due to the fact that Energy Trading held no commodity contracts during the three months ended 2017, while there were favourable settlements and unrealized mark-to-market gains recognized on commodity contracts held during the same period in 2016. As well, Oil and Gas recognized losses on the settlement of commodity contracts in the three months ended 2017 compared to a gain in the same period in 2016. These decreases were partially offset by more favourable foreign exchange on USD transactions in Oil and Gas.
Regulatory adjustments Regulatory adjustments for the period ended 2017 of $7 million in recoveries were favourable compared to expenses of $40 million for the same period in 2016, an increase of $47 million. The increase was primarily due to RSP amortization and deferred fuel costs as a result of the normal operation of the RSP, combined with a favorable variance relating to a non-recurring allowance for the impact of the Prudence Order recognized in Q1 2016.
NALCOR ENERGY 2017 Q1 FINANCIAL REPORT 9
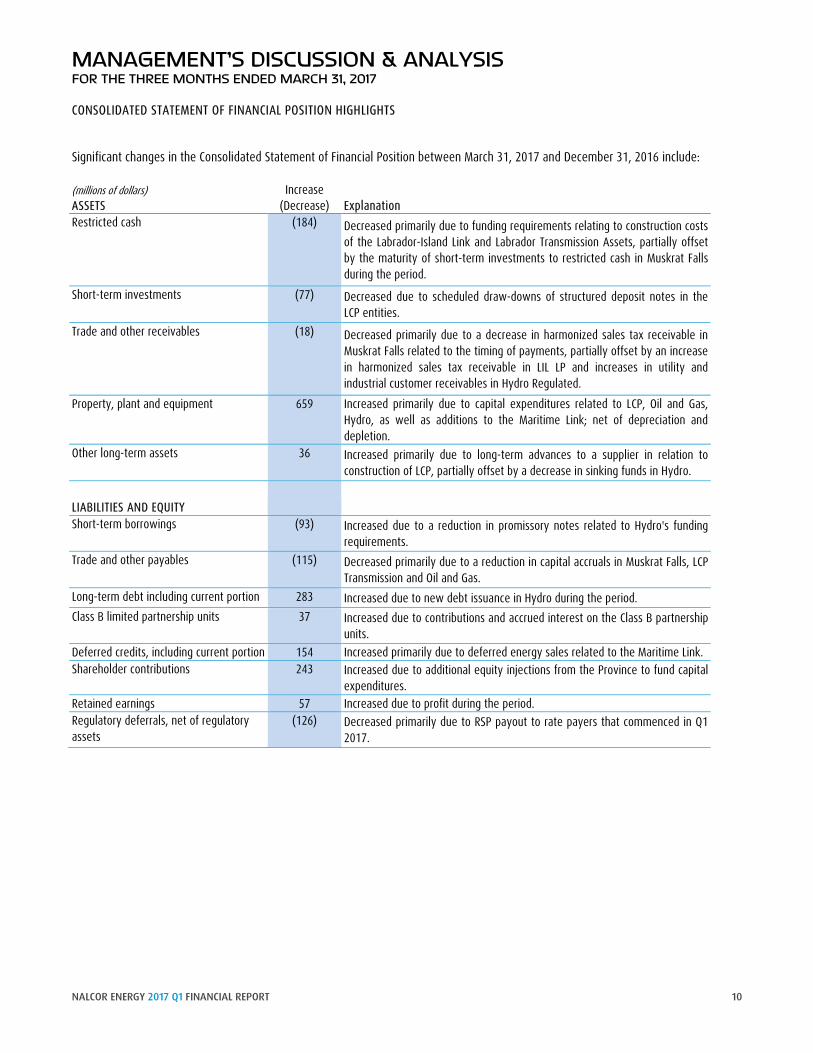
MANAGEMENT’S DISCUSSION & ANALYSIS FOR THE THREE MONTHS ENDED MARCH 31, 2017 CONSOLIDATED STATEMENT OF FINANCIAL POSITION HIGHLIGHTS
Significant changes in the Consolidated Statement of Financial Position between March 31, 2017 and December 31, 2016 include: (millions of dollars) Increase ASSETS (Decrease) Explanation Restricted cash (184) Decreased primarily due to funding requirements relating to construction costs
of the Labrador-Island Link and Labrador Transmission Assets, partially offset by the maturity of short-term investments to restricted cash in Muskrat Falls during the period.
Short-term investments (77) Decreased due to scheduled draw-downs of structured deposit notes in the LCP entities.
Trade and other receivables (18) Decreased primarily due to a decrease in harmonized sales tax receivable in Muskrat Falls related to the timing of payments, partially offset by an increase in harmonized sales tax receivable in LIL LP and increases in utility and industrial customer receivables in Hydro Regulated.
Property, plant and equipment 659 Increased primarily due to capital expenditures related to LCP, Oil and Gas, Hydro, as well as additions to the Maritime Link; net of depreciation and depletion.
Other long-term assets 36 Increased primarily due to long-term advances to a supplier in relation to construction of LCP, partially offset by a decrease in sinking funds in Hydro.
LIABILITIES AND EQUITY
Short-term borrowings (93) Increased due to a reduction in promissory notes related to Hydro's funding requirements.
Trade and other payables (115) Decreased primarily due to a reduction in capital accruals in Muskrat Falls, LCP Transmission and Oil and Gas.
Long-term debt including current portion 283 Increased due to new debt issuance in Hydro during the period. Class B limited partnership units 37 Increased due to contributions and accrued interest on the Class B partnership
units. Deferred credits, including current portion 154 Increased primarily due to deferred energy sales related to the Maritime Link. Shareholder contributions 243 Increased due to additional equity injections from the Province to fund capital
expenditures. Retained earnings 57 Increased due to profit during the period. Regulatory deferrals, net of regulatory assets
(126) Decreased primarily due to RSP payout to rate payers that commenced in Q1 2017.
NALCOR ENERGY 2017 Q1 FINANCIAL REPORT 10
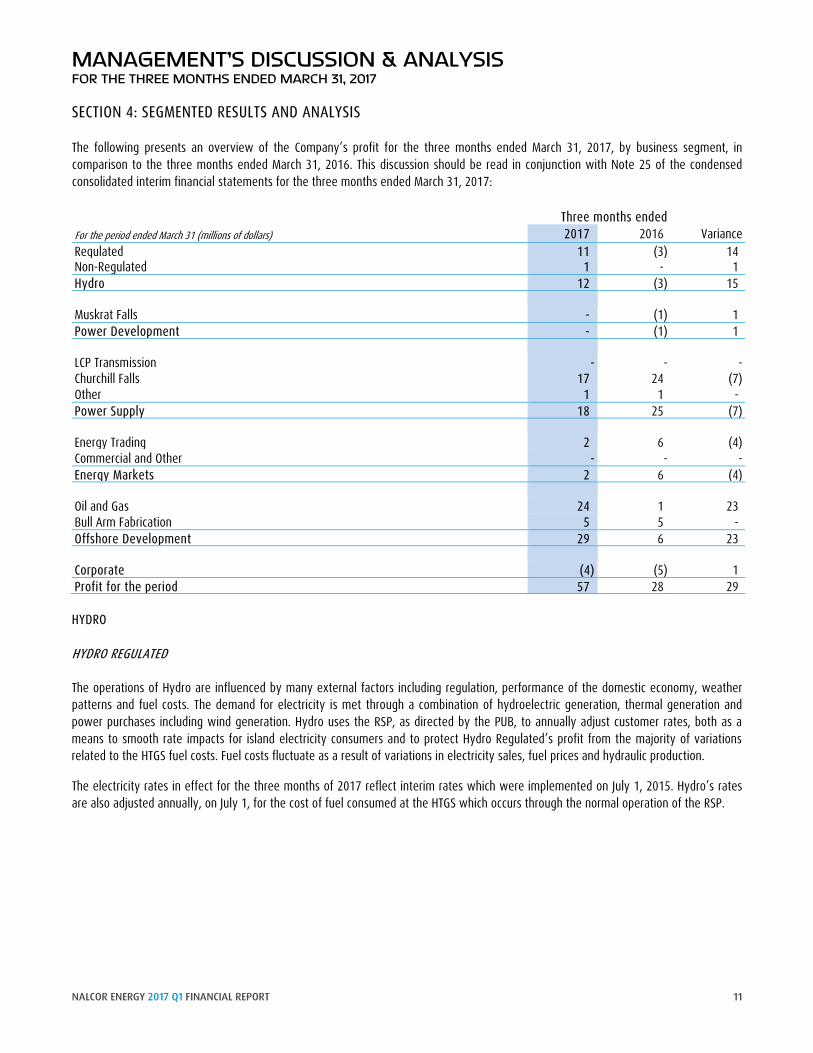
MANAGEMENT’S DISCUSSION & ANALYSIS FOR THE THREE MONTHS ENDED MARCH 31, 2017 SECTION 4: SEGMENTED RESULTS AND ANALYSIS The following presents an overview of the Company’s profit for the three months ended March 31, 2017, by business segment, in comparison to the three months ended March 31, 2016. This discussion should be read in conjunction with Note 25 of the condensed consolidated interim financial statements for the three months ended March 31, 2017: Three months ended For the period ended March 31 (millions of dollars) 2017 2016 Variance Regulated 11 (3) 14 Non-Regulated 1 - 1 Hydro 12 (3) 15 Muskrat Falls - (1) 1 Power Development - (1) 1 LCP Transmission - - - Churchill Falls 17 24 (7) Other 1 1 - Power Supply 18 25 (7)
Energy Trading 2 6 (4) Commercial and Other - - - Energy Markets 2 6 (4) Oil and Gas 24 1 23 Bull Arm Fabrication 5 5 - Offshore Development 29 6 23
Corporate (4) (5) 1 Profit for the period 57 28 29 HYDRO HYDRO REGULATED The operations of Hydro are influenced by many external factors including regulation, performance of the domestic economy, weather patterns and fuel costs. The demand for electricity is met through a combination of hydroelectric generation, thermal generation and power purchases including wind generation. Hydro uses the RSP, as directed by the PUB, to annually adjust customer rates, both as a means to smooth rate impacts for island electricity consumers and to protect Hydro Regulated’s profit from the majority of variations related to the HTGS fuel costs. Fuel costs fluctuate as a result of variations in electricity sales, fuel prices and hydraulic production.
The electricity rates in effect for the three months of 2017 reflect interim rates which were implemented on July 1, 2015. Hydro’s rates are also adjusted annually, on July 1, for the cost of fuel consumed at the HTGS which occurs through the normal operation of the RSP.
NALCOR ENERGY 2017 Q1 FINANCIAL REPORT 11
MANAGEMENT’S DISCUSSION & ANALYSIS FOR THE THREE MONTHS ENDED MARCH 31, 2017
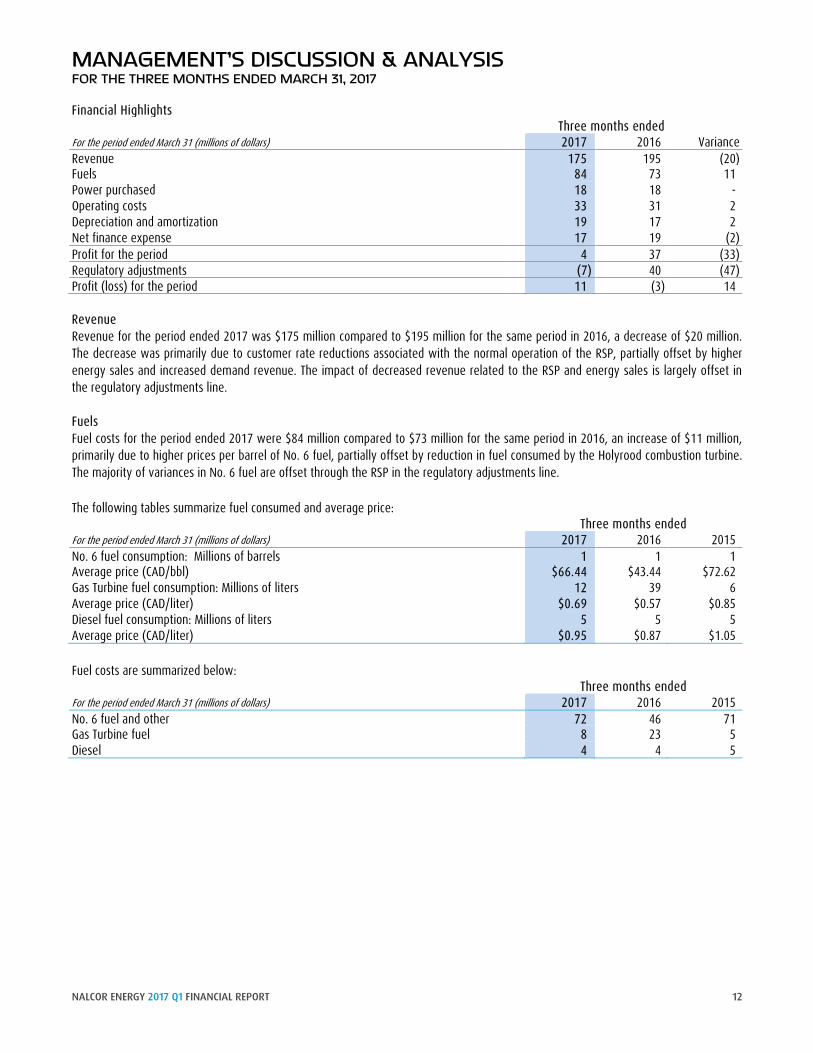
Financial Highlights Three months ended
For the period ended March 31 (millions of dollars) 2017 2016 Variance Revenue 175 195 (20) Fuels 84 73 11 Power purchased 18 18 - Operating costs 33 31 2 Depreciation and amortization 19 17 2 Net finance expense 17 19 (2) Profit for the period 4 37 (33) Regulatory adjustments (7) 40 (47) Profit (loss) for the period 11 (3) 14
Revenue Revenue for the period ended 2017 was $175 million compared to $195 million for the same period in 2016, a decrease of $20 million. The decrease was primarily due to customer rate reductions associated with the normal operation of the RSP, partially offset by higher energy sales and increased demand revenue. The impact of decreased revenue related to the RSP and energy sales is largely offset in the regulatory adjustments line.
Fuels Fuel costs for the period ended 2017 were $84 million compared to $73 million for the same period in 2016, an increase of $11 million, primarily due to higher prices per barrel of No. 6 fuel, partially offset by reduction in fuel consumed by the Holyrood combustion turbine. The majority of variances in No. 6 fuel are offset through the RSP in the regulatory adjustments line.
The following tables summarize fuel consumed and average price: Three months ended
For the period ended March 31 (millions of dollars) 2017 2016 2015 No. 6 fuel consumption: Millions of barrels 1 1 1 Average price (CAD/bbl) $66.44 $43.44 $72.62 Gas Turbine fuel consumption: Millions of liters 12 39 6 Average price (CAD/liter) $0.69 $0.57 $0.85 Diesel fuel consumption: Millions of liters 5 5 5 Average price (CAD/liter) $0.95 $0.87 $1.05
Fuel costs are summarized below: Three months ended
For the period ended March 31 (millions of dollars) 2017 2016 2015 No. 6 fuel and other 72 46 71 Gas Turbine fuel 8 23 5 Diesel 4 4 5
NALCOR ENERGY 2017 Q1 FINANCIAL REPORT 12
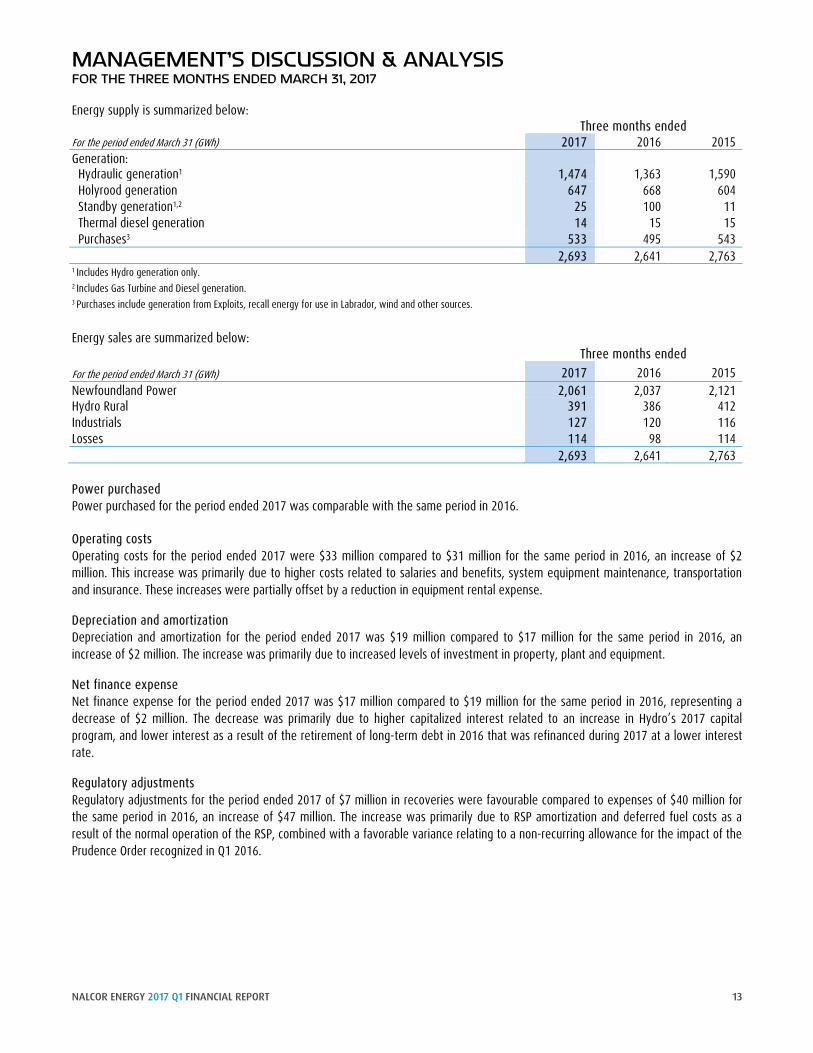
MANAGEMENT’S DISCUSSION & ANALYSIS FOR THE THREE MONTHS ENDED MARCH 31, 2017 Energy supply is summarized below: Three months ended For the period ended March 31 (GWh) 2017 2016 2015 Generation: Hydraulic generation1 1,474 1,363 1,590 Holyrood generation 647 668 604 Standby generation1,2 25 100 11 Thermal diesel generation 14 15 15 Purchases3 533 495 543 2,693 2,641 2,763 1 Includes Hydro generation only. 2 Includes Gas Turbine and Diesel generation. 3 Purchases include generation from Exploits, recall energy for use in Labrador, wind and other sources.
Energy sales are summarized below: Three months ended For the period ended March 31 (GWh) 2017 2016 2015 Newfoundland Power 2,061 2,037 2,121 Hydro Rural 391 386 412 Industrials 127 120 116 Losses 114 98 114 2,693 2,641 2,763 Power purchased Power purchased for the period ended 2017 was comparable with the same period in 2016.
Operating costs Operating costs for the period ended 2017 were $33 million compared to $31 million for the same period in 2016, an increase of $2 million. This increase was primarily due to higher costs related to salaries and benefits, system equipment maintenance, transportation and insurance. These increases were partially offset by a reduction in equipment rental expense.
Depreciation and amortization Depreciation and amortization for the period ended 2017 was $19 million compared to $17 million for the same period in 2016, an increase of $2 million. The increase was primarily due to increased levels of investment in property, plant and equipment.
Net finance expense Net finance expense for the period ended 2017 was $17 million compared to $19 million for the same period in 2016, representing a decrease of $2 million. The decrease was primarily due to higher capitalized interest related to an increase in Hydro’s 2017 capital program, and lower interest as a result of the retirement of long-term debt in 2016 that was refinanced during 2017 at a lower interest rate.
Regulatory adjustments Regulatory adjustments for the period ended 2017 of $7 million in recoveries were favourable compared to expenses of $40 million for the same period in 2016, an increase of $47 million. The increase was primarily due to RSP amortization and deferred fuel costs as a result of the normal operation of the RSP, combined with a favorable variance relating to a non-recurring allowance for the impact of the Prudence Order recognized in Q1 2016.
NALCOR ENERGY 2017 Q1 FINANCIAL REPORT 13
MANAGEMENT’S DISCUSSION & ANALYSIS FOR THE THREE MONTHS ENDED MARCH 31, 2017 HYDRO NON-REGULATED
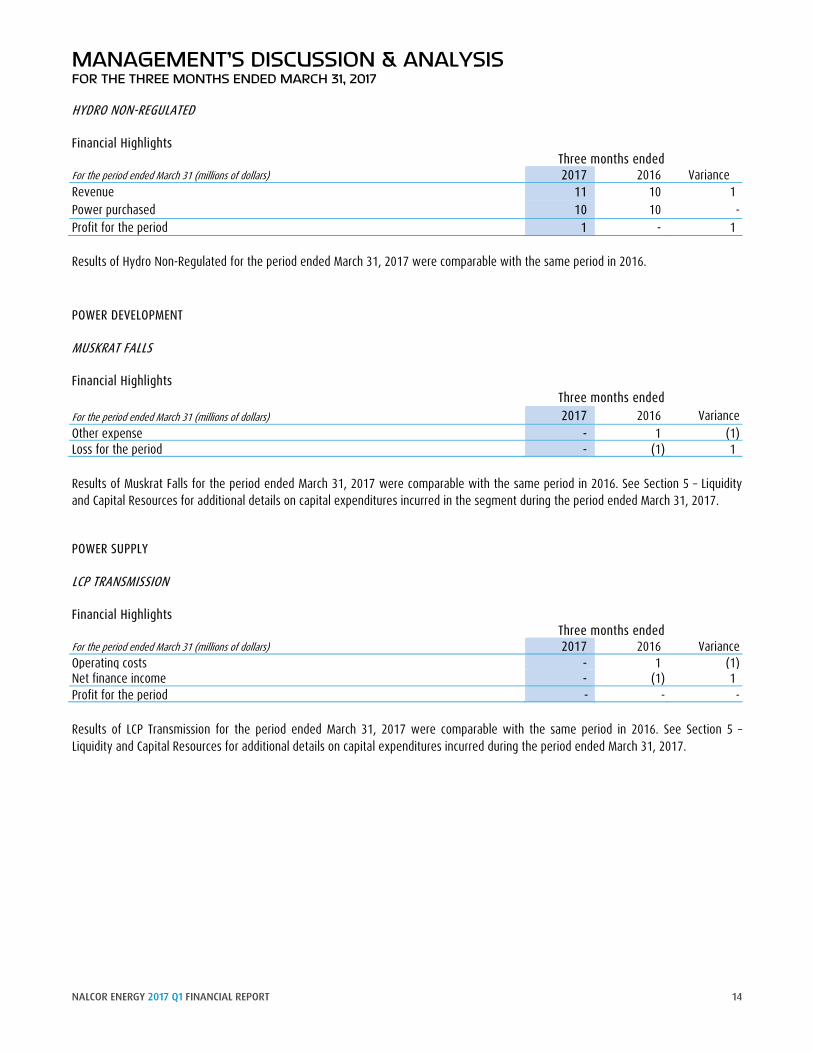
Financial Highlights Three months ended For the period ended March 31 (millions of dollars) 2017 2016 Variance Revenue 11 10 1 Power purchased 10 10 - Profit for the period 1 - 1 Results of Hydro Non-Regulated for the period ended March 31, 2017 were comparable with the same period in 2016. POWER DEVELOPMENT
MUSKRAT FALLS
Financial Highlights Three months ended For the period ended March 31 (millions of dollars) 2017 2016 Variance Other expense - 1 (1) Loss for the period - (1) 1 Results of Muskrat Falls for the period ended March 31, 2017 were comparable with the same period in 2016. See Section 5 – Liquidity and Capital Resources for additional details on capital expenditures incurred in the segment during the period ended March 31, 2017.
POWER SUPPLY
LCP TRANSMISSION
Financial Highlights Three months ended For the period ended March 31 (millions of dollars) 2017 2016 Variance Operating costs - 1 (1) Net finance income - (1) 1 Profit for the period - - - Results of LCP Transmission for the period ended March 31, 2017 were comparable with the same period in 2016. See Section 5 – Liquidity and Capital Resources for additional details on capital expenditures incurred during the period ended March 31, 2017.
NALCOR ENERGY 2017 Q1 FINANCIAL REPORT 14
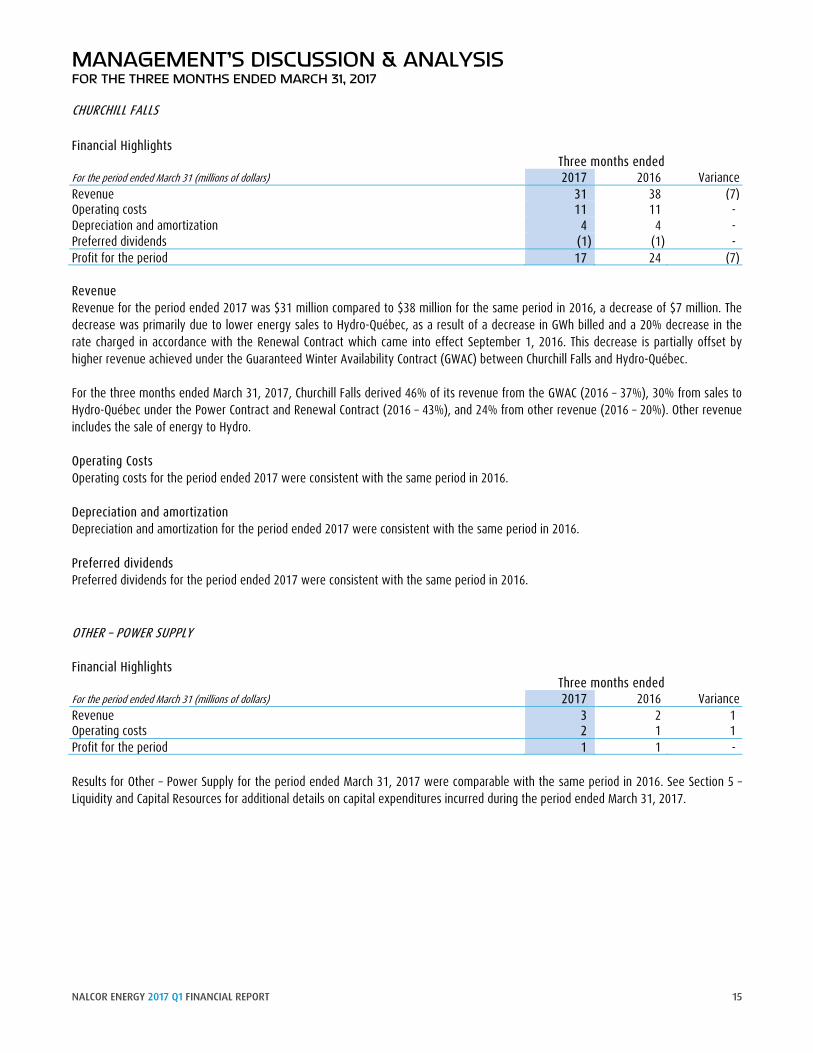
MANAGEMENT’S DISCUSSION & ANALYSIS FOR THE THREE MONTHS ENDED MARCH 31, 2017 CHURCHILL FALLS Financial Highlights Three months ended For the period ended March 31 (millions of dollars) 2017 2016 Variance Revenue 31 38 (7) Operating costs 11 11 - Depreciation and amortization 4 4 - Preferred dividends (1) (1) - Profit for the period 17 24 (7) Revenue Revenue for the period ended 2017 was $31 million compared to $38 million for the same period in 2016, a decrease of $7 million. The decrease was primarily due to lower energy sales to Hydro-Québec, as a result of a decrease in GWh billed and a 20% decrease in the rate charged in accordance with the Renewal Contract which came into effect September 1, 2016. This decrease is partially offset by higher revenue achieved under the Guaranteed Winter Availability Contract (GWAC) between Churchill Falls and Hydro-Québec. For the three months ended March 31, 2017, Churchill Falls derived 46% of its revenue from the GWAC (2016 – 37%), 30% from sales to Hydro-Québec under the Power Contract and Renewal Contract (2016 – 43%), and 24% from other revenue (2016 – 20%). Other revenue includes the sale of energy to Hydro. Operating Costs Operating costs for the period ended 2017 were consistent with the same period in 2016. Depreciation and amortization Depreciation and amortization for the period ended 2017 were consistent with the same period in 2016. Preferred dividends Preferred dividends for the period ended 2017 were consistent with the same period in 2016. OTHER – POWER SUPPLY Financial Highlights Three months ended For the period ended March 31 (millions of dollars) 2017 2016 Variance Revenue 3 2 1 Operating costs 2 1 1 Profit for the period 1 1 - Results for Other – Power Supply for the period ended March 31, 2017 were comparable with the same period in 2016. See Section 5 – Liquidity and Capital Resources for additional details on capital expenditures incurred during the period ended March 31, 2017.
NALCOR ENERGY 2017 Q1 FINANCIAL REPORT 15
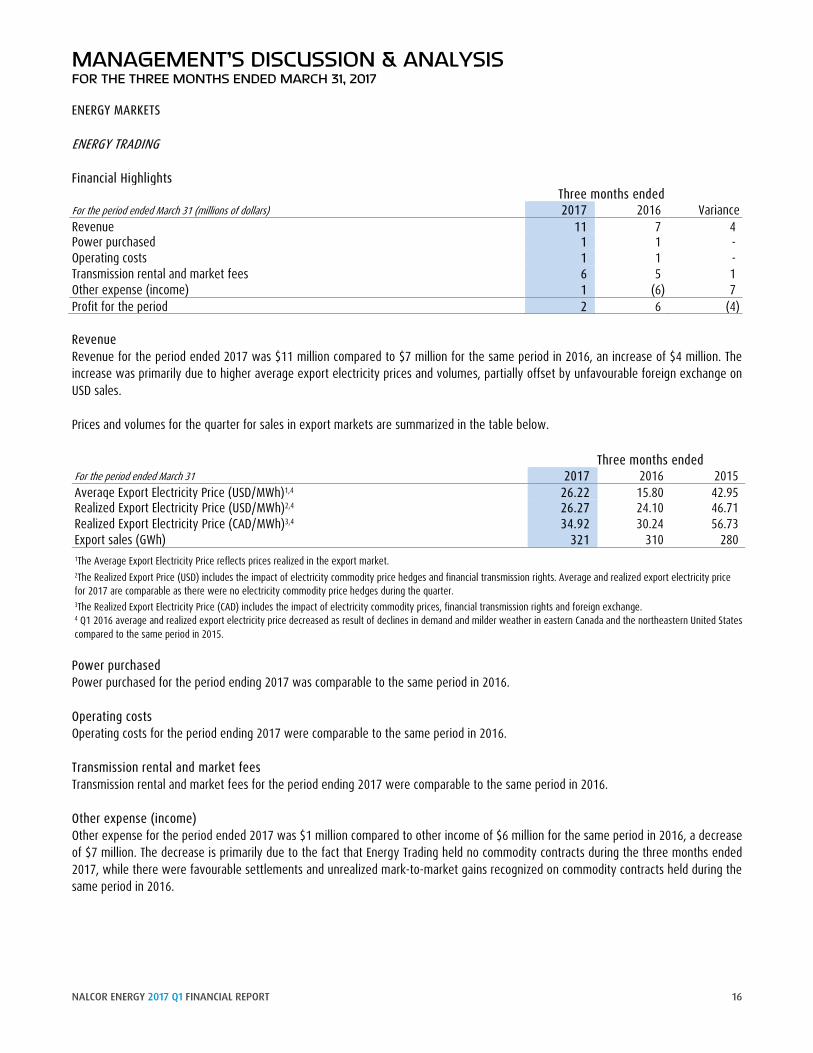
MANAGEMENT’S DISCUSSION & ANALYSIS FOR THE THREE MONTHS ENDED MARCH 31, 2017 ENERGY MARKETS ENERGY TRADING Financial Highlights Three months ended For the period ended March 31 (millions of dollars) 2017 2016 Variance Revenue 11 7 4 Power purchased 1 1 - Operating costs 1 1 - Transmission rental and market fees 6 5 1 Other expense (income) 1 (6) 7 Profit for the period 2 6 (4) Revenue Revenue for the period ended 2017 was $11 million compared to $7 million for the same period in 2016, an increase of $4 million. The increase was primarily due to higher average export electricity prices and volumes, partially offset by unfavourable foreign exchange on USD sales. Prices and volumes for the quarter for sales in export markets are summarized in the table below. Three months ended For the period ended March 31 2017 2016 2015 Average Export Electricity Price (USD/MWh)1,4 26.22 15.80 42.95 Realized Export Electricity Price (USD/MWh)2,4 26.27 24.10 46.71 Realized Export Electricity Price (CAD/MWh)3,4 34.92 30.24 56.73 Export sales (GWh) 321 310 280 1The Average Export Electricity Price reflects prices realized in the export market. 2The Realized Export Price (USD) includes the impact of electricity commodity price hedges and financial transmission rights. Average and realized export electricity price for 2017 are comparable as there were no electricity commodity price hedges during the quarter. 3The Realized Export Electricity Price (CAD) includes the impact of electricity commodity prices, financial transmission rights and foreign exchange. 4 Q1 2016 average and realized export electricity price decreased as result of declines in demand and milder weather in eastern Canada and the northeastern United States compared to the same period in 2015. Power purchased Power purchased for the period ending 2017 was comparable to the same period in 2016. Operating costs Operating costs for the period ending 2017 were comparable to the same period in 2016. Transmission rental and market fees Transmission rental and market fees for the period ending 2017 were comparable to the same period in 2016. Other expense (income) Other expense for the period ended 2017 was $1 million compared to other income of $6 million for the same period in 2016, a decrease of $7 million. The decrease is primarily due to the fact that Energy Trading held no commodity contracts during the three months ended 2017, while there were favourable settlements and unrealized mark-to-market gains recognized on commodity contracts held during the same period in 2016.
NALCOR ENERGY 2017 Q1 FINANCIAL REPORT 16
MANAGEMENT’S DISCUSSION & ANALYSIS FOR THE THREE MONTHS ENDED MARCH 31, 2017 COMMERCIAL AND OTHER Results of Commercial and Other for the period ended March 31, 2017 were primarily capital in nature. See Section 5 – Liquidity and Capital Resources for additional details on capital expenditures incurred during the period ended March 31, 2017.
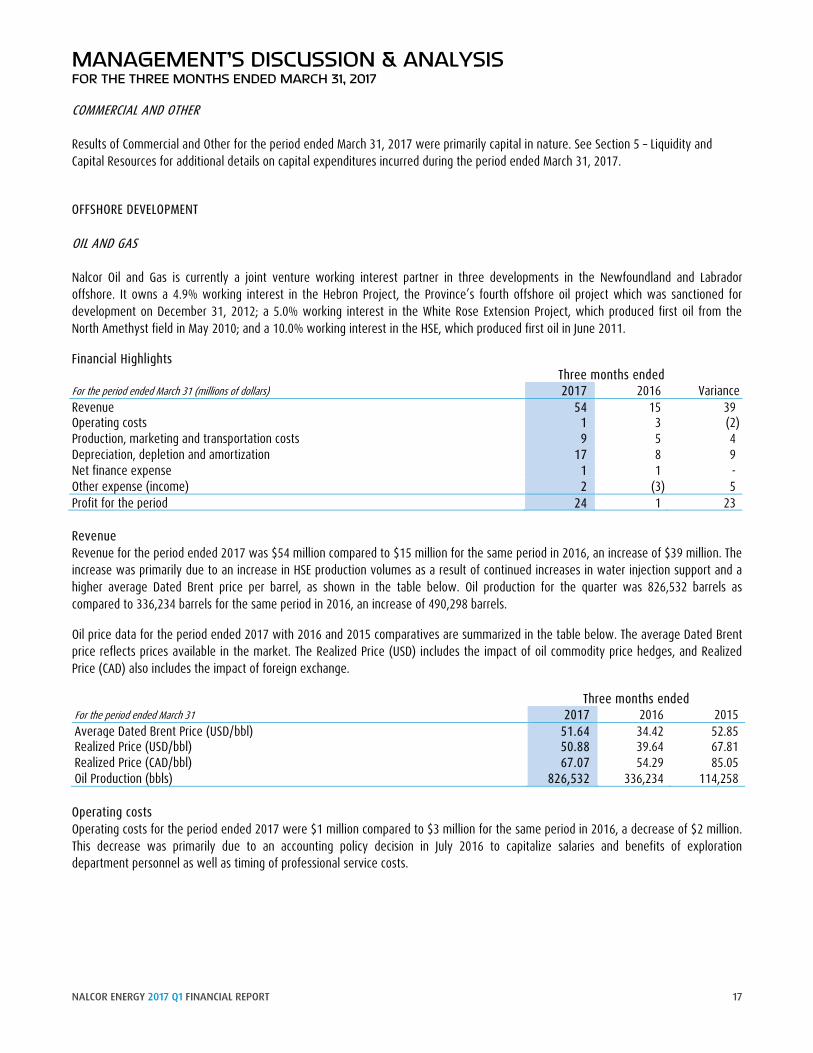
OFFSHORE DEVELOPMENT OIL AND GAS Nalcor Oil and Gas is currently a joint venture working interest partner in three developments in the Newfoundland and Labrador offshore. It owns a 4.9% working interest in the Hebron Project, the Province’s fourth offshore oil project which was sanctioned for development on December 31, 2012; a 5.0% working interest in the White Rose Extension Project, which produced first oil from the North Amethyst field in May 2010; and a 10.0% working interest in the HSE, which produced first oil in June 2011.
Financial Highlights Three months ended For the period ended March 31 (millions of dollars) 2017 2016 Variance Revenue 54 15 39 Operating costs 1 3 (2) Production, marketing and transportation costs 9 5 4 Depreciation, depletion and amortization 17 8 9 Net finance expense 1 1 - Other expense (income) 2 (3) 5 Profit for the period 24 1 23 Revenue Revenue for the period ended 2017 was $54 million compared to $15 million for the same period in 2016, an increase of $39 million. The increase was primarily due to an increase in HSE production volumes as a result of continued increases in water injection support and a higher average Dated Brent price per barrel, as shown in the table below. Oil production for the quarter was 826,532 barrels as compared to 336,234 barrels for the same period in 2016, an increase of 490,298 barrels.
Oil price data for the period ended 2017 with 2016 and 2015 comparatives are summarized in the table below. The average Dated Brent price reflects prices available in the market. The Realized Price (USD) includes the impact of oil commodity price hedges, and Realized Price (CAD) also includes the impact of foreign exchange.
Three months ended For the period ended March 31 2017 2016 2015 Average Dated Brent Price (USD/bbl) 51.64 34.42 52.85 Realized Price (USD/bbl) 50.88 39.64 67.81 Realized Price (CAD/bbl) 67.07 54.29 85.05 Oil Production (bbls) 826,532 336,234 114,258 Operating costs Operating costs for the period ended 2017 were $1 million compared to $3 million for the same period in 2016, a decrease of $2 million. This decrease was primarily due to an accounting policy decision in July 2016 to capitalize salaries and benefits of exploration department personnel as well as timing of professional service costs.
NALCOR ENERGY 2017 Q1 FINANCIAL REPORT 17
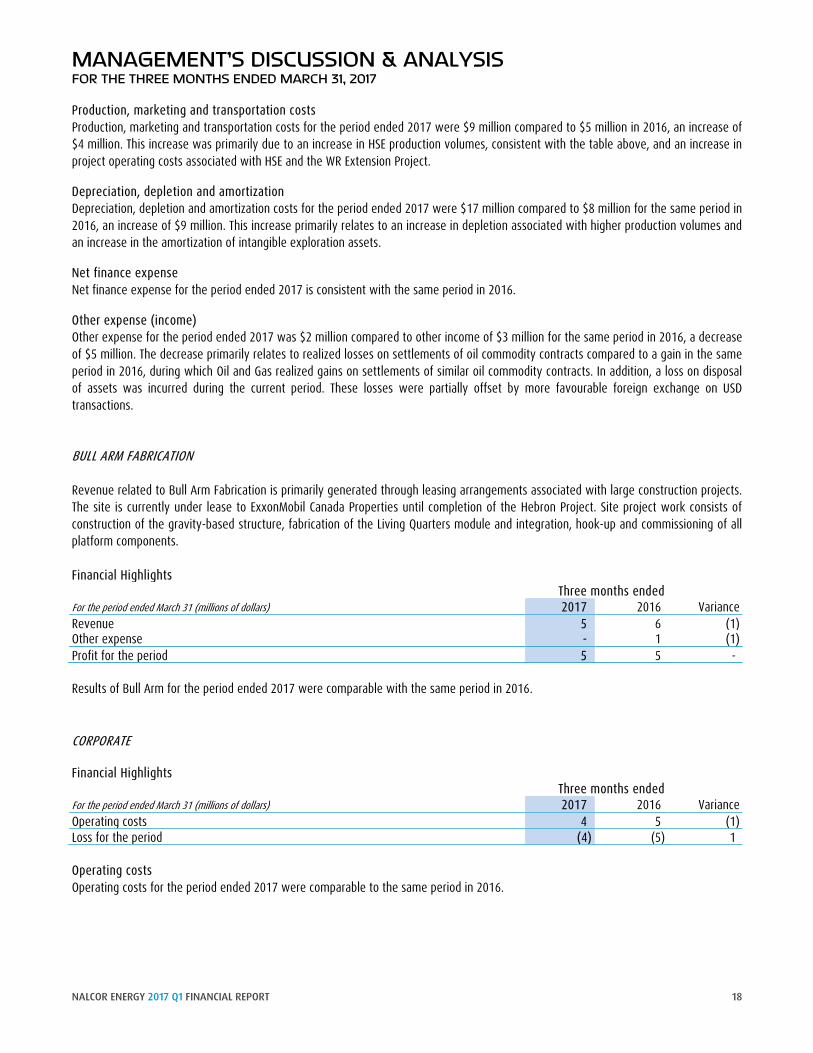
MANAGEMENT’S DISCUSSION & ANALYSIS FOR THE THREE MONTHS ENDED MARCH 31, 2017 Production, marketing and transportation costs Production, marketing and transportation costs for the period ended 2017 were $9 million compared to $5 million in 2016, an increase of $4 million. This increase was primarily due to an increase in HSE production volumes, consistent with the table above, and an increase in project operating costs associated with HSE and the WR Extension Project.
Depreciation, depletion and amortization Depreciation, depletion and amortization costs for the period ended 2017 were $17 million compared to $8 million for the same period in 2016, an increase of $9 million. This increase primarily relates to an increase in depletion associated with higher production volumes and an increase in the amortization of intangible exploration assets.
Net finance expense Net finance expense for the period ended 2017 is consistent with the same period in 2016.
Other expense (income) Other expense for the period ended 2017 was $2 million compared to other income of $3 million for the same period in 2016, a decrease of $5 million. The decrease primarily relates to realized losses on settlements of oil commodity contracts compared to a gain in the same period in 2016, during which Oil and Gas realized gains on settlements of similar oil commodity contracts. In addition, a loss on disposal of assets was incurred during the current period. These losses were partially offset by more favourable foreign exchange on USD transactions.
BULL ARM FABRICATION Revenue related to Bull Arm Fabrication is primarily generated through leasing arrangements associated with large construction projects. The site is currently under lease to ExxonMobil Canada Properties until completion of the Hebron Project. Site project work consists of construction of the gravity-based structure, fabrication of the Living Quarters module and integration, hook-up and commissioning of all platform components. Financial Highlights Three months ended For the period ended March 31 (millions of dollars) 2017 2016 Variance Revenue 5 6 (1) Other expense - 1 (1) Profit for the period 5 5 - Results of Bull Arm for the period ended 2017 were comparable with the same period in 2016. CORPORATE Financial Highlights Three months ended For the period ended March 31 (millions of dollars) 2017 2016 Variance Operating costs 4 5 (1) Loss for the period (4) (5) 1 Operating costs Operating costs for the period ended 2017 were comparable to the same period in 2016.
NALCOR ENERGY 2017 Q1 FINANCIAL REPORT 18
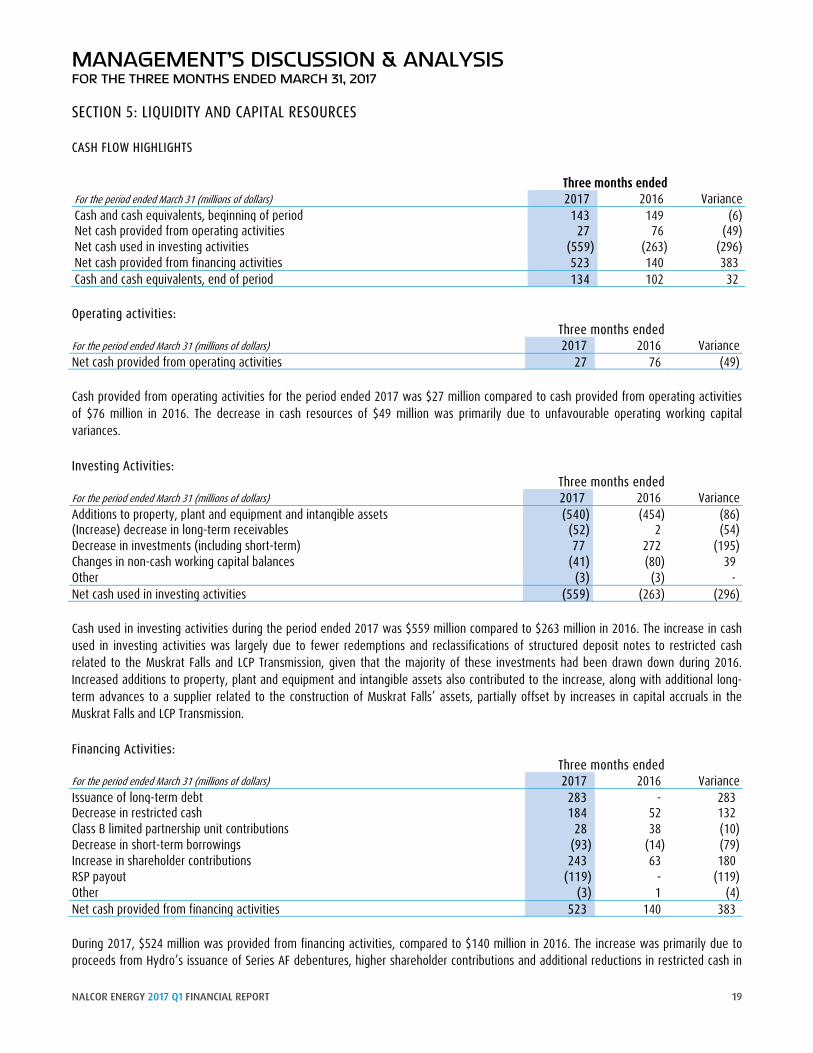
MANAGEMENT’S DISCUSSION & ANALYSIS FOR THE THREE MONTHS ENDED MARCH 31, 2017 SECTION 5: LIQUIDITY AND CAPITAL RESOURCES CASH FLOW HIGHLIGHTS Three months ended For the period ended March 31 (millions of dollars) 2017 2016 Variance Cash and cash equivalents, beginning of period 143 149 (6) Net cash provided from operating activities 27 76 (49) Net cash used in investing activities (559) (263) (296) Net cash provided from financing activities 523 140 383 Cash and cash equivalents, end of period 134 102 32 Operating activities: Three months ended For the period ended March 31 (millions of dollars) 2017 2016 Variance Net cash provided from operating activities 27 76 (49) Cash provided from operating activities for the period ended 2017 was $27 million compared to cash provided from operating activities of $76 million in 2016. The decrease in cash resources of $49 million was primarily due to unfavourable operating working capital variances. Investing Activities: Three months ended For the period ended March 31 (millions of dollars) 2017 2016 Variance Additions to property, plant and equipment and intangible assets (540) (454) (86) (Increase) decrease in long-term receivables (52) 2 (54) Decrease in investments (including short-term) 77 272 (195) Changes in non-cash working capital balances (41) (80) 39 Other (3) (3) - Net cash used in investing activities (559) (263) (296) Cash used in investing activities during the period ended 2017 was $559 million compared to $263 million in 2016. The increase in cash used in investing activities was largely due to fewer redemptions and reclassifications of structured deposit notes to restricted cash related to the Muskrat Falls and LCP Transmission, given that the majority of these investments had been drawn down during 2016. Increased additions to property, plant and equipment and intangible assets also contributed to the increase, along with additional long-term advances to a supplier related to the construction of Muskrat Falls’ assets, partially offset by increases in capital accruals in the Muskrat Falls and LCP Transmission. Financing Activities: Three months ended For the period ended March 31 (millions of dollars) 2017 2016 Variance Issuance of long-term debt 283 - 283 Decrease in restricted cash 184 52 132 Class B limited partnership unit contributions 28 38 (10) Decrease in short-term borrowings (93) (14) (79) Increase in shareholder contributions 243 63 180 RSP payout (119) - (119) Other (3) 1 (4) Net cash provided from financing activities 523 140 383 During 2017, $524 million was provided from financing activities, compared to $140 million in 2016. The increase was primarily due to proceeds from Hydro’s issuance of Series AF debentures, higher shareholder contributions and additional reductions in restricted cash in
NALCOR ENERGY 2017 Q1 FINANCIAL REPORT 19
MANAGEMENT’S DISCUSSION & ANALYSIS FOR THE THREE MONTHS ENDED MARCH 31, 2017 order to fund capital additions in Muskrat Falls, LIL LP, and Labrador Transco. These increases in funds provided were partially offset as a result of the RSP payout of $119 million refunded to rate payers during the quarter, decreases in short-term borrowings related to Hydro’s funding requirements and a reduction in Class B limited partnership unit contributions. CAPITAL RESOURCES Nalcor’s capital resources consist primarily of cash and cash equivalents, short-term investments, long-term investments and equity from the Province. These capital resources are used to fund the Company’s consolidated capital resource requirements, which continue to include working capital needs, capital expenditures, development costs and the servicing and repayment of consolidated debt. Capital resources are managed at the subsidiary level. Capital resource requirements for Hydro Regulated consist primarily of working capital needs, capital expenditures and debt servicing and repayment. Hydro funds capital resource requirements through a combination of cash from operations, sinking funds and long-term debt issuances as approved by the PUB. Capital expenditures in excess of cash from operations are funded with proceeds from short-term debt issued under Hydro’s $300.0 million promissory note program. Management will refinance promissory notes with proceeds from long-term debt as required. In addition, Hydro has utilized short-term funding from the Province, through Nalcor, to refinance existing long-term debt. Churchill Falls and Oil and Gas capital resource requirements consist primarily of working capital needs and capital expenditures, while Energy Trading and Bull Arm capital resource requirements are limited to working capital needs. The resources required are funded mainly through cash from operations. Churchill Falls also has a $75 million reserve fund which can be used if necessary, subject to the terms and conditions established in the Shareholder’s Agreement. As at March 31, 2017, the balance of the reserve fund was $23 million, of which Nalcor’s share was $15 million. Capital resource requirements for Muskrat Falls and LCP Transmission consist primarily of capital expenditures in connection with construction of the Lower Churchill Project. The primary source of financing for Muskrat Falls, Labrador Transco and LIL LP will continue to be the credit facilities, equity contributions from the Province and partnership unit contributions from Emera Newfoundland and Labrador-Island Link Inc. relating to its limited partnership interest in the LIL LP. While cash from operations depends on a number of factors, including commodity prices, regulated electricity prices, foreign exchange rates and oil production volumes, Management believes existing capital resources and demand operating facilities will be sufficient to fund all capital expenditures and working capital requirements in 2017.
NALCOR ENERGY 2017 Q1 FINANCIAL REPORT 20
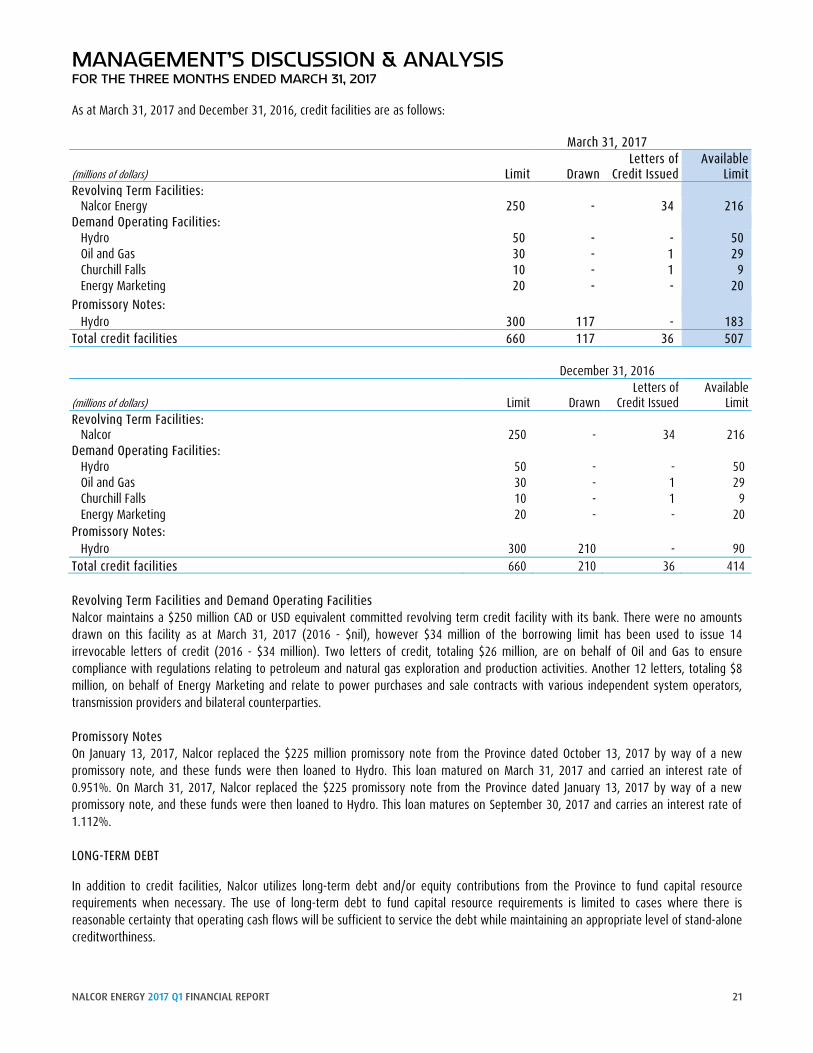
MANAGEMENT’S DISCUSSION & ANALYSIS FOR THE THREE MONTHS ENDED MARCH 31, 2017 As at March 31, 2017 and December 31, 2016, credit facilities are as follows: March 31, 2017 Letters of Available (millions of dollars) Limit Drawn Credit Issued Limit Revolving Term Facilities:
Nalcor Energy 250 - 34 216 Demand Operating Facilities:
Hydro 50 - - 50 Oil and Gas 30 - 1 29 Churchill Falls 10 - 1 9 Energy Marketing 20 - - 20
Promissory Notes: Hydro 300 117 - 183
Total credit facilities 660 117 36 507 December 31, 2016
Letters of Available (millions of dollars) Limit Drawn Credit Issued Limit Revolving Term Facilities:
Nalcor 250 - 34 216 Demand Operating Facilities:
Hydro 50 - - 50 Oil and Gas 30 - 1 29 Churchill Falls 10 - 1 9 Energy Marketing 20 - - 20
Promissory Notes: Hydro 300 210 - 90
Total credit facilities 660 210 36 414 Revolving Term Facilities and Demand Operating Facilities Nalcor maintains a $250 million CAD or USD equivalent committed revolving term credit facility with its bank. There were no amounts drawn on this facility as at March 31, 2017 (2016 - $nil), however $34 million of the borrowing limit has been used to issue 14 irrevocable letters of credit (2016 - $34 million). Two letters of credit, totaling $26 million, are on behalf of Oil and Gas to ensure compliance with regulations relating to petroleum and natural gas exploration and production activities. Another 12 letters, totaling $8 million, on behalf of Energy Marketing and relate to power purchases and sale contracts with various independent system operators, transmission providers and bilateral counterparties. Promissory Notes On January 13, 2017, Nalcor replaced the $225 million promissory note from the Province dated October 13, 2017 by way of a new promissory note, and these funds were then loaned to Hydro. This loan matured on March 31, 2017 and carried an interest rate of 0.951%. On March 31, 2017, Nalcor replaced the $225 promissory note from the Province dated January 13, 2017 by way of a new promissory note, and these funds were then loaned to Hydro. This loan matures on September 30, 2017 and carries an interest rate of 1.112%. LONG-TERM DEBT
In addition to credit facilities, Nalcor utilizes long-term debt and/or equity contributions from the Province to fund capital resource requirements when necessary. The use of long-term debt to fund capital resource requirements is limited to cases where there is reasonable certainty that operating cash flows will be sufficient to service the debt while maintaining an appropriate level of stand-alone creditworthiness.
NALCOR ENERGY 2017 Q1 FINANCIAL REPORT 21
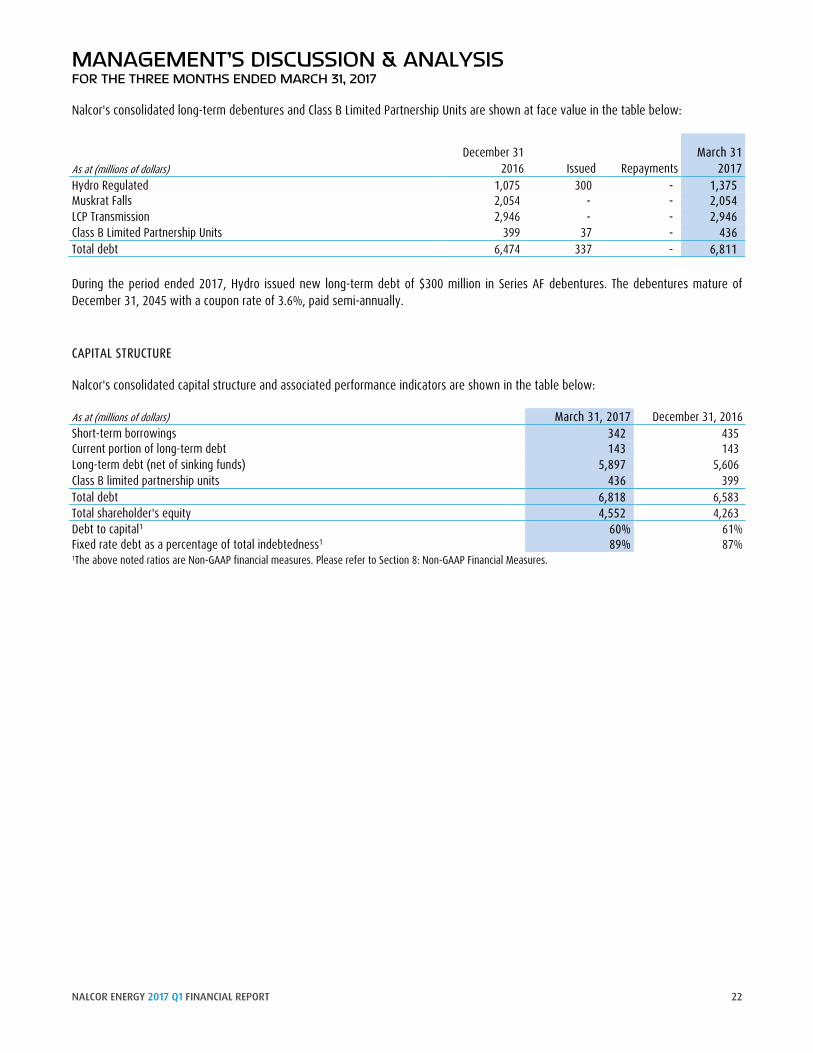
MANAGEMENT’S DISCUSSION & ANALYSIS FOR THE THREE MONTHS ENDED MARCH 31, 2017 Nalcor's consolidated long-term debentures and Class B Limited Partnership Units are shown at face value in the table below:
As at (millions of dollars) December 31
2016 Issued Repayments March 31
2017 Hydro Regulated 1,075 300 - 1,375 Muskrat Falls 2,054 - - 2,054 LCP Transmission 2,946 - - 2,946 Class B Limited Partnership Units 399 37 - 436 Total debt 6,474 337 - 6,811 During the period ended 2017, Hydro issued new long-term debt of $300 million in Series AF debentures. The debentures mature of December 31, 2045 with a coupon rate of 3.6%, paid semi-annually. CAPITAL STRUCTURE
Nalcor's consolidated capital structure and associated performance indicators are shown in the table below: As at (millions of dollars) March 31, 2017 December 31, 2016 Short-term borrowings 342 435 Current portion of long-term debt 143 143 Long-term debt (net of sinking funds) 5,897 5,606 Class B limited partnership units 436 399 Total debt 6,818 6,583 Total shareholder's equity 4,552 4,263 Debt to capital1 60% 61% Fixed rate debt as a percentage of total indebtedness1 89% 87% 1The above noted ratios are Non-GAAP financial measures. Please refer to Section 8: Non-GAAP Financial Measures.
NALCOR ENERGY 2017 Q1 FINANCIAL REPORT 22
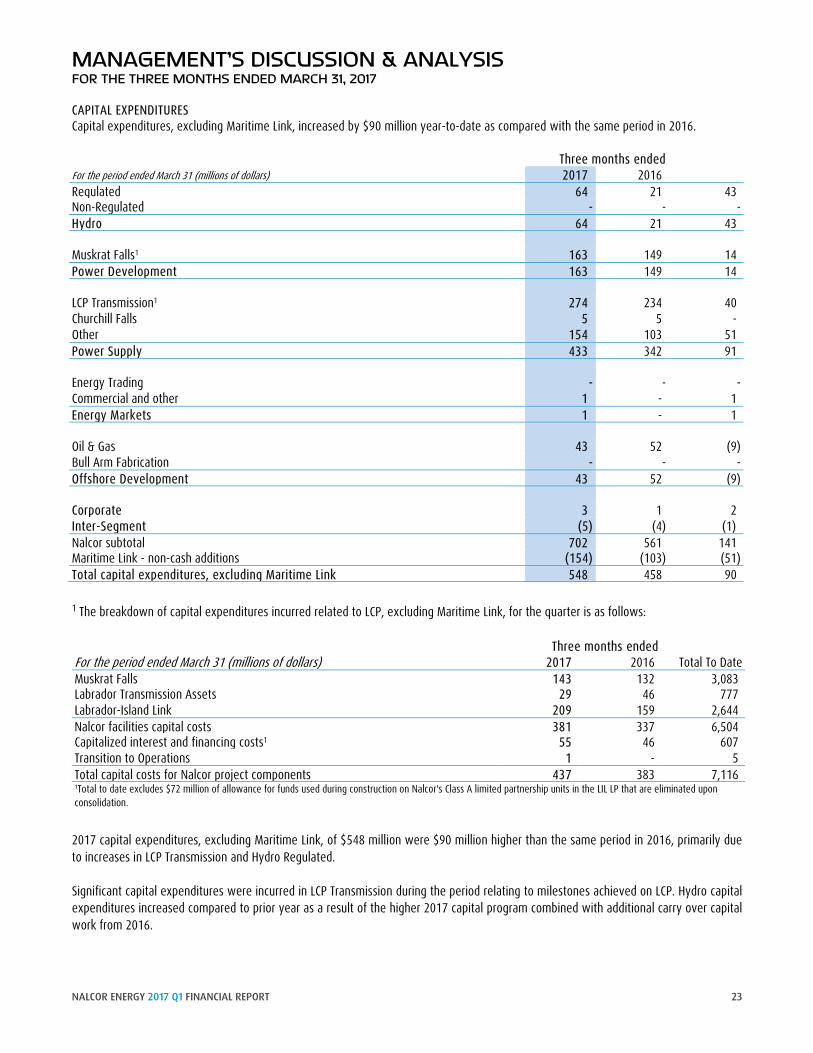
MANAGEMENT’S DISCUSSION & ANALYSIS FOR THE THREE MONTHS ENDED MARCH 31, 2017 CAPITAL EXPENDITURES Capital expenditures, excluding Maritime Link, increased by $90 million year-to-date as compared with the same period in 2016. Three months ended For the period ended March 31 (millions of dollars) 2017 2016
Regulated 64 21 43 Non-Regulated - - - Hydro 64 21 43 Muskrat Falls1 163 149 14 Power Development 163 149 14 LCP Transmission1 274 234 40 Churchill Falls 5 5 - Other 154 103 51 Power Supply 433 342 91 Energy Trading - - - Commercial and other 1 - 1 Energy Markets 1 - 1 Oil & Gas 43 52 (9) Bull Arm Fabrication - - - Offshore Development 43 52 (9) Corporate 3 1 2 Inter-Segment (5) (4) (1) Nalcor subtotal 702 561 141 Maritime Link - non-cash additions (154) (103) (51) Total capital expenditures, excluding Maritime Link 548 458 90
1 The breakdown of capital expenditures incurred related to LCP, excluding Maritime Link, for the quarter is as follows: Three months ended For the period ended March 31 (millions of dollars) 2017 2016 Total To Date Muskrat Falls 143 132 3,083 Labrador Transmission Assets 29 46 777 Labrador-Island Link 209 159 2,644 Nalcor facilities capital costs 381 337 6,504 Capitalized interest and financing costs1 55 46 607 Transition to Operations 1 - 5 Total capital costs for Nalcor project components 437 383 7,116 1Total to date excludes $72 million of allowance for funds used during construction on Nalcor's Class A limited partnership units in the LIL LP that are eliminated upon consolidation.
2017 capital expenditures, excluding Maritime Link, of $548 million were $90 million higher than the same period in 2016, primarily due to increases in LCP Transmission and Hydro Regulated. Significant capital expenditures were incurred in LCP Transmission during the period relating to milestones achieved on LCP. Hydro capital expenditures increased compared to prior year as a result of the higher 2017 capital program combined with additional carry over capital work from 2016.
NALCOR ENERGY 2017 Q1 FINANCIAL REPORT 23
MANAGEMENT’S DISCUSSION & ANALYSIS FOR THE THREE MONTHS ENDED MARCH 31, 2017 OBLIGATIONS AND COMMITMENTS Outstanding commitments for capital projects, excluding those related to Oil and Gas, total approximately $1.8 billion as at March 31, 2017 (2016 - $2.1 billion). Outstanding commitments related to pre-funded equity requirements associated with the Project Finance Agreements total approximately $0.8 billion as at March 31, 2017 (2016 - $3.3 billion). SECTION 6: RISK MANAGEMENT PROCESS Nalcor operates in various industry segments that have a variety of risk factors and uncertainties. The risks and uncertainties that could materially affect the business, financial condition and results of operations are described in Nalcor’s annual MD&A for the year ended December 31, 2016. There were no material changes in the Nalcor’s significant business risks during Q1 2017 from those disclosed in the MD&A for the year ended December 31, 2016. SECTION 7: ACCOUNTING POLICIES AND SIGNIFICANT ACCOUNTING JUDGMENTS, ESTIMATES AND ASSUMPTIONS ACCOUNTING POLICIES Nalcor’s significant accounting policies are described in Note 2 of the annual audited consolidated financial statements for the year ended December 31, 2016. SIGNIFICANT ACCOUNTING JUDGMENTS, ESTIMATES AND ASSUMPTIONS Significant accounting estimates are those that require Management to make assumptions about matters that are highly uncertain at the time the estimate is made. Significant accounting estimates are also those estimates which, where a different estimate could have been used or where changes in the estimate that are reasonably likely to occur, would have a material impact on the Company’s financial condition or financial performance. A description of Nalcor’s significant accounting judgments, estimates and assumptions are provided in Note 3 of the annual audited consolidated financial statements for the year ended December 31, 2016.
NALCOR ENERGY 2017 Q1 FINANCIAL REPORT 24
MANAGEMENT’S DISCUSSION & ANALYSIS FOR THE THREE MONTHS ENDED MARCH 31, 2017 SECTION 8: NON-GAAP FINANCIAL MEASURES
Certain financial measures in the MD&A are not prescribed by GAAP. These non-GAAP financial measures are included because they provide MD&A users with enhanced understanding and clarity of Nalcor’s financial performance, condition, leverage and liquidity. These non-GAAP financial measures do not have any standardized meaning and cannot necessarily be compared to similar measures presented by other companies. NON-GAAP FINANCIAL MEASURES Debt to capital Total debt (short-term borrowings, long-term debt including current portion less sinking
funds and Class B limited partnership units), divided by total debt plus shareholder’s equity
EBIT Profit (loss) excluding interest and taxes EBITDA Profit (loss) excluding interest, taxes, depreciation, depletion, amortization, impairment
and accretion Fixed rate debt as a percentage of total indebtedness Long-term debt divided by total debt Funds from operations (FFO) Profit (loss) excluding depreciation, depletion, amortization, impairment and accretion Return on capital employed (ROCE) Rolling twelve month average EBIT (excluding non-cash impairment expenses)/Capital
Employed (excluding assets that are under development) SECTION 9: RELATED PARTY TRANSACTIONS Nalcor enters into various transactions with its shareholder and other affiliates including various Crown Corporations, agencies, boards and commissions by virtue of common control by the Province of Newfoundland. These transactions occur within the normal course of operations and are measured at the exchange amount, which is the consideration agreed to by the related parties.
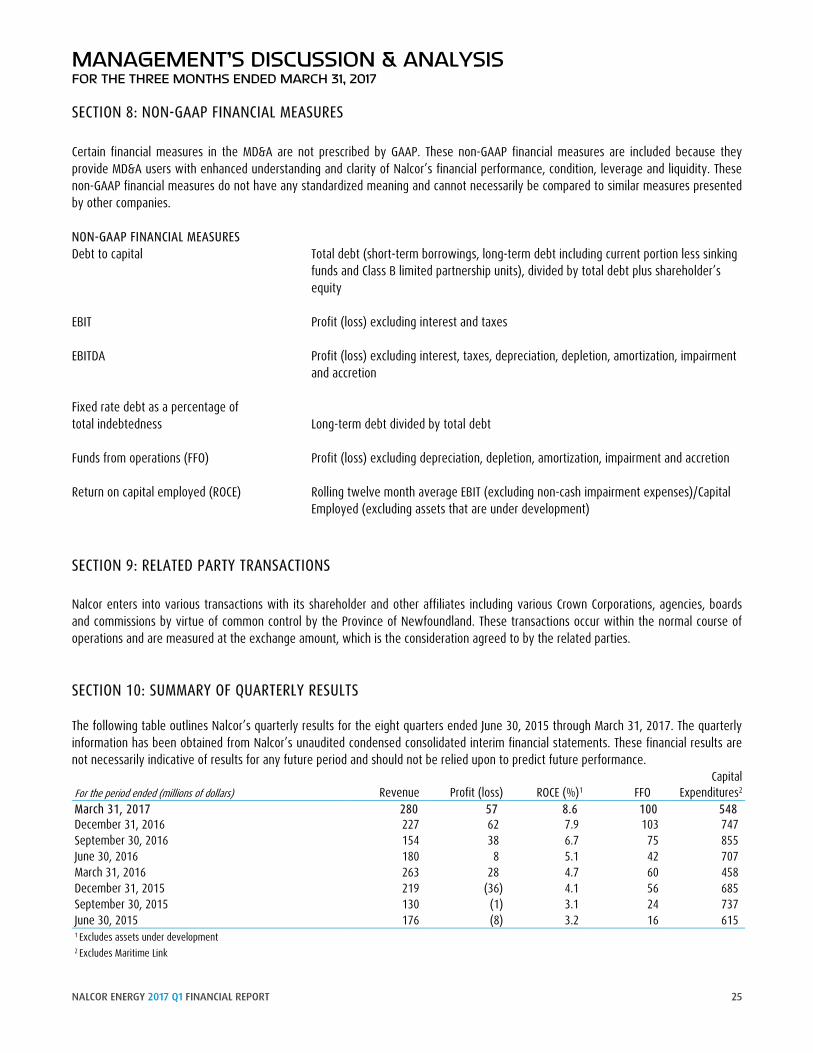
SECTION 10: SUMMARY OF QUARTERLY RESULTS The following table outlines Nalcor’s quarterly results for the eight quarters ended June 30, 2015 through March 31, 2017. The quarterly information has been obtained from Nalcor’s unaudited condensed consolidated interim financial statements. These financial results are not necessarily indicative of results for any future period and should not be relied upon to predict future performance. Capital For the period ended (millions of dollars) Revenue Profit (loss) ROCE (%)1 FFO Expenditures2 March 31, 2017 280 57 8.6 100 548 December 31, 2016 227 62 7.9 103 747 September 30, 2016 154 38 6.7 75 855 June 30, 2016 180 8 5.1 42 707 March 31, 2016 263 28 4.7 60 458 December 31, 2015 219 (36) 4.1 56 685 September 30, 2015 130 (1) 3.1 24 737 June 30, 2015 176 (8) 3.2 16 615 1 Excludes assets under development 2 Excludes Maritime Link
NALCOR ENERGY 2017 Q1 FINANCIAL REPORT 25
MANAGEMENT’S DISCUSSION & ANALYSIS FOR THE THREE MONTHS ENDED MARCH 31, 2017 The financial performance of several of Nalcor’s business segments are impacted by seasonality. Specifically, electricity sales in Hydro Regulated and Churchill Falls are typically highest during the first and last quarters and lowest during the summer months. In contrast, Energy Marketing has the highest level of energy available to sell in export markets during the summer months and the least available to sell in winter months. Electricity prices in the export markets tend to peak in winter and summer periods, but can vary by year depending on temperatures, the specific market and other factors. Interim results can also fluctuate due to the timing and recognition of regulatory decisions and the impact of commodity price changes. March 2017/March 2016 2017 first quarter profit increased by $29 million compared to the same period in 2016, largely due to higher oil revenue resulting from increased production and higher realized oil prices compared to the same period in 2016. In addition, Energy Trading experienced higher prices and volumes related to export sales, while Hydro contributed to the increase in profit as a result of a reduction in gas turbine fuel expense as well as the recognition of the Prudence Order in Q1 2016. These increases were partially offset by higher depletion and production costs associated with increased production in Oil and Gas, higher depreciation and amortization in Hydro Regulated and Oil and Gas, increases in other fuel costs in Hydro Regulated, lower unrealized gains on commodity contracts in energy Trading, lower realized gains on commodity contracts in Oil and Gas and reduced revenue in Churchill Falls as a result of the impact of the Renewal Contract. December 2016/December 2015 2016 fourth quarter profit increased by $98 million over the same period in 2015 due to lower operating costs across all lines of business, primarily due to decreased professional service costs, materials and maintenance costs and salaries and benefits; an impairment expense of $62 million related to Oil and Gas in the prior year; increased revenue, largely due to increased oil sales as a result of higher production at HSE; higher energy sales in Energy Marketing due to higher volumes of export sales, partially offset by lower realized export market prices; and, favourable changes in Hydro’s regulatory deferrals. These increases in profit were partially offset by increased oil production costs and higher depletion associated with increased production at HSE; lower gains on the settlement of oil commodity contracts; and, lower energy sales in Churchill Falls as a result of the impact of continuous energy under the Renewal Contract. September 2016/September 2015 2016 third quarter profit increased $39 million over the same period in 2015. The largest contributors to the increase were higher oil production, lower operating costs, reduced fuel costs and favourable foreign exchange. Increased levels of depreciation, amortization and depletion and higher production costs offset the increase in profit. June 2016/June 2015 2016 second quarter profit increased $16 million compared to the same period in 2015. This increase was primarily due to interim rates in Hydro Regulated, higher oil production and lower operating costs. These increases were partially offset by lower commodity prices, higher depreciation, depletion and amortization expense, and a reduction in other income. SECTION 11: SUBSEQUENT EVENTS In August 2016, Churchill Falls received judgment from the Québec Court of Appeal upholding the 2014 Québec Superior Court ruling on the motion filed by Churchill Falls to address the inequities of the pricing terms of the 1969 Power Contract between Churchill Falls and Hydro-Québec. The Court ruled against Churchill Falls. On April 20, 2017 Churchill Falls was granted leave to appeal the case to the Supreme Court of Canada. A hearing date is anticipated to be scheduled within 12 months.
On April 25, 2017, the expiry date of Nalcor's $250.0 million committed revolving term facility was extended to January 31, 2019. In December 2016, Hydro received Board Order No. P.U. 49 (2016) (the GRA Order) in relation to its General Rate Application. In January 2017, Hydro filed an application with the PUB seeking approval of final customer rates in compliance with the GRA Order. On May 1, 2017 Hydro received Board Order No. P.U. 14 (2017). While this Order provided additional clarity surrounding certain components of the
NALCOR ENERGY 2017 Q1 FINANCIAL REPORT 26
MANAGEMENT’S DISCUSSION & ANALYSIS FOR THE THREE MONTHS ENDED MARCH 31, 2017 Order requested by Hydro, additional regulatory process is required prior to the determination of final customer rates and any financial statement impact. SECTION 12: OUTLOOK On December 1, 2016, Hydro received its GRA order and it is anticipated that final customer rates will be in effect July 1, 2017, however regulatory risk remains around the timing and approval of Hydro’s GRA Compliance application. Churchill Falls 2017 forecasted profit is lower than 2016 mainly due to decreased revenue resulting from a 20% decrease in the power rate effective September 1, 2016 as per the 2016 Renewal Contract. Oil and Gas is forecasting higher profit over 2016, primarily due to an increase in revenue from higher forecasted oil prices and increased production. This is partially offset by higher production costs and depletion expense, and a decrease in the performance of commodity price contracts. Oil price continues to be volatile and any significant change in forecasted price for 2017 unhedged production will impact profit. To mitigate exposure on realized oil prices, Oil and Gas has entered into commodity price swaps providing an average fixed price of $52.09 USD per barrel on 25% of budgeted 2017 production. Given that oil sales are denominated in USD, Oil and Gas has also entered into foreign exchange forward contracts with an average rate of $1.33 CAD per USD and a notional value of $32.3 million USD representing 23% of budgeted USD oil revenue. Energy Trading’s 2017 forecasted profit not expected to vary significantly from 2016. To mitigate foreign exchange fluctuations on USD sales, Energy Marketing has entered into additional foreign exchange contracts with a notional value of $20 million USD on 57% of 2017 budgeted USD sales at an average rate of $1.32 CAD per USD. Currently, there are no commodity contracts in place for 2017. Total forecasted capital expenditures for 2017 (excluding those related to the Maritime Link) are forecasted to be $2.9 billion.
NALCOR ENERGY 2017 Q1 FINANCIAL REPORT 27
Appendix 1 Consolidated Financial Statements
March 31, 2017
NALCOR ENERGY CONDENSED CONSOLIDATED INTERIM FINANCIAL STATEMENTS
March 31, 2017 (Unaudited)
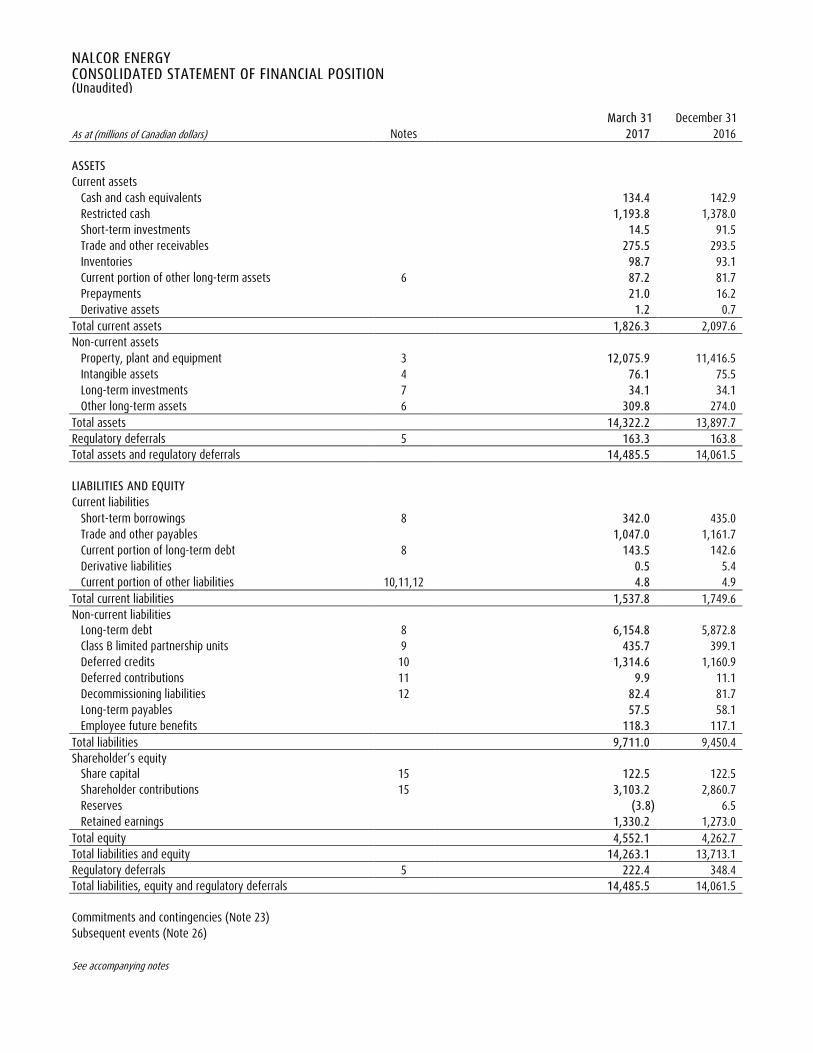
NALCOR ENERGY CONSOLIDATED STATEMENT OF FINANCIAL POSITION (Unaudited) March 31 December 31 As at (millions of Canadian dollars) Notes 2017 2016
ASSETS Current assets
Cash and cash equivalents 134.4 142.9 Restricted cash 1,193.8 1,378.0 Short-term investments 14.5 91.5 Trade and other receivables 275.5 293.5 Inventories 98.7 93.1 Current portion of other long-term assets 6 87.2 81.7 Prepayments 21.0 16.2 Derivative assets 1.2 0.7
Total current assets 1,826.3 2,097.6 Non-current assets
Property, plant and equipment 3 12,075.9 11,416.5 Intangible assets 4 76.1 75.5 Long-term investments 7 34.1 34.1 Other long-term assets 6 309.8 274.0
Total assets 14,322.2 13,897.7 Regulatory deferrals 5 163.3 163.8 Total assets and regulatory deferrals 14,485.5 14,061.5
LIABILITIES AND EQUITY Current liabilities
Short-term borrowings 8 342.0 435.0 Trade and other payables 1,047.0 1,161.7 Current portion of long-term debt 8 143.5 142.6 Derivative liabilities 0.5 5.4 Current portion of other liabilities 10,11,12 4.8 4.9
Total current liabilities 1,537.8 1,749.6 Non-current liabilities
Long-term debt 8 6,154.8 5,872.8 Class B limited partnership units 9 435.7 399.1 Deferred credits 10 1,314.6 1,160.9 Deferred contributions 11 9.9 11.1 Decommissioning liabilities 12 82.4 81.7 Long-term payables 57.5 58.1 Employee future benefits 118.3 117.1
Total liabilities 9,711.0 9,450.4 Shareholder’s equity
Share capital 15 122.5 122.5 Shareholder contributions 15 3,103.2 2,860.7 Reserves (3.8) 6.5 Retained earnings 1,330.2 1,273.0
Total equity 4,552.1 4,262.7 Total liabilities and equity 14,263.1 13,713.1 Regulatory deferrals 5 222.4 348.4 Total liabilities, equity and regulatory deferrals 14,485.5 14,061.5 Commitments and contingencies (Note 23) Subsequent events (Note 26) See accompanying notes
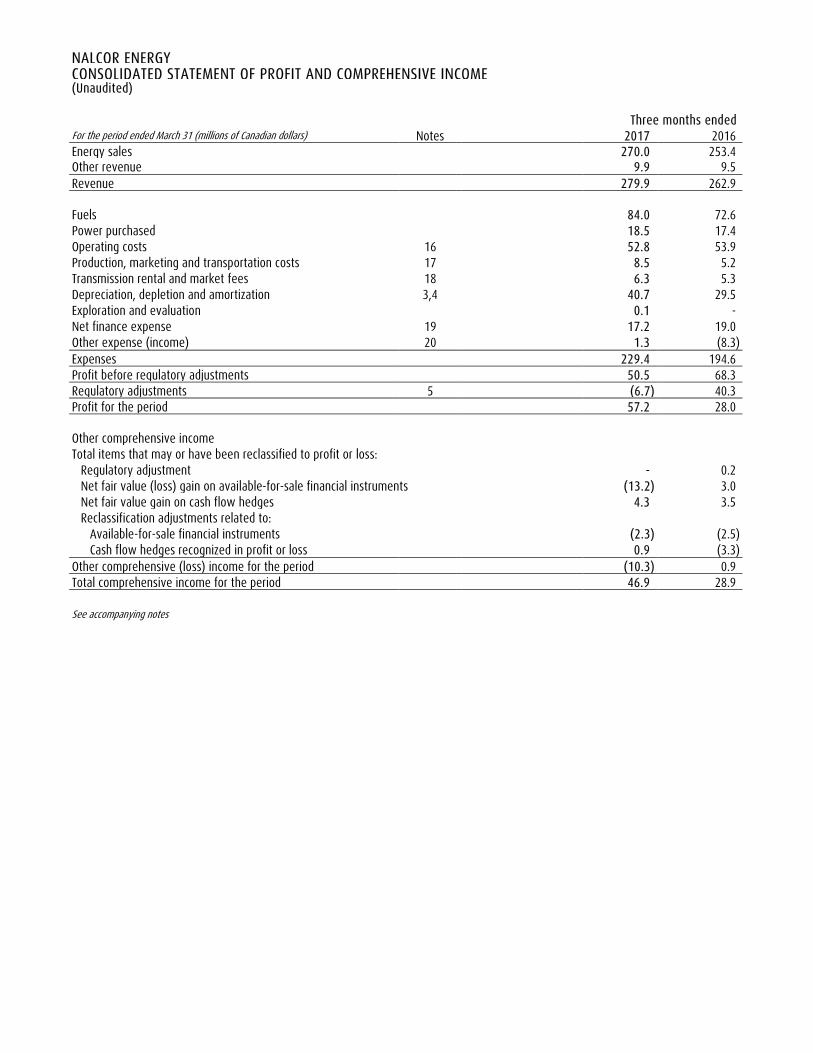
NALCOR ENERGY CONSOLIDATED STATEMENT OF PROFIT AND COMPREHENSIVE INCOME (Unaudited) Three months ended For the period ended March 31 (millions of Canadian dollars) Notes 2017 2016 Energy sales 270.0 253.4 Other revenue 9.9 9.5 Revenue 279.9 262.9 Fuels 84.0 72.6 Power purchased 18.5 17.4 Operating costs 16 52.8 53.9 Production, marketing and transportation costs 17 8.5 5.2 Transmission rental and market fees 18 6.3 5.3 Depreciation, depletion and amortization 3,4 40.7 29.5 Exploration and evaluation 0.1 - Net finance expense 19 17.2 19.0 Other expense (income) 20 1.3 (8.3) Expenses 229.4 194.6 Profit before regulatory adjustments 50.5 68.3 Regulatory adjustments 5 (6.7) 40.3 Profit for the period 57.2 28.0 Other comprehensive income Total items that may or have been reclassified to profit or loss:
Regulatory adjustment - 0.2 Net fair value (loss) gain on available-for-sale financial instruments (13.2) 3.0 Net fair value gain on cash flow hedges 4.3 3.5 Reclassification adjustments related to:
Available-for-sale financial instruments (2.3) (2.5) Cash flow hedges recognized in profit or loss 0.9 (3.3)
Other comprehensive (loss) income for the period (10.3) 0.9 Total comprehensive income for the period 46.9 28.9 See accompanying notes
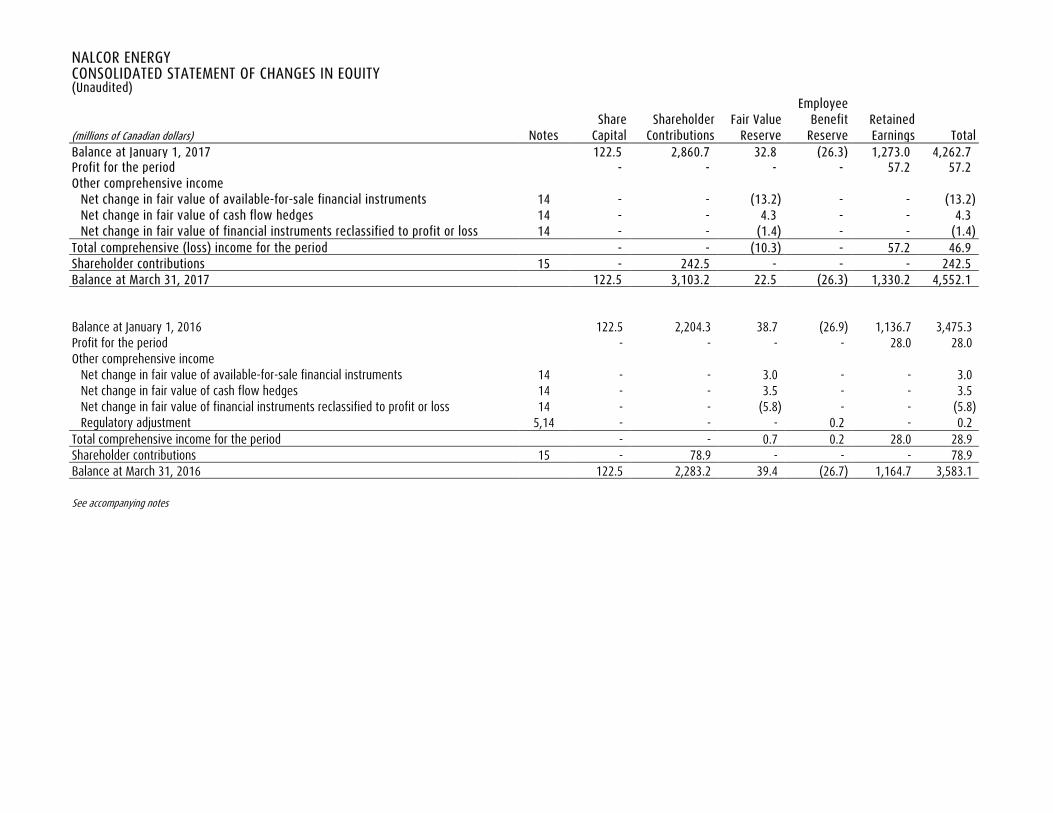
NALCOR ENERGY CONSOLIDATED STATEMENT OF CHANGES IN EQUITY (Unaudited) Employee Share Shareholder Fair Value Benefit Retained (millions of Canadian dollars) Notes Capital Contributions Reserve Reserve Earnings Total Balance at January 1, 2017 122.5 2,860.7 32.8 (26.3) 1,273.0 4,262.7 Profit for the period - - - - 57.2 57.2 Other comprehensive income
Net change in fair value of available-for-sale financial instruments 14 - - (13.2) - - (13.2) Net change in fair value of cash flow hedges 14 - - 4.3 - - 4.3 Net change in fair value of financial instruments reclassified to profit or loss 14 - - (1.4) - - (1.4)
Total comprehensive (loss) income for the period - - (10.3) - 57.2 46.9 Shareholder contributions 15 - 242.5 - - - 242.5 Balance at March 31, 2017 122.5 3,103.2 22.5 (26.3) 1,330.2 4,552.1 Balance at January 1, 2016 122.5 2,204.3 38.7 (26.9) 1,136.7 3,475.3 Profit for the period - - - - 28.0 28.0 Other comprehensive income
Net change in fair value of available-for-sale financial instruments 14 - - 3.0 - - 3.0 Net change in fair value of cash flow hedges 14 - - 3.5 - - 3.5 Net change in fair value of financial instruments reclassified to profit or loss 14 - - (5.8) - - (5.8) Regulatory adjustment 5,14 - - - 0.2 - 0.2
Total comprehensive income for the period - - 0.7 0.2 28.0 28.9 Shareholder contributions 15 - 78.9 - - - 78.9 Balance at March 31, 2016 122.5 2,283.2 39.4 (26.7) 1,164.7 3,583.1 See accompanying notes
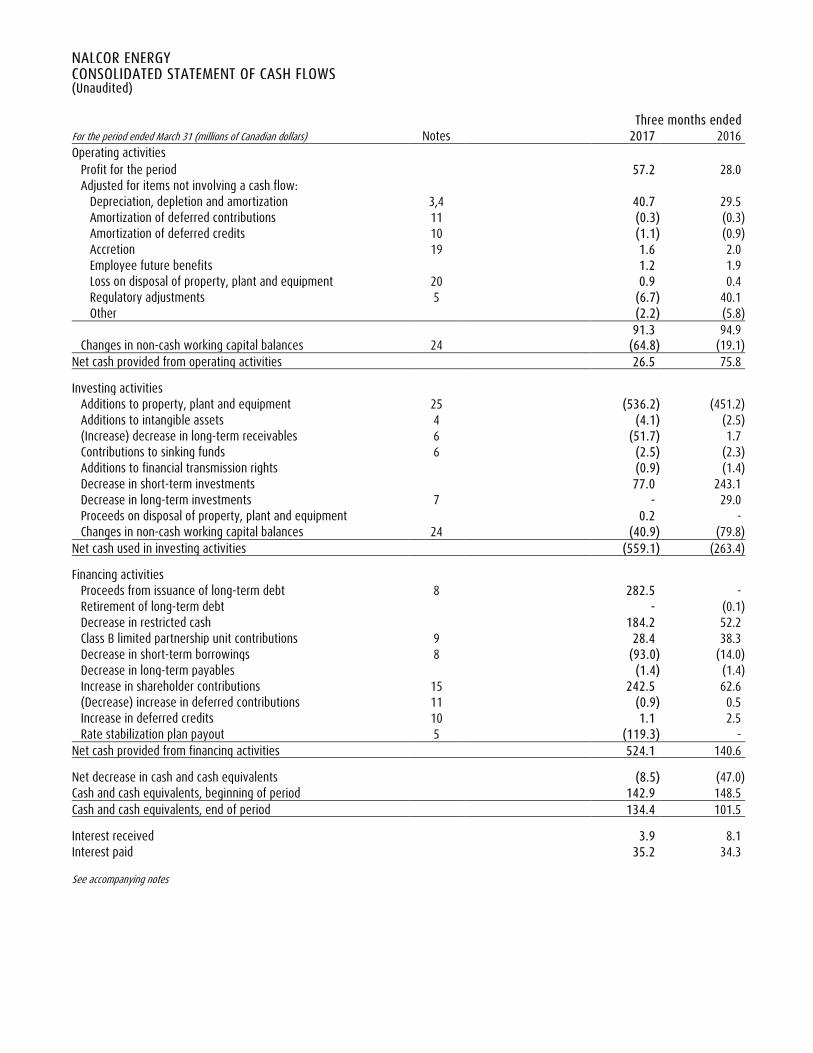
NALCOR ENERGY CONSOLIDATED STATEMENT OF CASH FLOWS (Unaudited) Three months ended For the period ended March 31 (millions of Canadian dollars) Notes 2017 2016 Operating activities
Profit for the period 57.2 28.0 Adjusted for items not involving a cash flow:
Depreciation, depletion and amortization 3,4 40.7 29.5 Amortization of deferred contributions 11 (0.3) (0.3) Amortization of deferred credits 10 (1.1) (0.9) Accretion 19 1.6 2.0 Employee future benefits 1.2 1.9 Loss on disposal of property, plant and equipment 20 0.9 0.4 Regulatory adjustments 5 (6.7) 40.1 Other (2.2) (5.8) 91.3 94.9
Changes in non-cash working capital balances 24 (64.8) (19.1) Net cash provided from operating activities 26.5 75.8 Investing activities
Additions to property, plant and equipment 25 (536.2) (451.2) Additions to intangible assets 4 (4.1) (2.5) (Increase) decrease in long-term receivables 6 (51.7) 1.7 Contributions to sinking funds 6 (2.5) (2.3) Additions to financial transmission rights (0.9) (1.4) Decrease in short-term investments 77.0 243.1 Decrease in long-term investments 7 - 29.0 Proceeds on disposal of property, plant and equipment 0.2 - Changes in non-cash working capital balances 24 (40.9) (79.8)
Net cash used in investing activities (559.1) (263.4) Financing activities
Proceeds from issuance of long-term debt 8 282.5 - Retirement of long-term debt - (0.1) Decrease in restricted cash 184.2 52.2 Class B limited partnership unit contributions 9 28.4 38.3 Decrease in short-term borrowings 8 (93.0) (14.0) Decrease in long-term payables (1.4) (1.4) Increase in shareholder contributions 15 242.5 62.6 (Decrease) increase in deferred contributions 11 (0.9) 0.5 Increase in deferred credits 10 1.1 2.5 Rate stabilization plan payout 5 (119.3) -
Net cash provided from financing activities 524.1 140.6 Net decrease in cash and cash equivalents (8.5) (47.0) Cash and cash equivalents, beginning of period 142.9 148.5 Cash and cash equivalents, end of period 134.4 101.5 Interest received 3.9 8.1 Interest paid 35.2 34.3 See accompanying notes
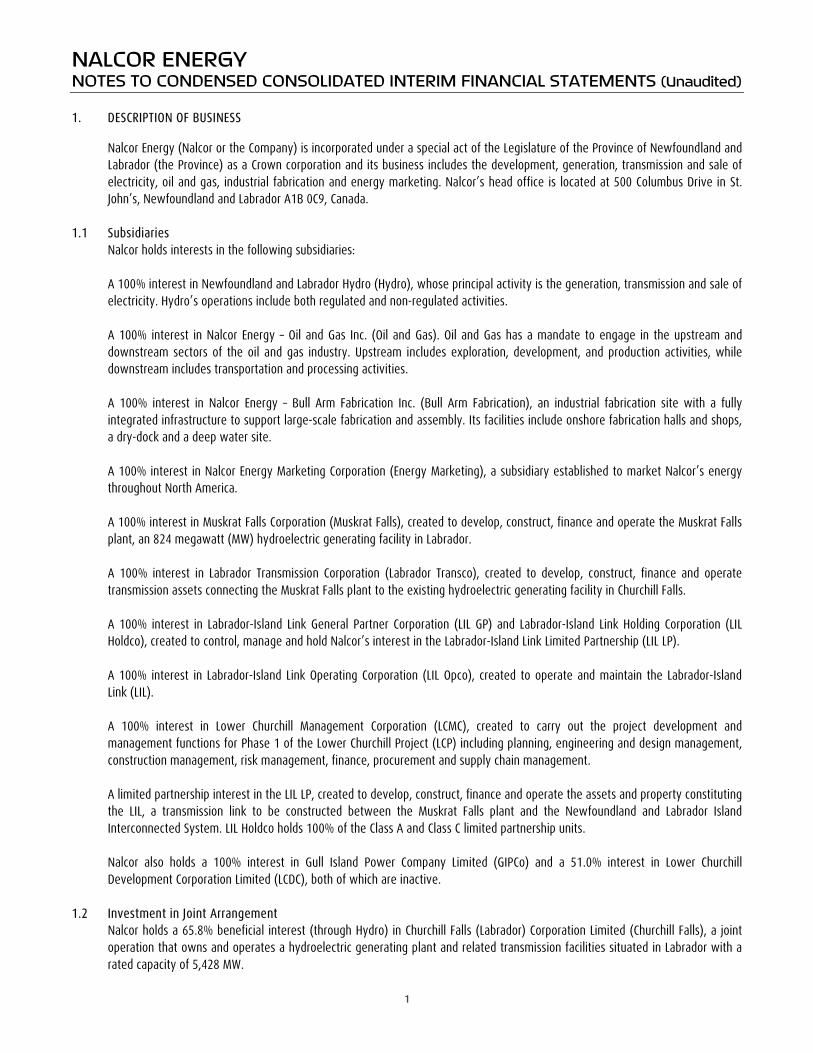
NALCOR ENERGY NOTES TO CONDENSED CONSOLIDATED INTERIM FINANCIAL STATEMENTS (Unaudited) 1. DESCRIPTION OF BUSINESS
Nalcor Energy (Nalcor or the Company) is incorporated under a special act of the Legislature of the Province of Newfoundland and Labrador (the Province) as a Crown corporation and its business includes the development, generation, transmission and sale of electricity, oil and gas, industrial fabrication and energy marketing. Nalcor’s head office is located at 500 Columbus Drive in St. John’s, Newfoundland and Labrador A1B 0C9, Canada.
1.1 Subsidiaries
Nalcor holds interests in the following subsidiaries: A 100% interest in Newfoundland and Labrador Hydro (Hydro), whose principal activity is the generation, transmission and sale of electricity. Hydro’s operations include both regulated and non-regulated activities. A 100% interest in Nalcor Energy – Oil and Gas Inc. (Oil and Gas). Oil and Gas has a mandate to engage in the upstream and downstream sectors of the oil and gas industry. Upstream includes exploration, development, and production activities, while downstream includes transportation and processing activities. A 100% interest in Nalcor Energy – Bull Arm Fabrication Inc. (Bull Arm Fabrication), an industrial fabrication site with a fully integrated infrastructure to support large-scale fabrication and assembly. Its facilities include onshore fabrication halls and shops, a dry-dock and a deep water site. A 100% interest in Nalcor Energy Marketing Corporation (Energy Marketing), a subsidiary established to market Nalcor’s energy throughout North America. A 100% interest in Muskrat Falls Corporation (Muskrat Falls), created to develop, construct, finance and operate the Muskrat Falls plant, an 824 megawatt (MW) hydroelectric generating facility in Labrador. A 100% interest in Labrador Transmission Corporation (Labrador Transco), created to develop, construct, finance and operate transmission assets connecting the Muskrat Falls plant to the existing hydroelectric generating facility in Churchill Falls.
A 100% interest in Labrador-Island Link General Partner Corporation (LIL GP) and Labrador-Island Link Holding Corporation (LIL Holdco), created to control, manage and hold Nalcor’s interest in the Labrador-Island Link Limited Partnership (LIL LP). A 100% interest in Labrador-Island Link Operating Corporation (LIL Opco), created to operate and maintain the Labrador-Island Link (LIL). A 100% interest in Lower Churchill Management Corporation (LCMC), created to carry out the project development and management functions for Phase 1 of the Lower Churchill Project (LCP) including planning, engineering and design management, construction management, risk management, finance, procurement and supply chain management.
A limited partnership interest in the LIL LP, created to develop, construct, finance and operate the assets and property constituting the LIL, a transmission link to be constructed between the Muskrat Falls plant and the Newfoundland and Labrador Island Interconnected System. LIL Holdco holds 100% of the Class A and Class C limited partnership units. Nalcor also holds a 100% interest in Gull Island Power Company Limited (GIPCo) and a 51.0% interest in Lower Churchill Development Corporation Limited (LCDC), both of which are inactive.
1.2 Investment in Joint Arrangement
Nalcor holds a 65.8% beneficial interest (through Hydro) in Churchill Falls (Labrador) Corporation Limited (Churchill Falls), a joint operation that owns and operates a hydroelectric generating plant and related transmission facilities situated in Labrador with a rated capacity of 5,428 MW.
1
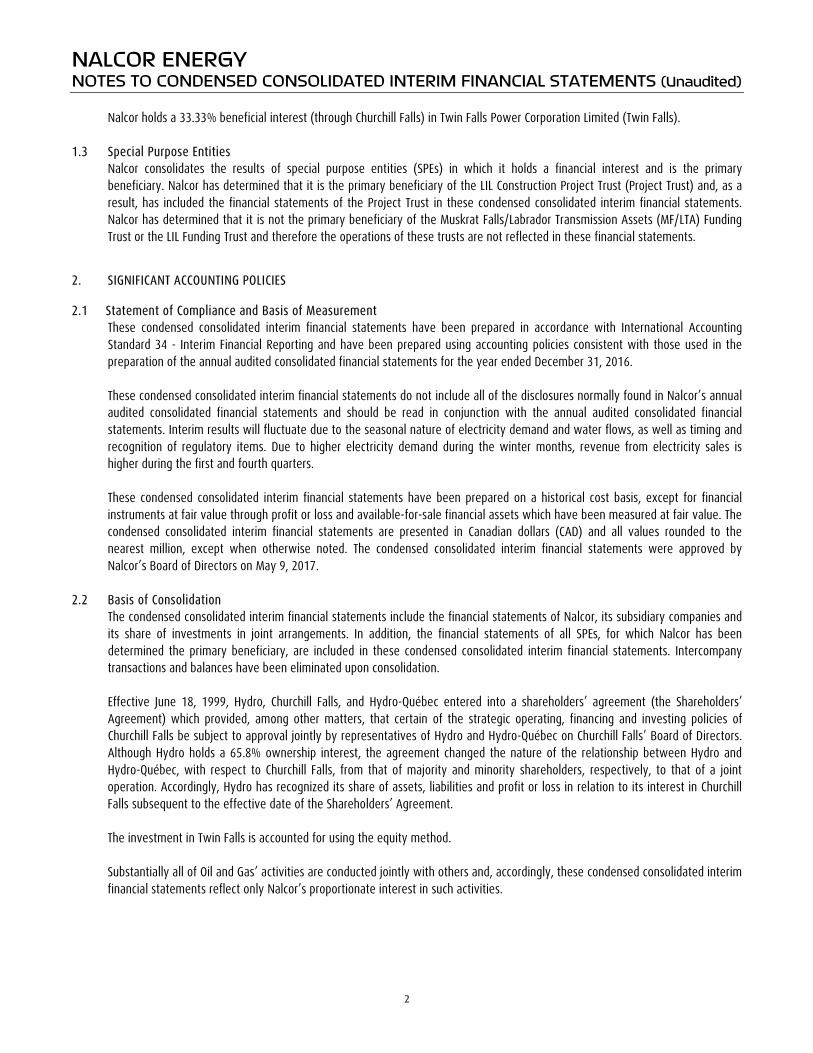
NALCOR ENERGY NOTES TO CONDENSED CONSOLIDATED INTERIM FINANCIAL STATEMENTS (Unaudited) Nalcor holds a 33.33% beneficial interest (through Churchill Falls) in Twin Falls Power Corporation Limited (Twin Falls).
1.3 Special Purpose Entities
Nalcor consolidates the results of special purpose entities (SPEs) in which it holds a financial interest and is the primary beneficiary. Nalcor has determined that it is the primary beneficiary of the LIL Construction Project Trust (Project Trust) and, as a result, has included the financial statements of the Project Trust in these condensed consolidated interim financial statements. Nalcor has determined that it is not the primary beneficiary of the Muskrat Falls/Labrador Transmission Assets (MF/LTA) Funding Trust or the LIL Funding Trust and therefore the operations of these trusts are not reflected in these financial statements.
2. SIGNIFICANT ACCOUNTING POLICIES 2.1 Statement of Compliance and Basis of Measurement
These condensed consolidated interim financial statements have been prepared in accordance with International Accounting Standard 34 - Interim Financial Reporting and have been prepared using accounting policies consistent with those used in the preparation of the annual audited consolidated financial statements for the year ended December 31, 2016. These condensed consolidated interim financial statements do not include all of the disclosures normally found in Nalcor’s annual audited consolidated financial statements and should be read in conjunction with the annual audited consolidated financial statements. Interim results will fluctuate due to the seasonal nature of electricity demand and water flows, as well as timing and recognition of regulatory items. Due to higher electricity demand during the winter months, revenue from electricity sales is higher during the first and fourth quarters. These condensed consolidated interim financial statements have been prepared on a historical cost basis, except for financial instruments at fair value through profit or loss and available-for-sale financial assets which have been measured at fair value. The condensed consolidated interim financial statements are presented in Canadian dollars (CAD) and all values rounded to the nearest million, except when otherwise noted. The condensed consolidated interim financial statements were approved by Nalcor’s Board of Directors on May 9, 2017.
2.2 Basis of Consolidation The condensed consolidated interim financial statements include the financial statements of Nalcor, its subsidiary companies and
its share of investments in joint arrangements. In addition, the financial statements of all SPEs, for which Nalcor has been determined the primary beneficiary, are included in these condensed consolidated interim financial statements. Intercompany transactions and balances have been eliminated upon consolidation.
Effective June 18, 1999, Hydro, Churchill Falls, and Hydro-Québec entered into a shareholders’ agreement (the Shareholders’ Agreement) which provided, among other matters, that certain of the strategic operating, financing and investing policies of Churchill Falls be subject to approval jointly by representatives of Hydro and Hydro-Québec on Churchill Falls’ Board of Directors. Although Hydro holds a 65.8% ownership interest, the agreement changed the nature of the relationship between Hydro and Hydro-Québec, with respect to Churchill Falls, from that of majority and minority shareholders, respectively, to that of a joint operation. Accordingly, Hydro has recognized its share of assets, liabilities and profit or loss in relation to its interest in Churchill Falls subsequent to the effective date of the Shareholders’ Agreement.
The investment in Twin Falls is accounted for using the equity method.
Substantially all of Oil and Gas’ activities are conducted jointly with others and, accordingly, these condensed consolidated interim financial statements reflect only Nalcor’s proportionate interest in such activities.
2
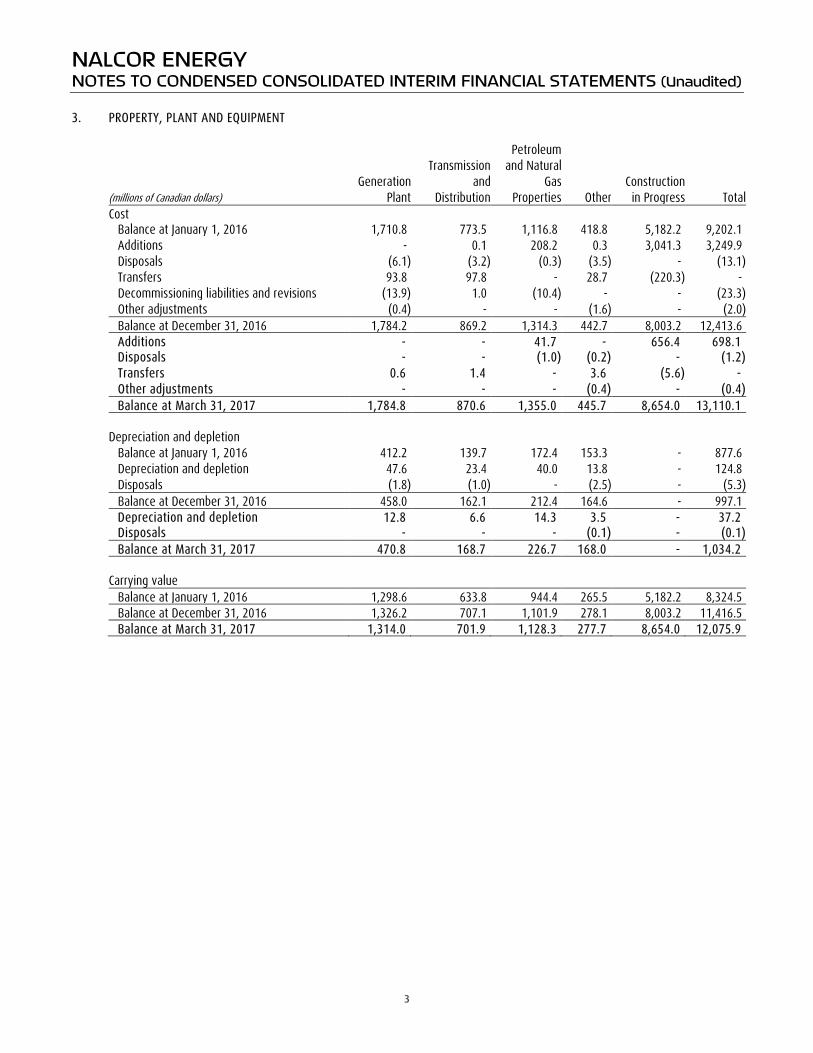
NALCOR ENERGY NOTES TO CONDENSED CONSOLIDATED INTERIM FINANCIAL STATEMENTS (Unaudited) 3. PROPERTY, PLANT AND EQUIPMENT Petroleum Transmission and Natural Generation and Gas Construction (millions of Canadian dollars) Plant Distribution Properties Other in Progress Total Cost Balance at January 1, 2016 1,710.8 773.5 1,116.8 418.8 5,182.2 9,202.1 Additions - 0.1 208.2 0.3 3,041.3 3,249.9 Disposals (6.1) (3.2) (0.3) (3.5) - (13.1) Transfers 93.8 97.8 - 28.7 (220.3) - Decommissioning liabilities and revisions (13.9) 1.0 (10.4) - - (23.3) Other adjustments (0.4) - - (1.6) - (2.0) Balance at December 31, 2016 1,784.2 869.2 1,314.3 442.7 8,003.2 12,413.6 Additions - - 41.7 - 656.4 698.1 Disposals - - (1.0) (0.2) - (1.2) Transfers 0.6 1.4 - 3.6 (5.6) - Other adjustments - - - (0.4) - (0.4) Balance at March 31, 2017 1,784.8 870.6 1,355.0 445.7 8,654.0 13,110.1 Depreciation and depletion Balance at January 1, 2016 412.2 139.7 172.4 153.3 - 877.6 Depreciation and depletion 47.6 23.4 40.0 13.8 - 124.8 Disposals (1.8) (1.0) - (2.5) - (5.3) Balance at December 31, 2016 458.0 162.1 212.4 164.6 - 997.1 Depreciation and depletion 12.8 6.6 14.3 3.5 - 37.2 Disposals - - - (0.1) - (0.1) Balance at March 31, 2017 470.8 168.7 226.7 168.0 - 1,034.2 Carrying value Balance at January 1, 2016 1,298.6 633.8 944.4 265.5 5,182.2 8,324.5 Balance at December 31, 2016 1,326.2 707.1 1,101.9 278.1 8,003.2 11,416.5 Balance at March 31, 2017 1,314.0 701.9 1,128.3 277.7 8,654.0 12,075.9
3
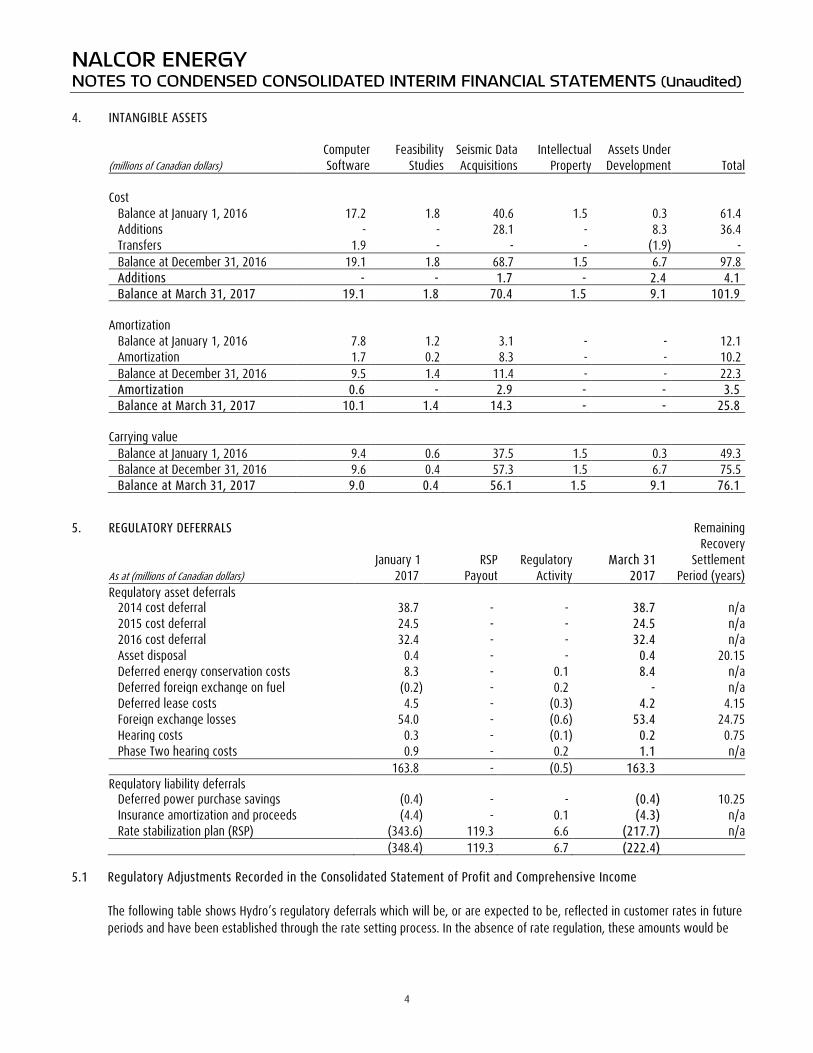
NALCOR ENERGY NOTES TO CONDENSED CONSOLIDATED INTERIM FINANCIAL STATEMENTS (Unaudited) 4. INTANGIBLE ASSETS Computer Feasibility Seismic Data Intellectual Assets Under (millions of Canadian dollars) Software Studies Acquisitions Property Development Total Cost Balance at January 1, 2016 17.2 1.8 40.6 1.5 0.3 61.4 Additions - - 28.1 - 8.3 36.4 Transfers 1.9 - - - (1.9) - Balance at December 31, 2016 19.1 1.8 68.7 1.5 6.7 97.8 Additions - - 1.7 - 2.4 4.1 Balance at March 31, 2017 19.1 1.8 70.4 1.5 9.1 101.9 Amortization Balance at January 1, 2016 7.8 1.2 3.1 - - 12.1 Amortization 1.7 0.2 8.3 - - 10.2 Balance at December 31, 2016 9.5 1.4 11.4 - - 22.3 Amortization 0.6 - 2.9 - - 3.5 Balance at March 31, 2017 10.1 1.4 14.3 - - 25.8 Carrying value Balance at January 1, 2016 9.4 0.6 37.5 1.5 0.3 49.3 Balance at December 31, 2016 9.6 0.4 57.3 1.5 6.7 75.5 Balance at March 31, 2017 9.0 0.4 56.1 1.5 9.1 76.1 5. REGULATORY DEFERRALS Remaining Recovery January 1 RSP Regulatory March 31 Settlement As at (millions of Canadian dollars) 2017 Payout Activity 2017 Period (years) Regulatory asset deferrals 2014 cost deferral 38.7 - - 38.7 n/a 2015 cost deferral 24.5 - - 24.5 n/a 2016 cost deferral 32.4 - - 32.4 n/a Asset disposal 0.4 - - 0.4 20.15 Deferred energy conservation costs 8.3 - 0.1 8.4 n/a Deferred foreign exchange on fuel (0.2) - 0.2 - n/a Deferred lease costs 4.5 - (0.3) 4.2 4.15 Foreign exchange losses 54.0 - (0.6) 53.4 24.75 Hearing costs 0.3 - (0.1) 0.2 0.75 Phase Two hearing costs 0.9 - 0.2 1.1 n/a 163.8 - (0.5) 163.3 Regulatory liability deferrals Deferred power purchase savings (0.4) - - (0.4) 10.25 Insurance amortization and proceeds (4.4) - 0.1 (4.3) n/a Rate stabilization plan (RSP) (343.6) 119.3 6.6 (217.7) n/a (348.4) 119.3 6.7 (222.4) 5.1 Regulatory Adjustments Recorded in the Consolidated Statement of Profit and Comprehensive Income
The following table shows Hydro’s regulatory deferrals which will be, or are expected to be, reflected in customer rates in future periods and have been established through the rate setting process. In the absence of rate regulation, these amounts would be
4
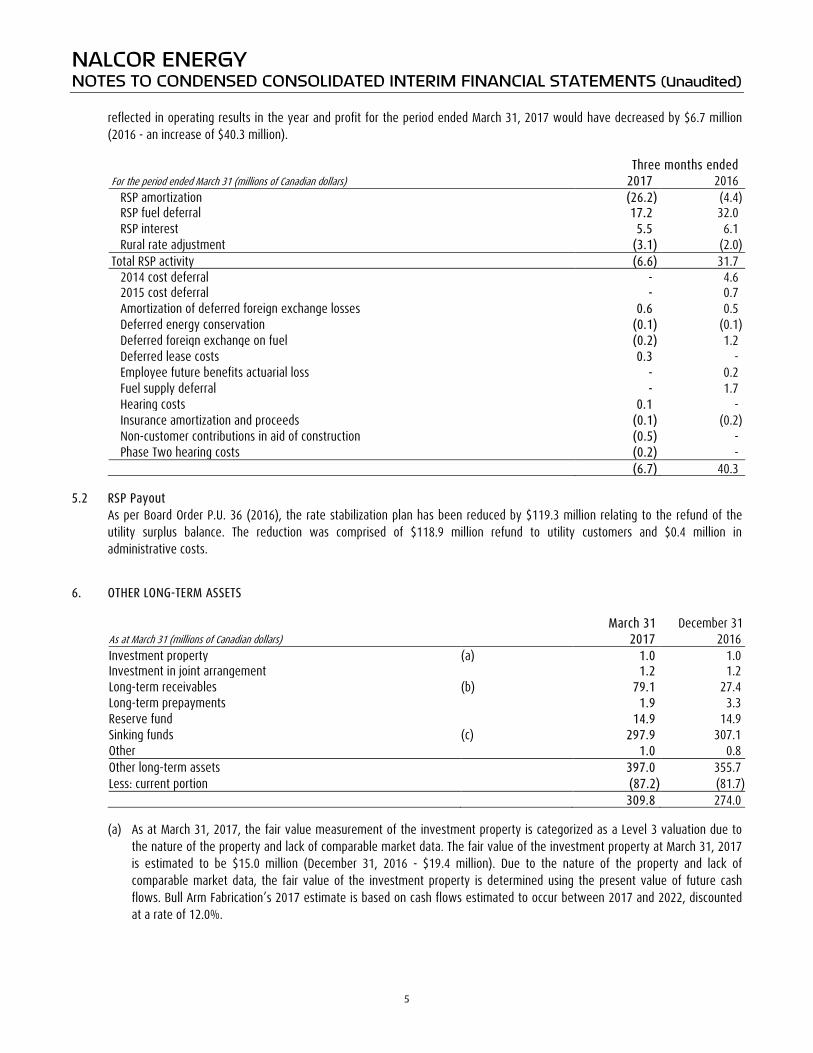
NALCOR ENERGY NOTES TO CONDENSED CONSOLIDATED INTERIM FINANCIAL STATEMENTS (Unaudited)
reflected in operating results in the year and profit for the period ended March 31, 2017 would have decreased by $6.7 million (2016 - an increase of $40.3 million).
Three months ended For the period ended March 31 (millions of Canadian dollars) 2017 2016 RSP amortization (26.2) (4.4) RSP fuel deferral 17.2 32.0 RSP interest 5.5 6.1 Rural rate adjustment (3.1) (2.0) Total RSP activity (6.6) 31.7 2014 cost deferral - 4.6 2015 cost deferral - 0.7 Amortization of deferred foreign exchange losses 0.6 0.5 Deferred energy conservation (0.1) (0.1) Deferred foreign exchange on fuel (0.2) 1.2 Deferred lease costs 0.3 - Employee future benefits actuarial loss - 0.2 Fuel supply deferral - 1.7 Hearing costs 0.1 - Insurance amortization and proceeds (0.1) (0.2) Non-customer contributions in aid of construction (0.5) - Phase Two hearing costs (0.2) - (6.7) 40.3 5.2 RSP Payout
As per Board Order P.U. 36 (2016), the rate stabilization plan has been reduced by $119.3 million relating to the refund of the utility surplus balance. The reduction was comprised of $118.9 million refund to utility customers and $0.4 million in administrative costs.
6. OTHER LONG-TERM ASSETS March 31 December 31 As at March 31 (millions of Canadian dollars) 2017 2016 Investment property (a) 1.0 1.0 Investment in joint arrangement 1.2 1.2 Long-term receivables (b) 79.1 27.4 Long-term prepayments 1.9 3.3 Reserve fund 14.9 14.9 Sinking funds (c) 297.9 307.1 Other 1.0 0.8 Other long-term assets 397.0 355.7 Less: current portion (87.2) (81.7) 309.8 274.0
(a) As at March 31, 2017, the fair value measurement of the investment property is categorized as a Level 3 valuation due to the nature of the property and lack of comparable market data. The fair value of the investment property at March 31, 2017 is estimated to be $15.0 million (December 31, 2016 - $19.4 million). Due to the nature of the property and lack of comparable market data, the fair value of the investment property is determined using the present value of future cash flows. Bull Arm Fabrication’s 2017 estimate is based on cash flows estimated to occur between 2017 and 2022, discounted at a rate of 12.0%.
5
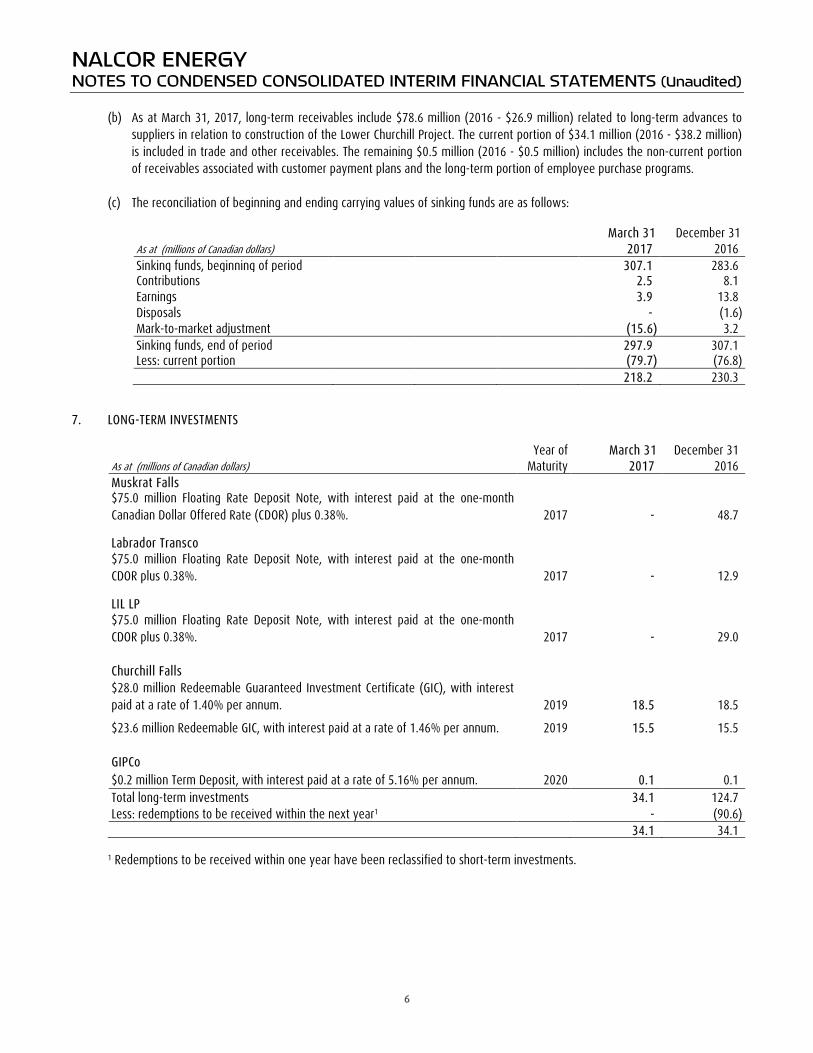
NALCOR ENERGY NOTES TO CONDENSED CONSOLIDATED INTERIM FINANCIAL STATEMENTS (Unaudited)
(b) As at March 31, 2017, long-term receivables include $78.6 million (2016 - $26.9 million) related to long-term advances to suppliers in relation to construction of the Lower Churchill Project. The current portion of $34.1 million (2016 - $38.2 million) is included in trade and other receivables. The remaining $0.5 million (2016 - $0.5 million) includes the non-current portion of receivables associated with customer payment plans and the long-term portion of employee purchase programs.
(c) The reconciliation of beginning and ending carrying values of sinking funds are as follows:
March 31 December 31 As at (millions of Canadian dollars) 2017 2016 Sinking funds, beginning of period 307.1 283.6 Contributions 2.5 8.1 Earnings 3.9 13.8 Disposals - (1.6) Mark-to-market adjustment (15.6) 3.2 Sinking funds, end of period 297.9 307.1 Less: current portion (79.7) (76.8) 218.2 230.3 7. LONG-TERM INVESTMENTS Year of March 31 December 31 As at (millions of Canadian dollars) Maturity 2017 2016 Muskrat Falls
$75.0 million Floating Rate Deposit Note, with interest paid at the one-month Canadian Dollar Offered Rate (CDOR) plus 0.38%. 2017 - 48.7
Labrador Transco
$75.0 million Floating Rate Deposit Note, with interest paid at the one-month CDOR plus 0.38%. 2017 - 12.9
LIL LP
$75.0 million Floating Rate Deposit Note, with interest paid at the one-month CDOR plus 0.38%. 2017 - 29.0
Churchill Falls
$28.0 million Redeemable Guaranteed Investment Certificate (GIC), with interest paid at a rate of 1.40% per annum. 2019 18.5 18.5
$23.6 million Redeemable GIC, with interest paid at a rate of 1.46% per annum. 2019 15.5 15.5 GIPCo $0.2 million Term Deposit, with interest paid at a rate of 5.16% per annum. 2020 0.1 0.1 Total long-term investments 34.1 124.7 Less: redemptions to be received within the next year1 - (90.6) 34.1 34.1
1 Redemptions to be received within one year have been reclassified to short-term investments.
6
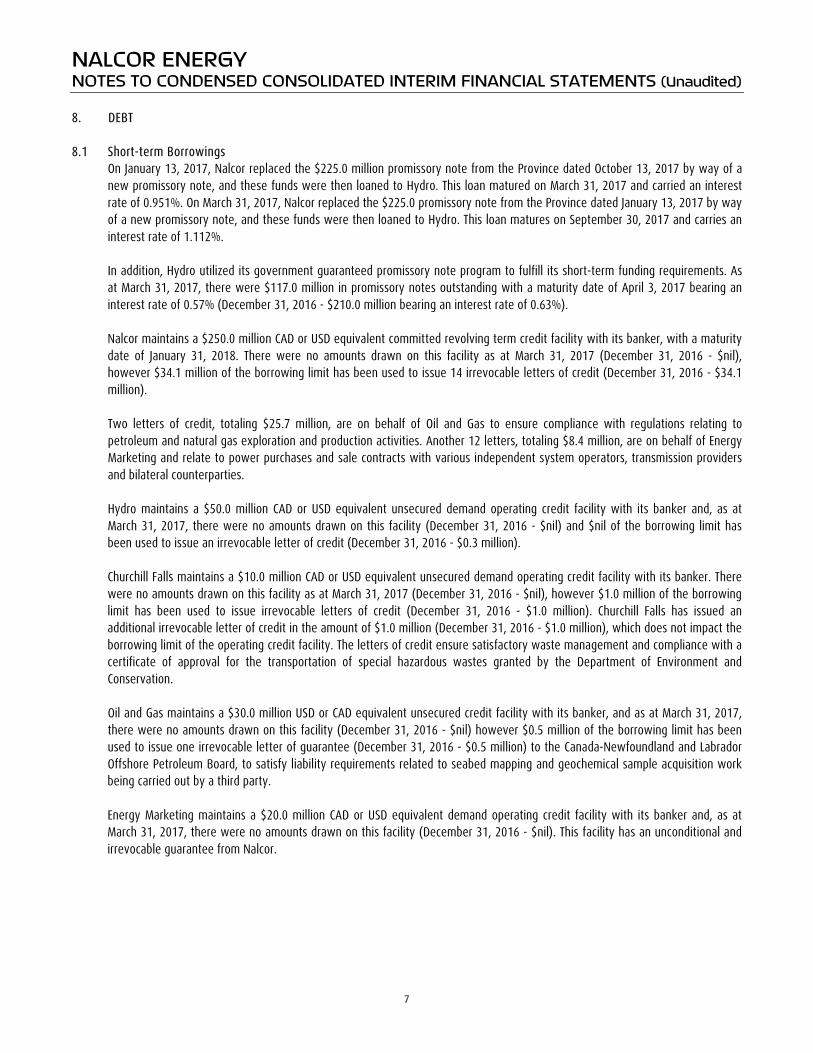
NALCOR ENERGY NOTES TO CONDENSED CONSOLIDATED INTERIM FINANCIAL STATEMENTS (Unaudited) 8. DEBT 8.1 Short-term Borrowings
On January 13, 2017, Nalcor replaced the $225.0 million promissory note from the Province dated October 13, 2017 by way of a new promissory note, and these funds were then loaned to Hydro. This loan matured on March 31, 2017 and carried an interest rate of 0.951%. On March 31, 2017, Nalcor replaced the $225.0 promissory note from the Province dated January 13, 2017 by way of a new promissory note, and these funds were then loaned to Hydro. This loan matures on September 30, 2017 and carries an interest rate of 1.112%. In addition, Hydro utilized its government guaranteed promissory note program to fulfill its short-term funding requirements. As at March 31, 2017, there were $117.0 million in promissory notes outstanding with a maturity date of April 3, 2017 bearing an interest rate of 0.57% (December 31, 2016 - $210.0 million bearing an interest rate of 0.63%). Nalcor maintains a $250.0 million CAD or USD equivalent committed revolving term credit facility with its banker, with a maturity date of January 31, 2018. There were no amounts drawn on this facility as at March 31, 2017 (December 31, 2016 - $nil), however $34.1 million of the borrowing limit has been used to issue 14 irrevocable letters of credit (December 31, 2016 - $34.1 million). Two letters of credit, totaling $25.7 million, are on behalf of Oil and Gas to ensure compliance with regulations relating to petroleum and natural gas exploration and production activities. Another 12 letters, totaling $8.4 million, are on behalf of Energy Marketing and relate to power purchases and sale contracts with various independent system operators, transmission providers and bilateral counterparties. Hydro maintains a $50.0 million CAD or USD equivalent unsecured demand operating credit facility with its banker and, as at March 31, 2017, there were no amounts drawn on this facility (December 31, 2016 - $nil) and $nil of the borrowing limit has been used to issue an irrevocable letter of credit (December 31, 2016 - $0.3 million). Churchill Falls maintains a $10.0 million CAD or USD equivalent unsecured demand operating credit facility with its banker. There were no amounts drawn on this facility as at March 31, 2017 (December 31, 2016 - $nil), however $1.0 million of the borrowing limit has been used to issue irrevocable letters of credit (December 31, 2016 - $1.0 million). Churchill Falls has issued an additional irrevocable letter of credit in the amount of $1.0 million (December 31, 2016 - $1.0 million), which does not impact the borrowing limit of the operating credit facility. The letters of credit ensure satisfactory waste management and compliance with a certificate of approval for the transportation of special hazardous wastes granted by the Department of Environment and Conservation. Oil and Gas maintains a $30.0 million USD or CAD equivalent unsecured credit facility with its banker, and as at March 31, 2017, there were no amounts drawn on this facility (December 31, 2016 - $nil) however $0.5 million of the borrowing limit has been used to issue one irrevocable letter of guarantee (December 31, 2016 - $0.5 million) to the Canada-Newfoundland and Labrador Offshore Petroleum Board, to satisfy liability requirements related to seabed mapping and geochemical sample acquisition work being carried out by a third party. Energy Marketing maintains a $20.0 million CAD or USD equivalent demand operating credit facility with its banker and, as at March 31, 2017, there were no amounts drawn on this facility (December 31, 2016 - $nil). This facility has an unconditional and irrevocable guarantee from Nalcor.
7
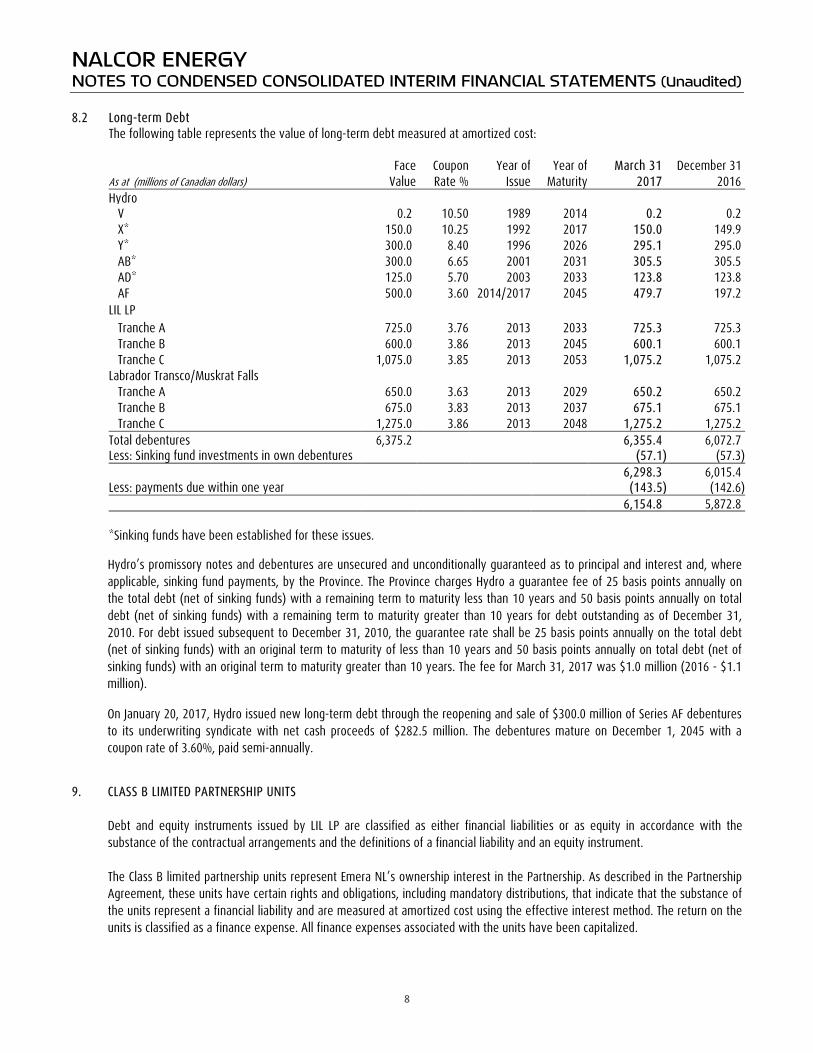
NALCOR ENERGY NOTES TO CONDENSED CONSOLIDATED INTERIM FINANCIAL STATEMENTS (Unaudited) 8.2 Long-term Debt The following table represents the value of long-term debt measured at amortized cost: Face Coupon Year of Year of March 31 December 31 As at (millions of Canadian dollars) Value Rate % Issue Maturity 2017 2016 Hydro V 0.2 10.50 1989 2014 0.2 0.2 X* 150.0 10.25 1992 2017 150.0 149.9 Y* 300.0 8.40 1996 2026 295.1 295.0 AB* 300.0 6.65 2001 2031 305.5 305.5 AD* 125.0 5.70 2003 2033 123.8 123.8 AF 500.0 3.60 2014/2017 2045 479.7 197.2 LIL LP Tranche A 725.0 3.76 2013 2033 725.3 725.3 Tranche B 600.0 3.86 2013 2045 600.1 600.1 Tranche C 1,075.0 3.85 2013 2053 1,075.2 1,075.2 Labrador Transco/Muskrat Falls Tranche A 650.0 3.63 2013 2029 650.2 650.2 Tranche B 675.0 3.83 2013 2037 675.1 675.1 Tranche C 1,275.0 3.86 2013 2048 1,275.2 1,275.2 Total debentures 6,375.2 6,355.4 6,072.7 Less: Sinking fund investments in own debentures (57.1) (57.3) 6,298.3 6,015.4 Less: payments due within one year (143.5) (142.6) 6,154.8 5,872.8 *Sinking funds have been established for these issues.
Hydro’s promissory notes and debentures are unsecured and unconditionally guaranteed as to principal and interest and, where applicable, sinking fund payments, by the Province. The Province charges Hydro a guarantee fee of 25 basis points annually on the total debt (net of sinking funds) with a remaining term to maturity less than 10 years and 50 basis points annually on total debt (net of sinking funds) with a remaining term to maturity greater than 10 years for debt outstanding as of December 31, 2010. For debt issued subsequent to December 31, 2010, the guarantee rate shall be 25 basis points annually on the total debt (net of sinking funds) with an original term to maturity of less than 10 years and 50 basis points annually on total debt (net of sinking funds) with an original term to maturity greater than 10 years. The fee for March 31, 2017 was $1.0 million (2016 - $1.1 million). On January 20, 2017, Hydro issued new long-term debt through the reopening and sale of $300.0 million of Series AF debentures to its underwriting syndicate with net cash proceeds of $282.5 million. The debentures mature on December 1, 2045 with a coupon rate of 3.60%, paid semi-annually.
9. CLASS B LIMITED PARTNERSHIP UNITS Debt and equity instruments issued by LIL LP are classified as either financial liabilities or as equity in accordance with the
substance of the contractual arrangements and the definitions of a financial liability and an equity instrument. The Class B limited partnership units represent Emera NL’s ownership interest in the Partnership. As described in the Partnership
Agreement, these units have certain rights and obligations, including mandatory distributions, that indicate that the substance of the units represent a financial liability and are measured at amortized cost using the effective interest method. The return on the units is classified as a finance expense. All finance expenses associated with the units have been capitalized.
8
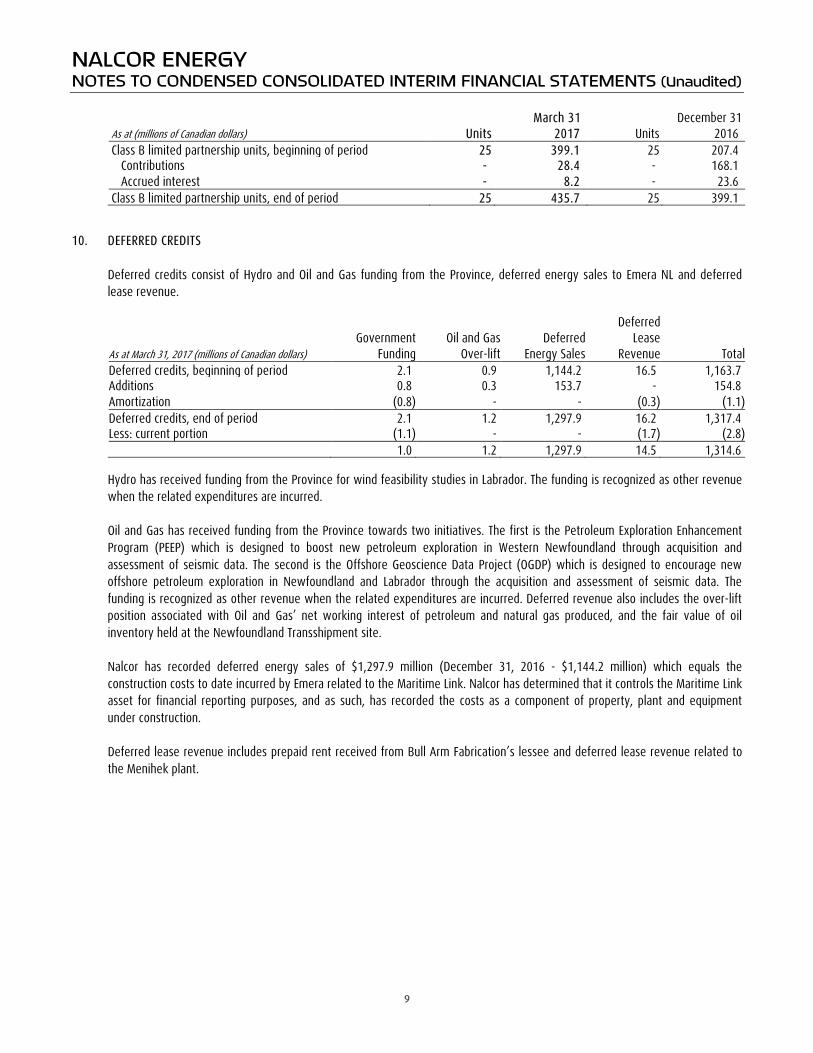
NALCOR ENERGY NOTES TO CONDENSED CONSOLIDATED INTERIM FINANCIAL STATEMENTS (Unaudited) March 31 December 31 As at (millions of Canadian dollars) Units 2017 Units 2016 Class B limited partnership units, beginning of period 25 399.1 25 207.4 Contributions - 28.4 - 168.1 Accrued interest - 8.2 - 23.6 Class B limited partnership units, end of period 25 435.7 25 399.1 10. DEFERRED CREDITS Deferred credits consist of Hydro and Oil and Gas funding from the Province, deferred energy sales to Emera NL and deferred
lease revenue. Deferred Government Oil and Gas Deferred Lease As at March 31, 2017 (millions of Canadian dollars) Funding Over-lift Energy Sales Revenue Total Deferred credits, beginning of period 2.1 0.9 1,144.2 16.5 1,163.7 Additions 0.8 0.3 153.7 - 154.8 Amortization (0.8) - - (0.3) (1.1) Deferred credits, end of period 2.1 1.2 1,297.9 16.2 1,317.4 Less: current portion (1.1) - - (1.7) (2.8) 1.0 1.2 1,297.9 14.5 1,314.6
Hydro has received funding from the Province for wind feasibility studies in Labrador. The funding is recognized as other revenue when the related expenditures are incurred. Oil and Gas has received funding from the Province towards two initiatives. The first is the Petroleum Exploration Enhancement Program (PEEP) which is designed to boost new petroleum exploration in Western Newfoundland through acquisition and assessment of seismic data. The second is the Offshore Geoscience Data Project (OGDP) which is designed to encourage new offshore petroleum exploration in Newfoundland and Labrador through the acquisition and assessment of seismic data. The funding is recognized as other revenue when the related expenditures are incurred. Deferred revenue also includes the over-lift position associated with Oil and Gas’ net working interest of petroleum and natural gas produced, and the fair value of oil inventory held at the Newfoundland Transshipment site. Nalcor has recorded deferred energy sales of $1,297.9 million (December 31, 2016 - $1,144.2 million) which equals the construction costs to date incurred by Emera related to the Maritime Link. Nalcor has determined that it controls the Maritime Link asset for financial reporting purposes, and as such, has recorded the costs as a component of property, plant and equipment under construction. Deferred lease revenue includes prepaid rent received from Bull Arm Fabrication’s lessee and deferred lease revenue related to the Menihek plant.
9
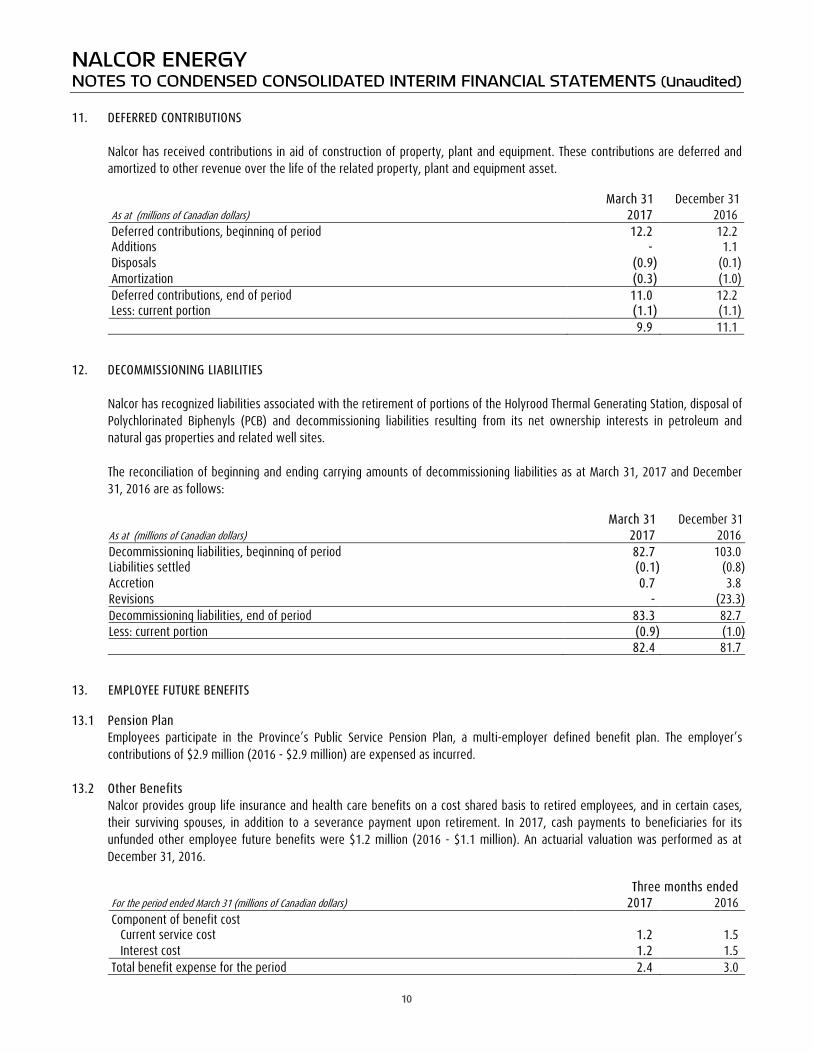
NALCOR ENERGY NOTES TO CONDENSED CONSOLIDATED INTERIM FINANCIAL STATEMENTS (Unaudited) 11. DEFERRED CONTRIBUTIONS Nalcor has received contributions in aid of construction of property, plant and equipment. These contributions are deferred and
amortized to other revenue over the life of the related property, plant and equipment asset. March 31 December 31 As at (millions of Canadian dollars) 2017 2016 Deferred contributions, beginning of period 12.2 12.2 Additions - 1.1 Disposals (0.9) (0.1) Amortization (0.3) (1.0) Deferred contributions, end of period 11.0 12.2 Less: current portion (1.1) (1.1) 9.9 11.1 12. DECOMMISSIONING LIABILITIES
Nalcor has recognized liabilities associated with the retirement of portions of the Holyrood Thermal Generating Station, disposal of Polychlorinated Biphenyls (PCB) and decommissioning liabilities resulting from its net ownership interests in petroleum and natural gas properties and related well sites. The reconciliation of beginning and ending carrying amounts of decommissioning liabilities as at March 31, 2017 and December 31, 2016 are as follows:
March 31 December 31 As at (millions of Canadian dollars) 2017 2016 Decommissioning liabilities, beginning of period 82.7 103.0 Liabilities settled (0.1) (0.8) Accretion 0.7 3.8 Revisions - (23.3) Decommissioning liabilities, end of period 83.3 82.7 Less: current portion (0.9) (1.0) 82.4 81.7 13. EMPLOYEE FUTURE BENEFITS
13.1 Pension Plan Employees participate in the Province’s Public Service Pension Plan, a multi-employer defined benefit plan. The employer’s contributions of $2.9 million (2016 - $2.9 million) are expensed as incurred.
13.2 Other Benefits
Nalcor provides group life insurance and health care benefits on a cost shared basis to retired employees, and in certain cases, their surviving spouses, in addition to a severance payment upon retirement. In 2017, cash payments to beneficiaries for its unfunded other employee future benefits were $1.2 million (2016 - $1.1 million). An actuarial valuation was performed as at December 31, 2016.
Three months ended For the period ended March 31 (millions of Canadian dollars) 2017 2016 Component of benefit cost Current service cost 1.2 1.5 Interest cost 1.2 1.5 Total benefit expense for the period 2.4 3.0
10
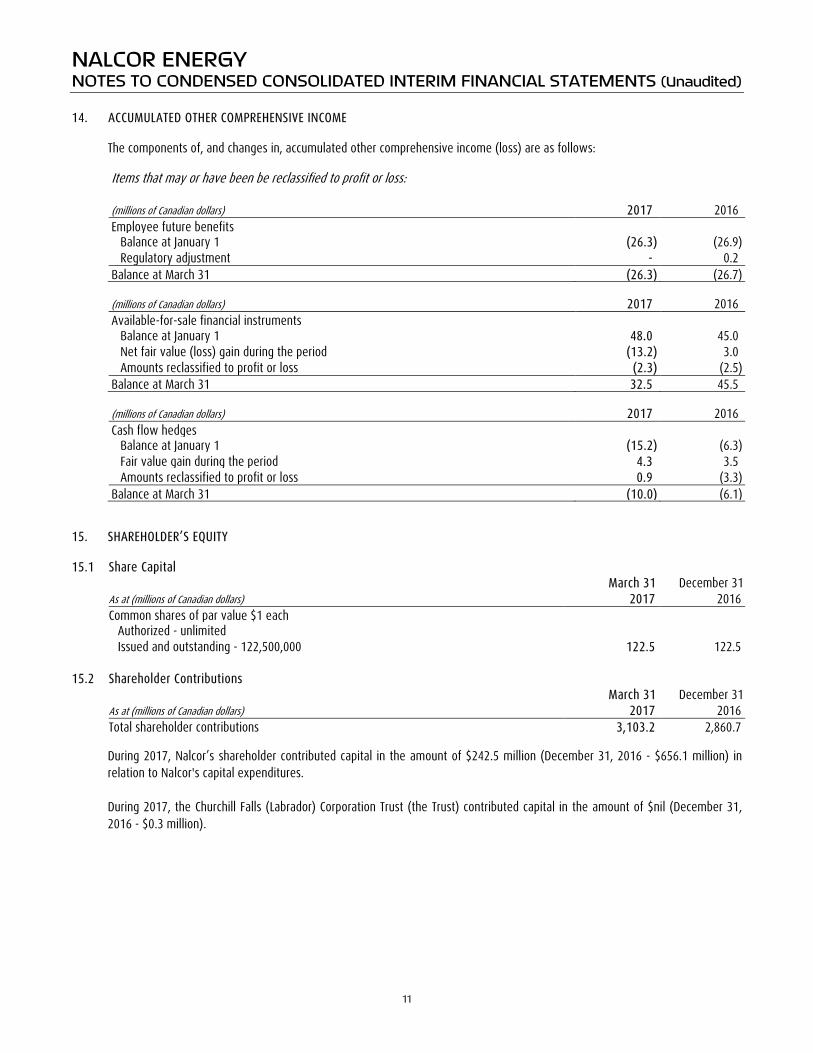
NALCOR ENERGY NOTES TO CONDENSED CONSOLIDATED INTERIM FINANCIAL STATEMENTS (Unaudited) 14. ACCUMULATED OTHER COMPREHENSIVE INCOME
The components of, and changes in, accumulated other comprehensive income (loss) are as follows: Items that may or have been be reclassified to profit or loss: (millions of Canadian dollars) 2017 2016 Employee future benefits Balance at January 1 (26.3) (26.9) Regulatory adjustment - 0.2 Balance at March 31 (26.3) (26.7) (millions of Canadian dollars) 2017 2016 Available-for-sale financial instruments Balance at January 1 48.0 45.0 Net fair value (loss) gain during the period (13.2) 3.0 Amounts reclassified to profit or loss (2.3) (2.5) Balance at March 31 32.5 45.5 (millions of Canadian dollars) 2017 2016 Cash flow hedges Balance at January 1 (15.2) (6.3) Fair value gain during the period 4.3 3.5 Amounts reclassified to profit or loss 0.9 (3.3) Balance at March 31 (10.0) (6.1) 15. SHAREHOLDER’S EQUITY 15.1 Share Capital March 31 December 31 As at (millions of Canadian dollars) 2017 2016 Common shares of par value $1 each Authorized - unlimited Issued and outstanding - 122,500,000 122.5 122.5 15.2 Shareholder Contributions March 31 December 31 As at (millions of Canadian dollars) 2017 2016 Total shareholder contributions 3,103.2 2,860.7
During 2017, Nalcor’s shareholder contributed capital in the amount of $242.5 million (December 31, 2016 - $656.1 million) in relation to Nalcor's capital expenditures. During 2017, the Churchill Falls (Labrador) Corporation Trust (the Trust) contributed capital in the amount of $nil (December 31, 2016 - $0.3 million).
11
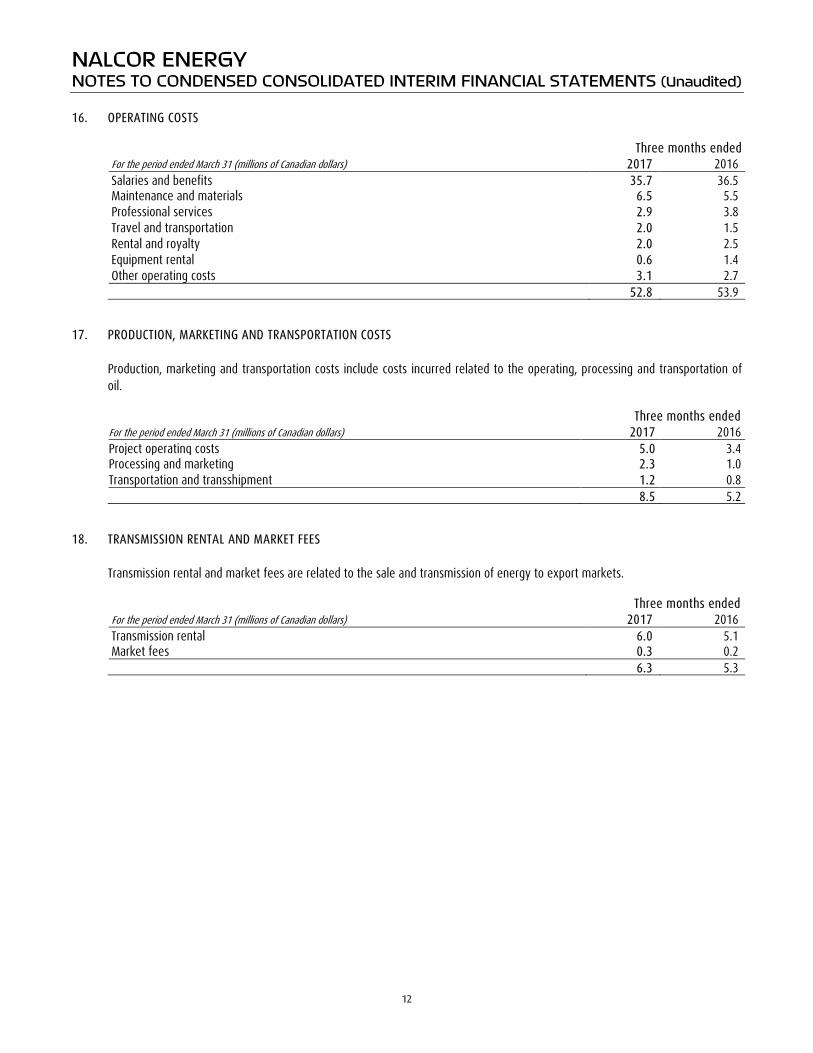
NALCOR ENERGY NOTES TO CONDENSED CONSOLIDATED INTERIM FINANCIAL STATEMENTS (Unaudited) 16. OPERATING COSTS Three months ended For the period ended March 31 (millions of Canadian dollars) 2017 2016 Salaries and benefits 35.7 36.5 Maintenance and materials 6.5 5.5 Professional services 2.9 3.8 Travel and transportation 2.0 1.5 Rental and royalty 2.0 2.5 Equipment rental 0.6 1.4 Other operating costs 3.1 2.7 52.8 53.9 17. PRODUCTION, MARKETING AND TRANSPORTATION COSTS Production, marketing and transportation costs include costs incurred related to the operating, processing and transportation of
oil. Three months ended For the period ended March 31 (millions of Canadian dollars) 2017 2016 Project operating costs 5.0 3.4 Processing and marketing 2.3 1.0 Transportation and transshipment 1.2 0.8 8.5 5.2 18. TRANSMISSION RENTAL AND MARKET FEES Transmission rental and market fees are related to the sale and transmission of energy to export markets. Three months ended For the period ended March 31 (millions of Canadian dollars) 2017 2016 Transmission rental 6.0 5.1 Market fees 0.3 0.2 6.3 5.3
12
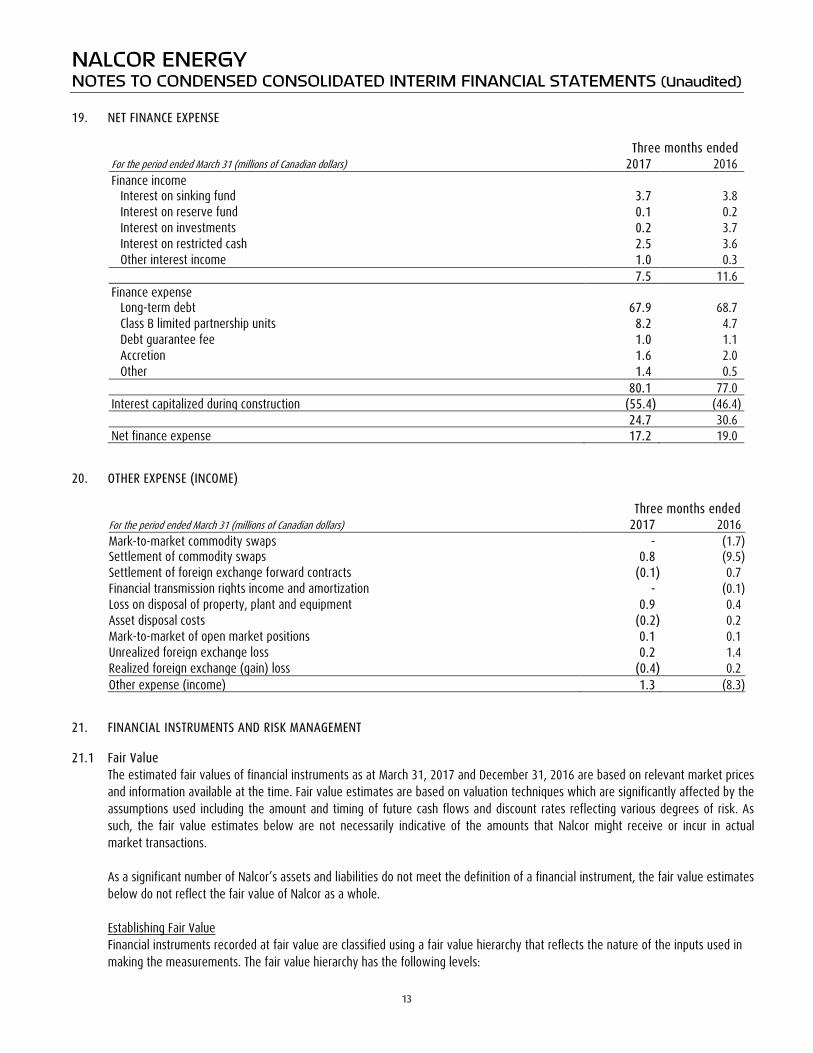
NALCOR ENERGY NOTES TO CONDENSED CONSOLIDATED INTERIM FINANCIAL STATEMENTS (Unaudited) 19. NET FINANCE EXPENSE Three months ended For the period ended March 31 (millions of Canadian dollars) 2017 2016 Finance income Interest on sinking fund 3.7 3.8 Interest on reserve fund 0.1 0.2 Interest on investments 0.2 3.7 Interest on restricted cash 2.5 3.6 Other interest income 1.0 0.3 7.5 11.6 Finance expense Long-term debt 67.9 68.7 Class B limited partnership units 8.2 4.7 Debt guarantee fee 1.0 1.1 Accretion 1.6 2.0 Other 1.4 0.5 80.1 77.0 Interest capitalized during construction (55.4) (46.4) 24.7 30.6 Net finance expense 17.2 19.0 20. OTHER EXPENSE (INCOME) Three months ended For the period ended March 31 (millions of Canadian dollars) 2017 2016 Mark-to-market commodity swaps - (1.7) Settlement of commodity swaps 0.8 (9.5) Settlement of foreign exchange forward contracts (0.1) 0.7 Financial transmission rights income and amortization - (0.1) Loss on disposal of property, plant and equipment 0.9 0.4 Asset disposal costs (0.2) 0.2 Mark-to-market of open market positions 0.1 0.1 Unrealized foreign exchange loss 0.2 1.4 Realized foreign exchange (gain) loss (0.4) 0.2 Other expense (income) 1.3 (8.3) 21. FINANCIAL INSTRUMENTS AND RISK MANAGEMENT
21.1 Fair Value The estimated fair values of financial instruments as at March 31, 2017 and December 31, 2016 are based on relevant market prices and information available at the time. Fair value estimates are based on valuation techniques which are significantly affected by the assumptions used including the amount and timing of future cash flows and discount rates reflecting various degrees of risk. As such, the fair value estimates below are not necessarily indicative of the amounts that Nalcor might receive or incur in actual market transactions.
As a significant number of Nalcor’s assets and liabilities do not meet the definition of a financial instrument, the fair value estimates below do not reflect the fair value of Nalcor as a whole. Establishing Fair Value Financial instruments recorded at fair value are classified using a fair value hierarchy that reflects the nature of the inputs used in making the measurements. The fair value hierarchy has the following levels:
13
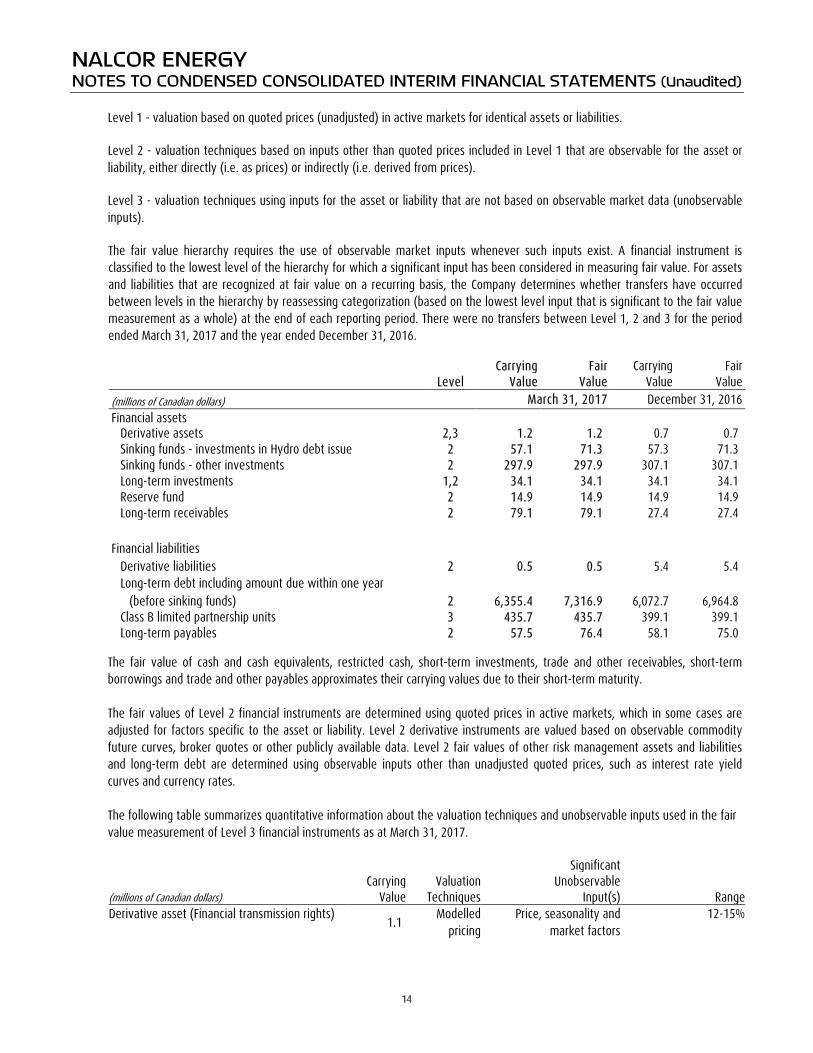
NALCOR ENERGY NOTES TO CONDENSED CONSOLIDATED INTERIM FINANCIAL STATEMENTS (Unaudited) Level 1 - valuation based on quoted prices (unadjusted) in active markets for identical assets or liabilities.
Level 2 - valuation techniques based on inputs other than quoted prices included in Level 1 that are observable for the asset or liability, either directly (i.e. as prices) or indirectly (i.e. derived from prices).
Level 3 - valuation techniques using inputs for the asset or liability that are not based on observable market data (unobservable inputs).
The fair value hierarchy requires the use of observable market inputs whenever such inputs exist. A financial instrument is classified to the lowest level of the hierarchy for which a significant input has been considered in measuring fair value. For assets and liabilities that are recognized at fair value on a recurring basis, the Company determines whether transfers have occurred between levels in the hierarchy by reassessing categorization (based on the lowest level input that is significant to the fair value measurement as a whole) at the end of each reporting period. There were no transfers between Level 1, 2 and 3 for the period ended March 31, 2017 and the year ended December 31, 2016.
Carrying Fair Carrying Fair Level Value Value Value Value (millions of Canadian dollars) March 31, 2017 December 31, 2016 Financial assets Derivative assets 2,3 1.2 1.2 0.7 0.7 Sinking funds - investments in Hydro debt issue 2 57.1 71.3 57.3 71.3 Sinking funds - other investments 2 297.9 297.9 307.1 307.1 Long-term investments 1,2 34.1 34.1 34.1 34.1 Reserve fund 2 14.9 14.9 14.9 14.9 Long-term receivables 2 79.1 79.1 27.4 27.4 Financial liabilities Derivative liabilities 2 0.5 0.5 5.4 5.4 Long-term debt including amount due within one year (before sinking funds) 2 6,355.4 7,316.9 6,072.7 6,964.8 Class B limited partnership units 3 435.7 435.7 399.1 399.1 Long-term payables 2 57.5 76.4 58.1 75.0
The fair value of cash and cash equivalents, restricted cash, short-term investments, trade and other receivables, short-term borrowings and trade and other payables approximates their carrying values due to their short-term maturity. The fair values of Level 2 financial instruments are determined using quoted prices in active markets, which in some cases are adjusted for factors specific to the asset or liability. Level 2 derivative instruments are valued based on observable commodity future curves, broker quotes or other publicly available data. Level 2 fair values of other risk management assets and liabilities and long-term debt are determined using observable inputs other than unadjusted quoted prices, such as interest rate yield curves and currency rates. The following table summarizes quantitative information about the valuation techniques and unobservable inputs used in the fair value measurement of Level 3 financial instruments as at March 31, 2017.
Significant Carrying Valuation Unobservable (millions of Canadian dollars) Value Techniques Input(s) Range
Derivative asset (Financial transmission rights)
1.1 Modelled
pricing Price, seasonality and
market factors 12-15%
14
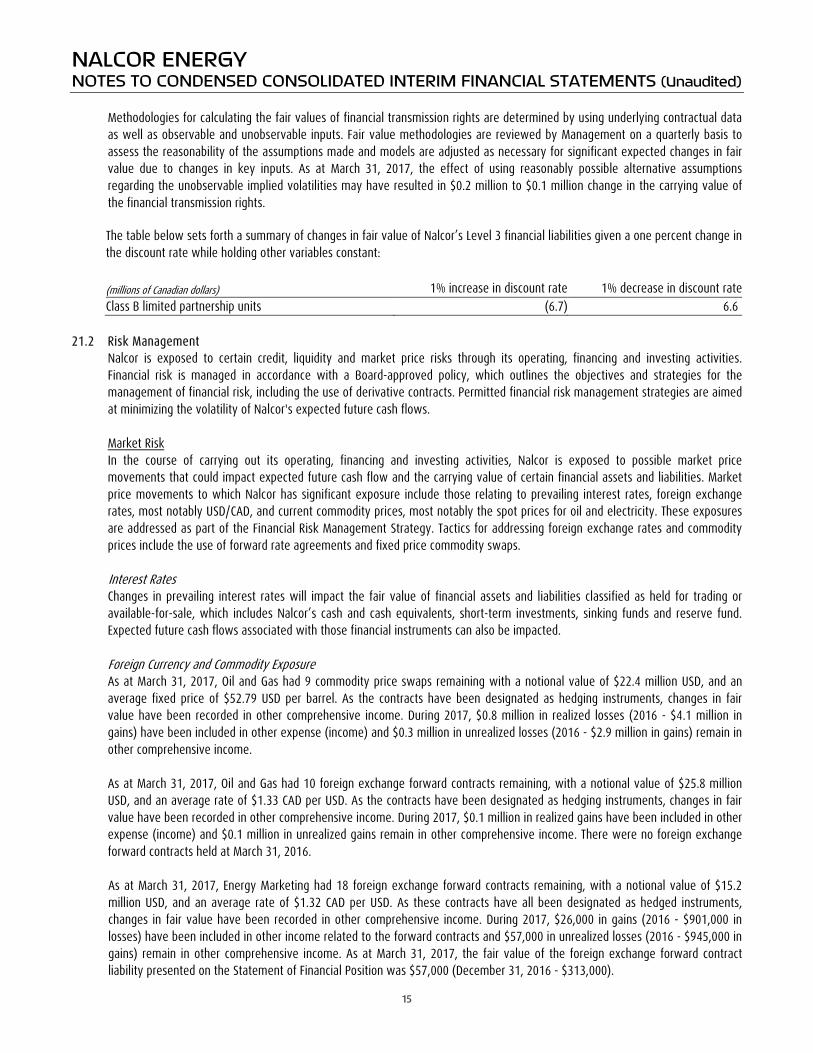
NALCOR ENERGY NOTES TO CONDENSED CONSOLIDATED INTERIM FINANCIAL STATEMENTS (Unaudited)
Methodologies for calculating the fair values of financial transmission rights are determined by using underlying contractual data as well as observable and unobservable inputs. Fair value methodologies are reviewed by Management on a quarterly basis to assess the reasonability of the assumptions made and models are adjusted as necessary for significant expected changes in fair value due to changes in key inputs. As at March 31, 2017, the effect of using reasonably possible alternative assumptions regarding the unobservable implied volatilities may have resulted in $0.2 million to $0.1 million change in the carrying value of the financial transmission rights.
The table below sets forth a summary of changes in fair value of Nalcor’s Level 3 financial liabilities given a one percent change in the discount rate while holding other variables constant: (millions of Canadian dollars) 1% increase in discount rate 1% decrease in discount rate Class B limited partnership units (6.7) 6.6
21.2 Risk Management
Nalcor is exposed to certain credit, liquidity and market price risks through its operating, financing and investing activities. Financial risk is managed in accordance with a Board-approved policy, which outlines the objectives and strategies for the management of financial risk, including the use of derivative contracts. Permitted financial risk management strategies are aimed at minimizing the volatility of Nalcor's expected future cash flows.
Market Risk In the course of carrying out its operating, financing and investing activities, Nalcor is exposed to possible market price movements that could impact expected future cash flow and the carrying value of certain financial assets and liabilities. Market price movements to which Nalcor has significant exposure include those relating to prevailing interest rates, foreign exchange rates, most notably USD/CAD, and current commodity prices, most notably the spot prices for oil and electricity. These exposures are addressed as part of the Financial Risk Management Strategy. Tactics for addressing foreign exchange rates and commodity prices include the use of forward rate agreements and fixed price commodity swaps. Interest Rates Changes in prevailing interest rates will impact the fair value of financial assets and liabilities classified as held for trading or available-for-sale, which includes Nalcor’s cash and cash equivalents, short-term investments, sinking funds and reserve fund. Expected future cash flows associated with those financial instruments can also be impacted. Foreign Currency and Commodity Exposure As at March 31, 2017, Oil and Gas had 9 commodity price swaps remaining with a notional value of $22.4 million USD, and an average fixed price of $52.79 USD per barrel. As the contracts have been designated as hedging instruments, changes in fair value have been recorded in other comprehensive income. During 2017, $0.8 million in realized losses (2016 - $4.1 million in gains) have been included in other expense (income) and $0.3 million in unrealized losses (2016 - $2.9 million in gains) remain in other comprehensive income. As at March 31, 2017, Oil and Gas had 10 foreign exchange forward contracts remaining, with a notional value of $25.8 million USD, and an average rate of $1.33 CAD per USD. As the contracts have been designated as hedging instruments, changes in fair value have been recorded in other comprehensive income. During 2017, $0.1 million in realized gains have been included in other expense (income) and $0.1 million in unrealized gains remain in other comprehensive income. There were no foreign exchange forward contracts held at March 31, 2016. As at March 31, 2017, Energy Marketing had 18 foreign exchange forward contracts remaining, with a notional value of $15.2 million USD, and an average rate of $1.32 CAD per USD. As these contracts have all been designated as hedged instruments, changes in fair value have been recorded in other comprehensive income. During 2017, $26,000 in gains (2016 - $901,000 in losses) have been included in other income related to the forward contracts and $57,000 in unrealized losses (2016 - $945,000 in gains) remain in other comprehensive income. As at March 31, 2017, the fair value of the foreign exchange forward contract liability presented on the Statement of Financial Position was $57,000 (December 31, 2016 - $313,000).
15
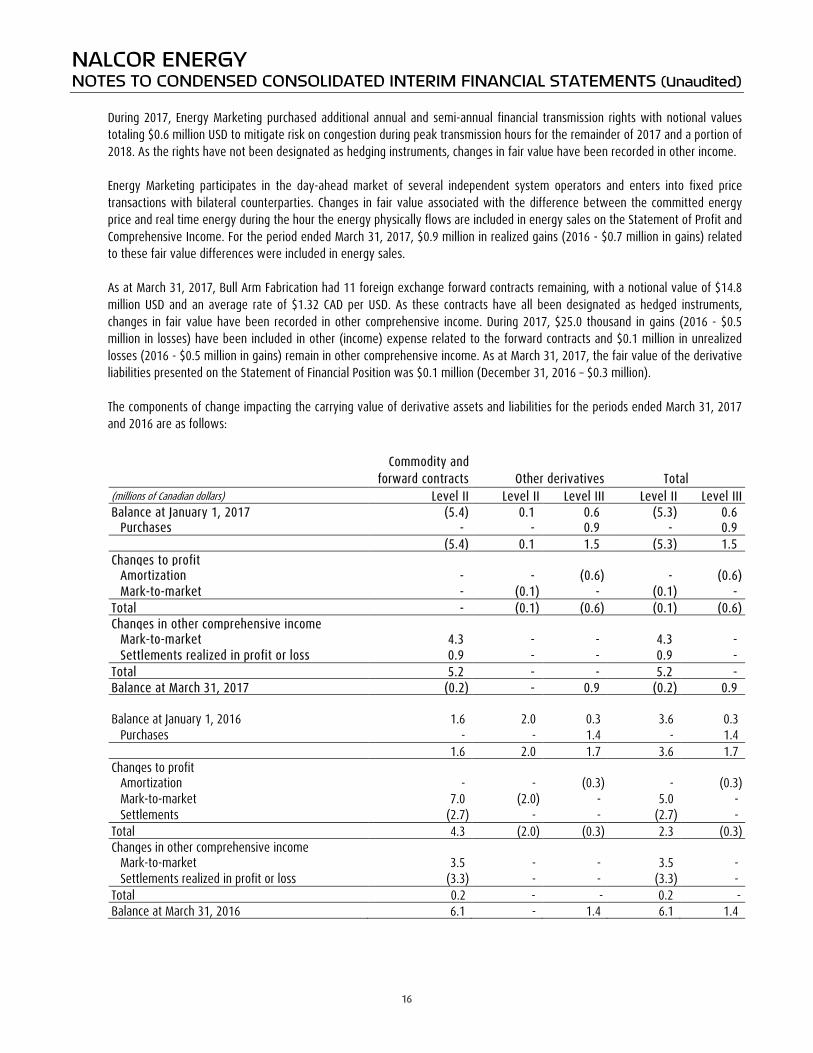
NALCOR ENERGY NOTES TO CONDENSED CONSOLIDATED INTERIM FINANCIAL STATEMENTS (Unaudited)
During 2017, Energy Marketing purchased additional annual and semi-annual financial transmission rights with notional values totaling $0.6 million USD to mitigate risk on congestion during peak transmission hours for the remainder of 2017 and a portion of 2018. As the rights have not been designated as hedging instruments, changes in fair value have been recorded in other income. Energy Marketing participates in the day-ahead market of several independent system operators and enters into fixed price transactions with bilateral counterparties. Changes in fair value associated with the difference between the committed energy price and real time energy during the hour the energy physically flows are included in energy sales on the Statement of Profit and Comprehensive Income. For the period ended March 31, 2017, $0.9 million in realized gains (2016 - $0.7 million in gains) related to these fair value differences were included in energy sales. As at March 31, 2017, Bull Arm Fabrication had 11 foreign exchange forward contracts remaining, with a notional value of $14.8 million USD and an average rate of $1.32 CAD per USD. As these contracts have all been designated as hedged instruments, changes in fair value have been recorded in other comprehensive income. During 2017, $25.0 thousand in gains (2016 - $0.5 million in losses) have been included in other (income) expense related to the forward contracts and $0.1 million in unrealized losses (2016 - $0.5 million in gains) remain in other comprehensive income. As at March 31, 2017, the fair value of the derivative liabilities presented on the Statement of Financial Position was $0.1 million (December 31, 2016 – $0.3 million). The components of change impacting the carrying value of derivative assets and liabilities for the periods ended March 31, 2017 and 2016 are as follows:
Commodity and forward contracts
Other derivatives Total (millions of Canadian dollars) Level II Level II Level III Level II Level III Balance at January 1, 2017 (5.4) 0.1 0.6 (5.3) 0.6 Purchases - - 0.9 - 0.9 (5.4) 0.1 1.5 (5.3) 1.5 Changes to profit Amortization - - (0.6) - (0.6) Mark-to-market - (0.1) - (0.1) - Total - (0.1) (0.6) (0.1) (0.6) Changes in other comprehensive income Mark-to-market 4.3 - - 4.3 - Settlements realized in profit or loss 0.9 - - 0.9 - Total 5.2 - - 5.2 - Balance at March 31, 2017 (0.2) - 0.9 (0.2) 0.9 Balance at January 1, 2016 1.6 2.0 0.3 3.6 0.3 Purchases - - 1.4 - 1.4 1.6 2.0 1.7 3.6 1.7 Changes to profit Amortization - - (0.3) - (0.3) Mark-to-market 7.0 (2.0) - 5.0 - Settlements (2.7) - - (2.7) - Total 4.3 (2.0) (0.3) 2.3 (0.3) Changes in other comprehensive income Mark-to-market 3.5 - - 3.5 - Settlements realized in profit or loss (3.3) - - (3.3) - Total 0.2 - - 0.2 - Balance at March 31, 2016 6.1 - 1.4 6.1 1.4
16
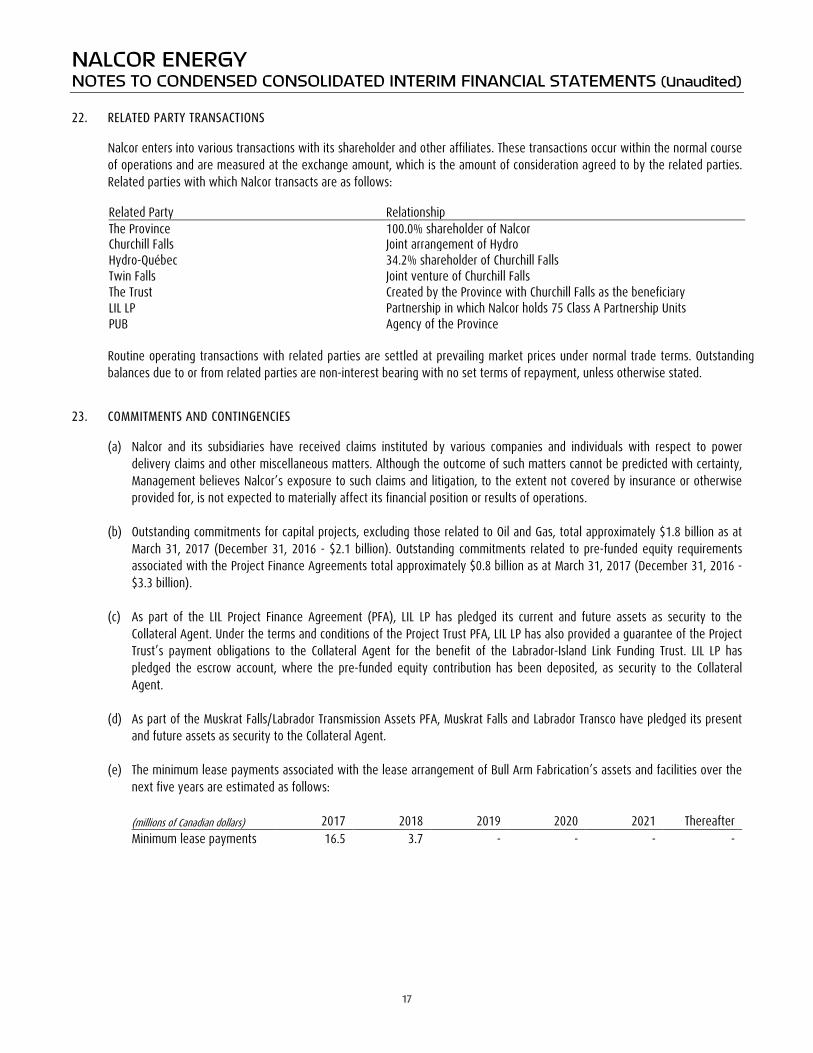
NALCOR ENERGY NOTES TO CONDENSED CONSOLIDATED INTERIM FINANCIAL STATEMENTS (Unaudited) 22. RELATED PARTY TRANSACTIONS
Nalcor enters into various transactions with its shareholder and other affiliates. These transactions occur within the normal course of operations and are measured at the exchange amount, which is the amount of consideration agreed to by the related parties. Related parties with which Nalcor transacts are as follows:
Related Party Relationship The Province 100.0% shareholder of Nalcor Churchill Falls Joint arrangement of Hydro Hydro-Québec 34.2% shareholder of Churchill Falls Twin Falls Joint venture of Churchill Falls The Trust Created by the Province with Churchill Falls as the beneficiary LIL LP Partnership in which Nalcor holds 75 Class A Partnership Units PUB Agency of the Province
Routine operating transactions with related parties are settled at prevailing market prices under normal trade terms. Outstanding balances due to or from related parties are non-interest bearing with no set terms of repayment, unless otherwise stated.
23. COMMITMENTS AND CONTINGENCIES
(a) Nalcor and its subsidiaries have received claims instituted by various companies and individuals with respect to power delivery claims and other miscellaneous matters. Although the outcome of such matters cannot be predicted with certainty, Management believes Nalcor’s exposure to such claims and litigation, to the extent not covered by insurance or otherwise provided for, is not expected to materially affect its financial position or results of operations.
(b) Outstanding commitments for capital projects, excluding those related to Oil and Gas, total approximately $1.8 billion as at March 31, 2017 (December 31, 2016 - $2.1 billion). Outstanding commitments related to pre-funded equity requirements associated with the Project Finance Agreements total approximately $0.8 billion as at March 31, 2017 (December 31, 2016 - $3.3 billion).
(c) As part of the LIL Project Finance Agreement (PFA), LIL LP has pledged its current and future assets as security to the
Collateral Agent. Under the terms and conditions of the Project Trust PFA, LIL LP has also provided a guarantee of the Project Trust’s payment obligations to the Collateral Agent for the benefit of the Labrador-Island Link Funding Trust. LIL LP has pledged the escrow account, where the pre-funded equity contribution has been deposited, as security to the Collateral Agent.
(d) As part of the Muskrat Falls/Labrador Transmission Assets PFA, Muskrat Falls and Labrador Transco have pledged its present
and future assets as security to the Collateral Agent.
(e) The minimum lease payments associated with the lease arrangement of Bull Arm Fabrication’s assets and facilities over the next five years are estimated as follows:
(millions of Canadian dollars) 2017 2018 2019 2020 2021 Thereafter Minimum lease payments 16.5 3.7 - - - -
17
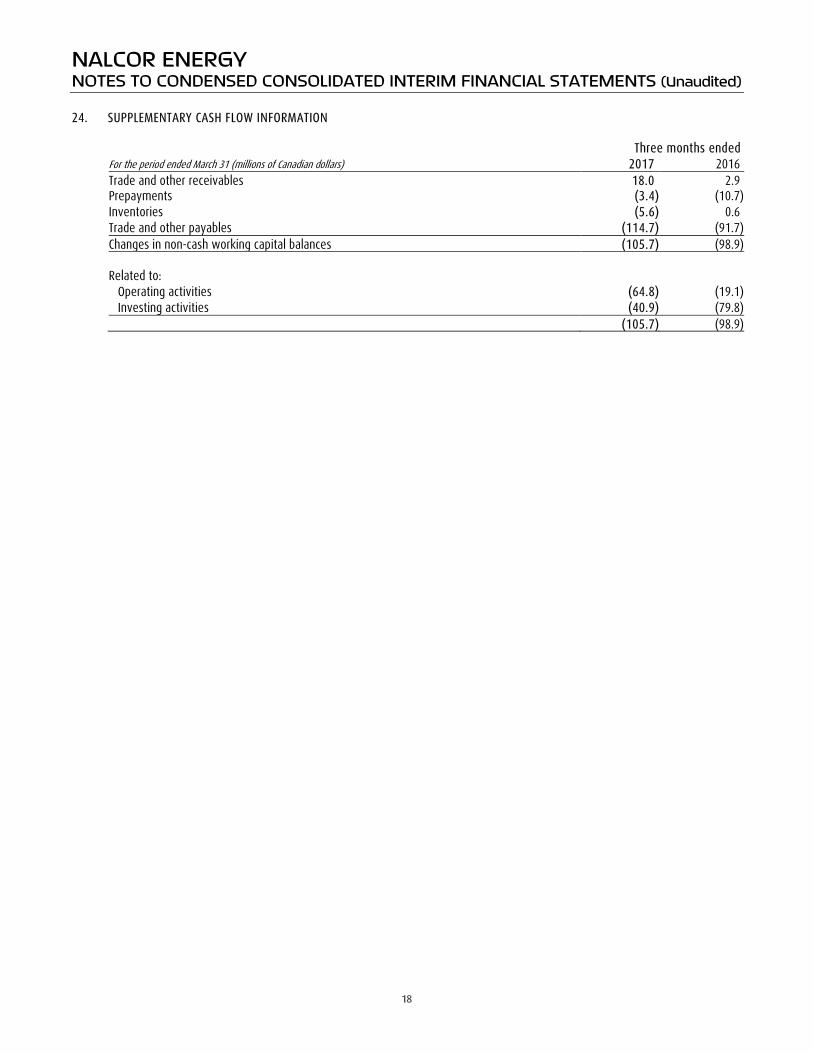
NALCOR ENERGY NOTES TO CONDENSED CONSOLIDATED INTERIM FINANCIAL STATEMENTS (Unaudited) 24. SUPPLEMENTARY CASH FLOW INFORMATION Three months ended For the period ended March 31 (millions of Canadian dollars) 2017 2016 Trade and other receivables 18.0 2.9 Prepayments (3.4) (10.7) Inventories (5.6) 0.6 Trade and other payables (114.7) (91.7) Changes in non-cash working capital balances (105.7) (98.9) Related to: Operating activities (64.8) (19.1) Investing activities (40.9) (79.8) (105.7) (98.9)
18
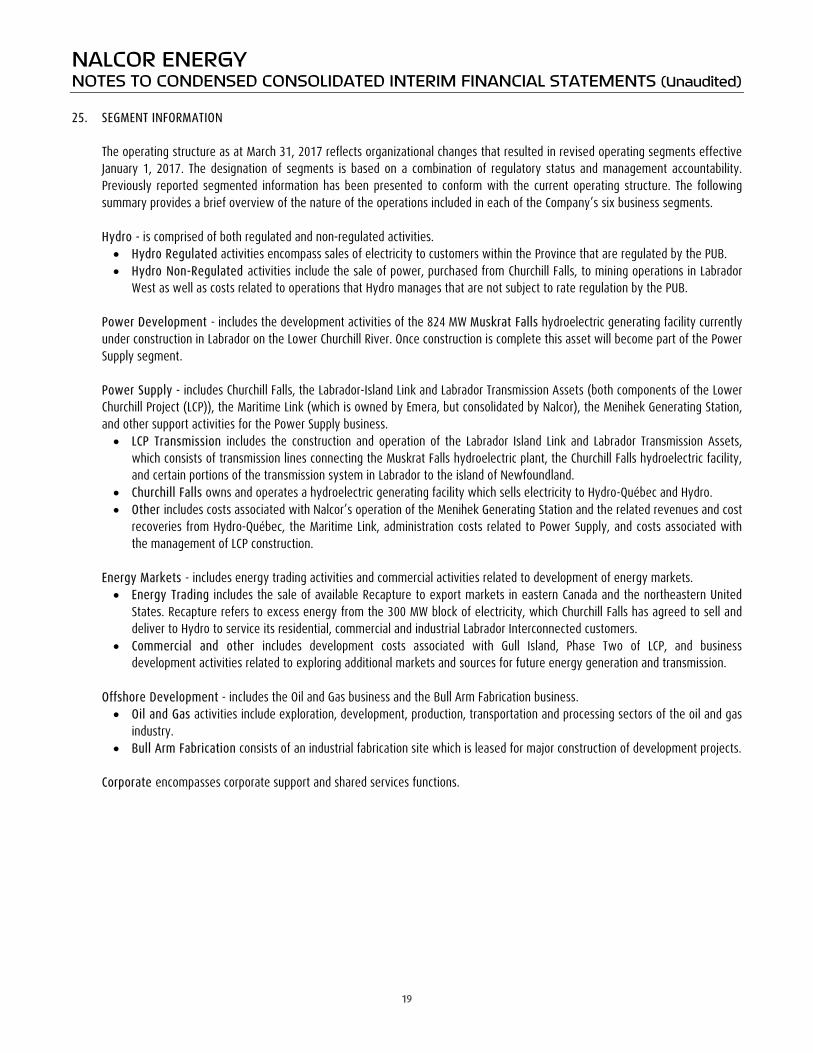
NALCOR ENERGY NOTES TO CONDENSED CONSOLIDATED INTERIM FINANCIAL STATEMENTS (Unaudited) 25. SEGMENT INFORMATION
The operating structure as at March 31, 2017 reflects organizational changes that resulted in revised operating segments effective January 1, 2017. The designation of segments is based on a combination of regulatory status and management accountability. Previously reported segmented information has been presented to conform with the current operating structure. The following summary provides a brief overview of the nature of the operations included in each of the Company’s six business segments. Hydro - is comprised of both regulated and non-regulated activities.
• Hydro Regulated activities encompass sales of electricity to customers within the Province that are regulated by the PUB. • Hydro Non-Regulated activities include the sale of power, purchased from Churchill Falls, to mining operations in Labrador
West as well as costs related to operations that Hydro manages that are not subject to rate regulation by the PUB. Power Development - includes the development activities of the 824 MW Muskrat Falls hydroelectric generating facility currently under construction in Labrador on the Lower Churchill River. Once construction is complete this asset will become part of the Power Supply segment. Power Supply - includes Churchill Falls, the Labrador-Island Link and Labrador Transmission Assets (both components of the Lower Churchill Project (LCP)), the Maritime Link (which is owned by Emera, but consolidated by Nalcor), the Menihek Generating Station, and other support activities for the Power Supply business.
• LCP Transmission includes the construction and operation of the Labrador Island Link and Labrador Transmission Assets, which consists of transmission lines connecting the Muskrat Falls hydroelectric plant, the Churchill Falls hydroelectric facility, and certain portions of the transmission system in Labrador to the island of Newfoundland.
• Churchill Falls owns and operates a hydroelectric generating facility which sells electricity to Hydro-Québec and Hydro. • Other includes costs associated with Nalcor’s operation of the Menihek Generating Station and the related revenues and cost
recoveries from Hydro-Québec, the Maritime Link, administration costs related to Power Supply, and costs associated with the management of LCP construction.
Energy Markets - includes energy trading activities and commercial activities related to development of energy markets.
• Energy Trading includes the sale of available Recapture to export markets in eastern Canada and the northeastern United States. Recapture refers to excess energy from the 300 MW block of electricity, which Churchill Falls has agreed to sell and deliver to Hydro to service its residential, commercial and industrial Labrador Interconnected customers.
• Commercial and other includes development costs associated with Gull Island, Phase Two of LCP, and business development activities related to exploring additional markets and sources for future energy generation and transmission.
Offshore Development - includes the Oil and Gas business and the Bull Arm Fabrication business.
• Oil and Gas activities include exploration, development, production, transportation and processing sectors of the oil and gas industry.
• Bull Arm Fabrication consists of an industrial fabrication site which is leased for major construction of development projects. Corporate encompasses corporate support and shared services functions.
19
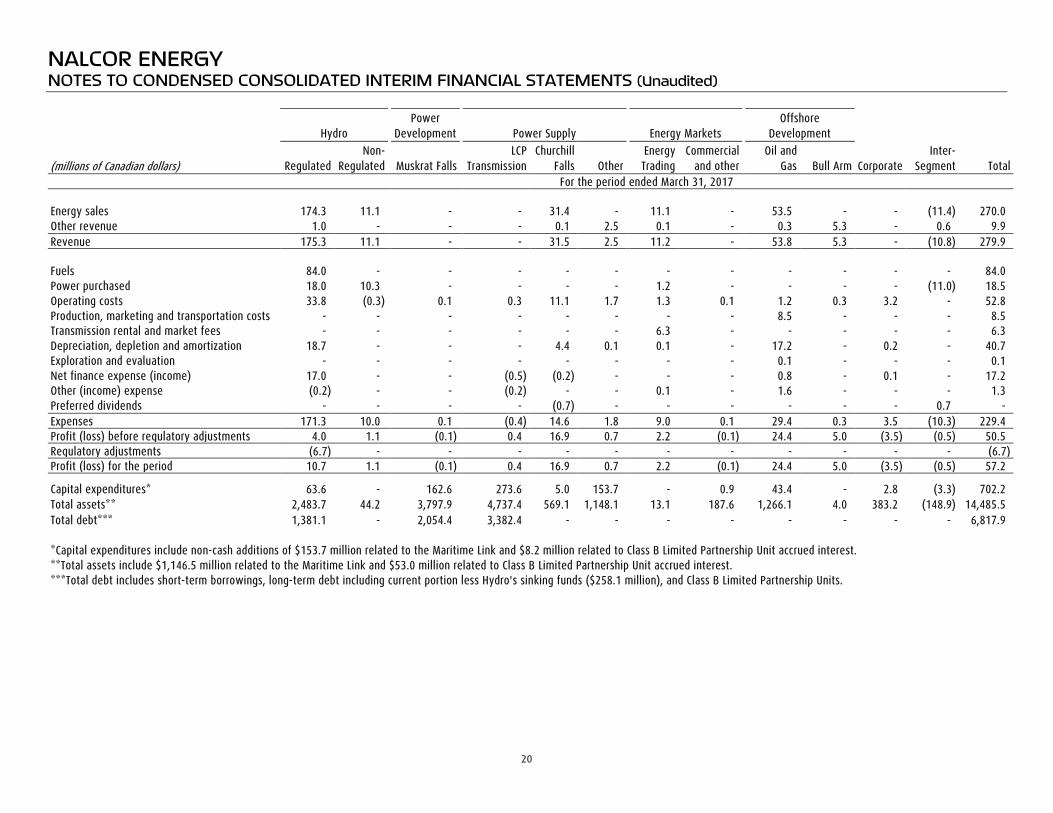
NALCOR ENERGY NOTES TO CONDENSED CONSOLIDATED INTERIM FINANCIAL STATEMENTS (Unaudited)
Hydro Power
Development Power Supply Energy Markets Offshore
Development
(millions of Canadian dollars) Regulated Non-
Regulated Muskrat Falls LCP
Transmission Churchill
Falls Other Energy
Trading Commercial
and other Oil and
Gas Bull Arm Corporate Inter-
Segment Total For the period ended March 31, 2017 Energy sales 174.3 11.1 - - 31.4 - 11.1 - 53.5 - - (11.4) 270.0 Other revenue 1.0 - - - 0.1 2.5 0.1 - 0.3 5.3 - 0.6 9.9 Revenue 175.3 11.1 - - 31.5 2.5 11.2 - 53.8 5.3 - (10.8) 279.9 Fuels 84.0 - - - - - - - - - - - 84.0 Power purchased 18.0 10.3 - - - - 1.2 - - - - (11.0) 18.5 Operating costs 33.8 (0.3) 0.1 0.3 11.1 1.7 1.3 0.1 1.2 0.3 3.2 - 52.8 Production, marketing and transportation costs - - - - - - - - 8.5 - - - 8.5 Transmission rental and market fees - - - - - - 6.3 - - - - - 6.3 Depreciation, depletion and amortization 18.7 - - - 4.4 0.1 0.1 - 17.2 - 0.2 - 40.7 Exploration and evaluation - - - - - - - - 0.1 - - - 0.1 Net finance expense (income) 17.0 - - (0.5) (0.2) - - - 0.8 - 0.1 - 17.2 Other (income) expense (0.2) - - (0.2) - - 0.1 - 1.6 - - - 1.3 Preferred dividends - - - - (0.7) - - - - - - 0.7 - Expenses 171.3 10.0 0.1 (0.4) 14.6 1.8 9.0 0.1 29.4 0.3 3.5 (10.3) 229.4 Profit (loss) before regulatory adjustments 4.0 1.1 (0.1) 0.4 16.9 0.7 2.2 (0.1) 24.4 5.0 (3.5) (0.5) 50.5 Regulatory adjustments (6.7) - - - - - - - - - - - (6.7) Profit (loss) for the period 10.7 1.1 (0.1) 0.4 16.9 0.7 2.2 (0.1) 24.4 5.0 (3.5) (0.5) 57.2
Capital expenditures* 63.6 - 162.6 273.6 5.0 153.7 - 0.9 43.4 - 2.8 (3.3) 702.2 Total assets** 2,483.7 44.2 3,797.9 4,737.4 569.1 1,148.1 13.1 187.6 1,266.1 4.0 383.2 (148.9) 14,485.5 Total debt*** 1,381.1 - 2,054.4 3,382.4 - - - - - - - - 6,817.9 *Capital expenditures include non-cash additions of $153.7 million related to the Maritime Link and $8.2 million related to Class B Limited Partnership Unit accrued interest. **Total assets include $1,146.5 million related to the Maritime Link and $53.0 million related to Class B Limited Partnership Unit accrued interest. ***Total debt includes short-term borrowings, long-term debt including current portion less Hydro's sinking funds ($258.1 million), and Class B Limited Partnership Units.
20
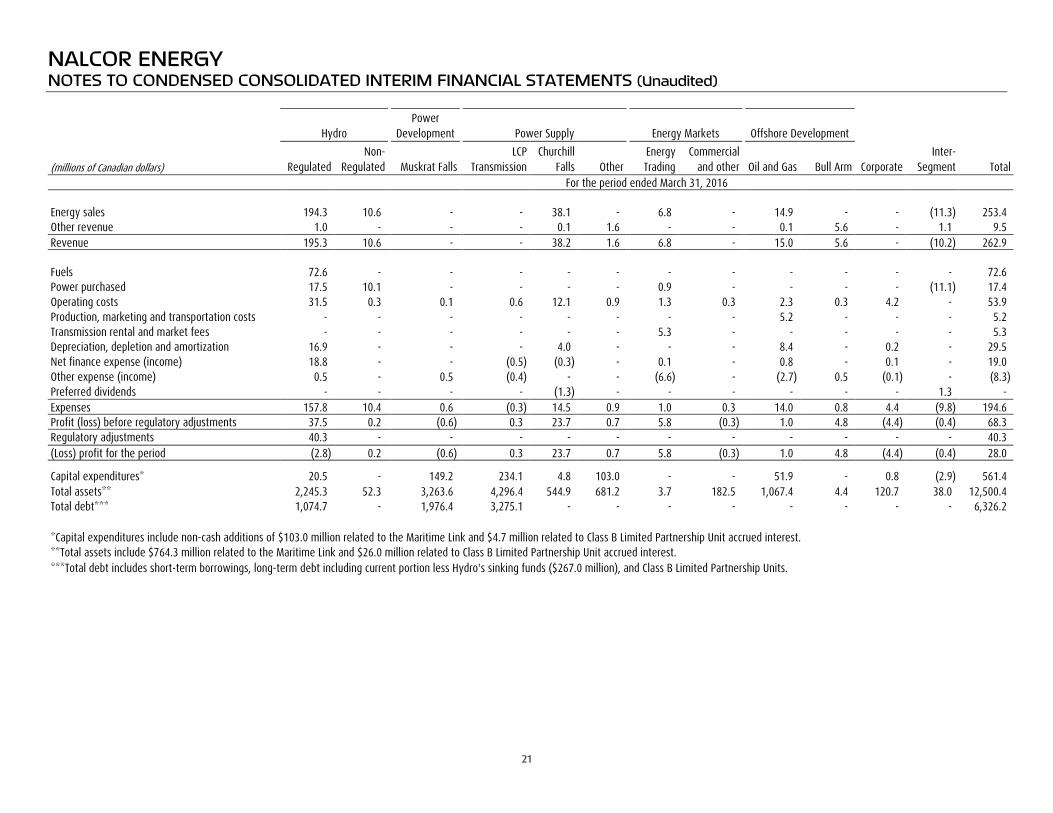
NALCOR ENERGY NOTES TO CONDENSED CONSOLIDATED INTERIM FINANCIAL STATEMENTS (Unaudited)
Hydro Power
Development Power Supply Energy Markets Offshore Development
(millions of Canadian dollars) Regulated Non-
Regulated Muskrat Falls LCP
Transmission Churchill
Falls Other Energy Trading
Commercial and other Oil and Gas Bull Arm Corporate
Inter-Segment Total
For the period ended March 31, 2016 Energy sales 194.3 10.6 - - 38.1 - 6.8 - 14.9 - - (11.3) 253.4 Other revenue 1.0 - - - 0.1 1.6 - - 0.1 5.6 - 1.1 9.5 Revenue 195.3 10.6 - - 38.2 1.6 6.8 - 15.0 5.6 - (10.2) 262.9 Fuels 72.6 - - - - - - - - - - - 72.6 Power purchased 17.5 10.1 - - - - 0.9 - - - - (11.1) 17.4 Operating costs 31.5 0.3 0.1 0.6 12.1 0.9 1.3 0.3 2.3 0.3 4.2 - 53.9 Production, marketing and transportation costs - - - - - - - - 5.2 - - - 5.2 Transmission rental and market fees - - - - - - 5.3 - - - - - 5.3 Depreciation, depletion and amortization 16.9 - - - 4.0 - - - 8.4 - 0.2 - 29.5 Net finance expense (income) 18.8 - - (0.5) (0.3) - 0.1 - 0.8 - 0.1 - 19.0 Other expense (income) 0.5 - 0.5 (0.4) - - (6.6) - (2.7) 0.5 (0.1) - (8.3) Preferred dividends - - - - (1.3) - - - - - - 1.3 - Expenses 157.8 10.4 0.6 (0.3) 14.5 0.9 1.0 0.3 14.0 0.8 4.4 (9.8) 194.6 Profit (loss) before regulatory adjustments 37.5 0.2 (0.6) 0.3 23.7 0.7 5.8 (0.3) 1.0 4.8 (4.4) (0.4) 68.3 Regulatory adjustments 40.3 - - - - - - - - - - - 40.3 (Loss) profit for the period (2.8) 0.2 (0.6) 0.3 23.7 0.7 5.8 (0.3) 1.0 4.8 (4.4) (0.4) 28.0
Capital expenditures* 20.5 - 149.2 234.1 4.8 103.0 - - 51.9 - 0.8 (2.9) 561.4 Total assets** 2,245.3 52.3 3,263.6 4,296.4 544.9 681.2 3.7 182.5 1,067.4 4.4 120.7 38.0 12,500.4 Total debt*** 1,074.7 - 1,976.4 3,275.1 - - - - - - - - 6,326.2 *Capital expenditures include non-cash additions of $103.0 million related to the Maritime Link and $4.7 million related to Class B Limited Partnership Unit accrued interest. **Total assets include $764.3 million related to the Maritime Link and $26.0 million related to Class B Limited Partnership Unit accrued interest. ***Total debt includes short-term borrowings, long-term debt including current portion less Hydro's sinking funds ($267.0 million), and Class B Limited Partnership Units.
21
NALCOR ENERGY NOTES TO CONDENSED CONSOLIDATED INTERIM FINANCIAL STATEMENTS (Unaudited) 26. SUBSEQUENT EVENTS
In August 2016, Churchill Falls received judgment from the Québec Court of Appeal upholding the 2014 Québec Superior Court ruling on the motion filed by Churchill Falls to address the inequities of the pricing terms of the 1969 Power Contract between Churchill Falls and Hydro-Québec. The Court ruled against Churchill Falls. On April 20, 2017 Churchill Falls was granted leave to appeal the case to the Supreme Court of Canada. A hearing date is anticipated to be scheduled within 12 months. On April 25, 2017, the expiry date of Nalcor's $250.0 million committed revolving term facility was extended to January 31, 2019. In December 2016, Hydro received Board Order No. P.U. 49 (2016) (the GRA Order) in relation to its General Rate Application. In January 2017, Hydro filed an application with the PUB seeking approval of final customer rates in compliance with the GRA Order. On May 1, 2017, Hydro received Board Order No. P.U. 14 (2017). While this Order provided additional clarity surrounding certain components of the Order requested by Hydro, additional regulatory process is required prior to the determination of final customer rates and any financial statement impact.
22