2016 Q1 FINANCIAL REPORT - Nalcor Energy · • Debt to capital ratio of 64.1% as at ... DISCUSSION...
64
2016 Q1 FINANCIAL REPORT
Transcript of 2016 Q1 FINANCIAL REPORT - Nalcor Energy · • Debt to capital ratio of 64.1% as at ... DISCUSSION...
2016 Q1 FINANCIAL REPORT

OUR VALUES: OPEN COMMUNICATION . ACCOUNTABILITY . SAFETY . HONESTY AND TRUST . TEAMWORK . RESPECT AND DIGNITY . LEADERSHIP
KEY HIGHLIGHTS
For the period ended March 31 2016 2015
Revenue (millions of dollars) 263.0 286.0
Profit (millions of dollars) 28.0 29.3
Operating profit (millions of dollars) 1 35.0 29.3
Funds from operations (FFO) 1 (millions of dollars) 66.5 53.5
Earnings before interest, taxes, depreciation, depletion,
amortization and accretion (EBITDA) 1 (millions of dollars) 82.4 69.1
Return on capital employed (ROCE) 4.40% 4.10%
Oil production (bbls) 336,234 114,258
Realized oil price (CAD/bbl) 54.29 85.05
Electricity sales (GWh):
Regulated 2,641 2,763
Export – Hydro Québec 9,840 10,307
Export – other markets 317 286
Realized electricity price –Other Export Markets (CAD/MWh) 29.69 54.82
Capital expenditures (millions of dollars) 558.9 494.1 As at March 31, 2016 December 31, 2015
Total assets (millions of dollars) 12,483.6 12,321.7
Capital assets, net (millions of dollars) 8,848.8 8,317.6
Long-term debt (net of sinking funds) (millions of dollars) 5,759.6 5,765.5
Shareholder’s equity (millions of dollars) 3,547.1 3,455.6
Debt to capital 64.1% 64.6%
FINANCIAL OVERVIEW • Profit for the period decreased by $1.3 million compared to the same period in 2015, largely due to:
• increased loss in Hydro Regulated of $1.2 million as a result of:
• higher costs associated with gas turbine fuel;
• Prudence Order adjustments;
• partially offset by:
• lower operating costs
• Operating profit for the period was $5.7 million higher than the same period in 2015 largely due to:
• higher oil production;
• lower operating costs;
• lower power purchased in Hydro Regulated;
• gain on settlement of commodity swaps;
• partially offset by:
• lower realized oil prices;
• higher costs associated with gas turbine fuel;
• decreased revenue; and
• increased depreciation, depletion and amortization.
• Continued the execution of Nalcor’s capital plan. Capital expenditures for the period totaled $558.9 million, a 13.1% increase over the same period
in 2015.
• Total assets continue to grow; $12.5 billion as at March 31, 2016, an increase of $0.2 billion over December 31, 2015.
• FFO for the period of $66.5 million, a $13.0 million improvement compared to the same period in 2015.
• EBITDA for the period of $77.7 million, a $10.3 million improvement compared to the same period in 2015.
• Debt to capital ratio of 64.1% as at March 31, 2016, a marginal improvement from December 31, 2015.
1 See Section 8 – Non-GAAP Financial Measures

NALCOR ENERGY 2016 Q1 FINANCIAL REPORT 01
TABLE OF CONTENTS
NALCOR ENERGY
Hydro Place. 500 Columbus Drive
P.O. Box 12800. St. John’s. NL
Canada A1B 0C9
T. 709.737.1440
F. 709.737.1800
W. nalcorenergy.com
HEAD OFFICE
02 MANAGEMENT’S DISCUSSION & ANALYSIS
33 CONDENSED CONSOLIDATED INTERIM FINANCIAL STATEMENTS (Unaudited)
60 EXECUTIVE LEADERSHIP TEAM, DIRECTORS & OFFICERS
Our vision is to build a strong economic
future for successive generations of
Newfoundlanders and Labradorians.
NALCOR ENERGY 2016 Q1 FINANCIAL REPORT02
TABLE OF CONTENTS
03 Section 1: Corporate Overview
04 Section 2: Significant Items and Recent Developments
10 Section 3: Consolidated Financial Highlights
13 Section 4: Segmented Results and Analysis
23 Section 5: Liquidity and Capital Resources
29 Section 6: Risk Management Process
29 Section 7: Accounting Policies and Significant Accounting Judgments,
Estimates and Assumptions
30 Section 8: Non-GAAP Financial Measures
30 Section 9: Summary of Quarterly Results
31 Section 10: Outlook
32 Section 11 : Abbreviations
MANAGEMENT’S DISCUSSION & ANALYSISFOR THE THREE MONTHS ENDED MARCH 31 , 2016

NALCOR ENERGY 2016 Q1 FINANCIAL REPORT 03
SECTION 1: CORPORATE OVERVIEW
Nalcor Energy (Nalcor or the Company) is a Crown corporation established in 2007 under a special act of the Legislature of the Province of
Newfoundland and Labrador (the Province). Nalcor’s business includes the development, generation, transmission and sale of electricity;
the exploration, development, production and sale of oil and gas; energy marketing; and, industrial fabrication site management.
Nalcor’s legal structure as at March 31, 2016 included the entities listed below:
Entity Name Description of Interest
Newfoundland and Labrador Hydro (Hydro) Wholly owned subsidiary
Nalcor Energy – Oil and Gas Inc. (Oil and Gas) Wholly owned subsidiary
Nalcor Energy – Bull Arm Fabrication Inc. (Bull Arm Fabrication) Wholly owned subsidiary
Nalcor Energy Marketing Corporation (Energy Marketing) Wholly owned subsidiary
Muskrat Falls Corporation (Muskrat Falls) Wholly owned subsidiary
Labrador Transmission Corporation (Labrador Transco) Wholly owned subsidiary
Labrador-Island Link Holding Corporation (LIL Holdco) Wholly owned subsidiary
Labrador-Island Link General Partner Corporation (LIL GP) Wholly owned subsidiary
Labrador-Island Link Operating Corporation (LIL OpCo) Wholly owned subsidiary
Lower Churchill Management Corporation (LCMC) Wholly owned subsidiary
Churchill Falls (Labrador) Corporation Limited (Churchill Falls) 65.8% owned joint operation of Hydro
Twin Falls Power Corporation Limited (Twin Falls) 33.3% owned joint venture of Churchill Falls
Labrador-Island Link Limited Partnership (LIL LP) Limited partnership in which Nalcor, through LIL Holdco, owns
100% of the 75 Class A limited partnership units
Gull Island Power Corporation (GIPCo) Wholly owned subsidiary (inactive)
Lower Churchill Development Corporation (LCDC) 51% owned subsidiary of Hydro (inactive)
Nalcor is leading the development of the province’s energy resources and has a corporate-wide framework that facilitates the prudent
management of its assets while continuing an unwavering focus on the safety of its employees, contractors and the public.
Nalcor has segregated its business into seven reporting segments. Segregation of business segments allows Management to evaluate
operational performance and assess the overall contribution of each segment to Nalcor’s long-term objectives. The designation of
segments has been based on a combination of regulatory status and management accountability. The following summary provides a
brief overview of the nature of the operations included in each of the Company’s business segments.
1. Hydro Regulated generates, transmits and distributes electricity to customers within Newfoundland and Labrador.
2. Churchill Falls owns and operates the Churchill Falls Generating Station, one of the largest power generation plants in the world.
3. Oil and Gas holds and manages both onshore and offshore oil and gas interests and conducts exploration in Newfoundland
and Labrador.
4. Energy Marketing markets and trades the province’s surplus energy in markets in Canada and the United States (US).
5. Bull Arm Fabrication consists of an industrial fabrication site which is currently leased for a major construction project.
6. Phase 1 Lower Churchill Project (Lower Churchill Project, LCP) includes construction of the Muskrat Falls hydroelectric plant, the
Labrador Transmission Assets, the Labrador-Island Link and the Maritime Link between the island of Newfoundland and Nova Scotia.
7. Corporate and Other Activities encompasses corporate support functions, shared services, business development activities and
certain development projects not yet sanctioned, including Phase 2 of the Lower Churchill Project (Gull Island).
MANAGEMENT’S DISCUSSION & ANALYSISFOR THE THREE MONTHS ENDED MARCH 31 , 2016
NALCOR ENERGY 2016 Q1 FINANCIAL REPORT04
Nalcor maintains appropriate systems of internal control, policies and procedures which provide Management with reasonable assurance
that assets are safeguarded and its financial information is reliable. The following discussion and analysis is the responsibility of
Management and is as at May 12, 2016. The Board of Directors carries out its responsibility for review of this disclosure principally
through its Audit Committee, comprised exclusively of independent directors.
This MD&A should be read in conjunction with the unaudited condensed consolidated interim financial statements of Nalcor for the three
months ended March 31, 2016 and Nalcor’s annual audited consolidated financial statements for the year ended December 31, 2015.
Basis of Presentation
Unless otherwise noted, all financial information has been prepared in accordance with International Financial Reporting Standards (IFRS)
as issued by the International Accounting Standards Board.
All financial information is reported in Canadian dollars (CAD), unless otherwise noted.
Non-GAAP Financial Measures
Certain financial measures in this MD&A are not prescribed by IFRS as contained within Part I of the Chartered Professional Accountants
of Canada Handbook. These non-generally accepted accounting principles (Non-GAAP) financial measures are defined in Section 8 - Non-
GAAP Financial Measures.
Forward-Looking Information
Certain statements in this MD&A are forward-looking statements, based on Nalcor’s current expectations, estimates, projections and
assumptions, which are subject to risks and uncertainties. Statements containing words such as “could”, “expect”, “may”, “anticipate”,
“believe”, “intend”, “estimate”, “plan” and similar expressions constitute forward-looking statements. By their nature, forward-looking
statements require Management to make assumptions and are subject to important unknown risks and uncertainties, which may
cause actual results in future periods to differ materially from forecasted results. While Management considers these assumptions to be
reasonable and appropriate based on information currently available, there is a risk that they may not be accurate. Nalcor assumes no
obligation to update or revise any forward-looking statements, whether as a result of new information, future events or any other reason.
SECTION 2: SIGNIFICANT ITEMS AND RECENT DEVELOPMENTS
SIGNIFICANT ITEMS
Key Profit Drivers
Key profit drivers vary across each of Nalcor’s seven business segments as there is a combination of regulated operations, operations
with long-term and medium-term supply contracts and operations in markets where revenues are driven entirely by commodity prices
(electricity and oil). In addition to the effect that oil prices have on Oil and Gas’ operations, Oil and Gas may incur impairment expenses
and future reversal of such expenses due to the nature of oil price fluctuations. Any impairment expense or reversal of such expense is
reflected in Nalcor’s results, and can lead to large fluctuations in profit or loss between financial reporting periods. Also, in the case of the
Oil and Gas segment, cash flow and results of operations are significantly influenced by oil production levels in offshore developments
in which Nalcor holds equity interests. As a result, it is necessary to consider the underlying key profit drivers and performance of each
business segment to understand Nalcor’s consolidated performance.
MANAGEMENT’S DISCUSSION & ANALYSISFOR THE THREE MONTHS ENDED MARCH 31 , 2016

NALCOR ENERGY 2016 Q1 FINANCIAL REPORT 05
Nalcor profitability is also impacted by exchange rate fluctuations for a number of foreign currencies, the most significant being the
CAD/United States Dollar (USD) exchange rate. Nearly all revenue generated by the Oil and Gas, Energy Marketing and Bull Arm business
segments are denominated in USD. Volatility is partially mitigated through USD hedging. However, in general, any fluctuations in the
USD exchange rate have a direct impact on Nalcor’s profit. Various expenses, capital expenditures and Statement of Financial Position
balances include amounts denominated in USD, particularly Hydro’s fuel purchases for the Holyrood Thermal Generating Station (HTGS).
Cost variances for these fuel purchases as a result of exchange rate fluctuations are captured in the Rate Stabilization Plan (RSP) and do
not impact Nalcor’s profit. The average exchange rate for the first three months of 2016 was $1.37 CAD/USD as compared to $1.24 CAD/
USD for the same period in 2015, before the impact of Nalcor’s foreign exchange hedging program.
Statement of Financial Position
Total Assets and Regulatory Deferrals
Q1 2016 - 12.5 billion Q4 2015 - 12.3 billion
OtherAssetsand
RegulatoryDeferrals,
$1.1
Property, Plantand Equipment, $8.8
Investmentsand Restricted
Cash, $2.6
OtherAssetsand
RegulatoryDeferrals,
$1.0
Property, Plantand Equipment, $8.3
Investmentsand Restricted
Cash, $3.0
Nalcor’s total assets and regulatory deferrals as at March 31, 2016 were $12.5 billion, an increase of $0.2 billion from December 31, 2015.
The composition of the Company’s assets as at March 31, 2016 included property, plant and equipment of $8.8 billion (2015 - $8.3 billion),
investments and restricted cash from the proceeds of the Lower Churchill Project financing of $2.6 billion (2015 - $3.0 billion), and other
assets totaling $1.1 billion (2015 - $1.0 billion). The change in assets during 2016 was primarily the result of capital expenditures related
to the Lower Churchill Project, offset by a reduction in investments and restricted cash used to fund said expenditures.
Capital
Year-to-date capital expenditures of $558.9 million related primarily to Lower Churchill Project capital expenditures. Additional details on
Nalcor’s capital expenditures are provided in Section 5 – Liquidity and Capital Resources.
Q1 2016 Profit
Nalcor’s profit for the three months ended March 31, 2016 of $28.0 million represents a decrease of $1.3 million over the same period
in 2015. This decrease primarily related to Hydro Regulated’s profit decrease of $1.2 million, primarily due to higher costs associated
with gas turbine fuel, Prudence Order adjustments and depreciation, depletion and amortization expense. The decrease in profit for the
quarter was partially offset by lower operating costs, increased gains on the settlement of commodity swaps and significant increased
oil production, despite lower oil prices.
MANAGEMENT’S DISCUSSION & ANALYSISFOR THE THREE MONTHS ENDED MARCH 31 , 2016

NALCOR ENERGY 2016 Q1 FINANCIAL REPORT06
RECENT DEVELOPMENTS
HYDRO REGULATED
Hydro Regulated is regulated by the PUB and operates under cost of service regulation, whereby it is entitled to the opportunity to
recover, through customer rates, all reasonable and prudent costs incurred in providing electricity service to its customers. In addition,
Hydro is also entitled to a just and reasonable return on rate base in accordance with Section 80 of the Public Utilities Act.
General Rate Application
Hydro filed a General Rate Application (GRA) in July 2013, using a 2013 test year, requesting a rate adjustment effective January 1, 2014.
Due to the length of time the GRA process required and the delay in obtaining a rate change, in November 2014, Hydro filed an amended
GRA based on 2014 and 2015 test years. The amended GRA filing requested new rates for Industrial Customers (IC) effective January 1,
2015 and the remainder of customer rates effective February 1, 2015.
The public hearing of Hydro’s GRA concluded at the end of November 2015. Final arguments were filed at the end of January 2016 and
Hydro is now awaiting the PUB’s final GRA order.
While Hydro’s GRA application is justified, regulatory risk remains until the PUB provides its final GRA order which is anticipated in the
second quarter of 2016.
Prudence Review
In 2015, the PUB informed Hydro that they would be conducting a “prudence” review of certain Hydro expenditures. This review was
included as part of the PUB’s review of Hydro’s GRA. The review addressed issues that were initially part of an investigation and hearing
into supply issues and power outages on the Island Interconnected system (the Supply Outage Inquiry), as well as the outstanding rate
base and cost recovery requests. There are approximately $156.5 million in capital projects, the largest being cost recovery of the 123
MW combustion turbine located adjacent to the HTGS, and approximately $55.6 million relating to 2014 cost deferrals which the PUB
approved establishing in 2014, but for which cost recovery is subject to this review. Hydro has recorded its best estimate of the impacts
of this order in its March 31, 2016 financial statements.
On April 28, 2016, Hydro received Order No. P.U. 13 (2016) which outlines the results of a Prudence Review of certain projects and
expenditures of Hydro. Hydro has recorded its best estimate of the impact of the Prudence Review on its March 31, 2016 financial results,
based upon Management's initial interpretation of the Order. Hydro will have to provide a compliance filing relating to this Order to the
PUB in the second quarter of 2016. Additional adjustments may be required pending further review and final approval of the Compliance
Order by the PUB.
Standby Fuel Deferral
On February 5, 2016 Hydro filed with the PUB an application to defer additional 2016 Standby Fuel costs as a result of low hydrology.
Hydro historically experienced low precipitation levels in and around its reservoir areas during the period of July 2015 through to the
end of February 2016. Hydro relies on precipitation in these areas to produce electricity from its hydroelectric plants in order to meet
customer’s electricity requirements.
MANAGEMENT’S DISCUSSION & ANALYSISFOR THE THREE MONTHS ENDED MARCH 31 , 2016

NALCOR ENERGY 2016 Q1 FINANCIAL REPORT 07
Currently, Hydro has no approved deferral mechanism to recover additional Standby Fuel consumed in the provision of service to
customers. If the 2016 Standby Fuel Deferral application is approved by the PUB, Hydro would recover approximately $12.9 million that
has been expensed for the period ended March 31, 2016. Hydro is currently awaiting a ruling from the PUB on this application. Any
balance in this proposed account is subject to PUB review and regulatory risk remains surrounding approval of any amount for deferral
and recovery.
Other Regulatory Activity
The Phase II Investigation and Hearing into Supply issues and Power Outages on the Island Interconnected System has begun in 2016.
The focus of this proceeding is on the implications of the interconnection with Muskrat Falls on the reliability and adequacy of the Island
Interconnected system. The PUB has engaged Liberty to provide assistance related to this review. A schedule has been issued for the
proceedings and a hearing is set for September 2016.
CHURCHILL FALLS
Maintenance of key generation and transmission assets is necessary to ensure maximum up-time to supply power and energy to customers.
While the majority of this maintenance is performed between the months of April and October, 100% of maintenance activities for these
assets that were planned for the first quarter were completed.
Winter availability of generating units at Churchill Falls represents a key source of revenue. In the first three months of the year, actual
winter availability was greater than 97% of the maximum available revenue, including 100% of maximum revenue in March. This was the
first time since December 2007 that 100% of maximum monthly revenue was achieved.
A capital rehabilitation program is underway to ensure that the age of the generation and transmission assets does not affect reliability to
customers. In the first quarter, capital expenditures were 92% of planned expenditures for the period while accomplishing the associated
work scope. The forecast for capital work for 2016 remains on time and on budget and indicates tracking with compliance to the
capital plan.
MANAGEMENT’S DISCUSSION & ANALYSISFOR THE THREE MONTHS ENDED MARCH 31 , 2016

NALCOR ENERGY 2016 Q1 FINANCIAL REPORT08
OIL AND GAS
Nalcor and partners continue to evaluate options for the White Rose Extension Project, including both subsea and wellhead platform
concepts. Drilling at the White Rose field is expected to resume in Q2 2016 with the Henry Goodrich drill rig. The current drilling
plan includes a continuation of the North Amethyst producer in the Hibernia formation and the continuation of the South White Rose
Extension scope.
At Hibernia Southern Extension (HSE), drilling continues on the remaining subsea water injectors to support production from existing oil
producers. Completion of the third and fourth operational water injectors is expected in Q2 and Q3, respectively.
Continued progress on the Hebron project, in both Newfoundland and Labrador and Korea, has been made towards a 2017 tow of the
Hebron Gravity Based Structure (GBS) to the field. Integration of the Derrick Equipment Set and Drilling Support Module has begun, and
mechanical completion of the remaining modules is expected by mid-2016. With GBS slip-forming operations complete, final mechanical
outfitting of the structure continues at the Bull Arm deep water site.
In January 2016, Nalcor signed an agreement with Beicip-Franlab to conduct a resource assessment of the 2016 license round in the
Orphan Basin. This resource assessment will be completed in Q3 and the results will be publicly announced in August, ahead of the closing
of the 2016 Call for Bids in November as part of the Schedule Land Tenure Regime. The Q4 2015 resource assessment demonstrated
impressive results as Nalcor Energy and Beicip-Franlab announced that the “in place” oil and gas resource potential was 12 billion barrels
of oil and 113 trillion cubic feet of gas for the 11 parcels available for bid in the Flemish Pass Call for Bids.
ENERGY MARKETING
Energy Marketing’s activities focused on expanding physical and financial transmission rights to increase access to the New England
and New York markets. Over the quarter, Energy Marketing acquired firm transmission service on the Phase I/II interface between
Quebec and New England, and successfully participated in New York Independent System Operator’s seasonal financial transmission
rights auction.
BULL ARM
In preparation for the conclusion of the Hebron project, Bull Arm is in the process of developing an Expression of Interest to assess and
quantify the opportunities for the site post-Hebron.
LOWER CHURCHILL PROJECT
As of September 2015, the capital cost forecast for the Muskrat Falls Generation Facility, Labrador Transmission Assets and Labrador-
Island Link components of the Lower Churchill Project was $7.65 billion. At Nalcor Energy’s Annual General Meeting, held on March 24,
2016, it was noted that cost and schedule for the project are both under review.
During the construction period, it is estimated that $9.0 million dollars is returned to the provincial economy each week through
wages and business opportunities. With work advancing on more than 100 locations across the province and around the globe, the
Lower Churchill Project has made significant construction progress throughout the first quarter of 2016. Major highlights include
the following:
MANAGEMENT’S DISCUSSION & ANALYSISFOR THE THREE MONTHS ENDED MARCH 31 , 2016

NALCOR ENERGY 2016 Q1 FINANCIAL REPORT 09
Muskrat Falls Generation Facility
• Concrete placement and activities recommenced at the powerhouse, spillway, transition dams and intake structures. To the end of
March, approximately 153,000 cubic meters of concrete have been poured for the facilities by Astaldi Canada.
• The Integrated Cover System was removed, thereby allowing reconfiguration of cranes to better support powerhouse construction.
• Continued progress on the manufacturing of the gates, turbines and generators by Andritz Hydro Canada (Andritz), now 73%
complete. Andritz also continued work on the primary anchor materials for the intake, powerhouse and spillway and delivered the
Hoist Tower steel in March.
• Construction activities for the North and South Dams recommenced and included work on the spillway bridge installation.
Labrador-Island Link
• A major milestone was reached on January 29 with the completion of the High Voltage direct current (HVdc) transmission line access
road through the interior of Labrador from Muskrat Falls to the south of Forteau.
• Continued progress achieved on the HVdc transmission line right-of-way (ROW) clearing and tower assembly. By the end of March,
100% of the ROW was cleared, 58% of the foundations were installed, 75% of the towers were assembled, 43% were erected and
22% of the conductor wire was strung in Labrador. On the island, 63% of the ROW was cleared and work began on the installation
of foundations and the assembly of towers.
• All steel components for the HVdc towers have been delivered to the province.
• The Strait of Belle Isle submarine cable arrived safely in Norway from Japan.
• Civil construction works continued on the synchronous condensers facility located at Soldiers Pond with the building now completely
enclosed, interior work progressing and fabrication of the Stator Frame and Rotor Rim/Flywheel progressing as planned.
• Continued civil work and building construction on the converter stations at Soldiers Pond and Muskrat Falls including foundation
work and Valve Hall steel erection and exterior cladding.
Labrador Transmission Assets
• High Voltage alternating current transmission construction and tower erection between Muskrat Falls and Churchill Falls is
substantially completed. By the end of March, 100% of the foundations were installed, 99% of the towers were assembled, 98%
were erected and 93% of conductor stringing was completed.
• Civil work construction continued on the alternating current substations at the Muskrat Falls and Churchill Falls switchyard sites. This
includes final pad placement of the transformer units with all materials on site or in storage for both switchyards.
MANAGEMENT’S DISCUSSION & ANALYSISFOR THE THREE MONTHS ENDED MARCH 31 , 2016

NALCOR ENERGY 2016 Q1 FINANCIAL REPORT10
SECTION 3: CONSOLIDATED FINANCIAL HIGHLIGHTS
CONSOLIDATED STATEMENT OF PROFIT AND COMPREHENSIVE INCOME HIGHLIGHTS
Three months ended
For the period ended March 31 (millions of dollars) 2016 2015 Variance
Revenue 263.0 286.0 (23.0)
Fuels 72.6 81.3 8.7
Power purchased 17.6 18.2 0.6
Operating costs 59.1 63.0 3.9
Production costs 5.2 3.1 (2.1)
Depreciation, depletion and amortization 29.5 22.9 (6.6)
Exploration and evaluation - 0.2 0.2
Net finance (income) expense 19.0 18.0 (1.0)
Other (income) expense (8.3) 2.3 10.6
Profit before regulatory adjustments 68.3 77.0 (8.7)
Regulatory adjustments 40.3 47.7 7.4
Profit for the period 28.0 29.3 (1.3)
Other comprehensive income for the period 0.9 13.5 (12.6)
Total comprehensive income for the period 28.9 42.8 (13.9)
Non-GAAP Operating Profit Disclosure
Reconciliation of Nalcor’s profit to operating profit for the three months ended March 31 is as follows:
Three months ended
For the period ended March 31 (millions of dollars) 2016 2015 Variance
Profit for the period 28.0 29.3 (1.3)
Prudence Order adjustment 7.0 - 7.0
Operating profit for the period 35.0 29.3 5.7
Revenue
The decrease in revenue for the quarter was primarily due to a decrease in Hydro Regulated, primarily due to lower RSP recovery
resulting from the normal operation of the RSP and lower utility consumption, partially offset by increased revenue as a result of the
implementation of interim rates combined with higher demand revenue; a decrease in Energy Marketing due to a decrease in export
market prices; partially offset by an increase in Oil and Gas due to increased HSE production volumes.
Fuels
The decrease in fuel costs for the quarter was primarily due to a lower price per barrel of No. 6 fuel as a result of lower oil prices. The
majority of this variance is offset through the RSP 1 in the regulatory adjustments line. The decrease is partially offset by increased gas
turbine fuel costs related to the operation of the Holyrood CT.
1 The RSP primarily provides for the deferral of fuel expense variances resulting from changes in No. 6 fuel prices, hydrology, load and associated interest. Items not stabilized through the RSP include demand revenue, rural sales volume, customer rate, diesel fuel, gas turbine fuel, power purchases, fuel efficiency and transmission loss variances.
MANAGEMENT’S DISCUSSION & ANALYSISFOR THE THREE MONTHS ENDED MARCH 31 , 2016

NALCOR ENERGY 2016 Q1 FINANCIAL REPORT 11
Operating costs
The decrease in operating costs for the quarter was primarily due to lower costs in Hydro Regulated related to system equipment
and maintenance, professional services and travel, as well as timing differences associated with capital labour, along with decreased
professional fees and marketing fees recognized in Energy Marketing resulting from operations moving in-house in Q2 2015.
Production costs
The increase in production costs for the quarter was primarily due to an increase in production volumes compared to Q1 2015.
Depreciation, depletion and amortization
The increase in depreciation, depletion and amortization for the quarter was primarily due to increased Oil and Gas depletion associated
with HSE due to higher production volumes compared to the same period in 2015, as well as increased depreciation in Hydro Regulated
due to increased levels of investment in property, plant and equipment.
Other (income) expense
The favourable variance in other (income) expense for the quarter was primarily due to gains on commodity hedge contracts and
reduced volatility on foreign exchange contracts in Energy Marketing, due to the implementation of hedge accounting, as well as gains
on the settlement of oil commodity contracts in Oil and Gas.
Regulatory adjustments
Regulatory adjustments decreased for the quarter primarily due to a reduction in RSP amortization, partially offset by higher deferred
fuel costs resulting from the normal operation of the RSP and changes to the regulatory deferrals primarily related to the Prudence
Review Order from the PUB.
MANAGEMENT’S DISCUSSION & ANALYSISFOR THE THREE MONTHS ENDED MARCH 31 , 2016

NALCOR ENERGY 2016 Q1 FINANCIAL REPORT12
CONSOLIDATED STATEMENT OF FINANCIAL POSITION HIGHLIGHTS
Significant changes in the Consolidated Statement of Financial Position between March 31, 2016 and December 31, 2015 include:
(millions of dollars) Increase ASSETS (Decrease) Explanation
Cash and cash equivalents (47.0) See Section 5 - Liquidity and Capital Resources Section.
Restricted cash (52.2) Decreased due to LCP funding activity from cash held in accounts administered
by the Collateral Agent. The balance of these accounts vary on a monthly basis as
cash is drawn down to fund construction costs and replenished with monthly
funding requests.
Short-term investments (243.1) Decreased due to redemptions and reclassifications of structured deposit notes to
restricted cash related to LCP.
Prepayments (current and long-term) 10.7 Increased primarily due to an additional prepaid cash call in relation to Hebron in
Oil and Gas, as well as an increase in the prepaid debt guarantee fee in Hydro.
Property, plant and equipment 531.2 Increased primarily due to capital expenditures related to LCP; Oil and Gas, notably
Hebron and HSE; additions to the Maritime Link; less depreciation and depletion.
Long-term investments (29.0) Decreased as a result of amounts maturing within one year.
LIABILITIES AND EQUITY
Short-term borrowings (14.0) Decreased due to a reduction in promissory notes in Hydro, based on funding
requirements.
Trade and other payables (91.7) Decreased due to a reduction in accrued interest on long-term debt in Hydro due
to payments during the period; decreased capital accruals in Oil and Gas related
to Hebron, HSE and exploration; and decreased capital accruals related to
construction costs for LCP.
Class B limited partnership units 43.0 Increased due to contributions of $38.3 million and accrued interest of $4.7 million
on the Class B limited partnership units.
Deferred credits (current and long-term) 104.6 Increased primarily due to deferred energy sales related to the Maritime Link. See
Note 10 – unaudited condensed consolidated interim financial statements for the
period ended March 31, 2016.
Shareholder contributions 62.6 Increased primarily due to Oil and Gas and LCP equity injections from the Province.
Retained earnings 28.0 Increased due to profit during the period.
Regulatory deferrals 40.1 Increased primarily due to an increase in fuel deferral costs, increased interest on
the RSP balance and changes to the regulatory deferrals primarily related to the
Prudence Review Order from the PUB, partially offset by a decrease in RSP
amortization and a rural rate adjustment.
MANAGEMENT’S DISCUSSION & ANALYSISFOR THE THREE MONTHS ENDED MARCH 31 , 2016

NALCOR ENERGY 2016 Q1 FINANCIAL REPORT 13
SECTION 4: SEGMENTED RESULTS AND ANALYSISThe following presents an overview of the Company’s profit for the three months ended March 31, 2016, by business segment, in
comparison to the three months ended March 31, 2015. This discussion should be read in conjunction with Note 24 of the condensed
consolidated interim financial statements for the period ended March 31, 2016:
Three months endedFor the period ended March 31 (millions of dollars) 2016 2015 Variance
Hydro Regulated (2.8) (1.6) (1.2)
Churchill Falls 23.7 24.4 (0.7)
Oil and Gas 1.0 1.5 (0.5)
Energy Marketing 7.2 6.9 0.3
Bull Arm Fabrication 4.8 4.4 0.4
Phase 1 Lower Churchill Project 0.2 - 0.2
Corporate and Other Activities (5.7) (5.9) 0.2
Inter-segment (0.4) (0.4) -
Profit for the period 28.0 29.3 (1.3)
HYDRO REGULATED
The operations of Hydro are influenced by many external factors including regulation, performance of the domestic economy, weather
patterns and fuel costs. The demand for electricity is met through a combination of hydroelectric generation, thermal generation and
power purchases including wind generation. Hydro uses the RSP, as directed by the PUB, to annually adjust customer rates, both as a
means to smooth rate impacts for island electricity consumers and to protect Hydro Regulated’s profit from variations in the HTGS fuel
costs. Fuel costs at the HTGS fluctuate as a result of variations in electricity sales, fuel prices and hydraulic production.
On April 28, 2016, Hydro received Order No. P.U. 13 (2016) which outlines the results of a Prudence Review of certain projects and
expenditures of Hydro. Hydro has recorded its best estimate of the impact of the Prudence Review on its March 31, 2016 financial results,
based upon Management's initial interpretation of the Order. Hydro will have to provide a compliance filing relating to this Order to the
PUB in the second quarter of 2016. Additional adjustments may be required pending further review and final approval of the Compliance
Order by the PUB.
As Hydro is still awaiting a final order on its GRA, and final rates have not been approved, the electricity rates in effect for the first quarter
of 2016 reflect interim rates which were implemented on July 1, 2015. Hydro’s rates are also adjusted annually, on July 1, for the cost of
fuel consumed at the HTGS which occurs through the normal operation of the RSP. However, this recovery is limited to the cost of No.
6 fuel only. Hydro’s cost of diesel and gas turbine fuel for standby generation currently has no deferral protection. Hydro did apply in
its GRA for deferral of these costs in excess of test year amounts which is currently pending approval. Hydro also filed an application in
February 2016 to provide recovery of additional 2016 fuel costs resulting from increased operation of the combustion turbines to maintain
reliable service. This application is also pending approval from the PUB.
MANAGEMENT’S DISCUSSION & ANALYSISFOR THE THREE MONTHS ENDED MARCH 31 , 2016

NALCOR ENERGY 2016 Q1 FINANCIAL REPORT14
Financial Highlights
Three months endedFor the period ended March 31 (millions of dollars) 2016 2015 Variance
Revenue 195.3 215.2 (19.9)
Fuels 72.6 81.3 8.7
Power purchased 17.5 18.2 0.7
Operating costs 31.5 34.6 3.1
Depreciation and amortization 16.9 15.5 (1.4)
Net finance (income) expense 18.8 18.2 (0.6)
Other (income) expense 0.5 1.3 0.8
Profit before regulatory adjustments 37.5 46.1 (8.6)
Regulatory adjustments 40.3 47.7 7.4
Loss for the period (2.8) (1.6) (1.2)
Non-GAAP Operating Profit Disclosure
Reconciliation of Hydro Regulated’s loss to operating profit for the three months ended March 31 is as follows:
Three months endedFor the period ended March 31 (millions of dollars) 2016 2015 Variance
Loss for the period (2.8) (1.6) (1.2)
Prudence Order adjustment 7.0 - 7.0
Operating profit (loss) for the period 4.2 (1.6) 5.8
Revenue
The decrease in revenue for the quarter was primarily due to lower RSP recovery resulting from the normal operation of the RSP and
lower utility consumption, partially offset by increased revenue as a result of the implementation of interim rates combined with higher
demand revenue. The impact of decreased revenue is partially offset in the regulatory adjustments line.
Fuels
The decrease in fuel costs for the quarter was primarily due to a lower price per barrel of No. 6 fuel as a result of lower oil prices. The
majority of this variance is offset through the RSP in the regulatory adjustments line. The decrease is partially offset by increased gas
turbine fuel costs related to the operation of the Holyrood CT.
The following tables summarize fuel consumed and average price: Three months endedFor the period ended March 31 2016 2015
No. 6 fuel consumption: Millions of barrels 1.1 1.0
Average price (CAD/bbl) $43.44 $72.62
Gas Turbine fuel consumption: Millions of liters 39.3 6.2
Average price (CAD/liter) $0.57 $0.85
Diesel fuel consumption: Millions of liters 4.8 4.6
Average price (CAD/liter) $0.87 $1.05
MANAGEMENT’S DISCUSSION & ANALYSISFOR THE THREE MONTHS ENDED MARCH 31 , 2016

NALCOR ENERGY 2016 Q1 FINANCIAL REPORT 15
Fuel costs are summarized below:
Three months endedFor the period ended March 31 (millions of dollars) 2016 2015
No. 6 fuel and other 46.1 71.2
Gas Turbine Fuel 22.4 5.3
Diesel 4.1 4.8
72.6 81.3
Energy supply is summarized below:
Three months ended
For the period ended March 31 (GWh) 2016 2015 Variance
Generation:
Hydraulic generation 1 1,362.6 1,590.3 (227.7)
Holyrood generation 667.5 604.2 63.3
Standby generation 1,2 100.0 10.6 89.4
Thermal diesel generation 15.0 14.8 0.2
Purchases 3 495.6 543.3 (47.7)
2,640.7 2,763.2 (122.5)1 Includes Hydro generation only.2 Includes Gas Turbine and Diesel generation. 3 Purchases include generation from Exploits, recall energy for use in Labrador, wind and other sources.
Energy sales are summarized below:
Three months ended
For the period ended March 31 (GWh) 2016 2015 Variance
Newfoundland Power 2,037.0 2,121.0 (84.0)
Hydro Rural 386.1 412.0 (25.9)
Industrial 120.0 116.2 3.8
Internal Usage 1.2 1.3 (0.1)
Losses 96.4 112.7 (16.3)
2,640.7 2,763.2 (122.5)
MANAGEMENT’S DISCUSSION & ANALYSISFOR THE THREE MONTHS ENDED MARCH 31 , 2016

NALCOR ENERGY 2016 Q1 FINANCIAL REPORT16
Power purchased
The decrease in power purchased for the quarter was primarily due to less purchases from Exploits due to lower hydrology production,
partially offset by higher co-generation purchases.
Operating costs
The decrease in operating costs for the quarter was primarily due to lower costs related to system equipment and maintenance,
professional services, travel and timing differences associated with capital labour.
Depreciation and amortization
The increase in depreciation and amortization for the quarter was due to increased levels of investment in property, plant and equipment.
Net finance (income) expense
The unfavourable variance in net finance (income) expense for the quarter was primarily due to additional capitalized interest costs in
2015 related to the Holyrood CT and higher interest in 2016 associated with short-term borrowings.
Other (income) expense
The favourable variance in other (income) expense for the quarter was primarily due to lower foreign exchange losses associated with
No. 6 fuel purchases, which is offset through the RSP in the regulatory adjustments line, partially offset by higher costs related to the
removal and retirement of assets.
Regulatory adjustments
Regulatory adjustments decreased for the quarter primarily due to a reduction in RSP amortization, partially offset by higher deferred
fuel costs resulting from the normal operation of the RSP and changes to the regulatory deferrals primarily related to the Prudence
Review Order from the PUB.
CHURCHILL FALLS
Churchill Falls is the owner and operator of the Churchill Falls Generating Station, with a rated capacity of 5,428 MW. The 1969 Power
Contract, and a Renewal Contract commencing September 1, 2016 and expiring August 31, 2041, provide for the sale of electricity from
this facility to Hydro-Québec. In addition, two power purchase agreements effective March 9, 1998 and January 1, 2015, provide for the
sale of electricity to Hydro for use domestically and for resale in export markets.
Churchill Falls earns revenue from Hydro-Québec under the Guaranteed Winter Availability Contract (GWAC). The GWAC was signed with
Hydro-Québec in 1998 and expires on August 31, 2041, and provides revenue from the sale of up to 682 MW of seasonal availability to
Hydro-Québec during the months of November through March.
During the first three months of 2016, Churchill Falls derived 43.3% of its revenue from sales to Hydro-Québec under the Power Contract
(2015 – 44.4%), 36.8% from the GWAC (2015 – 36.9%) and 20.0% from other revenue (2015 – 18.7%). Other revenue now includes the
sale of energy to Hydro pursuant to the 2015 Hydro PPA.
The strategy for Churchill Falls continues to focus on safely operating and maintaining its assets to optimize long-term value while
maximizing profit and cash flow.
MANAGEMENT’S DISCUSSION & ANALYSISFOR THE THREE MONTHS ENDED MARCH 31 , 2016

NALCOR ENERGY 2016 Q1 FINANCIAL REPORT 17
Churchill Falls’ capital requirements are expected to continue to increase as investments are made to replace aging infrastructure.
Churchill Falls has in place a long-term asset management plan, which addresses capital requirements to keep assets in reliable operating
condition, which will in turn provide reliable operations for the long-term.
Financial Highlights
Three months ended
For the period ended March 31 (millions of dollars) 2016 2015 Variance
Revenue 38.2 38.9 (0.7)
Operating costs 12.1 12.3 0.2
Depreciation and amortization 4.0 3.6 (0.4)
Net finance (income) expense (0.3) (0.2) 0.1
Preferred dividends (1.3) (1.2) 0.1
Profit for the period 23.7 24.4 (0.7)
Revenue
The decrease in revenue for the quarter was primarily due to lower energy sales and GWAC revenue to Hydro-Québec offset by additional
energy sales from the former Twinco Block to Hydro.
Operating costs
The decrease in operating costs for the quarter was due to an increase in operating recoveries offset by an increase in salaries and
benefits related costs.
Depreciation and amortization
The increase in depreciation and amortization for the quarter was due to increased levels of investment in property, plant and equipment.
MANAGEMENT’S DISCUSSION & ANALYSISFOR THE THREE MONTHS ENDED MARCH 31 , 2016

NALCOR ENERGY 2016 Q1 FINANCIAL REPORT18
OIL AND GAS
Nalcor Oil and Gas is currently a joint venture working interest partner in three developments in the Newfoundland and Labrador
offshore. It manages a 4.9% working interest in the Hebron oil field, the Province’s fourth offshore oil project which was sanctioned
for development on December 31, 2012; a 5.0% working interest in the White Rose Extension, which produced first oil from the North
Amethyst field in May 2010; and a 10.0% working interest in the HSE, which produced first oil in June 2011.
The following table presents net profit for the period as well as Nalcor’s non-GAAP measure EBITDA.
Financial Highlights
Three months ended
For the period ended March 31 (millions of dollars) 2016 2015 Variance
Revenue 15.0 9.5 5.5
Operating costs 2.3 2.4 0.1
Production costs 5.2 3.1 (2.1)
Depreciation, depletion and amortization 8.4 3.7 (4.7)
Exploration and evaluation - 0.2 0.2
Net finance (income) expense 0.8 0.1 (0.7)
Other (income) expense (2.7) (1.5) 1.2
Profit for the period 1.0 1.5 (0.5)
EBITDA 10.2 5.3 4.9
Revenue
The increase in revenue for Q1 2016 was primarily due to an increase in HSE production volumes due to the addition of water injection
support in Q4 2015. Total oil production increased by 221,976 barrels compared to Q1 2015. The Q1 2016 increase was partially offset by
a reduction in seismic sales and a lower average Dated Brent price per barrel. The table below summarizes the oil price data for Q1 2016
with Q1 2015 comparatives. The average Dated Brent price reflects prices available in the market. The Realized Price (USD) includes the
impact of oil commodity price hedges, and Realized Price (CAD) includes the impact of foreign exchange. In Q1 2016, 20% of production
was hedged at an average price of $59.65 USD, whereas 48% of production was hedged at an average price of $85.77 USD in Q1 2015.
Three months ended
For the period ended March 31 (dollars) 2016 2015
Average Dated Brent Price (USD/bbl) 34.42 52.85
Realized Price (USD/bbl) 39.64 67.81
Realized Price (CAD/bbl) 54.29 85.05
Oil Production (bbls) 336,234 114,258
Hedged Production (bbls) 68,000 54,941
% Hedged 20% 48%
Average Hedge Price (USD) 59.65 85.77
MANAGEMENT’S DISCUSSION & ANALYSISFOR THE THREE MONTHS ENDED MARCH 31 , 2016

NALCOR ENERGY 2016 Q1 FINANCIAL REPORT 19
Operating costs
The decrease in operating costs for the quarter was primarily due to a reduction in consulting costs.
Production costs
The increase in production costs for the quarter was primarily due to an increase in production volumes compared to Q1 2015.
Depreciation, depletion and amortization
The increase for the quarter was primarily due to an increase in depletion associated with HSE due to higher production volumes
compared to Q1 2015.
Exploration and evaluation
The decrease in exploration and evaluation for the first quarter relates to the timing of project execution in the operating portion
of Nalcor’s exploration expenditures, which are funded through two government-sponsored programs, the Petroleum Exploration
Enhancement Program and the Offshore Geoscience Data Program. Many of these projects are not anticipated to begin until Q2 2016.
Net finance (income) expense
The unfavourable variance for the quarter was primarily a result of an increase in accretion expense associated with decommissioning
liabilities mainly due to higher anticipated costs estimated to decommission the Hebron project.
Other (income) expense
The favourable variance for the quarter is primarily due to gains on settlement of oil commodity contracts, partially offset by unfavorable
foreign exchange fluctuations.
MANAGEMENT’S DISCUSSION & ANALYSISFOR THE THREE MONTHS ENDED MARCH 31 , 2016

NALCOR ENERGY 2016 Q1 FINANCIAL REPORT20
ENERGY MARKETING
The revenue and earnings in this segment are derived primarily from the sale of available Recapture as well as 225MW of power and
energy available from the PPA between Hydro and Churchill Falls. The Recapture is sold to markets in eastern Canada and the northeastern
United States, as well as to the iron ore industry in Labrador. The energy available under the PPA between Hydro and Churchill Falls
is sold in Labrador West at rates determined by the Labrador Industrial Rates policy. In addition, revenue is generated through the
18.7 MW Menihek Generating Station.
Financial Highlights
Three months ended
For the period ended March 31 (millions of dollars) 2016 2015 Variance
Revenue 19.0 27.1 (8.1)
Power purchased 11.1 10.5 (0.6)
Operating costs 7.2 7.7 0.5
Depreciation and amortization 0.1 - (0.1)
Other (income) expense (6.6) 2.0 8.6
Profit for the period 7.2 6.9 0.3
Revenue
The decrease in revenue for the quarter is due to lower electricity prices on export market sales. The first quarter noted declines in year-
over-year demand and mild weather which resulted in lower prices in eastern Canada and the northeastern United States. The decrease
in price was partially offset by increased volumes as mild weather in Labrador increased available energy for export. This was further
offset by favourable foreign exchange on US dollar sales.
In Q1 2016, approximately 55.6% of revenue related to sales to industrial customers (2015 - 38.2%), 36.4% related to export sales
(2015 - 56.5%) and 8.0% of revenues were derived from other sources (2015 - 5.3%).
Prices and volumes for the quarter for sales in export markets are summarized in the table below. The Average Market Price reflects
prices realized in the export market. The Realized Price (USD) includes the impact of electricity commodity price hedges, and Realized
Price (CAD) includes the impact of foreign exchange.
Three months ended
For the period ended March 31 2016 2015
Average Market Price (USD/MWh) $15.79 $42.59
Realized Export Electricity Price (USD/MWh) $23.69 $45.55
Realized Export Electricity Price (CAD/MWh) $29.69 $54.82
Export sales (GWh) 317 286
The following table depicts the prices and volumes for energy sales related to industrial customers.
Three months ended
For the period ended March 31 2016 2015
Average Industrial Customer Price (CAD/MWh) $22.74 $22.84
Industrial Customer Sales (GWh) 465 452
MANAGEMENT’S DISCUSSION & ANALYSISFOR THE THREE MONTHS ENDED MARCH 31 , 2016

NALCOR ENERGY 2016 Q1 FINANCIAL REPORT 21
Power purchased
The increase for the quarter was primarily a result of increased volume and price of power purchased under the Churchill Falls – Hydro
PPA which was subsequently sold to Labrador West customers.
Operating costs
The decrease in operating costs for the quarter was primarily due to decreased professional fees and marketing fees. The reduction in
marketing fees resulted from Energy Marketing’s move to in-house energy trading operations in Q2 2015.
Other (income) expense
The favourable variance for the quarter as compared to 2015 was primarily due to gains on commodity hedge contracts and reduced
volatility on foreign exchange contracts due to the implementation of hedge accounting.
BULL ARM FABRICATION
Bull Arm Fabrication is Atlantic Canada’s largest industrial fabrication site. The site is an important asset for the Province for the
development of the oil and gas industry in Newfoundland and Labrador and the advancement of the Province's fabrication capacity. The
Bull Arm Fabrication site provides extensive benefits for existing and future generations through its infrastructure, technology, and the
continual development of an experienced labour force and related knowledge transfer.
Revenue is primarily generated through leasing arrangements associated with large construction projects. The site is currently under
lease to ExxonMobil Canada Properties until completion of the Hebron Project which is planned to be in 2017. Site project work consists
of construction of the GBS platform, fabrication of the Living Quarters module, as well as other construction and fabrication activities
related to the Hebron project.
Financial Highlights
Three months ended
For the period ended March 31 (millions of dollars) 2016 2015 Variance
Revenue 5.6 4.9 0.7
Operating costs 0.3 0.2 (0.1)
Other (income) expense 0.5 0.3 (0.2)
Profit for the period 4.8 4.4 0.4
Revenue
The increase in revenue for the quarter was due to favorable foreign exchange on USD lease revenue.
Operating costs
The increase in operating costs for the quarter was due to increases in salaries and benefits, marketing fees and shared service charges
to support operations.
Other (income) expense
The unfavourable variance in other (income) expense for the quarter is primarily due to losses associated with settlement of
hedge contracts.
MANAGEMENT’S DISCUSSION & ANALYSISFOR THE THREE MONTHS ENDED MARCH 31 , 2016
NALCOR ENERGY 2016 Q1 FINANCIAL REPORT22
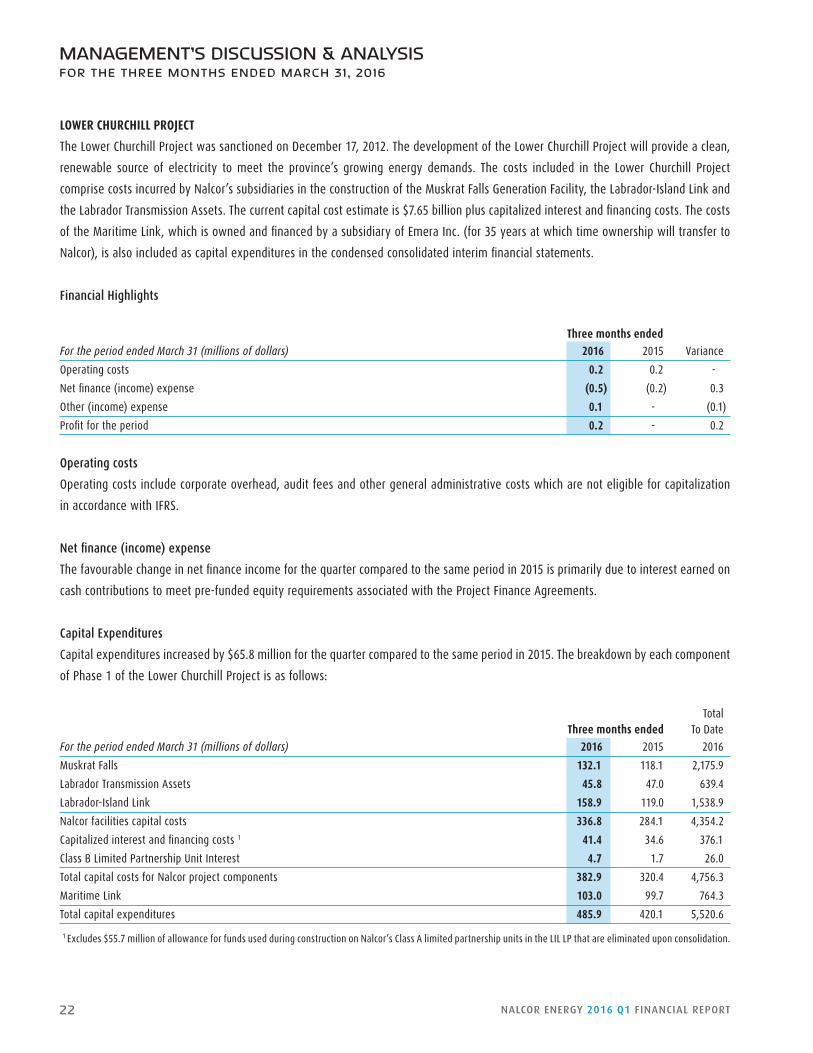
LOWER CHURCHILL PROJECT
The Lower Churchill Project was sanctioned on December 17, 2012. The development of the Lower Churchill Project will provide a clean,
renewable source of electricity to meet the province’s growing energy demands. The costs included in the Lower Churchill Project
comprise costs incurred by Nalcor’s subsidiaries in the construction of the Muskrat Falls Generation Facility, the Labrador-Island Link and
the Labrador Transmission Assets. The current capital cost estimate is $7.65 billion plus capitalized interest and financing costs. The costs
of the Maritime Link, which is owned and financed by a subsidiary of Emera Inc. (for 35 years at which time ownership will transfer to
Nalcor), is also included as capital expenditures in the condensed consolidated interim financial statements.
Financial Highlights
Three months ended
For the period ended March 31 (millions of dollars) 2016 2015 Variance
Operating costs 0.2 0.2 -
Net finance (income) expense (0.5) (0.2) 0.3
Other (income) expense 0.1 - (0.1)
Profit for the period 0.2 - 0.2
Operating costs
Operating costs include corporate overhead, audit fees and other general administrative costs which are not eligible for capitalization
in accordance with IFRS.
Net finance (income) expense
The favourable change in net finance income for the quarter compared to the same period in 2015 is primarily due to interest earned on
cash contributions to meet pre-funded equity requirements associated with the Project Finance Agreements.
Capital Expenditures
Capital expenditures increased by $65.8 million for the quarter compared to the same period in 2015. The breakdown by each component
of Phase 1 of the Lower Churchill Project is as follows:
Total Three months ended To Date
For the period ended March 31 (millions of dollars) 2016 2015 2016
Muskrat Falls 132.1 118.1 2,175.9
Labrador Transmission Assets 45.8 47.0 639.4
Labrador-Island Link 158.9 119.0 1,538.9
Nalcor facilities capital costs 336.8 284.1 4,354.2
Capitalized interest and financing costs 1 41.4 34.6 376.1
Class B Limited Partnership Unit Interest 4.7 1.7 26.0
Total capital costs for Nalcor project components 382.9 320.4 4,756.3
Maritime Link 103.0 99.7 764.3
Total capital expenditures 485.9 420.1 5,520.6
1 Excludes $55.7 million of allowance for funds used during construction on Nalcor’s Class A limited partnership units in the LIL LP that are eliminated upon consolidation.
MANAGEMENT’S DISCUSSION & ANALYSISFOR THE THREE MONTHS ENDED MARCH 31 , 2016

NALCOR ENERGY 2016 Q1 FINANCIAL REPORT 23
CORPORATE AND OTHER ACTIVITIES
Financial Highlights
Three months ended
For the period ended March 31 (millions of dollars) 2016 2015 Variance
Revenue - 0.1 (0.1)
Operating costs 5.5 5.6 0.1
Depreciation and amortization 0.2 0.1 (0.1)
Net finance (income) expense 0.1 0.1 -
Other (income) expense (0.1) 0.2 0.3
Loss for the period (5.7) (5.9) 0.2
With exception to other (income) expense, Corporate and Other activities were comparable with the same period in 2015. The favourable
variance in other (income) expense was due to fluctuations in foreign exchange gains and losses.
SECTION 5: LIQUIDITY AND CAPITAL RESOURCES
Nalcor’s capital resources consist primarily of cash from operations, cash and cash equivalents, short-term investments, long-term
investments and equity from the Province. These capital resources are used to fund the Company’s consolidated capital resource
requirements, which continue to include working capital needs, capital expenditures, development costs and the servicing and repayment
of consolidated debt. Additional liquidity is available through a $250.0 million committed credit facility that Nalcor maintains with its
primary banker. As at March 31, 2016, there were no amounts drawn on the facility (2015 - $nil).
While cash from operations depends on a number of factors, including commodity prices, foreign exchange rates and production
volumes, Management believes existing capital resources and credit lines will be sufficient to fund all capital resource requirements and
maintain adequate liquidity in 2016.
CASH FLOW HIGHLIGHTS
Summary of Consolidated Cash Flows:
Three months ended
For the period ended March 31 (millions of dollars) 2016 2015 Variance
Cash and cash equivalents, beginning of period 148.5 60.8 87.7
Net cash provided from operating activities 75.8 81.6 (5.8)
Net cash (used in) provided from investing activities (263.4) 45.3 (308.7)
Net cash provided from (used in) financing activities 140.6 (122.0) 262.6
Cash and cash equivalents, end of period 101.5 65.7 35.8
MANAGEMENT’S DISCUSSION & ANALYSISFOR THE THREE MONTHS ENDED MARCH 31 , 2016

NALCOR ENERGY 2016 Q1 FINANCIAL REPORT24
Operating Activities:
Three months ended
For the period ended March 31 (millions of dollars) 2016 2015 Variance
Net cash provided from operating activities 75.8 81.6 (5.8)
Cash provided from operating activities was $75.8 million, down $5.8 million compared to the three months ended March 31, 2015. The
decrease was due primarily to changes in regulatory adjustments, offset by increased depreciation, depletion and amortization.
Investing Activities:
Three months ended
For the period ended March 31 (millions of dollars) 2016 2015 Variance
Additions to property, plant and equipment and intangible assets (453.7) (395.0) (58.7)
Decrease in long-term receivables 1.7 28.6 (26.9)
Decrease in investments (including short-term) 272.1 420.2 (148.1)
Changes in non-cash working capital balances (79.8) (5.7) (74.1)
Other (3.7) (2.8) (0.9)
Net cash (used in) provided from investing activities (263.4) 45.3 (308.7)
Cash used in investing activities consisted of additions to property, plant and equipment and intangible assets, primarily related to
construction in progress as well as less significant additions to petroleum and natural gas properties, exploration investments and
computer software, partially offset by capital accruals. Long term receivables decreased significantly in Q1 2015 due to a reclassification
of long-term advances to suppliers to trade and other receivables. Investment redemptions were lower in 2016 than in the same
period in 2015.
Financing Activities:
Three months ended
For the period ended March 31 (millions of dollars) 2016 2015 Variance
Decrease (increase) in restricted cash 52.2 (147.9) 200.1
Class B limited partnership unit contributions 38.3 - 38.3
Decrease in short-term borrowings (14.0) (11.0) (3.0)
Increase in shareholder contributions 62.6 37.3 25.3
Other 1.5 (0.4) 1.9
Net cash provided from (used in) financing activities 140.6 (122.0) 262.6
In the first quarter of 2016, $140.6 million was provided from financing activities, compared to $122.0 million used in the first quarter of
2015, primarily due to a decrease in restricted cash, increased Class B limited partnership unit contributions and increased shareholder
contributions which were used to fund Nalcor’s capital expenditures.
MANAGEMENT’S DISCUSSION & ANALYSISFOR THE THREE MONTHS ENDED MARCH 31 , 2016

NALCOR ENERGY 2016 Q1 FINANCIAL REPORT 25
CAPITAL STRUCTURE
Nalcor’s consolidated capital structure and associated performance indicators are shown in the table below:
As at (millions of dollars) March 31, 2016 December 31, 2015
Short-term borrowings 83.0 97.0
Current portion of long-term debt 233.2 233.4
Long-term debt (net of sinking funds) 5,759.6 5,765.5
Class B limited partnership units 250.4 207.4
Total debt (net of sinking funds) 6,326.2 6,303.3
Total shareholder’s equity 3,547.1 3,455.6
Debt to capital 64.1% 64.6%
Fixed rate debt as percentage of total indebtedness 94.7% 95.2%
The above noted ratios are Non-GAAP financial measures. Please refer to Section 8: Non-GAAP Financial Measures.
Capital structure is managed at the subsidiary level. As a result, Nalcor’s consolidated capital structure is driven largely by the long-
term funding decisions made at the subsidiary level. When capital resource requirements exceed cash from operations for a particular
subsidiary, the difference is funded with long-term debt and/or equity contributions from Nalcor. The use of long-term debt to fund
capital resource requirements is limited to cases where there is reasonable certainty that operating cash flows will be sufficient to service
the debt while maintaining an appropriate level of stand-alone creditworthiness.
MANAGEMENT’S DISCUSSION & ANALYSISFOR THE THREE MONTHS ENDED MARCH 31 , 2016

NALCOR ENERGY 2016 Q1 FINANCIAL REPORT26
As at March 31, 2016 and December 31, 2015, total consolidated liquidity is as follows:
March 31, 2016 December 31, 2015
Letters Letters Credit Borrowings of Credit Total Credit Borrowings of Credit TotalAs at (millions of dollars) Facilities Outstanding Outstanding Liquidity Facilities Outstanding Outstanding Liquidity
Hydro Regulated:
Cash and cash equivalents/ Short-term investments 2.9 4.0
Promissory notes program 300.0 83.0 - 217.0 300.0 97.0 - 203.0
Demand operating facility 50.0 - 0.3 49.7 50.0 - 0.3 49.7
269.6 256.7
Churchill Falls:
Cash and cash equivalents/ Short-term investments 71.0 54.9
Demand operating facility 10.0 - 2.0 8.0 10.0 - 2.0 8.0
79.0 62.9
Oil and Gas:
Cash and cash equivalents/ Short-term investments 10.5 17.3
Demand operating facility 5.0 - - 5.0 5.0 - - 5.0
15.5 22.3
Energy Marketing:
Cash and cash equivalents/ Short-term investments 1.5 3.4
Demand operating facility 20.0 5.9 - 14.1 20.0 8.2 - 11.8
15.6 15.2
Bull Arm:
Cash and cash equivalents/ Short-term investments - - - 3.0 - - - 1.1
3.0 1.1
LCP:
Cash and cash equivalents/ Short-term investments 23.2 20.6
MFLTA working capital reserve account 75.0 - - 75.0 75.0 - - 75.0
LIL working capital revolving facility 75.0 - - 75.0 75.0 - - 75.0
173.2 170.6
Nalcor:
Cash and cash equivalents/ Short-term investments 19.6 75.1
2-year facility 250.0 - 20.1 229.9 250.0 - 12.0 238.0
249.5 313.1
Total consolidated liquidity 805.4 841.9
MANAGEMENT’S DISCUSSION & ANALYSISFOR THE THREE MONTHS ENDED MARCH 31 , 2016

NALCOR ENERGY 2016 Q1 FINANCIAL REPORT 27
HYDRO REGULATED
Capital resource requirements for Hydro Regulated consist primarily of working capital needs, capital expenditures and debt servicing
and repayment. Hydro funds capital resource requirements through a combination of cash from operations, sinking funds and long-term
debt issuances.
Capital expenditures in excess of cash from operations are funded with proceeds from short-term debt issued under Hydro’s provincially
guaranteed $300.0 million promissory note program. Once borrowings under this program reach a pre-determined level, Management
will refinance promissory notes with proceeds from long-term debt. As at March 31, 2016, there were $83.0 million in promissory notes
outstanding (2015 - $97.0 million). In addition, Hydro maintains a $50.0 million demand operating facility with its primary bank. As at
March 31, 2016, there were no amounts drawn on the facility (2015 - $nil).
Sinking funds were established for four of Hydro’s debt issues. These four debt issues have a par value of $875.0 million. The remaining
two debt issues, with par value of $425.0 million, will be refinanced in the capital markets at maturity.
CHURCHILL FALLS
Capital resource requirements for Churchill Falls consist primarily of working capital needs and capital expenditures, which Churchill
Falls funds mainly through cash from operations. Churchill Falls also maintains a $75.0 million reserve fund which can be drawn upon in
certain circumstances to fund capital expenditures, subject to the terms and conditions as established in the Shareholders’ Agreement.
In 2014, $23.4 million was withdrawn from the reserve fund to fund a portion of 2014 capital expenditures. In 2015, $5.0 million was
withdrawn to fund a portion of 2015 capital expenditures. These funds will be replaced in future periods in accordance with Article
5.6 of the Shareholders’ Agreement.
To ensure sufficient liquidity, Churchill Falls targets a minimum cash balance of $20.0 million (2015 - $20.0 million) and maintains a
$10.0 million demand operating facility with its primary banker. As at March 31, 2016, there were no amounts drawn on the facility
(2015 - $nil).
OIL AND GAS
Capital resource requirements for Oil and Gas consist primarily of capital expenditures and working capital needs. While cash from
operations is sufficient to meet working capital needs and fund a portion of Oil and Gas’ capital expenditures, the primary source of
long-term financing for capital expenditures in the near term will continue to be equity from the Province. Equity contributions from the
Province totalled $57.9 million for the quarter-ended March 31, 2016 (2015 - $192.7 million). Liquidity is provided through a $5.0 million
demand operating facility Oil and Gas maintains with its primary banker. As of March 31, 2016, there were no amounts drawn on the
facility (2015 - $nil).
ENERGY MARKETING
Capital resource requirements for Energy Marketing are limited to working capital needs. Energy Marketing maintains a $20.0 million
demand operating facility with its primary banker. As at March 31, 2016, there was $5.9 million drawn on the facility (2015 - $8.2 million).
MANAGEMENT’S DISCUSSION & ANALYSISFOR THE THREE MONTHS ENDED MARCH 31 , 2016

NALCOR ENERGY 2016 Q1 FINANCIAL REPORT28
BULL ARM FABRICATION
Capital resource requirements for Bull Arm Fabrication are limited to working capital needs, which will continue to be funded through
cash from operations. Historically, cash from operations has exceeded Bull Arm’s working capital requirements. Under the existing
dividend policy, cash and cash equivalents in excess of $1.0 million are distributed to Nalcor as a dividend at Management’s discretion.
LOWER CHURCHILL PROJECT
Capital resource requirements for LCP consist primarily of capital expenditures in connection with construction of the Lower Churchill
Project. The primary source of financing for Muskrat Falls, Labrador Transco and LIL LP will continue to be the credit facilities and equity
contributions from the Province as well as Emera Newfoundland and Labrador-Island Link Inc. relating to its limited partnership interest
in the LIL LP. Muskrat Falls and Labrador Transco have access to a $75.0 million working capital reserve account which can be used to
meet any short-term funding requirements that may arise between drawdowns under the MF/LTA Project Finance Agreement. LIL LP has
access to a $75.0 million working capital revolving facility which can be used to meet any short-term funding requirements that may
arise between drawdowns under the LIL Project Finance Agreement.
CAPITAL EXPENDITURES
Capital expenditures, which significantly impact the cash used in investing activities, increased by $64.8 million for the quarter.
Three months ended
For the period ended March 31 (millions of dollars) 2016 2015
Hydro Regulated 17.6 18.1
Churchill Falls 1 4.8 2.4
Oil and Gas 50.6 52.6
Energy Marketing - 0.1
Phase 1 Lower Churchill Project 382.9 320.4
Corporate and Other Activities - 0.8
Total Capital Expenditures before the following: 455.9 394.4
Maritime Link – Non Cash Additions 103.0 99.7
Total Capital Expenditures 558.9 494.11 Reflects Nalcor’s 65.8% ownership interest
OBLIGATIONS AND COMMITMENTS
Outstanding commitments for capital projects to be incurred in the next five years, excluding those related to Oil and Gas totalled
$3.2 billion as at March 31, 2016 (December 31, 2015 - $3.5 billion), primarily related to the Phase 1 Lower Churchill Project, Hydro
Regulated and Churchill Falls. Oil and Gas recognizes its share of obligations and commitments in relation to its interests in the joint
operations as the information becomes available. Additional information about Nalcor’s obligations and commitments can be found in
Note 22 of the unaudited condensed consolidated interim financial statements for the period ended March 31, 2016.
MANAGEMENT’S DISCUSSION & ANALYSISFOR THE THREE MONTHS ENDED MARCH 31 , 2016

NALCOR ENERGY 2016 Q1 FINANCIAL REPORT 29
SECTION 6: RISK MANAGEMENT PROCESS
Nalcor operates in various industry segments that have a variety of risk factors and uncertainties. The risks and uncertainties that could
materially affect the business, financial condition and results of operations are described in Nalcor’s annual MD&A for the year ended
December 31, 2015.
There were no material changes in Nalcor’s significant business risks during Q1 2016 from those disclosed in the MD&A for the year ended
December 31, 2015.
SECTION 7: SIGNIFICANT ACCOUNTING POLICIES, JUDGMENTS, ESTIMATES AND ASSUMPTIONS
SIGNIFICANT ACCOUNTING POLICIES
Nalcor’s significant accounting policies are described in Note 2 of the unaudited condensed consolidated interim financial statements for
the period ended March 31, 2016.
SIGNIFICANT ACCOUNTING JUDGMENTS, ESTIMATES AND ASSUMPTIONS
Significant accounting estimates are those that require Management to make assumptions about matters that are highly uncertain at the
time the estimate is made. Significant accounting estimates are also those estimates which, where a different estimate could have been
used or where changes in the estimate that are reasonably likely to occur, would have a material impact on the Company’s financial
condition or financial performance. Significant accounting judgments, estimates and assumptions are reviewed annually by the Audit
Committee of the Board. A description of Nalcor’s significant accounting judgments, estimates and assumptions is provided in Note 3 of
the annual audited consolidated financial statements for the year ended December 31, 2015.
MANAGEMENT’S DISCUSSION & ANALYSISFOR THE THREE MONTHS ENDED MARCH 31 , 2016
NALCOR ENERGY 2016 Q1 FINANCIAL REPORT30
MANAGEMENT’S DISCUSSION & ANALYSISFOR THE THREE MONTHS ENDED MARCH 31 , 2016
SECTION 8: NON-GAAP FINANCIAL MEASURES
Certain financial measures in the MD&A are not prescribed by GAAP. These non-GAAP financial measures are included because they
provide MD&A users with enhanced understanding and clarity of Nalcor’s financial performance, condition, leverage and liquidity. These
non-GAAP financial measures do not have any standardized meaning and cannot necessarily be compared to similar measures presented
by other companies.
Disclosure of Non-GAAP Financial Measures
Debt to capital Total debt (promissory notes, long-term debt including current portion
less sinking funds), divided by total debt plus shareholder’s equity
EBIT Operating profit (loss) excluding interest and taxes
EBIDTA Operating profit (loss) excluding interest, taxes, depreciation, depletion,
amortization, impairment and accretion
Fixed rate debt as a percentage of total indebtedness Long-term debt divided by total debt
Funds from operations (FFO) Profit (loss) excluding depreciation, depletion, amortization, impairment
and accretion
Operating profit (loss) Encompasses profit (loss) excluding extraordinary and non-recurring
items that are not indicative of Nalcor's future financial performance. This
non-GAAP financial measure provides a more accurate reflection of
Nalcor's operating performance and analysis against prior periods.
Return on capital employed (ROCE)1 EBIT/Capital employed2
SECTION 9: SUMMARY OF QUARTERLY RESULTS
The following table outlines Nalcor’s quarterly results for the four quarters ended June 30, 2015 through March 31, 2016. The quarterly
information has been obtained from Nalcor’s unaudited condensed consolidated interim financial statements for the periods ended
June 30, 2015, September 30, 2015 and March 31, 2016, and the annual audited consolidated financial statements for the year ended
December 31, 2015. These quarterly results are historical in nature and should not be used to estimate or project future performance
of Nalcor.
1 ROCE is based on the average EBIT over the previous four quarters and average capital employed for each quarter.2 Capital employed is calculated as total debt plus total equity, excluding assets under development.

NALCOR ENERGY 2016 Q1 FINANCIAL REPORT 31
CapitalFor the period ended (millions of dollars) Revenue Profit (loss) ROCE (%) 1 FFO Expenditures 2
June 30, 2015 175.5 (8.0) 3.20 16.0 614.8
September 30, 2015 130.0 (1.2) 3.18 23.6 736.6
December 31, 2015 219.4 (39.5) 4.17 114.0 685.0
March 31, 2016 263.0 28.0 4.40 66.5 455.9
1 Excludes assets under development 2 Excludes Maritime Link
The financial performance of several of Nalcor’s business segments are impacted by seasonality. Specifically, electricity sales in Hydro
Regulated and Churchill Falls are typically highest during the first quarter and lowest during the summer months. In contrast, Energy
Marketing has the highest level of energy available to sell in export markets during the summer months and the least available to sell
in winter months. Electricity prices in the export markets tend to peak in winter and summer periods, but can vary by year depending
on temperatures, the specific market and other factors.
SECTION 10: OUTLOOK
Hydro expects to receive a final regulatory decision on the GRA hearing in Q2 2016. However, until a final decision is rendered by the
PUB, there will continue to be regulatory risk that could materially impact 2016 profit. Hydro Regulated’s forecasted profit assumes that
all costs and deferrals included in its GRA will be approved.
Churchill Falls’ 2016 forecasted profit is lower than 2015 mainly due to decreased revenue resulting from a 20% decrease in the power
rate effective September 1, 2016 as per the 2016 Renewal Contract.
Oil and Gas is forecasting higher annual 2016 operating profit over 2015, primarily due to an increase in revenue due to higher forecasted
production in 2016.
Oil prices continue to fluctuate and any significant price change for 2016 unhedged production may impact profitability. For the remaining
nine months of 2016, Oil and Gas has entered into commodity price swaps to mitigate price exposure on its energy sales. These contracts
provide an average fixed price of $59.96 USD per barrel on 117,937 barrels, which represents approximately 12% of the remaining
2016 production.
Energy Marketing’s 2016 forecasted profit is higher than 2015 primarily due to an increase in revenue associated with higher forecasted
prices and favourable forecasted foreign exchange.
Energy Marketing entered into fixed price commodity swaps to mitigate price exposure. For the remaining nine months of 2016,
these contracts will provide an average fixed price of $41.29 USD per MWh (peak) volumes and $20.46 USD per MWh (off-peak) on
approximately 56% of the total remaining 2016 forecasted export electricity sales.
MANAGEMENT’S DISCUSSION & ANALYSISFOR THE THREE MONTHS ENDED MARCH 31 , 2016

NALCOR ENERGY 2016 Q1 FINANCIAL REPORT32
Energy Marketing also entered into foreign exchange contracts to mitigate foreign exchange fluctuations. As at March 31, 2016, the
remaining contracts have a notional value of $24.9 million USD at an average rate of $1.34 CAD per USD.
Bull Arm is forecasting higher profit in 2016 over 2015 largely due to higher forecasted realized foreign exchange rates on USD.
2016 total forecasted capital expenditures (excluding those related to the Maritime Link) are forecasted to be $2.8 billion. The largest
component of capital expenditures, $2.3 billion, relates to the Lower Churchill Project.
SECTION 11: ABBREVIATIONS
bbl Barrel
CAD Canadian Dollars
GAAP Generally Accepted Accounting Principles
GBS Gravity Based Structure
GRA General Rate Application
GWAC Guaranteed Winter Availability Contract
GWh Gigawatt hours
HSE Hibernia South Extension Project
HTGS Holyrood Thermal Generating Station
IFRS International Financial Reporting Standards
KWh Kilowatt hours
MD&A Management’s Discussion & Analysis
MW Megawatts
PPA Power Purchase Agreement
PUB Newfoundland and Labrador Board of Commissioners of Public Utilities
RSP Rate Stabilization Plan
USD United States Dollars
MANAGEMENT’S DISCUSSION & ANALYSISFOR THE THREE MONTHS ENDED MARCH 31 , 2016

NALCOR ENERGY 2016 Q1 FINANCIAL REPORT 33
NALCOR ENERGYCONDENSED CONSOLIDATED INTERIM FINANCIAL STATEMENTS(Unaudited)MARCH 31 , 2016

NALCOR ENERGY 2016 Q1 FINANCIAL REPORT34
NALCOR ENERGYCONSOLIDATED STATEMENT OF FINANCIAL POSITION(Unaudited)
As at (millions of Canadian dollars) Notes March 31, 2016 December 31, 2015ASSETS Current assets Cash and cash equivalents 101.5 148.5 Restricted cash 1,784.1 1,836.3 Short-term investments 783.1 1,026.2 Trade and other receivables 268.0 270.9 Inventories 77.3 77.9 Current portion of sinking funds 6 1.6 1.6 Prepayments 26.3 14.1 Derivative assets 7.5 9.1 Total current assets 3,049.4 3,384.6 Non-current assets Property, plant and equipment 3 8,848.8 8,317.6 Intangible assets 4 56.5 56.2 Investment property 1.0 1.0 Investment in joint arrangement 1.2 1.2 Long-term investments 7 61.6 90.6 Other long-term assets 6 329.4 326.2 Total assets 12,347.9 12,177.4 Regulatory deferrals 5 135.7 144.3 Total assets and regulatory deferrals 12,483.6 12,321.7 LIABILITIES AND EQUITY Current liabilities Short-term borrowings 8 83.0 97.0 Trade and other payables 905.4 997.1 Current portion of long-term debt 8 233.2 233.4 Derivative liabilities - 5.2 Current portion of other liabilities 10,11,12 8.1 6.1 Total current liabilities 1,229.7 1,338.8 Non-current liabilities Long-term debt 8 6,008.0 6,008.1 Class B limited partnership units 9 250.4 207.4 Deferred credits 10 772.9 670.3 Deferred contributions 11 11.8 11.6 Decommissioning liabilities 12 102.9 102.0 Long-term payables 62.1 62.6 Employee benefits liability 137.2 135.3 Total liabilities 8,575.0 8,536.1 Shareholder’s equity Share capital 15 122.5 122.5 Shareholder contributions 15 2,266.4 2,203.8 Reserves 3.2 2.3 Retained earnings 1,155.0 1,127.0 Total equity 3,547.1 3,455.6 Total liabilities and equity 12,122.1 11,991.7 Regulatory deferrals 5 361.5 330.0 Total liabilities, equity and regulatory deferrals 12,483.6 12,321.7
Commitments and contingencies (Note 22) Subsequent event (Note 26)
See accompanying notes

NALCOR ENERGY 2016 Q1 FINANCIAL REPORT 35
Three months endedFor the period ended March 31 (millions of Canadian dollars) Notes 2016 2015 (Note 25)Energy sales 253.5 275.1 Other revenue 9.5 10.9 Revenue 263.0 286.0 Fuels 72.6 81.3 Power purchased 17.6 18.2 Operating costs 16 59.1 63.0 Production costs 17 5.2 3.1 Depreciation, depletion and amortization 3,4 29.5 22.9 Exploration and evaluation - 0.2 Net finance (income) expense 18 19.0 18.0 Other (income) expense 19 (8.3) 2.3 Profit before regulatory adjustments 68.3 77.0 Regulatory adjustments 5 40.3 47.7 Profit for the period 28.0 29.3 Other comprehensive income for the period 0.9 13.5 Total comprehensive income for the period 28.9 42.8
See accompanying notes
Employee Share Shareholder Fair Value Benefit Retained (millions of Canadian dollars) Notes Capital Contributions Reserve Reserve Earnings TotalBalance at January 1, 2016 122.5 2,203.8 38.7 (36.4) 1,127.0 3,455.6 Profit for the period - - - - 28.0 28.0 Other comprehensive income Net change in fair value of available-for-sale financial instruments 14 - - 3.0 - - 3.0 Net change in fair value of cash flow hedge 14 - - (3.3) - - (3.3) Net change in fair value of financial instruments reclassified to profit or loss 14 - - 1.0 - - 1.0 Regulatory adjustment 5,14 - - - 0.2 - 0.2 Total comprehensive income for the period - - 0.7 0.2 28.0 28.9 Shareholder contributions 15 - 62.6 - - - 62.6 Balance at March 31, 2016 122.5 2,266.4 39.4 (36.2) 1,155.0 3,547.1 Balance at January 1, 2015 122.5 1,469.1 40.5 (56.3) 1,146.2 2,722.0 Profit for the period - - - - 29.3 29.3 Other comprehensive income Net change in fair value of available-for-sale financial instruments 14 - - 16.5 - - 16.5 Net change in fair value of cash flow hedge 14 - - (2.5) - - (2.5) Net change in fair value of financial instruments reclassified to profit or loss 14 - - (0.5) - - (0.5)Total comprehensive income for the period - - 13.5 - 29.3 42.8 Shareholder contributions 15 - 37.3 - - - 37.3 Balance at March 31, 2015 122.5 1,506.4 54.0 (56.3) 1,175.5 2,802.1
See accompanying notes
NALCOR ENERGYCONSOLIDATED STATEMENT OF PROFIT AND COMPREHENSIVE INCOME(Unaudited)
NALCOR ENERGYCONSOLIDATED STATEMENT OF CHANGES IN EQUITY(Unaudited)

NALCOR ENERGY 2016 Q1 FINANCIAL REPORT36
NALCOR ENERGYCONSOLIDATED STATEMENT OF CASH FLOWS(Unaudited)
Three months endedFor the period ended March 31 (millions of Canadian dollars) Notes 2016 2015
Cash provided from (used in)
Operating activities
Profit for the period 28.0 29.3
Adjusted for items not involving a cash flow:
Depreciation, depletion and amortization 3,4 29.5 22.9
Amortization of deferred contributions 11 (0.3) (0.2)
Amortization of deferred credits 10 (0.9) (0.5)
Accretion 18 2.0 1.3
Employee benefits 1.9 2.0
Loss on disposal of property, plant and equipment 19 0.4 0.1
Regulatory adjustments 5 40.1 47.7
Other (5.8) (0.6)
94.9 102.0
Changes in non-cash working capital balances 23 (19.1) (20.4)
Net cash provided from operating activities 75.8 81.6
Investing activities
Additions to property, plant and equipment 24 (451.2) (392.7)
Additions to intangible assets 4 (2.5) (2.3)
Decrease in long-term receivables 6 1.7 28.6
Increase in sinking fund (2.3) (2.4)
Additions to financial transmission rights (1.4) (0.4)
Decrease in short-term investments 243.1 1.1
Decrease in long-term investments 7 29.0 419.1
Changes in non-cash working capital balances 23 (79.8) (5.7)
Net cash (used in) provided from investing activities (263.4) 45.3
Financing activities
Retirement of long-term debt (0.1) -
Decrease (increase) in restricted cash 52.2 (147.9)
Class B limited partnership unit contributions 9 38.3 -
Decrease in short-term borrowings 8 (14.0) (11.0)
Decrease in long-term payables (1.4) (1.6)
Increase in shareholder contributions 15 62.6 37.3
Increase (decrease) in deferred contributions 11 0.5 (3.5)
Increase in deferred credits 2.5 4.7
Net cash provided from (used in) financing activities 140.6 (122.0)
Net (decrease) increase in cash and cash equivalents (47.0) 4.9
Cash and cash equivalents, beginning of period 148.5 60.8
Cash and cash equivalents, end of period 101.5 65.7
Interest received 8.1 14.2
Interest paid 34.3 34.2
See accompanying notes

NALCOR ENERGY 2016 Q1 FINANCIAL REPORT 37
1. DESCRIPTION OF BUSINESS
Nalcor Energy (Nalcor or the Company) is incorporated under a special act of the Legislature of the Province of Newfoundland and
Labrador (the Province) as a Crown corporation and its business includes the development, generation and sale of electricity, oil and
gas, industrial fabrication and energy marketing. Nalcor’s head office is located at 500 Columbus Drive in St. John’s, Newfoundland and
Labrador A1B 0C9, Canada.
1.1 SUBSIDIARIES
Nalcor holds interests in the following subsidiaries:
A 100.0% interest in Newfoundland and Labrador Hydro (Hydro), whose principal activity is the generation, transmission and sale of
electricity. Hydro’s operations include both regulated and non-regulated activities.
A 100.0% interest in Nalcor Energy – Oil and Gas Inc. (Oil and Gas), a company with a broad mandate to engage in upstream and
downstream sectors of the oil and gas industry including exploration, development, production, transportation and processing.
A 100.0% interest in Nalcor Energy – Bull Arm Fabrication Inc. (Bull Arm Fabrication), an industrial fabrication site with a fully integrated
infrastructure to support large-scale fabrication and assembly. Its facilities include onshore fabrication halls and shops, a dry-dock and
a deep water site.
A 100.0% interest in Muskrat Falls Corporation (Muskrat Falls), created to develop, construct, finance and operate the Muskrat Falls plant,
an 824 megawatt (MW) hydroelectric generating facility in Labrador.
A 100.0% interest in Labrador Transmission Corporation (Labrador Transco), created to develop, construct, finance and operate transmission
assets connecting the Muskrat Falls plant to the existing hydroelectric generating facility in Churchill Falls.
A limited partnership interest in the Labrador-Island Link Limited Partnership (LIL LP), created to develop, construct, finance and operate
the assets and property constituting the Labrador-Island Link (LIL), a transmission link to be constructed between the Muskrat Falls plant
and the Newfoundland and Labrador Island Interconnected System. Labrador-Island Link Holding Corporation (LIL Holdco) holds 100.0%
of the Class A and Class C limited partnership units.
A 100.0% interest in Labrador-Island Link General Partner Corporation (LIL GP) and LIL Holdco, created to control, manage and hold
Nalcor’s 65.0% interest in the LIL LP.
A 100.0% interest in Labrador-Island Link Operating Corporation (LIL Opco), created to operate and maintain the LIL.
A 100.0% interest in Lower Churchill Management Corporation (LCMC), created to carry out the project development and management
functions for Phase 1 of the Lower Churchill Project (LCP) including planning, engineering and design management, construction
management, risk management, finance, procurement and supply chain management.
A 100.0% interest in Nalcor Energy Marketing Corporation (Energy Marketing), a subsidiary established to market Nalcor’s energy
throughout North America.
Nalcor also holds a 100.0% interest in Gull Island Power Corporation (GIPCo) and a 51.0% interest in Lower Churchill Development
Corporation (LCDC), both of which are inactive.
NALCOR ENERGYNOTES TO THE CONDENSED CONSOLIDATED INTERIM FINANCIAL STATEMENTS(Unaudited)

NALCOR ENERGY 2016 Q1 FINANCIAL REPORT38
1.2 INVESTMENT IN JOINT ARRANGEMENT
Nalcor holds a 65.8% beneficial interest (through Hydro) in Churchill Falls (Labrador) Corporation Limited (Churchill Falls), a joint operation
that owns and operates a hydroelectric generating plant and related transmission facilities situated in Labrador with a rated capacity
of 5,428 MW.
Nalcor holds a 33.33% beneficial interest (through Churchill Falls) in Twin Falls Power Corporation (Twin Falls).
1.3 VARIABLE INTEREST ENTITIES
Nalcor consolidates the results of variable interest entities (VIEs) in which it holds a financial interest and is the primary beneficiary.
Nalcor has determined that it is the primary beneficiary of the LIL Construction Project Trust (Project Trust) and as a result has included
the financial statements of the Project Trust in these condensed consolidated interim financial statements. Nalcor has determined that
it is not the primary beneficiary of the Muskrat Falls/Labrador Transmission Assets (MF/LTA) Funding Trust or the LIL Funding Trust and
therefore the operations of these trusts are not reflected in these financial statements.
2. SIGNIFICANT ACCOUNTING POLICIES
2.1 STATEMENT OF COMPLIANCE AND BASIS OF MEASUREMENT
These condensed consolidated interim financial statements have been prepared in accordance with International Accounting Standard
(IAS) 34 Interim Financial Reporting and have been prepared using accounting policies consistent with those used in the preparation of
the annual audited consolidated financial statements for the year ended December 31, 2015.
These condensed consolidated interim financial statements do not include all of the disclosures normally found in Nalcor’s annual audited
consolidated financial statements and should be read in conjunction with the annual audited consolidated financial statements. Interim
results will fluctuate due to the seasonal nature of electricity demand and water flows, as well as timing and recognition of regulatory items.
Due to higher electricity demand during the winter months, revenue from electricity sales is higher during the first and fourth quarters.
These condensed consolidated interim financial statements have been prepared on a historical cost basis, except for financial instruments at
fair value through profit or loss and available-for-sale financial assets which have been measured at fair value. The condensed consolidated
interim financial statements are presented in Canadian Dollars (CAD) and all values rounded to the nearest million, except when
otherwise noted. The condensed consolidated interim financial statements were approved by Nalcor’s Board of Directors on May 12, 2016.
2.2 BASIS OF CONSOLIDATION
The condensed consolidated interim financial statements include the financial statements of Nalcor, its subsidiary companies and its
share of investments in joint arrangements. In addition, the financial statements of all VIEs for which Nalcor has been determined the
primary beneficiary are included in these condensed consolidated interim financial statements. Intercompany transactions and balances
have been eliminated upon consolidation.
Effective June 18, 1999, Hydro, Churchill Falls, and Hydro-Québec entered into a shareholders’ agreement (the Shareholders’ Agreement)
which provided, among other matters, that certain of the strategic operating, financing and investing policies of Churchill Falls be
subject to approval jointly by representatives of Hydro and Hydro-Québec on Churchill Falls’ Board of Directors. Although Hydro holds
NALCOR ENERGYNOTES TO THE CONDENSED CONSOLIDATED INTERIM FINANCIAL STATEMENTS(Unaudited)

NALCOR ENERGY 2016 Q1 FINANCIAL REPORT 39
a 65.8% ownership interest, the agreement changed the nature of the relationship between Hydro and Hydro-Québec, with respect
to Churchill Falls, from that of majority and minority shareholders, respectively, to that of a joint operation. Accordingly, Hydro has
recognized its share of assets, liabilities and profit or loss in relation to its interest in Churchill Falls subsequent to the effective date of the
Shareholders’ Agreement.
Churchill Falls investment in Twin Falls is accounted for using the equity method.
Substantially all of Oil and Gas’ activities are conducted jointly with others and, accordingly, these condensed consolidated interim
financial statements reflect only Nalcor’s proportionate interest in such activities.
3. PROPERTY, PLANT AND EQUIPMENT
Petroleum Transmission and Natural Generation and Gas Construction (millions of Canadian dollars) Plant Distribution Properties Other in Progress Total
Cost
Balance at January 1, 2015 1,527.5 718.2 837.2 207.9 3,016.4 6,307.2
Additions (0.2) - 221.2 - 2,538.8 2,759.8
Disposals (3.0) (3.1) - (3.6) - (9.7)
Transfers 179.1 58.7 - 23.6 (261.4) -
Decommissioning liabilities and revisions 0.5 (0.3) 58.4 - - 58.6
Other adjustments - - - 190.9 (111.6) 79.3
Balance at December 31, 2015 1,703.9 773.5 1,116.8 418.8 5,182.2 9,195.2
Additions - - 50.6 - 508.3 558.9
Disposals (0.2) (0.2) - (0.3) - (0.7)
Transfers 0.1 - - - (0.1) -
Balance at March 31, 2016 1,703.8 773.3 1,167.4 418.5 5,690.4 9,753.4
Depreciation, depletion and impairment
Balance at January 1, 2015 369.6 118.6 95.9 64.3 - 648.4
Depreciation and depletion 44.1 21.9 14.8 12.0 - 92.8
Impairment - - 61.7 - - 61.7
Disposals (1.5) (0.8) - (2.3) - (4.6)
Other adjustments - - - 79.3 - 79.3
Balance at December 31, 2015 412.2 139.7 172.4 153.3 - 877.6
Depreciation and depletion 11.7 5.8 6.7 3.1 - 27.3
Disposals - - - (0.3) - (0.3)
Balance at March 31, 2016 423.9 145.5 179.1 156.1 - 904.6
Carrying value
Balance at January 1, 2015 1,157.9 599.6 741.3 143.6 3,016.4 5,658.8
Balance at December 31, 2015 1,291.7 633.8 944.4 265.5 5,182.2 8,317.6
Balance at March 31, 2016 1,279.9 627.8 988.3 262.4 5,690.4 8,848.8
NALCOR ENERGYNOTES TO THE CONDENSED CONSOLIDATED INTERIM FINANCIAL STATEMENTS(Unaudited)

NALCOR ENERGY 2016 Q1 FINANCIAL REPORT40
4. INTANGIBLE ASSETS
Computer Feasibility Exploration Intellectual (millions of Canadian dollars) Software Studies Assets Property Total
Cost
Balance at January 1, 2015 11.5 1.8 13.0 8.6 34.9
Additions 2.4 - 27.6 - 30.0
Balance at December 31, 2015 13.9 1.8 40.6 8.6 64.9
Additions 1.2 - 1.3 - 2.5
Balance at March 31, 2016 15.1 1.8 41.9 8.6 67.4
Amortization
Balance at January 1, 2015 3.0 1.0 - - 4.0
Amortization 1.4 0.2 3.1 - 4.7
Balance at December 31, 2015 4.4 1.2 3.1 - 8.7
Amortization 0.3 0.1 1.8 - 2.2
Balance at March 31, 2016 4.7 1.3 4.9 - 10.9
Carrying value
Balance at January 1, 2015 8.5 0.8 13.0 8.6 30.9
Balance at December 31, 2015 9.5 0.6 37.5 8.6 56.2
Balance at March 31, 2016 10.4 0.5 37.0 8.6 56.5
5. REGULATORY DEFERRALS
Remaining Recovery January 1 Regulatory March 31 Settlement 2016 activity 2016 Period (years)
Regulatory asset deferrals
Foreign exchange losses 56.2 (0.5) 55.7 25.75
Foreign exchange on fuel 0.7 (1.2) (0.5) n/a
Deferred lease costs 5.1 - 5.1 n/a
2014 cost deferral 38.6 (4.6) 34.0 n/a
2015 cost deferral 27.8 (0.7) 27.1 n/a
Fuel supply deferral 9.6 (1.7) 7.9 n/a
Deferred energy conservation costs 6.3 0.1 6.4 n/a
144.3 (8.6) 135.7
Regulatory liability deferrals
Rate stabilization plan (RSP) (324.6) (31.7) (356.3) n/a
Insurance amortization and proceeds (5.0) 0.2 (4.8) n/a
Deferred power purchase savings (0.4) - (0.4) 11.25
(330.0) (31.5) (361.5)
NALCOR ENERGYNOTES TO THE CONDENSED CONSOLIDATED INTERIM FINANCIAL STATEMENTS(Unaudited)

NALCOR ENERGY 2016 Q1 FINANCIAL REPORT 41
5.1 REGULATORY ADJUSTMENTS RECORDED IN THE CONSOLIDATED STATEMENT OF PROFIT AND COMPREHENSIVE INCOME
Three months ended
For the period ended March 31 (millions of Canadian dollars) 2016 2015
RSP amortization (4.4) 20.5
Rural rate adjustment (2.0) 3.5
RSP fuel deferral 32.0 19.6
RSP interest 6.1 4.7
Total RSP activity 31.7 48.3
Amortization of deferred foreign exchange losses 0.5 0.6
2014 cost deferral 4.6 -
2015 cost deferral 0.7 -
Fuel supply deferral 1.7 -
Deferred foreign exchange on fuel 1.2 (0.2)
Deferred energy conservation (0.1) (0.1)
Employee benefits actuarial loss 0.2 -
Insurance amortization and proceeds (0.2) (0.2)
Deferred lease costs - (0.7)
40.3 47.7
The following section describes Hydro’s regulatory deferrals which will be, or are expected to be, reflected in customer rates in future
periods and have been established through the rate setting process. In the absence of rate regulation, these amounts would be
reflected in operating results in the year and profit for the period ended March 31, 2016 would have increased by $40.3 million
(2015 - $47.7 million).
5.2 FUEL SUPPLY DEFERRAL
Pursuant to Order No. P.U. 56 (2014), Hydro received approval in 2014 to defer $9.6 million as a regulatory asset in additional capacity
related supply costs incurred during the three months ended March 31, 2014. Recovery of this balance is subject to a future PUB Order. In
April 2016, Hydro received Order No. P.U. 13 (2016) which outlines the results of a Prudence Review of certain projects and expenditures
of Hydro. As a result, Hydro recorded in regulatory adjustments an expense of $1.7 million and a corresponding reduction to the Fuel
Supply Deferral. Please also refer to Note 22 of these condensed consolidated interim financial statements.
5.3 2014 COST DEFERRAL
As per Order No. P.U. 58 (2014), Hydro received approval in 2014 to defer $45.9 million in relation to Hydro’s proposed 2014 revenue
requirement with recovery subject to a future PUB Order. In 2015, Hydro decreased this regulatory asset by $7.3 million to recognize an
allowance for adjustments to certain costs that were discussed through the General Rate Application (GRA) process. In April 2016, Hydro
received Order No. P.U. 13 (2016) which outlines the results of a Prudence Review of certain projects and expenditures of Hydro. As a
result, Hydro recorded an expense of $4.6M and a corresponding reduction to the 2014 Cost Deferral. Please also refer to Note 22 of these
condensed consolidated interim financial statements.
NALCOR ENERGYNOTES TO THE CONDENSED CONSOLIDATED INTERIM FINANCIAL STATEMENTS(Unaudited)

NALCOR ENERGY 2016 Q1 FINANCIAL REPORT42
5.4 2015 COST DEFERRAL
As per Order No. P.U. 36 (2015), Hydro received approval to defer $30.2 million in relation to Hydro’s proposed 2015 net profit deficiency
with recovery subject to a future PUB Order. Accordingly, these costs have been recognized as a regulatory asset. In 2015, Hydro
decreased the regulatory asset by $2.4 million to recognize an allowance for adjustments to certain costs that were discussed through
the GRA process. In April 2016, Hydro received Order No. P.U. 13 (2016) which outlines the results of a Prudence Review of certain
projects and expenditures of Hydro. As a result, Hydro recorded an expense of $0.7 million and a corresponding reduction to the 2015
Cost Deferral. Please also refer to Note 22 of these condensed consolidated interim financial statements.
6. OTHER LONG-TERM ASSETS
March 31 December 31As at (millions of Canadian dollars) 2016 2015
Long-term receivables (a) 1.9 3.6
Long-term prepayments 7.7 9.2
Reserve fund 30.9 30.9
Sinking funds 290.0 283.6
Other 0.5 0.5
Other long-term assets, end of period 331.0 327.8
Less: current portion of sinking funds (1.6) (1.6)
329.4 326.2
(a) As at March 31, 2016, long-term receivables include $1.6 million (2015 - $3.3 million) related to long-term advances to suppliers in
relation to construction of the Lower Churchill Project. The current portion of $89.8 million (2015 - $88.8 million) is included in trade
and other receivables. The remaining $0.3 million (2015 - $0.3 million) includes the non-current portion of receivables associated
with customer payment plans and the long-term portion of employee purchase programs.
NALCOR ENERGYNOTES TO THE CONDENSED CONSOLIDATED INTERIM FINANCIAL STATEMENTS(Unaudited)

NALCOR ENERGY 2016 Q1 FINANCIAL REPORT 43
7. LONG-TERM INVESTMENTS
Long-term investments consist of structured deposit notes of $844.6 million (2015 - $1,115.8 million) related to Muskrat Falls, Labrador
Transco and the LIL Partnership.
Year of March 31 December 31As at (millions of Canadian dollars) Maturity 2016 2015
Muskrat Falls
$75.0 million Floating Rate Deposit Note, with interest paid at the one-month
Canadian Dealer Offer Rate (CDOR) plus 0.38%. 2017 57.0 57.0
$478.2 million Amortizing Floating Rate Deposit Note, with interest paid at the
one-month CDOR plus 0.38%. 2016 38.6 53.6
$1,912.7 million Amortizing Fixed Rate Deposit Note, with interest paid at a
rate of 1.5937% per annum. 2016 154.4 214.2
Labrador Transco
$75.0 million Floating Rate Deposit Note, with interest paid at the one-month
Canadian Dealer Offer Rate (CDOR) plus 0.38%. 2017 18.0 18.0
$478.2 million Amortizing Floating Rate Deposit Note, with interest paid at the
one-month CDOR plus 0.38%. 2016 12.2 16.9
$1,912.7 million Amortizing Fixed Rate Deposit Note, with interest paid at a
rate of 1.5937% per annum. 2016 48.8 67.6
LIL LP
$75.0 million Floating Rate Deposit Note, with interest paid at the one-month
Canadian Dealer Offer Rate (CDOR) plus 0.38%. 2017 75.0 75.0
$883.5 million Amortizing Floating Rate Deposit Note, with interest paid at the
one-month CDOR plus 0.38%. 2016 176.2 245.4
$1,325.3 million Amortizing Fixed Rate Deposit Note, with interest paid at a
rate of 1.6182% per annum. 2016 264.4 368.1
Long-term investments, end of period 844.6 1,115.8
Less: redemptions to be received within one year (a) (783.0) (1,025.2)
61.6 90.6
(a) Redemptions to be received within one year have been reclassified to short-term investments.
NALCOR ENERGYNOTES TO THE CONDENSED CONSOLIDATED INTERIM FINANCIAL STATEMENTS(Unaudited)

NALCOR ENERGY 2016 Q1 FINANCIAL REPORT44
8. DEBT
8.1 SHORT-TERM BORROWINGS
Nalcor maintains a $250.0 million CAD or USD equivalent committed revolving term credit facility with its banker, with a maturity date of
January 31, 2017. There were no amounts drawn on this facility as at March 31, 2016 (2015 - $nil). Borrowings in CAD may take the form
of Prime Rate Advances, Bankers' Acceptances (BAs) and letters of credit. Borrowings in USD may take the form of Base Rate Advances,
London Interbank Offer Rate (LIBOR) Advances and letters of credit. The facility also provides coverage for overdrafts on Nalcor's bank
accounts, with interest calculated at the Prime Rate.
Nalcor has issued eleven irrevocable letters of credit, with a total value of $20.1 million. Two of these letters, totaling $13.2 million, are in
favour of Oil and Gas to ensure compliance with regulations relating to petroleum and natural gas exploration and production activities.
On February 22, 2016, Nalcor, on behalf of Oil and Gas, issued an irrevocable letter of credit in the amount of $10.0 million to the
Canada-Newfoundland and Labrador Offshore Petroleum Board. The purpose of the letter was to provide proof of financial responsibility
with respect to the Hibernia South Extension project. This letter replaces a $1.5 million irrevocable letter of credit, which was previously
issued by Nalcor on behalf of Oil and Gas, and cancelled during the quarter. Another nine letters, totalling $6.9 million, are in favour
of Energy Marketing and relate to collateral requirements in the Québec, Ontario, New York, New England, Midwest United States and
Pennsylvania-New Jersey-Maryland (PJM) electricity markets.
Hydro maintains a $50.0 million CAD or USD equivalent unsecured demand operating credit facility with its banker and as at March 31,
2016 there were no amounts drawn on this facility (2015 - $nil). Borrowings in CAD may take the form of Prime Rate Advances, BAs and
letters of credit, with interest calculated at the Prime Rate or prevailing Government BA fee. Borrowings in USD may take the form of
Base Rate Advances, LIBOR Advances and letters of credit. The facility also provides coverage for overdrafts on Hydro's bank accounts,
with interest calculated at the Prime Rate. Hydro has issued one irrevocable letter of credit for $0.3 million as a performance guarantee
in relation to the Department of Fisheries and Oceans Fish Habitat Compensation Program.
In addition, Hydro utilized promissory notes to fulfil its short-term funding requirements. Total available short-term borrowings permitted
under the promissory notes program is $300.0 million. As at March 31, 2016, there were $83.0 million in short-term borrowings
outstanding with a maturity date of April 4, 2016 bearing an interest rate of 0.69% (2015 - $97.0 million).
Churchill Falls maintains a $10.0 million CAD or USD equivalent unsecured demand operating credit facility with its banker and as at March
31, 2016, there were no amounts drawn on this facility (2015 - $nil). Borrowings in CAD may take the form of Prime Rate Advances, BAs
or letters of credit, with interest calculated at the Prime Rate or prevailing Government BA fee. Borrowings in USD may take the form
of Base Rate Advances. The facility also provides coverage for overdrafts on Churchill Falls bank accounts, with interest calculated at
the Prime Rate. Churchill Falls has issued three irrevocable letters of credit totaling $2.0 million to ensure satisfactory management of
its waste management and compliance with a certificate of approval for the transportation of special hazardous wastes granted by the
Department of Environment and Conservation.
Oil and Gas maintains a $5.0 million USD or CAD equivalent unsecured credit facility with its banker and as at March 31, 2016, there
were no amounts drawn on this facility (2015 - $nil). Borrowings in CAD may take the form of Prime Rate Advances and letters of credit.
Borrowings in USD may take the form of Base Rate Advances and letters of credit.
NALCOR ENERGYNOTES TO THE CONDENSED CONSOLIDATED INTERIM FINANCIAL STATEMENTS(Unaudited)

NALCOR ENERGY 2016 Q1 FINANCIAL REPORT 45
Energy Marketing maintains a $20.0 million CAD or USD equivalent demand operating credit facility with its banker, and as at March 31,
2016, there was $5.9 million drawn on this facility (2015 - $8.2 million), presented with cash and cash equivalents. This facility has an
unconditional and irrevocable guarantee from Nalcor. Borrowings in CAD may take the form of Prime Rate Advances, BAs and letters of
credit. Borrowings in USD may take the form of Base Rate Advances, LIBOR Advances and letters of credit.
8.2 LONG-TERM DEBT
The following table represents the value of long-term debt measured at amortized cost:
Face Coupon Year of Year of March 31 December 31As at (millions of Canadian dollars) Value Rate % Issue Maturity 2016 2015
Hydro
V* 0.2 10.50 1989 2014 0.2 0.3
X* 150.0 10.25 1992 2017 149.8 149.8
Y* 300.0 8.40 1996 2026 294.7 294.7
AB* 300.0 6.65 2001 2031 305.7 305.7
AD* 125.0 5.70 2003 2033 123.8 123.8
AE 225.0 4.30 2006 2016 224.9 224.8
AF 200.0 3.60 2014 2045 197.1 197.1
LIL LP
Tranche A 725.0 3.76 2013 2033 725.3 725.3
Tranche B 600.0 3.86 2013 2045 600.1 600.1
Tranche C 1,075.0 3.85 2013 2053 1,075.2 1,075.2
Labrador Transco/Muskrat Falls
Tranche A 650.0 3.63 2013 2029 650.2 650.2
Tranche B 675.0 3.83 2013 2037 675.1 675.1
Tranche C 1,275.0 3.86 2013 2048 1,275.2 1,275.2
Total debentures 6,300.2 6,297.3 6,297.3
Less: Sinking fund investments in own debentures 56.1 55.8
6,241.2 6,241.5
Less: payments due within one year 233.2 233.4
Total debentures 6,008.0 6,008.1
* Sinking funds have been established for these issues.
Hydro’s promissory notes and debentures are unsecured and unconditionally guaranteed as to principal and interest and, where applicable,
sinking fund payments, by the Province. The Province charges Hydro a guarantee fee of 25 basis points annually on total debt (net of
sinking funds) with a remaining term to maturity less than 10 years and 50 basis points annually on total debt (net of sinking funds) with
a remaining term to maturity greater than 10 years. The fee for the period ended March 31, 2016 was $1.1 million (2015 - $1.1 million).
NALCOR ENERGYNOTES TO THE CONDENSED CONSOLIDATED INTERIM FINANCIAL STATEMENTS(Unaudited)

NALCOR ENERGY 2016 Q1 FINANCIAL REPORT46
9. CLASS B LIMITED PARTNERSHIP UNITS
Debt and equity instruments issued by LIL LP are classified as either financial liabilities or as equity in accordance with the substance of the
contractual arrangements and the definitions of a financial liability and an equity instrument.
The Class B limited partnership units represent Emera NL’s ownership interest in the Partnership. As described in the Partnership Agreement,
these units have certain rights and obligations, including mandatory distributions, that indicate that the substance of the units represent a
financial liability and are measured at amortized cost using the effective interest method. The return on the units is classified as a finance
expense. All finance expenses associated with the units have been capitalized.
March 31 December 31As at (millions of Canadian dollars) Units 2016 Units 2015
Class B limited partnership units, beginning of period 25 207.4 25 79.4
Contributions - 38.3 - 118.4
Accrued interest - 4.7 - 9.6
Class B limited partnership units, end of period 25 250.4 25 207.4
10. DEFERRED CREDITS
Deferred credits consist of Hydro and Oil and Gas funding from the Province, deferred energy sales to Emera NL and deferred lease revenue.
Hydro Oil and Gas Deferred Deferred Wind Program Energy Lease (millions of Canadian dollars) Funding Funding Sales Revenue Total
Deferred credits, beginning of period 0.5 5.9 659.0 8.9 674.3
Additions 0.8 - 103.0 1.7 105.5
Amortization (0.6) - - (0.3) (0.9)
Deferred credits, end of period 0.7 5.9 762.0 10.3 778.9
Less: current portion (0.7) (3.6) - (1.7) (6.0)
- 2.3 762.0 8.6 772.9
Hydro has received funding from the Province for wind feasibility studies in Labrador. Oil and Gas has received funding from the Province
for oil and gas exploration initiatives. Funding related to these studies and programs is amortized to income directly against the related
expenditures as the costs are incurred.
Nalcor has recorded deferred energy sales of $762.0 million (2015 - $659.0 million) which equals the construction costs to date incurred by
Emera. Nalcor has determined that it controls the Maritime Link asset for financial reporting purposes, and as such, has recorded the costs
as a component of property, plant and equipment under construction.
NALCOR ENERGYNOTES TO THE CONDENSED CONSOLIDATED INTERIM FINANCIAL STATEMENTS(Unaudited)

NALCOR ENERGY 2016 Q1 FINANCIAL REPORT 47
11. DEFERRED CONTRIBUTIONS
Nalcor has received contributions in aid of construction of property, plant and equipment. These contributions are deferred and amortized
to other revenue over the life of the related item of property, plant and equipment.
March 31 December 31As at (millions of Canadian dollars) 2016 2015
Deferred contributions, beginning of period 12.7 15.8
Additions 0.5 1.4
Adjustments - (3.6)
Amortization (0.3) (0.9)
Deferred contributions, end of period 12.9 12.7
Less: current portion (1.1) (1.1)
11.8 11.6
12. DECOMMISSIONING LIABILITIES
Nalcor has recognized liabilities associated with the retirement of portions of the Holyrood Thermal Generating Station, disposal of
Polychlorinated Biphenyls and decommissioning liabilities resulting from its net ownership interests in petroleum and natural gas properties
and related well sites.
The reconciliation of beginning and ending carrying amounts of decommissioning liabilities as at March 31, 2016 and December 31, 2015
are as follows:
March 31 December 31As at (millions of Canadian dollars) 2016 2015
Decommissioning liabilities, beginning of period 103.0 43.2
Liabilities settled (0.1) (0.2)
Accretion 1.0 1.4
Revisions - 58.6
Decommissioning liabilities, end of period 103.9 103.0
Less: current portion (1.0) (1.0)
102.9 102.0
13. EMPLOYEE BENEFITS LIABILITY
13.1 PENSION PLAN
Employees participate in the Province’s Public Service Pension Plan, a multi-employer defined benefit plan. The employer’s contributions
of $2.9 million (2015 - $2.6 million) are expensed as incurred.
NALCOR ENERGYNOTES TO THE CONDENSED CONSOLIDATED INTERIM FINANCIAL STATEMENTS(Unaudited)

NALCOR ENERGY 2016 Q1 FINANCIAL REPORT48
13.2 OTHER BENEFITS
Nalcor provides group life insurance and health care benefits on a cost-shared basis to retired employees, and in certain cases, their
surviving spouses, in addition to a severance payment upon retirement. In 2016, cash payments to beneficiaries for its unfunded other
employee future benefits were $1.1 million (2015 - $1.1 million). An actuarial valuation was performed as at December 31, 2015, with an
extrapolation to December 31, 2016.
Three months endedFor the period ended March 31 (millions of Canadian dollars) 2016 2015
Component of benefit cost
Current service cost 1.5 1.5
Interest cost 1.5 1.6
Total benefit expense for the period 3.0 3.1
14. ACCUMULATED OTHER COMPREHENSIVE INCOME
The components of, and changes in, accumulated other comprehensive income (loss) are as follows:
Items that may be reclassified to profit or loss:
Three months endedFor the period ended March 31 (millions of Canadian dollars) 2016 2015
Employee benefits liability
Balance, beginning of period (36.4) (56.3)
Regulatory adjustment 0.2 -
Balance, end of period (36.2) (56.3)
Three months endedFor the period ended March 31 (millions of Canadian dollars) 2016 2015
Available-for-sale financial instruments
Balance, beginning of period 45.0 44.6
Net fair value gain on available-for-sale during the period 3.0 16.5
Reclassification adjustments related to disposals during the period (2.5) (2.5)
Balance, end of period 45.5 58.6
Three months endedFor the period ended March 31 (millions of Canadian dollars) 2016 2015
Cash flow hedges
Balance, beginning of period (6.3) (4.1)
Fair value losses during the period (3.3) (2.5)
Reclassification adjustments for amounts recognized in profit or loss 3.5 2.0
Balance, end of period (6.1) (4.6)
NALCOR ENERGYNOTES TO THE CONDENSED CONSOLIDATED INTERIM FINANCIAL STATEMENTS(Unaudited)

NALCOR ENERGY 2016 Q1 FINANCIAL REPORT 49
15. SHAREHOLDER'S EQUITY
15.1 SHARE CAPITAL
March 31 December 31As at (millions of Canadian dollars) 2016 2015
Common shares of par value $1 each
Authorized - unlimited
Issued and outstanding - 122,500,000 122.5 122.5
15.2 SHAREHOLDER CONTRIBUTIONS
March 31 December 31As at (millions of Canadian dollars) 2016 2015
Total shareholder contributions 2,266.4 2,203.8
During 2016, Nalcor’s shareholder contributed capital in the amount of $62.6 million (2015 - $734.6 million) in relation to Nalcor's
capital expenditures.
During 2016, the Churchill Falls (Labrador) Corporation Trust (the Trust) contributed capital in the amount of $nil (2015 - $0.1 million).
16. OPERATING COSTS Three months endedFor the period ended March 31 (millions of Canadian dollars) 2016 2015
Salaries and benefits expense 36.5 36.7
Transmission rental 5.1 5.0
Maintenance and materials 5.5 6.5
Professional services 3.9 4.8
Travel and transportation 1.5 2.1
Rental and royalty expense 2.5 2.6
Equipment rental 1.4 1.4
Other operating costs 2.7 3.9
59.1 63.0
17. PRODUCTION COSTS Three months endedFor the period ended March 31 (millions of Canadian dollars) 2016 2015
Processing and marketing expense 1.0 0.4
Transportation and transshipment expense 0.8 0.5
Project operating costs 3.4 2.2
5.2 3.1
NALCOR ENERGYNOTES TO THE CONDENSED CONSOLIDATED INTERIM FINANCIAL STATEMENTS(Unaudited)

NALCOR ENERGY 2016 Q1 FINANCIAL REPORT50
18. NET FINANCE (INCOME) EXPENSE Three months endedFor the period ended March 31 (millions of Canadian dollars) 2016 2015
Finance income
Interest on sinking fund 3.8 3.5
Interest on reserve fund 0.2 0.2
Interest on investments 3.7 10.7
Interest on restricted cash 3.6 2.9
Other interest income 0.3 0.3
11.6 17.6
Finance expense
Long-term debt 68.7 68.7
Class B limited partnership units 4.7 1.7
Debt guarantee fee 1.1 1.1
Accretion 2.0 1.3
Other 0.5 0.4
77.0 73.2
Interest capitalized during construction (46.4) (37.6)
30.6 35.6
Net finance (income) expense 19.0 18.0
19. OTHER (INCOME) EXPENSE Three months endedFor the period ended March 31 (millions of Canadian dollars) 2016 2015
Mark-to-market of commodity swaps (1.7) (0.6)
Settlement of commodity swaps (9.5) (2.4)
Mark-to-market of foreign exchange forward contracts (0.6) 3.4
Financial transmission rights income and amortization (0.1) (0.3)
Loss on disposal of property, plant and equipment 0.4 0.1
Asset disposal costs 0.2 (0.1)
Foreign exchange loss 3.0 2.2
Other (income) expense (8.3) 2.3
20. FINANCIAL INSTRUMENTS AND RISK MANAGEMENT
20.1 FAIR VALUE
The estimated fair values of financial instruments as at March 31, 2016 and December 31, 2015 are based on relevant market prices
and information available at the time. Fair value estimates are based on valuation techniques which are significantly affected by the
assumptions used including the amount and timing of future cash flows and discount rates reflecting various degrees of risk. As such, the
fair value estimates below are not necessarily indicative of the amounts that Nalcor might receive or incur in actual market transactions.
NALCOR ENERGYNOTES TO THE CONDENSED CONSOLIDATED INTERIM FINANCIAL STATEMENTS(Unaudited)

NALCOR ENERGY 2016 Q1 FINANCIAL REPORT 51
As a significant number of Nalcor’s assets and liabilities do not meet the definition of a financial instrument, the fair value estimates
below do not reflect the fair value of Nalcor as a whole.
Establishing Fair Value
Financial instruments recorded at fair value are classified using a fair value hierarchy that reflects the nature of the inputs used in making
the measurements. The fair value hierarchy has the following levels:
Level 1 - valuation based on quoted prices (unadjusted) in active markets for identical assets or liabilities.
Level 2 - valuation techniques based on inputs other than quoted prices included in Level 1 that are observable for the asset or
liability, either directly (i.e. as prices) or indirectly (i.e. derived from prices).
Level 3 - valuation techniques using inputs for the asset or liability that are not based on observable market data (unobservable inputs).
The fair value hierarchy requires the use of observable market inputs whenever such inputs exist. A financial instrument is classified
to the lowest level of the hierarchy for which a significant input has been considered in measuring fair value. For assets and liabilities
that are recognized at fair value on a recurring basis, the Company determines whether transfers have occurred between levels in the
hierarchy by reassessing categorization (based on the lowest level input that is significant to the fair value measurement as a whole) at
the end of each reporting period. There were no transfers between Level 1, 2 and 3 fair value measurement for the period ended March
31, 2016 and the year ended December 31, 2015. Carrying Fair Carrying Fair Level Value Value Value Value
(millions of Canadian dollars) March 31, 2016 December 31, 2015
Financial assets
Derivative assets 2,3 7.5 7.5 9.1 9.1
Sinking funds - investments in same Hydro issue 2 56.1 69.3 55.8 69.9
Sinking funds - other investments 2 290.0 290.0 283.6 283.6
Long-term investments 2 61.6 61.6 90.6 90.6
Reserve fund 2 30.9 30.9 30.9 30.9
Long-term receivables1 2 1.9 1.9 3.6 3.6
Financial liabilities
Derivative liabilities 2 - - 5.2 5.2
Long-term debt including amount due within one year
(before sinking funds) 2 6,297.3 7,573.8 6,297.3 7,557.1
Class B limited partnership units 3 250.4 250.4 207.4 207.4
Long-term payables2 2 62.1 84.5 70.0 86.4
1 At March 31, 2016, the long-term receivable relating to the Annual Energy Base of $2.6 million (fair value - $2.8 million) was classified to trade and other receivables.
2 At June 30, 2015, Oil and Gas’ long-term payable balance of $7.1 million was reclassified to trade and other payables. At December 31, 2015, Churchill Falls’ long-term payable balance of $0.3 million was reclassified to trade and other payables.
NALCOR ENERGYNOTES TO THE CONDENSED CONSOLIDATED INTERIM FINANCIAL STATEMENTS(Unaudited)

NALCOR ENERGY 2016 Q1 FINANCIAL REPORT52
The fair value of cash and cash equivalents, restricted cash, short-term investments, trade and other receivables, short-term borrowings
and trade and other payables approximates their carrying values due to their short-term maturity.
The fair values of Level 2 financial instruments are determined using quoted prices in active markets, which in some cases are adjusted
for factors specific to the asset or liability. Level 2 derivative instruments are valued based on observable commodity future curves,
broker quotes or other publicly available data. Level 2 fair values of other risk management assets and liabilities and long-term debt are
determined using observable inputs other than unadjusted quoted prices, such as interest rate yield curves and currency rates.
20.2 RISK MANAGEMENT
Nalcor is exposed to certain credit, liquidity and market price risks through its operating, financing and investing activities. Financial risk
is managed in accordance with a Board approved policy, which outlines the objectives and strategies for the management of financial
risk, including the use of derivative contracts. Permitted financial risk management strategies are aimed at minimizing the volatility of
Nalcor’s expected future cash flows.
Market Risk
Commodity Exposure
As at March 31, 2016, Oil and Gas had 10 remaining commodity price swaps with a notional value of $7.1 million USD. These contracts
will provide an average fixed price of $59.96 USD per barrel on 117,937 barrels of production for the remainder of 2016. During 2016,
$4.1 million in gains have been included in other (income) expense related to commodity price swaps and $2.9 million in unrealized
gains have been included in other comprehensive income. As at March 31, 2016, the fair value of the derivative asset presented on the
Statement of Financial Position was $2.9 million (2015 - $6.9 million).
As at March 31, 2016, Bull Arm Fabrication had 11 remaining foreign exchange forward contracts with a notional value of $14.8 million
USD and an average rate of $1.33 CAD per USD. During 2016, $0.5 million in losses have been included in other (income) expense related
to forward contracts and $1.7 million in unrealized gains have been included in other comprehensive income. As at March 31, 2016, the
fair value of the derivative asset as presented on the Statement of Financial Position was $0.5 million.
As at March 31, 2016, Energy Marketing had 9 remaining foreign exchange forward contracts with a notional value of $24.9 million USD,
and an average rate of $1.34 CAD/USD. During 2016, $0.9 million in losses have been included in other (income) expense related to
foreign exchange forward contracts. At March 31, 2016, $2.3 million in unrealized gains were recognized in other comprehensive income
related to the remaining contracts.
As all of the above outstanding contracts have been designated as hedging instruments, changes in fair value have been recorded in
other comprehensive income.
As at March 31, 2016, Energy Marketing had 16 remaining fixed price commodity swaps with a notional value of $22.8 million USD, and
an average price of $41.29 USD per megawatt hour (peak) and $20.46 USD per megawatt hour (off-peak). During 2016, $3.4 million in
realized gains related to settled commodity swaps and $3.6 million in unrealized gains on remaining contracts were recognized in other
(income) expense. As the above outstanding swaps have not been designated as hedging instruments, changes in fair value have been
recorded in other (income) expense.
NALCOR ENERGYNOTES TO THE CONDENSED CONSOLIDATED INTERIM FINANCIAL STATEMENTS(Unaudited)

NALCOR ENERGY 2016 Q1 FINANCIAL REPORT 53
During 2015, Energy Marketing purchased a series of annual, semi-annual, and monthly financial transmission rights with notional values
of $847,800 USD and $78,900 CAD, respectively, to mitigate risk on congestion during peak transmission hours. During 2016, additional
rights with notional values of $1.0 million USD were purchased to mitigate risk on congestion for the remainder of 2016 and a portion of
2017. As the rights have not been designated as hedging instruments, changes in fair value have been recorded in other (income) expense.
21. RELATED PARTY TRANSACTIONS
Nalcor enters into various transactions with its shareholder and other affiliates. These transactions occur within the normal course of
operations and are measured at the exchange amount, which is the amount of consideration agreed to by the related parties. Related
parties with which Nalcor transacts are as follows:
Related Party Relationship
The Province 100.0% shareholder of Nalcor
Churchill Falls Joint arrangement of Hydro
Twin Falls Joint venture of Churchill Falls
The Trust Created by the Province with Churchill Falls as the beneficiary
LIL LP Partnership in which Nalcor holds 75 Class A Partnership Units
Board of Commissioners of Public Utilities (PUB) Agency of the Province
Routine operating transactions with related parties are settled at prevailing market prices under normal trade terms.
(a) Hydro is required to incur the costs of operations of the PUB as well as the cost of hearings and application costs. For the period
ended March 31, 2016, Hydro incurred $0.3 million (2015 - $0.5 million) in costs related to the PUB. As at March 31, 2016, there is a
balance of $2.6 million (2015 - $4.0 million) included in trade and other payables.
(b) In March 2016, Hydro paid the Province a debt guarantee fee of $4.5 million (2015 - $4.5 million). For the period ended March 31,
2016, $1.1 million (2015 - $1.1 million) has been recorded in net finance (income) expense.
(c) Hydro recognized contributions in aid of construction from the Province related to wind feasibility studies. As at March 31, 2016,
$0.4 million (2015 - $0.4 million) has been recorded in deferred credits.
(d) For the period ended March 31, 2016, Hydro has purchased $6.1 million (2015 - $7.5 million) of power generated from assets related
to Exploits Generation, which are held by the Province. In addition, Hydro operates these assets on behalf of Nalcor and recovered
costs in the amount of $5.7 million (2014 - $2.0 million).
(e) Hydro recorded $0.6 million (2015 - $0.6 million) as an energy rebate from the Province to offset the cost of basic electricity
consumption for Labrador rural isolated residential customers under the Northern Strategic Plan. As at March 31, 2016, there is a
balance of $0.2 million outstanding in trade and other receivables (2015 - $0.4 million).
NALCOR ENERGYNOTES TO THE CONDENSED CONSOLIDATED INTERIM FINANCIAL STATEMENTS(Unaudited)
NALCOR ENERGY 2016 Q1 FINANCIAL REPORT54
(f) Under the terms of the Lease and amendments thereto, Churchill Falls is required to pay the Province an annual rental of 8% of
the consolidated net profits before income taxes and an annual royalty of $0.50 per horsepower year generated, as defined in the
Lease. At March 31, 2016, $3.7 million (2015 - $3.9 million) was payable to the Province. Nalcor has recorded its share of $2.4 million
(2015 - $2.6 million).
(g) Churchill Falls has entered into long-term power contracts with its shareholders for the sale of substantially all of the power
produced by the generating plant. During 2016, revenue from Hydro-Québec was $46.9 million (2015 - $48.0 million), of which
Nalcor has recognized its share of $30.5 million (2015 - $31.6 million).
(h) Churchill Falls tracks the value of differences between energy delivered and the Annual Energy Base over a four year period. The
difference is then recovered from or refunded to Hydro-Québec over the subsequent four year period. The long-term receivable
from Hydro-Québec as at March 31, 2016 is $4.0 million (2015 - $nil) and relates to September 1, 2012 to August 31, 2016. Nalcor
has recorded its share of the long-term receivable as $2.6 million (2015 - $nil).
(i) On February 3, 2010, the Province established the Trust with Churchill Falls as the beneficiary. The purpose of the Trust is to fund the
external costs and expenses incurred in relation to the motion filed by Churchill Falls seeking a modification to the pricing terms of
the 1969 Power Contract. To date, $4.9 million (2015 - $4.8 million) has been received and $43.0 thousand (2015 - $17.0 thousand)
has been accrued as receivable from the Trust. Nalcor has recorded its share of $3.3 million (2015 - $3.3 million) as received and
$28.0 thousand (2015 - $11.0 thousand) accrued as receivable from the Trust.
(j) As at March 31, 2016, Churchill Falls capacity penalty payable was $0.4 million (2015 - $0.4 million), of which Nalcor has recorded
its share of $0.3 million (2015 - $0.3 million). The capacity penalty relates to the supply of power to Hydro-Québec. Churchill Falls
did not incur a capacity penalty in 2016 (2015 - $nil).
(k) Total funding to be received under the Petroleum Exploration Enhancement Program was $4.5 million over five years. For the
period ended March 31, 2016, there were no funds provided. Included in deferred credits at March 31, 2016 is $1.1 million
(2015 - $1.1 million) related to funding received.
(l) Total funding to be received under the Offshore Geoscience Data Project was $14.3 million over four years commencing in 2010.
For the period ended March 31, 2016, no additional funding was received (2015 - $0.5 million). Included in deferred credits at
March 31, 2016 is $2.0 million (2015 - $2.0 million) related to funding received.
(m) The Province provides cash to fund capital expenditures by way of shareholder contributions. For the period ended March 31,
2016, the Province provided $62.6 million (2015 - $37.3 million) in shareholder contributions relating to Oil and Gas, Muskrat Falls,
Labrador Transco and LIL Holdco.
NALCOR ENERGYNOTES TO THE CONDENSED CONSOLIDATED INTERIM FINANCIAL STATEMENTS(Unaudited)

NALCOR ENERGY 2016 Q1 FINANCIAL REPORT 55
22. COMMITMENTS AND CONTINGENCIES
(a) Nalcor and its subsidiaries have received claims instituted by various companies and individuals with respect to power delivery
claims and other miscellaneous matters. Although the outcome of such matters cannot be predicted with certainty, Management
believes Nalcor’s exposure to such claims and litigation, to the extent not covered by insurance or otherwise provided for, is not
expected to materially affect its financial position.
(b) Outstanding commitments for capital projects, excluding those related to Oil and Gas, total approximately $3.2 billion as at
March 31, 2016 (2015 - $3.5 billion).
(c) As part of the LIL Project Finance Agreement (PFA), LIL LP has pledged its current and future assets as security to the Collateral
Agent. Under the terms and conditions of the Project Trust PFA, LIL LP has also provided a guarantee of the Project Trust’s payment
obligations to the Collateral Agent for the benefit of the Labrador-Island Link Funding Trust. LIL LP has pledged the escrow account,
where the pre-funded equity contribution has been deposited, as security to the Collateral Agent.
(d) As part of the Muskrat Falls/Labrador Transmission Assets PFA, Muskrat Falls and Labrador Transco have pledged its present and
future assets as security to the Collateral Agent.
(e) Energy Marketing entered into a three-year agreement with a transmission provider for 18 MW of firm transmission rights and
12 MW of non-firm transmission rights, effective April 1, 2016. Total committed payments for 2016 are $0.8 million USD.
(f) The minimum lease payments associated with the lease arrangement of Bull Arm's assets and facilities over the next five years will
be as follows:
(millions of Canadian dollars) 2016 2017 2018 2019 2020 Thereafter
Minimum lease payments 16.1 3.5 - - - -
(g) On April 28, 2016, Hydro received Order No. P.U. 13 (2016) which outlines the results of a Prudence Review of certain projects and
expenditures of Hydro. These condensed consolidated interim financial statements have been adjusted to reflect Management's
best estimate of the impact of the Prudence Review on regulatory deferrals and financial results, based upon Management's initial
interpretation of the Order’s impacts to the 2014 revenue requirement and the 2015 test year costs. Material adjustments may be
required to the Statement of Financial Position, Profit and Comprehensive Income and Changes in Equity, pending further review
through a compliance filing and final approval by the PUB. Please refer to Note 5 for additional information.
NALCOR ENERGYNOTES TO THE CONDENSED CONSOLIDATED INTERIM FINANCIAL STATEMENTS(Unaudited)

NALCOR ENERGY 2016 Q1 FINANCIAL REPORT56
23. SUPPLEMENTARY CASH FLOW INFORMATION Three months endedFor the period ended March 31 (millions of Canadian dollars) 2016 2015
Trade and other receivables 2.9 (35.4)
Prepayments (10.7) (1.4)
Inventories 0.6 5.2
Trade and other payables (91.7) 5.5
Changes in non-cash working capital balances (98.9) (26.1)
Related to:
Operating activities (19.1) (20.4)
Investing activities (79.8) (5.7)
(98.9) (26.1)
24. SEGMENT INFORMATION
Nalcor operates in seven business segments. Hydro Regulated activities encompass sales of electricity to customers within the Province.
Churchill Falls operates a hydroelectric generating facility which sells electricity to Hydro-Québec and Hydro. Oil and Gas activities include
exploration, development, production, transportation and processing sectors of the oil and gas industry. Energy Marketing includes
the sale of electricity to markets outside the Province and other non-regulated electricity sales. Bull Arm Fabrication consists of an
industrial fabrication site which is leased for major construction of development projects. Phase 1 of the Lower Churchill Project includes
investments in the Muskrat Falls hydroelectric plant, the Labrador-Island Link and the Labrador Transmission Assets. Corporate and other
activities encompass development activities including Phase 2 of the Lower Churchill Project and corporate activities. The segments’
accounting policies are the same as those described in Note 2 of the annual audited consolidated financial statements. The designation
of segments has been based on a combination of regulatory status and management accountability.
NALCOR ENERGYNOTES TO THE CONDENSED CONSOLIDATED INTERIM FINANCIAL STATEMENTS(Unaudited)

NALCOR ENERGY 2016 Q1 FINANCIAL REPORT 57
Phase 1 Lower Corporate Hydro Churchill Oil and Energy Bull Churchill and Other Inter-(millions of Canadian dollars) Regulated Falls Gas Marketing Arm Project Activities Segment Total
For the three months ended March 31, 2016
Energy sales 194.3 38.1 14.9 17.5 - - - (11.3) 253.5
Other revenue 1.0 0.1 0.1 1.5 5.6 - - 1.2 9.5
Revenue 195.3 38.2 15.0 19.0 5.6 - - (10.1) 263.0
Fuels 72.6 - - - - - - - 72.6
Power purchased 17.5 - - 11.1 - - - (11.0) 17.6
Operating costs 31.5 12.1 2.3 7.2 0.3 0.2 5.5 - 59.1
Production costs - - 5.2 - - - - - 5.2
Depreciation, depletion and amortization 16.9 4.0 8.4 - - - 0.2 - 29.5
Net finance (income) expense 18.8 (0.3) 0.8 0.1 - (0.5) 0.1 - 19.0
Other (income) expense 0.5 - (2.7) (6.6) 0.5 0.1 (0.1) - (8.3)
Preferred dividends - (1.3) - - - - - 1.3 -
Profit (loss) before regulatory adjustments 37.5 23.7 1.0 7.2 4.8 0.2 (5.7) (0.4) 68.3
Regulatory adjustments 40.3 - - - - - - - 40.3
(Loss) profit for the period (2.8) 23.7 1.0 7.2 4.8 0.2 (5.7) (0.4) 28.0
Capital expenditures* 17.6 4.8 50.6 - - 485.9 - - 558.9
Total assets 2,228.7 544.9 1,067.4 15.9 4.4 8,349.4 303.3 (30.4) 12,483.6
* Capital expenditures include non-cash additions of $103.0 million related to the Maritime Link and $4.7 million related to Class B Limited Partnership Unit
accrued interest. Total assets include total-to-date amounts of $764.3 million related to the Maritime Link and $26.0 million related to Class B Limited
Partnership Unit accrued interest.
NALCOR ENERGYNOTES TO THE CONDENSED CONSOLIDATED INTERIM FINANCIAL STATEMENTS(Unaudited)

NALCOR ENERGY 2016 Q1 FINANCIAL REPORT58
Phase 1 Lower Corporate Hydro Churchill Oil and Energy Bull Churchill and Other Inter-(millions of Canadian dollars) Regulated Falls Gas Marketing Arm Project Activities Segment Total
For the three months ended March 31, 2015
Energy sales 214.3 38.8 7.1 25.8 - - - (10.9) 275.1
Other revenue 0.9 0.1 2.4 1.3 4.9 - 0.1 1.2 10.9
Revenue 215.2 38.9 9.5 27.1 4.9 - 0.1 (9.7) 286.0
Fuels 81.3 - - - - - - - 81.3
Power purchased 18.2 - - 10.5 - - - (10.5) 18.2
Operating costs 34.6 12.3 2.4 7.7 0.2 0.2 5.6 - 63.0
Production costs - - 3.1 - - - - - 3.1
Depreciation, depletion and amortization 15.5 3.6 3.7 - - - 0.1 - 22.9
Exploration and evaluation - - 0.2 - - - - - 0.2
Net finance (income) expense 18.2 (0.2) 0.1 - - (0.2) 0.1 - 18.0
Other (income) expense 1.3 - (1.5) 2.0 0.3 - 0.2 - 2.3
Preferred dividends - (1.2) - - - - - 1.2 -
Profit (loss) before regulatory adjustments 46.1 24.4 1.5 6.9 4.4 - (5.9) (0.4) 77.0
Regulatory adjustments 47.7 - - - - - - - 47.7
(Loss) profit for the period (1.6) 24.4 1.5 6.9 4.4 - (5.9) (0.4) 29.3
Capital expenditures 18.1 2.4 52.6 0.1 - 420.1 0.8 - 494.1
Total assets 2,175.3 513.6 846.6 15.0 3.9 7,007.7 335.4 (24.7) 10,872.8
* Capital expenditures include non-cash additions of $99.7 million related to the Maritime Link and $1.7 million related to Class B Limited Partnership Unit accrued
interest. Total assets include total-to-date amounts of $432.0 million related to the Maritime Link and $13.3 million related to Class B Limited Partnership Unit
accrued interest.
NALCOR ENERGYNOTES TO THE CONDENSED CONSOLIDATED INTERIM FINANCIAL STATEMENTS(Unaudited)

NALCOR ENERGY 2016 Q1 FINANCIAL REPORT 59
25. COMPARATIVE FIGURES
Certain of the comparative figures have been reclassified to conform to the basis of presentation adopted during the current reporting
period. The changes have been summarized as follows:
Previously Foreign Production Sale of Twin Block Reclassified (millions of Canadian dollars) reported exchange cost reclass power to LCP reclass balance
Energy sales 276.4 - - (0.3) (1.0) 275.1
Power purchased 19.2 - - - (1.0) 18.2
Operating costs 66.1 - (3.1) - - 63.0
Production costs - - 3.1 - - 3.1
Net finance (income) expense 20.2 (2.2) - - - 18.0
Other (income) expense 0.1 2.2 - - - 2.3
26. SUBSEQUENT EVENT
On April 4, 2016, Nalcor, on behalf of Oil and Gas, issued an irrevocable letter of credit in the amount of $4.9 million to the Canada-
Newfoundland and Labrador Offshore Petroleum Board. The purpose of the letter was to provide proof of financial responsibility with
respect to the Hebron project.
NALCOR ENERGYNOTES TO THE CONDENSED CONSOLIDATED INTERIM FINANCIAL STATEMENTS(Unaudited)

NALCOR ENERGY 2016 Q1 FINANCIAL REPORT60
NALCOR ENERGY EXECUTIVE LEADERSHIP TEAM (AT APRIL 30, 2016)
Stan MarshallChief Executive Officer
Derrick SturgeVice President Finance & Chief Financial Officer
Gilbert BennettVice President Lower Churchill Project
Robert HendersonVice President Transition to Operations
Jim KeatingVice President Oil and GasVice President (Acting) - Churchill Falls (Labrador) Corporation- Project Execution & Technical Services
Chris KieleyVice President Strategic Planning & Business Development
John MacIsaacPresident Newfoundland and Labrador Hydro
Michael RobertsVice President Human Resources & Organizational Effectiveness
John Green, Q.C. (Chairperson)Lawyer
Stan MarshallChief Executive Officer
Donna BrewerDeputy MinisterDepartment of FinanceGovernment of Newfoundland and Labrador
NALCOR ENERGY BOARD OF DIRECTORS (AT APRIL 30, 2016)
NALCOR ENERGY OFFICERS (AT APRIL 30, 2016)
John Green, Q.C.Chairperson
Stan MarshallChief Executive Officer
Derrick SturgeVice President, Finance & Chief Financial Officer
Gilbert BennettVice President Lower Churchill Project
Robert HendersonVice President Transition to Operations
Jim KeatingVice President Oil and GasVice President (Acting) - Churchill Falls (Labrador) Corporation- Project Execution & Technical Services
Chris KieleyVice President Strategic Planning & Business Development
Michael RobertsVice President Human Resources & Organizational Effectiveness
Peter HickmanAssistant Corporate Secretary
Robert HullGeneral Manager, Commercial Management& Integration
Auburn WarrenGeneral Manager, Commercial, Treasury and Risk
Jim MeaneyGeneral Manager, Finance (Business Units)
Carla RussellGeneral Manager, Finance (Nalcor)
Heather M. Jacobs, Q.C.Deputy Minister and Deputy Attorney General (Acting)Department of Justice and Public SafetyGovernment of Newfoundland and Labrador
Chris LoomisProfessor of Pharmacology (Retired)

NALCORENERGY.COM