Pumping Plant Performance Evaluation - Nc State … · Pumping Plant Performance Evaluation ......
12
Pumping Plant Performance Evaluation Prepared by: Robert Evans, Extension Agricultural Engineering Specialist R. E. Sneed, Extension Agricultural Engineering Specialist J. H. Hunt, Extension Agricultural Engineering Specialist Published by: North Carolina Cooperative Extension Service Publication Number: AG 452-6 Last Electronic Revision: June 1996 (KNS) Introduction Irrigation requires large quantities of energy. Most of the energy is consumed by the pumping plant. High pumping costs usually result from poor maintenance, excessive wear, or mismatched components. Annual energy costs run about $25per acre in North Carolina where application rates average 8 inches per acre per year. Energy cost may be several times higher when water is applied with poorly maintained and operated systems. This publication discusses the causes of poor irrigation system performance. Some of these causes can be identified and corrected by the irrigator. Others require specialized evaluation equipment, and the corrections should therefore be performed by specially trained technicians. The energy required to pump a given quantity of water is affected by: 1. pumping lift-the vertical distance from the water source to the discharge point (elevation) in the field; 2. operating pressure-pressure on the discharge side of the pump necessary to provide the proper pressure to sprinkler nozzles in the field; 3. pumping plant efficiency. Energy requirements decrease as pumping lift and operating pressure decrease and pumping plant efficiency increases. To maximize pumping plant efficiency, the components should be matched to the site-specific conditions of pumping lift, operating pressure, and flow rate.
Transcript of Pumping Plant Performance Evaluation - Nc State … · Pumping Plant Performance Evaluation ......
Pumping Plant Performance Evaluation
Prepared by:
Robert Evans, Extension Agricultural Engineering Specialist
R. E. Sneed, Extension Agricultural Engineering Specialist
J. H. Hunt, Extension Agricultural Engineering Specialist
Published by: North Carolina Cooperative Extension Service
Publication Number: AG 452-6
Last Electronic Revision: June 1996 (KNS)
Introduction Irrigation requires large quantities of energy. Most of the energy is consumed by the pumping plant. High
pumping costs usually result from poor maintenance, excessive wear, or mismatched components. Annual energy
costs run about $25per acre in North Carolina where application rates average 8 inches per acre per year. Energy
cost may be several times higher when water is applied with poorly maintained and operated systems.
This publication discusses the causes of poor irrigation system performance. Some of these causes can
be identified and corrected by the irrigator. Others require specialized evaluation equipment, and the
corrections should therefore be performed by specially trained technicians.
The energy required to pump a given quantity of water is affected by:
1. pumping lift-the vertical distance from the water source to the discharge point (elevation) in the field; 2. operating pressure-pressure on the discharge side of the pump necessary to provide the proper
pressure to sprinkler nozzles in the field; 3. pumping plant efficiency.
Energy requirements decrease as pumping lift and operating pressure decrease and pumping plant efficiency
increases. To maximize pumping plant efficiency, the components should be matched to the site-specific
conditions of pumping lift, operating pressure, and flow rate.

Pumping Plant Components
Irrigation Pumps
Pump designs vary depending on the application. Centrifugal pumps (self-priming or non-self-priming) are used
when pumping water from surface sources and shallow wells (Figure 1). Turbine pumps (vertical-shaft or sub-
mersible) are used when pumping from deep wells (Figure 2). Specific features of each pump are discussed in
Extension Service publication AG-389, Water Supplies for Subirrigation.
Figure 1. Electric-motor-driven centrifugal pump drawing water from a surface water supply.
Figure 2. Electric-motor-driven turbine pump drawing water from a deep well.
Some pumps are more efficient than others (Figure 3). Most types of pumps are available over a wide
range of operating efficiencies. Pump efficiency is the ratio (expressed as a percentage) of the water
horsepower of the discharge water divided by the energy delivered to the pump by the power unit.
Turbine pumps tend to have the highest efficiencies but over a relatively narrow range of operating
conditions. Efficiencies of some vertical-shaft turbine pumps approach 90 percent.
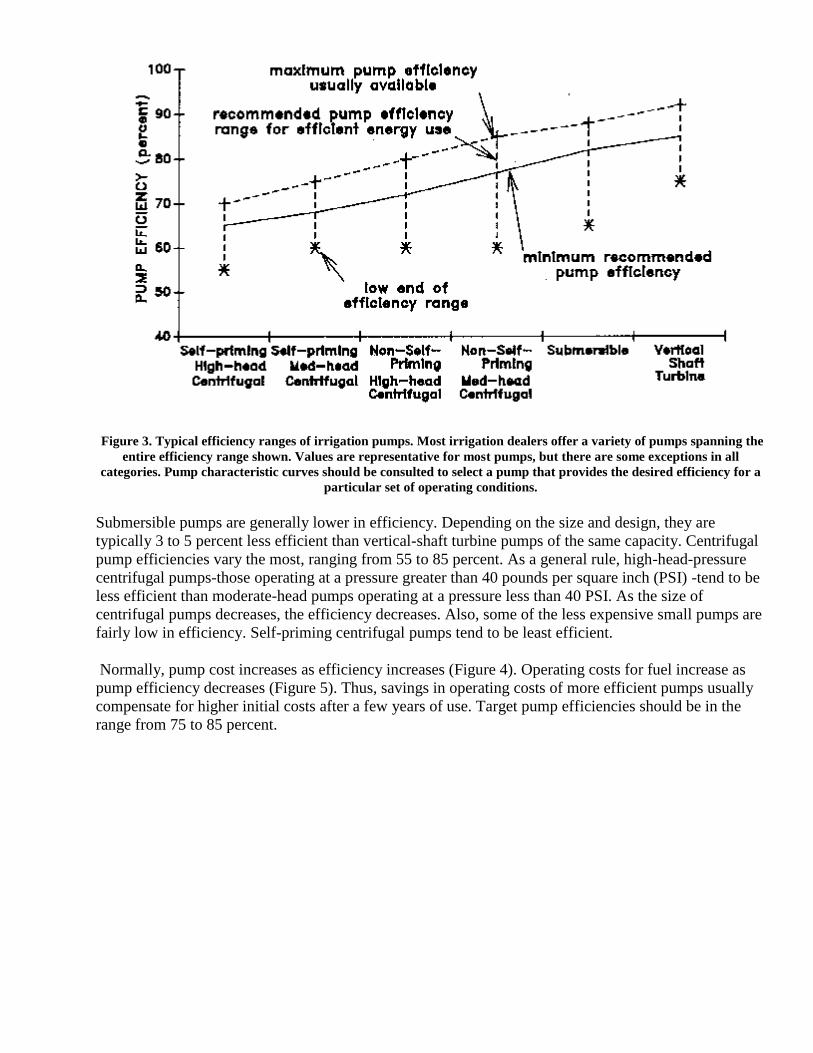
Figure 3. Typical efficiency ranges of irrigation pumps. Most irrigation dealers offer a variety of pumps spanning the
entire efficiency range shown. Values are representative for most pumps, but there are some exceptions in all
categories. Pump characteristic curves should be consulted to select a pump that provides the desired efficiency for a
particular set of operating conditions.
Submersible pumps are generally lower in efficiency. Depending on the size and design, they are
typically 3 to 5 percent less efficient than vertical-shaft turbine pumps of the same capacity. Centrifugal
pump efficiencies vary the most, ranging from 55 to 85 percent. As a general rule, high-head-pressure
centrifugal pumps-those operating at a pressure greater than 40 pounds per square inch (PSI) -tend to be
less efficient than moderate-head pumps operating at a pressure less than 40 PSI. As the size of
centrifugal pumps decreases, the efficiency decreases. Also, some of the less expensive small pumps are
fairly low in efficiency. Self-priming centrifugal pumps tend to be least efficient.
Normally, pump cost increases as efficiency increases (Figure 4). Operating costs for fuel increase as
pump efficiency decreases (Figure 5). Thus, savings in operating costs of more efficient pumps usually
compensate for higher initial costs after a few years of use. Target pump efficiencies should be in the
range from 75 to 85 percent.

Figure 4. General relationship between initial cost and efficiency of irrigation pumps.
Figure 5. Influence of pump efficiency on fuel cost. Minimum cost (zero percent increase) based on drive unit
performing at Nebraska Standard.
Once the operating pressure (head) and system capacity (flow rate) have been determined, consult pump
characteristic curves to select the most efficient pump for the specific conditions. Most pump
manufacturers provide characteristic curves for each of their pumps. These curves show the relationship
between head, horsepower, capacity, and efficiency. Irrigation pumps should be selected to match
specific conditions of pumping rate and operating pressure (expressed as total dynamic head, or TDH).

Figure 6 shows a typical characteristic curve for an electric-motor-driven pump.
Figure 6. Typical pump characteristic (performance) curve for a motor-driven pump. There is a narrow range
(shaded area) of pressure and volume within which the pump will perform at maximum efficiency. This pump is best
suited for operation in the range from 400 to 500 gallons per minute (GPM) at a TDH of 100 to 150 feet with a suction
lift (NPSHR) of 14 to 19 feet. In this operating range, the pump efficiency is greater than 80 percent. Maximum
efficiency for this pump is 82 percent when pumping 460 to 480 gallons per minute at a TDH of 135 to 145 feet and a
suction lift of 17 feet.
Pump wear and reduced efficiency occur quickly when the water contains sand or other abrasives. Many
wells in North Carolina are drilled into water-bearing sand or sandstone. To prevent movement of sand
into the pump, it is equipped with an intake screen. Improper sizing of well-screen openings will
accelerate pump wear and reduce its efficiency. Improper screening of the suction line of centrifugal
pumps can allow abrasives in surface water to enter. When water is pumped from a surface source, pond
sediments may be picked up, thus accelerating pump wear, especially near the end of the irrigation
season when the water level is low.
Power Units
Power units are of two basic types: electric motors and internal combustion engines (either direct-drive engines
adapted solely for irrigation or tractors with a power takeoff (PTO) used to drive a pump).
Where electricity is available, it is the most efficient power source. As shown in Table 1 on page 4, the
efficiency of electric motors ranges from 80 percent for motors under 7.5 horsepower to over 90 percent
for motors of 75 horsepower or larger. One disadvantage of electrical systems is that electric lines in
many rural areas do not run near the water source, and three-phase power is often less available in these
areas. Most electric companies require three-phase power for motors that deliver more than 5 or 10
horsepower, depending on the application and the company providing the service.

Typical Attainable
Electric Motor Full Load Motor Matched Size Pumping Plant
Size Efficiency Pump Efficiency* Efficiency**
(horsepower) (percent) (percent) (percent)
3-5 80 - 86 55 - 65 44 - 56
7.5 - 10 85 - 89 60 - 70 51 - 62
15 - 30 86 - 90 65 - 75 56 - 68
40 - 60 88 - 92 70 - 80 62 - 74
75 and larger 90 - 93 75 - 85 68 - 79
Table 1. Typical Electric Motor and Pumping Plant Efficiencies as Influenced by Motor Size
*Values shown are typical for centrifugal pumps. Submersible pumps range 3 to 5 percent higher and turbine
pumps range 5 to 10 percent higher for sizes under 75 horsepower. Above 75 horsepower, a few centrifugal
pumps may approach efficiencies of 88 percent, whereas large submersible and turbine pump efficiencies peak
at about 90 percent. Since pump efficiencies are quite variable depending on type, manufacturer, and size,
consult pump performance curves for a specific application.
**Values obtained by multiplying power source efficiency range (in this case, for an electric motor) by the
matched pump efficiency range. Internal combustion engine drives are available to meet most power
requirements of 3 horsepower or more. Generally, small engines are gasoline operated, whereas larger units are
usually diesel. Most power units with less than 40 horsepower plus some of the larger diesel units are air cooled.
Internal combustion engines are inefficient. Gasoline engines are only 20 to 26 percent efficient, while
diesel efficiencies range from 25 to 37 percent. The advantage of the diesel's higher efficiency and
longer operating life must be balanced against the higher initial cost. If the engine is to be operated over
a long period of time, the diesel engine is usually the most economical, but if the pump is operated for
only a few hours each year, a gasoline engine is more economical.
Performance standards for engines and pumping plants are published annually in the Nebraska Tractor
Test Report. The report contains performance data for most agricultural power equipment marketed in
the United States. These unbiased performance data are determined by University of Nebraska engineers
for equipment adjusted to manufacturer's recommendations. Standards for irrigation pumping plants are
given in Table 2.
Horsepower-
Hours(1) Per Unit Water Hp-hr(2) Per
Energy Source Energy Unit of Energy Unit of Energy(3)
Diesel Gallon 16.7 12.5
Gasoline(4) Gallon 11.5 8.66
Propane(4) Gallon 9.2 6.89
Natural Gas(6) 1,000 cu ft 88.9(5) 66.7
Electricity kWh 1.18(7) 0.885(8)
Table 2. Nebraska Performance Standards for Irrigation Energy Sources
Source: Dorn, T.W., P.E. Fishbach, D.F. Eisenhauer, J.R. Gilley, and L.E. Stateson, It Pays to Test Your Irrigation
Pumping Plant. Publication EC-713. Lincoln: University of Nebraska, Cooperative Extension Service.
(1)Horsepower-hours is the work being accomplished by the power unit with losses considered.
(2)Water horsepower-hours is the work being accomplished by the power plant at the Nebraska
Performance Criteria.
(3)Based on 75 percent pump efficiency.
(4)Taken from Test D of Nebraska Tractor Test Reports. Drive losses are accounted for in the data.
Assumes no cooling fan.
(5)Manufacturers' data corrected for 5 percent gear-head drive loss and no cooling fan.
(6)Assumes natural gas energy content of 1,000 Btu per cubic foot.
(7)Assumes 88 percent electric motor efficiently.
Pump Drive
The pump drive transfers energy from the power unit to the pump. Electric motors are frequently coupled
directly to the pump through the motor line shaft. When properly aligned and lubricated, direct drives introduce
very little energy loss. In some cases, power is transmitted through a belt drive so the pump speed can be
changed. Belt drive efficiencies are typically between 85 and 95 percent.
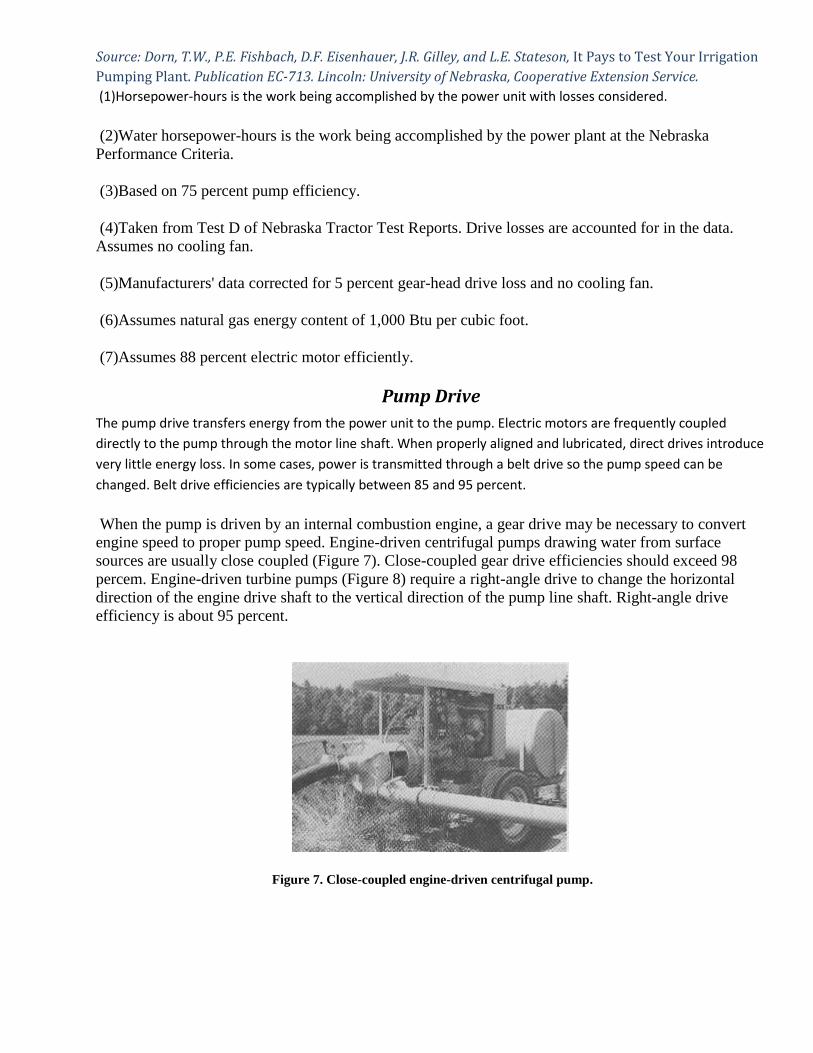
When the pump is driven by an internal combustion engine, a gear drive may be necessary to convert
engine speed to proper pump speed. Engine-driven centrifugal pumps drawing water from surface
sources are usually close coupled (Figure 7). Close-coupled gear drive efficiencies should exceed 98
percem. Engine-driven turbine pumps (Figure 8) require a right-angle drive to change the horizontal
direction of the engine drive shaft to the vertical direction of the pump line shaft. Right-angle drive
efficiency is about 95 percent.
Figure 7. Close-coupled engine-driven centrifugal pump.

Figure 8. Right-angle drive for engine-driven turbine pump.
Inefficient pumping plants cost more to operate. Low pumping
plant performance usually results from (1) an inefficient pump or
power unit, (2) mismatching of the pump and power unit, or (3) a
combination of these.
Pumping plant efficiency can be tested to provide information on
adjustments or retrofits needed to improve efficiency. To
determine the pumping plant efficiency, measure pumping lift,
discharge pressure, flow rate, and fuel usage. Fuel usage can be
read directly from the electric meter or by measuring the liquid
level in the fuel tank over a specific time period. A pressure gauge
is usually installed on the discharge side of the pump to indicate
operating pressure. Some systems have in-line flow meters to
indicate pumping rate. Thus, the only equipment needed is a device
to measure water level (relative to the pump) at the water source
and a flow meter if one is not present.
Once the above measurements have been made, the pumping plant
performance can be computed from the relationships in the box on
the following page.
An example of a pumping plant performance analysis is shown in
Table 3 on page 6. In this example, the pumping plant is
performing at 86 percent of the Nebraska Standard. For additional
explanation of the terminology used in Table 3, consult Extension
Publication AG-452-5, Irrigation Management Strategies to
Improve Water and Energy Efficiencies.
In establishing performance standards, it is recognized that
individual pumping plant components are not 100 percent efficient.
The performance standards were established to compare and
evaluate systems based on "reasonable efficiency expectations."
For an electrically driven pumping plant, the standard is based on a
motor efficiency of 88 percent and a pump efficiency of 75 percent
(see the footnotes to Table 2), resulting in an actual efficiency of
66 percent (0.88 x 0.75 = 0.66). Thus, an electrically driven
pumping plant performing at the standard is only 66 percent
efficient in converting electric energy to mechanical energy. In the

example, performing at 86 percent of the standard, the absolute pumping plant efficiency is only 57
percent (0.86 x 0.66 = 0.57).
Interpreting Pumping Plant Performance
There is no exact efficiency level that indicates when adjustments or
repairs are necessary. The cost of efficiency improvements must be
balanced against the possible energy savings. Factors that influence
the decision are:
the extent of poor performance fuel cost hours of operation each year specific conditions of operating pressure and pumping rate.
Normally, adjustment costs are small, and any resulting improvement
in pumping plant performance will pay dividends within one year.
Repair or replacement of minor components is more costly, and
payback may take one to three years. Minor repairs are usually
justified when the system performance is between 60 and 80
percent of the Nebraska Standard. For the example system
operating at 86 percent of the standard, adjustments are
warranted but repair or component replacement is not.
Replacement of major components, such as the engine, motor, or
pump or changing to a more efficient system are most costly.
Normally, replacement of major components is not warranted
unless the performance rating is less than 60 percent of the
standard. The payback period for replacement of major
components is typically five years or more.
Analyzing Pumping Plants Driven By Electric
Motors
The pumping plant analysis indicates whether or not overall
performance is acceptable but does not indicate which component is
responsible if overall efficiency is low. Overall pumping plant
efficiency can be computed by multiplying the efficiencies of the
individual components. Electric motors are relatively efficient and
reliable. Poor pumping plant performance can usually be attributed
to low pump efficiency.
When the pumping plant test indicates poor performance,
assume a reasonable motor efficiency (usually 90 percent) and
then compute the pump efficiency. In the example, the overall pumping plant performance was 86
percent of the standard. The absolute pumping plant efficiency was 57 percent. Assuming a motor
efficiency of 90 percent, the absolute pump efficiency is 63 percent (the overall efficiency divided by
the motor efficiency, 0.57/0.90 = 0.63). This value should be compared with the appropriate pump
characteristic curve (like the one shown in Figure 6) to determine if the pump is being operated outside
its highest efficiency range. The following are likely causes of low pump efficiency:
o Low pressure and low flow rate: These conditions indicate excessive pump wear. Internal pump components should be evaluated by a qualified representative of the pump manufacturer.
o Low pressure and high flow rate: These conditions indicate an excessive number of sprinklers operating at one time or excessive wear of sprinkler nozzles. Reduce the number of sprinklers until the proper flow rate is reached.
o If the pressure is still below standard, the pump is worn. o If pump efficiency returns to the recommended range, check nozzles for wear and replace them if
necessary. o If there is no evidence of excessive nozzle wear, too many sprinklers are operating at one time. Take
corrective action by reducing the number of sprinklers if possible, adjusting the pump to deliver more pressure for revised flow with all sprinklers
operating at one time, or replacing the pump with one rated for the desired operating conditions.
o High pressure and low flow: These conditions indicate that the discharge may be partially blocked or there are not enough sprinklers operating. Increase the number of sprinklers.
o If the problem is not corrected, look for blockage on the discharge side of the pump. If efficiency improves to the rated range, continue the operation with added sprinklers. If operating pressure and flow are in the high-efficiency range but efficiency is low, this indicates
a change in suction lift, usually resulting from a drop in water level at the water supply or a blocked intake (suction hose).
Analyzing Pumping Plants Driven By Internal Combustion Engines
More comprehensive testing procedures are necessary to identify specific causes of low pumping plant
efficiency when internal combustion engines are used because the engine efficiency must also be determined. In
addition to the measurements discussed above, specialized equipment is needed to measure the actual power
output of the engine. One such device, a dynamometer, allows the engine to be operated with a known load.
Strain gauges can be used to measure stress/strain deflection of the drive-shaft. This measurement can be
converted to engine power output with a calibration curve. Once engine efficiency has been determined, the
pump can be diagnosed in the same way as for electrically driven systems.
The importance of performing an engine analysis is demonstrated in Figure 9. For the gasoline engine
shown, fuel consumption increases nearly 5 percent for each percentage decrease in engine efficiency.
Poor engine efficiency combined with low pump efficiency quickly increases fuel costs (Figure 10).
You can measure the efficiency of your engine-driven pumping plant. If overall efficiency is low,
contact a pump or engine dealer, consultant, or Extension Service agent who has the necessary engine
analysis equipment.

Figure 9. Increase in fuel consumption (gasoline) resulting from poor engine efficiency.
Figure 10. Effect of overall pumping plant efficiency on fuel costs. values are based on a price of $1.10 per gallon for
gasoline. A zero percent increase is the minimum possible fuel cost with pump efficiency of 100 percent and engine
performing at the Nebraska Standard.
In general, the lower the existing efficiency, the shorter the payback period for repair or replacement of
system components. Higher fuel prices, increased operating pressure and pumping rate, and more annual
operating hours shorten the payback period required to recover major repair or replacement costs.
Contact your county Extension Service office for more information and assistance. Making a profitable
decision about repairs and improvements requires a complete economic evaluation of existing
performance and the cost of alternatives. Contact your personal accountant or an Extension economist
before making costly repairs or replacing major components.
Distributed in furtherance of the Acts of Congress of May 8 and June 30, 1914. Employment and program
opportunities are offered to all people regardless of race, color, national origin, sex, age, or disability. North
Carolina State University, North Carolina A&T State University, U.S. Department of Agriculture, and local
governments cooperating.
AG 452-6 Return to: BAE Extension Publications