Puerto Rico Manufacturing - Census.gov · E Commerce Statistics for Puerto Rico: 2002 39 Chapter 2....
108
Puerto Rico Manufacturing 2002 Economic Census of Island Areas Issued October 2005 IA02-00I-PRM (RV) U.S. Department of Commerce Economics and Statistics Administration U.S. CENSUS BUREAU
Transcript of Puerto Rico Manufacturing - Census.gov · E Commerce Statistics for Puerto Rico: 2002 39 Chapter 2....
Puerto Rico Manufacturing
2002 Economic Census of Island Areas
Issued October 2005
IA02-00I-PRM (RV)
U.S. Department of CommerceEconomics and Statistics Administration
U.S. CENSUS BUREAU

CONTENTS
Introduction v���������������������������������������������������
Tables
Chapter 1. Industry Statistics
1. General Statistics by Industry for Puerto Rico: 2002 1����������
2. Selected Statistics by Industry and Legal Form of Organizationfor Puerto Rico: 2002 5������������������������������������
3. Selected Statistics by Industry, Employment Size, and LegalForm of Organization for Puerto Rico: 2002 9����������������
4. Value of Shipments by Industry for Puerto Rico: 2002 25��������
5. Cost of Materials by Industry for Puerto Rico: 2002 28�����������
6. Share of Value of Shipments by Industry Accounted for by the4, 8, 20, and 50 Largest Establishments for Puerto Rico:2002 31���������������������������������������������������
7. Value of Products Shipped and Contract Receipts by Industryand Country of Destination for Puerto Rico: 2002 33�����������
8. Value of Products Shipped by Industry and Class of Customerfor Puerto Rico: 2002 36������������������������������������
9. E�Commerce Statistics for Puerto Rico: 2002 39����������������
Chapter 2. Area Statistics
10. General Statistics for Puerto Rico, Metropolitan Areas, andMunicipios: 2002 40����������������������������������������
11. Selected Statistics by Employment Size of Establishments forPuerto Rico, Metropolitan Areas, and Municipios: 2002 42������
12. Selected Statistics by Industry for Puerto Rico and MetropolitanAreas: 2002 56��������������������������������������������
13. Number of Production Workers and Hours Worked by Industryfor Puerto Rico and Metropolitan Areas: 2002 71��������������
14. Inventories by Stage of Fabrication by Industry for Puerto Ricoand Metropolitan Areas: End of 2001 and 2002 83�������������
15. Capital Expenditures and Rental Payments for Plant andEquipment by Industry for Puerto Rico and Metropolitan Areas:2002 95���������������������������������������������������
Appendixes
A. Explanation of Terms A–1�������������������������������������
B. NAICS Codes, Titles, and Descriptions B–1����������������������
C. Methodology C–1���������������������������������������������
D. Geographic Notes ������������������������������������������
E. Metropolitan Statistical Areas E–1������������������������������
�� Not applicable for this report.
Puerto Rico�Manufacturing Contents iiiU.S. Census Bureau, 2002 Economic Census

CONTENIDO
Introducción x���������������������������������������������������
TablasCapítulo 1. Estadísticas Industriales1. Estadísticas Generales para Puerto Rico Según la Industria:
2002 1���������������������������������������������������
2. Estadísticas Seleccionadas para Puerto Rico Según la Industriay el Tipo de Organización Jurídica: 2002 5�������������������
3. Estadísticas Seleccionadas para Puerto Rico Según laIndustria, el Volumen de Empleo y el Tipo de OrganizaciónJurídica: 2002 9������������������������������������������
4. Valor de Expedición para Puerto Rico Según la Industria:2002 25���������������������������������������������������
5. Costos de los Materiales para Puerto Rico Según la Industria:2002 28���������������������������������������������������
6. Valor de los Productos Expedidos para los Establecimientosque se Encuentran entre los 4, 8, 20 y 50 más Grandes,Según la Industria en Puerto Rico: 2002 31�������������������
7. Valor de los Productos Expedidos e Ingresos por Contrato paraPuerto Rico Según la Industria y el País de Destino: 2002 33����
8. Valor de los Productos Expedidos Según la Industria y el Tipode Cliente en Puerto Rico: 2002 36��������������������������
9. Estadísticas Sobre el Comercio Electrónico en Puerto Rico:2002 39���������������������������������������������������
Capítulo 2. Estadísticas por Áreas10. Estadísticas Generales para Puerto Rico, Áreas Metropolitanas
y Municipios: 2002 40��������������������������������������
11. Estadísticas Seleccionadas para Puerto Rico, ÁreasMetropolitanas y Municipios, de Acuerdo al Volumen deEmpleo del Establecimiento: 2002 42������������������������
12. Estadísticas Seleccionadas para Puerto Rico y las ÁreasMetropolitanas Según la Industria: 2002 56�������������������
13. Número de Trabajadores de Producción y Horas Trabajadaspara Puerto Rico y las Áreas Metropolitanas Según laIndustria: 2002 71�����������������������������������������
14. Inventarios para Puerto Rico y las Áreas Metropolitanas deAcuerdo a la Etapa de Fabricación, Según la Industria: Fin del2001 y 2002 83��������������������������������������������
15. Desembolsos de Capital y Pagos de Alquiler de Plantas yEquipo para Puerto Rico y las Áreas Metropolitanas Según laIndustria: 2002 95�����������������������������������������
ApéndicesA. Explicación de los Términos A–6�������������������������������
B. Códigos, Títulos y Descripciones de NAICS B–1������������������
C. Metodología C–3���������������������������������������������
D. Notas Geográficas ������������������������������������������
E. Áreas Estadísticas Metropolitanas E–1��������������������������
�� No es pertinente para este informe.
iv Contenido Puerto Rico�ManufacturaU.S. Census Bureau, 2002 Economic Census

Table 1. General Statistics by Industry for Puerto Rico: 2002[Includes only establishments of firms with payroll. For meaning of abbreviations and symbols, see introductory text. For explanation of terms, see Appendix A. Data based on the 2002 EconomicCensus. For information on confidentiality protection, sampling error, nonsampling error, and definitions, see note at the end of the table]
2002NAICScode
Industry
All employees1
Estab�lishments(number)
First�quarterpayroll
($1,000)Total
(number)Payroll
($1,000)
Valueadded by
manufacture($1,000)
Cost ofmaterials($1,000)
Capitalexpenditures
($1,000)
Rentalpayments
($1,000)
Value ofshipments
($1,000)
31�33 Manufacturing 2 195�����������������������������r756 008 r126 707 r3 130 631 45 614 305 13 370 948 3 673 690 311 984 58 580 060
311 Food manufacturing 446�����������������������r58 369 r14 509 230 955 3 596 987 1 309 404 84 912 7 880 4 883 924
3111 Animal food manufacturing 13��������������� 1 957 587 8 507 44 011 89 414 1 753 331 133 326
3112 Grain and oilseed milling 5����������������� D e D D D D D D
3113 Sugar and confectionery productmanufacturing 27������������������������� 5 680 1 143 23 395 106 948 93 851 2 198 1 528 200 648
31131 Sugar manufacturing 4������������������ 528 163 2 012 12 529 1 936 22 17 14 61231132 Chocolate and confectionery
manufacturing from cacao beans 1������ D a D D D D D D31133 Confectionery manufacturing from
purchased chocolate 6����������������� D c D D D D D D31134 Nonchocolate confectionery
manufacturing 16����������������������� 4 923 811 20 416 92 076 89 336 2 142 724 181 049
3114 Fruit and vegetable preserving andspecialty food manufacturing 31������������
r4 018 r1 638 25 594 84 410 170 106 799 956 248 24931141 Frozen food manufacturing 14������������� 910 381 4 200 20 584 14 219 345 38 28 36531142 Fruit and vegetable canning, pickling, and
drying 17������������������������������r3 108 r1 257 21 394 63 826 155 887 454 918 219 884
3115 Dairy product manufacturing 17������������� D g D D D D D D31151 Dairy product (except frozen)
manufacturing 6����������������������� D f D D D D D D31152 Ice cream and frozen dessert
manufacturing 11����������������������� 247 134 977 2 731 3 919 352 253 6 727
3116 Animal slaughtering and processing 20������ 5 099 r1 385 23 375 34 797 129 790 1 621 1 053 163 475
3117 Seafood product preparation andpackaging 2���������������������������� D g D D D D D D
3118 Bakeries and tortilla manufacturing 273�������� 15 692 4 988 47 697 207 519 150 236 17 617 2 072 335 67831181 Bread and bakery product
manufacturing 260����������������������� 12 319 3 893 34 112 178 579 122 935 16 202 1 703 279 81931182 Cookie, cracker, and pasta
manufacturing 11����������������������� D g D D D D D D31183 Tortilla manufacturing 2����������������� D a D D D D D D
3119 Other food manufacturing 58���������������� 14 634 2 423 56 028 2 908 301 425 097 58 805 1 481 3 333 89031191 Snack food manufacturing 2������������� D e D D D D D D31192 Coffee and tea manufacturing 11���������� 1 477 398 6 100 22 102 64 765 273 140 86 72531193 Flavoring syrup and concentrate
manufacturing 8����������������������� D c D D D D D D31194 Seasoning and dressing manufacturing 9�� 316 78 1 151 6 276 5 688 30 36 11 93331199 All other food manufacturing 28����������� D g D D D D D D
312 Beverage and tobacco productmanufacturing 57��������������������������� 23 484 3 859 102 833 783 483 771 613 57 403 2 987 1 547 995
3121 Beverage manufacturing 51����������������� 14 357 2 375 66 255 610 929 630 412 52 581 2 885 1 235 30331211 Soft drink and ice manufacturing 44�������� D g D D D D D D31212 Breweries 1���������������������������� D a D D D D D D31213 Wineries 4����������������������������� 373 89 1 644 629 5 357 2 420 14 6 02231214 Distilleries 2��������������������������� D f D D D D D D
3122 Tobacco manufacturing 6������������������ 9 127 1 484 36 578 172 554 141 201 4 822 102 312 692
313 Textile mills 8������������������������������ 192 61 737 2 665 2 257 – – 4 946
3132 Fabric mills 4���������������������������� D b D D D D D D
3133 Textile and fabric finishing and fabriccoating mills 4��������������������������� D b D D D D D D
314 Textile product mills 46����������������������� 5 543 r1 782 r21 858 34 512 48 011 2 100 1 400 93 872
3141 Textile furnishings mills 27������������������ 3 712 r1 196 r13 875 21 409 33 781 1 160 866 66 27631411 Carpet and rug mills 4������������������� 435 138 2 579 3 864 1 445 29 60 5 58031412 Curtain and linen mills 23����������������� 3 277 r1 058 r11 296 17 545 32 336 1 131 806 60 696
3149 Other textile product mills 19���������������� 1 831 586 7 983 13 103 14 230 940 534 27 59631491 Textile bag and canvas mills 5����������� 624 230 2 953 5 275 5 283 165 119 10 59731499 All other textile product mills 14������������ 1 207 356 5 030 7 828 8 947 775 415 16 999
315 Apparel manufacturing 122�������������������� 37 196 r9 731 161 743 505 836 224 934 6 249 3 389 725 181
3151 Apparel knitting mills 1�������������������� D a D D D D D D31519 Other apparel knitting mills 1������������� D a D D D D D D
3152 Cut and sew apparel manufacturing 113������� D i D D D D D D31521 Cut and sew apparel contractors 21�������� 3 613 824 14 472 25 671 36 645 1 618 470 62 28931522 Men’s and boys’ cut and sew apparel
manufacturing 21����������������������� D g D D D D D D31523 Women’s and girls’ cut and sew apparel
manufacturing 46����������������������� 21 136 r4 233 95 646 379 151 60 121 1 652 914 436 21631529 Other cut and sew apparel
manufacturing 25����������������������� 4 451 1 569 16 251 25 886 56 190 2 437 807 79 632
3159 Apparel accessories and other apparelmanufacturing 8������������������������� D g D D D D D D
316 Leather and allied product manufacturing 12���� 6 550 1 472 24 045 84 165 101 795 688 1 216 186 154
3161 Leather and hide tanning and finishing 1����� D a D D D D D D
3162 Footwear manufacturing 7����������������� D g D D D D D D
3169 Other leather and allied productmanufacturing 4������������������������� D e D D D D D D
See footnotes at end of table.
2002 Economic Census of Island Areas Puerto Rico–Manufacturing 1U.S. Census Bureau, 2002 Economic Census

Table 1. General Statistics by Industry for Puerto Rico: 2002�Con.[Includes only establishments of firms with payroll. For meaning of abbreviations and symbols, see introductory text. For explanation of terms, see Appendix A. Data based on the 2002 EconomicCensus. For information on confidentiality protection, sampling error, nonsampling error, and definitions, see note at the end of the table]
2002NAICScode
Industry
All employees1
Estab�lishments(number)
First�quarterpayroll
($1,000)Total
(number)Payroll
($1,000)
Valueadded by
manufacture($1,000)
Cost ofmaterials($1,000)
Capitalexpenditures
($1,000)
Rentalpayments
($1,000)
Value ofshipments
($1,000)
31�33 Manufacturing�Con.321 Wood product manufacturing 74��������������� 4 605 1 502 20 127 119 284 49 976 6 166 1 558 166 921
3211 Sawmills and wood preservation 4���������� D b D D D D D D
3212 Veneer, plywood, and engineered woodproduct manufacturing 12������������������ D e D D D D D D
3219 Other wood product manufacturing 58�������� 3 515 1 134 15 620 100 748 40 806 2 761 1 031 140 44332191 Millwork 24����������������������������� 992 410 5 057 22 420 10 880 1 520 351 31 58932192 Wood container and pallet
manufacturing 8����������������������� 661 209 2 875 12 079 11 485 405 251 23 63132199 All other wood product manufacturing 26��� 1 862 515 7 688 66 249 18 441 836 429 85 223
322 Paper manufacturing 44���������������������� 11 226 2 012 45 376 141 649 146 785 13 401 2 803 284 433
3221 Pulp, paper, and paperboard mills 4��������� 777 214 2 927 19 472 22 211 259 272 41 342
3222 Converted paper product manufacturing 40��� 10 449 1 798 42 449 122 177 124 574 13 142 2 531 243 09132221 Paperboard container manufacturing 22���� 7 669 1 246 31 111 87 904 89 686 12 534 2 252 174 02232222 Paper bag and coated and treated paper
manufacturing 7����������������������� 1 648 287 6 804 17 954 25 817 492 200 43 86832223 Stationery product manufacturing 9������� D c D D D D D D32229 Other converted paper product
manufacturing 2����������������������� D a D D D D D D
323 Printing and related support activities 181�������� 14 285 3 182 56 843 170 758 118 320 36 577 5 573 285 393
3231 Printing and related support activities 181������ 14 285 3 182 56 843 170 758 118 320 36 577 5 573 285 39332311 Printing 164������������������������������ 12 720 2 865 49 828 149 120 102 281 35 033 5 151 247 62032312 Support activities for printing 17����������� 1 565 317 7 015 21 638 16 039 1 544 422 37 773
324 Petroleum and coal products manufacturing 32�� 12 027 1 374 48 229 884 681 711 523 70 190 7 404 1 525 356
3241 Petroleum and coal productsmanufacturing 32������������������������� 12 027 1 374 48 229 884 681 711 523 70 190 7 404 1 525 356
32411 Petroleum refineries 9������������������� 7 124 554 26 353 676 372 175 913 61 756 787 798 24532412 Asphalt paving, roofing, and saturated
materials manufacturing 19�������������� D f D D D D D D32419 Other petroleum and coal products
manufacturing 4����������������������� D b D D D D D D
325 Chemical manufacturing 154������������������� 311 999 r28 937 1 228 680 33 935 557 6 126 966 2 932 133 42 419 39 808 729
3251 Basic chemical manufacturing 14������������ 2 251 290 6 733 34 069 15 361 44 084 89 49 41932511 Petrochemical manufacturing 2����������� D b D D D D D D32512 Industrial gas manufacturing 8����������� 1 679 168 4 975 30 559 8 610 43 659 52 39 07232513 Synthetic dye and pigment
manufacturing 1����������������������� D b D D D D D D32518 Other basic inorganic chemical
manufacturing 2����������������������� D b D D D D D D32519 Other basic organic chemical
manufacturing 1����������������������� D a D D D D D D
3252 Resin, synthetic rubber, and artificialsynthetic fibers and filamentsmanufacturing 4������������������������� D b D D D D D D
3253 Pesticide, fertilizer, and other agriculturalchemical manufacturing 5���������������� D e D D D D D D
3254 Pharmaceutical and medicinemanufacturing 74������������������������� 282 890 25 036 1 109 166 33 159 557 5 529 868 2 614 797 19 584 38 446 602
3255 Paint, coating, and adhesivemanufacturing 20������������������������� 7 516 1 112 33 000 92 182 122 515 13 694 349 214 620
32551 Paint and coating manufacturing 13�������� 3 862 652 18 427 66 498 69 296 8 435 60 135 11332552 Adhesive manufacturing 7��������������� 3 654 460 14 573 25 684 53 219 5 259 289 79 507
3256 Soap, cleaning compound, and toiletpreparation manufacturing 32�������������� 15 923 2 040 68 012 563 651 321 062 256 924 21 503 886 493
32561 Soap and cleaning compoundmanufacturing 22����������������������� 2 874 460 11 494 80 492 39 427 2 996 516 120 140
32562 Toilet preparation manufacturing 10�������� 13 049 1 580 56 518 483 159 281 635 253 928 20 987 766 353
3259 Other chemical product and preparationmanufacturing 5������������������������� 597 r75 1 941 24 486 13 274 541 124 37 547
326 Plastics and rubber products manufacturing 67�� 19 332 3 754 82 411 257 014 242 925 59 869 5 093 499 007
3261 Plastics product manufacturing 57����������� 18 347 3 573 78 013 252 898 233 994 59 795 4 985 485 671
3262 Rubber product manufacturing 10����������� 985 181 4 398 4 116 8 931 74 108 13 336
327 Nonmetallic mineral product manufacturing 157��� 18 220 3 956 82 210 284 665 256 199 41 851 3 170 529 642
3271 Clay product and refractory manufacturing 3� D b D D D D D D
3272 Glass and glass product manufacturing 4���� 1 713 310 6 590 24 589 19 622 1 373 336 41 364
3273 Cement and concrete productmanufacturing 138������������������������� 15 151 3 328 68 933 243 013 229 206 39 905 2 689 468 368
32731 Cement manufacturing 3���������������� D c D D D D D D32732 Ready�mix concrete manufacturing 77������ 7 787 1 466 35 373 136 120 137 143 6 732 1 456 268 88732733 Concrete pipe, brick, and block
manufacturing 31����������������������� D f D D D D D D32739 Other concrete product manufacturing 27��� 3 083 1 031 15 246 49 280 37 434 10 054 817 86 267
3274 Lime and gypsum product manufacturing 1�� D a D D D D D D
3279 Other nonmetallic mineral productmanufacturing 11������������������������� 1 289 241 5 985 14 987 6 517 185 80 17 080
See footnotes at end of table.
2 Puerto Rico–Manufacturing 2002 Economic Census of Island AreasU.S. Census Bureau, 2002 Economic Census

Table 1. General Statistics by Industry for Puerto Rico: 2002�Con.[Includes only establishments of firms with payroll. For meaning of abbreviations and symbols, see introductory text. For explanation of terms, see Appendix A. Data based on the 2002 EconomicCensus. For information on confidentiality protection, sampling error, nonsampling error, and definitions, see note at the end of the table]
2002NAICScode
Industry
All employees1
Estab�lishments(number)
First�quarterpayroll
($1,000)Total
(number)Payroll
($1,000)
Valueadded by
manufacture($1,000)
Cost ofmaterials($1,000)
Capitalexpenditures
($1,000)
Rentalpayments
($1,000)
Value ofshipments
($1,000)
31�33 Manufacturing�Con.331 Primary metal manufacturing 34��������������� 2 950 973 12 508 43 346 33 637 3 499 820 75 152
3311 Iron and steel mills and ferroalloymanufacturing 14������������������������� 1 093 326 4 547 21 406 13 787 2 929 331 34 131
3312 Steel product manufacturing frompurchased steel 7����������������������� 995 223 4 596 9 769 9 766 370 336 18 796
3313 Alumina and aluminum production andprocessing 10���������������������������� D c D D D D D D
3314 Nonferrous metal (except aluminum)production and processing 2�������������� D a D D D D D D
3315 Foundries 1������������������������������ D c D D D D D D
332 Fabricated metal product manufacturing 289����� 24 135 r6 960 105 703 427 227 356 727 30 600 8 968 782 960
3321 Forging and stamping 17������������������� 1 039 271 4 076 17 729 9 821 3 677 663 26 288
3322 Cutlery and handtool manufacturing 8������� 791 307 3 452 12 925 18 254 7 133 31 902
3323 Architectural and structural metalsmanufacturing 165������������������������� 13 525 r3 966 60 925 189 215 160 825 12 081 2 842 350 791
3324 Boiler, tank, and shipping containermanufacturing 15������������������������� 3 135 537 12 034 136 324 111 854 3 804 291 248 025
33241 Power boiler and heat exchangermanufacturing 1����������������������� D a D D D D D D
33243 Metal can, box, and other metal container(light gauge) manufacturing 14����������� D f D D D D D D
3326 Spring and wire product manufacturing 3���� 229 99 995 3 720 3 068 85 85 6 841
3327 Machine shops; turned product; and screw,nut, and bolt manufacturing 35������������� 1 248 427 5 608 14 222 10 973 1 138 562 24 265
33271 Machine shops 11����������������������� 182 62 739 1 691 2 321 255 59 4 01733272 Turned product and screw, nut, and bolt
manufacturing 24����������������������� 1 066 365 4 869 12 531 8 652 883 503 20 248
3328 Coating, engraving, heat treating, and alliedactivities 15������������������������������ 1 371 376 5 839 14 943 8 495 3 138 185 23 699
3329 Other fabricated metal productmanufacturing 31������������������������� 2 797 977 12 774 38 149 33 437 6 670 4 207 71 149
333 Machinery manufacturing 42������������������ 7 154 1 697 30 918 171 969 112 869 9 355 1 107 284 538
3331 Agriculture, construction, and miningmachinery manufacturing 1��������������� D a D D D D D D
3332 Industrial machinery manufacturing 4������� D b D D D D D D
3333 Commercial and service industry machinerymanufacturing 4������������������������� 182 32 750 2 961 1 698 14 265 4 742
3334 Ventilation, heating, air�conditioning, andcommercial refrigeration equipmentmanufacturing 15������������������������� D f D D D D D D
3335 Metalworking machinery manufacturing 15���� 2 340 707 10 675 34 809 17 185 7 855 68 51 739
3339 Other general purpose machinerymanufacturing 3������������������������� D c D D D D D D
334 Computer and electronic productmanufacturing 49��������������������������� 62 559 10 905 282 068 1 184 914 1 147 576 57 136 97 475 2 288 076
3341 Computer and peripheral equipmentmanufacturing 5������������������������� D g D D D D D D
33411 Computer and peripheral equipmentmanufacturing 5����������������������� D g D D D D D D
3342 Communications equipment manufacturing 5� 7 077 1 776 36 143 36 592 63 355 4 200 1 191 104 75433421 Telephone apparatus manufacturing 1���� D b D D D D D D33422 Radio and television broadcasting and
wireless communications equipmentmanufacturing 3����������������������� D g D D D D D D
33429 Other communications equipmentmanufacturing 1����������������������� D c D D D D D D
3343 Audio and video equipment manufacturing 1� D c D D D D D D
3344 Semiconductor and other electroniccomponent manufacturing 24�������������� 40 772 6 382 177 192 772 658 788 700 9 523 4 310 1 554 464
3345 Navigational, measuring, electromedical,and control instruments manufacturing 11��� 5 055 1 296 29 509 126 263 137 132 42 719 568 250 422
3346 Manufacturing and reproducing magneticand optical media 3���������������������� D a D D D D D D
335 Electrical equipment, appliance, andcomponent manufacturing 41���������������� 36 174 7 084 155 024 693 786 388 589 24 317 7 635 1 100 588
3351 Electric lighting equipment manufacturing 6�� D f D D D D D D
3352 Household appliance manufacturing 1������� D a D D D D D D
3353 Electrical equipment manufacturing 29������� 27 504 5 258 118 727 547 387 279 927 17 288 7 013 846 763
3359 Other electrical equipment and componentmanufacturing 5������������������������� D g D D D D D D
See footnotes at end of table.
2002 Economic Census of Island Areas Puerto Rico–Manufacturing 3U.S. Census Bureau, 2002 Economic Census
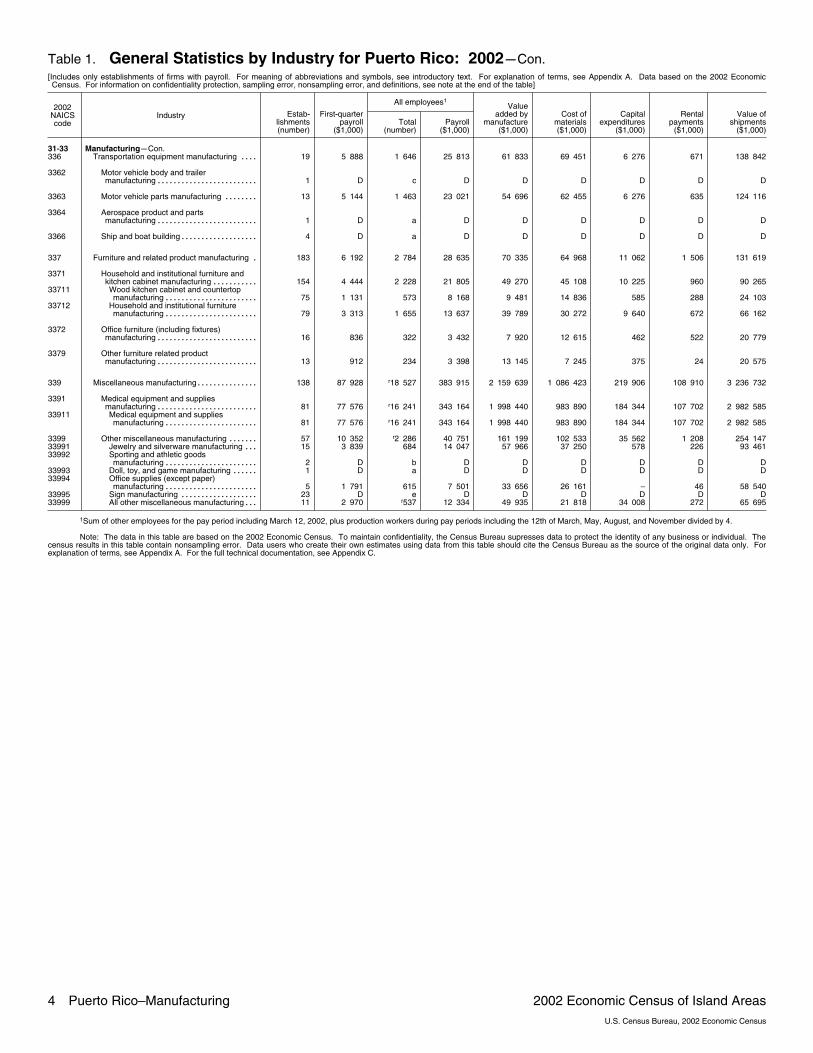
Table 1. General Statistics by Industry for Puerto Rico: 2002�Con.[Includes only establishments of firms with payroll. For meaning of abbreviations and symbols, see introductory text. For explanation of terms, see Appendix A. Data based on the 2002 EconomicCensus. For information on confidentiality protection, sampling error, nonsampling error, and definitions, see note at the end of the table]
2002NAICScode
Industry
All employees1
Estab�lishments(number)
First�quarterpayroll
($1,000)Total
(number)Payroll
($1,000)
Valueadded by
manufacture($1,000)
Cost ofmaterials($1,000)
Capitalexpenditures
($1,000)
Rentalpayments
($1,000)
Value ofshipments
($1,000)
31�33 Manufacturing�Con.336 Transportation equipment manufacturing 19���� 5 888 1 646 25 813 61 833 69 451 6 276 671 138 842
3362 Motor vehicle body and trailermanufacturing 1������������������������� D c D D D D D D
3363 Motor vehicle parts manufacturing 13�������� 5 144 1 463 23 021 54 696 62 455 6 276 635 124 116
3364 Aerospace product and partsmanufacturing 1������������������������� D a D D D D D D
3366 Ship and boat building 4������������������� D a D D D D D D
337 Furniture and related product manufacturing 183� 6 192 2 784 28 635 70 335 64 968 11 062 1 506 131 619
3371 Household and institutional furniture andkitchen cabinet manufacturing 154����������� 4 444 2 228 21 805 49 270 45 108 10 225 960 90 265
33711 Wood kitchen cabinet and countertopmanufacturing 75����������������������� 1 131 573 8 168 9 481 14 836 585 288 24 103
33712 Household and institutional furnituremanufacturing 79����������������������� 3 313 1 655 13 637 39 789 30 272 9 640 672 66 162
3372 Office furniture (including fixtures)manufacturing 16������������������������� 836 322 3 432 7 920 12 615 462 522 20 779
3379 Other furniture related productmanufacturing 13������������������������� 912 234 3 398 13 145 7 245 375 24 20 575
339 Miscellaneous manufacturing 138��������������� 87 928 r18 527 383 915 2 159 639 1 086 423 219 906 108 910 3 236 732
3391 Medical equipment and suppliesmanufacturing 81������������������������� 77 576 r16 241 343 164 1 998 440 983 890 184 344 107 702 2 982 585
33911 Medical equipment and suppliesmanufacturing 81����������������������� 77 576 r16 241 343 164 1 998 440 983 890 184 344 107 702 2 982 585
3399 Other miscellaneous manufacturing 57������� 10 352 r2 286 40 751 161 199 102 533 35 562 1 208 254 14733991 Jewelry and silverware manufacturing 15��� 3 839 684 14 047 57 966 37 250 578 226 93 46133992 Sporting and athletic goods
manufacturing 2����������������������� D b D D D D D D33993 Doll, toy, and game manufacturing 1������ D a D D D D D D33994 Office supplies (except paper)
manufacturing 5����������������������� 1 791 615 7 501 33 656 26 161 – 46 58 54033995 Sign manufacturing 23������������������� D e D D D D D D33999 All other miscellaneous manufacturing 11��� 2 970 r537 12 334 49 935 21 818 34 008 272 65 695
1Sum of other employees for the pay period including March 12, 2002, plus production workers during pay periods including the 12th of March, May, August, and November divided by 4.
Note: The data in this table are based on the 2002 Economic Census. To maintain confidentiality, the Census Bureau supresses data to protect the identity of any business or individual. Thecensus results in this table contain nonsampling error. Data users who create their own estimates using data from this table should cite the Census Bureau as the source of the original data only. Forexplanation of terms, see Appendix A. For the full technical documentation, see Appendix C.
4 Puerto Rico–Manufacturing 2002 Economic Census of Island AreasU.S. Census Bureau, 2002 Economic Census
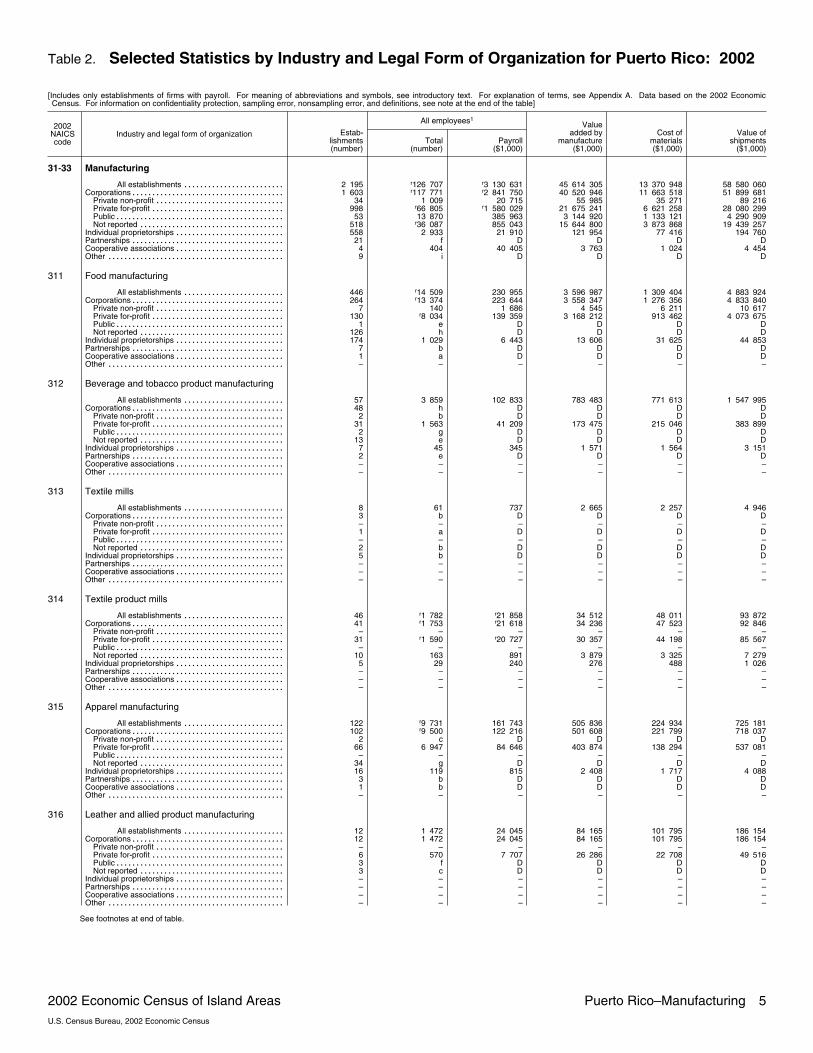
Table 2. Selected Statistics by Industry and Legal Form of Organization for Puerto Rico: 2002
[Includes only establishments of firms with payroll. For meaning of abbreviations and symbols, see introductory text. For explanation of terms, see Appendix A. Data based on the 2002 EconomicCensus. For information on confidentiality protection, sampling error, nonsampling error, and definitions, see note at the end of the table]
2002NAICScode
Industry and legal form of organization
All employees1
Estab�lishments(number)
Total(number)
Payroll($1,000)
Valueadded by
manufacture($1,000)
Cost ofmaterials($1,000)
Value ofshipments
($1,000)
31�33 Manufacturing
All establishments 2 195�������������������������r126 707 r3 130 631 45 614 305 13 370 948 58 580 060
Corporations 1 603��������������������������������������r117 771 r2 841 750 40 520 946 11 663 518 51 899 681
Private non�profit 34�������������������������������� 1 009 20 715 55 985 35 271 89 216Private for�profit 998���������������������������������
r66 805 r1 580 029 21 675 241 6 621 258 28 080 299Public 53������������������������������������������ 13 870 385 963 3 144 920 1 133 121 4 290 909Not reported 518������������������������������������
r36 087 855 043 15 644 800 3 873 868 19 439 257Individual proprietorships 558��������������������������� 2 933 21 910 121 954 77 416 194 760Partnerships 21�������������������������������������� f D D D DCooperative associations 4��������������������������� 404 40 405 3 763 1 024 4 454Other 9�������������������������������������������� i D D D D
311 Food manufacturing
All establishments 446�������������������������r14 509 230 955 3 596 987 1 309 404 4 883 924
Corporations 264��������������������������������������r13 374 223 644 3 558 347 1 276 356 4 833 840
Private non�profit 7�������������������������������� 140 1 686 4 545 6 211 10 617Private for�profit 130���������������������������������
r8 034 139 359 3 168 212 913 462 4 073 675Public 1������������������������������������������ e D D D DNot reported 126������������������������������������ h D D D D
Individual proprietorships 174��������������������������� 1 029 6 443 13 606 31 625 44 853Partnerships 7�������������������������������������� b D D D DCooperative associations 1��������������������������� a D D D DOther –�������������������������������������������� – – – – –
312 Beverage and tobacco product manufacturing
All establishments 57������������������������� 3 859 102 833 783 483 771 613 1 547 995Corporations 48�������������������������������������� h D D D D
Private non�profit 2�������������������������������� b D D D DPrivate for�profit 31��������������������������������� 1 563 41 209 173 475 215 046 383 899Public 2������������������������������������������ g D D D DNot reported 13������������������������������������ e D D D D
Individual proprietorships 7��������������������������� 45 345 1 571 1 564 3 151Partnerships 2�������������������������������������� e D D D DCooperative associations –��������������������������� – – – – –Other –�������������������������������������������� – – – – –
313 Textile mills
All establishments 8������������������������� 61 737 2 665 2 257 4 946Corporations 3�������������������������������������� b D D D D
Private non�profit –�������������������������������� – – – – –Private for�profit 1��������������������������������� a D D D DPublic –������������������������������������������ – – – – –Not reported 2������������������������������������ b D D D D
Individual proprietorships 5��������������������������� b D D D DPartnerships –�������������������������������������� – – – – –Cooperative associations –��������������������������� – – – – –Other –�������������������������������������������� – – – – –
314 Textile product mills
All establishments 46�������������������������r1 782 r21 858 34 512 48 011 93 872
Corporations 41��������������������������������������r1 753 r21 618 34 236 47 523 92 846
Private non�profit –�������������������������������� – – – – –Private for�profit 31���������������������������������
r1 590 r20 727 30 357 44 198 85 567Public –������������������������������������������ – – – – –Not reported 10������������������������������������ 163 891 3 879 3 325 7 279
Individual proprietorships 5��������������������������� 29 240 276 488 1 026Partnerships –�������������������������������������� – – – – –Cooperative associations –��������������������������� – – – – –Other –�������������������������������������������� – – – – –
315 Apparel manufacturing
All establishments 122�������������������������r9 731 161 743 505 836 224 934 725 181
Corporations 102��������������������������������������r9 500 122 216 501 608 221 799 718 037
Private non�profit 2�������������������������������� c D D D DPrivate for�profit 66��������������������������������� 6 947 84 646 403 874 138 294 537 081Public –������������������������������������������ – – – – –Not reported 34������������������������������������ g D D D D
Individual proprietorships 16��������������������������� 119 815 2 408 1 717 4 088Partnerships 3�������������������������������������� b D D D DCooperative associations 1��������������������������� b D D D DOther –�������������������������������������������� – – – – –
316 Leather and allied product manufacturing
All establishments 12������������������������� 1 472 24 045 84 165 101 795 186 154Corporations 12�������������������������������������� 1 472 24 045 84 165 101 795 186 154
Private non�profit –�������������������������������� – – – – –Private for�profit 6��������������������������������� 570 7 707 26 286 22 708 49 516Public 3������������������������������������������ f D D D DNot reported 3������������������������������������ c D D D D
Individual proprietorships –��������������������������� – – – – –Partnerships –�������������������������������������� – – – – –Cooperative associations –��������������������������� – – – – –Other –�������������������������������������������� – – – – –
See footnotes at end of table.
2002 Economic Census of Island Areas Puerto Rico–Manufacturing 5U.S. Census Bureau, 2002 Economic Census
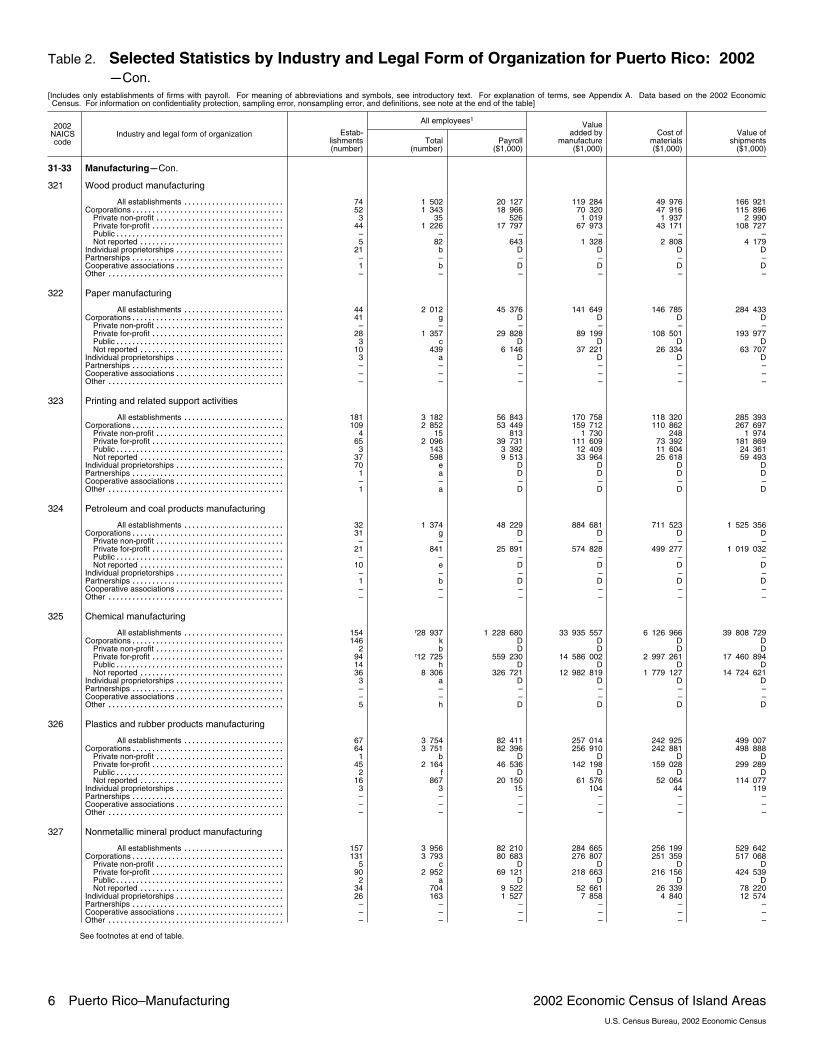
Table 2. Selected Statistics by Industry and Legal Form of Organization for Puerto Rico: 2002�Con.
[Includes only establishments of firms with payroll. For meaning of abbreviations and symbols, see introductory text. For explanation of terms, see Appendix A. Data based on the 2002 EconomicCensus. For information on confidentiality protection, sampling error, nonsampling error, and definitions, see note at the end of the table]
2002NAICScode
Industry and legal form of organization
All employees1
Estab�lishments(number)
Total(number)
Payroll($1,000)
Valueadded by
manufacture($1,000)
Cost ofmaterials($1,000)
Value ofshipments
($1,000)
31�33 Manufacturing�Con.
321 Wood product manufacturing
All establishments 74������������������������� 1 502 20 127 119 284 49 976 166 921Corporations 52�������������������������������������� 1 343 18 966 70 320 47 916 115 896
Private non�profit 3�������������������������������� 35 526 1 019 1 937 2 990Private for�profit 44��������������������������������� 1 226 17 797 67 973 43 171 108 727Public –������������������������������������������ – – – – –Not reported 5������������������������������������ 82 643 1 328 2 808 4 179
Individual proprietorships 21��������������������������� b D D D DPartnerships –�������������������������������������� – – – – –Cooperative associations 1��������������������������� b D D D DOther –�������������������������������������������� – – – – –
322 Paper manufacturing
All establishments 44������������������������� 2 012 45 376 141 649 146 785 284 433Corporations 41�������������������������������������� g D D D D
Private non�profit –�������������������������������� – – – – –Private for�profit 28��������������������������������� 1 357 29 828 89 199 108 501 193 977Public 3������������������������������������������ c D D D DNot reported 10������������������������������������ 439 6 146 37 221 26 334 63 707
Individual proprietorships 3��������������������������� a D D D DPartnerships –�������������������������������������� – – – – –Cooperative associations –��������������������������� – – – – –Other –�������������������������������������������� – – – – –
323 Printing and related support activities
All establishments 181������������������������� 3 182 56 843 170 758 118 320 285 393Corporations 109�������������������������������������� 2 852 53 449 159 712 110 862 267 697
Private non�profit 4�������������������������������� 15 813 1 730 248 1 974Private for�profit 65��������������������������������� 2 096 39 731 111 609 73 392 181 869Public 3������������������������������������������ 143 3 392 12 409 11 604 24 361Not reported 37������������������������������������ 598 9 513 33 964 25 618 59 493
Individual proprietorships 70��������������������������� e D D D DPartnerships 1�������������������������������������� a D D D DCooperative associations –��������������������������� – – – – –Other 1�������������������������������������������� a D D D D
324 Petroleum and coal products manufacturing
All establishments 32������������������������� 1 374 48 229 884 681 711 523 1 525 356Corporations 31�������������������������������������� g D D D D
Private non�profit –�������������������������������� – – – – –Private for�profit 21��������������������������������� 841 25 891 574 828 499 277 1 019 032Public –������������������������������������������ – – – – –Not reported 10������������������������������������ e D D D D
Individual proprietorships –��������������������������� – – – – –Partnerships 1�������������������������������������� b D D D DCooperative associations –��������������������������� – – – – –Other –�������������������������������������������� – – – – –
325 Chemical manufacturing
All establishments 154�������������������������r28 937 1 228 680 33 935 557 6 126 966 39 808 729
Corporations 146�������������������������������������� k D D D DPrivate non�profit 2�������������������������������� b D D D DPrivate for�profit 94���������������������������������
r12 725 559 230 14 586 002 2 997 261 17 460 894Public 14������������������������������������������ h D D D DNot reported 36������������������������������������ 8 306 326 721 12 982 819 1 779 127 14 724 621
Individual proprietorships 3��������������������������� a D D D DPartnerships –�������������������������������������� – – – – –Cooperative associations –��������������������������� – – – – –Other 5�������������������������������������������� h D D D D
326 Plastics and rubber products manufacturing
All establishments 67������������������������� 3 754 82 411 257 014 242 925 499 007Corporations 64�������������������������������������� 3 751 82 396 256 910 242 881 498 888
Private non�profit 1�������������������������������� b D D D DPrivate for�profit 45��������������������������������� 2 164 46 536 142 198 159 028 299 289Public 2������������������������������������������ f D D D DNot reported 16������������������������������������ 867 20 150 61 576 52 064 114 077
Individual proprietorships 3��������������������������� 3 15 104 44 119Partnerships –�������������������������������������� – – – – –Cooperative associations –��������������������������� – – – – –Other –�������������������������������������������� – – – – –
327 Nonmetallic mineral product manufacturing
All establishments 157������������������������� 3 956 82 210 284 665 256 199 529 642Corporations 131�������������������������������������� 3 793 80 683 276 807 251 359 517 068
Private non�profit 5�������������������������������� c D D D DPrivate for�profit 90��������������������������������� 2 952 69 121 218 663 216 156 424 539Public 2������������������������������������������ a D D D DNot reported 34������������������������������������ 704 9 522 52 661 26 339 78 220
Individual proprietorships 26��������������������������� 163 1 527 7 858 4 840 12 574Partnerships –�������������������������������������� – – – – –Cooperative associations –��������������������������� – – – – –Other –�������������������������������������������� – – – – –
See footnotes at end of table.
6 Puerto Rico–Manufacturing 2002 Economic Census of Island AreasU.S. Census Bureau, 2002 Economic Census

Table 2. Selected Statistics by Industry and Legal Form of Organization for Puerto Rico: 2002�Con.
[Includes only establishments of firms with payroll. For meaning of abbreviations and symbols, see introductory text. For explanation of terms, see Appendix A. Data based on the 2002 EconomicCensus. For information on confidentiality protection, sampling error, nonsampling error, and definitions, see note at the end of the table]
2002NAICScode
Industry and legal form of organization
All employees1
Estab�lishments(number)
Total(number)
Payroll($1,000)
Valueadded by
manufacture($1,000)
Cost ofmaterials($1,000)
Value ofshipments
($1,000)
31�33 Manufacturing�Con.
331 Primary metal manufacturing
All establishments 34������������������������� 973 12 508 43 346 33 637 75 152Corporations 26�������������������������������������� 951 12 317 42 658 33 001 73 810
Private non�profit 1�������������������������������� b D D D DPrivate for�profit 18��������������������������������� 643 8 831 22 487 23 869 45 693Public –������������������������������������������ – – – – –Not reported 7������������������������������������ c D D D D
Individual proprietorships 8��������������������������� 22 191 688 636 1 342Partnerships –�������������������������������������� – – – – –Cooperative associations –��������������������������� – – – – –Other –�������������������������������������������� – – – – –
332 Fabricated metal product manufacturing
All establishments 289�������������������������r6 960 105 703 427 227 356 727 782 960
Corporations 197��������������������������������������r6 497 101 867 415 218 345 906 760 319
Private non�profit 3�������������������������������� c D D D DPrivate for�profit 131��������������������������������� 3 969 67 661 220 212 163 003 382 499Public 2������������������������������������������ c D D D DNot reported 61������������������������������������
r2 288 28 169 159 671 150 852 310 991Individual proprietorships 92��������������������������� 463 3 836 12 009 10 821 22 641Partnerships –�������������������������������������� – – – – –Cooperative associations –��������������������������� – – – – –Other –�������������������������������������������� – – – – –
333 Machinery manufacturing
All establishments 42������������������������� 1 697 30 918 171 969 112 869 284 538Corporations 32�������������������������������������� 1 654 30 510 170 698 111 514 281 836
Private non�profit 1�������������������������������� c D D D DPrivate for�profit 16��������������������������������� e D D D DPublic 2������������������������������������������ f D D D DNot reported 13������������������������������������ e D D D D
Individual proprietorships 10��������������������������� 43 408 1 271 1 355 2 702Partnerships –�������������������������������������� – – – – –Cooperative associations –��������������������������� – – – – –Other –�������������������������������������������� – – – – –
334 Computer and electronic product manufacturing
All establishments 49������������������������� 10 905 282 068 1 184 914 1 147 576 2 288 076Corporations 47�������������������������������������� j D D D D
Private non�profit 2�������������������������������� a D D D DPrivate for�profit 23��������������������������������� 4 484 97 020 399 856 328 470 718 282Public 6������������������������������������������ g D D D DNot reported 16������������������������������������ 4 706 149 790 617 779 619 448 1 198 868
Individual proprietorships 2��������������������������� b D D D DPartnerships –�������������������������������������� – – – – –Cooperative associations –��������������������������� – – – – –Other –�������������������������������������������� – – – – –
335 Electrical equipment, appliance, and componentmanufacturing
All establishments 41������������������������� 7 084 155 024 693 786 388 589 1 100 588Corporations 39�������������������������������������� i D D D D
Private non�profit –�������������������������������� – – – – –Private for�profit 27��������������������������������� 4 899 104 669 439 886 239 578 690 492Public 7������������������������������������������ 1 775 40 606 210 138 115 465 333 123Not reported 5������������������������������������ e D D D D
Individual proprietorships 1��������������������������� a D D D DPartnerships –�������������������������������������� – – – – –Cooperative associations –��������������������������� – – – – –Other 1�������������������������������������������� b D D D D
336 Transportation equipment manufacturing
All establishments 19������������������������� 1 646 25 813 61 833 69 451 138 842Corporations 18�������������������������������������� g D D D D
Private non�profit –�������������������������������� – – – – –Private for�profit 11��������������������������������� 718 10 068 18 558 25 504 44 316Public 1������������������������������������������ c D D D DNot reported 6������������������������������������ f D D D D
Individual proprietorships 1��������������������������� a D D D DPartnerships –�������������������������������������� – – – – –Cooperative associations –��������������������������� – – – – –Other –�������������������������������������������� – – – – –
337 Furniture and related product manufacturing
All establishments 183������������������������� 2 784 28 635 70 335 64 968 131 619Corporations 92�������������������������������������� 2 300 26 290 61 971 58 028 119 186
Private non�profit –�������������������������������� – – – – –Private for�profit 56��������������������������������� 1 607 21 294 51 339 41 021 91 436Public –������������������������������������������ – – – – –Not reported 36������������������������������������ 693 4 996 10 632 17 007 27 750
Individual proprietorships 87��������������������������� 459 2 197 8 228 6 624 11 981Partnerships 4�������������������������������������� 25 148 136 316 452Cooperative associations –��������������������������� – – – – –Other –�������������������������������������������� – – – – –
See footnotes at end of table.
2002 Economic Census of Island Areas Puerto Rico–Manufacturing 7U.S. Census Bureau, 2002 Economic Census
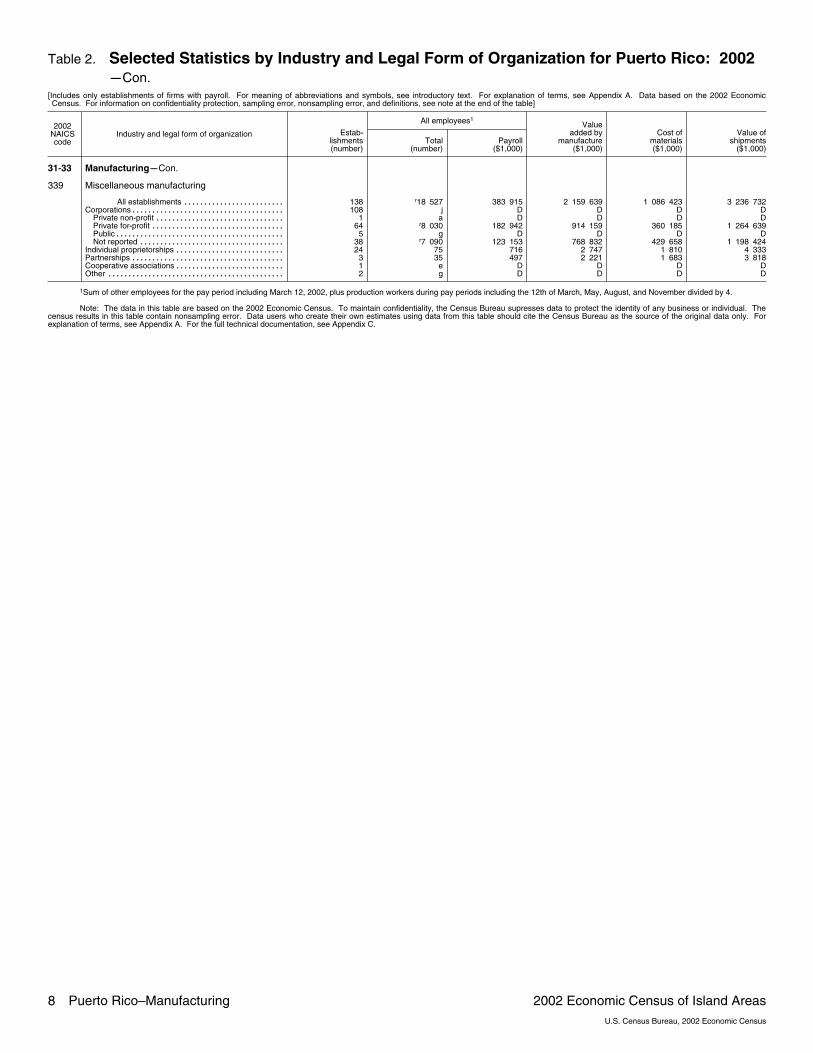
Table 2. Selected Statistics by Industry and Legal Form of Organization for Puerto Rico: 2002�Con.
[Includes only establishments of firms with payroll. For meaning of abbreviations and symbols, see introductory text. For explanation of terms, see Appendix A. Data based on the 2002 EconomicCensus. For information on confidentiality protection, sampling error, nonsampling error, and definitions, see note at the end of the table]
2002NAICScode
Industry and legal form of organization
All employees1
Estab�lishments(number)
Total(number)
Payroll($1,000)
Valueadded by
manufacture($1,000)
Cost ofmaterials($1,000)
Value ofshipments
($1,000)
31�33 Manufacturing�Con.
339 Miscellaneous manufacturing
All establishments 138�������������������������r18 527 383 915 2 159 639 1 086 423 3 236 732
Corporations 108�������������������������������������� j D D D DPrivate non�profit 1�������������������������������� a D D D DPrivate for�profit 64���������������������������������
r8 030 182 942 914 159 360 185 1 264 639Public 5������������������������������������������ g D D D DNot reported 38������������������������������������
r7 090 123 153 768 832 429 658 1 198 424Individual proprietorships 24��������������������������� 75 716 2 747 1 810 4 333Partnerships 3�������������������������������������� 35 497 2 221 1 683 3 818Cooperative associations 1��������������������������� e D D D DOther 2�������������������������������������������� g D D D D
1Sum of other employees for the pay period including March 12, 2002, plus production workers during pay periods including the 12th of March, May, August, and November divided by 4.
Note: The data in this table are based on the 2002 Economic Census. To maintain confidentiality, the Census Bureau supresses data to protect the identity of any business or individual. Thecensus results in this table contain nonsampling error. Data users who create their own estimates using data from this table should cite the Census Bureau as the source of the original data only. Forexplanation of terms, see Appendix A. For the full technical documentation, see Appendix C.
8 Puerto Rico–Manufacturing 2002 Economic Census of Island AreasU.S. Census Bureau, 2002 Economic Census

Table 3. Selected Statistics by Industry, Employment Size, and Legal Form of Organization forPuerto Rico: 2002
[Includes only establishments of firms with payroll. For meaning of abbreviations and symbols, see introductory text. For explanation of terms, see Appendix A. Data based on the 2002 EconomicCensus. For information on confidentiality protection, sampling error, nonsampling error, and definitions, see note at the end of the table]
2002NAICScode
Industry, employment size, and legal form oforganization
All employees1
Estab�lishments(number)
Total(number)
Payroll($1,000)
Valueadded by
manufacture($1,000)
Cost ofmaterials($1,000)
Value ofshipments
($1,000)
31�33 Manufacturing
All establishments 2 195�������������������������r126 707 r3 130 631 45 614 305 13 370 948 58 580 060
Establishments with an average of�1 to 4 employees 674���������������������������������� 1 557 17 357 123 417 72 167 183 6155 to 9 employees r337����������������������������������
r2 320 r29 014 r135 232 r128 232 r263 35710 to 19 employees r369��������������������������������
r5 173 r72 500 r277 399 r272 201 r537 25020 to 49 employees r376��������������������������������
r11 599 r241 070 r992 929 r911 457 r1 895 95550 to 99 employees 174�������������������������������� 12 045 227 970 1 751 946 1 329 266 3 020 711100 to 249 employees r139�����������������������������
r22 543 r575 349 r8 463 703 r2 762 256 r11 116 946250 to 499 employees r78�����������������������������
r27 622 r684 421 r9 315 258 r3 889 055 r13 116 710500 employees or more r48����������������������������
r43 848 r1 282 950 r24 554 421 r4 006 314 r28 445 516
Corporations
All establishments 1 603�������������������������r117 771 r2 841 750 40 520 946 11 663 518 51 899 681
Establishments with an average of�1 to 4 employees 268���������������������������������� f D D D D5 to 9 employees r239����������������������������������
r1 661 r23 606 r115 109 r111 621 r226 99110 to 19 employees r323��������������������������������
r4 511 r66 818 r258 687 r258 116 r508 27820 to 49 employees r350��������������������������������
r10 885 r196 055 r953 692 r870 736 r1 818 05350 to 99 employees 168�������������������������������� 11 624 221 549 1 700 949 1 305 244 2 966 707100 to 249 employees r136����������������������������� j D D D D250 to 499 employees r75����������������������������� k D D D D500 employees or more r44���������������������������� k D D D D
Individual proprietors
All establishments 558������������������������� 2 933 21 910 121 954 77 416 194 760Establishments with an average of�1 to 4 employees 398���������������������������������� f D D D D5 to 9 employees 94���������������������������������� 626 5 158 19 243 16 172 35 07010 to 19 employees 41�������������������������������� f D D D D20 to 49 employees 21�������������������������������� f D D D D50 to 99 employees 3�������������������������������� c D D D D100 to 249 employees 1����������������������������� c D D D D250 to 499 employees –����������������������������� – – – – –500 employees or more –���������������������������� – – – – –
Partnerships
All establishments 21������������������������� f D D D DEstablishments with an average of�1 to 4 employees 8���������������������������������� a D D D D5 to 9 employees 3���������������������������������� b D D D D10 to 19 employees 4�������������������������������� b D D D D20 to 49 employees 4�������������������������������� c D D D D50 to 99 employees 1�������������������������������� b D D D D100 to 249 employees –����������������������������� – – – – –250 to 499 employees 1����������������������������� e D D D D500 employees or more –���������������������������� – – – – –
Other types of legal form of organization
All establishments 13������������������������� i D D D DEstablishments with an average of�1 to 4 employees –���������������������������������� – – – – –5 to 9 employees 1���������������������������������� a D D D D10 to 19 employees 1�������������������������������� a D D D D20 to 49 employees 1�������������������������������� b D D D D50 to 99 employees 2�������������������������������� c D D D D100 to 249 employees 2����������������������������� e D D D D250 to 499 employees 2����������������������������� f D D D D500 employees or more 4���������������������������� h D D D D
311 Food manufacturing
All establishments 446�������������������������r14 509 230 955 3 596 987 1 309 404 4 883 924
Establishments with an average of�1 to 4 employees 169���������������������������������� 404 2 843 3 572 20 434 24 0685 to 9 employees 82���������������������������������� 566 4 392 15 550 15 381 30 68710 to 19 employees 76�������������������������������� 1 064 11 396 47 411 43 507 90 97120 to 49 employees 57�������������������������������� 1 712 19 815 96 172 96 147 192 39950 to 99 employees 29�������������������������������� 1 891 27 263 140 160 205 296 324 142100 to 249 employees r22�����������������������������
r3 392 r67 209 r2 959 267 r480 392 r3 435 423250 to 499 employees 8�����������������������������
r3 243 r59 939 r215 856 r261 544 r476 848500 employees or more r3����������������������������
r2 237 r38 098 r118 999 r186 703 r309 386
Corporations
All establishments 264�������������������������r13 374 223 644 3 558 347 1 276 356 4 833 840
Establishments with an average of�1 to 4 employees 55���������������������������������� c D D D D5 to 9 employees 44���������������������������������� e D D D D10 to 19 employees 56�������������������������������� 782 9 177 40 552 37 431 78 26420 to 49 employees 49�������������������������������� 1 513 18 615 92 471 91 672 184 20450 to 99 employees 27�������������������������������� g D D D D100 to 249 employees r22�����������������������������
r3 392 r67 209 r2 959 267 r480 392 r3 435 423250 to 499 employees 8�����������������������������
r3 243 r59 939 r215 856 r261 544 r476 848500 employees or more r3����������������������������
r2 237 r38 098 r118 999 r186 703 r309 386
See footnotes at end of table.
2002 Economic Census of Island Areas Puerto Rico–Manufacturing 9U.S. Census Bureau, 2002 Economic Census
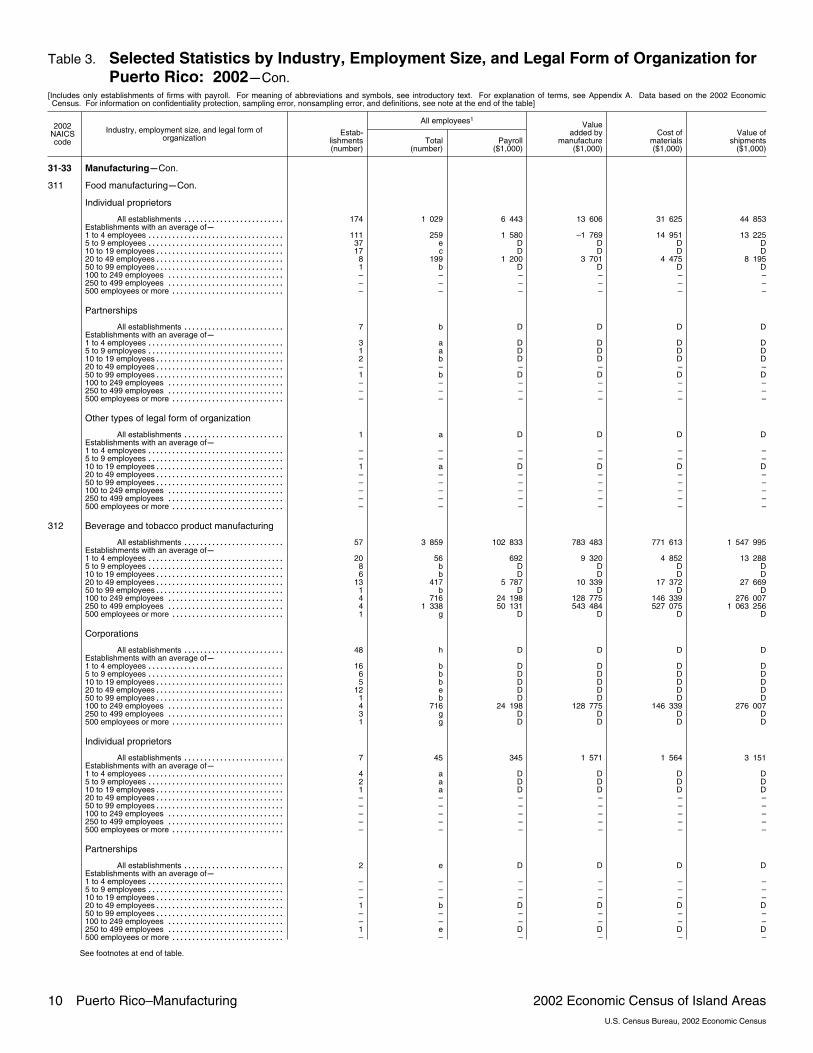
Table 3. Selected Statistics by Industry, Employment Size, and Legal Form of Organization forPuerto Rico: 2002�Con.
[Includes only establishments of firms with payroll. For meaning of abbreviations and symbols, see introductory text. For explanation of terms, see Appendix A. Data based on the 2002 EconomicCensus. For information on confidentiality protection, sampling error, nonsampling error, and definitions, see note at the end of the table]
2002NAICScode
Industry, employment size, and legal form oforganization
All employees1
Estab�lishments(number)
Total(number)
Payroll($1,000)
Valueadded by
manufacture($1,000)
Cost ofmaterials($1,000)
Value ofshipments
($1,000)
31�33 Manufacturing�Con.
311 Food manufacturing�Con.
Individual proprietors
All establishments 174������������������������� 1 029 6 443 13 606 31 625 44 853Establishments with an average of�1 to 4 employees 111���������������������������������� 259 1 580 –1 769 14 951 13 2255 to 9 employees 37���������������������������������� e D D D D10 to 19 employees 17�������������������������������� c D D D D20 to 49 employees 8�������������������������������� 199 1 200 3 701 4 475 8 19550 to 99 employees 1�������������������������������� b D D D D100 to 249 employees –����������������������������� – – – – –250 to 499 employees –����������������������������� – – – – –500 employees or more –���������������������������� – – – – –
Partnerships
All establishments 7������������������������� b D D D DEstablishments with an average of�1 to 4 employees 3���������������������������������� a D D D D5 to 9 employees 1���������������������������������� a D D D D10 to 19 employees 2�������������������������������� b D D D D20 to 49 employees –�������������������������������� – – – – –50 to 99 employees 1�������������������������������� b D D D D100 to 249 employees –����������������������������� – – – – –250 to 499 employees –����������������������������� – – – – –500 employees or more –���������������������������� – – – – –
Other types of legal form of organization
All establishments 1������������������������� a D D D DEstablishments with an average of�1 to 4 employees –���������������������������������� – – – – –5 to 9 employees –���������������������������������� – – – – –10 to 19 employees 1�������������������������������� a D D D D20 to 49 employees –�������������������������������� – – – – –50 to 99 employees –�������������������������������� – – – – –100 to 249 employees –����������������������������� – – – – –250 to 499 employees –����������������������������� – – – – –500 employees or more –���������������������������� – – – – –
312 Beverage and tobacco product manufacturing
All establishments 57������������������������� 3 859 102 833 783 483 771 613 1 547 995Establishments with an average of�1 to 4 employees 20���������������������������������� 56 692 9 320 4 852 13 2885 to 9 employees 8���������������������������������� b D D D D10 to 19 employees 6�������������������������������� b D D D D20 to 49 employees 13�������������������������������� 417 5 787 10 339 17 372 27 66950 to 99 employees 1�������������������������������� b D D D D100 to 249 employees 4����������������������������� 716 24 198 128 775 146 339 276 007250 to 499 employees 4����������������������������� 1 338 50 131 543 484 527 075 1 063 256500 employees or more 1���������������������������� g D D D D
Corporations
All establishments 48������������������������� h D D D DEstablishments with an average of�1 to 4 employees 16���������������������������������� b D D D D5 to 9 employees 6���������������������������������� b D D D D10 to 19 employees 5�������������������������������� b D D D D20 to 49 employees 12�������������������������������� e D D D D50 to 99 employees 1�������������������������������� b D D D D100 to 249 employees 4����������������������������� 716 24 198 128 775 146 339 276 007250 to 499 employees 3����������������������������� g D D D D500 employees or more 1���������������������������� g D D D D
Individual proprietors
All establishments 7������������������������� 45 345 1 571 1 564 3 151Establishments with an average of�1 to 4 employees 4���������������������������������� a D D D D5 to 9 employees 2���������������������������������� a D D D D10 to 19 employees 1�������������������������������� a D D D D20 to 49 employees –�������������������������������� – – – – –50 to 99 employees –�������������������������������� – – – – –100 to 249 employees –����������������������������� – – – – –250 to 499 employees –����������������������������� – – – – –500 employees or more –���������������������������� – – – – –
Partnerships
All establishments 2������������������������� e D D D DEstablishments with an average of�1 to 4 employees –���������������������������������� – – – – –5 to 9 employees –���������������������������������� – – – – –10 to 19 employees –�������������������������������� – – – – –20 to 49 employees 1�������������������������������� b D D D D50 to 99 employees –�������������������������������� – – – – –100 to 249 employees –����������������������������� – – – – –250 to 499 employees 1����������������������������� e D D D D500 employees or more –���������������������������� – – – – –
See footnotes at end of table.
10 Puerto Rico–Manufacturing 2002 Economic Census of Island AreasU.S. Census Bureau, 2002 Economic Census
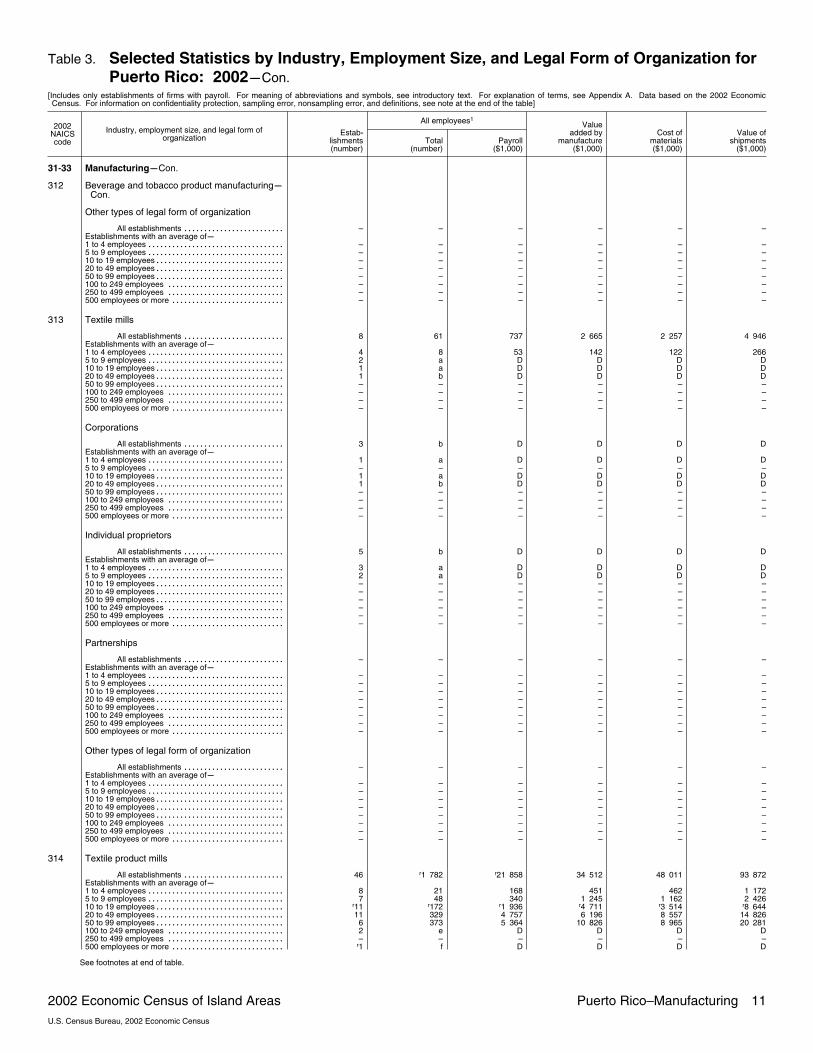
Table 3. Selected Statistics by Industry, Employment Size, and Legal Form of Organization forPuerto Rico: 2002�Con.
[Includes only establishments of firms with payroll. For meaning of abbreviations and symbols, see introductory text. For explanation of terms, see Appendix A. Data based on the 2002 EconomicCensus. For information on confidentiality protection, sampling error, nonsampling error, and definitions, see note at the end of the table]
2002NAICScode
Industry, employment size, and legal form oforganization
All employees1
Estab�lishments(number)
Total(number)
Payroll($1,000)
Valueadded by
manufacture($1,000)
Cost ofmaterials($1,000)
Value ofshipments
($1,000)
31�33 Manufacturing�Con.
312 Beverage and tobacco product manufacturing�Con.
Other types of legal form of organization
All establishments –������������������������� – – – – –Establishments with an average of�1 to 4 employees –���������������������������������� – – – – –5 to 9 employees –���������������������������������� – – – – –10 to 19 employees –�������������������������������� – – – – –20 to 49 employees –�������������������������������� – – – – –50 to 99 employees –�������������������������������� – – – – –100 to 249 employees –����������������������������� – – – – –250 to 499 employees –����������������������������� – – – – –500 employees or more –���������������������������� – – – – –
313 Textile mills
All establishments 8������������������������� 61 737 2 665 2 257 4 946Establishments with an average of�1 to 4 employees 4���������������������������������� 8 53 142 122 2665 to 9 employees 2���������������������������������� a D D D D10 to 19 employees 1�������������������������������� a D D D D20 to 49 employees 1�������������������������������� b D D D D50 to 99 employees –�������������������������������� – – – – –100 to 249 employees –����������������������������� – – – – –250 to 499 employees –����������������������������� – – – – –500 employees or more –���������������������������� – – – – –
Corporations
All establishments 3������������������������� b D D D DEstablishments with an average of�1 to 4 employees 1���������������������������������� a D D D D5 to 9 employees –���������������������������������� – – – – –10 to 19 employees 1�������������������������������� a D D D D20 to 49 employees 1�������������������������������� b D D D D50 to 99 employees –�������������������������������� – – – – –100 to 249 employees –����������������������������� – – – – –250 to 499 employees –����������������������������� – – – – –500 employees or more –���������������������������� – – – – –
Individual proprietors
All establishments 5������������������������� b D D D DEstablishments with an average of�1 to 4 employees 3���������������������������������� a D D D D5 to 9 employees 2���������������������������������� a D D D D10 to 19 employees –�������������������������������� – – – – –20 to 49 employees –�������������������������������� – – – – –50 to 99 employees –�������������������������������� – – – – –100 to 249 employees –����������������������������� – – – – –250 to 499 employees –����������������������������� – – – – –500 employees or more –���������������������������� – – – – –
Partnerships
All establishments –������������������������� – – – – –Establishments with an average of�1 to 4 employees –���������������������������������� – – – – –5 to 9 employees –���������������������������������� – – – – –10 to 19 employees –�������������������������������� – – – – –20 to 49 employees –�������������������������������� – – – – –50 to 99 employees –�������������������������������� – – – – –100 to 249 employees –����������������������������� – – – – –250 to 499 employees –����������������������������� – – – – –500 employees or more –���������������������������� – – – – –
Other types of legal form of organization
All establishments –������������������������� – – – – –Establishments with an average of�1 to 4 employees –���������������������������������� – – – – –5 to 9 employees –���������������������������������� – – – – –10 to 19 employees –�������������������������������� – – – – –20 to 49 employees –�������������������������������� – – – – –50 to 99 employees –�������������������������������� – – – – –100 to 249 employees –����������������������������� – – – – –250 to 499 employees –����������������������������� – – – – –500 employees or more –���������������������������� – – – – –
314 Textile product mills
All establishments 46�������������������������r1 782 r21 858 34 512 48 011 93 872
Establishments with an average of�1 to 4 employees 8���������������������������������� 21 168 451 462 1 1725 to 9 employees 7���������������������������������� 48 340 1 245 1 162 2 42610 to 19 employees r11��������������������������������
r172 r1 936 r4 711 r3 514 r8 64420 to 49 employees 11�������������������������������� 329 4 757 6 196 8 557 14 82650 to 99 employees 6�������������������������������� 373 5 364 10 826 8 965 20 281100 to 249 employees 2����������������������������� e D D D D250 to 499 employees –����������������������������� – – – – –500 employees or more r1���������������������������� f D D D D
See footnotes at end of table.
2002 Economic Census of Island Areas Puerto Rico–Manufacturing 11U.S. Census Bureau, 2002 Economic Census

Table 3. Selected Statistics by Industry, Employment Size, and Legal Form of Organization forPuerto Rico: 2002�Con.
[Includes only establishments of firms with payroll. For meaning of abbreviations and symbols, see introductory text. For explanation of terms, see Appendix A. Data based on the 2002 EconomicCensus. For information on confidentiality protection, sampling error, nonsampling error, and definitions, see note at the end of the table]
2002NAICScode
Industry, employment size, and legal form oforganization
All employees1
Estab�lishments(number)
Total(number)
Payroll($1,000)
Valueadded by
manufacture($1,000)
Cost ofmaterials($1,000)
Value ofshipments
($1,000)
31�33 Manufacturing�Con.
314 Textile product mills�Con.
Corporations
All establishments 41�������������������������r1 753 r21 618 34 236 47 523 92 846
Establishments with an average of�1 to 4 employees 4���������������������������������� a D D D D5 to 9 employees 7���������������������������������� 48 340 1 245 1 162 2 42610 to 19 employees r10�������������������������������� c D D D D20 to 49 employees 11�������������������������������� 329 4 757 6 196 8 557 14 82650 to 99 employees 6�������������������������������� 373 5 364 10 826 8 965 20 281100 to 249 employees 2����������������������������� e D D D D250 to 499 employees –����������������������������� – – – – –500 employees or more r1���������������������������� f D D D D
Individual proprietors
All establishments 5������������������������� 29 240 276 488 1 026Establishments with an average of�1 to 4 employees 4���������������������������������� a D D D D5 to 9 employees –���������������������������������� – – – – –10 to 19 employees 1�������������������������������� a D D D D20 to 49 employees –�������������������������������� – – – – –50 to 99 employees –�������������������������������� – – – – –100 to 249 employees –����������������������������� – – – – –250 to 499 employees –����������������������������� – – – – –500 employees or more –���������������������������� – – – – –
Partnerships
All establishments –������������������������� – – – – –Establishments with an average of�1 to 4 employees –���������������������������������� – – – – –5 to 9 employees –���������������������������������� – – – – –10 to 19 employees –�������������������������������� – – – – –20 to 49 employees –�������������������������������� – – – – –50 to 99 employees –�������������������������������� – – – – –100 to 249 employees –����������������������������� – – – – –250 to 499 employees –����������������������������� – – – – –500 employees or more –���������������������������� – – – – –
Other types of legal form of organization
All establishments –������������������������� – – – – –Establishments with an average of�1 to 4 employees –���������������������������������� – – – – –5 to 9 employees –���������������������������������� – – – – –10 to 19 employees –�������������������������������� – – – – –20 to 49 employees –�������������������������������� – – – – –50 to 99 employees –�������������������������������� – – – – –100 to 249 employees –����������������������������� – – – – –250 to 499 employees –����������������������������� – – – – –500 employees or more –���������������������������� – – – – –
315 Apparel manufacturing
All establishments 122�������������������������r9 731 161 743 505 836 224 934 725 181
Establishments with an average of�1 to 4 employees 23���������������������������������� 57 510 1 729 1 673 3 4305 to 9 employees 18���������������������������������� 122 1 063 3 616 3 061 6 75210 to 19 employees 18�������������������������������� 243 2 321 4 912 6 360 11 10520 to 49 employees 28�������������������������������� 916 50 353 31 588 27 770 59 58950 to 99 employees 16�������������������������������� 1 144 14 934 33 816 26 981 60 749100 to 249 employees 6����������������������������� 1 005 8 781 14 803 16 742 32 097250 to 499 employees 8����������������������������� 2 588 28 417 36 300 81 684 115 620500 employees or more 5����������������������������
r3 656 55 364 379 072 60 663 435 839
Corporations
All establishments 102�������������������������r9 500 122 216 501 608 221 799 718 037
Establishments with an average of�1 to 4 employees 15���������������������������������� b D D D D5 to 9 employees 12���������������������������������� 82 785 2 394 2 613 5 09010 to 19 employees 16�������������������������������� c D D D D20 to 49 employees 24�������������������������������� 774 11 496 29 524 26 138 56 07550 to 99 employees 16�������������������������������� 1 144 14 934 33 816 26 981 60 749100 to 249 employees 6����������������������������� 1 005 8 781 14 803 16 742 32 097250 to 499 employees 8����������������������������� 2 588 28 417 36 300 81 684 115 620500 employees or more 5����������������������������
r3 656 55 364 379 072 60 663 435 839
Individual proprietors
All establishments 16������������������������� 119 815 2 408 1 717 4 088Establishments with an average of�1 to 4 employees 7���������������������������������� a D D D D5 to 9 employees 6���������������������������������� 40 278 1 222 448 1 66210 to 19 employees 2�������������������������������� b D D D D20 to 49 employees 1�������������������������������� b D D D D50 to 99 employees –�������������������������������� – – – – –100 to 249 employees –����������������������������� – – – – –250 to 499 employees –����������������������������� – – – – –500 employees or more –���������������������������� – – – – –
See footnotes at end of table.
12 Puerto Rico–Manufacturing 2002 Economic Census of Island AreasU.S. Census Bureau, 2002 Economic Census
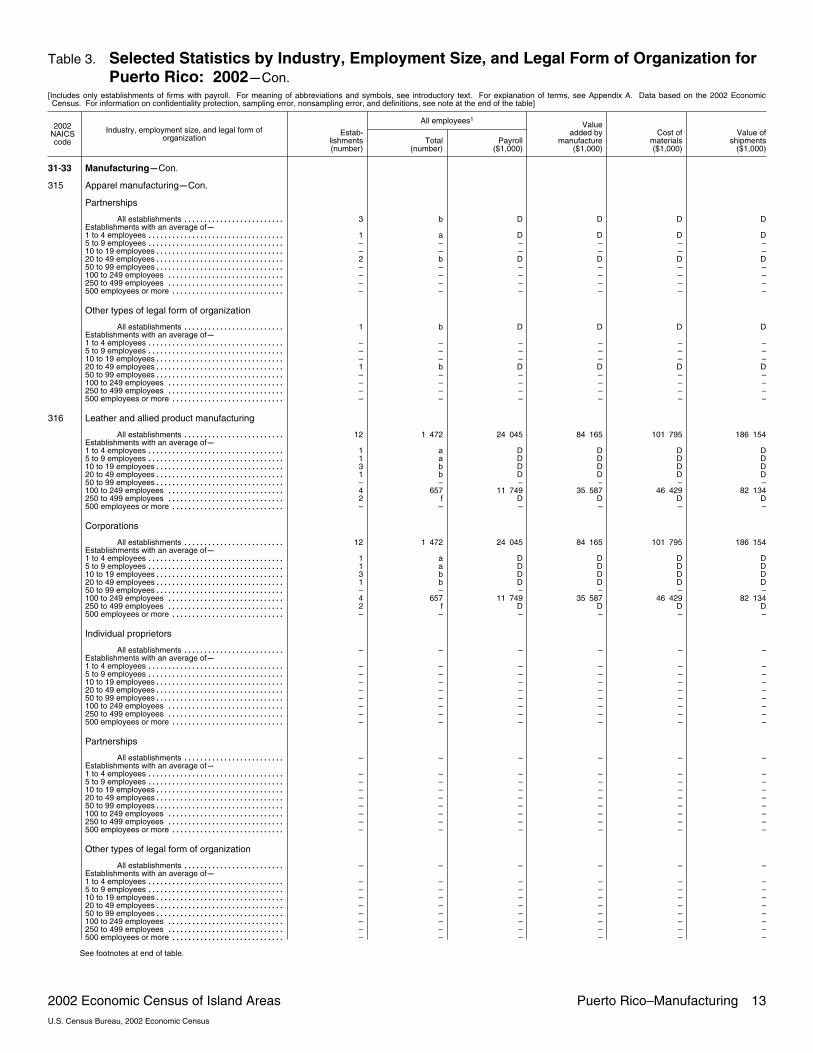
Table 3. Selected Statistics by Industry, Employment Size, and Legal Form of Organization forPuerto Rico: 2002�Con.
[Includes only establishments of firms with payroll. For meaning of abbreviations and symbols, see introductory text. For explanation of terms, see Appendix A. Data based on the 2002 EconomicCensus. For information on confidentiality protection, sampling error, nonsampling error, and definitions, see note at the end of the table]
2002NAICScode
Industry, employment size, and legal form oforganization
All employees1
Estab�lishments(number)
Total(number)
Payroll($1,000)
Valueadded by
manufacture($1,000)
Cost ofmaterials($1,000)
Value ofshipments
($1,000)
31�33 Manufacturing�Con.
315 Apparel manufacturing�Con.
Partnerships
All establishments 3������������������������� b D D D DEstablishments with an average of�1 to 4 employees 1���������������������������������� a D D D D5 to 9 employees –���������������������������������� – – – – –10 to 19 employees –�������������������������������� – – – – –20 to 49 employees 2�������������������������������� b D D D D50 to 99 employees –�������������������������������� – – – – –100 to 249 employees –����������������������������� – – – – –250 to 499 employees –����������������������������� – – – – –500 employees or more –���������������������������� – – – – –
Other types of legal form of organization
All establishments 1������������������������� b D D D DEstablishments with an average of�1 to 4 employees –���������������������������������� – – – – –5 to 9 employees –���������������������������������� – – – – –10 to 19 employees –�������������������������������� – – – – –20 to 49 employees 1�������������������������������� b D D D D50 to 99 employees –�������������������������������� – – – – –100 to 249 employees –����������������������������� – – – – –250 to 499 employees –����������������������������� – – – – –500 employees or more –���������������������������� – – – – –
316 Leather and allied product manufacturing
All establishments 12������������������������� 1 472 24 045 84 165 101 795 186 154Establishments with an average of�1 to 4 employees 1���������������������������������� a D D D D5 to 9 employees 1���������������������������������� a D D D D10 to 19 employees 3�������������������������������� b D D D D20 to 49 employees 1�������������������������������� b D D D D50 to 99 employees –�������������������������������� – – – – –100 to 249 employees 4����������������������������� 657 11 749 35 587 46 429 82 134250 to 499 employees 2����������������������������� f D D D D500 employees or more –���������������������������� – – – – –
Corporations
All establishments 12������������������������� 1 472 24 045 84 165 101 795 186 154Establishments with an average of�1 to 4 employees 1���������������������������������� a D D D D5 to 9 employees 1���������������������������������� a D D D D10 to 19 employees 3�������������������������������� b D D D D20 to 49 employees 1�������������������������������� b D D D D50 to 99 employees –�������������������������������� – – – – –100 to 249 employees 4����������������������������� 657 11 749 35 587 46 429 82 134250 to 499 employees 2����������������������������� f D D D D500 employees or more –���������������������������� – – – – –
Individual proprietors
All establishments –������������������������� – – – – –Establishments with an average of�1 to 4 employees –���������������������������������� – – – – –5 to 9 employees –���������������������������������� – – – – –10 to 19 employees –�������������������������������� – – – – –20 to 49 employees –�������������������������������� – – – – –50 to 99 employees –�������������������������������� – – – – –100 to 249 employees –����������������������������� – – – – –250 to 499 employees –����������������������������� – – – – –500 employees or more –���������������������������� – – – – –
Partnerships
All establishments –������������������������� – – – – –Establishments with an average of�1 to 4 employees –���������������������������������� – – – – –5 to 9 employees –���������������������������������� – – – – –10 to 19 employees –�������������������������������� – – – – –20 to 49 employees –�������������������������������� – – – – –50 to 99 employees –�������������������������������� – – – – –100 to 249 employees –����������������������������� – – – – –250 to 499 employees –����������������������������� – – – – –500 employees or more –���������������������������� – – – – –
Other types of legal form of organization
All establishments –������������������������� – – – – –Establishments with an average of�1 to 4 employees –���������������������������������� – – – – –5 to 9 employees –���������������������������������� – – – – –10 to 19 employees –�������������������������������� – – – – –20 to 49 employees –�������������������������������� – – – – –50 to 99 employees –�������������������������������� – – – – –100 to 249 employees –����������������������������� – – – – –250 to 499 employees –����������������������������� – – – – –500 employees or more –���������������������������� – – – – –
See footnotes at end of table.
2002 Economic Census of Island Areas Puerto Rico–Manufacturing 13U.S. Census Bureau, 2002 Economic Census
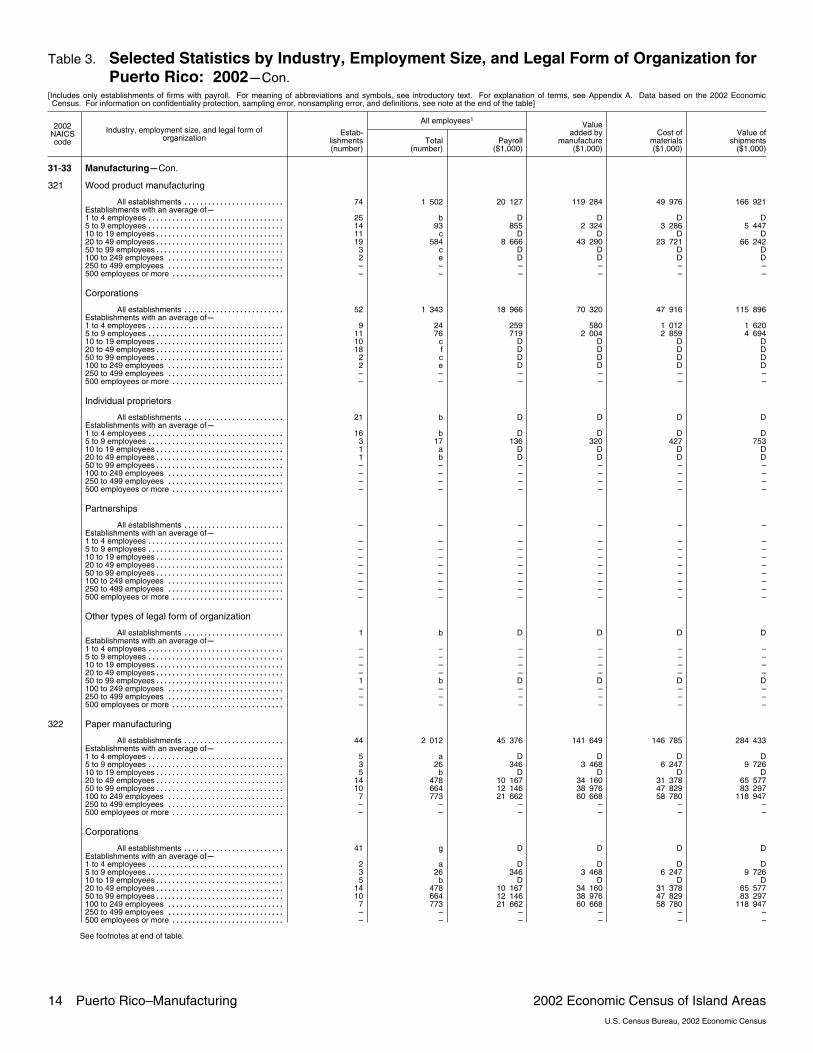
Table 3. Selected Statistics by Industry, Employment Size, and Legal Form of Organization forPuerto Rico: 2002�Con.
[Includes only establishments of firms with payroll. For meaning of abbreviations and symbols, see introductory text. For explanation of terms, see Appendix A. Data based on the 2002 EconomicCensus. For information on confidentiality protection, sampling error, nonsampling error, and definitions, see note at the end of the table]
2002NAICScode
Industry, employment size, and legal form oforganization
All employees1
Estab�lishments(number)
Total(number)
Payroll($1,000)
Valueadded by
manufacture($1,000)
Cost ofmaterials($1,000)
Value ofshipments
($1,000)
31�33 Manufacturing�Con.
321 Wood product manufacturing
All establishments 74������������������������� 1 502 20 127 119 284 49 976 166 921Establishments with an average of�1 to 4 employees 25���������������������������������� b D D D D5 to 9 employees 14���������������������������������� 93 855 2 324 3 286 5 44710 to 19 employees 11�������������������������������� c D D D D20 to 49 employees 19�������������������������������� 584 8 666 43 290 23 721 66 24250 to 99 employees 3�������������������������������� c D D D D100 to 249 employees 2����������������������������� e D D D D250 to 499 employees –����������������������������� – – – – –500 employees or more –���������������������������� – – – – –
Corporations
All establishments 52������������������������� 1 343 18 966 70 320 47 916 115 896Establishments with an average of�1 to 4 employees 9���������������������������������� 24 259 580 1 012 1 6205 to 9 employees 11���������������������������������� 76 719 2 004 2 859 4 69410 to 19 employees 10�������������������������������� c D D D D20 to 49 employees 18�������������������������������� f D D D D50 to 99 employees 2�������������������������������� c D D D D100 to 249 employees 2����������������������������� e D D D D250 to 499 employees –����������������������������� – – – – –500 employees or more –���������������������������� – – – – –
Individual proprietors
All establishments 21������������������������� b D D D DEstablishments with an average of�1 to 4 employees 16���������������������������������� b D D D D5 to 9 employees 3���������������������������������� 17 136 320 427 75310 to 19 employees 1�������������������������������� a D D D D20 to 49 employees 1�������������������������������� b D D D D50 to 99 employees –�������������������������������� – – – – –100 to 249 employees –����������������������������� – – – – –250 to 499 employees –����������������������������� – – – – –500 employees or more –���������������������������� – – – – –
Partnerships
All establishments –������������������������� – – – – –Establishments with an average of�1 to 4 employees –���������������������������������� – – – – –5 to 9 employees –���������������������������������� – – – – –10 to 19 employees –�������������������������������� – – – – –20 to 49 employees –�������������������������������� – – – – –50 to 99 employees –�������������������������������� – – – – –100 to 249 employees –����������������������������� – – – – –250 to 499 employees –����������������������������� – – – – –500 employees or more –���������������������������� – – – – –
Other types of legal form of organization
All establishments 1������������������������� b D D D DEstablishments with an average of�1 to 4 employees –���������������������������������� – – – – –5 to 9 employees –���������������������������������� – – – – –10 to 19 employees –�������������������������������� – – – – –20 to 49 employees –�������������������������������� – – – – –50 to 99 employees 1�������������������������������� b D D D D100 to 249 employees –����������������������������� – – – – –250 to 499 employees –����������������������������� – – – – –500 employees or more –���������������������������� – – – – –
322 Paper manufacturing
All establishments 44������������������������� 2 012 45 376 141 649 146 785 284 433Establishments with an average of�1 to 4 employees 5���������������������������������� a D D D D5 to 9 employees 3���������������������������������� 26 346 3 468 6 247 9 72610 to 19 employees 5�������������������������������� b D D D D20 to 49 employees 14�������������������������������� 478 10 167 34 160 31 378 65 57750 to 99 employees 10�������������������������������� 664 12 146 38 976 47 829 83 297100 to 249 employees 7����������������������������� 773 21 662 60 668 58 780 118 947250 to 499 employees –����������������������������� – – – – –500 employees or more –���������������������������� – – – – –
Corporations
All establishments 41������������������������� g D D D DEstablishments with an average of�1 to 4 employees 2���������������������������������� a D D D D5 to 9 employees 3���������������������������������� 26 346 3 468 6 247 9 72610 to 19 employees 5�������������������������������� b D D D D20 to 49 employees 14�������������������������������� 478 10 167 34 160 31 378 65 57750 to 99 employees 10�������������������������������� 664 12 146 38 976 47 829 83 297100 to 249 employees 7����������������������������� 773 21 662 60 668 58 780 118 947250 to 499 employees –����������������������������� – – – – –500 employees or more –���������������������������� – – – – –
See footnotes at end of table.
14 Puerto Rico–Manufacturing 2002 Economic Census of Island AreasU.S. Census Bureau, 2002 Economic Census
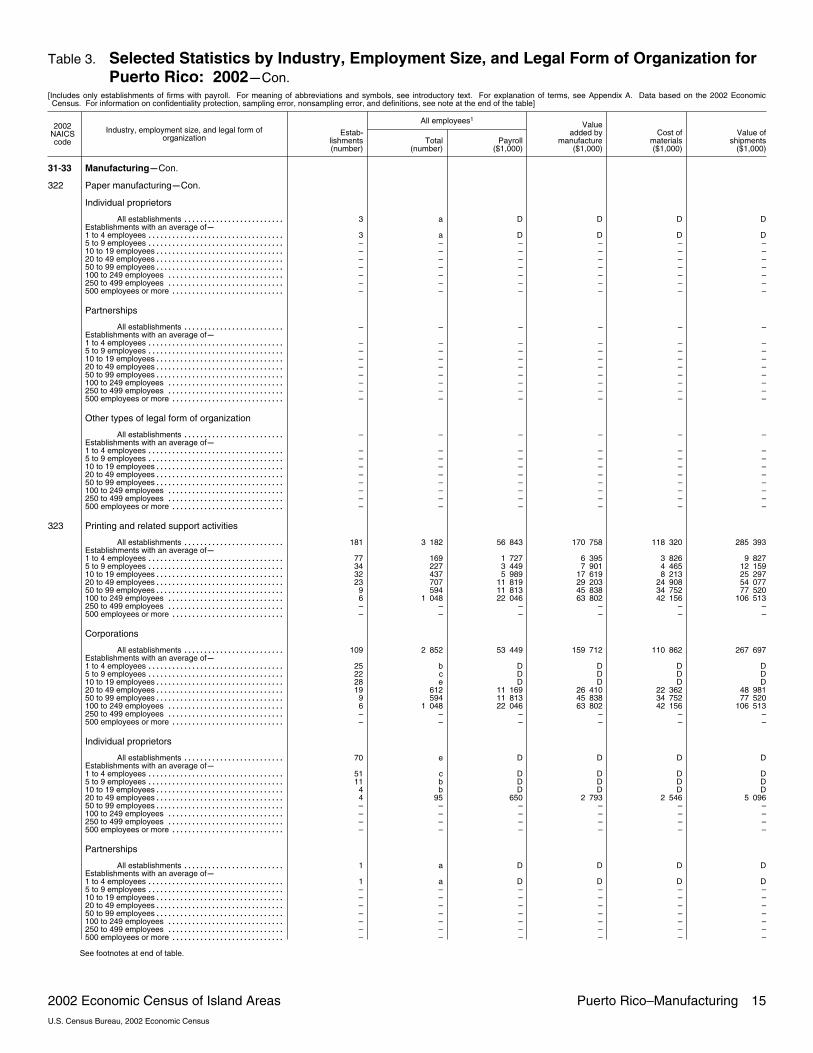
Table 3. Selected Statistics by Industry, Employment Size, and Legal Form of Organization forPuerto Rico: 2002�Con.
[Includes only establishments of firms with payroll. For meaning of abbreviations and symbols, see introductory text. For explanation of terms, see Appendix A. Data based on the 2002 EconomicCensus. For information on confidentiality protection, sampling error, nonsampling error, and definitions, see note at the end of the table]
2002NAICScode
Industry, employment size, and legal form oforganization
All employees1
Estab�lishments(number)
Total(number)
Payroll($1,000)
Valueadded by
manufacture($1,000)
Cost ofmaterials($1,000)
Value ofshipments
($1,000)
31�33 Manufacturing�Con.
322 Paper manufacturing�Con.
Individual proprietors
All establishments 3������������������������� a D D D DEstablishments with an average of�1 to 4 employees 3���������������������������������� a D D D D5 to 9 employees –���������������������������������� – – – – –10 to 19 employees –�������������������������������� – – – – –20 to 49 employees –�������������������������������� – – – – –50 to 99 employees –�������������������������������� – – – – –100 to 249 employees –����������������������������� – – – – –250 to 499 employees –����������������������������� – – – – –500 employees or more –���������������������������� – – – – –
Partnerships
All establishments –������������������������� – – – – –Establishments with an average of�1 to 4 employees –���������������������������������� – – – – –5 to 9 employees –���������������������������������� – – – – –10 to 19 employees –�������������������������������� – – – – –20 to 49 employees –�������������������������������� – – – – –50 to 99 employees –�������������������������������� – – – – –100 to 249 employees –����������������������������� – – – – –250 to 499 employees –����������������������������� – – – – –500 employees or more –���������������������������� – – – – –
Other types of legal form of organization
All establishments –������������������������� – – – – –Establishments with an average of�1 to 4 employees –���������������������������������� – – – – –5 to 9 employees –���������������������������������� – – – – –10 to 19 employees –�������������������������������� – – – – –20 to 49 employees –�������������������������������� – – – – –50 to 99 employees –�������������������������������� – – – – –100 to 249 employees –����������������������������� – – – – –250 to 499 employees –����������������������������� – – – – –500 employees or more –���������������������������� – – – – –
323 Printing and related support activities
All establishments 181������������������������� 3 182 56 843 170 758 118 320 285 393Establishments with an average of�1 to 4 employees 77���������������������������������� 169 1 727 6 395 3 826 9 8275 to 9 employees 34���������������������������������� 227 3 449 7 901 4 465 12 15910 to 19 employees 32�������������������������������� 437 5 989 17 619 8 213 25 29720 to 49 employees 23�������������������������������� 707 11 819 29 203 24 908 54 07750 to 99 employees 9�������������������������������� 594 11 813 45 838 34 752 77 520100 to 249 employees 6����������������������������� 1 048 22 046 63 802 42 156 106 513250 to 499 employees –����������������������������� – – – – –500 employees or more –���������������������������� – – – – –
Corporations
All establishments 109������������������������� 2 852 53 449 159 712 110 862 267 697Establishments with an average of�1 to 4 employees 25���������������������������������� b D D D D5 to 9 employees 22���������������������������������� c D D D D10 to 19 employees 28�������������������������������� e D D D D20 to 49 employees 19�������������������������������� 612 11 169 26 410 22 362 48 98150 to 99 employees 9�������������������������������� 594 11 813 45 838 34 752 77 520100 to 249 employees 6����������������������������� 1 048 22 046 63 802 42 156 106 513250 to 499 employees –����������������������������� – – – – –500 employees or more –���������������������������� – – – – –
Individual proprietors
All establishments 70������������������������� e D D D DEstablishments with an average of�1 to 4 employees 51���������������������������������� c D D D D5 to 9 employees 11���������������������������������� b D D D D10 to 19 employees 4�������������������������������� b D D D D20 to 49 employees 4�������������������������������� 95 650 2 793 2 546 5 09650 to 99 employees –�������������������������������� – – – – –100 to 249 employees –����������������������������� – – – – –250 to 499 employees –����������������������������� – – – – –500 employees or more –���������������������������� – – – – –
Partnerships
All establishments 1������������������������� a D D D DEstablishments with an average of�1 to 4 employees 1���������������������������������� a D D D D5 to 9 employees –���������������������������������� – – – – –10 to 19 employees –�������������������������������� – – – – –20 to 49 employees –�������������������������������� – – – – –50 to 99 employees –�������������������������������� – – – – –100 to 249 employees –����������������������������� – – – – –250 to 499 employees –����������������������������� – – – – –500 employees or more –���������������������������� – – – – –
See footnotes at end of table.
2002 Economic Census of Island Areas Puerto Rico–Manufacturing 15U.S. Census Bureau, 2002 Economic Census

Table 3. Selected Statistics by Industry, Employment Size, and Legal Form of Organization forPuerto Rico: 2002�Con.
[Includes only establishments of firms with payroll. For meaning of abbreviations and symbols, see introductory text. For explanation of terms, see Appendix A. Data based on the 2002 EconomicCensus. For information on confidentiality protection, sampling error, nonsampling error, and definitions, see note at the end of the table]
2002NAICScode
Industry, employment size, and legal form oforganization
All employees1
Estab�lishments(number)
Total(number)
Payroll($1,000)
Valueadded by
manufacture($1,000)
Cost ofmaterials($1,000)
Value ofshipments
($1,000)
31�33 Manufacturing�Con.
323 Printing and related support activities�Con.
Other types of legal form of organization
All establishments 1������������������������� a D D D DEstablishments with an average of�1 to 4 employees –���������������������������������� – – – – –5 to 9 employees 1���������������������������������� a D D D D10 to 19 employees –�������������������������������� – – – – –20 to 49 employees –�������������������������������� – – – – –50 to 99 employees –�������������������������������� – – – – –100 to 249 employees –����������������������������� – – – – –250 to 499 employees –����������������������������� – – – – –500 employees or more –���������������������������� – – – – –
324 Petroleum and coal products manufacturing
All establishments 32������������������������� 1 374 48 229 884 681 711 523 1 525 356Establishments with an average of�1 to 4 employees 1���������������������������������� a D D D D5 to 9 employees 4���������������������������������� b D D D D10 to 19 employees 6�������������������������������� b D D D D20 to 49 employees 14�������������������������������� 451 16 989 258 217 230 686 479 29650 to 99 employees 4�������������������������������� e D D D D100 to 249 employees 2����������������������������� e D D D D250 to 499 employees 1����������������������������� e D D D D500 employees or more –���������������������������� – – – – –
Corporations
All establishments 31������������������������� g D D D DEstablishments with an average of�1 to 4 employees 1���������������������������������� a D D D D5 to 9 employees 4���������������������������������� b D D D D10 to 19 employees 6�������������������������������� b D D D D20 to 49 employees 13�������������������������������� e D D D D50 to 99 employees 4�������������������������������� e D D D D100 to 249 employees 2����������������������������� e D D D D250 to 499 employees 1����������������������������� e D D D D500 employees or more –���������������������������� – – – – –
Individual proprietors
All establishments –������������������������� – – – – –Establishments with an average of�1 to 4 employees –���������������������������������� – – – – –5 to 9 employees –���������������������������������� – – – – –10 to 19 employees –�������������������������������� – – – – –20 to 49 employees –�������������������������������� – – – – –50 to 99 employees –�������������������������������� – – – – –100 to 249 employees –����������������������������� – – – – –250 to 499 employees –����������������������������� – – – – –500 employees or more –���������������������������� – – – – –
Partnerships
All establishments 1������������������������� b D D D DEstablishments with an average of�1 to 4 employees –���������������������������������� – – – – –5 to 9 employees –���������������������������������� – – – – –10 to 19 employees –�������������������������������� – – – – –20 to 49 employees 1�������������������������������� b D D D D50 to 99 employees –�������������������������������� – – – – –100 to 249 employees –����������������������������� – – – – –250 to 499 employees –����������������������������� – – – – –500 employees or more –���������������������������� – – – – –
Other types of legal form of organization
All establishments –������������������������� – – – – –Establishments with an average of�1 to 4 employees –���������������������������������� – – – – –5 to 9 employees –���������������������������������� – – – – –10 to 19 employees –�������������������������������� – – – – –20 to 49 employees –�������������������������������� – – – – –50 to 99 employees –�������������������������������� – – – – –100 to 249 employees –����������������������������� – – – – –250 to 499 employees –����������������������������� – – – – –500 employees or more –���������������������������� – – – – –
325 Chemical manufacturing
All establishments 154�������������������������r28 937 1 228 680 33 935 557 6 126 966 39 808 729
Establishments with an average of�1 to 4 employees 18���������������������������������� b D D D D5 to 9 employees 17���������������������������������� 115 2 865 29 714 12 973 42 60910 to 19 employees 19�������������������������������� e D D D D20 to 49 employees r28��������������������������������
r837 r21 765 r211 094 r210 537 r437 20750 to 99 employees 12�������������������������������� 890 33 845 825 368 311 784 1 120 152100 to 249 employees 27����������������������������� 4 683 200 090 3 674 974 1 114 787 4 736 288250 to 499 employees r15�����������������������������
r5 691 r231 629 r7 029 049 r1 761 892 r8 707 867500 employees or more 18���������������������������� 16 433 732 016 22 114 411 2 634 092 24 646 729
See footnotes at end of table.
16 Puerto Rico–Manufacturing 2002 Economic Census of Island AreasU.S. Census Bureau, 2002 Economic Census
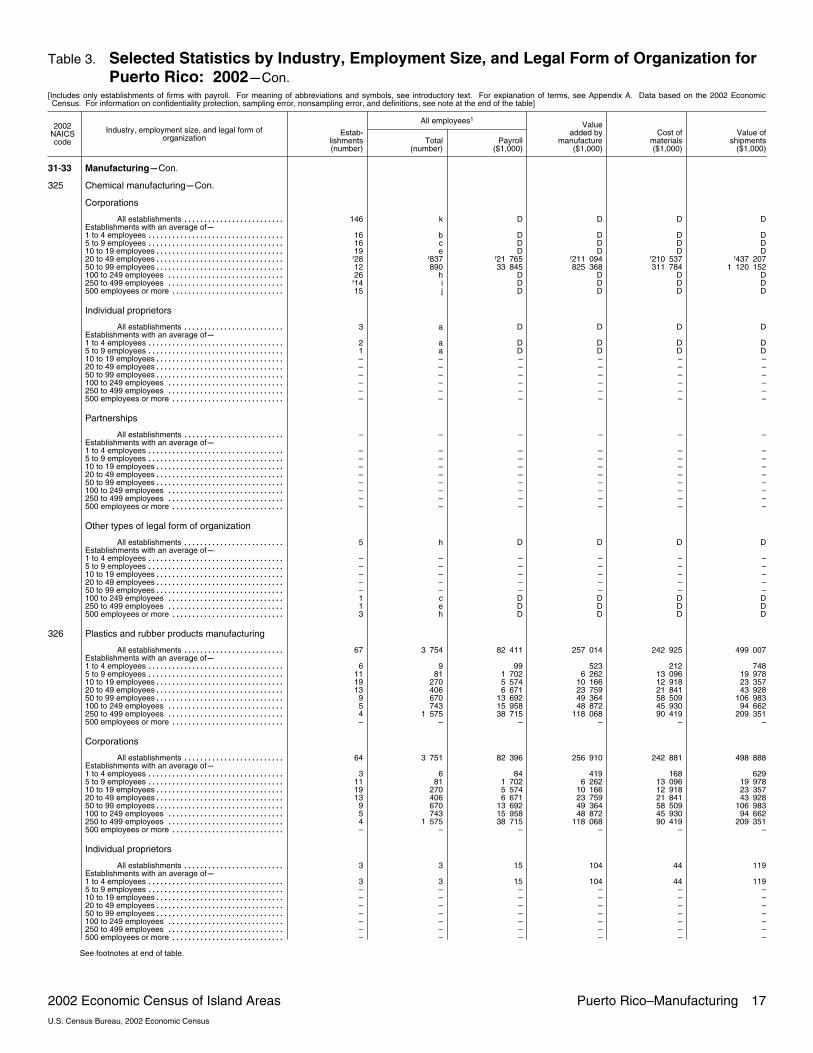
Table 3. Selected Statistics by Industry, Employment Size, and Legal Form of Organization forPuerto Rico: 2002�Con.
[Includes only establishments of firms with payroll. For meaning of abbreviations and symbols, see introductory text. For explanation of terms, see Appendix A. Data based on the 2002 EconomicCensus. For information on confidentiality protection, sampling error, nonsampling error, and definitions, see note at the end of the table]
2002NAICScode
Industry, employment size, and legal form oforganization
All employees1
Estab�lishments(number)
Total(number)
Payroll($1,000)
Valueadded by
manufacture($1,000)
Cost ofmaterials($1,000)
Value ofshipments
($1,000)
31�33 Manufacturing�Con.
325 Chemical manufacturing�Con.
Corporations
All establishments 146������������������������� k D D D DEstablishments with an average of�1 to 4 employees 16���������������������������������� b D D D D5 to 9 employees 16���������������������������������� c D D D D10 to 19 employees 19�������������������������������� e D D D D20 to 49 employees r28��������������������������������
r837 r21 765 r211 094 r210 537 r437 20750 to 99 employees 12�������������������������������� 890 33 845 825 368 311 784 1 120 152100 to 249 employees 26����������������������������� h D D D D250 to 499 employees r14����������������������������� i D D D D500 employees or more 15���������������������������� j D D D D
Individual proprietors
All establishments 3������������������������� a D D D DEstablishments with an average of�1 to 4 employees 2���������������������������������� a D D D D5 to 9 employees 1���������������������������������� a D D D D10 to 19 employees –�������������������������������� – – – – –20 to 49 employees –�������������������������������� – – – – –50 to 99 employees –�������������������������������� – – – – –100 to 249 employees –����������������������������� – – – – –250 to 499 employees –����������������������������� – – – – –500 employees or more –���������������������������� – – – – –
Partnerships
All establishments –������������������������� – – – – –Establishments with an average of�1 to 4 employees –���������������������������������� – – – – –5 to 9 employees –���������������������������������� – – – – –10 to 19 employees –�������������������������������� – – – – –20 to 49 employees –�������������������������������� – – – – –50 to 99 employees –�������������������������������� – – – – –100 to 249 employees –����������������������������� – – – – –250 to 499 employees –����������������������������� – – – – –500 employees or more –���������������������������� – – – – –
Other types of legal form of organization
All establishments 5������������������������� h D D D DEstablishments with an average of�1 to 4 employees –���������������������������������� – – – – –5 to 9 employees –���������������������������������� – – – – –10 to 19 employees –�������������������������������� – – – – –20 to 49 employees –�������������������������������� – – – – –50 to 99 employees –�������������������������������� – – – – –100 to 249 employees 1����������������������������� c D D D D250 to 499 employees 1����������������������������� e D D D D500 employees or more 3���������������������������� h D D D D
326 Plastics and rubber products manufacturing
All establishments 67������������������������� 3 754 82 411 257 014 242 925 499 007Establishments with an average of�1 to 4 employees 6���������������������������������� 9 99 523 212 7485 to 9 employees 11���������������������������������� 81 1 702 6 262 13 096 19 97810 to 19 employees 19�������������������������������� 270 5 574 10 166 12 918 23 35720 to 49 employees 13�������������������������������� 406 6 671 23 759 21 841 43 92850 to 99 employees 9�������������������������������� 670 13 692 49 364 58 509 106 983100 to 249 employees 5����������������������������� 743 15 958 48 872 45 930 94 662250 to 499 employees 4����������������������������� 1 575 38 715 118 068 90 419 209 351500 employees or more –���������������������������� – – – – –
Corporations
All establishments 64������������������������� 3 751 82 396 256 910 242 881 498 888Establishments with an average of�1 to 4 employees 3���������������������������������� 6 84 419 168 6295 to 9 employees 11���������������������������������� 81 1 702 6 262 13 096 19 97810 to 19 employees 19�������������������������������� 270 5 574 10 166 12 918 23 35720 to 49 employees 13�������������������������������� 406 6 671 23 759 21 841 43 92850 to 99 employees 9�������������������������������� 670 13 692 49 364 58 509 106 983100 to 249 employees 5����������������������������� 743 15 958 48 872 45 930 94 662250 to 499 employees 4����������������������������� 1 575 38 715 118 068 90 419 209 351500 employees or more –���������������������������� – – – – –
Individual proprietors
All establishments 3������������������������� 3 15 104 44 119Establishments with an average of�1 to 4 employees 3���������������������������������� 3 15 104 44 1195 to 9 employees –���������������������������������� – – – – –10 to 19 employees –�������������������������������� – – – – –20 to 49 employees –�������������������������������� – – – – –50 to 99 employees –�������������������������������� – – – – –100 to 249 employees –����������������������������� – – – – –250 to 499 employees –����������������������������� – – – – –500 employees or more –���������������������������� – – – – –
See footnotes at end of table.
2002 Economic Census of Island Areas Puerto Rico–Manufacturing 17U.S. Census Bureau, 2002 Economic Census
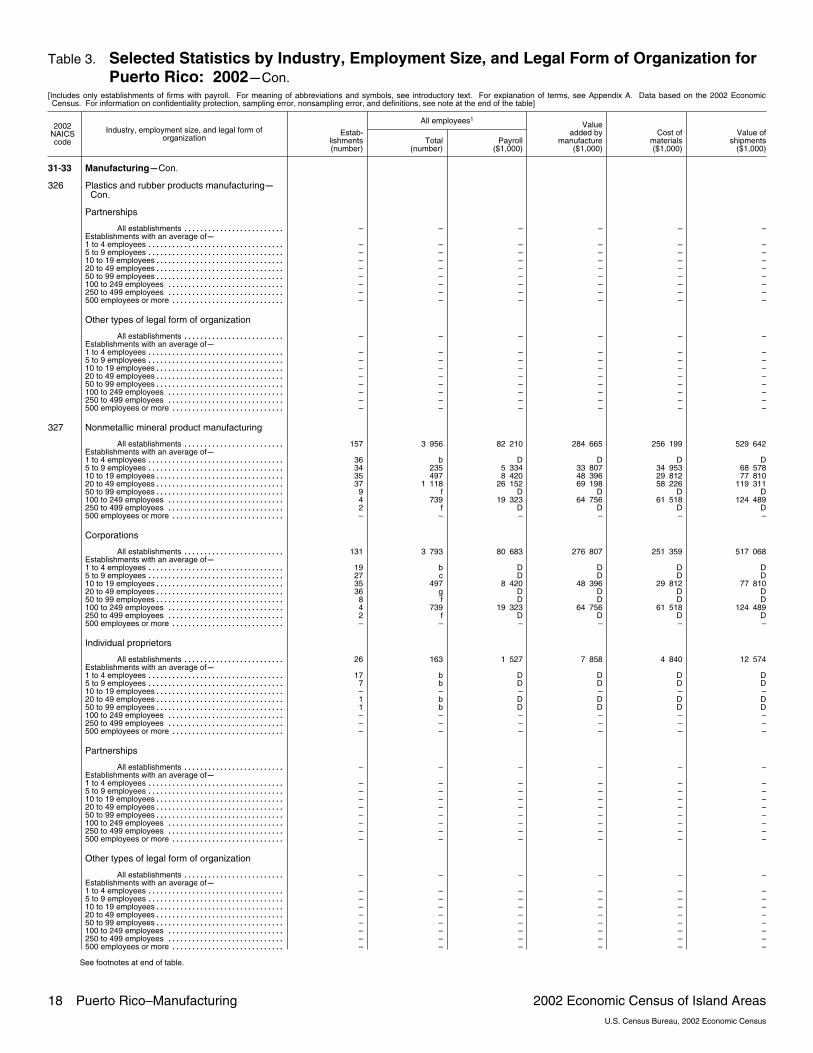
Table 3. Selected Statistics by Industry, Employment Size, and Legal Form of Organization forPuerto Rico: 2002�Con.
[Includes only establishments of firms with payroll. For meaning of abbreviations and symbols, see introductory text. For explanation of terms, see Appendix A. Data based on the 2002 EconomicCensus. For information on confidentiality protection, sampling error, nonsampling error, and definitions, see note at the end of the table]
2002NAICScode
Industry, employment size, and legal form oforganization
All employees1
Estab�lishments(number)
Total(number)
Payroll($1,000)
Valueadded by
manufacture($1,000)
Cost ofmaterials($1,000)
Value ofshipments
($1,000)
31�33 Manufacturing�Con.
326 Plastics and rubber products manufacturing�Con.
Partnerships
All establishments –������������������������� – – – – –Establishments with an average of�1 to 4 employees –���������������������������������� – – – – –5 to 9 employees –���������������������������������� – – – – –10 to 19 employees –�������������������������������� – – – – –20 to 49 employees –�������������������������������� – – – – –50 to 99 employees –�������������������������������� – – – – –100 to 249 employees –����������������������������� – – – – –250 to 499 employees –����������������������������� – – – – –500 employees or more –���������������������������� – – – – –
Other types of legal form of organization
All establishments –������������������������� – – – – –Establishments with an average of�1 to 4 employees –���������������������������������� – – – – –5 to 9 employees –���������������������������������� – – – – –10 to 19 employees –�������������������������������� – – – – –20 to 49 employees –�������������������������������� – – – – –50 to 99 employees –�������������������������������� – – – – –100 to 249 employees –����������������������������� – – – – –250 to 499 employees –����������������������������� – – – – –500 employees or more –���������������������������� – – – – –
327 Nonmetallic mineral product manufacturing
All establishments 157������������������������� 3 956 82 210 284 665 256 199 529 642Establishments with an average of�1 to 4 employees 36���������������������������������� b D D D D5 to 9 employees 34���������������������������������� 235 5 334 33 807 34 953 68 57810 to 19 employees 35�������������������������������� 497 8 420 48 396 29 812 77 81020 to 49 employees 37�������������������������������� 1 118 26 152 69 198 58 226 119 31150 to 99 employees 9�������������������������������� f D D D D100 to 249 employees 4����������������������������� 739 19 323 64 756 61 518 124 489250 to 499 employees 2����������������������������� f D D D D500 employees or more –���������������������������� – – – – –
Corporations
All establishments 131������������������������� 3 793 80 683 276 807 251 359 517 068Establishments with an average of�1 to 4 employees 19���������������������������������� b D D D D5 to 9 employees 27���������������������������������� c D D D D10 to 19 employees 35�������������������������������� 497 8 420 48 396 29 812 77 81020 to 49 employees 36�������������������������������� g D D D D50 to 99 employees 8�������������������������������� f D D D D100 to 249 employees 4����������������������������� 739 19 323 64 756 61 518 124 489250 to 499 employees 2����������������������������� f D D D D500 employees or more –���������������������������� – – – – –
Individual proprietors
All establishments 26������������������������� 163 1 527 7 858 4 840 12 574Establishments with an average of�1 to 4 employees 17���������������������������������� b D D D D5 to 9 employees 7���������������������������������� b D D D D10 to 19 employees –�������������������������������� – – – – –20 to 49 employees 1�������������������������������� b D D D D50 to 99 employees 1�������������������������������� b D D D D100 to 249 employees –����������������������������� – – – – –250 to 499 employees –����������������������������� – – – – –500 employees or more –���������������������������� – – – – –
Partnerships
All establishments –������������������������� – – – – –Establishments with an average of�1 to 4 employees –���������������������������������� – – – – –5 to 9 employees –���������������������������������� – – – – –10 to 19 employees –�������������������������������� – – – – –20 to 49 employees –�������������������������������� – – – – –50 to 99 employees –�������������������������������� – – – – –100 to 249 employees –����������������������������� – – – – –250 to 499 employees –����������������������������� – – – – –500 employees or more –���������������������������� – – – – –
Other types of legal form of organization
All establishments –������������������������� – – – – –Establishments with an average of�1 to 4 employees –���������������������������������� – – – – –5 to 9 employees –���������������������������������� – – – – –10 to 19 employees –�������������������������������� – – – – –20 to 49 employees –�������������������������������� – – – – –50 to 99 employees –�������������������������������� – – – – –100 to 249 employees –����������������������������� – – – – –250 to 499 employees –����������������������������� – – – – –500 employees or more –���������������������������� – – – – –
See footnotes at end of table.
18 Puerto Rico–Manufacturing 2002 Economic Census of Island AreasU.S. Census Bureau, 2002 Economic Census

Table 3. Selected Statistics by Industry, Employment Size, and Legal Form of Organization forPuerto Rico: 2002�Con.
[Includes only establishments of firms with payroll. For meaning of abbreviations and symbols, see introductory text. For explanation of terms, see Appendix A. Data based on the 2002 EconomicCensus. For information on confidentiality protection, sampling error, nonsampling error, and definitions, see note at the end of the table]
2002NAICScode
Industry, employment size, and legal form oforganization
All employees1
Estab�lishments(number)
Total(number)
Payroll($1,000)
Valueadded by
manufacture($1,000)
Cost ofmaterials($1,000)
Value ofshipments
($1,000)
31�33 Manufacturing�Con.
331 Primary metal manufacturing
All establishments 34������������������������� 973 12 508 43 346 33 637 75 152Establishments with an average of�1 to 4 employees 15���������������������������������� 29 239 1 326 1 134 2 3945 to 9 employees 3���������������������������������� 22 293 801 1 271 2 14610 to 19 employees 5�������������������������������� 65 727 2 367 6 475 8 86120 to 49 employees 4�������������������������������� 149 2 596 8 269 4 253 11 63450 to 99 employees 4�������������������������������� 232 3 516 18 192 9 921 27 352100 to 249 employees 3����������������������������� 476 5 137 12 391 10 583 22 765250 to 499 employees –����������������������������� – – – – –500 employees or more –���������������������������� – – – – –
Corporations
All establishments 26������������������������� 951 12 317 42 658 33 001 73 810Establishments with an average of�1 to 4 employees 9���������������������������������� b D D D D5 to 9 employees 1���������������������������������� a D D D D10 to 19 employees 5�������������������������������� 65 727 2 367 6 475 8 86120 to 49 employees 4�������������������������������� 149 2 596 8 269 4 253 11 63450 to 99 employees 4�������������������������������� 232 3 516 18 192 9 921 27 352100 to 249 employees 3����������������������������� 476 5 137 12 391 10 583 22 765250 to 499 employees –����������������������������� – – – – –500 employees or more –���������������������������� – – – – –
Individual proprietors
All establishments 8������������������������� 22 191 688 636 1 342Establishments with an average of�1 to 4 employees 6���������������������������������� a D D D D5 to 9 employees 2���������������������������������� a D D D D10 to 19 employees –�������������������������������� – – – – –20 to 49 employees –�������������������������������� – – – – –50 to 99 employees –�������������������������������� – – – – –100 to 249 employees –����������������������������� – – – – –250 to 499 employees –����������������������������� – – – – –500 employees or more –���������������������������� – – – – –
Partnerships
All establishments –������������������������� – – – – –Establishments with an average of�1 to 4 employees –���������������������������������� – – – – –5 to 9 employees –���������������������������������� – – – – –10 to 19 employees –�������������������������������� – – – – –20 to 49 employees –�������������������������������� – – – – –50 to 99 employees –�������������������������������� – – – – –100 to 249 employees –����������������������������� – – – – –250 to 499 employees –����������������������������� – – – – –500 employees or more –���������������������������� – – – – –
Other types of legal form of organization
All establishments –������������������������� – – – – –Establishments with an average of�1 to 4 employees –���������������������������������� – – – – –5 to 9 employees –���������������������������������� – – – – –10 to 19 employees –�������������������������������� – – – – –20 to 49 employees –�������������������������������� – – – – –50 to 99 employees –�������������������������������� – – – – –100 to 249 employees –����������������������������� – – – – –250 to 499 employees –����������������������������� – – – – –500 employees or more –���������������������������� – – – – –
332 Fabricated metal product manufacturing
All establishments 289�������������������������r6 960 105 703 427 227 356 727 782 960
Establishments with an average of�1 to 4 employees 106���������������������������������� c D D D D5 to 9 employees 39���������������������������������� e D D D D10 to 19 employees 59�������������������������������� 845 11 647 34 087 32 131 65 19320 to 49 employees 49�������������������������������� 1 552 20 716 72 604 64 949 136 66350 to 99 employees 24�������������������������������� 1 761 28 050 139 660 102 823 243 107100 to 249 employees 7����������������������������� 883 13 837 68 666 78 104 147 765250 to 499 employees r5�����������������������������
r1 396 r26 242 r93 755 r59 002 r152 462500 employees or more r–���������������������������� a D D D D
Corporations
All establishments 197�������������������������r6 497 101 867 415 218 345 906 760 319
Establishments with an average of�1 to 4 employees 35���������������������������������� b D D D D5 to 9 employees 29���������������������������������� c D D D D10 to 19 employees 51�������������������������������� 725 10 789 31 912 29 585 60 87720 to 49 employees 47�������������������������������� g D D D D50 to 99 employees 23�������������������������������� g D D D D100 to 249 employees 7����������������������������� 883 13 837 68 666 78 104 147 765250 to 499 employees r5�����������������������������
r1 396 r26 242 r93 755 r59 002 r152 462500 employees or more r–���������������������������� a D D D D
See footnotes at end of table.
2002 Economic Census of Island Areas Puerto Rico–Manufacturing 19U.S. Census Bureau, 2002 Economic Census

Table 3. Selected Statistics by Industry, Employment Size, and Legal Form of Organization forPuerto Rico: 2002�Con.
[Includes only establishments of firms with payroll. For meaning of abbreviations and symbols, see introductory text. For explanation of terms, see Appendix A. Data based on the 2002 EconomicCensus. For information on confidentiality protection, sampling error, nonsampling error, and definitions, see note at the end of the table]
2002NAICScode
Industry, employment size, and legal form oforganization
All employees1
Estab�lishments(number)
Total(number)
Payroll($1,000)
Valueadded by
manufacture($1,000)
Cost ofmaterials($1,000)
Value ofshipments
($1,000)
31�33 Manufacturing�Con.
332 Fabricated metal product manufacturing�Con.
Individual proprietors
All establishments 92������������������������� 463 3 836 12 009 10 821 22 641Establishments with an average of�1 to 4 employees 71���������������������������������� c D D D D5 to 9 employees 10���������������������������������� b D D D D10 to 19 employees 8�������������������������������� 120 858 2 175 2 546 4 31620 to 49 employees 2�������������������������������� b D D D D50 to 99 employees 1�������������������������������� b D D D D100 to 249 employees –����������������������������� – – – – –250 to 499 employees –����������������������������� – – – – –500 employees or more –���������������������������� – – – – –
Partnerships
All establishments –������������������������� – – – – –Establishments with an average of�1 to 4 employees –���������������������������������� – – – – –5 to 9 employees –���������������������������������� – – – – –10 to 19 employees –�������������������������������� – – – – –20 to 49 employees –�������������������������������� – – – – –50 to 99 employees –�������������������������������� – – – – –100 to 249 employees –����������������������������� – – – – –250 to 499 employees –����������������������������� – – – – –500 employees or more –���������������������������� – – – – –
Other types of legal form of organization
All establishments –������������������������� – – – – –Establishments with an average of�1 to 4 employees –���������������������������������� – – – – –5 to 9 employees –���������������������������������� – – – – –10 to 19 employees –�������������������������������� – – – – –20 to 49 employees –�������������������������������� – – – – –50 to 99 employees –�������������������������������� – – – – –100 to 249 employees –����������������������������� – – – – –250 to 499 employees –����������������������������� – – – – –500 employees or more –���������������������������� – – – – –
333 Machinery manufacturing
All establishments 42������������������������� 1 697 30 918 171 969 112 869 284 538Establishments with an average of�1 to 4 employees 15���������������������������������� b D D D D5 to 9 employees 9���������������������������������� b D D D D10 to 19 employees 5�������������������������������� 59 1 126 1 874 2 276 4 38220 to 49 employees 5�������������������������������� c D D D D50 to 99 employees 1�������������������������������� b D D D D100 to 249 employees 5����������������������������� 702 11 188 40 035 19 726 59 627250 to 499 employees 2����������������������������� f D D D D500 employees or more –���������������������������� – – – – –
Corporations
All establishments 32������������������������� 1 654 30 510 170 698 111 514 281 836Establishments with an average of�1 to 4 employees 8���������������������������������� a D D D D5 to 9 employees 7���������������������������������� b D D D D10 to 19 employees 4�������������������������������� b D D D D20 to 49 employees 5�������������������������������� c D D D D50 to 99 employees 1�������������������������������� b D D D D100 to 249 employees 5����������������������������� 702 11 188 40 035 19 726 59 627250 to 499 employees 2����������������������������� f D D D D500 employees or more –���������������������������� – – – – –
Individual proprietors
All establishments 10������������������������� 43 408 1 271 1 355 2 702Establishments with an average of�1 to 4 employees 7���������������������������������� a D D D D5 to 9 employees 2���������������������������������� a D D D D10 to 19 employees 1�������������������������������� a D D D D20 to 49 employees –�������������������������������� – – – – –50 to 99 employees –�������������������������������� – – – – –100 to 249 employees –����������������������������� – – – – –250 to 499 employees –����������������������������� – – – – –500 employees or more –���������������������������� – – – – –
Partnerships
All establishments –������������������������� – – – – –Establishments with an average of�1 to 4 employees –���������������������������������� – – – – –5 to 9 employees –���������������������������������� – – – – –10 to 19 employees –�������������������������������� – – – – –20 to 49 employees –�������������������������������� – – – – –50 to 99 employees –�������������������������������� – – – – –100 to 249 employees –����������������������������� – – – – –250 to 499 employees –����������������������������� – – – – –500 employees or more –���������������������������� – – – – –
See footnotes at end of table.
20 Puerto Rico–Manufacturing 2002 Economic Census of Island AreasU.S. Census Bureau, 2002 Economic Census
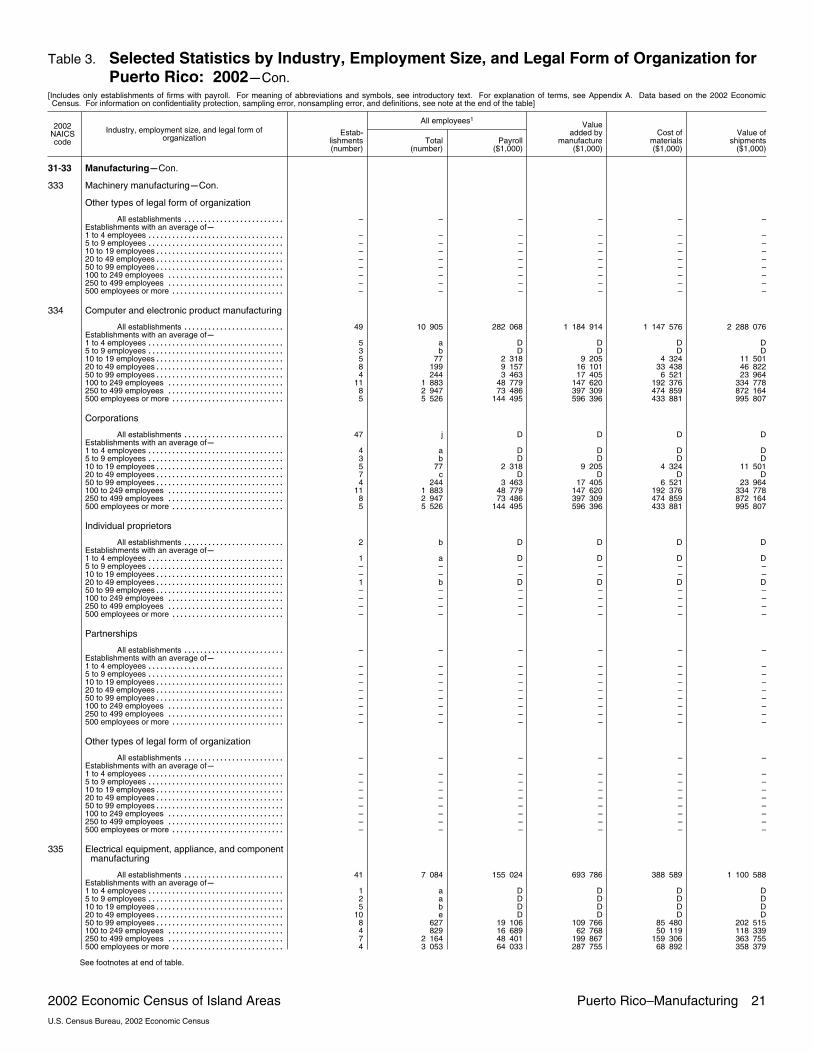
Table 3. Selected Statistics by Industry, Employment Size, and Legal Form of Organization forPuerto Rico: 2002�Con.
[Includes only establishments of firms with payroll. For meaning of abbreviations and symbols, see introductory text. For explanation of terms, see Appendix A. Data based on the 2002 EconomicCensus. For information on confidentiality protection, sampling error, nonsampling error, and definitions, see note at the end of the table]
2002NAICScode
Industry, employment size, and legal form oforganization
All employees1
Estab�lishments(number)
Total(number)
Payroll($1,000)
Valueadded by
manufacture($1,000)
Cost ofmaterials($1,000)
Value ofshipments
($1,000)
31�33 Manufacturing�Con.
333 Machinery manufacturing�Con.
Other types of legal form of organization
All establishments –������������������������� – – – – –Establishments with an average of�1 to 4 employees –���������������������������������� – – – – –5 to 9 employees –���������������������������������� – – – – –10 to 19 employees –�������������������������������� – – – – –20 to 49 employees –�������������������������������� – – – – –50 to 99 employees –�������������������������������� – – – – –100 to 249 employees –����������������������������� – – – – –250 to 499 employees –����������������������������� – – – – –500 employees or more –���������������������������� – – – – –
334 Computer and electronic product manufacturing
All establishments 49������������������������� 10 905 282 068 1 184 914 1 147 576 2 288 076Establishments with an average of�1 to 4 employees 5���������������������������������� a D D D D5 to 9 employees 3���������������������������������� b D D D D10 to 19 employees 5�������������������������������� 77 2 318 9 205 4 324 11 50120 to 49 employees 8�������������������������������� 199 9 157 16 101 33 438 46 82250 to 99 employees 4�������������������������������� 244 3 463 17 405 6 521 23 964100 to 249 employees 11����������������������������� 1 883 48 779 147 620 192 376 334 778250 to 499 employees 8����������������������������� 2 947 73 486 397 309 474 859 872 164500 employees or more 5���������������������������� 5 526 144 495 596 396 433 881 995 807
Corporations
All establishments 47������������������������� j D D D DEstablishments with an average of�1 to 4 employees 4���������������������������������� a D D D D5 to 9 employees 3���������������������������������� b D D D D10 to 19 employees 5�������������������������������� 77 2 318 9 205 4 324 11 50120 to 49 employees 7�������������������������������� c D D D D50 to 99 employees 4�������������������������������� 244 3 463 17 405 6 521 23 964100 to 249 employees 11����������������������������� 1 883 48 779 147 620 192 376 334 778250 to 499 employees 8����������������������������� 2 947 73 486 397 309 474 859 872 164500 employees or more 5���������������������������� 5 526 144 495 596 396 433 881 995 807
Individual proprietors
All establishments 2������������������������� b D D D DEstablishments with an average of�1 to 4 employees 1���������������������������������� a D D D D5 to 9 employees –���������������������������������� – – – – –10 to 19 employees –�������������������������������� – – – – –20 to 49 employees 1�������������������������������� b D D D D50 to 99 employees –�������������������������������� – – – – –100 to 249 employees –����������������������������� – – – – –250 to 499 employees –����������������������������� – – – – –500 employees or more –���������������������������� – – – – –
Partnerships
All establishments –������������������������� – – – – –Establishments with an average of�1 to 4 employees –���������������������������������� – – – – –5 to 9 employees –���������������������������������� – – – – –10 to 19 employees –�������������������������������� – – – – –20 to 49 employees –�������������������������������� – – – – –50 to 99 employees –�������������������������������� – – – – –100 to 249 employees –����������������������������� – – – – –250 to 499 employees –����������������������������� – – – – –500 employees or more –���������������������������� – – – – –
Other types of legal form of organization
All establishments –������������������������� – – – – –Establishments with an average of�1 to 4 employees –���������������������������������� – – – – –5 to 9 employees –���������������������������������� – – – – –10 to 19 employees –�������������������������������� – – – – –20 to 49 employees –�������������������������������� – – – – –50 to 99 employees –�������������������������������� – – – – –100 to 249 employees –����������������������������� – – – – –250 to 499 employees –����������������������������� – – – – –500 employees or more –���������������������������� – – – – –
335 Electrical equipment, appliance, and componentmanufacturing
All establishments 41������������������������� 7 084 155 024 693 786 388 589 1 100 588Establishments with an average of�1 to 4 employees 1���������������������������������� a D D D D5 to 9 employees 2���������������������������������� a D D D D10 to 19 employees 5�������������������������������� b D D D D20 to 49 employees 10�������������������������������� e D D D D50 to 99 employees 8�������������������������������� 627 19 106 109 766 85 480 202 515100 to 249 employees 4����������������������������� 829 16 689 62 768 50 119 118 339250 to 499 employees 7����������������������������� 2 164 48 401 199 867 159 306 363 755500 employees or more 4���������������������������� 3 053 64 033 287 755 68 892 358 379
See footnotes at end of table.
2002 Economic Census of Island Areas Puerto Rico–Manufacturing 21U.S. Census Bureau, 2002 Economic Census
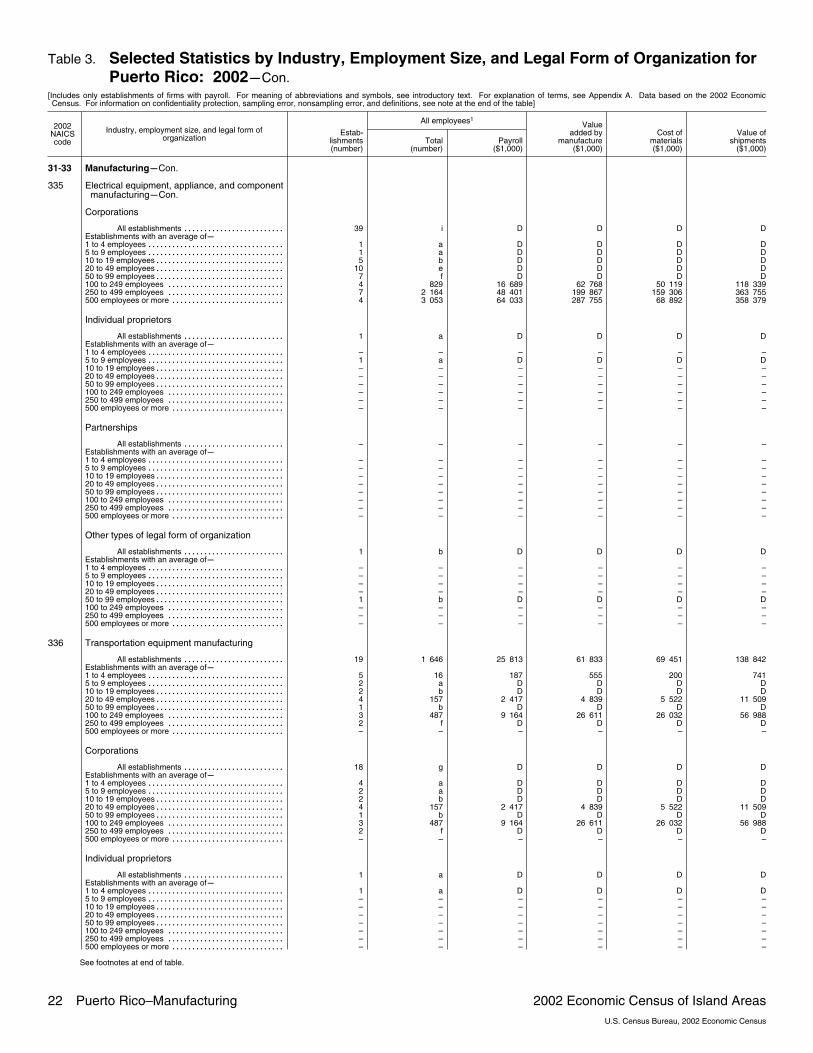
Table 3. Selected Statistics by Industry, Employment Size, and Legal Form of Organization forPuerto Rico: 2002�Con.
[Includes only establishments of firms with payroll. For meaning of abbreviations and symbols, see introductory text. For explanation of terms, see Appendix A. Data based on the 2002 EconomicCensus. For information on confidentiality protection, sampling error, nonsampling error, and definitions, see note at the end of the table]
2002NAICScode
Industry, employment size, and legal form oforganization
All employees1
Estab�lishments(number)
Total(number)
Payroll($1,000)
Valueadded by
manufacture($1,000)
Cost ofmaterials($1,000)
Value ofshipments
($1,000)
31�33 Manufacturing�Con.
335 Electrical equipment, appliance, and componentmanufacturing�Con.
Corporations
All establishments 39������������������������� i D D D DEstablishments with an average of�1 to 4 employees 1���������������������������������� a D D D D5 to 9 employees 1���������������������������������� a D D D D10 to 19 employees 5�������������������������������� b D D D D20 to 49 employees 10�������������������������������� e D D D D50 to 99 employees 7�������������������������������� f D D D D100 to 249 employees 4����������������������������� 829 16 689 62 768 50 119 118 339250 to 499 employees 7����������������������������� 2 164 48 401 199 867 159 306 363 755500 employees or more 4���������������������������� 3 053 64 033 287 755 68 892 358 379
Individual proprietors
All establishments 1������������������������� a D D D DEstablishments with an average of�1 to 4 employees –���������������������������������� – – – – –5 to 9 employees 1���������������������������������� a D D D D10 to 19 employees –�������������������������������� – – – – –20 to 49 employees –�������������������������������� – – – – –50 to 99 employees –�������������������������������� – – – – –100 to 249 employees –����������������������������� – – – – –250 to 499 employees –����������������������������� – – – – –500 employees or more –���������������������������� – – – – –
Partnerships
All establishments –������������������������� – – – – –Establishments with an average of�1 to 4 employees –���������������������������������� – – – – –5 to 9 employees –���������������������������������� – – – – –10 to 19 employees –�������������������������������� – – – – –20 to 49 employees –�������������������������������� – – – – –50 to 99 employees –�������������������������������� – – – – –100 to 249 employees –����������������������������� – – – – –250 to 499 employees –����������������������������� – – – – –500 employees or more –���������������������������� – – – – –
Other types of legal form of organization
All establishments 1������������������������� b D D D DEstablishments with an average of�1 to 4 employees –���������������������������������� – – – – –5 to 9 employees –���������������������������������� – – – – –10 to 19 employees –�������������������������������� – – – – –20 to 49 employees –�������������������������������� – – – – –50 to 99 employees 1�������������������������������� b D D D D100 to 249 employees –����������������������������� – – – – –250 to 499 employees –����������������������������� – – – – –500 employees or more –���������������������������� – – – – –
336 Transportation equipment manufacturing
All establishments 19������������������������� 1 646 25 813 61 833 69 451 138 842Establishments with an average of�1 to 4 employees 5���������������������������������� 16 187 555 200 7415 to 9 employees 2���������������������������������� a D D D D10 to 19 employees 2�������������������������������� b D D D D20 to 49 employees 4�������������������������������� 157 2 417 4 839 5 522 11 50950 to 99 employees 1�������������������������������� b D D D D100 to 249 employees 3����������������������������� 487 9 164 26 611 26 032 56 988250 to 499 employees 2����������������������������� f D D D D500 employees or more –���������������������������� – – – – –
Corporations
All establishments 18������������������������� g D D D DEstablishments with an average of�1 to 4 employees 4���������������������������������� a D D D D5 to 9 employees 2���������������������������������� a D D D D10 to 19 employees 2�������������������������������� b D D D D20 to 49 employees 4�������������������������������� 157 2 417 4 839 5 522 11 50950 to 99 employees 1�������������������������������� b D D D D100 to 249 employees 3����������������������������� 487 9 164 26 611 26 032 56 988250 to 499 employees 2����������������������������� f D D D D500 employees or more –���������������������������� – – – – –
Individual proprietors
All establishments 1������������������������� a D D D DEstablishments with an average of�1 to 4 employees 1���������������������������������� a D D D D5 to 9 employees –���������������������������������� – – – – –10 to 19 employees –�������������������������������� – – – – –20 to 49 employees –�������������������������������� – – – – –50 to 99 employees –�������������������������������� – – – – –100 to 249 employees –����������������������������� – – – – –250 to 499 employees –����������������������������� – – – – –500 employees or more –���������������������������� – – – – –
See footnotes at end of table.
22 Puerto Rico–Manufacturing 2002 Economic Census of Island AreasU.S. Census Bureau, 2002 Economic Census

Table 3. Selected Statistics by Industry, Employment Size, and Legal Form of Organization forPuerto Rico: 2002�Con.
[Includes only establishments of firms with payroll. For meaning of abbreviations and symbols, see introductory text. For explanation of terms, see Appendix A. Data based on the 2002 EconomicCensus. For information on confidentiality protection, sampling error, nonsampling error, and definitions, see note at the end of the table]
2002NAICScode
Industry, employment size, and legal form oforganization
All employees1
Estab�lishments(number)
Total(number)
Payroll($1,000)
Valueadded by
manufacture($1,000)
Cost ofmaterials($1,000)
Value ofshipments
($1,000)
31�33 Manufacturing�Con.
336 Transportation equipment manufacturing�Con.
Partnerships
All establishments –������������������������� – – – – –Establishments with an average of�1 to 4 employees –���������������������������������� – – – – –5 to 9 employees –���������������������������������� – – – – –10 to 19 employees –�������������������������������� – – – – –20 to 49 employees –�������������������������������� – – – – –50 to 99 employees –�������������������������������� – – – – –100 to 249 employees –����������������������������� – – – – –250 to 499 employees –����������������������������� – – – – –500 employees or more –���������������������������� – – – – –
Other types of legal form of organization
All establishments –������������������������� – – – – –Establishments with an average of�1 to 4 employees –���������������������������������� – – – – –5 to 9 employees –���������������������������������� – – – – –10 to 19 employees –�������������������������������� – – – – –20 to 49 employees –�������������������������������� – – – – –50 to 99 employees –�������������������������������� – – – – –100 to 249 employees –����������������������������� – – – – –250 to 499 employees –����������������������������� – – – – –500 employees or more –���������������������������� – – – – –
337 Furniture and related product manufacturing
All establishments 183������������������������� 2 784 28 635 70 335 64 968 131 619Establishments with an average of�1 to 4 employees 92���������������������������������� c D D D D5 to 9 employees 29���������������������������������� 190 1 822 3 088 4 656 7 73610 to 19 employees 28�������������������������������� 387 3 422 8 925 9 263 15 75120 to 49 employees 22�������������������������������� 643 8 727 25 121 16 143 40 86550 to 99 employees 9�������������������������������� 634 6 722 23 362 22 343 45 089100 to 249 employees 2����������������������������� c D D D D250 to 499 employees 1����������������������������� e D D D D500 employees or more –���������������������������� – – – – –
Corporations
All establishments 92������������������������� 2 300 26 290 61 971 58 028 119 186Establishments with an average of�1 to 4 employees 20���������������������������������� b D D D D5 to 9 employees 20���������������������������������� 132 1 521 2 264 3 981 6 21410 to 19 employees 21�������������������������������� 289 2 840 5 013 7 719 13 41720 to 49 employees 20�������������������������������� f D D D D50 to 99 employees 9�������������������������������� 634 6 722 23 362 22 343 45 089100 to 249 employees 1����������������������������� c D D D D250 to 499 employees 1����������������������������� e D D D D500 employees or more –���������������������������� – – – – –
Individual proprietors
All establishments 87������������������������� 459 2 197 8 228 6 624 11 981Establishments with an average of�1 to 4 employees 69���������������������������������� 147 1 004 2 694 3 943 6 9105 to 9 employees 9���������������������������������� 58 301 824 675 1 52210 to 19 employees 6�������������������������������� b D D D D20 to 49 employees 2�������������������������������� b D D D D50 to 99 employees –�������������������������������� – – – – –100 to 249 employees 1����������������������������� c D D D D250 to 499 employees –����������������������������� – – – – –500 employees or more –���������������������������� – – – – –
Partnerships
All establishments 4������������������������� 25 148 136 316 452Establishments with an average of�1 to 4 employees 3���������������������������������� a D D D D5 to 9 employees –���������������������������������� – – – – –10 to 19 employees 1�������������������������������� a D D D D20 to 49 employees –�������������������������������� – – – – –50 to 99 employees –�������������������������������� – – – – –100 to 249 employees –����������������������������� – – – – –250 to 499 employees –����������������������������� – – – – –500 employees or more –���������������������������� – – – – –
Other types of legal form of organization
All establishments –������������������������� – – – – –Establishments with an average of�1 to 4 employees –���������������������������������� – – – – –5 to 9 employees –���������������������������������� – – – – –10 to 19 employees –�������������������������������� – – – – –20 to 49 employees –�������������������������������� – – – – –50 to 99 employees –�������������������������������� – – – – –100 to 249 employees –����������������������������� – – – – –250 to 499 employees –����������������������������� – – – – –500 employees or more –���������������������������� – – – – –
See footnotes at end of table.
2002 Economic Census of Island Areas Puerto Rico–Manufacturing 23U.S. Census Bureau, 2002 Economic Census
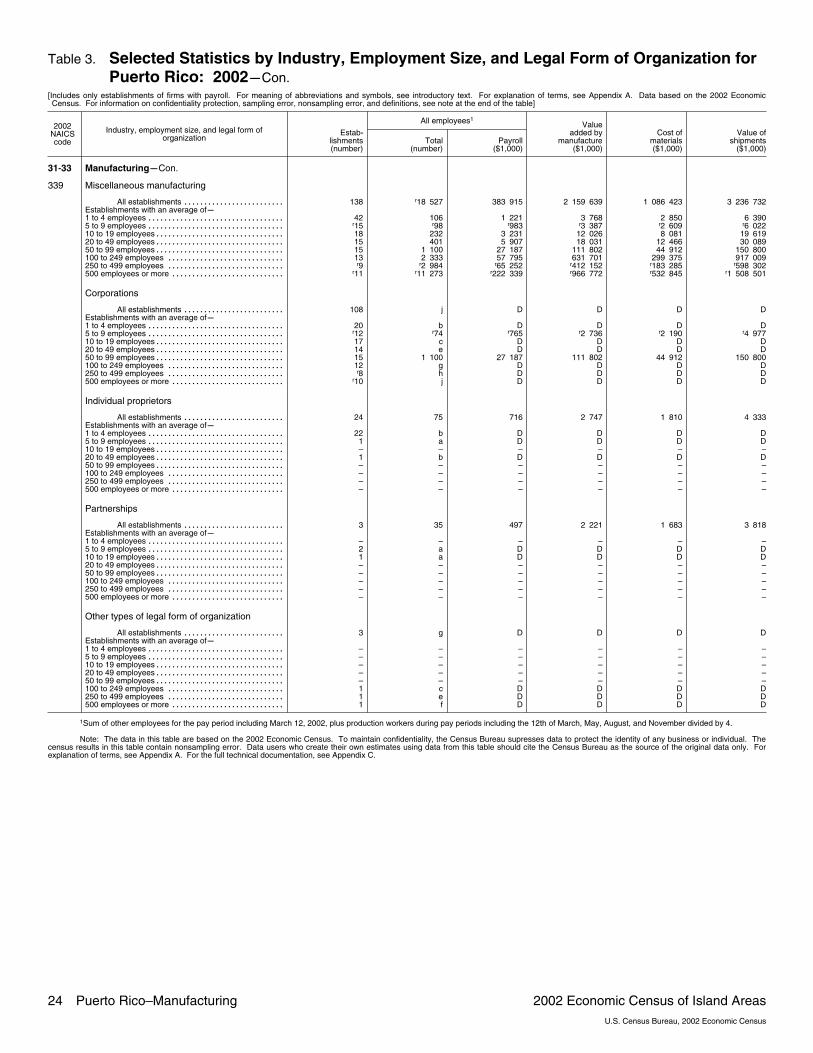
Table 3. Selected Statistics by Industry, Employment Size, and Legal Form of Organization forPuerto Rico: 2002�Con.
[Includes only establishments of firms with payroll. For meaning of abbreviations and symbols, see introductory text. For explanation of terms, see Appendix A. Data based on the 2002 EconomicCensus. For information on confidentiality protection, sampling error, nonsampling error, and definitions, see note at the end of the table]
2002NAICScode
Industry, employment size, and legal form oforganization
All employees1
Estab�lishments(number)
Total(number)
Payroll($1,000)
Valueadded by
manufacture($1,000)
Cost ofmaterials($1,000)
Value ofshipments
($1,000)
31�33 Manufacturing�Con.
339 Miscellaneous manufacturing
All establishments 138�������������������������r18 527 383 915 2 159 639 1 086 423 3 236 732
Establishments with an average of�1 to 4 employees 42���������������������������������� 106 1 221 3 768 2 850 6 3905 to 9 employees r15����������������������������������
r98 r983 r3 387 r2 609 r6 02210 to 19 employees 18�������������������������������� 232 3 231 12 026 8 081 19 61920 to 49 employees 15�������������������������������� 401 5 907 18 031 12 466 30 08950 to 99 employees 15�������������������������������� 1 100 27 187 111 802 44 912 150 800100 to 249 employees 13����������������������������� 2 333 57 795 631 701 299 375 917 009250 to 499 employees r9�����������������������������
r2 984 r65 252 r412 152 r183 285 r598 302500 employees or more r11����������������������������
r11 273 r222 339 r966 772 r532 845 r1 508 501
Corporations
All establishments 108������������������������� j D D D DEstablishments with an average of�1 to 4 employees 20���������������������������������� b D D D D5 to 9 employees r12����������������������������������
r74 r765 r2 736 r2 190 r4 97710 to 19 employees 17�������������������������������� c D D D D20 to 49 employees 14�������������������������������� e D D D D50 to 99 employees 15�������������������������������� 1 100 27 187 111 802 44 912 150 800100 to 249 employees 12����������������������������� g D D D D250 to 499 employees r8����������������������������� h D D D D500 employees or more r10���������������������������� j D D D D
Individual proprietors
All establishments 24������������������������� 75 716 2 747 1 810 4 333Establishments with an average of�1 to 4 employees 22���������������������������������� b D D D D5 to 9 employees 1���������������������������������� a D D D D10 to 19 employees –�������������������������������� – – – – –20 to 49 employees 1�������������������������������� b D D D D50 to 99 employees –�������������������������������� – – – – –100 to 249 employees –����������������������������� – – – – –250 to 499 employees –����������������������������� – – – – –500 employees or more –���������������������������� – – – – –
Partnerships
All establishments 3������������������������� 35 497 2 221 1 683 3 818Establishments with an average of�1 to 4 employees –���������������������������������� – – – – –5 to 9 employees 2���������������������������������� a D D D D10 to 19 employees 1�������������������������������� a D D D D20 to 49 employees –�������������������������������� – – – – –50 to 99 employees –�������������������������������� – – – – –100 to 249 employees –����������������������������� – – – – –250 to 499 employees –����������������������������� – – – – –500 employees or more –���������������������������� – – – – –
Other types of legal form of organization
All establishments 3������������������������� g D D D DEstablishments with an average of�1 to 4 employees –���������������������������������� – – – – –5 to 9 employees –���������������������������������� – – – – –10 to 19 employees –�������������������������������� – – – – –20 to 49 employees –�������������������������������� – – – – –50 to 99 employees –�������������������������������� – – – – –100 to 249 employees 1����������������������������� c D D D D250 to 499 employees 1����������������������������� e D D D D500 employees or more 1���������������������������� f D D D D
1Sum of other employees for the pay period including March 12, 2002, plus production workers during pay periods including the 12th of March, May, August, and November divided by 4.
Note: The data in this table are based on the 2002 Economic Census. To maintain confidentiality, the Census Bureau supresses data to protect the identity of any business or individual. Thecensus results in this table contain nonsampling error. Data users who create their own estimates using data from this table should cite the Census Bureau as the source of the original data only. Forexplanation of terms, see Appendix A. For the full technical documentation, see Appendix C.
24 Puerto Rico–Manufacturing 2002 Economic Census of Island AreasU.S. Census Bureau, 2002 Economic Census
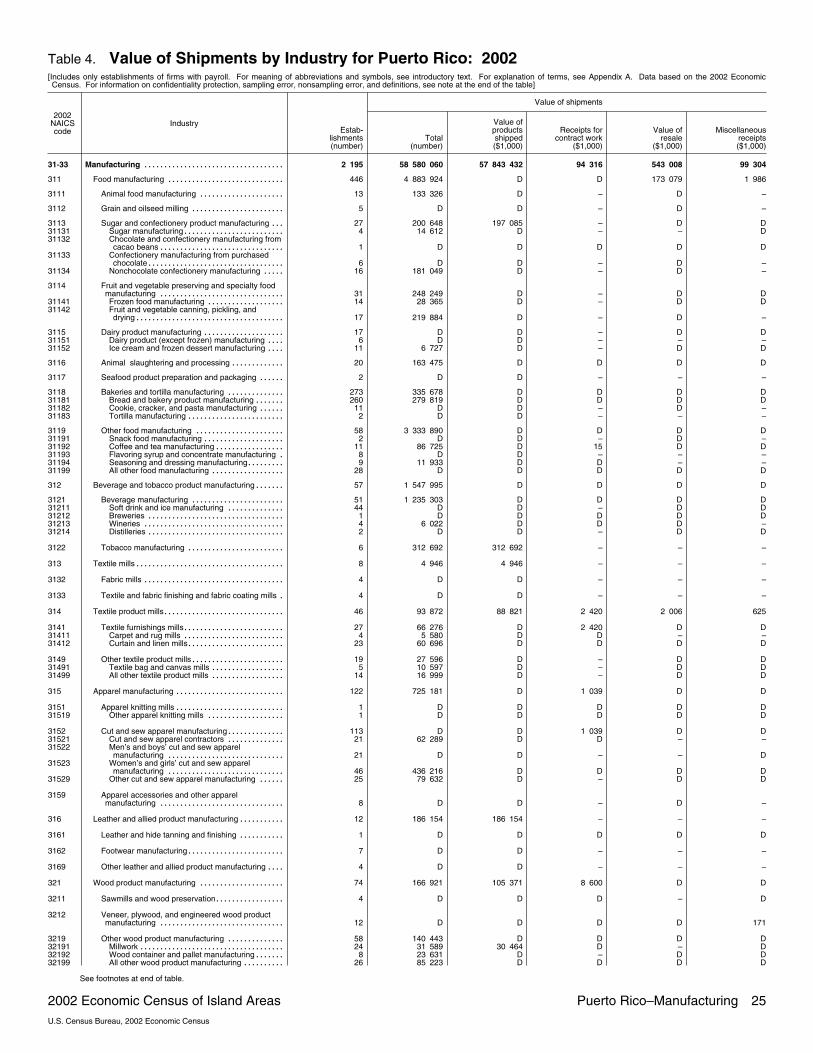
Table 4. Value of Shipments by Industry for Puerto Rico: 2002[Includes only establishments of firms with payroll. For meaning of abbreviations and symbols, see introductory text. For explanation of terms, see Appendix A. Data based on the 2002 EconomicCensus. For information on confidentiality protection, sampling error, nonsampling error, and definitions, see note at the end of the table]
2002NAICScode
Industry
Value of shipments
Estab�lishments(number)
Total(number)
Value ofproductsshipped($1,000)
Receipts forcontract work
($1,000)
Value ofresale
($1,000)
Miscellaneousreceipts($1,000)
31�33 Manufacturing 2 195����������������������������������� 58 580 060 57 843 432 94 316 543 008 99 304
311 Food manufacturing 446����������������������������� 4 883 924 D D 173 079 1 986
3111 Animal food manufacturing 13��������������������� 133 326 D – D –
3112 Grain and oilseed milling 5����������������������� D D – D –
3113 Sugar and confectionery product manufacturing 27��� 200 648 197 085 – D D31131 Sugar manufacturing 4������������������������� 14 612 D – – D31132 Chocolate and confectionery manufacturing from
cacao beans 1������������������������������� D D D D D31133 Confectionery manufacturing from purchased
chocolate 6���������������������������������� D D – D –31134 Nonchocolate confectionery manufacturing 16����� 181 049 D – D –
3114 Fruit and vegetable preserving and specialty foodmanufacturing 31������������������������������� 248 249 D – D D
31141 Frozen food manufacturing 14������������������� 28 365 D – D D31142 Fruit and vegetable canning, pickling, and
drying 17������������������������������������� 219 884 D – D –
3115 Dairy product manufacturing 17�������������������� D D – D D31151 Dairy product (except frozen) manufacturing 6���� D D – – –31152 Ice cream and frozen dessert manufacturing 11���� 6 727 D – D D
3116 Animal slaughtering and processing 20������������� 163 475 D D D D
3117 Seafood product preparation and packaging 2������ D D – – –
3118 Bakeries and tortilla manufacturing 273�������������� 335 678 D D D D31181 Bread and bakery product manufacturing 260������� 279 819 D D D D31182 Cookie, cracker, and pasta manufacturing 11������ D D – D –31183 Tortilla manufacturing 2������������������������ D D – – –
3119 Other food manufacturing 58���������������������� 3 333 890 D D D D31191 Snack food manufacturing 2�������������������� D D – D –31192 Coffee and tea manufacturing 11����������������� 86 725 D 15 D D31193 Flavoring syrup and concentrate manufacturing 8� D D – – –31194 Seasoning and dressing manufacturing 9��������� 11 933 D D – –31199 All other food manufacturing 28������������������ D D D D D
312 Beverage and tobacco product manufacturing 57������� 1 547 995 D D D D
3121 Beverage manufacturing 51����������������������� 1 235 303 D D D D31211 Soft drink and ice manufacturing 44�������������� D D – D D31212 Breweries 1���������������������������������� D D D D D31213 Wineries 4����������������������������������� 6 022 D D D –31214 Distilleries 2���������������������������������� D D – D D
3122 Tobacco manufacturing 6������������������������ 312 692 312 692 – – –
313 Textile mills 8������������������������������������� 4 946 4 946 – – –
3132 Fabric mills 4����������������������������������� D D – – –
3133 Textile and fabric finishing and fabric coating mills 4� D D – – –
314 Textile product mills 46������������������������������ 93 872 88 821 2 420 2 006 625
3141 Textile furnishings mills 27������������������������� 66 276 D 2 420 D D31411 Carpet and rug mills 4������������������������� 5 580 D D – –31412 Curtain and linen mills 23������������������������ 60 696 D D D D
3149 Other textile product mills 19����������������������� 27 596 D – D D31491 Textile bag and canvas mills 5������������������ 10 597 D – D D31499 All other textile product mills 14������������������ 16 999 D – D D
315 Apparel manufacturing 122��������������������������� 725 181 D 1 039 D D
3151 Apparel knitting mills 1��������������������������� D D D D D31519 Other apparel knitting mills 1������������������� D D D D D
3152 Cut and sew apparel manufacturing 113�������������� D D 1 039 D D31521 Cut and sew apparel contractors 21�������������� 62 289 D D – –31522 Men’s and boys’ cut and sew apparel
manufacturing 21����������������������������� D D – – D31523 Women’s and girls’ cut and sew apparel
manufacturing 46����������������������������� 436 216 D D D D31529 Other cut and sew apparel manufacturing 25������ 79 632 D – D D
3159 Apparel accessories and other apparelmanufacturing 8������������������������������� D D – D –
316 Leather and allied product manufacturing 12����������� 186 154 186 154 – – –
3161 Leather and hide tanning and finishing 1����������� D D D D D
3162 Footwear manufacturing 7������������������������ D D – – –
3169 Other leather and allied product manufacturing 4���� D D – – –
321 Wood product manufacturing 74��������������������� 166 921 105 371 8 600 D D
3211 Sawmills and wood preservation 4����������������� D D D – D
3212 Veneer, plywood, and engineered wood productmanufacturing 12������������������������������� D D D D 171
3219 Other wood product manufacturing 58�������������� 140 443 D D D D32191 Millwork 24������������������������������������ 31 589 30 464 D – D32192 Wood container and pallet manufacturing 8������� 23 631 D – D D32199 All other wood product manufacturing 26���������� 85 223 D D D D
See footnotes at end of table.
2002 Economic Census of Island Areas Puerto Rico–Manufacturing 25U.S. Census Bureau, 2002 Economic Census

Table 4. Value of Shipments by Industry for Puerto Rico: 2002�Con.[Includes only establishments of firms with payroll. For meaning of abbreviations and symbols, see introductory text. For explanation of terms, see Appendix A. Data based on the 2002 EconomicCensus. For information on confidentiality protection, sampling error, nonsampling error, and definitions, see note at the end of the table]
2002NAICScode
Industry
Value of shipments
Estab�lishments(number)
Total(number)
Value ofproductsshipped($1,000)
Receipts forcontract work
($1,000)
Value ofresale
($1,000)
Miscellaneousreceipts($1,000)
31�33 Manufacturing�Con.322 Paper manufacturing 44����������������������������� 284 433 264 173 334 D D
3221 Pulp, paper, and paperboard mills 4��������������� 41 342 D D D –
3222 Converted paper product manufacturing 40���������� 243 091 D D D D32221 Paperboard container manufacturing 22����������� 174 022 163 430 231 D D32222 Paper bag and coated and treated paper
manufacturing 7����������������������������� 43 868 D D – D32223 Stationery product manufacturing 9�������������� D 23 682 D – –32229 Other converted paper product manufacturing 2��� D D D – –
323 Printing and related support activities 181�������������� 285 393 276 936 1 378 4 936 2 143
3231 Printing and related support activities 181������������ 285 393 276 936 1 378 4 936 2 14332311 Printing 164������������������������������������ 247 620 241 147 D D D32312 Support activities for printing 17������������������ 37 773 35 789 D D D
324 Petroleum and coal products manufacturing 32�������� 1 525 356 1 491 587 – D D
3241 Petroleum and coal products manufacturing 32������ 1 525 356 1 491 587 – D D32411 Petroleum refineries 9������������������������� 798 245 D – D –32412 Asphalt paving, roofing, and saturated materials
manufacturing 19����������������������������� D D – D D32419 Other petroleum and coal products
manufacturing 4����������������������������� D D – – D
325 Chemical manufacturing 154�������������������������� 39 808 729 39 736 640 24 291 42 716 5 082
3251 Basic chemical manufacturing 14������������������� 49 419 47 841 D D –32511 Petrochemical manufacturing 2����������������� D D – – –32512 Industrial gas manufacturing 8������������������ 39 072 39 072 – – –32513 Synthetic dye and pigment manufacturing 1������ D D D D D32518 Other basic inorganic chemical manufacturing 2��� D D – D –32519 Other basic organic chemical manufacturing 1���� D D D D D
3252 Resin, synthetic rubber, and artificial syntheticfibers and filaments manufacturing 4�������������� D D – – D
3253 Pesticide, fertilizer, and other agricultural chemicalmanufacturing 5������������������������������� D D – D D
3254 Pharmaceutical and medicine manufacturing 74������ 38 446 602 D D D D
3255 Paint, coating, and adhesive manufacturing 20������� 214 620 D D D D32551 Paint and coating manufacturing 13�������������� 135 113 D D 5 467 –32552 Adhesive manufacturing 7���������������������� 79 507 D D D D
3256 Soap, cleaning compound, and toilet preparationmanufacturing 32������������������������������� 886 493 D D D D
32561 Soap and cleaning compound manufacturing 22���� 120 140 D D D D32562 Toilet preparation manufacturing 10�������������� 766 353 D – D –
3259 Other chemical product and preparationmanufacturing 5������������������������������� 37 547 37 547 – – –
326 Plastics and rubber products manufacturing 67��������� 499 007 D D 12 787 4 984
3261 Plastics product manufacturing 57������������������ 485 671 466 569 D D D
3262 Rubber product manufacturing 10������������������ 13 336 D – D D
327 Nonmetallic mineral product manufacturing 157��������� 529 642 D D 13 775 427
3271 Clay product and refractory manufacturing 3�������� D D – – –
3272 Glass and glass product manufacturing 4���������� 41 364 D – D D
3273 Cement and concrete product manufacturing 138������ 468 368 441 280 D D D32731 Cement manufacturing 3����������������������� D D – D –32732 Ready�mix concrete manufacturing 77������������ 268 887 D D – 8432733 Concrete pipe, brick, and block manufacturing 31�� D 38 429 D D D32739 Other concrete product manufacturing 27��������� 86 267 D – D D
3274 Lime and gypsum product manufacturing 1��������� D D D D D
3279 Other nonmetallic mineral product manufacturing 11�� 17 080 D – D –
331 Primary metal manufacturing 34���������������������� 75 152 D D 3 411 82
3311 Iron and steel mills and ferroalloy manufacturing 14��� 34 131 D D D D
3312 Steel product manufacturing from purchased steel 7� 18 796 15 280 D D D
3313 Alumina and aluminum production and processing 10� D D – D D
3314 Nonferrous metal (except aluminum) productionand processing 2������������������������������� D D – – –
3315 Foundries 1������������������������������������ D D D D D
332 Fabricated metal product manufacturing 289������������ 782 960 741 246 17 607 19 491 4 616
3321 Forging and stamping 17�������������������������� 26 288 D D D D
3322 Cutlery and handtool manufacturing 8������������� 31 902 31 902 – – –
3323 Architectural and structural metals manufacturing 165�� 350 791 339 411 3 894 6 443 1 043
3324 Boiler, tank, and shipping container manufacturing 15� 248 025 229 399 D D D33241 Power boiler and heat exchanger manufacturing 1� D D D D D33243 Metal can, box, and other metal container (light
gauge) manufacturing 14����������������������� D D D D D
3326 Spring and wire product manufacturing 3����������� 6 841 6 841 – – –
3327 Machine shops; turned product; and screw, nut,and bolt manufacturing 35������������������������ 24 265 20 356 D D D
33271 Machine shops 11������������������������������ 4 017 D D D –33272 Turned product and screw, nut, and bolt
manufacturing 24����������������������������� 20 248 D D D D
See footnotes at end of table.
26 Puerto Rico–Manufacturing 2002 Economic Census of Island AreasU.S. Census Bureau, 2002 Economic Census

Table 4. Value of Shipments by Industry for Puerto Rico: 2002�Con.[Includes only establishments of firms with payroll. For meaning of abbreviations and symbols, see introductory text. For explanation of terms, see Appendix A. Data based on the 2002 EconomicCensus. For information on confidentiality protection, sampling error, nonsampling error, and definitions, see note at the end of the table]
2002NAICScode
Industry
Value of shipments
Estab�lishments(number)
Total(number)
Value ofproductsshipped($1,000)
Receipts forcontract work
($1,000)
Value ofresale
($1,000)
Miscellaneousreceipts($1,000)
31�33 Manufacturing�Con.332 Fabricated metal product manufacturing�Con.3328 Coating, engraving, heat treating, and allied
activities 15������������������������������������� 23 699 D D D D
3329 Other fabricated metal product manufacturing 31����� 71 149 68 587 D D D
333 Machinery manufacturing 42������������������������� 284 538 280 761 D D D
3331 Agriculture, construction, and mining machinerymanufacturing 1������������������������������� D D D D D
3332 Industrial machinery manufacturing 4�������������� D D – – –
3333 Commercial and service industry machinerymanufacturing 4������������������������������� 4 742 4 742 – – –
3334 Ventilation, heating, air�conditioning, andcommercial refrigeration equipmentmanufacturing 15������������������������������� D D – – D
3335 Metalworking machinery manufacturing 15���������� 51 739 D D D D
3339 Other general purpose machinery manufacturing 3�� D D – D D
334 Computer and electronic product manufacturing 49����� 2 288 076 2 226 173 D D D
3341 Computer and peripheral equipmentmanufacturing 5������������������������������� D D D – –
33411 Computer and peripheral equipmentmanufacturing 5����������������������������� D D D – –
3342 Communications equipment manufacturing 5������� 104 754 D D – –33421 Telephone apparatus manufacturing 1����������� D D D D D33422 Radio and television broadcasting and wireless
communications equipment manufacturing 3����� D D D – –33429 Other communications equipment
manufacturing 1����������������������������� D D D D D
3343 Audio and video equipment manufacturing 1�������� D D D D D
3344 Semiconductor and other electronic componentmanufacturing 24������������������������������� 1 554 464 D D D D
3345 Navigational, measuring, electromedical, andcontrol instruments manufacturing 11�������������� 250 422 D D – D
3346 Manufacturing and reproducing magnetic andoptical media 3�������������������������������� D D – D D
335 Electrical equipment, appliance, and componentmanufacturing 41��������������������������������� 1 100 588 D 534 D D
3351 Electric lighting equipment manufacturing 6��������� D D D D D
3352 Household appliance manufacturing 1������������� D D D D D
3353 Electrical equipment manufacturing 29�������������� 846 763 D D D D
3359 Other electrical equipment and componentmanufacturing 5������������������������������� D D – – D
336 Transportation equipment manufacturing 19����������� 138 842 D – D D
3362 Motor vehicle body and trailer manufacturing 1������ D D D D D
3363 Motor vehicle parts manufacturing 13��������������� 124 116 D – D D
3364 Aerospace product and parts manufacturing 1������ D D D D D
3366 Ship and boat building 4������������������������� D D – – D
337 Furniture and related product manufacturing 183�������� 131 619 124 060 428 5 769 1 362
3371 Household and institutional furniture and kitchencabinet manufacturing 154������������������������ 90 265 83 498 D D D
33711 Wood kitchen cabinet and countertopmanufacturing 75����������������������������� 24 103 23 426 D D D
33712 Household and institutional furnituremanufacturing 79����������������������������� 66 162 60 072 – D D
3372 Office furniture (including fixtures) manufacturing 16�� 20 779 D – D D
3379 Other furniture related product manufacturing 13����� 20 575 D D – –
339 Miscellaneous manufacturing 138��������������������� 3 236 732 3 231 321 D D D
3391 Medical equipment and supplies manufacturing 81��� 2 982 585 2 978 115 D D D33911 Medical equipment and supplies manufacturing 81� 2 982 585 2 978 115 D D D
3399 Other miscellaneous manufacturing 57�������������� 254 147 253 206 D D D33991 Jewelry and silverware manufacturing 15���������� 93 461 D – D –33992 Sporting and athletic goods manufacturing 2������ D D – – –33993 Doll, toy, and game manufacturing 1������������� D D D D D33994 Office supplies (except paper) manufacturing 5��� 58 540 58 540 – – –33995 Sign manufacturing 23�������������������������� D 33 717 D D D33999 All other miscellaneous manufacturing 11��������� 65 695 65 695 – – –
Note: The data in this table are based on the 2002 Economic Census. To maintain confidentiality, the Census Bureau supresses data to protect the identity of any business or individual. Thecensus results in this table contain nonsampling error. Data users who create their own estimates using data from this table should cite the Census Bureau as the source of the original data only. Forexplanation of terms, see Appendix A. For the full technical documentation, see Appendix C.
2002 Economic Census of Island Areas Puerto Rico–Manufacturing 27U.S. Census Bureau, 2002 Economic Census
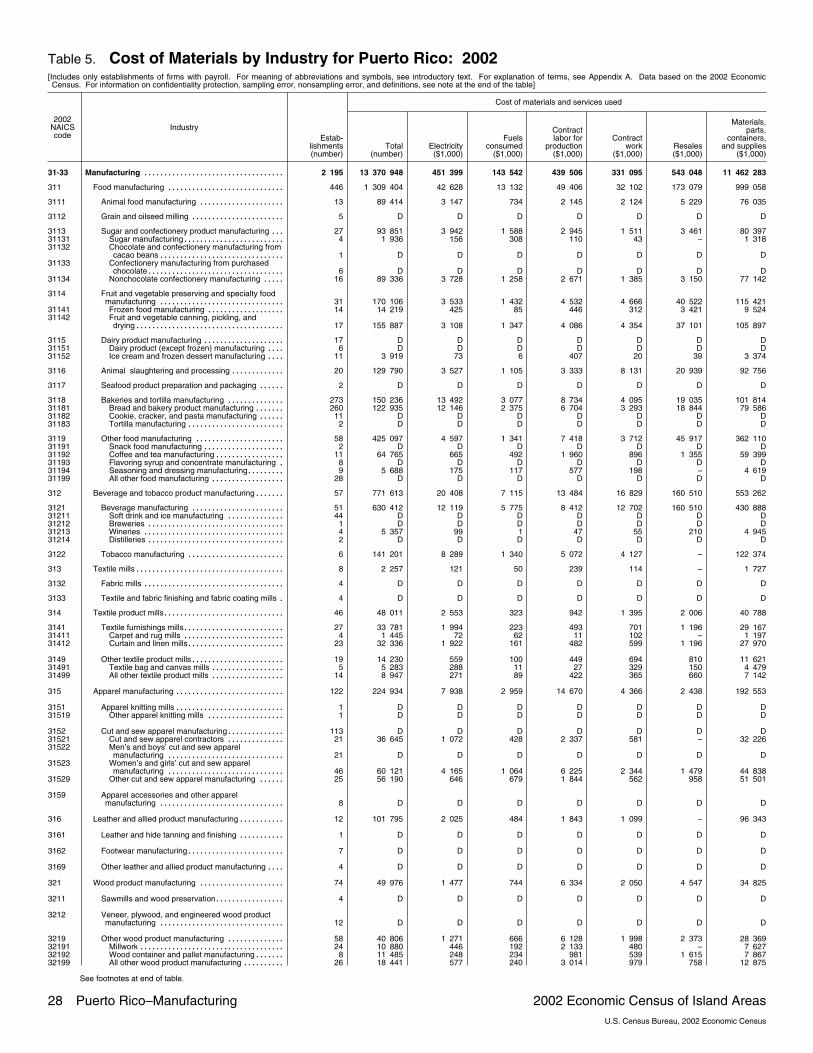
Table 5. Cost of Materials by Industry for Puerto Rico: 2002[Includes only establishments of firms with payroll. For meaning of abbreviations and symbols, see introductory text. For explanation of terms, see Appendix A. Data based on the 2002 EconomicCensus. For information on confidentiality protection, sampling error, nonsampling error, and definitions, see note at the end of the table]
2002NAICScode
Industry
Cost of materials and services used
Estab�lishments(number)
Total(number)
Electricity($1,000)
Fuelsconsumed
($1,000)
Contractlabor for
production($1,000)
Contractwork
($1,000)Resales($1,000)
Materials,parts,
containers,and supplies
($1,000)
31�33 Manufacturing 2 195����������������������������������� 13 370 948 451 399 143 542 439 506 331 095 543 048 11 462 283
311 Food manufacturing 446����������������������������� 1 309 404 42 628 13 132 49 406 32 102 173 079 999 058
3111 Animal food manufacturing 13��������������������� 89 414 3 147 734 2 145 2 124 5 229 76 035
3112 Grain and oilseed milling 5����������������������� D D D D D D D
3113 Sugar and confectionery product manufacturing 27��� 93 851 3 942 1 588 2 945 1 511 3 461 80 39731131 Sugar manufacturing 4������������������������� 1 936 156 308 110 43 – 1 31831132 Chocolate and confectionery manufacturing from
cacao beans 1������������������������������� D D D D D D D31133 Confectionery manufacturing from purchased
chocolate 6���������������������������������� D D D D D D D31134 Nonchocolate confectionery manufacturing 16����� 89 336 3 728 1 258 2 671 1 385 3 150 77 142
3114 Fruit and vegetable preserving and specialty foodmanufacturing 31������������������������������� 170 106 3 533 1 432 4 532 4 666 40 522 115 421
31141 Frozen food manufacturing 14������������������� 14 219 425 85 446 312 3 421 9 52431142 Fruit and vegetable canning, pickling, and
drying 17������������������������������������� 155 887 3 108 1 347 4 086 4 354 37 101 105 897
3115 Dairy product manufacturing 17�������������������� D D D D D D D31151 Dairy product (except frozen) manufacturing 6���� D D D D D D D31152 Ice cream and frozen dessert manufacturing 11���� 3 919 73 6 407 20 39 3 374
3116 Animal slaughtering and processing 20������������� 129 790 3 527 1 105 3 333 8 131 20 939 92 756
3117 Seafood product preparation and packaging 2������ D D D D D D D
3118 Bakeries and tortilla manufacturing 273�������������� 150 236 13 492 3 077 8 734 4 095 19 035 101 81431181 Bread and bakery product manufacturing 260������� 122 935 12 146 2 375 6 704 3 293 18 844 79 58631182 Cookie, cracker, and pasta manufacturing 11������ D D D D D D D31183 Tortilla manufacturing 2������������������������ D D D D D D D
3119 Other food manufacturing 58���������������������� 425 097 4 597 1 341 7 418 3 712 45 917 362 11031191 Snack food manufacturing 2�������������������� D D D D D D D31192 Coffee and tea manufacturing 11����������������� 64 765 665 492 1 960 896 1 355 59 39931193 Flavoring syrup and concentrate manufacturing 8� D D D D D D D31194 Seasoning and dressing manufacturing 9��������� 5 688 175 117 577 198 – 4 61931199 All other food manufacturing 28������������������ D D D D D D D
312 Beverage and tobacco product manufacturing 57������� 771 613 20 408 7 115 13 484 16 829 160 510 553 262
3121 Beverage manufacturing 51����������������������� 630 412 12 119 5 775 8 412 12 702 160 510 430 88831211 Soft drink and ice manufacturing 44�������������� D D D D D D D31212 Breweries 1���������������������������������� D D D D D D D31213 Wineries 4����������������������������������� 5 357 99 1 47 55 210 4 94531214 Distilleries 2���������������������������������� D D D D D D D
3122 Tobacco manufacturing 6������������������������ 141 201 8 289 1 340 5 072 4 127 – 122 374
313 Textile mills 8������������������������������������� 2 257 121 50 239 114 – 1 727
3132 Fabric mills 4����������������������������������� D D D D D D D
3133 Textile and fabric finishing and fabric coating mills 4� D D D D D D D
314 Textile product mills 46������������������������������ 48 011 2 553 323 942 1 395 2 006 40 788
3141 Textile furnishings mills 27������������������������� 33 781 1 994 223 493 701 1 196 29 16731411 Carpet and rug mills 4������������������������� 1 445 72 62 11 102 – 1 19731412 Curtain and linen mills 23������������������������ 32 336 1 922 161 482 599 1 196 27 970
3149 Other textile product mills 19����������������������� 14 230 559 100 449 694 810 11 62131491 Textile bag and canvas mills 5������������������ 5 283 288 11 27 329 150 4 47931499 All other textile product mills 14������������������ 8 947 271 89 422 365 660 7 142
315 Apparel manufacturing 122��������������������������� 224 934 7 938 2 959 14 670 4 366 2 438 192 553
3151 Apparel knitting mills 1��������������������������� D D D D D D D31519 Other apparel knitting mills 1������������������� D D D D D D D
3152 Cut and sew apparel manufacturing 113�������������� D D D D D D D31521 Cut and sew apparel contractors 21�������������� 36 645 1 072 428 2 337 581 – 32 22631522 Men’s and boys’ cut and sew apparel
manufacturing 21����������������������������� D D D D D D D31523 Women’s and girls’ cut and sew apparel
manufacturing 46����������������������������� 60 121 4 165 1 064 6 225 2 344 1 479 44 83831529 Other cut and sew apparel manufacturing 25������ 56 190 646 679 1 844 562 958 51 501
3159 Apparel accessories and other apparelmanufacturing 8������������������������������� D D D D D D D
316 Leather and allied product manufacturing 12����������� 101 795 2 025 484 1 843 1 099 – 96 343
3161 Leather and hide tanning and finishing 1����������� D D D D D D D
3162 Footwear manufacturing 7������������������������ D D D D D D D
3169 Other leather and allied product manufacturing 4���� D D D D D D D
321 Wood product manufacturing 74��������������������� 49 976 1 477 744 6 334 2 050 4 547 34 825
3211 Sawmills and wood preservation 4����������������� D D D D D D D
3212 Veneer, plywood, and engineered wood productmanufacturing 12������������������������������� D D D D D D D
3219 Other wood product manufacturing 58�������������� 40 806 1 271 666 6 128 1 998 2 373 28 36932191 Millwork 24������������������������������������ 10 880 446 192 2 133 480 – 7 62732192 Wood container and pallet manufacturing 8������� 11 485 248 234 981 539 1 615 7 86732199 All other wood product manufacturing 26���������� 18 441 577 240 3 014 979 758 12 875
See footnotes at end of table.
28 Puerto Rico–Manufacturing 2002 Economic Census of Island AreasU.S. Census Bureau, 2002 Economic Census

Table 5. Cost of Materials by Industry for Puerto Rico: 2002�Con.[Includes only establishments of firms with payroll. For meaning of abbreviations and symbols, see introductory text. For explanation of terms, see Appendix A. Data based on the 2002 EconomicCensus. For information on confidentiality protection, sampling error, nonsampling error, and definitions, see note at the end of the table]
2002NAICScode
Industry
Cost of materials and services used
Estab�lishments(number)
Total(number)
Electricity($1,000)
Fuelsconsumed
($1,000)
Contractlabor for
production($1,000)
Contractwork
($1,000)Resales($1,000)
Materials,parts,
containers,and supplies
($1,000)
31�33 Manufacturing�Con.322 Paper manufacturing 44����������������������������� 146 785 3 639 1 575 2 689 1 671 16 915 120 297
3221 Pulp, paper, and paperboard mills 4��������������� 22 211 417 395 382 726 7 775 12 515
3222 Converted paper product manufacturing 40���������� 124 574 3 222 1 180 2 307 945 9 140 107 78232221 Paperboard container manufacturing 22����������� 89 686 2 479 607 1 695 377 9 140 75 39032222 Paper bag and coated and treated paper
manufacturing 7����������������������������� 25 817 403 315 299 160 – 24 64032223 Stationery product manufacturing 9�������������� D D D D D D D32229 Other converted paper product manufacturing 2��� D D D D D D D
323 Printing and related support activities 181�������������� 118 320 6 077 1 523 4 950 2 502 4 936 98 317
3231 Printing and related support activities 181������������ 118 320 6 077 1 523 4 950 2 502 4 936 98 31732311 Printing 164������������������������������������ 102 281 5 408 1 485 3 992 2 473 3 095 85 81432312 Support activities for printing 17������������������ 16 039 669 38 958 29 1 841 12 503
324 Petroleum and coal products manufacturing 32�������� 711 523 16 265 31 499 25 735 57 698 18 157 562 170
3241 Petroleum and coal products manufacturing 32������ 711 523 16 265 31 499 25 735 57 698 18 157 562 17032411 Petroleum refineries 9������������������������� 175 913 10 157 9 212 11 625 24 353 16 312 104 25732412 Asphalt paving, roofing, and saturated materials
manufacturing 19����������������������������� D D D D D D D32419 Other petroleum and coal products
manufacturing 4����������������������������� D D D D D D D
325 Chemical manufacturing 154�������������������������� 6 126 966 200 605 44 746 162 189 143 022 42 716 5 533 686
3251 Basic chemical manufacturing 14������������������� 15 361 5 303 661 1 024 445 1 521 6 40632511 Petrochemical manufacturing 2����������������� D D D D D D D32512 Industrial gas manufacturing 8������������������ 8 610 5 047 117 679 377 – 2 38932513 Synthetic dye and pigment manufacturing 1������ D D D D D D D32518 Other basic inorganic chemical manufacturing 2��� D D D D D D D32519 Other basic organic chemical manufacturing 1���� D D D D D D D
3252 Resin, synthetic rubber, and artificial syntheticfibers and filaments manufacturing 4�������������� D D D D D D D
3253 Pesticide, fertilizer, and other agricultural chemicalmanufacturing 5������������������������������� D D D D D D D
3254 Pharmaceutical and medicine manufacturing 74������ 5 529 868 180 204 39 001 146 798 131 726 34 137 4 998 002
3255 Paint, coating, and adhesive manufacturing 20������� 122 515 2 243 346 3 533 2 304 5 727 108 36232551 Paint and coating manufacturing 13�������������� 69 296 1 111 154 3 309 2 091 5 467 57 16432552 Adhesive manufacturing 7���������������������� 53 219 1 132 192 224 213 260 51 198
3256 Soap, cleaning compound, and toilet preparationmanufacturing 32������������������������������� 321 062 10 690 4 492 8 879 4 665 1 294 291 043
32561 Soap and cleaning compound manufacturing 22���� 39 427 1 720 381 2 039 888 838 33 56132562 Toilet preparation manufacturing 10�������������� 281 635 8 970 4 111 6 840 3 777 456 257 482
3259 Other chemical product and preparationmanufacturing 5������������������������������� 13 274 276 38 74 40 – 12 845
326 Plastics and rubber products manufacturing 67��������� 242 925 25 313 4 269 8 578 5 469 12 787 186 506
3261 Plastics product manufacturing 57������������������ 233 994 24 960 4 181 8 505 5 422 11 878 179 045
3262 Rubber product manufacturing 10������������������ 8 931 353 88 73 47 909 7 461
327 Nonmetallic mineral product manufacturing 157��������� 256 199 18 716 10 337 13 078 4 435 13 775 195 852
3271 Clay product and refractory manufacturing 3�������� D D D D D D D
3272 Glass and glass product manufacturing 4���������� 19 622 2 749 1 628 1 015 1 199 4 750 8 281
3273 Cement and concrete product manufacturing 138������ 229 206 15 262 8 543 11 046 2 953 8 525 182 87132731 Cement manufacturing 3����������������������� D D D D D D D32732 Ready�mix concrete manufacturing 77������������ 137 143 2 681 2 706 2 943 901 – 127 90832733 Concrete pipe, brick, and block manufacturing 31�� D D D D D D D32739 Other concrete product manufacturing 27��������� 37 434 1 776 955 3 021 826 4 331 26 523
3274 Lime and gypsum product manufacturing 1��������� D D D D D D D
3279 Other nonmetallic mineral product manufacturing 11�� 6 517 598 154 879 243 500 4 143
331 Primary metal manufacturing 34���������������������� 33 637 1 258 340 3 747 1 419 3 451 23 426
3311 Iron and steel mills and ferroalloy manufacturing 14��� 13 787 464 165 973 275 300 11 611
3312 Steel product manufacturing from purchased steel 7� 9 766 368 31 2 153 891 3 018 3 306
3313 Alumina and aluminum production and processing 10� D D D D D D D
3314 Nonferrous metal (except aluminum) productionand processing 2������������������������������� D D D D D D D
3315 Foundries 1������������������������������������ D D D D D D D
332 Fabricated metal product manufacturing 289������������ 356 727 17 343 6 090 25 469 13 066 19 491 275 249
3321 Forging and stamping 17�������������������������� 9 821 294 47 854 358 87 8 181
3322 Cutlery and handtool manufacturing 8������������� 18 254 385 123 807 250 – 16 690
3323 Architectural and structural metals manufacturing 165�� 160 825 5 709 2 174 12 766 6 587 6 443 127 128
3324 Boiler, tank, and shipping container manufacturing 15� 111 854 8 315 2 586 6 772 4 096 7 203 82 88133241 Power boiler and heat exchanger manufacturing 1� D D D D D D D33243 Metal can, box, and other metal container (light
gauge) manufacturing 14����������������������� D D D D D D D
3326 Spring and wire product manufacturing 3����������� 3 068 152 68 234 133 – 2 481
3327 Machine shops; turned product; and screw, nut,and bolt manufacturing 35������������������������ 10 973 337 91 1 993 206 2 947 5 398
33271 Machine shops 11������������������������������ 2 321 49 24 164 94 637 1 35333272 Turned product and screw, nut, and bolt
manufacturing 24����������������������������� 8 652 288 67 1 829 112 2 310 4 045
See footnotes at end of table.
2002 Economic Census of Island Areas Puerto Rico–Manufacturing 29U.S. Census Bureau, 2002 Economic Census
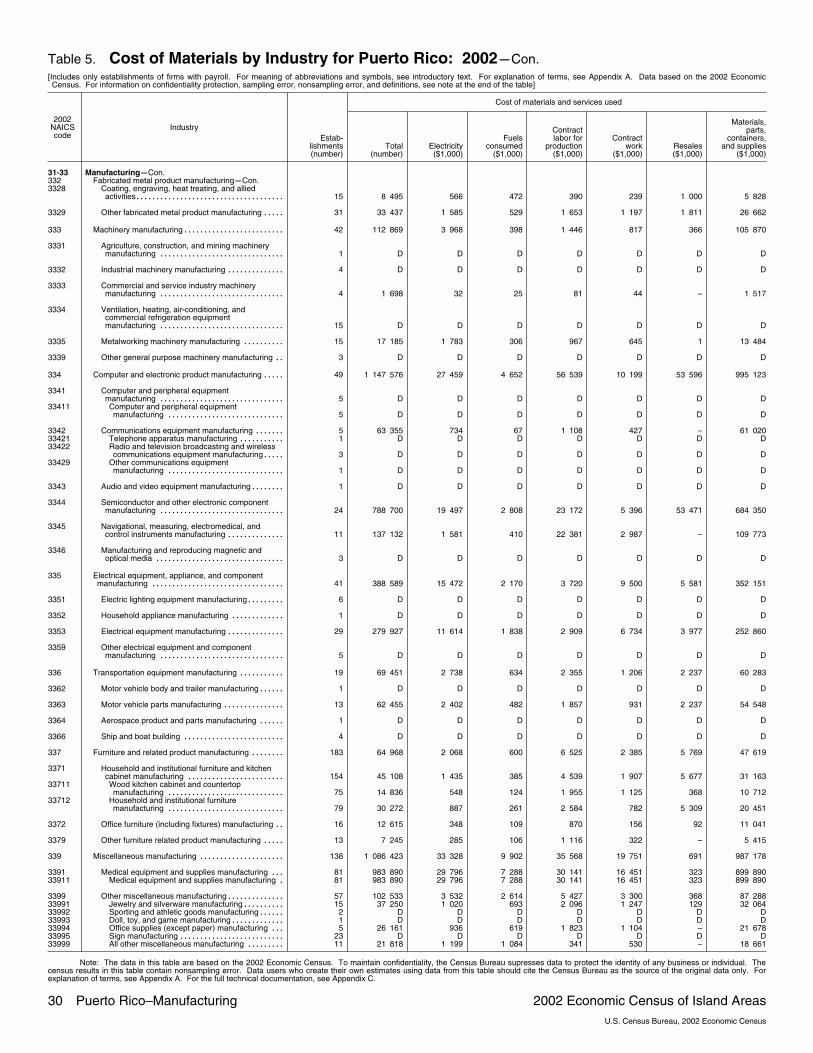
Table 5. Cost of Materials by Industry for Puerto Rico: 2002�Con.[Includes only establishments of firms with payroll. For meaning of abbreviations and symbols, see introductory text. For explanation of terms, see Appendix A. Data based on the 2002 EconomicCensus. For information on confidentiality protection, sampling error, nonsampling error, and definitions, see note at the end of the table]
2002NAICScode
Industry
Cost of materials and services used
Estab�lishments(number)
Total(number)
Electricity($1,000)
Fuelsconsumed
($1,000)
Contractlabor for
production($1,000)
Contractwork
($1,000)Resales($1,000)
Materials,parts,
containers,and supplies
($1,000)
31�33 Manufacturing�Con.332 Fabricated metal product manufacturing�Con.3328 Coating, engraving, heat treating, and allied
activities 15������������������������������������� 8 495 566 472 390 239 1 000 5 828
3329 Other fabricated metal product manufacturing 31����� 33 437 1 585 529 1 653 1 197 1 811 26 662
333 Machinery manufacturing 42������������������������� 112 869 3 968 398 1 446 817 366 105 870
3331 Agriculture, construction, and mining machinerymanufacturing 1������������������������������� D D D D D D D
3332 Industrial machinery manufacturing 4�������������� D D D D D D D
3333 Commercial and service industry machinerymanufacturing 4������������������������������� 1 698 32 25 81 44 – 1 517
3334 Ventilation, heating, air�conditioning, andcommercial refrigeration equipmentmanufacturing 15������������������������������� D D D D D D D
3335 Metalworking machinery manufacturing 15���������� 17 185 1 783 306 967 645 1 13 484
3339 Other general purpose machinery manufacturing 3�� D D D D D D D
334 Computer and electronic product manufacturing 49����� 1 147 576 27 459 4 652 56 539 10 199 53 596 995 123
3341 Computer and peripheral equipmentmanufacturing 5������������������������������� D D D D D D D
33411 Computer and peripheral equipmentmanufacturing 5����������������������������� D D D D D D D
3342 Communications equipment manufacturing 5������� 63 355 734 67 1 108 427 – 61 02033421 Telephone apparatus manufacturing 1����������� D D D D D D D33422 Radio and television broadcasting and wireless
communications equipment manufacturing 3����� D D D D D D D33429 Other communications equipment
manufacturing 1����������������������������� D D D D D D D
3343 Audio and video equipment manufacturing 1�������� D D D D D D D
3344 Semiconductor and other electronic componentmanufacturing 24������������������������������� 788 700 19 497 2 808 23 172 5 396 53 471 684 350
3345 Navigational, measuring, electromedical, andcontrol instruments manufacturing 11�������������� 137 132 1 581 410 22 381 2 987 – 109 773
3346 Manufacturing and reproducing magnetic andoptical media 3�������������������������������� D D D D D D D
335 Electrical equipment, appliance, and componentmanufacturing 41��������������������������������� 388 589 15 472 2 170 3 720 9 500 5 581 352 151
3351 Electric lighting equipment manufacturing 6��������� D D D D D D D
3352 Household appliance manufacturing 1������������� D D D D D D D
3353 Electrical equipment manufacturing 29�������������� 279 927 11 614 1 838 2 909 6 734 3 977 252 860
3359 Other electrical equipment and componentmanufacturing 5������������������������������� D D D D D D D
336 Transportation equipment manufacturing 19����������� 69 451 2 738 634 2 355 1 206 2 237 60 283
3362 Motor vehicle body and trailer manufacturing 1������ D D D D D D D
3363 Motor vehicle parts manufacturing 13��������������� 62 455 2 402 482 1 857 931 2 237 54 548
3364 Aerospace product and parts manufacturing 1������ D D D D D D D
3366 Ship and boat building 4������������������������� D D D D D D D
337 Furniture and related product manufacturing 183�������� 64 968 2 068 600 6 525 2 385 5 769 47 619
3371 Household and institutional furniture and kitchencabinet manufacturing 154������������������������ 45 108 1 435 385 4 539 1 907 5 677 31 163
33711 Wood kitchen cabinet and countertopmanufacturing 75����������������������������� 14 836 548 124 1 955 1 125 368 10 712
33712 Household and institutional furnituremanufacturing 79����������������������������� 30 272 887 261 2 584 782 5 309 20 451
3372 Office furniture (including fixtures) manufacturing 16�� 12 615 348 109 870 156 92 11 041
3379 Other furniture related product manufacturing 13����� 7 245 285 106 1 116 322 – 5 415
339 Miscellaneous manufacturing 138��������������������� 1 086 423 33 328 9 902 35 568 19 751 691 987 178
3391 Medical equipment and supplies manufacturing 81��� 983 890 29 796 7 288 30 141 16 451 323 899 89033911 Medical equipment and supplies manufacturing 81� 983 890 29 796 7 288 30 141 16 451 323 899 890
3399 Other miscellaneous manufacturing 57�������������� 102 533 3 532 2 614 5 427 3 300 368 87 28833991 Jewelry and silverware manufacturing 15���������� 37 250 1 020 693 2 096 1 247 129 32 06433992 Sporting and athletic goods manufacturing 2������ D D D D D D D33993 Doll, toy, and game manufacturing 1������������� D D D D D D D33994 Office supplies (except paper) manufacturing 5��� 26 161 936 619 1 823 1 104 – 21 67833995 Sign manufacturing 23�������������������������� D D D D D D D33999 All other miscellaneous manufacturing 11��������� 21 818 1 199 1 084 341 530 – 18 661
Note: The data in this table are based on the 2002 Economic Census. To maintain confidentiality, the Census Bureau supresses data to protect the identity of any business or individual. Thecensus results in this table contain nonsampling error. Data users who create their own estimates using data from this table should cite the Census Bureau as the source of the original data only. Forexplanation of terms, see Appendix A. For the full technical documentation, see Appendix C.
30 Puerto Rico–Manufacturing 2002 Economic Census of Island AreasU.S. Census Bureau, 2002 Economic Census
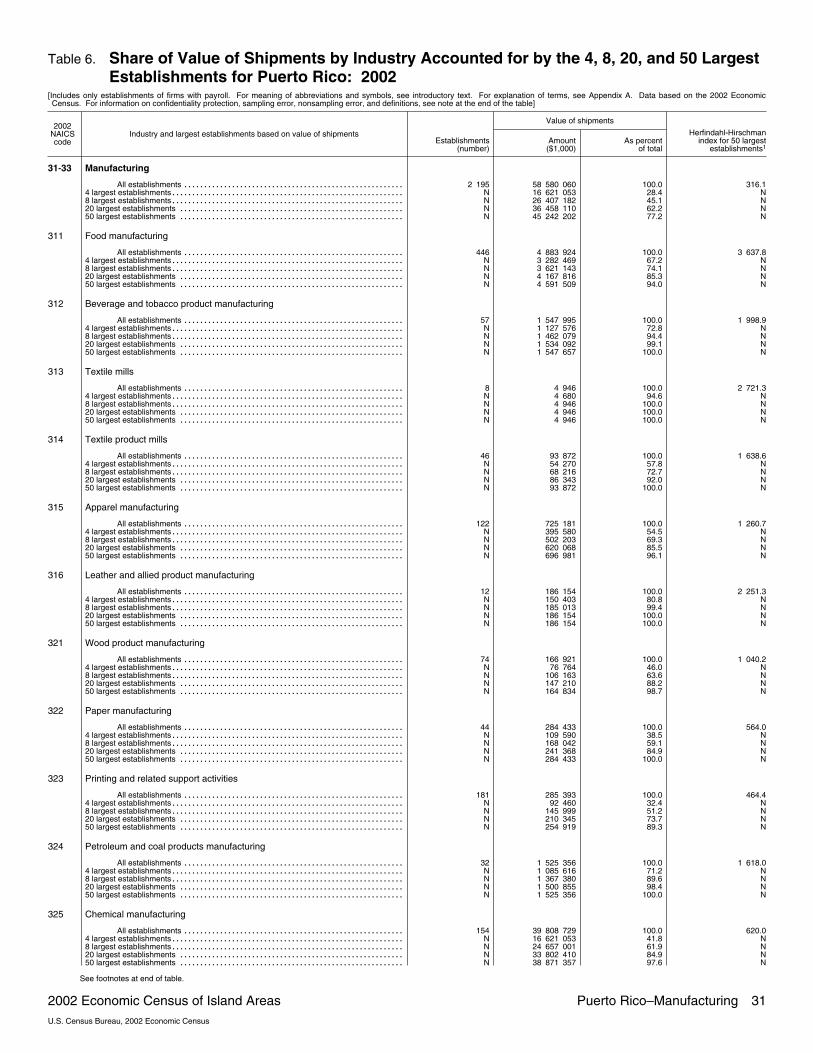
Table 6. Share of Value of Shipments by Industry Accounted for by the 4, 8, 20, and 50 LargestEstablishments for Puerto Rico: 2002
[Includes only establishments of firms with payroll. For meaning of abbreviations and symbols, see introductory text. For explanation of terms, see Appendix A. Data based on the 2002 EconomicCensus. For information on confidentiality protection, sampling error, nonsampling error, and definitions, see note at the end of the table]
2002NAICScode
Industry and largest establishments based on value of shipments
Value of shipments
Establishments(number)
Amount($1,000)
As percentof total
Herfindahl�Hirschmanindex for 50 largest
establishments1
31�33 Manufacturing
All establishments 2 195������������������������������������������������������� 58 580 060 100.0 316.14 largest establishments N���������������������������������������������������������� 16 621 053 28.4 N8 largest establishments N���������������������������������������������������������� 26 407 182 45.1 N20 largest establishments N�������������������������������������������������������� 36 458 110 62.2 N50 largest establishments N�������������������������������������������������������� 45 242 202 77.2 N
311 Food manufacturing
All establishments 446������������������������������������������������������� 4 883 924 100.0 3 637.84 largest establishments N���������������������������������������������������������� 3 282 469 67.2 N8 largest establishments N���������������������������������������������������������� 3 621 143 74.1 N20 largest establishments N�������������������������������������������������������� 4 167 816 85.3 N50 largest establishments N�������������������������������������������������������� 4 591 509 94.0 N
312 Beverage and tobacco product manufacturing
All establishments 57������������������������������������������������������� 1 547 995 100.0 1 998.94 largest establishments N���������������������������������������������������������� 1 127 576 72.8 N8 largest establishments N���������������������������������������������������������� 1 462 079 94.4 N20 largest establishments N�������������������������������������������������������� 1 534 092 99.1 N50 largest establishments N�������������������������������������������������������� 1 547 657 100.0 N
313 Textile mills
All establishments 8������������������������������������������������������� 4 946 100.0 2 721.34 largest establishments N���������������������������������������������������������� 4 680 94.6 N8 largest establishments N���������������������������������������������������������� 4 946 100.0 N20 largest establishments N�������������������������������������������������������� 4 946 100.0 N50 largest establishments N�������������������������������������������������������� 4 946 100.0 N
314 Textile product mills
All establishments 46������������������������������������������������������� 93 872 100.0 1 638.64 largest establishments N���������������������������������������������������������� 54 270 57.8 N8 largest establishments N���������������������������������������������������������� 68 216 72.7 N20 largest establishments N�������������������������������������������������������� 86 343 92.0 N50 largest establishments N�������������������������������������������������������� 93 872 100.0 N
315 Apparel manufacturing
All establishments 122������������������������������������������������������� 725 181 100.0 1 260.74 largest establishments N���������������������������������������������������������� 395 580 54.5 N8 largest establishments N���������������������������������������������������������� 502 203 69.3 N20 largest establishments N�������������������������������������������������������� 620 068 85.5 N50 largest establishments N�������������������������������������������������������� 696 981 96.1 N
316 Leather and allied product manufacturing
All establishments 12������������������������������������������������������� 186 154 100.0 2 251.34 largest establishments N���������������������������������������������������������� 150 403 80.8 N8 largest establishments N���������������������������������������������������������� 185 013 99.4 N20 largest establishments N�������������������������������������������������������� 186 154 100.0 N50 largest establishments N�������������������������������������������������������� 186 154 100.0 N
321 Wood product manufacturing
All establishments 74������������������������������������������������������� 166 921 100.0 1 040.24 largest establishments N���������������������������������������������������������� 76 764 46.0 N8 largest establishments N���������������������������������������������������������� 106 163 63.6 N20 largest establishments N�������������������������������������������������������� 147 210 88.2 N50 largest establishments N�������������������������������������������������������� 164 834 98.7 N
322 Paper manufacturing
All establishments 44������������������������������������������������������� 284 433 100.0 564.04 largest establishments N���������������������������������������������������������� 109 590 38.5 N8 largest establishments N���������������������������������������������������������� 168 042 59.1 N20 largest establishments N�������������������������������������������������������� 241 368 84.9 N50 largest establishments N�������������������������������������������������������� 284 433 100.0 N
323 Printing and related support activities
All establishments 181������������������������������������������������������� 285 393 100.0 464.44 largest establishments N���������������������������������������������������������� 92 460 32.4 N8 largest establishments N���������������������������������������������������������� 145 999 51.2 N20 largest establishments N�������������������������������������������������������� 210 345 73.7 N50 largest establishments N�������������������������������������������������������� 254 919 89.3 N
324 Petroleum and coal products manufacturing
All establishments 32������������������������������������������������������� 1 525 356 100.0 1 618.04 largest establishments N���������������������������������������������������������� 1 085 616 71.2 N8 largest establishments N���������������������������������������������������������� 1 367 380 89.6 N20 largest establishments N�������������������������������������������������������� 1 500 855 98.4 N50 largest establishments N�������������������������������������������������������� 1 525 356 100.0 N
325 Chemical manufacturing
All establishments 154������������������������������������������������������� 39 808 729 100.0 620.04 largest establishments N���������������������������������������������������������� 16 621 053 41.8 N8 largest establishments N���������������������������������������������������������� 24 657 001 61.9 N20 largest establishments N�������������������������������������������������������� 33 802 410 84.9 N50 largest establishments N�������������������������������������������������������� 38 871 357 97.6 N
See footnotes at end of table.
2002 Economic Census of Island Areas Puerto Rico–Manufacturing 31U.S. Census Bureau, 2002 Economic Census

Table 6. Share of Value of Shipments by Industry Accounted for by the 4, 8, 20, and 50 LargestEstablishments for Puerto Rico: 2002�Con.
[Includes only establishments of firms with payroll. For meaning of abbreviations and symbols, see introductory text. For explanation of terms, see Appendix A. Data based on the 2002 EconomicCensus. For information on confidentiality protection, sampling error, nonsampling error, and definitions, see note at the end of the table]
2002NAICScode
Industry and largest establishments based on value of shipments
Value of shipments
Establishments(number)
Amount($1,000)
As percentof total
Herfindahl�Hirschmanindex for 50 largest
establishments1
31�33 Manufacturing�Con.
326 Plastics and rubber products manufacturing
All establishments 67������������������������������������������������������� 499 007 100.0 629.24 largest establishments N���������������������������������������������������������� 209 351 42.0 N8 largest establishments N���������������������������������������������������������� 314 194 63.0 N20 largest establishments N�������������������������������������������������������� 434 257 87.0 N50 largest establishments N�������������������������������������������������������� 493 851 99.0 N
327 Nonmetallic mineral product manufacturing
All establishments 157������������������������������������������������������� 529 642 100.0 392.94 largest establishments N���������������������������������������������������������� 174 033 32.9 N8 largest establishments N���������������������������������������������������������� 233 346 44.1 N20 largest establishments N�������������������������������������������������������� 324 572 61.3 N50 largest establishments N�������������������������������������������������������� 439 166 82.9 N
331 Primary metal manufacturing
All establishments 34������������������������������������������������������� 75 152 100.0 930.54 largest establishments N���������������������������������������������������������� 40 246 53.6 N8 largest establishments N���������������������������������������������������������� 57 343 76.3 N20 largest establishments N�������������������������������������������������������� 73 880 98.3 N50 largest establishments N�������������������������������������������������������� 75 152 100.0 N
332 Fabricated metal product manufacturing
All establishments 289������������������������������������������������������� 782 960 100.0 343.64 largest establishments N���������������������������������������������������������� 228 752 29.2 N8 largest establishments N���������������������������������������������������������� 337 121 43.1 N20 largest establishments N�������������������������������������������������������� 501 293 64.0 N50 largest establishments N�������������������������������������������������������� 638 586 81.6 N
333 Machinery manufacturing
All establishments 42������������������������������������������������������� 284 538 100.0 4 800.44 largest establishments N���������������������������������������������������������� 243 129 85.4 N8 largest establishments N���������������������������������������������������������� 262 873 92.4 N20 largest establishments N�������������������������������������������������������� 280 333 98.5 N50 largest establishments N�������������������������������������������������������� 284 538 100.0 N
334 Computer and electronic product manufacturing
All establishments 49������������������������������������������������������� 2 288 076 100.0 1 209.74 largest establishments N���������������������������������������������������������� 1 294 297 56.6 N8 largest establishments N���������������������������������������������������������� 1 734 597 75.8 N20 largest establishments N�������������������������������������������������������� 2 174 793 95.0 N50 largest establishments N�������������������������������������������������������� 2 288 076 100.0 N
335 Electrical equipment, appliance, and component manufacturing
All establishments 41������������������������������������������������������� 1 100 588 100.0 567.54 largest establishments N���������������������������������������������������������� 408 076 37.1 N8 largest establishments N���������������������������������������������������������� 634 262 57.6 N20 largest establishments N�������������������������������������������������������� 1 018 065 92.5 N50 largest establishments N�������������������������������������������������������� 1 100 588 100.0 N
336 Transportation equipment manufacturing
All establishments 19������������������������������������������������������� 138 842 100.0 1 824.24 largest establishments N���������������������������������������������������������� 105 712 76.1 N8 largest establishments N���������������������������������������������������������� 129 964 93.6 N20 largest establishments N�������������������������������������������������������� 138 842 100.0 N50 largest establishments N�������������������������������������������������������� 138 842 100.0 N
337 Furniture and related product manufacturing
All establishments 183������������������������������������������������������� 131 619 100.0 349.14 largest establishments N���������������������������������������������������������� 38 130 29.0 N8 largest establishments N���������������������������������������������������������� 56 343 42.8 N20 largest establishments N�������������������������������������������������������� 86 661 65.8 N50 largest establishments N�������������������������������������������������������� 112 760 85.7 N
339 Miscellaneous manufacturing
All establishments 138������������������������������������������������������� 3 236 732 100.0 534.84 largest establishments N���������������������������������������������������������� 1 169 611 36.1 N8 largest establishments N���������������������������������������������������������� 1 846 635 57.1 N20 largest establishments N�������������������������������������������������������� 2 768 205 85.5 N50 largest establishments N�������������������������������������������������������� 3 186 977 98.5 N
1The Herfindahl�Hirschman index is calculated by summing the squares of the individual establishments’ market share percentages for the 50 largest establishments or for the universe,whichever is lower, in a particular industry. The market share for each establishment is the total value of shipments for that establishment divided by total value of shipments for the entire industry,multiplied by 100.
Note: The data in this table are based on the 2002 Economic Census. To maintain confidentiality, the Census Bureau supresses data to protect the identity of any business or individual. Thecensus results in this table contain nonsampling error. Data users who create their own estimates using data from this table should cite the Census Bureau as the source of the original data only. Forexplanation of terms, see Appendix A. For the full technical documentation, see Appendix C.
32 Puerto Rico–Manufacturing 2002 Economic Census of Island AreasU.S. Census Bureau, 2002 Economic Census
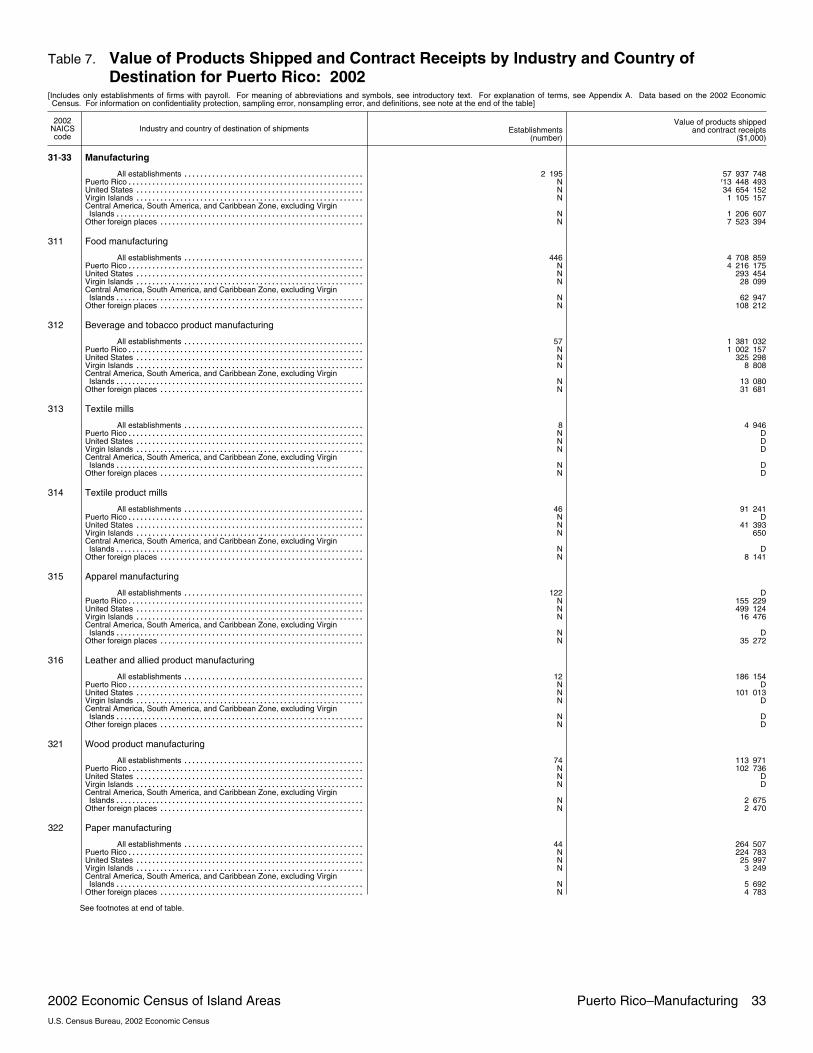
Table 7. Value of Products Shipped and Contract Receipts by Industry and Country ofDestination for Puerto Rico: 2002
[Includes only establishments of firms with payroll. For meaning of abbreviations and symbols, see introductory text. For explanation of terms, see Appendix A. Data based on the 2002 EconomicCensus. For information on confidentiality protection, sampling error, nonsampling error, and definitions, see note at the end of the table]
2002NAICScode
Industry and country of destination of shipments Establishments(number)
Value of products shippedand contract receipts
($1,000)
31�33 Manufacturing
All establishments 2 195��������������������������������������������� 57 937 748Puerto Rico N�����������������������������������������������������������
r13 448 493United States N��������������������������������������������������������� 34 654 152Virgin Islands N��������������������������������������������������������� 1 105 157Central America, South America, and Caribbean Zone, excluding VirginIslands N�������������������������������������������������������������� 1 206 607
Other foreign places N��������������������������������������������������� 7 523 394
311 Food manufacturing
All establishments 446��������������������������������������������� 4 708 859Puerto Rico N����������������������������������������������������������� 4 216 175United States N��������������������������������������������������������� 293 454Virgin Islands N��������������������������������������������������������� 28 099Central America, South America, and Caribbean Zone, excluding VirginIslands N�������������������������������������������������������������� 62 947
Other foreign places N��������������������������������������������������� 108 212
312 Beverage and tobacco product manufacturing
All establishments 57��������������������������������������������� 1 381 032Puerto Rico N����������������������������������������������������������� 1 002 157United States N��������������������������������������������������������� 325 298Virgin Islands N��������������������������������������������������������� 8 808Central America, South America, and Caribbean Zone, excluding VirginIslands N�������������������������������������������������������������� 13 080
Other foreign places N��������������������������������������������������� 31 681
313 Textile mills
All establishments 8��������������������������������������������� 4 946Puerto Rico N����������������������������������������������������������� DUnited States N��������������������������������������������������������� DVirgin Islands N��������������������������������������������������������� DCentral America, South America, and Caribbean Zone, excluding VirginIslands N�������������������������������������������������������������� D
Other foreign places N��������������������������������������������������� D
314 Textile product mills
All establishments 46��������������������������������������������� 91 241Puerto Rico N����������������������������������������������������������� DUnited States N��������������������������������������������������������� 41 393Virgin Islands N��������������������������������������������������������� 650Central America, South America, and Caribbean Zone, excluding VirginIslands N�������������������������������������������������������������� D
Other foreign places N��������������������������������������������������� 8 141
315 Apparel manufacturing
All establishments 122��������������������������������������������� DPuerto Rico N����������������������������������������������������������� 155 229United States N��������������������������������������������������������� 499 124Virgin Islands N��������������������������������������������������������� 16 476Central America, South America, and Caribbean Zone, excluding VirginIslands N�������������������������������������������������������������� D
Other foreign places N��������������������������������������������������� 35 272
316 Leather and allied product manufacturing
All establishments 12��������������������������������������������� 186 154Puerto Rico N����������������������������������������������������������� DUnited States N��������������������������������������������������������� 101 013Virgin Islands N��������������������������������������������������������� DCentral America, South America, and Caribbean Zone, excluding VirginIslands N�������������������������������������������������������������� D
Other foreign places N��������������������������������������������������� D
321 Wood product manufacturing
All establishments 74��������������������������������������������� 113 971Puerto Rico N����������������������������������������������������������� 102 736United States N��������������������������������������������������������� DVirgin Islands N��������������������������������������������������������� DCentral America, South America, and Caribbean Zone, excluding VirginIslands N�������������������������������������������������������������� 2 675
Other foreign places N��������������������������������������������������� 2 470
322 Paper manufacturing
All establishments 44��������������������������������������������� 264 507Puerto Rico N����������������������������������������������������������� 224 783United States N��������������������������������������������������������� 25 997Virgin Islands N��������������������������������������������������������� 3 249Central America, South America, and Caribbean Zone, excluding VirginIslands N�������������������������������������������������������������� 5 692
Other foreign places N��������������������������������������������������� 4 783
See footnotes at end of table.
2002 Economic Census of Island Areas Puerto Rico–Manufacturing 33U.S. Census Bureau, 2002 Economic Census
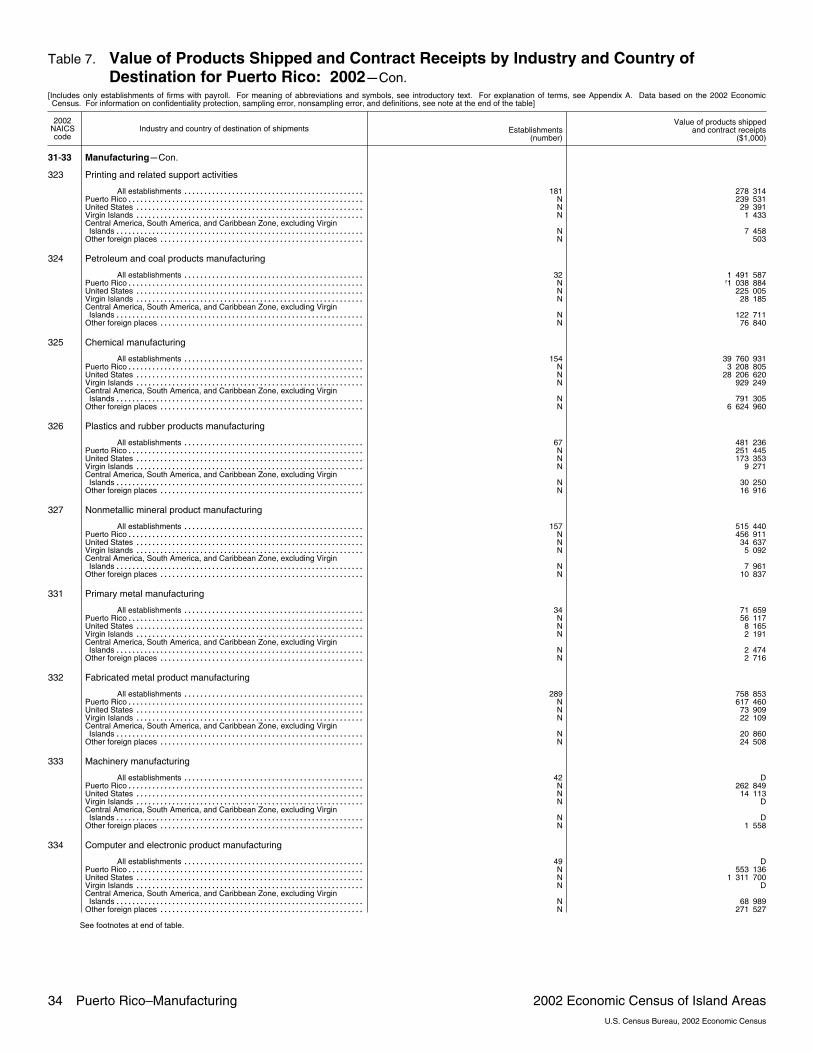
Table 7. Value of Products Shipped and Contract Receipts by Industry and Country ofDestination for Puerto Rico: 2002�Con.
[Includes only establishments of firms with payroll. For meaning of abbreviations and symbols, see introductory text. For explanation of terms, see Appendix A. Data based on the 2002 EconomicCensus. For information on confidentiality protection, sampling error, nonsampling error, and definitions, see note at the end of the table]
2002NAICScode
Industry and country of destination of shipments Establishments(number)
Value of products shippedand contract receipts
($1,000)
31�33 Manufacturing�Con.
323 Printing and related support activities
All establishments 181��������������������������������������������� 278 314Puerto Rico N����������������������������������������������������������� 239 531United States N��������������������������������������������������������� 29 391Virgin Islands N��������������������������������������������������������� 1 433Central America, South America, and Caribbean Zone, excluding VirginIslands N�������������������������������������������������������������� 7 458
Other foreign places N��������������������������������������������������� 503
324 Petroleum and coal products manufacturing
All establishments 32��������������������������������������������� 1 491 587Puerto Rico N�����������������������������������������������������������
r1 038 884United States N��������������������������������������������������������� 225 005Virgin Islands N��������������������������������������������������������� 28 185Central America, South America, and Caribbean Zone, excluding VirginIslands N�������������������������������������������������������������� 122 711
Other foreign places N��������������������������������������������������� 76 840
325 Chemical manufacturing
All establishments 154��������������������������������������������� 39 760 931Puerto Rico N����������������������������������������������������������� 3 208 805United States N��������������������������������������������������������� 28 206 620Virgin Islands N��������������������������������������������������������� 929 249Central America, South America, and Caribbean Zone, excluding VirginIslands N�������������������������������������������������������������� 791 305
Other foreign places N��������������������������������������������������� 6 624 960
326 Plastics and rubber products manufacturing
All establishments 67��������������������������������������������� 481 236Puerto Rico N����������������������������������������������������������� 251 445United States N��������������������������������������������������������� 173 353Virgin Islands N��������������������������������������������������������� 9 271Central America, South America, and Caribbean Zone, excluding VirginIslands N�������������������������������������������������������������� 30 250
Other foreign places N��������������������������������������������������� 16 916
327 Nonmetallic mineral product manufacturing
All establishments 157��������������������������������������������� 515 440Puerto Rico N����������������������������������������������������������� 456 911United States N��������������������������������������������������������� 34 637Virgin Islands N��������������������������������������������������������� 5 092Central America, South America, and Caribbean Zone, excluding VirginIslands N�������������������������������������������������������������� 7 961
Other foreign places N��������������������������������������������������� 10 837
331 Primary metal manufacturing
All establishments 34��������������������������������������������� 71 659Puerto Rico N����������������������������������������������������������� 56 117United States N��������������������������������������������������������� 8 165Virgin Islands N��������������������������������������������������������� 2 191Central America, South America, and Caribbean Zone, excluding VirginIslands N�������������������������������������������������������������� 2 474
Other foreign places N��������������������������������������������������� 2 716
332 Fabricated metal product manufacturing
All establishments 289��������������������������������������������� 758 853Puerto Rico N����������������������������������������������������������� 617 460United States N��������������������������������������������������������� 73 909Virgin Islands N��������������������������������������������������������� 22 109Central America, South America, and Caribbean Zone, excluding VirginIslands N�������������������������������������������������������������� 20 860
Other foreign places N��������������������������������������������������� 24 508
333 Machinery manufacturing
All establishments 42��������������������������������������������� DPuerto Rico N����������������������������������������������������������� 262 849United States N��������������������������������������������������������� 14 113Virgin Islands N��������������������������������������������������������� DCentral America, South America, and Caribbean Zone, excluding VirginIslands N�������������������������������������������������������������� D
Other foreign places N��������������������������������������������������� 1 558
334 Computer and electronic product manufacturing
All establishments 49��������������������������������������������� DPuerto Rico N����������������������������������������������������������� 553 136United States N��������������������������������������������������������� 1 311 700Virgin Islands N��������������������������������������������������������� DCentral America, South America, and Caribbean Zone, excluding VirginIslands N�������������������������������������������������������������� 68 989
Other foreign places N��������������������������������������������������� 271 527
See footnotes at end of table.
34 Puerto Rico–Manufacturing 2002 Economic Census of Island AreasU.S. Census Bureau, 2002 Economic Census
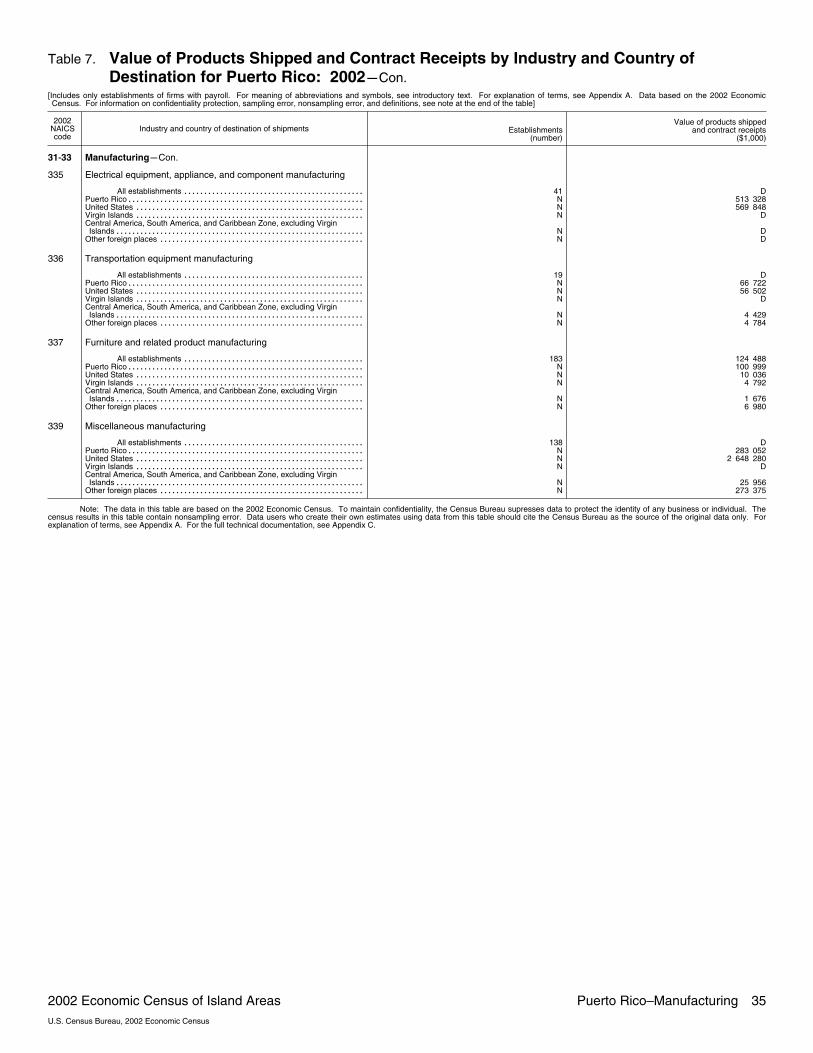
Table 7. Value of Products Shipped and Contract Receipts by Industry and Country ofDestination for Puerto Rico: 2002�Con.
[Includes only establishments of firms with payroll. For meaning of abbreviations and symbols, see introductory text. For explanation of terms, see Appendix A. Data based on the 2002 EconomicCensus. For information on confidentiality protection, sampling error, nonsampling error, and definitions, see note at the end of the table]
2002NAICScode
Industry and country of destination of shipments Establishments(number)
Value of products shippedand contract receipts
($1,000)
31�33 Manufacturing�Con.
335 Electrical equipment, appliance, and component manufacturing
All establishments 41��������������������������������������������� DPuerto Rico N����������������������������������������������������������� 513 328United States N��������������������������������������������������������� 569 848Virgin Islands N��������������������������������������������������������� DCentral America, South America, and Caribbean Zone, excluding VirginIslands N�������������������������������������������������������������� D
Other foreign places N��������������������������������������������������� D
336 Transportation equipment manufacturing
All establishments 19��������������������������������������������� DPuerto Rico N����������������������������������������������������������� 66 722United States N��������������������������������������������������������� 56 502Virgin Islands N��������������������������������������������������������� DCentral America, South America, and Caribbean Zone, excluding VirginIslands N�������������������������������������������������������������� 4 429
Other foreign places N��������������������������������������������������� 4 784
337 Furniture and related product manufacturing
All establishments 183��������������������������������������������� 124 488Puerto Rico N����������������������������������������������������������� 100 999United States N��������������������������������������������������������� 10 036Virgin Islands N��������������������������������������������������������� 4 792Central America, South America, and Caribbean Zone, excluding VirginIslands N�������������������������������������������������������������� 1 676
Other foreign places N��������������������������������������������������� 6 980
339 Miscellaneous manufacturing
All establishments 138��������������������������������������������� DPuerto Rico N����������������������������������������������������������� 283 052United States N��������������������������������������������������������� 2 648 280Virgin Islands N��������������������������������������������������������� DCentral America, South America, and Caribbean Zone, excluding VirginIslands N�������������������������������������������������������������� 25 956
Other foreign places N��������������������������������������������������� 273 375
Note: The data in this table are based on the 2002 Economic Census. To maintain confidentiality, the Census Bureau supresses data to protect the identity of any business or individual. Thecensus results in this table contain nonsampling error. Data users who create their own estimates using data from this table should cite the Census Bureau as the source of the original data only. Forexplanation of terms, see Appendix A. For the full technical documentation, see Appendix C.
2002 Economic Census of Island Areas Puerto Rico–Manufacturing 35U.S. Census Bureau, 2002 Economic Census

Table 8. Value of Products Shipped by Industry and Class of Customer forPuerto Rico: 2002
[Includes only establishments of firms with payroll. For meaning of abbreviations and symbols, see introductory text. For explanation of terms, see Appendix A. Data based on the 2002 EconomicCensus. For information on confidentiality protection, sampling error, nonsampling error, and definitions, see note at the end of the table]
2002NAICScode
Industry and class of customer Establishments(number)
Value of products shippedand contract receipts1
($1,000)
31�33 Manufacturing
All establishments 2 195���������������������������������������������r13 448 493
Wholesale establishments N���������������������������������������������� 2 098 187Household consumers N������������������������������������������������� 949 052Retailers N������������������������������������������������������������� 1 017 501Construction firms N����������������������������������������������������� 1 665 817Other manufacturer establishments N�������������������������������������� 4 545 686Commonwealth government N�������������������������������������������� 653 160All other class of customers N��������������������������������������������� 2 519 011
311 Food manufacturing
All establishments 446��������������������������������������������� 4 216 175Wholesale establishments N���������������������������������������������� 392 026Household consumers N������������������������������������������������� 160 298Retailers N������������������������������������������������������������� 378 612Construction firms N����������������������������������������������������� 96 236Other manufacturer establishments N�������������������������������������� 1 553 503Commonwealth government N�������������������������������������������� 36 525All other class of customers N��������������������������������������������� 1 598 984
312 Beverage and tobacco product manufacturing
All establishments 57��������������������������������������������� 1 002 157Wholesale establishments N���������������������������������������������� 300 398Household consumers N������������������������������������������������� DRetailers N������������������������������������������������������������� 42 523Construction firms N����������������������������������������������������� DOther manufacturer establishments N�������������������������������������� DCommonwealth government N�������������������������������������������� DAll other class of customers N��������������������������������������������� 29 589
313 Textile mills
All establishments 8��������������������������������������������� DWholesale establishments N���������������������������������������������� DHousehold consumers N������������������������������������������������� DRetailers N������������������������������������������������������������� –Construction firms N����������������������������������������������������� DOther manufacturer establishments N�������������������������������������� DCommonwealth government N�������������������������������������������� DAll other class of customers N��������������������������������������������� D
314 Textile product mills
All establishments 46��������������������������������������������� DWholesale establishments N���������������������������������������������� 6 272Household consumers N������������������������������������������������� 5 901Retailers N������������������������������������������������������������� 13 819Construction firms N����������������������������������������������������� 730Other manufacturer establishments N�������������������������������������� 8 285Commonwealth government N�������������������������������������������� DAll other class of customers N��������������������������������������������� 5 376
315 Apparel manufacturing
All establishments 122��������������������������������������������� 155 229Wholesale establishments N���������������������������������������������� 33 134Household consumers N������������������������������������������������� 30 273Retailers N������������������������������������������������������������� 14 163Construction firms N����������������������������������������������������� 24 730Other manufacturer establishments N�������������������������������������� 21 484Commonwealth government N�������������������������������������������� 11 036All other class of customers N��������������������������������������������� 20 403
316 Leather and allied product manufacturing
All establishments 12��������������������������������������������� DWholesale establishments N���������������������������������������������� DHousehold consumers N������������������������������������������������� DRetailers N������������������������������������������������������������� DConstruction firms N����������������������������������������������������� DOther manufacturer establishments N�������������������������������������� DCommonwealth government N�������������������������������������������� DAll other class of customers N��������������������������������������������� D
321 Wood product manufacturing
All establishments 74��������������������������������������������� 102 736Wholesale establishments N���������������������������������������������� 7 201Household consumers N������������������������������������������������� 5 680Retailers N������������������������������������������������������������� 21 121Construction firms N����������������������������������������������������� 28 994Other manufacturer establishments N�������������������������������������� 16 568Commonwealth government N�������������������������������������������� 4 481All other class of customers N��������������������������������������������� 18 684
See footnotes at end of table.
36 Puerto Rico–Manufacturing 2002 Economic Census of Island AreasU.S. Census Bureau, 2002 Economic Census

Table 8. Value of Products Shipped by Industry and Class of Customer forPuerto Rico: 2002�Con.
[Includes only establishments of firms with payroll. For meaning of abbreviations and symbols, see introductory text. For explanation of terms, see Appendix A. Data based on the 2002 EconomicCensus. For information on confidentiality protection, sampling error, nonsampling error, and definitions, see note at the end of the table]
2002NAICScode
Industry and class of customer Establishments(number)
Value of products shippedand contract receipts1
($1,000)
31�33 Manufacturing�Con.
322 Paper manufacturing
All establishments 44��������������������������������������������� 224 783Wholesale establishments N���������������������������������������������� 19 881Household consumers N������������������������������������������������� 4 132Retailers N������������������������������������������������������������� DConstruction firms N����������������������������������������������������� 6 628Other manufacturer establishments N�������������������������������������� 175 919Commonwealth government N�������������������������������������������� DAll other class of customers N��������������������������������������������� 11 273
323 Printing and related support activities
All establishments 181��������������������������������������������� 239 531Wholesale establishments N���������������������������������������������� 16 374Household consumers N������������������������������������������������� 14 368Retailers N������������������������������������������������������������� 14 277Construction firms N����������������������������������������������������� 1 077Other manufacturer establishments N�������������������������������������� 109 506Commonwealth government N�������������������������������������������� 9 948All other class of customers N��������������������������������������������� 73 965
324 Petroleum and coal products manufacturing
All establishments 32���������������������������������������������r1 038 884
Wholesale establishments N���������������������������������������������� 291 491Household consumers N������������������������������������������������� DRetailers N������������������������������������������������������������� DConstruction firms N����������������������������������������������������� 328 477Other manufacturer establishments N�������������������������������������� 81 558Commonwealth government N�������������������������������������������� 275 444All other class of customers N��������������������������������������������� 31 616
325 Chemical manufacturing
All establishments 154��������������������������������������������� 3 208 805Wholesale establishments N���������������������������������������������� 352 174Household consumers N������������������������������������������������� 420 609Retailers N������������������������������������������������������������� 211 392Construction firms N����������������������������������������������������� 643 756Other manufacturer establishments N�������������������������������������� 884 883Commonwealth government N�������������������������������������������� 213 660All other class of customers N��������������������������������������������� 482 329
326 Plastics and rubber products manufacturing
All establishments 67��������������������������������������������� 251 445Wholesale establishments N���������������������������������������������� 33 647Household consumers N������������������������������������������������� 10 946Retailers N������������������������������������������������������������� 15 135Construction firms N����������������������������������������������������� 24 598Other manufacturer establishments N�������������������������������������� 142 379Commonwealth government N�������������������������������������������� 8 138All other class of customers N��������������������������������������������� 16 599
327 Nonmetallic mineral product manufacturing
All establishments 157��������������������������������������������� 456 911Wholesale establishments N���������������������������������������������� 24 151Household consumers N������������������������������������������������� 44 429Retailers N������������������������������������������������������������� 25 322Construction firms N����������������������������������������������������� 266 984Other manufacturer establishments N�������������������������������������� 51 177Commonwealth government N�������������������������������������������� 21 181All other class of customers N��������������������������������������������� 23 669
331 Primary metal manufacturing
All establishments 34��������������������������������������������� 56 117Wholesale establishments N���������������������������������������������� 16 427Household consumers N������������������������������������������������� 3 898Retailers N������������������������������������������������������������� 1 434Construction firms N����������������������������������������������������� 14 333Other manufacturer establishments N�������������������������������������� 13 530Commonwealth government N�������������������������������������������� 4 200All other class of customers N��������������������������������������������� 2 293
332 Fabricated metal product manufacturing
All establishments 289��������������������������������������������� 617 460Wholesale establishments N���������������������������������������������� 126 376Household consumers N������������������������������������������������� 133 199Retailers N������������������������������������������������������������� 23 712Construction firms N����������������������������������������������������� 141 424Other manufacturer establishments N�������������������������������������� 131 583Commonwealth government N�������������������������������������������� 19 121All other class of customers N��������������������������������������������� 42 015
See footnotes at end of table.
2002 Economic Census of Island Areas Puerto Rico–Manufacturing 37U.S. Census Bureau, 2002 Economic Census
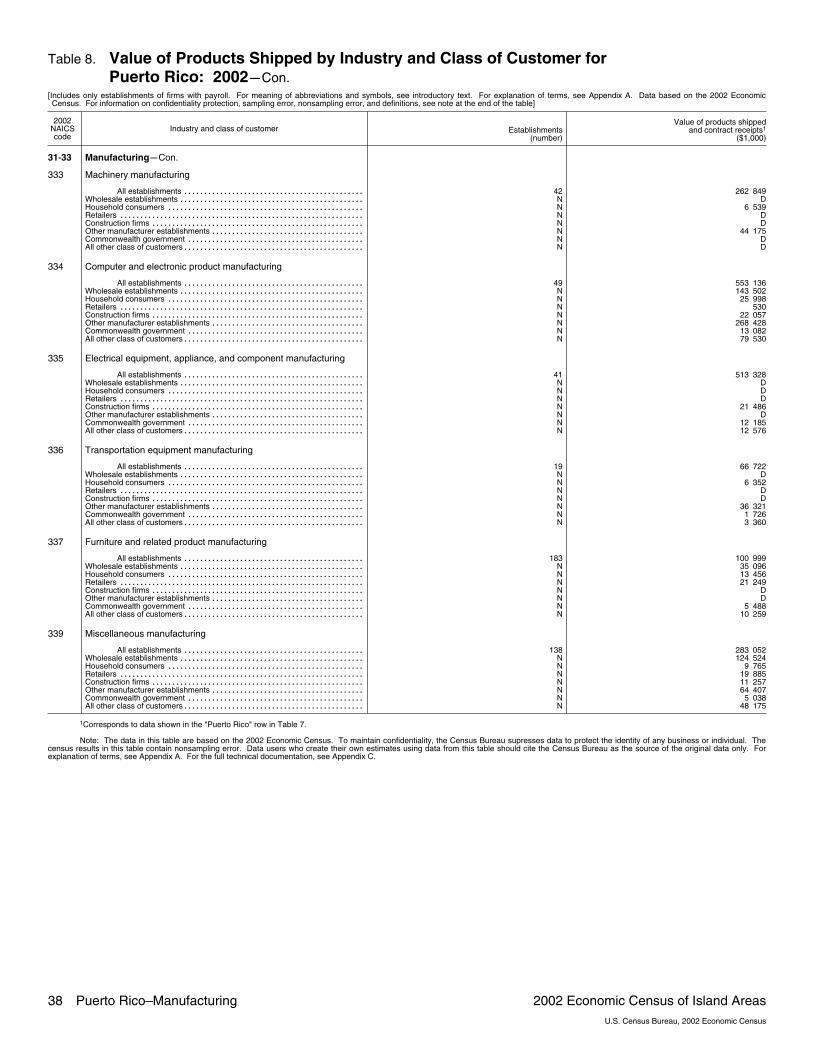
Table 8. Value of Products Shipped by Industry and Class of Customer forPuerto Rico: 2002�Con.
[Includes only establishments of firms with payroll. For meaning of abbreviations and symbols, see introductory text. For explanation of terms, see Appendix A. Data based on the 2002 EconomicCensus. For information on confidentiality protection, sampling error, nonsampling error, and definitions, see note at the end of the table]
2002NAICScode
Industry and class of customer Establishments(number)
Value of products shippedand contract receipts1
($1,000)
31�33 Manufacturing�Con.
333 Machinery manufacturing
All establishments 42��������������������������������������������� 262 849Wholesale establishments N���������������������������������������������� DHousehold consumers N������������������������������������������������� 6 539Retailers N������������������������������������������������������������� DConstruction firms N����������������������������������������������������� DOther manufacturer establishments N�������������������������������������� 44 175Commonwealth government N�������������������������������������������� DAll other class of customers N��������������������������������������������� D
334 Computer and electronic product manufacturing
All establishments 49��������������������������������������������� 553 136Wholesale establishments N���������������������������������������������� 143 502Household consumers N������������������������������������������������� 25 998Retailers N������������������������������������������������������������� 530Construction firms N����������������������������������������������������� 22 057Other manufacturer establishments N�������������������������������������� 268 428Commonwealth government N�������������������������������������������� 13 082All other class of customers N��������������������������������������������� 79 530
335 Electrical equipment, appliance, and component manufacturing
All establishments 41��������������������������������������������� 513 328Wholesale establishments N���������������������������������������������� DHousehold consumers N������������������������������������������������� DRetailers N������������������������������������������������������������� DConstruction firms N����������������������������������������������������� 21 486Other manufacturer establishments N�������������������������������������� DCommonwealth government N�������������������������������������������� 12 185All other class of customers N��������������������������������������������� 12 576
336 Transportation equipment manufacturing
All establishments 19��������������������������������������������� 66 722Wholesale establishments N���������������������������������������������� DHousehold consumers N������������������������������������������������� 6 352Retailers N������������������������������������������������������������� DConstruction firms N����������������������������������������������������� DOther manufacturer establishments N�������������������������������������� 36 321Commonwealth government N�������������������������������������������� 1 726All other class of customers N��������������������������������������������� 3 360
337 Furniture and related product manufacturing
All establishments 183��������������������������������������������� 100 999Wholesale establishments N���������������������������������������������� 35 096Household consumers N������������������������������������������������� 13 456Retailers N������������������������������������������������������������� 21 249Construction firms N����������������������������������������������������� DOther manufacturer establishments N�������������������������������������� DCommonwealth government N�������������������������������������������� 5 488All other class of customers N��������������������������������������������� 10 259
339 Miscellaneous manufacturing
All establishments 138��������������������������������������������� 283 052Wholesale establishments N���������������������������������������������� 124 524Household consumers N������������������������������������������������� 9 765Retailers N������������������������������������������������������������� 19 885Construction firms N����������������������������������������������������� 11 257Other manufacturer establishments N�������������������������������������� 64 407Commonwealth government N�������������������������������������������� 5 038All other class of customers N��������������������������������������������� 48 175
1Corresponds to data shown in the "Puerto Rico" row in Table 7.
Note: The data in this table are based on the 2002 Economic Census. To maintain confidentiality, the Census Bureau supresses data to protect the identity of any business or individual. Thecensus results in this table contain nonsampling error. Data users who create their own estimates using data from this table should cite the Census Bureau as the source of the original data only. Forexplanation of terms, see Appendix A. For the full technical documentation, see Appendix C.
38 Puerto Rico–Manufacturing 2002 Economic Census of Island AreasU.S. Census Bureau, 2002 Economic Census

Table 9. E�Commerce Statistics for Puerto Rico: 2002[Includes only establishments of firms with payroll. For meaning of abbreviations and symbols, see introductory text. For explanation of terms, see Appendix A. Data based on the 2002 EconomicCensus. For information on confidentiality protection, sampling error, nonsampling error, and definitions, see note at the end of the table]
Industry
Total E�commerce
Establishments(number)
Value ofshipments
($1,000)Establishments
(number)
Value ofshipments
($1,000)
E�commercevalue of shipments
as a percentof total sales
31�33, Manufacturing 2 195������������������������������������������������������������ 58 580 060 51 5 600 814 9.6
Note: The data in this table are based on the 2002 Economic Census. To maintain confidentiality, the Census Bureau supresses data to protect the identity of any business or individual. Thecensus results in this table contain nonsampling error. Data users who create their own estimates using data from this table should cite the Census Bureau as the source of the original data only. Forexplanation of terms, see Appendix A. For the full technical documentation, see Appendix C.
2002 Economic Census of Island Areas Puerto Rico–Manufacturing 39U.S. Census Bureau, 2002 Economic Census
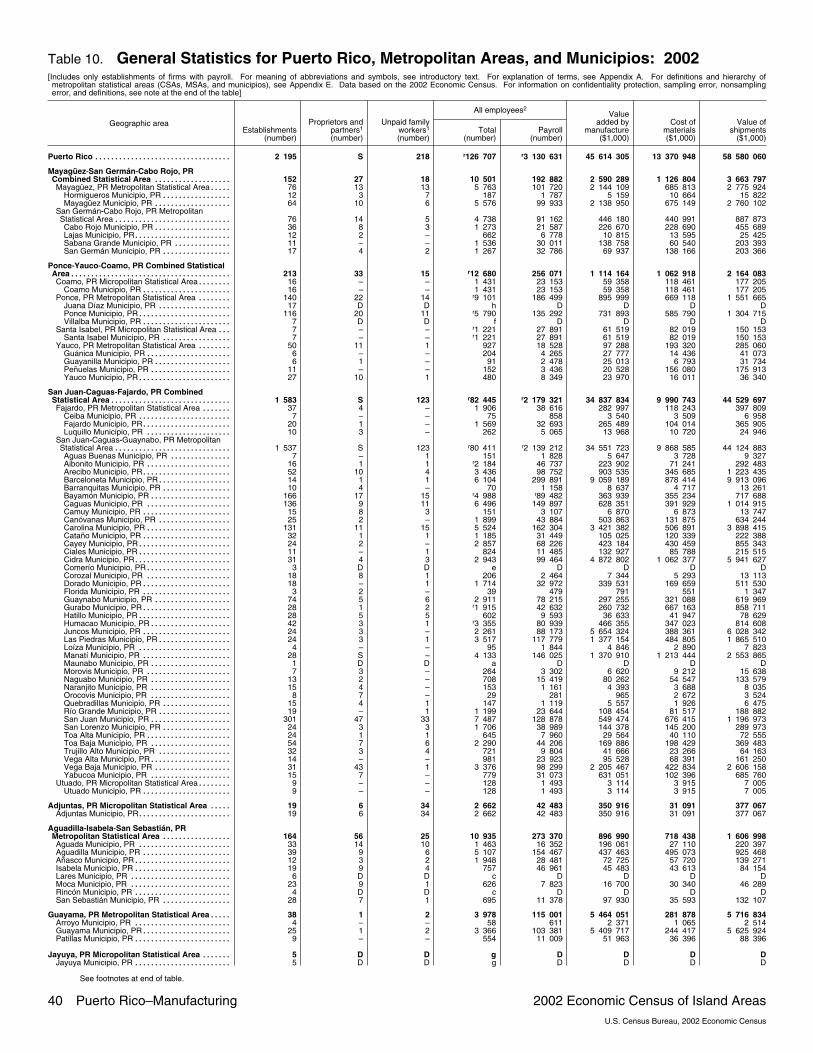
Table 10. General Statistics for Puerto Rico, Metropolitan Areas, and Municipios: 2002[Includes only establishments of firms with payroll. For meaning of abbreviations and symbols, see introductory text. For explanation of terms, see Appendix A. For definitions and hierarchy ofmetropolitan statistical areas (CSAs, MSAs, and municipios), see Appendix E. Data based on the 2002 Economic Census. For information on confidentiality protection, sampling error, nonsamplingerror, and definitions, see note at the end of the table]
Geographic area
All employees2
Establishments(number)
Proprietors andpartners1
(number)
Unpaid familyworkers1
(number)Total
(number)Payroll
(number)
Valueadded by
manufacture($1,000)
Cost ofmaterials($1,000)
Value ofshipments
($1,000)
Puerto Rico 2 195���������������������������������� S 218 r126 707 r3 130 631 45 614 305 13 370 948 58 580 060
Mayagüez�San Germán�Cabo Rojo, PRCombined Statistical Area 152������������������� 27 18 10 501 192 882 2 590 289 1 126 804 3 663 797Mayagüez, PR Metropolitan Statistical Area 76����� 13 13 5 763 101 720 2 144 109 685 813 2 775 924
Hormigueros Municipio, PR 12����������������� 3 7 187 1 787 5 159 10 664 15 822Mayagüez Municipio, PR 64������������������� 10 6 5 576 99 933 2 138 950 675 149 2 760 102
San Germán�Cabo Rojo, PR MetropolitanStatistical Area 76����������������������������� 14 5 4 738 91 162 446 180 440 991 887 873Cabo Rojo Municipio, PR 36������������������� 8 3 1 273 21 587 226 670 228 690 455 689Lajas Municipio, PR 12������������������������ 2 – 662 6 778 10 815 13 595 25 425Sabana Grande Municipio, PR 11�������������� – – 1 536 30 011 138 758 60 540 203 393San Germán Municipio, PR 17����������������� 4 2 1 267 32 786 69 937 138 166 203 366
Ponce�Yauco�Coamo, PR Combined StatisticalArea 213���������������������������������������� 33 15 r12 680 256 071 1 114 164 1 062 918 2 164 083Coamo, PR Micropolitan Statistical Area 16�������� – – 1 431 23 153 59 358 118 461 177 205
Coamo Municipio, PR 16���������������������� – – 1 431 23 153 59 358 118 461 177 205Ponce, PR Metropolitan Statistical Area 140�������� 22 14 r9 101 186 499 895 999 669 118 1 551 665
Juana Díaz Municipio, PR 17������������������ D D h D D D DPonce Municipio, PR 116����������������������� 20 11 r5 790 135 292 731 893 585 790 1 304 715Villalba Municipio, PR 7���������������������� D D f D D D D
Santa Isabel, PR Micropolitan Statistical Area 7��� – – r1 221 27 891 61 519 82 019 150 153Santa Isabel Municipio, PR 7����������������� – – r1 221 27 891 61 519 82 019 150 153
Yauco, PR Metropolitan Statistical Area 50�������� 11 1 927 18 528 97 288 193 320 285 060Guánica Municipio, PR 6��������������������� – – 204 4 265 27 777 14 436 41 073Guayanilla Municipio, PR 6������������������� 1 – 91 2 478 25 013 6 793 31 734Peñuelas Municipio, PR 11�������������������� – – 152 3 436 20 528 156 080 175 913Yauco Municipio, PR 27����������������������� 10 1 480 8 349 23 970 16 011 36 340
San Juan�Caguas�Fajardo, PR CombinedStatistical Area 1 583������������������������������ S 123 r82 445 r2 179 321 34 837 834 9 990 743 44 529 697Fajardo, PR Metropolitan Statistical Area 37������� 4 – 1 906 38 616 282 997 118 243 397 809
Ceiba Municipio, PR 7����������������������� – – 75 858 3 540 3 509 6 958Fajardo Municipio, PR 20���������������������� 1 – 1 569 32 693 265 489 104 014 365 905Luquillo Municipio, PR 10��������������������� 3 – 262 5 065 13 968 10 720 24 946
San Juan�Caguas�Guaynabo, PR MetropolitanStatistical Area 1 537����������������������������� S 123 r80 411 r2 139 212 34 551 723 9 868 585 44 124 883Aguas Buenas Municipio, PR 7��������������� – 1 151 1 828 5 647 3 728 9 327Aibonito Municipio, PR 16��������������������� 1 1 r2 184 46 737 223 902 71 241 292 483Arecibo Municipio, PR 52���������������������� 10 4 3 436 98 752 903 535 345 685 1 223 435Barceloneta Municipio, PR 14������������������ 1 1 6 104 299 891 9 059 189 878 414 9 913 096Barranquitas Municipio, PR 10����������������� 4 – 70 1 158 8 637 4 717 13 261Bayamón Municipio, PR 166�������������������� 17 15 r4 988 r89 482 363 939 355 234 717 688Caguas Municipio, PR 136��������������������� 9 11 6 496 149 897 628 351 391 929 1 014 915Camuy Municipio, PR 15���������������������� 8 3 151 3 107 6 870 6 873 13 747Canóvanas Municipio, PR 25������������������ 2 – 1 899 43 884 503 863 131 875 634 244Carolina Municipio, PR 131��������������������� 11 15 5 524 162 304 3 421 382 506 891 3 898 415Cataño Municipio, PR 32���������������������� 1 1 1 185 31 449 105 025 120 339 222 388Cayey Municipio, PR 24����������������������� 2 – 2 857 68 226 423 184 430 459 855 343Ciales Municipio, PR 11����������������������� – 1 824 11 485 132 927 85 788 215 515Cidra Municipio, PR 31������������������������ 4 3 2 943 99 464 4 872 802 1 062 377 5 941 627Comerío Municipio, PR 3��������������������� D D e D D D DCorozal Municipio, PR 18��������������������� 8 1 206 2 464 7 344 5 293 13 113Dorado Municipio, PR 18���������������������� – 1 1 714 32 972 339 531 169 659 511 530Florida Municipio, PR 3���������������������� 2 – 39 479 791 551 1 347Guaynabo Municipio, PR 74������������������� 5 6 2 911 78 215 297 255 321 088 619 969Gurabo Municipio, PR 28���������������������� 1 2 r1 915 42 632 260 732 667 163 858 711Hatillo Municipio, PR 28����������������������� 5 5 602 9 593 36 633 41 947 78 629Humacao Municipio, PR 42�������������������� 3 1 r3 355 80 939 466 355 347 023 814 608Juncos Municipio, PR 24���������������������� 3 – 2 261 88 173 5 654 324 388 361 6 028 342Las Piedras Municipio, PR 24������������������ 3 1 3 517 117 779 1 377 154 484 805 1 865 510Loíza Municipio, PR 4����������������������� – – 95 1 844 4 846 2 890 7 823Manatí Municipio, PR 28���������������������� S – 4 133 146 025 1 370 910 1 213 444 2 553 865Maunabo Municipio, PR 1�������������������� D D a D D D DMorovis Municipio, PR 7��������������������� 3 – 264 3 302 6 620 9 212 15 638Naguabo Municipio, PR 13�������������������� 2 – 708 15 419 80 262 54 547 133 579Naranjito Municipio, PR 15�������������������� 4 – 153 1 161 4 393 3 688 8 035Orocovis Municipio, PR 8�������������������� 7 – 29 281 965 2 672 3 524Quebradillas Municipio, PR 15����������������� 4 1 147 1 119 5 557 1 926 6 475Río Grande Municipio, PR 19������������������ – 1 1 199 23 644 108 454 81 517 188 882San Juan Municipio, PR 301�������������������� 47 33 7 487 128 878 549 474 676 415 1 196 973San Lorenzo Municipio, PR 24����������������� 3 3 1 706 38 989 144 378 145 200 289 973Toa Alta Municipio, PR 24��������������������� 1 1 645 7 960 29 564 40 110 72 555Toa Baja Municipio, PR 54�������������������� 7 6 2 290 44 206 169 886 198 429 369 483Trujillo Alto Municipio, PR 32������������������ 3 4 721 9 804 41 666 23 266 64 163Vega Alta Municipio, PR 14�������������������� – – 981 23 923 95 528 68 391 161 250Vega Baja Municipio, PR 31������������������� 43 1 3 376 98 299 2 205 467 422 834 2 606 158Yabucoa Municipio, PR 15�������������������� 7 – 779 31 073 631 051 102 396 685 760
Utuado, PR Micropolitan Statistical Area 9�������� – – 128 1 493 3 114 3 915 7 005Utuado Municipio, PR 9���������������������� – – 128 1 493 3 114 3 915 7 005
Adjuntas, PR Micropolitan Statistical Area 19����� 6 34 2 662 42 483 350 916 31 091 377 067Adjuntas Municipio, PR 19����������������������� 6 34 2 662 42 483 350 916 31 091 377 067
Aguadilla�Isabela�San Sebastián, PRMetropolitan Statistical Area 164����������������� 56 25 10 935 273 370 896 990 718 438 1 606 998Aguada Municipio, PR 33����������������������� 14 10 1 463 16 352 196 061 27 110 220 397Aguadilla Municipio, PR 39���������������������� 9 6 5 107 154 467 437 463 495 073 925 468Añasco Municipio, PR 12������������������������ 3 2 1 948 28 481 72 725 57 720 139 271Isabela Municipio, PR 19������������������������ 9 4 757 46 961 45 483 43 613 84 154Lares Municipio, PR 6������������������������� D D c D D D DMoca Municipio, PR 23������������������������� 9 1 626 7 823 16 700 30 340 46 289Rincón Municipio, PR 4������������������������ D D c D D D DSan Sebastián Municipio, PR 28����������������� 7 1 695 11 378 97 930 35 593 132 107
Guayama, PR Metropolitan Statistical Area 38����� 1 2 3 978 115 001 5 464 051 281 878 5 716 834Arroyo Municipio, PR 4������������������������ – – 58 611 2 371 1 065 2 514Guayama Municipio, PR 25���������������������� 1 2 3 366 103 381 5 409 717 244 417 5 625 924Patillas Municipio, PR 9������������������������ – – 554 11 009 51 963 36 396 88 396
Jayuya, PR Micropolitan Statistical Area 5������� D D g D D D DJayuya Municipio, PR 5������������������������ D D g D D D D
See footnotes at end of table.
40 Puerto Rico–Manufacturing 2002 Economic Census of Island AreasU.S. Census Bureau, 2002 Economic Census

Table 10. General Statistics for Puerto Rico, Metropolitan Areas, and Municipios: 2002�Con.[Includes only establishments of firms with payroll. For meaning of abbreviations and symbols, see introductory text. For explanation of terms, see Appendix A. For definitions and hierarchy ofmetropolitan statistical areas (CSAs, MSAs, and municipios), see Appendix E. Data based on the 2002 Economic Census. For information on confidentiality protection, sampling error, nonsamplingerror, and definitions, see note at the end of the table]
Geographic area
All employees2
Establishments(number)
Proprietors andpartners1
(number)
Unpaid familyworkers1
(number)Total
(number)Payroll
(number)
Valueadded by
manufacture($1,000)
Cost ofmaterials($1,000)
Value ofshipments
($1,000)
Area Outside Puerto Rico Metropolitan Areas 21�� D D g D D D DCulebra Municipio, PR 2����������������������� D D c D D D DLas Marías Municipio, PR 2�������������������� D D a D D D DMaricao Municipio, PR 1����������������������� D D g D D D DSalinas Municipio, PR 13������������������������ D D e D D D DVieques Municipio, PR 3����������������������� D D b D D D D
1Includes only those who worked 15 hours or more during week including March 12.2Sum of other employees for the pay period including March 12, 2002, plus production workers during pay periods including the 12th of March, May, August, and November divided by 4.
Note: The data in this table are based on the 2002 Economic Census. To maintain confidentiality, the Census Bureau supresses data to protect the identity of any business or individual. Thecensus results in this table contain nonsampling error. Data users who create their own estimates using data from this table should cite the Census Bureau as the source of the original data only. Forexplanation of terms, see Appendix A. For the full technical documentation, see Appendix C.
2002 Economic Census of Island Areas Puerto Rico–Manufacturing 41U.S. Census Bureau, 2002 Economic Census

Table 11. Selected Statistics by Employment Size of Establishments for Puerto Rico,Metropolitan Areas, and Municipios: 2002
[Includes only establishments of firms with payroll. For meaning of abbreviations and symbols, see introductory text. For explanation of terms, see Appendix A. For definitions and hierarchy ofmetropolitan statistical areas (CSAs, MSAs, and municipios), see Appendix E. Data based on the 2002 Economic Census. For information on confidentiality protection, sampling error, nonsamplingerror, and definitions, see note at the end of the table]
Geographic area and employment size of establishment
All employees1
Estab�lishments(number)
Total(number)
Payroll($1,000)
Valueadded by
manufacture($1,000)
Value ofshipments
($1,000)
PUERTO RICO
All establishments 2 195����������������������������������������������r126 707 r3 130 631 45 614 305 58 580 060
Establishments with an average of�1 to 4 employees 674������������������������������������������������������� 1 557 17 357 123 417 183 6155 to 9 employees r337�������������������������������������������������������
r2 320 r29 014 r135 232 r263 35710 to 19 employees r369�����������������������������������������������������
r5 173 r72 500 r277 399 r537 25020 to 49 employees r376�����������������������������������������������������
r11 599 r241 070 r992 929 r1 895 95550 to 99 employees 174����������������������������������������������������� 12 045 227 970 1 751 946 3 020 711100 to 249 employees r139��������������������������������������������������
r22 543 r575 349 r8 463 703 r11 116 946250 to 499 employees r78��������������������������������������������������
r27 622 r684 421 r9 315 258 r13 116 710500 employees or more r48�������������������������������������������������
r43 848 r1 282 950 r24 554 421 r28 445 516
MAYAGÜEZ�SAN GERMÁN�CABO ROJO, PR COMBINEDSTATISTICAL AREA
All establishments 152���������������������������������������������� 10 501 192 882 2 590 289 3 663 797Establishments with an average of�1 to 4 employees 50������������������������������������������������������� c D D D5 to 9 employees 26������������������������������������������������������� c D D D10 to 19 employees 23����������������������������������������������������� 310 3 643 16 480 35 26020 to 49 employees 21����������������������������������������������������� f D D D50 to 99 employees 7����������������������������������������������������� e D D D100 to 249 employees 12�������������������������������������������������� 2 038 53 900 1 120 707 1 463 326250 to 499 employees 8�������������������������������������������������� 2 809 62 174 402 401 710 015500 employees or more 5������������������������������������������������� h D D D
Mayagüez, PR Metropolitan Statistical Area
All establishments 76���������������������������������������������� 5 763 101 720 2 144 109 2 775 924Establishments with an average of�1 to 4 employees 22������������������������������������������������������� b D D D5 to 9 employees 7������������������������������������������������������� b D D D10 to 19 employees 15����������������������������������������������������� c D D D20 to 49 employees 16����������������������������������������������������� f D D D50 to 99 employees 4����������������������������������������������������� e D D D100 to 249 employees 5�������������������������������������������������� f D D D250 to 499 employees 4�������������������������������������������������� 1 502 40 443 362 376 568 241500 employees or more 3������������������������������������������������� 2 464 27 782 150 262 210 296
Hormigueros Municipio, PR
All establishments 12���������������������������������������������� 187 1 787 5 159 15 822Establishments with an average of�1 to 4 employees 4������������������������������������������������������� 11 58 287 5335 to 9 employees 1������������������������������������������������������� a D D D10 to 19 employees 2����������������������������������������������������� b D D D20 to 49 employees 5����������������������������������������������������� c D D D50 to 99 employees –����������������������������������������������������� – – – –100 to 249 employees –�������������������������������������������������� – – – –250 to 499 employees –�������������������������������������������������� – – – –500 employees or more –������������������������������������������������� – – – –
Mayagüez Municipio, PR
All establishments 64���������������������������������������������� 5 576 99 933 2 138 950 2 760 102Establishments with an average of�1 to 4 employees 18������������������������������������������������������� b D D D5 to 9 employees 6������������������������������������������������������� b D D D10 to 19 employees 13����������������������������������������������������� c D D D20 to 49 employees 11����������������������������������������������������� e D D D50 to 99 employees 4����������������������������������������������������� e D D D100 to 249 employees 5�������������������������������������������������� f D D D250 to 499 employees 4�������������������������������������������������� 1 502 40 443 362 376 568 241500 employees or more 3������������������������������������������������� 2 464 27 782 150 262 210 296
San Germán�Cabo Rojo, PR Metropolitan Statistical Area
All establishments 76���������������������������������������������� 4 738 91 162 446 180 887 873Establishments with an average of�1 to 4 employees 28������������������������������������������������������� 60 566 3 006 6 0335 to 9 employees 19������������������������������������������������������� 136 1 444 4 495 10 02310 to 19 employees 8����������������������������������������������������� c D D D20 to 49 employees 5����������������������������������������������������� c D D D50 to 99 employees 3����������������������������������������������������� c D D D100 to 249 employees 7�������������������������������������������������� g D D D250 to 499 employees 4�������������������������������������������������� 1 307 21 731 40 025 141 774500 employees or more 2������������������������������������������������� g D D D
Cabo Rojo Municipio, PR
All establishments 36���������������������������������������������� 1 273 21 587 226 670 455 689Establishments with an average of�1 to 4 employees 13������������������������������������������������������� b D D D5 to 9 employees 11������������������������������������������������������� b D D D10 to 19 employees 5����������������������������������������������������� b D D D20 to 49 employees 3����������������������������������������������������� b D D D50 to 99 employees 1����������������������������������������������������� b D D D100 to 249 employees 1�������������������������������������������������� c D D D250 to 499 employees 2�������������������������������������������������� f D D D500 employees or more –������������������������������������������������� – – – –
See footnotes at end of table.
42 Puerto Rico–Manufacturing 2002 Economic Census of Island AreasU.S. Census Bureau, 2002 Economic Census
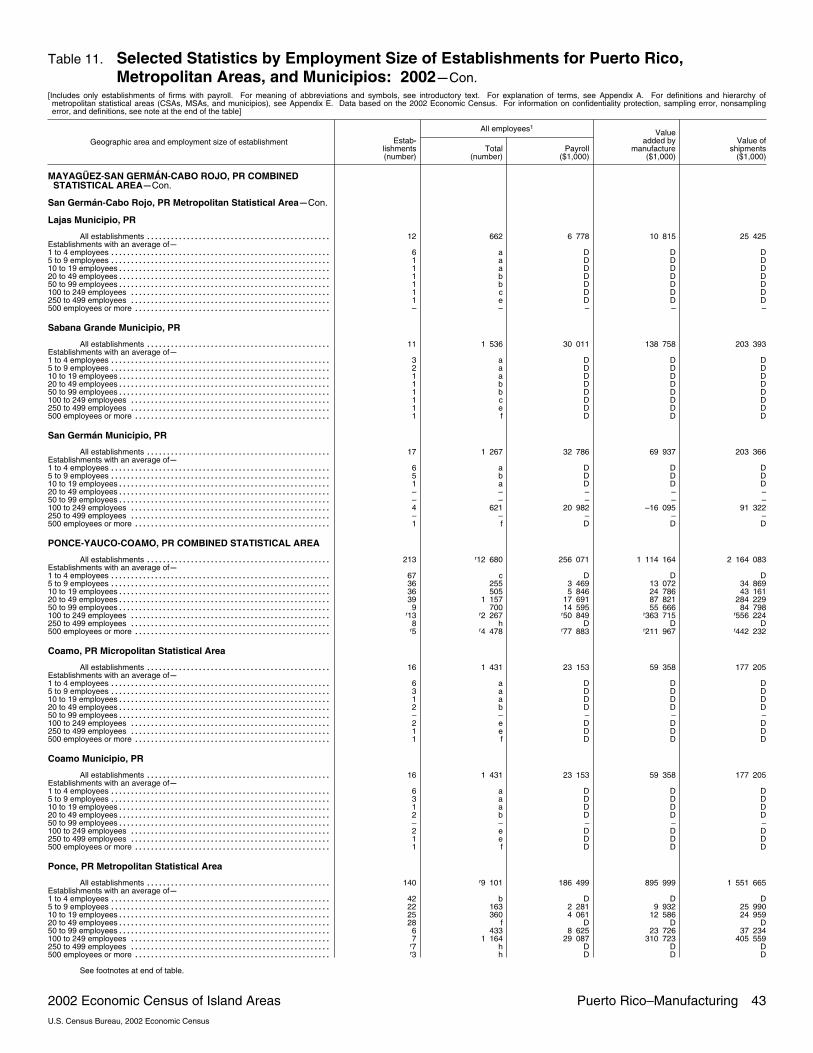
Table 11. Selected Statistics by Employment Size of Establishments for Puerto Rico,Metropolitan Areas, and Municipios: 2002�Con.
[Includes only establishments of firms with payroll. For meaning of abbreviations and symbols, see introductory text. For explanation of terms, see Appendix A. For definitions and hierarchy ofmetropolitan statistical areas (CSAs, MSAs, and municipios), see Appendix E. Data based on the 2002 Economic Census. For information on confidentiality protection, sampling error, nonsamplingerror, and definitions, see note at the end of the table]
Geographic area and employment size of establishment
All employees1
Estab�lishments(number)
Total(number)
Payroll($1,000)
Valueadded by
manufacture($1,000)
Value ofshipments
($1,000)
MAYAGÜEZ�SAN GERMÁN�CABO ROJO, PR COMBINEDSTATISTICAL AREA�Con.
San Germán�Cabo Rojo, PR Metropolitan Statistical Area�Con.
Lajas Municipio, PR
All establishments 12���������������������������������������������� 662 6 778 10 815 25 425Establishments with an average of�1 to 4 employees 6������������������������������������������������������� a D D D5 to 9 employees 1������������������������������������������������������� a D D D10 to 19 employees 1����������������������������������������������������� a D D D20 to 49 employees 1����������������������������������������������������� b D D D50 to 99 employees 1����������������������������������������������������� b D D D100 to 249 employees 1�������������������������������������������������� c D D D250 to 499 employees 1�������������������������������������������������� e D D D500 employees or more –������������������������������������������������� – – – –
Sabana Grande Municipio, PR
All establishments 11���������������������������������������������� 1 536 30 011 138 758 203 393Establishments with an average of�1 to 4 employees 3������������������������������������������������������� a D D D5 to 9 employees 2������������������������������������������������������� a D D D10 to 19 employees 1����������������������������������������������������� a D D D20 to 49 employees 1����������������������������������������������������� b D D D50 to 99 employees 1����������������������������������������������������� b D D D100 to 249 employees 1�������������������������������������������������� c D D D250 to 499 employees 1�������������������������������������������������� e D D D500 employees or more 1������������������������������������������������� f D D D
San Germán Municipio, PR
All establishments 17���������������������������������������������� 1 267 32 786 69 937 203 366Establishments with an average of�1 to 4 employees 6������������������������������������������������������� a D D D5 to 9 employees 5������������������������������������������������������� b D D D10 to 19 employees 1����������������������������������������������������� a D D D20 to 49 employees –����������������������������������������������������� – – – –50 to 99 employees –����������������������������������������������������� – – – –100 to 249 employees 4�������������������������������������������������� 621 20 982 –16 095 91 322250 to 499 employees –�������������������������������������������������� – – – –500 employees or more 1������������������������������������������������� f D D D
PONCE�YAUCO�COAMO, PR COMBINED STATISTICAL AREA
All establishments 213����������������������������������������������r12 680 256 071 1 114 164 2 164 083
Establishments with an average of�1 to 4 employees 67������������������������������������������������������� c D D D5 to 9 employees 36������������������������������������������������������� 255 3 469 13 072 34 86910 to 19 employees 36����������������������������������������������������� 505 5 846 24 786 43 16120 to 49 employees 39����������������������������������������������������� 1 157 17 691 87 821 284 22950 to 99 employees 9����������������������������������������������������� 700 14 595 55 666 84 798100 to 249 employees r13��������������������������������������������������
r2 267 r50 849 r363 715 r556 224250 to 499 employees 8�������������������������������������������������� h D D D500 employees or more r5�������������������������������������������������
r4 478 r77 883 r211 967 r442 232
Coamo, PR Micropolitan Statistical Area
All establishments 16���������������������������������������������� 1 431 23 153 59 358 177 205Establishments with an average of�1 to 4 employees 6������������������������������������������������������� a D D D5 to 9 employees 3������������������������������������������������������� a D D D10 to 19 employees 1����������������������������������������������������� a D D D20 to 49 employees 2����������������������������������������������������� b D D D50 to 99 employees –����������������������������������������������������� – – – –100 to 249 employees 2�������������������������������������������������� e D D D250 to 499 employees 1�������������������������������������������������� e D D D500 employees or more 1������������������������������������������������� f D D D
Coamo Municipio, PR
All establishments 16���������������������������������������������� 1 431 23 153 59 358 177 205Establishments with an average of�1 to 4 employees 6������������������������������������������������������� a D D D5 to 9 employees 3������������������������������������������������������� a D D D10 to 19 employees 1����������������������������������������������������� a D D D20 to 49 employees 2����������������������������������������������������� b D D D50 to 99 employees –����������������������������������������������������� – – – –100 to 249 employees 2�������������������������������������������������� e D D D250 to 499 employees 1�������������������������������������������������� e D D D500 employees or more 1������������������������������������������������� f D D D
Ponce, PR Metropolitan Statistical Area
All establishments 140����������������������������������������������r9 101 186 499 895 999 1 551 665
Establishments with an average of�1 to 4 employees 42������������������������������������������������������� b D D D5 to 9 employees 22������������������������������������������������������� 163 2 281 9 932 25 99010 to 19 employees 25����������������������������������������������������� 360 4 061 12 586 24 95920 to 49 employees 28����������������������������������������������������� f D D D50 to 99 employees 6����������������������������������������������������� 433 8 625 23 726 37 234100 to 249 employees 7�������������������������������������������������� 1 164 29 087 310 723 405 559250 to 499 employees r7�������������������������������������������������� h D D D500 employees or more r3������������������������������������������������� h D D D
See footnotes at end of table.
2002 Economic Census of Island Areas Puerto Rico–Manufacturing 43U.S. Census Bureau, 2002 Economic Census

Table 11. Selected Statistics by Employment Size of Establishments for Puerto Rico,Metropolitan Areas, and Municipios: 2002�Con.
[Includes only establishments of firms with payroll. For meaning of abbreviations and symbols, see introductory text. For explanation of terms, see Appendix A. For definitions and hierarchy ofmetropolitan statistical areas (CSAs, MSAs, and municipios), see Appendix E. Data based on the 2002 Economic Census. For information on confidentiality protection, sampling error, nonsamplingerror, and definitions, see note at the end of the table]
Geographic area and employment size of establishment
All employees1
Estab�lishments(number)
Total(number)
Payroll($1,000)
Valueadded by
manufacture($1,000)
Value ofshipments
($1,000)
PONCE�YAUCO�COAMO, PR COMBINED STATISTICAL AREA�Con.
Ponce, PR Metropolitan Statistical Area�Con.
Juana Díaz Municipio, PR
All establishments 17���������������������������������������������� h D D DEstablishments with an average of�1 to 4 employees 5������������������������������������������������������� 10 74 294 6085 to 9 employees 4������������������������������������������������������� b D D D10 to 19 employees 3����������������������������������������������������� b D D D20 to 49 employees 3����������������������������������������������������� b D D D50 to 99 employees –����������������������������������������������������� – – – –100 to 249 employees –�������������������������������������������������� – – – –250 to 499 employees –�������������������������������������������������� – – – –500 employees or more 2������������������������������������������������� h D D D
Ponce Municipio, PR
All establishments 116����������������������������������������������r5 790 135 292 731 893 1 304 715
Establishments with an average of�1 to 4 employees 35������������������������������������������������������� b D D D5 to 9 employees 17������������������������������������������������������� c D D D10 to 19 employees 20����������������������������������������������������� e D D D20 to 49 employees 25����������������������������������������������������� f D D D50 to 99 employees 6����������������������������������������������������� 433 8 625 23 726 37 234100 to 249 employees 6�������������������������������������������������� g D D D250 to 499 employees r6��������������������������������������������������
r2 370 r66 051 r252 910 r542 112500 employees or more r1������������������������������������������������� f D D D
Villalba Municipio, PR
All establishments 7���������������������������������������������� f D D DEstablishments with an average of�1 to 4 employees 2������������������������������������������������������� a D D D5 to 9 employees 1������������������������������������������������������� a D D D10 to 19 employees 2����������������������������������������������������� b D D D20 to 49 employees –����������������������������������������������������� – – – –50 to 99 employees –����������������������������������������������������� – – – –100 to 249 employees 1�������������������������������������������������� c D D D250 to 499 employees 1�������������������������������������������������� e D D D500 employees or more –������������������������������������������������� – – – –
Santa Isabel, PR Micropolitan Statistical Area
All establishments 7����������������������������������������������r1 221 27 891 61 519 150 153
Establishments with an average of�1 to 4 employees 2������������������������������������������������������� a D D D5 to 9 employees 1������������������������������������������������������� a D D D10 to 19 employees –����������������������������������������������������� – – – –20 to 49 employees –����������������������������������������������������� – – – –50 to 99 employees –����������������������������������������������������� – – – –100 to 249 employees r3�������������������������������������������������� f D D D250 to 499 employees r–�������������������������������������������������� a D D D500 employees or more 1������������������������������������������������� f D D D
Santa Isabel Municipio, PR
All establishments 7����������������������������������������������r1 221 27 891 61 519 150 153
Establishments with an average of�1 to 4 employees 2������������������������������������������������������� a D D D5 to 9 employees 1������������������������������������������������������� a D D D10 to 19 employees –����������������������������������������������������� – – – –20 to 49 employees –����������������������������������������������������� – – – –50 to 99 employees –����������������������������������������������������� – – – –100 to 249 employees r3�������������������������������������������������� f D D D250 to 499 employees r–�������������������������������������������������� a D D D500 employees or more 1������������������������������������������������� f D D D
Yauco, PR Metropolitan Statistical Area
All establishments 50���������������������������������������������� 927 18 528 97 288 285 060Establishments with an average of�1 to 4 employees 17������������������������������������������������������� b D D D5 to 9 employees 10������������������������������������������������������� 68 1 011 2 546 7 74310 to 19 employees 10����������������������������������������������������� c D D D20 to 49 employees 9����������������������������������������������������� 287 6 302 43 172 196 73850 to 99 employees 3����������������������������������������������������� 267 5 970 31 940 47 564100 to 249 employees 1�������������������������������������������������� c D D D250 to 499 employees –�������������������������������������������������� – – – –500 employees or more –������������������������������������������������� – – – –
Guánica Municipio, PR
All establishments 6���������������������������������������������� 204 4 265 27 777 41 073Establishments with an average of�1 to 4 employees –������������������������������������������������������� – – – –5 to 9 employees 1������������������������������������������������������� a D D D10 to 19 employees 1����������������������������������������������������� a D D D20 to 49 employees 3����������������������������������������������������� c D D D50 to 99 employees 1����������������������������������������������������� b D D D100 to 249 employees –�������������������������������������������������� – – – –250 to 499 employees –�������������������������������������������������� – – – –500 employees or more –������������������������������������������������� – – – –
See footnotes at end of table.
44 Puerto Rico–Manufacturing 2002 Economic Census of Island AreasU.S. Census Bureau, 2002 Economic Census

Table 11. Selected Statistics by Employment Size of Establishments for Puerto Rico,Metropolitan Areas, and Municipios: 2002�Con.
[Includes only establishments of firms with payroll. For meaning of abbreviations and symbols, see introductory text. For explanation of terms, see Appendix A. For definitions and hierarchy ofmetropolitan statistical areas (CSAs, MSAs, and municipios), see Appendix E. Data based on the 2002 Economic Census. For information on confidentiality protection, sampling error, nonsamplingerror, and definitions, see note at the end of the table]
Geographic area and employment size of establishment
All employees1
Estab�lishments(number)
Total(number)
Payroll($1,000)
Valueadded by
manufacture($1,000)
Value ofshipments
($1,000)
PONCE�YAUCO�COAMO, PR COMBINED STATISTICAL AREA�Con.
Yauco, PR Metropolitan Statistical Area�Con.
Guayanilla Municipio, PR
All establishments 6���������������������������������������������� 91 2 478 25 013 31 734Establishments with an average of�1 to 4 employees 1������������������������������������������������������� a D D D5 to 9 employees 2������������������������������������������������������� a D D D10 to 19 employees 1����������������������������������������������������� a D D D20 to 49 employees 2����������������������������������������������������� b D D D50 to 99 employees –����������������������������������������������������� – – – –100 to 249 employees –�������������������������������������������������� – – – –250 to 499 employees –�������������������������������������������������� – – – –500 employees or more –������������������������������������������������� – – – –
Peñuelas Municipio, PR
All establishments 11���������������������������������������������� 152 3 436 20 528 175 913Establishments with an average of�1 to 4 employees 5������������������������������������������������������� a D D D5 to 9 employees 1������������������������������������������������������� a D D D10 to 19 employees 1����������������������������������������������������� a D D D20 to 49 employees 4����������������������������������������������������� c D D D50 to 99 employees –����������������������������������������������������� – – – –100 to 249 employees –�������������������������������������������������� – – – –250 to 499 employees –�������������������������������������������������� – – – –500 employees or more –������������������������������������������������� – – – –
Yauco Municipio, PR
All establishments 27���������������������������������������������� 480 8 349 23 970 36 340Establishments with an average of�1 to 4 employees 11������������������������������������������������������� b D D D5 to 9 employees 6������������������������������������������������������� b D D D10 to 19 employees 7����������������������������������������������������� 96 649 5 138 4 12720 to 49 employees –����������������������������������������������������� – – – –50 to 99 employees 2����������������������������������������������������� c D D D100 to 249 employees 1�������������������������������������������������� c D D D250 to 499 employees –�������������������������������������������������� – – – –500 employees or more –������������������������������������������������� – – – –
SAN JUAN�CAGUAS�FAJARDO, PR COMBINED STATISTICALAREA
All establishments 1 583����������������������������������������������r82 445 r2 179 321 34 837 834 44 529 697
Establishments with an average of�1 to 4 employees 459������������������������������������������������������� 1 073 13 596 65 524 101 7845 to 9 employees r240�������������������������������������������������������
r1 650 r21 742 r107 155 r197 33310 to 19 employees r279�����������������������������������������������������
r3 911 r57 812 r220 902 r428 80820 to 49 employees r287�����������������������������������������������������
r8 958 r161 887 r828 985 r1 475 40950 to 99 employees 144����������������������������������������������������� 9 850 184 730 887 280 1 825 696100 to 249 employees 92�������������������������������������������������� 14 632 383 706 6 322 585 8 178 712250 to 499 employees r56��������������������������������������������������
r19 809 r496 809 r8 389 214 r11 361 196500 employees or more r26�������������������������������������������������
r22 562 r859 039 r18 016 189 r20 960 759
Fajardo, PR Metropolitan Statistical Area
All establishments 37���������������������������������������������� 1 906 38 616 282 997 397 809Establishments with an average of�1 to 4 employees 14������������������������������������������������������� b D D D5 to 9 employees 4������������������������������������������������������� b D D D10 to 19 employees 4����������������������������������������������������� b D D D20 to 49 employees 5����������������������������������������������������� c D D D50 to 99 employees 4����������������������������������������������������� e D D D100 to 249 employees 4�������������������������������������������������� 757 16 105 57 244 92 355250 to 499 employees 2�������������������������������������������������� f D D D500 employees or more –������������������������������������������������� – – – –
Ceiba Municipio, PR
All establishments 7���������������������������������������������� 75 858 3 540 6 958Establishments with an average of�1 to 4 employees 4������������������������������������������������������� 14 104 461 5625 to 9 employees 1������������������������������������������������������� a D D D10 to 19 employees 1����������������������������������������������������� a D D D20 to 49 employees 1����������������������������������������������������� b D D D50 to 99 employees –����������������������������������������������������� – – – –100 to 249 employees –�������������������������������������������������� – – – –250 to 499 employees –�������������������������������������������������� – – – –500 employees or more –������������������������������������������������� – – – –
Fajardo Municipio, PR
All establishments 20���������������������������������������������� 1 569 32 693 265 489 365 905Establishments with an average of�1 to 4 employees 5������������������������������������������������������� 15 181 565 1 0215 to 9 employees 3������������������������������������������������������� b D D D10 to 19 employees 1����������������������������������������������������� a D D D20 to 49 employees 3����������������������������������������������������� b D D D50 to 99 employees 3����������������������������������������������������� c D D D100 to 249 employees 3�������������������������������������������������� f D D D250 to 499 employees 2�������������������������������������������������� f D D D500 employees or more –������������������������������������������������� – – – –
See footnotes at end of table.
2002 Economic Census of Island Areas Puerto Rico–Manufacturing 45U.S. Census Bureau, 2002 Economic Census

Table 11. Selected Statistics by Employment Size of Establishments for Puerto Rico,Metropolitan Areas, and Municipios: 2002�Con.
[Includes only establishments of firms with payroll. For meaning of abbreviations and symbols, see introductory text. For explanation of terms, see Appendix A. For definitions and hierarchy ofmetropolitan statistical areas (CSAs, MSAs, and municipios), see Appendix E. Data based on the 2002 Economic Census. For information on confidentiality protection, sampling error, nonsamplingerror, and definitions, see note at the end of the table]
Geographic area and employment size of establishment
All employees1
Estab�lishments(number)
Total(number)
Payroll($1,000)
Valueadded by
manufacture($1,000)
Value ofshipments
($1,000)
SAN JUAN�CAGUAS�FAJARDO, PR COMBINED STATISTICALAREA�Con.
Fajardo, PR Metropolitan Statistical Area�Con.
Luquillo Municipio, PR
All establishments 10���������������������������������������������� 262 5 065 13 968 24 946Establishments with an average of�1 to 4 employees 5������������������������������������������������������� a D D D5 to 9 employees –������������������������������������������������������� – – – –10 to 19 employees 2����������������������������������������������������� b D D D20 to 49 employees 1����������������������������������������������������� b D D D50 to 99 employees 1����������������������������������������������������� b D D D100 to 249 employees 1�������������������������������������������������� c D D D250 to 499 employees –�������������������������������������������������� – – – –500 employees or more –������������������������������������������������� – – – –
San Juan�Caguas�Guaynabo, PR Metropolitan Statistical Area
All establishments 1 537����������������������������������������������r80 411 r2 139 212 34 551 723 44 124 883
Establishments with an average of�1 to 4 employees 441������������������������������������������������������� g D D D5 to 9 employees r236������������������������������������������������������� g D D D10 to 19 employees r273�����������������������������������������������������
r3 832 r56 864 r217 638 r422 73220 to 49 employees r280�����������������������������������������������������
r8 776 r159 913 r822 252 r1 463 44550 to 99 employees 139����������������������������������������������������� 9 526 180 269 874 517 1 804 180100 to 249 employees 88�������������������������������������������������� 13 875 367 601 6 265 341 8 086 357250 to 499 employees r54�������������������������������������������������� j D D D500 employees or more r26�������������������������������������������������
r22 562 r859 039 r18 016 189 r20 960 759
Aguas Buenas Municipio, PR
All establishments 7���������������������������������������������� 151 1 828 5 647 9 327Establishments with an average of�1 to 4 employees 2������������������������������������������������������� a D D D5 to 9 employees –������������������������������������������������������� – – – –10 to 19 employees 1����������������������������������������������������� a D D D20 to 49 employees 4����������������������������������������������������� 124 1 480 4 734 7 90450 to 99 employees –����������������������������������������������������� – – – –100 to 249 employees –�������������������������������������������������� – – – –250 to 499 employees –�������������������������������������������������� – – – –500 employees or more –������������������������������������������������� – – – –
Aibonito Municipio, PR
All establishments 16����������������������������������������������r2 184 46 737 223 902 292 483
Establishments with an average of�1 to 4 employees 4������������������������������������������������������� 16 124 397 7515 to 9 employees 3������������������������������������������������������� b D D D10 to 19 employees 4����������������������������������������������������� 54 417 250 1 15720 to 49 employees 1����������������������������������������������������� b D D D50 to 99 employees 1����������������������������������������������������� b D D D100 to 249 employees –�������������������������������������������������� – – – –250 to 499 employees r2�������������������������������������������������� f D D D500 employees or more r1������������������������������������������������� g D D D
Arecibo Municipio, PR
All establishments 52���������������������������������������������� 3 436 98 752 903 535 1 223 435Establishments with an average of�1 to 4 employees 16������������������������������������������������������� 31 278 1 838 2 4145 to 9 employees 10������������������������������������������������������� 71 681 2 756 4 50910 to 19 employees 9����������������������������������������������������� 117 1 229 5 511 10 75720 to 49 employees 8����������������������������������������������������� 290 5 149 17 593 30 20150 to 99 employees 3����������������������������������������������������� 205 3 149 15 670 20 004100 to 249 employees 2�������������������������������������������������� c D D D250 to 499 employees 2�������������������������������������������������� f D D D500 employees or more 2������������������������������������������������� g D D D
Barceloneta Municipio, PR
All establishments 14���������������������������������������������� 6 104 299 891 9 059 189 9 913 096Establishments with an average of�1 to 4 employees 2������������������������������������������������������� a D D D5 to 9 employees 1������������������������������������������������������� a D D D10 to 19 employees 1����������������������������������������������������� a D D D20 to 49 employees 2����������������������������������������������������� b D D D50 to 99 employees –����������������������������������������������������� – – – –100 to 249 employees 2�������������������������������������������������� e D D D250 to 499 employees 2�������������������������������������������������� f D D D500 employees or more 4������������������������������������������������� 4 960 230 073 7 842 796 8 453 161
Barranquitas Municipio, PR
All establishments 10���������������������������������������������� 70 1 158 8 637 13 261Establishments with an average of�1 to 4 employees 5������������������������������������������������������� a D D D5 to 9 employees 3������������������������������������������������������� 16 137 884 1 66810 to 19 employees 1����������������������������������������������������� a D D D20 to 49 employees 1����������������������������������������������������� b D D D50 to 99 employees –����������������������������������������������������� – – – –100 to 249 employees –�������������������������������������������������� – – – –250 to 499 employees –�������������������������������������������������� – – – –500 employees or more –������������������������������������������������� – – – –
See footnotes at end of table.
46 Puerto Rico–Manufacturing 2002 Economic Census of Island AreasU.S. Census Bureau, 2002 Economic Census
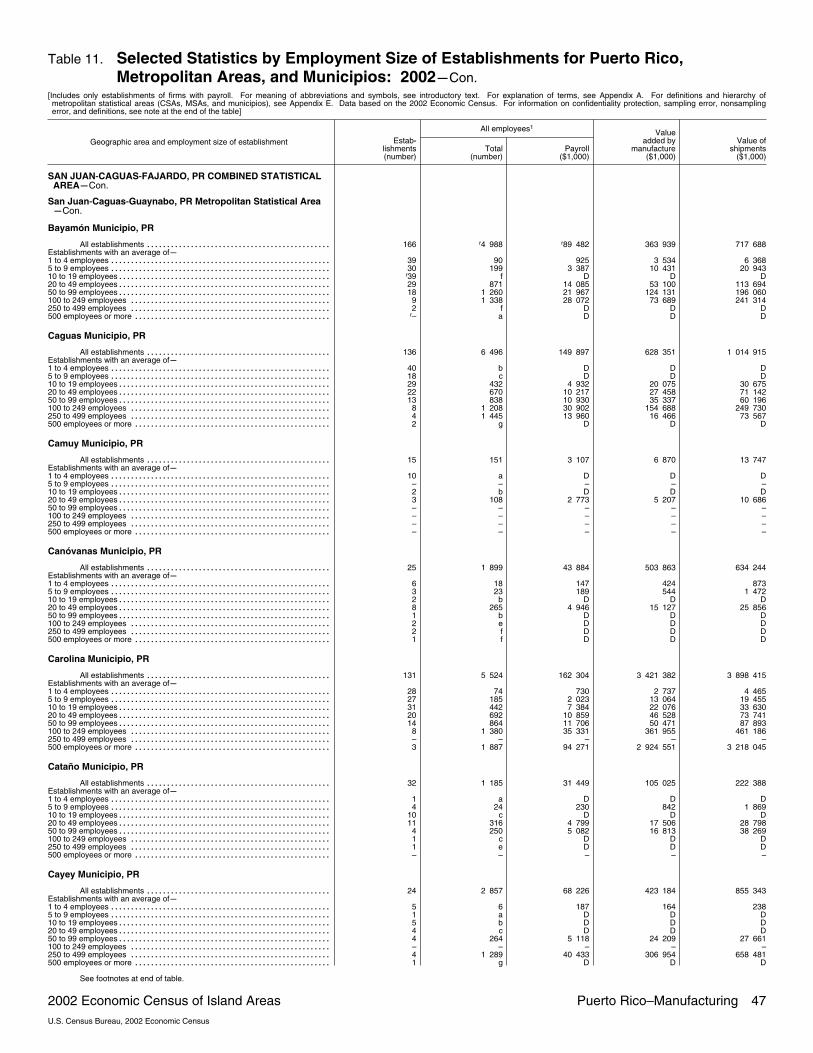
Table 11. Selected Statistics by Employment Size of Establishments for Puerto Rico,Metropolitan Areas, and Municipios: 2002�Con.
[Includes only establishments of firms with payroll. For meaning of abbreviations and symbols, see introductory text. For explanation of terms, see Appendix A. For definitions and hierarchy ofmetropolitan statistical areas (CSAs, MSAs, and municipios), see Appendix E. Data based on the 2002 Economic Census. For information on confidentiality protection, sampling error, nonsamplingerror, and definitions, see note at the end of the table]
Geographic area and employment size of establishment
All employees1
Estab�lishments(number)
Total(number)
Payroll($1,000)
Valueadded by
manufacture($1,000)
Value ofshipments
($1,000)
SAN JUAN�CAGUAS�FAJARDO, PR COMBINED STATISTICALAREA�Con.
San Juan�Caguas�Guaynabo, PR Metropolitan Statistical Area�Con.
Bayamón Municipio, PR
All establishments 166����������������������������������������������r4 988 r89 482 363 939 717 688
Establishments with an average of�1 to 4 employees 39������������������������������������������������������� 90 925 3 534 6 3685 to 9 employees 30������������������������������������������������������� 199 3 387 10 431 20 94310 to 19 employees r39����������������������������������������������������� f D D D20 to 49 employees 29����������������������������������������������������� 871 14 085 53 100 113 69450 to 99 employees 18����������������������������������������������������� 1 260 21 967 124 131 196 060100 to 249 employees 9�������������������������������������������������� 1 338 28 072 73 689 241 314250 to 499 employees 2�������������������������������������������������� f D D D500 employees or more r–������������������������������������������������� a D D D
Caguas Municipio, PR
All establishments 136���������������������������������������������� 6 496 149 897 628 351 1 014 915Establishments with an average of�1 to 4 employees 40������������������������������������������������������� b D D D5 to 9 employees 18������������������������������������������������������� c D D D10 to 19 employees 29����������������������������������������������������� 432 4 932 20 075 30 67520 to 49 employees 22����������������������������������������������������� 670 10 217 27 458 71 14250 to 99 employees 13����������������������������������������������������� 838 10 930 35 337 60 196100 to 249 employees 8�������������������������������������������������� 1 208 30 902 154 688 249 730250 to 499 employees 4�������������������������������������������������� 1 445 13 960 16 466 73 567500 employees or more 2������������������������������������������������� g D D D
Camuy Municipio, PR
All establishments 15���������������������������������������������� 151 3 107 6 870 13 747Establishments with an average of�1 to 4 employees 10������������������������������������������������������� a D D D5 to 9 employees –������������������������������������������������������� – – – –10 to 19 employees 2����������������������������������������������������� b D D D20 to 49 employees 3����������������������������������������������������� 108 2 773 5 207 10 68650 to 99 employees –����������������������������������������������������� – – – –100 to 249 employees –�������������������������������������������������� – – – –250 to 499 employees –�������������������������������������������������� – – – –500 employees or more –������������������������������������������������� – – – –
Canóvanas Municipio, PR
All establishments 25���������������������������������������������� 1 899 43 884 503 863 634 244Establishments with an average of�1 to 4 employees 6������������������������������������������������������� 18 147 424 8735 to 9 employees 3������������������������������������������������������� 23 189 544 1 47210 to 19 employees 2����������������������������������������������������� b D D D20 to 49 employees 8����������������������������������������������������� 265 4 946 15 127 25 85650 to 99 employees 1����������������������������������������������������� b D D D100 to 249 employees 2�������������������������������������������������� e D D D250 to 499 employees 2�������������������������������������������������� f D D D500 employees or more 1������������������������������������������������� f D D D
Carolina Municipio, PR
All establishments 131���������������������������������������������� 5 524 162 304 3 421 382 3 898 415Establishments with an average of�1 to 4 employees 28������������������������������������������������������� 74 730 2 737 4 4655 to 9 employees 27������������������������������������������������������� 185 2 023 13 064 19 45510 to 19 employees 31����������������������������������������������������� 442 7 384 22 076 33 63020 to 49 employees 20����������������������������������������������������� 692 10 859 46 528 73 74150 to 99 employees 14����������������������������������������������������� 864 11 706 50 471 87 893100 to 249 employees 8�������������������������������������������������� 1 380 35 331 361 955 461 186250 to 499 employees –�������������������������������������������������� – – – –500 employees or more 3������������������������������������������������� 1 887 94 271 2 924 551 3 218 045
Cataño Municipio, PR
All establishments 32���������������������������������������������� 1 185 31 449 105 025 222 388Establishments with an average of�1 to 4 employees 1������������������������������������������������������� a D D D5 to 9 employees 4������������������������������������������������������� 24 230 842 1 86910 to 19 employees 10����������������������������������������������������� c D D D20 to 49 employees 11����������������������������������������������������� 316 4 799 17 506 28 79850 to 99 employees 4����������������������������������������������������� 250 5 082 16 813 38 269100 to 249 employees 1�������������������������������������������������� c D D D250 to 499 employees 1�������������������������������������������������� e D D D500 employees or more –������������������������������������������������� – – – –
Cayey Municipio, PR
All establishments 24���������������������������������������������� 2 857 68 226 423 184 855 343Establishments with an average of�1 to 4 employees 5������������������������������������������������������� 6 187 164 2385 to 9 employees 1������������������������������������������������������� a D D D10 to 19 employees 5����������������������������������������������������� b D D D20 to 49 employees 4����������������������������������������������������� c D D D50 to 99 employees 4����������������������������������������������������� 264 5 118 24 209 27 661100 to 249 employees –�������������������������������������������������� – – – –250 to 499 employees 4�������������������������������������������������� 1 289 40 433 306 954 658 481500 employees or more 1������������������������������������������������� g D D D
See footnotes at end of table.
2002 Economic Census of Island Areas Puerto Rico–Manufacturing 47U.S. Census Bureau, 2002 Economic Census
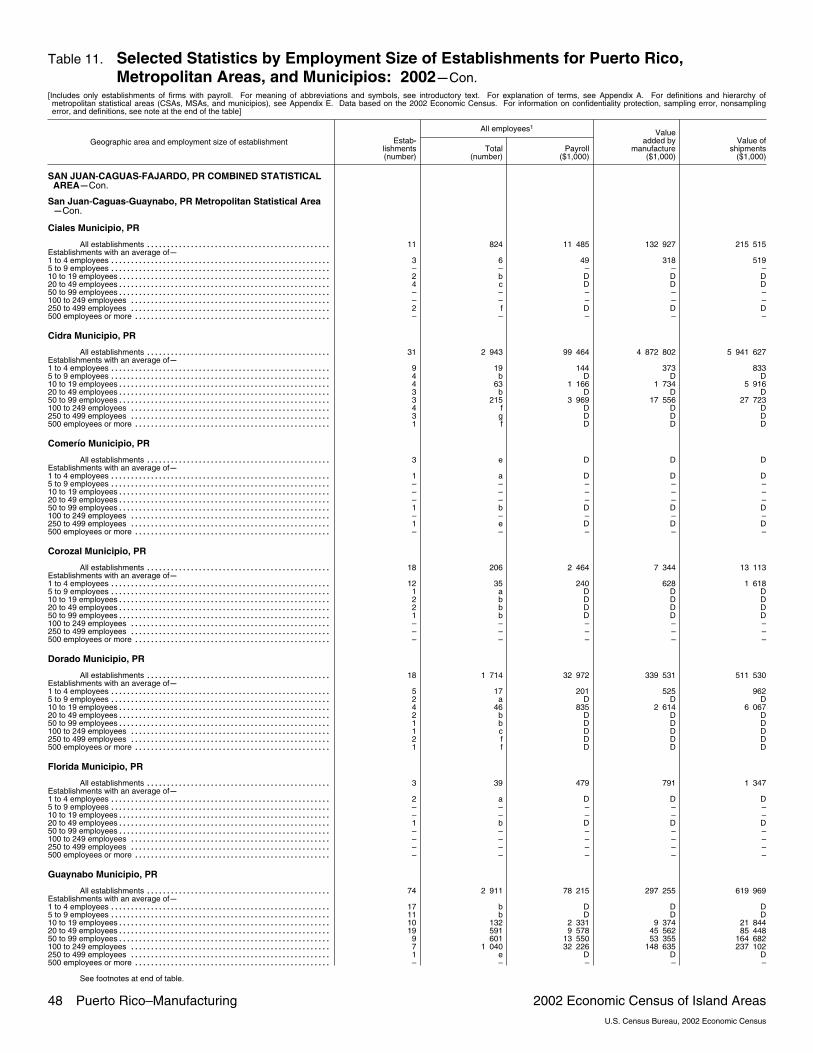
Table 11. Selected Statistics by Employment Size of Establishments for Puerto Rico,Metropolitan Areas, and Municipios: 2002�Con.
[Includes only establishments of firms with payroll. For meaning of abbreviations and symbols, see introductory text. For explanation of terms, see Appendix A. For definitions and hierarchy ofmetropolitan statistical areas (CSAs, MSAs, and municipios), see Appendix E. Data based on the 2002 Economic Census. For information on confidentiality protection, sampling error, nonsamplingerror, and definitions, see note at the end of the table]
Geographic area and employment size of establishment
All employees1
Estab�lishments(number)
Total(number)
Payroll($1,000)
Valueadded by
manufacture($1,000)
Value ofshipments
($1,000)
SAN JUAN�CAGUAS�FAJARDO, PR COMBINED STATISTICALAREA�Con.
San Juan�Caguas�Guaynabo, PR Metropolitan Statistical Area�Con.
Ciales Municipio, PR
All establishments 11���������������������������������������������� 824 11 485 132 927 215 515Establishments with an average of�1 to 4 employees 3������������������������������������������������������� 6 49 318 5195 to 9 employees –������������������������������������������������������� – – – –10 to 19 employees 2����������������������������������������������������� b D D D20 to 49 employees 4����������������������������������������������������� c D D D50 to 99 employees –����������������������������������������������������� – – – –100 to 249 employees –�������������������������������������������������� – – – –250 to 499 employees 2�������������������������������������������������� f D D D500 employees or more –������������������������������������������������� – – – –
Cidra Municipio, PR
All establishments 31���������������������������������������������� 2 943 99 464 4 872 802 5 941 627Establishments with an average of�1 to 4 employees 9������������������������������������������������������� 19 144 373 8335 to 9 employees 4������������������������������������������������������� b D D D10 to 19 employees 4����������������������������������������������������� 63 1 166 1 734 5 91620 to 49 employees 3����������������������������������������������������� b D D D50 to 99 employees 3����������������������������������������������������� 215 3 969 17 556 27 723100 to 249 employees 4�������������������������������������������������� f D D D250 to 499 employees 3�������������������������������������������������� g D D D500 employees or more 1������������������������������������������������� f D D D
Comerío Municipio, PR
All establishments 3���������������������������������������������� e D D DEstablishments with an average of�1 to 4 employees 1������������������������������������������������������� a D D D5 to 9 employees –������������������������������������������������������� – – – –10 to 19 employees –����������������������������������������������������� – – – –20 to 49 employees –����������������������������������������������������� – – – –50 to 99 employees 1����������������������������������������������������� b D D D100 to 249 employees –�������������������������������������������������� – – – –250 to 499 employees 1�������������������������������������������������� e D D D500 employees or more –������������������������������������������������� – – – –
Corozal Municipio, PR
All establishments 18���������������������������������������������� 206 2 464 7 344 13 113Establishments with an average of�1 to 4 employees 12������������������������������������������������������� 35 240 628 1 6185 to 9 employees 1������������������������������������������������������� a D D D10 to 19 employees 2����������������������������������������������������� b D D D20 to 49 employees 2����������������������������������������������������� b D D D50 to 99 employees 1����������������������������������������������������� b D D D100 to 249 employees –�������������������������������������������������� – – – –250 to 499 employees –�������������������������������������������������� – – – –500 employees or more –������������������������������������������������� – – – –
Dorado Municipio, PR
All establishments 18���������������������������������������������� 1 714 32 972 339 531 511 530Establishments with an average of�1 to 4 employees 5������������������������������������������������������� 17 201 525 9625 to 9 employees 2������������������������������������������������������� a D D D10 to 19 employees 4����������������������������������������������������� 46 835 2 614 6 06720 to 49 employees 2����������������������������������������������������� b D D D50 to 99 employees 1����������������������������������������������������� b D D D100 to 249 employees 1�������������������������������������������������� c D D D250 to 499 employees 2�������������������������������������������������� f D D D500 employees or more 1������������������������������������������������� f D D D
Florida Municipio, PR
All establishments 3���������������������������������������������� 39 479 791 1 347Establishments with an average of�1 to 4 employees 2������������������������������������������������������� a D D D5 to 9 employees –������������������������������������������������������� – – – –10 to 19 employees –����������������������������������������������������� – – – –20 to 49 employees 1����������������������������������������������������� b D D D50 to 99 employees –����������������������������������������������������� – – – –100 to 249 employees –�������������������������������������������������� – – – –250 to 499 employees –�������������������������������������������������� – – – –500 employees or more –������������������������������������������������� – – – –
Guaynabo Municipio, PR
All establishments 74���������������������������������������������� 2 911 78 215 297 255 619 969Establishments with an average of�1 to 4 employees 17������������������������������������������������������� b D D D5 to 9 employees 11������������������������������������������������������� b D D D10 to 19 employees 10����������������������������������������������������� 132 2 331 9 374 21 84420 to 49 employees 19����������������������������������������������������� 591 9 578 45 562 85 44850 to 99 employees 9����������������������������������������������������� 601 13 550 53 355 164 682100 to 249 employees 7�������������������������������������������������� 1 040 32 226 148 635 237 102250 to 499 employees 1�������������������������������������������������� e D D D500 employees or more –������������������������������������������������� – – – –
See footnotes at end of table.
48 Puerto Rico–Manufacturing 2002 Economic Census of Island AreasU.S. Census Bureau, 2002 Economic Census

Table 11. Selected Statistics by Employment Size of Establishments for Puerto Rico,Metropolitan Areas, and Municipios: 2002�Con.
[Includes only establishments of firms with payroll. For meaning of abbreviations and symbols, see introductory text. For explanation of terms, see Appendix A. For definitions and hierarchy ofmetropolitan statistical areas (CSAs, MSAs, and municipios), see Appendix E. Data based on the 2002 Economic Census. For information on confidentiality protection, sampling error, nonsamplingerror, and definitions, see note at the end of the table]
Geographic area and employment size of establishment
All employees1
Estab�lishments(number)
Total(number)
Payroll($1,000)
Valueadded by
manufacture($1,000)
Value ofshipments
($1,000)
SAN JUAN�CAGUAS�FAJARDO, PR COMBINED STATISTICALAREA�Con.
San Juan�Caguas�Guaynabo, PR Metropolitan Statistical Area�Con.
Gurabo Municipio, PR
All establishments 28����������������������������������������������r1 915 42 632 260 732 858 711
Establishments with an average of�1 to 4 employees 7������������������������������������������������������� a D D D5 to 9 employees 5������������������������������������������������������� 30 578 1 363 3 68810 to 19 employees 3����������������������������������������������������� 44 355 1 913 3 92020 to 49 employees 7����������������������������������������������������� 210 2 338 9 608 14 38450 to 99 employees 2����������������������������������������������������� c D D D100 to 249 employees –�������������������������������������������������� – – – –250 to 499 employees r4�������������������������������������������������� g D D D500 employees or more r–������������������������������������������������� a D D D
Hatillo Municipio, PR
All establishments 28���������������������������������������������� 602 9 593 36 633 78 629Establishments with an average of�1 to 4 employees 11������������������������������������������������������� 32 194 538 1 6405 to 9 employees 6������������������������������������������������������� 45 530 3 604 7 83610 to 19 employees 2����������������������������������������������������� b D D D20 to 49 employees 5����������������������������������������������������� 189 2 764 10 167 18 94450 to 99 employees 3����������������������������������������������������� c D D D100 to 249 employees 1�������������������������������������������������� c D D D250 to 499 employees –�������������������������������������������������� – – – –500 employees or more –������������������������������������������������� – – – –
Humacao Municipio, PR
All establishments 42����������������������������������������������r3 355 80 939 466 355 814 608
Establishments with an average of�1 to 4 employees 8������������������������������������������������������� 16 87 352 7495 to 9 employees r5�������������������������������������������������������
r33 r566 r13 593 r18 86410 to 19 employees 7����������������������������������������������������� 91 3 419 22 539 81 62920 to 49 employees r10�����������������������������������������������������
r351 r6 463 r66 012 r103 09750 to 99 employees 3����������������������������������������������������� c D D D100 to 249 employees 5�������������������������������������������������� 943 28 096 214 039 351 498250 to 499 employees r3��������������������������������������������������
r967 r26 264 r100 764 r170 469500 employees or more r1������������������������������������������������� f D D D
Juncos Municipio, PR
All establishments 24���������������������������������������������� 2 261 88 173 5 654 324 6 028 342Establishments with an average of�1 to 4 employees 6������������������������������������������������������� 18 178 378 6865 to 9 employees 2������������������������������������������������������� a D D D10 to 19 employees 3����������������������������������������������������� b D D D20 to 49 employees 3����������������������������������������������������� b D D D50 to 99 employees 4����������������������������������������������������� c D D D100 to 249 employees 2�������������������������������������������������� e D D D250 to 499 employees 4�������������������������������������������������� g D D D500 employees or more –������������������������������������������������� – – – –
Las Piedras Municipio, PR
All establishments 24���������������������������������������������� 3 517 117 779 1 377 154 1 865 510Establishments with an average of�1 to 4 employees 5������������������������������������������������������� 12 99 538 5925 to 9 employees 1������������������������������������������������������� a D D D10 to 19 employees 3����������������������������������������������������� b D D D20 to 49 employees 3����������������������������������������������������� 104 782 1 487 3 51150 to 99 employees 4����������������������������������������������������� 307 12 398 57 269 94 127100 to 249 employees 3�������������������������������������������������� 472 8 178 108 408 162 068250 to 499 employees 2�������������������������������������������������� f D D D500 employees or more 3������������������������������������������������� 1 904 74 228 1 099 517 1 409 845
Loíza Municipio, PR
All establishments 4���������������������������������������������� 95 1 844 4 846 7 823Establishments with an average of�1 to 4 employees –������������������������������������������������������� – – – –5 to 9 employees –������������������������������������������������������� – – – –10 to 19 employees 2����������������������������������������������������� b D D D20 to 49 employees 2����������������������������������������������������� b D D D50 to 99 employees –����������������������������������������������������� – – – –100 to 249 employees –�������������������������������������������������� – – – –250 to 499 employees –�������������������������������������������������� – – – –500 employees or more –������������������������������������������������� – – – –
Manatí Municipio, PR
All establishments 28���������������������������������������������� 4 133 146 025 1 370 910 2 553 865Establishments with an average of�1 to 4 employees 7������������������������������������������������������� 11 165 876 1 4505 to 9 employees 3������������������������������������������������������� b D D D10 to 19 employees 4����������������������������������������������������� 56 899 2 482 5 71120 to 49 employees 2����������������������������������������������������� b D D D50 to 99 employees 2����������������������������������������������������� c D D D100 to 249 employees 4�������������������������������������������������� 639 24 312 499 752 843 396250 to 499 employees 5�������������������������������������������������� 1 910 57 579 598 793 1 313 456500 employees or more 1������������������������������������������������� g D D D
See footnotes at end of table.
2002 Economic Census of Island Areas Puerto Rico–Manufacturing 49U.S. Census Bureau, 2002 Economic Census

Table 11. Selected Statistics by Employment Size of Establishments for Puerto Rico,Metropolitan Areas, and Municipios: 2002�Con.
[Includes only establishments of firms with payroll. For meaning of abbreviations and symbols, see introductory text. For explanation of terms, see Appendix A. For definitions and hierarchy ofmetropolitan statistical areas (CSAs, MSAs, and municipios), see Appendix E. Data based on the 2002 Economic Census. For information on confidentiality protection, sampling error, nonsamplingerror, and definitions, see note at the end of the table]
Geographic area and employment size of establishment
All employees1
Estab�lishments(number)
Total(number)
Payroll($1,000)
Valueadded by
manufacture($1,000)
Value ofshipments
($1,000)
SAN JUAN�CAGUAS�FAJARDO, PR COMBINED STATISTICALAREA�Con.
San Juan�Caguas�Guaynabo, PR Metropolitan Statistical Area�Con.
Maunabo Municipio, PR
All establishments 1���������������������������������������������� a D D DEstablishments with an average of�1 to 4 employees –������������������������������������������������������� – – – –5 to 9 employees 1������������������������������������������������������� a D D D10 to 19 employees –����������������������������������������������������� – – – –20 to 49 employees –����������������������������������������������������� – – – –50 to 99 employees –����������������������������������������������������� – – – –100 to 249 employees –�������������������������������������������������� – – – –250 to 499 employees –�������������������������������������������������� – – – –500 employees or more –������������������������������������������������� – – – –
Morovis Municipio, PR
All establishments 7���������������������������������������������� 264 3 302 6 620 15 638Establishments with an average of�1 to 4 employees 2������������������������������������������������������� a D D D5 to 9 employees –������������������������������������������������������� – – – –10 to 19 employees 1����������������������������������������������������� a D D D20 to 49 employees 3����������������������������������������������������� 95 1 346 4 314 10 47350 to 99 employees –����������������������������������������������������� – – – –100 to 249 employees 1�������������������������������������������������� c D D D250 to 499 employees –�������������������������������������������������� – – – –500 employees or more –������������������������������������������������� – – – –
Naguabo Municipio, PR
All establishments 13���������������������������������������������� 708 15 419 80 262 133 579Establishments with an average of�1 to 4 employees 3������������������������������������������������������� 6 40 125 2655 to 9 employees –������������������������������������������������������� – – – –10 to 19 employees 2����������������������������������������������������� b D D D20 to 49 employees 3����������������������������������������������������� 85 1 260 3 872 4 99550 to 99 employees 3����������������������������������������������������� 250 6 916 28 114 51 111100 to 249 employees 2�������������������������������������������������� e D D D250 to 499 employees –�������������������������������������������������� – – – –500 employees or more –������������������������������������������������� – – – –
Naranjito Municipio, PR
All establishments 15���������������������������������������������� 153 1 161 4 393 8 035Establishments with an average of�1 to 4 employees 6������������������������������������������������������� 15 138 553 8685 to 9 employees 1������������������������������������������������������� a D D D10 to 19 employees 6����������������������������������������������������� 84 722 2 959 5 77220 to 49 employees 2����������������������������������������������������� b D D D50 to 99 employees –����������������������������������������������������� – – – –100 to 249 employees –�������������������������������������������������� – – – –250 to 499 employees –�������������������������������������������������� – – – –500 employees or more –������������������������������������������������� – – – –
Orocovis Municipio, PR
All establishments 8���������������������������������������������� 29 281 965 3 524Establishments with an average of�1 to 4 employees 6������������������������������������������������������� a D D D5 to 9 employees 1������������������������������������������������������� a D D D10 to 19 employees 1����������������������������������������������������� a D D D20 to 49 employees –����������������������������������������������������� – – – –50 to 99 employees –����������������������������������������������������� – – – –100 to 249 employees –�������������������������������������������������� – – – –250 to 499 employees –�������������������������������������������������� – – – –500 employees or more –������������������������������������������������� – – – –
Quebradillas Municipio, PR
All establishments 15���������������������������������������������� 147 1 119 5 557 6 475Establishments with an average of�1 to 4 employees 8������������������������������������������������������� 15 112 645 1 4945 to 9 employees 3������������������������������������������������������� b D D D10 to 19 employees 1����������������������������������������������������� a D D D20 to 49 employees 3����������������������������������������������������� 97 744 2 913 3 44150 to 99 employees –����������������������������������������������������� – – – –100 to 249 employees –�������������������������������������������������� – – – –250 to 499 employees –�������������������������������������������������� – – – –500 employees or more –������������������������������������������������� – – – –
Río Grande Municipio, PR
All establishments 19���������������������������������������������� 1 199 23 644 108 454 188 882Establishments with an average of�1 to 4 employees 2������������������������������������������������������� a D D D5 to 9 employees 5������������������������������������������������������� 32 1 164 883 1 79810 to 19 employees 3����������������������������������������������������� 38 443 1 683 2 66020 to 49 employees 3����������������������������������������������������� b D D D50 to 99 employees 4����������������������������������������������������� 310 7 644 26 237 40 533100 to 249 employees –�������������������������������������������������� – – – –250 to 499 employees 2�������������������������������������������������� f D D D500 employees or more –������������������������������������������������� – – – –
See footnotes at end of table.
50 Puerto Rico–Manufacturing 2002 Economic Census of Island AreasU.S. Census Bureau, 2002 Economic Census

Table 11. Selected Statistics by Employment Size of Establishments for Puerto Rico,Metropolitan Areas, and Municipios: 2002�Con.
[Includes only establishments of firms with payroll. For meaning of abbreviations and symbols, see introductory text. For explanation of terms, see Appendix A. For definitions and hierarchy ofmetropolitan statistical areas (CSAs, MSAs, and municipios), see Appendix E. Data based on the 2002 Economic Census. For information on confidentiality protection, sampling error, nonsamplingerror, and definitions, see note at the end of the table]
Geographic area and employment size of establishment
All employees1
Estab�lishments(number)
Total(number)
Payroll($1,000)
Valueadded by
manufacture($1,000)
Value ofshipments
($1,000)
SAN JUAN�CAGUAS�FAJARDO, PR COMBINED STATISTICALAREA�Con.
San Juan�Caguas�Guaynabo, PR Metropolitan Statistical Area�Con.
San Juan Municipio, PR
All establishments 301���������������������������������������������� 7 487 128 878 549 474 1 196 973Establishments with an average of�1 to 4 employees 102������������������������������������������������������� 246 2 891 12 443 22 9945 to 9 employees 63������������������������������������������������������� 440 4 663 17 513 31 85010 to 19 employees 51����������������������������������������������������� 724 9 358 27 903 56 23120 to 49 employees 53����������������������������������������������������� 1 577 28 771 108 728 206 72450 to 99 employees 20����������������������������������������������������� 1 398 24 696 182 551 510 505100 to 249 employees 9�������������������������������������������������� 1 309 20 671 88 166 156 517250 to 499 employees 1�������������������������������������������������� e D D D500 employees or more 2������������������������������������������������� g D D D
San Lorenzo Municipio, PR
All establishments 24���������������������������������������������� 1 706 38 989 144 378 289 973Establishments with an average of�1 to 4 employees 9������������������������������������������������������� 20 210 703 1 1985 to 9 employees 3������������������������������������������������������� b D D D10 to 19 employees 5����������������������������������������������������� 67 731 982 3 57420 to 49 employees 3����������������������������������������������������� 84 964 6 291 10 61550 to 99 employees 1����������������������������������������������������� b D D D100 to 249 employees 1�������������������������������������������������� c D D D250 to 499 employees 1�������������������������������������������������� e D D D500 employees or more 1������������������������������������������������� f D D D
Toa Alta Municipio, PR
All establishments 24���������������������������������������������� 645 7 960 29 564 72 555Establishments with an average of�1 to 4 employees 6������������������������������������������������������� 22 185 1 103 1 8515 to 9 employees 3������������������������������������������������������� 24 317 1 313 1 78510 to 19 employees 5����������������������������������������������������� 69 1 153 6 440 8 31720 to 49 employees 7����������������������������������������������������� 196 2 345 11 023 19 64750 to 99 employees 1����������������������������������������������������� b D D D100 to 249 employees 2�������������������������������������������������� c D D D250 to 499 employees –�������������������������������������������������� – – – –500 employees or more –������������������������������������������������� – – – –
Toa Baja Municipio, PR
All establishments 54���������������������������������������������� 2 290 44 206 169 886 369 483Establishments with an average of�1 to 4 employees 16������������������������������������������������������� 36 353 1 269 2 1665 to 9 employees 3������������������������������������������������������� 19 132 441 68510 to 19 employees 5����������������������������������������������������� 66 927 1 070 6 68620 to 49 employees 18����������������������������������������������������� 559 15 356 33 335 73 73050 to 99 employees 7����������������������������������������������������� 507 6 269 23 936 38 990100 to 249 employees 4�������������������������������������������������� f D D D250 to 499 employees 1�������������������������������������������������� e D D D500 employees or more –������������������������������������������������� – – – –
Trujillo Alto Municipio, PR
All establishments 32���������������������������������������������� 721 9 804 41 666 64 163Establishments with an average of�1 to 4 employees 11������������������������������������������������������� b D D D5 to 9 employees 6������������������������������������������������������� 43 385 2 303 3 93310 to 19 employees 5����������������������������������������������������� 77 1 431 5 743 11 08620 to 49 employees 3����������������������������������������������������� 118 1 577 8 089 10 27150 to 99 employees 6����������������������������������������������������� 360 5 942 25 218 37 693100 to 249 employees 1�������������������������������������������������� c D D D250 to 499 employees –�������������������������������������������������� – – – –500 employees or more –������������������������������������������������� – – – –
Vega Alta Municipio, PR
All establishments 14���������������������������������������������� 981 23 923 95 528 161 250Establishments with an average of�1 to 4 employees 3������������������������������������������������������� 5 61 –296 5145 to 9 employees –������������������������������������������������������� – – – –10 to 19 employees 3����������������������������������������������������� b D D D20 to 49 employees 3����������������������������������������������������� c D D D50 to 99 employees 1����������������������������������������������������� b D D D100 to 249 employees 3�������������������������������������������������� 449 11 230 36 104 54 160250 to 499 employees 1�������������������������������������������������� e D D D500 employees or more –������������������������������������������������� – – – –
Vega Baja Municipio, PR
All establishments 31���������������������������������������������� 3 376 98 299 2 205 467 2 606 158Establishments with an average of�1 to 4 employees 9������������������������������������������������������� a D D D5 to 9 employees 6������������������������������������������������������� b D D D10 to 19 employees 4����������������������������������������������������� b D D D20 to 49 employees 1����������������������������������������������������� b D D D50 to 99 employees 4����������������������������������������������������� 302 5 317 9 471 23 924100 to 249 employees 3�������������������������������������������������� e D D D250 to 499 employees 2�������������������������������������������������� f D D D500 employees or more 2������������������������������������������������� g D D D
See footnotes at end of table.
2002 Economic Census of Island Areas Puerto Rico–Manufacturing 51U.S. Census Bureau, 2002 Economic Census
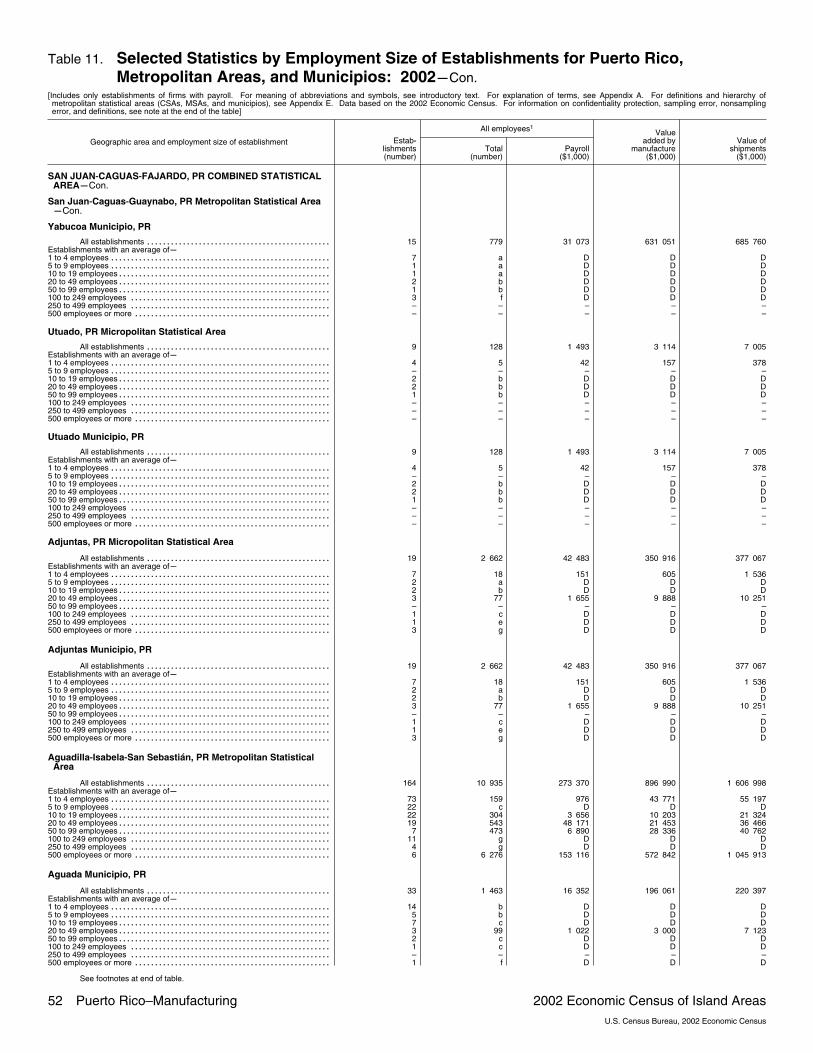
Table 11. Selected Statistics by Employment Size of Establishments for Puerto Rico,Metropolitan Areas, and Municipios: 2002�Con.
[Includes only establishments of firms with payroll. For meaning of abbreviations and symbols, see introductory text. For explanation of terms, see Appendix A. For definitions and hierarchy ofmetropolitan statistical areas (CSAs, MSAs, and municipios), see Appendix E. Data based on the 2002 Economic Census. For information on confidentiality protection, sampling error, nonsamplingerror, and definitions, see note at the end of the table]
Geographic area and employment size of establishment
All employees1
Estab�lishments(number)
Total(number)
Payroll($1,000)
Valueadded by
manufacture($1,000)
Value ofshipments
($1,000)
SAN JUAN�CAGUAS�FAJARDO, PR COMBINED STATISTICALAREA�Con.
San Juan�Caguas�Guaynabo, PR Metropolitan Statistical Area�Con.
Yabucoa Municipio, PR
All establishments 15���������������������������������������������� 779 31 073 631 051 685 760Establishments with an average of�1 to 4 employees 7������������������������������������������������������� a D D D5 to 9 employees 1������������������������������������������������������� a D D D10 to 19 employees 1����������������������������������������������������� a D D D20 to 49 employees 2����������������������������������������������������� b D D D50 to 99 employees 1����������������������������������������������������� b D D D100 to 249 employees 3�������������������������������������������������� f D D D250 to 499 employees –�������������������������������������������������� – – – –500 employees or more –������������������������������������������������� – – – –
Utuado, PR Micropolitan Statistical Area
All establishments 9���������������������������������������������� 128 1 493 3 114 7 005Establishments with an average of�1 to 4 employees 4������������������������������������������������������� 5 42 157 3785 to 9 employees –������������������������������������������������������� – – – –10 to 19 employees 2����������������������������������������������������� b D D D20 to 49 employees 2����������������������������������������������������� b D D D50 to 99 employees 1����������������������������������������������������� b D D D100 to 249 employees –�������������������������������������������������� – – – –250 to 499 employees –�������������������������������������������������� – – – –500 employees or more –������������������������������������������������� – – – –
Utuado Municipio, PR
All establishments 9���������������������������������������������� 128 1 493 3 114 7 005Establishments with an average of�1 to 4 employees 4������������������������������������������������������� 5 42 157 3785 to 9 employees –������������������������������������������������������� – – – –10 to 19 employees 2����������������������������������������������������� b D D D20 to 49 employees 2����������������������������������������������������� b D D D50 to 99 employees 1����������������������������������������������������� b D D D100 to 249 employees –�������������������������������������������������� – – – –250 to 499 employees –�������������������������������������������������� – – – –500 employees or more –������������������������������������������������� – – – –
Adjuntas, PR Micropolitan Statistical Area
All establishments 19���������������������������������������������� 2 662 42 483 350 916 377 067Establishments with an average of�1 to 4 employees 7������������������������������������������������������� 18 151 605 1 5365 to 9 employees 2������������������������������������������������������� a D D D10 to 19 employees 2����������������������������������������������������� b D D D20 to 49 employees 3����������������������������������������������������� 77 1 655 9 888 10 25150 to 99 employees –����������������������������������������������������� – – – –100 to 249 employees 1�������������������������������������������������� c D D D250 to 499 employees 1�������������������������������������������������� e D D D500 employees or more 3������������������������������������������������� g D D D
Adjuntas Municipio, PR
All establishments 19���������������������������������������������� 2 662 42 483 350 916 377 067Establishments with an average of�1 to 4 employees 7������������������������������������������������������� 18 151 605 1 5365 to 9 employees 2������������������������������������������������������� a D D D10 to 19 employees 2����������������������������������������������������� b D D D20 to 49 employees 3����������������������������������������������������� 77 1 655 9 888 10 25150 to 99 employees –����������������������������������������������������� – – – –100 to 249 employees 1�������������������������������������������������� c D D D250 to 499 employees 1�������������������������������������������������� e D D D500 employees or more 3������������������������������������������������� g D D D
Aguadilla�Isabela�San Sebastián, PR Metropolitan StatisticalArea
All establishments 164���������������������������������������������� 10 935 273 370 896 990 1 606 998Establishments with an average of�1 to 4 employees 73������������������������������������������������������� 159 976 43 771 55 1975 to 9 employees 22������������������������������������������������������� c D D D10 to 19 employees 22����������������������������������������������������� 304 3 656 10 203 21 32420 to 49 employees 19����������������������������������������������������� 543 48 171 21 453 36 46650 to 99 employees 7����������������������������������������������������� 473 6 890 28 336 40 762100 to 249 employees 11�������������������������������������������������� g D D D250 to 499 employees 4�������������������������������������������������� g D D D500 employees or more 6������������������������������������������������� 6 276 153 116 572 842 1 045 913
Aguada Municipio, PR
All establishments 33���������������������������������������������� 1 463 16 352 196 061 220 397Establishments with an average of�1 to 4 employees 14������������������������������������������������������� b D D D5 to 9 employees 5������������������������������������������������������� b D D D10 to 19 employees 7����������������������������������������������������� c D D D20 to 49 employees 3����������������������������������������������������� 99 1 022 3 000 7 12350 to 99 employees 2����������������������������������������������������� c D D D100 to 249 employees 1�������������������������������������������������� c D D D250 to 499 employees –�������������������������������������������������� – – – –500 employees or more 1������������������������������������������������� f D D D
See footnotes at end of table.
52 Puerto Rico–Manufacturing 2002 Economic Census of Island AreasU.S. Census Bureau, 2002 Economic Census
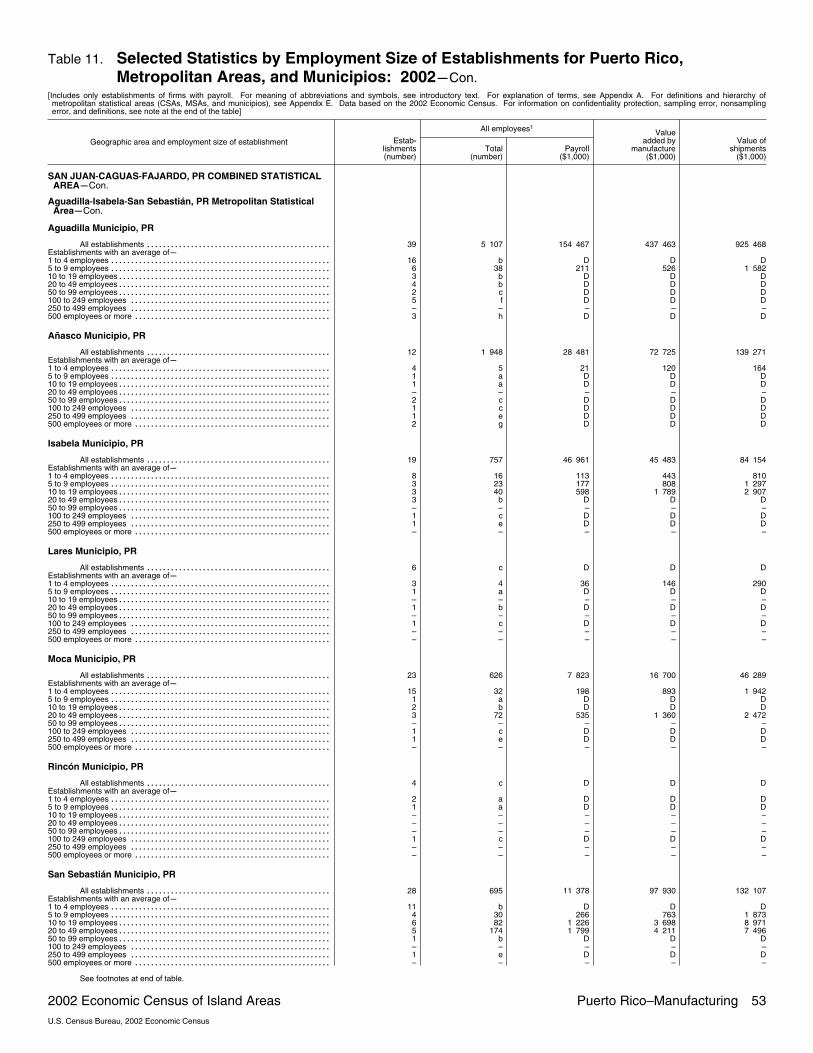
Table 11. Selected Statistics by Employment Size of Establishments for Puerto Rico,Metropolitan Areas, and Municipios: 2002�Con.
[Includes only establishments of firms with payroll. For meaning of abbreviations and symbols, see introductory text. For explanation of terms, see Appendix A. For definitions and hierarchy ofmetropolitan statistical areas (CSAs, MSAs, and municipios), see Appendix E. Data based on the 2002 Economic Census. For information on confidentiality protection, sampling error, nonsamplingerror, and definitions, see note at the end of the table]
Geographic area and employment size of establishment
All employees1
Estab�lishments(number)
Total(number)
Payroll($1,000)
Valueadded by
manufacture($1,000)
Value ofshipments
($1,000)
SAN JUAN�CAGUAS�FAJARDO, PR COMBINED STATISTICALAREA�Con.
Aguadilla�Isabela�San Sebastián, PR Metropolitan StatisticalArea�Con.
Aguadilla Municipio, PR
All establishments 39���������������������������������������������� 5 107 154 467 437 463 925 468Establishments with an average of�1 to 4 employees 16������������������������������������������������������� b D D D5 to 9 employees 6������������������������������������������������������� 38 211 526 1 58210 to 19 employees 3����������������������������������������������������� b D D D20 to 49 employees 4����������������������������������������������������� b D D D50 to 99 employees 2����������������������������������������������������� c D D D100 to 249 employees 5�������������������������������������������������� f D D D250 to 499 employees –�������������������������������������������������� – – – –500 employees or more 3������������������������������������������������� h D D D
Añasco Municipio, PR
All establishments 12���������������������������������������������� 1 948 28 481 72 725 139 271Establishments with an average of�1 to 4 employees 4������������������������������������������������������� 5 21 120 1645 to 9 employees 1������������������������������������������������������� a D D D10 to 19 employees 1����������������������������������������������������� a D D D20 to 49 employees –����������������������������������������������������� – – – –50 to 99 employees 2����������������������������������������������������� c D D D100 to 249 employees 1�������������������������������������������������� c D D D250 to 499 employees 1�������������������������������������������������� e D D D500 employees or more 2������������������������������������������������� g D D D
Isabela Municipio, PR
All establishments 19���������������������������������������������� 757 46 961 45 483 84 154Establishments with an average of�1 to 4 employees 8������������������������������������������������������� 16 113 443 8105 to 9 employees 3������������������������������������������������������� 23 177 808 1 29710 to 19 employees 3����������������������������������������������������� 40 598 1 789 2 90720 to 49 employees 3����������������������������������������������������� b D D D50 to 99 employees –����������������������������������������������������� – – – –100 to 249 employees 1�������������������������������������������������� c D D D250 to 499 employees 1�������������������������������������������������� e D D D500 employees or more –������������������������������������������������� – – – –
Lares Municipio, PR
All establishments 6���������������������������������������������� c D D DEstablishments with an average of�1 to 4 employees 3������������������������������������������������������� 4 36 146 2905 to 9 employees 1������������������������������������������������������� a D D D10 to 19 employees –����������������������������������������������������� – – – –20 to 49 employees 1����������������������������������������������������� b D D D50 to 99 employees –����������������������������������������������������� – – – –100 to 249 employees 1�������������������������������������������������� c D D D250 to 499 employees –�������������������������������������������������� – – – –500 employees or more –������������������������������������������������� – – – –
Moca Municipio, PR
All establishments 23���������������������������������������������� 626 7 823 16 700 46 289Establishments with an average of�1 to 4 employees 15������������������������������������������������������� 32 198 893 1 9425 to 9 employees 1������������������������������������������������������� a D D D10 to 19 employees 2����������������������������������������������������� b D D D20 to 49 employees 3����������������������������������������������������� 72 535 1 360 2 47250 to 99 employees –����������������������������������������������������� – – – –100 to 249 employees 1�������������������������������������������������� c D D D250 to 499 employees 1�������������������������������������������������� e D D D500 employees or more –������������������������������������������������� – – – –
Rincón Municipio, PR
All establishments 4���������������������������������������������� c D D DEstablishments with an average of�1 to 4 employees 2������������������������������������������������������� a D D D5 to 9 employees 1������������������������������������������������������� a D D D10 to 19 employees –����������������������������������������������������� – – – –20 to 49 employees –����������������������������������������������������� – – – –50 to 99 employees –����������������������������������������������������� – – – –100 to 249 employees 1�������������������������������������������������� c D D D250 to 499 employees –�������������������������������������������������� – – – –500 employees or more –������������������������������������������������� – – – –
San Sebastián Municipio, PR
All establishments 28���������������������������������������������� 695 11 378 97 930 132 107Establishments with an average of�1 to 4 employees 11������������������������������������������������������� b D D D5 to 9 employees 4������������������������������������������������������� 30 266 763 1 87310 to 19 employees 6����������������������������������������������������� 82 1 226 3 698 8 97120 to 49 employees 5����������������������������������������������������� 174 1 799 4 211 7 49650 to 99 employees 1����������������������������������������������������� b D D D100 to 249 employees –�������������������������������������������������� – – – –250 to 499 employees 1�������������������������������������������������� e D D D500 employees or more –������������������������������������������������� – – – –
See footnotes at end of table.
2002 Economic Census of Island Areas Puerto Rico–Manufacturing 53U.S. Census Bureau, 2002 Economic Census
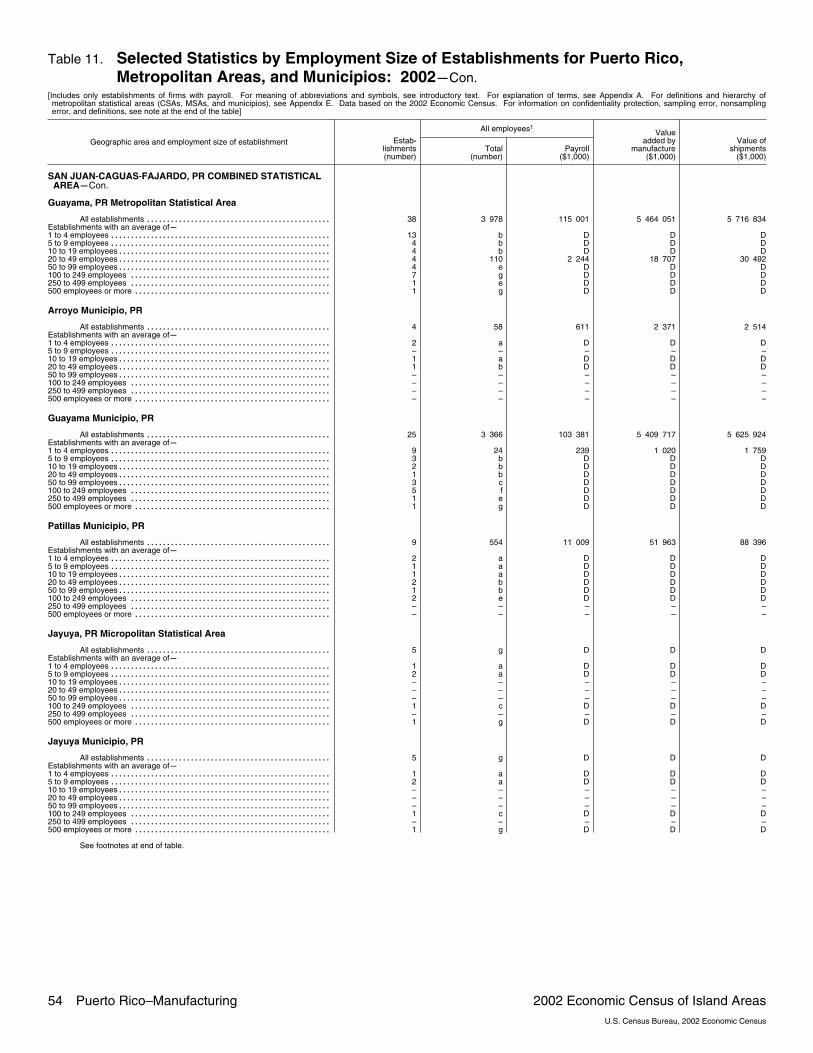
Table 11. Selected Statistics by Employment Size of Establishments for Puerto Rico,Metropolitan Areas, and Municipios: 2002�Con.
[Includes only establishments of firms with payroll. For meaning of abbreviations and symbols, see introductory text. For explanation of terms, see Appendix A. For definitions and hierarchy ofmetropolitan statistical areas (CSAs, MSAs, and municipios), see Appendix E. Data based on the 2002 Economic Census. For information on confidentiality protection, sampling error, nonsamplingerror, and definitions, see note at the end of the table]
Geographic area and employment size of establishment
All employees1
Estab�lishments(number)
Total(number)
Payroll($1,000)
Valueadded by
manufacture($1,000)
Value ofshipments
($1,000)
SAN JUAN�CAGUAS�FAJARDO, PR COMBINED STATISTICALAREA�Con.
Guayama, PR Metropolitan Statistical Area
All establishments 38���������������������������������������������� 3 978 115 001 5 464 051 5 716 834Establishments with an average of�1 to 4 employees 13������������������������������������������������������� b D D D5 to 9 employees 4������������������������������������������������������� b D D D10 to 19 employees 4����������������������������������������������������� b D D D20 to 49 employees 4����������������������������������������������������� 110 2 244 18 707 30 49250 to 99 employees 4����������������������������������������������������� e D D D100 to 249 employees 7�������������������������������������������������� g D D D250 to 499 employees 1�������������������������������������������������� e D D D500 employees or more 1������������������������������������������������� g D D D
Arroyo Municipio, PR
All establishments 4���������������������������������������������� 58 611 2 371 2 514Establishments with an average of�1 to 4 employees 2������������������������������������������������������� a D D D5 to 9 employees –������������������������������������������������������� – – – –10 to 19 employees 1����������������������������������������������������� a D D D20 to 49 employees 1����������������������������������������������������� b D D D50 to 99 employees –����������������������������������������������������� – – – –100 to 249 employees –�������������������������������������������������� – – – –250 to 499 employees –�������������������������������������������������� – – – –500 employees or more –������������������������������������������������� – – – –
Guayama Municipio, PR
All establishments 25���������������������������������������������� 3 366 103 381 5 409 717 5 625 924Establishments with an average of�1 to 4 employees 9������������������������������������������������������� 24 239 1 020 1 7595 to 9 employees 3������������������������������������������������������� b D D D10 to 19 employees 2����������������������������������������������������� b D D D20 to 49 employees 1����������������������������������������������������� b D D D50 to 99 employees 3����������������������������������������������������� c D D D100 to 249 employees 5�������������������������������������������������� f D D D250 to 499 employees 1�������������������������������������������������� e D D D500 employees or more 1������������������������������������������������� g D D D
Patillas Municipio, PR
All establishments 9���������������������������������������������� 554 11 009 51 963 88 396Establishments with an average of�1 to 4 employees 2������������������������������������������������������� a D D D5 to 9 employees 1������������������������������������������������������� a D D D10 to 19 employees 1����������������������������������������������������� a D D D20 to 49 employees 2����������������������������������������������������� b D D D50 to 99 employees 1����������������������������������������������������� b D D D100 to 249 employees 2�������������������������������������������������� e D D D250 to 499 employees –�������������������������������������������������� – – – –500 employees or more –������������������������������������������������� – – – –
Jayuya, PR Micropolitan Statistical Area
All establishments 5���������������������������������������������� g D D DEstablishments with an average of�1 to 4 employees 1������������������������������������������������������� a D D D5 to 9 employees 2������������������������������������������������������� a D D D10 to 19 employees –����������������������������������������������������� – – – –20 to 49 employees –����������������������������������������������������� – – – –50 to 99 employees –����������������������������������������������������� – – – –100 to 249 employees 1�������������������������������������������������� c D D D250 to 499 employees –�������������������������������������������������� – – – –500 employees or more 1������������������������������������������������� g D D D
Jayuya Municipio, PR
All establishments 5���������������������������������������������� g D D DEstablishments with an average of�1 to 4 employees 1������������������������������������������������������� a D D D5 to 9 employees 2������������������������������������������������������� a D D D10 to 19 employees –����������������������������������������������������� – – – –20 to 49 employees –����������������������������������������������������� – – – –50 to 99 employees –����������������������������������������������������� – – – –100 to 249 employees 1�������������������������������������������������� c D D D250 to 499 employees –�������������������������������������������������� – – – –500 employees or more 1������������������������������������������������� g D D D
See footnotes at end of table.
54 Puerto Rico–Manufacturing 2002 Economic Census of Island AreasU.S. Census Bureau, 2002 Economic Census

Table 11. Selected Statistics by Employment Size of Establishments for Puerto Rico,Metropolitan Areas, and Municipios: 2002�Con.
[Includes only establishments of firms with payroll. For meaning of abbreviations and symbols, see introductory text. For explanation of terms, see Appendix A. For definitions and hierarchy ofmetropolitan statistical areas (CSAs, MSAs, and municipios), see Appendix E. Data based on the 2002 Economic Census. For information on confidentiality protection, sampling error, nonsamplingerror, and definitions, see note at the end of the table]
Geographic area and employment size of establishment
All employees1
Estab�lishments(number)
Total(number)
Payroll($1,000)
Valueadded by
manufacture($1,000)
Value ofshipments
($1,000)
AREA OUTSIDE PUERTO RICO METROPOLITAN AREAS
Culebra Municipio, PR
All establishments 2���������������������������������������������� c D D DEstablishments with an average of�1 to 4 employees –������������������������������������������������������� – – – –5 to 9 employees –������������������������������������������������������� – – – –10 to 19 employees –����������������������������������������������������� – – – –20 to 49 employees –����������������������������������������������������� – – – –50 to 99 employees 1����������������������������������������������������� b D D D100 to 249 employees 1�������������������������������������������������� c D D D250 to 499 employees –�������������������������������������������������� – – – –500 employees or more –������������������������������������������������� – – – –
Las Marías Municipio, PR
All establishments 2���������������������������������������������� a D D DEstablishments with an average of�1 to 4 employees 1������������������������������������������������������� a D D D5 to 9 employees 1������������������������������������������������������� a D D D10 to 19 employees –����������������������������������������������������� – – – –20 to 49 employees –����������������������������������������������������� – – – –50 to 99 employees –����������������������������������������������������� – – – –100 to 249 employees –�������������������������������������������������� – – – –250 to 499 employees –�������������������������������������������������� – – – –500 employees or more –������������������������������������������������� – – – –
Maricao Municipio, PR
All establishments 1���������������������������������������������� g D D DEstablishments with an average of�1 to 4 employees –������������������������������������������������������� – – – –5 to 9 employees –������������������������������������������������������� – – – –10 to 19 employees –����������������������������������������������������� – – – –20 to 49 employees –����������������������������������������������������� – – – –50 to 99 employees –����������������������������������������������������� – – – –100 to 249 employees –�������������������������������������������������� – – – –250 to 499 employees –�������������������������������������������������� – – – –500 employees or more 1������������������������������������������������� g D D D
Salinas Municipio, PR
All establishments 13���������������������������������������������� e D D DEstablishments with an average of�1 to 4 employees 2������������������������������������������������������� a D D D5 to 9 employees 3������������������������������������������������������� 22 141 901 1 43510 to 19 employees 3����������������������������������������������������� 47 626 2 513 5 08420 to 49 employees 3����������������������������������������������������� b D D D50 to 99 employees 1����������������������������������������������������� b D D D100 to 249 employees 1�������������������������������������������������� c D D D250 to 499 employees –�������������������������������������������������� – – – –500 employees or more –������������������������������������������������� – – – –
Vieques Municipio, PR
All establishments 3���������������������������������������������� b D D DEstablishments with an average of�1 to 4 employees 1������������������������������������������������������� a D D D5 to 9 employees 1������������������������������������������������������� a D D D10 to 19 employees –����������������������������������������������������� – – – –20 to 49 employees –����������������������������������������������������� – – – –50 to 99 employees 1����������������������������������������������������� b D D D100 to 249 employees –�������������������������������������������������� – – – –250 to 499 employees –�������������������������������������������������� – – – –500 employees or more –������������������������������������������������� – – – –
1Sum of other employees for the pay period including March 12, 2002, plus production workers during pay periods including the 12th of March, May, August, and November divided by 4.
Note: The data in this table are based on the 2002 Economic Census. To maintain confidentiality, the Census Bureau supresses data to protect the identity of any business or individual. Thecensus results in this table contain nonsampling error. Data users who create their own estimates using data from this table should cite the Census Bureau as the source of the original data only. Forexplanation of terms, see Appendix A. For the full technical documentation, see Appendix C.
2002 Economic Census of Island Areas Puerto Rico–Manufacturing 55U.S. Census Bureau, 2002 Economic Census

Table 12. Selected Statistics by Industry for Puerto Rico and Metropolitan Areas: 2002[Includes only establishments of firms with payroll. For meaning of abbreviations and symbols, see introductory text. For explanation of terms, see Appendix A. For definitions and hierarchy ofmetropolitan statistical areas (CSAs, MSAs, and municipios), see Appendix E. Data based on the 2002 Economic Census. For information on confidentiality protection, sampling error, nonsamplingerror, and definitions, see note at the end of the table]
2002NAICScode
Industry and metropolitanareas
All employees1
Production workers Other employees
Estab�lishments(number)
Totalannualpayroll
($1,000)
Totalfirst�
quarterpayroll
($1,000)
Totalem�
ployees(number)
Averagefor the
year(number)
Wages($1,000) Number
Salaries($1,000)
Pro�prietors
andpartners2
(number)
Unpaidfamily
workers2
(number)
Valueadded
bymanufacture
($1,000)
Cost ofmaterials($1,000)
Value ofshipments
($1,000)
PUERTO RICO
31�33 Manufacturing 2 195����������r3 130 631 r756 008 r126 707 r88 964 r1 869 447 r37 743 r1 261 182 S 218 45 614 305 13 370 948 58 580 060
311 Food manufacturing 446���� 230 955 r58 369 r14 509 r8 520 r150 246 r5 989 r80 709 86 61 3 596 987 1 309 404 4 883 924
3111 Animal foodmanufacturing 13������ 8 507 1 957 587 397 4 170 190 4 337 – – 44 011 89 414 133 326
3112 Grain and oilseedmilling 5������������� D D e c D c D D D D D D
3113 Sugar andconfectioneryproductmanufacturing 27������ 23 395 5 680 1 143 760 16 949 383 6 446 3 3 106 948 93 851 200 648
31131 Sugarmanufacturing 4���� 2 012 528 163 113 1 212 50 800 – – 12 529 1 936 14 612
31132 Chocolate andconfectionerymanufacturingfrom cacao beans 1� D D a a D a D D D D D D
31133 Confectionerymanufacturingfrom purchasedchocolate 6�������� D D c b D b D D D D D D
31134 Nonchocolateconfectionerymanufacturing 16���� 20 416 4 923 811 550 15 294 261 5 122 3 3 92 076 89 336 181 049
3114 Fruit and vegetablepreserving andspecialty foodmanufacturing 31������ 25 594 r4 018 r1 638 r1 268 r18 912 r370 r6 682 6 – 84 410 170 106 248 249
31141 Frozen foodmanufacturing 14���� 4 200 910 381 211 1 942 170 2 258 5 – 20 584 14 219 28 365
31142 Fruit and vegetablecanning, pickling,and drying 17������� 21 394 r3 108 r1 257 r1 057 r16 970 r200 r4 424 1 – 63 826 155 887 219 884
3115 Dairy productmanufacturing 17������ D D g f D e D D D D D D
31151 Dairy product(except frozen)manufacturing 6���� D D f e D e D D D D D D
31152 Ice cream andfrozen dessertmanufacturing 11���� 977 247 134 73 726 61 251 – – 2 731 3 919 6 727
3116 Animal slaughteringand processing 20����� 23 375 5 099 r1 385 r1 198 19 783 r187 3 592 – – 34 797 129 790 163 475
3117 Seafood productpreparation andpackaging 2��������� D D g f D e D D D D D D
3118 Bakeries and tortillamanufacturing 273������ 47 697 15 692 4 988 2 328 33 765 2 660 13 932 66 43 207 519 150 236 335 678
31181 Bread and bakeryproductmanufacturing 260���� 34 112 12 319 3 893 1 724 26 958 2 169 7 154 56 36 178 579 122 935 279 819
31182 Cookie, cracker,and pastamanufacturing 11���� D D g f D e D D D D D D
31183 Tortillamanufacturing 2���� D D a a D a D D D D D D
3119 Other foodmanufacturing 58������ 56 028 14 634 2 423 1 273 22 762 1 150 33 266 11 15 2 908 301 425 097 3 333 890
31191 Snack foodmanufacturing 2���� D D e b D e D D D D D D
31192 Coffee and teamanufacturing 11���� 6 100 1 477 398 197 2 749 201 3 351 – – 22 102 64 765 86 725
31193 Flavoring syrup andconcentratemanufacturing 8���� D D c c D b D D D D D D
31194 Seasoning anddressingmanufacturing 9���� 1 151 316 78 41 679 37 472 – – 6 276 5 688 11 933
31199 All other foodmanufacturing 28���� D D g f D e D D D D D D
312 Beverage and tobaccoproduct manufacturing 57� 102 833 23 484 3 859 2 679 69 212 1 180 33 621 3 12 783 483 771 613 1 547 995
3121 Beveragemanufacturing 51������ 66 255 14 357 2 375 1 394 39 030 981 27 225 3 12 610 929 630 412 1 235 303
31211 Soft drink and icemanufacturing 44���� D D g f D f D D D D D D
31212 Breweries 1��������� D D a a D a D D D D D D31213 Wineries 4���������� 1 644 373 89 61 1 012 28 632 – – 629 5 357 6 02231214 Distilleries 2�������� D D f f D c D D D D D D
3122 Tobaccomanufacturing 6������ 36 578 9 127 1 484 1 285 30 182 199 6 396 – – 172 554 141 201 312 692
See footnotes at end of table.
56 Puerto Rico–Manufacturing 2002 Economic Census of Island AreasU.S. Census Bureau, 2002 Economic Census

Table 12. Selected Statistics by Industry for Puerto Rico and Metropolitan Areas: 2002�Con.[Includes only establishments of firms with payroll. For meaning of abbreviations and symbols, see introductory text. For explanation of terms, see Appendix A. For definitions and hierarchy ofmetropolitan statistical areas (CSAs, MSAs, and municipios), see Appendix E. Data based on the 2002 Economic Census. For information on confidentiality protection, sampling error, nonsamplingerror, and definitions, see note at the end of the table]
2002NAICScode
Industry and metropolitanareas
All employees1
Production workers Other employees
Estab�lishments(number)
Totalannualpayroll
($1,000)
Totalfirst�
quarterpayroll
($1,000)
Totalem�
ployees(number)
Averagefor the
year(number)
Wages($1,000) Number
Salaries($1,000)
Pro�prietors
andpartners2
(number)
Unpaidfamily
workers2
(number)
Valueadded
bymanufacture
($1,000)
Cost ofmaterials($1,000)
Value ofshipments
($1,000)
PUERTO RICO�Con.
31�33 Manufacturing�Con.313 Textile mills 8����������� 737 192 61 43 609 18 128 3 2 2 665 2 257 4 946
3132 Fabric mills 4��������� D D b b D a D D D D D D
3133 Textile and fabricfinishing and fabriccoating mills 4�������� D D b b D a D D D D D D
314 Textile product mills 46����r21 858 5 543 r1 782 r1 030 r13 752 r752 r8 106 8 – 34 512 48 011 93 872
3141 Textile furnishingsmills 27���������������
r13 875 3 712 r1 196 r637 r10 171 r559 r3 704 4 – 21 409 33 781 66 27631411 Carpet and rug
mills 4������������� 2 579 435 138 126 2 264 12 315 3 – 3 864 1 445 5 58031412 Curtain and linen
mills 23�������������r11 296 3 277 r1 058 r511 r7 907 r547 r3 389 1 – 17 545 32 336 60 696
3149 Other textile productmills 19��������������� 7 983 1 831 586 393 3 581 193 4 402 4 – 13 103 14 230 27 596
31491 Textile bag andcanvas mills 5������ 2 953 624 230 162 1 214 68 1 739 – – 5 275 5 283 10 597
31499 All other textileproduct mills 14����� 5 030 1 207 356 231 2 367 125 2 663 4 – 7 828 8 947 16 999
315 Apparel manufacturing 122� 161 743 37 196 r9 731 r7 922 105 360 r1 809 56 383 22 6 505 836 224 934 725 181
3151 Apparel knitting mills 1� D D a a D a D D D D D D31519 Other apparel
knitting mills 1������ D D a a D a D D D D D D
3152 Cut and sew apparelmanufacturing 113������ D D i i D g D D D D D D
31521 Cut and sewapparelcontractors 21������� 14 472 3 613 824 672 8 741 152 5 731 3 1 25 671 36 645 62 289
31522 Men’s and boys’ cutand sew apparelmanufacturing 21���� D D g f D c D D D D D D
31523 Women’s and girls’cut and sewapparelmanufacturing 46���� 95 646 21 136 r4 233 r3 447 56 181 r786 39 465 12 3 379 151 60 121 436 216
31529 Other cut and sewapparelmanufacturing 25���� 16 251 4 451 1 569 1 342 11 362 227 4 889 5 2 25 886 56 190 79 632
3159 Apparel accessoriesand other apparelmanufacturing 8������ D D g g D e D D D D D D
316 Leather and alliedproduct manufacturing 12� 24 045 6 550 1 472 1 194 17 435 278 6 610 – – 84 165 101 795 186 154
3161 Leather and hidetanning andfinishing 1����������� D D a a D a D D D D D D
3162 Footwearmanufacturing 7������ D D g f D c D D D D D D
3169 Other leather andallied productmanufacturing 4������ D D e e D b D D D D D D
321 Wood productmanufacturing 74�������� 20 127 4 605 1 502 1 189 14 762 313 5 365 14 10 119 284 49 976 166 921
3211 Sawmills and woodpreservation 4�������� D D b b D a D D D D D D
3212 Veneer, plywood, andengineered woodproductmanufacturing 12������ D D e c D b D D D D D D
3219 Other wood productmanufacturing 58������ 15 620 3 515 1 134 925 11 740 209 3 880 10 8 100 748 40 806 140 443
32191 Millwork 24���������� 5 057 992 410 325 3 713 85 1 344 4 4 22 420 10 880 31 58932192 Wood container and
palletmanufacturing 8���� 2 875 661 209 143 1 708 66 1 167 1 – 12 079 11 485 23 631
32199 All other woodproductmanufacturing 26���� 7 688 1 862 515 457 6 319 58 1 369 5 4 66 249 18 441 85 223
322 Paper manufacturing 44��� 45 376 11 226 2 012 1 534 29 863 478 15 513 5 2 141 649 146 785 284 433
3221 Pulp, paper, andpaperboard mills 4���� 2 927 777 214 164 2 247 50 680 – – 19 472 22 211 41 342
See footnotes at end of table.
2002 Economic Census of Island Areas Puerto Rico–Manufacturing 57U.S. Census Bureau, 2002 Economic Census

Table 12. Selected Statistics by Industry for Puerto Rico and Metropolitan Areas: 2002�Con.[Includes only establishments of firms with payroll. For meaning of abbreviations and symbols, see introductory text. For explanation of terms, see Appendix A. For definitions and hierarchy ofmetropolitan statistical areas (CSAs, MSAs, and municipios), see Appendix E. Data based on the 2002 Economic Census. For information on confidentiality protection, sampling error, nonsamplingerror, and definitions, see note at the end of the table]
2002NAICScode
Industry and metropolitanareas
All employees1
Production workers Other employees
Estab�lishments(number)
Totalannualpayroll
($1,000)
Totalfirst�
quarterpayroll
($1,000)
Totalem�
ployees(number)
Averagefor the
year(number)
Wages($1,000) Number
Salaries($1,000)
Pro�prietors
andpartners2
(number)
Unpaidfamily
workers2
(number)
Valueadded
bymanufacture
($1,000)
Cost ofmaterials($1,000)
Value ofshipments
($1,000)
PUERTO RICO�Con.
31�33 Manufacturing�Con.322 Paper manufacturing�
Con.3222 Converted paper
productmanufacturing 40������ 42 449 10 449 1 798 1 370 27 616 428 14 833 5 2 122 177 124 574 243 091
32221 Paperboardcontainermanufacturing 22���� 31 111 7 669 1 246 1 017 20 668 229 10 443 2 1 87 904 89 686 174 022
32222 Paper bag andcoated and treatedpapermanufacturing 7���� 6 804 1 648 287 177 4 267 110 2 537 1 – 17 954 25 817 43 868
32223 Stationery productmanufacturing 9���� D D c c D b D D D D D D
32229 Other convertedpaper productmanufacturing 2���� D D a a D a D D D D D D
323 Printing and relatedsupport activities 181������ 56 843 14 285 3 182 2 190 40 536 992 16 307 55 22 170 758 118 320 285 393
3231 Printing and relatedsupport activities 181���� 56 843 14 285 3 182 2 190 40 536 992 16 307 55 22 170 758 118 320 285 393
32311 Printing 164����������� 49 828 12 720 2 865 1 936 35 939 929 13 889 49 18 149 120 102 281 247 62032312 Support activities
for printing 17������� 7 015 1 565 317 254 4 597 63 2 418 6 4 21 638 16 039 37 773
324 Petroleum and coalproductsmanufacturing 32�������� 48 229 12 027 1 374 865 29 294 509 18 935 – – 884 681 711 523 1 525 356
3241 Petroleum and coalproductsmanufacturing 32������ 48 229 12 027 1 374 865 29 294 509 18 935 – – 884 681 711 523 1 525 356
32411 Petroleumrefineries 9�������� 26 353 7 124 554 335 13 162 219 13 191 – – 676 372 175 913 798 245
32412 Asphalt paving,roofing, andsaturatedmaterialsmanufacturing 19���� D D f e D e D D D D D D
32419 Other petroleumand coal productsmanufacturing 4���� D D b b D b D D D D D D
325 Chemicalmanufacturing 154�������� 1 228 680 311 999 r28 937 r18 914 r603 295 r10 023 r625 385 S – 33 935 557 6 126 966 39 808 729
3251 Basic chemicalmanufacturing 14������ 6 733 2 251 290 207 5 295 83 1 438 – – 34 069 15 361 49 419
32511 Petrochemicalmanufacturing 2���� D D b a D b D D D D D D
32512 Industrial gasmanufacturing 8���� 4 975 1 679 168 134 4 168 34 807 – – 30 559 8 610 39 072
32513 Synthetic dye andpigmentmanufacturing 1���� D D b a D a D D D D D D
32518 Other basicinorganic chemicalmanufacturing 2���� D D b b D a D D D D D D
32519 Other basic organicchemicalmanufacturing 1���� D D a a D a D D D D D D
3252 Resin, syntheticrubber, and artificialsynthetic fibers andfilamentsmanufacturing 4������ D D b b D b D D D D D D
3253 Pesticide, fertilizer,and other agriculturalchemicalmanufacturing 5������ D D e c D c D D D D D D
3254 Pharmaceutical andmedicinemanufacturing 74������ 1 109 166 282 890 25 036 r16 474 r541 410 r8 562 r567 756 S – 33 159 557 5 529 868 38 446 602
3255 Paint, coating, andadhesivemanufacturing 20������ 33 000 7 516 1 112 631 12 551 481 20 449 1 – 92 182 122 515 214 620
32551 Paint and coatingmanufacturing 13���� 18 427 3 862 652 330 6 434 322 11 993 1 – 66 498 69 296 135 113
32552 Adhesivemanufacturing 7���� 14 573 3 654 460 301 6 117 159 8 456 – – 25 684 53 219 79 507
3256 Soap, cleaningcompound, and toiletpreparationmanufacturing 32������ 68 012 15 923 2 040 1 322 37 329 718 30 683 1 – 563 651 321 062 886 493
32561 Soap and cleaningcompoundmanufacturing 22���� 11 494 2 874 460 279 5 939 181 5 555 1 – 80 492 39 427 120 140
32562 Toilet preparationmanufacturing 10���� 56 518 13 049 1 580 1 043 31 390 537 25 128 – – 483 159 281 635 766 353
See footnotes at end of table.
58 Puerto Rico–Manufacturing 2002 Economic Census of Island AreasU.S. Census Bureau, 2002 Economic Census

Table 12. Selected Statistics by Industry for Puerto Rico and Metropolitan Areas: 2002�Con.[Includes only establishments of firms with payroll. For meaning of abbreviations and symbols, see introductory text. For explanation of terms, see Appendix A. For definitions and hierarchy ofmetropolitan statistical areas (CSAs, MSAs, and municipios), see Appendix E. Data based on the 2002 Economic Census. For information on confidentiality protection, sampling error, nonsamplingerror, and definitions, see note at the end of the table]
2002NAICScode
Industry and metropolitanareas
All employees1
Production workers Other employees
Estab�lishments(number)
Totalannualpayroll
($1,000)
Totalfirst�
quarterpayroll
($1,000)
Totalem�
ployees(number)
Averagefor the
year(number)
Wages($1,000) Number
Salaries($1,000)
Pro�prietors
andpartners2
(number)
Unpaidfamily
workers2
(number)
Valueadded
bymanufacture
($1,000)
Cost ofmaterials($1,000)
Value ofshipments
($1,000)
PUERTO RICO�Con.31�33 Manufacturing�Con.325 Chemical
manufacturing�Con.3259 Other chemical
product andpreparationmanufacturing 5������ 1 941 597 r75 39 817 r36 1 124 – – 24 486 13 274 37 547
326 Plastics and rubberproductsmanufacturing 67�������� 82 411 19 332 3 754 2 739 51 203 1 015 31 208 1 4 257 014 242 925 499 007
3261 Plastics productmanufacturing 57������ 78 013 18 347 3 573 2 583 49 082 990 28 931 – 3 252 898 233 994 485 671
3262 Rubber productmanufacturing 10������ 4 398 985 181 156 2 121 25 2 277 1 1 4 116 8 931 13 336
327 Nonmetallic mineralproduct manufacturing 157� 82 210 18 220 3 956 2 697 51 698 1 259 30 512 16 14 284 665 256 199 529 642
3271 Clay product andrefractorymanufacturing 3������ D D b b D b D D D D D D
3272 Glass and glassproductmanufacturing 4������ 6 590 1 713 310 243 4 280 67 2 310 1 – 24 589 19 622 41 364
3273 Cement and concreteproductmanufacturing 138������ 68 933 15 151 3 328 2 288 44 463 1 040 24 470 14 14 243 013 229 206 468 368
32731 Cementmanufacturing 3���� D D c c D b D D D D D D
32732 Ready�mix concretemanufacturing 77���� 35 373 7 787 1 466 959 21 226 507 14 147 4 7 136 120 137 143 268 887
32733 Concrete pipe,brick, and blockmanufacturing 31���� D D f e D c D D D D D D
32739 Other concreteproductmanufacturing 27���� 15 246 3 083 1 031 762 11 351 269 3 895 3 4 49 280 37 434 86 267
3274 Lime and gypsumproductmanufacturing 1������ D D a a D a D D D D D D
3279 Other nonmetallicmineral productmanufacturing 11������ 5 985 1 289 241 134 2 555 107 3 430 – – 14 987 6 517 17 080
331 Primary metalmanufacturing 34�������� 12 508 2 950 973 721 8 565 252 3 943 6 4 43 346 33 637 75 152
3311 Iron and steel millsand ferroalloymanufacturing 14������ 4 547 1 093 326 242 3 259 84 1 288 2 1 21 406 13 787 34 131
3312 Steel productmanufacturing frompurchased steel 7���� 4 596 995 223 151 2 947 72 1 649 – – 9 769 9 766 18 796
3313 Alumina andaluminum productionand processing 10����� D D c c D b D D D D D D
3314 Nonferrous metal(except aluminum)production andprocessing 2��������� D D a a D a D D D D D D
3315 Foundries 1����������� D D c c D b D D D D D D
332 Fabricated metalproduct manufacturing 289� 105 703 24 135 r6 960 r5 171 73 649 r1 789 32 052 43 18 427 227 356 727 782 960
3321 Forging andstamping 17���������� 4 076 1 039 271 194 2 248 77 1 828 2 – 17 729 9 821 26 288
3322 Cutlery and handtoolmanufacturing 8������ 3 452 791 307 237 2 771 70 680 1 1 12 925 18 254 31 902
3323 Architectural andstructural metalsmanufacturing 165������ 60 925 13 525 r3 966 r3 013 42 277 r953 18 648 31 8 189 215 160 825 350 791
3324 Boiler, tank, andshipping containermanufacturing 15������ 12 034 3 135 537 393 8 114 144 3 920 – – 136 324 111 854 248 025
33241 Power boiler andheat exchangermanufacturing 1���� D D a a D a D D D D D D
33243 Metal can, box, andother metalcontainer (lightgauge)manufacturing 14���� D D f e D c D D D D D D
3326 Spring and wireproductmanufacturing 3������ 995 229 99 45 602 54 393 – – 3 720 3 068 6 841
See footnotes at end of table.
2002 Economic Census of Island Areas Puerto Rico–Manufacturing 59U.S. Census Bureau, 2002 Economic Census

Table 12. Selected Statistics by Industry for Puerto Rico and Metropolitan Areas: 2002�Con.[Includes only establishments of firms with payroll. For meaning of abbreviations and symbols, see introductory text. For explanation of terms, see Appendix A. For definitions and hierarchy ofmetropolitan statistical areas (CSAs, MSAs, and municipios), see Appendix E. Data based on the 2002 Economic Census. For information on confidentiality protection, sampling error, nonsamplingerror, and definitions, see note at the end of the table]
2002NAICScode
Industry and metropolitanareas
All employees1
Production workers Other employees
Estab�lishments(number)
Totalannualpayroll
($1,000)
Totalfirst�
quarterpayroll
($1,000)
Totalem�
ployees(number)
Averagefor the
year(number)
Wages($1,000) Number
Salaries($1,000)
Pro�prietors
andpartners2
(number)
Unpaidfamily
workers2
(number)
Valueadded
bymanufacture
($1,000)
Cost ofmaterials($1,000)
Value ofshipments
($1,000)
PUERTO RICO�Con.31�33 Manufacturing�Con.332 Fabricated metal
product manufacturing�Con.
3327 Machine shops;turned product; andscrew, nut, and boltmanufacturing 35������ 5 608 1 248 427 314 3 884 113 1 724 5 5 14 222 10 973 24 265
33271 Machine shops 11���� 739 182 62 53 487 9 252 1 1 1 691 2 321 4 01733272 Turned product and
screw, nut, andboltmanufacturing 24���� 4 869 1 066 365 261 3 397 104 1 472 4 4 12 531 8 652 20 248
3328 Coating, engraving,heat treating, andallied activities 15������ 5 839 1 371 376 275 4 281 101 1 557 – 1 14 943 8 495 23 699
3329 Other fabricated metalproductmanufacturing 31������ 12 774 2 797 977 700 9 472 277 3 302 4 3 38 149 33 437 71 149
333 Machinerymanufacturing 42�������� 30 918 7 154 1 697 1 157 20 098 540 10 820 2 4 171 969 112 869 284 538
3331 Agriculture,construction, andmining machinerymanufacturing 1������ D D a a D a D D D D D D
3332 Industrial machinerymanufacturing 4������ D D b b D a D D D D D D
3333 Commercial andservice industrymachinerymanufacturing 4������ 750 182 32 17 403 15 347 – – 2 961 1 698 4 742
3334 Ventilation, heating,air�conditioning, andcommercialrefrigerationequipmentmanufacturing 15������ D D f f D c D D D D D D
3335 Metalworkingmachinerymanufacturing 15������ 10 675 2 340 707 449 7 632 258 3 043 – 1 34 809 17 185 51 739
3339 Other generalpurpose machinerymanufacturing 3������ D D c c D a D D D D D D
334 Computer and electronicproduct manufacturing 49� 282 068 62 559 10 905 8 126 201 329 2 779 80 739 – – 1 184 914 1 147 576 2 288 076
3341 Computer andperipheral equipmentmanufacturing 5������ D D g g D c D D D D D D
33411 Computer andperipheralequipmentmanufacturing 5���� D D g g D c D D D D D D
3342 Communicationsequipmentmanufacturing 5������ 36 143 7 077 1 776 1 326 33 247 450 2 896 – – 36 592 63 355 104 754
33421 Telephoneapparatusmanufacturing 1���� D D b b D a D D D D D D
33422 Radio and televisionbroadcasting andwirelesscommunicationsequipmentmanufacturing 3���� D D g g D e D D D D D D
33429 Othercommunicationsequipmentmanufacturing 1���� D D c c D a D D D D D D
3343 Audio and videoequipmentmanufacturing 1������ D D c c D b D D D D D D
3344 Semiconductor andother electroniccomponentmanufacturing 24������ 177 192 40 772 6 382 4 546 121 779 1 836 55 413 – – 772 658 788 700 1 554 464
3345 Navigational,measuring,electromedical, andcontrol instrumentsmanufacturing 11������ 29 509 5 055 1 296 1 117 20 152 179 9 357 – – 126 263 137 132 250 422
3346 Manufacturing andreproducingmagnetic and opticalmedia 3������������� D D a a D a D D D D D D
See footnotes at end of table.
60 Puerto Rico–Manufacturing 2002 Economic Census of Island AreasU.S. Census Bureau, 2002 Economic Census

Table 12. Selected Statistics by Industry for Puerto Rico and Metropolitan Areas: 2002�Con.[Includes only establishments of firms with payroll. For meaning of abbreviations and symbols, see introductory text. For explanation of terms, see Appendix A. For definitions and hierarchy ofmetropolitan statistical areas (CSAs, MSAs, and municipios), see Appendix E. Data based on the 2002 Economic Census. For information on confidentiality protection, sampling error, nonsamplingerror, and definitions, see note at the end of the table]
2002NAICScode
Industry and metropolitanareas
All employees1
Production workers Other employees
Estab�lishments(number)
Totalannualpayroll
($1,000)
Totalfirst�
quarterpayroll
($1,000)
Totalem�
ployees(number)
Averagefor the
year(number)
Wages($1,000) Number
Salaries($1,000)
Pro�prietors
andpartners2
(number)
Unpaidfamily
workers2
(number)
Valueadded
bymanufacture
($1,000)
Cost ofmaterials($1,000)
Value ofshipments
($1,000)
PUERTO RICO�Con.
31�33 Manufacturing�Con.335 Electrical equipment,
appliance, andcomponentmanufacturing 41�������� 155 024 36 174 7 084 6 000 119 106 1 084 35 918 – 1 693 786 388 589 1 100 588
3351 Electric lightingequipmentmanufacturing 6������ D D f e D c D D D D D D
3352 Household appliancemanufacturing 1������ D D a a D a D D D D D D
3353 Electrical equipmentmanufacturing 29������ 118 727 27 504 5 258 4 416 93 235 842 25 492 – – 547 387 279 927 846 763
3359 Other electricalequipment andcomponentmanufacturing 5������ D D g g D b D D D D D D
336 Transportationequipmentmanufacturing 19�������� 25 813 5 888 1 646 966 16 668 680 9 145 1 – 61 833 69 451 138 842
3362 Motor vehicle bodyand trailermanufacturing 1������ D D c c D b D D D D D D
3363 Motor vehicle partsmanufacturing 13������ 23 021 5 144 1 463 848 14 530 615 8 491 1 – 54 696 62 455 124 116
3364 Aerospace productand partsmanufacturing 1������ D D a a D a D D D D D D
3366 Ship and boatbuilding 4������������ D D a a D a D D D D D D
337 Furniture and relatedproduct manufacturing 183� 28 635 6 192 2 784 2 040 22 936 744 5 699 84 14 70 335 64 968 131 619
3371 Household andinstitutional furnitureand kitchen cabinetmanufacturing 154������ 21 805 4 444 2 228 1 656 17 743 572 4 062 81 12 49 270 45 108 90 265
33711 Wood kitchencabinet andcountertopmanufacturing 75���� 8 168 1 131 573 393 7 179 180 989 26 5 9 481 14 836 24 103
33712 Household andinstitutionalfurnituremanufacturing 79���� 13 637 3 313 1 655 1 263 10 564 392 3 073 55 7 39 789 30 272 66 162
3372 Office furniture(including fixtures)manufacturing 16������ 3 432 836 322 234 2 419 88 1 013 2 1 7 920 12 615 20 779
3379 Other furniture relatedproductmanufacturing 13������ 3 398 912 234 150 2 774 84 624 1 1 13 145 7 245 20 575
339 Miscellaneousmanufacturing 138�������� 383 915 87 928 r18 527 r13 267 229 831 r5 260 154 084 101 44 2 159 639 1 086 423 3 236 732
3391 Medical equipmentand suppliesmanufacturing 81������ 343 164 77 576 r16 241 r11 679 202 735 r4 562 140 429 93 6 1 998 440 983 890 2 982 585
33911 Medical equipmentand suppliesmanufacturing 81���� 343 164 77 576 r16 241 r11 679 202 735 r4 562 140 429 93 6 1 998 440 983 890 2 982 585
3399 Other miscellaneousmanufacturing 57������ 40 751 10 352 r2 286 r1 588 27 096 r698 13 655 8 38 161 199 102 533 254 147
33991 Jewelry andsilverwaremanufacturing 15���� 14 047 3 839 684 516 9 702 168 4 345 3 – 57 966 37 250 93 461
33992 Sporting andathletic goodsmanufacturing 2���� D D b a D a D D D D D D
33993 Doll, toy, and gamemanufacturing 1���� D D a a D a D D D D D D
33994 Office supplies(except paper)manufacturing 5���� 7 501 1 791 615 390 5 465 225 2 036 – – 33 656 26 161 58 540
33995 Signmanufacturing 23���� D D e e D c D D D D D D
33999 All othermiscellaneousmanufacturing 11���� 12 334 2 970 r537 r356 6 796 r181 5 538 – 33 49 935 21 818 65 695
See footnotes at end of table.
2002 Economic Census of Island Areas Puerto Rico–Manufacturing 61U.S. Census Bureau, 2002 Economic Census

Table 12. Selected Statistics by Industry for Puerto Rico and Metropolitan Areas: 2002�Con.[Includes only establishments of firms with payroll. For meaning of abbreviations and symbols, see introductory text. For explanation of terms, see Appendix A. For definitions and hierarchy ofmetropolitan statistical areas (CSAs, MSAs, and municipios), see Appendix E. Data based on the 2002 Economic Census. For information on confidentiality protection, sampling error, nonsamplingerror, and definitions, see note at the end of the table]
2002NAICScode
Industry and metropolitanareas
All employees1
Production workers Other employees
Estab�lishments(number)
Totalannualpayroll
($1,000)
Totalfirst�
quarterpayroll
($1,000)
Totalem�
ployees(number)
Averagefor the
year(number)
Wages($1,000) Number
Salaries($1,000)
Pro�prietors
andpartners2
(number)
Unpaidfamily
workers2
(number)
Valueadded
bymanufacture
($1,000)
Cost ofmaterials($1,000)
Value ofshipments
($1,000)
MAYAGÜEZ�SANGERMÁN�CABOROJO, PRCOMBINEDSTATISTICAL AREA
31�33 Manufacturing 152���������� 192 882 47 690 10 501 7 687 121 475 2 814 71 407 27 18 2 590 289 1 126 804 3 663 797
311 Food manufacturing 37���� 17 750 4 273 1 457 844 11 618 613 6 132 7 8 81 096 94 499 175 793
312 Beverage and tobaccoproduct manufacturing 4� D D e c D c D D D D D D
313 Textile mills 1����������� D D a a D a D D D D D D
314 Textile product mills 1���� D D b b D a D D D D D D
315 Apparel manufacturing 13� D D h g D e D D D D D D
321 Wood productmanufacturing 7�������� D D c b D b D D D D D D
322 Paper manufacturing 1��� D D b a D a D D D D D D
323 Printing and relatedsupport activities 11������ 1 215 328 124 63 1 013 61 202 1 – 3 470 1 453 4 878
324 Petroleum and coalproductsmanufacturing 1�������� D D a a D a D D D D D D
325 Chemicalmanufacturing 8�������� 52 488 15 847 1 391 835 29 407 556 23 081 – – 1 894 672 493 503 2 367 783
326 Plastics and rubberproductsmanufacturing 3�������� 994 207 66 42 679 24 315 – – 4 132 3 656 7 884
327 Nonmetallic mineralproduct manufacturing 17� D D f e D e D D D D D D
331 Primary metalmanufacturing 3�������� D D a a D a D D D D D D
332 Fabricated metalproduct manufacturing 19� 8 579 1 901 575 429 6 362 146 2 217 5 1 61 119 65 848 127 407
333 Machinerymanufacturing 1�������� D D a a D a D D D D D D
334 Computer and electronicproduct manufacturing 4� D D f f D b D D D D D D
335 Electrical equipment,appliance, andcomponentmanufacturing 3�������� D D f f D c D D D D D D
336 Transportationequipmentmanufacturing 1�������� D D a a D a D D D D D D
337 Furniture and relatedproduct manufacturing 11� 947 202 91 73 709 18 238 4 4 1 391 1 571 2 963
339 Miscellaneousmanufacturing 6�������� D D g g D c D D D D D D
MAYAGÜEZ, PRMETROPOLITANSTATISTICAL AREA
31�33 Manufacturing 76���������� 101 720 26 328 5 763 3 978 66 325 1 785 35 395 13 13 2 144 109 685 813 2 775 924
311 Food manufacturing 23���� 17 248 4 160 1 396 803 11 248 593 6 000 3 6 78 912 92 493 171 577
312 Beverage and tobaccoproduct manufacturing 2� D D b a D a D D D D D D
313 Textile mills 1����������� D D a a D a D D D D D D
314 Textile product mills 1���� D D b b D a D D D D D D
315 Apparel manufacturing 8� 20 648 4 670 1 566 1 205 13 717 361 6 931 1 1 40 177 50 885 90 964
321 Wood productmanufacturing 2�������� D D a a D a D D D D D D
322 Paper manufacturing 1��� D D b a D a D D D D D D
323 Printing and relatedsupport activities 4������ 209 56 35 20 175 15 34 – – 687 420 1 100
325 Chemicalmanufacturing 5�������� D D f f D e D D D D D D
326 Plastics and rubberproductsmanufacturing 1�������� D D a a D a D D D D D D
327 Nonmetallic mineralproduct manufacturing 6� D D e c D e D D D D D D
331 Primary metalmanufacturing 1�������� D D a a D a D D D D D D
See footnotes at end of table.
62 Puerto Rico–Manufacturing 2002 Economic Census of Island AreasU.S. Census Bureau, 2002 Economic Census

Table 12. Selected Statistics by Industry for Puerto Rico and Metropolitan Areas: 2002�Con.[Includes only establishments of firms with payroll. For meaning of abbreviations and symbols, see introductory text. For explanation of terms, see Appendix A. For definitions and hierarchy ofmetropolitan statistical areas (CSAs, MSAs, and municipios), see Appendix E. Data based on the 2002 Economic Census. For information on confidentiality protection, sampling error, nonsamplingerror, and definitions, see note at the end of the table]
2002NAICScode
Industry and metropolitanareas
All employees1
Production workers Other employees
Estab�lishments(number)
Totalannualpayroll
($1,000)
Totalfirst�
quarterpayroll
($1,000)
Totalem�
ployees(number)
Averagefor the
year(number)
Wages($1,000) Number
Salaries($1,000)
Pro�prietors
andpartners2
(number)
Unpaidfamily
workers2
(number)
Valueadded
bymanufacture
($1,000)
Cost ofmaterials($1,000)
Value ofshipments
($1,000)
MAYAGÜEZ, PRMETROPOLITANSTATISTICAL AREA�Con.
31�33 Manufacturing�Con.332 Fabricated metal
product manufacturing 11� 7 082 1 517 418 325 5 196 93 1 886 3 1 58 501 63 015 121 954
334 Computer and electronicproduct manufacturing 2� D D f f D b D D D D D D
336 Transportationequipmentmanufacturing 1�������� D D a a D a D D D D D D
337 Furniture and relatedproduct manufacturing 4� 511 100 52 44 434 8 77 1 2 919 835 1 753
339 Miscellaneousmanufacturing 3�������� 435 100 33 30 344 3 91 – – 1 118 325 1 436
SAN GERMÁN�CABOROJO, PRMETROPOLITANSTATISTICAL AREA
31�33 Manufacturing 76���������� 91 162 21 362 4 738 3 709 55 150 1 029 36 012 14 5 446 180 440 991 887 873
311 Food manufacturing 14���� 502 113 61 41 370 20 132 4 2 2 184 2 006 4 216
312 Beverage and tobaccoproduct manufacturing 2� D D c b D c D D D D D D
315 Apparel manufacturing 5� D D g f D c D D D D D D
321 Wood productmanufacturing 5�������� 904 205 94 77 715 17 189 2 1 2 545 2 427 4 997
323 Printing and relatedsupport activities 7������ 1 006 272 89 43 838 46 168 1 – 2 783 1 033 3 778
324 Petroleum and coalproductsmanufacturing 1�������� D D a a D a D D D D D D
325 Chemicalmanufacturing 3�������� D D f e D c D D D D D D
326 Plastics and rubberproductsmanufacturing 2�������� D D b b D a D D D D D D
327 Nonmetallic mineralproduct manufacturing 11� 821 237 80 65 722 15 99 1 – 4 203 4 698 8 840
331 Primary metalmanufacturing 2�������� D D a a D a D D D D D D
332 Fabricated metalproduct manufacturing 8� 1 497 384 157 104 1 166 53 331 2 – 2 618 2 833 5 453
333 Machinerymanufacturing 1�������� D D a a D a D D D D D D
334 Computer and electronicproduct manufacturing 2� D D c c D a D D D D D D
335 Electrical equipment,appliance, andcomponentmanufacturing 3�������� D D f f D c D D D D D D
337 Furniture and relatedproduct manufacturing 7� 436 102 39 29 275 10 161 3 2 472 736 1 210
339 Miscellaneousmanufacturing 3�������� D D g f D c D D D D D D
See footnotes at end of table.
2002 Economic Census of Island Areas Puerto Rico–Manufacturing 63U.S. Census Bureau, 2002 Economic Census

Table 12. Selected Statistics by Industry for Puerto Rico and Metropolitan Areas: 2002�Con.[Includes only establishments of firms with payroll. For meaning of abbreviations and symbols, see introductory text. For explanation of terms, see Appendix A. For definitions and hierarchy ofmetropolitan statistical areas (CSAs, MSAs, and municipios), see Appendix E. Data based on the 2002 Economic Census. For information on confidentiality protection, sampling error, nonsamplingerror, and definitions, see note at the end of the table]
2002NAICScode
Industry and metropolitanareas
All employees1
Production workers Other employees
Estab�lishments(number)
Totalannualpayroll
($1,000)
Totalfirst�
quarterpayroll
($1,000)
Totalem�
ployees(number)
Averagefor the
year(number)
Wages($1,000) Number
Salaries($1,000)
Pro�prietors
andpartners2
(number)
Unpaidfamily
workers2
(number)
Valueadded
bymanufacture
($1,000)
Cost ofmaterials($1,000)
Value ofshipments
($1,000)
PONCE�YAUCO�COAMO, PRCOMBINEDSTATISTICAL AREA
31�33 Manufacturing 213���������� 256 071 r56 976 r12 680 r8 962 r168 327 r3 718 r87 744 33 15 1 114 164 1 062 918 2 164 083
311 Food manufacturing 49���� D D g g D e D D D D D D
312 Beverage and tobaccoproduct manufacturing 5� D D e c D c D D D D D D
313 Textile mills 1����������� D D a a D a D D D D D D
314 Textile product mills 1���� D D a a D a D D D D D D
315 Apparel manufacturing 10� 5 725 1 446 223 163 4 697 60 1 028 – – 15 036 13 561 28 451
321 Wood productmanufacturing 11�������� D D e c D b D D D D D D
322 Paper manufacturing 5��� D D c b D b D D D D D D
323 Printing and relatedsupport activities 10������ D D b b D a D D D D D D
324 Petroleum and coalproductsmanufacturing 7�������� 4 473 1 094 204 132 3 457 72 1 016 – – 46 918 173 615 218 922
325 Chemicalmanufacturing 7�������� 5 059 1 223 204 113 3 024 91 2 035 – – 28 612 18 898 47 012
326 Plastics and rubberproductsmanufacturing 8�������� 8 158 1 868 402 291 4 805 111 3 353 1 1 19 360 27 677 46 939
327 Nonmetallic mineralproduct manufacturing 14� 2 577 570 182 139 1 898 43 679 2 2 14 922 7 498 22 309
331 Primary metalmanufacturing 3�������� 57 20 4 4 52 – 5 1 – 486 591 1 010
332 Fabricated metalproduct manufacturing 24� 4 650 1 033 307 228 3 101 79 1 549 8 – 10 144 14 859 24 775
333 Machinerymanufacturing 5�������� D D c c D b D D D D D D
334 Computer and electronicproduct manufacturing 7� D D g g D f D D D D D D
335 Electrical equipment,appliance, andcomponentmanufacturing 2�������� D D f f D e D D D D D D
336 Transportationequipmentmanufacturing 3�������� D D f e D c D D D D D D
337 Furniture and relatedproduct manufacturing 24� D D c c D b D D D D D D
339 Miscellaneousmanufacturing 17�������� D D h h D g D D D D D D
COAMO, PRMICROPOLITANSTATISTICAL AREA
31�33 Manufacturing 16���������� 23 153 5 584 1 431 1 294 19 395 137 3 758 – – 59 358 118 461 177 205
311 Food manufacturing 6���� D D f f D a D D D D D D
315 Apparel manufacturing 1� D D a a D a D D D D D D
321 Wood productmanufacturing 2�������� D D c c D b D D D D D D
323 Printing and relatedsupport activities 1������ D D a a D a D D D D D D
332 Fabricated metalproduct manufacturing 2� D D a a D a D D D D D D
333 Machinerymanufacturing 1�������� D D c c D a D D D D D D
334 Computer and electronicproduct manufacturing 1� D D e e D b D D D D D D
337 Furniture and relatedproduct manufacturing 1� D D a a D a D D D D D D
339 Miscellaneousmanufacturing 1�������� D D a a D a D D D D D D
See footnotes at end of table.
64 Puerto Rico–Manufacturing 2002 Economic Census of Island AreasU.S. Census Bureau, 2002 Economic Census

Table 12. Selected Statistics by Industry for Puerto Rico and Metropolitan Areas: 2002�Con.[Includes only establishments of firms with payroll. For meaning of abbreviations and symbols, see introductory text. For explanation of terms, see Appendix A. For definitions and hierarchy ofmetropolitan statistical areas (CSAs, MSAs, and municipios), see Appendix E. Data based on the 2002 Economic Census. For information on confidentiality protection, sampling error, nonsamplingerror, and definitions, see note at the end of the table]
2002NAICScode
Industry and metropolitanareas
All employees1
Production workers Other employees
Estab�lishments(number)
Totalannualpayroll
($1,000)
Totalfirst�
quarterpayroll
($1,000)
Totalem�
ployees(number)
Averagefor the
year(number)
Wages($1,000) Number
Salaries($1,000)
Pro�prietors
andpartners2
(number)
Unpaidfamily
workers2
(number)
Valueadded
bymanufacture
($1,000)
Cost ofmaterials($1,000)
Value ofshipments
($1,000)
PONCE, PRMETROPOLITANSTATISTICAL AREA
31�33 Manufacturing 140���������� 186 499 40 436 r9 101 r6 230 120 749 r2 871 65 750 22 14 895 999 669 118 1 551 665
311 Food manufacturing 28���� 8 025 1 917 673 382 4 429 291 3 596 6 7 21 459 16 027 37 755
312 Beverage and tobaccoproduct manufacturing 5� D D e c D c D D D D D D
313 Textile mills 1����������� D D a a D a D D D D D D
314 Textile product mills 1���� D D a a D a D D D D D D
315 Apparel manufacturing 7� D D c c D b D D D D D D
321 Wood productmanufacturing 5�������� D D b b D b D D D D D D
322 Paper manufacturing 5��� D D c b D b D D D D D D
323 Printing and relatedsupport activities 8������ 879 210 68 53 685 15 194 2 – 2 013 920 2 848
324 Petroleum and coalproductsmanufacturing 3�������� 1 718 402 103 61 1 434 42 284 – – 10 357 23 055 32 402
325 Chemicalmanufacturing 3�������� 629 166 45 15 375 30 254 – – 3 407 1 615 4 820
326 Plastics and rubberproductsmanufacturing 8�������� 8 158 1 868 402 291 4 805 111 3 353 1 1 19 360 27 677 46 939
327 Nonmetallic mineralproduct manufacturing 11� 2 449 538 167 128 1 794 39 655 1 2 14 562 7 019 21 430
331 Primary metalmanufacturing 2�������� D D a a D a D D D D D D
332 Fabricated metalproduct manufacturing 16� 3 669 846 250 179 2 373 71 1 296 6 – 5 345 11 512 16 653
333 Machinerymanufacturing 4�������� 681 230 53 36 525 17 156 – – 2 029 1 087 3 183
334 Computer and electronicproduct manufacturing 5� 41 154 10 353 1 331 857 26 118 474 15 036 – – 170 148 185 822 355 052
336 Transportationequipmentmanufacturing 3�������� D D f e D c D D D D D D
337 Furniture and relatedproduct manufacturing 13� 2 150 505 117 75 1 687 42 463 1 2 9 996 1 964 11 987
339 Miscellaneousmanufacturing 12�������� 87 831 16 162 r4 517 r3 330 58 951 r1 187 28 880 1 – 534 376 307 887 831 326
SANTA ISABEL, PRMICROPOLITANSTATISTICAL AREA
31�33 Manufacturing 7���������� 27 891 r6 489 r1 221 r803 r17 154 r418 r10 737 – – 61 519 82 019 150 153
311 Food manufacturing 3���� D D c c D b D D D D D D
332 Fabricated metalproduct manufacturing 1� D D a a D a D D D D D D
334 Computer and electronicproduct manufacturing 1� D D c c D b D D D D D D
335 Electrical equipment,appliance, andcomponentmanufacturing 2�������� D D f f D e D D D D D D
See footnotes at end of table.
2002 Economic Census of Island Areas Puerto Rico–Manufacturing 65U.S. Census Bureau, 2002 Economic Census
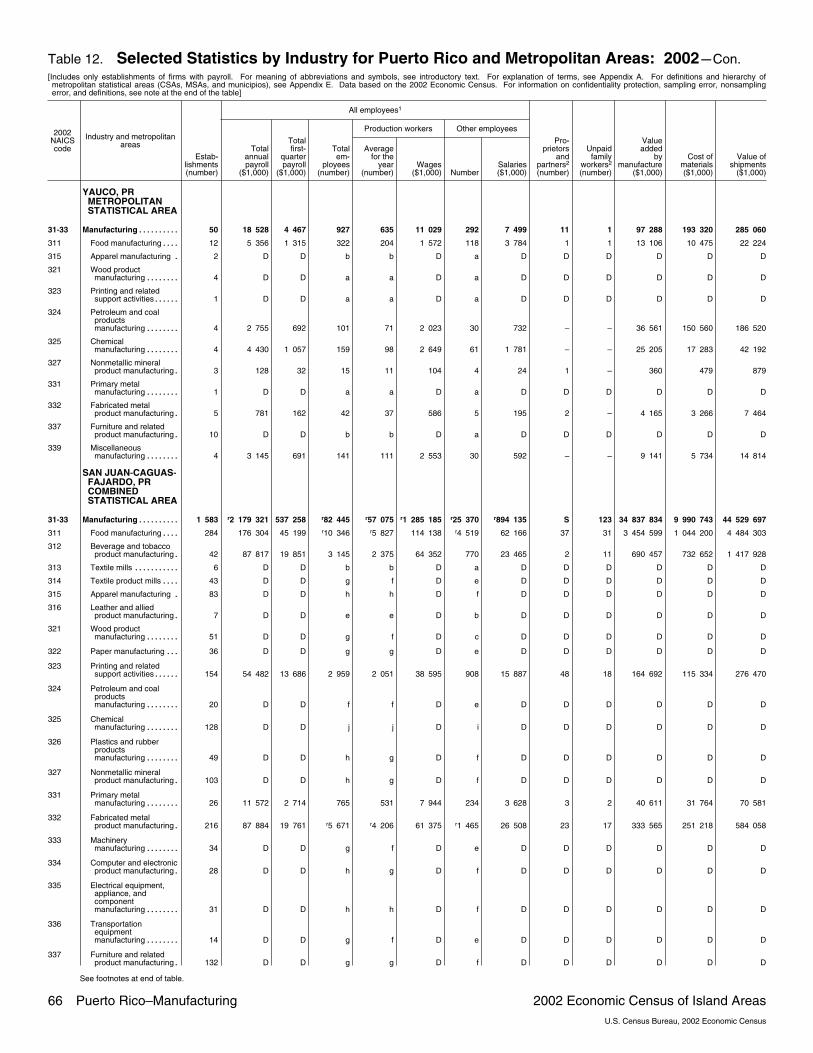
Table 12. Selected Statistics by Industry for Puerto Rico and Metropolitan Areas: 2002�Con.[Includes only establishments of firms with payroll. For meaning of abbreviations and symbols, see introductory text. For explanation of terms, see Appendix A. For definitions and hierarchy ofmetropolitan statistical areas (CSAs, MSAs, and municipios), see Appendix E. Data based on the 2002 Economic Census. For information on confidentiality protection, sampling error, nonsamplingerror, and definitions, see note at the end of the table]
2002NAICScode
Industry and metropolitanareas
All employees1
Production workers Other employees
Estab�lishments(number)
Totalannualpayroll
($1,000)
Totalfirst�
quarterpayroll
($1,000)
Totalem�
ployees(number)
Averagefor the
year(number)
Wages($1,000) Number
Salaries($1,000)
Pro�prietors
andpartners2
(number)
Unpaidfamily
workers2
(number)
Valueadded
bymanufacture
($1,000)
Cost ofmaterials($1,000)
Value ofshipments
($1,000)
YAUCO, PRMETROPOLITANSTATISTICAL AREA
31�33 Manufacturing 50���������� 18 528 4 467 927 635 11 029 292 7 499 11 1 97 288 193 320 285 060
311 Food manufacturing 12���� 5 356 1 315 322 204 1 572 118 3 784 1 1 13 106 10 475 22 224
315 Apparel manufacturing 2� D D b b D a D D D D D D
321 Wood productmanufacturing 4�������� D D a a D a D D D D D D
323 Printing and relatedsupport activities 1������ D D a a D a D D D D D D
324 Petroleum and coalproductsmanufacturing 4�������� 2 755 692 101 71 2 023 30 732 – – 36 561 150 560 186 520
325 Chemicalmanufacturing 4�������� 4 430 1 057 159 98 2 649 61 1 781 – – 25 205 17 283 42 192
327 Nonmetallic mineralproduct manufacturing 3� 128 32 15 11 104 4 24 1 – 360 479 879
331 Primary metalmanufacturing 1�������� D D a a D a D D D D D D
332 Fabricated metalproduct manufacturing 5� 781 162 42 37 586 5 195 2 – 4 165 3 266 7 464
337 Furniture and relatedproduct manufacturing 10� D D b b D a D D D D D D
339 Miscellaneousmanufacturing 4�������� 3 145 691 141 111 2 553 30 592 – – 9 141 5 734 14 814
SAN JUAN�CAGUAS�FAJARDO, PRCOMBINEDSTATISTICAL AREA
31�33 Manufacturing 1 583����������r2 179 321 537 258 r82 445 r57 075 r1 285 185 r25 370 r894 135 S 123 34 837 834 9 990 743 44 529 697
311 Food manufacturing 284���� 176 304 45 199 r10 346 r5 827 114 138 r4 519 62 166 37 31 3 454 599 1 044 200 4 484 303
312 Beverage and tobaccoproduct manufacturing 42� 87 817 19 851 3 145 2 375 64 352 770 23 465 2 11 690 457 732 652 1 417 928
313 Textile mills 6����������� D D b b D a D D D D D D
314 Textile product mills 43���� D D g f D e D D D D D D
315 Apparel manufacturing 83� D D h h D f D D D D D D
316 Leather and alliedproduct manufacturing 7� D D e e D b D D D D D D
321 Wood productmanufacturing 51�������� D D g f D c D D D D D D
322 Paper manufacturing 36��� D D g g D e D D D D D D
323 Printing and relatedsupport activities 154������ 54 482 13 686 2 959 2 051 38 595 908 15 887 48 18 164 692 115 334 276 470
324 Petroleum and coalproductsmanufacturing 20�������� D D f f D e D D D D D D
325 Chemicalmanufacturing 128�������� D D j j D i D D D D D D
326 Plastics and rubberproductsmanufacturing 49�������� D D h g D f D D D D D D
327 Nonmetallic mineralproduct manufacturing 103� D D h g D f D D D D D D
331 Primary metalmanufacturing 26�������� 11 572 2 714 765 531 7 944 234 3 628 3 2 40 611 31 764 70 581
332 Fabricated metalproduct manufacturing 216� 87 884 19 761 r5 671 r4 206 61 375 r1 465 26 508 23 17 333 565 251 218 584 058
333 Machinerymanufacturing 34�������� D D g f D e D D D D D D
334 Computer and electronicproduct manufacturing 28� D D h g D f D D D D D D
335 Electrical equipment,appliance, andcomponentmanufacturing 31�������� D D h h D f D D D D D D
336 Transportationequipmentmanufacturing 14�������� D D g f D e D D D D D D
337 Furniture and relatedproduct manufacturing 132� D D g g D f D D D D D D
See footnotes at end of table.
66 Puerto Rico–Manufacturing 2002 Economic Census of Island AreasU.S. Census Bureau, 2002 Economic Census
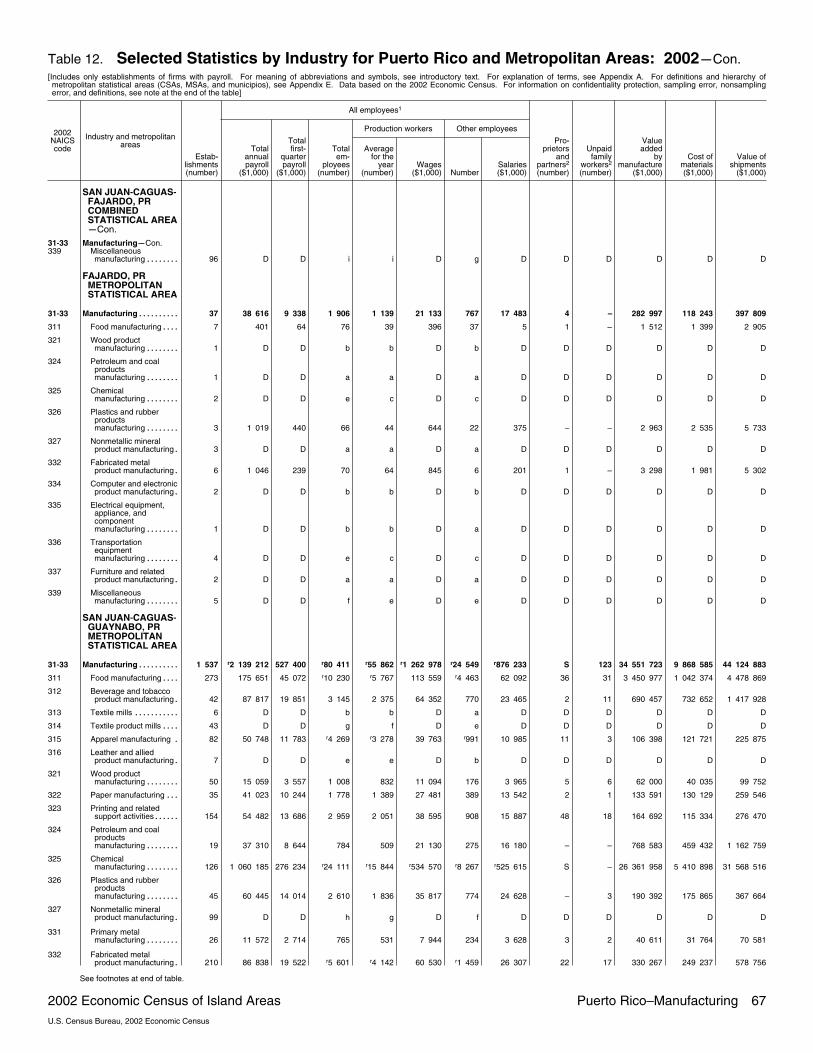
Table 12. Selected Statistics by Industry for Puerto Rico and Metropolitan Areas: 2002�Con.[Includes only establishments of firms with payroll. For meaning of abbreviations and symbols, see introductory text. For explanation of terms, see Appendix A. For definitions and hierarchy ofmetropolitan statistical areas (CSAs, MSAs, and municipios), see Appendix E. Data based on the 2002 Economic Census. For information on confidentiality protection, sampling error, nonsamplingerror, and definitions, see note at the end of the table]
2002NAICScode
Industry and metropolitanareas
All employees1
Production workers Other employees
Estab�lishments(number)
Totalannualpayroll
($1,000)
Totalfirst�
quarterpayroll
($1,000)
Totalem�
ployees(number)
Averagefor the
year(number)
Wages($1,000) Number
Salaries($1,000)
Pro�prietors
andpartners2
(number)
Unpaidfamily
workers2
(number)
Valueadded
bymanufacture
($1,000)
Cost ofmaterials($1,000)
Value ofshipments
($1,000)
SAN JUAN�CAGUAS�FAJARDO, PRCOMBINEDSTATISTICAL AREA�Con.
31�33 Manufacturing�Con.339 Miscellaneous
manufacturing 96�������� D D i i D g D D D D D D
FAJARDO, PRMETROPOLITANSTATISTICAL AREA
31�33 Manufacturing 37���������� 38 616 9 338 1 906 1 139 21 133 767 17 483 4 – 282 997 118 243 397 809
311 Food manufacturing 7���� 401 64 76 39 396 37 5 1 – 1 512 1 399 2 905
321 Wood productmanufacturing 1�������� D D b b D b D D D D D D
324 Petroleum and coalproductsmanufacturing 1�������� D D a a D a D D D D D D
325 Chemicalmanufacturing 2�������� D D e c D c D D D D D D
326 Plastics and rubberproductsmanufacturing 3�������� 1 019 440 66 44 644 22 375 – – 2 963 2 535 5 733
327 Nonmetallic mineralproduct manufacturing 3� D D a a D a D D D D D D
332 Fabricated metalproduct manufacturing 6� 1 046 239 70 64 845 6 201 1 – 3 298 1 981 5 302
334 Computer and electronicproduct manufacturing 2� D D b b D b D D D D D D
335 Electrical equipment,appliance, andcomponentmanufacturing 1�������� D D b b D a D D D D D D
336 Transportationequipmentmanufacturing 4�������� D D e c D c D D D D D D
337 Furniture and relatedproduct manufacturing 2� D D a a D a D D D D D D
339 Miscellaneousmanufacturing 5�������� D D f e D e D D D D D D
SAN JUAN�CAGUAS�GUAYNABO, PRMETROPOLITANSTATISTICAL AREA
31�33 Manufacturing 1 537����������r2 139 212 527 400 r80 411 r55 862 r1 262 978 r24 549 r876 233 S 123 34 551 723 9 868 585 44 124 883
311 Food manufacturing 273���� 175 651 45 072 r10 230 r5 767 113 559 r4 463 62 092 36 31 3 450 977 1 042 374 4 478 869
312 Beverage and tobaccoproduct manufacturing 42� 87 817 19 851 3 145 2 375 64 352 770 23 465 2 11 690 457 732 652 1 417 928
313 Textile mills 6����������� D D b b D a D D D D D D
314 Textile product mills 43���� D D g f D e D D D D D D
315 Apparel manufacturing 82� 50 748 11 783 r4 269 r3 278 39 763 r991 10 985 11 3 106 398 121 721 225 875
316 Leather and alliedproduct manufacturing 7� D D e e D b D D D D D D
321 Wood productmanufacturing 50�������� 15 059 3 557 1 008 832 11 094 176 3 965 5 6 62 000 40 035 99 752
322 Paper manufacturing 35��� 41 023 10 244 1 778 1 389 27 481 389 13 542 2 1 133 591 130 129 259 546
323 Printing and relatedsupport activities 154������ 54 482 13 686 2 959 2 051 38 595 908 15 887 48 18 164 692 115 334 276 470
324 Petroleum and coalproductsmanufacturing 19�������� 37 310 8 644 784 509 21 130 275 16 180 – – 768 583 459 432 1 162 759
325 Chemicalmanufacturing 126�������� 1 060 185 276 234 r24 111 r15 844 r534 570 r8 267 r525 615 S – 26 361 958 5 410 898 31 568 516
326 Plastics and rubberproductsmanufacturing 45�������� 60 445 14 014 2 610 1 836 35 817 774 24 628 – 3 190 392 175 865 367 664
327 Nonmetallic mineralproduct manufacturing 99� D D h g D f D D D D D D
331 Primary metalmanufacturing 26�������� 11 572 2 714 765 531 7 944 234 3 628 3 2 40 611 31 764 70 581
332 Fabricated metalproduct manufacturing 210� 86 838 19 522 r5 601 r4 142 60 530 r1 459 26 307 22 17 330 267 249 237 578 756
See footnotes at end of table.
2002 Economic Census of Island Areas Puerto Rico–Manufacturing 67U.S. Census Bureau, 2002 Economic Census

Table 12. Selected Statistics by Industry for Puerto Rico and Metropolitan Areas: 2002�Con.[Includes only establishments of firms with payroll. For meaning of abbreviations and symbols, see introductory text. For explanation of terms, see Appendix A. For definitions and hierarchy ofmetropolitan statistical areas (CSAs, MSAs, and municipios), see Appendix E. Data based on the 2002 Economic Census. For information on confidentiality protection, sampling error, nonsamplingerror, and definitions, see note at the end of the table]
2002NAICScode
Industry and metropolitanareas
All employees1
Production workers Other employees
Estab�lishments(number)
Totalannualpayroll
($1,000)
Totalfirst�
quarterpayroll
($1,000)
Totalem�
ployees(number)
Averagefor the
year(number)
Wages($1,000) Number
Salaries($1,000)
Pro�prietors
andpartners2
(number)
Unpaidfamily
workers2
(number)
Valueadded
bymanufacture
($1,000)
Cost ofmaterials($1,000)
Value ofshipments
($1,000)
SAN JUAN�CAGUAS�GUAYNABO, PRMETROPOLITANSTATISTICAL AREA�Con.
31�33 Manufacturing�Con.333 Machinery
manufacturing 33�������� D D g f D e D D D D D D
334 Computer and electronicproduct manufacturing 26� 59 512 13 208 2 775 2 107 44 415 668 15 097 – – 322 204 351 245 673 549
335 Electrical equipment,appliance, andcomponentmanufacturing 30�������� D D h h D f D D D D D D
336 Transportationequipmentmanufacturing 10�������� D D f e D e D D D D D D
337 Furniture and relatedproduct manufacturing 130� 23 773 4 822 2 354 1 724 19 052 630 4 721 70 7 50 876 58 779 108 951
339 Miscellaneousmanufacturing 91�������� 154 643 34 231 r6 746 r4 947 93 308 r1 799 61 335 99 11 961 080 367 278 1 332 457
UTUADO, PRMICROPOLITANSTATISTICAL AREA
31�33 Manufacturing 9���������� 1 493 520 128 74 1 074 54 419 – – 3 114 3 915 7 005
311 Food manufacturing 4���� 252 63 40 21 183 19 69 – – 2 110 427 2 529
315 Apparel manufacturing 1� D D b a D a D D D D D D
322 Paper manufacturing 1��� D D b b D b D D D D D D
326 Plastics and rubberproductsmanufacturing 1�������� D D a a D a D D D D D D
327 Nonmetallic mineralproduct manufacturing 1� D D a a D a D D D D D D
333 Machinerymanufacturing 1�������� D D a a D a D D D D D D
ADJUNTAS, PRMICROPOLITANSTATISTICAL AREA
31�33 Manufacturing 19���������� 42 483 8 912 2 662 2 420 35 352 242 7 131 6 34 350 916 31 091 377 067
311 Food manufacturing 7���� D D b b D b D D D D D D
315 Apparel manufacturing 4� D D g g D c D D D D D D
326 Plastics and rubberproductsmanufacturing 1�������� D D b a D a D D D D D D
327 Nonmetallic mineralproduct manufacturing 1� D D b b D a D D D D D D
332 Fabricated metalproduct manufacturing 2� D D a a D a D D D D D D
334 Computer and electronicproduct manufacturing 1� D D a a D a D D D D D D
335 Electrical equipment,appliance, andcomponentmanufacturing 1�������� D D e e D a D D D D D D
337 Furniture and relatedproduct manufacturing 1� D D a a D a D D D D D D
339 Miscellaneousmanufacturing 1�������� D D b b D a D D D D D D
See footnotes at end of table.
68 Puerto Rico–Manufacturing 2002 Economic Census of Island AreasU.S. Census Bureau, 2002 Economic Census

Table 12. Selected Statistics by Industry for Puerto Rico and Metropolitan Areas: 2002�Con.[Includes only establishments of firms with payroll. For meaning of abbreviations and symbols, see introductory text. For explanation of terms, see Appendix A. For definitions and hierarchy ofmetropolitan statistical areas (CSAs, MSAs, and municipios), see Appendix E. Data based on the 2002 Economic Census. For information on confidentiality protection, sampling error, nonsamplingerror, and definitions, see note at the end of the table]
2002NAICScode
Industry and metropolitanareas
All employees1
Production workers Other employees
Estab�lishments(number)
Totalannualpayroll
($1,000)
Totalfirst�
quarterpayroll
($1,000)
Totalem�
ployees(number)
Averagefor the
year(number)
Wages($1,000) Number
Salaries($1,000)
Pro�prietors
andpartners2
(number)
Unpaidfamily
workers2
(number)
Valueadded
bymanufacture
($1,000)
Cost ofmaterials($1,000)
Value ofshipments
($1,000)
AGUADILLA�ISABELA�SANSEBASTIÁN, PRMETROPOLITANSTATISTICAL AREA
31�33 Manufacturing 164���������� 273 370 65 946 10 935 7 660 180 493 3 275 92 876 56 25 896 990 718 438 1 606 998
311 Food manufacturing 61���� D D f e D e D D D D D D
312 Beverage and tobaccoproduct manufacturing 3� D D a a D a D D D D D D
314 Textile product mills 1���� D D f c D e D D D D D D
315 Apparel manufacturing 9� 39 458 9 838 245 199 10 797 46 28 661 10 2 5 285 2 400 7 512
316 Leather and alliedproduct manufacturing 4� D D g f D c D D D D D D
321 Wood productmanufacturing 5�������� D D a a D a D D D D D D
322 Paper manufacturing 2��� D D b b D a D D D D D D
323 Printing and relatedsupport activities 4������ D D a a D a D D D D D D
325 Chemicalmanufacturing 1�������� D D c b D b D D D D D D
326 Plastics and rubberproductsmanufacturing 2�������� D D c c D b D D D D D D
327 Nonmetallic mineralproduct manufacturing 14� 2 394 513 231 159 1 874 72 520 – 5 9 964 4 949 13 699
331 Primary metalmanufacturing 2�������� D D c c D a D D D D D D
332 Fabricated metalproduct manufacturing 19� D D c c D b D D D D D D
333 Machinerymanufacturing 2�������� D D b b D b D D D D D D
334 Computer and electronicproduct manufacturing 8� 151 254 33 568 5 172 3 752 113 943 1 420 37 311 – – 579 692 468 124 1 040 856
336 Transportationequipmentmanufacturing 1�������� D D a a D a D D D D D D
337 Furniture and relatedproduct manufacturing 13� 1 333 531 141 113 1 088 28 245 2 1 4 163 1 304 5 511
339 Miscellaneousmanufacturing 13�������� 33 243 9 439 1 942 1 331 23 532 611 9 711 1 – 119 733 69 421 185 838
GUAYAMA, PRMETROPOLITANSTATISTICAL AREA
31�33 Manufacturing 38���������� 115 001 20 848 3 978 2 736 43 087 1 242 71 914 1 2 5 464 051 281 878 5 716 834
311 Food manufacturing 5���� 77 15 13 7 76 6 1 – – 301 309 610
312 Beverage and tobaccoproduct manufacturing 2� D D a a D a D D D D D D
315 Apparel manufacturing 1� D D b b D a D D D D D D
323 Printing and relatedsupport activities 2������ D D a a D a D D D D D D
324 Petroleum and coalproductsmanufacturing 2�������� D D e c D c D D D D D D
325 Chemicalmanufacturing 7�������� D D h g D f D D D D D D
326 Plastics and rubberproductsmanufacturing 2�������� D D e e D b D D D D D D
327 Nonmetallic mineralproduct manufacturing 3� 223 52 11 8 216 3 7 – – 2 707 2 085 4 779
332 Fabricated metalproduct manufacturing 6� 2 474 849 181 145 1 082 36 1 392 – – 16 846 19 786 36 263
334 Computer and electronicproduct manufacturing 1� D D b a D a D D D D D D
335 Electrical equipment,appliance, andcomponentmanufacturing 3�������� D D e c D b D D D D D D
337 Furniture and relatedproduct manufacturing 2� D D a a D a D D D D D D
339 Miscellaneousmanufacturing 2�������� D D e b D c D D D D D D
See footnotes at end of table.
2002 Economic Census of Island Areas Puerto Rico–Manufacturing 69U.S. Census Bureau, 2002 Economic Census
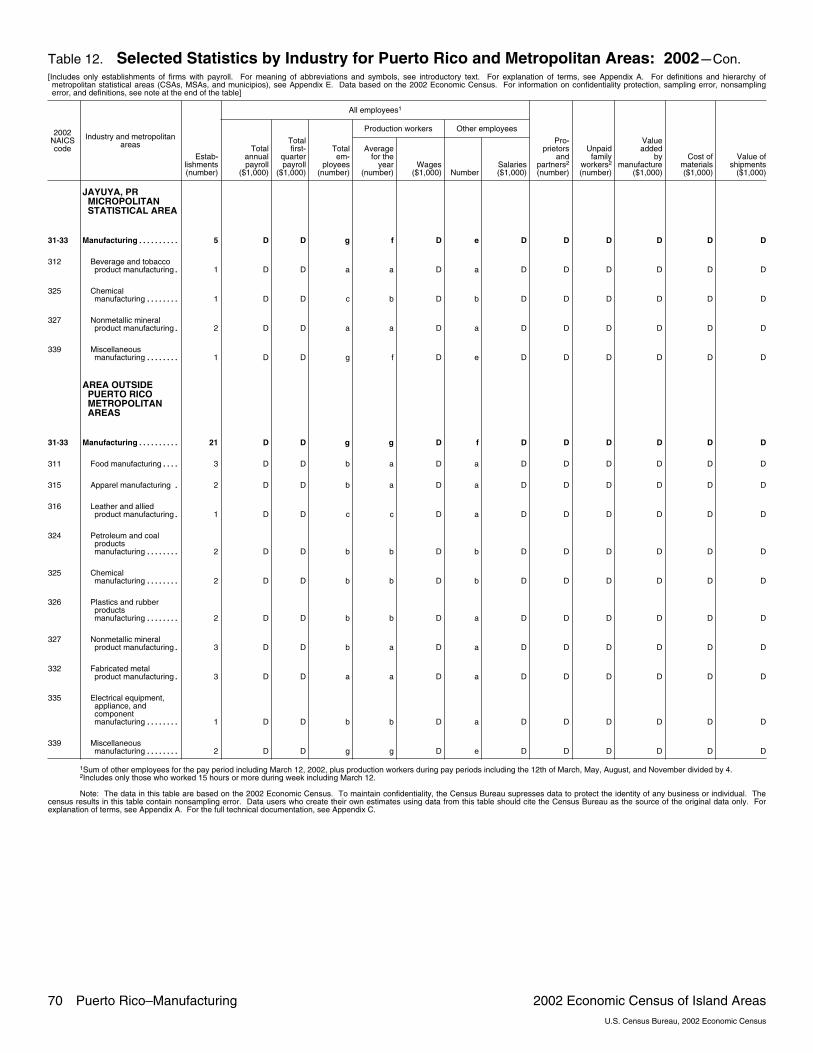
Table 12. Selected Statistics by Industry for Puerto Rico and Metropolitan Areas: 2002�Con.[Includes only establishments of firms with payroll. For meaning of abbreviations and symbols, see introductory text. For explanation of terms, see Appendix A. For definitions and hierarchy ofmetropolitan statistical areas (CSAs, MSAs, and municipios), see Appendix E. Data based on the 2002 Economic Census. For information on confidentiality protection, sampling error, nonsamplingerror, and definitions, see note at the end of the table]
2002NAICScode
Industry and metropolitanareas
All employees1
Production workers Other employees
Estab�lishments(number)
Totalannualpayroll
($1,000)
Totalfirst�
quarterpayroll
($1,000)
Totalem�
ployees(number)
Averagefor the
year(number)
Wages($1,000) Number
Salaries($1,000)
Pro�prietors
andpartners2
(number)
Unpaidfamily
workers2
(number)
Valueadded
bymanufacture
($1,000)
Cost ofmaterials($1,000)
Value ofshipments
($1,000)
JAYUYA, PRMICROPOLITANSTATISTICAL AREA
31�33 Manufacturing 5���������� D D g f D e D D D D D D
312 Beverage and tobaccoproduct manufacturing 1� D D a a D a D D D D D D
325 Chemicalmanufacturing 1�������� D D c b D b D D D D D D
327 Nonmetallic mineralproduct manufacturing 2� D D a a D a D D D D D D
339 Miscellaneousmanufacturing 1�������� D D g f D e D D D D D D
AREA OUTSIDEPUERTO RICOMETROPOLITANAREAS
31�33 Manufacturing 21���������� D D g g D f D D D D D D
311 Food manufacturing 3���� D D b a D a D D D D D D
315 Apparel manufacturing 2� D D b a D a D D D D D D
316 Leather and alliedproduct manufacturing 1� D D c c D a D D D D D D
324 Petroleum and coalproductsmanufacturing 2�������� D D b b D b D D D D D D
325 Chemicalmanufacturing 2�������� D D b b D b D D D D D D
326 Plastics and rubberproductsmanufacturing 2�������� D D b b D a D D D D D D
327 Nonmetallic mineralproduct manufacturing 3� D D b a D a D D D D D D
332 Fabricated metalproduct manufacturing 3� D D a a D a D D D D D D
335 Electrical equipment,appliance, andcomponentmanufacturing 1�������� D D b b D a D D D D D D
339 Miscellaneousmanufacturing 2�������� D D g g D e D D D D D D
1Sum of other employees for the pay period including March 12, 2002, plus production workers during pay periods including the 12th of March, May, August, and November divided by 4.2Includes only those who worked 15 hours or more during week including March 12.
Note: The data in this table are based on the 2002 Economic Census. To maintain confidentiality, the Census Bureau supresses data to protect the identity of any business or individual. Thecensus results in this table contain nonsampling error. Data users who create their own estimates using data from this table should cite the Census Bureau as the source of the original data only. Forexplanation of terms, see Appendix A. For the full technical documentation, see Appendix C.
70 Puerto Rico–Manufacturing 2002 Economic Census of Island AreasU.S. Census Bureau, 2002 Economic Census

Table 13. Number of Production Workers and Hours Worked by Industry for Puerto Rico andMetropolitan Areas: 2002
[Includes only establishments of firms with payroll. For meaning of abbreviations and symbols, see introductory text. For explanation of terms, see Appendix A. For definitions and hierarchy ofmetropolitan statistical areas (CSAs, MSAs, and municipios), see Appendix E. Data based on the 2002 Economic Census. For information on confidentiality protection, sampling error, nonsamplingerror, and definitions, see note at the end of the table]
2002NAICScode
Industry and metropolitan areas
Production workers for pay period including the 12th of� Hours worked
Estab�lishments(number)
Averagefor the
year(number)
March(number)
May(number)
August(number)
November(number)
Total(number)
Januarythrough
March(number)
Aprilthrough
June(number)
Julythrough
September(number)
Octoberthrough
December(number)
PUERTO RICO
31�33 Manufacturing 2 195�����������������r88 964 r86 939 r88 866 r89 519 r90 011 r180 946 334 r43 602 719 r44 510 694 r46 532 686 r46 300 235
311 Food manufacturing 446�����������r8 520 r8 371 r8 510 r8 522 r8 555 r15 491 883 r3 820 962 r3 753 075 r3 972 210 r3 945 636
3111 Animal food manufacturing 13��� 397 378 395 398 411 910 157 231 926 208 152 231 915 238 164
3112 Grain and oilseed milling 5����� c D D D D D D D D D
3113 Sugar and confectioneryproduct manufacturing 27������ 760 740 754 761 763 1 321 269 292 094 363 132 349 361 316 682
31131 Sugar manufacturing 4������ 113 109 113 114 113 173 966 48 831 74 714 25 871 24 55031132 Chocolate and confectionery
manufacturing from cacaobeans 1������������������ a D D D D D D D D D
31133 Confectionerymanufacturing frompurchased chocolate 6����� b D D D D D D D D D
31134 Nonchocolate confectionerymanufacturing 16����������� 550 536 544 551 552 993 665 206 998 249 866 284 125 252 676
3114 Fruit and vegetable preservingand specialty foodmanufacturing 31�������������
r1 268 r1 245 r1 253 r1 273 r1 277 r2 159 701 r590 905 r502 347 r522 586 r543 86331141 Frozen food manufacturing 14� 211 199 197 214 225 341 076 63 765 66 803 104 377 106 13131142 Fruit and vegetable canning,
pickling, and drying 17�������r1 057 r1 046 r1 056 r1 059 r1 052 r1 818 625 r527 140 r435 544 r418 209 r437 732
3115 Dairy product manufacturing 17�� f D D D D D D D D D31151 Dairy product (except
frozen) manufacturing 6���� e D D D D D D D D D31152 Ice cream and frozen
dessert manufacturing 11���� 73 62 79 72 75 126 341 24 391 35 463 35 367 31 120
3116 Animal slaughtering andprocessing 20����������������
r1 198 r1 178 r1 218 r1 190 r1 192 r999 381 r238 267 r210 522 r275 581 r275 011
3117 Seafood product preparationand packaging 2������������� f D D D D D D D D D
3118 Bakeries and tortillamanufacturing 273������������� 2 328 2 247 2 336 2 345 2 348 4 348 786 1 044 632 1 074 193 1 114 264 1 115 697
31181 Bread and bakery productmanufacturing 260����������� 1 724 1 655 1 733 1 728 1 747 3 192 993 764 126 797 905 816 089 814 873
31182 Cookie, cracker, and pastamanufacturing 11����������� f D D D D D D D D D
31183 Tortilla manufacturing 2������ a D D D D D D D D D
3119 Other food manufacturing 58���� 1 273 1 288 1 231 1 274 1 284 2 804 781 730 589 654 720 717 698 701 77431191 Snack food manufacturing 2�� b D D D D D D D D D31192 Coffee and tea
manufacturing 11����������� 197 195 202 193 198 434 076 112 109 109 659 101 272 111 03631193 Flavoring syrup and
concentratemanufacturing 8����������� c D D D D D D D D D
31194 Seasoning and dressingmanufacturing 9����������� 41 39 42 40 39 84 176 20 600 20 907 20 744 21 925
31199 All other foodmanufacturing 28����������� f D D D D D D D D D
312 Beverage and tobacco productmanufacturing 57��������������� 2 679 2 644 2 676 2 681 2 696 5 472 375 1 301 474 1 381 409 1 445 044 1 344 448
3121 Beverage manufacturing 51����� 1 394 1 382 1 408 1 383 1 388 2 804 180 670 203 730 952 745 023 658 00231211 Soft drink and ice
manufacturing 44����������� f D D D D D D D D D31212 Breweries 1���������������� a D D D D D D D D D31213 Wineries 4����������������� 61 53 65 61 65 115 534 26 077 29 325 28 742 31 39031214 Distilleries 2���������������� f D D D D D D D D D
3122 Tobacco manufacturing 6������ 1 285 1 262 1 268 1 298 1 308 2 668 195 631 271 650 457 700 021 686 446
313 Textile mills 8������������������ 43 43 44 40 40 96 611 24 553 25 769 23 125 23 164
3132 Fabric mills 4����������������� b D D D D D D D D D
3133 Textile and fabric finishing andfabric coating mills 4��������� b D D D D D D D D D
314 Textile product mills 46�����������r1 030 r1 024 r1 050 r1 011 r1 012 1 994 071 477 969 519 295 469 638 527 169
3141 Textile furnishings mills 27������r637 r650 r659 r626 r602 1 279 802 325 210 343 144 291 092 320 356
31411 Carpet and rug mills 4������� 126 124 126 125 126 236 567 49 545 53 621 61 652 71 74931412 Curtain and linen mills 23�����
r511 r526 r533 r501 r476 1 043 235 275 665 289 523 229 440 248 607
3149 Other textile product mills 19���� 393 374 391 385 410 714 269 152 759 176 151 178 546 206 81331491 Textile bag and canvas
mills 5�������������������� 162 146 164 147 185 315 938 70 449 79 615 73 207 92 66731499 All other textile product
mills 14�������������������� 231 228 227 238 225 398 331 82 310 96 536 105 339 114 146
See footnotes at end of table.
2002 Economic Census of Island Areas Puerto Rico–Manufacturing 71U.S. Census Bureau, 2002 Economic Census
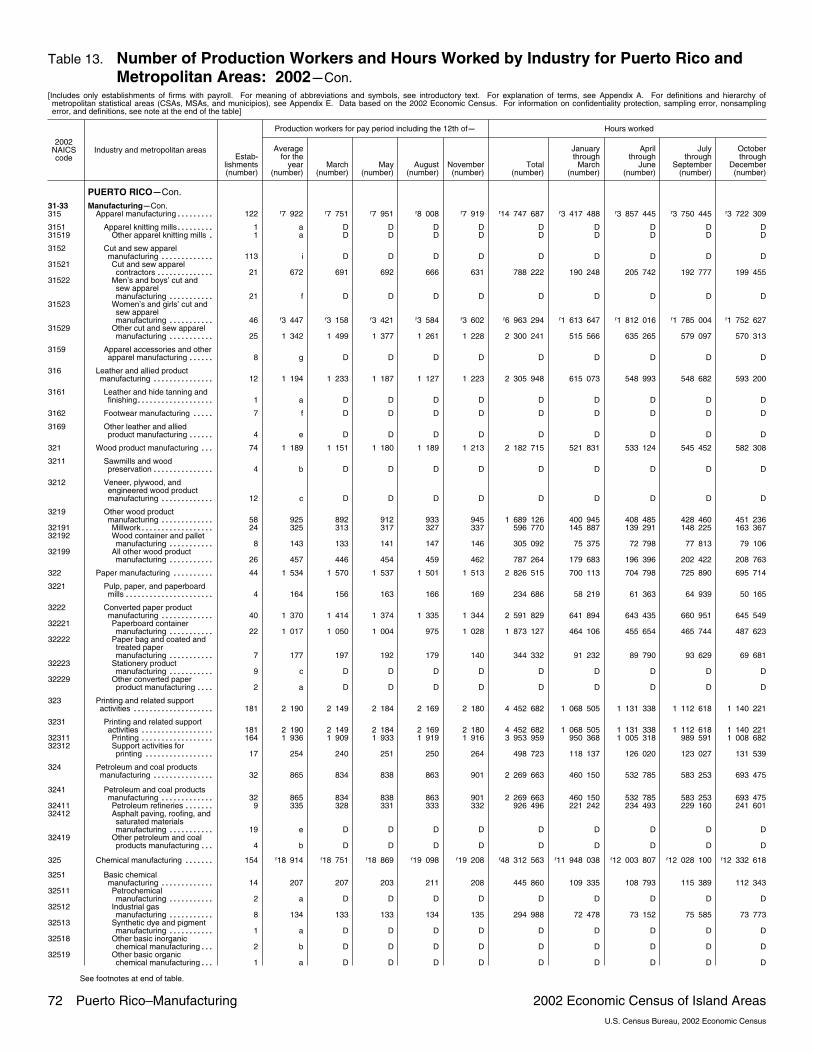
Table 13. Number of Production Workers and Hours Worked by Industry for Puerto Rico andMetropolitan Areas: 2002�Con.
[Includes only establishments of firms with payroll. For meaning of abbreviations and symbols, see introductory text. For explanation of terms, see Appendix A. For definitions and hierarchy ofmetropolitan statistical areas (CSAs, MSAs, and municipios), see Appendix E. Data based on the 2002 Economic Census. For information on confidentiality protection, sampling error, nonsamplingerror, and definitions, see note at the end of the table]
2002NAICScode
Industry and metropolitan areas
Production workers for pay period including the 12th of� Hours worked
Estab�lishments(number)
Averagefor the
year(number)
March(number)
May(number)
August(number)
November(number)
Total(number)
Januarythrough
March(number)
Aprilthrough
June(number)
Julythrough
September(number)
Octoberthrough
December(number)
PUERTO RICO�Con.31�33 Manufacturing�Con.315 Apparel manufacturing 122���������
r7 922 r7 751 r7 951 r8 008 r7 919 r14 747 687 r3 417 488 r3 857 445 r3 750 445 r3 722 309
3151 Apparel knitting mills 1��������� a D D D D D D D D D31519 Other apparel knitting mills 1� a D D D D D D D D D
3152 Cut and sew apparelmanufacturing 113������������� i D D D D D D D D D
31521 Cut and sew apparelcontractors 21�������������� 672 691 692 666 631 788 222 190 248 205 742 192 777 199 455
31522 Men’s and boys’ cut andsew apparelmanufacturing 21����������� f D D D D D D D D D
31523 Women’s and girls’ cut andsew apparelmanufacturing 46�����������
r3 447 r3 158 r3 421 r3 584 r3 602 r6 963 294 r1 613 647 r1 812 016 r1 785 004 r1 752 62731529 Other cut and sew apparel
manufacturing 25����������� 1 342 1 499 1 377 1 261 1 228 2 300 241 515 566 635 265 579 097 570 313
3159 Apparel accessories and otherapparel manufacturing 8������ g D D D D D D D D D
316 Leather and allied productmanufacturing 12��������������� 1 194 1 233 1 187 1 127 1 223 2 305 948 615 073 548 993 548 682 593 200
3161 Leather and hide tanning andfinishing 1������������������� a D D D D D D D D D
3162 Footwear manufacturing 7����� f D D D D D D D D D
3169 Other leather and alliedproduct manufacturing 4������ e D D D D D D D D D
321 Wood product manufacturing 74��� 1 189 1 151 1 180 1 189 1 213 2 182 715 521 831 533 124 545 452 582 308
3211 Sawmills and woodpreservation 4��������������� b D D D D D D D D D
3212 Veneer, plywood, andengineered wood productmanufacturing 12������������� c D D D D D D D D D
3219 Other wood productmanufacturing 58������������� 925 892 912 933 945 1 689 126 400 945 408 485 428 460 451 236
32191 Millwork 24������������������ 325 313 317 327 337 596 770 145 887 139 291 148 225 163 36732192 Wood container and pallet
manufacturing 8����������� 143 133 141 147 146 305 092 75 375 72 798 77 813 79 10632199 All other wood product
manufacturing 26����������� 457 446 454 459 462 787 264 179 683 196 396 202 422 208 763
322 Paper manufacturing 44���������� 1 534 1 570 1 537 1 501 1 513 2 826 515 700 113 704 798 725 890 695 714
3221 Pulp, paper, and paperboardmills 4���������������������� 164 156 163 166 169 234 686 58 219 61 363 64 939 50 165
3222 Converted paper productmanufacturing 40������������� 1 370 1 414 1 374 1 335 1 344 2 591 829 641 894 643 435 660 951 645 549
32221 Paperboard containermanufacturing 22����������� 1 017 1 050 1 004 975 1 028 1 873 127 464 106 455 654 465 744 487 623
32222 Paper bag and coated andtreated papermanufacturing 7����������� 177 197 192 179 140 344 332 91 232 89 790 93 629 69 681
32223 Stationery productmanufacturing 9����������� c D D D D D D D D D
32229 Other converted paperproduct manufacturing 2���� a D D D D D D D D D
323 Printing and related supportactivities 181�������������������� 2 190 2 149 2 184 2 169 2 180 4 452 682 1 068 505 1 131 338 1 112 618 1 140 221
3231 Printing and related supportactivities 181������������������ 2 190 2 149 2 184 2 169 2 180 4 452 682 1 068 505 1 131 338 1 112 618 1 140 221
32311 Printing 164������������������ 1 936 1 909 1 933 1 919 1 916 3 953 959 950 368 1 005 318 989 591 1 008 68232312 Support activities for
printing 17����������������� 254 240 251 250 264 498 723 118 137 126 020 123 027 131 539
324 Petroleum and coal productsmanufacturing 32��������������� 865 834 838 863 901 2 269 663 460 150 532 785 583 253 693 475
3241 Petroleum and coal productsmanufacturing 32������������� 865 834 838 863 901 2 269 663 460 150 532 785 583 253 693 475
32411 Petroleum refineries 9������� 335 328 331 333 332 926 496 221 242 234 493 229 160 241 60132412 Asphalt paving, roofing, and
saturated materialsmanufacturing 19����������� e D D D D D D D D D
32419 Other petroleum and coalproducts manufacturing 4��� b D D D D D D D D D
325 Chemical manufacturing 154�������r18 914 r18 751 r18 869 r19 098 r19 208 r48 312 563 r11 948 038 r12 003 807 r12 028 100 r12 332 618
3251 Basic chemicalmanufacturing 14������������� 207 207 203 211 208 445 860 109 335 108 793 115 389 112 343
32511 Petrochemicalmanufacturing 2����������� a D D D D D D D D D
32512 Industrial gasmanufacturing 8����������� 134 133 133 134 135 294 988 72 478 73 152 75 585 73 773
32513 Synthetic dye and pigmentmanufacturing 1����������� a D D D D D D D D D
32518 Other basic inorganicchemical manufacturing 2��� b D D D D D D D D D
32519 Other basic organicchemical manufacturing 1��� a D D D D D D D D D
See footnotes at end of table.
72 Puerto Rico–Manufacturing 2002 Economic Census of Island AreasU.S. Census Bureau, 2002 Economic Census

Table 13. Number of Production Workers and Hours Worked by Industry for Puerto Rico andMetropolitan Areas: 2002�Con.
[Includes only establishments of firms with payroll. For meaning of abbreviations and symbols, see introductory text. For explanation of terms, see Appendix A. For definitions and hierarchy ofmetropolitan statistical areas (CSAs, MSAs, and municipios), see Appendix E. Data based on the 2002 Economic Census. For information on confidentiality protection, sampling error, nonsamplingerror, and definitions, see note at the end of the table]
2002NAICScode
Industry and metropolitan areas
Production workers for pay period including the 12th of� Hours worked
Estab�lishments(number)
Averagefor the
year(number)
March(number)
May(number)
August(number)
November(number)
Total(number)
Januarythrough
March(number)
Aprilthrough
June(number)
Julythrough
September(number)
Octoberthrough
December(number)
PUERTO RICO�Con.31�33 Manufacturing�Con.325 Chemical manufacturing�Con.3252 Resin, synthetic rubber, and
artificial synthetic fibers andfilaments manufacturing 4����� b D D D D D D D D D
3253 Pesticide, fertilizer, and otheragricultural chemicalmanufacturing 5������������� c D D D D D D D D D
3254 Pharmaceutical and medicinemanufacturing 74�������������
r16 474 r16 343 r16 465 r16 661 r16 757 r43 571 078 r10 753 125 r10 838 780 r10 856 167 r11 123 006
3255 Paint, coating, and adhesivemanufacturing 20������������� 631 617 610 629 645 1 332 671 351 240 308 454 317 973 355 004
32551 Paint and coatingmanufacturing 13����������� 330 309 313 331 351 674 866 151 717 154 265 166 868 202 016
32552 Adhesive manufacturing 7��� 301 308 297 298 294 657 805 199 523 154 189 151 105 152 988
3256 Soap, cleaning compound,and toilet preparationmanufacturing 32������������� 1 322 1 303 1 311 1 313 1 326 2 338 900 580 689 590 492 580 871 586 848
32561 Soap and cleaningcompound manufacturing 22� 279 263 264 269 288 645 289 173 224 159 802 157 125 155 138
32562 Toilet preparationmanufacturing 10����������� 1 043 1 040 1 047 1 044 1 038 1 693 611 407 465 430 690 423 746 431 710
3259 Other chemical product andpreparation manufacturing 5�� 39 41 39 40 38 81 930 21 838 18 765 20 835 20 492
326 Plastics and rubber productsmanufacturing 67��������������� 2 739 2 740 2 662 2 704 2 828 5 740 250 1 395 965 1 393 442 1 509 285 1 441 558
3261 Plastics productmanufacturing 57������������� 2 583 2 603 2 508 2 544 2 662 5 338 844 1 308 230 1 298 768 1 407 337 1 324 509
3262 Rubber productmanufacturing 10������������� 156 137 154 160 166 401 406 87 735 94 674 101 948 117 049
327 Nonmetallic mineral productmanufacturing 157��������������� 2 697 2 682 2 690 2 707 2 640 5 423 327 1 338 370 1 337 356 1 362 174 1 385 427
3271 Clay product and refractorymanufacturing 3������������� b D D D D D D D D D
3272 Glass and glass productmanufacturing 4������������� 243 243 244 238 247 488 509 125 443 129 117 120 421 113 528
3273 Cement and concrete productmanufacturing 138������������� 2 288 2 273 2 284 2 304 2 219 4 566 900 1 118 226 1 122 720 1 150 910 1 175 044
32731 Cement manufacturing 3����� c D D D D D D D D D32732 Ready�mix concrete
manufacturing 77����������� 959 1 001 947 920 939 2 002 250 512 754 496 791 487 693 505 01232733 Concrete pipe, brick, and
block manufacturing 31������ e D D D D D D D D D32739 Other concrete product
manufacturing 27����������� 762 718 779 820 709 1 531 013 342 920 388 492 393 729 405 872
3274 Lime and gypsum productmanufacturing 1������������� a D D D D D D D D D
3279 Other nonmetallic mineralproduct manufacturing 11������ 134 133 132 133 142 307 483 79 690 70 526 75 489 81 778
331 Primary metal manufacturing 34��� 721 720 720 721 715 1 210 809 286 246 305 176 304 279 315 108
3311 Iron and steel mills andferroalloy manufacturing 14���� 242 245 244 241 239 491 622 118 834 124 966 123 461 124 361
3312 Steel product manufacturingfrom purchased steel 7������� 151 151 151 155 148 336 392 84 621 83 926 82 734 85 111
3313 Alumina and aluminumproduction and processing 10�� c D D D D D D D D D
3314 Nonferrous metal (exceptaluminum) production andprocessing 2���������������� a D D D D D D D D D
3315 Foundries 1������������������ c D D D D D D D D D
332 Fabricated metal productmanufacturing 289���������������
r5 171 r5 033 r5 175 r5 114 r5 257 r10 398 936 r2 483 532 r2 615 362 r2 543 965 r2 756 077
3321 Forging and stamping 17�������� 194 195 195 190 187 412 611 90 240 99 323 108 282 114 766
3322 Cutlery and handtoolmanufacturing 8������������� 237 236 237 237 239 507 960 121 343 128 044 130 696 127 877
3323 Architectural and structuralmetals manufacturing 165�������
r3 013 r2 896 r3 010 r2 971 r3 109 r5 834 620 r1 404 084 r1 494 031 r1 414 458 r1 522 047
3324 Boiler, tank, and shippingcontainer manufacturing 15���� 393 393 408 382 390 949 819 204 774 224 608 208 716 311 721
33241 Power boiler and heatexchanger manufacturing 1� a D D D D D D D D D
33243 Metal can, box, and othermetal container (lightgauge) manufacturing 14���� e D D D D D D D D D
3326 Spring and wire productmanufacturing 3������������� 45 42 43 45 47 106 569 25 912 26 249 25 778 28 630
See footnotes at end of table.
2002 Economic Census of Island Areas Puerto Rico–Manufacturing 73U.S. Census Bureau, 2002 Economic Census

Table 13. Number of Production Workers and Hours Worked by Industry for Puerto Rico andMetropolitan Areas: 2002�Con.
[Includes only establishments of firms with payroll. For meaning of abbreviations and symbols, see introductory text. For explanation of terms, see Appendix A. For definitions and hierarchy ofmetropolitan statistical areas (CSAs, MSAs, and municipios), see Appendix E. Data based on the 2002 Economic Census. For information on confidentiality protection, sampling error, nonsamplingerror, and definitions, see note at the end of the table]
2002NAICScode
Industry and metropolitan areas
Production workers for pay period including the 12th of� Hours worked
Estab�lishments(number)
Averagefor the
year(number)
March(number)
May(number)
August(number)
November(number)
Total(number)
Januarythrough
March(number)
Aprilthrough
June(number)
Julythrough
September(number)
Octoberthrough
December(number)
PUERTO RICO�Con.31�33 Manufacturing�Con.332 Fabricated metal product
manufacturing�Con.3327 Machine shops; turned
product; and screw, nut, andbolt manufacturing 35��������� 314 306 312 310 305 588 892 146 279 140 931 152 471 149 211
33271 Machine shops 11����������� 53 50 49 48 48 92 977 22 400 23 244 24 341 22 99233272 Turned product and screw,
nut, and boltmanufacturing 24����������� 261 256 263 262 257 495 915 123 879 117 687 128 130 126 219
3328 Coating, engraving, heattreating, and allied activities 15� 275 275 269 273 280 517 856 128 934 128 014 128 137 132 771
3329 Other fabricated metal productmanufacturing 31������������� 700 690 701 706 700 1 480 609 361 966 374 162 375 427 369 054
333 Machinery manufacturing 42������ 1 157 1 109 1 160 1 150 1 187 2 567 509 612 723 636 335 658 864 659 587
3331 Agriculture, construction, andmining machinerymanufacturing 1������������� a D D D D D D D D D
3332 Industrial machinerymanufacturing 4������������� b D D D D D D D D D
3333 Commercial and serviceindustry machinerymanufacturing 4������������� 17 17 17 17 17 73 335 17 411 18 890 18 388 18 646
3334 Ventilation, heating, air�conditioning, and commercialrefrigeration equipmentmanufacturing 15������������� f D D D D D D D D D
3335 Metalworking machinerymanufacturing 15������������� 449 448 452 439 448 913 579 220 619 229 554 240 344 223 062
3339 Other general purposemachinery manufacturing 3��� c D D D D D D D D D
334 Computer and electronic productmanufacturing 49��������������� 8 126 7 206 8 317 8 539 8 421 13 466 058 2 786 049 3 527 790 3 620 018 3 532 201
3341 Computer and peripheralequipment manufacturing 5��� g D D D D D D D D D
33411 Computer and peripheralequipment manufacturing 5� g D D D D D D D D D
3342 Communications equipmentmanufacturing 5������������� 1 326 609 1 575 1 514 1 602 2 701 874 270 244 728 268 848 531 854 831
33421 Telephone apparatusmanufacturing 1����������� b D D D D D D D D D
33422 Radio and televisionbroadcasting and wirelesscommunications equipmentmanufacturing 3����������� g D D D D D D D D D
33429 Other communicationsequipment manufacturing 1� c D D D D D D D D D
3343 Audio and video equipmentmanufacturing 1������������� c D D D D D D D D D
3344 Semiconductor and otherelectronic componentmanufacturing 24������������� 4 546 4 500 4 560 4 645 4 469 7 666 477 1 820 365 2 052 802 1 940 843 1 852 467
3345 Navigational, measuring,electromedical, and controlinstruments manufacturing 11�� 1 117 983 1 039 1 239 1 203 2 003 682 443 462 465 176 555 862 539 182
3346 Manufacturing andreproducing magnetic andoptical media 3�������������� a D D D D D D D D D
335 Electrical equipment, appliance,and component manufacturing 41� 6 000 6 028 5 952 6 042 5 946 11 542 800 2 529 080 2 713 334 3 247 702 3 052 684
3351 Electric lighting equipmentmanufacturing 6������������� e D D D D D D D D D
3352 Household appliancemanufacturing 1������������� a D D D D D D D D D
3353 Electrical equipmentmanufacturing 29������������� 4 416 4 446 4 419 4 417 4 351 8 016 449 1 662 515 1 828 396 2 344 102 2 181 436
3359 Other electrical equipment andcomponent manufacturing 5��� g D D D D D D D D D
336 Transportation equipmentmanufacturing 19��������������� 966 855 881 1 015 1 099 2 170 398 501 308 479 027 609 512 580 551
3362 Motor vehicle body and trailermanufacturing 1������������� c D D D D D D D D D
3363 Motor vehicle partsmanufacturing 13������������� 848 740 762 894 986 1 884 235 431 886 405 686 534 839 511 824
3364 Aerospace product and partsmanufacturing 1������������� a D D D D D D D D D
3366 Ship and boat building 4������� a D D D D D D D D D
See footnotes at end of table.
74 Puerto Rico–Manufacturing 2002 Economic Census of Island AreasU.S. Census Bureau, 2002 Economic Census

Table 13. Number of Production Workers and Hours Worked by Industry for Puerto Rico andMetropolitan Areas: 2002�Con.
[Includes only establishments of firms with payroll. For meaning of abbreviations and symbols, see introductory text. For explanation of terms, see Appendix A. For definitions and hierarchy ofmetropolitan statistical areas (CSAs, MSAs, and municipios), see Appendix E. Data based on the 2002 Economic Census. For information on confidentiality protection, sampling error, nonsamplingerror, and definitions, see note at the end of the table]
2002NAICScode
Industry and metropolitan areas
Production workers for pay period including the 12th of� Hours worked
Estab�lishments(number)
Averagefor the
year(number)
March(number)
May(number)
August(number)
November(number)
Total(number)
Januarythrough
March(number)
Aprilthrough
June(number)
Julythrough
September(number)
Octoberthrough
December(number)
PUERTO RICO�Con.
31�33 Manufacturing�Con.337 Furniture and related product
manufacturing 183��������������� 2 040 2 009 2 014 2 003 2 043 3 679 623 985 091 976 725 908 567 809 240
3371 Household and institutionalfurniture and kitchen cabinetmanufacturing 154������������� 1 656 1 626 1 633 1 619 1 664 3 020 026 809 685 785 261 760 624 664 456
33711 Wood kitchen cabinet andcountertop manufacturing 75� 393 373 379 390 391 724 690 181 762 187 452 170 919 184 557
33712 Household and institutionalfurniture manufacturing 79��� 1 263 1 253 1 254 1 229 1 273 2 295 336 627 923 597 809 589 705 479 899
3372 Office furniture (includingfixtures) manufacturing 16����� 234 237 236 235 226 299 299 73 772 73 897 77 111 74 519
3379 Other furniture related productmanufacturing 13������������� 150 146 145 149 153 360 298 101 634 117 567 70 832 70 265
339 Miscellaneous manufacturing 138���r13 267 r13 036 r13 269 r13 315 r13 415 r24 593 911 r6 328 199 r5 534 309 r6 563 863 r6 167 540
3391 Medical equipment andsupplies manufacturing 81�����
r11 679 r11 454 r11 642 r11 745 r11 849 r21 299 784 r5 523 208 r4 688 834 r5 761 075 r5 326 66733911 Medical equipment and
supplies manufacturing 81���r11 679 r11 454 r11 642 r11 745 r11 849 r21 299 784 r5 523 208 r4 688 834 r5 761 075 r5 326 667
3399 Other miscellaneousmanufacturing 57�������������
r1 588 r1 582 r1 627 r1 570 r1 566 r3 294 127 804 991 845 475 r802 788 840 87333991 Jewelry and silverware
manufacturing 15����������� 516 498 523 532 512 1 070 569 241 090 278 083 273 839 277 55733992 Sporting and athletic goods
manufacturing 2����������� a D D D D D D D D D33993 Doll, toy, and game
manufacturing 1����������� a D D D D D D D D D33994 Office supplies (except
paper) manufacturing 5����� 390 374 397 388 402 934 202 214 045 241 146 231 895 247 11633995 Sign manufacturing 23�������� e D D D D D D D D D33999 All other miscellaneous
manufacturing 11�����������r356 r373 r376 r343 r338 r626 461 178 995 158 318 r137 801 151 347
MAYAGÜEZ�SAN GERMÁN�CABO ROJO, PRCOMBINED STATISTICALAREA
31�33 Manufacturing 152����������������� 7 687 7 590 7 654 7 680 7 774 12 636 496 3 195 138 3 031 401 2 995 137 3 414 820
311 Food manufacturing 37����������� 844 829 861 843 851 2 138 966 513 435 541 762 541 639 542 130
312 Beverage and tobacco productmanufacturing 4��������������� c D D D D D D D D D
313 Textile mills 1������������������ a D D D D D D D D D
314 Textile product mills 1����������� b D D D D D D D D D
315 Apparel manufacturing 13��������� g D D D D D D D D D
321 Wood product manufacturing 7��� b D D D D D D D D D
322 Paper manufacturing 1���������� a D D D D D D D D D
323 Printing and related supportactivities 11�������������������� 63 60 60 62 61 97 678 23 390 25 104 22 339 26 845
324 Petroleum and coal productsmanufacturing 1��������������� a D D D D D D D D D
325 Chemical manufacturing 8������� 835 827 832 838 840 1 700 204 462 927 438 859 397 577 400 841
326 Plastics and rubber productsmanufacturing 3��������������� 42 42 43 42 40 86 237 21 710 23 668 22 506 18 353
327 Nonmetallic mineral productmanufacturing 17��������������� e D D D D D D D D D
331 Primary metal manufacturing 3��� a D D D D D D D D D
332 Fabricated metal productmanufacturing 19��������������� 429 385 396 404 522 857 141 202 035 217 127 210 926 227 053
333 Machinery manufacturing 1������ a D D D D D D D D D
334 Computer and electronic productmanufacturing 4��������������� f D D D D D D D D D
335 Electrical equipment, appliance,and component manufacturing 3� f D D D D D D D D D
336 Transportation equipmentmanufacturing 1��������������� a D D D D D D D D D
337 Furniture and related productmanufacturing 11��������������� 73 62 65 79 83 129 913 29 440 26 889 35 530 38 054
339 Miscellaneous manufacturing 6��� g D D D D D D D D D
See footnotes at end of table.
2002 Economic Census of Island Areas Puerto Rico–Manufacturing 75U.S. Census Bureau, 2002 Economic Census

Table 13. Number of Production Workers and Hours Worked by Industry for Puerto Rico andMetropolitan Areas: 2002�Con.
[Includes only establishments of firms with payroll. For meaning of abbreviations and symbols, see introductory text. For explanation of terms, see Appendix A. For definitions and hierarchy ofmetropolitan statistical areas (CSAs, MSAs, and municipios), see Appendix E. Data based on the 2002 Economic Census. For information on confidentiality protection, sampling error, nonsamplingerror, and definitions, see note at the end of the table]
2002NAICScode
Industry and metropolitan areas
Production workers for pay period including the 12th of� Hours worked
Estab�lishments(number)
Averagefor the
year(number)
March(number)
May(number)
August(number)
November(number)
Total(number)
Januarythrough
March(number)
Aprilthrough
June(number)
Julythrough
September(number)
Octoberthrough
December(number)
MAYAGÜEZ, PRMETROPOLITANSTATISTICAL AREA
31�33 Manufacturing 76����������������� 3 978 3 974 3 963 3 917 4 040 6 662 977 1 642 896 1 716 040 1 627 620 1 676 421
311 Food manufacturing 23����������� 803 789 821 804 811 2 079 574 497 701 527 951 525 994 527 928
312 Beverage and tobacco productmanufacturing 2��������������� a D D D D D D D D D
313 Textile mills 1������������������ a D D D D D D D D D
314 Textile product mills 1����������� b D D D D D D D D D
315 Apparel manufacturing 8��������� 1 205 1 211 1 210 1 201 1 193 1 932 520 457 816 490 758 479 764 504 182
321 Wood product manufacturing 2��� a D D D D D D D D D
322 Paper manufacturing 1���������� a D D D D D D D D D
323 Printing and related supportactivities 4�������������������� 20 19 19 19 19 26 064 6 084 6 715 6 545 6 720
325 Chemical manufacturing 5������� f D D D D D D D D D
326 Plastics and rubber productsmanufacturing 1��������������� a D D D D D D D D D
327 Nonmetallic mineral productmanufacturing 6��������������� c D D D D D D D D D
331 Primary metal manufacturing 1��� a D D D D D D D D D
332 Fabricated metal productmanufacturing 11��������������� 325 285 294 299 418 618 192 145 587 156 766 150 108 165 731
334 Computer and electronic productmanufacturing 2��������������� f D D D D D D D D D
336 Transportation equipmentmanufacturing 1��������������� a D D D D D D D D D
337 Furniture and related productmanufacturing 4��������������� 44 35 35 50 54 90 830 18 409 17 687 26 115 28 619
339 Miscellaneous manufacturing 3��� 30 30 28 28 30 62 032 15 955 15 118 14 952 16 007
SAN GERMÁN�CABOROJO, PRMETROPOLITANSTATISTICAL AREA
31�33 Manufacturing 76����������������� 3 709 3 616 3 691 3 763 3 734 5 973 519 1 552 242 1 315 361 1 367 517 1 738 399
311 Food manufacturing 14����������� 41 40 40 39 40 59 392 15 734 13 811 15 645 14 202
312 Beverage and tobacco productmanufacturing 2��������������� b D D D D D D D D D
315 Apparel manufacturing 5��������� f D D D D D D D D D
321 Wood product manufacturing 5��� 77 77 80 77 73 105 899 27 720 27 330 27 438 23 411
323 Printing and related supportactivities 7�������������������� 43 41 41 43 42 71 614 17 306 18 389 15 794 20 125
324 Petroleum and coal productsmanufacturing 1��������������� a D D D D D D D D D
325 Chemical manufacturing 3������� e D D D D D D D D D
326 Plastics and rubber productsmanufacturing 2��������������� b D D D D D D D D D
327 Nonmetallic mineral productmanufacturing 11��������������� 65 62 64 63 60 109 829 27 043 27 629 27 807 27 350
331 Primary metal manufacturing 2��� a D D D D D D D D D
332 Fabricated metal productmanufacturing 8��������������� 104 100 102 105 104 238 949 56 448 60 361 60 818 61 322
333 Machinery manufacturing 1������ a D D D D D D D D D
334 Computer and electronic productmanufacturing 2��������������� c D D D D D D D D D
335 Electrical equipment, appliance,and component manufacturing 3� f D D D D D D D D D
337 Furniture and related productmanufacturing 7��������������� 29 27 30 29 29 39 083 11 031 9 202 9 415 9 435
339 Miscellaneous manufacturing 3��� f D D D D D D D D D
See footnotes at end of table.
76 Puerto Rico–Manufacturing 2002 Economic Census of Island AreasU.S. Census Bureau, 2002 Economic Census
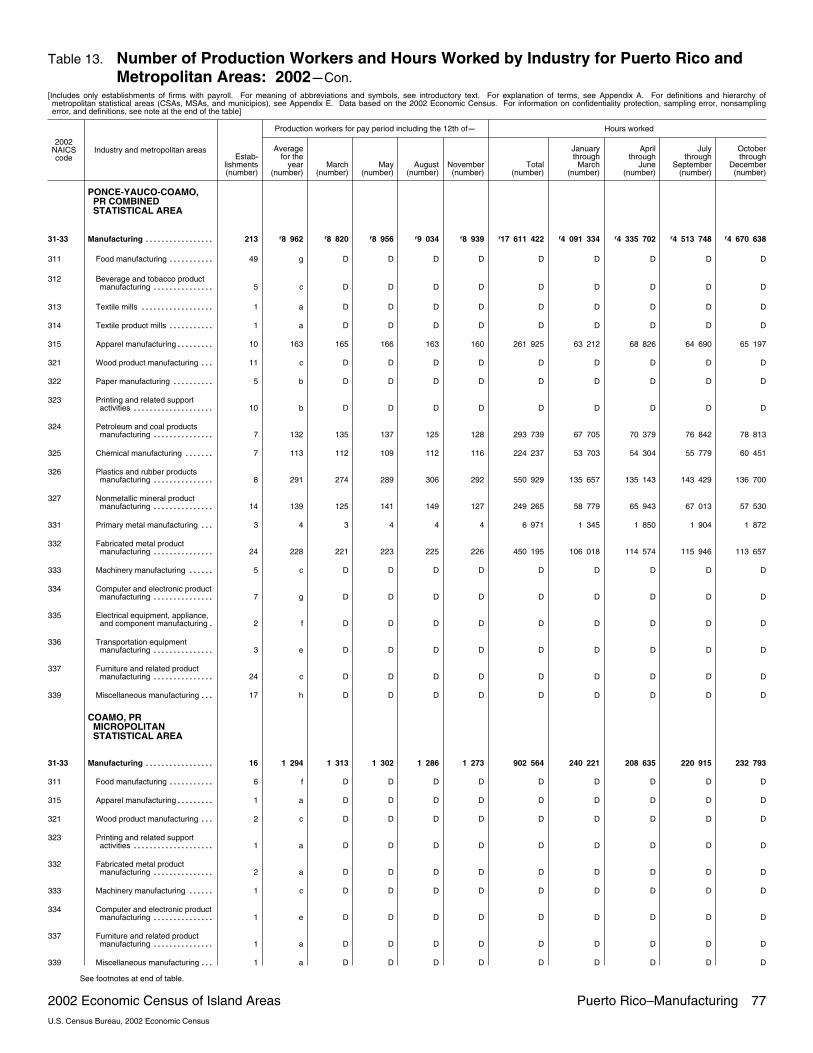
Table 13. Number of Production Workers and Hours Worked by Industry for Puerto Rico andMetropolitan Areas: 2002�Con.
[Includes only establishments of firms with payroll. For meaning of abbreviations and symbols, see introductory text. For explanation of terms, see Appendix A. For definitions and hierarchy ofmetropolitan statistical areas (CSAs, MSAs, and municipios), see Appendix E. Data based on the 2002 Economic Census. For information on confidentiality protection, sampling error, nonsamplingerror, and definitions, see note at the end of the table]
2002NAICScode
Industry and metropolitan areas
Production workers for pay period including the 12th of� Hours worked
Estab�lishments(number)
Averagefor the
year(number)
March(number)
May(number)
August(number)
November(number)
Total(number)
Januarythrough
March(number)
Aprilthrough
June(number)
Julythrough
September(number)
Octoberthrough
December(number)
PONCE�YAUCO�COAMO,PR COMBINEDSTATISTICAL AREA
31�33 Manufacturing 213�����������������r8 962 r8 820 r8 956 r9 034 r8 939 r17 611 422 r4 091 334 r4 335 702 r4 513 748 r4 670 638
311 Food manufacturing 49����������� g D D D D D D D D D
312 Beverage and tobacco productmanufacturing 5��������������� c D D D D D D D D D
313 Textile mills 1������������������ a D D D D D D D D D
314 Textile product mills 1����������� a D D D D D D D D D
315 Apparel manufacturing 10��������� 163 165 166 163 160 261 925 63 212 68 826 64 690 65 197
321 Wood product manufacturing 11��� c D D D D D D D D D
322 Paper manufacturing 5���������� b D D D D D D D D D
323 Printing and related supportactivities 10�������������������� b D D D D D D D D D
324 Petroleum and coal productsmanufacturing 7��������������� 132 135 137 125 128 293 739 67 705 70 379 76 842 78 813
325 Chemical manufacturing 7������� 113 112 109 112 116 224 237 53 703 54 304 55 779 60 451
326 Plastics and rubber productsmanufacturing 8��������������� 291 274 289 306 292 550 929 135 657 135 143 143 429 136 700
327 Nonmetallic mineral productmanufacturing 14��������������� 139 125 141 149 127 249 265 58 779 65 943 67 013 57 530
331 Primary metal manufacturing 3��� 4 3 4 4 4 6 971 1 345 1 850 1 904 1 872
332 Fabricated metal productmanufacturing 24��������������� 228 221 223 225 226 450 195 106 018 114 574 115 946 113 657
333 Machinery manufacturing 5������ c D D D D D D D D D
334 Computer and electronic productmanufacturing 7��������������� g D D D D D D D D D
335 Electrical equipment, appliance,and component manufacturing 2� f D D D D D D D D D
336 Transportation equipmentmanufacturing 3��������������� e D D D D D D D D D
337 Furniture and related productmanufacturing 24��������������� c D D D D D D D D D
339 Miscellaneous manufacturing 17��� h D D D D D D D D D
COAMO, PRMICROPOLITANSTATISTICAL AREA
31�33 Manufacturing 16����������������� 1 294 1 313 1 302 1 286 1 273 902 564 240 221 208 635 220 915 232 793
311 Food manufacturing 6����������� f D D D D D D D D D
315 Apparel manufacturing 1��������� a D D D D D D D D D
321 Wood product manufacturing 2��� c D D D D D D D D D
323 Printing and related supportactivities 1�������������������� a D D D D D D D D D
332 Fabricated metal productmanufacturing 2��������������� a D D D D D D D D D
333 Machinery manufacturing 1������ c D D D D D D D D D
334 Computer and electronic productmanufacturing 1��������������� e D D D D D D D D D
337 Furniture and related productmanufacturing 1��������������� a D D D D D D D D D
339 Miscellaneous manufacturing 1��� a D D D D D D D D D
See footnotes at end of table.
2002 Economic Census of Island Areas Puerto Rico–Manufacturing 77U.S. Census Bureau, 2002 Economic Census

Table 13. Number of Production Workers and Hours Worked by Industry for Puerto Rico andMetropolitan Areas: 2002�Con.
[Includes only establishments of firms with payroll. For meaning of abbreviations and symbols, see introductory text. For explanation of terms, see Appendix A. For definitions and hierarchy ofmetropolitan statistical areas (CSAs, MSAs, and municipios), see Appendix E. Data based on the 2002 Economic Census. For information on confidentiality protection, sampling error, nonsamplingerror, and definitions, see note at the end of the table]
2002NAICScode
Industry and metropolitan areas
Production workers for pay period including the 12th of� Hours worked
Estab�lishments(number)
Averagefor the
year(number)
March(number)
May(number)
August(number)
November(number)
Total(number)
Januarythrough
March(number)
Aprilthrough
June(number)
Julythrough
September(number)
Octoberthrough
December(number)
PONCE, PRMETROPOLITANSTATISTICAL AREA
31�33 Manufacturing 140�����������������r6 230 r6 062 r6 186 r6 337 r6 272 r13 143 248 r3 205 641 r3 318 817 r3 344 908 r3 273 882
311 Food manufacturing 28����������� 382 372 348 397 399 606 145 164 530 126 724 158 001 156 890
312 Beverage and tobacco productmanufacturing 5��������������� c D D D D D D D D D
313 Textile mills 1������������������ a D D D D D D D D D
314 Textile product mills 1����������� a D D D D D D D D D
315 Apparel manufacturing 7��������� c D D D D D D D D D
321 Wood product manufacturing 5��� b D D D D D D D D D
322 Paper manufacturing 5���������� b D D D D D D D D D
323 Printing and related supportactivities 8�������������������� 53 52 54 57 51 137 268 32 342 33 308 37 156 34 462
324 Petroleum and coal productsmanufacturing 3��������������� 61 65 67 55 57 137 499 29 195 31 561 37 788 38 955
325 Chemical manufacturing 3������� 15 15 15 15 13 25 903 6 158 6 056 6 799 6 890
326 Plastics and rubber productsmanufacturing 8��������������� 291 274 289 306 292 550 929 135 657 135 143 143 429 136 700
327 Nonmetallic mineral productmanufacturing 11��������������� 128 115 131 137 117 239 740 56 678 63 718 64 239 55 105
331 Primary metal manufacturing 2��� a D D D D D D D D D
332 Fabricated metal productmanufacturing 16��������������� 179 174 176 177 178 359 130 84 741 92 381 91 628 90 380
333 Machinery manufacturing 4������ 36 35 31 36 33 69 513 16 343 17 043 19 015 17 112
334 Computer and electronic productmanufacturing 5��������������� 857 827 842 880 880 1 601 372 387 167 421 549 436 158 356 498
336 Transportation equipmentmanufacturing 3��������������� e D D D D D D D D D
337 Furniture and related productmanufacturing 13��������������� 75 73 72 72 75 208 426 64 805 83 014 28 830 31 777
339 Miscellaneous manufacturing 12���r3 330 r3 236 r3 311 r3 379 r3 391 r7 323 152 r1 760 889 r1 820 758 r1 842 633 r1 898 872
SANTA ISABEL, PRMICROPOLITANSTATISTICAL AREA
31�33 Manufacturing 7�����������������r803 r824 r821 r791 r769 r2 354 218 r346 431 r504 459 r655 460 r847 868
311 Food manufacturing 3����������� c D D D D D D D D D
332 Fabricated metal productmanufacturing 1��������������� a D D D D D D D D D
334 Computer and electronic productmanufacturing 1��������������� c D D D D D D D D D
335 Electrical equipment, appliance,and component manufacturing 2� f D D D D D D D D D
YAUCO, PRMETROPOLITANSTATISTICAL AREA
31�33 Manufacturing 50����������������� 635 621 647 620 625 1 211 392 299 041 303 791 292 465 316 095
311 Food manufacturing 12����������� 204 193 224 196 194 428 875 102 456 106 793 100 744 118 882
315 Apparel manufacturing 2��������� b D D D D D D D D D
321 Wood product manufacturing 4��� a D D D D D D D D D
323 Printing and related supportactivities 1�������������������� a D D D D D D D D D
324 Petroleum and coal productsmanufacturing 4��������������� 71 70 70 70 71 156 240 38 510 38 818 39 054 39 858
325 Chemical manufacturing 4������� 98 97 94 97 103 198 334 47 545 48 248 48 980 53 561
327 Nonmetallic mineral productmanufacturing 3��������������� 11 10 10 12 10 9 525 2 101 2 225 2 774 2 425
331 Primary metal manufacturing 1��� a D D D D D D D D D
332 Fabricated metal productmanufacturing 5��������������� 37 36 36 37 37 72 285 16 653 17 448 19 631 18 553
337 Furniture and related productmanufacturing 10��������������� b D D D D D D D D D
339 Miscellaneous manufacturing 4��� 111 112 112 109 108 238 355 62 868 61 945 57 941 55 601
See footnotes at end of table.
78 Puerto Rico–Manufacturing 2002 Economic Census of Island AreasU.S. Census Bureau, 2002 Economic Census

Table 13. Number of Production Workers and Hours Worked by Industry for Puerto Rico andMetropolitan Areas: 2002�Con.
[Includes only establishments of firms with payroll. For meaning of abbreviations and symbols, see introductory text. For explanation of terms, see Appendix A. For definitions and hierarchy ofmetropolitan statistical areas (CSAs, MSAs, and municipios), see Appendix E. Data based on the 2002 Economic Census. For information on confidentiality protection, sampling error, nonsamplingerror, and definitions, see note at the end of the table]
2002NAICScode
Industry and metropolitan areas
Production workers for pay period including the 12th of� Hours worked
Estab�lishments(number)
Averagefor the
year(number)
March(number)
May(number)
August(number)
November(number)
Total(number)
Januarythrough
March(number)
Aprilthrough
June(number)
Julythrough
September(number)
Octoberthrough
December(number)
SAN JUAN�CAGUAS�FAJARDO, PR COMBINEDSTATISTICAL AREA
31�33 Manufacturing 1 583�����������������r57 075 r56 260 r56 645 r57 168 r57 596 r125 161 429 r30 519 717 r30 872 821 r31 999 462 r31 769 429
311 Food manufacturing 284�����������r5 827 r5 715 r5 818 r5 821 r5 864 r11 328 660 r2 812 355 r2 714 215 r2 919 986 r2 882 104
312 Beverage and tobacco productmanufacturing 42��������������� 2 375 2 338 2 366 2 386 2 396 4 771 689 1 121 408 1 204 542 1 273 955 1 171 784
313 Textile mills 6������������������ b D D D D D D D D D
314 Textile product mills 43����������� f D D D D D D D D D
315 Apparel manufacturing 83��������� h D D D D D D D D D
316 Leather and allied productmanufacturing 7��������������� e D D D D D D D D D
321 Wood product manufacturing 51��� f D D D D D D D D D
322 Paper manufacturing 36���������� g D D D D D D D D D
323 Printing and related supportactivities 154�������������������� 2 051 2 017 2 049 2 029 2 047 4 173 872 1 003 087 1 061 180 1 041 980 1 067 625
324 Petroleum and coal productsmanufacturing 20��������������� f D D D D D D D D D
325 Chemical manufacturing 128������� j D D D D D D D D D
326 Plastics and rubber productsmanufacturing 49��������������� g D D D D D D D D D
327 Nonmetallic mineral productmanufacturing 103��������������� g D D D D D D D D D
331 Primary metal manufacturing 26��� 531 530 529 532 526 1 132 203 266 625 285 023 285 110 295 445
332 Fabricated metal productmanufacturing 216���������������
r4 206 r4 123 r4 253 r4 179 r4 206 r8 468 119 r2 026 591 r2 134 205 r2 057 999 r2 249 324
333 Machinery manufacturing 34������ f D D D D D D D D D
334 Computer and electronic productmanufacturing 28��������������� g D D D D D D D D D
335 Electrical equipment, appliance,and component manufacturing 31� h D D D D D D D D D
336 Transportation equipmentmanufacturing 14��������������� f D D D D D D D D D
337 Furniture and related productmanufacturing 132��������������� g D D D D D D D D D
339 Miscellaneous manufacturing 96��� i D D D D D D D D D
FAJARDO, PRMETROPOLITANSTATISTICAL AREA
31�33 Manufacturing 37����������������� 1 139 1 152 1 163 1 114 1 124 2 880 390 753 188 706 600 703 173 717 429
311 Food manufacturing 7����������� 39 31 42 42 40 62 218 13 336 15 488 18 625 14 769
321 Wood product manufacturing 1��� b D D D D D D D D D
324 Petroleum and coal productsmanufacturing 1��������������� a D D D D D D D D D
325 Chemical manufacturing 2������� c D D D D D D D D D
326 Plastics and rubber productsmanufacturing 3��������������� 44 44 45 44 44 82 173 23 225 24 900 17 019 17 029
327 Nonmetallic mineral productmanufacturing 3��������������� a D D D D D D D D D
332 Fabricated metal productmanufacturing 6��������������� 64 63 67 65 65 120 139 31 169 23 431 32 642 32 897
334 Computer and electronic productmanufacturing 2��������������� b D D D D D D D D D
335 Electrical equipment, appliance,and component manufacturing 1� b D D D D D D D D D
336 Transportation equipmentmanufacturing 4��������������� c D D D D D D D D D
337 Furniture and related productmanufacturing 2��������������� a D D D D D D D D D
339 Miscellaneous manufacturing 5��� e D D D D D D D D D
See footnotes at end of table.
2002 Economic Census of Island Areas Puerto Rico–Manufacturing 79U.S. Census Bureau, 2002 Economic Census

Table 13. Number of Production Workers and Hours Worked by Industry for Puerto Rico andMetropolitan Areas: 2002�Con.
[Includes only establishments of firms with payroll. For meaning of abbreviations and symbols, see introductory text. For explanation of terms, see Appendix A. For definitions and hierarchy ofmetropolitan statistical areas (CSAs, MSAs, and municipios), see Appendix E. Data based on the 2002 Economic Census. For information on confidentiality protection, sampling error, nonsamplingerror, and definitions, see note at the end of the table]
2002NAICScode
Industry and metropolitan areas
Production workers for pay period including the 12th of� Hours worked
Estab�lishments(number)
Averagefor the
year(number)
March(number)
May(number)
August(number)
November(number)
Total(number)
Januarythrough
March(number)
Aprilthrough
June(number)
Julythrough
September(number)
Octoberthrough
December(number)
SAN JUAN�CAGUAS�GUAYNABO, PRMETROPOLITANSTATISTICAL AREA
31�33 Manufacturing 1 537�����������������r55 862 r55 030 r55 412 r55 979 r56 401 r122 154 157 r29 729 934 r30 133 868 r31 266 560 r31 023 795
311 Food manufacturing 273�����������r5 767 r5 663 r5 755 r5 758 r5 803 r11 224 073 r2 788 487 r2 688 331 r2 890 710 r2 856 545
312 Beverage and tobacco productmanufacturing 42��������������� 2 375 2 338 2 366 2 386 2 396 4 771 689 1 121 408 1 204 542 1 273 955 1 171 784
313 Textile mills 6������������������ b D D D D D D D D D
314 Textile product mills 43����������� f D D D D D D D D D
315 Apparel manufacturing 82���������r3 278 r3 357 r3 284 r3 246 r3 180 r6 089 163 r1 419 818 r1 610 240 r1 543 107 r1 515 998
316 Leather and allied productmanufacturing 7��������������� e D D D D D D D D D
321 Wood product manufacturing 50��� 832 796 820 845 852 1 509 472 355 887 368 794 385 305 399 486
322 Paper manufacturing 35���������� 1 389 1 401 1 382 1 353 1 402 2 557 746 627 525 634 789 650 883 644 549
323 Printing and related supportactivities 154�������������������� 2 051 2 017 2 049 2 029 2 047 4 173 872 1 003 087 1 061 180 1 041 980 1 067 625
324 Petroleum and coal productsmanufacturing 19��������������� 509 473 486 511 546 1 383 714 255 242 317 778 361 320 449 374
325 Chemical manufacturing 126�������r15 844 r15 639 r15 711 r15 940 r16 020 r44 031 230 r10 893 635 r10 934 603 r10 970 591 r11 232 401
326 Plastics and rubber productsmanufacturing 45��������������� 1 836 1 860 1 765 1 780 1 922 3 893 398 935 143 941 535 1 026 749 989 971
327 Nonmetallic mineral productmanufacturing 99��������������� g D D D D D D D D D
331 Primary metal manufacturing 26��� 531 530 529 532 526 1 132 203 266 625 285 023 285 110 295 445
332 Fabricated metal productmanufacturing 210���������������
r4 142 r4 060 r4 186 r4 114 r4 141 r8 347 980 r1 995 422 r2 110 774 r2 025 357 r2 216 427
333 Machinery manufacturing 33������ f D D D D D D D D D
334 Computer and electronic productmanufacturing 26��������������� 2 107 2 065 2 077 2 169 2 104 4 093 861 967 153 1 083 150 1 031 088 1 012 470
335 Electrical equipment, appliance,and component manufacturing 30� h D D D D D D D D D
336 Transportation equipmentmanufacturing 10��������������� e D D D D D D D D D
337 Furniture and related productmanufacturing 130��������������� 1 724 1 703 1 712 1 696 1 713 3 063 187 802 182 799 193 786 064 675 748
339 Miscellaneous manufacturing 91���r4 947 r4 854 r4 876 r4 943 r5 095 r9 396 799 2 446 058 2 141 611 r2 493 218 2 315 912
UTUADO, PRMICROPOLITANSTATISTICAL AREA
31�33 Manufacturing 9����������������� 74 78 70 75 71 126 882 36 595 32 353 29 729 28 205
311 Food manufacturing 4����������� 21 21 21 21 21 42 369 10 532 10 396 10 651 10 790
315 Apparel manufacturing 1��������� a D D D D D D D D D
322 Paper manufacturing 1���������� b D D D D D D D D D
326 Plastics and rubber productsmanufacturing 1��������������� a D D D D D D D D D
327 Nonmetallic mineral productmanufacturing 1��������������� a D D D D D D D D D
333 Machinery manufacturing 1������ a D D D D D D D D D
See footnotes at end of table.
80 Puerto Rico–Manufacturing 2002 Economic Census of Island AreasU.S. Census Bureau, 2002 Economic Census

Table 13. Number of Production Workers and Hours Worked by Industry for Puerto Rico andMetropolitan Areas: 2002�Con.
[Includes only establishments of firms with payroll. For meaning of abbreviations and symbols, see introductory text. For explanation of terms, see Appendix A. For definitions and hierarchy ofmetropolitan statistical areas (CSAs, MSAs, and municipios), see Appendix E. Data based on the 2002 Economic Census. For information on confidentiality protection, sampling error, nonsamplingerror, and definitions, see note at the end of the table]
2002NAICScode
Industry and metropolitan areas
Production workers for pay period including the 12th of� Hours worked
Estab�lishments(number)
Averagefor the
year(number)
March(number)
May(number)
August(number)
November(number)
Total(number)
Januarythrough
March(number)
Aprilthrough
June(number)
Julythrough
September(number)
Octoberthrough
December(number)
ADJUNTAS, PRMICROPOLITANSTATISTICAL AREA
31�33 Manufacturing 19����������������� 2 420 2 220 2 439 2 535 2 481 4 871 227 1 090 957 1 288 619 1 296 214 1 195 437
311 Food manufacturing 7����������� b D D D D D D D D D
315 Apparel manufacturing 4��������� g D D D D D D D D D
326 Plastics and rubber productsmanufacturing 1��������������� a D D D D D D D D D
327 Nonmetallic mineral productmanufacturing 1��������������� b D D D D D D D D D
332 Fabricated metal productmanufacturing 2��������������� a D D D D D D D D D
334 Computer and electronic productmanufacturing 1��������������� a D D D D D D D D D
335 Electrical equipment, appliance,and component manufacturing 1� e D D D D D D D D D
337 Furniture and related productmanufacturing 1��������������� a D D D D D D D D D
339 Miscellaneous manufacturing 1��� b D D D D D D D D D
AGUADILLA�ISABELA�SANSEBASTIÁN, PRMETROPOLITANSTATISTICAL AREA
31�33 Manufacturing 164����������������� 7 660 6 873 7 921 7 861 7 928 14 069 197 3 055 987 3 611 763 3 640 931 3 760 516
311 Food manufacturing 61����������� e D D D D D D D D D
312 Beverage and tobacco productmanufacturing 3��������������� a D D D D D D D D D
314 Textile product mills 1����������� c D D D D D D D D D
315 Apparel manufacturing 9��������� 199 185 203 189 209 313 909 74 768 90 084 51 907 97 150
316 Leather and allied productmanufacturing 4��������������� f D D D D D D D D D
321 Wood product manufacturing 5��� a D D D D D D D D D
322 Paper manufacturing 2���������� b D D D D D D D D D
323 Printing and related supportactivities 4�������������������� a D D D D D D D D D
325 Chemical manufacturing 1������� b D D D D D D D D D
326 Plastics and rubber productsmanufacturing 2��������������� c D D D D D D D D D
327 Nonmetallic mineral productmanufacturing 14��������������� 159 154 157 161 162 322 267 76 141 80 265 83 299 82 562
331 Primary metal manufacturing 2��� c D D D D D D D D D
332 Fabricated metal productmanufacturing 19��������������� c D D D D D D D D D
333 Machinery manufacturing 2������ b D D D D D D D D D
334 Computer and electronic productmanufacturing 8��������������� 3 752 2 988 4 009 4 036 3 968 6 616 328 1 183 073 1 742 449 1 843 659 1 847 147
336 Transportation equipmentmanufacturing 1��������������� a D D D D D D D D D
337 Furniture and related productmanufacturing 13��������������� 113 116 114 104 115 201 181 66 509 47 196 42 674 44 802
339 Miscellaneous manufacturing 13��� 1 331 1 281 1 350 1 345 1 340 2 964 869 721 656 717 116 768 577 757 520
See footnotes at end of table.
2002 Economic Census of Island Areas Puerto Rico–Manufacturing 81U.S. Census Bureau, 2002 Economic Census

Table 13. Number of Production Workers and Hours Worked by Industry for Puerto Rico andMetropolitan Areas: 2002�Con.
[Includes only establishments of firms with payroll. For meaning of abbreviations and symbols, see introductory text. For explanation of terms, see Appendix A. For definitions and hierarchy ofmetropolitan statistical areas (CSAs, MSAs, and municipios), see Appendix E. Data based on the 2002 Economic Census. For information on confidentiality protection, sampling error, nonsamplingerror, and definitions, see note at the end of the table]
2002NAICScode
Industry and metropolitan areas
Production workers for pay period including the 12th of� Hours worked
Estab�lishments(number)
Averagefor the
year(number)
March(number)
May(number)
August(number)
November(number)
Total(number)
Januarythrough
March(number)
Aprilthrough
June(number)
Julythrough
September(number)
Octoberthrough
December(number)
GUAYAMA, PRMETROPOLITANSTATISTICAL AREA
31�33 Manufacturing 38����������������� 2 736 2 799 2 839 2 807 2 825 2 966 885 727 934 725 789 767 630 745 532
311 Food manufacturing 5����������� 7 7 7 7 7 15 137 3 594 3 978 3 795 3 770
312 Beverage and tobacco productmanufacturing 2��������������� a D D D D D D D D D
315 Apparel manufacturing 1��������� b D D D D D D D D D
323 Printing and related supportactivities 2�������������������� a D D D D D D D D D
324 Petroleum and coal productsmanufacturing 2��������������� c D D D D D D D D D
325 Chemical manufacturing 7������� g D D D D D D D D D
326 Plastics and rubber productsmanufacturing 2��������������� e D D D D D D D D D
327 Nonmetallic mineral productmanufacturing 3��������������� 8 8 7 8 6 13 548 3 255 3 443 3 427 3 423
332 Fabricated metal productmanufacturing 6��������������� 145 142 143 147 145 306 127 73 621 75 988 78 025 78 493
334 Computer and electronic productmanufacturing 1��������������� a D D D D D D D D D
335 Electrical equipment, appliance,and component manufacturing 3� c D D D D D D D D D
337 Furniture and related productmanufacturing 2��������������� a D D D D D D D D D
339 Miscellaneous manufacturing 2��� b D D D D D D D D D
JAYUYA, PRMICROPOLITANSTATISTICAL AREA
31�33 Manufacturing 5����������������� f D D D D D D D D D
312 Beverage and tobacco productmanufacturing 1��������������� a D D D D D D D D D
325 Chemical manufacturing 1������� b D D D D D D D D D
327 Nonmetallic mineral productmanufacturing 2��������������� a D D D D D D D D D
339 Miscellaneous manufacturing 1��� f D D D D D D D D D
AREA OUTSIDE PUERTORICO METROPOLITANAREAS
31�33 Manufacturing 21����������������� g D D D D D D D D D
311 Food manufacturing 3����������� a D D D D D D D D D
315 Apparel manufacturing 2��������� a D D D D D D D D D
316 Leather and allied productmanufacturing 1��������������� c D D D D D D D D D
324 Petroleum and coal productsmanufacturing 2��������������� b D D D D D D D D D
325 Chemical manufacturing 2������� b D D D D D D D D D
326 Plastics and rubber productsmanufacturing 2��������������� b D D D D D D D D D
327 Nonmetallic mineral productmanufacturing 3��������������� a D D D D D D D D D
332 Fabricated metal productmanufacturing 3��������������� a D D D D D D D D D
335 Electrical equipment, appliance,and component manufacturing 1� b D D D D D D D D D
339 Miscellaneous manufacturing 2��� g D D D D D D D D D
Note: The data in this table are based on the 2002 Economic Census. To maintain confidentiality, the Census Bureau supresses data to protect the identity of any business or individual. Thecensus results in this table contain nonsampling error. Data users who create their own estimates using data from this table should cite the Census Bureau as the source of the original data only. Forexplanation of terms, see Appendix A. For the full technical documentation, see Appendix C.
82 Puerto Rico–Manufacturing 2002 Economic Census of Island AreasU.S. Census Bureau, 2002 Economic Census

Table 14. Inventories by Stage of Fabrication by Industry for Puerto Rico and MetropolitanAreas: End of 2001 and 2002
[Includes only establishments of firms with payroll. For meaning of abbreviations and symbols, see introductory text. For explanation of terms, see Appendix A. For definitions and hierarchy ofmetropolitan statistical areas (CSAs, MSAs, and municipios), see Appendix E. Data based on the 2002 Economic Census. For information on confidentiality protection, sampling error, nonsamplingerror, and definitions, see note at the end of the table]
2002NAICScode
Industry and metropolitan areas Estab�lishments(number)
Totalinventories,end of year
($1,000)
Finishedgoods
inventories($1,000)
Work inprocess
inventories($1,000)
Materials,and supplies
inventories, etc.($1,000)
PUERTO RICO31�33 Manufacturing 2002�������������������������������������������������� 2 195 7 006 525 1 139 344 3 125 778 2 741 387
2001�� X 6 421 907 1 018 794 2 841 135 2 561 969
311 Food manufacturing 2002�������������������������������������������� 446 249 265 70 087 44 829 134 3412001�� X 244 699 61 227 31 222 152 245
3111 Animal food manufacturing 2002������������������������������������ 13 19 524 3 265 1 845 14 4142001�� X 20 626 3 491 1 520 15 615
3112 Grain and oilseed milling 2002�������������������������������������� 5 D D D D2001�� X D D D D
3113 Sugar and confectionery product manufacturing 2002������������������ 27 20 063 4 235 3 224 12 6032001�� X 23 206 3 910 3 398 15 897
31131 Sugar manufacturing 2002��������������������������������������� 4 2 522 241 567 1 7142001�� X 2 883 149 806 1 928
31132 Chocolate and confectionery manufacturing from cacao beans 2002��� 1 D D D D2001�� X D D D D
31133 Confectionery manufacturing from purchased chocolate 2002��������� 6 D D D D2001�� X D D D D
31134 Nonchocolate confectionery manufacturing 2002�������������������� 16 16 703 3 616 2 583 10 5042001�� X 19 264 3 308 2 528 13 428
3114 Fruit and vegetable preserving and specialty food manufacturing 2002��� 31 31 779 19 255 3 607 8 9172001�� X 26 970 11 031 5 564 10 374
31141 Frozen food manufacturing 2002���������������������������������� 14 8 877 7 425 498 9542001�� X 2 514 822 663 1 028
31142 Fruit and vegetable canning, pickling, and drying 2002��������������� 17 22 902 11 830 3 109 7 9632001�� X 24 456 10 209 4 901 9 346
3115 Dairy product manufacturing 2002����������������������������������� 17 D D D D2001�� X D D D D
31151 Dairy product (except frozen) manufacturing 2002������������������� 6 D D D D2001�� X D D D D
31152 Ice cream and frozen dessert manufacturing 2002������������������� 11 718 83 69 5662001�� X 844 118 111 615
3116 Animal slaughtering and processing 2002���������������������������� 20 13 598 3 033 4 245 6 3202001�� X 10 243 1 695 4 471 4 077
3117 Seafood product preparation and packaging 2002��������������������� 2 D D D D2001�� X D D D D
3118 Bakeries and tortilla manufacturing 2002����������������������������� 273 51 752 15 252 22 614 13 8792001�� X 30 242 11 869 3 920 14 450
31181 Bread and bakery product manufacturing 2002���������������������� 260 42 450 11 680 21 182 9 5812001�� X 21 310 8 677 2 490 10 140
31182 Cookie, cracker, and pasta manufacturing 2002��������������������� 11 D D D D2001�� X D D D D
31183 Tortilla manufacturing 2002��������������������������������������� 2 D D D D2001�� X D D D D
3119 Other food manufacturing 2002������������������������������������� 58 60 379 10 494 2 764 47 1212001�� X 69 029 11 178 2 572 55 279
31191 Snack food manufacturing 2002����������������������������������� 2 D D D D2001�� X D D D D
31192 Coffee and tea manufacturing 2002������������������������������� 11 10 186 2 114 807 7 2652001�� X 13 993 2 164 615 11 214
31193 Flavoring syrup and concentrate manufacturing 2002���������������� 8 D D D D2001�� X D D D D
31194 Seasoning and dressing manufacturing 2002����������������������� 9 1 256 417 185 6542001�� X 1 250 422 149 679
31199 All other food manufacturing 2002��������������������������������� 28 D D D D2001�� X D D D D
312 Beverage and tobacco product manufacturing 2002��������������������� 57 228 803 39 116 62 969 126 7182001�� X 212 023 36 492 58 492 117 039
3121 Beverage manufacturing 2002�������������������������������������� 51 146 659 31 887 59 197 55 5752001�� X 149 346 30 416 54 630 64 300
31211 Soft drink and ice manufacturing 2002����������������������������� 44 D D D D2001�� X D D D D
31212 Breweries 2002������������������������������������������������� 1 D D D D2001�� X D D D D
31213 Wineries 2002�������������������������������������������������� 4 2 427 644 332 1 4512001�� X 2 227 736 276 1 215
31214 Distilleries 2002������������������������������������������������� 2 D D D D2001�� X D D D D
3122 Tobacco manufacturing 2002��������������������������������������� 6 82 144 7 229 3 772 71 1432001�� X 62 677 6 076 3 862 52 739
313 Textile mills 2002��������������������������������������������������� 8 892 245 200 4462001�� X 949 266 203 479
3132 Fabric mills 2002�������������������������������������������������� 4 D D D D2001�� X D D D D
3133 Textile and fabric finishing and fabric coating mills 2002���������������� 4 D D D D2001�� X D D D D
314 Textile product mills 2002�������������������������������������������� 46 20 024 5 320 4 124 10 5802001�� X 31 018 13 975 6 818 10 225
3141 Textile furnishings mills 2002��������������������������������������� 27 16 006 4 394 3 581 8 0312001�� X 27 133 12 990 6 071 8 072
31411 Carpet and rug mills 2002���������������������������������������� 4 1 876 426 924 5262001�� X 2 233 442 1 179 612
31412 Curtain and linen mills 2002�������������������������������������� 23 14 130 3 968 2 657 7 5052001�� X 24 900 12 548 4 892 7 460
3149 Other textile product mills 2002������������������������������������� 19 4 018 926 543 2 549
See footnotes at end of table.
2002 Economic Census of Island Areas Puerto Rico–Manufacturing 83U.S. Census Bureau, 2002 Economic Census
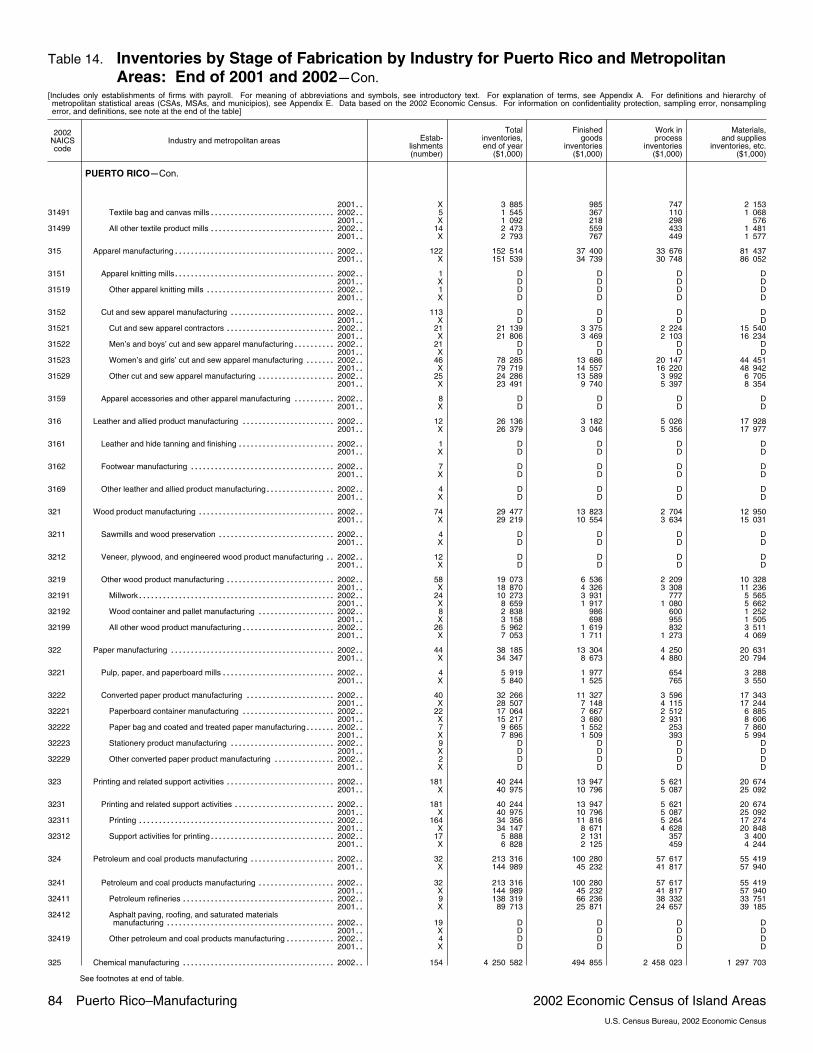
Table 14. Inventories by Stage of Fabrication by Industry for Puerto Rico and MetropolitanAreas: End of 2001 and 2002�Con.
[Includes only establishments of firms with payroll. For meaning of abbreviations and symbols, see introductory text. For explanation of terms, see Appendix A. For definitions and hierarchy ofmetropolitan statistical areas (CSAs, MSAs, and municipios), see Appendix E. Data based on the 2002 Economic Census. For information on confidentiality protection, sampling error, nonsamplingerror, and definitions, see note at the end of the table]
2002NAICScode
Industry and metropolitan areas Estab�lishments(number)
Totalinventories,end of year
($1,000)
Finishedgoods
inventories($1,000)
Work inprocess
inventories($1,000)
Materials,and supplies
inventories, etc.($1,000)
PUERTO RICO�Con.
2001�� X 3 885 985 747 2 15331491 Textile bag and canvas mills 2002��������������������������������� 5 1 545 367 110 1 068
2001�� X 1 092 218 298 57631499 All other textile product mills 2002��������������������������������� 14 2 473 559 433 1 481
2001�� X 2 793 767 449 1 577
315 Apparel manufacturing 2002������������������������������������������ 122 152 514 37 400 33 676 81 4372001�� X 151 539 34 739 30 748 86 052
3151 Apparel knitting mills 2002������������������������������������������ 1 D D D D2001�� X D D D D
31519 Other apparel knitting mills 2002���������������������������������� 1 D D D D2001�� X D D D D
3152 Cut and sew apparel manufacturing 2002���������������������������� 113 D D D D2001�� X D D D D
31521 Cut and sew apparel contractors 2002����������������������������� 21 21 139 3 375 2 224 15 5402001�� X 21 806 3 469 2 103 16 234
31522 Men’s and boys’ cut and sew apparel manufacturing 2002������������ 21 D D D D2001�� X D D D D
31523 Women’s and girls’ cut and sew apparel manufacturing 2002��������� 46 78 285 13 686 20 147 44 4512001�� X 79 719 14 557 16 220 48 942
31529 Other cut and sew apparel manufacturing 2002��������������������� 25 24 286 13 589 3 992 6 7052001�� X 23 491 9 740 5 397 8 354
3159 Apparel accessories and other apparel manufacturing 2002������������ 8 D D D D2001�� X D D D D
316 Leather and allied product manufacturing 2002������������������������� 12 26 136 3 182 5 026 17 9282001�� X 26 379 3 046 5 356 17 977
3161 Leather and hide tanning and finishing 2002�������������������������� 1 D D D D2001�� X D D D D
3162 Footwear manufacturing 2002�������������������������������������� 7 D D D D2001�� X D D D D
3169 Other leather and allied product manufacturing 2002������������������� 4 D D D D2001�� X D D D D
321 Wood product manufacturing 2002������������������������������������ 74 29 477 13 823 2 704 12 9502001�� X 29 219 10 554 3 634 15 031
3211 Sawmills and wood preservation 2002������������������������������� 4 D D D D2001�� X D D D D
3212 Veneer, plywood, and engineered wood product manufacturing 2002���� 12 D D D D2001�� X D D D D
3219 Other wood product manufacturing 2002����������������������������� 58 19 073 6 536 2 209 10 3282001�� X 18 870 4 326 3 308 11 236
32191 Millwork 2002��������������������������������������������������� 24 10 273 3 931 777 5 5652001�� X 8 659 1 917 1 080 5 662
32192 Wood container and pallet manufacturing 2002��������������������� 8 2 838 986 600 1 2522001�� X 3 158 698 955 1 505
32199 All other wood product manufacturing 2002������������������������� 26 5 962 1 619 832 3 5112001�� X 7 053 1 711 1 273 4 069
322 Paper manufacturing 2002������������������������������������������� 44 38 185 13 304 4 250 20 6312001�� X 34 347 8 673 4 880 20 794
3221 Pulp, paper, and paperboard mills 2002������������������������������ 4 5 919 1 977 654 3 2882001�� X 5 840 1 525 765 3 550
3222 Converted paper product manufacturing 2002������������������������ 40 32 266 11 327 3 596 17 3432001�� X 28 507 7 148 4 115 17 244
32221 Paperboard container manufacturing 2002������������������������� 22 17 064 7 667 2 512 6 8852001�� X 15 217 3 680 2 931 8 606
32222 Paper bag and coated and treated paper manufacturing 2002��������� 7 9 665 1 552 253 7 8602001�� X 7 896 1 509 393 5 994
32223 Stationery product manufacturing 2002���������������������������� 9 D D D D2001�� X D D D D
32229 Other converted paper product manufacturing 2002����������������� 2 D D D D2001�� X D D D D
323 Printing and related support activities 2002����������������������������� 181 40 244 13 947 5 621 20 6742001�� X 40 975 10 796 5 087 25 092
3231 Printing and related support activities 2002��������������������������� 181 40 244 13 947 5 621 20 6742001�� X 40 975 10 796 5 087 25 092
32311 Printing 2002��������������������������������������������������� 164 34 356 11 816 5 264 17 2742001�� X 34 147 8 671 4 628 20 848
32312 Support activities for printing 2002��������������������������������� 17 5 888 2 131 357 3 4002001�� X 6 828 2 125 459 4 244
324 Petroleum and coal products manufacturing 2002����������������������� 32 213 316 100 280 57 617 55 4192001�� X 144 989 45 232 41 817 57 940
3241 Petroleum and coal products manufacturing 2002��������������������� 32 213 316 100 280 57 617 55 4192001�� X 144 989 45 232 41 817 57 940
32411 Petroleum refineries 2002���������������������������������������� 9 138 319 66 236 38 332 33 7512001�� X 89 713 25 871 24 657 39 185
32412 Asphalt paving, roofing, and saturated materialsmanufacturing 2002�������������������������������������������� 19 D D D D
2001�� X D D D D32419 Other petroleum and coal products manufacturing 2002�������������� 4 D D D D
2001�� X D D D D
325 Chemical manufacturing 2002���������������������������������������� 154 4 250 582 494 855 2 458 023 1 297 703
See footnotes at end of table.
84 Puerto Rico–Manufacturing 2002 Economic Census of Island AreasU.S. Census Bureau, 2002 Economic Census

Table 14. Inventories by Stage of Fabrication by Industry for Puerto Rico and MetropolitanAreas: End of 2001 and 2002�Con.
[Includes only establishments of firms with payroll. For meaning of abbreviations and symbols, see introductory text. For explanation of terms, see Appendix A. For definitions and hierarchy ofmetropolitan statistical areas (CSAs, MSAs, and municipios), see Appendix E. Data based on the 2002 Economic Census. For information on confidentiality protection, sampling error, nonsamplingerror, and definitions, see note at the end of the table]
2002NAICScode
Industry and metropolitan areas Estab�lishments(number)
Totalinventories,end of year
($1,000)
Finishedgoods
inventories($1,000)
Work inprocess
inventories($1,000)
Materials,and supplies
inventories, etc.($1,000)
PUERTO RICO�Con.
2001�� X 3 845 319 458 005 2 241 079 1 146 234
3251 Basic chemical manufacturing 2002��������������������������������� 14 5 498 2 209 715 2 5742001�� X 6 228 2 073 840 3 315
32511 Petrochemical manufacturing 2002�������������������������������� 2 D D D D2001�� X D D D D
32512 Industrial gas manufacturing 2002��������������������������������� 8 3 342 1 574 700 1 0682001�� X 3 568 1 458 719 1 391
32513 Synthetic dye and pigment manufacturing 2002��������������������� 1 D D D D2001�� X D D D D
32518 Other basic inorganic chemical manufacturing 2002����������������� 2 D D D D2001�� X D D D D
32519 Other basic organic chemical manufacturing 2002������������������� 1 D D D D2001�� X D D D D
3252 Resin, synthetic rubber, and artificial synthetic fibers andfilaments manufacturing 2002�������������������������������������� 4 D D D D
2001�� X D D D D
3253 Pesticide, fertilizer, and other agricultural chemicalmanufacturing 2002���������������������������������������������� 5 D D D D
2001�� X D D D D
3254 Pharmaceutical and medicine manufacturing 2002�������������������� 74 4 038 658 434 129 2 422 281 1 182 2472001�� X 3 641 592 404 833 2 208 754 1 028 004
3255 Paint, coating, and adhesive manufacturing 2002��������������������� 20 36 863 17 426 3 428 16 0092001�� X 39 692 15 500 5 277 18 915
32551 Paint and coating manufacturing 2002����������������������������� 13 27 928 16 166 464 11 2982001�� X 29 260 14 039 1 910 13 311
32552 Adhesive manufacturing 2002������������������������������������ 7 8 935 1 260 2 964 4 7112001�� X 10 432 1 461 3 367 5 604
3256 Soap, cleaning compound, and toilet preparation manufacturing 2002���� 32 114 411 29 681 13 575 71 1552001�� X 101 320 28 001 17 035 56 284
32561 Soap and cleaning compound manufacturing 2002������������������ 22 13 554 4 920 1 715 6 9192001�� X 13 840 4 087 2 769 6 984
32562 Toilet preparation manufacturing 2002����������������������������� 10 100 857 24 761 11 860 64 2362001�� X 87 480 23 914 14 266 49 300
3259 Other chemical product and preparation manufacturing 2002����������� 5 1 708 739 256 7132001�� X 1 550 552 230 768
326 Plastics and rubber products manufacturing 2002����������������������� 67 67 755 30 792 8 251 28 7122001�� X 70 264 30 620 7 491 32 153
3261 Plastics product manufacturing 2002�������������������������������� 57 64 362 29 556 8 021 26 7852001�� X 66 554 29 041 7 315 30 198
3262 Rubber product manufacturing 2002��������������������������������� 10 3 393 1 236 230 1 9272001�� X 3 710 1 579 176 1 955
327 Nonmetallic mineral product manufacturing 2002������������������������ 157 344 907 44 685 15 773 284 4482001�� X 312 700 32 544 16 692 263 463
3271 Clay product and refractory manufacturing 2002���������������������� 3 D D D D2001�� X D D D D
3272 Glass and glass product manufacturing 2002������������������������� 4 16 652 11 108 258 5 2862001�� X 12 804 8 270 249 4 285
3273 Cement and concrete product manufacturing 2002�������������������� 138 320 445 28 250 14 306 277 8882001�� X 296 373 23 242 15 463 257 667
32731 Cement manufacturing 2002�������������������������������������� 3 D D D D2001�� X D D D D
32732 Ready�mix concrete manufacturing 2002��������������������������� 77 280 864 14 120 4 336 262 4072001�� X 256 564 9 860 4 220 242 483
32733 Concrete pipe, brick, and block manufacturing 2002����������������� 31 D D D D2001�� X D D D D
32739 Other concrete product manufacturing 2002������������������������ 27 9 768 3 770 1 766 4 2322001�� X 8 791 3 266 1 823 3 702
3274 Lime and gypsum product manufacturing 2002������������������������ 1 D D D D2001�� X D D D D
3279 Other nonmetallic mineral product manufacturing 2002����������������� 11 7 313 5 051 1 180 1 0822001�� X 3 155 852 955 1 348
331 Primary metal manufacturing 2002������������������������������������ 34 23 472 13 049 4 236 6 1872001�� X 25 376 11 496 3 958 9 922
3311 Iron and steel mills and ferroalloy manufacturing 2002����������������� 14 9 805 5 479 1 744 2 5822001�� X 10 321 4 223 1 938 4 160
3312 Steel product manufacturing from purchased steel 2002���������������� 7 9 612 6 727 1 828 1 0572001�� X 9 907 6 429 1 387 2 091
3313 Alumina and aluminum production and processing 2002���������������� 10 D D D D2001�� X D D D D
3314 Nonferrous metal (except aluminum) production and processing 2002��� 2 D D D D2001�� X D D D D
3315 Foundries 2002��������������������������������������������������� 1 D D D D2001�� X D D D D
332 Fabricated metal product manufacturing 2002�������������������������� 289 184 846 44 027 17 896 122 922
See footnotes at end of table.
2002 Economic Census of Island Areas Puerto Rico–Manufacturing 85U.S. Census Bureau, 2002 Economic Census
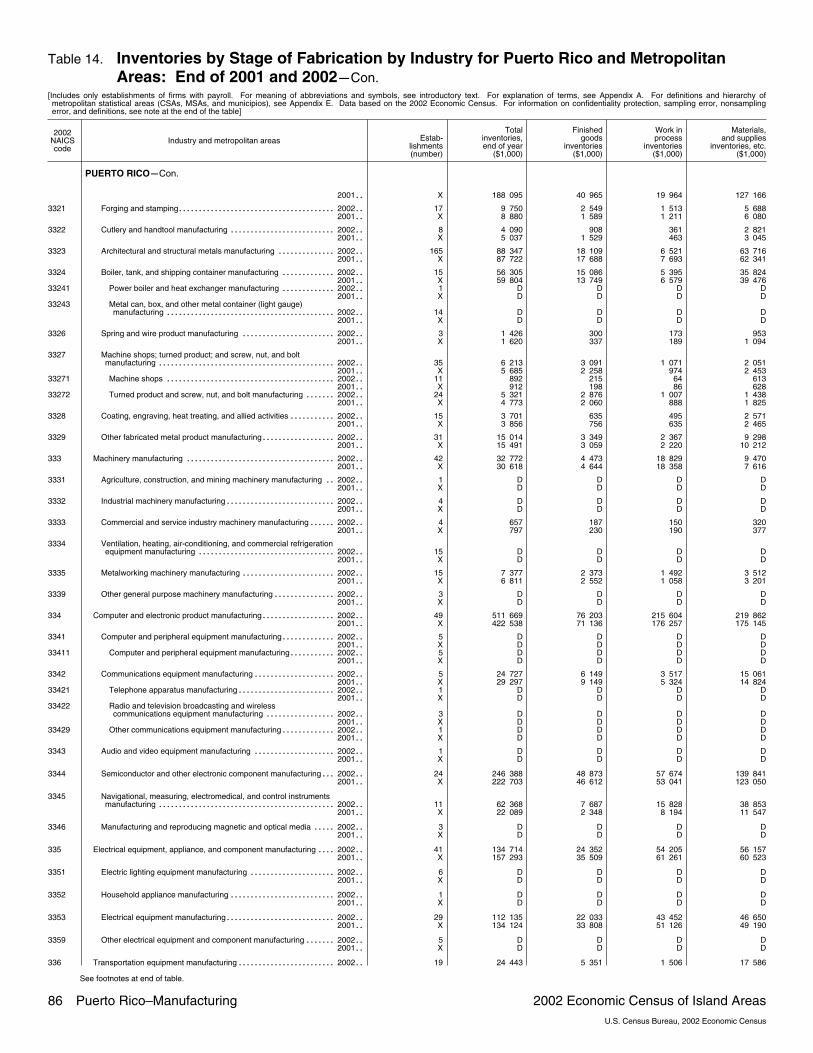
Table 14. Inventories by Stage of Fabrication by Industry for Puerto Rico and MetropolitanAreas: End of 2001 and 2002�Con.
[Includes only establishments of firms with payroll. For meaning of abbreviations and symbols, see introductory text. For explanation of terms, see Appendix A. For definitions and hierarchy ofmetropolitan statistical areas (CSAs, MSAs, and municipios), see Appendix E. Data based on the 2002 Economic Census. For information on confidentiality protection, sampling error, nonsamplingerror, and definitions, see note at the end of the table]
2002NAICScode
Industry and metropolitan areas Estab�lishments(number)
Totalinventories,end of year
($1,000)
Finishedgoods
inventories($1,000)
Work inprocess
inventories($1,000)
Materials,and supplies
inventories, etc.($1,000)
PUERTO RICO�Con.
2001�� X 188 095 40 965 19 964 127 166
3321 Forging and stamping 2002����������������������������������������� 17 9 750 2 549 1 513 5 6882001�� X 8 880 1 589 1 211 6 080
3322 Cutlery and handtool manufacturing 2002���������������������������� 8 4 090 908 361 2 8212001�� X 5 037 1 529 463 3 045
3323 Architectural and structural metals manufacturing 2002���������������� 165 88 347 18 109 6 521 63 7162001�� X 87 722 17 688 7 693 62 341
3324 Boiler, tank, and shipping container manufacturing 2002��������������� 15 56 305 15 086 5 395 35 8242001�� X 59 804 13 749 6 579 39 476
33241 Power boiler and heat exchanger manufacturing 2002��������������� 1 D D D D2001�� X D D D D
33243 Metal can, box, and other metal container (light gauge)manufacturing 2002�������������������������������������������� 14 D D D D
2001�� X D D D D
3326 Spring and wire product manufacturing 2002������������������������� 3 1 426 300 173 9532001�� X 1 620 337 189 1 094
3327 Machine shops; turned product; and screw, nut, and boltmanufacturing 2002���������������������������������������������� 35 6 213 3 091 1 071 2 051
2001�� X 5 685 2 258 974 2 45333271 Machine shops 2002�������������������������������������������� 11 892 215 64 613
2001�� X 912 198 86 62833272 Turned product and screw, nut, and bolt manufacturing 2002��������� 24 5 321 2 876 1 007 1 438
2001�� X 4 773 2 060 888 1 825
3328 Coating, engraving, heat treating, and allied activities 2002������������� 15 3 701 635 495 2 5712001�� X 3 856 756 635 2 465
3329 Other fabricated metal product manufacturing 2002�������������������� 31 15 014 3 349 2 367 9 2982001�� X 15 491 3 059 2 220 10 212
333 Machinery manufacturing 2002��������������������������������������� 42 32 772 4 473 18 829 9 4702001�� X 30 618 4 644 18 358 7 616
3331 Agriculture, construction, and mining machinery manufacturing 2002���� 1 D D D D2001�� X D D D D
3332 Industrial machinery manufacturing 2002����������������������������� 4 D D D D2001�� X D D D D
3333 Commercial and service industry machinery manufacturing 2002�������� 4 657 187 150 3202001�� X 797 230 190 377
3334 Ventilation, heating, air�conditioning, and commercial refrigerationequipment manufacturing 2002������������������������������������ 15 D D D D
2001�� X D D D D
3335 Metalworking machinery manufacturing 2002������������������������� 15 7 377 2 373 1 492 3 5122001�� X 6 811 2 552 1 058 3 201
3339 Other general purpose machinery manufacturing 2002����������������� 3 D D D D2001�� X D D D D
334 Computer and electronic product manufacturing 2002�������������������� 49 511 669 76 203 215 604 219 8622001�� X 422 538 71 136 176 257 175 145
3341 Computer and peripheral equipment manufacturing 2002��������������� 5 D D D D2001�� X D D D D
33411 Computer and peripheral equipment manufacturing 2002������������� 5 D D D D2001�� X D D D D
3342 Communications equipment manufacturing 2002���������������������� 5 24 727 6 149 3 517 15 0612001�� X 29 297 9 149 5 324 14 824
33421 Telephone apparatus manufacturing 2002�������������������������� 1 D D D D2001�� X D D D D
33422 Radio and television broadcasting and wirelesscommunications equipment manufacturing 2002������������������� 3 D D D D
2001�� X D D D D33429 Other communications equipment manufacturing 2002��������������� 1 D D D D
2001�� X D D D D
3343 Audio and video equipment manufacturing 2002���������������������� 1 D D D D2001�� X D D D D
3344 Semiconductor and other electronic component manufacturing 2002����� 24 246 388 48 873 57 674 139 8412001�� X 222 703 46 612 53 041 123 050
3345 Navigational, measuring, electromedical, and control instrumentsmanufacturing 2002���������������������������������������������� 11 62 368 7 687 15 828 38 853
2001�� X 22 089 2 348 8 194 11 547
3346 Manufacturing and reproducing magnetic and optical media 2002������� 3 D D D D2001�� X D D D D
335 Electrical equipment, appliance, and component manufacturing 2002������ 41 134 714 24 352 54 205 56 1572001�� X 157 293 35 509 61 261 60 523
3351 Electric lighting equipment manufacturing 2002����������������������� 6 D D D D2001�� X D D D D
3352 Household appliance manufacturing 2002���������������������������� 1 D D D D2001�� X D D D D
3353 Electrical equipment manufacturing 2002����������������������������� 29 112 135 22 033 43 452 46 6502001�� X 134 124 33 808 51 126 49 190
3359 Other electrical equipment and component manufacturing 2002��������� 5 D D D D2001�� X D D D D
336 Transportation equipment manufacturing 2002�������������������������� 19 24 443 5 351 1 506 17 586
See footnotes at end of table.
86 Puerto Rico–Manufacturing 2002 Economic Census of Island AreasU.S. Census Bureau, 2002 Economic Census

Table 14. Inventories by Stage of Fabrication by Industry for Puerto Rico and MetropolitanAreas: End of 2001 and 2002�Con.
[Includes only establishments of firms with payroll. For meaning of abbreviations and symbols, see introductory text. For explanation of terms, see Appendix A. For definitions and hierarchy ofmetropolitan statistical areas (CSAs, MSAs, and municipios), see Appendix E. Data based on the 2002 Economic Census. For information on confidentiality protection, sampling error, nonsamplingerror, and definitions, see note at the end of the table]
2002NAICScode
Industry and metropolitan areas Estab�lishments(number)
Totalinventories,end of year
($1,000)
Finishedgoods
inventories($1,000)
Work inprocess
inventories($1,000)
Materials,and supplies
inventories, etc.($1,000)
PUERTO RICO�Con.
2001�� X 36 749 11 120 3 295 22 334
3362 Motor vehicle body and trailer manufacturing 2002�������������������� 1 D D D D2001�� X D D D D
3363 Motor vehicle parts manufacturing 2002������������������������������ 13 21 626 4 524 1 211 15 8912001�� X 32 145 9 893 2 807 19 445
3364 Aerospace product and parts manufacturing 2002��������������������� 1 D D D D2001�� X D D D D
3366 Ship and boat building 2002���������������������������������������� 4 D D D D2001�� X D D D D
337 Furniture and related product manufacturing 2002����������������������� 183 38 706 11 178 8 737 18 7912001�� X 34 249 10 793 5 438 18 018
3371 Household and institutional furniture and kitchen cabinetmanufacturing 2002���������������������������������������������� 154 29 439 8 776 7 422 13 241
2001�� X 25 041 8 132 3 953 12 95633711 Wood kitchen cabinet and countertop manufacturing 2002������������ 75 8 673 4 784 1 280 2 609
2001�� X 8 095 4 418 1 432 2 24533712 Household and institutional furniture manufacturing 2002������������� 79 20 766 3 992 6 142 10 632
2001�� X 16 946 3 714 2 521 10 711
3372 Office furniture (including fixtures) manufacturing 2002����������������� 16 4 667 1 338 461 2 8682001�� X 4 579 1 429 614 2 536
3379 Other furniture related product manufacturing 2002�������������������� 13 4 600 1 064 854 2 6822001�� X 4 629 1 232 871 2 526
339 Miscellaneous manufacturing 2002������������������������������������ 138 393 803 93 675 101 702 198 4252001�� X 382 569 86 962 99 085 196 521
3391 Medical equipment and supplies manufacturing 2002������������������ 81 320 861 78 038 83 532 159 2902001�� X 316 235 76 192 85 633 154 409
33911 Medical equipment and supplies manufacturing 2002���������������� 81 320 861 78 038 83 532 159 2902001�� X 316 235 76 192 85 633 154 409
3399 Other miscellaneous manufacturing 2002���������������������������� 57 72 942 15 637 18 170 39 1352001�� X 66 334 10 770 13 452 42 112
33991 Jewelry and silverware manufacturing 2002������������������������ 15 32 614 7 070 6 031 19 5132001�� X 29 944 4 747 6 599 18 598
33992 Sporting and athletic goods manufacturing 2002�������������������� 2 D D D D2001�� X D D D D
33993 Doll, toy, and game manufacturing 2002��������������������������� 1 D D D D2001�� X D D D D
33994 Office supplies (except paper) manufacturing 2002������������������ 5 17 504 4 141 2 993 10 3702001�� X 16 443 2 350 3 507 10 586
33995 Sign manufacturing 2002����������������������������������������� 23 D D D D2001�� X D D D D
33999 All other miscellaneous manufacturing 2002������������������������ 11 15 253 2 776 8 029 4 4482001�� X 11 148 2 662 2 085 6 401
MAYAGÜEZ�SAN GERMÁN�CABO ROJO, PRCOMBINED STATISTICAL AREA
31�33 Manufacturing 2002�������������������������������������������������� 152 863 112 81 499 619 830 161 7832001�� X 800 493 91 802 556 231 152 460
311 Food manufacturing 2002�������������������������������������������� 37 19 618 6 248 3 057 10 3132001�� X 21 169 6 185 3 318 11 666
312 Beverage and tobacco product manufacturing 2002��������������������� 4 D D D D2001�� X D D D D
313 Textile mills 2002��������������������������������������������������� 1 D D D D2001�� X D D D D
314 Textile product mills 2002�������������������������������������������� 1 D D D D2001�� X D D D D
315 Apparel manufacturing 2002������������������������������������������ 13 D D D D2001�� X D D D D
321 Wood product manufacturing 2002������������������������������������ 7 D D D D2001�� X D D D D
322 Paper manufacturing 2002������������������������������������������� 1 D D D D2001�� X D D D D
323 Printing and related support activities 2002����������������������������� 11 560 93 110 3572001�� X 452 84 74 294
324 Petroleum and coal products manufacturing 2002����������������������� 1 D D D D2001�� X D D D D
325 Chemical manufacturing 2002���������������������������������������� 8 543 457 34 255 451 184 58 0182001�� X 522 331 43 098 421 949 57 284
326 Plastics and rubber products manufacturing 2002����������������������� 3 1 014 350 180 4842001�� X 1 116 448 178 490
327 Nonmetallic mineral product manufacturing 2002������������������������ 17 D D D D2001�� X D D D D
331 Primary metal manufacturing 2002������������������������������������ 3 D D D D2001�� X D D D D
332 Fabricated metal product manufacturing 2002�������������������������� 19 28 492 6 965 3 391 18 1362001�� X 30 021 7 285 3 511 19 225
333 Machinery manufacturing 2002��������������������������������������� 1 D D D D2001�� X D D D D
334 Computer and electronic product manufacturing 2002�������������������� 4 D D D D
See footnotes at end of table.
2002 Economic Census of Island Areas Puerto Rico–Manufacturing 87U.S. Census Bureau, 2002 Economic Census
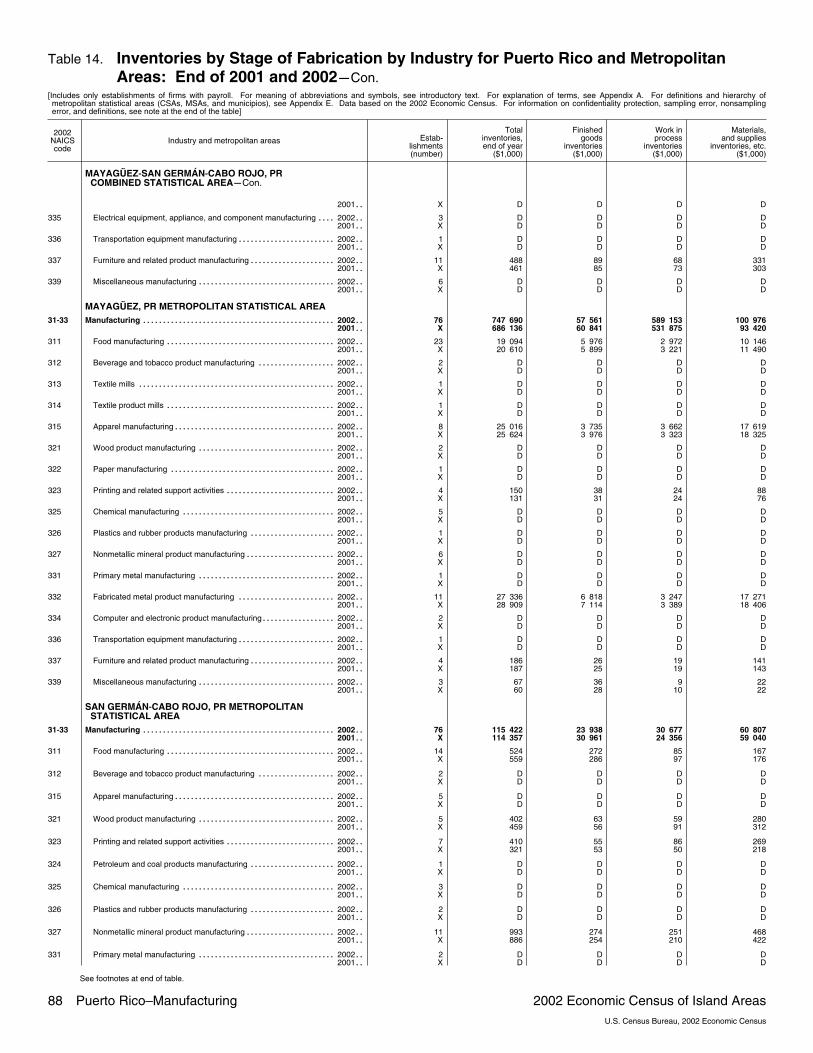
Table 14. Inventories by Stage of Fabrication by Industry for Puerto Rico and MetropolitanAreas: End of 2001 and 2002�Con.
[Includes only establishments of firms with payroll. For meaning of abbreviations and symbols, see introductory text. For explanation of terms, see Appendix A. For definitions and hierarchy ofmetropolitan statistical areas (CSAs, MSAs, and municipios), see Appendix E. Data based on the 2002 Economic Census. For information on confidentiality protection, sampling error, nonsamplingerror, and definitions, see note at the end of the table]
2002NAICScode
Industry and metropolitan areas Estab�lishments(number)
Totalinventories,end of year
($1,000)
Finishedgoods
inventories($1,000)
Work inprocess
inventories($1,000)
Materials,and supplies
inventories, etc.($1,000)
MAYAGÜEZ�SAN GERMÁN�CABO ROJO, PRCOMBINED STATISTICAL AREA�Con.
2001�� X D D D D
335 Electrical equipment, appliance, and component manufacturing 2002������ 3 D D D D2001�� X D D D D
336 Transportation equipment manufacturing 2002�������������������������� 1 D D D D2001�� X D D D D
337 Furniture and related product manufacturing 2002����������������������� 11 488 89 68 3312001�� X 461 85 73 303
339 Miscellaneous manufacturing 2002������������������������������������ 6 D D D D2001�� X D D D D
MAYAGÜEZ, PR METROPOLITAN STATISTICAL AREA31�33 Manufacturing 2002�������������������������������������������������� 76 747 690 57 561 589 153 100 976
2001�� X 686 136 60 841 531 875 93 420
311 Food manufacturing 2002�������������������������������������������� 23 19 094 5 976 2 972 10 1462001�� X 20 610 5 899 3 221 11 490
312 Beverage and tobacco product manufacturing 2002��������������������� 2 D D D D2001�� X D D D D
313 Textile mills 2002��������������������������������������������������� 1 D D D D2001�� X D D D D
314 Textile product mills 2002�������������������������������������������� 1 D D D D2001�� X D D D D
315 Apparel manufacturing 2002������������������������������������������ 8 25 016 3 735 3 662 17 6192001�� X 25 624 3 976 3 323 18 325
321 Wood product manufacturing 2002������������������������������������ 2 D D D D2001�� X D D D D
322 Paper manufacturing 2002������������������������������������������� 1 D D D D2001�� X D D D D
323 Printing and related support activities 2002����������������������������� 4 150 38 24 882001�� X 131 31 24 76
325 Chemical manufacturing 2002���������������������������������������� 5 D D D D2001�� X D D D D
326 Plastics and rubber products manufacturing 2002����������������������� 1 D D D D2001�� X D D D D
327 Nonmetallic mineral product manufacturing 2002������������������������ 6 D D D D2001�� X D D D D
331 Primary metal manufacturing 2002������������������������������������ 1 D D D D2001�� X D D D D
332 Fabricated metal product manufacturing 2002�������������������������� 11 27 336 6 818 3 247 17 2712001�� X 28 909 7 114 3 389 18 406
334 Computer and electronic product manufacturing 2002�������������������� 2 D D D D2001�� X D D D D
336 Transportation equipment manufacturing 2002�������������������������� 1 D D D D2001�� X D D D D
337 Furniture and related product manufacturing 2002����������������������� 4 186 26 19 1412001�� X 187 25 19 143
339 Miscellaneous manufacturing 2002������������������������������������ 3 67 36 9 222001�� X 60 28 10 22
SAN GERMÁN�CABO ROJO, PR METROPOLITANSTATISTICAL AREA
31�33 Manufacturing 2002�������������������������������������������������� 76 115 422 23 938 30 677 60 8072001�� X 114 357 30 961 24 356 59 040
311 Food manufacturing 2002�������������������������������������������� 14 524 272 85 1672001�� X 559 286 97 176
312 Beverage and tobacco product manufacturing 2002��������������������� 2 D D D D2001�� X D D D D
315 Apparel manufacturing 2002������������������������������������������ 5 D D D D2001�� X D D D D
321 Wood product manufacturing 2002������������������������������������ 5 402 63 59 2802001�� X 459 56 91 312
323 Printing and related support activities 2002����������������������������� 7 410 55 86 2692001�� X 321 53 50 218
324 Petroleum and coal products manufacturing 2002����������������������� 1 D D D D2001�� X D D D D
325 Chemical manufacturing 2002���������������������������������������� 3 D D D D2001�� X D D D D
326 Plastics and rubber products manufacturing 2002����������������������� 2 D D D D2001�� X D D D D
327 Nonmetallic mineral product manufacturing 2002������������������������ 11 993 274 251 4682001�� X 886 254 210 422
331 Primary metal manufacturing 2002������������������������������������ 2 D D D D2001�� X D D D D
See footnotes at end of table.
88 Puerto Rico–Manufacturing 2002 Economic Census of Island AreasU.S. Census Bureau, 2002 Economic Census
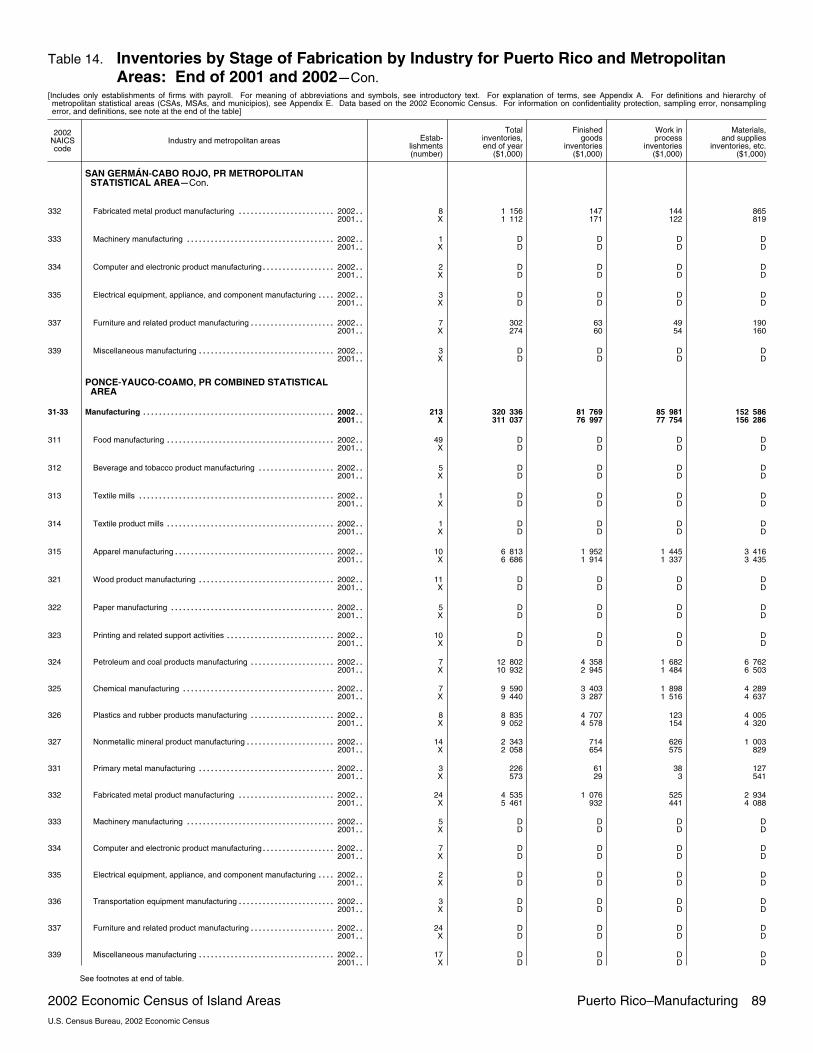
Table 14. Inventories by Stage of Fabrication by Industry for Puerto Rico and MetropolitanAreas: End of 2001 and 2002�Con.
[Includes only establishments of firms with payroll. For meaning of abbreviations and symbols, see introductory text. For explanation of terms, see Appendix A. For definitions and hierarchy ofmetropolitan statistical areas (CSAs, MSAs, and municipios), see Appendix E. Data based on the 2002 Economic Census. For information on confidentiality protection, sampling error, nonsamplingerror, and definitions, see note at the end of the table]
2002NAICScode
Industry and metropolitan areas Estab�lishments(number)
Totalinventories,end of year
($1,000)
Finishedgoods
inventories($1,000)
Work inprocess
inventories($1,000)
Materials,and supplies
inventories, etc.($1,000)
SAN GERMÁN�CABO ROJO, PR METROPOLITANSTATISTICAL AREA�Con.
332 Fabricated metal product manufacturing 2002�������������������������� 8 1 156 147 144 8652001�� X 1 112 171 122 819
333 Machinery manufacturing 2002��������������������������������������� 1 D D D D2001�� X D D D D
334 Computer and electronic product manufacturing 2002�������������������� 2 D D D D2001�� X D D D D
335 Electrical equipment, appliance, and component manufacturing 2002������ 3 D D D D2001�� X D D D D
337 Furniture and related product manufacturing 2002����������������������� 7 302 63 49 1902001�� X 274 60 54 160
339 Miscellaneous manufacturing 2002������������������������������������ 3 D D D D2001�� X D D D D
PONCE�YAUCO�COAMO, PR COMBINED STATISTICALAREA
31�33 Manufacturing 2002�������������������������������������������������� 213 320 336 81 769 85 981 152 5862001�� X 311 037 76 997 77 754 156 286
311 Food manufacturing 2002�������������������������������������������� 49 D D D D2001�� X D D D D
312 Beverage and tobacco product manufacturing 2002��������������������� 5 D D D D2001�� X D D D D
313 Textile mills 2002��������������������������������������������������� 1 D D D D2001�� X D D D D
314 Textile product mills 2002�������������������������������������������� 1 D D D D2001�� X D D D D
315 Apparel manufacturing 2002������������������������������������������ 10 6 813 1 952 1 445 3 4162001�� X 6 686 1 914 1 337 3 435
321 Wood product manufacturing 2002������������������������������������ 11 D D D D2001�� X D D D D
322 Paper manufacturing 2002������������������������������������������� 5 D D D D2001�� X D D D D
323 Printing and related support activities 2002����������������������������� 10 D D D D2001�� X D D D D
324 Petroleum and coal products manufacturing 2002����������������������� 7 12 802 4 358 1 682 6 7622001�� X 10 932 2 945 1 484 6 503
325 Chemical manufacturing 2002���������������������������������������� 7 9 590 3 403 1 898 4 2892001�� X 9 440 3 287 1 516 4 637
326 Plastics and rubber products manufacturing 2002����������������������� 8 8 835 4 707 123 4 0052001�� X 9 052 4 578 154 4 320
327 Nonmetallic mineral product manufacturing 2002������������������������ 14 2 343 714 626 1 0032001�� X 2 058 654 575 829
331 Primary metal manufacturing 2002������������������������������������ 3 226 61 38 1272001�� X 573 29 3 541
332 Fabricated metal product manufacturing 2002�������������������������� 24 4 535 1 076 525 2 9342001�� X 5 461 932 441 4 088
333 Machinery manufacturing 2002��������������������������������������� 5 D D D D2001�� X D D D D
334 Computer and electronic product manufacturing 2002�������������������� 7 D D D D2001�� X D D D D
335 Electrical equipment, appliance, and component manufacturing 2002������ 2 D D D D2001�� X D D D D
336 Transportation equipment manufacturing 2002�������������������������� 3 D D D D2001�� X D D D D
337 Furniture and related product manufacturing 2002����������������������� 24 D D D D2001�� X D D D D
339 Miscellaneous manufacturing 2002������������������������������������ 17 D D D D2001�� X D D D D
See footnotes at end of table.
2002 Economic Census of Island Areas Puerto Rico–Manufacturing 89U.S. Census Bureau, 2002 Economic Census
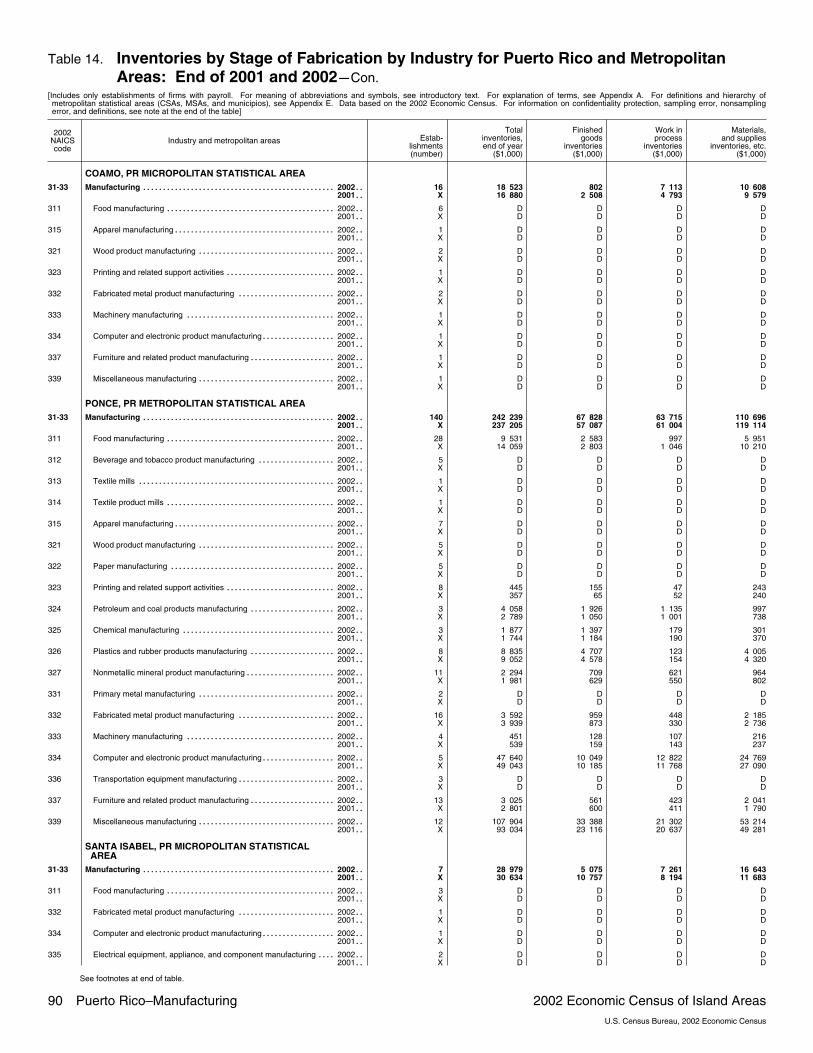
Table 14. Inventories by Stage of Fabrication by Industry for Puerto Rico and MetropolitanAreas: End of 2001 and 2002�Con.
[Includes only establishments of firms with payroll. For meaning of abbreviations and symbols, see introductory text. For explanation of terms, see Appendix A. For definitions and hierarchy ofmetropolitan statistical areas (CSAs, MSAs, and municipios), see Appendix E. Data based on the 2002 Economic Census. For information on confidentiality protection, sampling error, nonsamplingerror, and definitions, see note at the end of the table]
2002NAICScode
Industry and metropolitan areas Estab�lishments(number)
Totalinventories,end of year
($1,000)
Finishedgoods
inventories($1,000)
Work inprocess
inventories($1,000)
Materials,and supplies
inventories, etc.($1,000)
COAMO, PR MICROPOLITAN STATISTICAL AREA31�33 Manufacturing 2002�������������������������������������������������� 16 18 523 802 7 113 10 608
2001�� X 16 880 2 508 4 793 9 579
311 Food manufacturing 2002�������������������������������������������� 6 D D D D2001�� X D D D D
315 Apparel manufacturing 2002������������������������������������������ 1 D D D D2001�� X D D D D
321 Wood product manufacturing 2002������������������������������������ 2 D D D D2001�� X D D D D
323 Printing and related support activities 2002����������������������������� 1 D D D D2001�� X D D D D
332 Fabricated metal product manufacturing 2002�������������������������� 2 D D D D2001�� X D D D D
333 Machinery manufacturing 2002��������������������������������������� 1 D D D D2001�� X D D D D
334 Computer and electronic product manufacturing 2002�������������������� 1 D D D D2001�� X D D D D
337 Furniture and related product manufacturing 2002����������������������� 1 D D D D2001�� X D D D D
339 Miscellaneous manufacturing 2002������������������������������������ 1 D D D D2001�� X D D D D
PONCE, PR METROPOLITAN STATISTICAL AREA31�33 Manufacturing 2002�������������������������������������������������� 140 242 239 67 828 63 715 110 696
2001�� X 237 205 57 087 61 004 119 114
311 Food manufacturing 2002�������������������������������������������� 28 9 531 2 583 997 5 9512001�� X 14 059 2 803 1 046 10 210
312 Beverage and tobacco product manufacturing 2002��������������������� 5 D D D D2001�� X D D D D
313 Textile mills 2002��������������������������������������������������� 1 D D D D2001�� X D D D D
314 Textile product mills 2002�������������������������������������������� 1 D D D D2001�� X D D D D
315 Apparel manufacturing 2002������������������������������������������ 7 D D D D2001�� X D D D D
321 Wood product manufacturing 2002������������������������������������ 5 D D D D2001�� X D D D D
322 Paper manufacturing 2002������������������������������������������� 5 D D D D2001�� X D D D D
323 Printing and related support activities 2002����������������������������� 8 445 155 47 2432001�� X 357 65 52 240
324 Petroleum and coal products manufacturing 2002����������������������� 3 4 058 1 926 1 135 9972001�� X 2 789 1 050 1 001 738
325 Chemical manufacturing 2002���������������������������������������� 3 1 877 1 397 179 3012001�� X 1 744 1 184 190 370
326 Plastics and rubber products manufacturing 2002����������������������� 8 8 835 4 707 123 4 0052001�� X 9 052 4 578 154 4 320
327 Nonmetallic mineral product manufacturing 2002������������������������ 11 2 294 709 621 9642001�� X 1 981 629 550 802
331 Primary metal manufacturing 2002������������������������������������ 2 D D D D2001�� X D D D D
332 Fabricated metal product manufacturing 2002�������������������������� 16 3 592 959 448 2 1852001�� X 3 939 873 330 2 736
333 Machinery manufacturing 2002��������������������������������������� 4 451 128 107 2162001�� X 539 159 143 237
334 Computer and electronic product manufacturing 2002�������������������� 5 47 640 10 049 12 822 24 7692001�� X 49 043 10 185 11 768 27 090
336 Transportation equipment manufacturing 2002�������������������������� 3 D D D D2001�� X D D D D
337 Furniture and related product manufacturing 2002����������������������� 13 3 025 561 423 2 0412001�� X 2 801 600 411 1 790
339 Miscellaneous manufacturing 2002������������������������������������ 12 107 904 33 388 21 302 53 2142001�� X 93 034 23 116 20 637 49 281
SANTA ISABEL, PR MICROPOLITAN STATISTICALAREA
31�33 Manufacturing 2002�������������������������������������������������� 7 28 979 5 075 7 261 16 6432001�� X 30 634 10 757 8 194 11 683
311 Food manufacturing 2002�������������������������������������������� 3 D D D D2001�� X D D D D
332 Fabricated metal product manufacturing 2002�������������������������� 1 D D D D2001�� X D D D D
334 Computer and electronic product manufacturing 2002�������������������� 1 D D D D2001�� X D D D D
335 Electrical equipment, appliance, and component manufacturing 2002������ 2 D D D D2001�� X D D D D
See footnotes at end of table.
90 Puerto Rico–Manufacturing 2002 Economic Census of Island AreasU.S. Census Bureau, 2002 Economic Census

Table 14. Inventories by Stage of Fabrication by Industry for Puerto Rico and MetropolitanAreas: End of 2001 and 2002�Con.
[Includes only establishments of firms with payroll. For meaning of abbreviations and symbols, see introductory text. For explanation of terms, see Appendix A. For definitions and hierarchy ofmetropolitan statistical areas (CSAs, MSAs, and municipios), see Appendix E. Data based on the 2002 Economic Census. For information on confidentiality protection, sampling error, nonsamplingerror, and definitions, see note at the end of the table]
2002NAICScode
Industry and metropolitan areas Estab�lishments(number)
Totalinventories,end of year
($1,000)
Finishedgoods
inventories($1,000)
Work inprocess
inventories($1,000)
Materials,and supplies
inventories, etc.($1,000)
YAUCO, PR METROPOLITAN STATISTICAL AREA31�33 Manufacturing 2002�������������������������������������������������� 50 30 595 8 064 7 892 14 639
2001�� X 26 318 6 645 3 763 15 910
311 Food manufacturing 2002�������������������������������������������� 12 4 963 1 598 1 438 1 9272001�� X 3 493 1 182 497 1 814
315 Apparel manufacturing 2002������������������������������������������ 2 D D D D2001�� X D D D D
321 Wood product manufacturing 2002������������������������������������ 4 D D D D2001�� X D D D D
323 Printing and related support activities 2002����������������������������� 1 D D D D2001�� X D D D D
324 Petroleum and coal products manufacturing 2002����������������������� 4 8 744 2 432 547 5 7652001�� X 8 143 1 895 483 5 765
325 Chemical manufacturing 2002���������������������������������������� 4 7 713 2 006 1 719 3 9882001�� X 7 696 2 103 1 326 4 267
327 Nonmetallic mineral product manufacturing 2002������������������������ 3 49 5 5 392001�� X 77 25 25 27
331 Primary metal manufacturing 2002������������������������������������ 1 D D D D2001�� X D D D D
332 Fabricated metal product manufacturing 2002�������������������������� 5 820 19 72 7292001�� X 1 410 28 96 1 286
337 Furniture and related product manufacturing 2002����������������������� 10 D D D D2001�� X D D D D
339 Miscellaneous manufacturing 2002������������������������������������ 4 2 401 941 654 8062001�� X 2 631 618 916 1 097
SAN JUAN�CAGUAS�FAJARDO, PR COMBINEDSTATISTICAL AREA
31�33 Manufacturing 2002�������������������������������������������������� 1 583 5 221 873 859 172 2 198 816 2 163 8722001�� X 4 760 372 746 643 2 012 465 2 001 258
311 Food manufacturing 2002�������������������������������������������� 284 186 793 47 119 34 845 104 8242001�� X 187 075 46 109 21 359 119 605
312 Beverage and tobacco product manufacturing 2002��������������������� 42 193 750 32 244 39 663 121 8432001�� X 176 528 30 651 36 075 109 802
313 Textile mills 2002��������������������������������������������������� 6 D D D D2001�� X D D D D
314 Textile product mills 2002�������������������������������������������� 43 D D D D2001�� X D D D D
315 Apparel manufacturing 2002������������������������������������������ 83 D D D D2001�� X D D D D
316 Leather and allied product manufacturing 2002������������������������� 7 D D D D2001�� X D D D D
321 Wood product manufacturing 2002������������������������������������ 51 D D D D2001�� X D D D D
322 Paper manufacturing 2002������������������������������������������� 36 D D D D2001�� X D D D D
323 Printing and related support activities 2002����������������������������� 154 38 915 13 461 5 446 20 0062001�� X 39 843 10 410 4 941 24 492
324 Petroleum and coal products manufacturing 2002����������������������� 20 D D D D2001�� X D D D D
325 Chemical manufacturing 2002���������������������������������������� 128 D D D D2001�� X D D D D
326 Plastics and rubber products manufacturing 2002����������������������� 49 D D D D2001�� X D D D D
327 Nonmetallic mineral product manufacturing 2002������������������������ 103 D D D D2001�� X D D D D
331 Primary metal manufacturing 2002������������������������������������ 26 22 499 12 824 4 065 5 6102001�� X 24 006 11 284 3 811 8 911
332 Fabricated metal product manufacturing 2002�������������������������� 216 141 388 31 642 13 615 96 1302001�� X 140 908 29 981 14 551 96 376
333 Machinery manufacturing 2002��������������������������������������� 34 D D D D2001�� X D D D D
334 Computer and electronic product manufacturing 2002�������������������� 28 D D D D2001�� X D D D D
335 Electrical equipment, appliance, and component manufacturing 2002������ 31 D D D D2001�� X D D D D
336 Transportation equipment manufacturing 2002�������������������������� 14 D D D D2001�� X D D D D
337 Furniture and related product manufacturing 2002����������������������� 132 D D D D2001�� X D D D D
339 Miscellaneous manufacturing 2002������������������������������������ 96 D D D D2001�� X D D D D
See footnotes at end of table.
2002 Economic Census of Island Areas Puerto Rico–Manufacturing 91U.S. Census Bureau, 2002 Economic Census
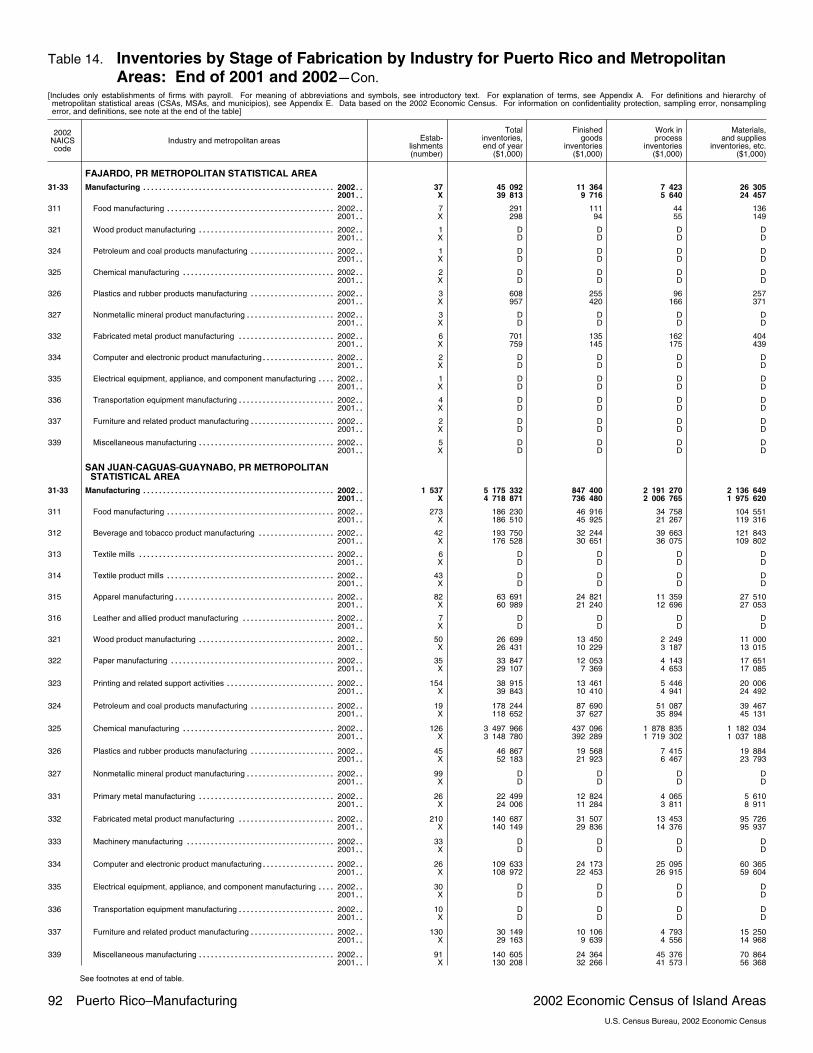
Table 14. Inventories by Stage of Fabrication by Industry for Puerto Rico and MetropolitanAreas: End of 2001 and 2002�Con.
[Includes only establishments of firms with payroll. For meaning of abbreviations and symbols, see introductory text. For explanation of terms, see Appendix A. For definitions and hierarchy ofmetropolitan statistical areas (CSAs, MSAs, and municipios), see Appendix E. Data based on the 2002 Economic Census. For information on confidentiality protection, sampling error, nonsamplingerror, and definitions, see note at the end of the table]
2002NAICScode
Industry and metropolitan areas Estab�lishments(number)
Totalinventories,end of year
($1,000)
Finishedgoods
inventories($1,000)
Work inprocess
inventories($1,000)
Materials,and supplies
inventories, etc.($1,000)
FAJARDO, PR METROPOLITAN STATISTICAL AREA31�33 Manufacturing 2002�������������������������������������������������� 37 45 092 11 364 7 423 26 305
2001�� X 39 813 9 716 5 640 24 457
311 Food manufacturing 2002�������������������������������������������� 7 291 111 44 1362001�� X 298 94 55 149
321 Wood product manufacturing 2002������������������������������������ 1 D D D D2001�� X D D D D
324 Petroleum and coal products manufacturing 2002����������������������� 1 D D D D2001�� X D D D D
325 Chemical manufacturing 2002���������������������������������������� 2 D D D D2001�� X D D D D
326 Plastics and rubber products manufacturing 2002����������������������� 3 608 255 96 2572001�� X 957 420 166 371
327 Nonmetallic mineral product manufacturing 2002������������������������ 3 D D D D2001�� X D D D D
332 Fabricated metal product manufacturing 2002�������������������������� 6 701 135 162 4042001�� X 759 145 175 439
334 Computer and electronic product manufacturing 2002�������������������� 2 D D D D2001�� X D D D D
335 Electrical equipment, appliance, and component manufacturing 2002������ 1 D D D D2001�� X D D D D
336 Transportation equipment manufacturing 2002�������������������������� 4 D D D D2001�� X D D D D
337 Furniture and related product manufacturing 2002����������������������� 2 D D D D2001�� X D D D D
339 Miscellaneous manufacturing 2002������������������������������������ 5 D D D D2001�� X D D D D
SAN JUAN�CAGUAS�GUAYNABO, PR METROPOLITANSTATISTICAL AREA
31�33 Manufacturing 2002�������������������������������������������������� 1 537 5 175 332 847 400 2 191 270 2 136 6492001�� X 4 718 871 736 480 2 006 765 1 975 620
311 Food manufacturing 2002�������������������������������������������� 273 186 230 46 916 34 758 104 5512001�� X 186 510 45 925 21 267 119 316
312 Beverage and tobacco product manufacturing 2002��������������������� 42 193 750 32 244 39 663 121 8432001�� X 176 528 30 651 36 075 109 802
313 Textile mills 2002��������������������������������������������������� 6 D D D D2001�� X D D D D
314 Textile product mills 2002�������������������������������������������� 43 D D D D2001�� X D D D D
315 Apparel manufacturing 2002������������������������������������������ 82 63 691 24 821 11 359 27 5102001�� X 60 989 21 240 12 696 27 053
316 Leather and allied product manufacturing 2002������������������������� 7 D D D D2001�� X D D D D
321 Wood product manufacturing 2002������������������������������������ 50 26 699 13 450 2 249 11 0002001�� X 26 431 10 229 3 187 13 015
322 Paper manufacturing 2002������������������������������������������� 35 33 847 12 053 4 143 17 6512001�� X 29 107 7 369 4 653 17 085
323 Printing and related support activities 2002����������������������������� 154 38 915 13 461 5 446 20 0062001�� X 39 843 10 410 4 941 24 492
324 Petroleum and coal products manufacturing 2002����������������������� 19 178 244 87 690 51 087 39 4672001�� X 118 652 37 627 35 894 45 131
325 Chemical manufacturing 2002���������������������������������������� 126 3 497 966 437 096 1 878 835 1 182 0342001�� X 3 148 780 392 289 1 719 302 1 037 188
326 Plastics and rubber products manufacturing 2002����������������������� 45 46 867 19 568 7 415 19 8842001�� X 52 183 21 923 6 467 23 793
327 Nonmetallic mineral product manufacturing 2002������������������������ 99 D D D D2001�� X D D D D
331 Primary metal manufacturing 2002������������������������������������ 26 22 499 12 824 4 065 5 6102001�� X 24 006 11 284 3 811 8 911
332 Fabricated metal product manufacturing 2002�������������������������� 210 140 687 31 507 13 453 95 7262001�� X 140 149 29 836 14 376 95 937
333 Machinery manufacturing 2002��������������������������������������� 33 D D D D2001�� X D D D D
334 Computer and electronic product manufacturing 2002�������������������� 26 109 633 24 173 25 095 60 3652001�� X 108 972 22 453 26 915 59 604
335 Electrical equipment, appliance, and component manufacturing 2002������ 30 D D D D2001�� X D D D D
336 Transportation equipment manufacturing 2002�������������������������� 10 D D D D2001�� X D D D D
337 Furniture and related product manufacturing 2002����������������������� 130 30 149 10 106 4 793 15 2502001�� X 29 163 9 639 4 556 14 968
339 Miscellaneous manufacturing 2002������������������������������������ 91 140 605 24 364 45 376 70 8642001�� X 130 208 32 266 41 573 56 368
See footnotes at end of table.
92 Puerto Rico–Manufacturing 2002 Economic Census of Island AreasU.S. Census Bureau, 2002 Economic Census
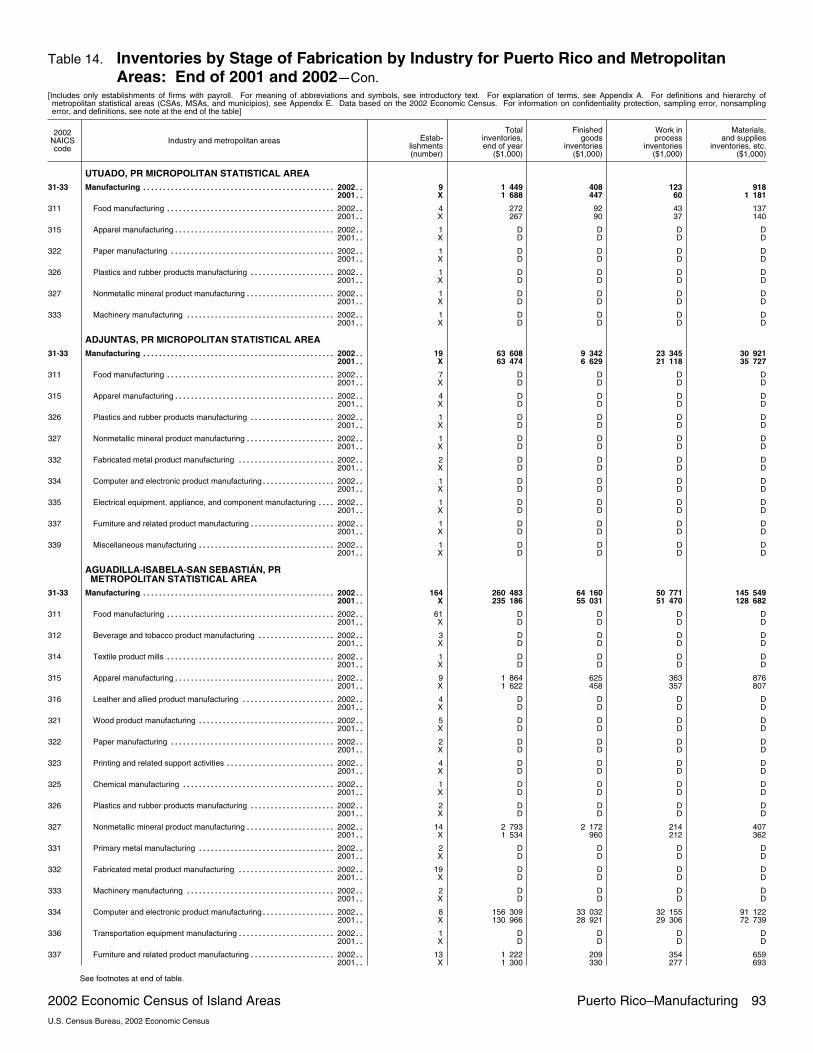
Table 14. Inventories by Stage of Fabrication by Industry for Puerto Rico and MetropolitanAreas: End of 2001 and 2002�Con.
[Includes only establishments of firms with payroll. For meaning of abbreviations and symbols, see introductory text. For explanation of terms, see Appendix A. For definitions and hierarchy ofmetropolitan statistical areas (CSAs, MSAs, and municipios), see Appendix E. Data based on the 2002 Economic Census. For information on confidentiality protection, sampling error, nonsamplingerror, and definitions, see note at the end of the table]
2002NAICScode
Industry and metropolitan areas Estab�lishments(number)
Totalinventories,end of year
($1,000)
Finishedgoods
inventories($1,000)
Work inprocess
inventories($1,000)
Materials,and supplies
inventories, etc.($1,000)
UTUADO, PR MICROPOLITAN STATISTICAL AREA31�33 Manufacturing 2002�������������������������������������������������� 9 1 449 408 123 918
2001�� X 1 688 447 60 1 181
311 Food manufacturing 2002�������������������������������������������� 4 272 92 43 1372001�� X 267 90 37 140
315 Apparel manufacturing 2002������������������������������������������ 1 D D D D2001�� X D D D D
322 Paper manufacturing 2002������������������������������������������� 1 D D D D2001�� X D D D D
326 Plastics and rubber products manufacturing 2002����������������������� 1 D D D D2001�� X D D D D
327 Nonmetallic mineral product manufacturing 2002������������������������ 1 D D D D2001�� X D D D D
333 Machinery manufacturing 2002��������������������������������������� 1 D D D D2001�� X D D D D
ADJUNTAS, PR MICROPOLITAN STATISTICAL AREA31�33 Manufacturing 2002�������������������������������������������������� 19 63 608 9 342 23 345 30 921
2001�� X 63 474 6 629 21 118 35 727
311 Food manufacturing 2002�������������������������������������������� 7 D D D D2001�� X D D D D
315 Apparel manufacturing 2002������������������������������������������ 4 D D D D2001�� X D D D D
326 Plastics and rubber products manufacturing 2002����������������������� 1 D D D D2001�� X D D D D
327 Nonmetallic mineral product manufacturing 2002������������������������ 1 D D D D2001�� X D D D D
332 Fabricated metal product manufacturing 2002�������������������������� 2 D D D D2001�� X D D D D
334 Computer and electronic product manufacturing 2002�������������������� 1 D D D D2001�� X D D D D
335 Electrical equipment, appliance, and component manufacturing 2002������ 1 D D D D2001�� X D D D D
337 Furniture and related product manufacturing 2002����������������������� 1 D D D D2001�� X D D D D
339 Miscellaneous manufacturing 2002������������������������������������ 1 D D D D2001�� X D D D D
AGUADILLA�ISABELA�SAN SEBASTIÁN, PRMETROPOLITAN STATISTICAL AREA
31�33 Manufacturing 2002�������������������������������������������������� 164 260 483 64 160 50 771 145 5492001�� X 235 186 55 031 51 470 128 682
311 Food manufacturing 2002�������������������������������������������� 61 D D D D2001�� X D D D D
312 Beverage and tobacco product manufacturing 2002��������������������� 3 D D D D2001�� X D D D D
314 Textile product mills 2002�������������������������������������������� 1 D D D D2001�� X D D D D
315 Apparel manufacturing 2002������������������������������������������ 9 1 864 625 363 8762001�� X 1 622 458 357 807
316 Leather and allied product manufacturing 2002������������������������� 4 D D D D2001�� X D D D D
321 Wood product manufacturing 2002������������������������������������ 5 D D D D2001�� X D D D D
322 Paper manufacturing 2002������������������������������������������� 2 D D D D2001�� X D D D D
323 Printing and related support activities 2002����������������������������� 4 D D D D2001�� X D D D D
325 Chemical manufacturing 2002���������������������������������������� 1 D D D D2001�� X D D D D
326 Plastics and rubber products manufacturing 2002����������������������� 2 D D D D2001�� X D D D D
327 Nonmetallic mineral product manufacturing 2002������������������������ 14 2 793 2 172 214 4072001�� X 1 534 960 212 362
331 Primary metal manufacturing 2002������������������������������������ 2 D D D D2001�� X D D D D
332 Fabricated metal product manufacturing 2002�������������������������� 19 D D D D2001�� X D D D D
333 Machinery manufacturing 2002��������������������������������������� 2 D D D D2001�� X D D D D
334 Computer and electronic product manufacturing 2002�������������������� 8 156 309 33 032 32 155 91 1222001�� X 130 966 28 921 29 306 72 739
336 Transportation equipment manufacturing 2002�������������������������� 1 D D D D2001�� X D D D D
337 Furniture and related product manufacturing 2002����������������������� 13 1 222 209 354 6592001�� X 1 300 330 277 693
See footnotes at end of table.
2002 Economic Census of Island Areas Puerto Rico–Manufacturing 93U.S. Census Bureau, 2002 Economic Census
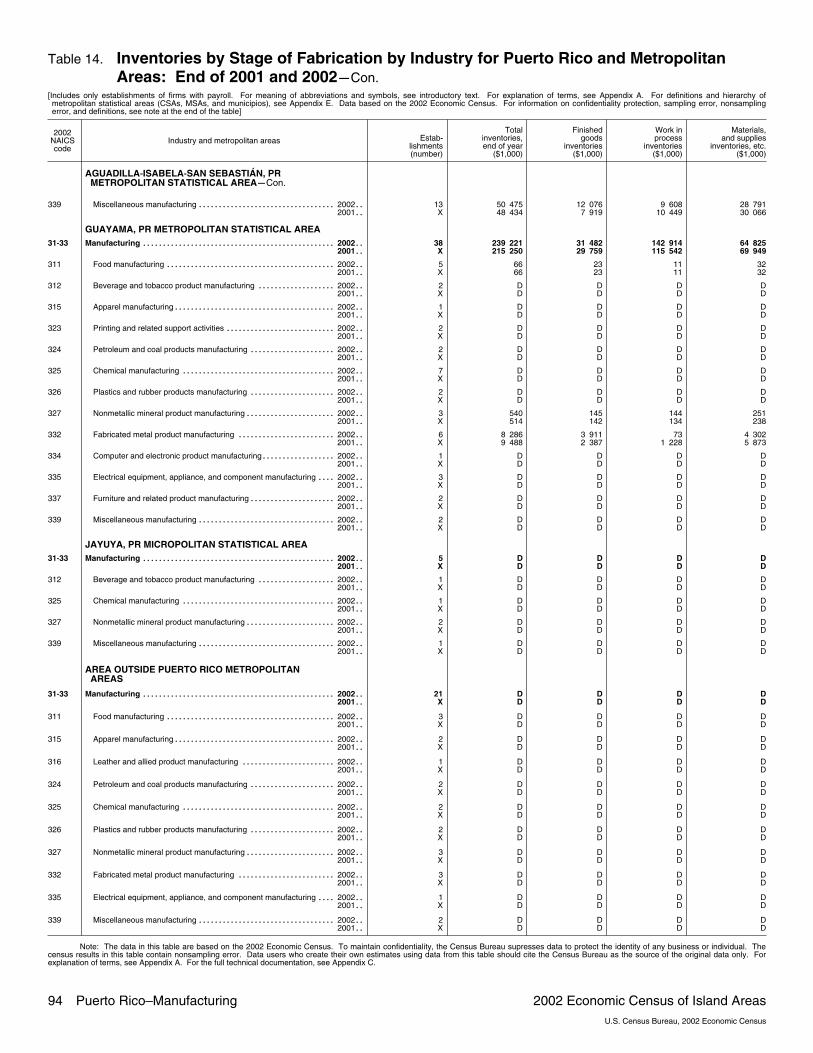
Table 14. Inventories by Stage of Fabrication by Industry for Puerto Rico and MetropolitanAreas: End of 2001 and 2002�Con.
[Includes only establishments of firms with payroll. For meaning of abbreviations and symbols, see introductory text. For explanation of terms, see Appendix A. For definitions and hierarchy ofmetropolitan statistical areas (CSAs, MSAs, and municipios), see Appendix E. Data based on the 2002 Economic Census. For information on confidentiality protection, sampling error, nonsamplingerror, and definitions, see note at the end of the table]
2002NAICScode
Industry and metropolitan areas Estab�lishments(number)
Totalinventories,end of year
($1,000)
Finishedgoods
inventories($1,000)
Work inprocess
inventories($1,000)
Materials,and supplies
inventories, etc.($1,000)
AGUADILLA�ISABELA�SAN SEBASTIÁN, PRMETROPOLITAN STATISTICAL AREA�Con.
339 Miscellaneous manufacturing 2002������������������������������������ 13 50 475 12 076 9 608 28 7912001�� X 48 434 7 919 10 449 30 066
GUAYAMA, PR METROPOLITAN STATISTICAL AREA31�33 Manufacturing 2002�������������������������������������������������� 38 239 221 31 482 142 914 64 825
2001�� X 215 250 29 759 115 542 69 949
311 Food manufacturing 2002�������������������������������������������� 5 66 23 11 322001�� X 66 23 11 32
312 Beverage and tobacco product manufacturing 2002��������������������� 2 D D D D2001�� X D D D D
315 Apparel manufacturing 2002������������������������������������������ 1 D D D D2001�� X D D D D
323 Printing and related support activities 2002����������������������������� 2 D D D D2001�� X D D D D
324 Petroleum and coal products manufacturing 2002����������������������� 2 D D D D2001�� X D D D D
325 Chemical manufacturing 2002���������������������������������������� 7 D D D D2001�� X D D D D
326 Plastics and rubber products manufacturing 2002����������������������� 2 D D D D2001�� X D D D D
327 Nonmetallic mineral product manufacturing 2002������������������������ 3 540 145 144 2512001�� X 514 142 134 238
332 Fabricated metal product manufacturing 2002�������������������������� 6 8 286 3 911 73 4 3022001�� X 9 488 2 387 1 228 5 873
334 Computer and electronic product manufacturing 2002�������������������� 1 D D D D2001�� X D D D D
335 Electrical equipment, appliance, and component manufacturing 2002������ 3 D D D D2001�� X D D D D
337 Furniture and related product manufacturing 2002����������������������� 2 D D D D2001�� X D D D D
339 Miscellaneous manufacturing 2002������������������������������������ 2 D D D D2001�� X D D D D
JAYUYA, PR MICROPOLITAN STATISTICAL AREA31�33 Manufacturing 2002�������������������������������������������������� 5 D D D D
2001�� X D D D D
312 Beverage and tobacco product manufacturing 2002��������������������� 1 D D D D2001�� X D D D D
325 Chemical manufacturing 2002���������������������������������������� 1 D D D D2001�� X D D D D
327 Nonmetallic mineral product manufacturing 2002������������������������ 2 D D D D2001�� X D D D D
339 Miscellaneous manufacturing 2002������������������������������������ 1 D D D D2001�� X D D D D
AREA OUTSIDE PUERTO RICO METROPOLITANAREAS
31�33 Manufacturing 2002�������������������������������������������������� 21 D D D D2001�� X D D D D
311 Food manufacturing 2002�������������������������������������������� 3 D D D D2001�� X D D D D
315 Apparel manufacturing 2002������������������������������������������ 2 D D D D2001�� X D D D D
316 Leather and allied product manufacturing 2002������������������������� 1 D D D D2001�� X D D D D
324 Petroleum and coal products manufacturing 2002����������������������� 2 D D D D2001�� X D D D D
325 Chemical manufacturing 2002���������������������������������������� 2 D D D D2001�� X D D D D
326 Plastics and rubber products manufacturing 2002����������������������� 2 D D D D2001�� X D D D D
327 Nonmetallic mineral product manufacturing 2002������������������������ 3 D D D D2001�� X D D D D
332 Fabricated metal product manufacturing 2002�������������������������� 3 D D D D2001�� X D D D D
335 Electrical equipment, appliance, and component manufacturing 2002������ 1 D D D D2001�� X D D D D
339 Miscellaneous manufacturing 2002������������������������������������ 2 D D D D2001�� X D D D D
Note: The data in this table are based on the 2002 Economic Census. To maintain confidentiality, the Census Bureau supresses data to protect the identity of any business or individual. Thecensus results in this table contain nonsampling error. Data users who create their own estimates using data from this table should cite the Census Bureau as the source of the original data only. Forexplanation of terms, see Appendix A. For the full technical documentation, see Appendix C.
94 Puerto Rico–Manufacturing 2002 Economic Census of Island AreasU.S. Census Bureau, 2002 Economic Census
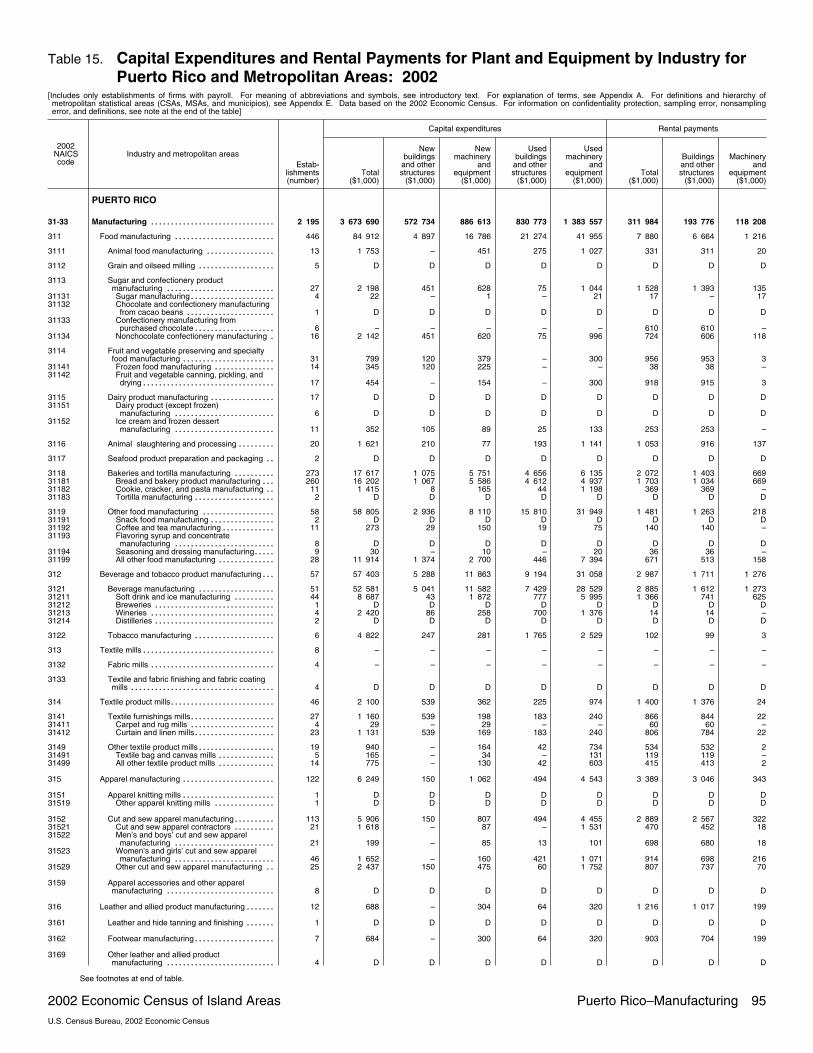
Table 15. Capital Expenditures and Rental Payments for Plant and Equipment by Industry forPuerto Rico and Metropolitan Areas: 2002
[Includes only establishments of firms with payroll. For meaning of abbreviations and symbols, see introductory text. For explanation of terms, see Appendix A. For definitions and hierarchy ofmetropolitan statistical areas (CSAs, MSAs, and municipios), see Appendix E. Data based on the 2002 Economic Census. For information on confidentiality protection, sampling error, nonsamplingerror, and definitions, see note at the end of the table]
2002NAICScode
Industry and metropolitan areas
Capital expenditures Rental payments
Estab�lishments(number)
Total($1,000)
Newbuildings
and otherstructures
($1,000)
Newmachinery
andequipment
($1,000)
Usedbuildings
and otherstructures
($1,000)
Usedmachinery
andequipment
($1,000)Total
($1,000)
Buildingsand otherstructures
($1,000)
Machineryand
equipment($1,000)
PUERTO RICO
31�33 Manufacturing 2 195������������������������������� 3 673 690 572 734 886 613 830 773 1 383 557 311 984 193 776 118 208
311 Food manufacturing 446������������������������� 84 912 4 897 16 786 21 274 41 955 7 880 6 664 1 216
3111 Animal food manufacturing 13����������������� 1 753 – 451 275 1 027 331 311 20
3112 Grain and oilseed milling 5������������������� D D D D D D D D
3113 Sugar and confectionery productmanufacturing 27��������������������������� 2 198 451 628 75 1 044 1 528 1 393 135
31131 Sugar manufacturing 4��������������������� 22 – 1 – 21 17 – 1731132 Chocolate and confectionery manufacturing
from cacao beans 1���������������������� D D D D D D D D31133 Confectionery manufacturing from
purchased chocolate 6�������������������� – – – – – 610 610 –31134 Nonchocolate confectionery manufacturing 16� 2 142 451 620 75 996 724 606 118
3114 Fruit and vegetable preserving and specialtyfood manufacturing 31����������������������� 799 120 379 – 300 956 953 3
31141 Frozen food manufacturing 14��������������� 345 120 225 – – 38 38 –31142 Fruit and vegetable canning, pickling, and
drying 17��������������������������������� 454 – 154 – 300 918 915 3
3115 Dairy product manufacturing 17���������������� D D D D D D D D31151 Dairy product (except frozen)
manufacturing 6������������������������� D D D D D D D D31152 Ice cream and frozen dessert
manufacturing 11������������������������� 352 105 89 25 133 253 253 –
3116 Animal slaughtering and processing 20��������� 1 621 210 77 193 1 141 1 053 916 137
3117 Seafood product preparation and packaging 2�� D D D D D D D D
3118 Bakeries and tortilla manufacturing 273���������� 17 617 1 075 5 751 4 656 6 135 2 072 1 403 66931181 Bread and bakery product manufacturing 260��� 16 202 1 067 5 586 4 612 4 937 1 703 1 034 66931182 Cookie, cracker, and pasta manufacturing 11�� 1 415 8 165 44 1 198 369 369 –31183 Tortilla manufacturing 2�������������������� D D D D D D D D
3119 Other food manufacturing 58������������������ 58 805 2 936 8 110 15 810 31 949 1 481 1 263 21831191 Snack food manufacturing 2���������������� D D D D D D D D31192 Coffee and tea manufacturing 11������������� 273 29 150 19 75 140 140 –31193 Flavoring syrup and concentrate
manufacturing 8������������������������� D D D D D D D D31194 Seasoning and dressing manufacturing 9����� 30 – 10 – 20 36 36 –31199 All other food manufacturing 28�������������� 11 914 1 374 2 700 446 7 394 671 513 158
312 Beverage and tobacco product manufacturing 57��� 57 403 5 288 11 863 9 194 31 058 2 987 1 711 1 276
3121 Beverage manufacturing 51������������������� 52 581 5 041 11 582 7 429 28 529 2 885 1 612 1 27331211 Soft drink and ice manufacturing 44���������� 8 687 43 1 872 777 5 995 1 366 741 62531212 Breweries 1������������������������������ D D D D D D D D31213 Wineries 4������������������������������� 2 420 86 258 700 1 376 14 14 –31214 Distilleries 2������������������������������ D D D D D D D D
3122 Tobacco manufacturing 6�������������������� 4 822 247 281 1 765 2 529 102 99 3
313 Textile mills 8��������������������������������� – – – – – – – –
3132 Fabric mills 4������������������������������� – – – – – – – –
3133 Textile and fabric finishing and fabric coatingmills 4������������������������������������ D D D D D D D D
314 Textile product mills 46�������������������������� 2 100 539 362 225 974 1 400 1 376 24
3141 Textile furnishings mills 27��������������������� 1 160 539 198 183 240 866 844 2231411 Carpet and rug mills 4��������������������� 29 – 29 – – 60 60 –31412 Curtain and linen mills 23�������������������� 1 131 539 169 183 240 806 784 22
3149 Other textile product mills 19������������������� 940 – 164 42 734 534 532 231491 Textile bag and canvas mills 5�������������� 165 – 34 – 131 119 119 –31499 All other textile product mills 14�������������� 775 – 130 42 603 415 413 2
315 Apparel manufacturing 122����������������������� 6 249 150 1 062 494 4 543 3 389 3 046 343
3151 Apparel knitting mills 1����������������������� D D D D D D D D31519 Other apparel knitting mills 1��������������� D D D D D D D D
3152 Cut and sew apparel manufacturing 113���������� 5 906 150 807 494 4 455 2 889 2 567 32231521 Cut and sew apparel contractors 21���������� 1 618 – 87 – 1 531 470 452 1831522 Men’s and boys’ cut and sew apparel
manufacturing 21������������������������� 199 – 85 13 101 698 680 1831523 Women’s and girls’ cut and sew apparel
manufacturing 46������������������������� 1 652 – 160 421 1 071 914 698 21631529 Other cut and sew apparel manufacturing 25�� 2 437 150 475 60 1 752 807 737 70
3159 Apparel accessories and other apparelmanufacturing 8��������������������������� D D D D D D D D
316 Leather and allied product manufacturing 12������� 688 – 304 64 320 1 216 1 017 199
3161 Leather and hide tanning and finishing 1������� D D D D D D D D
3162 Footwear manufacturing 7�������������������� 684 – 300 64 320 903 704 199
3169 Other leather and allied productmanufacturing 4��������������������������� D D D D D D D D
See footnotes at end of table.
2002 Economic Census of Island Areas Puerto Rico–Manufacturing 95U.S. Census Bureau, 2002 Economic Census
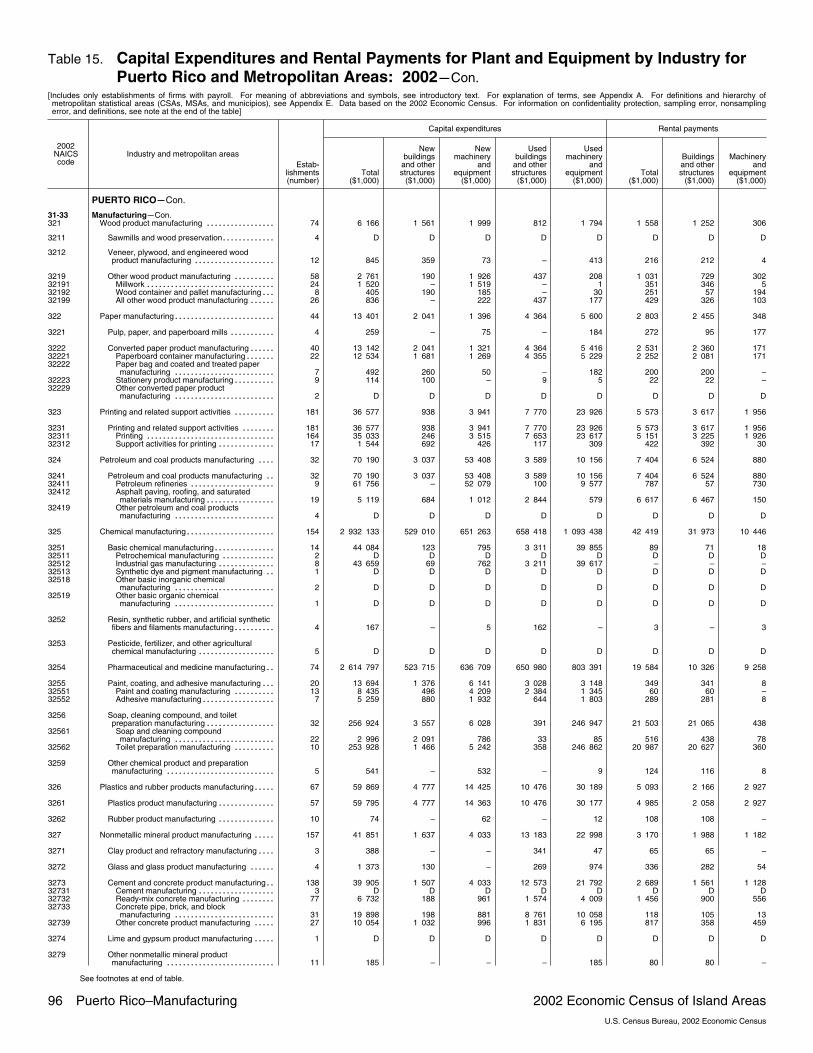
Table 15. Capital Expenditures and Rental Payments for Plant and Equipment by Industry forPuerto Rico and Metropolitan Areas: 2002�Con.
[Includes only establishments of firms with payroll. For meaning of abbreviations and symbols, see introductory text. For explanation of terms, see Appendix A. For definitions and hierarchy ofmetropolitan statistical areas (CSAs, MSAs, and municipios), see Appendix E. Data based on the 2002 Economic Census. For information on confidentiality protection, sampling error, nonsamplingerror, and definitions, see note at the end of the table]
2002NAICScode
Industry and metropolitan areas
Capital expenditures Rental payments
Estab�lishments(number)
Total($1,000)
Newbuildings
and otherstructures
($1,000)
Newmachinery
andequipment
($1,000)
Usedbuildings
and otherstructures
($1,000)
Usedmachinery
andequipment
($1,000)Total
($1,000)
Buildingsand otherstructures
($1,000)
Machineryand
equipment($1,000)
PUERTO RICO�Con.
31�33 Manufacturing�Con.321 Wood product manufacturing 74����������������� 6 166 1 561 1 999 812 1 794 1 558 1 252 306
3211 Sawmills and wood preservation 4������������� D D D D D D D D
3212 Veneer, plywood, and engineered woodproduct manufacturing 12�������������������� 845 359 73 – 413 216 212 4
3219 Other wood product manufacturing 58���������� 2 761 190 1 926 437 208 1 031 729 30232191 Millwork 24�������������������������������� 1 520 – 1 519 – 1 351 346 532192 Wood container and pallet manufacturing 8��� 405 190 185 – 30 251 57 19432199 All other wood product manufacturing 26������ 836 – 222 437 177 429 326 103
322 Paper manufacturing 44������������������������� 13 401 2 041 1 396 4 364 5 600 2 803 2 455 348
3221 Pulp, paper, and paperboard mills 4����������� 259 – 75 – 184 272 95 177
3222 Converted paper product manufacturing 40������ 13 142 2 041 1 321 4 364 5 416 2 531 2 360 17132221 Paperboard container manufacturing 22������� 12 534 1 681 1 269 4 355 5 229 2 252 2 081 17132222 Paper bag and coated and treated paper
manufacturing 7������������������������� 492 260 50 – 182 200 200 –32223 Stationery product manufacturing 9���������� 114 100 – 9 5 22 22 –32229 Other converted paper product
manufacturing 2������������������������� D D D D D D D D
323 Printing and related support activities 181���������� 36 577 938 3 941 7 770 23 926 5 573 3 617 1 956
3231 Printing and related support activities 181�������� 36 577 938 3 941 7 770 23 926 5 573 3 617 1 95632311 Printing 164�������������������������������� 35 033 246 3 515 7 653 23 617 5 151 3 225 1 92632312 Support activities for printing 17�������������� 1 544 692 426 117 309 422 392 30
324 Petroleum and coal products manufacturing 32���� 70 190 3 037 53 408 3 589 10 156 7 404 6 524 880
3241 Petroleum and coal products manufacturing 32�� 70 190 3 037 53 408 3 589 10 156 7 404 6 524 88032411 Petroleum refineries 9��������������������� 61 756 – 52 079 100 9 577 787 57 73032412 Asphalt paving, roofing, and saturated
materials manufacturing 19����������������� 5 119 684 1 012 2 844 579 6 617 6 467 15032419 Other petroleum and coal products
manufacturing 4������������������������� D D D D D D D D
325 Chemical manufacturing 154���������������������� 2 932 133 529 010 651 263 658 418 1 093 438 42 419 31 973 10 446
3251 Basic chemical manufacturing 14��������������� 44 084 123 795 3 311 39 855 89 71 1832511 Petrochemical manufacturing 2������������� D D D D D D D D32512 Industrial gas manufacturing 8�������������� 43 659 69 762 3 211 39 617 – – –32513 Synthetic dye and pigment manufacturing 1�� D D D D D D D D32518 Other basic inorganic chemical
manufacturing 2������������������������� D D D D D D D D32519 Other basic organic chemical
manufacturing 1������������������������� D D D D D D D D
3252 Resin, synthetic rubber, and artificial syntheticfibers and filaments manufacturing 4���������� 167 – 5 162 – 3 – 3
3253 Pesticide, fertilizer, and other agriculturalchemical manufacturing 5������������������� D D D D D D D D
3254 Pharmaceutical and medicine manufacturing 74�� 2 614 797 523 715 636 709 650 980 803 391 19 584 10 326 9 258
3255 Paint, coating, and adhesive manufacturing 20��� 13 694 1 376 6 141 3 028 3 148 349 341 832551 Paint and coating manufacturing 13���������� 8 435 496 4 209 2 384 1 345 60 60 –32552 Adhesive manufacturing 7������������������ 5 259 880 1 932 644 1 803 289 281 8
3256 Soap, cleaning compound, and toiletpreparation manufacturing 32����������������� 256 924 3 557 6 028 391 246 947 21 503 21 065 438
32561 Soap and cleaning compoundmanufacturing 22������������������������� 2 996 2 091 786 33 85 516 438 78
32562 Toilet preparation manufacturing 10���������� 253 928 1 466 5 242 358 246 862 20 987 20 627 360
3259 Other chemical product and preparationmanufacturing 5��������������������������� 541 – 532 – 9 124 116 8
326 Plastics and rubber products manufacturing 67����� 59 869 4 777 14 425 10 476 30 189 5 093 2 166 2 927
3261 Plastics product manufacturing 57�������������� 59 795 4 777 14 363 10 476 30 177 4 985 2 058 2 927
3262 Rubber product manufacturing 10�������������� 74 – 62 – 12 108 108 –
327 Nonmetallic mineral product manufacturing 157����� 41 851 1 637 4 033 13 183 22 998 3 170 1 988 1 182
3271 Clay product and refractory manufacturing 3���� 388 – – 341 47 65 65 –
3272 Glass and glass product manufacturing 4������ 1 373 130 – 269 974 336 282 54
3273 Cement and concrete product manufacturing 138�� 39 905 1 507 4 033 12 573 21 792 2 689 1 561 1 12832731 Cement manufacturing 3������������������� D D D D D D D D32732 Ready�mix concrete manufacturing 77�������� 6 732 188 961 1 574 4 009 1 456 900 55632733 Concrete pipe, brick, and block
manufacturing 31������������������������� 19 898 198 881 8 761 10 058 118 105 1332739 Other concrete product manufacturing 27����� 10 054 1 032 996 1 831 6 195 817 358 459
3274 Lime and gypsum product manufacturing 1����� D D D D D D D D
3279 Other nonmetallic mineral productmanufacturing 11��������������������������� 185 – – – 185 80 80 –
See footnotes at end of table.
96 Puerto Rico–Manufacturing 2002 Economic Census of Island AreasU.S. Census Bureau, 2002 Economic Census
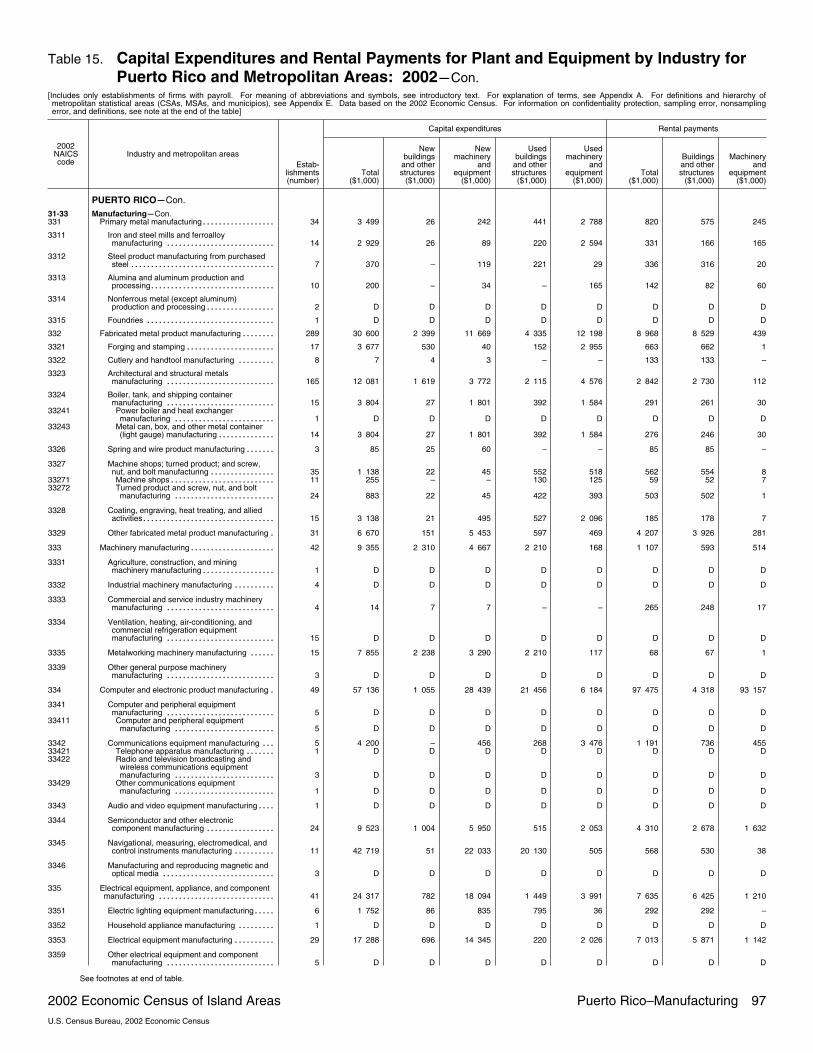
Table 15. Capital Expenditures and Rental Payments for Plant and Equipment by Industry forPuerto Rico and Metropolitan Areas: 2002�Con.
[Includes only establishments of firms with payroll. For meaning of abbreviations and symbols, see introductory text. For explanation of terms, see Appendix A. For definitions and hierarchy ofmetropolitan statistical areas (CSAs, MSAs, and municipios), see Appendix E. Data based on the 2002 Economic Census. For information on confidentiality protection, sampling error, nonsamplingerror, and definitions, see note at the end of the table]
2002NAICScode
Industry and metropolitan areas
Capital expenditures Rental payments
Estab�lishments(number)
Total($1,000)
Newbuildings
and otherstructures
($1,000)
Newmachinery
andequipment
($1,000)
Usedbuildings
and otherstructures
($1,000)
Usedmachinery
andequipment
($1,000)Total
($1,000)
Buildingsand otherstructures
($1,000)
Machineryand
equipment($1,000)
PUERTO RICO�Con.31�33 Manufacturing�Con.331 Primary metal manufacturing 34������������������ 3 499 26 242 441 2 788 820 575 245
3311 Iron and steel mills and ferroalloymanufacturing 14��������������������������� 2 929 26 89 220 2 594 331 166 165
3312 Steel product manufacturing from purchasedsteel 7������������������������������������ 370 – 119 221 29 336 316 20
3313 Alumina and aluminum production andprocessing 10������������������������������� 200 – 34 – 165 142 82 60
3314 Nonferrous metal (except aluminum)production and processing 2����������������� D D D D D D D D
3315 Foundries 1�������������������������������� D D D D D D D D
332 Fabricated metal product manufacturing 289�������� 30 600 2 399 11 669 4 335 12 198 8 968 8 529 439
3321 Forging and stamping 17���������������������� 3 677 530 40 152 2 955 663 662 1
3322 Cutlery and handtool manufacturing 8��������� 7 4 3 – – 133 133 –
3323 Architectural and structural metalsmanufacturing 165��������������������������� 12 081 1 619 3 772 2 115 4 576 2 842 2 730 112
3324 Boiler, tank, and shipping containermanufacturing 15��������������������������� 3 804 27 1 801 392 1 584 291 261 30
33241 Power boiler and heat exchangermanufacturing 1������������������������� D D D D D D D D
33243 Metal can, box, and other metal container(light gauge) manufacturing 14�������������� 3 804 27 1 801 392 1 584 276 246 30
3326 Spring and wire product manufacturing 3������� 85 25 60 – – 85 85 –
3327 Machine shops; turned product; and screw,nut, and bolt manufacturing 35���������������� 1 138 22 45 552 518 562 554 8
33271 Machine shops 11�������������������������� 255 – – 130 125 59 52 733272 Turned product and screw, nut, and bolt
manufacturing 24������������������������� 883 22 45 422 393 503 502 1
3328 Coating, engraving, heat treating, and alliedactivities 15��������������������������������� 3 138 21 495 527 2 096 185 178 7
3329 Other fabricated metal product manufacturing 31� 6 670 151 5 453 597 469 4 207 3 926 281
333 Machinery manufacturing 42��������������������� 9 355 2 310 4 667 2 210 168 1 107 593 514
3331 Agriculture, construction, and miningmachinery manufacturing 1������������������ D D D D D D D D
3332 Industrial machinery manufacturing 4���������� D D D D D D D D
3333 Commercial and service industry machinerymanufacturing 4��������������������������� 14 7 7 – – 265 248 17
3334 Ventilation, heating, air�conditioning, andcommercial refrigeration equipmentmanufacturing 15��������������������������� D D D D D D D D
3335 Metalworking machinery manufacturing 15������ 7 855 2 238 3 290 2 210 117 68 67 1
3339 Other general purpose machinerymanufacturing 3��������������������������� D D D D D D D D
334 Computer and electronic product manufacturing 49� 57 136 1 055 28 439 21 456 6 184 97 475 4 318 93 157
3341 Computer and peripheral equipmentmanufacturing 5��������������������������� D D D D D D D D
33411 Computer and peripheral equipmentmanufacturing 5������������������������� D D D D D D D D
3342 Communications equipment manufacturing 5��� 4 200 – 456 268 3 476 1 191 736 45533421 Telephone apparatus manufacturing 1������� D D D D D D D D33422 Radio and television broadcasting and
wireless communications equipmentmanufacturing 3������������������������� D D D D D D D D
33429 Other communications equipmentmanufacturing 1������������������������� D D D D D D D D
3343 Audio and video equipment manufacturing 1���� D D D D D D D D
3344 Semiconductor and other electroniccomponent manufacturing 24����������������� 9 523 1 004 5 950 515 2 053 4 310 2 678 1 632
3345 Navigational, measuring, electromedical, andcontrol instruments manufacturing 11���������� 42 719 51 22 033 20 130 505 568 530 38
3346 Manufacturing and reproducing magnetic andoptical media 3���������������������������� D D D D D D D D
335 Electrical equipment, appliance, and componentmanufacturing 41����������������������������� 24 317 782 18 094 1 449 3 991 7 635 6 425 1 210
3351 Electric lighting equipment manufacturing 6����� 1 752 86 835 795 36 292 292 –
3352 Household appliance manufacturing 1��������� D D D D D D D D
3353 Electrical equipment manufacturing 29���������� 17 288 696 14 345 220 2 026 7 013 5 871 1 142
3359 Other electrical equipment and componentmanufacturing 5��������������������������� D D D D D D D D
See footnotes at end of table.
2002 Economic Census of Island Areas Puerto Rico–Manufacturing 97U.S. Census Bureau, 2002 Economic Census

Table 15. Capital Expenditures and Rental Payments for Plant and Equipment by Industry forPuerto Rico and Metropolitan Areas: 2002�Con.
[Includes only establishments of firms with payroll. For meaning of abbreviations and symbols, see introductory text. For explanation of terms, see Appendix A. For definitions and hierarchy ofmetropolitan statistical areas (CSAs, MSAs, and municipios), see Appendix E. Data based on the 2002 Economic Census. For information on confidentiality protection, sampling error, nonsamplingerror, and definitions, see note at the end of the table]
2002NAICScode
Industry and metropolitan areas
Capital expenditures Rental payments
Estab�lishments(number)
Total($1,000)
Newbuildings
and otherstructures
($1,000)
Newmachinery
andequipment
($1,000)
Usedbuildings
and otherstructures
($1,000)
Usedmachinery
andequipment
($1,000)Total
($1,000)
Buildingsand otherstructures
($1,000)
Machineryand
equipment($1,000)
PUERTO RICO�Con.
31�33 Manufacturing�Con.336 Transportation equipment manufacturing 19������� 6 276 13 5 884 276 103 671 614 57
3362 Motor vehicle body and trailer manufacturing 1�� D D D D D D D D
3363 Motor vehicle parts manufacturing 13����������� 6 276 13 5 884 276 103 635 578 57
3364 Aerospace product and parts manufacturing 1�� D D D D D D D D
3366 Ship and boat building 4��������������������� – – – – – 36 36 –
337 Furniture and related product manufacturing 183���� 11 062 100 401 9 103 1 459 1 506 1 399 107
3371 Household and institutional furniture andkitchen cabinet manufacturing 154�������������� 10 225 90 283 8 903 950 960 883 77
33711 Wood kitchen cabinet and countertopmanufacturing 75������������������������� 585 90 75 273 147 288 263 25
33712 Household and institutional furnituremanufacturing 79������������������������� 9 640 – 208 8 630 803 672 620 52
3372 Office furniture (including fixtures)manufacturing 16��������������������������� 462 10 118 90 244 522 492 30
3379 Other furniture related product manufacturing 13� 375 – – 110 265 24 24 –
339 Miscellaneous manufacturing 138����������������� 219 906 12 174 56 375 61 640 89 715 108 910 107 534 1 376
3391 Medical equipment and suppliesmanufacturing 81��������������������������� 184 344 11 317 53 667 44 410 74 948 107 702 106 515 1 187
33911 Medical equipment and suppliesmanufacturing 81������������������������� 184 344 11 317 53 667 44 410 74 948 107 702 106 515 1 187
3399 Other miscellaneous manufacturing 57���������� 35 562 857 2 708 17 230 14 767 1 208 1 019 18933991 Jewelry and silverware manufacturing 15������ 578 – 497 11 70 226 203 2333992 Sporting and athletic goods manufacturing 2�� D D D D D D D D33993 Doll, toy, and game manufacturing 1��������� D D D D D D D D33994 Office supplies (except paper)
manufacturing 5������������������������� – – – – – 46 46 –33995 Sign manufacturing 23���������������������� 976 60 174 94 648 662 537 12533999 All other miscellaneous manufacturing 11����� 34 008 797 2 037 17 125 14 049 272 231 41
MAYAGÜEZ�SAN GERMÁN�CABO ROJO,PR COMBINED STATISTICAL AREA
31�33 Manufacturing 152������������������������������� 247 158 7 584 48 604 91 808 99 161 8 915 7 944 971
311 Food manufacturing 37������������������������� 2 256 1 151 1 105 – – 52 52 –
312 Beverage and tobacco product manufacturing 4��� D D D D D D D D
313 Textile mills 1��������������������������������� D D D D D D D D
314 Textile product mills 1�������������������������� D D D D D D D D
315 Apparel manufacturing 13����������������������� 1 906 – 316 13 1 577 1 064 1 026 38
321 Wood product manufacturing 7����������������� – – – – – 118 112 6
322 Paper manufacturing 1������������������������� D D D D D D D D
323 Printing and related support activities 11���������� 393 190 123 50 30 45 21 24
324 Petroleum and coal products manufacturing 1���� D D D D D D D D
325 Chemical manufacturing 8���������������������� 152 765 4 982 9 505 59 275 79 003 723 599 124
326 Plastics and rubber products manufacturing 3����� 1 746 – 83 – 1 663 60 60 –
327 Nonmetallic mineral product manufacturing 17����� 1 576 11 665 – 900 487 267 220
331 Primary metal manufacturing 3������������������ D D D D D D D D
332 Fabricated metal product manufacturing 19�������� 5 932 – 5 003 741 188 3 178 3 170 8
333 Machinery manufacturing 1��������������������� D D D D D D D D
334 Computer and electronic product manufacturing 4� 41 503 – 20 742 20 606 154 481 374 107
335 Electrical equipment, appliance, and componentmanufacturing 3����������������������������� D D D D D D D D
336 Transportation equipment manufacturing 1������� D D D D D D D D
337 Furniture and related product manufacturing 11���� 52 – 9 16 27 56 56 –
339 Miscellaneous manufacturing 6����������������� D D D D D D D D
See footnotes at end of table.
98 Puerto Rico–Manufacturing 2002 Economic Census of Island AreasU.S. Census Bureau, 2002 Economic Census
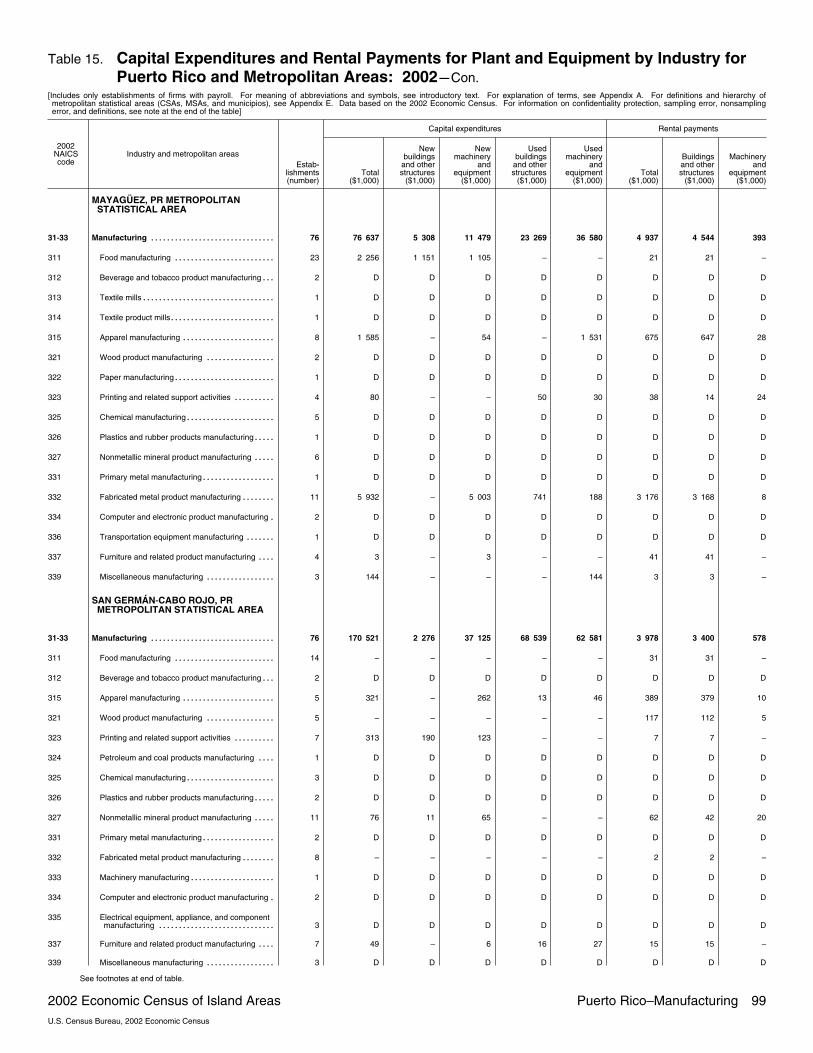
Table 15. Capital Expenditures and Rental Payments for Plant and Equipment by Industry forPuerto Rico and Metropolitan Areas: 2002�Con.
[Includes only establishments of firms with payroll. For meaning of abbreviations and symbols, see introductory text. For explanation of terms, see Appendix A. For definitions and hierarchy ofmetropolitan statistical areas (CSAs, MSAs, and municipios), see Appendix E. Data based on the 2002 Economic Census. For information on confidentiality protection, sampling error, nonsamplingerror, and definitions, see note at the end of the table]
2002NAICScode
Industry and metropolitan areas
Capital expenditures Rental payments
Estab�lishments(number)
Total($1,000)
Newbuildings
and otherstructures
($1,000)
Newmachinery
andequipment
($1,000)
Usedbuildings
and otherstructures
($1,000)
Usedmachinery
andequipment
($1,000)Total
($1,000)
Buildingsand otherstructures
($1,000)
Machineryand
equipment($1,000)
MAYAGÜEZ, PR METROPOLITANSTATISTICAL AREA
31�33 Manufacturing 76������������������������������� 76 637 5 308 11 479 23 269 36 580 4 937 4 544 393
311 Food manufacturing 23������������������������� 2 256 1 151 1 105 – – 21 21 –
312 Beverage and tobacco product manufacturing 2��� D D D D D D D D
313 Textile mills 1��������������������������������� D D D D D D D D
314 Textile product mills 1�������������������������� D D D D D D D D
315 Apparel manufacturing 8����������������������� 1 585 – 54 – 1 531 675 647 28
321 Wood product manufacturing 2����������������� D D D D D D D D
322 Paper manufacturing 1������������������������� D D D D D D D D
323 Printing and related support activities 4���������� 80 – – 50 30 38 14 24
325 Chemical manufacturing 5���������������������� D D D D D D D D
326 Plastics and rubber products manufacturing 1����� D D D D D D D D
327 Nonmetallic mineral product manufacturing 6����� D D D D D D D D
331 Primary metal manufacturing 1������������������ D D D D D D D D
332 Fabricated metal product manufacturing 11�������� 5 932 – 5 003 741 188 3 176 3 168 8
334 Computer and electronic product manufacturing 2� D D D D D D D D
336 Transportation equipment manufacturing 1������� D D D D D D D D
337 Furniture and related product manufacturing 4���� 3 – 3 – – 41 41 –
339 Miscellaneous manufacturing 3����������������� 144 – – – 144 3 3 –
SAN GERMÁN�CABO ROJO, PRMETROPOLITAN STATISTICAL AREA
31�33 Manufacturing 76������������������������������� 170 521 2 276 37 125 68 539 62 581 3 978 3 400 578
311 Food manufacturing 14������������������������� – – – – – 31 31 –
312 Beverage and tobacco product manufacturing 2��� D D D D D D D D
315 Apparel manufacturing 5����������������������� 321 – 262 13 46 389 379 10
321 Wood product manufacturing 5����������������� – – – – – 117 112 5
323 Printing and related support activities 7���������� 313 190 123 – – 7 7 –
324 Petroleum and coal products manufacturing 1���� D D D D D D D D
325 Chemical manufacturing 3���������������������� D D D D D D D D
326 Plastics and rubber products manufacturing 2����� D D D D D D D D
327 Nonmetallic mineral product manufacturing 11����� 76 11 65 – – 62 42 20
331 Primary metal manufacturing 2������������������ D D D D D D D D
332 Fabricated metal product manufacturing 8�������� – – – – – 2 2 –
333 Machinery manufacturing 1��������������������� D D D D D D D D
334 Computer and electronic product manufacturing 2� D D D D D D D D
335 Electrical equipment, appliance, and componentmanufacturing 3����������������������������� D D D D D D D D
337 Furniture and related product manufacturing 7���� 49 – 6 16 27 15 15 –
339 Miscellaneous manufacturing 3����������������� D D D D D D D D
See footnotes at end of table.
2002 Economic Census of Island Areas Puerto Rico–Manufacturing 99U.S. Census Bureau, 2002 Economic Census
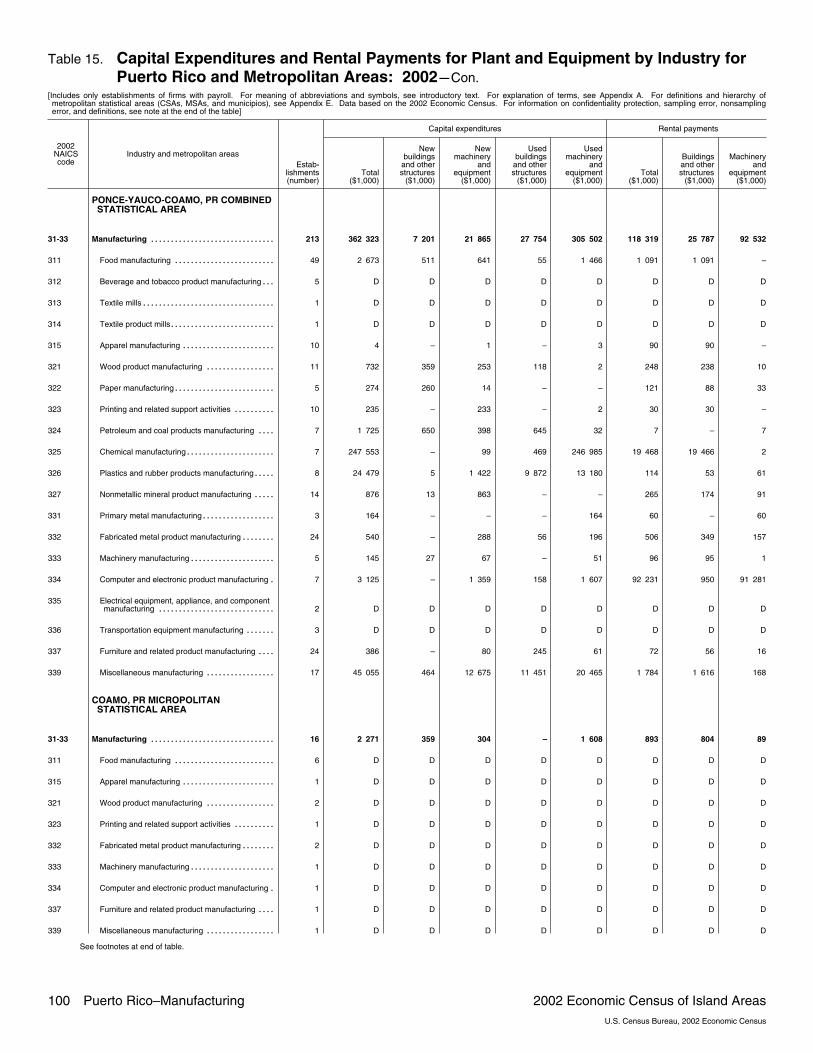
Table 15. Capital Expenditures and Rental Payments for Plant and Equipment by Industry forPuerto Rico and Metropolitan Areas: 2002�Con.
[Includes only establishments of firms with payroll. For meaning of abbreviations and symbols, see introductory text. For explanation of terms, see Appendix A. For definitions and hierarchy ofmetropolitan statistical areas (CSAs, MSAs, and municipios), see Appendix E. Data based on the 2002 Economic Census. For information on confidentiality protection, sampling error, nonsamplingerror, and definitions, see note at the end of the table]
2002NAICScode
Industry and metropolitan areas
Capital expenditures Rental payments
Estab�lishments(number)
Total($1,000)
Newbuildings
and otherstructures
($1,000)
Newmachinery
andequipment
($1,000)
Usedbuildings
and otherstructures
($1,000)
Usedmachinery
andequipment
($1,000)Total
($1,000)
Buildingsand otherstructures
($1,000)
Machineryand
equipment($1,000)
PONCE�YAUCO�COAMO, PR COMBINEDSTATISTICAL AREA
31�33 Manufacturing 213������������������������������� 362 323 7 201 21 865 27 754 305 502 118 319 25 787 92 532
311 Food manufacturing 49������������������������� 2 673 511 641 55 1 466 1 091 1 091 –
312 Beverage and tobacco product manufacturing 5��� D D D D D D D D
313 Textile mills 1��������������������������������� D D D D D D D D
314 Textile product mills 1�������������������������� D D D D D D D D
315 Apparel manufacturing 10����������������������� 4 – 1 – 3 90 90 –
321 Wood product manufacturing 11����������������� 732 359 253 118 2 248 238 10
322 Paper manufacturing 5������������������������� 274 260 14 – – 121 88 33
323 Printing and related support activities 10���������� 235 – 233 – 2 30 30 –
324 Petroleum and coal products manufacturing 7���� 1 725 650 398 645 32 7 – 7
325 Chemical manufacturing 7���������������������� 247 553 – 99 469 246 985 19 468 19 466 2
326 Plastics and rubber products manufacturing 8����� 24 479 5 1 422 9 872 13 180 114 53 61
327 Nonmetallic mineral product manufacturing 14����� 876 13 863 – – 265 174 91
331 Primary metal manufacturing 3������������������ 164 – – – 164 60 – 60
332 Fabricated metal product manufacturing 24�������� 540 – 288 56 196 506 349 157
333 Machinery manufacturing 5��������������������� 145 27 67 – 51 96 95 1
334 Computer and electronic product manufacturing 7� 3 125 – 1 359 158 1 607 92 231 950 91 281
335 Electrical equipment, appliance, and componentmanufacturing 2����������������������������� D D D D D D D D
336 Transportation equipment manufacturing 3������� D D D D D D D D
337 Furniture and related product manufacturing 24���� 386 – 80 245 61 72 56 16
339 Miscellaneous manufacturing 17����������������� 45 055 464 12 675 11 451 20 465 1 784 1 616 168
COAMO, PR MICROPOLITANSTATISTICAL AREA
31�33 Manufacturing 16������������������������������� 2 271 359 304 – 1 608 893 804 89
311 Food manufacturing 6������������������������� D D D D D D D D
315 Apparel manufacturing 1����������������������� D D D D D D D D
321 Wood product manufacturing 2����������������� D D D D D D D D
323 Printing and related support activities 1���������� D D D D D D D D
332 Fabricated metal product manufacturing 2�������� D D D D D D D D
333 Machinery manufacturing 1��������������������� D D D D D D D D
334 Computer and electronic product manufacturing 1� D D D D D D D D
337 Furniture and related product manufacturing 1���� D D D D D D D D
339 Miscellaneous manufacturing 1����������������� D D D D D D D D
See footnotes at end of table.
100 Puerto Rico–Manufacturing 2002 Economic Census of Island AreasU.S. Census Bureau, 2002 Economic Census
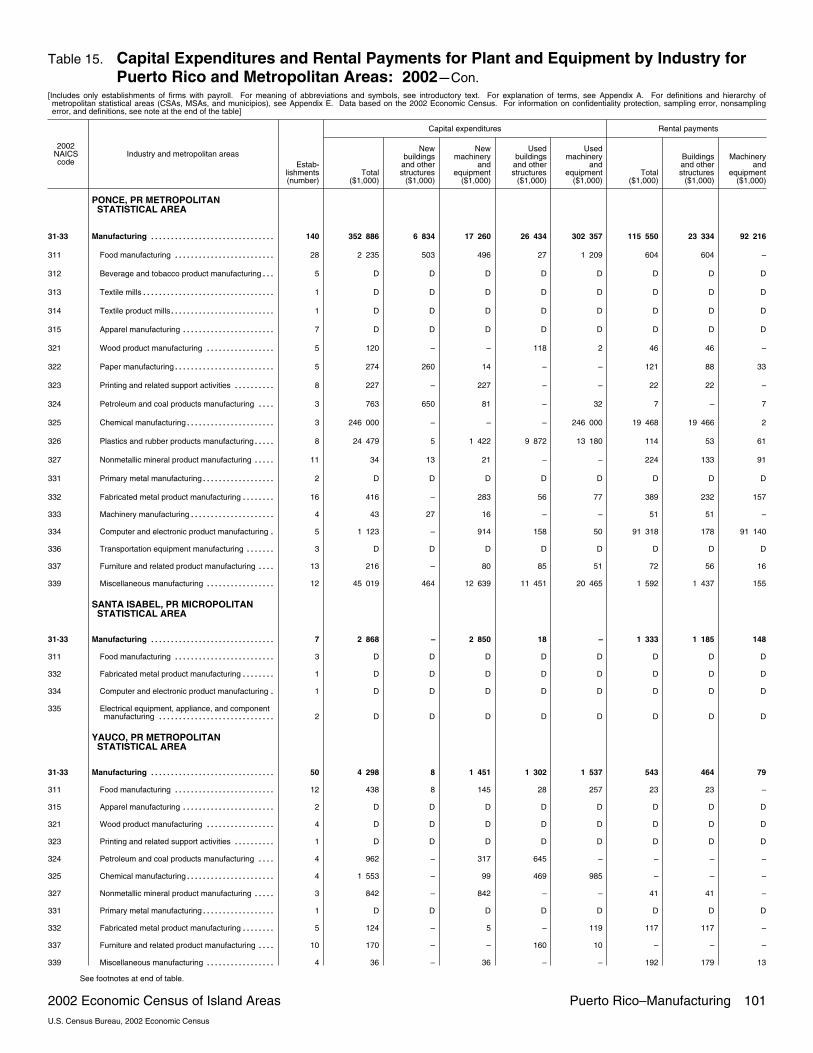
Table 15. Capital Expenditures and Rental Payments for Plant and Equipment by Industry forPuerto Rico and Metropolitan Areas: 2002�Con.
[Includes only establishments of firms with payroll. For meaning of abbreviations and symbols, see introductory text. For explanation of terms, see Appendix A. For definitions and hierarchy ofmetropolitan statistical areas (CSAs, MSAs, and municipios), see Appendix E. Data based on the 2002 Economic Census. For information on confidentiality protection, sampling error, nonsamplingerror, and definitions, see note at the end of the table]
2002NAICScode
Industry and metropolitan areas
Capital expenditures Rental payments
Estab�lishments(number)
Total($1,000)
Newbuildings
and otherstructures
($1,000)
Newmachinery
andequipment
($1,000)
Usedbuildings
and otherstructures
($1,000)
Usedmachinery
andequipment
($1,000)Total
($1,000)
Buildingsand otherstructures
($1,000)
Machineryand
equipment($1,000)
PONCE, PR METROPOLITANSTATISTICAL AREA
31�33 Manufacturing 140������������������������������� 352 886 6 834 17 260 26 434 302 357 115 550 23 334 92 216
311 Food manufacturing 28������������������������� 2 235 503 496 27 1 209 604 604 –
312 Beverage and tobacco product manufacturing 5��� D D D D D D D D
313 Textile mills 1��������������������������������� D D D D D D D D
314 Textile product mills 1�������������������������� D D D D D D D D
315 Apparel manufacturing 7����������������������� D D D D D D D D
321 Wood product manufacturing 5����������������� 120 – – 118 2 46 46 –
322 Paper manufacturing 5������������������������� 274 260 14 – – 121 88 33
323 Printing and related support activities 8���������� 227 – 227 – – 22 22 –
324 Petroleum and coal products manufacturing 3���� 763 650 81 – 32 7 – 7
325 Chemical manufacturing 3���������������������� 246 000 – – – 246 000 19 468 19 466 2
326 Plastics and rubber products manufacturing 8����� 24 479 5 1 422 9 872 13 180 114 53 61
327 Nonmetallic mineral product manufacturing 11����� 34 13 21 – – 224 133 91
331 Primary metal manufacturing 2������������������ D D D D D D D D
332 Fabricated metal product manufacturing 16�������� 416 – 283 56 77 389 232 157
333 Machinery manufacturing 4��������������������� 43 27 16 – – 51 51 –
334 Computer and electronic product manufacturing 5� 1 123 – 914 158 50 91 318 178 91 140
336 Transportation equipment manufacturing 3������� D D D D D D D D
337 Furniture and related product manufacturing 13���� 216 – 80 85 51 72 56 16
339 Miscellaneous manufacturing 12����������������� 45 019 464 12 639 11 451 20 465 1 592 1 437 155
SANTA ISABEL, PR MICROPOLITANSTATISTICAL AREA
31�33 Manufacturing 7������������������������������� 2 868 – 2 850 18 – 1 333 1 185 148
311 Food manufacturing 3������������������������� D D D D D D D D
332 Fabricated metal product manufacturing 1�������� D D D D D D D D
334 Computer and electronic product manufacturing 1� D D D D D D D D
335 Electrical equipment, appliance, and componentmanufacturing 2����������������������������� D D D D D D D D
YAUCO, PR METROPOLITANSTATISTICAL AREA
31�33 Manufacturing 50������������������������������� 4 298 8 1 451 1 302 1 537 543 464 79
311 Food manufacturing 12������������������������� 438 8 145 28 257 23 23 –
315 Apparel manufacturing 2����������������������� D D D D D D D D
321 Wood product manufacturing 4����������������� D D D D D D D D
323 Printing and related support activities 1���������� D D D D D D D D
324 Petroleum and coal products manufacturing 4���� 962 – 317 645 – – – –
325 Chemical manufacturing 4���������������������� 1 553 – 99 469 985 – – –
327 Nonmetallic mineral product manufacturing 3����� 842 – 842 – – 41 41 –
331 Primary metal manufacturing 1������������������ D D D D D D D D
332 Fabricated metal product manufacturing 5�������� 124 – 5 – 119 117 117 –
337 Furniture and related product manufacturing 10���� 170 – – 160 10 – – –
339 Miscellaneous manufacturing 4����������������� 36 – 36 – – 192 179 13
See footnotes at end of table.
2002 Economic Census of Island Areas Puerto Rico–Manufacturing 101U.S. Census Bureau, 2002 Economic Census
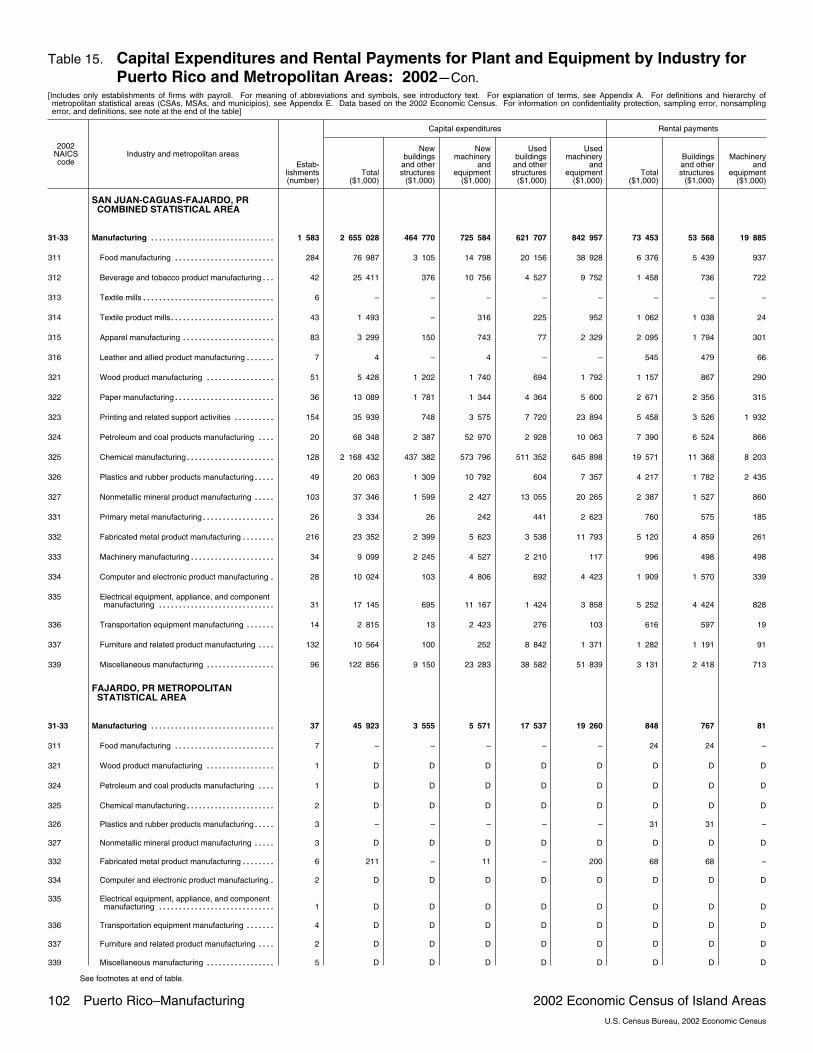
Table 15. Capital Expenditures and Rental Payments for Plant and Equipment by Industry forPuerto Rico and Metropolitan Areas: 2002�Con.
[Includes only establishments of firms with payroll. For meaning of abbreviations and symbols, see introductory text. For explanation of terms, see Appendix A. For definitions and hierarchy ofmetropolitan statistical areas (CSAs, MSAs, and municipios), see Appendix E. Data based on the 2002 Economic Census. For information on confidentiality protection, sampling error, nonsamplingerror, and definitions, see note at the end of the table]
2002NAICScode
Industry and metropolitan areas
Capital expenditures Rental payments
Estab�lishments(number)
Total($1,000)
Newbuildings
and otherstructures
($1,000)
Newmachinery
andequipment
($1,000)
Usedbuildings
and otherstructures
($1,000)
Usedmachinery
andequipment
($1,000)Total
($1,000)
Buildingsand otherstructures
($1,000)
Machineryand
equipment($1,000)
SAN JUAN�CAGUAS�FAJARDO, PRCOMBINED STATISTICAL AREA
31�33 Manufacturing 1 583������������������������������� 2 655 028 464 770 725 584 621 707 842 957 73 453 53 568 19 885
311 Food manufacturing 284������������������������� 76 987 3 105 14 798 20 156 38 928 6 376 5 439 937
312 Beverage and tobacco product manufacturing 42��� 25 411 376 10 756 4 527 9 752 1 458 736 722
313 Textile mills 6��������������������������������� – – – – – – – –
314 Textile product mills 43�������������������������� 1 493 – 316 225 952 1 062 1 038 24
315 Apparel manufacturing 83����������������������� 3 299 150 743 77 2 329 2 095 1 794 301
316 Leather and allied product manufacturing 7������� 4 – 4 – – 545 479 66
321 Wood product manufacturing 51����������������� 5 428 1 202 1 740 694 1 792 1 157 867 290
322 Paper manufacturing 36������������������������� 13 089 1 781 1 344 4 364 5 600 2 671 2 356 315
323 Printing and related support activities 154���������� 35 939 748 3 575 7 720 23 894 5 458 3 526 1 932
324 Petroleum and coal products manufacturing 20���� 68 348 2 387 52 970 2 928 10 063 7 390 6 524 866
325 Chemical manufacturing 128���������������������� 2 168 432 437 382 573 796 511 352 645 898 19 571 11 368 8 203
326 Plastics and rubber products manufacturing 49����� 20 063 1 309 10 792 604 7 357 4 217 1 782 2 435
327 Nonmetallic mineral product manufacturing 103����� 37 346 1 599 2 427 13 055 20 265 2 387 1 527 860
331 Primary metal manufacturing 26������������������ 3 334 26 242 441 2 623 760 575 185
332 Fabricated metal product manufacturing 216�������� 23 352 2 399 5 623 3 538 11 793 5 120 4 859 261
333 Machinery manufacturing 34��������������������� 9 099 2 245 4 527 2 210 117 996 498 498
334 Computer and electronic product manufacturing 28� 10 024 103 4 806 692 4 423 1 909 1 570 339
335 Electrical equipment, appliance, and componentmanufacturing 31����������������������������� 17 145 695 11 167 1 424 3 858 5 252 4 424 828
336 Transportation equipment manufacturing 14������� 2 815 13 2 423 276 103 616 597 19
337 Furniture and related product manufacturing 132���� 10 564 100 252 8 842 1 371 1 282 1 191 91
339 Miscellaneous manufacturing 96����������������� 122 856 9 150 23 283 38 582 51 839 3 131 2 418 713
FAJARDO, PR METROPOLITANSTATISTICAL AREA
31�33 Manufacturing 37������������������������������� 45 923 3 555 5 571 17 537 19 260 848 767 81
311 Food manufacturing 7������������������������� – – – – – 24 24 –
321 Wood product manufacturing 1����������������� D D D D D D D D
324 Petroleum and coal products manufacturing 1���� D D D D D D D D
325 Chemical manufacturing 2���������������������� D D D D D D D D
326 Plastics and rubber products manufacturing 3����� – – – – – 31 31 –
327 Nonmetallic mineral product manufacturing 3����� D D D D D D D D
332 Fabricated metal product manufacturing 6�������� 211 – 11 – 200 68 68 –
334 Computer and electronic product manufacturing 2� D D D D D D D D
335 Electrical equipment, appliance, and componentmanufacturing 1����������������������������� D D D D D D D D
336 Transportation equipment manufacturing 4������� D D D D D D D D
337 Furniture and related product manufacturing 2���� D D D D D D D D
339 Miscellaneous manufacturing 5����������������� D D D D D D D D
See footnotes at end of table.
102 Puerto Rico–Manufacturing 2002 Economic Census of Island AreasU.S. Census Bureau, 2002 Economic Census
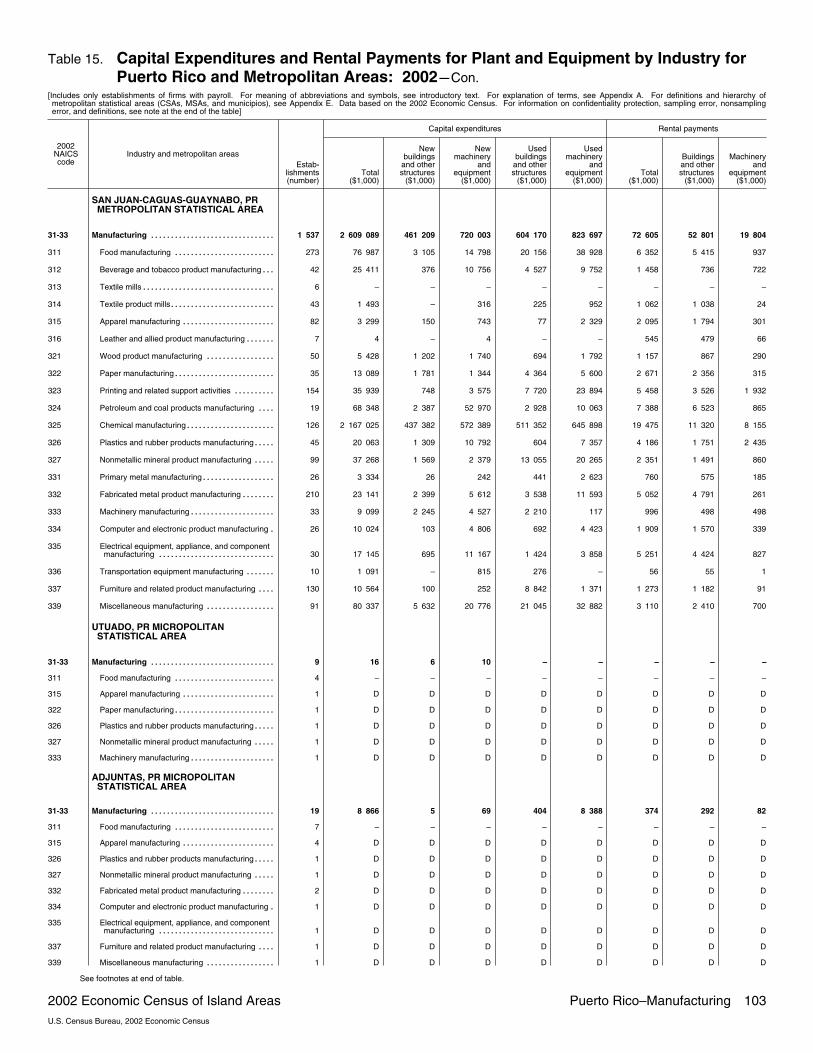
Table 15. Capital Expenditures and Rental Payments for Plant and Equipment by Industry forPuerto Rico and Metropolitan Areas: 2002�Con.
[Includes only establishments of firms with payroll. For meaning of abbreviations and symbols, see introductory text. For explanation of terms, see Appendix A. For definitions and hierarchy ofmetropolitan statistical areas (CSAs, MSAs, and municipios), see Appendix E. Data based on the 2002 Economic Census. For information on confidentiality protection, sampling error, nonsamplingerror, and definitions, see note at the end of the table]
2002NAICScode
Industry and metropolitan areas
Capital expenditures Rental payments
Estab�lishments(number)
Total($1,000)
Newbuildings
and otherstructures
($1,000)
Newmachinery
andequipment
($1,000)
Usedbuildings
and otherstructures
($1,000)
Usedmachinery
andequipment
($1,000)Total
($1,000)
Buildingsand otherstructures
($1,000)
Machineryand
equipment($1,000)
SAN JUAN�CAGUAS�GUAYNABO, PRMETROPOLITAN STATISTICAL AREA
31�33 Manufacturing 1 537������������������������������� 2 609 089 461 209 720 003 604 170 823 697 72 605 52 801 19 804
311 Food manufacturing 273������������������������� 76 987 3 105 14 798 20 156 38 928 6 352 5 415 937
312 Beverage and tobacco product manufacturing 42��� 25 411 376 10 756 4 527 9 752 1 458 736 722
313 Textile mills 6��������������������������������� – – – – – – – –
314 Textile product mills 43�������������������������� 1 493 – 316 225 952 1 062 1 038 24
315 Apparel manufacturing 82����������������������� 3 299 150 743 77 2 329 2 095 1 794 301
316 Leather and allied product manufacturing 7������� 4 – 4 – – 545 479 66
321 Wood product manufacturing 50����������������� 5 428 1 202 1 740 694 1 792 1 157 867 290
322 Paper manufacturing 35������������������������� 13 089 1 781 1 344 4 364 5 600 2 671 2 356 315
323 Printing and related support activities 154���������� 35 939 748 3 575 7 720 23 894 5 458 3 526 1 932
324 Petroleum and coal products manufacturing 19���� 68 348 2 387 52 970 2 928 10 063 7 388 6 523 865
325 Chemical manufacturing 126���������������������� 2 167 025 437 382 572 389 511 352 645 898 19 475 11 320 8 155
326 Plastics and rubber products manufacturing 45����� 20 063 1 309 10 792 604 7 357 4 186 1 751 2 435
327 Nonmetallic mineral product manufacturing 99����� 37 268 1 569 2 379 13 055 20 265 2 351 1 491 860
331 Primary metal manufacturing 26������������������ 3 334 26 242 441 2 623 760 575 185
332 Fabricated metal product manufacturing 210�������� 23 141 2 399 5 612 3 538 11 593 5 052 4 791 261
333 Machinery manufacturing 33��������������������� 9 099 2 245 4 527 2 210 117 996 498 498
334 Computer and electronic product manufacturing 26� 10 024 103 4 806 692 4 423 1 909 1 570 339
335 Electrical equipment, appliance, and componentmanufacturing 30����������������������������� 17 145 695 11 167 1 424 3 858 5 251 4 424 827
336 Transportation equipment manufacturing 10������� 1 091 – 815 276 – 56 55 1
337 Furniture and related product manufacturing 130���� 10 564 100 252 8 842 1 371 1 273 1 182 91
339 Miscellaneous manufacturing 91����������������� 80 337 5 632 20 776 21 045 32 882 3 110 2 410 700
UTUADO, PR MICROPOLITANSTATISTICAL AREA
31�33 Manufacturing 9������������������������������� 16 6 10 – – – – –
311 Food manufacturing 4������������������������� – – – – – – – –
315 Apparel manufacturing 1����������������������� D D D D D D D D
322 Paper manufacturing 1������������������������� D D D D D D D D
326 Plastics and rubber products manufacturing 1����� D D D D D D D D
327 Nonmetallic mineral product manufacturing 1����� D D D D D D D D
333 Machinery manufacturing 1��������������������� D D D D D D D D
ADJUNTAS, PR MICROPOLITANSTATISTICAL AREA
31�33 Manufacturing 19������������������������������� 8 866 5 69 404 8 388 374 292 82
311 Food manufacturing 7������������������������� – – – – – – – –
315 Apparel manufacturing 4����������������������� D D D D D D D D
326 Plastics and rubber products manufacturing 1����� D D D D D D D D
327 Nonmetallic mineral product manufacturing 1����� D D D D D D D D
332 Fabricated metal product manufacturing 2�������� D D D D D D D D
334 Computer and electronic product manufacturing 1� D D D D D D D D
335 Electrical equipment, appliance, and componentmanufacturing 1����������������������������� D D D D D D D D
337 Furniture and related product manufacturing 1���� D D D D D D D D
339 Miscellaneous manufacturing 1����������������� D D D D D D D D
See footnotes at end of table.
2002 Economic Census of Island Areas Puerto Rico–Manufacturing 103U.S. Census Bureau, 2002 Economic Census

Table 15. Capital Expenditures and Rental Payments for Plant and Equipment by Industry forPuerto Rico and Metropolitan Areas: 2002�Con.
[Includes only establishments of firms with payroll. For meaning of abbreviations and symbols, see introductory text. For explanation of terms, see Appendix A. For definitions and hierarchy ofmetropolitan statistical areas (CSAs, MSAs, and municipios), see Appendix E. Data based on the 2002 Economic Census. For information on confidentiality protection, sampling error, nonsamplingerror, and definitions, see note at the end of the table]
2002NAICScode
Industry and metropolitan areas
Capital expenditures Rental payments
Estab�lishments(number)
Total($1,000)
Newbuildings
and otherstructures
($1,000)
Newmachinery
andequipment
($1,000)
Usedbuildings
and otherstructures
($1,000)
Usedmachinery
andequipment
($1,000)Total
($1,000)
Buildingsand otherstructures
($1,000)
Machineryand
equipment($1,000)
AGUADILLA�ISABELA�SAN SEBASTIÁN,PR METROPOLITAN STATISTICALAREA
31�33 Manufacturing 164������������������������������� 18 550 2 918 8 106 1 762 5 764 5 224 3 142 2 082
311 Food manufacturing 61������������������������� 2 996 130 242 1 063 1 561 352 73 279
312 Beverage and tobacco product manufacturing 3��� 40 – – – 40 – – –
314 Textile product mills 1�������������������������� D D D D D D D D
315 Apparel manufacturing 9����������������������� 50 – 2 – 48 50 47 3
316 Leather and allied product manufacturing 4������� 664 – 280 64 320 671 538 133
321 Wood product manufacturing 5����������������� D D D D D D D D
322 Paper manufacturing 2������������������������� D D D D D D D D
323 Printing and related support activities 4���������� 10 – 10 – – 34 34 –
325 Chemical manufacturing 1���������������������� D D D D D D D D
326 Plastics and rubber products manufacturing 2����� D D D D D D D D
327 Nonmetallic mineral product manufacturing 14����� 1 995 4 61 128 1 802 11 – 11
331 Primary metal manufacturing 2������������������ D D D D D D D D
332 Fabricated metal product manufacturing 19�������� 109 – 103 – 6 113 108 5
333 Machinery manufacturing 2��������������������� D D D D D D D D
334 Computer and electronic product manufacturing 8� 2 484 952 1 532 – – 2 854 1 424 1 430
336 Transportation equipment manufacturing 1������� D D D D D D D D
337 Furniture and related product manufacturing 13���� 60 – 60 – – 96 96 –
339 Miscellaneous manufacturing 13����������������� 4 803 1 148 1 161 507 1 987 155 145 10
GUAYAMA, PR METROPOLITANSTATISTICAL AREA
31�33 Manufacturing 38������������������������������� 372 323 89 851 73 793 87 083 121 595 104 814 102 297 2 517
311 Food manufacturing 5������������������������� – – – – – – – –
312 Beverage and tobacco product manufacturing 2��� D D D D D D D D
315 Apparel manufacturing 1����������������������� D D D D D D D D
323 Printing and related support activities 2���������� D D D D D D D D
324 Petroleum and coal products manufacturing 2���� D D D D D D D D
325 Chemical manufacturing 7���������������������� D D D D D D D D
326 Plastics and rubber products manufacturing 2����� D D D D D D D D
327 Nonmetallic mineral product manufacturing 3����� 27 10 17 – – 20 20 –
332 Fabricated metal product manufacturing 6�������� 667 – 652 – 15 50 43 7
334 Computer and electronic product manufacturing 1� D D D D D D D D
335 Electrical equipment, appliance, and componentmanufacturing 3����������������������������� D D D D D D D D
337 Furniture and related product manufacturing 2���� D D D D D D D D
339 Miscellaneous manufacturing 2����������������� D D D D D D D D
JAYUYA, PR MICROPOLITANSTATISTICAL AREA
31�33 Manufacturing 5������������������������������� D D D D D D D D
312 Beverage and tobacco product manufacturing 1��� D D D D D D D D
325 Chemical manufacturing 1���������������������� D D D D D D D D
327 Nonmetallic mineral product manufacturing 2����� D D D D D D D D
339 Miscellaneous manufacturing 1����������������� D D D D D D D D
See footnotes at end of table.
104 Puerto Rico–Manufacturing 2002 Economic Census of Island AreasU.S. Census Bureau, 2002 Economic Census

Table 15. Capital Expenditures and Rental Payments for Plant and Equipment by Industry forPuerto Rico and Metropolitan Areas: 2002�Con.
[Includes only establishments of firms with payroll. For meaning of abbreviations and symbols, see introductory text. For explanation of terms, see Appendix A. For definitions and hierarchy ofmetropolitan statistical areas (CSAs, MSAs, and municipios), see Appendix E. Data based on the 2002 Economic Census. For information on confidentiality protection, sampling error, nonsamplingerror, and definitions, see note at the end of the table]
2002NAICScode
Industry and metropolitan areas
Capital expenditures Rental payments
Estab�lishments(number)
Total($1,000)
Newbuildings
and otherstructures
($1,000)
Newmachinery
andequipment
($1,000)
Usedbuildings
and otherstructures
($1,000)
Usedmachinery
andequipment
($1,000)Total
($1,000)
Buildingsand otherstructures
($1,000)
Machineryand
equipment($1,000)
AREA OUTSIDE PUERTO RICOMETROPOLITAN AREAS
31�33 Manufacturing 21������������������������������� 4 376 405 3 796 16 159 520 461 59
311 Food manufacturing 3������������������������� – – – – – 9 9 –
315 Apparel manufacturing 2����������������������� D D D D D D D D
316 Leather and allied product manufacturing 1������� D D D D D D D D
324 Petroleum and coal products manufacturing 2���� D D D D D D D D
325 Chemical manufacturing 2���������������������� D D D D D D D D
326 Plastics and rubber products manufacturing 2����� D D D D D D D D
327 Nonmetallic mineral product manufacturing 3����� D D D D D D D D
332 Fabricated metal product manufacturing 3�������� – – – – – 1 – 1
335 Electrical equipment, appliance, and componentmanufacturing 1����������������������������� D D D D D D D D
339 Miscellaneous manufacturing 2����������������� D D D D D D D D
Note: The data in this table are based on the 2002 Economic Census. To maintain confidentiality, the Census Bureau supresses data to protect the identity of any business or individual. Thecensus results in this table contain nonsampling error. Data users who create their own estimates using data from this table should cite the Census Bureau as the source of the original data only. Forexplanation of terms, see Appendix A. For the full technical documentation, see Appendix C.
2002 Economic Census of Island Areas Puerto Rico–Manufacturing 105U.S. Census Bureau, 2002 Economic Census