Published by the Stationery Office, Dublin, Ireland. - ESRI · Published by the Stationery Office,...
86
Published by the Stationery Office, Dublin, Ireland. To be purchased from the: Central Statistics Office, Information Section, Skehard Road, Cork. Government Publications Sales Office, Sun Alliance House, Molesworth Street, Dublin 2, or through any bookseller. Prn A9/0570 Price €10.00 April 2009
Transcript of Published by the Stationery Office, Dublin, Ireland. - ESRI · Published by the Stationery Office,...

Published by the Stationery Office, Dublin, Ireland.
To be purchased from the:
Central Statistics Office, Information Section, Skehard Road, Cork.
Government Publications Sales Office, Sun Alliance House,Molesworth Street, Dublin 2,
or through any bookseller.
Prn A9/0570 Price €10.00 April 2009

© Government of Ireland 2009
Material compiled and presented by theCentral Statistics Office in collaboration with the Economic and Social Research Institute.
Reproduction is authorised, except for commercialpurposes, provided the source is acknowledged.
ISBN 9781-4064-2089-0

3
Table of Contents Page
Introduction 5
Qualifications attaching to POWCAR data 5Broad information on commuting from Census 2006 6Notes on town profiles 7
Town Profiles
Athlone 10Bray 12Carlow 14Castlebar 16Clonmel 18Cork City 20Drogheda 22Droichead Nua (formerly Newbridge) 24Dublin City 26Dundalk 32Ennis 34Galway City 36Kilkenny 38Killarney 40Leixlip 42Letterkenny 44Limerick City 46Mullingar 48Naas 50Navan (An Uaimh) 52Portlaoighise 54Sligo 56Swords 58Tralee 60Tullamore 62Waterford City 64Wexford 66
Working populations - gainers and losers 68
Appendices
1 2006 Census questionnaire 72
2 Definitions 85

4
5
Introduction This report examines the towns in Ireland with a working population in excess of 5,000 persons in April 2006 and provides profiles for each of the 27 towns involved. These profiles focus on the principal characteristics of the relevant workers including their commuting patterns, the industries in which they were employed and their educational and socio-economic characteristics. The analysis draws on the Place of Work Census of Anonymised Records (POWCAR1) data set. As part of the census processing operation the responses to questions 31 and 32 on the 2006 census form were geo-coded. All journeys to work were coded and the detailed geographic data which resulted from this coding exercise was combined with the associated demographic and socio-economic information from the census.
Analyses of towns provided in previous Census 2006 reports were based on the resident populations of these towns. Utilising the POWCAR data, the present report provides a more refined analysis of the working population of the main centres of employment in April 2006. The following three components of the working population are distinguished separately: workers commuting into the town; persons leaving to work elsewhere and those who both live and work in the town. Also included are data relating to journey times and means of travel to work. The present report has been written in collaboration with the Economic and Social Research Institute (ESRI)2 which produced the town maps illustrated. These maps which were based on the POWCAR data illustrate the commuting catchment areas of each town specified in terms of Electoral Divisions (EDs). In the case of Dublin City, whose working population is many times larger than that of any of the other urban centres, further analysis is provided, showing the geographic distribution of the main industries.
Qualifications attaching to POWCAR data
A number of qualifications should be borne in mind with regard to the POWCAR data. Workers with no fixed place of work cannot have their journey coded to a particular destination. This is particularly pronounced for the construction industry which has a high proportion of mobile workers. The construction industry therefore is under-represented in the working populations of the towns in the present report. The boundaries of towns are redefined after each census in conformity with United Nations recommendations, as described in Appendix 2. It is possible that certain centres of employment, such as shopping centres, industrial estates and business parks, may lie just outside town boundaries. In these cases, residents who work in these locations outside the town boundary will be recorded as travelling outside the town to work elsewhere. Towns in border areas may have significant numbers commuting from Northern Ireland. However as residents of Northern Ireland are not covered by the Census, they are not included in the 1 For a full description of this data set see http://www.cso.ie/census/POWCAR_2006.htm. 2 The CSO wishes to place on record its appreciation for the input provided by Edgar Morgenroth of the ESRI.

6
2006: Percentage of workers in each Electoral Division who travel 30 kilometres or more to work
2002: Percentage of workers in each Electoral Division who travel 20 miles or more to work
profiles in this report. The tables only include those workers who are resident in the State and no small area geographical breakdown is provided for workers travelling from Northern Ireland.
Broad information on commuting from Census 2006 Even before the POWCAR became available, the Census 2006 published data already contains a wealth of information on travel to work. The increased reliance on car transport was noted, with over 57 per cent of workers driving to work. By contrast, bus transport saw its share drop from 6.7 per cent in 2002 to 6.1 per cent by 2006. Over the same period, the numbers travelling by train increased by over two thirds, a direct result of the introduction of the LUAS in Dublin. This general pattern of increasing numbers of workers commuting by car at the expense of public transport is further illustrated in this report with the number of car drivers far surpassing any other form of transport, even in the towns located on major railway lines. In terms of the distances travelled, no major changes were in evidence between 2002 and 2006. However the 2006 census was the first in which the question relating to journey distances was asked in kilometres. As a result the number of respondents who left the question blank increased from 12.2 per cent to 20.4 per cent. It is not clear to what extent this ‘questionnaire effect’ has impacted on comparisons between the two census years. In spite of this discontinuity, it is still possible to examine the trends in commuting distances over this period. The maps below show the percentages of workers who travelled more than 20 miles (2002) or 30 kilometres (2006) to work. It is evident from both maps that the main urban centres drew their workforces from a wide hinterland, a pattern borne out repeatedly in the town profiles in this report.
The average journey time to work increased slightly between 2002 and 2006, but remained under half an hour. The numbers taking more than an hour to get to work increased from 142,500 to 187,000, with urban dwellers having a longer commuting time than their rural counterparts despite their shorter average travelling distances.

7
Note on Town Profiles The maps in the town profiles shown in the remainder of this report are based on the working populations of each town as of April 2006. They illustrate the catchment area of each town by depicting the total number of workers in each Electoral Division who work in the relevant town. The major road and rail lines are also included. Each town profile also contains detailed tables on the Industrial Groups, Education and Socio-economic Group (SEG) of the workers. These tables distinguish between the town’s resident workers, those who travel outside the town to work and those who travel from outside to work within the town. Additional tables classify means of travel and journey times to work.


Town Profiles
Athlone
10
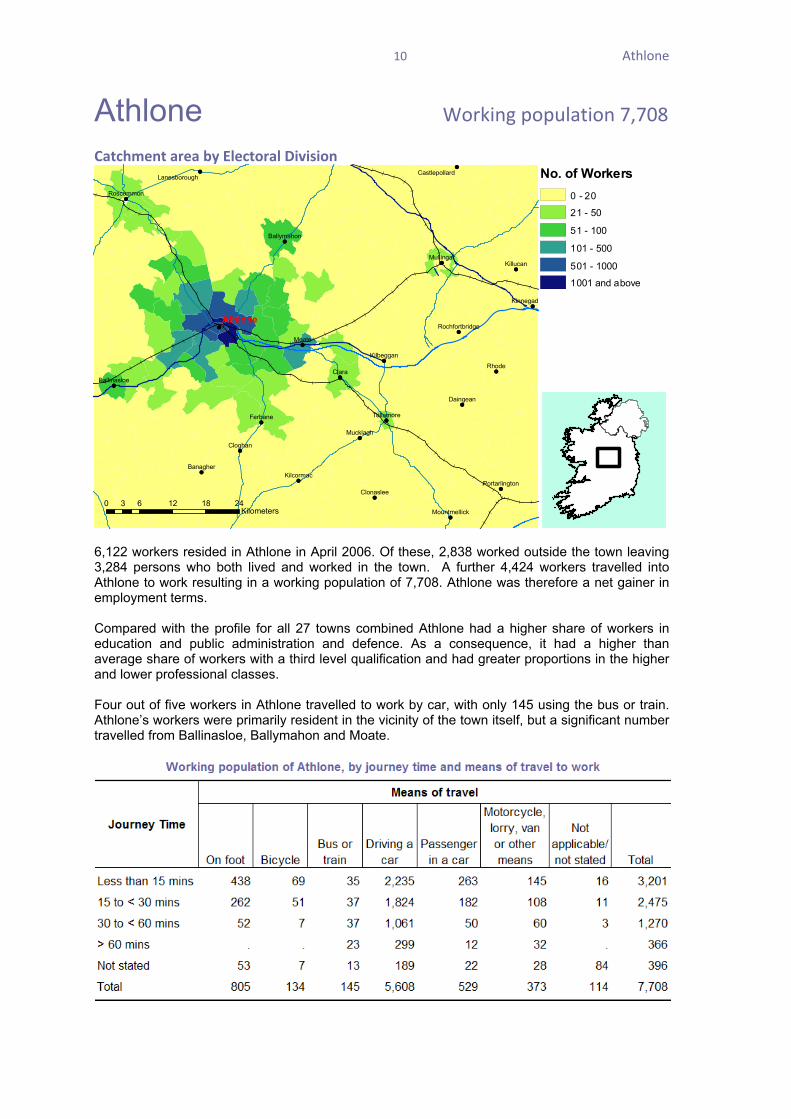
Athlone Working population 7,708 Catchment area by Electoral Division
●
●●
●
●
●
●
●
●
●
●
●
●
●
●
●
●
●
●
●●
●
●
●
●
●●
●
●
●
●
●
●
●
●
●
●
●
●
●
●
●
●
●●
●
●
●
RhodeClara
Moate
Cloghan
Ferbane
Mucklagh
Daingean
Banagher
Kinnegad
Killucan
Clonaslee
Roscommon
Kilcormac
Tullamore
Kilbeggan
Mullingar
Ballymahon
Ballinasloe
Mountmellick
Lanesborough
Portarlington
Castlepollard
RochfortbridgeAthlone
6,122 workers resided in Athlone in April 2006. Of these, 2,838 worked outside the town leaving 3,284 persons who both lived and worked in the town. A further 4,424 workers travelled into Athlone to work resulting in a working population of 7,708. Athlone was therefore a net gainer in employment terms. Compared with the profile for all 27 towns combined Athlone had a higher share of workers in education and public administration and defence. As a consequence, it had a higher than average share of workers with a third level qualification and had greater proportions in the higher and lower professional classes. Four out of five workers in Athlone travelled to work by car, with only 145 using the bus or train. Athlone’s workers were primarily resident in the vicinity of the town itself, but a significant number travelled from Ballinasloe, Ballymahon and Moate.
0 6 12 18 243Kilometers
No. of Workers0 - 20
21 - 50
51 - 100
101 - 500
501 - 1000
1001 and above

Athlone
11
Industrial Group
Total resident workers
Residents working outside
town
Workers living and working in
town
Workers travelling
from outside town
Working population
[A + B] [A] [B] [C] [B + C]Agriculture, forestry and fishing 37 23 14 28 42Manufacturing* 1,037 690 347 623 970Construction 243 155 88 220 308Wholesale and retail trade 1,046 336 710 698 1,408Hotels and restaurants 579 191 388 144 532Transport, storage and communications 532 350 182 274 456Banking and financial services 172 106 66 169 235Real estate, renting and business activities 582 291 291 392 683Public administration and defence 591 222 369 585 954Education 616 226 390 712 1,102Health and social work 440 166 274 420 694Other community, social and personal service activities
224 65 159 139 298
Industry not stated 23 17 6 20 26Total 6,122 2,838 3,284 4,424 7,708
*Includes Mining, quarrying and turf production and Electricity, gas and water supply
Level of Education
Total resident workers
Residents working outside
town
Workers living and working in
town
Workers travelling
from outside town
Working population
[A + B] [A] [B] [C] [B + C]Primary Education or none 317 75 242 188 430Lower Secondary 852 312 540 649 1,189Leaving Cert., Technical or Vocational 1,918 853 1,065 1,501 2,566Third level or higher 2,369 1,284 1,085 1,792 2,877Persons still in education (incl. not stated) 666 314 352 294 646Total 6,122 2,838 3,284 4,424 7,708
Socio-Economic Group
Total resident workers
Residents working outside
town
Workers living and working in
town
Workers travelling
from outside town
Working population
[A + B] [A] [B] [C] [B + C]A Employers and managers 885 410 475 682 1,157B Higher professional 606 351 255 440 695C Lower professional 780 421 359 764 1,123D Non-manual 2,102 673 1,429 1,483 2,912E Manual skilled 484 304 180 372 552F Semi-skilled 866 503 363 482 845G Unskilled 235 85 150 105 255H Own account workers 120 58 62 55 117Others including farmers, agricultural workers and not stated (I, J & Z) 44 33 11 41 52Total 6,122 2,838 3,284 4,424 7,708

Bray
12
Bray Working population 8,723 Catchment area by Electoral Division
11,771 workers resided in Bray in April 2006. Of these, 8,078 worked outside the town (mainly in Dublin City) leaving 3,693 persons who both lived and worked in the town. A further 5,030 workers travelled into Bray to work (again mainly from Dublin City) resulting in a working population of 8,723. Bray was therefore a significant net loser in employment terms. Compared with the profile for all 27 towns combined Bray had a higher share of workers in manufacturing (23%). It also had a higher than average share of workers with third level qualifications (41%). Compared with the other towns profiled in this report, Bray had a larger than average share of workers commuting by bus or train (9%) reflecting the fact that it has a DART and rail service. The main commuting catchment area of the town extends south from Dún Laoghaire along the coast to Wicklow town, with additional workers travelling from as far as Arklow and Gorey.
●
●
●●
●
●●
●
●
●
●
●
●
●●
●
●
●●
●●●
●●
●●●
●
●
●
●
●
●
●
● ●
●
●
●
●
●●●
●
●
●
●
●
●
●
●
●
●●
●
●
●
●
●
●
●
●
●●
●
●
●
●
●●
●
●●
●
●
●
●
●
●
●●
●
●
●●
●●●
●●
●●●
●
●
●
●
●
●
●
● ●
●
●
●
●
●●●
●
●
●
●
●
●
●
●
●
●●
●
●
●
●
●
●
●
●
●●
●
●
Kill
Naas
Athy
Ferns
Gorey
Avoca
Clane
Dublin
Borris
Ballon
Tullow
Carlow
Carnew
Arklow
Carragh
Aughrim
Sallins
Saggart
AshfordRathnew
Leixlip
Kildare
Wicklow
Suncroft
Bunclody
Glenealy
Tinahely
Dunlavin
Kilcoole
Maynooth
Rathdrum
Blackwood
Johnstown
Paulstown
Rathvilly
Edenderry
Kilmeague
Allenwood
RoundwoodNewcastle
Newcastle
Rathcoole
Rathangan
Celbridge
Kilcullen
Derrinturn
Ballylynan
Muinebheag
Prosperous
Enniskerry
Greystones
Calverstown
Hacketstown
Robertstown
KilmacanogeBlessington
Baltinglass
Castledermot
Monasterevin
Dun Laoghaire
Droichead Nua
Leighlinbridge
Courtown Harbour
Ballymore Eustace
Bray
No. of Workers0 - 20
21 - 50
51 - 100
101 - 500
501 - 1000
1001 and above
0 8 16 24 324Kilometers

Bray
13
Industrial Group
Total resident workers
Residents working outside
town
Workers living and working in
town
Workers travelling
from outside town
Working population
[A + B] [A] [B] [C] [B + C]Agriculture, forestry and fishing 50 37 13 15 28Manufacturing* 1,660 922 738 1,267 2,005Construction 495 381 114 209 323Wholesale and retail trade 1,894 1,156 738 797 1,535Hotels and restaurants 671 368 303 183 486Transport, storage and communications 657 493 164 155 319Banking and financial services 968 886 82 137 219Real estate, renting and business activities 1,529 1,241 288 632 920Public administration and defence 602 505 97 185 282Education 1,008 688 320 492 812Health and social work 1,361 818 543 584 1,127Other community, social and personal service activities
816 539 277 350 627
Industry not stated 60 44 16 24 40Total 11,771 8,078 3,693 5,030 8,723
*Includes Mining, quarrying and turf production and Electricity, gas and water supply
Level of Education
Total resident workers
Residents working outside
town
Workers living and working in
town
Workers travelling
from outside town
Working population
[A + B] [A] [B] [C] [B + C]Primary Education or none 656 314 342 193 535Lower Secondary 1,669 948 721 634 1,355Leaving Cert., Technical or Vocational 3,308 2,206 1,102 1,358 2,460Third level or higher 5,087 3,970 1,117 2,464 3,581Persons still in education (incl. not stated) 1,051 640 411 381 792Total 11,771 8,078 3,693 5,030 8,723
Socio-Economic Group
Total resident workers
Residents working outside
town
Workers living and working in
town
Workers travelling
from outside town
Working population
[A + B] [A] [B] [C] [B + C]A Employers and managers 2,339 1,785 554 1,170 1,724B Higher professional 991 822 169 491 660C Lower professional 1,866 1,374 492 931 1,423D Non-manual 3,838 2,521 1,317 1,250 2,567E Manual skilled 878 602 276 444 720F Semi-skilled 1,205 563 642 558 1,200G Unskilled 275 152 123 63 186H Own account workers 316 217 99 97 196Others including farmers, agricultural workers and not stated (I, J & Z) 63 42 21 26 47Total 11,771 8,078 3,693 5,030 8,723

Carlow
14
Carlow Working population 7,823 Catchment area by Electoral Division
6,851 workers resided in Carlow town in April 2006. Of these, 3,135 worked outside the town leaving 3,716 persons who both lived and worked in the town. A further 4,107 workers travelled into Carlow town to work resulting in a working population of 7,823. Carlow town was therefore a net gainer in employment terms. Compared with the profile for all 27 towns combined, Carlow town had a higher than average share of workers in wholesale and retail trade, education and manufacturing. Over 34 per cent of its workers had a third level qualification compared with 33 per cent for all towns with a population of 5,000 or more. Most workers lived close to Carlow town, with few travelling more than 20km. Kilkenny, Muinebheag and Tullow were the main feeder towns. Three out of four workers in Carlow town travelled to work by car in 2006.
●
●
●
●
●
●
●
●
●
●
●
●
●
●
●
●
●●
●●
●
●
●
●
●
●
● ●
●
●
●
●
●
●
●
●
●
●
●
●
●
●
●
●●
●●
●
●
●
●
●
●
●
Athy
FernsBorris
Ballon
Tullow
Carnew
Aughrim
BunclodyKilkenny
Tinahely
Moneenroe
Paulstown
Rathvilly
Ballylynan
Stradbally
Thomastown
Muinebheag
Ballyragget
Castlecomer
Hacketstown
Baltinglass
Castledermot
Bennetsbridge
Portlaoighise
Leighlinbridge
Graiguenamanagh
Carlow
No. of Workers0 - 20
21 - 50
51 - 100
101 - 500
501 - 1000
1001 and above
0 5 10 15 202.5Kilometers

Carlow
15
Industrial Group
Total resident workers
Residents working outside
town
Workers living and working in
town
Workers travelling
from outside town
Working population
[A + B] [A] [B] [C] [B + C]Agriculture, forestry and fishing 81 73 8 13 21Manufacturing* 1,301 743 558 637 1,195Construction 434 281 153 233 386Wholesale and retail trade 1,395 449 946 853 1,799Hotels and restaurants 614 134 480 199 679Transport, storage and communications 201 110 91 108 199Banking and financial services 212 142 70 145 215Real estate, renting and business activities 495 267 228 310 538Public administration and defence 353 224 129 257 386Education 677 263 414 512 926Health and social work 661 252 409 613 1,022Other community, social and personal service activities
327 137 190 180 370
Industry not stated 100 60 40 47 87Total 6,851 3,135 3,716 4,107 7,823
*Includes Mining, quarrying and turf production and Electricity, gas and water supply
Level of Education
Total resident workers
Residents working outside
town
Workers living and working in
town
Workers travelling
from outside town
Working population
[A + B] [A] [B] [C] [B + C]Primary Education or none 293 100 193 178 371Lower Secondary 1,102 414 688 702 1,390Leaving Cert., Technical or Vocational 2,108 919 1,189 1,363 2,552Third level or higher 2,446 1,319 1,127 1,558 2,685Persons still in education (incl. not stated) 902 383 519 306 825Total 6,851 3,135 3,716 4,107 7,823
Socio-Economic Group
Total resident workers
Residents working outside
town
Workers living and working in
town
Workers travelling
from outside town
Working population
[A + B] [A] [B] [C] [B + C]A Employers and managers 979 461 518 629 1,147B Higher professional 431 235 196 336 532C Lower professional 966 539 427 702 1,129D Non-manual 2,252 741 1,511 1,343 2,854E Manual skilled 809 481 328 438 766F Semi-skilled 884 416 468 448 916G Unskilled 299 103 196 125 321H Own account workers 118 74 44 61 105Others including farmers, agricultural workers and not stated (I, J & Z) 113 85 28 25 53Total 6,851 3,135 3,716 4,107 7,823

Castlebar
16
Castlebar Working Population 8,461 Catchment area by Electoral Division
●
●
●
●
●
●
●
●
●
●
●
●
●
●
●
●
●
●
●
●
●
●
●
●
●
●
●
●
Keel
BallaKnock
Foxford
Newport
Ballina
Swinford
Westport
Kiltimagh
Ballinrobe
Crossmolina
Claremorris
Charlestown
Castlebar
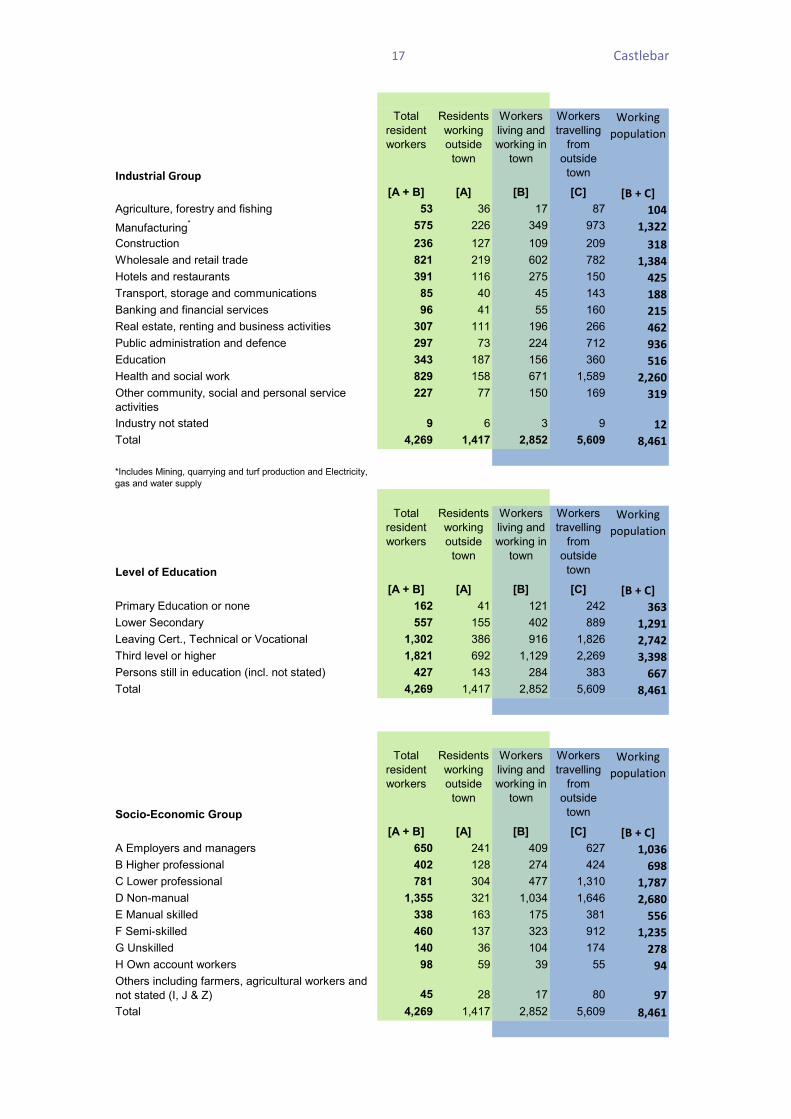
4,269 workers resided in Castlebar in April 2006. Of these, 1,417 worked outside the town leaving 2,852 persons who both lived and worked in the town. A further 5,609 workers travelled into Castlebar to work resulting in a working population of 8,461. Castlebar was therefore a significant net gainer in employment terms. At almost 27 per cent Castlebar had the highest proportion of persons working in the health sector of all the towns profiled in this report. It also had higher than average numbers involved in manufacturing, and public administration and defence. Two out of five workers had third level qualifications – higher than the profile for all towns with a population of 5,000 or more. More than four out of five workers commuted to Castlebar by car in 2006. Over 70 per cent of journeys took less than a half an hour.
No. of Workers0 - 20
21 - 50
51 - 100
101 - 500
501 - 1000
1001 and above
0 5 10 15 202.5Kilometers
Castlebar
17
Industrial Group
Total resident workers
Residents working outside
town
Workers living and working in
town
Workers travelling
from outside town
Working population
[A + B] [A] [B] [C] [B + C]Agriculture, forestry and fishing 53 36 17 87 104Manufacturing* 575 226 349 973 1,322Construction 236 127 109 209 318Wholesale and retail trade 821 219 602 782 1,384Hotels and restaurants 391 116 275 150 425Transport, storage and communications 85 40 45 143 188Banking and financial services 96 41 55 160 215Real estate, renting and business activities 307 111 196 266 462Public administration and defence 297 73 224 712 936Education 343 187 156 360 516Health and social work 829 158 671 1,589 2,260Other community, social and personal service activities
227 77 150 169 319
Industry not stated 9 6 3 9 12Total 4,269 1,417 2,852 5,609 8,461
*Includes Mining, quarrying and turf production and Electricity, gas and water supply
Level of Education
Total resident workers
Residents working outside
town
Workers living and working in
town
Workers travelling
from outside town
Working population
[A + B] [A] [B] [C] [B + C]Primary Education or none 162 41 121 242 363Lower Secondary 557 155 402 889 1,291Leaving Cert., Technical or Vocational 1,302 386 916 1,826 2,742Third level or higher 1,821 692 1,129 2,269 3,398Persons still in education (incl. not stated) 427 143 284 383 667Total 4,269 1,417 2,852 5,609 8,461
Socio-Economic Group
Total resident workers
Residents working outside
town
Workers living and working in
town
Workers travelling
from outside town
Working population
[A + B] [A] [B] [C] [B + C]A Employers and managers 650 241 409 627 1,036B Higher professional 402 128 274 424 698C Lower professional 781 304 477 1,310 1,787D Non-manual 1,355 321 1,034 1,646 2,680E Manual skilled 338 163 175 381 556F Semi-skilled 460 137 323 912 1,235G Unskilled 140 36 104 174 278H Own account workers 98 59 39 55 94Others including farmers, agricultural workers and not stated (I, J & Z) 45 28 17 80 97Total 4,269 1,417 2,852 5,609 8,461

Clonmel
18
Clonmel Working population 7,548 Catchment area by Electoral Division
●
●●
●
●
●
●
●
●
●●
●
●
●
●
●
●
●
●
●
●
●
●
●
●
●
●
●●
●
●
●
●
●
●
●●
●
●
●
●
●
●
●
●
●
●
●
●
●
●
●
Cahir
Callan
Cashel
Fethard
Portlaw
Piltown
Thurles
Clogheen
Kilworth
Mooncoin
Kilkenny
Ardfinnan
Holycross
Freshford
Tipperary
Cappamore
Kilsheelan
Killenaule
Urlingford
Kilmacthomas
Mitchelstown
Ballyclerehan
Twomileborris
Bennetsbridge
Carrick on SuirClonmel
5,738 workers resided in Clonmel in April 2006. Of these, 2,199 worked outside the town leaving 3,539 persons who both lived and worked in the town. A further 4,009 workers travelled into Clonmel to work resulting in a working population of 7,548. Clonmel was therefore a net gainer in employment terms. Wholesale and retail trade, health and manufacturing were the predominant industries and Clonmel had higher than average shares of workers in these sectors compared with the remaining towns in this report. The three sectors combined accounted for 55 per cent of the working population. A third of workers were in non-manual jobs compared with one in five for all towns with a population of 5,000 or more. Four out of five workers in Clonmel travelled to work by car with significant numbers making the journey from Carrick-On-Suir, Cahir and Fethard. Less than 1 per cent travelled by bus or train.
0 4 8 12 162Kilometers No. of Workers
0 - 20
21 - 50
51 - 100
101 - 500
501 - 1000
1001 and above

Clonmel
19
Industrial Group
Total resident workers
Residents working outside
town
Workers living and working in
town
Workers travelling
from outside town
Working population
[A + B] [A] [B] [C] [B + C]Agriculture, forestry and fishing 63 54 9 24 33Manufacturing* 1,398 890 508 620 1,128Construction 354 185 169 309 478Wholesale and retail trade 1,077 176 901 747 1,648Hotels and restaurants 352 67 285 140 425Transport, storage and communications 163 36 127 88 215Banking and financial services 113 49 64 163 227Real estate, renting and business activities 349 140 209 260 469Public administration and defence 358 89 269 372 641Education 452 223 229 263 492Health and social work 737 203 534 835 1,369Other community, social and personal service activities
286 69 217 173 390
Industry not stated 36 18 18 15 33Total 5,738 2,199 3,539 4,009 7,548
*Includes Mining, quarrying and turf production and Electricity, gas and water supply
Level of Education
Total resident workers
Residents working outside
town
Workers living and working in
town
Workers travelling
from outside town
Working population
[A + B] [A] [B] [C] [B + C]Primary Education or none 388 105 283 151 434Lower Secondary 981 296 685 638 1,323Leaving Cert., Technical or Vocational 1,873 681 1,192 1,313 2,505Third level or higher 1,951 917 1,034 1,645 2,679Persons still in education (incl. not stated) 545 200 345 262 607Total 5,738 2,199 3,539 4,009 7,548
Socio-Economic Group
Total resident workers
Residents working outside
town
Workers living and working in
town
Workers travelling
from outside town
Working population
[A + B] [A] [B] [C] [B + C]A Employers and managers 750 283 467 602 1,069B Higher professional 376 176 200 242 442C Lower professional 801 368 433 817 1,250D Non-manual 1,759 396 1,363 1,261 2,624E Manual skilled 567 280 287 438 725F Semi-skilled 1,012 500 512 486 998G Unskilled 262 67 195 97 292H Own account workers 136 71 65 38 103Others including farmers, agricultural workers and not stated (I, J & Z) 75 58 17 28 45Total 5,738 2,199 3,539 4,009 7,548
Cork City
20
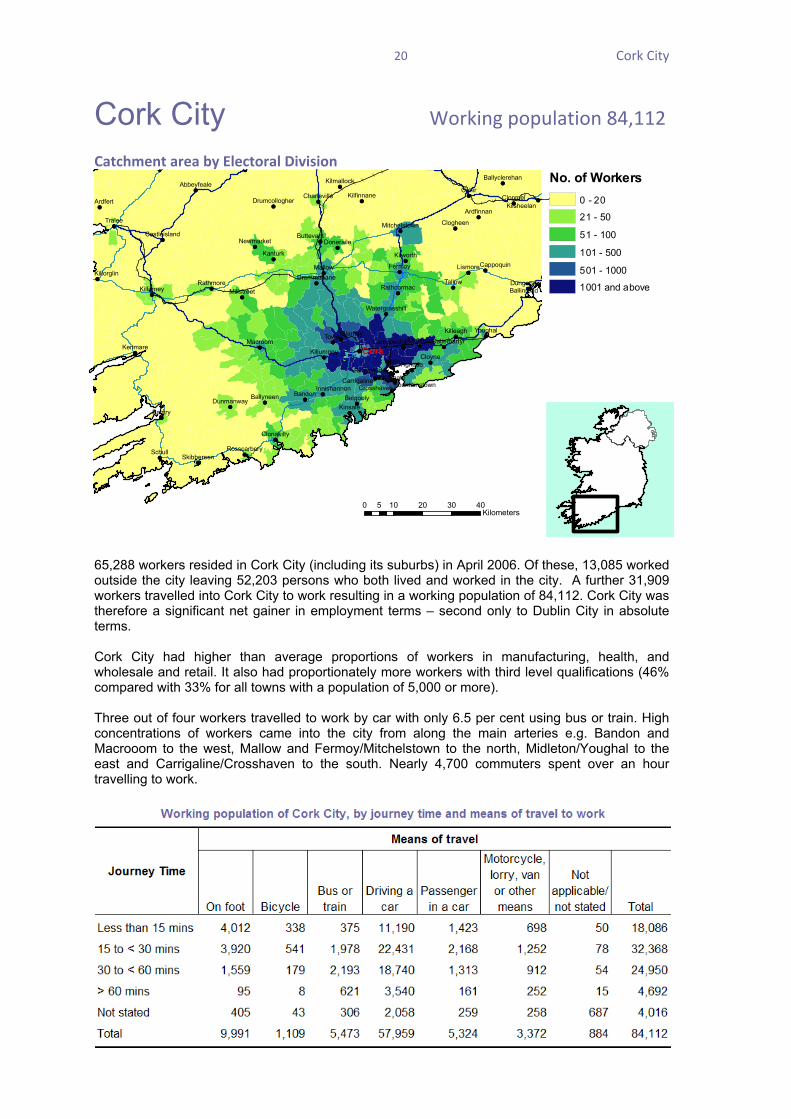
Cork City Working population 84,112 Catchment area by Electoral Division
●
● ●
● ●
●
●
●
●
●●
●
●●
●
●
●●
●
●
●●
●
●
●
●
●
●
●●
●
●●●
●
●
●
●
●● ●
●
●●
●
●●
●
●●
●
●
●
●
●
● ●
●
●
●
●●
●
●
●
●●
●
● ●
● ●
●
●
●
●
●●
●
●●
●
●
●●
●
●
●●
●
●
●
●
●
●
●●
●
●●●
●
●
●
●
●● ●
●
●●
●
●●
●
●●
●
●
●
●
●
● ●
●
●
●
●●
●
●
●
●●
Cobh
Tower
Cahir
Tallow
Aghada
Schull
Cloyne
Tralee
Bantry
Bandon
FermoyMallow Lismore
Kanturk
YoughalBlarney
Ardfert
Kenmare
Kinsale
Clonmel
Macroom
Clogheen
Belgooly
Killeagh
Kilworth
Midleton
Rathmore
Ardfinnan
Cappoquin
Killumney
Ballyneen
DoneraileNewmarket
Whitegate
Killarney
Buttevant
Dunmanway
Dungarvan
Kilsheelan
Ballinroad
Drommahane
Millstreet Rathcormac
Crosshaven
Killorglin
Skibbereen
Clonakilty
Kilfinnane
KilmallockAbbeyfeale
Rosscarbery
Innishannon
Catlemartyr
RingaskiddyCarrigaline
Charleville
MitchelstownCastleisland
Ballyclerehan
Fountainstown
Carrigtwohill
Drumcollogher
Watergrasshill
Cork
65,288 workers resided in Cork City (including its suburbs) in April 2006. Of these, 13,085 worked outside the city leaving 52,203 persons who both lived and worked in the city. A further 31,909 workers travelled into Cork City to work resulting in a working population of 84,112. Cork City was therefore a significant net gainer in employment terms – second only to Dublin City in absolute terms. Cork City had higher than average proportions of workers in manufacturing, health, and wholesale and retail. It also had proportionately more workers with third level qualifications (46% compared with 33% for all towns with a population of 5,000 or more). Three out of four workers travelled to work by car with only 6.5 per cent using bus or train. High concentrations of workers came into the city from along the main arteries e.g. Bandon and Macrooom to the west, Mallow and Fermoy/Mitchelstown to the north, Midleton/Youghal to the east and Carrigaline/Crosshaven to the south. Nearly 4,700 commuters spent over an hour travelling to work.
0 10 20 30 405Kilometers
No. of Workers0 - 20
21 - 50
51 - 100
101 - 500
501 - 1000
1001 and above

Cork City
21
Industrial Group
Total resident workers
Residents working outside
town
Workers living and working in
town
Workers travelling
from outside town
Working population
[A + B] [A] [B] [C] [B + C]Agriculture, forestry and fishing 336 230 106 121 227Manufacturing* 11,638 4,063 7,575 5,118 12,693Construction 3,709 1,140 2,569 2,091 4,660Wholesale and retail trade 11,201 1,387 9,814 4,854 14,668Hotels and restaurants 4,193 543 3,650 948 4,598Transport, storage and communications 3,552 831 2,721 1,733 4,454Banking and financial services 2,314 532 1,782 1,289 3,071Real estate, renting and business activities 8,275 1,682 6,593 3,984 10,577Public administration and defence 3,356 504 2,852 2,520 5,372Education 5,578 889 4,689 2,844 7,533Health and social work 8,109 683 7,426 5,321 12,747Other community, social and personal service activities
2,732 478 2,254 1,001 3,255
Industry not stated 295 123 172 85 257Total 65,288 13,085 52,203 31,909 84,112
*Includes Mining, quarrying and turf production and Electricity, gas and water supply
Level of Education
Total resident workers
Residents working outside
town
Workers living and working in
town
Workers travelling
from outside town
Working population
[A + B] [A] [B] [C] [B + C]Primary Education or none 2,982 423 2,559 767 3,326Lower Secondary 9,176 1,491 7,685 3,492 11,177Leaving Cert., Technical or Vocational 18,118 3,355 14,763 9,105 23,868Third level or higher 28,778 6,661 22,117 16,287 38,404Persons still in education (incl. not stated) 6,234 1,155 5,079 2,258 7,337Total 65,288 13,085 52,203 31,909 84,112
Socio-Economic Group
Total resident workers
Residents working outside
town
Workers living and working in
town
Workers travelling
from outside town
Working population
[A + B] [A] [B] [C] [B + C]A Employers and managers 10,006 2,165 7,841 5,550 13,391B Higher professional 7,213 1,666 5,547 3,597 9,144C Lower professional 10,045 2,275 7,770 6,228 13,998D Non-manual 19,696 2,474 17,222 9,183 26,405E Manual skilled 6,012 1,535 4,477 3,141 7,618F Semi-skilled 8,139 1,736 6,403 3,124 9,527G Unskilled 2,214 339 1,875 556 2,431H Own account workers 1,501 676 825 376 1,201Others including farmers, agricultural workers and not stated (I, J & Z) 462 219 243 154 397Total 65,288 13,085 52,203 31,909 84,112

Drogheda
22
Drogheda Working population 11,078 Catchment area by Electoral Division
12,603 workers resided in Drogheda in April 2006. Of these, 6,777 worked outside the town leaving 5,826 persons who both lived and worked in the town. A further 5,252 workers travelled into Drogheda to work resulting in a working population of 11,078. Drogheda was therefore a marginal net loser in employment terms. Wholesale and retail trade, health and manufacturing were the predominant sectors of activity in Drogheda and the percentage shares of workers in these sectors were higher than those for the 27 towns covered in this report combined. Non-manual and lower professional occupations also predominated. Of those commuting out of Drogheda a significant number travelled by train. The majority of these went to Dublin City. Despite the train link only 2.7 per cent of Drogheda’s working population travelled by bus or train each day with 70 per cent opting for car travel. One in five workers walked to work. Dundalk and Navan were significant suppliers of labour to Drogheda.
●
● ●
●●
●
●
●
●
●
●
●
●●
●
●
●
●
●
●
●
●
●
●
●
●
●
●
●
●
●●●
●●
●●
●
●
●●
●
●
●
●
●
● ●
●●
●
●
●
●
●
●
●
●●
●
●
●
●
●
●
●
●
●
●
●
●
●
●
●
●
●●●
●●
●●
●
●
●●
●
●
●
●
Lusk Rush
Trim
Ardee
Louth
Slane
Navan
Donore
Collon
Duleek
Athboy
Swords
Mullagh
Dunleer
Dundalk
Laytown
Ratoath
Longwood
Portrane
Ballivor
Donabate
Skerries
Asbourne
Malahide
Dromiskin
StamullinKentstown
Kildalkey
Rivermeade
Tullyallen
Kingscourt
Summerhill
Balbriggan
Clogherhead
Tallanstown
Julianstown
Loughshinny
Baileborough
Termonfeckin
Dunshaughlin
Ceannanus Mor
Carrickmacross
Castlebellingham
Drogheda
No. of Workers0 - 20
21 - 50
51 - 100
101 - 500
501 - 1000
1001 and above
0 5 10 15 202.5Kilometers

Drogheda
23
Industrial Group
Total resident workers
Residents working outside
town
Workers living and working in
town
Workers travelling
from outside town
Working population
[A + B] [A] [B] [C] [B + C]Agriculture, forestry and fishing 67 54 13 14 27Manufacturing* 2,314 1,313 1,001 825 1,826Construction 667 477 190 274 464Wholesale and retail trade 2,267 840 1,427 1,094 2,521Hotels and restaurants 692 237 455 157 612Transport, storage and communications 961 656 305 230 535Banking and financial services 593 471 122 255 377Real estate, renting and business activities 1,268 815 453 412 865Public administration and defence 725 528 197 171 368Education 779 442 337 398 735Health and social work 1,651 627 1,024 1,114 2,138Other community, social and personal service activities
563 285 278 284 562
Industry not stated 56 32 24 24 48Total 12,603 6,777 5,826 5,252 11,078
*Includes Mining, quarrying and turf production and Electricity, gas and water supply
Level of Education
Total resident workers
Residents working outside
town
Workers living and working in
town
Workers travelling
from outside town
Working population
[A + B] [A] [B] [C] [B + C]Primary Education or none 987 365 622 254 876Lower Secondary 2,149 924 1,225 819 2,044Leaving Cert., Technical or Vocational 3,662 1,896 1,766 1,549 3,315Third level or higher 4,466 2,907 1,559 2,257 3,816Persons still in education (incl. not stated) 1,339 685 654 373 1,027Total 12,603 6,777 5,826 5,252 11,078
Socio-Economic Group
Total resident workers
Residents working outside
town
Workers living and working in
town
Workers travelling
from outside town
Working population
[A + B] [A] [B] [C] [B + C]A Employers and managers 1,894 1,181 713 967 1,680B Higher professional 731 509 222 419 641C Lower professional 1,867 1,101 766 1,161 1,927D Non-manual 4,000 1,805 2,195 1,546 3,741E Manual skilled 1,458 864 594 518 1,112F Semi-skilled 1,730 849 881 418 1,299G Unskilled 550 247 303 102 405H Own account workers 277 163 114 90 204Others including farmers, agricultural workers and not stated (I, J & Z) 96 58 38 31 69Total 12,603 6,777 5,826 5,252 11,078
Droichead Nua (Newbridge)
24
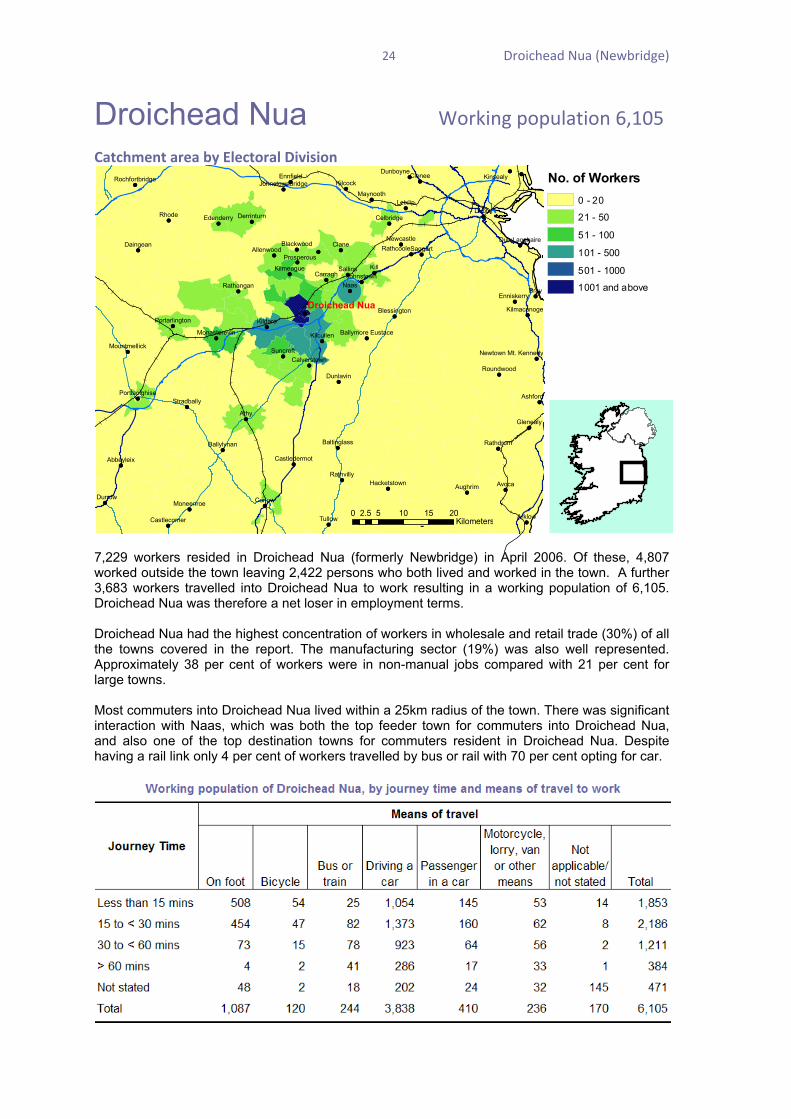
Droichead Nua Working population 6,105 Catchment area by Electoral Division
7,229 workers resided in Droichead Nua (formerly Newbridge) in April 2006. Of these, 4,807 worked outside the town leaving 2,422 persons who both lived and worked in the town. A further 3,683 workers travelled into Droichead Nua to work resulting in a working population of 6,105. Droichead Nua was therefore a net loser in employment terms. Droichead Nua had the highest concentration of workers in wholesale and retail trade (30%) of all the towns covered in the report. The manufacturing sector (19%) was also well represented. Approximately 38 per cent of workers were in non-manual jobs compared with 21 per cent for large towns. Most commuters into Droichead Nua lived within a 25km radius of the town. There was significant interaction with Naas, which was both the top feeder town for commuters into Droichead Nua, and also one of the top destination towns for commuters resident in Droichead Nua. Despite having a rail link only 4 per cent of workers travelled by bus or rail with 70 per cent opting for car.
●
●●
●
●●
●
●
●
●
●
●●
●
●
●
●
●
●
●●
●●●
●●
●
●
●
●
●
●
●
● ●
●
●
●
●
●
●●
●
●
●
●
●
●
●●
●
●
●
●
●
●
●
●
●
●
●
●
●
●●
●
●
●
●
●
●●
●
●●
●
●
●
●
●
●●
●
●
●
●
●
●
●●
●●●
●●
●
●
●
●
●
●
●
● ●
●
●
●
●
●
●●
●
●
●
●
●
●
●●
●
●
●
●
●
●
●
●
●
●
●
●
●
●●
●
●
●
●
Bray
Kill
Naas
Athy
Rhode
Avoca
Clane
Dublin
Clonee
Durrow
Tullow
Carlow
Arklow
Carragh
Aughrim
Sallins
Saggart
Ashford
Leixlip
Kilcock
Kildare
Suncroft
Daingean
Kinsealy
Glenealy
Tinahely
Dunlavin
EnnfieldDunboyne
Maynooth
Rathdrum
Blackwood
Johnstown
Abbeyleix
Moneenroe
Rathvilly
Edenderry
Kilmeague
Allenwood
Roundwood
NewcastleRathcoole
Rathangan
Celbridge
Kilcullen
Derrinturn
Ballylynan
Stradbally
Prosperous
Enniskerry
Calverstown
Castlecomer
Hacketstown
KilmacanogeBlessington
Baltinglass
Mountmellick
Castledermot
Monasterevin
Dun Laoghaire
Portarlington
Portlaoighise
RochfortbridgeJohnstownbridge
Ballymore Eustace
Newtown Mt. Kennedy
Droichead Nua
No. of Workers0 - 20
21 - 50
51 - 100
101 - 500
501 - 1000
1001 and above
0 5 10 15 202.5Kilometers
Droichead Nua (Newbridge)
25
Industrial Group
Total resident workers
Residents working outside
town
Workers living and working in
town
Workers travelling
from outside town
Working population
[A + B] [A] [B] [C] [B + C]Agriculture, forestry and fishing 77 74 3 13 16Manufacturing* 1,321 896 425 742 1,167Construction 428 336 92 265 357Wholesale and retail trade 1,467 666 801 1,018 1,819Hotels and restaurants 422 178 244 156 400Transport, storage and communications 358 291 67 73 140Banking and financial services 311 268 43 144 187Real estate, renting and business activities 712 502 210 365 575Public administration and defence 649 585 64 135 199Education 467 274 193 300 493Health and social work 546 432 114 248 362Other community, social and personal service activities
405 262 143 184 327
Industry not stated 66 43 23 40 63Total 7,229 4,807 2,422 3,683 6,105
*Includes Mining, quarrying and turf production and Electricity, gas and water supply
Level of Education
Total resident workers
Residents working outside
town
Workers living and working in
town
Workers travelling
from outside town
Working population
[A + B] [A] [B] [C] [B + C]Primary Education or none 409 223 186 187 373Lower Secondary 1,303 766 537 667 1,204Leaving Cert., Technical or Vocational 2,282 1,467 815 1,262 2,077Third level or higher 2,481 1,903 578 1,211 1,789Persons still in education (incl. not stated) 754 448 306 356 662Total 7,229 4,807 2,422 3,683 6,105
Socio-Economic Group
Total resident workers
Residents working outside
town
Workers living and working in
town
Workers travelling
from outside town
Working population
[A + B] [A] [B] [C] [B + C]A Employers and managers 1,227 894 333 671 1,004B Higher professional 410 344 66 212 278C Lower professional 939 746 193 462 655D Non-manual 2,370 1,347 1,023 1,297 2,320E Manual skilled 769 564 205 310 515F Semi-skilled 1,020 607 413 502 915G Unskilled 236 127 109 145 254H Own account workers 152 96 56 51 107Others including farmers, agricultural workers and not stated (I, J & Z) 106 82 24 33 57Total 7,229 4,807 2,422 3,683 6,105
Dublin City
26
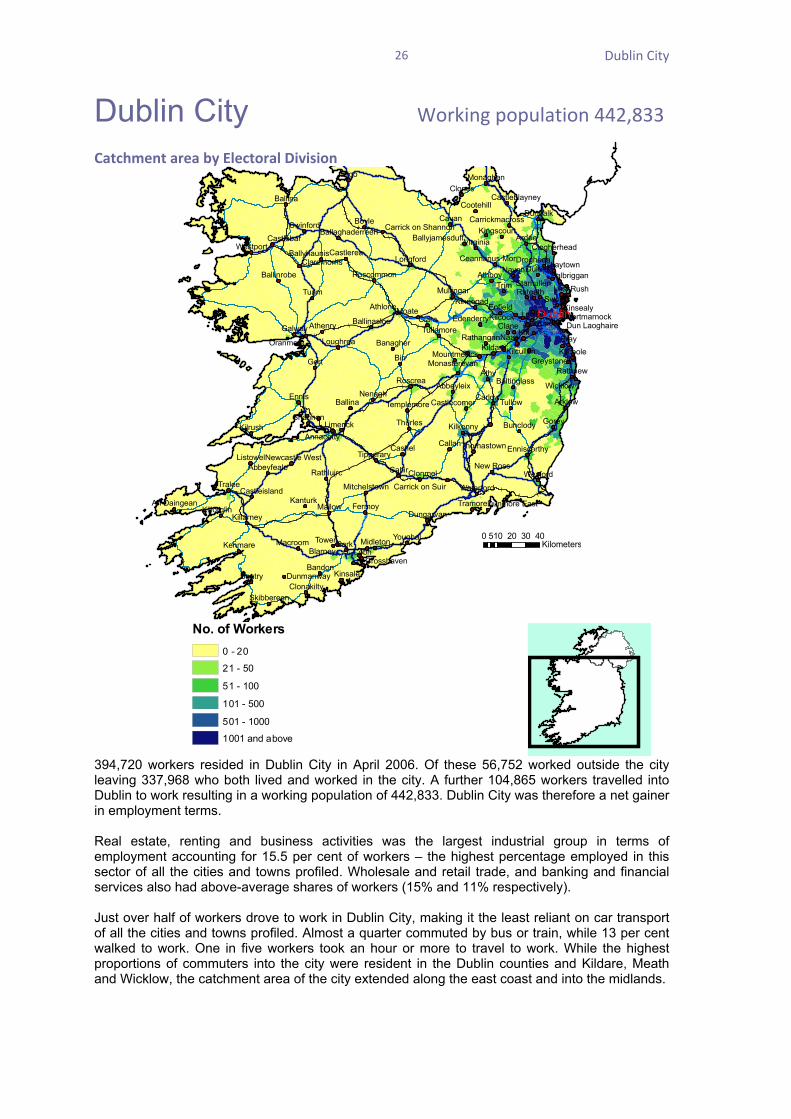
Dublin City Working population 442,833 Catchment area by Electoral Division
394,720 workers resided in Dublin City in April 2006. Of these 56,752 worked outside the city leaving 337,968 who both lived and worked in the city. A further 104,865 workers travelled into Dublin to work resulting in a working population of 442,833. Dublin City was therefore a net gainer in employment terms. Real estate, renting and business activities was the largest industrial group in terms of employment accounting for 15.5 per cent of workers – the highest percentage employed in this sector of all the cities and towns profiled. Wholesale and retail trade, and banking and financial services also had above-average shares of workers (15% and 11% respectively). Just over half of workers drove to work in Dublin City, making it the least reliant on car transport of all the cities and towns profiled. Almost a quarter commuted by bus or train, while 13 per cent walked to work. One in five workers took an hour or more to travel to work. While the highest proportions of commuters into the city were resident in the Dublin counties and Kildare, Meath and Wicklow, the catchment area of the city extended along the east coast and into the midlands.
CobhCork
Gort
Tuam
Birr
LuskRush
BrayKill
Trim
Naas
Athy
Tower
Gorey
Cahir
Ennis
Boyle
Sligo
ClaraMoate
Cavan
Ardee
Navan
Clane
Tralee
TullowCarlow
BantryBandon
CallanCashel
FermoyMallow
Nenagh
Galway
Clones
DuleekAthboy
Swords
Arklow
Tramore
Ballina
Kanturk
Youghal
BlarneyKenmare
Kilrush
Kinsale
Thurles
Clonmel Wexford
Macroom
Roscrea
Shannon
Athenry
Ballina
Athlone
Dundalk
Enfield
Laytown
Ratoath
Rathnew
LeixlipKilcock
Kildare
Wicklow
Midleton
Listowel
BunclodyKilkenny
New Ross
Limerick
LoughreaOranmore
Longford
Swinford
Westport
Banagher
Kinnegad
Virginia
Drogheda
Monaghan
Kinsealy
Kilcoole
Maynooth
Killarney
Abbeyleix
Rathluirc
Edenderry
Dunmanway
Tipperary
Waterford
Dungarvan
Annacotty
Roscommon
Castlerea
Castlebar
Tullamore
Mullingar
Cootehill
Stamullen
Rathangan
Kilcullen
Templemore
Crosshaven
Killorglin
Thomastown
SkibbereenClonakilty
Abbeyfeale
Ballinrobe
Kingscourt
Balbriggan
Greystones
An Daingean
Enniscorthy
Castlecomer
Ballinasloe
BallyhaunisClaremorris
Clogherhead
Portmarnock
Baltinglass
Dunmore East
MitchelstownCastleisland
MountmellickMonasterevan
Dun Laoghaire
Castleblayney
Ceannanus Mor
Newcastle West
Ballyjamesduff
Carrickmacross
Carrick on Suir
Ballaghaderreen Carrick on Shannon
Dublin
No. of Workers0 - 20
21 - 50
51 - 100
101 - 500
501 - 1000
1001 and above
0 10 20 30 405Kilometers

Dublin City
27
Distribution of employment Employment was not spread evenly throughout Dublin City in April 2006. The greatest concentration was around the city centre, with significant clusters in the west and south-west of the city. The map below shows the number of workers per square kilometre in each Enumeration Area3 in Dublin City.
Across Dublin City the employment distribution of the different industries varied greatly. All sectors had a strong concentration in the city centre areas. Wholesale and retail trade was spread evenly across the city. Public administration and defence, along with banking and financial services were the most concentrated in the city centre, while manufacturing had large concentrations at the outskirts. Education and health were quite evenly spread across the city, as was real estate renting and business activities, though to a lesser extent. The maps on the following pages for selected industrial sectors illustrate these contrasts.
3 An Enumeration Area or EA was the area assigned to each enumerator for the purpose of census enumeration. They consisted of about 350 households on average.

Dublin City
28
Manufacturing
Wholesale and retail trade

Dublin City
29
Banking and financial services
Public administration and defence

Dublin City
30
Education
Health

Dublin City
31
Industrial Group
Total resident workers
Residents working outside
town
Workers living and working in
town
Workers travelling
from outside town
Working population
[A + B] [A] [B] [C] [B + C]Agriculture, forestry and fishing 866 459 407 174 581Manufacturing* 41,176 11,433 29,743 11,182 40,925Construction 16,072 4,456 11,616 5,557 17,173Wholesale and retail trade 59,596 7,852 51,744 14,672 66,416Hotels and restaurants 22,375 2,415 19,960 2,860 22,820Transport, storage and communications 26,187 6,985 19,202 7,410 26,612Banking and financial services 37,114 1,620 35,494 13,002 48,496Real estate, renting and business activities 63,926 9,955 53,971 14,851 68,822Public administration and defence 27,459 1,917 25,542 11,460 37,002Education 29,899 2,466 27,433 7,175 34,608Health and social work 44,834 3,089 41,745 11,794 53,539Other community, social and personal service activities
20,637 2,780 17,857 4,154 22,011
Industry not stated 4,579 1,325 3,254 574 3,828Total 394,720 56,752 337,968 104,865 442,833
*Includes Mining, quarrying and turf production and Electricity, gas and water supply
Level of Education
Total resident workers
Residents working outside
town
Workers living and working in
town
Workers travelling
from outside town
Working population
[A + B] [A] [B] [C] [B + C]Primary Education or none 23,472 3,053 20,419 2,894 23,313Lower Secondary 49,016 6,978 42,038 10,830 52,868Leaving Cert., Technical or Vocational 98,919 14,719 84,200 30,081 114,281Third level or higher 181,975 25,778 156,197 53,909 210,106Persons still in education (incl. not stated) 41,338 6,224 35,114 7,151 42,265Total 394,720 56,752 337,968 104,865 442,833
Socio-Economic Group
Total resident workers
Residents working outside
town
Workers living and working in
town
Workers travelling
from outside town
Working population
[A + B] [A] [B] [C] [B + C]A Employers and managers 75,601 10,675 64,926 25,735 90,661B Higher professional 44,930 6,426 38,504 10,806 49,310C Lower professional 64,015 9,079 54,936 19,209 74,145D Non-manual 123,443 12,306 111,137 31,607 142,744E Manual skilled 30,419 6,590 23,829 8,741 32,570F Semi-skilled 33,161 5,579 27,582 5,750 33,332G Unskilled 12,491 1,819 10,672 1,366 12,038H Own account workers 8,424 3,698 4,726 1,294 6,020Others including farmers, agricultural workers and not stated (I, J & Z) 2,236 580 1,656 357 2,013Total 394,720 56,752 337,968 104,865 442,833

Dundalk
32
Dundalk Working population 13,522 Catchment area by Electoral Division
11,616 workers resided in Dundalk in April 2006. Of these, 3,302 worked outside the town leaving 8,314 persons who both lived and worked in the town. A further 5,208 workers travelled into Dundalk to work resulting in a working population of 13,522. Dundalk was therefore a net gainer in employment terms. The wholesale and retail trade and manufacturing sectors between them accounted for two out of five persons working in Dundalk. These are well up on the averages for all towns covered in this report. Non manual occupations accounted for 38 per cent of workers compared with 21 per cent for all towns with a population of 5,000 or more. Dundalk drew its workforce form the entire county of Louth, with significant numbers coming from Meath and Monaghan as well. Despite its train link only 3.3 per cent of workers chose to travel by bus or rail in April 2006 with 74 per cent opting for car transport.
●
●
●
●
●
●
●●
●
●
●
●
●
●●
●●
●
●●●
●●
●●
●
●
●●
●
●
●
●
●
●
●
●
●
●●
●
●
●
●
●
●●
●●
●
●●●
●●
●●
●
●
●●
●
●
●
Ardee
Louth
Slane
Navan
Collon
Duleek
Athboy
Mullagh
Dunleer
Laytown
Drogheda
Ballybay
Skerries
Dromiskin
StamullinKentstown
Tullyallen
Clonmellon
Kingscourt
Balbriggan
Clogherhead
Tallanstown
Carlingford
Julianstown
Baileborough
Termonfeckin
Castleblaney
Ceannanus Mor
Carrickmacross
Castlebellingham
Dundalk
No. of Workers0 - 20
21 - 50
51 - 100
101 - 500
501 - 1000
1001 and above
0 5 10 15 202.5Kilometers

Dundalk
33
Industrial Group
Total resident workers
Residents working outside
town
Workers living and working in
town
Workers travelling
from outside town
Working population
[A + B] [A] [B] [C] [B + C]Agriculture, forestry and fishing 59 49 10 15 25Manufacturing* 2,102 617 1,485 924 2,409Construction 518 293 225 194 419Wholesale and retail trade 2,402 461 1,941 948 2,889Hotels and restaurants 775 187 588 170 758Transport, storage and communications 526 166 360 232 592Banking and financial services 551 191 360 303 663Real estate, renting and business activities 1,063 345 718 435 1,153Public administration and defence 822 218 604 493 1,097Education 1,010 246 764 566 1,330Health and social work 1,171 383 788 587 1,375Other community, social and personal service activities
568 124 444 311 755
Industry not stated 49 22 27 30 57Total 11,616 3,302 8,314 5,208 13,522
*Includes Mining, quarrying and turf production and Electricity, gas and water supply
Level of Education
Total resident workers
Residents working outside
town
Workers living and working in
town
Workers travelling
from outside town
Working population
[A + B] [A] [B] [C] [B + C]Primary Education or none 890 158 732 243 975Lower Secondary 2,260 484 1,776 861 2,637Leaving Cert., Technical or Vocational 3,430 856 2,574 1,536 4,110Third level or higher 3,965 1,479 2,486 2,193 4,679Persons still in education (incl. not stated) 1,071 325 746 375 1,121Total 11,616 3,302 8,314 5,208 13,522
Socio-Economic Group
Total resident workers
Residents working outside
town
Workers living and working in
town
Workers travelling
from outside town
Working population
[A + B] [A] [B] [C] [B + C]A Employers and managers 1,725 618 1,107 871 1,978B Higher professional 744 292 452 468 920C Lower professional 1,584 589 995 872 1,867D Non-manual 4,096 702 3,394 1,785 5,179E Manual skilled 1,201 471 730 553 1,283F Semi-skilled 1,535 376 1,159 483 1,642G Unskilled 419 93 326 92 418H Own account workers 229 111 118 54 172Others including farmers, agricultural workers and not stated (I, J & Z) 83 50 33 30 63Total 11,616 3,302 8,314 5,208 13,522
Ennis
34
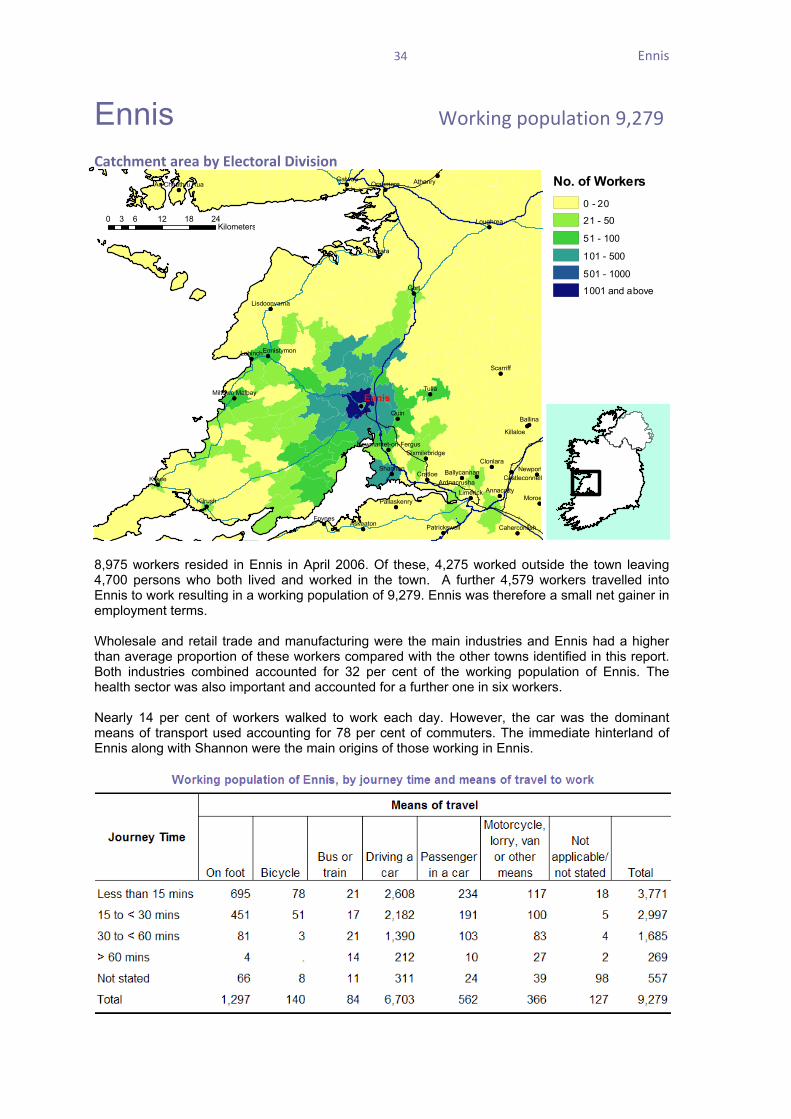
Ennis Working population 9,279 Catchment area by Electoral Division
●●
●
●
●
●
●
●
●
●●●
●●
●
●
●
●●
●
●
●●
●
●
●
●
●
●
●
●●●
●
●
●
●
●●
●
●
●
●
●
●
●
●●●
●●
●
●
●
●●
●
●
●●
●
●
●
●
●
●
●
●●●
●
●
●
●Quin
Gort
Tulla
Moroe
Foynes
Kilkee
Galway
Ballina
Kinvara
NewportCratloe
Lahinch
Kilrush
Shannon
Athenry
Clonlara
Scarriff
Killaloe
Askeaton
Limerick
Loughrea
Oranmore
Annacotty
Ennistymon
BallycannanArdnacrusha
Pallaskenry
Lisdoonvarna
CaherconlishPatrickswell
Sixmilebridge
Castleconnell
Miltown Malbay
An Cheathru Rua
Newmarket-on-Fergus
Ennis
8,975 workers resided in Ennis in April 2006. Of these, 4,275 worked outside the town leaving 4,700 persons who both lived and worked in the town. A further 4,579 workers travelled into Ennis to work resulting in a working population of 9,279. Ennis was therefore a small net gainer in employment terms. Wholesale and retail trade and manufacturing were the main industries and Ennis had a higher than average proportion of these workers compared with the other towns identified in this report. Both industries combined accounted for 32 per cent of the working population of Ennis. The health sector was also important and accounted for a further one in six workers. Nearly 14 per cent of workers walked to work each day. However, the car was the dominant means of transport used accounting for 78 per cent of commuters. The immediate hinterland of Ennis along with Shannon were the main origins of those working in Ennis.
0 6 12 18 243Kilometers
No. of Workers0 - 20
21 - 50
51 - 100
101 - 500
501 - 1000
1001 and above

Ennis
35
Industrial Group
Total resident workers
Residents working outside
town
Workers living and working in
town
Workers travelling
from outside town
Working population
[A + B] [A] [B] [C] [B + C]Agriculture, forestry and fishing 61 45 16 20 36Manufacturing* 1,655 1,079 576 566 1,142Construction 532 332 200 342 542Wholesale and retail trade 1,378 350 1,028 796 1,824Hotels and restaurants 802 240 562 156 718Transport, storage and communications 555 426 129 128 257Banking and financial services 357 239 118 149 267Real estate, renting and business activities 821 449 372 345 717Public administration and defence 693 294 399 563 962Education 730 380 350 347 697Health and social work 928 269 659 949 1,608Other community, social and personal service activities
421 140 281 204 485
Industry not stated 42 32 10 14 24Total 8,975 4,275 4,700 4,579 9,279
*Includes Mining, quarrying and turf production and Electricity, gas and water supply
Level of Education
Total resident workers
Residents working outside
town
Workers living and working in
town
Workers travelling
from outside town
Working population
[A + B] [A] [B] [C] [B + C]Primary Education or none 336 124 212 184 396Lower Secondary 1,112 429 683 697 1,380Leaving Cert., Technical or Vocational 2,793 1,254 1,539 1,551 3,090Third level or higher 3,772 2,065 1,707 1,816 3,523Persons still in education (incl. not stated) 962 403 559 331 890Total 8,975 4,275 4,700 4,579 9,279
Socio-Economic Group
Total resident workers
Residents working outside
town
Workers living and working in
town
Workers travelling
from outside town
Working population
[A + B] [A] [B] [C] [B + C]A Employers and managers 1,449 701 748 697 1,445B Higher professional 739 445 294 318 612C Lower professional 1,514 814 700 971 1,671D Non-manual 2,896 1,020 1,876 1,475 3,351E Manual skilled 933 576 357 452 809F Semi-skilled 871 417 454 439 893G Unskilled 277 128 149 109 258H Own account workers 220 121 99 76 175Others including farmers, agricultural workers and not stated (I, J & Z) 76 53 23 42 65Total 8,975 4,275 4,700 4,579 9,279

Galway City
36
Galway City Working population 39,892 Catchment area by Electoral Division
●
●
●
●
●●
●
● ●
●
●
●
● ●●
●
●
●
●
● ●
●
●●
●
●
● ●
●
●
●
●
●
●
●
● ●
●
●
●
●●●
●
●
●
●
●●
●
● ●
●
●
●
● ●●
●
●
●
●
● ●
●
●●
●
●
● ●
●
●
●
●
●
●
●
● ●
●
●
●
●●●
Quin
Gort
Tuam
BallaKnock
TullaEnnis
Elphin
Nenagh
Dunmore
Balygar
Kinvara
Lahinch
Athenry
Clifden
Newport
Headford
Portumna
Scarriff
Loughrea
Oranmore
Westport
Kiltimagh
Roscommon
Castlerea
Castlebar
Glenamaddy
Ennistymon
Oughterard
Ballinrobe
Borrisokane
Ballinasloe
StrokestownBallyhaunis
Claremorris
Baile Chlair
Maigh Cuilin
Mount Bellew
Lisdoonvarna
Miltown Malbay
An Cheathru Rua
Ballaghaderreen
Galway
26,017 workers resided in Galway City in April 2006. Of these, 5,056 worked outside the city leaving 20,961 persons who both lived and worked in the city. A further 18,931 workers travelled into Galway City to work resulting in a working population of 39,892. Galway City was therefore a significant net gainer in employment terms and had the third largest working population in the State after Dublin and Cork. Manufacturing accounted for over one in five workers in Galway City while hotels and restaurants (8.2%) had a higher than average share of employment compared with the average for all 27 towns (5.9%). Nearly half of Galway’s working population were educated to third level – second only to Leixlip. More than a third of Galway City’s workers took more than thirty minutes to commute to work. Three out of four commuters travelled by car. Many surrounding towns were significant suppliers of labour to Galway City e.g. Oughterard, Headford, Tuam, Athenry, Loughrea, Gort and Kinvara.
0 8 16 24 324Kilometers
No. of Workers0 - 20
21 - 50
51 - 100
101 - 500
501 - 1000
1001 and above

Galway City
37
Industrial Group
Total resident workers
Residents working outside
town
Workers living and working in
town
Workers travelling
from outside town
Working population
[A + B] [A] [B] [C] [B + C]Agriculture, forestry and fishing 97 68 29 95 124Manufacturing* 4,789 844 3,945 5,037 8,982Construction 1,060 405 655 924 1,579Wholesale and retail trade 3,646 510 3,136 2,226 5,362Hotels and restaurants 2,966 350 2,616 644 3,260Transport, storage and communications 865 195 670 750 1,420Banking and financial services 1,042 149 893 873 1,766Real estate, renting and business activities 3,121 845 2,276 1,834 4,110Public administration and defence 1,109 170 939 1,206 2,145Education 2,539 732 1,807 1,488 3,295Health and social work 3,419 397 3,022 3,216 6,238Other community, social and personal service activities
1,239 320 919 587 1,506
Industry not stated 125 71 54 51 105Total 26,017 5,056 20,961 18,931 39,892
*Includes Mining, quarrying and turf production and Electricity, gas and water supply
Level of Education
Total resident workers
Residents working outside
town
Workers living and working in
town
Workers travelling
from outside town
Working population
[A + B] [A] [B] [C] [B + C]Primary Education or none 790 152 638 499 1,137Lower Secondary 2,188 372 1,816 2,012 3,828Leaving Cert., Technical or Vocational 6,767 1,098 5,669 5,741 11,410Third level or higher 13,087 2,817 10,270 9,471 19,741Persons still in education (incl. not stated) 3,185 617 2,568 1,208 3,776Total 26,017 5,056 20,961 18,931 39,892
Socio-Economic Group
Total resident workers
Residents working outside
town
Workers living and working in
town
Workers travelling
from outside town
Working population
[A + B] [A] [B] [C] [B + C]A Employers and managers 3,759 733 3,026 2,997 6,023B Higher professional 3,242 753 2,489 2,135 4,624C Lower professional 4,232 1,086 3,146 3,607 6,753D Non-manual 7,707 955 6,752 4,686 11,438E Manual skilled 1,671 501 1,170 1,620 2,790F Semi-skilled 3,751 514 3,237 3,195 6,432G Unskilled 879 151 728 340 1,068H Own account workers 623 298 325 199 524Others including farmers, agricultural workers and not stated (I, J & Z) 153 65 88 152 240Total 26,017 5,056 20,961 18,931 39,892

Kilkenny
38
Kilkenny Working population 10,572 Catchment area by Electoral Division
●
●
●
●
●
●
●
●
●
●
●●
●
●●
●
●
●
●
●
●●
●
●
●
●
●
●
●
●
●
●
●●
●
●●
●
●
●
●
●
●● Durrow
Borris
Ballon
Tullow
Carlow
Callan
Bunclody
New Ross
Moneenroe
Paulstown
Freshford
Rathvilly
Rathdowney
Thomastown
Urlingford
Muinebheag
Ballyragget
Castlecomer
Bennetsbridge
Leighlinbridge
Graiguenamanagh
Kilkenny
8,425 workers resided in Kilkenny in April 2006. Of these, 3,447 worked outside the town leaving 4,978 persons who both lived and worked in the town. A further 5,594 workers travelled into Kilkenny to work resulting in a working population of 10,572. Kilkenny City was therefore a net gainer in employment terms. The health sector, wholesale and retail trade, hotels and restaurants and public administration and defence were the main industry sectors. Between them they accounted for 64.3 per cent of total employment. Manufacturing on the other hand was under-represented. Kilkenny’s catchment area was clearly spread along the major road networks. The main towns from which workers travelled were Ballyragget, Castlecomer, Paulstown, Bennetsbridge, Thomastown and Callan. Nearly 75 per cent of workers travelled to work by car while a further one in six walked.
0 5 10 15 202.5Kilometers
No. of Workers0 - 20
21 - 50
51 - 100
101 - 500
501 - 1000
1001 and above

Kilkenny
39
Industrial Group
Total resident workers
Residents working outside
town
Workers living and working in
town
Workers travelling
from outside town
Working population
[A + B] [A] [B] [C] [B + C]Agriculture, forestry and fishing 101 84 17 47 64Manufacturing* 1,029 785 244 324 568Construction 425 293 132 217 349Wholesale and retail trade 1,537 455 1,082 1,013 2,095Hotels and restaurants 1,022 170 852 337 1,189Transport, storage and communications 213 124 89 103 192Banking and financial services 452 285 167 262 429Real estate, renting and business activities 600 224 376 417 793Public administration and defence 594 172 422 680 1,102Education 690 321 369 407 776Health and social work 1,287 377 910 1,501 2,411Other community, social and personal service activities
393 113 280 253 533
Industry not stated 82 44 38 33 71Total 8,425 3,447 4,978 5,594 10,572
*Includes Mining, quarrying and turf production and Electricity, gas and water supply
Level of Education
Total resident workers
Residents working outside
town
Workers living and working in
town
Workers travelling
from outside town
Working population
[A + B] [A] [B] [C] [B + C]Primary Education or none 424 143 281 188 469Lower Secondary 1,210 459 751 761 1,512Leaving Cert., Technical or Vocational 2,489 925 1,564 1,786 3,350Third level or higher 3,413 1,570 1,843 2,489 4,332Persons still in education (incl. not stated) 889 350 539 370 909Total 8,425 3,447 4,978 5,594 10,572
Socio-Economic Group
Total resident workers
Residents working outside
town
Workers living and working in
town
Workers travelling
from outside town
Working population
[A + B] [A] [B] [C] [B + C]A Employers and managers 1,343 591 752 817 1,569B Higher professional 665 331 334 379 713C Lower professional 1,435 597 838 1,335 2,173D Non-manual 2,761 699 2,062 2,092 4,154E Manual skilled 761 517 244 326 570F Semi-skilled 761 363 398 374 772G Unskilled 356 136 220 148 368H Own account workers 217 122 95 77 172Others including farmers, agricultural workers and not stated (I, J & Z) 126 91 35 46 81Total 8,425 3,447 4,978 5,594 10,572

Killarney
40
Killarney Working population 6,380 Catchment area by Electoral Division
●
●
●
●
●
●
●
●
●
●
●
●
●
●
●
●
●
●
●
●
Tralee
KenmareMacroom
Rathmore
Ballyneen
Newmarket
Millstreet
Killorglin
Castleisland
Killarney
4,591 workers resided in Killarney in April 2006. Of these, 1,834 worked outside the town leaving 2,757 persons who both lived and worked in the town. A further 3,623 workers travelled into Killarney to work resulting in a working population of 6,380. Killarney was therefore a net gainer in employment terms. Over 28 per cent of Killarney’s working population worked in the hotel and restaurant industry in 2006 compared with a 5.9 per cent share for all towns covered in this report. Workers in non-manual occupations accounted for 42 per cent of the working population – twice the proportion for all towns with a population of 5,000 or more. Killarney drew the majority its working population from its immediate hinterland although Tralee was also a significant contributor. Three out of four commuters travelled by car.
0 5 10 15 202.5Kilometers
No. of Workers0 - 20
21 - 50
51 - 100
101 - 500
501 - 1000
1001 and above

Killarney
41
Industrial Group
Total resident workers
Residents working outside
town
Workers living and working in
town
Workers travelling
from outside town
Working population
[A + B] [A] [B] [C] [B + C]Agriculture, forestry and fishing 34 30 4 14 18Manufacturing* 758 614 144 279 423Construction 247 160 87 172 259Wholesale and retail trade 675 141 534 763 1,297Hotels and restaurants 1,365 231 1,134 678 1,812Transport, storage and communications 161 68 93 112 205Banking and financial services 144 83 61 150 211Real estate, renting and business activities 240 86 154 250 404Public administration and defence 147 63 84 267 351Education 231 123 108 188 296Health and social work 385 151 234 583 817Other community, social and personal service activities
167 58 109 162 271
Industry not stated 37 26 11 5 16Total 4,591 1,834 2,757 3,623 6,380
*Includes Mining, quarrying and turf production and Electricity, gas and water supply
Level of Education
Total resident workers
Residents working outside
town
Workers living and working in
town
Workers travelling
from outside town
Working population
[A + B] [A] [B] [C] [B + C]Primary Education or none 255 82 173 171 344Lower Secondary 624 231 393 637 1,030Leaving Cert., Technical or Vocational 1,576 628 948 1,209 2,157Third level or higher 1,477 644 833 1,356 2,189Persons still in education (incl. not stated) 659 249 410 250 660Total 4,591 1,834 2,757 3,623 6,380
Socio-Economic Group
Total resident workers
Residents working outside
town
Workers living and working in
town
Workers travelling
from outside town
Working population
[A + B] [A] [B] [C] [B + C]A Employers and managers 725 242 483 599 1,082B Higher professional 191 106 85 173 258C Lower professional 504 253 251 589 840D Non-manual 1,632 372 1,260 1,435 2,695E Manual skilled 516 368 148 286 434F Semi-skilled 594 311 283 352 635G Unskilled 212 51 161 121 282H Own account workers 158 84 74 47 121Others including farmers, agricultural workers and not stated (I, J & Z) 59 47 12 21 33Total 4,591 1,834 2,757 3,623 6,380

Leixlip
42
Leixlip Working population 6,926 Catchment area by Electoral Division
6,494 workers resided in Leixlip in April 2006. Of these, 5,362 worked outside the town leaving 1,132 persons who both lived and worked in the town. A further 5,794 workers travelled into Leixlip to work resulting in a working population of 6,926. Leixlip was therefore a small net gainer in employment terms. Manufacturing was by far the most important sector of employment in Leixlip accounting for two thirds of all jobs. Of the 27 towns and cities identified in this report Leixlip had the highest proportion of workers educated to third level (61%). Higher and lower professional and skilled manual occupations predominated. The working population in Leixlip came from a wide catchment area with 47 per cent of workers taking more than a half an hour to commute to work. Nearly 83 per cent of workers travelled by car while approximately 7.4 per cent lived within walking or cycling distance of their workplace.
●
●
●●
●
●●
●●
●
●
●
●●
●
●●
●
●
●●
●●●
●●
●●●
● ●●
●
●
●
●
●
●
●
●●
●
●●●
●
●
●
●
●
●
●
●
●
●
●
● ●
●
●
●
●
●
●
●
●
●
●
●
●
●●●
●
●
●
●
●
●
●●
●
●
●
●
●
●●
●
●
●
●●
● ●
●●
● ●
●
●●
●●
●
●
●
●
●
●
●
●
●
●
●●
●
●
●
●
●
●
●
●
●●
●
●●
●●
●
●
●
●●
●
●●
●
●
●●
●●●
●●
●●●
● ●●
●
●
●
●
●
●
●
●●
●
●●●
●
●
●
●
●
●
●
●
●
●
●
● ●
●
●
●
●
●
●
●
●
●
●
●
●
●●●
●
●
●
●
●
●
●●
●
●
●
●
●
●●
●
●
●
●●
● ●
●●
● ●
●
●●
●●
●
●
●
●
●
●
●
●
●
●
●●
●
●
●
●
●
●
Lusk Rush
Bray
Kill
Trim
Naas
Athy
RhodeClara
Moate
Avoca
Slane
Navan
Clane
Dublin
Donore
Clonee
Durrow
Tullow
Carlow
Duleek
Athboy
Swords
Arklow
Carragh
Roscrea
Aughrim
Laytown
Ratoath
Saggart
Ashford
Rathnew
Kilcock
Kildare
Wicklow
Mucklagh
Suncroft
Longford
Daingean
Kinnegad
Killucan
Drogheda
Longwood
Portrane
Kinsealy
Glenealy
Dunlavin
Ballivor
Ennfield
Donabate
Skerries
Dunboyne
Asbourne
Malahide
Kilcoole
Maynooth
Rathdrum
Blackwood
Johnstown
Clonaslee
Abbeyleix
Mountrath
Moneenroe
Rathvilly
Edenderry
Kilcormac
Tullamore
Kilbeggan
Mullingar
Kilmeague
Allenwood
StamullinKentstown
Kildalkey
RoundwoodNewcastle
Newcastle
Rathcoole
Rathangan
Celbridge
Kilcullen
Ballymahon
Derrinturn
Rivermeade
Ballylynan
Rathdowney
Stradbally
Clonmellon
Prosperous
Summerhill
Balbriggan
Enniskerry
Greystones
Calverstown
Hacketstown
Julianstown
Loughshinny
Kilmacanoge
Portmarnock
Blessington
Baltinglass
Mountmellick
Castledermot
Dunshaughlin
Monasterevin
Dun Laoghaire
Portarlington
Portlaoighise
Meathas TruimCastlepollard
Ceannanus Mor
Droichead Nua
Rochfortbridge
Johnstownbridge
Ballymore Eustace
Leixlip
No. of Workers0 - 20
21 - 50
51 - 100
101 - 500
501 - 1000
1001 and above
0 4 8 12 162Kilometers

Leixlip
43
Industrial Group
Total resident workers
Residents working outside
town
Workers living and working in
town
Workers travelling
from outside town
Working population
[A + B] [A] [B] [C] [B + C]Agriculture, forestry and fishing 9 9 . 7 7Manufacturing* 1,136 749 387 4,202 4,589Construction 436 373 63 302 365Wholesale and retail trade 884 769 115 178 293Hotels and restaurants 317 191 126 151 277Transport, storage and communications 380 364 16 57 73Banking and financial services 480 454 26 65 91Real estate, renting and business activities 698 582 116 314 430Public administration and defence 646 629 17 76 93Education 498 396 102 203 305Health and social work 675 578 97 125 222Other community, social and personal service activities
271 212 59 79 138
Industry not stated 64 56 8 35 43Total 6,494 5,362 1,132 5,794 6,926
*Includes Mining, quarrying and turf production and Electricity, gas and water supply
Level of Education
Total resident workers
Residents working outside
town
Workers living and working in
town
Workers travelling
from outside town
Working population
[A + B] [A] [B] [C] [B + C]Primary Education or none 282 212 70 107 177Lower Secondary 852 712 140 287 427Leaving Cert., Technical or Vocational 2,159 1,833 326 1,129 1,455Third level or higher 2,661 2,226 435 3,766 4,201Persons still in education (incl. not stated) 540 379 161 505 666Total 6,494 5,362 1,132 5,794 6,926
Socio-Economic Group
Total resident workers
Residents working outside
town
Workers living and working in
town
Workers travelling
from outside town
Working population
[A + B] [A] [B] [C] [B + C]A Employers and managers 1,257 1,123 134 732 866B Higher professional 473 381 92 955 1,047C Lower professional 1,165 913 252 1,978 2,230D Non-manual 2,076 1,758 318 550 868E Manual skilled 600 505 95 991 1,086F Semi-skilled 588 465 123 407 530G Unskilled 177 90 87 91 178H Own account workers 145 115 30 65 95Others including farmers, agricultural workers and not stated (I, J & Z) 13 12 1 25 26Total 6,494 5,362 1,132 5,794 6,926

Letterkenny
44
Letterkenny Working population 9,834 Catchment area by Electoral Division
●
●
●
●
●
●
●
●
●●
●●
●●
●
●
●
●
●●
●
●
●
●
●
●
●
●
●
●●
●●
●●
●
●
●
●
●●
●
ConvoyRaphoe
Ardara
Kildrum
Milford
Lifford
Donegal
Ramelton
Glenties
Buncrana
Gweedore
Castlefin
Killybegs
Ballybofey
Dunfanaghy
An Bun Beag
Kilmacreenan
An Fal Carragh
An Clochan Liath
Newtowncunningham
Letterkenny
6,219 workers resided in Letterkenny in April 2006. Of these, 1,778 worked outside the town leaving 4,441 persons who both lived and worked in the town. A further 5,393 workers travelled into Letterkenny to work resulting in a working population of 9,834. Letterkenny was therefore a significant net gainer in employment terms. Almost one in four jobs in Letterkenny were in the health sector which employed over 2,300 people. Wholesale and retail trade was also a significant contributor with 19 per cent. Nearly 43 per cent of Letterkenny’s working population had a third level education compared with 33 per cent for all towns with a population of 5,000 or more. Letterkenny drew its working population from a wide catchment area in County Donegal. Over three quarters of those commuting to work took less than a half an hour to do so. The car (83%) was the main means of travel to work.
0 6 12 18 243Kilometers
No. of Workers0 - 20
21 - 50
51 - 100
101 - 500
501 - 1000
1001 and above

Letterkenny
45
Industrial Group
Total resident workers
Residents working outside
town
Workers living and working in
town
Workers travelling
from outside town
Working population
[A + B] [A] [B] [C] [B + C]Agriculture, forestry and fishing 45 39 6 28 34Manufacturing* 553 235 318 524 842Construction 204 122 82 149 231Wholesale and retail trade 1,038 198 840 1,053 1,893Hotels and restaurants 520 105 415 246 661Transport, storage and communications 170 49 121 149 270Banking and financial services 351 62 289 381 670Real estate, renting and business activities 601 128 473 458 931Public administration and defence 492 213 279 429 708Education 731 335 396 463 859Health and social work 1,226 206 1,020 1,336 2,356Other community, social and personal service activities
270 73 197 165 362
Industry not stated 18 13 5 12 17Total 6,219 1,778 4,441 5,393 9,834
*Includes Mining, quarrying and turf production and Electricity, gas and water supply
Level of Education
Total resident workers
Residents working outside
town
Workers living and working in
town
Workers travelling
from outside town
Working population
[A + B] [A] [B] [C] [B + C]Primary Education or none 331 100 231 335 566Lower Secondary 832 215 617 917 1,534Leaving Cert., Technical or Vocational 1,632 384 1,248 1,561 2,809Third level or higher 2,898 940 1,958 2,265 4,223Persons still in education (incl. not stated) 526 139 387 315 702Total 6,219 1,778 4,441 5,393 9,834
Socio-Economic Group
Total resident workers
Residents working outside
town
Workers living and working in
town
Workers travelling
from outside town
Working population
[A + B] [A] [B] [C] [B + C]A Employers and managers 780 228 552 648 1,200B Higher professional 537 161 376 329 705C Lower professional 1,428 462 966 1,206 2,172D Non-manual 2,142 447 1,695 1,983 3,678E Manual skilled 431 193 238 439 677F Semi-skilled 529 146 383 554 937G Unskilled 173 32 141 146 287H Own account workers 152 71 81 57 138Others including farmers, agricultural workers and not stated (I, J & Z) 47 38 9 31 40Total 6,219 1,778 4,441 5,393 9,834

Limerick City
46
Limerick City Working population 35,025 Catchment area by Electoral Division
●
●
●
●
●●
●
●
●
●●●
●●
●
●
●
●
●
●
●
●
●
●
● ●
●
●
●
●
●
●
●●
●
●●
●
●
●
●
●
●
●●
●
●
●
●
●
●
●●
●
●
●●
●●
●
●
●
●
●●
●
●
●
●●●
●●
●
●
●
●
●
●
●
●
●
●
● ●
●
●
●
●
●
●
●●
●
●●
●
●
●
●
●
●
●●
●
●
●
●
●
●
●●
●
●
●●
●●
Quin
Glin
Tulla
Cahir
Moroe
Croom
Bruff
Adare
Ennis
Cashel
Fermoy
Foynes
Nenagh
Lismore
Ballina
Kanturk
Tarbert
NewportCratloe
Lahinch
Thurles
Shannon
Clogheen
Kilworth
Clonlara
Scarriff
Killaloe
Hospital
Askeaton
Ardfinnan
Holycross
DoneraileNewmarketButtevant
Tipperary
Cappamore
Annacotty
Rathkeale
Templemore
Kilfinnane
KilmallockAbbeyfeale
Ballycannan
Silvermines
Ardnacrusha
Charleville
Pallaskenry
Borrisoleigh
Mitchelstown
CaherconlishPatrickswell
Sixmilebridge
Castleconnell
Drumcollogher
Newcastle West
Newmarket-on-Fergus
Limerick
31,910 workers resided in Limerick City (including its suburbs) in April 2006. Of these, 12,869 worked outside the city leaving 19,041 persons who both lived and worked in the city. A further 15,984 workers travelled into Limerick City to work resulting in a working population of 35,025. Limerick City was therefore a net gainer in employment terms. Wholesale and retail trade, health and education were the most important industrial sectors with shares well in excess of those for all towns combined. Together they accounted for nearly half of all employment in Limerick City in April 2006. 42 per cent of workers had a third level education compared with 33 per cent for towns with a population of 5,000 or more. Limerick City drew its working population from a wide catchment area encompassing Ennis, Shannon, Nenagh, Kilmallock and Newcastlewest. One in three commuters took more than a half an hour to commute to work.
0 8 16 24 324Kilometers
No. of Workers0 - 20
21 - 50
51 - 100
101 - 500
501 - 1000
1001 and above

Limerick City
47
Industrial Group
Total resident workers
Residents working outside
town
Workers living and working in
town
Workers travelling
from outside town
Working population
[A + B] [A] [B] [C] [B + C]Agriculture, forestry and fishing 104 80 24 49 73Manufacturing* 7,585 5,977 1,608 1,167 2,775Construction 1,230 569 661 957 1,618Wholesale and retail trade 5,238 1,001 4,237 2,505 6,742Hotels and restaurants 2,220 497 1,723 537 2,260Transport, storage and communications 2,099 1,044 1,055 930 1,985Banking and financial services 1,005 424 581 601 1,182Real estate, renting and business activities 3,458 1,444 2,014 1,544 3,558Public administration and defence 1,414 325 1,089 1,632 2,721Education 2,788 565 2,223 2,024 4,247Health and social work 3,307 556 2,751 3,323 6,074Other community, social and personal service activities
1,304 298 1,006 670 1,676
Industry not stated 158 89 69 45 114Total 31,910 12,869 19,041 15,984 35,025
*Includes Mining, quarrying and turf production and Electricity, gas and water supply
Level of Education
Total resident workers
Residents working outside
town
Workers living and working in
town
Workers travelling
from outside town
Working population
[A + B] [A] [B] [C] [B + C]Primary Education or none 1,816 529 1,287 524 1,811Lower Secondary 4,765 1,628 3,137 2,114 5,251Leaving Cert., Technical or Vocational 9,499 3,798 5,701 4,752 10,453Third level or higher 12,777 5,661 7,116 7,557 14,673Persons still in education (incl. not stated) 3,053 1,253 1,800 1,037 2,837Total 31,910 12,869 19,041 15,984 35,025
Socio-Economic Group
Total resident workers
Residents working outside
town
Workers living and working in
town
Workers travelling
from outside town
Working population
[A + B] [A] [B] [C] [B + C]A Employers and managers 4,679 1,894 2,785 2,491 5,276B Higher professional 3,003 1,305 1,698 1,608 3,306C Lower professional 4,368 1,788 2,580 3,493 6,073D Non-manual 9,738 2,431 7,307 5,230 12,537E Manual skilled 3,058 1,522 1,536 1,512 3,048F Semi-skilled 5,136 3,186 1,950 1,082 3,032G Unskilled 1,110 301 809 307 1,116H Own account workers 610 313 297 186 483Others including farmers, agricultural workers and not stated (I, J & Z) 208 129 79 75 154Total 31,910 12,869 19,041 15,984 35,025

Mullingar
48
Mullingar Working population 7,256 Catchment area by Electoral Division
6,399 workers resided in Mullingar in April 2006. Of these, 3,099 worked outside the town leaving 3,300 persons who both lived and worked in the town. A further 3,956 workers travelled into Mullingar to work resulting in a working population of 7,256. Mullingar was therefore a net gainer in employment terms. Of all the towns profiled in this report Mullingar was the most dependent on the health sector for employment with over 25 per cent of workers employed in that sector. Wholesale and retail trade was the next most important sector (20.7%) while manufacturing accounted for only 6 per cent of jobs. Non-manual occupations (36.9%) predominated. Mullingar drew relatively few workers from Athlone or Tullamore and mainly attracted workers within a closer proximity to the town. Nearly three out of four commuters took less than a half an hour to travel to work. Four out of five workers travelled by car while 12.6 per cent walked to work.
●
●
●
●
●
●
●
●
●
●
●
●
●
●
●
●
●
●
●●
●
●
●
●
●
●
●
●
●
●
●
●
●
●
●
●●
●
●
●
●
●
●
●
●
●
●
●
●
●
●
●
●
●
●●
●
●
●
●
●
●
●
●
●
●
●
●
●
●
●
●
RhodeClara
Moate
Donore
Athboy
Cloghan
Ferbane
Athlone
Mucklagh
Longford
Daingean
Kinnegad
Killucan
Longwood
Ballivor
Ennfield
Edenderry
Tullamore
Kilbeggan
Kilmeague
Allenwood
Kildalkey
Oldcastle
Rathangan
Ballymahon
Derrinturn
ClonmellonLanesborough
Newtownforbes
Meathas TruimCastlepollard
Ceannanus Mor
RochfortbridgeJohnstownbridge
Mullingar
No. of Workers0 - 20
21 - 50
51 - 100
101 - 500
501 - 1000
1001 and above
0 5 10 15 202.5Kilometers

Mullingar
49
Industrial Group
Total resident workers
Residents working outside
town
Workers living and working in
town
Workers travelling
from outside town
Working population
[A + B] [A] [B] [C] [B + C]Agriculture, forestry and fishing 71 63 8 33 41Manufacturing* 900 694 206 247 453Construction 431 328 103 185 288Wholesale and retail trade 1,173 384 789 715 1,504Hotels and restaurants 465 160 305 130 435Transport, storage and communications 273 131 142 170 312Banking and financial services 300 182 118 185 303Real estate, renting and business activities 494 257 237 327 564Public administration and defence 491 231 260 397 657Education 486 256 230 269 499Health and social work 1,014 305 709 1,135 1,844Other community, social and personal service activities
276 95 181 149 330
Industry not stated 25 13 12 14 26Total 6,399 3,099 3,300 3,956 7,256
*Includes Mining, quarrying and turf production and Electricity, gas and water supply
Level of Education
Total resident workers
Residents working outside
town
Workers living and working in
town
Workers travelling
from outside town
Working population
[A + B] [A] [B] [C] [B + C]Primary Education or none 309 111 198 184 382Lower Secondary 909 366 543 569 1,112Leaving Cert., Technical or Vocational 1,964 924 1,040 1,286 2,326Third level or higher 2,570 1,397 1,173 1,606 2,779Persons still in education (incl. not stated) 647 301 346 311 657Total 6,399 3,099 3,300 3,956 7,256
Socio-Economic Group
Total resident workers
Residents working outside
town
Workers living and working in
town
Workers travelling
from outside town
Working population
[A + B] [A] [B] [C] [B + C]A Employers and managers 927 503 424 555 979B Higher professional 551 329 222 299 521C Lower professional 1,134 524 610 936 1,546D Non-manual 2,004 692 1,312 1,369 2,681E Manual skilled 604 393 211 324 535F Semi-skilled 704 393 311 286 597G Unskilled 232 109 123 104 227H Own account workers 170 95 75 53 128Others including farmers, agricultural workers and not stated (I, J & Z) 73 61 12 30 42Total 6,399 3,099 3,300 3,956 7,256
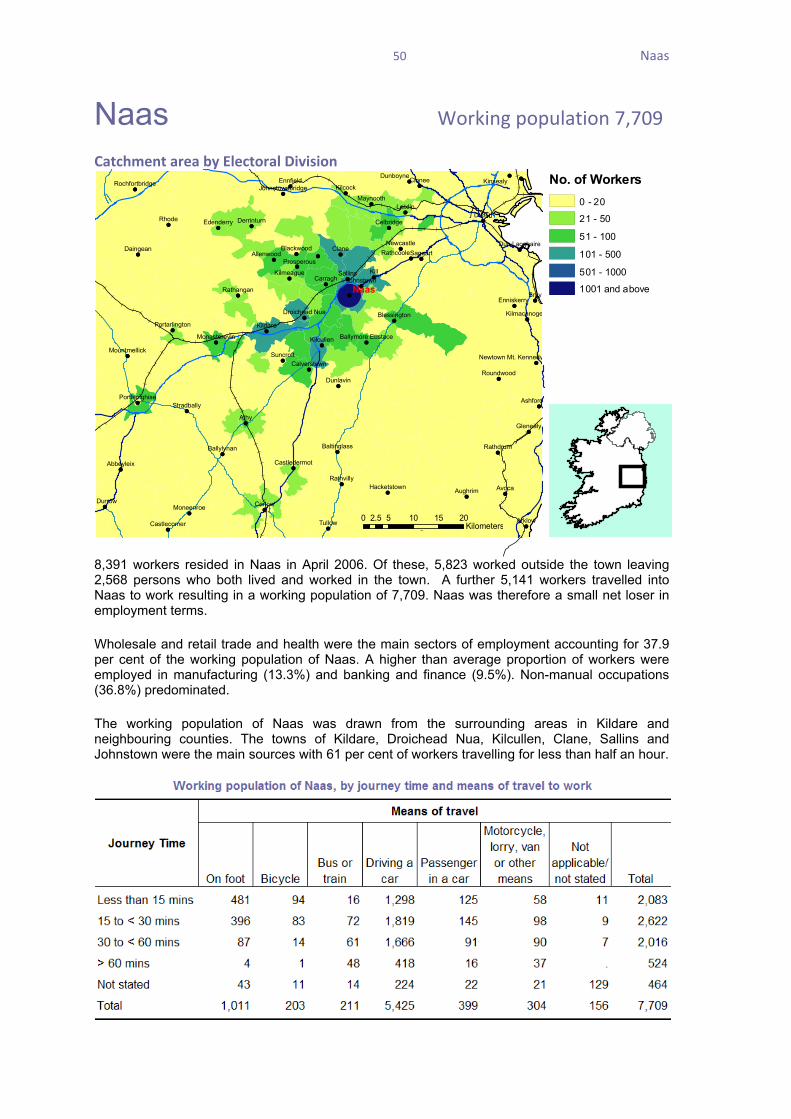
Naas
50
Naas Working population 7,709 Catchment area by Electoral Division
8,391 workers resided in Naas in April 2006. Of these, 5,823 worked outside the town leaving 2,568 persons who both lived and worked in the town. A further 5,141 workers travelled into Naas to work resulting in a working population of 7,709. Naas was therefore a small net loser in employment terms. Wholesale and retail trade and health were the main sectors of employment accounting for 37.9 per cent of the working population of Naas. A higher than average proportion of workers were employed in manufacturing (13.3%) and banking and finance (9.5%). Non-manual occupations (36.8%) predominated. The working population of Naas was drawn from the surrounding areas in Kildare and neighbouring counties. The towns of Kildare, Droichead Nua, Kilcullen, Clane, Sallins and Johnstown were the main sources with 61 per cent of workers travelling for less than half an hour.
●
●●
●
●●
●
●
●
●
●
●●
●
●
●
●
●
●
●●
●●●
●●
●
●
●
●
●
●
●
● ●
●
●
●
●
●
●●
●
●
●
●
●
●
●●
●
●
●
●
●
●
●
●
●
●
●
●
●
●●
●
●
●
●
●
●●
●
●●
●
●
●
●
●
●●
●
●
●
●
●
●
●●
●●●
●●
●
●
●
●
●
●
●
● ●
●
●
●
●
●
●●
●
●
●
●
●
●
●●
●
●
●
●
●
●
●
●
●
●
●
●
●
●●
●
●
●
●
Bray
Kill
Athy
Rhode
Avoca
Clane
Dublin
Clonee
Durrow
Tullow
Carlow
Arklow
Carragh
Aughrim
Sallins
Saggart
Ashford
Leixlip
Kilcock
Kildare
Suncroft
Daingean
Kinsealy
Glenealy
Tinahely
Dunlavin
EnnfieldDunboyne
Maynooth
Rathdrum
Blackwood
Johnstown
Abbeyleix
Moneenroe
Rathvilly
Edenderry
Kilmeague
Allenwood
Roundwood
NewcastleRathcoole
Rathangan
Celbridge
Kilcullen
Derrinturn
Ballylynan
Stradbally
Prosperous
Enniskerry
Calverstown
Castlecomer
Hacketstown
KilmacanogeBlessington
Baltinglass
Mountmellick
Castledermot
Monasterevin
Dun Laoghaire
Portarlington
Portlaoighise
Droichead Nua
RochfortbridgeJohnstownbridge
Ballymore Eustace
Newtown Mt. Kennedy
Naas
No. of Workers0 - 20
21 - 50
51 - 100
101 - 500
501 - 1000
1001 and above
0 5 10 15 202.5Kilometers

Naas
51
Industrial Group
Total resident workers
Residents working outside
town
Workers living and working in
town
Workers travelling
from outside town
Working population
[A + B] [A] [B] [C] [B + C]Agriculture, forestry and fishing 106 61 45 23 68Manufacturing* 1,582 1,178 404 645 1,049Construction 507 429 78 189 267Wholesale and retail trade 1,490 927 563 934 1,497Hotels and restaurants 504 250 254 201 455Transport, storage and communications 464 362 102 154 256Banking and financial services 506 341 165 571 736Real estate, renting and business activities 850 657 193 442 635Public administration and defence 598 493 105 445 550Education 585 443 142 234 376Health and social work 797 404 393 1,029 1,422Other community, social and personal service activities
329 227 102 248 350
Industry not stated 73 51 22 26 48Total 8,391 5,823 2,568 5,141 7,709
*Includes Mining, quarrying and turf production and Electricity, gas and water supply
Level of Education
Total resident workers
Residents working outside
town
Workers living and working in
town
Workers travelling
from outside town
Working population
[A + B] [A] [B] [C] [B + C]Primary Education or none 279 145 134 212 346Lower Secondary 914 580 334 722 1,056Leaving Cert., Technical or Vocational 2,453 1,586 867 1,685 2,552Third level or higher 3,751 2,925 826 2,120 2,946Persons still in education (incl. not stated) 994 587 407 402 809Total 8,391 5,823 2,568 5,141 7,709
Socio-Economic Group
Total resident workers
Residents working outside
town
Workers living and working in
town
Workers travelling
from outside town
Working population
[A + B] [A] [B] [C] [B + C]A Employers and managers 1,698 1,374 324 870 1,194B Higher professional 742 579 163 412 575C Lower professional 1,338 1,004 334 838 1,172D Non-manual 2,272 1,363 909 1,926 2,835E Manual skilled 780 552 228 442 670F Semi-skilled 1,054 625 429 463 892G Unskilled 231 140 91 115 206H Own account workers 170 116 54 50 104Others including farmers, agricultural workers and not stated (I, J & Z) 106 70 36 25 61Total 8,391 5,823 2,568 5,141 7,709

Navan
52
Navan (an Uaimh) Working population 7,564 Catchment area by Electoral Division
9,402 workers resided in Navan in April 2006. Of these, 6,180 worked outside the town leaving 3,222 persons who both lived and worked in the town. A further 4,342 workers travelled into Navan to work resulting in a working population of 7,564. Navan was therefore a significant net loser in employment terms. Wholesale and retail trade and health accounted for two out of every five jobs in Navan in April 2006. Manufacturing (10%) was relatively under-represented. The non-manual and lower professional categories were the most prevalent of the socio-economic groups. The neighbouring towns of Trim and Kells were significant suppliers of workers to Navan in April 2006. Three out of four workers travelled by car while about 26 per cent of commuters travelled for more than a half an hour to work each day.
●
●
●●
●
●
●●●
● ●
●
●
●
●
●
●
●
●
●
●
●
●●
●
●
●
●
●
●
●
●
●
●
●
●
●
●
●
●
●●
●●●
●●
●●
●
●
●●
●●
●
●
●
●
●
●
●
●
●
●
●
●
●
●
●
●
●
●●
●
●
●●●
● ●
●
●
●
●
●
●
●
●
●
●
●
●●
●
●
●
●
●
●
●
●
●
●
●
●
●
●
●
●
●●
●●●
●●
●●
●
●
●●
●●
●
●
●
●
●
●
●
●
●
●
●
●
●
●
●
Lusk Rush
Trim
Rhode
Ardee
Slane
Clane
Dublin
Donore
Clonee
Collon
Duleek
Athboy
Swords
Mullagh
Dunleer
Laytown
Ratoath
Saggart
Leixlip
Kilcock
Kinnegad
Killucan
Virginia
Drogheda
Longwood
Portrane
Kinsealy
Ballivor
Ennfield
Donabate
Skerries
Dunboyne
Asbourne
Malahide
Maynooth
Blackwood
Edenderry
Dromiskin
Allenwood
StamullinKentstown
Kildalkey
Oldcastle
NewcastleRathcoole
CelbridgeDerrinturn
Rivermeade
Tullyallen
Clonmellon
Kingscourt
Prosperous
Summerhill
Balbriggan
Clogherhead
Tallanstown
Julianstown
Loughshinny
Portmarnock
Baileborough
Termonfeckin
Dunshaughlin
Dun Laoghaire
Ceannanus Mor
Ballyjamesduff
Johnstownbridge
Castlebellingham
Navan
No. of Workers0 - 20
21 - 50
51 - 100
101 - 500
501 - 1000
1001 and above
0 6 12 18 243Kilometers
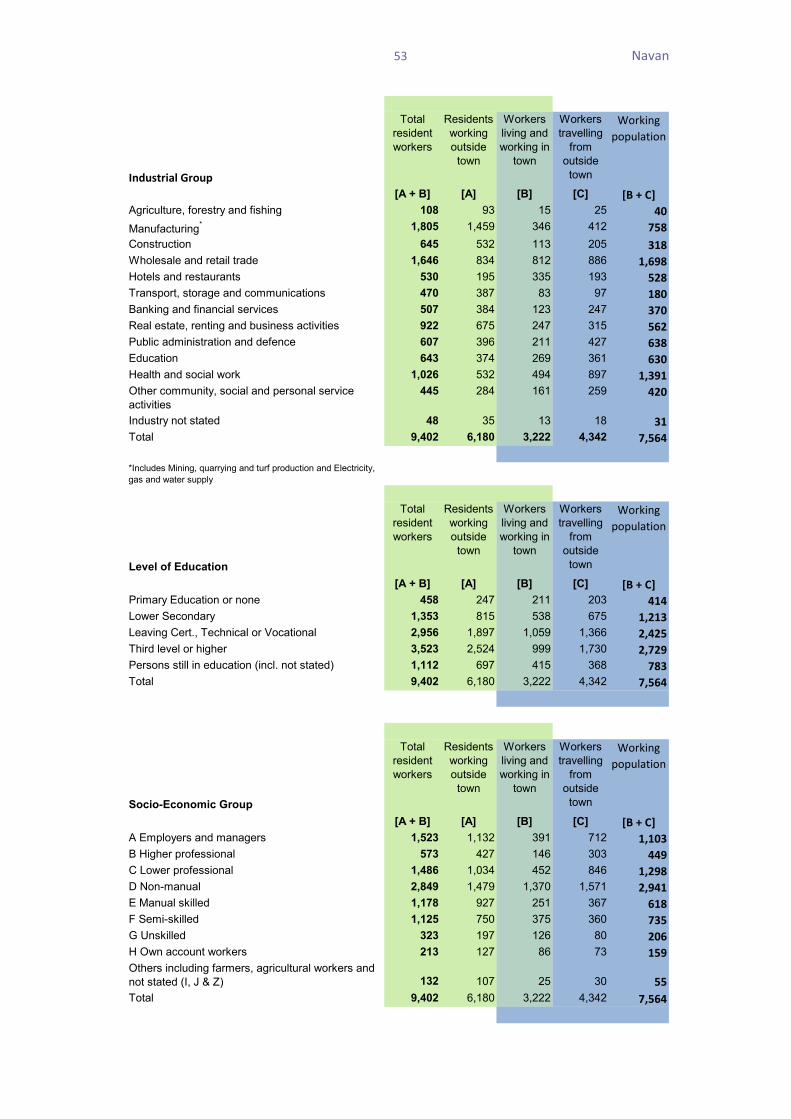
Navan
53
Industrial Group
Total resident workers
Residents working outside
town
Workers living and working in
town
Workers travelling
from outside town
Working population
[A + B] [A] [B] [C] [B + C]Agriculture, forestry and fishing 108 93 15 25 40Manufacturing* 1,805 1,459 346 412 758Construction 645 532 113 205 318Wholesale and retail trade 1,646 834 812 886 1,698Hotels and restaurants 530 195 335 193 528Transport, storage and communications 470 387 83 97 180Banking and financial services 507 384 123 247 370Real estate, renting and business activities 922 675 247 315 562Public administration and defence 607 396 211 427 638Education 643 374 269 361 630Health and social work 1,026 532 494 897 1,391Other community, social and personal service activities
445 284 161 259 420
Industry not stated 48 35 13 18 31Total 9,402 6,180 3,222 4,342 7,564
*Includes Mining, quarrying and turf production and Electricity, gas and water supply
Level of Education
Total resident workers
Residents working outside
town
Workers living and working in
town
Workers travelling
from outside town
Working population
[A + B] [A] [B] [C] [B + C]Primary Education or none 458 247 211 203 414Lower Secondary 1,353 815 538 675 1,213Leaving Cert., Technical or Vocational 2,956 1,897 1,059 1,366 2,425Third level or higher 3,523 2,524 999 1,730 2,729Persons still in education (incl. not stated) 1,112 697 415 368 783Total 9,402 6,180 3,222 4,342 7,564
Socio-Economic Group
Total resident workers
Residents working outside
town
Workers living and working in
town
Workers travelling
from outside town
Working population
[A + B] [A] [B] [C] [B + C]A Employers and managers 1,523 1,132 391 712 1,103B Higher professional 573 427 146 303 449C Lower professional 1,486 1,034 452 846 1,298D Non-manual 2,849 1,479 1,370 1,571 2,941E Manual skilled 1,178 927 251 367 618F Semi-skilled 1,125 750 375 360 735G Unskilled 323 197 126 80 206H Own account workers 213 127 86 73 159Others including farmers, agricultural workers and not stated (I, J & Z) 132 107 25 30 55Total 9,402 6,180 3,222 4,342 7,564

Portlaoighise
54
Portlaoighise Working population 6,601 Catchment area by Electoral Division
5,018 workers resided in Portlaoighise in April 2006. Of these, 2,615 worked outside the town leaving 2,403 persons who both lived and worked in the town. A further 4,198 workers travelled into Portlaoighise to work resulting in a working population of 6,601. Portlaoighise was therefore a net gainer in employment terms. Public administration and defence was the most important industry sector accounting for just over one in five jobs in April 2006 and reflecting the importance of the prison as a local employer. The wholesale and retail and health sectors accounted for a further 35 per cent of workers. Despite a reasonably good rail service just under 2 per cent of workers travelled by either bus or train. The preferred means of travel was the car accounting for 80 per cent of daily commuters. Portarlington, Stradbally, Abbeyleix, Mountrath and Mountmellick were the major sources of commuters into Portlaoighise each day.
●
●
●●
●
●
●
●
●
●
●
●●
●
●
●
●
●
●
●
●●●
●
●
●
●
●
●
●
●●
●
●
●
●
●
●
●
●
●●
●●
●
●
●
●
●
●●
●
●●
●
●
●
●
●●
●
●●
●
●
●
●
●
●
●
●●
●
●
●
●
●
●
●
●●
●
●
●
●
●
●
●
●●●
●
●
●
●
●
●
●
●●
●
●
●
●
●
●
●
●
●●
●●
●
●
●
●
●
●●
●
●●
●
●
●
●
●●
●
●●
●
●
●
●
●
Birr
Kill
Naas
Athy
Ferns
Clane
Durrow
Borris
Ballon
Tullow
Carlow
Carnew
Carragh
Thurles
Roscrea
Cloghan
FerbaneSallins
Kildare
Mucklagh
Shinrone
Suncroft
BunclodyKilkenny
Daingean
Dunlavin
Holycross
Blackwood
Johnstown
Clonaslee
Abbeyleix
Mountrath
Moneenroe
Paulstown
Freshford
Rathvilly
Kilcormac
TullamoreKilmeague
Allenwood NewcastleRathcoole
Rathangan
Kilcullen
Templemore
Ballylynan
Rathdowney
Stradbally
UrlingfordMuinebheag
Prosperous
Calverstown
BallyraggetCastlecomer
Hacketstown
Blessington
Baltinglass
Mountmellick
Castledermot
Monasterevin
Twomileborris
Portarlington
Bennetsbridge
Droichead Nua
Leighlinbridge
Ballymore Eustace
Portlaoighise
No. of Workers0 - 20
21 - 50
51 - 100
101 - 500
501 - 1000
1001 and above
0 7 14 21 283.5Kilometers

Portlaoighise
55
Industrial Group
Total resident workers
Residents working outside
town
Workers living and working in
town
Workers travelling
from outside town
Working population
[A + B] [A] [B] [C] [B + C]Agriculture, forestry and fishing 40 30 10 32 42Manufacturing* 545 401 144 309 453Construction 407 290 117 247 364Wholesale and retail trade 921 352 569 652 1,221Hotels and restaurants 369 118 251 176 427Transport, storage and communications 330 206 124 231 355Banking and financial services 201 148 53 105 158Real estate, renting and business activities 341 201 140 261 401Public administration and defence 598 234 364 1,036 1,400Education 364 219 145 246 391Health and social work 647 297 350 722 1,072Other community, social and personal service activities
225 101 124 163 287
Industry not stated 30 18 12 18 30Total 5,018 2,615 2,403 4,198 6,601
*Includes Mining, quarrying and turf production and Electricity, gas and water supply
Level of Education
Total resident workers
Residents working outside
town
Workers living and working in
town
Workers travelling
from outside town
Working population
[A + B] [A] [B] [C] [B + C]Primary Education or none 221 101 120 176 296Lower Secondary 758 362 396 648 1,044Leaving Cert., Technical or Vocational 1,670 817 853 1,529 2,382Third level or higher 1,737 1,018 719 1,540 2,259Persons still in education (incl. not stated) 632 317 315 305 620Total 5,018 2,615 2,403 4,198 6,601
Socio-Economic Group
Total resident workers
Residents working outside
town
Workers living and working in
town
Workers travelling
from outside town
Working population
[A + B] [A] [B] [C] [B + C]A Employers and managers 716 384 332 565 897B Higher professional 309 185 124 233 357C Lower professional 730 413 317 824 1,141D Non-manual 1,795 700 1,095 1,711 2,806E Manual skilled 587 392 195 395 590F Semi-skilled 508 326 182 255 437G Unskilled 222 121 101 120 221H Own account workers 102 66 36 54 90Others including farmers, agricultural workers and not stated (I, J & Z) 49 28 21 41 62Total 5,018 2,615 2,403 4,198 6,601

Sligo
56
Sligo Working population 13,398 Catchment area by Electoral Division
●
●
●
●
●
●
●
●
●
●
●
●
●
●
●
●
●
●
●
●
●
●
●
●
●
●
●
●
●
●
●
●
●
●
●
●
●
●
●
●
●
●
●
●
●
●
●
●
Boyle
Killala
Foxford
Ballina
Kinlough
Swinford
Bundoran
Ballincar
Dromahair
Collooney
Ballymote
Inniscrone
Strandhill
DrumshanboTobercurry
Ballysodare
Charlestown
Rosses Point
Ballyshannon
Manorhamilton
Ballaghaderreen
Carrick on Shannon
Sligo
6,769 workers resided in Sligo in April 2006. Of these, 1,483 worked outside the town leaving 5,286 persons who both lived and worked in the town. A further 8,112 workers travelled into Sligo to work resulting in a working population of 13,398. Sligo was therefore a major net gainer in employment terms with the number of workers almost doubling as a result of inflows. The health and manufacturing sectors accounted for two out of five jobs in Sligo with public administration and defence accounting for a further 10.8 per cent. 44 per cent of workers were educated to third level. Sligo drew a significant numbers of its daily workers from the surrounding towns of Tobercurry, Ballymote, Collooney, Ballysadare, Dromahair, Manorhamilton and from along the coastal strip to Bundoran. While nearly 80 per cent of workers travelled by car a significant minority (13.4%) walked to work.
0 5 10 15 202.5Kilometers
No. of Workers0 - 20
21 - 50
51 - 100
101 - 500
501 - 1000
1001 and above
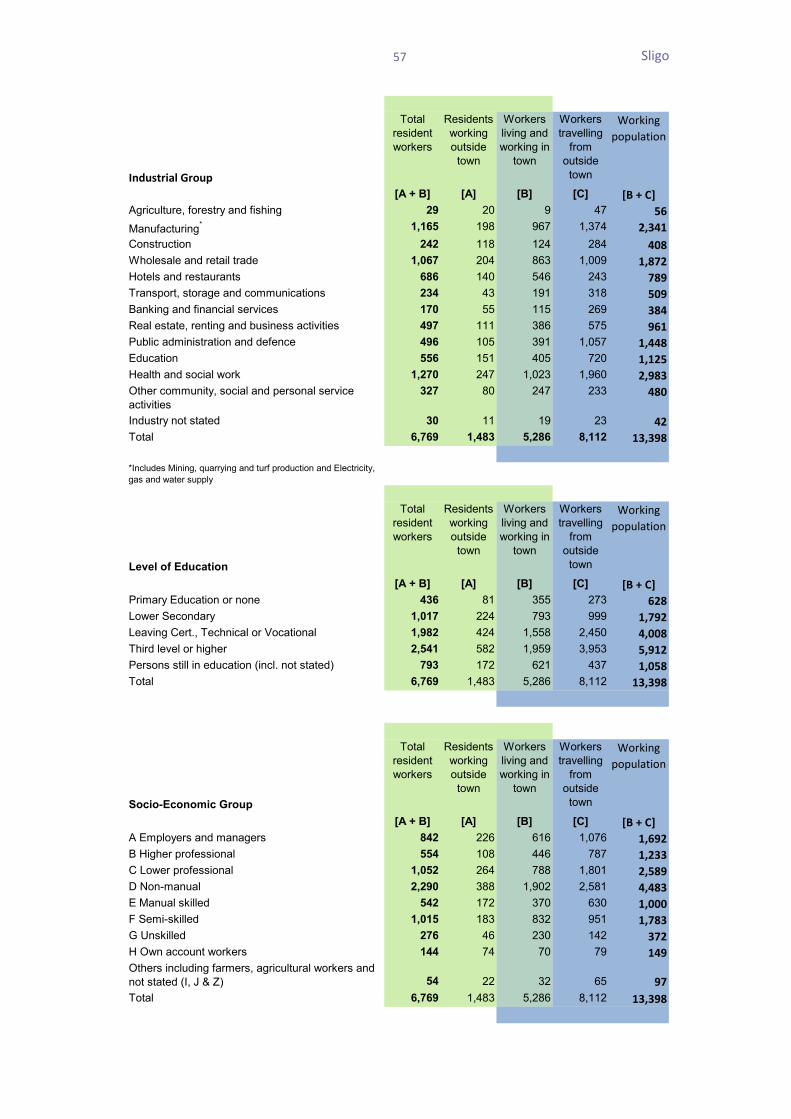
Sligo
57
Industrial Group
Total resident workers
Residents working outside
town
Workers living and working in
town
Workers travelling
from outside town
Working population
[A + B] [A] [B] [C] [B + C]Agriculture, forestry and fishing 29 20 9 47 56Manufacturing* 1,165 198 967 1,374 2,341Construction 242 118 124 284 408Wholesale and retail trade 1,067 204 863 1,009 1,872Hotels and restaurants 686 140 546 243 789Transport, storage and communications 234 43 191 318 509Banking and financial services 170 55 115 269 384Real estate, renting and business activities 497 111 386 575 961Public administration and defence 496 105 391 1,057 1,448Education 556 151 405 720 1,125Health and social work 1,270 247 1,023 1,960 2,983Other community, social and personal service activities
327 80 247 233 480
Industry not stated 30 11 19 23 42Total 6,769 1,483 5,286 8,112 13,398
*Includes Mining, quarrying and turf production and Electricity, gas and water supply
Level of Education
Total resident workers
Residents working outside
town
Workers living and working in
town
Workers travelling
from outside town
Working population
[A + B] [A] [B] [C] [B + C]Primary Education or none 436 81 355 273 628Lower Secondary 1,017 224 793 999 1,792Leaving Cert., Technical or Vocational 1,982 424 1,558 2,450 4,008Third level or higher 2,541 582 1,959 3,953 5,912Persons still in education (incl. not stated) 793 172 621 437 1,058Total 6,769 1,483 5,286 8,112 13,398
Socio-Economic Group
Total resident workers
Residents working outside
town
Workers living and working in
town
Workers travelling
from outside town
Working population
[A + B] [A] [B] [C] [B + C]A Employers and managers 842 226 616 1,076 1,692B Higher professional 554 108 446 787 1,233C Lower professional 1,052 264 788 1,801 2,589D Non-manual 2,290 388 1,902 2,581 4,483E Manual skilled 542 172 370 630 1,000F Semi-skilled 1,015 183 832 951 1,783G Unskilled 276 46 230 142 372H Own account workers 144 74 70 79 149Others including farmers, agricultural workers and not stated (I, J & Z) 54 22 32 65 97Total 6,769 1,483 5,286 8,112 13,398
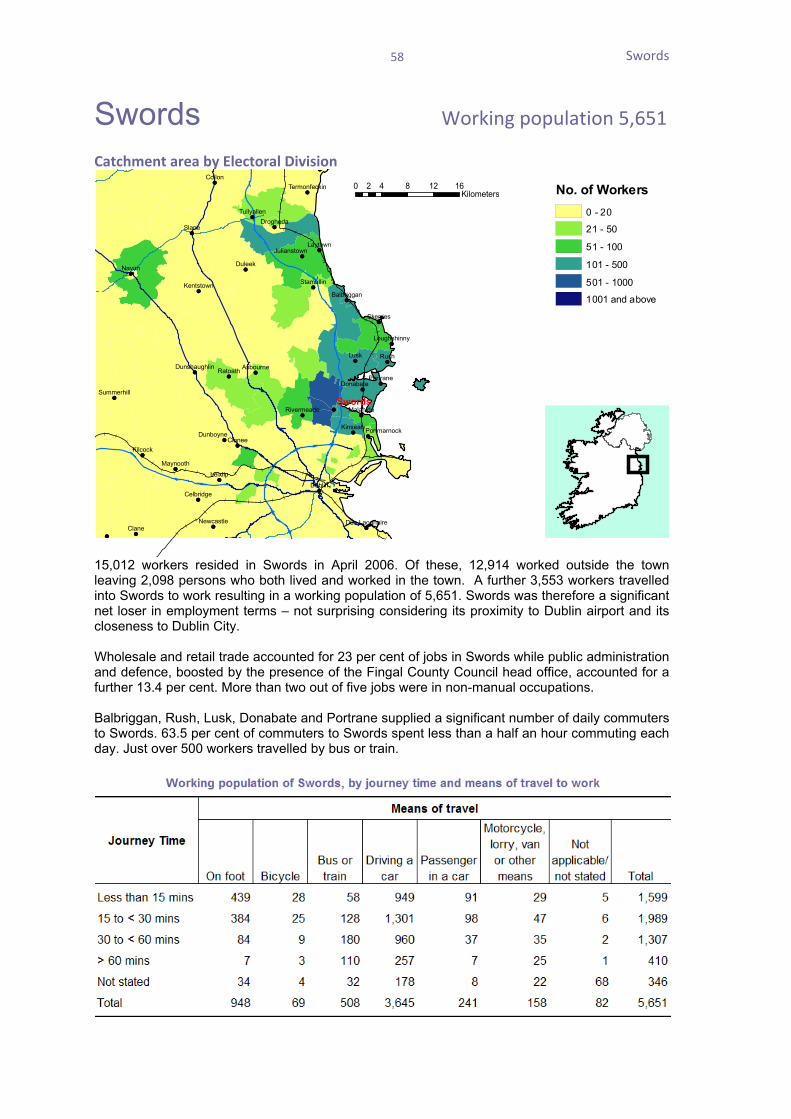
Swords
58
Swords Working population 5,651 Catchment area by Electoral Division
15,012 workers resided in Swords in April 2006. Of these, 12,914 worked outside the town leaving 2,098 persons who both lived and worked in the town. A further 3,553 workers travelled into Swords to work resulting in a working population of 5,651. Swords was therefore a significant net loser in employment terms – not surprising considering its proximity to Dublin airport and its closeness to Dublin City. Wholesale and retail trade accounted for 23 per cent of jobs in Swords while public administration and defence, boosted by the presence of the Fingal County Council head office, accounted for a further 13.4 per cent. More than two out of five jobs were in non-manual occupations. Balbriggan, Rush, Lusk, Donabate and Portrane supplied a significant number of daily commuters to Swords. 63.5 per cent of commuters to Swords spent less than a half an hour commuting each day. Just over 500 workers travelled by bus or train.
●
●
●●
●
●●●
● ●
●
●
●
●
●
●
●
●
●
●●
●
●
●
●
●
●
●
●
●
●
●
●●
●
●
●
●
●
●
●●
●
●●
●
●●●
● ●
●
●
●
●
●
●
●
●
●
●●
●
●
●
●
●
●
●
●
●
●
●
●●
●
●
●
●
●
●
●
Lusk Rush
Slane
Navan
Clane
Dublin
Clonee
Collon
Duleek
Laytown
Ratoath
Leixlip
Kilcock
Drogheda
Portrane
Kinsealy
Donabate
Skerries
Dunboyne
Asbourne
Malahide
Maynooth
StamullinKentstown
Newcastle
Celbridge
Rivermeade
Tullyallen
Summerhill
Balbriggan
Julianstown
Loughshinny
Portmarnock
Termonfeckin
Dunshaughlin
Dun Laoghaire
Swords
No. of Workers0 - 20
21 - 50
51 - 100
101 - 500
501 - 1000
1001 and above
0 4 8 12 162Kilometers

Swords
59
Industrial Group
Total resident workers
Residents working outside
town
Workers living and working in
town
Workers travelling
from outside town
Working population
[A + B] [A] [B] [C] [B + C]Agriculture, forestry and fishing 105 102 3 9 12Manufacturing* 1,708 1,581 127 432 559Construction 608 513 95 211 306Wholesale and retail trade 2,647 1,988 659 643 1,302Hotels and restaurants 948 661 287 137 424Transport, storage and communications 2,064 1,969 95 245 340Banking and financial services 1,124 1,050 74 205 279Real estate, renting and business activities 2,128 1,983 145 319 464Public administration and defence 1,035 859 176 579 755Education 741 566 175 338 513Health and social work 1,272 1,123 149 234 383Other community, social and personal service activities
539 435 104 178 282
Industry not stated 93 84 9 23 32Total 15,012 12,914 2,098 3,553 5,651
*Includes Mining, quarrying and turf production and Electricity, gas and water supply
Level of Education
Total resident workers
Residents working outside
town
Workers living and working in
town
Workers travelling
from outside town
Working population
[A + B] [A] [B] [C] [B + C]Primary Education or none 508 367 141 196 337Lower Secondary 2,042 1,609 433 492 925Leaving Cert., Technical or Vocational 4,933 4,212 721 1,052 1,773Third level or higher 5,751 5,244 507 1,561 2,068Persons still in education (incl. not stated) 1,778 1,482 296 252 548Total 15,012 12,914 2,098 3,553 5,651
Socio-Economic Group
Total resident workers
Residents working outside
town
Workers living and working in
town
Workers travelling
from outside town
Working population
[A + B] [A] [B] [C] [B + C]A Employers and managers 2,643 2,398 245 600 845B Higher professional 948 870 78 381 459C Lower professional 2,011 1,826 185 570 755D Non-manual 5,627 4,510 1,117 1,217 2,334E Manual skilled 1,399 1,306 93 252 345F Semi-skilled 1,468 1,273 195 305 500G Unskilled 462 357 105 140 245H Own account workers 299 233 66 68 134Others including farmers, agricultural workers and not stated (I, J & Z) 155 141 14 20 34Total 15,012 12,914 2,098 3,553 5,651

Tralee
60
Tralee Working population 11,548 Catchment area by Electoral Division
●
●
●
●
●
●
●
●
●
●
●
●
●
●
●
●
●
●
●
●
●
●
●
●
Ardfert
Rathmore
ListowelBallyduff
Killarney
Killorglin
AbbeyfealeBallyheigue
Ballybunion
An Daingean
Castleisland
Tralee
6,844 workers resided in Tralee in April 2006. Of these, 1,808 worked outside the town leaving 5,036 persons who both lived and worked in the town. A further 6,512 workers travelled into Tralee to work resulting in a working population of 11,548. Tralee was therefore a major net gainer in employment terms. Wholesale and retail trade and the health sector each accounted for 20 per cent of employment in Tralee with the manufacturing sector (13%) and public administration and defence (8.9%) also playing a major role. 41.3 per cent of workers were educated to third level – high compared with other towns of 5,000 population and over. Significant numbers of commuters travelled into Tralee from the surrounding towns of Listowel, Castleisland and Killarney. About four out of five commuters travelled by car and 70 per cent of commuters took less than a half an hour to travel to work.
0 4 8 12 162Kilometers No. of Workers
0 - 20
21 - 50
51 - 100
101 - 500
501 - 1000
1001 and above

Tralee
61
Industrial Group
Total resident workers
Residents working outside
town
Workers living and working in
town
Workers travelling
from outside town
Working population
[A + B] [A] [B] [C] [B + C]Agriculture, forestry and fishing 56 51 5 29 34Manufacturing* 936 252 684 819 1,503Construction 358 177 181 288 469Wholesale and retail trade 1,427 246 1,181 1,206 2,387Hotels and restaurants 630 171 459 228 687Transport, storage and communications 301 79 222 311 533Banking and financial services 208 97 111 168 279Real estate, renting and business activities 559 169 390 402 792Public administration and defence 433 84 349 675 1,024Education 601 224 377 614 991Health and social work 973 156 817 1,524 2,341Other community, social and personal service activities
325 83 242 222 464
Industry not stated 37 19 18 26 44Total 6,844 1,808 5,036 6,512 11,548
*Includes Mining, quarrying and turf production and Electricity, gas and water supply
Level of Education
Total resident workers
Residents working outside
town
Workers living and working in
town
Workers travelling
from outside town
Working population
[A + B] [A] [B] [C] [B + C]Primary Education or none 324 63 261 246 507Lower Secondary 1,054 247 807 1,040 1,847Leaving Cert., Technical or Vocational 2,088 470 1,618 1,935 3,553Third level or higher 2,727 858 1,869 2,905 4,774Persons still in education (incl. not stated) 651 170 481 386 867Total 6,844 1,808 5,036 6,512 11,548
Socio-Economic Group
Total resident workers
Residents working outside
town
Workers living and working in
town
Workers travelling
from outside town
Working population
[A + B] [A] [B] [C] [B + C]A Employers and managers 1,066 324 742 836 1,578B Higher professional 550 175 375 528 903C Lower professional 987 315 672 1,383 2,055D Non-manual 2,337 436 1,901 2,177 4,078E Manual skilled 626 204 422 631 1,053F Semi-skilled 742 129 613 650 1,263G Unskilled 252 54 198 205 403H Own account workers 202 119 83 70 153Others including farmers, agricultural workers and not stated (I, J & Z) 82 52 30 32 62Total 6,844 1,808 5,036 6,512 11,548

Tullamore
62
Tullamore Working population 7,473 Catchment area by Electoral Division
4,510 workers resided in Tullamore in April 2006. Of these, 1,864 worked outside the town leaving 2,646 persons who both lived and worked in the town. A further 4,827 workers travelled into Tullamore to work resulting in a working population of 7,473. Tullamore was therefore a net gainer in employment terms. The health sector was the most important contributor to jobs in Tullamore accounting for 22.5 per cent of total employment. Manufacturing and wholesale and retail trade were also higher than average contributors and accounted for a further 37 per cent of the working population. Non-manual occupations made up one in three of all jobs. The towns of Clara and Daingean were significant suppliers of labour to Tullamore as well as the immediately surrounding areas of the town itself. The links with Athlone and Mullingar were somewhat weaker. Over two thirds of the journeys to work took less than a half an hour each day.
●
●●
●
●
●
●
●
●
●
●
●●
● ●
●
●●
●
●
●
●
●
●
●
●
●
●
●
●
●
●
●●
●
●
●
●
●
●
●
●
●
●
●
●
●
●
●
●●
●
●
●
●
●
●
●
●
●●
● ●
●
●●
●
●
●
●
●
●
●
●
●
●
●
●
●
●
●●
●
●
●
●
●
●
●
●
●
●
●
●
●
●
Birr
Trim
Athy
RhodeClara
Moate
Donore
Roscrea
Cloghan
Ferbane
Athlone
Kildare
Mucklagh
Shinrone
Suncroft
Daingean
Banagher
Kinnegad
Killucan
Longwood
Ballivor
Ennfield
Blackwood
Clonaslee
Abbeyleix
Mountrath
Edenderry
Kilcormac
Kilbeggan
Mullingar
Kilmeague
Allenwood
Rathangan
Ballymahon
Derrinturn
Ballylynan
Stradbally
Robertstown
Mountmellick
Castledermot
Monasterevin
Portarlington
Portlaoighise
Droichead Nua
RochfortbridgeJohnstownbridge
Tullamore
No. of Workers0 - 20
21 - 50
51 - 100
101 - 500
501 - 1000
1001 and above
0 6 12 18 243Kilometers

Tullamore
63
Industrial Group
Total resident workers
Residents working outside
town
Workers living and working in
town
Workers travelling
from outside town
Working population
[A + B] [A] [B] [C] [B + C]Agriculture, forestry and fishing 44 39 5 20 25Manufacturing* 840 444 396 964 1,360Construction 327 216 111 180 291Wholesale and retail trade 775 234 541 852 1,393Hotels and restaurants 382 64 318 218 536Transport, storage and communications 141 69 72 109 181Banking and financial services 126 62 64 139 203Real estate, renting and business activities 318 117 201 255 456Public administration and defence 333 164 169 502 671Education 360 216 144 208 352Health and social work 692 176 516 1,167 1,683Other community, social and personal service activities
147 52 95 190 285
Industry not stated 25 11 14 23 37Total 4,510 1,864 2,646 4,827 7,473
*Includes Mining, quarrying and turf production and Electricity, gas and water supply
Level of Education
Total resident workers
Residents working outside
town
Workers living and working in
town
Workers travelling
from outside town
Working population
[A + B] [A] [B] [C] [B + C]Primary Education or none 219 48 171 253 424Lower Secondary 586 200 386 796 1,182Leaving Cert., Technical or Vocational 1,267 507 760 1,556 2,316Third level or higher 1,717 807 910 1,830 2,740Persons still in education (incl. not stated) 721 302 419 392 811Total 4,510 1,864 2,646 4,827 7,473
Socio-Economic Group
Total resident workers
Residents working outside
town
Workers living and working in
town
Workers travelling
from outside town
Working population
[A + B] [A] [B] [C] [B + C]A Employers and managers 623 282 341 603 944B Higher professional 350 143 207 285 492C Lower professional 784 340 444 976 1,420D Non-manual 1,258 363 895 1,590 2,485E Manual skilled 561 343 218 385 603F Semi-skilled 553 189 364 799 1,163G Unskilled 209 95 114 117 231H Own account workers 106 59 47 44 91Others including farmers, agricultural workers and not stated (I, J & Z) 66 50 16 28 44Total 4,510 1,864 2,646 4,827 7,473
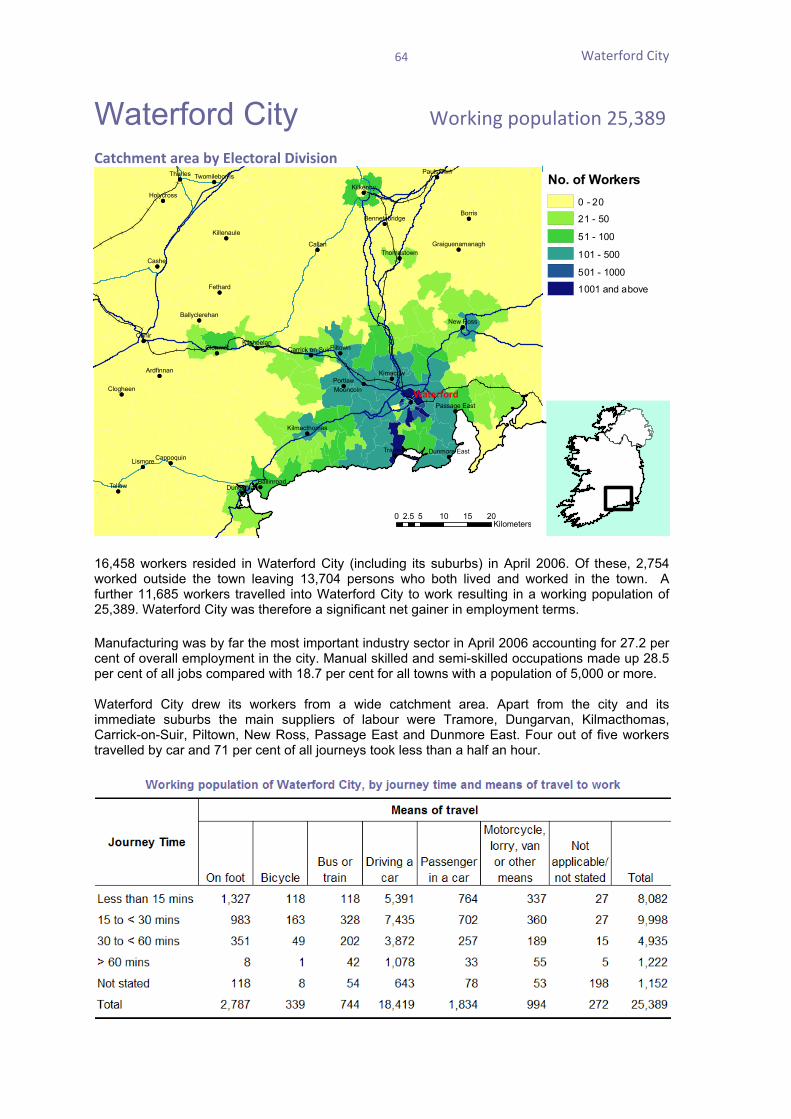
Waterford City
64
Waterford City Working population 25,389 Catchment area by Electoral Division
●
●
●
●●
●
●
●
●
●
●
●●
●
●
●
●
●
●
●
● ●
●
●
●
●
●
●
●
●
●
●
●
●
●
●
●
●
●●
●
●
●
●
●
●
●●
●
●
●
●
●
●
●
● ●
●
●
●
●
●
●
●
●
●
●
●
●
●
Cahir
Tallow
Borris
Callan
Cashel
Fethard
Lismore
Portlaw
Tramore
Kimacow
Piltown
Thurles
Clonmel
Clogheen Mooncoin
Kilkenny
New Ross
Ardfinnan
Cappoquin
Holycross
Paulstown
Dungarvan
Kilsheelan
Killenaule
Ballinroad
Thomastown
Kilmacthomas
Passage East
Dunmore East
Ballyclerehan
Twomileborris
Bennetsbridge
Graiguenamanagh
Carrick on Suir
Waterford
16,458 workers resided in Waterford City (including its suburbs) in April 2006. Of these, 2,754 worked outside the town leaving 13,704 persons who both lived and worked in the town. A further 11,685 workers travelled into Waterford City to work resulting in a working population of 25,389. Waterford City was therefore a significant net gainer in employment terms. Manufacturing was by far the most important industry sector in April 2006 accounting for 27.2 per cent of overall employment in the city. Manual skilled and semi-skilled occupations made up 28.5 per cent of all jobs compared with 18.7 per cent for all towns with a population of 5,000 or more. Waterford City drew its workers from a wide catchment area. Apart from the city and its immediate suburbs the main suppliers of labour were Tramore, Dungarvan, Kilmacthomas, Carrick-on-Suir, Piltown, New Ross, Passage East and Dunmore East. Four out of five workers travelled by car and 71 per cent of all journeys took less than a half an hour.
0 5 10 15 202.5Kilometers
No. of Workers0 - 20
21 - 50
51 - 100
101 - 500
501 - 1000
1001 and above

Waterford City
65
Industrial Group
Total resident workers
Residents working outside
town
Workers living and working in
town
Workers travelling
from outside town
Working population
[A + B] [A] [B] [C] [B + C]Agriculture, forestry and fishing 84 57 27 30 57Manufacturing* 4,403 603 3,800 3,097 6,897Construction 714 269 445 604 1,049Wholesale and retail trade 2,690 350 2,340 1,385 3,725Hotels and restaurants 1,293 211 1,082 377 1,459Transport, storage and communications 681 163 518 534 1,052Banking and financial services 470 87 383 490 873Real estate, renting and business activities 1,518 273 1,245 1,077 2,322Public administration and defence 639 147 492 635 1,127Education 1,295 220 1,075 1,115 2,190Health and social work 1,942 235 1,707 1,932 3,639Other community, social and personal service activities
637 115 522 368 890
Industry not stated 92 24 68 41 109Total 16,458 2,754 13,704 11,685 25,389
*Includes Mining, quarrying and turf production and Electricity, gas and water supply
Level of Education
Total resident workers
Residents working outside
town
Workers living and working in
town
Workers travelling
from outside town
Working population
[A + B] [A] [B] [C] [B + C]Primary Education or none 982 128 854 411 1,265Lower Secondary 3,145 461 2,684 1,866 4,550Leaving Cert., Technical or Vocational 5,093 773 4,320 3,575 7,895Third level or higher 5,676 1,086 4,590 5,117 9,707Persons still in education (incl. not stated) 1,562 306 1,256 716 1,972Total 16,458 2,754 13,704 11,685 25,389
Socio-Economic Group
Total resident workers
Residents working outside
town
Workers living and working in
town
Workers travelling
from outside town
Working population
[A + B] [A] [B] [C] [B + C]A Employers and managers 2,250 482 1,768 1,765 3,533B Higher professional 1,210 239 971 1,161 2,132C Lower professional 2,125 411 1,714 2,264 3,978D Non-manual 4,828 556 4,272 2,955 7,227E Manual skilled 2,138 444 1,694 1,559 3,253F Semi-skilled 2,728 306 2,422 1,553 3,975G Unskilled 693 102 591 261 852H Own account workers 323 143 180 128 308Others including farmers, agricultural workers and not stated (I, J & Z) 163 71 92 39 131Total 16,458 2,754 13,704 11,685 25,389

Wexford
66
Wexford Working population 9,020 Catchment area by Electoral Division
●
●
●
●
●
●
●
●
●
●
●
●●
●
●
●
●
●
●
●
●●
●●
●
●
●
●
●
● ●
●
●
●
●
●
●
●
●
●
●
●
●
●
●●
●
●
●
●
●
●
●
●●
●●
●
●
●
●
●
● ●
●
●
Ferns
Gorey
Borris
Ballon
Callan
Carnew
Portlaw
Tramore
Taghmon
Kimacow
Piltown
Rosslare
Bunclody
Mooncoin
Kilkenny
New Ross
Paulstown
Freshford
Waterford
Piercetown
Thomastown
Muinebheag
Enniscorthy
Passage East
Dunmore East
Castlebridge
Bennetsbridge
Leighlinbridge
Graiguenamanagh
Courtown Harbour
Rosslare Harbour
Wexford
6,372 workers resided in Wexford town in April 2006. Of these, 2,524 worked outside the town leaving 3,848 persons who both lived and worked in the town. A further 5,172 workers travelled into Wexford town to work resulting in a working population of 9,020. Wexford town was therefore a net gainer in employment terms. Wholesale and retail trade was the largest sector of economic activity accounting for just over one in five of all jobs. The health sector (16.6%) and manufacturing (15%) were also important providers of employment. Two out of five occupations were non-manual. While most of the labour force was drawn from the immediate vicinity of Wexford town Enniscorthy and Rosslare were also significant sources of labour. One in six workers walked to their place of employment while three quarters travelled by car. Only 17.6 per cent of journeys to work took over half an hour.
0 7 14 21 283.5Kilometers
No. of Workers0 - 20
21 - 50
51 - 100
101 - 500
501 - 1000
1001 and above

Wexford
67
Industrial Group
Total resident workers
Residents working outside
town
Workers living and working in
town
Workers travelling
from outside town
Working population
[A + B] [A] [B] [C] [B + C]Agriculture, forestry and fishing 48 43 5 8 13Manufacturing* 963 385 578 777 1,355Construction 414 248 166 233 399Wholesale and retail trade 1,306 332 974 932 1,906Hotels and restaurants 705 226 479 266 745Transport, storage and communications 204 124 80 109 189Banking and financial services 268 106 162 395 557Real estate, renting and business activities 468 233 235 352 587Public administration and defence 451 219 232 457 689Education 421 179 242 369 611Health and social work 656 176 480 1,013 1,493Other community, social and personal service activities
443 241 202 245 447
Industry not stated 25 12 13 16 29Total 6,372 2,524 3,848 5,172 9,020
*Includes Mining, quarrying and turf production and Electricity, gas and water supply
Level of Education
Total resident workers
Residents working outside
town
Workers living and working in
town
Workers travelling
from outside town
Working population
[A + B] [A] [B] [C] [B + C]Primary Education or none 432 136 296 254 550Lower Secondary 1,410 469 941 939 1,880Leaving Cert., Technical or Vocational 2,092 798 1,294 1,779 3,073Third level or higher 1,924 910 1,014 1,931 2,945Persons still in education (incl. not stated) 514 211 303 269 572Total 6,372 2,524 3,848 5,172 9,020
Socio-Economic Group
Total resident workers
Residents working outside
town
Workers living and working in
town
Workers travelling
from outside town
Working population
[A + B] [A] [B] [C] [B + C]A Employers and managers 861 352 509 759 1,268B Higher professional 358 179 179 270 449C Lower professional 809 387 422 1,016 1,438D Non-manual 2,283 595 1,688 1,990 3,678E Manual skilled 663 367 296 425 721F Semi-skilled 924 410 514 536 1,050G Unskilled 275 108 167 111 278H Own account workers 153 91 62 49 111Others including farmers, agricultural workers and not stated (I, J & Z) 46 35 11 16 27Total 6,372 2,524 3,848 5,172 9,020
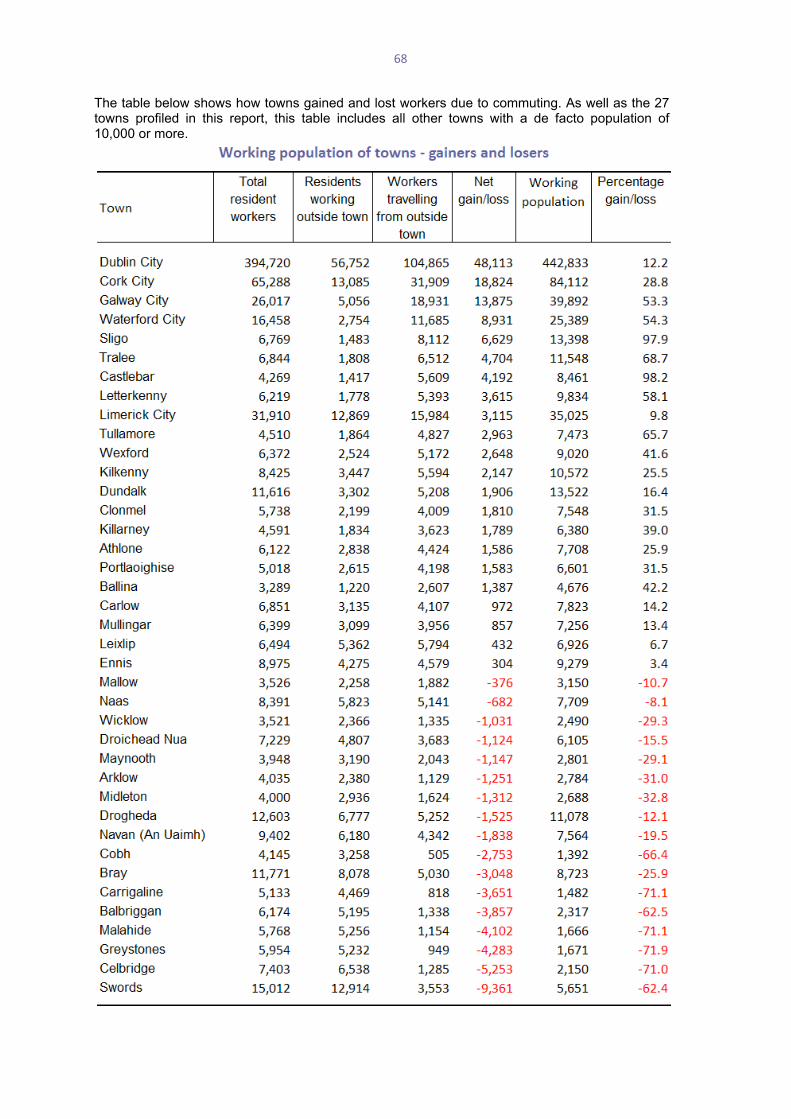
68
The table below shows how towns gained and lost workers due to commuting. As well as the 27 towns profiled in this report, this table includes all other towns with a de facto population of 10,000 or more.
69
The table highlights the ‘dormitory town’ effect around the major cities, with Celbridge, Greystones, Malahide and Balbriggan appearing as large net losers of commuters to Dulbin City. The pattern is repeated for the towns around Cork City, with significant numbers travelling from Carrigaline, Cobh and Midleton. Unsurprisingly, Dublin City was the top gainer with over 48,000 people travelling into the city to work. As a result, the towns in Dublin’s commuter belt were the losers in terms of working population. This was most pronounced in Swords with 9,361 fewer workers employed in the town than lived there (equivalent to 62.4% of Swords’ resident workers). A notable exception to this pattern was Leixlip, which in spite of losing 5,362 commuters, attracted 5,794 mainly high tech manufacturing workers. Cork, Galway and Waterford Cities were also major gainers of workers, while the number of workers in Limerick City grew by a more modest proportion (9%) due to commuter effects. Towns in the west of the country with a large rural hinterland attracted large net gains, with commuters to both Castlebar and Sligo almost doubling their respective working populations.

70

71
Appendices

Appendix 1 – 2006 Census Questionnaire
72
Appendix 1
2006 Census Questionnaire The attached extract is taken from the household form used in the 2006 Census. The household form covers 6 persons and consists of 24 pages. The attached extract covers persons 1 and 2 only. The layouts for persons 3 to 6 are identical to that for person 2, apart from the relationship question (Q3).

������ ���� �����
������������������� ������������� ����������������������������������
������������������������� �����������������������������������������������������������������������������������������������������������������������������������������������������������������������������������������������������������������������������������������
�� �������������������������������������������������������������������������������������������������� �!""#�����������������������$������������������������������������������������������������������������������������������������������������������������������������������������������������������������������
���������������%�������&�����������������������������������������������������������������������������������'������������������
���� ��������������(����������
)�����*�����)��������*������
������������������������������ ��������������������������������������������������������������������������������+#�������+,,-������������������������
&������������������������������������.�������/����
�����������0
�������������������������
���������� �������1���������������� ���������� ���������������������������� ������������������ ������ ���������������������������������������������������������������������
��� ������������&�����������0
������������������������������������������������������ ���������������������
������ ���� ����� ����� -� ������ ��� ���� ������������������������������������������� ������������
�!������������������������ ���
�"����������������� ���������� ����������������&�������������������������������������������������������2������+3��������������������������������������������������������������������������������������������������������������������2������++�2���+,,- ���������������������/4&&5$����������������������������������$����� 5$�6�7�+,,- �/4&&5$���#"89 ������ ����)�����
�������������������������������������������������+#������
5�����������'�������������������������������������+�
�����������������#0
����������:���������������;����������������������������+#���������������������<
�������������������������������������������������������������������������������������������������������+#�������
!�
+�
����������'������������������������3�������������������������������������������+#�������
����������'��������������++(+#�������������������������������� �������������������� ������������������+#�������
������������������������������� ������
#�
3�
9�
-�
# �������"�����$������
)���=�����������>�������������5�������������������
������+#�������+,,-
%���� ����������������������� ������������ �� �����
����� ������ ������ � � � � � � � � � � � � � � � � � � � � � ������
����� ���� ������
� ����� � ��������� �!����� ���������� �� ������ !���"
&������������������������������������������� ������������������������ �!""#�����������������:�������5��������;�$���� �+,,9��?������������+-�������������������� �!""# �������������������������������������� ���������� ������ ���� ����� ��� ����� ��� �������� ���������������������� �����������������������������������������@����������������������A+9 ,,,�

������ ���� �����
/������������������������������� ������������� ���
E��������������'���������������������������������������������������������������������������������������������������������������������������������������� ����������7������
# �������*���������*�-���*���.�����*������-
/�������������7��� �����0
�������������� �����0
!
+
5������
5��������
&�������������������� ����������,2��3����,24����)
5��1�� �1�
�!�����������������������%��� ������������������������
67 �&�����������.������
�
!
�8�9&2�
'���������������������"��������������������:&�;�
6<
%�
C�
!
+
�������������������� ��������������������64$�) ��������������$?C�4%�
" # � � � �
����������� ����������������������������������������
6
����������
��!��������������������!��������-
����(��������
���������:�����������������������;
! )�������
+
#
�������������������������������-
��������������������������������������������
D
�����+���-
6��(���:�����������������������������������;
-
�� ���� ��� ��������� :������������.��;������������ +�������-
����������(���������
5�������������������������������������������
3
9
����������������� ��� ������ ����������������� ��� ������� ��!�� ������������� ���
����������!������������������������������������������������������� �����������
7
!
+
#
3
9
-
D
8
"
6������!"!"
!"!"�(�!"3,��������
!"3!�(�!"-,��������
!"-!�(�!"D,��������
!"D!�(�!"8,��������
!"8!�(�!"",��������
!""!�(�!""9��������
!""-�(�+,,,��������
+,,!���������
'������������������������"���������������
=
"#��$������������ ����� �������������������� ������� ������� �
%�
C�
!
+
�!��������������������"�� ����������������������������
>
%�&'(���� �� ������! ��� �!)� ����� ��!� �� ������!����� ��������!�������!�����!������������!������� �� ���������������� ���������������������
%����� �� �����������������)� �����!����������!��������!�������� ������������� ��!���� ������
�� ��������������������� ���� ����!���� �������������
C������������
������������������� ����������� ��������������?���������������
0
3 4�������������B�������������
9 4�������������F��������6���
- 4��������������������������������B�����������������F��������6���
D 4�����������������������������������������������B����������������F��������6���
! $�����������������������������������������������������������
8 $��������������������:������ �� ���������������� �����;
+ $��������������������������������������������������������������
# 6��������������������B���������������������������5�����������
����������
# ���������������������������@��!���������������������������������
A
B ������� �
5������
5��������
5�������
!
+
#
*� ������� � �������� *����
$��
���
�����
/����������
C���
�!�������������"��������!����������"�������� ����������������������������� ����������������
C
!
+
#
3
9
����������
����������������������������������������� �����
����������� �������!������������������������������������"��
D����������
����������������5�����2���!
����������������*����E������������������B��������������������������
+
����������������*����E���������������������������������������:������������ ��� � �����;
#
��������������������������������:��������� ��� � �����(��������� �����;
3
C������������������9
E ����� ������ ���!������ ��������������������������������"������������
! 5������������������
+ �������������������
# ����������������������������������������������
3 $���������������������
9 C������������������
'���������������������"���������������#������
66
"#��$��������������� � ���� ���� �����������
%� �6�������������������
%� �����������������
C�
!
+
#

������ ���� �����
&����������������������������������������� �5�����70������
2�����"����������!������������������ �5�����70��������������������������!�������"������� ����!�������������"���������������������!����)
�C�B?)&
)$�C$���C�B?)&
�������������������������������������+#�������
����������������������������������������
���������������������������������������������������+#������<�������������������������������������B���+�������
�����������������������������������+#�������
��������������������������������������������������������������+#���������.������ ������������������������������������������B���+�������
2#5��6 &������&1�5�F������������������������������ �5�����70������
&�����F�) %������������������
670A>=
DEC6<6667
�����������������������-���������������������������������������������������+#������ ��������������������������/�������������������������������5������ �����&���������
&�������������������!��� ������������������������������ �5�����70������
2�������������������������!�������������"����������������������!���!�����,5�F�������������� �5�����70������)#���������������������������!���������"����!��� �������������������������!���!�������������������������� 5�����70������)
2#5��7 &�������,5�F�� ������������������������������ �5�����70������
&�����F�) %������������������
�����������������������-����������������������������������������+#������ �������� �����&��������������������
670A>=
��!���$����������������������������������������������������5����70���������������&����A)
(����������!��$����������������&���77� ��������������������������������������������� ����������������������������� 5�����70������)
&��������!���$�������� ������������������������������������������������� 5�����70������������������������������������2����6����"�����������&����A)
��!���$������������������������D@�E@�C����)������������#��"�����%������"������� �����������������)
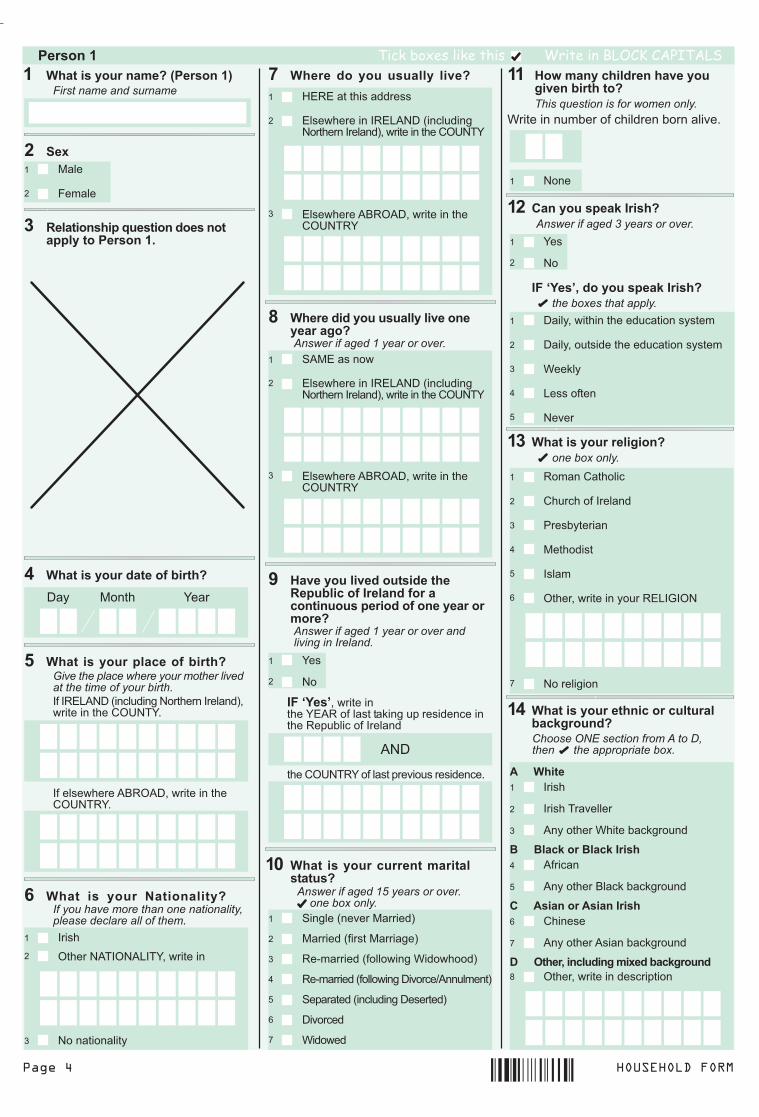
������ ���� �����
!
+
#
������ ��� ���� �������� ��"��D.&4&�������������
&������������4&B�C)�:��������C���������������; ���������������$?C�%
&���������64$�) ��������������$?C�4%
%�
C�
!
+
�"��������"��������������1��������� �#������ ��������������������� ����������������
C
+�����������,���������������������������
#%�H(��? �������������%&�4���������� ���������������������4�����������������
�C)
�����$?C�4%������������������������
��2&������
&������������4&B�C)�:��������C���������������; ���������������$?C�%
&���������64$�) ��������������$?C�4%
!
+
#
������������������������"�������������
E+�����������,�����������
����� �����������������������������
6<+�����������,-�����������������������������:������2������;
2�������:�����2�������;
4�(��������:����������E��������;
4�(��������:����������)������1��������;
����������:���������)������;
)�������
E������
!
+
#
3
9
-
D
&�����6 ������������� ��� "�� ������������������������������������:&�����6;���� ��������������
6
������������������� �������A)�� 2���� %���
2���
/�����
5�.!
+
7
����4&B�C)�:���������C���������������; ��������������$?C�%�
�������������64$�) ��������������$?C�4%�
����� ��������������� �������>.��� ����������������� �������� �� ������������ ��
=
!
+
������������� �������� ����� �!�������������� ��������
$�����C���$C�B��% ���������
����� ��� ����� F����������
C�������������#
1�����������$�����������������������&�����6)
0�����������*�#�����67+�����������/������������
#%�H(��?@������������*�#�����
%�
C�
!
+
)���� �������������������������
)���� ������������������������
E�� ��
B�������
C����
!
+
#
3
9
������� �� �����
���������������������60
!
+
#
3
9
-
D
����������
4�������������
����������������
5����������
2�������
����
$���� ��������������4&B�*�$C
C����������
�!���������������"�������"�����������
66
(��� ��� �����������������E�������������������������������������
C���!
���������������������������������*������
6A
0�����'&*��� �������+ �%! ��� ����������� �����
8 $���� ��������������������'�����G����@�����������.������*�����
,�����,���*����,���*�#�����������3
����������6��� ���� �����9
�������������������#����������-
������������������ �����D
���������������!
��������������+
����������E�������� �����#

������ ���� �����
&�����6�+��������� ������������� ��� "�� ������������������
5*������/0A����.������
# �������������������6>@7<
�"����������������� ���+��������������
77
#%�H(��?@�����������*&������������������
%�
C�
!
+
���������������������������"����������������!��*@������������������
6E
6������,-0#,
,-0#!�(�,D0,,
,D0,!�(�,D0#,
,D0#!�(�,80,,
,80,!�(�,80#,
,80#!�(�,"0,,
,"0,!�(�,"0#,
������,"0#,
C�������������
!
+
#
3
9
-
D
8
"
'���������"������������������������������ ���� �������� �������������!��������+�����������@�����������������������������
76
������������������������ �������7��������������������� ������ ��)�������������������������
%� �!(!3����������
%� �!9(+8����������
%� �+"(3+����������
%� �3#������������������
C�
!
+
#
3
9
�!�������������������"�����!��*@�������������������
6D
$������
6������
6 ���������������
����� �)�4�����B?��
2��������������������
)������������
5���������������
B�����������
$���������
E�� �����������������������
C�������������
!
+
#
3
9
-
D
8
"
!,
!!
���������!��� ������� ��� !����� ����!����������2������ ����)!�������������
:�;��6������ ��������������������������������������������
%� C�! +
:�;������������������������������������
%� C�! +
:�;��������������������������������������
%� C�! +
:�;��$���� ��������������������������
%� C�! +
:�;���������������������������������������������������������������������������� ��� ������������� ��������� �������������������
%� C�! +
'��������"������ ����� ����!�����+����������������
6>
:�;��B������� ����������������������������
%� C�! +
:�;��)����� ��������������������������������������
%� C�! +
:�;��*�����������������������������������������������H������
%� C�! +
:�;��E�� ���������@��������������������������������������
%� C�! +
:�;��5������������������������������ ������7��������������������������
%� C�! +
#%�H(��?@�������� ������������������ ������/�������6>@���������"������� ������������������ ���� ����!�������"������
6=
����������������������"���� ���������: ���+������������+����;�!�����������"�������������������
70
����������
)���������:5��);!#
5����������)������:2����;!+
5�������������������������)������!!
6������)������������5����������'�����������!,
5����������'������������:���)����������������;
"
5�������)����� �(����5���8������%������8
������2�"��C���)�����0&� ����0�� ����� �!%�����&0*+9��� � � ���(����������� ������ !&������%�����
D
! C�����������������
5���������������+
5�����2�"��B�������������0:�����9�� ������� �9.����0�� ����� �!"'$5����9.0;*�!&0<+������ ���0�� ����� �!8����;)��(�������0�� ����� ���� ������
#
?�������������05������0�� ����� ����������+��������<��� ����7����������!"+$5����!&0<+5���,0�� ����� ���� ������
3
6����?�������������������������������F����������'�����������
-
�������������F����������'�����������00���� ��+����� �������!&0<+5���=9/0�� ����� �!(������0�� ����� �9%�������� ������
9
'��������������� #1'�2�J�2$���� ������:�;�!������������������ �������������7���������������� �������
7A
#%�H(��?@��������������������������@�������:;��������������'�����������:;��������+55 ������� �� �����
%�
C�
!
+
B����������� �5�������������� �2���������������������
3
��������9
&�������!
.���������������+ ����������������5��������!��� ���!7��������!����+� �!1�������7���������+� �!%������
�����������������������16���1B��#7��������!*��������!:��������!�������!+����� ����
.�����8 ���������1�������!&������!%�� �; �����!(���������>������ � ���!7��������
��������������" ���������0���0������#�� �;�������!;����?��)���0���������
�������!, ����������� �!0� �����!;��� �!(������� !*��������� �7�� �� ���!;����� �!'����� ������� ����;��� �!1�� ������%�������
&���������� �2�������������������������-���������+���� �� ����
��������������F���������D �������������� ��!�������!��� ��� ����
��������������������I������ ������������!��*@�����������������������!����������������������*��
6C
?�� ������ ���� � �������� )���� �����2������ ��������� ���
2����
I��������
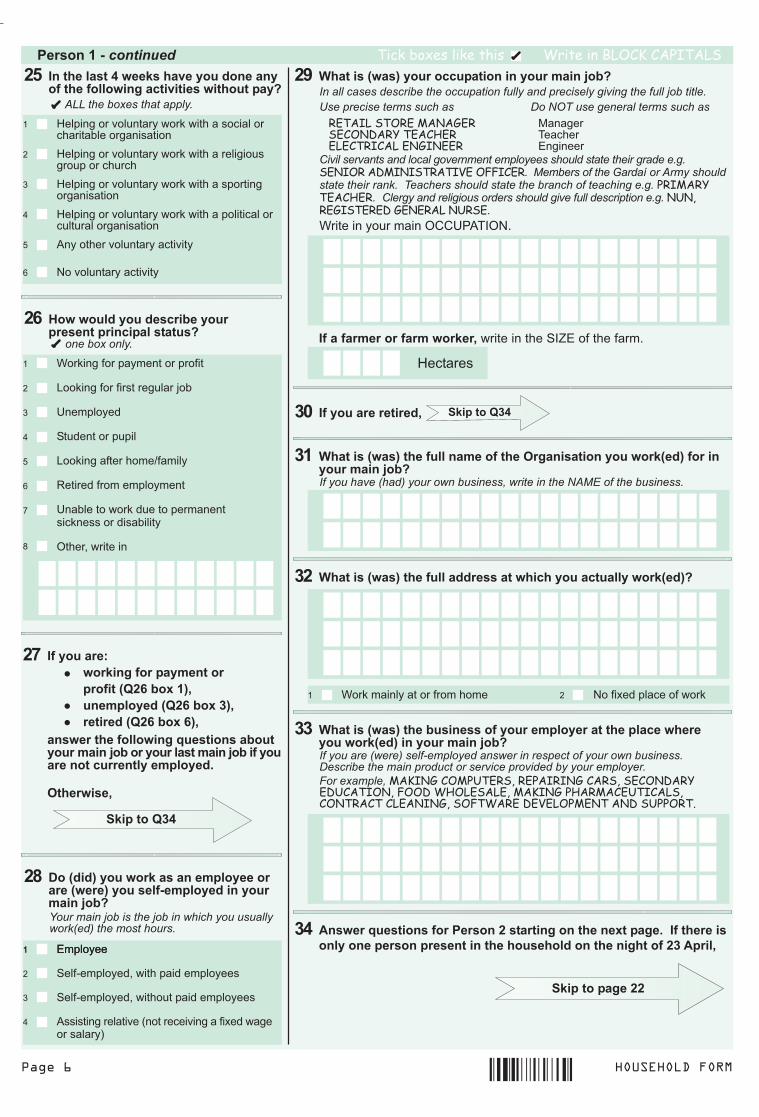
������ ���� �����
&�����6�+��������� ������������� ��� "�� ������������������
# ����������������@0< 5*������/0A
��������:!��;����� ���������������!������������������!��*:��;�07
E�� �����������������������! C����7��������������� +
��������:!��;����� ��������� �����G��������������!��*:��;� �������������I���
06�����������������������������!��� ��� ��&+1*�� �����������
��������:!��;���������������������������I���7C���������������� �������� ����������������������� ����2�� � ��3��������� ���������� %�&'(��������� �����������������������$� �%������ !��&�����'�������������� %� ���
2�������������&�������
0��������� ���������������� �������������� � � ��������������� �����!$� �������(���))�����1�������� ��.����4��+��������� � � �������)�(������������� � � ���������� ��������������$��&����'���0��������������������������������������� ������� � *��%������!�%� ����� �����E�����������������$��?5���$C�
# ��� ��������� ����!��*��@����������������G&�������������
.������
+55 ������� �� �����
#����������A�!��*����"������������� ����� ����!�������"������!�����������
7>
! .���������������������� ��������������������������������������
+ .���������������������� ����������������������������
# .���������������������� ��������������������������
3 .���������������������� ��������������������������������������
9 ���������������������������
- C�������������������
'��:���;�����!��*���������������������:!���;�������� +�������������������I���
7E
#�������2���� ��2��������������������)���� ����� ������
&�������! &�������!
����(�������� �������������������+
����(�������� ���������������������#
����������������:������������������7���������������;
3
��������:!��;�������������� ����������������������������!��������!��*:��;������������I���
00�����������������6��������������������� ������������������%������� ������������ ����������������������������������������!$��� %���$������*�������� %�����*����� !��&�!������ *�)��!�"'�������*�$��� %��'��$����������*�� ���������� � %*���)�"����!�(����$� ��� !��������+
��!���$�������� ���&�����7����������������.������)��# ��������������������������������������������������������� �70������@
0A
5*�����������77
# ��������-!��*��� ��������������� ���:/7=���.�6;@����������:/7=���.�0;@��������:/7=���.�=;@
��!������� ����!���$����������������������I��������������������I���� ����������������������������)
G����!���@
7D
5*������/0A
����������
�!�!���������������������������������������������
7=
!
+
#
3
9
-
D
8
E�� �������������������������
B�� ��������������������@��
?���������
��������������
B�� ��������������1������
4����������������������
?������������ ������������������ ���������������
$���� ���������

������ ���� �����
!
+
#
������ ��� ���� �������� ��"��D.&4&�������������
&������������4&B�C)�:��������C���������������; ���������������$?C�%
&���������64$�) ��������������$?C�4%
%�
C�
!
+
�"��������"��������������1��������� �#������ ��������������������� ����������������
C
+�����������,���������������������������
#%�H(��? �������������%&�4���������� ���������������������4�����������������
�C)
�����$?C�4%������������������������
��2&������
&������������4&B�C)�:��������C���������������; ���������������$?C�%
&���������64$�) ��������������$?C�4%
!
+
#
������������������������"�������������
E+�����������,�����������
����� �����������������������������
6<+�����������,-�����������������������������:������2������;
2�������:�����2�������;
4�(��������:����������E��������;
4�(��������:����������)������1��������;
����������:���������)������;
)�������
E������
!
+
#
3
9
-
D
&�����7 ������������� ��� "�� ������������������������������������:&�����7;���� ��������������
6
������������������� �������A)�� 2���� %���
2���
/�����
5�.!
+
7
����4&B�C)�:���������C���������������; ��������������$?C�%�
�������������64$�) ��������������$?C�4%�
����� ��������������� �������>.��� ����������������� �������� �� ������������ ��
=
!
+
������������� �������� ����� �!�������������� ��������
$�����C���$C�B��% ���������
����� ��� ����� F����������
C�������������#
����� �������� ������������ ��&�����6�
0
����������;�������������)�����
.������������
5������
��������������
����(�����
6��������������
2���������������
����(������1(������
���(1�������(��(���
*���������
$������������
?��������:��������������������;
4�������������5&4�$C�+��� 5����
!
+
#
3
9
-
D
8
"
!,
!!
�����������*�#�����67+�����������/������������
#%�H(��?@������������*�#�����
%�
C�
!
+
)���� �������������������������
)���� ������������������������
E�� ��
B�������
C����
!
+
#
3
9
������� �� �����
���������������������60
!
+
#
3
9
-
D
����������
4�������������
����������������
5����������
2�������
����
$���� ��������������4&B�*�$C
C����������
!
�!���������������"�������"�����������
66
(��� ��� �����������������E�������������������������������������
C���!
���������������������������������*������
6A
0�����'&*��� �������+ �%! ��� ����������� �����
8 $���� ��������������������'�����G����@�����������.������*�����
,�����,���*����,���*�#�����������3
����������6��� ���� �����9
�������������������#����������-
������������������ �����D
���������������!
��������������+
����������E�������� �����#

������ ���� �����
&�����7�+��������� ������������� ��� "�� ������������������
5*������/0A����.������
# �������������������6>@7<
�"����������������� ���+��������������
77
#%�H(��?@�����������*&������������������
%�
C�
!
+
���������������������������"����������������!��*@������������������
6E
6������,-0#,
,-0#!�(�,D0,,
,D0,!�(�,D0#,
,D0#!�(�,80,,
,80,!�(�,80#,
,80#!�(�,"0,,
,"0,!�(�,"0#,
������,"0#,
C�������������
!
+
#
3
9
-
D
8
"
'���������"������������������������������ ���� �������� �������������!��������+�����������@�����������������������������
76
������������������������ �������7��������������������� ������ ��)�������������������������
%� �!(!3����������
%� �!9(+8����������
%� �+"(3+����������
%� �3#������������������
C�
!
+
#
3
9
�!�������������������"�����!��*@�������������������
6D
$������
6������
6 ���������������
����� �)�4�����B?��
2��������������������
)������������
5���������������
B�����������
$���������
E�� �����������������������
C�������������
!
+
#
3
9
-
D
8
"
!,
!!
���������!��� ������� ��� !����� ����!����������2������ ����)!�������������
:�;��6������ ��������������������������������������������
%� C�! +
:�;������������������������������������
%� C�! +
:�;��������������������������������������
%� C�! +
:�;��$���� ��������������������������
%� C�! +
:�;���������������������������������������������������������������������������� ��� ������������� ��������� �������������������
%� C�! +
'��������"������ ����� ����!�����+����������������
6>
:�;��B������� ����������������������������
%� C�! +
:�;��)����� ��������������������������������������
%� C�! +
:�;��*�����������������������������������������������H������
%� C�! +
:�;��E�� ���������@��������������������������������������
%� C�! +
:�;��5������������������������������ ������7��������������������������
%� C�! +
#%�H(��?@�������� ������������������ ������/�������6>@���������"������� ������������������ ���� ����!�������"������
6=
����������������������"���� ���������: ���+������������+����;�!�����������"�������������������
70
����������
)���������:5��);!#
5����������)������:2����;!+
5�������������������������)������!!
6������)������������5����������'�����������!,
5����������'������������:���)����������������;
"
5�������)����� �(����5���8������%������8
������2�"��C���)�����0&� ����0�� ����� �!%�����&0*+9��� � � ���(����������� ������ !&������%�����
D
! C�����������������
5���������������+
5�����2�"��B�������������0:�����9�� ������� �9.����0�� ����� �!"'$5����9.0;*�!&0<+������ ���0�� ����� �!8����;)��(�������0�� ����� ���� ������
#
?�������������05������0�� ����� ����������+��������<��� ����7����������!"+$5����!&0<+5���,0�� ����� ���� ������
3
6����?�������������������������������F����������'�����������
-
�������������F����������'�����������00���� ��+����� �������!&0<+5���=9/0�� ����� �!(������0�� ����� �9%�������� ������
9
'��������������� #1'�2�J�2$���� ������:�;�!������������������ �������������7���������������� �������
7A
#%�H(��?@��������������������������@�������:;��������������'�����������:;��������+55 ������� �� �����
%�
C�
!
+
B����������� �5�������������� �2���������������������
3
��������9
&�������!
.���������������+ ����������������5��������!��� ���!7��������!����+� �!1�������7���������+� �!%������
�����������������������16���1B��#7��������!*��������!:��������!�������!+����� ����
.�����8 ���������1�������!&������!%�� �; �����!(���������>������ � ���!7��������
��������������" ���������0���0������#�� �;�������!;����?��)���0���������
�������!, ����������� �!0� �����!;��� �!(������� !*��������� �7�� �� ���!;����� �!'����� ������� ����;��� �!1�� ������%�������
&���������� �2�������������������������-���������+���� �� ����
��������������F���������D �������������� ��!�������!��� ��� ����
��������������������I������ ������������!��*@�����������������������!����������������������*��
6C
?�� ������ ���� � �������� )���� �����2������ ��������� ���
2����
I��������

������ ���� �����
&�����7�+��������� ������������� ��� "�� ������������������
# ����������������@0< 5*������/0A
��������:!��;����� ���������������!������������������!��*:��;�07
E�� �����������������������! C����7��������������� +
��������:!��;����� ��������� �����G��������������!��*:��;� �������������I���
06�����������������������������!��� ��� ��&+1*�� �����������
��������:!��;���������������������������I���7C���������������� �������� ����������������������� ����2�� � ��3��������� ���������� %�&'(��������� �����������������������$� �%������ !��&�����'�������������� %� ���
2�������������&�������
0��������� ���������������� �������������� � � ��������������� �����!$� �������(���))�����1�������� ��.����4��+��������� � � �������)�(������������� � � ���������� ��������������$��&����'���0��������������������������������������� ������� � *��%������!�%� ����� �����E�����������������$��?5���$C�
# ��� ��������� ����!��*��@����������������G&�������������
.������
+55 ������� �� �����
#����������A�!��*����"������������� ����� ����!�������"������!�����������
7>
! .���������������������� ��������������������������������������
+ .���������������������� ����������������������������
# .���������������������� ��������������������������
3 .���������������������� ��������������������������������������
9 ���������������������������
- C�������������������
'��:���;�����!��*���������������������:!���;�������� +�������������������I���
7E
#�������2���� ��2��������������������)���� ����� ������
&�������! &�������!
����(�������� �������������������+
����(�������� ���������������������#
����������������:������������������7���������������;
3
��������:!��;�������������� ����������������������������!��������!��*:��;������������I���
00�����������������6��������������������� ������������������%������� ������������ ����������������������������������������!$��� %���$������*�������� %�����*����� !��&�!������ *�)��!�"'�������*�$��� %��'��$����������*�� ���������� � %*���)�"����!�(����$� ��� !��������+
��!���$�������� ���&�����0����������������.������)��# ���������������!�������������������������������������������� �70������@
0A
5*�����������77
# ��������-!��*��� ��������������� ���:/7=���.�6;@����������:/7=���.�0;@��������:/7=���.�=;@
��!������� ����!���$����������������������I��������������������I���� ����������������������������)
G����!���@
7D
5*������/0A
����������
�!�!���������������������������������������������
7=
!
+
#
3
9
-
D
8
E�� �������������������������
B�� ��������������������@��
?���������
��������������
B�� ��������������1������
4����������������������
?������������ ������������������ ���������������
$���� ���������
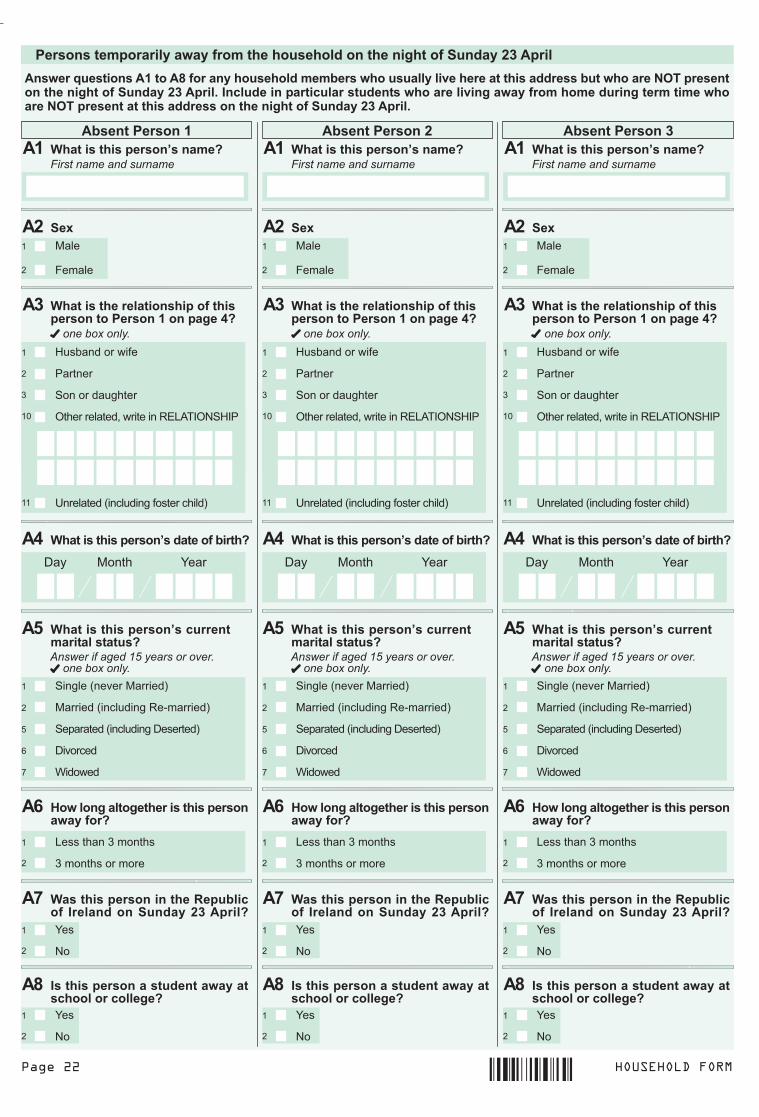
������� ���� �����
&�������������������!��� ������������������������������ �5�����70������
��!���$���������6�����E� ������������������������!�������������"���������������������������!�������FG�������������������� �5�����70������)�#���������������������������!���������"����!��� �������������������������!������FG������������������������������������� �5�����70������)
������&�����0������&�����7������&�����6������������������?�������6���� ��������������
5�.�72���
/�����
!
+
#�����������������������!�����������������������
�E
%�
C�
!
+
���������������������1�������� � #��������5�����70�������
�D
%�
C�
!
+
������������������?�����������������������
�>+�����������,-����������������������
�������:������2������;
2�������:���������4�(�������;
����������:���������)������;
)�������
E������
!
+
9
-
D
�A ������������������?�������� �������
)�� 2���� %���
������������������������� ��������������&�����6��������A�
�0
����������
.������������
5������
��������������
$������������ ����������4&B���$C�.�5
?���������:��������������������;
!
+
#
!,
!!
������������������?�������6���� ��������������
5�.�72���
/�����
!
+
#�����������������������!�����������������������
�E
%�
C�
!
+
���������������������1�������� � #��������5�����70�������
�D
%�
C�
!
+
������������������?�����������������������
�>+�����������,-����������������������
�������:������2������;
2�������:���������4�(�������;
����������:���������)������;
)�������
E������
!
+
9
-
D
�A ������������������?�������� �������
)�� 2���� %���
������������������������� ��������������&�����6��������A�
�0
����������
.������������
5������
��������������
$������������ ����������4&B���$C�.�5
?���������:��������������������;
!
+
#
!,
!!
�!������������������������������!��� ���
�=
B�������#������
#��������������
!
+
�!������������������������������!��� ���
�=
B�������#������
#��������������
!
+
�!������������������������������!��� ���
�=
B�������#������
#��������������
!
+
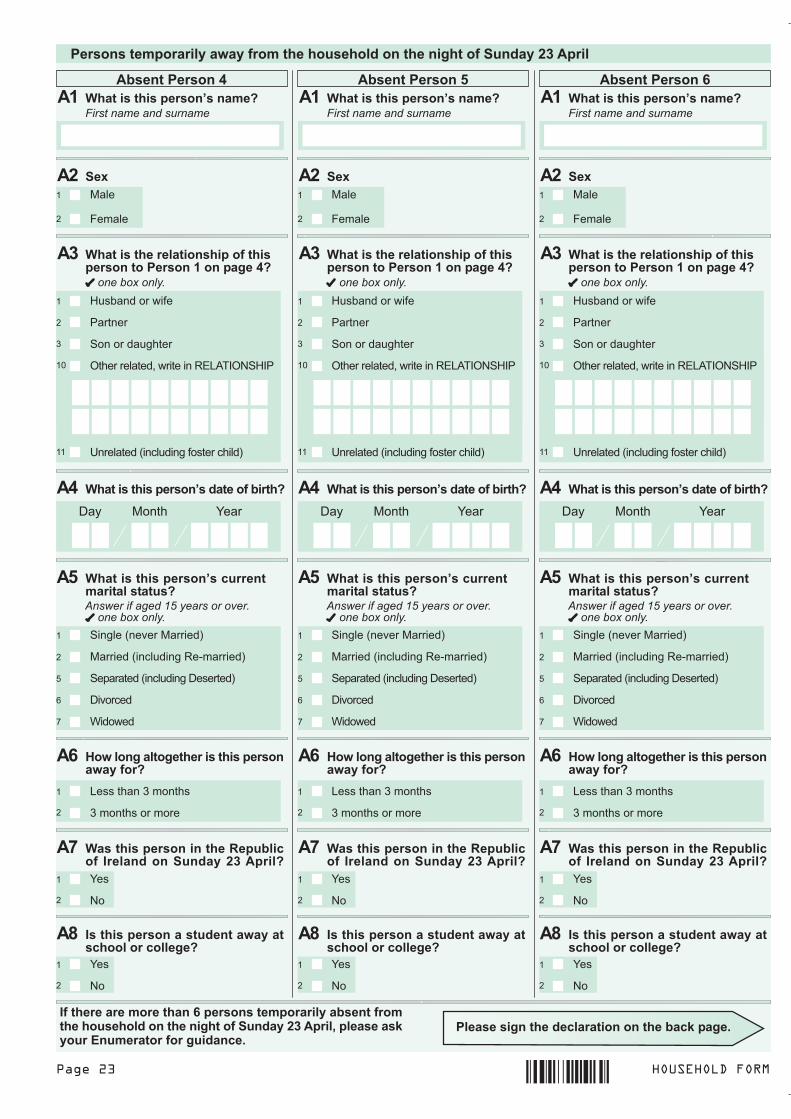
������� ���� �����
&�������������������!��� ������������������������������ �5�����70������
# ��������������������=�������������������������� ����������������������������� �5�����70������@����������*��������������� ����������)
������&�����A ������&�����=������&�����>������������������?�������6���� ��������������
5�.�72���
/�����
!
+
#�����������������������!�����������������������
�E
%�
C�
!
+
���������������������1�������� � #��������5�����70�������
�D
%�
C�
!
+
������������������?�����������������������
�>+�����������,-����������������������
�������:������2������;
2�������:���������4�(�������;
����������:���������)������;
)�������
E������
!
+
9
-
D
�A ������������������?�������� �������
)�� 2���� %���
������������������������� ��������������&�����6��������A�
�0
����������
.������������
5������
��������������
$������������ ����������4&B���$C�.�5
?���������:��������������������;
!
+
#
!,
!!
������������������?�������6���� ��������������
5�.�72���
/�����
!
+
#�����������������������!�����������������������
�E
%�
C�
!
+
���������������������1�������� � #��������5�����70�������
�D
%�
C�
!
+
������������������?�����������������������
�>+�����������,-����������������������
�������:������2������;
2�������:���������4�(�������;
����������:���������)������;
)�������
E������
!
+
9
-
D
�A ������������������?�������� �������
)�� 2���� %���
������������������������� ��������������&�����6��������A�
�0
����������
.������������
5������
��������������
$������������ ����������4&B���$C�.�5
?���������:��������������������;
!
+
#
!,
!!
&����������������������������������*�����)
�!������������������������������!��� ���
�=
B�������#������
#��������������
!
+
�!������������������������������!��� ���
�=
B�������#������
#��������������
!
+
�!������������������������������!��� ���
�=
B�������#������
#��������������
!
+

������� ���� �����
'�������������������������������������������������� ����������������� ���
���������������������������������������������������������������� ��������������������
(�����"���!��������������������� ���)
���*����� ����������+��������)
��������
'������������������������������������������ ������������������������ ���
,� ��������������������������������������*-
���������������������������'�������������������������������������+�
��������B���!���������# ��������������������������������:���������������;�����������������������������+#���������������������:�����������������������-������������� ������������������������������������������������/���;�
�������������������������'�����������������������������������������������������������������������������+#����������������������:�����3(+!;�
��������B���+���������# ����������������������������������������������������������������������������������������������������������+#�������:�����������������������-������������ �������� �����&��������������������;�
�������������������������'��������������++(+#�������������������������������������������������������������������������������+#�������
�����������������������������������������������
4�����������'����������������������5�����!
/������������������������������9������ �����������������5�����!��������������� �������'������������������������������������������������������������/�����������������������-�������������� �5�����9�����������������'����������������������������������5�����!(3������
�����7������������������������������������������������'�������������������������������0�.�����2���� ��������������� ����������������������������������������������:������������������;�
�.������+�/�������0�+� ��������������������������1������������!��������� ��������
���������� ��� ��� ��� ��� ���� �������
.������������
5������
��������������
����(�����
6��������������
2���������������
����(������1(������
���(1�������(��(���
*���������
$������������
?��������:��������� ������ �����;
4�������������5&4�$C�3���
5����
!
+
#
3
9
-
D
8
"
!,
!!
C�������5�����3
! + #
� �������� ��� ��� ��� ��� ���� �������
.������������
5������
��������������
����(�����
6��������������
2���������������
����(������1(������
���(1�������(��(���
*���������
$������������
?��������:��������� ������ �����;
4�������������5&4�$C�#���
5����
!
+
#
3
9
-
D
8
"
!,
!!
C�������5�����#
! +
�����������������������
.������������
5������
��������������
����(�����
6��������������
2���������������
����(������1(������
���(1�������(��(���
*���������
$������������
?��������:��������� ������ �����;
4�������������5&4�$C�+���
5����
!
+
#
3
9
-
D
8
"
!,
!!
C�������5�����+
!
�� ��������

Appendix 2 – Definitions
85
Appendix 2
Definitions Towns For census purposes towns fall into two types, namely those with and those without legally defined boundaries. Towns with legally defined boundaries consist of:
(1) five Cities; (2) five Boroughs; (3) 75 Towns.
Towns without legally defined boundaries are called "census towns". Their boundaries are determined, for census purposes only, by the Central Statistics Office. There were 664 such towns in 2006. (i) Towns with Legally Defined Boundaries
In the case of towns with legally defined boundaries it is necessary, for administrative purposes, to compile population figures for the areas within these boundaries. However, many of these towns have expanded beyond their legally defined boundaries. This report is concerned with the overall size of population clusters and not simply with areas within legally defined boundaries. Consequently, where urban areas have extended beyond the legally defined town boundary, the Central Statistics Office has drawn up new boundaries defining the suburban areas of Cities/Boroughs and environs of other legal towns for census purposes. Suburbs/environs are defined, in conformity with United Nations recommendations, as the continuation of a distinct population cluster outside its legally defined boundary in which no occupied dwelling is more than 200 metres distant from the nearest occupied dwelling. New suburbs or environs are defined only where there are at least twenty occupied dwellings outside the legal boundary within the new limit. In applying the 200-metre criterion, industrial, commercial and recreational buildings and facilities are not regarded as breaking the continuity of a built-up area.
(ii) Census Towns
As in censuses since 1971, a census town is defined as a cluster of fifty or more occupied dwellings, not having a legally defined boundary, in which within a distance of 800 metres there is a nucleus of either thirty occupied houses on both sides of the road or twenty occupied houses on one side of the road. A complete review was carried out of the boundaries of existing and potential census towns as part of the processing phase of the 2006 Census. In this review the limits to existing census towns were extended where appropriate using the 200-metre criterion as described for suburban areas above.
For the purposes of the present report legal towns have been combined with their suburbs/environs and no distinction has been made between legal towns and census towns. All towns with over 5,000 persons employed in April 2006 are profiled.

Appendix 2 – Definitions
86
Industry The 2006 Census coded industry using NACE – the General Industrial Classification of Economic Activities within the European Communities. NACE Rev. 1 is a 4-digit activity classification that was drawn up in 1990 and is a revision of the version originally published by Eurostat in 1970. NACE is a hierarchical classification, with 60 2-digit codes, 222 codes at 3-digit level and 503 at 4-digit level. For a detailed description of NACE codes used in Census 2006, please refer to Census 2006 Volume 7 – Principal Economic Status and Industries (see http://www.cso.ie/census/Census2006_Volume7.htm). The industry in which a person is engaged is determined (whatever the occupation) by the main economic activity carried out in the local unit in which he or she works. A manufacturing or commercial unit may employ persons with many different occupations for the purpose of making a particular product or for giving a particular service. A hospital is also a good example, with persons in medical occupations employed alongside persons of other occupations e.g. cleaners, management, clerical staff. Conversely, there are cases in which particular occupations are largely confined to a single industry. For example, the majority of persons with agricultural occupations are in the agriculture industry and most miners are in the mining industry. The term ‘industry’ used for Census of Population purposes is not confined to manufacturing industry. It is synonymous with the term “sector of economic activity”. The basis of the industrial classification is, in the case of employees, the business or profession of their employer and in the case of self-employed persons, the nature of their own business or profession. Socio-economic Group The entire population was classified to one of ten specific socio-economic groups (introduced in 1996). In addition a residual group entitled “All others gainfully occupied and unknown” was used where sufficient details were not provided. The classification aims to bring together persons with similar social and economic statuses on the basis of the level of skill or educational attainment required. In defining socio-economic group no attempt is made to rank groups in order of socio-economic importance. The detailed classification used for determining the socio-economic group of all persons at work, unemployed or retired is given in Appendix 6 of Census 2006 Volume 8 – Occupations (see http://www.cso.ie/census/census2006_volume8.htm). The socio-economic groups used in the census are as follows: A Employers and managers B Higher professional C Lower professional D Non-manual E Manual skilled F Semi-skilled G Unskilled H Own account workers I Farmers J Agricultural workers Z All others gainfully occupied and unknown