Published by the Stationery Office, Dublin, Ireland. To be ... · Published by the Stationery...
33
Published by the Stationery Office, Dublin, Ireland. To be purchased from the: Central Statistics Office, Information Section, Skehard Road, Cork, Government Publications Sales Office, Sun Alliance House, Molesworth Street, Dublin 2, or through any bookseller. Prn A9/1853 Price €10.00 December 2009
Transcript of Published by the Stationery Office, Dublin, Ireland. To be ... · Published by the Stationery...
Published by the Stationery Office, Dublin, Ireland.
To be purchased from the:
Central Statistics Office, Information Section, Skehard Road, Cork,
Government Publications Sales Office, Sun Alliance House,Molesworth Street, Dublin 2,
or through any bookseller.
Prn A9/1853 Price €10.00 December 2009

© Government of Ireland 2009
Material compiled and presented by theCentral Statistics Office.
Reproduction is authorised, except for commercialpurposes, provided the source is acknowledged.
ISBN 978-1-4064-2351-8
Contents
Page
Introduction 5
Tables
Table 1 Net Capital Stock Held at End of Year by Type of Industry at Current Market Prices 12
Table 2 Net Capital Stock Held at End of Year by Type of Industry at Constant Market Prices (base 2007)
13
Table 3 Net Capital Stock Held at End of Year by Asset at Current Market Prices 14
Table 4 Net Capital Stock Held at End of Year by Asset at Constant Market Prices (base 2007) 15
Table 5 Gross Capital Stock Held at End of Year by Type of Industry at Current Market Prices 16
Table 6 Gross Capital Stock Held at End of Year by Type of Industry at Constant Market Prices (base 2007)
17
Table 7 Gross Capital Stock Held at End of Year by Asset at Current Market Prices 18
Table 8 Gross Capital Stock Held at End of Year by Asset at Constant Market Prices (base 2007) 19
Table 9 Consumption of Fixed Capital by Type of Industry at Current Market Prices 20
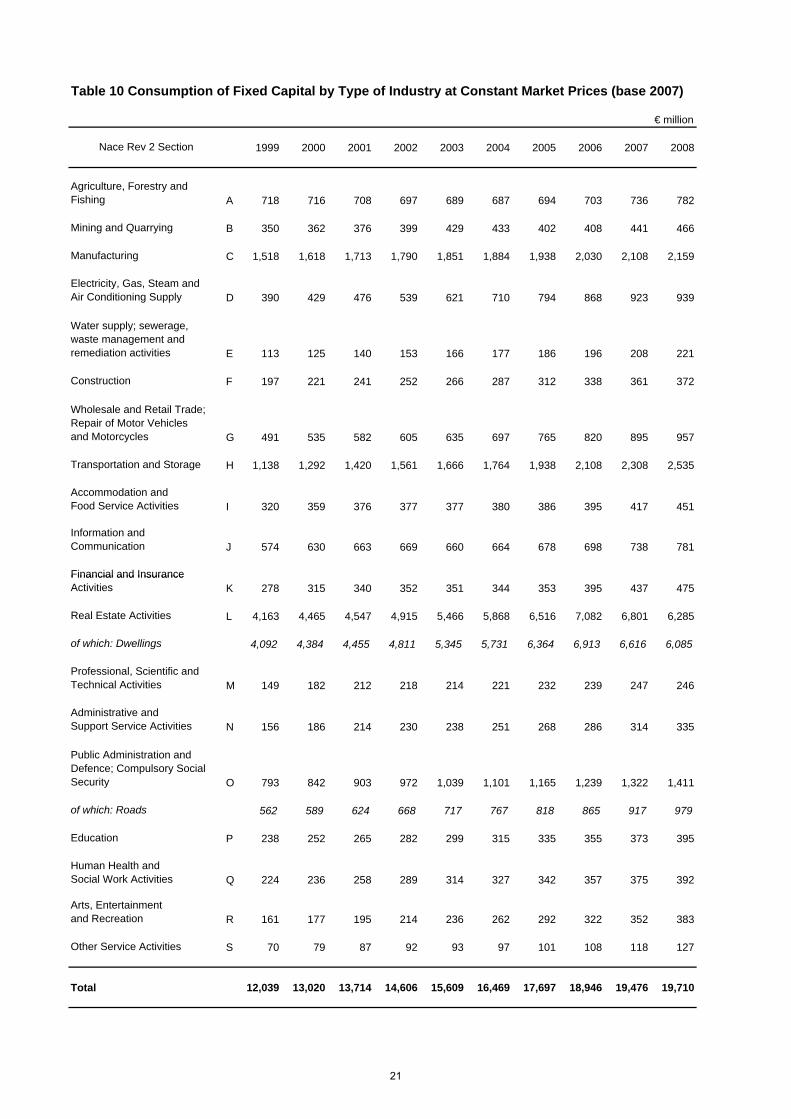
Table 10 Consumption of Fixed Capital by Type of Industry at Constant Market Prices (base 2007)
21
Table 11 Consumption of Fixed Capital by Asset at Current Market Prices 22
Table 12 Consumption of Fixed Capital by Asset at Constant Market Prices (base 2007) 23
Table 13 Net Capital Stock Held at End of Year by Type of Industry and Asset at Current Market Prices 2008
24
Table 14 Gross Capital Stock Held at End of Year by Type of Industry and Asset at Current Market Prices 2008
25
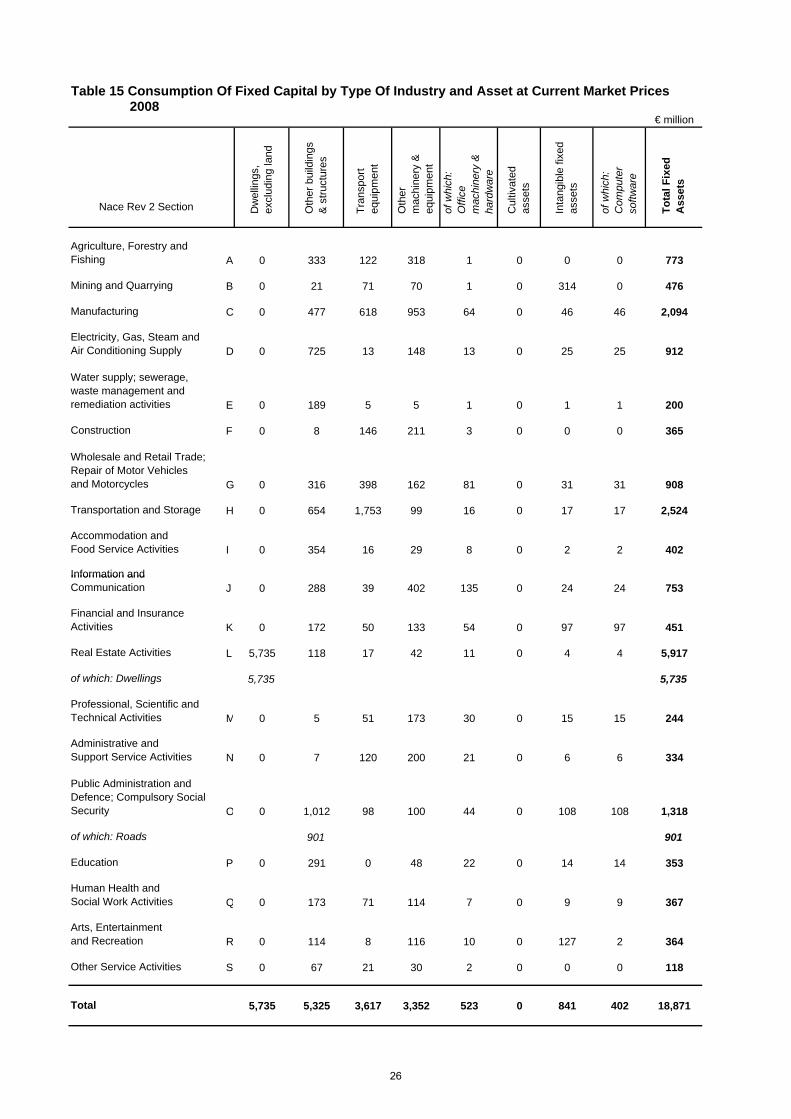
Table 15 Consumption of Fixed Capital by Type of Industry and Asset at Current Market Prices 2008
26
Appendix Appendix 1 Average Service Lives 29
3


Introduction
This report presents the first estimates produced by the Central Statistics Office (CSO) of the stock of fixed assets in Ireland. Estimates are provided of the stock of assets in existence at the end of each year from 1999 to 2008 inclusive1. Estimates were formerly compiled by the Economic and Social Research Institute, the most recent estimate being that published in 1989 in their publication entitled “The capital stock of Ireland 1950 to 1984”. The results which follow are prepared in compliance with ESA regulation 2223/96 on National Accounts which stipulates that estimates of the stock of capital assets should be available in all member states annually.
Fixed Assets
The assets covered in these tables relate to Produced Fixed Assets as defined in the European System of Accounts (ESA95). Produced fixed assets are assets which result from human effort. They exclude natural assets such as land, mineral deposits etc. They also exclude legal constructs such as patents, leases etc. Produced fixed assets comprise
• Dwellings and other buildings and structures (excluding the land on which they are built) • Machinery and equipment (including transport equipment) • Cultivated assets (e.g. Livestock for breeding such as dairy cattle etc.) • Intangible fixed assets (only a limited number of intangibles are recognised in the ESA 95
classification i.e. Computer software, Original works of art including musical and literary works, Mineral exploration)
Gross / Net
The two most common valuation methods for fixed capital assets are Gross and Net. The gross capital stock represents the value of the stock still in use (i.e. not retired or scrapped) and valued at the price of new capital goods. The term Gross means gross of consumption of fixed capital (the national accounts term for depreciation). Thus the gross stock of assets ignores decay of assets and considers past investments as new – only retirement is taken into account. In practice fixed assets normally decline in value over time due to factors such as wear and tear and obsolescence. Taking this declining value into account together with retirements give rise to the Net value of the stock of assets. Estimates are provided in this report using both valuation concepts.
Current and Constant prices
The stock of assets is generally valued in current and constant prices. Valuation in current prices implies that all the assets accumulated over the years are valued at the prices obtaining in the year for which the estimates are given. In the case of the gross stock this is the price of new assets. In the case of the net stock it is the written down price of assets. Valuation at constant prices represents the stock of capital assets in the price of the stated reference year (2007 in these tables).
Methodology
There is no readily available source for the value of the stock of assets as defined above for statistical purposes. In company accounts assets are generally priced at historical prices i.e. at the prices obtaining in the years in which they were purchased. Thus the resulting accumulated stock is a sum of values in prices obtaining in different years. This situation has led to countries developing their statistical estimates of the stock of assets by a modelling exercise, referred to as the Perpetual Inventory Method (PIM). Around the time the CSO embarked on this exercise the OECD had 1 Similar data is available in the CSO’s databank for the years 1985 onwards. This can be accessed through the CSO’s web page www.cso.ie.
5
recently examined the best methodologies in its member countries and with the expertise and research of its statistical directorate had compiled a manual on the compilation of capital stock and related productivity measurement viz. Measuring Capital, October 2007, OECD. The guidelines in this manual were followed in compiling the estimates in this report and the manual proved invaluable as a guide in producing the CSO’s first estimates of capital stocks.
Perpetual inventory method (PIM)
The perpetual inventory method accumulates past investments to form the stock of assets. Estimates of capital stocks are made within the national accounts framework. Consequently the estimates of gross fixed capital formation which were used in the compilation of GDP form the historical series of investments.
The Gross stock of assets can be expressed as follows
Gross stock at time g
Where
= the gross fixed capital formation in year t-j
g = the proportion of the gross fixed capital formation still in use after j years
= twice the average lifetime of the fixed asset
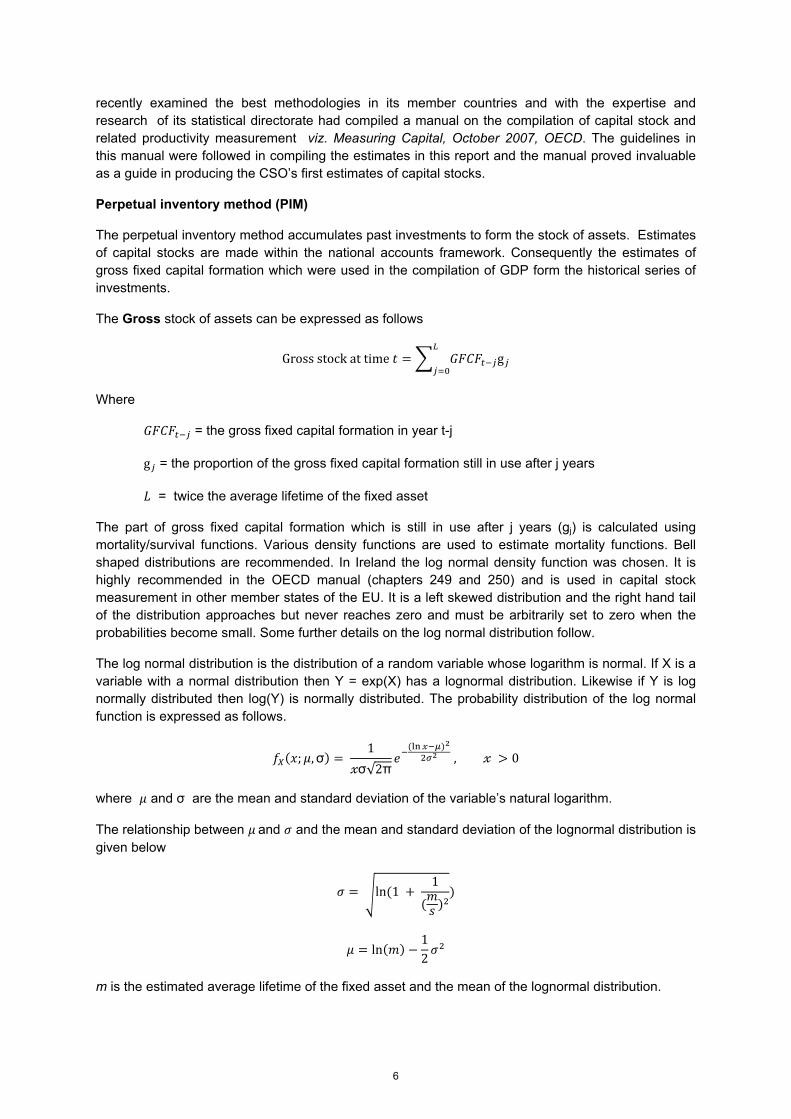
The part of gross fixed capital formation which is still in use after j years (gj) is calculated using mortality/survival functions. Various density functions are used to estimate mortality functions. Bell shaped distributions are recommended. In Ireland the log normal density function was chosen. It is highly recommended in the OECD manual (chapters 249 and 250) and is used in capital stock measurement in other member states of the EU. It is a left skewed distribution and the right hand tail of the distribution approaches but never reaches zero and must be arbitrarily set to zero when the probabilities become small. Some further details on the log normal distribution follow.
The log normal distribution is the distribution of a random variable whose logarithm is normal. If X is a variable with a normal distribution then Y = exp(X) has a lognormal distribution. Likewise if Y is log normally distributed then log(Y) is normally distributed. The probability distribution of the log normal function is expressed as follows.
; ,σ 1
σ√2π , 0
where and σ are the mean and standard deviation of the variable’s natural logarithm.
The relationship between and and the mean and standard deviation of the lognormal distribution is given below
ln 1 1
ln12
m is the estimated average lifetime of the fixed asset and the mean of the lognormal distribution.
6

s (where s2 is the variance of the lognormal distribution) controls the flatness of the distribution curve and is generally a value between m/2 and m/4 in the context of mortality functions. The value m/3 was used for all types of fixed assets in Ireland with the exception of dwellings and public administration offices. In those cases a value of m/1.5 was assigned to s which maintained consistency with the series of net capital assets described below.
The Net stock of assets is calculated using geometric depreciation as highly recommended in the OECD manual (e.g. paragraphs 7, 181 etc.). Accordingly if It is the investment in year t in a particular asset group then the net stock of assets at the end of period t (WtE) can be expressed as follows
W E 1 2 1 1 … … . .
where ∂ is the annual rate of depreciation (or consumption of fixed capital) for the category of investment good in question. It is assumed that investment takes place throughout the year and that by the end of the year depreciation for a half of a year is appropriate for the year in which the investment was made. Hence the term (1- ∂/2) is the first term in the formula. The rate of depreciation has generally been assumed to be 2/m where m is the average life of the asset (in years). In other words double declining geometric depreciation has been used. An exception to this general rule has been made in the case of dwellings and public administration office buildings due to the extended life of some dwellings, a minority of which can be in existence for over two hundred years. In the cases of dwellings and public administration office buildings a declining geometric depreciation at a rate of 1.3 divided by the average lifetime of these assets was used.
Re pricing of investments
It can be seen from the above that the PIM involves accumulating assets acquired over a number of years. For the resultant total to be meaningful all of the assets have to be valued in the prices of a common year. The stock of assets is generally presented for a number of years as a series. They are shown in current or constant prices. The series in current prices shows for each year the value of the stocks at the end of each year priced in the average prices of the year in question. The series in constant prices shows for each year the stock at the end of each year valued at the prices of the reference year (2007 in this report). In this latter case any change in the level of the series from year to year is not affected by changes in the prices of the assets.
Availability of investment series
In general investment series were available for a long enough period to enable the stock of assets in each category to be built up from the series of investments in the preceding years. The main exceptions to this where the historical series were not available for a sufficiently long period were
• Dwellings • Roads • Buildings • Rail transport equipment • Aircraft
These assets have particularly long lives which make consequential demands for correspondingly long historical series of investments. A solution was found for each of the above categories of assets. In the case of dwellings the stock in the year 1949 was taken from the ESRI’s estimate for the years 1950 to 1984 as published in 1989. This stock of dwellings (i.e. the stock in existence up and including 1949) was then updated in value allowing for depreciation, retirements and change in value. The standard methods of using the log normal function for retirements and geometric depreciation were used for this purpose. Alongside this exercise dwellings built since 1950 were dealt with similarly
7

to other assets in the new series (i.e. GFCF in dwellings was taken from the national accounts, depreciated using geometric depreciation and retired using log normal retirement functions). Results of the exercise show that in 2008, the earlier stock dating back to 1950 and former years only represents about 6% of the total stock of dwellings so that its importance in the overall estimate is fairly limited. [It should of course be understood here that the stock of dwellings being measured only includes the buildings themselves and takes no account of the site or property on which they are built.]
A similar approach was adopted in the case of roads. Roads built prior to 1950 or previous years were valued from the ESRI survey. They were updated for depreciation and change in values in the usual way. The stock of roads which were built post 1949 were evaluated using annual data on GFCF in roads, the perpetual inventory method, geometric depreciation etc. Here again the pace of road building in the last fifty years, similar to construction of houses , has been so rapid that the stock of roads built prior to 1950 only accounts in 2008 for about 11% of the total road stock in the country.
This general approach of using data in the ESRI report for stocks in existence prior to 1950 while accumulating the stock of assets built since 1950 using GFCF data was adopted for building and construction work in the following sectors:
• Offices • Commercial buildings • Hospitals and buildings for special care • Communications • Religion • Education • Amusement and recreational activities
In other sectors which were controlled by monopolies at the time it was possible to obtain historical data from the enterprises involved. An example of this is CIE who provided data on investment in rolling stock. We take this opportunity to express our thanks to these organisations for the help they gave us in providing historical data to make the estimation procedure possible.
Availability of price indices
Reference was made in an earlier paragraph to the need to reprice the assets in order that assets accumulated over a number of years can be summed in value in a meaningful way. The repricing is done by means of suitable price indices. For some of the asset categories (e.g. cars, machinery and equipment) distinguished in this report price indices are readily available in the CSO’s wholesale price index series. However for others it is not so straightforward and substitutes had to be used where exact indices were not available. For example, the WPI for transportable capital had to be used in years prior to 1975 for commercial vehicles as a specific price index for commercial vehicles was not available in the early years.
In the case of housing and building, official price indices do not exist. However deflators have been available for national accounts purposes from the Department of Environment for the purposes of bringing the GFCF to constant prices and these have been used in this exercise on the stock of assets.
NACE Sectors
Results are provided in this report by NACE sector. These are effectively the sectors of use in the sense that machinery hired out to a particular sector is assigned to the company which uses the machines rather than to the company which hires them out (e.g. machinery hired from a finance company to the construction industry will be assigned to the construction sector). The NACE
8
classification system is in a transitional phase currently. A new NACE Rev 2 system is in operation for all statistics now being collected. The former NACE Rev 1 system is still used for many datasets which were compiled up to last year. The national accounts results are still delivered to the EU Commission under the NACE Rev 1 system. However discussions are now almost finalised on the groupings of the NACE Rev 2 system which are to be used in the national accounts in the period 2011 and afterwards. In view of the fact that this is a new series the proposed groupings of the new NACE Rev 2 system have been adopted in this report. This means that a continuous series will be available from the outset rather than having to change the classification system a couple of years after initiating the project.
The allocation of stocks to NACE sector is achieved through the allocation of GFCF each year in the PIM model. The CSO has used the information available to it to achieve a reasonable allocation between sectors. However sufficient data does not exist to determine an absolutely precise allocation.
In the case of the building and construction items a sectoral breakdown is provided for GFCF in building in the Department of Environment’s “Review and Outlook in the Construction Sector”. The sectoral breakdown reflects sector of use rather than sector of ownership. A consequence of this is that these tables do not accurately reflect ownership by property developers (for example) of buildings which are let to businesses in other sectors. Machinery and Equipment items are largely allocated to sectors based on the detailed description of the items in the trade and prodcom statistics. Data on capital investment in the CSO structural business surveys (e.g. the Census of Industrial Production and the Annual Services inquiries) have also been used in determining the allocation of investment items. Company reports and accounts have been used in other cases. However the final allocations to the various sectors must be looked on as the best possible in the circumstances and do not necessarily result in definitive and absolutely precise series.
Consumption of Fixed capital
Consumption of fixed capital (also known as depreciation of fixed assets) automatically becomes available as a by-product of the calculation of the stock of fixed assets in net and gross terms. This enables the transformation to be made for the main national accounts aggregates from gross to net terms e.g. Gross Domestic Product to Net Domestic Product, Gross National Income to Net National Income. Estimates of the consumption of fixed capital are provided in this report in current and constant terms.
9


Tables

Table 1 Net Capital Stock Held at End of Year by Type of Industry at Current Market Prices
€ million
Nace Rev 2 Section 1999 2000 2001 2002 2003 2004 2005 2006 2007 2008
Agriculture, Forestry and Fishing A 7,929 8,041 8,205 7,922 7,508 7,666 7,796 8,120 8,583 9,387
Mining and Quarrying B 1,726 1,892 2,049 2,064 2,084 2,078 2,148 2,346 2,462 2,403
Manufacturing C 18,681 21,500 23,276 23,940 23,126 23,634 24,938 26,444 26,745 25,655
Electricity, Gas, Steam and Air Conditioning Supply D 4,218 5,040 5,909 7,051 7,893 9,022 10,153 11,273 11,849 11,802
Water supply; sewerage, waste management and remediation activities E 2,896 3,640 4,391 5,067 5,566 5,926 6,283 6,674 7,097 6,778
Construction F 1,630 1,926 2,112 2,150 2,158 2,312 2,526 2,727 2,849 2,725
Wholesale and Retail Trade; Repair of Motor Vehicles and Motorcycles G 4,016 4,733 5,387 5,402 5,565 6,692 8,181 10,079 11,903 11,730
Transportation and Storage H 8,952 10,522 12,054 13,726 14,442 15,726 17,542 18,754 21,076 22,208
Accommodation and Food Service Activities I 3,639 4,426 4,854 4,723 4,583 4,773 5,010 5,357 5,863 5,596
Information and Communication J 5,581 6,458 7,013 7,196 7,096 7,346 7,591 8,020 8,568 8,605
Financial and Insurance Activities K 3,190 3,833 4,520 4,391 4,231 4,335 4,671 5,248 5,719 5,544
Real Estate Activities L 101,023 119,198 138,719 159,972 191,784 225,811 251,175 288,508 310,414 305,848
of which: Dwellings 100,016 117,911 137,134 158,352 190,020 223,812 248,785 285,554 306,965 302,477
Professional, Scientific and Technical Activities M 985 1,291 1,434 1,388 1,287 1,333 1,369 1,469 1,500 1,476
Administrative and Support Service Activities N 981 1,226 1,408 1,472 1,450 1,517 1,621 1,761 1,973 2,002
Public Administration and Defence; Compulsory Social Security O 15,868 18,829 22,030 24,387 26,496 29,227 32,195 35,364 38,731 37,829
of which: Roads 10,986 12,909 15,016 16,949 18,691 20,818 23,075 25,325 27,918 27,462
Education P 3,833 4,522 5,163 5,629 5,879 6,522 7,119 7,733 8,110 7,641
Human Health and Social Work Activities Q 2,642 3,093 3,621 4,051 4,334 4,742 5,139 5,432 5,755 5,495
Arts, Entertainment and Recreation R 855 1,033 1,235 1,456 1,571 1,773 2,047 2,343 2,723 2,857
Other Service Activities S 669 836 1,000 982 973 1,022 1,104 1,239 1,374 1,329
Total 189,313 222,040 254,381 282,968 318,025 361,458 398,607 448,890 483,294 476,913
12
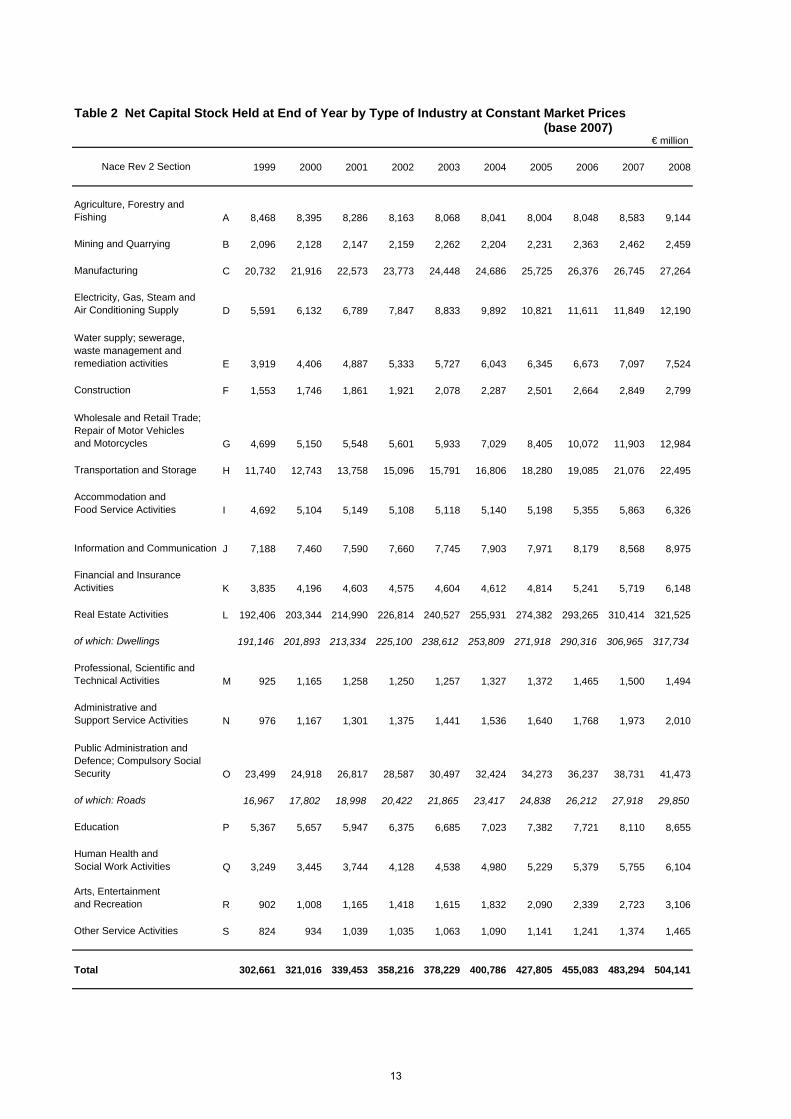
Table 2 Net Capital Stock Held at End of Year by Type of Industry at Constant Market Prices (base 2007)
€ million
Nace Rev 2 Section 1999 2000 2001 2002 2003 2004 2005 2006 2007 2008
Agriculture, Forestry and Fishing A 8,468 8,395 8,286 8,163 8,068 8,041 8,004 8,048 8,583 9,144
Mining and Quarrying B 2,096 2,128 2,147 2,159 2,262 2,204 2,231 2,363 2,462 2,459
Manufacturing C 20,732 21,916 22,573 23,773 24,448 24,686 25,725 26,376 26,745 27,264
Electricity, Gas, Steam and Air Conditioning Supply D 5,591 6,132 6,789 7,847 8,833 9,892 10,821 11,611 11,849 12,190
Water supply; sewerage, waste management and remediation activities E 3,919 4,406 4,887 5,333 5,727 6,043 6,345 6,673 7,097 7,524
Construction F 1,553 1,746 1,861 1,921 2,078 2,287 2,501 2,664 2,849 2,799
Wholesale and Retail Trade; Repair of Motor Vehicles and Motorcycles G 4,699 5,150 5,548 5,601 5,933 7,029 8,405 10,072 11,903 12,984
Transportation and Storage H 11,740 12,743 13,758 15,096 15,791 16,806 18,280 19,085 21,076 22,495
Accommodation and Food Service Activities I 4,692 5,104 5,149 5,108 5,118 5,140 5,198 5,355 5,863 6,326
Information and Communication J 7,188 7,460 7,590 7,660 7,745 7,903 7,971 8,179 8,568 8,975
Financial and Insurance Activities K 3,835 4,196 4,603 4,575 4,604 4,612 4,814 5,241 5,719 6,148
Real Estate Activities L 192,406 203,344 214,990 226,814 240,527 255,931 274,382 293,265 310,414 321,525
of which: Dwellings 191,146 201,893 213,334 225,100 238,612 253,809 271,918 290,316 306,965 317,734
Professional, Scientific and Technical Activities M 925 1,165 1,258 1,250 1,257 1,327 1,372 1,465 1,500 1,494
Administrative and Support Service Activities N 976 1,167 1,301 1,375 1,441 1,536 1,640 1,768 1,973 2,010
Public Administration and Defence; Compulsory Social Security O 23,499 24,918 26,817 28,587 30,497 32,424 34,273 36,237 38,731 41,473
of which: Roads 16,967 17,802 18,998 20,422 21,865 23,417 24,838 26,212 27,918 29,850
Education P 5,367 5,657 5,947 6,375 6,685 7,023 7,382 7,721 8,110 8,655
Human Health and Social Work Activities Q 3,249 3,445 3,744 4,128 4,538 4,980 5,229 5,379 5,755 6,104
Arts, Entertainment and Recreation R 902 1,008 1,165 1,418 1,615 1,832 2,090 2,339 2,723 3,106
Other Service Activities S 824 934 1,039 1,035 1,063 1,090 1,141 1,241 1,374 1,465
Total 302,661 321,016 339,453 358,216 378,229 400,786 427,805 455,083 483,294 504,141
13

Table 3 Net Capital Stock Held at End of Year by Asset at Current Market Prices
€ million
Asset Category 1999 2000 2001 2002 2003 2004 2005 2006 2007 2008
Dwellings, excluding land 100,016 117,911 137,134 158,352 190,020 223,812 248,785 285,554 306,965 302,477
Other buildings and structures 56,609 67,047 77,294 83,443 87,721 96,045 105,247 115,489 125,385 122,224of which: Roads 10,986 12,909 15,016 16,949 18,691 20,818 23,075 25,325 27,918 27,462
Transport equipment 8,803 10,034 11,011 12,255 12,693 13,728 15,579 16,919 19,056 19,771
Other machinery and equipment 20,739 24,035 25,691 25,646 24,131 24,246 25,388 27,170 28,155 28,342of which: Office machinery and hardware 1,623 2,000 2,069 1,955 1,671 1,685 1,612 1,780 1,970 1,925
Cultivated assets 2,225 1,974 1,950 1,890 1,934 2,091 2,092 2,180 2,119 2,416
Intangible fixed assets 920 1,039 1,302 1,383 1,526 1,538 1,517 1,578 1,614 1,683of which: Computer software 403 490 652 690 729 786 800 794 778 781
Total 189,313 222,040 254,381 282,968 318,025 361,458 398,607 448,890 483,294 476,913
14
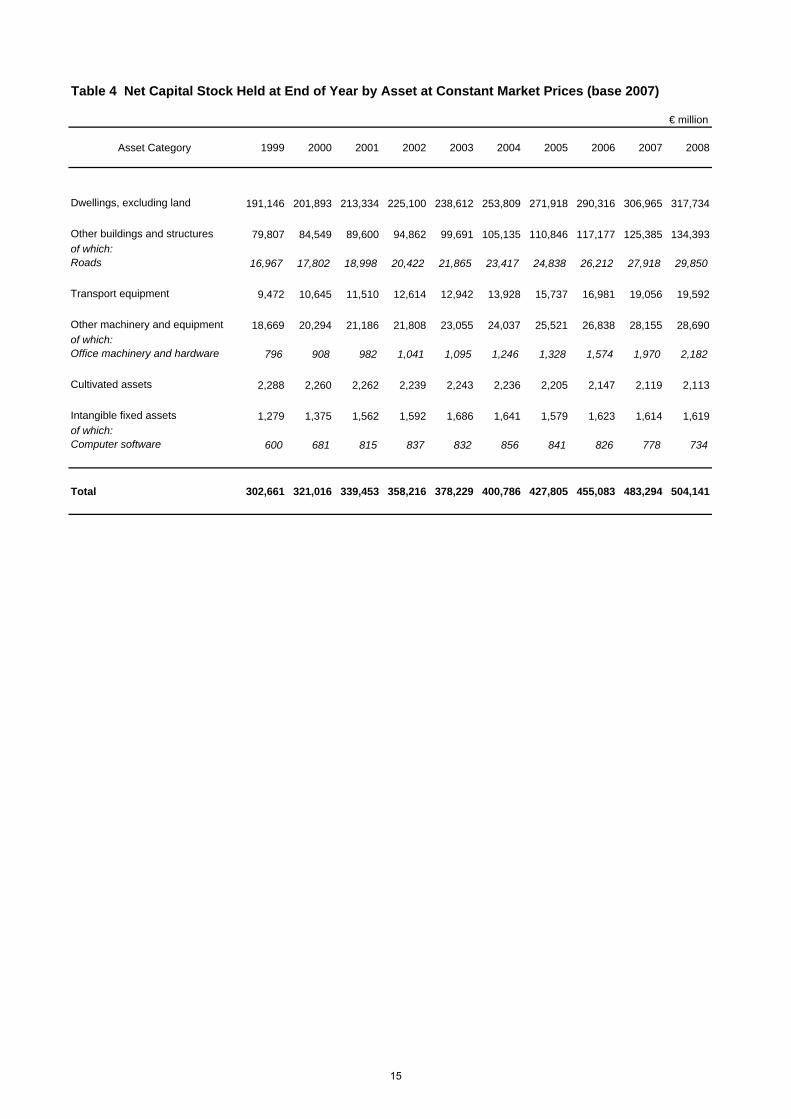
Table 4 Net Capital Stock Held at End of Year by Asset at Constant Market Prices (base 2007)
€ million
Asset Category 1999 2000 2001 2002 2003 2004 2005 2006 2007 2008
Dwellings, excluding land 191,146 201,893 213,334 225,100 238,612 253,809 271,918 290,316 306,965 317,734
Other buildings and structures 79,807 84,549 89,600 94,862 99,691 105,135 110,846 117,177 125,385 134,393of which: Roads 16,967 17,802 18,998 20,422 21,865 23,417 24,838 26,212 27,918 29,850
Transport equipment 9,472 10,645 11,510 12,614 12,942 13,928 15,737 16,981 19,056 19,592
Other machinery and equipment 18,669 20,294 21,186 21,808 23,055 24,037 25,521 26,838 28,155 28,690of which: Office machinery and hardware 796 908 982 1,041 1,095 1,246 1,328 1,574 1,970 2,182
Cultivated assets 2,288 2,260 2,262 2,239 2,243 2,236 2,205 2,147 2,119 2,113
Intangible fixed assets 1,279 1,375 1,562 1,592 1,686 1,641 1,579 1,623 1,614 1,619of which: Computer software 600 681 815 837 832 856 841 826 778 734
Total 302,661 321,016 339,453 358,216 378,229 400,786 427,805 455,083 483,294 504,141
15

Table 5 Gross Capital Stock Held at End of Year by Type of Industry at Current Market Prices
€ million
Nace Rev 2 Section 1999 2000 2001 2002 2003 2004 2005 2006 2007 2008
Agriculture, Forestry and Fishing A 14,849 15,370 15,804 15,278 14,354 14,486 14,743 15,207 15,634 16,444
Mining and Quarrying B 3,544 4,033 4,451 4,573 4,604 4,734 4,906 5,215 5,397 5,329
Manufacturing C 35,403 40,287 43,756 44,720 43,286 44,699 46,980 50,020 51,086 49,590
Electricity, Gas, Steam and Air Conditioning Supply D 7,349 8,669 10,006 11,554 12,672 14,310 16,092 18,013 19,437 19,790
Water supply; sewerage, waste management and remediation activities E 3,992 4,961 5,945 6,844 7,528 8,068 8,619 9,219 9,839 9,441
Construction F 3,373 3,782 4,068 4,131 4,061 4,250 4,579 4,946 5,173 5,149
Wholesale and Retail Trade; Repair of Motor Vehicles and Motorcycles G 7,051 8,127 9,161 9,351 9,647 11,084 12,986 15,339 17,557 17,422
Transportation and Storage H 15,413 18,001 20,618 23,350 24,958 27,317 30,434 33,101 36,969 39,325
Accommodation and Food Service Activities I 6,424 7,672 8,546 8,500 8,391 8,875 9,430 10,118 10,814 10,178
Information and Communication J 10,433 12,115 13,413 14,079 14,078 14,641 15,274 16,120 17,067 17,081
Financial and Insurance Activities K 5,822 6,824 7,852 7,794 7,594 7,847 8,370 9,190 9,835 9,508
Real Estate Activities L 131,764 154,520 178,672 205,054 244,618 286,443 316,782 362,227 387,988 382,515
of which: Dwellings 130,341 152,726 176,481 202,765 242,124 283,593 313,400 358,122 383,253 377,296
Professional, Scientific and Technical Activities M 1,705 2,172 2,485 2,553 2,470 2,573 2,701 2,895 3,011 3,082
Administrative and Support Service Activities N 1,891 2,231 2,522 2,664 2,665 2,799 3,021 3,296 3,660 3,843
Public Administration and Defence; Compulsory Social Security O 23,753 27,770 31,951 35,013 37,691 41,227 45,169 49,385 53,800 52,420
of which: Roads 17,522 20,279 23,143 25,632 27,844 30,612 33,657 36,751 40,242 39,325
Education P 7,543 8,791 9,931 10,612 10,971 12,039 13,002 14,017 14,571 13,530
Human Health and Social Work Activities Q 5,062 5,858 6,691 7,287 7,638 8,174 8,835 9,399 9,865 9,415
Arts, Entertainment and Recreation R 1,860 2,138 2,441 2,718 2,848 3,130 3,528 3,995 4,541 4,760
Other Service Activities S 1,277 1,528 1,777 1,780 1,779 1,885 2,037 2,251 2,444 2,364
Total 288,510 334,849 380,088 417,855 461,854 518,583 567,487 633,951 678,689 671,185
16

Table 6 Gross Capital Stock Held at End of Year by Type of Industry at Constant Market Prices (base 2007)
€ million
Nace Rev 2 Section 1999 2000 2001 2002 2003 2004 2005 2006 2007 2008
Agriculture, Forestry and Fishing A 16,008 15,847 15,641 15,428 15,254 15,162 15,076 15,089 15,634 16,261
Mining and Quarrying B 4,366 4,642 4,873 4,958 5,018 5,026 5,070 5,271 5,397 5,465
Manufacturing C 38,884 40,727 42,107 44,073 45,541 46,564 48,396 49,871 51,086 52,428
Electricity, Gas, Steam and Air Conditioning Supply D 9,728 10,467 11,366 12,731 14,107 15,641 17,124 18,536 19,437 20,449
Water supply; sewerage, waste management and remediation activities E 5,374 5,982 6,596 7,188 7,740 8,224 8,704 9,217 9,839 10,474
Construction F 3,193 3,403 3,557 3,670 3,895 4,197 4,529 4,831 5,173 5,280
Wholesale and Retail Trade; Repair of Motor Vehicles and Motorcycles G 8,137 8,730 9,314 9,578 10,149 11,541 13,271 15,318 17,557 19,049
Transportation and Storage H 20,176 21,769 23,472 25,609 27,179 29,134 31,684 33,676 36,969 39,789
Accommodation and Food Service Activities I 8,272 8,842 9,059 9,188 9,366 9,556 9,782 10,114 10,814 11,497
Information and Communication J 13,405 14,015 14,497 14,899 15,274 15,691 15,996 16,431 17,067 17,744
Financial and Insurance Activities K 6,890 7,369 7,917 8,032 8,185 8,296 8,603 9,173 9,835 10,486
Real Estate Activities L 250,975 263,658 276,972 290,906 307,073 324,965 346,354 368,332 387,988 401,616
of which: Dwellings 249,223 261,660 274,705 288,503 304,376 321,953 342,879 364,239 383,253 396,389
Professional, Scientific and Technical Activities M 1,572 1,917 2,140 2,260 2,380 2,553 2,697 2,884 3,011 3,083
Administrative and Support Service Activities N 1,864 2,098 2,303 2,463 2,624 2,824 3,046 3,304 3,660 3,854
Public Administration and Defence; Compulsory Social Security O 35,233 36,812 38,945 41,032 43,335 45,723 48,093 50,644 53,800 57,290
of which: Roads 27,063 27,965 29,280 30,885 32,572 34,434 36,229 38,037 40,242 42,744
Education P 10,570 10,996 11,425 11,999 12,460 12,955 13,479 13,996 14,571 15,315
Human Health and Social Work Activities Q 6,176 6,470 6,881 7,400 7,961 8,561 8,978 9,304 9,865 10,405
Arts, Entertainment and Recreation R 1,942 2,083 2,276 2,589 2,874 3,194 3,580 3,982 4,541 5,118
Other Service Activities S 1,570 1,703 1,840 1,873 1,939 2,006 2,103 2,253 2,444 2,600
Total 444,337 467,528 491,181 515,875 542,355 571,813 606,566 642,226 678,689 708,203
17
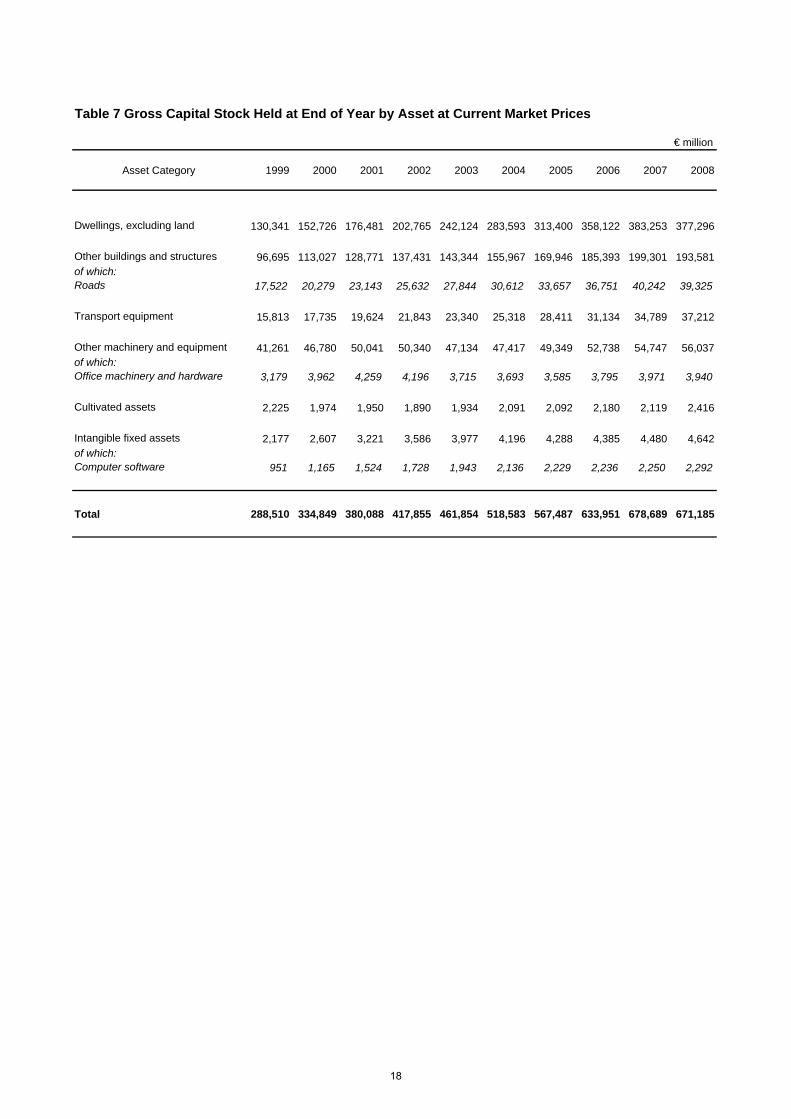
Table 7 Gross Capital Stock Held at End of Year by Asset at Current Market Prices
€ million
Asset Category 1999 2000 2001 2002 2003 2004 2005 2006 2007 2008
Dwellings, excluding land 130,341 152,726 176,481 202,765 242,124 283,593 313,400 358,122 383,253 377,296
Other buildings and structures 96,695 113,027 128,771 137,431 143,344 155,967 169,946 185,393 199,301 193,581of which: Roads 17,522 20,279 23,143 25,632 27,844 30,612 33,657 36,751 40,242 39,325
Transport equipment 15,813 17,735 19,624 21,843 23,340 25,318 28,411 31,134 34,789 37,212
Other machinery and equipment 41,261 46,780 50,041 50,340 47,134 47,417 49,349 52,738 54,747 56,037of which: Office machinery and hardware 3,179 3,962 4,259 4,196 3,715 3,693 3,585 3,795 3,971 3,940
Cultivated assets 2,225 1,974 1,950 1,890 1,934 2,091 2,092 2,180 2,119 2,416
Intangible fixed assets 2,177 2,607 3,221 3,586 3,977 4,196 4,288 4,385 4,480 4,642of which: Computer software 951 1,165 1,524 1,728 1,943 2,136 2,229 2,236 2,250 2,292
Total 288,510 334,849 380,088 417,855 461,854 518,583 567,487 633,951 678,689 671,185
18
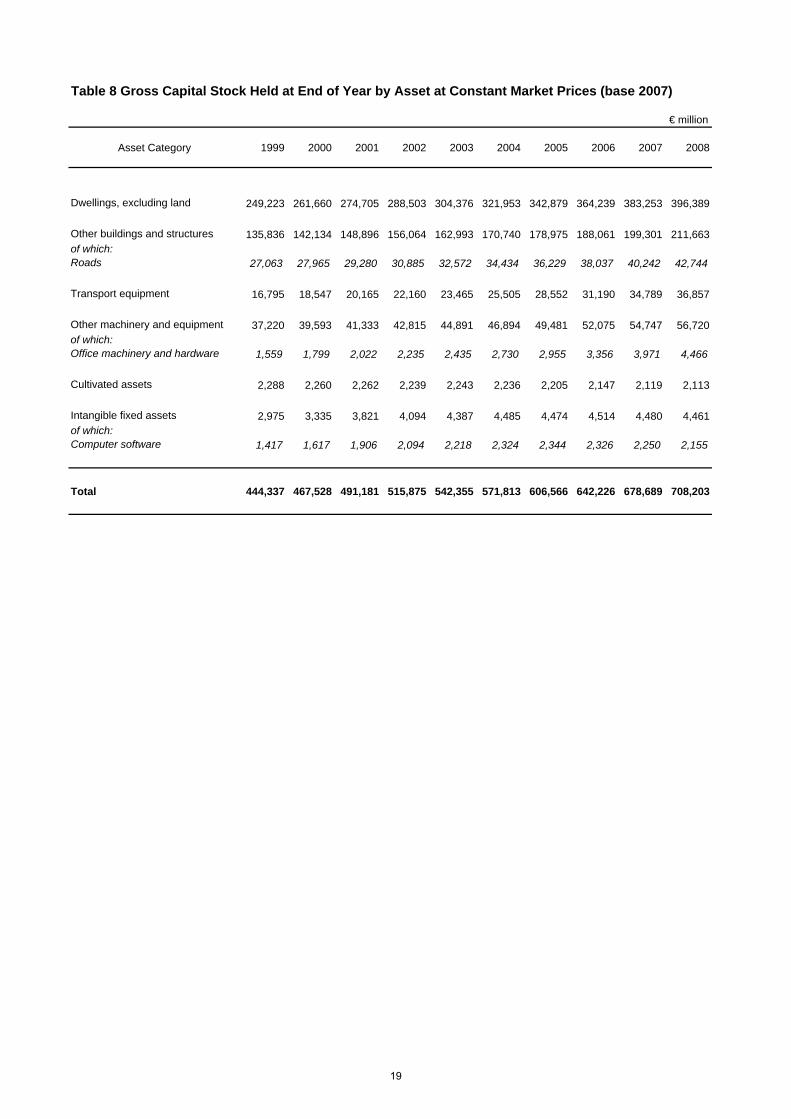
Table 8 Gross Capital Stock Held at End of Year by Asset at Constant Market Prices (base 2007)
€ million
Asset Category 1999 2000 2001 2002 2003 2004 2005 2006 2007 2008
Dwellings, excluding land 249,223 261,660 274,705 288,503 304,376 321,953 342,879 364,239 383,253 396,389
Other buildings and structures 135,836 142,134 148,896 156,064 162,993 170,740 178,975 188,061 199,301 211,663of which: Roads 27,063 27,965 29,280 30,885 32,572 34,434 36,229 38,037 40,242 42,744
Transport equipment 16,795 18,547 20,165 22,160 23,465 25,505 28,552 31,190 34,789 36,857
Other machinery and equipment 37,220 39,593 41,333 42,815 44,891 46,894 49,481 52,075 54,747 56,720of which: Office machinery and hardware 1,559 1,799 2,022 2,235 2,435 2,730 2,955 3,356 3,971 4,466
Cultivated assets 2,288 2,260 2,262 2,239 2,243 2,236 2,205 2,147 2,119 2,113
Intangible fixed assets 2,975 3,335 3,821 4,094 4,387 4,485 4,474 4,514 4,480 4,461of which: Computer software 1,417 1,617 1,906 2,094 2,218 2,324 2,344 2,326 2,250 2,155
Total 444,337 467,528 491,181 515,875 542,355 571,813 606,566 642,226 678,689 708,203
19

Financial and Insurance
Table 9 Consumption of Fixed Capital by Type of Industry at Current Market Prices
€ million
Nace Rev 2 Section 1999 2000 2001 2002 2003 2004 2005 2006 2007 2008
Agriculture, Forestry and Fishing A 684 726 750 725 674 668 687 708 736 773
Mining and Quarrying B 258 293 325 359 384 399 382 399 441 476
Manufacturing C 1,468 1,673 1,826 1,866 1,811 1,845 1,899 2,038 2,108 2,094
Electricity, Gas, Steam and Air Conditioning Supply D 299 357 417 486 556 650 746 843 923 912
Water supply; sewerage, waste management and remediation activities E 85 105 127 147 162 173 185 196 208 200
Construction F 204 239 266 276 274 289 315 344 361 365
Wholesale and Retail Trade; Repair of Motor Vehicles and Motorcycles G 457 520 582 608 627 687 758 822 895 908
Transportation and Storage H 923 1,123 1,296 1,465 1,569 1,684 1,882 2,084 2,308 2,524
Accommodation and Food Service Activities I 253 316 358 353 342 356 374 395 417 402
Information and Communication J 517 629 700 701 651 648 666 695 738 753
Financial and Insurance Activities K 260 316 358 363 343 335 348 396 437 451
Real Estate Activities L 2,140 2,547 2,852 3,299 4,107 4,881 5,665 6,829 6,801 5,917
of which: Dwellings 2,078 2,470 2,760 3,195 3,989 4,745 5,514 6,658 6,616 5,735
Professional, Scientific and Technical Activities M 163 206 243 244 221 225 235 241 247 244
Administrative and Support Service Activities N 158 195 230 245 241 249 266 286 314 334
Public Administration and Defence; Compulsory Social Security O 572 675 777 860 927 1,010 1,105 1,212 1,322 1,318
of which: Roads 364 427 493 555 613 682 760 836 917 901
Education P 183 215 244 261 271 297 326 357 373 353
Human Health and Social Work Activities Q 203 230 265 298 309 317 338 360 375 367
Arts, Entertainment and Recreation R 170 195 221 240 249 268 294 325 352 364
Other Service Activities S 59 73 86 89 87 92 98 108 118 118
Total 9,057 10,634 11,922 12,884 13,806 15,074 16,569 18,637 19,476 18,871
20
Financial and Insurance
Table 10 Consumption of Fixed Capital by Type of Industry at Constant Market Prices (base 2007)
€ million
Nace Rev 2 Section 1999 2000 2001 2002 2003 2004 2005 2006 2007 2008
Agriculture, Forestry and Fishing A 718 716 708 697 689 687 694 703 736 782
Mining and Quarrying B 350 362 376 399 429 433 402 408 441 466
Manufacturing C 1,518 1,618 1,713 1,790 1,851 1,884 1,938 2,030 2,108 2,159
Electricity, Gas, Steam and Air Conditioning Supply D 390 429 476 539 621 710 794 868 923 939
Water supply; sewerage, waste management and remediation activities E 113 125 140 153 166 177 186 196 208 221
Construction F 197 221 241 252 266 287 312 338 361 372
Wholesale and Retail Trade; Repair of Motor Vehicles and Motorcycles G 491 535 582 605 635 697 765 820 895 957
Transportation and Storage H 1,138 1,292 1,420 1,561 1,666 1,764 1,938 2,108 2,308 2,535
Accommodation and Food Service Activities I 320 359 376 377 377 380 386 395 417 451
Information and Communication J 574 630 663 669 660 664 678 698 738 781
Financial and Insurance Activities K 278 315 340 352 351 344 353 395 437 475
Real Estate Activities L 4,163 4,465 4,547 4,915 5,466 5,868 6,516 7,082 6,801 6,285
of which: Dwellings 4,092 4,384 4,455 4,811 5,345 5,731 6,364 6,913 6,616 6,085
Professional, Scientific and Technical Activities M 149 182 212 218 214 221 232 239 247 246
Administrative and Support Service Activities N 156 186 214 230 238 251 268 286 314 335
Public Administration and Defence; Compulsory Social Security O 793 842 903 972 1,039 1,101 1,165 1,239 1,322 1,411
of which: Roads 562 589 624 668 717 767 818 865 917 979
Education P 238 252 265 282 299 315 335 355 373 395
Human Health and Social Work Activities Q 224 236 258 289 314 327 342 357 375 392
Arts, Entertainment and Recreation R 161 177 195 214 236 262 292 322 352 383
Other Service Activities S 70 79 87 92 93 97 101 108 118 127
Total 12,039 13,020 13,714 14,606 15,609 16,469 17,697 18,946 19,476 19,710
21
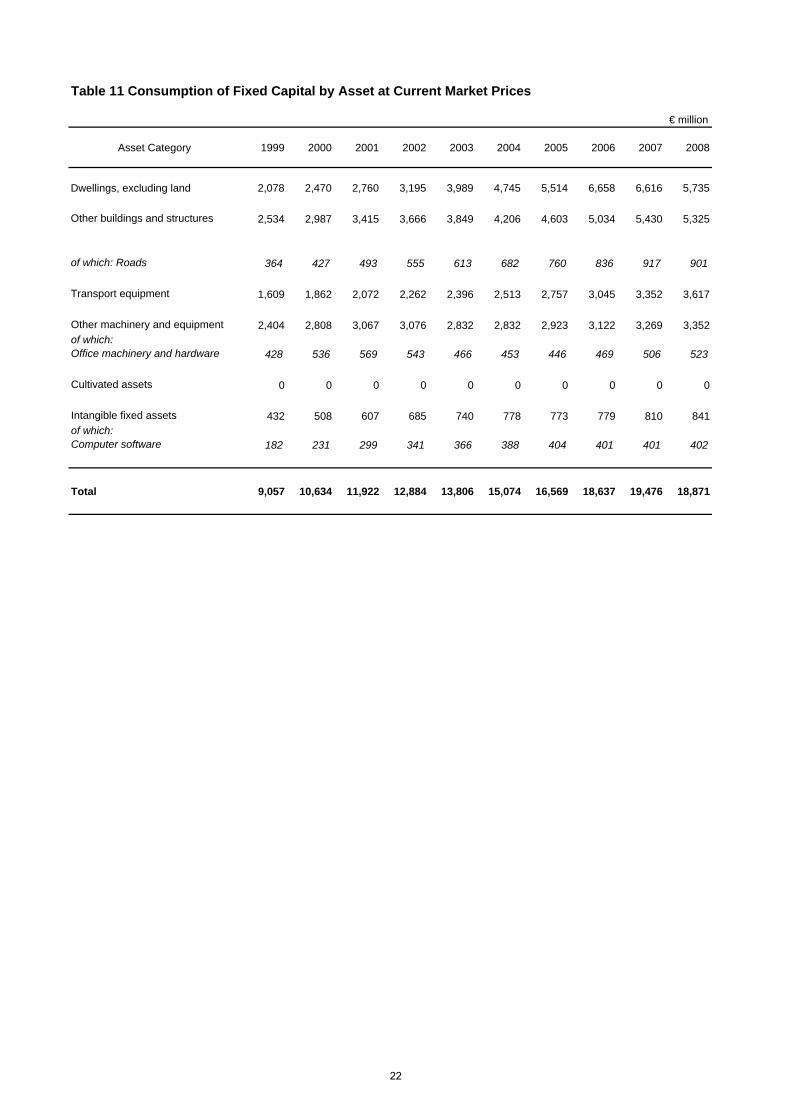
Table 11 Consumption of Fixed Capital by Asset at Current Market Prices
€ million
Asset Category 1999 2000 2001 2002 2003 2004 2005 2006 2007 2008
Dwellings, excluding land 2,078 2,470 2,760 3,195 3,989 4,745 5,514 6,658 6,616 5,735
Other buildings and structures 2,534 2,987 3,415 3,666 3,849 4,206 4,603 5,034 5,430 5,325
of which: Roads 364 427 493 555 613 682 760 836 917 901
Transport equipment 1,609 1,862 2,072 2,262 2,396 2,513 2,757 3,045 3,352 3,617
Other machinery and equipment 2,404 2,808 3,067 3,076 2,832 2,832 2,923 3,122 3,269 3,352of which: Office machinery and hardware 428 536 569 543 466 453 446 469 506 523
Cultivated assets 0 0 0 0 0 0 0 0 0 0
Intangible fixed assets 432 508 607 685 740 778 773 779 810 841of which: Computer software 182 231 299 341 366 388 404 401 401 402
Total 9,057 10,634 11,922 12,884 13,806 15,074 16,569 18,637 19,476 18,871
22
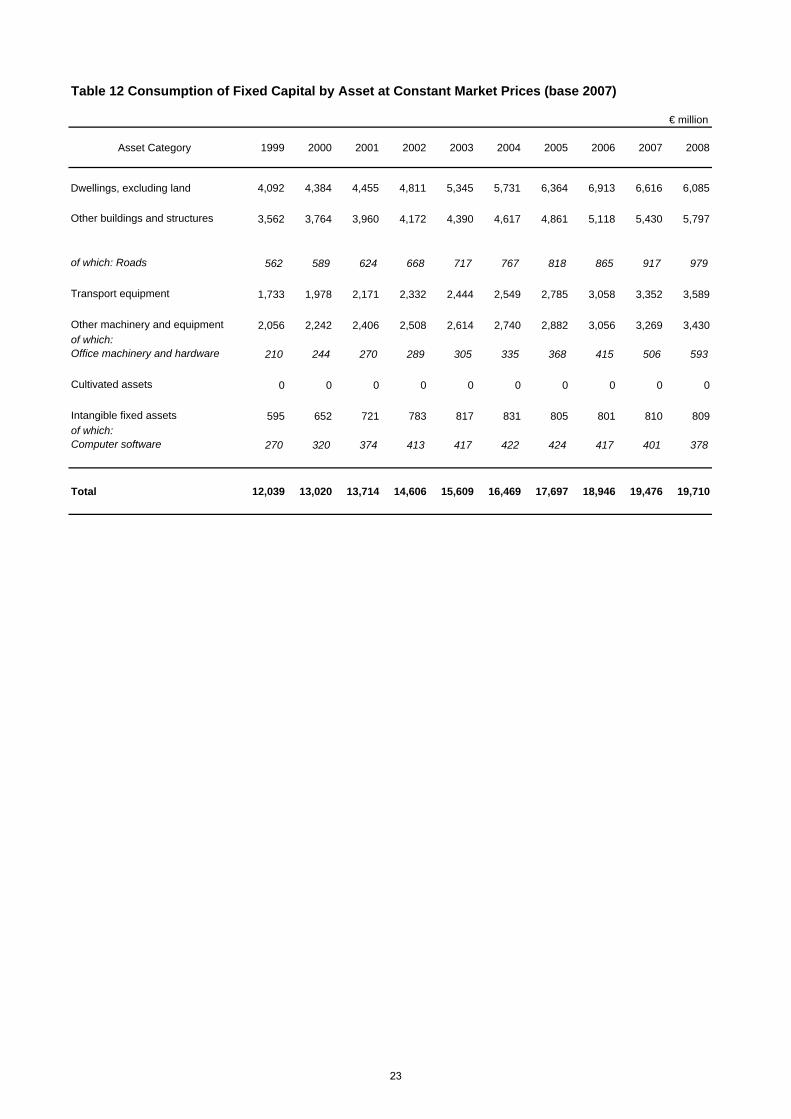
Table 12 Consumption of Fixed Capital by Asset at Constant Market Prices (base 2007)
€ million
Asset Category 1999 2000 2001 2002 2003 2004 2005 2006 2007 2008
Dwellings, excluding land 4,092 4,384 4,455 4,811 5,345 5,731 6,364 6,913 6,616 6,085
Other buildings and structures 3,562 3,764 3,960 4,172 4,390 4,617 4,861 5,118 5,430 5,797
of which: Roads 562 589 624 668 717 767 818 865 917 979
Transport equipment 1,733 1,978 2,171 2,332 2,444 2,549 2,785 3,058 3,352 3,589
Other machinery and equipment 2,056 2,242 2,406 2,508 2,614 2,740 2,882 3,056 3,269 3,430of which: Office machinery and hardware 210 244 270 289 305 335 368 415 506 593
Cultivated assets 0 0 0 0 0 0 0 0 0 0
Intangible fixed assets 595 652 721 783 817 831 805 801 810 809of which: Computer software 270 320 374 413 417 422 424 417 401 378
Total 12,039 13,020 13,714 14,606 15,609 16,469 17,697 18,946 19,476 19,710
23
Information and
M
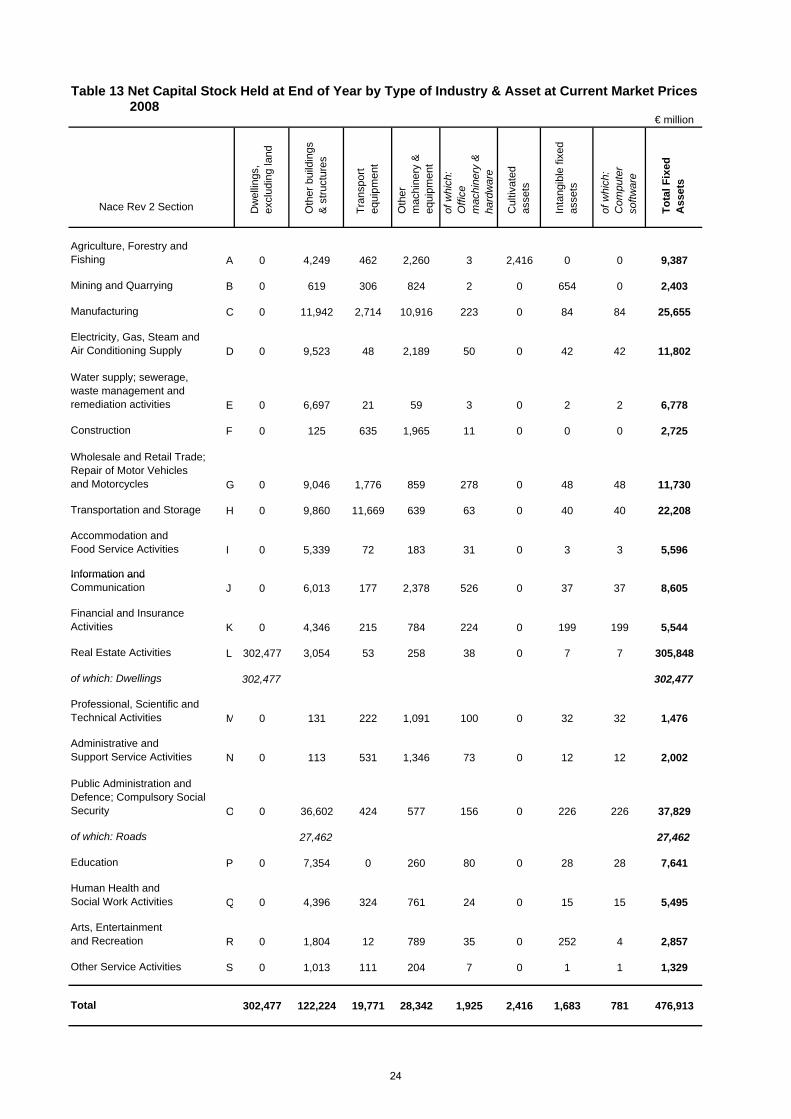
Table 13 Net Capital Stock Held at End of Year by Type of Industry & Asset at Current Market Prices 2008
€ million
Nace Rev 2 Section Dw
ellin
gs,
excl
udin
g la
nd
Oth
er b
uild
ings
&
stru
ctur
es
Tran
spor
t eq
uipm
ent
Oth
er
mac
hine
ry &
eq
uipm
ent
of w
hich
: O
ffice
m
achi
nery
&
hard
war
e
Cul
tivat
ed
asse
ts
Inta
ngib
le fi
xed
asse
ts
of w
hich
: C
ompu
ter
softw
are
Tota
l Fix
ed
Ass
ets
Agriculture, Forestry and Fishing A 0 4,249 462 2,260 3 2,416 0 0 9,387
Mining and Quarrying B 0 619 306 824 2 0 654 0 2,403
Manufacturing C 0 11,942 2,714 10,916 223 0 84 84 25,655
Electricity, Gas, Steam and Air Conditioning Supply D 0 9,523 48 2,189 50 0 42 42 11,802
Water supply; sewerage, waste management and remediation activities E 0 6,697 21 59 3 0 2 2 6,778
Construction F 0 125 635 1,965 11 0 0 0 2,725
Wholesale and Retail Trade; Repair of Motor Vehicles and Motorcycles G 0 9,046 1,776 859 278 0 48 48 11,730
Transportation and Storage H 0 9,860 11,669 639 63 0 40 40 22,208
Accommodation and Food Service Activities I 0 5,339 72 183 31 0 3 3 5,596
Information and Communication J 0 6,013 177 2,378 526 0 37 37 8,605
Financial and Insurance Activities K 0 4,346 215 784 224 0 199 199 5,544
Real Estate Activities L 302,477 3,054 53 258 38 0 7 7 305,848
of which: Dwellings 302,477 302,477
Professional, Scientific and Technical Activities 0 131 222 1,091 100 0 32 32 1,476
Administrative and Support Service Activities N 0 113 531 1,346 73 0 12 12 2,002
Public Administration and Defence; Compulsory Social Security O 0 36,602 424 577 156 0 226 226 37,829
of which: Roads 27,462 27,462
Education P 0 7,354 0 260 80 0 28 28 7,641
Human Health and Social Work Activities Q 0 4,396 324 761 24 0 15 15 5,495
Arts, Entertainment and Recreation R 0 1,804 12 789 35 0 252 4 2,857
Other Service Activities S 0 1,013 111 204 7 0 1 1 1,329
Total 302,477 122,224 19,771 28,342 1,925 2,416 1,683 781 476,913
24
Information and
M
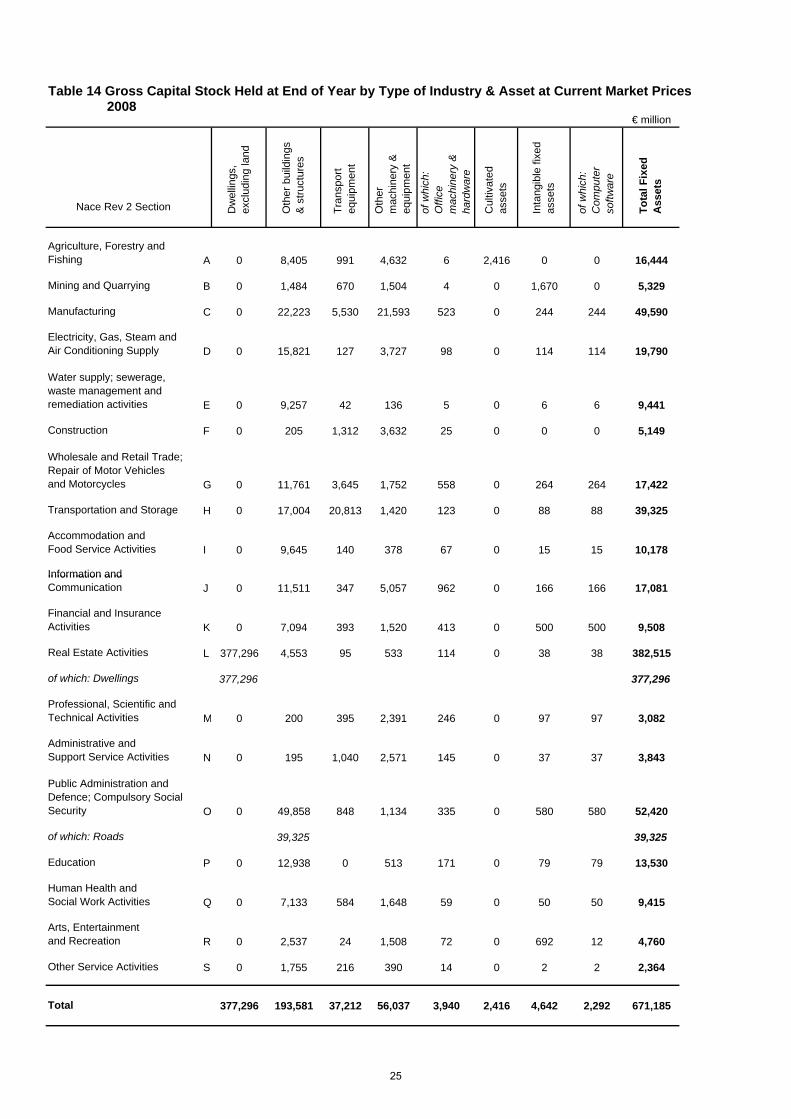
Table 14 Gross Capital Stock Held at End of Year by Type of Industry & Asset at Current Market Prices 2008
€ million
Nace Rev 2 Section Dw
ellin
gs,
excl
udin
g la
nd
Oth
er b
uild
ings
&
stru
ctur
es
Tran
spor
t eq
uipm
ent
Oth
er
mac
hine
ry &
eq
uipm
ent
of w
hich
: O
ffice
m
achi
nery
&
hard
war
e
Cul
tivat
ed
asse
ts
Inta
ngib
le fi
xed
asse
ts
of w
hich
: C
ompu
ter
softw
are
Tota
l Fix
ed
Ass
ets
Agriculture, Forestry and Fishing A 0 8,405 991 4,632 6 2,416 0 0 16,444
Mining and Quarrying B 0 1,484 670 1,504 4 0 1,670 0 5,329
Manufacturing C 0 22,223 5,530 21,593 523 0 244 244 49,590
Electricity, Gas, Steam and Air Conditioning Supply D 0 15,821 127 3,727 98 0 114 114 19,790
Water supply; sewerage, waste management and remediation activities E 0 9,257 42 136 5 0 6 6 9,441
Construction F 0 205 1,312 3,632 25 0 0 0 5,149
Wholesale and Retail Trade; Repair of Motor Vehicles and Motorcycles G 0 11,761 3,645 1,752 558 0 264 264 17,422
Transportation and Storage H 0 17,004 20,813 1,420 123 0 88 88 39,325
Accommodation and Food Service Activities I 0 9,645 140 378 67 0 15 15 10,178
Information and Communication J 0 11,511 347 5,057 962 0 166 166 17,081
Financial and Insurance Activities K 0 7,094 393 1,520 413 0 500 500 9,508
Real Estate Activities L 377,296 4,553 95 533 114 0 38 38 382,515
of which: Dwellings 377,296 377,296
Professional, Scientific and Technical Activities 0 200 395 2,391 246 0 97 97 3,082
Administrative and Support Service Activities N 0 195 1,040 2,571 145 0 37 37 3,843
Public Administration and Defence; Compulsory Social Security O 0 49,858 848 1,134 335 0 580 580 52,420
of which: Roads 39,325 39,325
Education P 0 12,938 0 513 171 0 79 79 13,530
Human Health and Social Work Activities Q 0 7,133 584 1,648 59 0 50 50 9,415
Arts, Entertainment and Recreation R 0 2,537 24 1,508 72 0 692 12 4,760
Other Service Activities S 0 1,755 216 390 14 0 2 2 2,364
Total 377,296 193,581 37,212 56,037 3,940 2,416 4,642 2,292 671,185
25
Information and
M
Table 15 Consumption Of Fixed Capital by Type Of Industry and Asset at Current Market Prices2008
€ million
Nace Rev 2 Section Dw
ellin
gs,
excl
udin
g la
nd
Oth
er b
uild
ings
&
stru
ctur
es
Tran
spor
t eq
uipm
ent
Oth
er
mac
hine
ry &
eq
uipm
ent
of w
hich
: O
ffice
m
achi
nery
&
hard
war
e
Cul
tivat
ed
asse
ts
Inta
ngib
le fi
xed
asse
ts
of w
hich
: C
ompu
ter
softw
are
Tota
l Fix
ed
Ass
ets
Agriculture, Forestry and Fishing A 0 333 122 318 1 0 0 0 773
Mining and Quarrying B 0 21 71 70 1 0 314 0 476
Manufacturing C 0 477 618 953 64 0 46 46 2,094
Electricity, Gas, Steam and Air Conditioning Supply D 0 725 13 148 13 0 25 25 912
Water supply; sewerage, waste management and remediation activities E 0 189 5 5 1 0 1 1 200
Construction F 0 8 146 211 3 0 0 0 365
Wholesale and Retail Trade; Repair of Motor Vehicles and Motorcycles G 0 316 398 162 81 0 31 31 908
Transportation and Storage H 0 654 1,753 99 16 0 17 17 2,524
Accommodation and Food Service Activities I 0 354 16 29 8 0 2 2 402
Information and Communication J 0 288 39 402 135 0 24 24 753
Financial and Insurance Activities K 0 172 50 133 54 0 97 97 451
Real Estate Activities L 5,735 118 17 42 11 0 4 4 5,917
of which: Dwellings 5,735 5,735
Professional, Scientific and Technical Activities 0 5 51 173 30 0 15 15 244
Administrative and Support Service Activities N 0 7 120 200 21 0 6 6 334
Public Administration and Defence; Compulsory Social Security O 0 1,012 98 100 44 0 108 108 1,318
of which: Roads 901 901
Education P 0 291 0 48 22 0 14 14 353
Human Health and Social Work Activities Q 0 173 71 114 7 0 9 9 367
Arts, Entertainment and Recreation R 0 114 8 116 10 0 127 2 364
Other Service Activities S 0 67 21 30 2 0 0 0 118
Total 5,735 5,325 3,617 3,352 523 0 841 402 18,871
26
Appendix 1
Average Service Lives for assets with comparable data for other OECD Countries

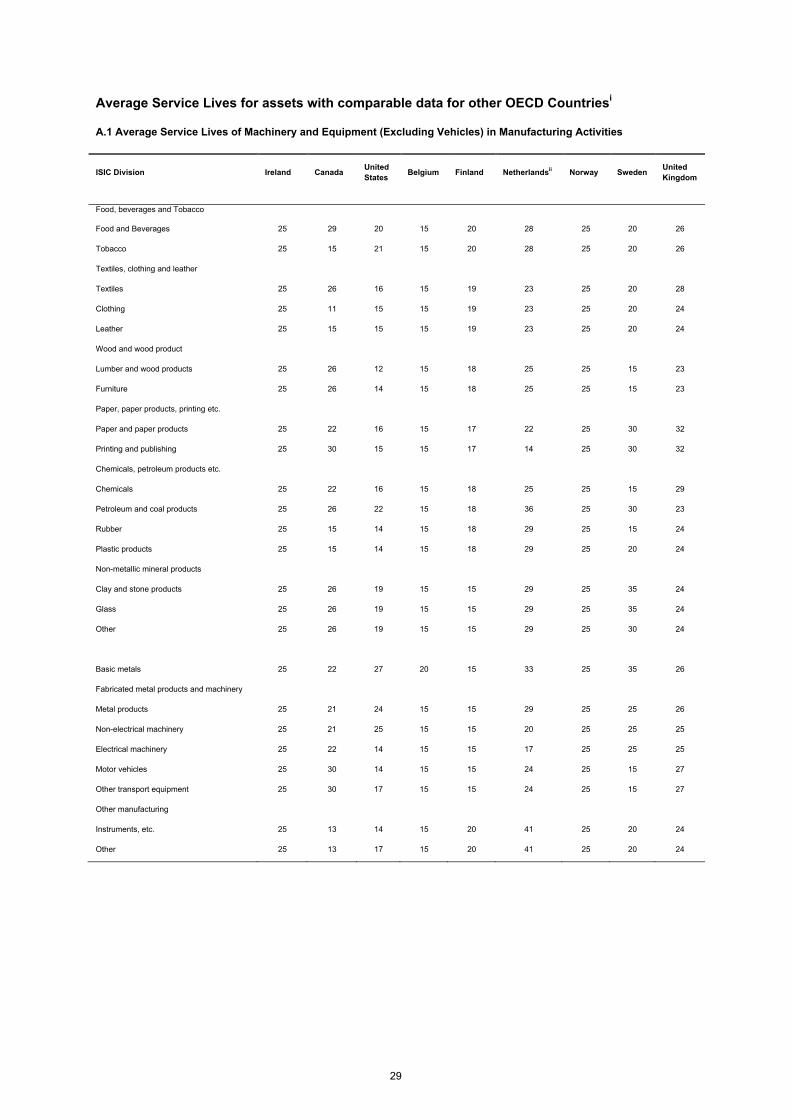
Average Service Lives for assets with comparable data for other OECD Countriesi A.1 Average Service Lives of Machinery and Equipment (Excluding Vehicles) in Manufacturing Activities
ISIC Division Ireland Canada United States Belgium Finland Netherlandsii Norway Sweden United
Kingdom
Food, beverages and Tobacco Food and Beverages 25 29 20 15 20 28 25 20 26
Tobacco 25 15 21 15 20 28 25 20 26
Textiles, clothing and leather
Textiles 25 26 16 15 19 23 25 20 28
Clothing 25 11 15 15 19 23 25 20 24
Leather 25 15 15 15 19 23 25 20 24
Wood and wood product
Lumber and wood products 25 26 12 15 18 25 25 15 23
Furniture 25 26 14 15 18 25 25 15 23
Paper, paper products, printing etc.
Paper and paper products 25 22 16 15 17 22 25 30 32
Printing and publishing 25 30 15 15 17 14 25 30 32
Chemicals, petroleum products etc.
Chemicals 25 22 16 15 18 25 25 15 29
Petroleum and coal products 25 26 22 15 18 36 25 30 23
Rubber 25 15 14 15 18 29 25 15 24
Plastic products 25 15 14 15 18 29 25 20 24
Non-metallic mineral products
Clay and stone products 25 26 19 15 15 29 25 35 24
Glass 25 26 19 15 15 29 25 35 24
Other 25 26 19 15 15 29 25 30 24
Basic metals 25 22 27 20 15 33 25 35 26
Fabricated metal products and machinery
Metal products 25 21 24 15 15 29 25 25 26
Non-electrical machinery 25 21 25 15 15 20 25 25 25
Electrical machinery 25 22 14 15 15 17 25 25 25
Motor vehicles 25 30 14 15 15 24 25 15 27
Other transport equipment 25 30 17 15 15 24 25 15 27
Other manufacturing
Instruments, etc. 25 13 14 15 20 41 25 20 24
Other 25 13 17 15 20 41 25 20 24
29
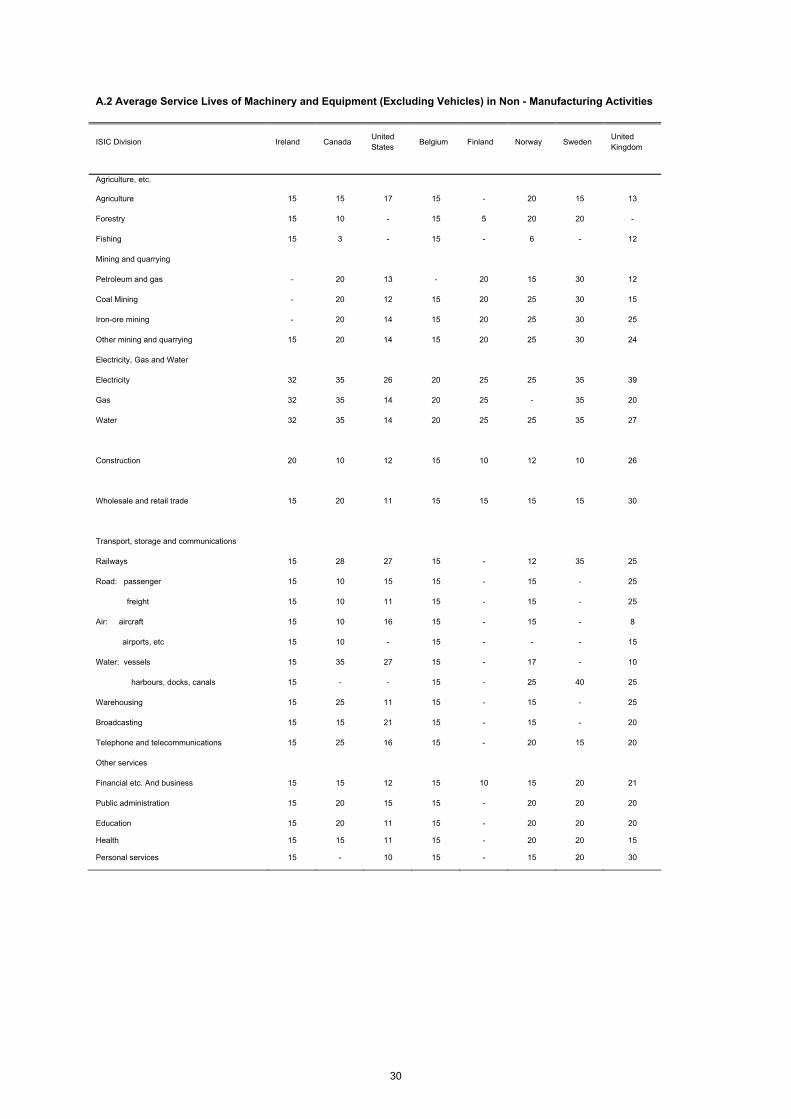
A.2 Average Service Lives of Machinery and Equipment (Excluding Vehicles) in Non - Manufacturing Activities
ISIC Division Ireland Canada United States Belgium Finland Norway Sweden United
Kingdom
Agriculture, etc.
Agriculture 15 15 17 15 - 20 15 13
Forestry 15 10 - 15 5 20 20 -
Fishing 15 3 - 15 - 6 - 12
Mining and quarrying
Petroleum and gas - 20 13 - 20 15 30 12
Coal Mining - 20 12 15 20 25 30 15
Iron-ore mining - 20 14 15 20 25 30 25
Other mining and quarrying 15 20 14 15 20 25 30 24
Electricity, Gas and Water
Electricity 32 35 26 20 25 25 35 39
Gas 32 35 14 20 25 - 35 20
Water 32 35 14 20 25 25 35 27
Construction 20 10 12 15 10 12 10 26
Wholesale and retail trade 15 20 11 15 15 15 15 30
Transport, storage and communications
Railways 15 28 27 15 - 12 35 25
Road: passenger 15 10 15 15 - 15 - 25
freight 15 10 11 15 - 15 - 25
Air: aircraft 15 10 16 15 - 15 - 8
airports, etc 15 10 - 15 - - - 15
Water: vessels 15 35 27 15 - 17 - 10
harbours, docks, canals 15 - - 15 - 25 40 25
Warehousing 15 25 11 15 - 15 - 25
Broadcasting 15 15 21 15 - 15 - 20
Telephone and telecommunications 15 25 16 15 - 20 15 20
Other services
Financial etc. And business 15 15 12 15 10 15 20 21
Public administration 15 20 15 15 - 20 20 20
Education 15 20 11 15 - 20 20 20
Health 15 15 11 15 - 20 20 15
Personal services 15 - 10 15 - 15 20 30
30
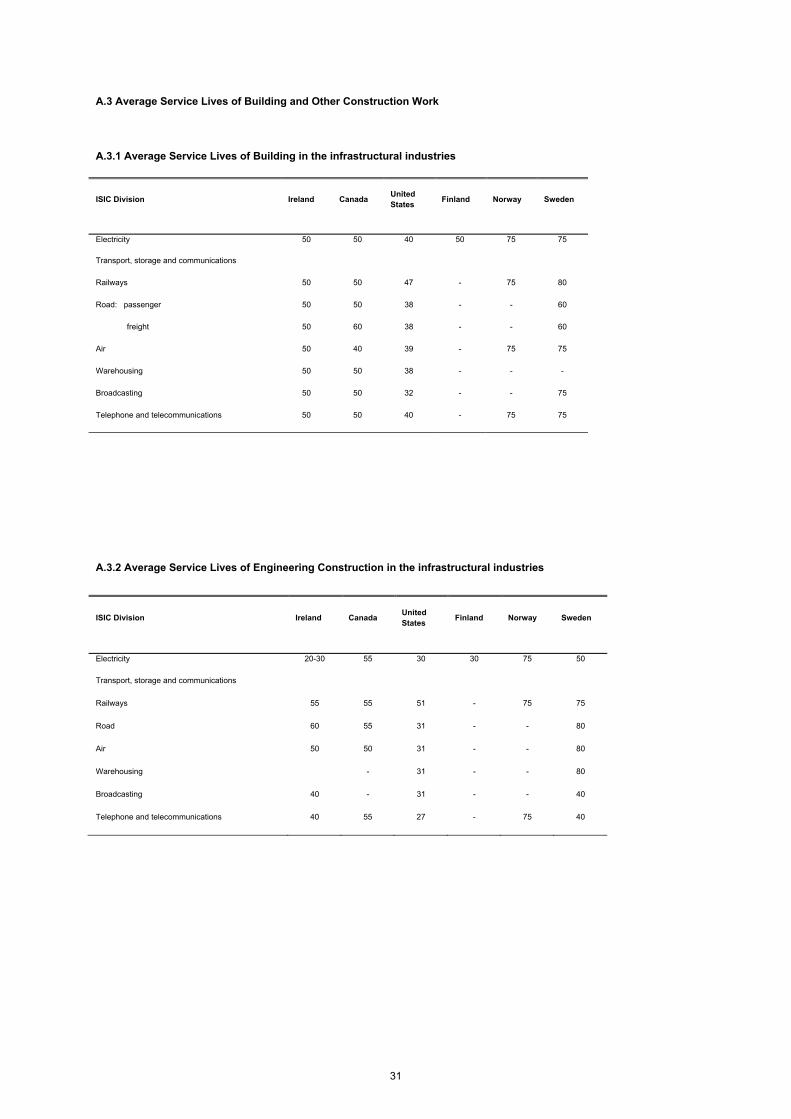
A.3 Average Service Lives of Building and Other Construction Work
A.3.1 Average Service Lives of Building in the infrastructural industries
A.3.2 Average Service Lives of Engineering Construction in the infrastructural industries
ISIC Division Ireland Canada United States Finland Norway Sweden
Electricity 50 50 40 50 75 75
Transport, storage and communications
Railways 50 50 47 - 75 80
Road: passenger 50 50 38 - - 60
freight 50 60 38 - - 60
Air 50 40 39 - 75 75
Warehousing 50 50 38 - - -
Broadcasting 50 50 32 - - 75
Telephone and telecommunications 50 50 40 - 75 75
ISIC Division Ireland Canada United States Finland Norway Sweden
Electricity 20-30 55 30 30 75 50
Transport, storage and communications
Railways 55 55 51 - 75 75
Road 60 55 31 - - 80
Air 50 50 31 - - 80
Warehousing - 31 - - 80
Broadcasting 40 - 31 - - 40
Telephone and telecommunications 40 55 27 - 75 40
31
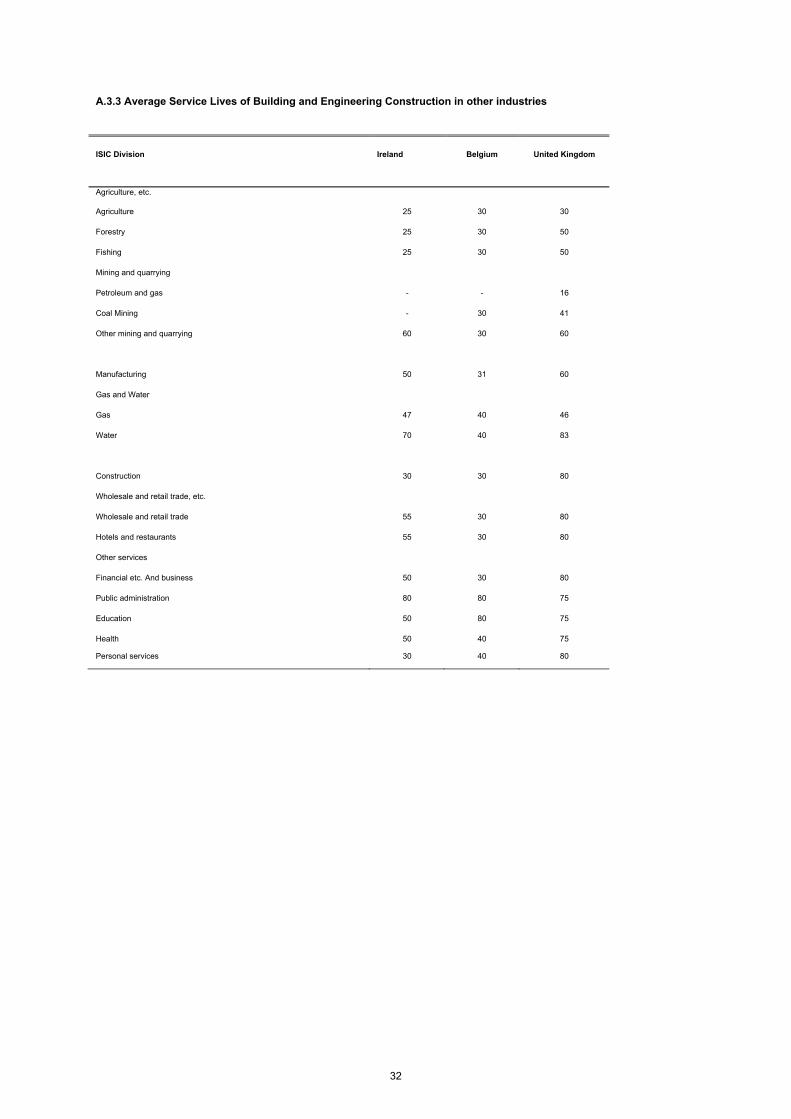
A.3.3 Average Service Lives of Building and Engineering Construction in other industries
ISIC Division Ireland Belgium United Kingdom
Agriculture, etc.
Agriculture 25 30 30
Forestry 25 30 50
Fishing 25 30 50
Mining and quarrying
Petroleum and gas - - 16
Coal Mining - 30 41
Other mining and quarrying 60 30 60
Manufacturing 50 31 60
Gas and Water
Gas 47 40 46
Water 70 40 83
Construction 30 30 80
Wholesale and retail trade, etc.
Wholesale and retail trade 55 30 80
Hotels and restaurants 55 30 80
Other services
Financial etc. And business 50 30 80
Public administration 80 80 75
Education 50 80 75
Health 50 40 75
Personal services 30 40 80
32
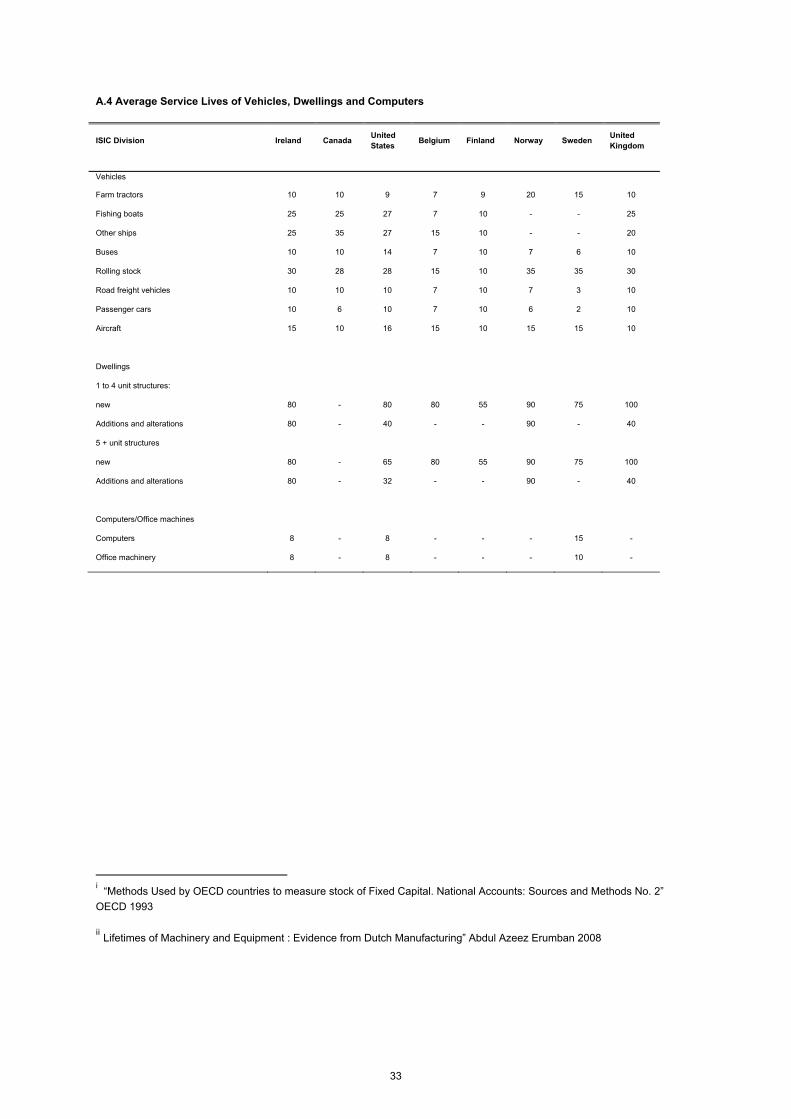
A.4 Average Service Lives of Vehicles, Dwellings and Computers
i “Methods Used by OECD countries to measure stock of Fixed Capital. National Accounts: Sources and Methods No. 2” OECD 1993
ii Lifetimes of Machinery and Equipment : Evidence from Dutch Manufacturing” Abdul Azeez Erumban 2008
ISIC Division Ireland Canada United States Belgium Finland Norway Sweden United
Kingdom
Vehicles
Farm tractors 10 10 9 7 9 20 15 10
Fishing boats 25 25 27 7 10 - - 25
Other ships 25 35 27 15 10 - - 20
Buses 10 10 14 7 10 7 6 10
Rolling stock 30 28 28 15 10 35 35 30
Road freight vehicles 10 10 10 7 10 7 3 10
Passenger cars 10 6 10 7 10 6 2 10
Aircraft 15 10 16 15 10 15 15 10
Dwellings
1 to 4 unit structures:
new 80 - 80 80 55 90 75 100
Additions and alterations 80 - 40 - - 90 - 40
5 + unit structures
new 80 - 65 80 55 90 75 100
Additions and alterations 80 - 32 - - 90 - 40
Computers/Office machines
Computers 8 - 8 - - - 15 -
Office machinery 8 - 8 - - - 10 -
33