Public-Private Partnerships: a focus on Energy ... · Ca’ Foscari Workshop . Venice, 9 May 2014 ....
20
Ca’ Foscari Workshop Venice, 9 May 2014 Public-Private Partnerships: a focus on Energy Infrastructures and Sustainable Growth
Transcript of Public-Private Partnerships: a focus on Energy ... · Ca’ Foscari Workshop . Venice, 9 May 2014 ....

Ca’ Foscari Workshop
Venice, 9 May 2014
Public-Private Partnerships: a focus on Energy Infrastructures and Sustainable Growth

The world is not enough
2,5bn
6,9bn
25%
38%
1950 2010
Global population Consumers as % of global population
2 1. Source: United Nations, World Population Prospects: The 2010 revision, medium scenario; Ambienta analysis 2. Source: McKinsey & Co, McKinsey Commodity Price Index, 1999-2001 based at 100 3. Source: Stern, DI (2006), Reversal in the trend of global anthropogenic sulfur emissions, Global Environmental Change 16, 207-220
Growth in global population and consumption driving resource demand and increasing pollution
2.75x increase in
global population
2 billion new consumers
Rising global growth and consumption1
Driving up prices of natural resources2
Increasing pollution3
40
90
140
190
240
1900 1910 1920 1930 1940 1950 1960 1970 1980 1990 2000 2010
-0.6% p.a.
1970s oil shock
0
2.000
4.000
6.000
8.000
10.000
12.000
14.000
Su
lph
ur
emis
sio
ns
(Kto
nn
es)
Sulphur emissions in emerging markets
China Brazil India
+8.9% p.a.

A European centre of excellence
Source: Ambienta research and analysis; UN; World Bank 3
Leadership in environmental businesses
Efficient energy consumption Severe scarcity of resources
High population density
99% 92% 97% 98%
1% 8% 3% 2%
Oil Coal Natural gas Iron ore
RoW Europe
0-9
10-24
25-49
People per km2
50-74
75-149
150-999
1000+
Controlling air pollution
37,4
17,6
USA EU
Electricity consumption kWh/capita/day
2008
Reaction Situation
66
8
66
Ruhr region(1981)
Ruhr region(2000-2005)
Beijing(2000-2005)
Average sulphur dioxide concentrations μg/m3
-52%

A European SME job
Source: European Commission; Number of SMEs (€10-250 million annual turnover) in the manufacturing sector 4
Focus on core industrial “belt” through Europe
Numerous global leading SME businesses
Germany: 76,000
Italy: 79,000
Nordics: 18,000
Spain: 32,000
UK: 31,000
France: 38,000
► Global demand for European pioneered technologies and services
► Developed in a fragmented industrial environment
► Hidden in tens of thousands of SMEs
Ambienta offices

4,5%
6,7%
9,1%
21,6%
France
Spain
Germany
Italy
Global niche leaders with growing succession concerns
Source: Fondazione Edison, Family business international Monitor 2008, Aidat, AUB Monitoring agency
Niche leaders across Italy and Germany
# ranking Country First Places Second Places Third Places Total
1 Germany 828 638 521 1987
2 China 1108 533 343 1984
3 USA 592 579 609 1780
4 Italy 288 382 352 1022
5 Japan 230 217 253 700
6 France 139 234 305 678
7 India 136 163 131 430
8 UK 95 120 184 399
9 Indonesia 111 93 89 293
10 Canada 76 74 101 251
11 Mexico 67 66 101 234
12 South Korea 53 80 79 212
13 Turkey 35 63 62 160
14 Brazil 41 44 45 130
15 Russia 36 50 41 127
= reference markets
5
Ambienta target markets
% of entrepreneurs over 65 years old Global niche leaders (by number of product categories)

Sector-focused approach
6
Granular approach to sub-sector targeting Addressed by Portfolio
► Environmental themes shape almost any industrial sector
► Top-down approach to reviewing resource efficiency and pollution control themes
► Systematic outbound origination based on clear investment theses
Resource Efficiency
Pollution Control
Energy
Water
Other Resources (Food, minerals,…)
Renewables
Air
Water
Soil
Renewable power
Energy Mobility Industry Infrastruct. & Buildings
Combustion efficiency
Smart grid
Energy services
Water efficiency
Energy storage
Biofuels
Combustion efficiency
Energy recovery
Hybrid and electric vehicles
Light materials
Traffic management
Car Sharing
Efficient motors
Power electronics
Efficient irrigation
Heat recovery
Energy & Resources efficient processes
Biomass power and equipment
Recycling
Water efficiency
Efficient lighting
Building automation
Insulation
Efficient heating
Higher efficiency appliances
Biomaterials
Soil remediation
Control and monitoring
Flue gas cleaning
Dust reduction
Water treatment and recycling
Advanced materials
Congestion charging
Ecosystem preservation
Engine control and abatement systems
Low emission engines
Traffic control
Waste disposal
Waste to energy
Cleaner products
Waste management
Pollution monitoring
Wastewater treatment
Leak Detection & Prevention
Cleaner products
Noise insulation
Infrastructure rehabilitation
Pollution monitoring
Air filtration
Waste management
Water treatment
$1,349bn
$443bn

Ambienta investment thesis Portfolio company Country Description Investment
date
Energy
Energy efficient lighting towers Feb-12
Offshore grouting services Jun-12
Pellet-fed stoves and boilers May-10
Water
Water treatment and filtration Oct-11
Industrial cooling systems Jun-10
Industrial Industrial processing efficiency Oct-12
Recycling Low-cost recycled plastics Feb-11
Asset investments
Renewable energy plant developer and producer Sep-08
Southern Europe’s largest pellet producer Aug-08
7
Fund I portfolio

228 263
282 312
398 438
2008 2009 2010 2011 2012 2013
104 118 126 130 129 118
27
33 36 23
56 60
2008 2009 2010 2011 2012 2013
Project debt
Other NFP items
1.303
817
981
1.134
1.240 1.261
2008 2009 2010 2011 2012 2013
27
33
40 44
59
70
2008 2009 2010 2011 2012 2013
Robust growth trajectory across investments
1. Italiana Pellets financials excluded as divested in February 2013 8
08-13: +486 YoY 12-13: +3%
+59%
Aggregated sales (€ml) Aggregated EBITDA (€ml)
Aggregated employees Net Financial position (€ml)
CAGR:+14% +40%
►Gearing ratio 0.85x
►Gearing ratio 1,7x
Project debt
Other NFP items
CAGR:+22%
+59%
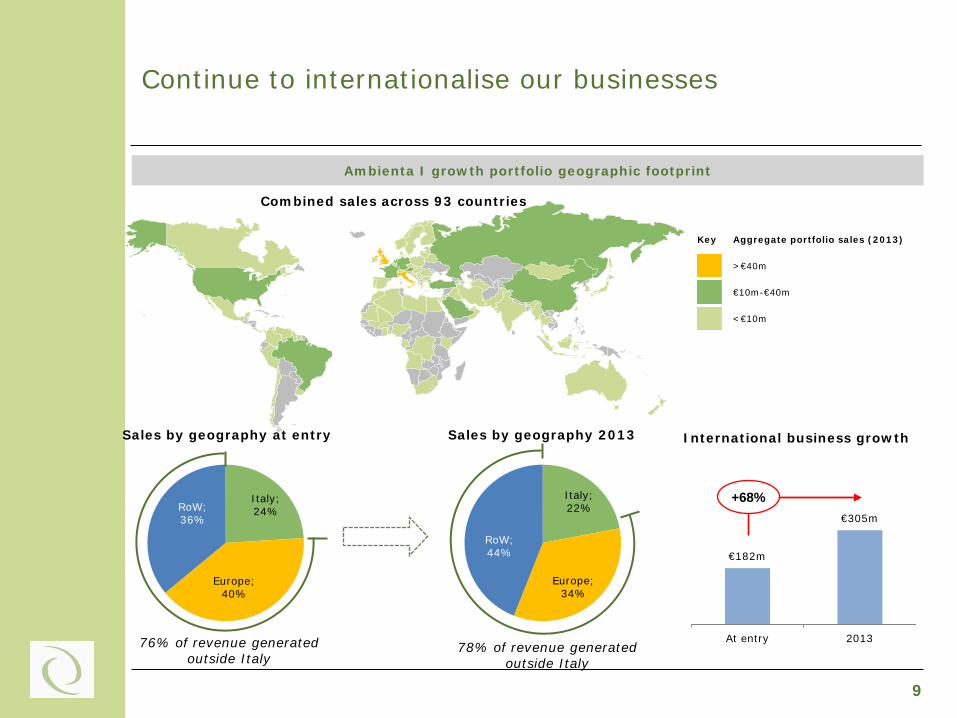
Continue to internationalise our businesses
9
Ambienta I growth portfolio geographic footprint
Sales by geography 2013
Combined sales across 93 countries
€182m
€305m
At entry 2013
+68%
International business growth
78% of revenue generated outside Italy
Italy; 22%
Europe; 34%
RoW; 44%
Key Aggregate portfolio sales (2013)
>€40m
€10m-€40m
<€10m
Italy; 24%
Europe; 40%
RoW; 36%
76% of revenue generated outside Italy
Sales by geography at entry

€19,8m
€30,9m
€37,1m
€42,5m
€3,3m
€6,4m €7,0m €8,5m
€0,0m €2,0m €4,0m €6,0m €8,0m €10,0m €12,0m €14,0m €16,0m €18,0m €20,0m
€15,0m
€20,0m
€25,0m
€30,0m
€35,0m
€40,0m
€45,0m
€50,0m
2010 2011 2012 2013
Revenue EBITDA
Tower Light Manufacturer and distributer of the world’s largest range of lighting towers
► #1 in Europe, manufacturer of the world’s largest range of lighting towers
► Increased penetration of non-infrastructure industries e.g. events, security and mining
► Two-fold increase in non-European sales
► Exit in July 2013 to Generac, a US-based manufacturer of engine powered products, realising a 3.1x MoC
Product leadership
Strong financial performance
Opportunity for safe, energy efficient, cost-effective lighting solutions driven by rise in “round-the-clock” working in global infrastructure
Deal summary Sector Lighting systems Investment date February 2012 Exit date July 2013 Headquarters Italy Sourcing Limited auction Stake 82% Acquisition EV €28.4 million Entry multiple 4.4x Investment cost €13.5 million Total proceeds1 €42.1 million Realised MoC1 3.1x cost
TL “VB9 Eco Tower” Peer products Savings
Fuel consumption 0.53 L/hour 1.93 L/hour 72%
Running cost per week €48 €175 €127 per week per
unit
Running time on full tank of fuel 320 hours 60 hours +260 hours
Labour saving on re-fuelling 1 per week 4 per week 75% in labour and
travel
1. Of which €37 million at closing with the remaining portion deferred through an earn-out structure
Investment performance
Cost Total proceeds
3.1x MoC >100% IRR
€42.0m
€13.5m
Earn-out Realised proceeds
10

Tower Light Key achievements - internationalisation
Domestic consolidation
Key foreign markets
New markets
Brazil: Established a subsidiary in Q1 2013 to capture the South American opportunity
Europe: Successful commencement of trading in Germany and continued consolidation across Western Europe
Middle East: Laid ground work to establish a direct commercial presence in the region
Italy 12%
RoW 23%
Revenues 2011
Europe 65%
€30.9m
Internationalisation
€42.5m
Italy 10%
RoW 34%
Revenues 2013
Europe 56%
11

Tower Light Exit strategy and value creation
1. Analysis completed using the original 2012 budget EBITDA (€4.8m), using an implied entry multiple of 5.9x EBITDA. Dashed line represents calculation if actual 2012 EBITDA used (€6.4m), implying an entry multiple of 4.4x EBITDA
Generac profile
► Leading US-based designer and manufacturer of generators and other engine powered products
► Listed on the NYSE, with a market cap of $2.7 billion
► Products marketed and distributed under the Generac, Magnum, Ottomotores and now the Tower Light brands
► Actively pursuing external growth opportunities with the goal of expanding its products’ range and its geographical footprint
Value creation1
► Successfully exit in July 2013
► Both companies will be able to leverage on established platforms in Europe and US to launch their respective products
► As the #1 European player, Tower Light was a natural acquisition target for
> European strategics seeking a platform extension; or
> US players seeking to expand their offering globally
► Having fulfilled many strategic objectives ahead of plan, the company received significant interest from large corporates operating in the industry
> Atlas Copco > Generac
1
2
3
4
Strategically attractive
asset
Strategic interest
Exclusive engagment
Successful exit
► Generac was rapidly granted exclusivity based on:
> Clear strategic fit between Tower Light and Generac’s declared growth strategy
> Senior attention from the outset > Attractive valuation, fully pricing in
expected 2013 performance 0,4x
0,6x 0,2x
2,7x 3,1x
EBITDAgrowth
Multipleexpansion
De-leverage Returns atclosing
EBITDAgrowth
Returns incl.earn-outbased onbudgetEBITDA
1.7x 0.9x
2.0x
12
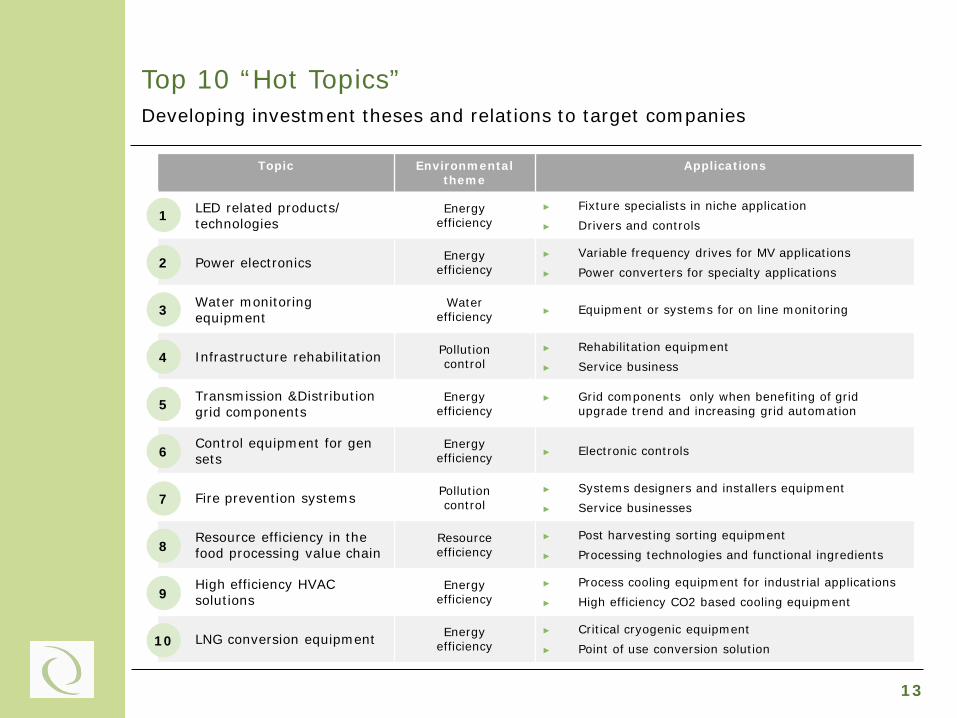
Top 10 “Hot Topics”
13
Developing investment theses and relations to target companies
Topic Environmental theme
Applications
LED related products/ technologies
Energy efficiency
► Fixture specialists in niche application ► Drivers and controls
Power electronics Energy efficiency
► Variable frequency drives for MV applications ► Power converters for specialty applications
Water monitoring equipment
Water efficiency ► Equipment or systems for on line monitoring
Infrastructure rehabilitation Pollution control
► Rehabilitation equipment ► Service business
Transmission &Distribution grid components
Energy efficiency
► Grid components only when benefiting of grid upgrade trend and increasing grid automation
Control equipment for gen sets
Energy efficiency ► Electronic controls
Fire prevention systems Pollution control
► Systems designers and installers equipment ► Service businesses
Resource efficiency in the food processing value chain
Resource efficiency
► Post harvesting sorting equipment ► Processing technologies and functional ingredients
High efficiency HVAC solutions
Energy efficiency
► Process cooling equipment for industrial applications ► High efficiency CO2 based cooling equipment
LNG conversion equipment Energy efficiency
► Critical cryogenic equipment ► Point of use conversion solution
1
2
3
4
5
6
7
8
10
9

Top 10 “Hot Topics”
14
Topic Environmental theme
Applications
LED related products/ technologies
Energy efficiency
► Fixture specialists in niche application ► Drivers and controls
Power electronics Energy efficiency
► Variable frequency drives for MV applications ► Power converters for specialty applications
Water monitoring equipment
Water efficiency ► Equipment or systems for on line monitoring
Infrastructure rehabilitation Pollution control
► Rehabilitation equipment ► Service business
Transmission &Distribution grid components
Energy efficiency
► Grid components only when benefiting of grid upgrade trend and increasing grid automation
Control equipment for gen sets
Energy efficiency ► Electronic controls
Fire prevention systems Pollution control
► Systems designers and installers equipment ► Service businesses
Resource efficiency in the food processing value chain
Resource efficiency
► Post harvesting sorting equipment ► Processing technologies and functional ingredients
High efficiency HVAC solutions
Energy efficiency
► Process cooling equipment for industrial applications ► High efficiency CO2 based cooling equipment
LNG conversion equipment Energy efficiency
► Critical cryogenic equipment ► Point of use conversion solution
1
2
3
4
5
6
7
8
10
9
32
34
36
38
40
42
44
46Price of Electricity (€/MWh)
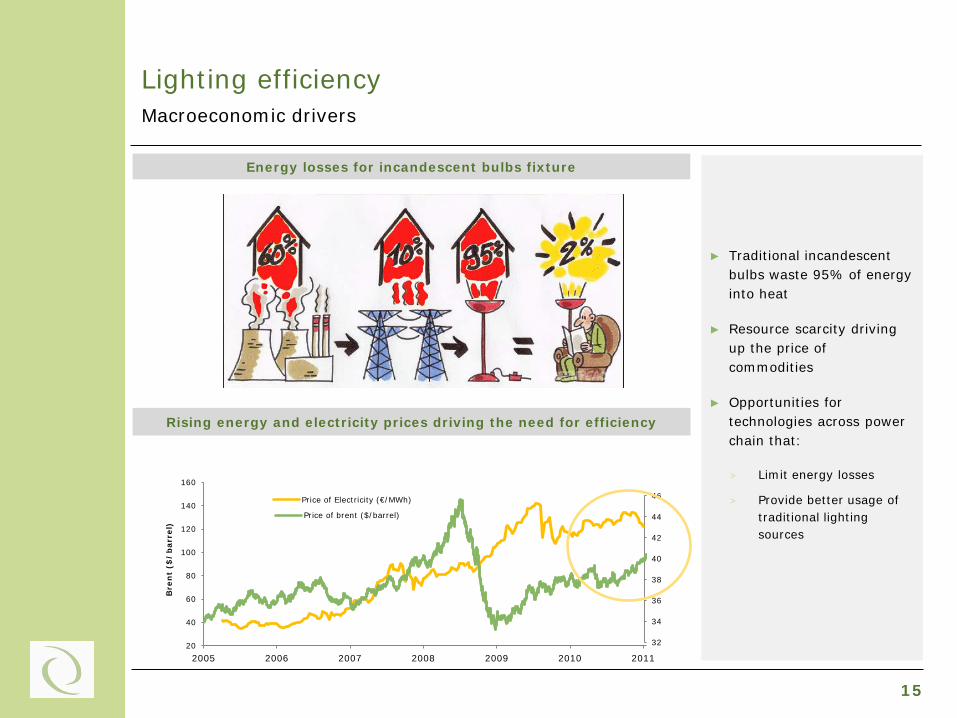
Lighting efficiency Macroeconomic drivers
Energy losses for incandescent bulbs fixture
Rising energy and electricity prices driving the need for efficiency
20
40
60
80
100
120
140
160
2005 2006 2007 2008 2009 2010 2011
Bre
nt
($/b
arre
l) Price of brent ($/barrel)
► Traditional incandescent bulbs waste 95% of energy into heat
► Resource scarcity driving up the price of commodities
► Opportunities for technologies across power chain that:
> Limit energy losses
> Provide better usage of traditional lighting sources
15

Lighting efficiency Macroeconomic drivers
Lighting: 19% of global electricity consumption
Lighting sources installed base by technology
► Lighting represent a relevant part of global electricity consumption (19%)
► Installed based of lighting devices is still dominated by old technologies like incandescent bulbs or fluorescent lamps
Global Electricity consumption
19%
81%
20’300 TWh = Lighting consumes about 3800 TWh of electricity which is:
► ~1x EU or China total electricity consumption
► ~10x UK total electricity consumption
39%
9%
2%
47%
2%
Incadescent
Halogen
HID
Fluorescent
LED
Installed base light sources = 26.4 bn pieces
16

Lighting efficiency
17
Identifying sources of efficiency along the energy value chain
LED value value chain
Chip/Epi Package Moduling Electricity control/Drivers Fixtures
Key success factor
Scale Scale Increasing technical
integration
Increasing technical integration
Differentiation and customer
relationship
Type of player
Typically large companies
► Cree
► Nichia
► Philips
► Large integrated global players
► Large integrated global players
► Select specialised players
► Large integrated players
► Some subsidiaries of diversified power supplies manufacturers
► Some specialized players
► Very fragmented market
► Both large and small local or specialized players
► Core and soul of the LED technology
► Room for improvement
► Limited number of targets around
► Commercial scalability issues
► Healthy margins
► Large target universe

Lighting efficiency
1. Source: Markets and Markets, Global LED driver IC Market for Display and Lighting Applications report, 2011 2. Source: McKinsey, Lighting the way report 2012 18
Lighting controls and fixtures: tremendous growth ahead
$5,0bn
$32,0bn
2011 2016
LED General Lighting market2
+640%
LED based general lighting market
► LED based lighting fixtures will spread because of steep decrease in chip prices and energy savings
► Segments (outdoor, indoor, architectural,…) show different growth an penetration rates
► Further segment analysis to identify best in class assets
$1,1bn
$4,4bn
2010 2015
LED drivers market1
+400%
Lighting controls market
► Lighting controls can boost LED fixtures performance and lifespan
► Lighting controls can integrate sensor and remote control options to improve usage patterns

Lighting efficiency
19
Identifying niche sectors
2 target areas identified to capture the current market opportunity
Sources of efficiency / Market
opportunity
Market size ($bn)
Target universe
LED drivers/ Controls
► Crucial part of LED technology
► Enable innovation and specific features
► c.$1,1bn ► 8 relevant
players (WIP)
Lighting fixtures
► Penetration of efficient lighting in niche applications
► €5 bn ► +60
relevant (WIP)
Large target
universe
Review of ~150
companies
2 niche areas
identified

Disclaimer
ADDRESSEE ONLY: This document (the "Document") is issued by Ambienta SGR S.p.A. (the “SGR” or “Ambienta”) and provided on a confidential basis to a limited number of sophisticated and qualified investors (subject to applicable marketing restrictions in each relevant jurisdiction). Each recipient of this Document is deemed to have agreed not to reproduce, publish or distribute in whole or in part any information contained in this Document nor should its contents be disclosed to any person, except to the recipient's professional advisers who are bound by substantially equivalent duties of confidentiality as apply to the recipient of this Document and with the prior written consent of the SGR. Upon receipt of the Document, each recipient is deemed to have agreed that the contents of this Document (A) constitute proprietary and confidential information that the SGR derives economic value from not being generally known and (B) are the subject of reasonable endeavours to maintain their secrecy. The contents of this Document are a trade secret, the disclosure of which is likely to cause substantial and irreparable competitive harm to the SGR.
CAPACITY: The SGR will not act for any recipient and will not be responsible to you for providing protections afforded to the clients of the SGR's asset management services. No member or employee of the SGR is permitted to lead you to believe otherwise. Without prejudice to the generality of the foregoing, the SGR does not provide any investment service to you. This Document is not, and must not be treated as, investment advice, investment recommendations, or investment research. Recipients of this Document must not take (or refrain from taking) any investment decision on the basis of the information set out in this Document. Before making any investment decision, you should seek independent investment, legal, tax, accounting or other professional advice as appropriate. The SGR neither provides investment advice to, nor receives or transmits orders from, recipients of this Document, nor does it carry on any other activities with or for such recipients that constitutes MiFID or equivalent third country business for the purposes of the Italian Unified Financial Act and the relevant implementing regulations issued by CONSOB and the Bank of Italy. The SGR accepts no duty of care to you in relation to investments.
NO OFFER: This Document is for information purposes only. It does not constitute an offer or invitation to subscribe for interests. The information contained herein should not be relied upon by any recipient for any purpose. Any such offer or invitation, if made, would be made only by way of a Confidential Private Placement Memorandum (or other formal offering document) and only in jurisdictions in which such an offer or invitation would be lawful.
The information contained in this Document should not be construed as either projections or predictions. The IRR figures presented on a gross basis do not take account of fund level expenses, priority profit share, carried interest and taxes borne by investors, which in aggregate may be substantial. Past performance cannot be relied on as a guide to future performance. The SGR makes no representation or warranty, express or implied, except as required by law or in the case of fraud, regarding the accuracy, completeness or adequacy of the information. To the maximum extent permitted by law, none of the SGR’s parties shall be liable (including in negligence) for any direct, indirect or consequential losses, damages, costs or expenses arising out of or in connection with the use of or reliance on this Document.
OTHER RESTRICTIONS: This Document is issued by the SGR only to and/or is directed only at persons who are permitted to receive it under the rules and regulations applicable where such persons are located. In Italy, any offer of foreign funds to resident investors, including institutional investors, and any distribution of offering documents will be subject to the prior clearance of the Bank of Italy. Other requirements will apply in other jurisdictions.
Accordingly, this Document may not be used in any jurisdiction except under circumstances that will result in compliance with any applicable laws and regulations. Recipients of this Document should inform themselves about and observe any such restrictions. Any failure to comply with these restrictions may constitute a violation of applicable securities law.
ACCURACY: The information in this presentation has not been audited or verified by any third party and is subject to change at any time, without notice. Certain information contained herein was based on or obtained or derived from data published or prepared by other parties, including, without limitation, personnel of Ambienta I portfolio companies (“Third Party Information”). While such sources are believed to be reliable, none of the Ambient aentities or any of their respective directors, officers, employees, partners, shareholders or agents (each, a “Ambienta Party”) assumes any responsibility for the accuracy of any Third-Party Information. No Ambienta Party makes any representation or warranty, express or implied, as to the accuracy of completeness of any Third Party Information or any opinions contained in this presentation. No Ambienta Party shall have any liability to any recipient of this presentation or any other person relation to or resulting from the use of or reliance on any such information contained herein or any errors therein or emissions therefrom.
INFORMATION: Ambienta SGR S.p.A. is a portfolio management company approved and regulated by the Bank of Italy and CONSOB. For further information about Ambienta SGR S.p.A. and Ambienta I please visit our website at www.ambientasgr.com or contact Stefano Bacci at [email protected]
20