Public Expenditure, by Plan Period - Documents &...
90
Report No. - 66303-NP Nepal Public Expenditure Review - Roads June, 2011 Poverty Reduction and Economic Management Sector Unit South Asia Region The World Bank
Transcript of Public Expenditure, by Plan Period - Documents &...

Report No. - 66303-NP
NepalPublic Expenditure Review - Roads
June, 2011
Poverty Reduction and Economic Management Sector UnitSouth Asia RegionThe World Bank

Document of the World Bank
CURRENCY EQUIVALENTS(Exchange rate effective June 5, 2010)Currency unit = Nepalese rupee (NPR)
US$1 = 74.95 NPRsGOVERNMENT FISCAL YEAR
July 15–July 14
ABBREVIATIONS
ADB Asian Development Bank IPSAS International Public Sector Accounting Standards
AG Auditor General LBFAR Local Bodies (Financial Administration) Regulations
APP Agriculture Perspective Plan LSGA Local Self-Governance Act
BMIS Budget Management Information System
LTO Large Taxpayer Office
CIAA Commission for the Investigation of Abuse of Authority
MDG Millennium Development Goal
DALY Disability-adjusted life year MoHP Ministry of Health and Population
DDC District Development Committee MoLD Ministry of Local Development
DDF District Development Fund MPPW Ministry of Physical Planning and Works
DECS District Expenditure Control System
MTEF Medium-Term Expenditure Framework
DfID UK Department for International Development
NARDF National Agriculture Research and Development Fund
DHS Demographic and Health Survey NER Net Enrolment Rate
DoLIDAR Department of Local Infrastructure Development and Agricultural Roads
NGO Non-Governmental Organization
DoR Department of Roads NLSS Nepal Living-Standards Survey
DTCO District Treasury and Controller Office
NPC National Planning Commission
DTMP District Transport Master Plan NRB Nepal Rastra Bank
DTW Deep Tube Well OECD/ DAC
Development-Assistance Committee of the Organisation for Economic Co-operation and Development
EHCS Essential Health Care Services PAC Public Accounts Committee
FAR Financial Administration PAF Poverty Alleviation Fund

RegulationsFCGO Financial Comptroller General
OfficePEFA Public Expenditure and Financial
Accountability FMIS Financial Management
Information SystemPFM Public Finance Management
FUG Forest User Group PPIS Project Performance Information System
GDP Gross Domestic Product PPMO Public Procurement Monitoring Office
GFS Government Fiscal Statistics (of the IMF)
PRS Poverty Reduction Strategy
GoN Government of Nepal RBN Roads Board Nepal
HIPC Heavily Indebted Poor Countries SMC School Management Committee
HSS Health Sector Strategy SOE State-owned Enterprise
IA Internal Audit SRN Strategic Road Network
IAP Immediate Action Plan STW Shallow Tube Well
IDA International Development Association
SWAp Sector-wide Approach
IDP Internally Displaced People VAT Value Added Tax
IFMIS Integrated Financial Information Management System
VDC Village Development Committee
IMF International Monetary Fund WTO World Trade Organization
Vice President Country Director Sector Director Sector ManagerTask Manager
Isabel M. Guerrero, SARVPSusan G. Goldmark, SACNPErnesto May. SASPFVinaya Swaroop. SASEPRoshan Darshan Bajracharya, SASEP

Table of Contents
ContentsAcknowledgements....................................................................................................................................vi
Executive Summary...................................................................................................................................1
1. STATE BUILDING AND THE ECONOMY............................................................................................5
2. Fiscal Framework.............................................................................................................................12
3. Transport Sector Expenditures and Outputs.................................................................................20
Public Expenditure, by Plan Period........................................................................................................22
4. Local Roads Sub-Sector: Institutional ArrangementS....................................................................36
5. Recommendations...........................................................................................................................47
BOXES: Box 1: Budget Virement and Need for Realistic Budget Making………………………………………………….…………15Box 2: Has Nepal Achieved Its Accessibility Targets………………………………………………………………………………28LIST OF FIGURES:Figure 2.1: Deficit Financing in Percentage of GDP………………………………………………………….…………………..8Figure2.2: Sources of Financing ……………………………………………………………………………………………………………10Figure 2.3: Expenditure in Percentage of GDP……………………………………………………………………………………..11Figure 2.4: Budget Spending…………………………………………………………………………………………………………………..11Figure 2.5: Community and Local Government Expenditure………………………………………………………………….12Figure 2.6: Expenditure (as percentage of GDP)…………………………………………………………………………………..12Figure 2.7: Audit Observation and Transfer Spending…………………………………………………………………………..13

Figure 2.8: Spending in Third Trimester…………………………………………………………………………………………………14Figure 2.9: Budget Virement (in Rs. million).....................................................................15Figure 3.1: Public Expenditure in Major Sectors as Percentage of GDP………………………………………………..17Figure 3.2: Public Expenditure as Percentage of GDP……………………………………………………………………………17Figure 3.3: Social Sector Spending ………………………………………………………………………………………………………..18Figure 3.4: Road Sector Investment as Percentage of GDP…………………………………………………………………….19Figure 3.5: Road Investment…………………………………………………………………………………………………………………….20Figure 3.6: Road Sector Expenditure……………………………………………………………………………………………………….20Figure 3.7: Central Subsector Road Investment…………………………………………………………………………………21Figure 3.8: Road Maintenance: Source and Uses………………………………………………………………………………..22Figure 3.9: As Percentage of Road Sector Spending……………………………………………………………………………22Figure 3.10: Districts Road Sector Investment by Region…………………………………………………………………..23Figure 3.11: Road Sector Investment by Region…………………………………………………………………………………24Figure 3.12 Road Sector Spending by Ecological Belt…………………………………………………………………………25Figure 3.13 Road Sector Per Capita Expenditure in Nepalese Rupee………………………………………………..25Figure 3.15: FY 04 Types of Road by Region……………………………………………………………………………………….29Figure 3.16 FY 10 Types of Road by Region……………………………………………………..…………………………………29Figure 4.1: Mapping of Institutional Arrangements for Local Road Sub-Sector…………………………………..33 LIST OF TABLES:Table 1.1: Real GDP Growth Rates………………………………………………………………………………………………………2

Table 2.1: Tax revenue (as percentage of GDP)…………………………………………………………………………………9Table 2.2: Fiscal Performance (percentage of GDP)………………………………………………………………………….11Table 3.1: Selected Indicator in social Sector…………………………………………………………………………………..18Table 3.2: Road Sector Investment: Channel (as percentage of total)……………………………………………..22Table 3.3: Status: Road Network (Kilometer)………………………………………………………………………….………..26Table 3.4: DoR Category of Roads in Region (kilometers)………………………………………………………………….27Table 3.5: Status: Road Network By Ecological Belt and Category (kilometer)…………………………………27Table 3.6: Time Duration to Reach the Road…………………………………………………………………………………….28Table 3.7: Types of Road Constructed in percent of total………………………………………………………………….30Table 3.8: Walking Time to Nearest All-Season Road…………………………………………………………………….…..31Table 4.1: Road Classification…………………………………………………………………………………………………………....32Table 4.2: Road Specific and Non-Road Specific Programs in MolD Cluster……………………………………....35Table 4.3: Actual Budget and Accomplishments in Local Road-related Programs/Project under MolD/DoLIDAR……………………………………………………………………………………………………………………………………..36Table 4.4: Actual Budget and Accomplishment in Local Road –Related/Projects under MolD/DoLIAR.37Table 4.5: Staffing in DoLIDAR and Support Offices…………………………………………………………………………….42
LIST OF CHARTS:Chart :1: CPI Nepal and India………………………………………………………………………………………………………………….3Chart 2: Deficit Financing in Percentage of GDP…………………………………………………………………………………….3

Chart 3: Private Credit Growth and Interbank Interestrates………………………………………………………………….5Chart 4: Total Credit and Deposit of Commercial Banks (In Rs. Billion)…………………………………………………5
ACKNOWLEDGEMENTS
1. The Public Expenditure Review process that led to this report was initiated in September, 2010 under the guidance of Mr. Som Lal Subedhi, Joint Secretary, Ministry of Local Development.
2. This document builds on earlier reports, including the World Bank’s 2000 Public Expenditure Review; Managing Public Finances for New Nepal, 2007; and, Reforms under Fiscal Stress: A Policy Note on the Priorities for Fiscal and Budget Reform in Nepal, 2006; Nepal: Public Expenditure Review, 2010.
3. The World Bank team was led by Roshan Darshan Bajracharyan. The team was composed of Surendra Govinda Joshi, Farhad Ahmed, Hiramani Ghimire, Deepak Man Singh Shrestha Prajwal Shahi, Sunita Kumari Yadav and consultants: Raghav Regmi (DECC), Hari Regmi (DECC), Shreehari Dhungana and Dr. Dinesh Pant. The team worked under the guidance of Susan G. Goldmark, Country Director, Vinaya Swaroop and Michel Audige, Sector Managers, Mr. Deepak Bhattasali, Lead Economist and Hisanobu Shishido, Policy Cluster Leader,. Peer reviewers who provided comments included Mr. Som Lal Subedhi, Joint Secretary, and Yasuhiko Matsuda, Sr. Public Sector Specialist, World Bank.
4. The concept note for the work program was reviewed in November 2010. Preliminary findings of the Public Expenditure Review were shared with concerned government officials and specifically with Ministry of Local Development.

EXECUTIVE SUMMARY
Introduction
The Government of Nepal has achieved several of the Millennium Development Goals (MDGs), while maintaining macroeconomic stability and prudent fiscal management. Strengthening public expenditure management is an ongoing reform agenda of the government’s Three Year Plan, an inclusive development strategy. The World Bank is contributing to this public expenditure management-strengthening agenda through a programmatic and participatory Public Expenditure Review (PER) conducted jointly with the government, relevant sector ministries and donors. This report is the second of several in the programmatic PER to assist the government to align resources in the Three Year Plan and explore potential actions that contribute to improving public expenditure and its management. This report builds on the PER 2010 report analysis of evolving fiscal aggregates and public expenditure trends, and drills deeper into road sector public financial management issues in order to improve the sector’s performance. Analysis of this report is based on government’s official data.
Fiscal Outcomes
Prudent fiscal management has kept the net domestic financing requirement and primary deficit at sustainable levels, a remarkable achievement. Prudent fiscal management, aid availability and strong revenue performance have widened fiscal space and allowed the government to increase public expenditure. The debt level is the lowest in the region (37 percent of GDP in fiscal 2010) and is declining; the primary deficit never exceeded 2 percent of GDP and with low debt stock and loan use, the debt level is expected stay within this range in the medium term; and, with government policy to keep net domestic financing within the range of 2 -2.5 percent of GDP, the overall fiscal aggregate balance does not provide fiscal space to meet development expenditure factoring in loss of state owned enterprises, cost of integration and subsidies.
The overall budget deficit is low, current expenditure is rising while fixed capital expenditure is declining. Current expenditure is 14 percent of GDP, from 11 percent at end of the Tenth Plan (2007), with higher wages and pension payments, and a rapid rise in non-salary expenditure, such as transfers and supplies. This has eroded spending space on capital formation; fixed capital formation increased to 3.3 percent of GDP in fiscal 2010, from 2.1 percent in fiscal 2005, but is still too low to boost productivity of the economy. Transfer payments (current and capital) have become a new channel for investment and are increasing rapidly – to 8.1 percent of GDP, from 4.4 percent, and are a source of rising concern over governance in public expenditure.
Revenue growth has been impressive, increasing by 1 percentage point of GDP annually for the past four years, but this bullish trend is slowing down. Revenue collection is trade dependent, amounting to 42 percent of tax revenues. With the slowing of import growth, the tax rate increase on major products, narrowing of price arbitrage in favor of domestic importers, low capital expenditure and hemorrhaging
1
of VAT collection, the revenue collection target of 15.9 percent of GDP will be missed this fiscal year, for the first time in four years. Planned public expenditure under the Three Year Plan will have to account for this slowdown in revenue collection if it is to maintain a prudent fiscal aggregate balance and protect the social sector’s outcome gains from past public expenditure.
Aid availability is rising, but implementation constraints will lower the absorption rate. Aid absorption has increased to 2.6 percent of GDP, from 1.8 percent in the Tenth Plan period. But, with polity disturbing implementation space, aid absorption capacity will stay low and thus maintain donors’ preference to deliver aid outside the budget, which challenges the primacy of the budget as the primary instrument of national policy.
Concerns about the poor quality of public investment abound; the recent trend towards transfer payments in public investment is raising serious concerns about governance. For every rupee channeled through transfers, 30 “paisa” of expenditure fall into the “audit observation” category. There is a correlation between transfers to local governments and the level of audit observations. It is a governance issue that raises questions about the efficiency of public expenditure, and needs to be addressed.
Inter-Sectoral Budget Allocations
Investment in the social sector is a priority, but it is shifting towards the economic sector. There has been a single percentage point increase in GDP expenditure in the social sector each year since fiscal 2007. The state’s expenditure emphasis is in the education, health and local development sectors. But with the Three Year Plan’s emphasis on connectivity and access to social and economic capital, the plan’s implementing policy directive is to increase economic sector funding – especially in transport and power. The economic sector’s investments averaged 4.2 percent of GDP (fiscal 2003-2010) and are projected to reach 6.3 percent in fiscal 2011, the first year of the plan.
The economic sectoral investments are meant to improve and increase access of services to, and expand connectivity of, underserved regions and populations. All 75 district headquarters are to be connected by road, and a further 9 percent of the population will have access to electricity (currently, just 71 of the headquarters are linked by road and 56 percent of the population is in reach of electricity). To achieve this outcome, resources are shifting to the power and transport sectors. Spending in transport rose from a low base of 1 percent of GDP in fiscal 2009 to 1.5 percent in fiscal 2010, and is projected at reach 2 percent in fiscal 2011. The power sector’s investments are expected to reach 1.2 percent of GDP in fiscal 2011, from 0.6 percent in fiscal 2009. Investments in these two sectors are very much aligned to the Three Year Plan, with a capital investment outlay direction of 35 percent of total capital investments. With such a level of investment, the plan aims to add 675 kilometers of roads, other than rural roads, and 281 megawatts of power by fiscal 2013.
Despite impressive gains initially, the government is in danger of missing its social sector outcome targets. After impressive outcome gains, important social sectors may fall short of their targets – especially in health. The health sector’s annual spending growth rate is falling; from a high of 18 percent
2

of GDP in fiscal 2009 it dropped to 5 percent in fiscal 2010, reflecting unaddressed systemic issues in the sector.
Roads: Outcomes, Challenges and Recommendations
Nepal’s accessibility national indicators are within reach. The preliminary estimates of National Living Standards Survey – III (2011) suggests that Nepal is within reach of achieving its national accessibility targets. While in Tarai the accessibility is 6 percent below the national target and in the Hills it is below 10.6 percent, 91 percent of the Hills people and nearly 100 percent of those in Tarai are within the specified two- and four-hours’ walking distance from a dirt road.
Rural road is the priority and much of these roads are earthen. The government has prioritized expansion of rural roads (33 percent of road sector investment, 2613 km. of new roads per year). Second priority of the government is in strategic roads (26 percent of road sector investment, 148 km. of new roads per year). Maintenance and rehabilitation has gained priority as from fiscal year 2011 equaling investment level of strategic roads and is the result of the government’s policy shift in the emphasis in road maintenance.
Three features of road sector outcomes need improvement. Firstly, only one-fifth of district headquarters can be accessed by roads during the monsoon (14 district headquarters out of 75 districts do not have all-weather roads). Secondly, only 40 percent of the population has access to paved roads within 20-minute’s walk, while the national indicator suggests access for Tarai and Hills people to the nearest all weather roads may be within reach. And, thirdly, proportion of strategic roads network (SRN) in poor condition has increased to 22.4 percent in fiscal 2010, from 18 percent in fiscal 2008.
Two salient features of the roads public expenditure pattern need highlighting: (i) rural roads are expanding; and (ii) while rehabilitation and maintenance expenditure is being prioritized, the efficacy of investment in rehabilitation and maintenance is questionable, given that the maintenance budget increase is insufficient to cover the rate of road expansion.
The accessibility gap should guide investment in the roads sectors according to regional and ecological belts. To raise the level of accessibility to all-weather roads, roads should be upgraded in stages, from dirt to gravel and from gravel to bitumen. This will require a policy directive to change the current rules and impose penalties on the noncompliant.
Review the transfer policy for better downstream accounting of expenditure. The transfer of funds to local governments for development activities is an important empowerment vehicle but it also increases governance issues downstream. Vertical transfer to local governments should be tied to improvement of the downstream accountability indicator, which should reduce audit observations.
Restore realism in the budget. To restore realism in the budget, begin reducing virement of funds by early approvals of annual work plan of budget and halt the practice of virement altogether nine months into the fiscal year.
3

Strengthen Road Fund Board’s capacity for maintenance of road network.
Institutional Challenges
Public sector organizations have crowded out the informal sector in road construction. State organizations from two major ministries and departments (i.e., the Ministry of Physical Planning and Works’ Department of Roads (DoR); and the Ministry of Local Development’s Department of Local Infrastructure Development and Agricultural Roads (DoLIDAR)), have left no room for the informal sector, notably user committees in some areas, effectively marginalizing NGOs and CBOs and preventing them from raising public awareness and improving people’s contributions to the functioning of the infrastructure.
The focus of the DoR on strategic roads construction is constrained by its workload . Local participation in road construction has fostered ownership but there is troubling evidence of people’s contribution being on paper only. The increasing use of mechanical dozers to build roads is limiting people’s participation
A lapse in the national road policy has encouraged duplication of work. The DoR is engaged in local road programs although its primary responsibility is to expand strategic roads. The definition of rural and agricultural roads is vague and no institution is designated under the Three Year Plan to monitor targets; the District Transport Master Plan guides only donor-funded rural roads programs.
Recommendations for Strengthen Road-Sector Institutions
A single, umbrella law and policy should guide roads-sector development, starting with completion of local roads network (LRN) strategy. On rural roads, there should be a delineation of responsibilities between the DoR and the DoLIDAR.
Roads-sector public financial management must be improved. The records of uses and sources of roads funds for local area development are woefully inadequate to enable proper policymaking or evaluation. Strengthening of PFM in roads-sector institutions will reduce costs due to multiple reporting and duplication of work, and increase efficiency of investments, strengthen overall governance by increasing transparency and accountability in the use of funds, and support accountability to local beneficiaries. The first step could be to make it mandatory to report all sources of funds for local development.
Roads-sector planning and impact of public investment must be improved. To improve planning, monitoring and execution of road programs, consider: (i) Controlling overall LRN expansion through the District Transport Master Plan; (ii) Assigning a code to each road for monitoring physical and financial progress and; (iii) Assigning road asset management at national level to DoLIDAR and at local level, to District Development Committees.
4
1. STATE BUILDING AND THE ECONOMY
Key Messages
Nepal is still in the middle of a critical political transition. The Constitution Assembly (CA) was extended the second time for three months on May 29th 2011, and if the contentions are not resolved, Nepal’s political scenario will look more unstable.
The peace process has not been smooth, and uncertainties have prevented the so-called “peace dividend” from peace reaching Nepali citizens.
Fiscal management remains prudent, economic growth has slowed with current and balance-of-payment deficits. The cost of integration and use of subsidies give additional cause for fiscal concern.
Summary
Nepal’s political transition continues with uncertainty. A three-month extension of the Constitution Assembly (CA) was voted on May 29th 2011 – the second such extension. While the political transition process has continued, economic reform has taken a back seat, further hampering growth. Fiscal 2011 GDP growth is projected to be 3.5 percent, the lowest since peace was achieved. Law and order problems, difficult industrial relationships, and infrastructural bottlenecks, especially power shortages have added to the climate of uncertainty. In addition, tight credit conditions and delays in capital spending are weighing on growth. Inflation remained in the low teens throughout fiscal 2010 and early 2011, with high food inflation and imported inflation from India.
Political Context
1.1 Four years after the comprehensive peace agreement was signed, the Nepal political transition process is still ongoing. The period has seen a rise in ethnic identity movements which, along with the decision to move to federalism, is making the transition longer. With CA members and party leaders focused on management of the political transition, too little attention has been given to implementation of reforms to improve the investment climate and stimulate growth, thereby creating more private-sector jobs.
1.2 A new coalition government was formed on February 3, 2011 under leadership of the Communist Party-UML (Unified Marxist-Leninist) – after a caretaker government had been in place for more than seven months. The coalition consists of the UML party, Unified Communist Party of Nepal (Maoists), and parties representing “Madesh” groups living in the Tarai regions. The new government has expressed its intention to move quickly to create an integrated national military and issue the new constitution. The risk of continued uncertainty exists because of intra- and inter-party differences that dominate the political scene.
5

1.3 On May 29th 2011 the CA was extended for three months to complete the writing of a new Constitution. A five-point deal secured the extension of the CA, the second such extension in four years. The deal lacks specifics and details, being: (i) to complete the basic tasks of the peace process within three months; (ii) to prepare the first draft of the Constitution in the CA within three months; (iii) to implement effectively various agreements already reached with the “Madhesi Front”, including one to make the Nepal Army an inclusive institution; (iv) to extend the CA term by three months; and (v) for the Prime Minister to resign and pave the way for the formation of a consensus national unity government.
1.4 The CA still needs to settle more than a dozen critical contestations, notably those related to state restructuring and forms of governance. However, the leading UCPN-Maoist party has lately said it accepts the Nepal army proposal on integration of Maoist ex-combatants – involving the establishment of a new directorate composed of the Nepal Army (35 percent), PLA (35 percent), Armed Police (15 percent) and Civilian Police (15 percent) that would primarily be assigned to non-combat duties. However, many issues remain to be resolved, including leadership of the new directorate, harmonization of ranks, numbers and modalities for integration, and compensation packages for ex-combatants opting for voluntary retirement and rehabilitation.
Economic Profile
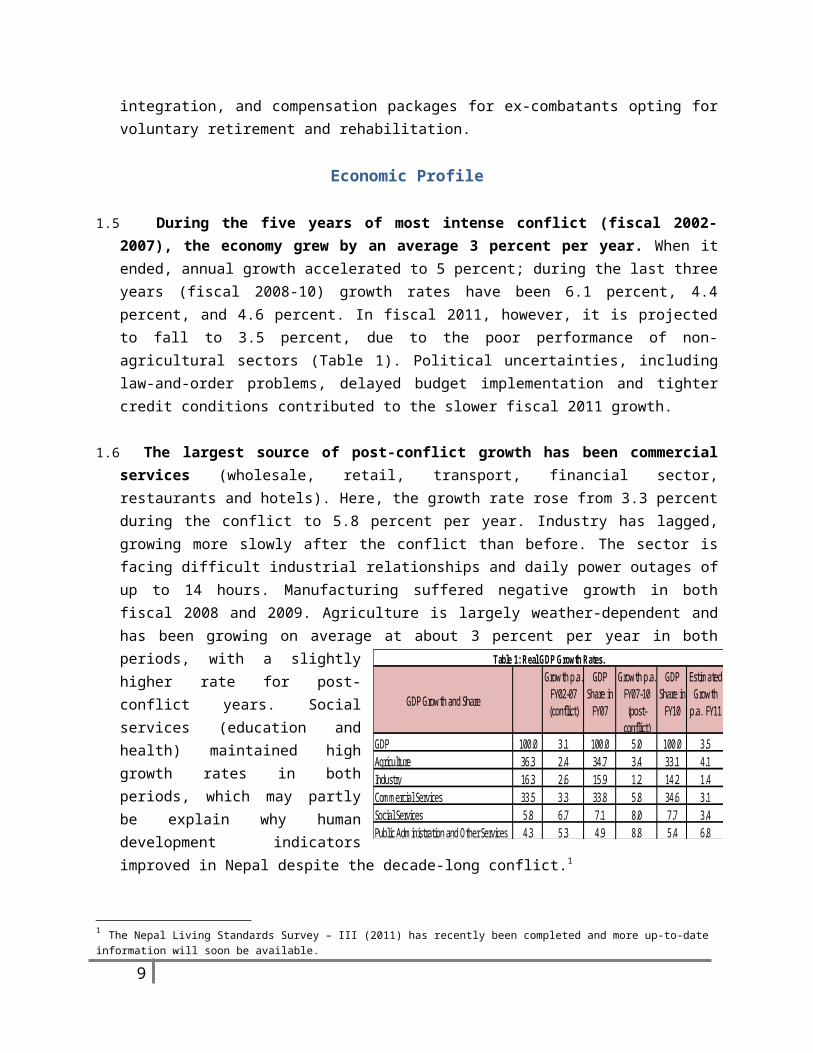
1.5 During the five years of most intense conflict (fiscal 2002-2007), the economy grew by an average 3 percent per year. When it ended, annual growth accelerated to 5 percent; during the last three years (fiscal 2008-10) growth rates have been 6.1 percent, 4.4 percent, and 4.6 percent. In fiscal 2011, however, it is projected to fall to 3.5 percent, due to the poor performance of non-agricultural sectors (Table 1). Political uncertainties, including law-and-order problems, delayed budget implementation and tighter credit conditions contributed to the slower fiscal 2011 growth.
1.6 The largest source of post-conflict growth has been commercial services (wholesale, retail, transport, financial sector, restaurants and hotels). Here, the growth rate rose from 3.3 percent during the conflict to 5.8 percent per year. Industry has lagged, growing more slowly after the conflict than before. The sector is facing difficult industrial relationships and daily power outages of up to 14 hours. Manufacturing suffered negative growth in both fiscal 2008 and 2009. Agriculture is largely weather-dependent and has been growing on average at about 3 percent per year in both periods, with a slightly higher rate for post-conflict years. Social services (education and health) maintained high growth rates in both periods, which
6
GDP 100.0 3.1 100.0 5.0 100.0 3.5Agriculture 36.3 2.4 34.7 3.4 33.1 4.1Industry 16.3 2.6 15.9 1.2 14.2 1.4Commercial Services 33.5 3.3 33.8 5.8 34.6 3.1Social Services 5.8 6.7 7.1 8.0 7.7 3.4Public Administration and Other Services 4.3 5.3 4.9 8.8 5.4 6.8
Estimated Growth
p.a. FY11
Table 1: Real GDP Growth Rates.
GDP Growth and Share
Growth p.a. FY02-07 (conflict)
GDP Share in
FY07
Growth p.a. FY07-10 (post-
conflict)
GDP Share in
FY10

may partly be explain why human development indicators improved in Nepal despite the decade-long conflict.1
1.7 Remittance has remained sizeable although its growth has slowed. Officially recorded remittance is now equivalent to 20 percent of GDP, excluding flows from India and other flows that use informal channels such as hundi. Including the informal flows, total remittance could exceed 25 percent of GDP. Inflows grew by 13 percent a year in nominal NRs terms during fiscal 2001-07, and have accelerated to 32 percent over the last three years. In both fiscal 2008 and 2009, the growth of remittance exceeded 40 percent a year and, as a consequence, real disposable income grew by 7-9 percent annually during these two years. In the absence of viable investment opportunities in other sectors, this flow was largely consumed; fueling imports, and eventually found its way into real estate. Asset prices rose rapidly, and speculative activities also increased. Banks and other financial institutions are seen to have financed a significant portion of the real estate transactions. Growth of remittance has, however, stabilized to around 10-12 percent now, helping cool the boom. But increasing numbers of Nepalese workers are heading abroad.
1.8 Consumption has thus been the main growth driver. The growth in consumption has been contributing 200 percent of the change in GDP for the last three years, more than offsetting the negative effects on demand from net exports. Capital formation explains only 10 percent of growth during the same period due in part to security issues and political uncertainties. This level is clearly insufficient for a country that desperately needs infrastructure investment to help accelerate inclusive growth. Gross exports have steadily declined as a share of GDP during the last decade, while imports have grown
1 The Nepal Living Standards Survey – III (2011) has recently been completed and more up-to-date information will soon be available.
7
0.0
5.0
10.0
15.0
20.0
25.0
Jan
-08
Feb
-08
Mar
-08
Apr
-08
May
-08
Jun
-08
Jul
-08
Aug
-08
Sep
-08
Oct
-08
Nov
-08
Dec
-08
Jan
-09
Feb
-09
Mar
-09
Apr
-09
May
-09
Jun
-09
Jul
-09
Aug
-09
Sep
-09
Oct
-09
Nov
-09
Dec
-09
Jan
-10
Feb
-10
Mar
-10
Apr
-10
May
-10
Jun
-10
Jul
-10
Aug
-10
Sep
-10
Oct
-10
Nov
-10
Dec
-10
Jan
-11
Chart 1: CPI Nepal and India( y/y change)
Nepal Food Nepal Non-Food Nepal CPI India CPI Industrial
-9.00
-8.00
-7.00
-6.00
-5.00
-4.00
-3.00
-2.00
-1.00
0.00
1.00
FY 02 FY 03 FY 04 FY 05 FY 06 FY 07 FY 08 FY 09 FY 10 FY 11 Budget
Chart 2: Deficit Financingin percent of GDP
Overall balance before grants (fiscal) Domestic finance netPrimary Deficit

strongly on the back of remittance – so the external sector, on net, has exerted a contractionary pressure on national income.
1.9 Inflation has been within the 10-12 percent range, due mostly to food price increases and the lagged impact of earlier monetary expansion. With accommodative monetary management and high liquidity associated with remittance, inflation rose to nearly 15 percent in 2008 and has since stayed at double digits. Although money growth slowed in fiscal 2010, inflation held to around 10 percent. In addition, during most of fiscal 2010, Indian inflation was higher than Nepal’s which, given the open border, resulted in imported inflation.
1.10 Prudent fiscal management has been maintained in terms of keeping both the net domestic financing requirement and primary deficit at sustainable levels. The rapid expansion of expenditures has been supported by strong revenue performance and the availability of foreign aid. Revenue collection increased from 10.8 percent of GDP to 15.0 percent during fiscal 2006-10. Donors’ grant commitments have also increased, but implementation capacity is limiting their disbursements to less than 3 percent of GDP.
1.11 Major fiscal issues are expenditure quality and speed of implementation. The government continues to use the Medium Term Expenditure Framework (MTEF) in preparing annual budgets. In MTEF, spending ceilings are established in line with available resources and allocations are made according to agreed national and sectoral priorities. But recently, MTEF ceilings are inadequately enforced, and more than 80 percent of the proposed spending is classified as the highest priority – reducing the benefit of prioritization. Furthermore, approval of “annual work plan budgets” is delayed often, pushing back the start of implementation. This causes further bunching of spending; more than 70 percent of capital expenditure is disbursed in the last trimester of the fiscal year.
With such bunching, the quality of expenditure is obviously suffering. Financial recording and reconciliation of treasury accounts have also been weakened by late submission of reimbursement accounts and late reporting of non-cash expenditures.
1.12 Monetary policy was accommodative through fiscal 2010 and contributed to credit and real estate cycles. Reflecting high growth in remittance flows in fiscal 2008 and 2009, broad money grew by 25 percent and 27 percent. Private sector credit also expanded by 24 percent and 29 percent in these two years. Inflation rose, as a result, to 13.2 percent in fiscal 2009 (period average).
8
1.13 To stabilize the overheated economy, the central bank targeted 17 percent money growth and 7 percent inflation for fiscal 2010. Early in that year, broad money continued to grow as fast as in fiscal 2009 but its growth gradually tapered off with an increasing BOP deficit and associated reserve losses. Sluggish exports combined with continued high import growth resulted in a large trade deficit of US$3.9 billion, or about 27 percent of GDP. Remittances, which in the past were enough to offset trade gaps, started to grow slowly in fiscal 2010 turning the current account to deficit. Capital flight was also widespread (using gold imports as a major conduit) and added to the deficit. All these contributed to the overall BOP deficit of more than US$100 million in fiscal 2010. Net foreign assets declined significantly, and despite the Nepal Rastra Bank (NRB) injecting liquidity equal to 20 percent of initial money stock, broad money grew by only 14 percent. Private credit growth also slowed to 14 percent in fiscal 2010.
1.14 The credit boom based in real estate lending appears to be ending. The end began with a commercial banks’ liquidity crunch caused by slowing of deposit growth while credits continued to expand. Deposits started to stagnate as early as late-2009 with the general public’s preference to hold cash prompted by intensified scrutiny on real estate transactions and under the Anti Money-Laundering Act. Commercial banks’ deposits declined further because of competition from new banks and non-bank financial institutions that offered higher deposit rates. This raised the average credit-to-deposit (CD) ratios to nearly 90 percent from 60-70 percent seen during 2000-06. Currently, most commercial banks have CD ratios exceeding 90 percent. During the first half of fiscal 2011, credit continued to expand, though slowly, while deposits have stagnated. All this has reduced the capacity of commercial banks to extend new loans, leaving many businesses, including real estate speculators, short of cash. Thus,
9
0.0
5.0
10.0
15.0
20.0
25.0
30.0
35.0
Chart 3: Private credit growth and interbank interest rates ( in percent)
M2 growth Weighted Average Interbank Transaction Rate Private credit growth rate
0.0
100.0
200.0
300.0
400.0
500.0
600.0
700.0
FY07 Q1
FY07 Q2
FY07 Q3
FY07 Q4
FY 08 Q1
FY 08 Q2
FY 08 Q3
FY 08 Q4
FY 09 Q1
FY 09 Q2
FY 09 Q3
FY 09 Q4
FY 10 Q1
FY 10 Q2
FY 10 Q3
FY 10 Q4
FY 11 Q1
FY 11 Q2
Chart 4: Total Credit and Deposit of Commercial Banks (In Rs. Billions)
Total Deposits LCY Total CreditSource:NRB
the NRB has been taking proactive actions to enhance supervision and enforce appropriate prudential regulations to ensure soundness of the financial sector.
1.15 Nepal’s merchandise exports are stagnating in nominal terms – staying at less than US$1 billion over the last ten years. As a share of GDP, exports have declined continuously from 13 percent to 5 percent over the same period – as traditional exports such as carpets, pashmena, and ready-made garments struggle while other export commodities are not being developed. Furthermore, external competitiveness has been eroded by the appreciating real exchange rate and increasing real wages, both of which are due in part to high remittance inflows. A relatively bright spot is service exports: tourism receipts rose 2.5 times since the end of the conflict, to US$380 million in fiscal 2010 (but still at 2.4 percent of GDP). The sector has strong potential although it could fluctuate with the overall law-and-order situation and political uncertainty; tourism receipts during the first six months of fiscal 2011 are 15 percent below those of the same period last year.
1.16 The fiscal 2010 trade deficit expanded as imports continued to surge, fueled in large part by remittance. Major imports are oil products, automobiles/motor cycles, and building materials – in addition to gold and silver that could be used speculatively. The overall import structure is increasingly consumption oriented – and imports are now six times the size of exports. Trade deficit rose accordingly, but rising remittance financed the gap, and kept the current and the overall accounts positive in most years. These balances, however, turned to deficit in fiscal 2010. This is because imports grew by 38 percent while remittance growth slowed to 15 percent (in dollar terms). As a result, the trade deficit rose to 27 percent of GDP, and the current account turned to deficit; this led to reserve loss of US$100 million in fiscal 2010.
1.17 To contain and reverse the high trade deficit, the government increased tariff rates and domestic sales prices of petroleum products, and even auctioned the gold it had to ease market demand. Together with the monetary tightening, these measures have helped to reduce import growth in the first six months of fiscal 2011 to 2.8 percent. With the rebound of export growth to 12.7 percent (as opposed to a decline of 7.4 percent during the first sixth months of fiscal 2010), both the current account and overall balances have improved to near zero, although still in deficit. Official reserves have been maintained at US$2.8 billion.
10
-10.0
-5.0
0.0
5.0
10.0
15.0
20.0
25.0
30.0
FY 02 FY 03 FY 04 FY 05 FY 06 FY 07 FY 08 FY 09 FY 10 2010 2011
First six months
Chart 5: Remittances and Trade Deficit( as percent of GDP)
Worker remittances Current account balance
Reserves, net change Trade deficit incl. sevice

Nepal’s Development Strategy and Reform Agenda
1.18 The Three Year Plan (2011-2013) guides development challenges. It is aimed at building a foundation for sustained growth under a federal structure. Its core crosscutting policies are to:
Attain employment-centric, broad-based economic growth that is inclusive and equitable;
Develop infrastructure for regional balance under a federal structure; Make governance and service delivery effective and mainstream trade in
development; and Support the process of socioeconomic transformation.
1.19 Political uncertainties have taken their toll by slowing the economy. With unstable law-and-order situation, uncertainty about property rights, difficult worker-management relationships, and infrastructural bottlenecks are drawing down the growth rates necessary for meet the Three Year Plan’s outcomes. However, remittance growth and expansion of the informal sector will likely sustain the pace of consumption-led growth in revenue collection, put pressure on current and reserve accounts, maintain the poverty decline and, if the investment climate improves, continue to extend economic activities from informal to formal.
1.20 The emerging fiscal risks stem from the cost of integration of two armies, the burden of an expanding government bureaucracy and the absence of meaningful regulations to contain the fiscal hemorrhaging in state enterprises.
1.21 Looming structural challenges, especially in the proposed federal structure, remain largely unaddressed. The modalities of fiscal devolution under the restructured state are still unclear and, if pressed ahead without due diligence because of political commitments, will lead to a weakening of the otherwise-prudent fiscal aggregates.□
11

Figure 2.1 Deficit Financing in Percent of GDP
-9.00
-8.00
-7.00
-6.00
-5.00
-4.00
-3.00
-2.00
-1.00
0.00
1.00
FY 02 FY 03 FY 04 FY 05 FY 06 FY 07 FY 08 FY 09 FY 10 FY 11 Budget
Deficit Financingin percent of GDP
Overall balance before grants (fiscal) Domestic finance netPrimary Deficit
2. FISCAL FRAMEWORK
Summary
This chapter reviews performance of macro fiscal aggregates in various national plans, particularly the Interim Plan and the first year’s budget of the new Three Year Plan. The chapter builds on findings of “Nepal – Public Expenditure Review 2010”, examining macro fiscal performance and outlining key emerging fiscal issues.
Macro Fiscal Performance
2.1 Prudent fiscal management has kept both the net domestic financing requirement and primary deficit at sustainable levels. Tax administration reforms, consumption-led imports – fueled by remittance2 – and liberal monetary policy that failed to sterilize the remittance inflow have increased revenue collection by an average of 1 percentage point of GDP annually since 2007. Aid availability, more use of grants than loans, have served to keep domestic borrowing to 2 percent on GDP and the primary deficit below 2 percent of GDP.
2 20 of GDP in fiscal 2010.
12
Key Messages
Prudent fiscal management has kept both the net domestic financing requirement and primary deficit at sustainable levels.
Fiscal space exists, but concerns about poor public expenditure management are limiting the efficiency of public spending.
The low level of fixed capital formation and use of “transfers” to expand public expenditure must be addressed.
Emerging fiscal risks should be attended to in order to help strengthen public expenditure management and limit borrowing.

2.2 Revenue growth is impressive: a 1 percentage point of GDP increase per annum for the past four years. Revenue collection is trade-dependent3 (42 percent of tax revenues) and its composition share in total collection has not changed significantly over two plan periods (the Tenth and Interim Plan periods, fiscal 2003-10). Trade taxes held much the same share of total collection in the Tenth Plan Period (fiscal 2003-07) as in the Interim Plan Period (fiscal 2008-10) – increasing from 41 percent to 42 percent. Capitalizing on import trade and consumption growth4, VAT collection has increased from 27 percent to 29 percent of total tax collection during the two plan periods, through a single tax rate of 13 percent. Efforts to increase the share of direct tax collection – income tax – in total tax collection has not been sustainable after an impressive collection gain in the Interim Plan period of 19 percent of total collection, from 16 percent during the Tenth Period. The system’s inability to sustain the growth momentum has been blamed in part on failure to enact administrative tax reforms during the four years when revenue targets were being achieved, and – as is now being reported – the hemorrhaging of VAT collection when fake VAT credit bills were issued, thus compromising the tax system5 and effectively making VAT collection the basis of income tax collection.
2.3 The revenue collection target will be missed this fiscal year. With import growth slowing, the tax rate increasing on major products, the narrowing of price arbitrage in favor of domestic importers, low capital expenditure from the third trimester (25 percent of the budgeted amount) and fake-VAT scandal, the revenue collection target of 15.9 percent of GDP will be missed, for the first time in four years. Revenue collection in fiscal 2010 was 15.2 percent of GDP.
2.4 Aid availability is rising, but implementation constraints will lower the absorption rate. Aid use has increased to 2.6 percent of GDP during the Interim Plan, compared to 1.8 percent of GDP absorbed in the Tenth Plan period. In addition to continuing social sector programs initiated in the Tenth Plan, aid money increased funding to safety-net programs, activities that were initiated and expanded in the Interim Plan period.6 With existing aid commitments, aid usage in fiscal 2011 is projected to reach 5.6
3 Through trade, VAT and excise taxes on trading activities.4 Imports are six times the value of exports and the trade deficit was 27 percent of GDP in fiscal 2010, with growth in consumption contributing 200 percent of the change in GDP over the last three years.5 The reported fake VAT transactions amounted to NRs 10 billion (over US$ 138 million), resulting into revenue losses of NRs 4 billion (US$ 55. 2 million), and were widespread with both traders and industrialists engaging in the evasion (460 large and small firms are being investigated).6 Safety-net programs increased to 2.04 percent of GDP in fiscal 2010 from 0.5 percent in fiscal 2005.
13
Table: 2.1: Tax Revenue (as percent of GDP)
Three Year Plan
FY 2003 FY 2004 FY 2005 FY 2006 FY 2007 FY 2008 FY 2009 FY 2010 FY 2011 Budget
Tota l Revenue 11.1 11.3 11.7 10.8 11.9 12.9 14.2 15.2 15.9
Tax Revenue 8.7 9.0 9.2 8.8 9.8 10.4 11.8 13.3 14.0
Trade Taxes 2.9 2.9 2.7 2.3 2.3 2.6 2.7 3.0 3.1
VAT 2.7 2.7 3.2 3.3 3.6 3.7 4.0 4.7 5.0
Income Tax 1.7 1.8 1.8 1.7 2.2 2.3 2.8 2.9 3.0
Tota l Trade Ta x(s )'1 4.6 4.6 4.9 4.6 4.8 5.3 5.8 6.8 7.3
1/ Trade, VAT,Excise
Table 2.1 : Tax Revenue ( as percent of GDP)
Tenth Plan Interim Plan

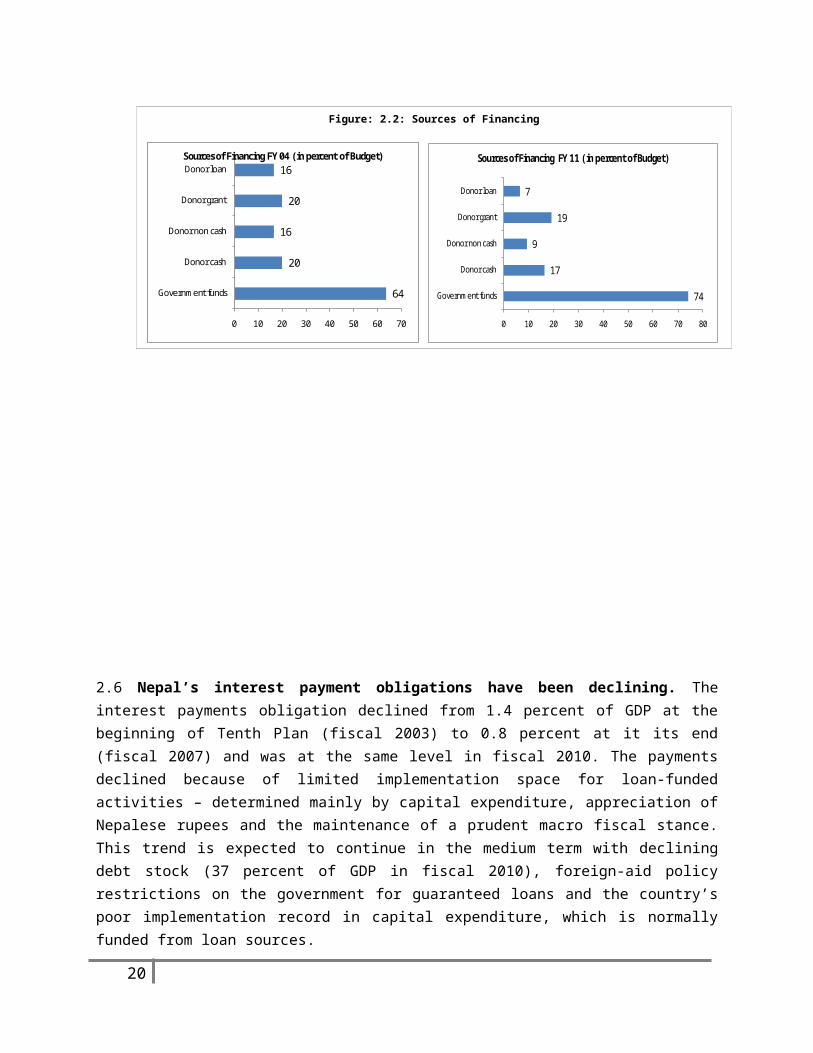
Figure: 2.2: Sources of Financing
64
20
16
20
16
0 10 20 30 40 50 60 70
Government funds
Donor cash
Donor non cash
Donor grant
Donor loanSources of Financing FY 04 ( in percent of Budget)
74
17
9
19
7
0 10 20 30 40 50 60 70 80
Government funds
Donor cash
Donor non cash
Donor grant
Donor loan
Sources of Financing FY 11 ( in percent of Budget)
percent of GDP. But that target will likely be missed because the budget announcement was delayed,7 leaving no systemic implementation measures for increasing the use of available funds, thereby compromising public finance management.
2.5 Grant in aid is the main source of aid money. While the overall aid availability has increased, the mix of aid sources has changed in favor of grants over loans, in line with the recipient’s preference, availability of aid money, the government’s poor record in implementing loan commitments and large projects.
2.6 Nepal’s interest payment obligations have been declining. The interest payments obligation declined from 1.4 percent of GDP at the beginning of Tenth Plan (fiscal 2003) to 0.8 percent at it its end (fiscal 2007) and was at the same level in fiscal 2010. The payments declined because of limited implementation space for loan-funded activities – determined mainly by capital expenditure, appreciation of Nepalese rupees and the maintenance of a prudent macro fiscal stance. This trend is 7 The fiscal 2011 budget was announced in November 2010, four months after the fiscal year began.
14

expected to continue in the medium term with declining debt stock (37 percent of GDP in fiscal 2010), foreign-aid policy restrictions on the government for guaranteed loans and the country’s poor implementation record in capital expenditure, which is normally funded from loan sources.
2.7 There is no fiscal space. Prudent fiscal management, aid availability and strong revenue
performance have allowed the government to increase public expenditure in the short run. The debt level is the lowest in the geographic region (37 percent of GDP in fiscal 2010) and is declining; the primary deficit has never exceeded 2 percent of GDP, and with low debt stock and loan use, the debt level is expected stay within this range in the medium term. However, factoring in the loss of state owned enterprises, cost of integration, cost of financial sector reforms and cost of subsidies to the treasury it is unlikely that there is fiscal space to fund rising public expenditure with current level of resource availability8.
2.8 Current expenditure is rising while fixed capital expenditure is declining. Current expenditure was 11 percent of GDP during the Tenth Plan (fiscal 2003-07), rose to 13 percent by the end of Interim Plan (fiscal 2010), and is budgeted to reach 14.1 percent in fiscal 2011. Higher wages and pension
8 Reported loss of Nepal Oil Corporation and Nepal Electricity Corporation is 3 % of GDP, reported integration cost is 0.5-1 percent of GDP and estimated cost of financial sector reform is 5 percent of GDP.
15
Table 2.2: Fiscal Performance (percent of GDP)
Three Year Plan Tenth PlanFY 03 FY 04 FY 05 FY 06 FY 07 FY 08 FY 09 FY 10 FY 11 Budget
Revenue 11.1 11.3 11.7 10.8 11.9 12.9 14.2 15.2 15.9 11.4 14.1 15.9Expenditure 11.1 14.3 14.9 14.5 15.9 17.4 20.0 20.2 23.6 14.2 19.2 23.6 Current 14.8 10.3 10.5 10.2 10.6 11.2 12.9 12.9 14.1 11.3 12.4 14.1 Capital 10.6 4.0 4.4 4.3 5.3 6.2 7.0 7.2 9.4 5.7 6.8 9.4Overal l balance after grants ( fiscal ) 4.2 -0.9 -0.8 -1.6 -1.8 -2.1 -3.1 -2.5 -2.8 -0.2 -2.6 -2.8Aid ( loan and grant) -1.4 2.4 3.0 2.3 2.5 2.6 2.7 2.6 5.6 1.8 2.6 5.6Domestic borrowing ( net ) 2.1 0.6 0.2 1.4 1.5 2.0 3.1 2.4 2.1 1.2 2.5 2.1Primary Deficit 1.6 0.3 0.3 -0.7 -1.0 -1.3 -2.3 -1.7 -1.9 0.1 -1.8 -1.9
Three Year Plan
Fiscal Performance ( percent of GDP).
Tenth Plan Interim Plan Interim Plan
Fig 2.3: Expenditure
0.0
5.0
10.0
15.0
20.0
25.0
2005 2006 2007 2008 2009 2010 2011 ( Budget)
Expenditure ( in percent of GDP)
Staff Salary Other Current Capital formation Other Capital
Figure: 2.4: Budget Spending
10.5 10.2 10.6 11.212.9 12.9
2.1 1.9 2.3 2.4 3.2 3.34.4 4.6 5.3 5.68.0 8.1
14.9 14.515.9
17.420.0 20.4
0.0
5.0
10.0
15.0
20.0
25.0
2005 2006 2007 2008 2009 2010
Budget SpendingMajor Economic Heads (Percent of GDP)
Current Expenditure Capital formation Trasfers Total Public Expenditure

payments, a rapid rise in non-salary expenditure – such as transfers and supplies – have eroded spending space on capital formation. Transfer payments (current and capital) have become a new channel for investment and are increasing rapidly. While fixed capital formation increased to 3.3 percent of GDP in fiscal 2010, from 2.1 percent in fiscal 2005, transfer expenditures increased from 4.4 percent to 8.1 percent of GDP. Low capital formation is effectively a tax on future growth.
2.8 Increases in community controlled funds. In support of the government policy to empower communities with their own resources, community controlled funds have steadily increased, from 6.2 percent of total expenditure in fiscal 2009 to 6.8 percent in fiscal 2010, and are budgeted to be 6.3 percent in fiscal 2011, reaching an expected 7 percent by the end of the year. Overall public expenditures are lower than those of funds controlled by local communities; the community-controlled funds expenditure increase in fiscal 2011 was 21 percent more than estimated for fiscal 2010.
New emerging issues9
2.9 While rising resource availability is a positive development, issues are emerging that could increase future fiscal risks and jeopardize fiscal management. These include the relaxation of prudence in fiscal management, higher wages and pension payments, a rapid rise in non-salary expenditure to finance various subsidy schemes, erosion in the size and quality of capital expenditure, and increased funding for questionable government-funded projects10.
2.10 While the issues relating to public finance management have not changed since 2007, there is evidence that the government is breaking its own “financial administrative regulations” (see Box 1), which is largely due to unrealistic budget formulation.
9 Issues other than those identified in the Nepal Public Expenditure Review – June 2010.10 Issues identified in the Nepal Public Expenditure Review – June 2010.
16
Figure: 2.6: Expenditure (as perentage of GDP)
4.4 4.65.3 5.6
8.0 8.18.9
2.1 1.9 2.3 2.43.2 3.3
2.3
0.0
1.0
2.0
3.0
4.0
5.0
6.0
7.0
8.0
9.0
10.0
2005 2006 2007 2008 2009 2010 2011 ( Budget)
Expenditure ( as percent of GDP)
Trasfers Capital Formation
Figure: 2.5: Community and Local Government Expenditure
6.2%6.8%
6.3%
0.0%
1.0%
2.0%
3.0%
4.0%
5.0%
6.0%
7.0%
8.0%
2009
2010
2011 B
udget
Tota
l Exp
endi
ture
Community and Local Government Expenditure
Community controlled funds Block Grants to Local Governments

2.11 The transfer investment channel may be fueling the scale and level of audit observations. Local governments’ and public institutions’ spending from central government subsidies (transfers – capital and current) increased to NRs 95 billion in fiscal 2010, from NRs 46 billion in fiscal 2008. Correspondingly, the Auditor General reported an increase in annual “audit observations” from NRs 10 billion in fiscal 2008 to NRs 17 billion in fiscal 2010. Submission of accounts without appropriate documents, spending without authorization, advances, non-settlement of accounts and spending incurred outside approved annual plans are common reasons cited for this situation. Unavailability of accountants, especially experienced accountants, may be one factor that has led to late completion of audit reports; but, more importantly, inability to settle accounts upon submission of expenditure is a major governance issue. On average, only 35 percent of observations are settled in any given year (2008-10). These rates of audit observation and settlement undermine confidence in the public finance management systems and discourage efforts to expand public expenditure without better PFM.
2.12 The Auditor General’s annual audit report singles out the Ministry of Local Development (MoLD) with the highest number of audit observations. Such observations in local government involved NRs 2.4 billion in fiscal 2010, from NRs 0.85 billion in 2008. For every rupee increase in investment through transfers, 30 “paisa” of expenditure falls into the “audit observation” category, with a correlation between increased transfers to local government and the level of audit observations. Audit observations in fiscal 2010 amounted to 11 percent of the total transferred amount. In addition to the audit observation rate, unaudited accounts of the MoLD in fiscal 2010 involved NRs 28 billion, the largest among all ministries, while its PFM monitoring, controls and governance structure were also questioned. For every rupee increased in transfers to the MoLD, nearly 22 “paisa” were flagged by auditors as breaking financial administration regulations.
17
Fig: 2.7: Audit Observation ans Transfer Spending
0
20
40
60
80
100
120
FY 08FY 09
FY 10
4679 95
10
12
17
Nepal: Audit Observation and Transfer Spending( Rs. Billion)
Transfer ( current and capital) Audit Observations
0
5000
10000
15000
20000
25000
FY 08 FY 09 FY 10
8922
1687222029
850
1250
2390
Local Government: Audit Observation and Transfer Spending( Rs. Million)
Transfer ( current and capital) Audit Observations

2.13 The practice of bunching activities in the last trimester of the fiscal year continues. Positive steps are being taken by government-donor working groups to improve public finance management Benefits of these efforts may be seen in near future, but the government is still bunching activities in the last trimester – cramming up to 70 percent of the annual work into that period. This reflects late approval of annual work and procurement plans, unrealistic budget formulation that that takes no account of implementing capacity and, to some extent, lax governance and low levels of accountability. With the late approval of the fiscal 2011 budget and no significant attempts to resolve causes of the problem, bunching is bound to occur in the last trimester of fiscal 2011 too.
2. 14 The absence of qualified accountants, late approval of procurement plans following budget announcement and lenient approval of donor funds against late submission of “statement of accounts” led to an outstanding reimbursement of 1.0-1.5 percent of GDP in early 2010. A policy decision requiring budgets only to be released against reimbursement amounts, effective from the first quarter of fiscal 2011, brought a marked improvement in collection of outstanding reimbursement amounts. However, a recent decision to relax this policy directive could lead to a reversion of the problem. The state has relaxed all budgetary control measures in order to increase the level of capital expenditure – raising questions as to whether it is more committed to spending than efficiency of fund use.
18
Figure 2.8: Spending in Third Trimester
41 46 4557
74 70
01020304050607080
2008 2009 2010
Third Trimester Third Trimester Third Trimester
In p
erce
nt
Spending in Third Trimester (as percent of Total )
Current Expenditure Capital Expenditure

Box 1: Budget Virement and the Need for Realistic Budget-Making
The government practices hard-budget constraint at the macro and sectoral levels, but its use of virement gives cause for concern. Virement is authorized between line items if it is within parliamentary-approved budget size, but never from capital account to current account. In a realistic budget, one can expect the level of virement to be low, which is not the case in Nepal.
In fiscal 2003, virement from current budget to capital budget amounted to NRs 1.07 million, and it increased annually for the next five years. In fiscal 2009 there was no virement, but the following year a virement of NRs 198 million was made from the capital budget to the recurrent budget, a gross violation of the government’s own financial administrative regulations. Virement is more pervasive and costly in the capital account (averaging 31 percent during fiscal 2003-10) than in the current account, due to the strong tendency towards unrealistic budget-making.
Realistic budget-making should be a prime objective of the government in order to (i) develop credibility within its own ranks and those of civil society and the donor community, and (ii) improve financial management. To do this requires a reasonably conservative resource envelope, prioritization of expenditures, conservative estimates of the impact of recent revenue enhancement measures, setting a domestic-borrowing range compatible with the macroeconomic framework, and conservative estimates for externally-financed projects. Except for its limits on domestic borrowing, Nepal shows only weak adherence to the above principles – hence the trend in virement between accounts and line items.
Each virement is like a remaking of the budget, reflecting a disconnection with spending realities. Virement is typically directed at discretionary items, notably capital expenditures and non-salary expenditures – both critical items for the effectiveness of spending and its impact on growth. A high budget envelope allows low-priority spending to slip into the budget, some of which is non-discretionary, and which cannot be scaled down when resources fail to materialize. When this happens they tend to crowd out government priorities. Enlarging the budget excessively, especially with poorly prepared projects, discourages donor funding, raises unrealistic expectations, and damages the government’s credibility. On the other hand, adopting a smaller budget presents only one downside – the political cost of initially resisting political pressure to pad the budget – which can be eased at mid-year by revising the budget upward, if domestic
19
Figure: 2.9: Budget Virement (In Rs. millions)
1.1
2.1
2715.3
2687.8
1785.1
3001.9
0.0
198.0
0500100015002000250030003500
FY03
FY04
FY05
FY06
FY07
FY08
FY09
FY10
Budget Virement (In Rs. million)
Virement from current budget to capital Virement from capital budget to recurrent
0
20
40
60
80
100
120
FY 03 FY 04 FY 05 FY 06 FY 07 FY 08 FY 09 FY 10
10 12 12 618 20 12 10
26 1129
20
59 48
3423
Virement(percent of respective budget)
Current Capital Budget

3.TRANSPORT SECTOR EXPENDITURES AND OUTPUTS
Summary
This chapter reviews transport-sector spending trends, progress and alignment of resources to network expansion, and accessibility improvement. The assessment of road sector expenditure performance is based on official government expenditure data. It is divided into sections that review the overall public expenditure trend (an update of the 2010 Public Expenditure Report), the roads-sector’s public expenditure review for three plan periods, the structure and composition of roads-sector expenditure, equity in roads-sector investment, efficacy of roads-sector expenditure, and the types of roads constructed. It concludes with a set of recommendations.
Public Expenditure, by Sector11
Public expenditure is poverty-focused and inclusive, with social spending as a priority. The immediate past decade was the decade of social-sector focus, especially education and health sectors, guided by the Poverty Reduction Strategy (Tenth Plan, fiscal 2003-07), and continuing through the Interim Plan period (fiscal 2008-10). The Three Year Plan (fiscal 2011-13) has sharpened its focus on the economic sector, while continuing the past policy direction. The Three Year Plan aims to increase gross fixed capital formation to 25.5 percent of GDP by its end12, from 21.3 percent in fiscal 2010. The plan also envisages investment outlays of 24 percent of total capital investment to the transport and communications sector, a marked departure from past plan policy directives. This direction of funding policy shift will need to be carefully balanced between social and economic sectors so as to protect the
11 Update of Nepal Public Expenditure Review – June 2010.12 Three Year Plan Approach Paper, pg. 30. August 2010.
20
Key Messages
Road access and connectivity are critical components of Nepal’s development strategy. Planning of road expansion should be guided by accessibility indicators, especially in regions lacking in walking access to all-weather roads.
The quality of roads has deteriorated and Roads Board Nepal capacity to maintain roads needs strengthening.
The transfer of funds to local governments is an important empowerment vehicle but also raises downstream governance issues. Vertical transfers to local governments should be tied to improved downstream accountability – indicated by a reduction in audit observations.
gains social sectors made from past investments, as the state expands its economic-sector investments within an overall prudent fiscal framework.
3.2 The social sector has been the priority sector, but the shift in investment now is towards the economic sector. Social-sector expenditure increased by 1 percentage point of GDP in each of the last four years, with the emphasis on education, health and local development ( annex one).
3.3 Connectivity and access to social and economic capital are the Three Year Plan’s points of emphasis. The Implementing policy directive of the plan is to increase funding to economic sectors –especially transport and power. Economic sector investment averaged 4.2 percent of GDP from fiscal 2003-10 (Tenth and Interim Plan Periods) and is projected to reach to 6.3 percent in fiscal 2011, when the plan is set to begin. The investment priority shift started in fiscal 2010 (rising to 5.2 percent of GDP from 4.6 percent the year before). From a low base of 1 percent of GDP in fiscal 2009, spending on transport increased to 1.5 percent the following year and is projected to reach 2 percent in fiscal 2011. Power-sector investment is expected to reach 1.2 percent of GDP in fiscal 2011, from 0.6 percent in 2009 (annex one). Investment in these two sectors represents a capital outlay direction of 35 percent of total capital investment. The plan aims to add 675 kilometers of strategic roads and 281 megawatts of power by fiscal 2013.
3.4 The increased economic sector investment is aimed at improving and increasing access of services and expanding connectivity of underserved regions and populations. All district headquarters will be connected by roads and additional 9 percent of population will have access to electricity. Currently only 71 out of 75 district headquarters are connected by roads and 56 percent of the population has access to electricity.13
3.5 Spending in the social sector is expected to double by the end of the Three Year Plan. The sector’s investment averaged 6.7 percent of GDP from fiscal 2003-10 and is estimated to reach 11.1 percent in fiscal 2011. Past investment policy directives on the social sector’s importance, especially in education
13 Three Year Plan Approach Paper, pg. 21.
21
Table: 3.1 Public Expenditure in Major Sectors as percentage of GDP
Sectoral Expenditure
As percent of GDPSocial Sector 5.55 8.60 11.14
Education 2.83 3.61 4.28Health 0.88 1.34 1.82Drinking Water 0.45 0.63 0.69Local Development 0.93 1.63 2.07Other Social Sectors 0.47 1.39 2.28
Economic Sector 3.76 4.83 6.34Agriculture 0.40 0.71 0.97Irrigation 0.45 0.63 0.67Forestry 0.31 0.28 0.32Industry 0.11 0.09 0.14Other Econic Sector Sectors 0.46 0.95 0.69Infrastruture 2.03 2.17 3.54Roads 0.82 1.15 2.02Air Transport 0.00 0.05 0.08Railroads 0.01Water Transport 0.0004Communication 0.28 0.22 0.20Power 0.93 0.75 1.24
General Administration 7.98 7.94 7.61 o/w Police 1.23 1.49 1.42o/w Defense 1.62 1.44 1.33 o/w Loan payments 3.23 2.65 2.27o/w Others 1.89 2.36 2.59
Three Year Plan ( First
Year)Tenth Plan
Interim Three
Year Plan

and health, are maintained in the Three Year Plan, but there are signs of decelerated absorption capacity, especially in the health sector. The education sector spending averaged 3.1 percent of GDP and health sector spending was 1.05 percent during the review period, fiscal 2003-10. Spending levels of these two sectors are expected to reach 4 percent and 1.8 percent of GDP by the end of fiscal 2011.
3.6 After achieving impressive outcomes gains, the social sector is in danger of missing its targets. The health sector, especially, looks set to fall short; its annual spending growth rate has fallen from a high of 18 percent of GDP in fiscal 2009 to just 5 percent in fiscal 2010, reflecting unaddressed systemic issues in the sector.14
14 Nepal Public Expenditure Review, June 26th 2010.
22
Figure: 3.2: Public Expenditure as Percentage of GDP
0.00
5.00
10.00
15.00
20.00
25.00
30.00
2002/03 2003/04 2004/05 2005/06 2006/07 2007/08 2008/09 2009/10 (Provisional)
2010/11 Allocation
Tenth Plan Interim Three Year
Plan
Three Year Plan
Public Expenditureas percent of GDP
Social Sector Infrastruture General Administration
Economic Sector Total Public Expenditure

Public Expenditure, by Plan Period3.7 Three features of road sector outcomes need improvement. Firstly, administrative connectivity; only one-fifth of district headquarters can be accessed by roads during monsoons (only 17 out of 75 district headquarters have all-weather roads). Secondly, social and commercial connectivity; only 40 percent of the population has access to paved roads within a 20-minute’s walk.15 Thirdly, maintenance; the proportion of strategic roads network (SRN) in poor conditions has risen to 22.4 percent in fiscal 2010, from 18 percent in fiscal 2008.
3.8 Two salient features stand out for Nepal’s roads public expenditure: (i) the share of rural roads expansion is rising; and (ii) rehabilitation and maintenance expenditure is being prioritized, but the efficacy investment in rehabilitation and maintenance is questionable, given that growth in the maintenance budget is not commensurate with road expansion, resulting in declining road conditions.
3.9 Two ministries are responsible for road network expansion. The Ministry of Physical Planning and Works (MoPPW) and Ministry of Local Development (MoLD) build roads in Nepal. There are also several donors, international organizations, user committees and local community based organizations involved in the roads sector. On an average, 72 percent of public-sector investment on roads is done through MoPPW and the balance through the MoLD. With devolution a national priority, roads sector investment through the MoLD is rising, and is expected to continue so in coming years.
3.10 Rural road is the priority and much of these roads are earthen. The government has prioritized expansion of rural roads (33 percent of road sector investment, 2613 km. of new roads per year). Second priority of the government is in strategic roads (26 percent of road sector investment, 148 km. of new roads per year). Maintenance and rehabilitation has gained priority as from fiscal year 2011 equaling investment level of strategic roads and is the result of the government’s policy shift in the emphasis in road maintenance. Over 65 percent of all new roads are earthen with less than 15 percent as blacktopped.
15 Preliminary estimates of the NLSS – III record improvements in this outcome.
23
Table: 3.1: Selected Indicator in Social Sector
1995-96 Lates t ava i lable
Headcount Poverty rate 42% 31% (2003-04)
Gini coeffi cient 34.2 41.4 (2003-04)
Net primary enrol lment 67.50% 94.50% (2010)
Gender Pari ty ratio in primary education 0.66 0.99 (2010)
Materal Mortal i ty Ratio 539 229 (2009)
Under 5 morta l i ty rate (per 1000) 118 48 (2009)
IMR (per 1000 l ive bi rths) 79 39 (2009)
Ful l immunizati on coverage 43% 83% (2006)
Selected Indicators in Social Sector
Figure: 3.3: Social Sector Spending
-0.39
7.10
10.92
14.39
18.43
7.995.07
-5
0
5
10
15
20
25
30
35
2003/04 2004/05 2005/06 2006/07 (Peace
restored)
2007/08 2008/09 2009/10 (Provisional)
Social Sector SpenidngGrowth Rate
(as percent of GDP)
Social Sector Education Health

3.11 Road sector spending has doubled. Road sector investment averaged 1.5 percent of GDP during the Interim Plan Period, from a low base of 1 percent of GDP during Tenth Plan. This spending level is projected to reach to 2.6 percent in fiscal 2011. Restoration of peace in 2006 increased development space; roads-sector investment increased by 40 percent in 2007, and had doubled its GDP share to 1.9 percent by fiscal 2010, from a low of 0.88 percent in fiscal 2006. The increased investment was aimed at stopping the overall deterioration in physical infrastructure, improving the country’s road connectivity, especially in underserved regions, and enhancing access to social and economic capitals. Much of this investment was directed at expansion of rural roads (see especially paragraphs 3.12 and 3.30).
3.12 Investment in the strategic roads network is low. Investment in the network was 0.3 percent of GDP during the Interim Plan period, up from spending of 0.2 percent during the Tenth Plan period. This low spending level partially reflects the crowding out of infrastructure investment during the Poverty-Reduction Strategy years of the Tenth Plan, when the focus was far more on social sectors and conflict-related issues. This shrank development space for roads-sector investment, in spite of the fact that funds were available for roads expansion. With the cessation of conflict and review of past policy directions, investment shifted to expansion of strategic roads, such as the Fast Track Road and Mid-Hill east-west highway.16 This was an attempt to make up ground lost during the conflict and meet the need for another highway linking the Hill districts17 and shorten the travel time to between the nation’s capital and international borders. Investment in highways has increased and is should reach 0.7 percent of GDP in fiscal 2011, from a low of 0.2 percent in 2006.
3.13 Rural roads are a prioritized roads subsector. Rural roads investment has nearly doubled between the two
16 In fiscal 2010, highway spending was 0.43 percent of GDP, from 0.29 percent the previous year.17 Hill districts – 39 districts out of the total 75.
24
Figure 3.4: Road Sector Investment as Percentage of GDP
0.00
0.50
1.00
1.50
2.00
2.50
3.00
2002
/03
2003
/04
2004
/05
2005
/06
( Pea
ce R
esto
red)
2006
/07
2007
/08
2008
/09
2009
/10
(Pro
visio
nal)
2010
/11
Allo
catio
n
Tent
h Pl
an
Inte
rim P
lan
Thre
e Ye
ar P
lan
Road Sector Investmentin percent of GDP
Road Sector (central) Rural Roads ( Ministry of Local Development) Road Sector Total
Figure:3.6: Road Sector Expenditure
1.0
0.2 0.30.1
0.3
0.1
1.5
0.3
0.6
0.2
0.4
0.1
2.6
0.7
0.9
0.3
0.7
0.1
0.0
0.5
1.0
1.5
2.0
2.5
3.0
Road Transport Sector
Highways Feeder Roads ( agri.+rural roads)
Bridges Rehabilitation & Maintenance
Others
Road Sector" Sub Sectoral Expenditure ( 2003-2011)( percent of GDP)
Tenth Plan Interim Plan Budget 2011
Figure: 3.5: Road Investment
24.3 26.2 28.3 31.6 30.226.6
0.0
10.0
20.0
30.0
40.0
50.0
60.0
70.0
80.0
FY 05 FY 06 FY 07 FY 08 FY 09 FY 10 (Provisional)
Road Investment : Ministry(as apercent of total road investment)
Ministry of Physical Planning and Works Ministry of Local Development

recent plan periods, reaching 0.6 percent of GDP during the Interim Plan from 0.3 percent in the Tenth Plan. This spending level is projected to increase by a further 50 percent by the end of fiscal 2011, if implementation goes smoothly. Immediately after the end of conflict, with broadening of implementation space and local governments’ interest in rural roads, spending levels on rural roads increased by 64 percent in just one year (fiscal 2007, when it reached 0.3 percent of GDP. This spending priority trend has continued, and is projected to reach 1 percentage point of GDP in fiscal 2011. While the rural road network has expanded exponentially – it may not necessary be durable (see paragraph 3.34).
3.14 Bridges and rehabilitation are less of a priority than roads network expansion. Investment on bridges has never exceeded 0.2 percent of roads-sector investment. Some 300 new bridges are required to achieve year-round accessibility of the strategic roads network – a challenging target with the current level of bridge investment. In addition, investment in road maintenance and rehabilitation is low – 0.4 percent of GDP during the Interim Plan, projected to reach 0.7 percent in fiscal 2011. These low levels of investment in bridges, rehabilitation and maintenance of the roads sector raises serious questions about not only the condition of road assets18 but also the likelihood of government achieving its accessibility targets by 2016 – 87 percent of hills and 100 percent of the Tarai population being within two hours’ and four hours’ walk from an all-weather road (Box 2 ).
Structure and Composition of Expenditures
Central Level
3.15 Roads-sector investment is managed by two departments and one board. At the central level, besides the two ministries involved, the Department of Roads (DoR) and Department of Local Infrastructure Development and Agricultural Roads (DoLIDAR) share responsibilities for road network expansion, and the Road Fund Board is responsible for maintenance of existing roads, at both central and local levels.
3.16 Roads-sector projects are managed by central level. Decentralization and empowerment of local bodies for road construction is an ongoing process, but, the overall roads-sector investment is controlled at the center – 75 percent of total roads investment.
3.17 Rehabilitation and maintenance expenditure is rising. The central government spends 40 percent of roads-sector investment on rehabilitation and maintenance – more on maintenance than
18 The road condition of the SRN as measured by Surface Distress Index has deteriorated from 18 percent in 2008 to 20 percent in 2010.
25
Figure 3.7: Central Subsector Road Investment
42.8
50.146.3
33.828.9
32.5
39.1
27.0 25.728.7 27.5
31.5 30.928.6
0.0
10.0
20.0
30.0
40.0
50.0
60.0
FY05 FY06 FY07 FY08 FY09 FY10 Period Average ( FY 05 to FY 10)
Central Sub Sectoral Road Investment( percent of total road investment)
Feeder Roads (Agri. Roads) Bridges Rehabilitation Others Highways

rehabilitation – and this averages 10 percentage points more than the investment on the SRN, possibly because of implementation difficulties in roads network expansion, a preference for rehabilition and manteneance by decision-makers, and better absorption of released funds at end of the fiscal year.
3.18 The Road Fund Board’s expenditure is rising, but below the recommended budget level that would allow it to carry out effective road maintenance. The board is the only autonomus board with a secure revenue code to fund its activities. While the spending level of board has risen, it is still averages only about 51 percent of annual transportation fees collected. The government has not transferred total transport fee collection from the revenue code to Road Fund Board account. Continuation of this non-transfer policy could result in further deterioration of road conditions. The reason for the non-transfer is given as the board’s lackluster perforamnce record. However, a positive change in maintenance policy was introduced this year; the board is now responsibe for maintenance of all roads within the country and its budget doubled from a current spending level of NRs 1.3 billion in last year to NRs 2.5 billion this year. Previously, roads maintenance was also undertaken by the DoR, local governments and user groups.
3.19 The first “call” on the roads-sector budget in any year should be to make sufficient provision for roads maintenance, but this principle is not adhered to. The roads-sector maintenace budget is not sufficient to maintain the current road network. The Priority Investment Plan recommended NRs 2.6 billion for
26
Figure :3.9: As percentage of Road Sector Spending
0% 20% 40% 60% 80% 100%
FY 04
FY 05
FY 06
FY 07
FY 08
FY 09
Period Average
83
81
75
77
81
80
80
15
17
24
22
17
18
19
As percent of Road Sector Spending
Current expenditure
Capital expenditure
Transfer ( current and capital)
Table 3.2: Road Sector Investment:nChannel(as percent of total)
Central District TotalCurrent expenditure 1 3 1 o/w salary 0 1 1 Capital expenditure 99 29 80 o/w civil construction 94 24 74Transfer ( current and capital) 0 68 19
Road Sector Investment: Channel ( as percent of total)
Figure 3.8: Road Maintenance: Sources and Uses
677 850
1339
2073
3024
3669
324 390760 665
1315
2518
0
500
1000
1500
2000
2500
3000
3500
4000
FY 06 FY 07 FY 08 FY 09 FY 10 FY 11 Budget
Road Maintenance: Sources and Uses (Rs. Million)
Transport Sector Fee ( from revenue code)Road Fund Board expenditureRecommended budget for regular annual maintenance (9930 kms. SRN)/1Recommended budget for periodic maintenance and upgrading (7917 kms. SRN)/1Total recommended annual maintenance budget

annual maintenance (regular and periodic upgrading) of the SRN and NRs 2.5 billion for the Roads Fund Board’s maintenance budget in fiscal 2011, which is insufficient to keep the roads to recommnded technical standards. The government still holds on to transportation fee revenues for unsatisfactory performance of Roads Fund Board. This capacity issue needs to be resolved before more funds are allocated to the Board.
3.20 Appropriate accounting charge codes are practiced at central government level but not at district level for expenditure. Central level road expenditure is nearly all capital expenditure (99 percent) and with appropriate charts of accounts coding, civil construction is 94 percent of total expenditure. There is not the same transparency in the districts. While at the district level, capital expenditure accounts for only 29 percent of total roads expenditure, this is a misnomer; much of district-level capital expenditure (68 percent) is accounted as transfers. This non-transparent accounting not only raises governance issues but make it impossible to link inputs to outputs.
3.21 Use of the “transfer” channel in roads sector investment is widespread. Current and capital expenditures have generally retained their respective shares of total roads expenditure, at 1 percent and 80 percent between fiscal 2004 and 2009; but, the channel used for these investments have changed – the “transfer route”, conditional and unconditional grants to local governments and user
committees. Roads-sector investment through the transfer charge code increased to 19 percent in fiscal 2009, from 15 percent in 2004. This accounting practice is more prevalent with roads constructed by local governments, taking up nearly 70 percent of total district road investment in the review period.
District Level
3.22 District roads expenditure is nearly all capital expenditure. Expenditure through transfers dominates the district roads portfolio (68 percent of total) and capital expenditure; just 24 percent is accounted for as civil construction – a gross misstatement. The transfer channel is used mainly for road expansion, rehabilitation and/or maintenance, rendering it impossible to differentiate these activities under appropriate expense accounts. But this discretionary expenditure not only masks the identity of
27
Figure 3.10: Districts Road Sector Investment by Region
11.6
14.513.6
12.4
9.4
12.7 12.4
2.2 1.9 1.93.1 3.4
2.6 2.5
0.0
2.0
4.0
6.0
8.0
10.0
12.0
14.0
16.0
FY 05 FY 06 FY 07 FY 08 FY 09 FY 10 Average for period ( FY
05 to FY 10)District Road Sector Investment by RegionPercent of Total Road Sector Investment
Eastern Central Western Mid West Far West

expenditure, it raises governance issues (Box 1). Expenditure on roads made by user committees and/or own resources of local governments are not accounted for nor captured in roads-investment statistics.
3.23 Rural road expansion is also largely funded through the “transfer route”. On average, the rural roads-sector’s current expenditure is about 5 percent of total rural roads expenditure, with the balance being capital expenditure. The local governments’ preferred spending route for rural road expansion is through transfers – conditional and non-conditional grants – and amounts to 70 percent of the total rural roads capital budget. Policy decisions to empower local governments and user groups to provide basic services and, thereafter, to raise funding levels for user/community groups to provide basic services are two plausible reasons for increasing grants to these agencies through transfers. Local governments’ grant expenditure increased to 8 of GDP in fiscal 2010, from 5.6 percent in fiscal 2008 and, in the roads sector, government has doubled the ceiling of earthwork cover that can be implemented through user/community groups, from NRs 3 million in fiscal 2009 to NRs 6 million this year. This policy decision will extend the earthen road network and increase governance issues, especially in areas of accountability and auditing downstream (Box 2).
Equity in Roads Expenditure
3.24 More than half of all roads-sector investment (53 percent) went to the Central region between fiscal 2005 and 2010, compared to 8 percent in the far-Western region, which is underserved. Accessibility and connectivity are two key parameters that guide road sector investment. A hub-and- spoke concept may have prevailed in the strategy to favor the Central region, with Kathmandu as the hub extending out to the rest of the country, and a need to improve connections with China and India. The Central region is the heart of economic activity of the country, the Bagmati zone accounting for 80 percent of total national consumption. The Central region is also home to the two largest customs points – Birgunj and Tatopani – from where 80 percent of country’s external trade is conducted.
3.25 Roads-sector investment in underserved regions, especially far-Western Nepal, is below
10
percent of total sector investment. This is a result of a north-south divide between the Hills and Tarai; with no major settlements in the Hills, road connectivity in this region has been historically neglected,
28
Figure: 3.11: Road Sector Investment by Region
5459
5549
45
5753
8 8 6 710 8 8
0
10
20
30
40
50
60
70
2005 2006 2007 2008 2009 2010 Average for period (FY05 to
FY10)
Road Sector Investment By RegionPercent of Total Road Sector Investment
Eastern Central Western Mid Western Far Western

and thus largely marginalized from the economic mainstream. This status quo and low roads density in far-Western region will change upon completion of the Mid-Hill east-west highway. This highway will facilitate not only road accessibility and intra-district connectivity but also expedite construction of planned north-south road expansion within the regions, with the Mid-Hill highway functioning as the trunk route.
3.26 Local governments in the Central region favor rural roads. Contrary to equitable investment policy, local governments in the central region are moving aggressively towards rural roads expansion; their expenditure accounts for 12 percent of total roads-sector investment and 53 percent of investment on rural roads. In comparison to the Central region, the mid-Western and far-Western regions roads sector investment range between 3 percent and 4 percent of total roads-sector investment, four times lower than that of the Central region. Plausible reasons for this investment status include the fact that parliamentarians from Central region are the biggest voting bloc and push for more road connectivity, the presence of the SRN, with north south and east-west highways,19 enabling construction of more feeder roads, and competent user-committees prioritizing road connectivity investment at their respective locations over those of other sectors.20
3.27 The Central region has the highest per-capita roads-sector investment and the Eastern region the lowest. By population head count, the Eastern region’s per-capita roads-sector investment averages NRs 200 and that of the Central region an average of NRs 553. The latter is well above the national average of NRs 367. High population concentration in the Eastern region relative to low roads-sector investment explains the low unit-investment.
19 Tribhuban Rajpath, Arniko Highway and BP Highway.20 The local population spent 62 percent of VDC capital grant on physical infrastructure, according to Assessment of Village Development Committee Governance and the Use of Block Grants, 2009.
29
Figure: 3.12: Road Sector Spending by Ecological Belt
8.5 8.9 9.3 8.6 10.9 10.6 9.5
71.575.6 74.2 72.5 71.0
74.1 73.2
20.015.5 16.5 18.8 18.0
15.3 17.4
0.0
10.0
20.0
30.0
40.0
50.0
60.0
70.0
80.0
2005 2006 2007 2008 2009 2010 Period average( FY 05 to FY 10)
Road Sector Spending by Ecologocal Belts ( as percent of Road Sector Total)
Mountain Hill Tarai
Table: 3.3: Status: Road Network (kilometer)
FY 04 FY 10Per Yea r Road Cons tructed
Strategic Road Network (SRN)/1 8206 10835 438
o/w National Highway 3134 3392 43
o/w Mid Hi l l 102 734 105
o/w Feeder Roads 4401 6117 286
o/w Posta l 570 592 4
Rural Roads/2 18054 32018 2327
Total Road Length 26261 42853 2765/1 DoR
2/ MoLD, 2010 - only 57 districts
Strategic Road Network (SRN)/1 31 25 16
o/w National Highway 12 8 2
o/w Mid Hi l l 0 2 4
o/w Feeder Roads 17 14 10
o/w Posta l 2 1 0
Rura l Roads/2 69 75 84
Perceta ge of Tota l
Stautus : Road Network ( kilometer)

3.28 The Teria lags other regions in roads-sector investment. Although topography in the southern plains favors roads-sector investment efficiency – lower distance/construction costs compared to the hilly and mountainous regions – roads-sector investment in Tarai amounts to 17 percent of the total roads-sector investment, while those of the Hill districts have crowded out investment in other ecological belts. Even with this low investment level, preliminary indications are that the Tarai region averages better than two hours’ walking distance to a road (Box 2).
Efficacy of Road Investment, by Network Expansion Category
3.29 Nepal’s roads density is stated as 291 kilometers per 1,000 square kilometers of land mass. This is low (and probably an underestimation) compared to India’s 1,115 km and Bangladesh’s estimated 2,080 km.21 Road density status in fiscal 2004 was said to be 211 kilometers per 1,000 square kilometers.
3.30 Roads network expansion is towards improving rural connectivity. Rural connectivity through roads is the government’s priority. Four times more rural roads than strategic roads are being constructed each year. More than 80 percent of total roads constructed are rural (fiscal 2004-10). An average of 2,327 kilometers of rural roads was constructed versus 438 kilometers of strategic roads each year in that time. Within the SRN category, the Mid-Hill road network has expanded six-fold, reflecting the recent policy priority of the government to connect all Hill districts (paragraph 3.11) As noted above, the rural road network status is an underestimate, as roads constructed through “user committees” are not within the purview of official statistics. However, the improvement in national outcome indicators of the percentage of population within two to four hours’ walking distance from the nearest road indicates that roads constructed by “user committee” have spread dramatically (Box 2).
3.31 SRN expansion has picked up in Eastern and mid-Western regions. The Central and Eastern regions have more than half of country’s total road network, while the far-Western region lags in terms of total road network and ongoing expansion. More road-length per year is being constructed in Eastern (124 kilometers per year) and mid-Western (109 kilometers per year) regions than in the rest of the country.
21 Source: Department of Roads and DoLIDAR (preliminary estimates of 57 out of 75 districts).
30
Figure: 3.13: Road Sector Per Capita Expenditure in Nepalese Rupee
99 83
178 198
284358
199.8
309 339
492 473
588
1115
552.6
200 201
315 338
454
694
367.0
0
200
400
600
800
1000
1200
2005 2006 2007 2008 2009 2010 Average for period (FY05
to FY10)
Road Sector Per Capita Expenditurein Nepalese Rupees.
Eastern Central Western Mid West Far West National

3.32 Expansion of feeder roads and the Mid Hills highway dominate roads network expansion. To improve road access within the Hills districts (39 of a total 75), the central government has expanded 286 kilometers of feeder roads per year and 105 kilometers of Mid Hills highway. The expansion of these two categories of roads may be diverting from the expansion of national highways (just 43 kilometers of
road per year) and postal roads (4 kilometers per year).
3.33 More roads are being constructed in the Hills districts.22 Three times more kilometers of roads per year are being constructed in the Hills regions than the Tarai districts. Rural roads construction dominates road construction and has reversed the status of connectivity across three ecological belts. Only 39 percent of total road length in fiscal 2010 was in the Tarai, which used to absorb 50 percent of
government investment (fiscal 2004), but this has changed because local governments of the Hills districts have started investing in rural roads.
22 Hills and Mountain regions represent 83 percent of the total area of the country.
31
Table: 3.4: DoR Category of Roads in Region (Kilometers)
Regi onsNational Hi ghway Mid Hi l l
Feeder Roa ds Pos ta l Tota l
National Hi ghway Mid Hi l l
Feeder Roa ds Postal Tota l
Na tional Hi ghway Mid Hi l l
Feeder Roads Pos tal Tota l
Eastern 699 26 900 126 1751 783 369 1207 136 2495 14 57 51 2 124
Central 807 0 1458 214 2479 873 61 1832 212 2978 11 10 62 0 83
Western 478 8 840 54 1380 478 89 1349 51 1967 0 14 85 0 98
Mid Wes tern 636 30 741 82 1489 735 129 1179 100 2143 17 16 73 3 109
Far Western 514 38 461 95 1107 522 87 549 94 1253 1 8 15 0 24
Nepal 3134 102 4401 570 8206 3392 734 6117 592 10835 43 105 286 4 438
FY 04 FY 10
DoR : Category of Roads i n Region ( ki lometers)
Per Year Road Cons tructed
Table: 3.5: Status: Road Network by Ecological Belt and Category (Kilometer)
Regions
FY 04 FY 10Strategic
RoadsRura l
Roads Tota lStrategic
RoadsRura l
Roads Tota lStrategic
RoadsRura l
Roads Tota l
Mountains 1310 4393 572 738 1310 1081 3312 4393 85 429 514
Hi l l 11065 21553 3953 7112 11065 5820 15733 21553 311 1437 1748
Tara i 13886 16907 3682 10205 13886 3934 12973 16907 42 461 503
Nepal 26261 42853 8206 18054 26261 10835 32018 42853 438 2327 2765
FY 04 FY 10
Status: Road Network by Ecological Belt and Category ( kilometers)
Tota l Per Yea r Road Constructed

32
Box 2: Has Nepal Achieved Its Accessibility Targets?
Nepal’s accessibility measurements range between at two hours (for Tarai, or plains) and four hours (for Hills) of walk time to the nearest all-weather road. This covers 87 percent of the Hill population and all of the Tarai population by 2016. The current status is described in the preliminary estimates of the National Living Standards Survey – III (2011) which suggests that Nepal is within reach of achieving the national targets. In Tarai, the accessibility is 6 percent below the target (94 percent of the targeted 100 percent are within two-hours walk to a paved road) and in the Hills accessibility is 10.6 below thel target (in other words, 76.4 percent of the targeted 87 percent are within four hours walk of a paved road). But, if dirt roads are taken as the measure, then the country has achieved its target of 91 percent for the Hill population and nearly 100 percent of Tarai being within four and two hours’ walking distance from a dirt road.
However, if the Roads Condition Survey data is put into this equation, the results appear less rosy, because in this case the target does not mention a dirt road, but rather access to the nearest paved road, which can be taken as meaning an all-weather road. Of the 10,835 kilometers of strategic roads, almost 35 percent are earthen. The Surface Distress Index Survey of Strategic Roads Network (2010, November), the DoR states that 22.42 percent of strategic roads are in poor condition. Road condition statistics for local roads is dismal with most being earthen, and 50 percent in poor condition. Even without the road condition figures, it is clear that at least 13.5 percent of the population does not have all-weather road access. So, while more people are now living closer to roads – whether the roads have been built to their villages or they have moved their homes closer to roads is an unanswered question. What does matter is to what degree they are able to use the roads services year-round. The issue that is facing road sector today is not so much accessibility, but year-round serviceability. With 65 percent of roads being built of earth, the road sector investment challenge now is to shift policy towards construction of more all- season roads instead of “monsoon roads”, which are washed away during the rainy season under the “track opening policy”, and more investment in maintenance activities than in trying to achieve full coverage of the entire population to all-weather roads year-round.
Table:3.6: Time duration to reach the road
Walking time to Nearest All-Season Road
Population (%)Les s than
2 hours 2-4 hoursMore than
4 hoursLes s than
2 hours 2-4 hoursMore than
4 hours
Eas tern 23 66 6 28 76 8 16
Central 35 83 10 7 84 8 8
Wes tern 20 65 12 23 80 12 9
Mi d-Western 13 40 5 55 52 9 38
Far-Wes tern 10 52 17 32 63 14 23
Mounta in 7 20 6 74 21 17 62
Hi l l s 44 48 13 39 63 13 24
Tera i 49 91 6 2 94 5 1
Nepal 100 67 9 23 75 9 15
Walking time to Dirt Road
Population (%)Les s than
2 hours 2-4 hoursMore than
4 hoursLes s than
2 hours 2-4 hoursMore than
4 hours
Eas tern 23 73 7 20 90 4 7
Central 35 94 3 3 96 2 2
Wes tern 20 83 6 11 93 4 3
Mi d-Western 13 73 5 21 74 12 15
Far-Wes tern 10 73 8 19 76 10 14
Mounta in 7 40 4 56 59 10 30
Hi l l s 44 66 12 22 81 10 9
Tera i 49 99 0.6 0 99 0.03 0.2
Nepal 100 81 5 13 89 5 6
NLSS -II NLSS -II I
NLSS -II NLSS -II I

Efficacy of Road Investment, by Network Expansion Type
3.34 More earthen roads are being constructed. Earthen road construction amounted to 65 percent (26,201 km) of total road network in fiscal 2010 compared to 60 percent (15,811 km) in fiscal 2004. By contrast, longer-lasting roads amounted to 21 percent gravel and 14 percent paved, which raises questions about the durability of the overall roads network, its year-round use, and impact on biodiversity. The availability of resources at the centre, especially donor finance – and investment preferences of local governments to construct roads instead of investing in other sectors – has facilitated roads network expansion. Ceiling increases in the amounts that community or user committees can be contracted for to do earthen work, and the use of earth-moving equipment instead of manual labor to construct roads are two plausible reasons why planners prefer to build earthen roads instead of longer-lasting roads of gravel and bitumen. Although expansion of the roads network increases connectivity, making most of it from dirt limits its year-round use, investment efficiency and raises its harm to biodiversity.
3.35 No change was apparent in the types of roads being constructed in regions during the period under review. In fiscal 2004-10 most of the new roads were built in the Central region, with an annual average of 1,225 kilometers of earthen roads compared to just 87 kilometers of paved roads.23 With this
trend, the proportion of durable roads has been declining; in fiscal 2004, 16 percent of all roads were paved, by fiscal 2010 this had fallen to 14 percent. There is an urgent need for a policy directive channeling more public resources to construction of durable roads to improve all-season connectivity.
23 Source: DoR and DoLIDAR (57 districts only).
33
Figure: 3.14: Types of Road Constructed
0
5000
10000
15000
20000
25000
30000
35000
40000
45000
Blacktopped Gravel Earthern
4199 6249
15811601710635
26201
Types of Roads Constructed(in kilometer)
Nepal FY 10
Nepal FY 04
Figure: 3.15: FY 04 Types of Road by Region
0
1000
2000
3000
4000
5000
6000
7000
8000
Eastern Central Western Mid Western
Far Western
1540 804 460 443 951
1502 23341297 538
578
38934771
4597
1449 1100
FY 04 -Types of Roads by Region in kilometer
Blacktopped Gravel Earthern
Figure: 3.16: FY10 Types of Road by Region
0
2000
4000
6000
8000
10000
12000
14000
16000
18000
Eastern Central Western Mid Western Far Western
1763 1325 1151 768 1010
2396 3087 20921292 1767
4276
12123
6937
1859 1006
FY 10 - Types of Roads by Regionin kilometer
Blacktopped Gravel Earthern

3.36 Fewer roads are being constructed in Tarai. The expansion of roads in Mountain and Hill districts has crowded out construction in Tarai districts.24 In fiscal 2010, Tarai road connectivity comprised 39 percent of all roads constructed in the country, down from 53 percent in fiscal 2004. On an average, per year, 504 kilometers of roads are constructed in whole of Tarai region.
Road Sector Investment Impact
3.37 The national indicator target of two hours’ walking time to the nearest all-season road in Tarai and four hours’ in the Hills is within reach. Preliminary NLS III data show that 84 percent of the total population is within four hours’ walk from an all-season road, following a 1 percentage point improvement in the figure since 2003 (NLSS II). In 2003, 76 percent of the population was within four hours’ walk from an all-season road.
3.38 The Central region is well connected with roads and over 92 percent of its population lives within a four hours’ walk to an all-season road. Commensurate with the improved access, the Central region’s share in total roads-sector investment is 53 percent, with more than 16,000 kilometers of road facilitating the movement of goods and people across the region.
3.39 Preliminary NLSS III data show that the national indicator of 100 percent coverage of the Tarai population is within reach. Only 6 percent of Tarai inhabitants now have to walk more than two hours to an all-season road – and improvement achieved with only 17 percent of total roads-sector investment. Once data analysis of the NLSS III is complete, the state’s roads-sector should use this information to guide its expansion policy in the Tarai.
3.40 The roads sector’s investment in earthen roads has improved access. More than 91 percent of the Hills population is within four hours’ walk from an earthen road and 99 percent of the population of Tarai population is within two hours’ walk from such a road. However, as pointed out above (see Box 2), many of the earthen roads are prone to flooding and may not be navigable in rainy seasons. If priority is given to upgrading earthen roads to gravel road status, the country will be better-placed to achieve the national indicator milestones.
24 From investment data of the DoR and DoLIDAR.
34
Table: 3.7: Types of Roads Constructed in percent of total
Blacktopped Gravel Earthern Total BlacktoppedGravel Earthern TotalMountain 1 1 4 5 1 1 9 10Hill 7 5 30 42 6 5 39 50Tarai 8 18 27 53 7 15 17 39Grand Total 16 24 60 100 14 21 65 100
Types of Roads Constructed in percent of otalFY 04 FY 10

Recommendations
3.41 The achievements in the roads sector need to be protected and expanded, focusing implementation in the following areas:
Roads network expansion should keep focus on achieving the national indicator of the entire population being within two to four hours’ walk from an all-weather road by 2016. This will require (i) using the accessibility gap as a guide to regional and ecological-belt roads-sector investments; and (ii) expediting accessibility to all-weather roads – upgrading earthen roads to gravel and then to bitumen – with issuance of a policy directive that carries verification indicators to track progress.
Review the transfer policy – grants to local governments – for better downstream accounting of expenditure under appropriate accounting identities. Transfers of funds to local governments can be an important empowerment vehicle, but they also increase the risk of governance issues downstream. Vertical transfers to local governments should be tied to improvement of downstream accountability indicators, with consequent reduction in audit observations.
Resolve the issue of strengthening the capacity of Road Fund Board to carry out road maintenance work. After demonstrated capacity to maintain SRN with lowering of the levels of strategic roads network in poor conditions, put into operation the transfer of tax collected for road maintenance, from revenue code to Road Fund Board budget line for maintenance. The LRN maintenance budget should be tied to local governments’ contributions to ensure that local roads network-expansion is in line with maintenance availability.□
35
Table: 3.8: Walking Time to Nearest All-Season RoadWalking time to Nearest All-Season Road
Populati on (%)Less than
2 hours 2-4 hoursMore than
4 hoursLess than
2 hours 2-4 hoursMore than
4 hoursBlacktopp
ed Gravel Earthern Tota l
Average for period
(FY05 to FY10)
Eastern 23 66 6 28 76 8 16 1763 2396 4276 8435 12
Centra l 35 83 10 7 84 8 8 1325 3087 12123 16535 53
Western 20 65 12 23 80 12 9 1151 2092 6937 10180 14
Mid-Wes tern 13 40 5 55 52 9 38 768 1292 1859 3919 13
Far-Wes tern 10 52 17 32 63 14 23 1010 1767 1006 3783 8
Mounta in 7 20 6 74 21 17 62 257 251 3885 4393 9
Hi l l s 44 48 13 39 63 13 24 2750 2057 16746 21553 73
Terai 49 91 6 2 94 5 1 3010 6574 7323 16907 17
Nepal 100 67 9 23 75 9 15 6017 10635 26201 42853
Status of Roads in Kilometers FY 10NLSS -I I NLSS -I II

4. LOCAL ROADS SUB-SECTOR: INSTITUTIONAL ARRANGEMENTS
Summary
This chapter reviews the institutional arrangements within the local roads sector, covering the main stakeholders such as the Ministry of Local Development (MoLD); Department of Local Infrastructure Development and Agricultural Roads (DoLIDAR); Ministry of Physical Planning and Works (MoPPW); Department of Roads (DoR); Nepal Roads Board; and local bodies such as District Development Committees (DDC), municipalities (MU) and village development committees (VDC), and their linkages (see diagram below).
Existing Institutional Arrangements in the Local Roads Sub-Sector
4.1 There is no uniformity in the definition of a local road. “Local” is the generic term for all roads – rural, urban and agricultural – that fall into the broad category of local roads network (LRN). It excludes highways and feeder roads labeled as strategic roads network (SRN). The National Transport Policy
Table 4. 1: Road ClassificationRoad System Roads(i) Central Road System: 1. National Highways
2. Feeder Roads3. Roads having a specific objective.
(ii) Local Road System: 1. District Roads2. Village-Roads.3. Agricultural Roads4. Main Trails/Mule Tracks5. Village Trails/Mule Tracks
(iii) Urban Road System: 1. Roads inside municipalities2. Roads inside Town Development Board
36
Key Messages
Budgets and length of local roads have expanded but the institutional capacity of local institutions needs strengthening.
The District Transport Master Plan should guide expansion of local roads-network expansion and should not be limited to donor-funded projects.
Responsibility for local roads should be handled by a single entity, the Ministry of Local Development.

2001, classifies local roads as district roads, village roads, agriculture roads and main trails, with urban roads in a separate category (Table 4.1), and requires that the local roads and urban roads are planned and built by local governments – district or village development committees, or municipalities, whichever is responsible for a particular area.
4.2 The Ministry of Local Development is responsible for rural roads-sector development. At central level, the DoLIDAR, under the MoLD, is engaged in planning, budgeting, monitoring and controlling local roads programs (with some 75 percent of annual budget allocated to various agencies under their umbrella). DoLIDAR has been designated as the main government agency responsible for coordinating and extending technical support for construction, upgrading, rehabilitation and maintenance of local roads through the District Technical Office (DTO). The DTO is active in all 75 district development committees.
Figure: 4.1: Mapping of Institutional Arrangements for Local Road Sub-Sector
4.3 The DoR is also engaged with local road-building. The department, through its roads division offices, is engaged in designing and building local roads in many districts, in addition to its primary focus on the SRN. Roads Board Nepal is engaged with the local roads sub-sector as a funding source for road maintenance.
37
Mapping of Institutional Arrangements for Local Road Sub-sector
MoPPW DoR DoR-RDOs (through UCs or contractors) + ZDs
Planning+funding Executing
Road Board
planning+ funding
MLD DoLIDAR DDCs VDCs/UCs/BGs + Contractors
(planning+ funding) Planning + funding + executing
(planning+ funding+ executing)
VDCs UCs
(planning + executing) Projects / Programs Donors
(planning, funding, executing) (planning+ funding)
DDC (executing)
VDCs UCs
(executing)
VDCs

4.4 DoLIDAR, as the main technical office of the MoLD, is the lead central agency for coordinating and extending technical support in design, monitoring and executing local roads programs, including coordinating some donor-funded projects at local level. DoLIDAR is involved in over 75 percent of centrally-controlled local infrastructure development programs, most of which are donor funded.
4.5 There is no designated unit at the MoLD to coordinate development of local roads. No separate organizational unit is responsible for local roads development at the MoLD. But, DoLIDAR has a separate work unit called the “rural and agricultural division” overseeing local roads development. However, through its technical office – District Technical Office – DOLIDAR provides technical services for all infrastructure development to all 75 districts.
4.6 The processes of planning and budgeting are as follows: Both the MoLD and DoLIDAR issue directives to DDCs, municipalities and VDCs for planning and executing road programs. They also give framework and support for preparing and updating the long-term District Transport Master Plan. In line with these standards and directives – which vary by program and project – the planning for local roads programs begins locally. This devolution in planning is to ensure that road programs are demand-led by local communities and are incorporated into the District Transport Master Plan and donor-funded road projects. However, this principle does not always apply in practice; LRN planning and its implementation is still very much influenced by local politics, with support from the local bureaucracies. The absence of locally-elected representatives is citied as a reason for this low level of community ownership and, consequently, poor governance. This situation may be the single most important factor, among several, limiting popular participation in the planning of the LRN.
4.7 Local contributions must cover 30 percent of the total cost of a rural road, if it is centrally managed. A central grant budgets only 70 percent of the estimated cost of the project; the balance must come in the form of people’s participation (20 percent) and from internal sources of the local governments concerned (10 percent). The central government stipulates that all local governments must set aside at least 30 percent of their annual budgets for roads programs, and 30 percent of that for new roads. In practice, however, the local governments’ expenditure on roads is much higher.
4.8 The District Technical Office is responsible for regular monitoring, supervision and evaluation of local roads while under construction. The local user committees take over this responsibility upon completion. The DTO undertakes regular supervision, quality control and evaluation inspections of local road programs and it can outsource consulting services. The office regularly submits physical and financial reports, on a trimester and annual basis, to the DDC, DoLIDAR, PCOs, LTISP and MoLD, within seven days of the completed period. The operation and maintenance of completed road programs is the responsibility of user committees.
4.9 The DoR has limited responsibility for local roads but full control over all centrally-managed local road programs. The DoR’s roads division office – 25 offices covering 75 districts of the country – constructs local roads but is restricted to roads that (i) connect two districts; (ii) connect economic centers within a district; and (iii) connect villages to district headquarters.
38

4.10 The DoR has latitude to include road programs in its annual budget. It includes annual local road programs its annual departmental program, under “central carried-forward road programs – budget line item number 48-4-249” of the national budget. After considering the size of approved budget, senior officials of DoR decide on the number of roads to include in the roads program, allowing DoR officials to influence the allocation of funds and alignment of local roads. Politicians from around the country typically try to influence the decision-making, which has led to a skewing of resources and road length, according to political influence rather than need across the development and geographical regions.
4.11 Contracting is required for job work exceeding NRs 150,000. As a result small projects are often packaged together to raise the value of the work to contract size. This practice is prevalent in areas where local road construction is done with earth-moving equipment and contracts tend to be awarded to preferred contractors under an all-party approval mechanism.
Effectiveness of Institutional Arrangements
4.12 There are too many stakeholders in the local roads sub-sector. The wide variety of institutions involved with policymaking, legal, structural and regulatory arrangements, makes it extremely difficult to assess the effectiveness of planning, budgeting, funding, executing and control functions, and inter-linkages in the sub-sector (see paragraph 4.18).
4.13 The MoLD budget has increased and significant amount of this is transferred vertically to local governments. The MoLD budget has increased four-fold, to NRs 42 billion in fiscal 2011, from NRs 11 billion in fiscal 2008. More than two-thirds of the ministry’s budget is allocated to local development in the form of transfers – grants to district and village development committees and municipalities – and LRN expansion.
39
Table: 4.2: Road Specific and Non-Road Specific Programs in MoLD Cluster
Road-specific Infrastructure Development Programs/ Projects
Non-road Specific Development / Support Programs
Title Donor Title Donor1) Rural Access Improvement and
Decentralization Project (RAIDP) WB 1) DDC Grant
2) Decentralization Rural Infrastructure and Livelihood Project (DRILP)
ADB 2) VDC Grant
3) Rural Reconstruction and Rehabilitation Sector Development Project (RRRSDP)
ADB/SWISS
3) Municipality Grant
4) Rural Community Infrastructure Works Program
4) Election Constituency Development Program
5) Local Transport Infrastructure Sector Program (RTI-SWAP)
5) Local Development Fees Fund
6) Trail bridge and local road bridge program
6) Local Governance and Community Development Program (LGCDP)
Donor Community
7) Rural Access Program DFID 7) Rural Road Bridge Program8) District Road Support Program Swiss Govt9) Rural Road Maintenance Fund

4.14 Road construction is local government’s priority and such roads are mostly earthen. Local governments appear to prefer extending the LRN length rather than improving its quality. As the LRN budget has increased, the extent of earthen roads has increased from 1,799 km per year in fiscal 2008 to 2,402 km in fiscal 2010. This trend is expected to continue, following a central government directive to raise the ceiling of the amounts of earthen work conducted by user committees to NRs 6 million, from NRs 3.5 million, and an eagerness of local governments to appropriate funds for such work in their budgets. Besides LRN expansion, local governments have increased funds for road maintenance. Road-length under local-government maintenance increased five-fold during fiscal 2008-10, from 1,137 km to 5,184 km. In absence of audit of local roads, although priority shown on maintenance work by DoLIDAR is a positive change, amount spent per kilometer for maintenance is declining with increase in budget (FY 08 to FY 10) questioning quality of work undertaken.
4.15 “Track opening” is another priority of local government’s investment25. More than 5,000 km of track roads were completed during fiscal 2009-10. The LRN definition has been expanded to include the category of “track opening”. The availability of funds to complete these ongoing activities is contentious, as it has become a widespread practice among local governments, with or without treasury-backed budgeting.
4.16 Two donor-funded projects have reported good progress and one (Local Transport Infrastructure Sectoral Program) dominates the sub-sector. Ten large, local infrastructure projects are donor-financed and performance across these programs/projects varies. The Local Transport Infrastructure Sectoral Program (LTISP) is by far the largest donor-funded program, both in terms of funding level and activities, and has prioritized road maintenance (Table 4.2).
25 Track opening is when two destinations are connected by dirt road not necessarily motorable.
40
Table 4.3- Actual Budget and Accomplishments in Local Road-related Programs / Projects under MoLD / DoLIDAR(Budget in NRs million and physical progress in lengths of road in kilometer)
Programs / Projects FY 2007/08 FY 2008/09 FY 2009/10Actual budget
Physical Progress Actual budget
Physical Progress Actual budget
Physical Progress
MoLD / DoLIDAR Total
10972 Earth Rd: 1799kmGravelling: 437kmBlacktop: 100 kmMaint: 1137km
24844 Earth Rd: 1740kmGravelling: 1582kmBlacktop: 398 kmMaint: 4459kmTrack: 3142km
31348 Earth Rd: 2402kmGravelling: 1569kmBlacktop: 383 kmMaint: 5184kmTrack:2142km
a) Road Program / Project Specific Total (Physical infrastructure Development)
2749 Earth rd: 1375kmAll-weather: 191km
4627 Earth Rd: 1687kmGravel Rd: 1289kmBlacktop: Maint: 3888kmTrack: 583km
5351 Earth Rd: 1378kmGravelling: 436kmBlacktop: 35 kmMaint: 2205kmTrack:83km
b) Non-Road Program / Project Specific Total (General local development)
5851 Earth Rd: 424kmAll-weather (Grav/btop) Rd: 346kmMaint: 1137km
13167 Earth Rd: 53kmGravelling: 293kmBlacktop: -Maint: 571kmTrack: 2559km
15167 Earth Rd: 1024kmGravelling: 1133kmBlacktop: 348 kmMaint: 2979kmTrack:2059km

Table 4.4 Actual Budget and Accomplishments in Local Road-related Programs / Projects under MoLD / DoLIDAR(Budget in NRs million and physical progress in lengths of road in kilometer)
Programs / Projects FY 2007/08 FY 2008/09 FY 2009/10Actual budget
Physical Progress Actual budget
Physical Progress Actual budget
Physical Progress
1) Rural Access Improvement and Decentralization Project (RAIDP)
630 All-wthr: 160kmNew: 25km
631 All-wthr: 256kmSeasonal: 17kmMaint: 150km
306 All-wthr: 87kmSeasonal: 20km
2) Decentralization Rural Infrastructure and Livelihood Project (DRILP)
449 Survey: 109kmNew rd: 26kmRural rd: 48km
1209 Design: 160kmNew rd: 112kmUpgd: 75km
1352 New rd: 71kmUpgd: 32km
3) Rural Reconstruction and Rehabilitation Sectoral Development Project (RRRSDP)
14.0 Prep work 220 Feasibilities, design etc.
776 Const: 20 districtssurvey/design
4) Rural Community Infrastructure Works Program (RCIWP)
163 Rural rd: 114km 133 Rural rd: 104km 112 Rural rd: 43km
5) Local Transport Infrastructure Sectoral Program (LTISP)
964 Survey 830kmNew.: 1121kmGrav: 418kmMaint: 667kmBlacktop: 31km
973 Survey: 422km New rd: 1331kmMaint: 1274kmGrav: 864Blacktop: 27km
994 Survey: 712km Earth rd: 1033kmMaint: 1650kmGrav: 370kmBlacktop: 35km
6) Trail bridge and local road bridge program
87 Com bridges: 3CF Bridges: 6Dtl.studies: 10
252 Design: 11 bridWork-in-prog: 79
403 Surv design: 17Rural rd bridge: 4
7) Rural Access Program 300 Project prep 241 Track: 365km 1131 Rural rd: 98km
8) District Road Support Program
87 New rd: 15kmRtn. Maint.:109Prd.Maint.:109Rehab.: 25km
90 Rural Rd: 12kmRtn. Maint: 100kmPrd. Maint: 102kmRehab: 25km
150 New rd: 26kmRtn.maint: 330kmPrd.Maint: 225kmRehab.: 34km
9) Rural Road Maintenance Fund
55 As targeted 19 - - -
10) Participation-based Development Program
- - 859 Survey: 109kmNew track: 333kmR.Maint: 188km
133
41
4.17 Several centrally executed projects are underway involving LRN expansion. Roughly 2,000 km of roads are being constructed annually in these projects, with more than 70 percent of this network expansion being undertaken under the Local Transport Infrastructure Sectoral Program.
4.18 The many sources of funding for local roads construction make it difficult to collate data. All levels of local government undertake large numbers of road construction activities. Here are some observations of common practice:26
Multiple sources of funding:o District Development Committees (DDCs) undertake large numbers of road
programs but data recording is poor;
o DDCs of the Tarai districts are found to have more programs and wider coverage than those of DDCs in Hills districts;
o The DDC of Jhapa has 11 sources of funding for road programs while the DDC of Kaski has just seven funding sources;
o Both Jhapa’s and Kaski’s DDcs receive funding for road expansion from grants, the LGCDP, LTISP, Road Board Nepal, and internal income, but the lengths of road covered by these projects seem too short to warrant the extent of technical support and capacity-building programs in place;
o Municipalities undertake urban road programs. Like DDCs, municipalities have several funding sources for local road development, ranging from seven in Damak to three in Pokhara. Apart from external funding sources, municipalities use their own resources and mobilize people to participate in funding urban road construction;
o Different criteria are used to cost road building. Damak uses a low cost per unit for road construction but a high level for people’s construction, nearly 50 percent of the total cost;
o About 70 percent of the municipal grant is used for road construction.
26 Inferences were drawn from Jhapa and Kaski DDCs, Damak and Pokhara municipalities, and Gailadubba and Methinkot VDCs.
42

o Village development committee (VDC) roads have four funding sources:– the VDC, LGCDP, DDC grants and internal sources. The VDC grant has doubled, from NRs 3.7 billion NRs 7.8 during fiscal 2008-10. In Tarai, the DDCs are undertaking road programs, at the request of VDC, with budgets of less than NRs 300,000 per road.
Local contribution:o Local contribution is one criterion to access grants from central government
for road construction projects. Local bodies fulfill such criteria by mobilizing resources from internal sources or people’s participation (either through cash or labor). But contribution ratios vary across programs;
o Roads constructed at the local level by the RoD do not require people’s participation contributions, which raises questions about the consistency of policy.
o There is reportedly evidence of people’s contributions being made only on paper, and of inflated project costs to access more central funding. Also, evidence suggests the value of local contributions is sometimes inflated to raise the central fund contribution.
Local Contributions to Total Program CostS.N Local bodies Total budget of local
bodyRoad Program Budget Local Contribution
Local body People’s participation
1 DDC (Jhapa):Total budget / Internal source:
DDC grantsLGCDPLTISPRoad Board Nepal
582 / 77
8.87.2
22.80.14
NANANANA
NANANANA
2 DDC (Kaski):Total budget:
DDC GrantLGCDPLTISPRoad Board NepalInternal source
522 / 70
10.09.9
18.02.2NA
NANANANANA
NANANANANA
3 Municipality (Damak): FY 2008/09Total budget / internal source:
Municipality GrantLGCDP LTISPRoad BoardReserve FundInternal Source
100 / 58
8.9
7.94.09.5
10.5
4.4
3.80.70.0
10.0
4.4 (100%)
4.1 (100%)0.9 (40%)
4.75 (50%)0.5 (100%)
43

4 Sub-metropolitan (Pokhara):Total budget / Internal source
LTISPRoad BoardInternal source
310 / 118
3.514.956.7
-1.2
38.2
0.9 (26%)3.2 (29%
18.5 (100%)
5 VDC (Gailadubba, Jhapa):Total budget / Internal source
(12 Road Progs in FY 2009/10)DDC GrantLGCDP
11.1 /1.4
1.91.30.6
-0.34 (18%)
0.180.16
6 VDC (Methinkot, Kavre):Total budget / Internal source
(7km Road in FY 2008/09)DDC GrantDDC-LGCDP
1.95 / 0.1
2.00.50.4
- 1.1 (55%)
44

Specific Issues in LRN Institutional Arrangements
4.19 Public-sector organizations associated with the MoPPW/DoR and MoLD/DoLIDAR have crowded out the informal sector in road construction, especially user committees. This crowding out affect marginalizes the role of NGOs and CBOs in raising awareness and stimulating people’s contributions in areas where public institutions are involved.
4.20 The focus of the DoR on strategic roads construction is constrained by its workload . Each DoR divisional office averages 40-75 small road programs yearly – costing less than NRs 10 million per program 27 – in addition to their main function of expanding the SRN.
4.21 Local participation in road construction has fostered ownership but there is troubling evidence corruption where people’s contributions are made on paper only. This practice needs to be stopped before it becomes pervasive. User committees should be registered with their respective district administration offices to avoid pseudo-local partnering, as has been reported in the surveyed districts.
4.22 Programs in the roads sub-sector could be strengthened by selectivity. Road projects should be selected on the basis of need, with due focus on maintenance of existing roads, the likelihood of timely completion, predictability of funds, and with the active participation of user committees to ensure mobilization of local labor and resources, and adoption of measures to reduce environmental degradation and road maintenance.
4.23 The increasing use of earth-moving equipment to build roads that should be built with local labor undermines people’s participation. It also marginalizes local responsibility, involvement and effectiveness of user committees, and quality and sustainability of roads built. At the surveyed districts, more than 30 bulldozers were in operation constructing local roads which, in principle, were supposed to be built with local labor.
4.24 Participatory planning for development of local economies through people’s participation is insufficient. Other than improving access and connectivity, there is very little discussion at the planning stage to assess the impact of roads in terms of their benefit to marginalized groups, improved access to socio-economic opportunities, environmental protection and sustainability of local infrastructure. With many sources of funding and diverse accountability mechanisms in place, local bodies’ record keeping is lax.
4.25 A multitude of stake-holders have influence in roads programs. People are the ultimate stakeholders but their influence in, and development of, local roads are limited. Though stakeholders have varied levels of influence in the choice of program and program execution, donor communities and local political leaders are most influential in shaping numbers, locations and budgets for local roads.
27 The DoR at Bhaktapur is engaged in 116 road-related programs with a budget of NRs 71.6m. This includes 76 local roads with a combined budget of NRs 6.6 millions, of which NRs 3.3m is allocated for 73 of them. Likewise, the DoR at Jhapa has been involved in 127 road-related programs involving NRs 100.4m, with 98 local roads having budget of NRs 17.1m, 93 of them costing a combined NRs 10.5 m. This has hampered their performance in strategic road-building, and in some cases has duplicated the work of other DoRs and local bodies.
45

Major change agents engaged in the local roads sub-sector at central policy level are the NPC, MoF, DoR, MoLD/DoLIDAR and donors.
Institutional Environment – Policy, Legal and Regulatory Arrangements
4.26 A lapse in national roads policy has encouraged duplication of work. The DoR is engaged in local roads programs although its primary responsibility is to expand strategic roads. Some 600 local roads were placed under DoLIDAR’s responsibility six year ago. But, with policy lapses that have encouraged political interference, more local roads are being constructed today by the DoR than a few years ago, undermining the role of local governments. The DoR spends 5 percent of its budget on local roads programs.
4.27 The definition of rural and agricultural roads is vague and there is no designated institution Three Year Plan targets. Agricultural roads were conceptualized in the 20-year Agricultural Perspective Plan (1992) to support agricultural growth. But, so do rural roads, and there is no mechanism or institution in place to monitor the rural road targets of the Three Year Plan: 675 km of new roads, routine maintenance of 8,300 km of roads and periodic maintenance of 1,500 km.
4.28 The District Transport Master Plan (DTMP) guides only donor-funded rural roads programs. Construction of roads is a synonym for development in local areas, even if it means only track opening. Hence more tracks are opened by local governments under local roads programs using their own resources. The DTMP guides donor-funded road projects through central grant.
4.29 Governance and accountability arrangements are weak in the rural road sector. There may be conflict of interest in the appointment of auditors to audit local governments’ accounts. Internal auditing of DDC programs by DDC-appointed internal auditors, and auditing of VDC programs by private auditors, has often cast doubt on these institutions’ financial discipline. The alleged nexus between contractor and local influential leader (sometime pseudo-contractors) has limited accountability in public expenditures. The cases of cumulative unsettled accounts and irregularities of local bodies reached NRs 5.2 billion in fiscal 2010, from NRs 0.46 billion in 2008. 28. Reasons given for the increase included (i) a lack of internal control system; (ii) unmanaged and unplanned procurement without procurement unit; (iii) doing work through user committees for the amount as prescribed by the law; and, (iv) a tendency to work towards the end of fiscal year to spend unused budget.
4.30 Lobbying for roads at the centre is effective in ensuring budget but not implementation. Lobbying at the centre adds work to the DoR roads programs, but fund allocation for these is minimum. Actual local needs do not spell out road length nor alignment, but the process in place is influenced by local political leaders or parties. Local leaders often influence the composition of user committees, including accounting and reporting and auditing of the actual expenses.
28 The DDC at Jhapa has unsettled accounts amounting to NRs 36.4 million, involving programs and projects with road components in fiscal 2010. Also, it was reported that the chairperson had fled after misappropriating funds for a road program at Kavrepalanchowk DDC.
46

4.31 National roads strategies guide the SRN development but not for the rural LRN. The Three Year Plan spells out outcomes to be achieved for both the SRN and rural roads by fiscal 2013. But, organizational initiatives for sharing and improving understanding of such strategic outcomes are missing. Donor-funded projects follow the DTMP but the same cannot be said for roads funded by local bodies as there is no long-term plan for rural roads expansion.
4.32 Donor-funded road projects have sufficient budget allocation, but the same cannot be said for government-funded activities. Donor-funded projects receive appropriate levels of funds. For instance, 36 donor-funded roads in fiscal 2011 received NRs 3.26 million per km, compared to Kavrepalanchowk DDC’s allocation of NRs 1.5 million for the entire length of road. Meanwhile, a VDC of Kavrepalanchowk allocated a mere NRs 60,000 for the whole road program. Such meager budget allocations do more to leverage political needs than actual completion of roads.
4.33 There is evidence (though little) of improvement within local road sector. A performance-based conditional grant, the handing over of small roads programs of less than NRs 2000, 00 by DDC to VDCs, and the introduction of low-cost technology – “otta sealing” – for quick block-topping of gravel roads are just three notable changes that have taken place within the roads sector.
4.34 The MoLD has inconsistent lines of responsibility and accountability for the management of roads. The MoLD interacts directly with local governments on the release of funds, while DoLIDAR manages all technical issues.29 Blurred lines of authority and weak project design management – namely of RRRSDP and RAP donor-funded projects – has created tension between the LDO and DoLIDAR. The LDO, being accountable for local development programs, argues that all executive authorities for all types of local development programs,30 including donor-funded projects, should rest with this entity. But, the District Technical Office (DTO), which has yet to be fully incorporated as a section within the DDC formal structure, argues that the DTO chief should carry delegated administrative and financial authorities until such a time as this entity becomes part of the DDC network.
29 Local people say that DoLIDAR has overstepped its mandate and become an implementing agency.
30 Local office of line agency, DoLIDAR.
47
Table :4.5: Staffing in DoLIDAR and Support Offices
Levels DoLIDAR PCUs (RRRSDP)* DTOs DPOs (RRRSDP)
Tech Adm Total Tech Adm Total Tech Adm Total Tech Adm Total
Officer 17 3 20 10 1 11 176 - 176 20 - 20
Non-officers 1 9 10 2 3 5 561 248 809 80 40 120
Class-less - 7 7 - 7 7 - 148 148 - 60 60
Total 18 19 37 12 11 23 737 396 1133 100 100 200
* Cited only an example of PCU staffing, excluding staffing of other PCUs and program offices like LTISP

4.34 Staffing strength is not commensurate with the increase in budget and workload. At DoR and DoLIDAR, the budgets for local roads have increased but their staffing strengths have remained unchanged for the last seven years. DoLIDAR’s 20 officials and 10 non- officials provide technical backstop to all 75 districts’ local governments. Similarly, the DoR technical teams, besides managing the SRN, provide technical input, normally under stretched conditions, to the construction of centrally-managed local roads.31
5. RECOMMENDATIONS
Strategic focus for reforms: It is recommended that institutional improvement measures be directed towards: (i) strategic policy reforms to improve compliance; (ii) building on existing institutional arrangements and their inter-linkages to strengthen institutions; and (iii) institutionalizing proven organizational management practices to improve efficiency of road institutions. It is important that these improvement measures be carried out in ways that strengthen local governance in line with national development priorities and the process of transitional management taking place in the country.
Strategic Policy Reforms
Integrated Framework
Establish one umbrella law and policy articulated for road sector development. The existing Road Act 1976, Nepal Road Board Act and Local Infrastructure Development Policy and their related manual and directives should be reviewed and amended with a view to mitigating duplication of work.
Complete the LRN policy and articulate its strategy. Integrate policy and its legal framework to ensure coordination and linkages between planning
and executing work for strategic road network and local road network. Likewise, policy focus must be towards rehabilitation, upgrading and maintenance of existing local roads, and moving away from “track-opening” types of road programs.
Issue a policy directive that all road programs should have an impact assessment on socio-economic improvement of local people, community and environment.
Steer policy towards strengthening accountability, transparency, responsiveness, and people-centricity of local bodies.
Simplifying Institutional Arrangements
31 The government has reversed a decision to hand over to MoLD 249 local-level projects managed by the DoR.
48

Make a clear distinction between the SRN and LRN, and identify the institution(s) responsible for maximization the development of each. This could be achieved in two ways: (i) completely shifting all local road-related functions to DoLIDAR and having them executed through local bodies; or (ii) executing local road programs, designed and funded by the DoR, though respective DDCs and municipalities by incorporating these programs into their annual plans with technical support for their technical wings.
Provide adequate technical human resources to local bodies, DDCs, municipalities and VDCS, according to their sizes and workloads to ensure that these bodies are able to locally monitor and meet technical standards of the infrastructural development work. The proposals made by the DoLIDAR for reorganizing its staffing patterns, qualitatively and quantitatively at its central level organizations and DTOs of DDCs are most timely and worthy of consideration by the responsible decision-making authorities of the government.
The emphasis on upgrading the position of DTO, from class III engineer to class II engineer, and supply of supportive technical staff in the Hills districts could meet the increased road-related activities in such districts. Likewise, the proposal floated by the MoLD for upgrading the leadership position in selected VDCs and municipalities, with increased staff, would likely bear fruit, and hence needs to be supported by all stakeholders.
DoLIDAR, being the lead agency for local infrastructure development in the country, need strengthening by a review of its mandates, roles, functions, authorities, and resources (human, finance and technological), as well as its organizational set-up, which should also reflect in institutional capacity of local bodies. In this regard, it is recommended that DoLIDAR:
o Limits its roles in designing and monitoring of execution of integrated local infrastructure development plans and extending technical backstopping for execution of road programs through local bodies;
o Focuses on strengthening its central level organizations and DTOs of DDCs to ensure their improved technical support to DDCs, municipalities and VDCs by reviewing organizational structures and staffing patterns.
o Executes the existing HR policies and strategies (developed and approved in 2010), and focuses on delivery of training services to staff of local bodies and members of local non-government organizations and local communities, particularly those participating in the user committees;
o Maintains close working relationships with DTOs as its focal points for extending technical support, without administrative control, and ensuring maintenance of technical standards to design, execution and supervision of local road programs; and
o Operates as focal point between international development partners and local bodies in design and execution of donor-funded projects, for which either one project unit for each big project (such as the one for DRILP) or one sector-wide project coordination
49

office (such as that for RTI-SWAP) can be set-up, instead of having a separate project coordination office.
There is need to improve the roads-sector public financial system. The uses and sources of road fund records for local area development are far from sufficient to undertake policy decisions or evaluation. Strengthening of PFM in the roads-sector institutions will reduce costs of multiple reporting and duplication of work, increase efficiency of investments and generally enhance governance in this sector by increasing transparency and accountability of funds use and supporting accountability to local beneficiaries. The first step should be to make it mandatory to report all sources of funds for local development. The second step is to have all sources of funds be reported as part of district development fund to undertake development work by stakeholders other than the government.
Roads-sector planning and the impact of public investment can be improved. To improve planning and monitoring of execution of road programs, the following measures should be considered for implementation: (i) DTMP must the overall local road expansion; (ii) code should be assigned to each road for monitoring both physical and financial progress; and (iii) Assign DoLIDAR, at national level, and DDCs, at local level, to carry out road asset management.
50

Annex One:
Sectoral ExpenditureThree
year Plan
As percent of GDP 2002/03 2003/04 2004/05 2005/06
2006/07 (Peace
restored) 2007/08 2008/09
2009/10 (Provision
al)2010/11
AllocationSocial Sector 5.22 5.15 5.49 5.57 6.34 6.98 9.21 9.61 11.14 5.55 8.60 11.14
Education 2.68 2.67 2.91 2.94 2.94 3.30 3.58 3.95 4.28 2.83 3.61 4.28Health 0.78 0.78 0.83 0.92 1.06 1.25 1.35 1.42 1.82 0.88 1.34 1.82Drinking Water 0.44 0.48 0.34 0.42 0.56 0.58 0.72 0.59 0.69 0.45 0.63 0.69Local Development 0.98 0.81 0.85 0.82 1.20 1.11 1.91 1.86 2.07 0.93 1.63 2.07Other Social Sectors 0.34 0.41 0.56 0.47 0.58 0.74 1.65 1.78 2.28 0.47 1.39 2.28
Economic Sector 3.82 3.72 3.89 3.69 3.67 4.76 4.59 5.15 6.34 3.76 4.83 6.34Agriculture 0.40 0.37 0.37 0.41 0.43 0.44 1.11 0.59 0.97 0.40 0.71 0.97Irrigation 0.48 0.46 0.40 0.44 0.48 0.50 0.64 0.74 0.67 0.45 0.63 0.67Forestry 0.33 0.33 0.34 0.28 0.26 0.26 0.28 0.29 0.32 0.31 0.28 0.32Industry 0.17 0.12 0.10 0.08 0.08 0.09 0.10 0.09 0.14 0.11 0.09 0.14Other Econic Sector Sectors 0.30 0.48 0.40 0.60 0.53 1.57 0.52 0.76 0.69 0.46 0.95 0.69Infrastruture 2.14 1.96 2.28 1.89 1.90 1.89 1.94 2.67 3.54 2.03 2.17 3.54Roads 0.83 0.84 0.78 0.70 0.94 0.94 1.03 1.48 2.02 0.82 1.15 2.02Air Transport 0.00 0.00 0.00 0.01 0.01 0.02 0.05 0.08 0.08 0.00 0.05 0.08Railroads 0.01 0.01Water Transport 0.0004 0.0004Communication 0.52 0.23 0.26 0.20 0.19 0.20 0.24 0.21 0.20 0.28 0.22 0.20Power 0.79 0.89 1.24 0.97 0.76 0.73 0.63 0.91 1.24 0.93 0.75 1.24
General Administration 8.03 7.80 8.02 7.69 8.34 8.04 8.43 7.36 7.61 7.98 7.94 7.61 o/w Police 1.25 1.16 1.24 1.23 1.29 1.53 1.45 1.50 1.42 1.23 1.49 1.42o/w Defense 1.48 1.56 1.84 1.71 1.51 1.37 1.46 1.50 1.33 1.62 1.44 1.33 o/w Loan payments 3.29 3.23 3.35 3.12 3.15 2.79 2.73 2.42 2.27 3.23 2.65 2.27o/w Others 2.01 1.84 1.59 1.63 2.39 2.35 2.79 1.93 2.59 1.89 2.36 2.59
Three Year Plan ( First
Year)
Tenth Plan Interim Three Year Plan
Tenth Plan
Interim Three
Year Plan
I

Annex Two:
Line Item Expenditure - National
In Rs. BillionCentra l
LevelDi stri ct
Le vel2061/62
Tota lCentra l
Le velDi stri ct
Le vel2062/63
Tota lCentra l
LevelDi strict
Level2063/64
Tota lCentra l
LevelDi strict
Level2064/65
Tota lCentra l
Le velDi strict
Level2065/66
Tota lCentra l
Le velDi strict
Level2066/67
Tota l
Current Expenditure 55.5 6.2 61.7 60.5 6.5 67.0 69.7 7.5 77.1 82.8 8.7 91.4 115.1 12.6 127.7 132.7 18.9 151.6
Staff sa lary and a l lowa nces 16.5 1.3 17.8 19.3 1.1 20.4 21.2 1.2 22.4 26.5 1.3 27.9 32.7 1.6 34.4 39.9 2.0 41.9
Cons ultancy and other s ervices 0.4 0.1 0.5 0.5 0.1 0.7 0.5 0.1 0.6 0.6 0.0 0.7 0.7 0.1 0.8 1.0 0.1 1.1
Local Government trans fer 0.1 1.2 1.3 0.1 1.4 1.4 0.1 1.7 1.8 0.1 1.9 2.0 0.2 2.8 2.9 0.3 4.1 4.4
Non- profi t i ns titution - grants ( conditi onal and unconditi ona l ) 13.9 2.1 16.0 15.6 1.9 17.4 17.5 2.1 19.6 21.4 2.4 23.8 31.3 4.1 35.4 38.8 6.8 45.6
Program Travel l i ng expens es 0.7 0.1 0.9 0.7 0.2 0.9 0.8 0.2 1.0 1.2 0.2 1.4 0.9 0.3 1.2 1.0 0.4 1.4
Capital Expenditure 35.7 5.2 40.9 37.7 6.2 43.9 46.4 10.1 56.5 57.4 12.5 69.9 69.9 22.0 91.9 82.0 25.7 107.7
Civi l Constructi on 6.8 1.2 8.0 7.0 0.9 7.9 10.6 1.4 12.0 10.8 2.1 12.9 18.9 4.0 22.9 24.9 3.1 28.0
Inves tment (7) 7.4 0.0 7.4 7.8 0.0 7.8 7.9 0.0 7.9 15.3 0.0 15.3 7.8 0.0 7.8 14.0 0.0 14.0
Local Government trans fer 0.0 3.4 3.4 0.1 4.0 4.1 0.1 6.8 6.9 0.2 6.7 6.9 0.7 13.3 13.9 1.3 16.4 17.6
Non- profi t i ns titution - conditi ona l and unconditi onal grants 2.8 0.4 3.2 3.4 0.9 4.3 5.5 1.3 6.8 7.6 2.6 10.1 16.7 2.8 19.5 12.4 3.8 16.2
Transfer ( 3+8) 6.7 5.0 11.7 7.6 5.8 13.4 11.2 9.4 20.6 14.2 10.9 25.0 24.2 18.7 42.9 23.1 23.9 46.9
In Percent of total
Current Expendi ture 60.9% 54.5% 60.1% 61.6% 51.4% 60.4% 60.0% 42.4% 57.7% 59.1% 40.9% 56.7% 62.2% 36.4% 58.2% 61.8% 42.4% 58.5%
Capi ta l Expendi ture 39.1% 45.5% 39.9% 38.4% 48.6% 39.6% 40.0% 57.6% 42.3% 40.9% 59.1% 43.3% 37.8% 63.6% 41.8% 38.2% 57.6% 41.5%
Transfer ( 3+8) 7.4% 44.2% 11.5% 7.7% 45.8% 12.1% 9.7% 53.3% 15.4% 10.1% 51.2% 15.5% 13.1% 54.1% 19.5% 10.7% 53.4% 18.1%
Percent of Current Expendi ture
Staff sa lary and a l lowa nces 29.8% 20.6% 28.9% 31.9% 17.5% 30.5% 30.4% 15.6% 29.0% 32.0% 15.4% 30.5% 28.4% 13.0% 26.9% 30.1% 10.5% 27.6%
Cons ultancy and other s ervices 0.7% 1.1% 0.8% 0.9% 1.8% 1.0% 0.8% 1.0% 0.8% 0.8% 0.4% 0.7% 0.6% 0.5% 0.6% 0.7% 0.6% 0.7%
Local Government trans fer 0.2% 18.5% 2.1% 0.1% 21.0% 2.2% 0.1% 23.2% 2.4% 0.2% 21.6% 2.2% 0.2% 21.8% 2.3% 0.2% 21.6% 2.9%
Non- profi t i ns titution - grants ( conditi onal and unconditi ona l ) 25.0% 34.2% 25.9% 25.7% 28.7% 26.0% 25.2% 28.4% 25.5% 25.8% 27.8% 26.0% 27.2% 32.4% 27.7% 29.3% 35.7% 30.1%
Program Travel l i ng expens es 1.3% 2.4% 1.4% 1.2% 2.5% 1.3% 1.1% 2.2% 1.2% 1.4% 2.2% 1.5% 0.8% 2.2% 1.0% 0.8% 1.9% 0.9%
Percent of Capita l Expendi ture
Civi l Constructi on 19.2% 23.2% 19.7% 18.6% 15.1% 18.1% 22.8% 14.1% 21.2% 18.8% 16.8% 18.5% 27.0% 18.2% 24.9% 30.4% 12.1% 26.0%
Inves tment (7) 20.7% 0.0% 18.1% 20.8% 0.0% 17.9% 17.0% 0.0% 14.0% 26.7% 0.0% 21.9% 11.1% 0.0% 8.5% 17.1% 0.0% 13.0%
Local Government trans fer 0.1% 66.2% 8.4% 0.3% 64.4% 9.3% 0.2% 67.1% 12.2% 0.4% 53.3% 9.9% 0.9% 60.3% 15.2% 1.5% 63.7% 16.4%
Non- profi t i ns titution - conditi ona l and unconditi onal grants 7.9% 6.8% 7.7% 9.1% 14.0% 9.8% 11.8% 13.1% 12.0% 13.2% 20.5% 14.5% 23.8% 12.8% 21.2% 15.1% 14.8% 15.0%
20102005 2006 2007 2008 2009
II

Annex Three:
Line Item Expenditure ( Road Sector)
In Rs. MillionCentra l
LevelDis trict
Level2061/62
Tota lCentra l
LevelDis trict
Level2062/63
Tota lCentra l
LevelDis trict
Level2063/64
Tota lCentra l
LevelDis trict
Level2064/65
Tota lCentra l
LevelDis trict
Level2065/66
Tota lCentra l
LevelDis trict
Level2066/67
Tota l
Current Expenditure 287 52 340 305 78 383 300 85 384 361 95 456 434 127 561 496 238 734
Staff sa lary a nd a l lowances 210 21 231 226 18 244 232 19 251 282 23 305 348 30 378 399 59 458
Consultancy and other servi ces 4 0 5 6 1 6 5 0 6 8 1 9 13 2 15 13 5 18
Loca l Government transfer 0 6 6 0 24 24 0 29 29 0 31 31 0 32 32 0 59 59
Non- profi t ins titution - grants ( condi tiona l and unconditi ona l) 9 1 10 13 0 13 14 0 14 15 0 15 15 0 15 15 0 15
Program Travel l ing expenses 3 3 5 3 4 7 4 7 11 4 9 13 6 13 18 7 18 25
Capital Expenditure 4142 1178 5320 4124 1281 5405 6320 2274 8594 7011 2785 9795 9372 3641 13012 15982 4946 20927
Civi l Construction 3671 385 4056 3781 294 4074 5717 275 5992 5618 673 6291 8307 1246 9553 12982 1087 14070
Investment (7) 0 0 0 0 0 0 0 0 0 0 0 0 0 0 0 0 0 0
Loca l Government transfer 8 742 750 0 858 858 0 1936 1936 0 1993 1993 0 2147 2147 13 3495 3508
Non- profi t ins titution - conditi ona l and unconditiona l grants 337 0 337 317 0 317 376 0 376 746 0 746 650 0 650 1300 0 1300
Transfer ( 3+8) 354 748 1102 330 882 1212 390 1965 2355 760 2024 2784 665 2179 2844 1327 3554 4881
In Percent of total
Current Expendi ture 6.5% 4.3% 6.0% 6.9% 5.8% 6.6% 4.5% 3.6% 4.3% 4.9% 3.3% 4.4% 4.4% 3.4% 4.1% 3.0% 4.6% 3.4%
Capi ta l Expendi ture 93.5% 95.7% 94.0% 93.1% 94.2% 93.4% 95.5% 96.4% 95.7% 95.1% 96.7% 95.6% 95.6% 96.6% 95.9% 97.0% 95.4% 96.6%
Transfer ( 3+8) 8.0% 60.8% 19.5% 7.5% 64.9% 20.9% 5.9% 83.3% 26.2% 10.3% 70.3% 27.2% 6.8% 57.8% 20.9% 8.1% 68.6% 22.5%
Percent of Current Expendi ture
Staff sa lary a nd a l lowances 73.1% 40.4% 68.1% 74.3% 22.7% 63.7% 77.5% 22.4% 65.4% 78.1% 24.4% 66.9% 80.3% 23.6% 67.4% 80.4% 24.8% 62.3%
Consultancy and other servi ces 1.6% 0.5% 1.4% 1.9% 0.7% 1.6% 1.7% 0.6% 1.4% 2.2% 0.9% 1.9% 3.0% 1.2% 2.6% 2.6% 2.0% 2.4%
Loca l Government transfer 0.0% 11.1% 1.7% 0.0% 30.2% 6.2% 0.0% 33.8% 7.4% 0.0% 32.7% 6.8% 0.0% 25.3% 5.7% 0.0% 24.6% 8.0%
Non- profi t ins titution - grants ( condi tiona l and unconditi ona l) 3.2% 1.0% 2.9% 4.3% 0.0% 3.4% 4.7% 0.0% 3.6% 4.0% 0.0% 3.2% 3.3% 0.0% 2.6% 2.9% 0.0% 2.0%
Program Travel l ing expenses 0.9% 5.4% 1.6% 1.0% 5.5% 2.0% 1.3% 8.0% 2.8% 1.2% 9.2% 2.9% 1.3% 9.9% 3.3% 1.4% 7.6% 3.4%
Percent of Capita l Expendi ture
Civi l Construction 88.6% 32.7% 76.2% 91.7% 22.9% 75.4% 90.5% 12.1% 69.7% 80.1% 24.2% 64.2% 88.6% 34.2% 73.4% 81.2% 22.0% 67.2%
Investment (7) 0.0% 0.0% 0.0% 0.0% 0.0% 0.0% 0.0% 0.0% 0.0% 0.0% 0.0% 0.0% 0.0% 0.0% 0.0% 0.0% 0.0% 0.0%
Loca l Government transfer 0.2% 63.0% 14.1% 0.0% 67.0% 15.9% 0.0% 85.2% 22.5% 0.0% 71.6% 20.4% 0.0% 59.0% 16.5% 0.1% 70.7% 16.8%
Non- profi t ins titution - conditi ona l and unconditiona l grants 8.1% 0.0% 6.3% 7.7% 0.0% 5.9% 5.9% 0.0% 4.4% 10.6% 0.0% 7.6% 6.9% 0.0% 5.0% 8.1% 0.0% 6.2%
20102005 2006 2007 2008 2009
III

Annex Four:
Length of SRN with category and Pavement(in Kilometer)By Development RegionsCategory Development RegionsBlack Top Gravel Earthen Total
Eastern 543.55 131.18 108.6 783.33Central 801.55 37.6 33.9 873.05Western 478.3 0 0 478.3Mid Western 465.72 153.92 115.46 735.1Far Western 431.92 0 90.11 522.03NH Total 2721.04 322.7 348.07 3391.81Eastern 447.12 212.1 519.31 1178.53Central 707.41 501.87 482.85 1692.13Western 499.77 86.41 568.75 1154.93Mid Western 241.8 307.7 413.73 963.23Far Western 147.22 104.17 298.06 549.45FRN Total 2043.32 1212.25 2282.7 5538.27Eastern 0 0 28 28Central 62.83 26.4 50.85 140.08Western 32.15 50 112.1 194.25Mid Western 7.57 39 169.43 216FRO Total 102.55 115.4 360.38 578.33Eastern 6 36.29 326.61 368.9Central 0 0 61 61Western 0 0 89 89Mid Western 0 0 128.5 128.5Far Western 11.5 0 75.5 87MH Total 17.5 36.29 680.61 734.4Eastern 23 63 50 136Central 39 138 34.5 211.5Western 0 38.5 12 50.5Mid Western 0 71 29 100Far Western 5.7 68 20.5 94.2PR Total 67.7 378.5 146 592.2
Grand Total 4952.11 2065.14 3817.76 10835.01Source of Basic Data: DoR, Statistics of Strategic Road Network (SSRN) 2009/10
NH -National Highway
FRN - Feeder Road Network (Major)
FRO-Feeder Road Ordinary (Minor)
MH - Mid Hill Highway
PR - Postal Road
IV

Annex Five:
By Ecological BeltsCategory Ecological Belts Black Top Gravel Earthen Total
Mountain 53.93 27.5 184.02 265.45Hill 1258.18 244.52 164.05 1666.75Tarai 1408.93 50.68 0 1459.61NH Total 2721.04 322.7 348.07 3391.81Mountain 198.36 138.16 453.36 789.88Hill 1066.79 463.35 1428.44 2958.58Tarai 778.17 610.74 400.9 1789.81FRN Total 2043.32 1212.25 2282.7 5538.27Mountain 5 0 21 26Hill 65.4 84.4 310.38 460.18Tarai 32.15 31 29 92.15FRO Total 102.55 115.4 360.38 578.33Hill 17.5 36.29 680.61 734.4MH Total 17.5 36.29 680.61 734.4Tarai 67.7 378.5 146 592.2PR Total 67.7 378.5 146 592.2
4952.11 2065.14 3817.76 10835.01Source of Basic Data: DoR, Statistics of Strategic Road Network (SSRN) 2009/10
NH -National Highway
FRN - Feeder Road Network (Major)
FRO-Feeder Road Ordinary (Minor)
MH - Mid Hill Highway
PR - Postal Road
Grand Total
Length of SRN with category and Pavement(in Kilometer)
V

Annex: Six
Walking time to Nearest All-Season Road
Population (%)Less than
2 hours 2-4 hoursMore than
4 hoursLess than
2 hours 2-4 hoursMore than
4 hoursBlacktopp
ed Gravel Earthern Total
Average for period
(FY05 to FY10)
Eastern 23 66 6 28 76 8 16 1763 2396 4276 8435 12
Central 35 83 10 7 84 8 8 1325 3087 12123 16535 53
Wes tern 20 65 12 23 80 12 9 1151 2092 6937 10180 14
Mid-Western 13 40 5 55 52 9 38 768 1292 1859 3919 13
Far-Western 10 52 17 32 63 14 23 1010 1767 1006 3783 8
Mountain 7 20 6 74 21 17 62 257 251 3885 4393 9
Hi l l s 44 48 13 39 63 13 24 2750 2057 16746 21553 73
Terai 49 91 6 2 94 5 1 3010 6574 7323 16907 17
Nepal 100 67 9 23 75 9 15 6017 10635 26201 42853
Walking time to Dirt Road
Population (%)Less than
2 hours 2-4 hoursMore than
4 hoursLess than
2 hours 2-4 hoursMore than
4 hours
Eastern 23 73 7 20 90 4 7
Central 35 94 3 3 96 2 2
Wes tern 20 83 6 11 93 4 3
Mid-Western 13 73 5 21 74 12 15
Far-Western 10 73 8 19 76 10 14
Mountain 7 40 4 56 59 10 30
Hi l l s 44 66 12 22 81 10 9
Terai 49 99 0.6 0 99 0.03 0.2
Nepal 100 81 5 13 89 5 6
NLSS -II NLSS -I I I
Status of Roads in Kilometers FY 10NLSS -II NLSS -I I I
VI

Annex Seven:
Organization Structure of
Department of Local Infrastructure Development and Agriculture Roads
VII
Ministry of Local Development
Department of Local Infrastructure Development and Agricultural Roads
Rural/Agricultural
Roads Division
Planning Monitoring and Foreign Aid Co-ordination Division
Other Infrastructure Development
Division
Planning & Donor Co-ordination section
Monitoring, Environment and
Technology Development Section
Rural Water Supply, Sanitation and
Building Section
Irrigation, River Training & Other
Infrastructure Development Section
Rural/Agricultural Roads Section
Trail Bridge Section
DTOs 75 Districts
ProjectsGeneral
Administration Section
Financial Administration
Section
Village Development Committees
District Development Committees 75 Districts
Municipalities (in 58 cities/towns)
Administrative control line
Functional link line (with staff representatives to be suspired
––––..........
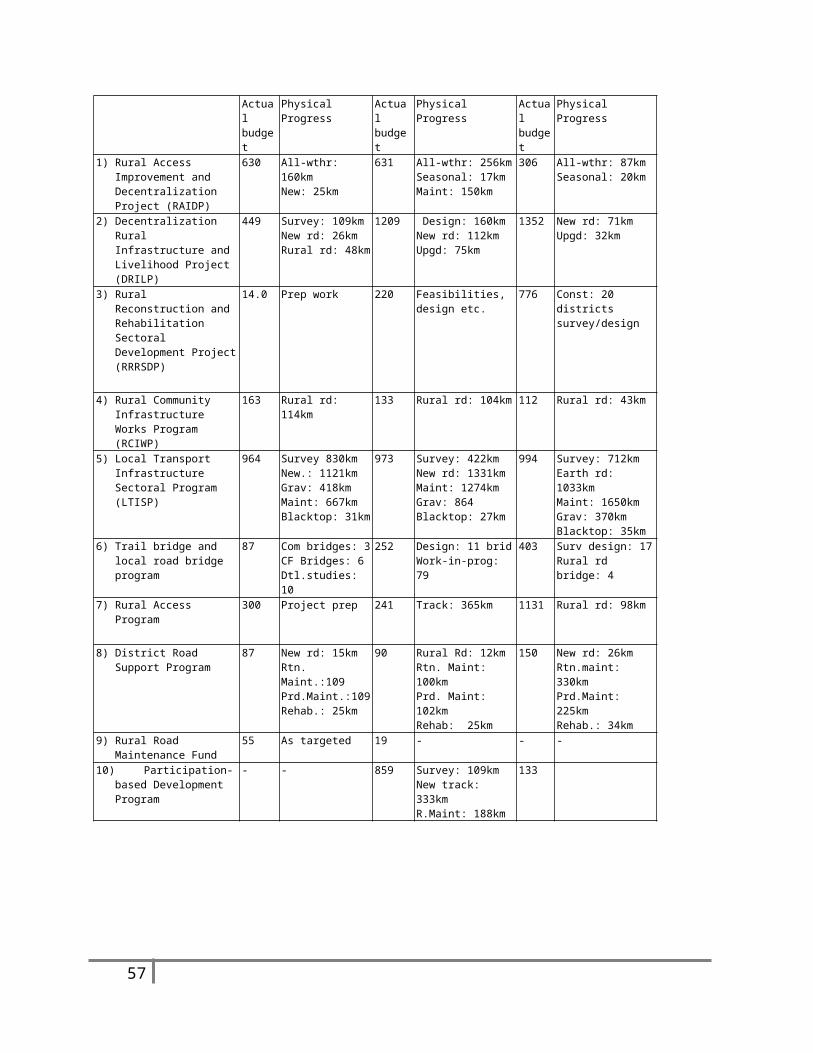
Annex Eight
Actual Budget and Accomplishments in Local Road Related Programs / Projects under MoLD / DoLIDAR
(Budget in NRs million and physical progress in lengths of road in kilometer)
Programs / Projects
FY 2007/08 FY 2008/09 FY 2009/10 FY 2007/08Actual budget
Physical Progress
Actual budget
Physical Progress
Actual budget
Physical Progress
Budget
Targets
MoLD / DoLIDAR Total
10972 Earth Rd: 1799kmGravel Rd: 437kmBlacktop: 100 kmMaintenance: 1137km
24844 Earthen Rd: 1740kmGravel Road: 1582kmBlacktop: 398 kmMaintenance: 4459kmTrack opening: 3142km
31348 Earth Rd: 2402kmGravel Road: 1569kmBlacktop: 383 kmMaintenance: 5184kmTrack open:2142km
41841 NA
a) Road-Program / Project Specific Total (Physical Infrastructure Development)
2749 Rural rd (Earth Rd): 1375kmAll-weather (Gravel/blacktop) Rd: 191km
4627 Earth Rd: 1687kmGravel Rd: 1289kmBlacktop: Maintenance: 3888kmTrack open: 583km
5357 Earth Rd: 1378kmGravel Road: 436kmBlacktop: 35 kmMaintenance: 2205kmTrack open:83km
8613 NA
b) Non-Road Program / Project Specific Total (General Local Development)
5851 Earth Rd: 424kmAll-weather (Gravel/blacktop) Rd: 346kmMaintenance: 1137km
13167 Earth Rd: 53kmGravel Rd: 293kmBlacktop: -Maintenance: 571kmTrack open: 2559km
15167 Earth Rd: 1024kmGravel Road: 1133kmBlacktop: 348 kmMaintenance: 2979kmTrack open:2059km
18645 NA
a) Program / Project Specific (Road-related Physical Infrastructure Development11)Rural Access
Improvement and Decentralizatio
630 All-weather Rd: 160kmNew Rd: 25km
631 All-weather Rd: 256kmSeasonal Rd: 17km
306 All-weather Rd: 87kmSeasonal Rd: 20km
913 R.Rd: 12kmR.Maintenance: 130kmRehab: 10km
VIII

n Project (RAIDP)
Maintenance: 150km
12)Decentralization Rural Infrastructure and Livelihood Project (DRILP)
449 Survey design: 109New rd: 26Rural rd: 48
1209 Dtl. Surv design: 160kmNew rd: 112kmUpgd Rural rd: 75km
1352 New rd: 71kmRural rd upgd: 32km
1748 New rd: 27kmRural rd: 26km
13)Rural Reconstruction and Rehabilitation Sectoral Development Project (RRRSDP)
14.0 Preparatory work 220 Feasibilities, detailed survey, design etc.
776 Road construction in 20 districts + survey/design
2600 Design of 924km + starting construction of 370 km, tendering for 314km
14)Rural Community Infrastructure Works Program
163 Rural rd: 114km 133 Rural rd: 104km
112 Rural rd: 43km
398 Design estimate for 20 districts
15)Local Transport Infrastructure Sectoral Program (RTI-SWAP)
964 Survey 830kmNew rd.: 1121kmGravel rd: 418kmMaintenance: 667kmBlacktopping: 31km
973 Survey: 422km New rd: 1331kmMaintenance: 1274kmGtravel rd: 864Blacktopping: 27km
994 Survey: 712km Earth rd: 1033kmMaintenance: 1650kmGravel rd: 370kmBlacktopping: 35km
1102 Survey: 175km Earth rd: 100kmMaintenance: 300km
16)Trail bridge and local road bridge program
87 Community new bridges: 3Carried Forward Bridges: 6D.studies: 10 bridges
252 Surv. design: 11 bridWork-in-prog: 79
403 Surv design: 17Rural rd bridge: 4
907 Work in progress of rural rd bridge: 43
17)Rural Access Program
300 Completion of project preparation
241 Track open: 365km
1131 Rural rd: 98km
632 Rural rd: 82Track open: 185km
18)District Road Support Program
87 New rd: 15kmRtn. Maint.:109Prd.Maint.:109Rehab.: 25km
90 Rural Rd: 12kmRtn. Maint: 100kmPrd. Maint: 102kmRehab: 25km
150 New rd: 26kmRtn.maint: 330kmPrd.Maint: 225kmRehab.: 34km
313 Rural rd: 12kmR.Maint: 130kmRehab: 10km
19)Rural Road Maintenance Fund
55 Done as per targets in 68 districts
19 - - - - -
20)Participation-based Development Program
- - 859 Survey: 109kmNew track: 333km
133
IX

R.Maint: 188km
b) Non-Program / Project Specific Total (Road-related Physical Infrastructure Development)DDC Grant 1388 3385 2281 2434DDC Grant 3705 7793 7284 7830Municipality Grant 505 362 361 700Election Constituency Development Program
- - 583 601
Local Development Fees Fund
- 980 1998 2164
Local Governance and Community Development Program (Decentralised local governance support program till FY 2007/08)
253 647 2660 4502
Rural Road Bridge Program
- - - 414
DoLIDAR Central 16 16 71 300
X