Public Disclosure Authorized 40860 IFRS Financial Reporting Reference...
164
International Finance Corporation World Bank Group IFRS Financial Reporting Reference Manual 40860 Public Disclosure Authorized Public Disclosure Authorized Public Disclosure Authorized Public Disclosure Authorized Public Disclosure Authorized Public Disclosure Authorized Public Disclosure Authorized Public Disclosure Authorized
Transcript of Public Disclosure Authorized 40860 IFRS Financial Reporting Reference...

InternationalFinance CorporationWorld Bank Group
IFRS FinancialReporting Reference
Manual
InternationalFinance CorporationWorld Bank Group
IFRS Fin
an
cial R
ep
ortin
g R
efe
ren
ce M
an
ual
2121 Pennsylvania Avenue, NWWashington, DC 20433 USATelephone 202-473-3800Fax 202-974-4384www.ifc.org
10323-CoverFINAL.qxd 2/12/07 1:25 PM Page 1
40860P
ublic
Dis
clos
ure
Aut
horiz
edP
ublic
Dis
clos
ure
Aut
horiz
edP
ublic
Dis
clos
ure
Aut
horiz
edP
ublic
Dis
clos
ure
Aut
horiz
edP
ublic
Dis
clos
ure
Aut
horiz
edP
ublic
Dis
clos
ure
Aut
horiz
edP
ublic
Dis
clos
ure
Aut
horiz
edP
ublic
Dis
clos
ure
Aut
horiz
ed

© 2007 The International Finance Corporation2121 Pennsylvania Avenue, N.W.Washington DC 20433, U.S.A.
All rights reserved
The findings, interpretations, and conclusions expressed herein are those of the authors and do not neces-sarily reflect the views of the Executive Directors of International Finance Corporation/The World Bankor the governments they represent.
The World Bank does not guarantee the accuracy of the data included in this work. The boundaries, colors, denominations, and other information shown on any map in this work do not imply any judgmenton the part of the International Finance Corporation or The World Bank concerning the legal status of anyterritory or the endorsement or acceptance of such boundaries.
Rights and PermissionsThe material in this publication is copyrighted. Copying and/or transmitting portions or all of this workwithout permission may be a violation of applicable law. The International Bank for Reconstruction andDevelopment / The World Bank encourages dissemination of its work and will normally grant permissionto reproduce portions of the work promptly.
For permission to photocopy or reprint any part of this work, please send a request with complete informa-tion to the Copyright Clearance Center Inc., 222 Rosewood Drive, Danvers, MA 01923, USA; telephone:978-750-8400; fax: 978-750-4470; Internet: www.copyright.com.
Principal AuthorsAlphonse I. Kouagou, Sr. Portfolio Officer/Equity Research, Corporate Portfolio Management Depart-ment; and Warlinda Walker, Portfolio Analyst, Corporate Portfolio Management Department.
This document has a restricted distribution and may be used by recipients only in the performance of theirofficial duties. Its contents may not otherwise be disclosed without the Corporation’s authorization.
Produced by Corporate Portfolio Management. For additional copies, please contact the following CPMteam:
Program assistant: 202-473-5332Alphonse Kouagou: 202-458-9831Warlinda Walker: 202-473-0514
10323-00_FM.qxd 2/12/07 1:26 PM Page ii
YMeng1
Text Box
This Manual has been prepared for the use of IFC staff and IFC clients in connection with the reporting obligations of IFC clients. It is not intended to constitute accounting advice or to substitute for obtaining accounting advice from an accounting firm. While the authors strive for accuracy, this Manual may contain inaccuracies or typographical errors. Also, the information in the Manual is subject to change over time. Therefore, IFC assumes no responsibility for the use of the information in the Manual, and shall not be liable for any direct or indirect damages however caused and on any theory of liability.

Contents
Introduction to International Financial Reporting Standards (IFRS) . . . . . . . . . . . . . . . . . . . . . . . . . . . . . . . . . . . . . . . . . . . . . . . . . 1
International Financial Reporting Standards . . . . . . . . . . . . . . . . . . . . . . . . . . . . . 1 Accounting and Financial Reporting Covenants in Investment Agreements . . . . . . 9Issues in Financial Reporting . . . . . . . . . . . . . . . . . . . . . . . . . . . . . . . . . . . . . . . . . 9Client Year-End Financial Reporting . . . . . . . . . . . . . . . . . . . . . . . . . . . . . . . . . . 10Annual Financial Reporting . . . . . . . . . . . . . . . . . . . . . . . . . . . . . . . . . . . . . . . . . 12Disclosure Requirements . . . . . . . . . . . . . . . . . . . . . . . . . . . . . . . . . . . . . . . . . . . 13Interim Financial Reports . . . . . . . . . . . . . . . . . . . . . . . . . . . . . . . . . . . . . . . . . . 14Summary of Current IAS/IFRS . . . . . . . . . . . . . . . . . . . . . . . . . . . . . . . . . . . . . . 15
Analysis of International Financial Reporting Standards (IFRS) . 19Accounting Policies (IAS 8) . . . . . . . . . . . . . . . . . . . . . . . . . . . . . . . . . . . . . . 19Financial Instruments . . . . . . . . . . . . . . . . . . . . . . . . . . . . . . . . . . . . . . . . . . 20Inventory (IAS 2) . . . . . . . . . . . . . . . . . . . . . . . . . . . . . . . . . . . . . . . . . . . . . 23 Property, Plant, and Equipment (IAS 16) . . . . . . . . . . . . . . . . . . . . . . . . . . . 24Investments in Associates (IAS 28). . . . . . . . . . . . . . . . . . . . . . . . . . . . . . . . . 27 Interests in Joint Ventures (IAS 31) . . . . . . . . . . . . . . . . . . . . . . . . . . . . . . . . 29 Investment Property (IAS 40) . . . . . . . . . . . . . . . . . . . . . . . . . . . . . . . . . . . . 30 Provisions, Contingent Liabilities and Contingent Assets (IAS 37) . . . . . . . . 32 Employee Benefits (IAS 19) . . . . . . . . . . . . . . . . . . . . . . . . . . . . . . . . . . . . . . 33 Construction Contracts (IAS 11) . . . . . . . . . . . . . . . . . . . . . . . . . . . . . . . . . . 34 Intangible Assets (IAS 38) . . . . . . . . . . . . . . . . . . . . . . . . . . . . . . . . . . . . . . . 36 Borrowing Costs (IAS 23) . . . . . . . . . . . . . . . . . . . . . . . . . . . . . . . . . . . . . . . 37 Impairment (IAS 36) . . . . . . . . . . . . . . . . . . . . . . . . . . . . . . . . . . . . . . . . . . . 39 Revenue (IAS 18) . . . . . . . . . . . . . . . . . . . . . . . . . . . . . . . . . . . . . . . . . . . . . 41 Income Taxes (IAS 12) . . . . . . . . . . . . . . . . . . . . . . . . . . . . . . . . . . . . . . . . . 43 Leases (IAS 17) . . . . . . . . . . . . . . . . . . . . . . . . . . . . . . . . . . . . . . . . . . . . . . . 44Earnings per Share (EPS) (IAS 33). . . . . . . . . . . . . . . . . . . . . . . . . . . . . . . . . 48 Effects of Changes in Foreign Exchange Rates (IAS 21) . . . . . . . . . . . . . . . . . 50 Hyperinflationary Economies (IAS 29) . . . . . . . . . . . . . . . . . . . . . . . . . . . . . 52 Insurance Contracts (IAS 4). . . . . . . . . . . . . . . . . . . . . . . . . . . . . . . . . . . . . . 53
2
1
30776_10323-00_FM.qxd 5/8/07 12:59 PM Page iii
Segment Reporting (IAS 14) . . . . . . . . . . . . . . . . . . . . . . . . . . . . . . . . . . . . . 54 Business Combinations (IFRS 3) . . . . . . . . . . . . . . . . . . . . . . . . . . . . . . . . . . 55 Consolidated and Separate Financial Statements (IAS 27) . . . . . . . . . . . . . . . 56 Cash Flow Statements (IAS 7) . . . . . . . . . . . . . . . . . . . . . . . . . . . . . . . . . . . . 57 Events after the Balance Sheet Date (IAS 10) . . . . . . . . . . . . . . . . . . . . . . . . . 59 Extractive Industries (IFRS 6) . . . . . . . . . . . . . . . . . . . . . . . . . . . . . . . . . . . . 61 Agriculture (IAS 41) . . . . . . . . . . . . . . . . . . . . . . . . . . . . . . . . . . . . . . . . . . . 63 Disclosures in the Financial Statements of Banks and Similar Financial
Institutions (IAS 30) . . . . . . . . . . . . . . . . . . . . . . . . . . . . . . . . . . . . . . . 64 Related Party Disclosures (IAS 24). . . . . . . . . . . . . . . . . . . . . . . . . . . . . . . . . 65 Interim Financial Reporting (IAS 34) . . . . . . . . . . . . . . . . . . . . . . . . . . . . . . 67 Small and Medium-Sized Entities . . . . . . . . . . . . . . . . . . . . . . . . . . . . . . . . . 68
Illustrative Set of Financial Statements . . . . . . . . . . . . . . . . . . . . . . . . . 69Part I. General Manufacturing. . . . . . . . . . . . . . . . . . . . . . . . . . . . . . . . . . . . 69Part II. Banking Industry . . . . . . . . . . . . . . . . . . . . . . . . . . . . . . . . . . . . . . . . 94 Part III. Small and Medium-sized Entities (SMEs). . . . . . . . . . . . . . . . . . . . 112
Audit and the Financial Reporting . . . . . . . . . . . . . . . . . . . . . . . . . . . . 119Assessing External Auditors . . . . . . . . . . . . . . . . . . . . . . . . . . . . . . . . . . . . . 119Prohibited Non-Audit Services . . . . . . . . . . . . . . . . . . . . . . . . . . . . . . . . . . 121Objective of an Audit . . . . . . . . . . . . . . . . . . . . . . . . . . . . . . . . . . . . . . . . . 121Audit Reports and Opinions . . . . . . . . . . . . . . . . . . . . . . . . . . . . . . . . . . . . 121 Unaudited Financial Statements . . . . . . . . . . . . . . . . . . . . . . . . . . . . . . . . . 127
Accounting and Financial Reporting Covenantsin Investment Agreements . . . . . . . . . . . . . . . . . . . . . . . . . . . . . . . . . . . . . . 129
AppendicesA. IFRS versus U.S. GAAP . . . . . . . . . . . . . . . . . . . . . . . . . . . . . . . . . . . . . 139 B. Financial Ratios . . . . . . . . . . . . . . . . . . . . . . . . . . . . . . . . . . . . . . . . . . . 153
References . . . . . . . . . . . . . . . . . . . . . . . . . . . . . . . . . . . . . . . . . . . . . . . . . . . . . . 155
5
4
3
C O N T E N T S
30776_10323-00_FM.qxd 5/4/07 4:17 PM Page iv

Figures
1.1 Composition of the IASB . . . . . . . . . . . . . . . . . . . . . . . . . . . . . . . . . . . . . . . . . . . . 2
2.1 Features of Joint Ventures . . . . . . . . . . . . . . . . . . . . . . . . . . . . . . . . . . . . . . . . . . 292.2 Estimating the Outcome of a Construction Contract—Company A
(Contractor) Agrees to Construct an Automobile Manufacturing Plant for Company B (Client) . . . . . . . . . . . . . . . . . . . . . . . . . . . . . . . . . . . . . . . . . . . . 35
2.3 Allocation of a Loan Payment—Company A Paid Its Loan Paymentfor the Month in the Amount of $5,000. . . . . . . . . . . . . . . . . . . . . . . . . . . . . . . . 39
2.4 A Revenue-Earning Process . . . . . . . . . . . . . . . . . . . . . . . . . . . . . . . . . . . . . . . . . 412.5 An Operating Lease . . . . . . . . . . . . . . . . . . . . . . . . . . . . . . . . . . . . . . . . . . . . . . . 452.6 A Finance Lease . . . . . . . . . . . . . . . . . . . . . . . . . . . . . . . . . . . . . . . . . . . . . . . . . . 462.7 Currency Conversion . . . . . . . . . . . . . . . . . . . . . . . . . . . . . . . . . . . . . . . . . . . . . . 512.8 Consolidating Subsidiaries . . . . . . . . . . . . . . . . . . . . . . . . . . . . . . . . . . . . . . . . . . 562.9 A Related Party. . . . . . . . . . . . . . . . . . . . . . . . . . . . . . . . . . . . . . . . . . . . . . . . . . . 66
4.1 Structure of an Audit Report . . . . . . . . . . . . . . . . . . . . . . . . . . . . . . . . . . . . . . . 1224.2 Types of Audit Opinions . . . . . . . . . . . . . . . . . . . . . . . . . . . . . . . . . . . . . . . . . . 123
Tables
1.1 Benefits of IFRS . . . . . . . . . . . . . . . . . . . . . . . . . . . . . . . . . . . . . . . . . . . . . . . . . . . 21.2 IFRS Use Around the World . . . . . . . . . . . . . . . . . . . . . . . . . . . . . . . . . . . . . . . . . 31.3 Components of an Interim Financial Report . . . . . . . . . . . . . . . . . . . . . . . . . . . . 141.4 IAS/IFRS Standards and Amendments as of August 2006 . . . . . . . . . . . . . . . . . . 15
2.1 Recording of Financial Instruments . . . . . . . . . . . . . . . . . . . . . . . . . . . . . . . . . . . 212.2 Examples of Compound Financial Instruments . . . . . . . . . . . . . . . . . . . . . . . . . . 222.3 Common Methods of Valuing Inventory Used by U.S. GAAP and IFRS . . . . . . . 232.4 Effects of FIFO versus LIFO During a Period of Rising Prices . . . . . . . . . . . . . . . 242.5 Effects of Depreciation Methods. . . . . . . . . . . . . . . . . . . . . . . . . . . . . . . . . . . . . . 252.6 Effects of Capitalization versus Expense, Initial Period of Purchase. . . . . . . . . . . . 262.7 Example of Equity Method. . . . . . . . . . . . . . . . . . . . . . . . . . . . . . . . . . . . . . . . . . 282.8 Effects of Fair Value Model versus Cost Model. . . . . . . . . . . . . . . . . . . . . . . . . . . 312.9 Effects of Changes in Actuarial Components . . . . . . . . . . . . . . . . . . . . . . . . . . . . 342.10 Effects of Percentage-of-Completion versus Completed-Contract Methods . . . . . 362.11 Effects of Interest: Expensed versus Capitalized . . . . . . . . . . . . . . . . . . . . . . . . . . 382.12 Effects of Impairment. . . . . . . . . . . . . . . . . . . . . . . . . . . . . . . . . . . . . . . . . . . . . . 402.13 Examples of Timing Differences and the Effect of Deferred Tax
Asset/Liability. . . . . . . . . . . . . . . . . . . . . . . . . . . . . . . . . . . . . . . . . . . . . . . . . . . . 442.14 Effects of the Operating Lease on Company A’s Financial Statements . . . . . . . . . 452.15 Effect of the Finance Lease . . . . . . . . . . . . . . . . . . . . . . . . . . . . . . . . . . . . . . . . . . 462.16 Impact of Finance Lease and Operating Lease. . . . . . . . . . . . . . . . . . . . . . . . . . . . 472.17 Effect of Exchange Rates on Financial Statements. . . . . . . . . . . . . . . . . . . . . . . . . 52
vC O N T E N T S
10323-00_FM.qxd 2/12/07 1:26 PM Page v

2.18 Events after the Balance Sheet Date and Adjustments to the Financial Statement . . . . . . . . . . . . . . . . . . . . . . . . . . . . . . . . . . . . . . . . . . . . . . . 60
2.19 Consequences of Different Accounting Methods . . . . . . . . . . . . . . . . . . . . . . . . . 622.20 Measuring the Fair Value of Livestock . . . . . . . . . . . . . . . . . . . . . . . . . . . . . . . . . 64
4.1 Summary of Audit Opinions . . . . . . . . . . . . . . . . . . . . . . . . . . . . . . . . . . . . . . . 1244.2 Structure of an Audit Report . . . . . . . . . . . . . . . . . . . . . . . . . . . . . . . . . . . . . . . 127
5.1 Selected Definitions of Ratios and Terms from Investment Agreementswith General Manufacturing Companies . . . . . . . . . . . . . . . . . . . . . . . . . . . . . . 134
Boxes
1.1 Minimum Disclosure Information . . . . . . . . . . . . . . . . . . . . . . . . . . . . . . . . . . . . 15
2.1 Types of Pension Plans . . . . . . . . . . . . . . . . . . . . . . . . . . . . . . . . . . . . . . . . . . . . . 342.2 Methods Used to Account for Borrowing Cost . . . . . . . . . . . . . . . . . . . . . . . . . . . 38
4.1 Criteria for Assessing External Auditors . . . . . . . . . . . . . . . . . . . . . . . . . . . . . . . 120
vi C O N T E N T S
10323-00_FM.qxd 2/12/07 1:26 PM Page vi
The final product of the IFRS manual is made possible by key participants. Marc Babin,Director/Corporate Portfolio Management (CPM), provided valuable guidance and contin-uous support. Sara York Kenny and Jani Sakari Laakso from the Controller’s Departmentprovided keen IFRS insight and formative influence on the manual’s format. Robin L.Glantz from the Credit Review Department contributed critical information on IFC’soperational perspective. Finally, we want to extend tremendous appreciation with the IFRSteam in the CPM department with their creative ideas and constructive feedback.
Acknowledgments
vii
10323-00_FM.qxd 2/12/07 1:26 PM Page vii

10323-00_FM.qxd 2/12/07 1:26 PM Page viii
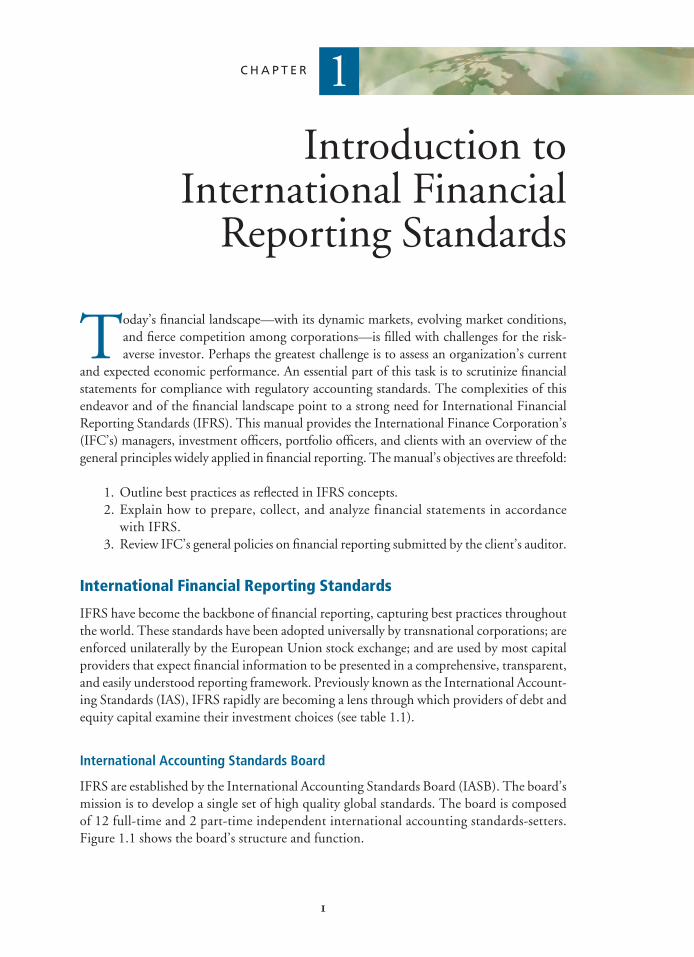
Today’s financial landscape—with its dynamic markets, evolving market conditions,and fierce competition among corporations—is filled with challenges for the risk-averse investor. Perhaps the greatest challenge is to assess an organization’s current
and expected economic performance. An essential part of this task is to scrutinize financialstatements for compliance with regulatory accounting standards. The complexities of thisendeavor and of the financial landscape point to a strong need for International FinancialReporting Standards (IFRS). This manual provides the International Finance Corporation’s(IFC’s) managers, investment officers, portfolio officers, and clients with an overview of thegeneral principles widely applied in financial reporting. The manual’s objectives are threefold:
1. Outline best practices as reflected in IFRS concepts.2. Explain how to prepare, collect, and analyze financial statements in accordance
with IFRS.3. Review IFC’s general policies on financial reporting submitted by the client’s auditor.
International Financial Reporting Standards
IFRS have become the backbone of financial reporting, capturing best practices throughoutthe world. These standards have been adopted universally by transnational corporations; areenforced unilaterally by the European Union stock exchange; and are used by most capitalproviders that expect financial information to be presented in a comprehensive, transparent,and easily understood reporting framework. Previously known as the International Account-ing Standards (IAS), IFRS rapidly are becoming a lens through which providers of debt andequity capital examine their investment choices (see table 1.1).
International Accounting Standards Board
IFRS are established by the International Accounting Standards Board (IASB). The board’smission is to develop a single set of high quality global standards. The board is composedof 12 full-time and 2 part-time independent international accounting standards-setters.Figure 1.1 shows the board’s structure and function.
1
Introduction to International Financial
Reporting Standards
C H A P T E R
1
10323-01_Ch01.qxd 2/12/07 1:27 PM Page 1

2 I N T E R N A T I O N A L F I N A N C E R E P O R T I N G S T A N D A R D S
Entities complying with IFRS
IFRS have a wide following, ranging from global-market participants and IFC clients toagencies involved in regulatory exchanges, such as the European Union (see table 1.2). As aresult, IFC’s board of directors approved the use of IFRS in preparing the organization’sfinancial statements starting in fiscal 2008. IFC strongly urges all its client companies tocomply with IFRS. Clients reporting under IFRS also may be asked to comply with somespecific reporting requirements in investment agreements.
Sector coverage
IFC finances projects in many sectors, including general manufacturing, extraction industries,commercial banking, leasing and housing finance, agriculture, and in many subsectors. The client companies in which IFC invests range from large manufacturing corporations tosmall and medium-sized businesses. This manual covers IFC’s general financial reporting
2 I N T E R N A T I O N A L F I N A N C E R E P O R T I N G S T A N D A R D S
IFC and many lenders findthat IFRS improve the keymetrics that analysts useto measure and evaluateclients’ performance andprice shares. Under IFRS,all equity and quasi-equity instruments arefair valued.
The extensive requirements underIFRS lead to greater transparency—a new feature for many organiza-tions, especially in emerging mar-kets. Transparency will give smallcompanies in underdeveloped anddeveloping nations a better chanceof raising capital.
With widespread use, the com-mon standards of IFRS willenable capital providers through-out the world to analyze andcompare companies, making theprocess of raising capital lessexpensive and more competitive.
Table 1.1 Benefits of IFRS
Valuation Transparency Comparability
Working groupsFor major agenda
projects
IASC Foundation22 trustees
Appoint, oversee,raise funds
Board12 full-time members and 2 part-time members
Set technical agenda; approve standards,exposure drafts, interpretations
StandardsAdvisory Council
40 members
International Financial ReportingInterpretations Committee
12 members
Appoints
Advises
Reports to
Figure 1.1 Composition of the IASB
10323-01_Ch01.qxd 2/12/07 1:27 PM Page 2

3I N T R O D U C T I O N T O I N T E R N A T I O N A L F I N A N C I A L R E P O R T I N G S T A N D A R D S 3
Table 1.2 IFRS Use Around the World
Required for some Required forIFRS not IFRS domestic listed all domestic
Location permitted permitted companies listed companies
Albania No stock exchange; companies use Albanian GAAP
Argentina �
Armenia �
Aruba �
Australia �b
Austria �a
Bahamas, The �
Bahrain Banks
Bangladesh �
Barbados �
Belgium �a
Belize No stock exchange; companies may use IFRS
Benin �
Bermuda �
Bolivia �
Botswana �
Brazil �
Brunei �Darussalam
Bulgaria �
Burkina Faso
Cambodia No stock exchange; companies may use IFRS
Canada �
10323-01_Ch01.qxd 2/12/07 1:27 PM Page 3

4 I N T E R N A T I O N A L F I N A N C E R E P O R T I N G S T A N D A R D S
Table 1.2 IFRS Use Around the World (Continued )
Required for some Required forIFRS not IFRS domestic listed all domestic
Location permitted permitted companies listed companies
Cayman Islands �
Chile �
China �
Colombia �
Costa Rica �
Côte d’Ivoire �
Croatia �
Cyprus �a
Czech Republic �a
Denmark �a
Dominica �
Dominican�Republic
Ecuador �
Egypt, Arab Rep. �
El Salvador �
Estonia �a
Fiji �
Finland �a
France �a
Georgia �
Germany �a
Ghana �
10323-01_Ch01.qxd 2/12/07 1:27 PM Page 4

5I N T R O D U C T I O N T O I N T E R N A T I O N A L F I N A N C I A L R E P O R T I N G S T A N D A R D S
Table 1.2 IFRS Use Around the World (Continued )
Required for some Required forIFRS not IFRS domestic listed all domestic
Location permitted permitted companies listed companies
Gibraltar �
Greece �a
Guam No stock exchange; companies use U.S. GAAP
Guatemala �
Guyana �
Haiti �
Honduras �
Hong Kong, �c
China
Hungary �a
Iceland �a
India �
Indonesia �
Ireland �a
Israel �
Italy �a
Jamaica �
Japan �
Jordan �
Kazakhstan Banks
Kenya �
Korea, Rep. of �
Kuwait �
10323-01_Ch01.qxd 2/12/07 1:27 PM Page 5

6 I N T E R N A T I O N A L F I N A N C E R E P O R T I N G S T A N D A R D S
Table 1.2 IFRS Use Around the World (Continued )
Required for some Required forIFRS not IFRS domestic listed all domestic
Location permitted permitted companies listed companies
Kyrgyz Republic �
Lao PDR �
Latvia �a
Lebanon �
Lesotho �
Liechtenstein �a
Lithuania �a
Luxembourg �a
Macedonia, FYR �
Malawi �
Malaysia �
Mali �
Malta �a
Mauritius �
Mexico �
Moldova �
Myanmar �
Namibia �
Netherlands �a
Netherlands�Antilles
Nepal �
New Zealand 2007b
Niger �
10323-01_Ch01.qxd 2/12/07 1:27 PM Page 6

7I N T R O D U C T I O N T O I N T E R N A T I O N A L F I N A N C I A L R E P O R T I N G S T A N D A R D S
Table 1.2 IFRS Use Around the World (Continued )
Required for some Required forIFRS not IFRS domestic listed all domestic
Location permitted permitted companies listed companies
Norway �a
Oman �
Pakistan �
Panama �
Papua�New Guinea
Peru �
Philippines �c
Poland �a
Portugal �a
Romania All large companies
Russian �
Proposed phase-inFederation starting 2006
Saudi Arabia �
Singapore �c
Slovenia �a
Slovak Republic �a
South Africa �
Spain �
Sri Lanka �
Swaziland �
Sweden �a
Switzerland �
Syria �
10323-01_Ch01.qxd 2/12/07 1:27 PM Page 7

8 I N T E R N A T I O N A L F I N A N C E R E P O R T I N G S T A N D A R D S
Table 1.2 IFRS Use Around the World (Continued )
Required for some Required forIFRS not IFRS domestic listed all domestic
Location permitted permitted companies listed companies
Taiwan, China �
Tajikistan �
Tanzania �
Thailand �
Togo �
Trinidad �and Tobago
Tunisia �
Turkey �
Uganda �
Ukraine �
United Arab Banks and some others Emirates
United Kingdom �a
United States �
Uruguay �d
Uzbekistan �
Venezuela �
Vietnam �
Yugoslavia, �Fed. Rep. (Serbia/
Montenegro)
Zambia �
Zimbabwe �
a. Audit report refers to IFRS as adopted by the European Union.b. Compliance with IFRS is stated in a note.c. IFRS adopted virtually in full as national GAAP.d. By law, all companies must follow IFRS existing on May 19, 2004. The auditor’s report refers to conformity withUruguayan generally accepted accounting principles (GAAP).
10323-01_Ch01.qxd 2/12/07 1:27 PM Page 8

requirements for all sectors. For projects that may have substantially different reportingrequirements, such as unincorporated joint ventures, leasing or extraction industries, IFCmay provide the companies and their auditors with additional materials to address their spe-cific reporting needs.
Accounting and Financial Reporting Covenants in Investment Agreements
IFC staff should make sure that financial reporting requirements (financial statements, ratios,and applicable standards) are incorporated in contract and investment agreements. Invest-ment staff (officers and analysts), IFC client companies, and their auditors are urged to abideby the covenants in the signed investment agreements. If the covenants differ from those inthis manual, the covenants in the agreements should take precedence. Detailed examples ofaccounting and financial reporting covenants are provided in chapter 5.
Key challenges
Although IFRS facilitate comparability between companies, the resulting performance fig-ures likely will differ from those reported under local GAAP. Such differences may affect theoutcomes of the metrics commonly used to evaluate business performance, such as earningsper share, operating income, and earnings before interest taxes depreciation and amortiza-tion, which may include larger noncash items compared with other standards.
IFC’s existing accounting and financial reporting covenants in investment agreements mayhave to be reviewed and adjusted for client companies adopting IFRS for the first time. IFC’sinvestment staff is encouraged to impose or suggest the use of IFRS in new or restructured con-tractual agreements. Conversion to IFRS also represents a cultural change for companies whosenational accounting standards may have evolved out of legal or tax rules and are thus less com-prehensive than IFRS or U.S. GAAP, which are geared to the needs of capital markets.
Issues in Financial Reporting
Financial reporting is governed by many factors. Among the more notable are the politi-cal environment, the expectations gap, the extent of international standards, and ethicalconsiderations.
Political environment
Accounting standards are influenced by the political action of user groups, for example:
� Government agencies, such as the Securities and Exchange Commission and InternalRevenue Service
� The financial community (analysts and bankers)� Chartered public accountants and accounting firms� Academicians.
9I N T R O D U C T I O N T O I N T E R N A T I O N A L F I N A N C I A L R E P O R T I N G S T A N D A R D S
10323-01_Ch01.qxd 2/12/07 1:27 PM Page 9

10 I N T E R N A T I O N A L F I N A N C E R E P O R T I N G S T A N D A R D S
Expectations gap
Standards also are affected by what the public thinks accountants should do and whataccountants think they can do, especially in the critical area of fraud.
International accounting standards
Global standards are needed to harmonize the financial reporting process.
Ethics
One of the most difficult challenges is to do the right thing and make the right decisionwhile trying to “maximize the bottom line, withstand competition, and focus on short-term results.”
Client Year-End Financial Reporting
IFC requires all client companies to supply financial statements and auditors’ reports atthe end of each year, unless otherwise stated in the investment agreement between thepartner (the client company) and IFC. The documents to be provided by the client com-pany are annual financial statements prepared in accordance with IFRS; notes and sched-ules, in accordance with IFRS disclosure policies; and supplementary information and anyother disclosures required by IFC pertinent to the interim and annual financial statements.The chief financial officer must certify the financial statements. The documents to be pre-pared by the client company’s auditor are the auditor’s long-form report; the summary ofprincipal auditing procedures, if reporting to the IFC for the first time; the managementletter; and the auditor’s certificate indicating that the company has complied with all con-tractual covenants.
Purpose of financial statements
Annual financial statements are a structured representation of an entity’s financial positionand financial performance. The information they provide on the financial position, finan-cial performance, and cash flows is essential in making economic and investment decisions.Lenders and stakeholders often rely on these documents as primary sources of informationwhen evaluating an entity.
Reporting entity and responsibility for financial statements
An entity’s board of directors, governing bodies, or both are responsible for preparing andpresenting its financial statements. The statements are an expression of the client company’smanagement. Management should disclose all information pertinent to a fair presentationof the company’s financial and operating results in conformity with generally acceptedaccounting principles. IFC requires these statements to abide by IFRS.
10323-01_Ch01.qxd 2/12/07 1:27 PM Page 10

Components of IFRS financial statements include:
� Cash flow statement� Income statement� Balance sheet� Statement of changes in shareholders’ equity� Accounting policies and notes to the financial statements.
IFC encourages its clients to supplement financial statements with a financial review by man-agement. This review should present the main details of the entity’s financial performanceand financial position and should explain the principal uncertainties the organization faces.Any such reports or reviews accompanying the financial statements are outside of IFRS scope.
Identifying financial statements
Financial statements should be identified clearly as such and should be distinguished from otherinformation in the document. Each component of the financial statement should be labeledclearly. IFRS apply only to financial statements and their notes, not to other information in anannual report or other document. Users must be able to distinguish information prepared usingIFRS from other information that may be helpful but is not subject to those requirements.
The following information must be displayed prominently and repeated when neces-sary, to ensure that the contents of a financial statement are understood:
� Name of the reporting entity, or other means of identification, and any change inthat information from the date of the preceding balance sheet
� Nature of the entity, whether an individual business or a group of businesses� Date of the balance sheet or the period covered by the financial statements, whichever
is appropriate to that component of the financial statements� Relevant currency� Level of rounding applied to amounts in the financial statements.
These details usually are presented as page headings and abbreviated column headings oneach page of the financial statement. The entity must decide the best way to present suchinformation. When financial statements are presented electronically, for example, separatepages are not always used. In that case, the details must appear frequently enough to ensurethat the information in the financial statements is clear.
It may be helpful to present amounts in thousands or millions of units of the relevantcurrency. This is acceptable as long as the level of rounding is specified, material informa-tion is not omitted, and the rounding does not misrepresent the facts.
Consolidated financial statements
For a variety of legal, tax, and other reasons, companies generally conduct their activitiesthrough several subsidiaries controlled by the parent company, rather than through a single
11I N T R O D U C T I O N T O I N T E R N A T I O N A L F I N A N C I A L R E P O R T I N G S T A N D A R D S
10323-01_Ch01.qxd 2/12/07 1:27 PM Page 11

12 I N T E R N A T I O N A L F I N A N C E R E P O R T I N G S T A N D A R D S
legal entity. However, separate financial statements for those activities would not present afull picture of the parent company’s economic activities or financial position.
Consolidated financial statements integrate a parent company’s financial statementswith those of its subsidiaries, both domestic and foreign, as long as the parent has more than50 percent voting rights. IAS 27 establishes the requirements for the presentation of consol-idated financial statements. Consolidated financial statements include not only subsidiariesbut also all joint ventures in which the parent has joint control (IAS 31), and all associateventures in which the parent exercises significant influence (IAS 28).
Comparative financial statements
Comparative information on the balance sheet, income statement, cash flow statement, state-ment of changes in shareholders’ equity, and notes to the financial statements should be dis-closed, unless the standards require or permit otherwise. Comparative information shouldinclude, in addition to quantitative data, narrative and descriptive information relevant tothe current period’s financial statements.
In hyperinflationary economies, such as Turkey, financial data from a prior periodmay have to be adjusted to equivalent current-year amounts, in accordance with IAS 29(Accounting for Hyperinflation) before they are included in comparative statements. Green-field projects and newly formed companies issuing their first set of financial statements arenot required to provide comparative financial statements.
Annual Financial Reporting
A company’s management is expected to prepare financial statements annually, as of the lastday of the financial year. Financial reports of a parent company must be consolidated state-ments. Whether separate or consolidated, all financial statements must give a fair presenta-tion of the entity’s financial position, results of operations, and cash flows. In other words,they must represent faithfully the effects of transactions, other events, and conditions inaccordance with the definitions and recognition criteria for assets, liabilities, income, andexpenses set out in the IFRS framework. If a company adopts IFRS and provides additionaldisclosure when necessary, its financial statements should achieve a fair presentation.
Adoption of IFRS
An entity preparing its first IFRS financial statements will apply IFRS 1, which pertains tothe first-time adoption of financial reporting standards. The main principle of IFRS 1 is ret-rospective application of all IFRS and IAS standards.
Opening balance sheet
The entity must prepare an opening IFRS balance sheet at the beginning of the earliestperiod covered by its first IFRS financial statements. For example, if the closing balance sheetdate is December 31, 2005, the opening IFRS balance sheet will be January 1, 2004. Theopening IFRS balance sheet serves as the starting point for subsequent accounting under
10323-01_Ch01.qxd 2/12/07 1:27 PM Page 12

IFRS. The opening IFRS balance sheet need not be published in the first IFRS financial state-ments. To satisfy IAS 1, an entity’s first IFRS financial statements must include at least oneyear of comparatives under IFRS.
If the first IFRS financial statements contain more than one year of comparative figures,that information should comply with IFRS. A company’s IFRS opening balance sheet shouldrestate the recognition and measurement of every asset and liability to comply fully with theIFRS requirements at the closing balance sheet date.
Unless specific exemptions apply, an entity should report all assets and liabilities thatIFRS require to be recognized, and not report items that IFRS do not recognize as assets andliabilities. The entity must reclassify items into the correct IFRS category and apply IFRS inmeasuring its assets and liabilities.
The adjustments as a result of applying IFRS 1 are recorded in retained earnings of theopening balance sheet. The opening balance sheet need not be a published statement butshould reconcile to equity of the previous GAAP.
Optional exemptions from retrospective application of IFRS
IFRS 1 grants limited exemption in specified areas in which the cost of retrospective appli-cation likely would exceed the benefits of financial statements. An entity may elect to use oneor more of the following exemptions:
� Business combinations� Fair value or revaluation as deemed cost� Employee benefits� Cumulative translation differences� Compound financial instruments� Assets and liabilities of subsidiaries, associates, and joint ventures.
Mandatory exceptions to retrospective application
IFRS 1 prohibits retrospective application of some aspects of other IFRS relating to derecog-nition of financial assets and liabilities, hedge accounting, and estimates.
Disclosure Requirements
IFRS 1 requires disclosures to explain the effect of the transition to IFRS. The first IFRSfinancial statements should:
1. Reconcile equity from local GAAP to IFRS at the date of transition (opening bal-ance sheet date) and at the end of the last period presented in the entity’s most recentfinancial statements under local GAAP
2. Reconcile net income from local GAAP to IFRS for the last period in the entity’smost recent financial statements under local GAAP
3. Ensure that reconciliations give sufficient detail to enable users to understand mate-rial adjustments to the balance sheet and income statement.
13I N T R O D U C T I O N T O I N T E R N A T I O N A L F I N A N C I A L R E P O R T I N G S T A N D A R D S
10323-01_Ch01.qxd 2/12/07 1:27 PM Page 13

14 I N T E R N A T I O N A L F I N A N C E R E P O R T I N G S T A N D A R D S
Some financial statements contain historical summaries of data selected from periods beforethe first period for which they provide full comparative information. IFRS require disclo-sures of the principal adjustments needed to recognize that historical summaries are includedin financial statements. Historical summaries published outside of annual financial state-ments or interim reports fall outside the scope of IFRS.
Interim Financial Reports
IFRS 1 requirements also apply to each interim financial report, if any, that an entity includesunder IAS 34 in the annual report covered by its first IFRS financial statements. In additionto meeting the reconciliation requirements of its first IFRS annual financial statements (seedisclosure requirements outlined in Box 1.1), an entity must reconcile its equity under pre-vious GAAP at the end of a comparable interim period, to its equity under IFRS for thatperiod. In addition, the entity must reconcile its profit or loss under previous GAAP for acomparable interim period (current and year-to-date), to its profit or loss under IFRS forthat period.
Although IFRS do not call for interim financial information, many regulators requireinterim financial reports. Because IFC believes that financial information is more useful if itis frequent and timely, IFC financial reporting covenants also require interim reports fromits clients. These reports are expected to provide either a complete set of financial statements(as described in IAS 1) or a set of condensed financial statements (as described in IAS 34) forthe specified interim period. Entities that prepare interim financial statements in accordancewith IFRS must submit a statement of compliance, as indicated by IAS 34. It is comparableto the statement of compliance for annual financial statements required by IAS 1. Table 1.3shows the minimum information needed in a condensed interim financial report.
Condensed statements should include each of the headings and subtotals from the lat-est annual financial statement, with the comparatives. IFC may call for additional informa-tion in clients’ interim reporting statements.
Disclosures
The minimum information required in a disclosure appears in Box 1.1. An entity also shoulddisclose any events or transactions that are material to understanding of the current interimperiod.
Table 1.3 Components of an Interim Financial Report
Condensed statement Condensed Condensed Condensed of changes in cash flow
balance sheet income statement shareholders’ equity statement
Shows comparativeinformation as ofthe end of the previous full financial year
Shows comparatives forthe comparable interimperiods
Shows comparativesfor the comparableinterim periods
Shows comparativesfor the comparableinterim periods
10323-01_Ch01.qxd 2/12/07 1:27 PM Page 14

15I N T R O D U C T I O N T O I N T E R N A T I O N A L F I N A N C I A L R E P O R T I N G S T A N D A R D S
Box 1.1
● State whether the accounting policies and methods of computation in the interim financial statements are the sameas those used in the most recent annual financial statements; or, if those policies or methods have changed, describethe nature and effect of the change.
● Explain the seasonality or cyclic structure of interim operations.● Describe the nature and amount of items affecting assets, liabilities, equity, net income, or cash flows that are
unusual because of their nature, size, or incidence.● Specify the nature and amount of changes in the estimates of amounts reported in prior interim periods of the current
financial year, or changes in estimates of amounts reported in prior financial years, if those changes have a materialeffect in the current interim period.
● Note issuance, repurchases, and repayments of debt and equity securities.● Report separately dividends paid (on an aggregate or per share basis) for ordinary shares and other shares.● Indicate revenue and result for each business or geographical segment, whichever is the enterprise’s primary basis
of segment reporting (disclosure of segment data is required in an enterprise’s interim financial report only if IAS 14,Segment Reporting, requires an enterprise to disclose segment data in its annual financial statements).
● Include material events occurring after the end of the interim period that have not been reflected in the financial statements.● Note the effect of changes in the composition of the enterprise during the interim period, such as business combinations,
acquisition or disposal of subsidiaries and long-term investments, restructurings, and operations being discontinued.● Report changes in contingent liabilities or contingent assets since the last annual balance sheet date.● Present basic and diluted earnings per share on the face of the income statement for an interim period (including
comparative period).
Minimum Disclosure Information
Table 1.4 IAS/IFRS Standards and Amendments as of August 2006
Standard Description
IFRS 1 First-time adoption of International Financial Reporting Standards
IFRS 2 Share-based payment
IFRS 3 Business combinations
Measurement
An entity should apply the same accounting policies in its interim financial statements as itapplies in annual financial statements. If a new accounting policy is adopted in an interimperiod, that policy is to be applied as required either by the transitional provisions in therelevant IFRS or in accordance with IAS 8.
Summary of Current IAS/IFRS
Table 1.4 summarizes current IAS/IFRS standards and their amendments as of August 2006.Readers should refer to these standards for further details on financial reporting and disclo-sure requirements as published by the IASB. The IASB is working aggressively on develop-ing new pronouncements. Any updates will be available through the IFC Controller’sDepartment. Details of all the IFRS pronouncements listed in table 1.4 are available on Cor-porate Portfolio Management and Controller’s Department websites.
10323-01_Ch01.qxd 2/12/07 1:27 PM Page 15

16 I N T E R N A T I O N A L F I N A N C E R E P O R T I N G S T A N D A R D S
Table 1.4 IAS/IFRS Standards and Amendments as of August 2006 (Continued )
Standard Description
IFRS 4 Insurance contracts
IFRS 5 Noncurrent assets held for sale and discontinued operations
IFRS 6 Exploration for and evaluation of mineral assets
IFRS 7 Financial instruments: disclosures, effective on or after 1/1/2007
IAS 1 Presentation of financial statements
IAS 2 Inventories
IAS 3 Consolidated financial statements, superseded in 1989 by IAS 27 and IAS 28
IAS 4 Depreciation accounting, replaced by IAS 16, 22, and 38
IAS 5 Information to be disclosed in financial statements, superseded by IAS 1 in 1997
IAS 6 Accounting responses to changing prices, superseded by IAS 15, which was withdrawnin December 2003
IAS 7 Cashflow statements
IAS 8 Accounting policies, changes in accounting estimates, and errors
IAS 9 Accounting for research and development activities, superseded by IAS 38 effectiveJanuary 1999
IAS 10 Events after the balance sheet date
IAS 11 Construction contracts
IAS 12 Income taxes
IAS 13 Presentation of current assets and current liabilities, superseded by IAS 1
IAS 14 Segment reporting
IAS 15 Information reflecting the effects of changing prices, withdrawn December 2003
IAS 16 Property, plant, and equipment
IAS 17 Leases
IAS 18 Revenue
IAS 19 Employee benefits
10323-01_Ch01.qxd 2/12/07 1:27 PM Page 16

17I N T R O D U C T I O N T O I N T E R N A T I O N A L F I N A N C I A L R E P O R T I N G S T A N D A R D S
Table 1.4 IAS/IFRS Standards and Amendments as of August 2006 (Continued )
Standard Description
IAS 20 Accounting for government grants and disclosure of government assistance
IAS 21 Effects of changes in foreign exchange rates
IAS 22 Business combinations, effective March 31, 2004, superseded by IFRS 3
IAS 23 Borrowing costs
IAS 24 Related party disclosures
IAS 25 Accounting for investments, superseded by IAS 39 and IAS 40 effective 2001
IAS 26 Accounting and reporting by retirement benefit plans
IAS 27 Consolidated and separate financial statements
IAS 28 Investments in associates
IAS 29 Financial reporting in hyperinflationary economies
IAS 30 Disclosures in the financial statements of banks and similar financial institutions,superseded by IFRS 7 effective 2007
IAS 31 Interests in joint ventures
IAS 32 Financial instruments: disclosure and presentation, disclosure provisions superseded byIFRS 7 effective 2007
IAS 33 Earnings per share
IAS 34 Interim financial reporting
IAS 35 Operations being discontinued, superseded by IFRS 5 effective 2005
IAS 36 Impairment of assets
IAS 37 Provisions, contingent liabilities, and contingent assets
IAS 38 Intangible assets
IAS 39 Financial instruments: recognition and measurement
IAS 40 Investment property
IAS 41 Agriculture
10323-01_Ch01.qxd 2/12/07 1:27 PM Page 17

10323-01_Ch01.qxd 2/12/07 1:27 PM Page 18

Audited financial statements provide crucial information that market participants, suchas investors, creditors, and managers, use to analyze an enterprise’s historical perform-ance, evaluate its liquidity, and help project free cash flow for decision-making purposes.
Of all the documents an enterprise distributes to market participants, the most impor-tant is the annual report. This report has two main components. The verbal section containsa letter from the company’s chairman, the past year’s operating results, and a description ofdevelopments that will have an impact on the operation. Financial statements provide quan-titative information on financial position (balance sheet), income (profit and loss), changesin equity (retained earnings), and cash flow. Financial statements show what actually hap-pened to a company’s assets, earnings, liabilities, and dividends over the past years; the ver-bal section explains why the numbers are at those levels.
An investigator, such as an analyst, examining an annual report with a critical eye mustunderstand the significance of financial data. These data form the bedrock of financial ratios,firm valuation, and trend analysis.
To critically analyze an annual report
� Begin with the audit opinion.� Read the footnotes.� Scrutinize the financial statements and notes reflecting the details of the aggregate
numbers.
The following International Financial Reporting Standards (IFRS) by the InternationalAccounting Standards Board (IASB) are useful for analyzing annual reports.
Accounting Policies (IAS 8)Accounting policies are the principles, foundations, conventions, rules, and practices thatcompanies use to prepare and present their financial statements. A business operation’s day-to-day transactions must be captured quantitatively in the financial statements. Each trans-action has unique attributes that require special attention in the statements.
Accounting policies are guided by standards such as International Financial ReportingStandards (IFRS) or U.S. Generally Accepted Accounting Principles (U.S. GAAP). How-ever, when business transactions are not covered or clear to the application of the standards,management must use sound judgment to develop and apply policies that ensure account-ing information is both relevant and reliable.
2
Analysis of International Financial
Reporting Standards
C H A P T E R
19
10323-02_Ch02.qxd 2/12/07 1:28 PM Page 19

I N T E R N A T I O N A L F I N A N C E R E P O R T I N G S T A N D A R D S
Analyst’s Role
The analyst should:
n Examine the disclosures in the annual report; they provide important informationabout the company’s accounting policies.
n Pay close attention to accounting policies that are based on management’s judgment;there is a potential for discreet manipulation of earnings.
n Investigate the reasons for any inconsistency in accounting methods from one periodto another. Note, for example, that the inventory cost-flow method of “last in, firstout” (LIFO) produces different net income from the “first in, first out” (FIFO)method. During inflationary periods, LIFO produces lower net income than FIFO.
n Recognize that accounting estimates can change, and that such changes are permit-ted. Determine whether the change is relevant and reliable. For example, a change inthe useful lives of PP&E affects the depreciation expense, which will ultimately affectnet income. The settlement of litigation may increase or decrease liability.
n Be cognizant of nonrecurring events and transactions. Such events (for example,unusual government expropriation of a company’s foreign business segment owingto political unrest) might not occur in the future and, therefore, should not beincluded in the analysis.
Financial instruments
The relevant standards for financial instruments are:
n IFRS 7 Financial Instruments: Disclosures (effective January 1, 2007)n IAS 32 Financial Instruments: Disclosure and Presentationn IAS 39 Financial Instruments: Recognition and Measurement.
What are financial instruments?
A contract is a financial instrument that results in a financial asset in one company and afinancial liability in another company. Examples of financial instruments include cash; leases;derivatives (that is, options, swaps, and warrants); equity securities (that is, common stocksand preference shares); and debt securities (that is, purchasing of bonds of another company).
Table 2.1 shows how some financial instruments are recorded.
K E Y Q U E S T I O N S
n Have I examined the “summary of significant accounting policies” located in thefootnotes of the annual report?
n What method is used to depreciate property, plant, and equipment (PP&E)?n What method is used for costing inventories?n What is management’s strategy for dealing with risk?
30776_10323-02_Ch02.qxd 5/4/07 4:29 PM Page 20

21A N A L Y S I S O F I N T E R N A T I O N A L F I N A N C I A L R E P O R T I N G S T A N D A R D S
Classification of financial assets
Financial assets can be classified according to management’s purpose in acquiring them:
� Financial assets at fair value through profit or loss (trading). Assets acquired principallyfor the purpose of generating short-term profits (within less than a year) by takingadvantage of changes in price, as in the purchase of common stocks.
� Loans and receivables. Nonderivative financial assets arising through a transferbetween a borrower and a lender and having fixed or determinable payments that arenot quoted in an active market. An example is money that one company lends toanother on contractual terms.
� Held-to-maturity investments. Assets with fixed or determinable payments and fixedmaturity, which an entity intends to hold to maturity and has the ability to do so.An example is a bond subscription.
� Available-for-sale. Financial securities that do not meet the definition of the otherfinancial assets. An example is a stock purchased with the intention of not selling itin the near future.
Table 2.1 Recording of Financial Instruments
Unrealized gain/ Balance loss due to fair sheet
Instrument Valued ata value changes Realized gain/loss classification
Financial assetsat fair valuethrough profit orloss (trading),including allderivatives
Loans and receivables
Held-to-maturityinvestments
Available-for-sale
Fair value
Amortizedcost
Amortizedcost
Fair value
Recognized directlyin the income statement
None
None
Unrealized gain isrecognized directlyin the equity accountof the balance sheet;however, allimpaired losses areincluded in theincome statement.
Recognized directly inthe income statement
Recognized directly inthe income statement
Recognized directly inthe income statement
When the instrument issold, derecognized, orimpaired, the cumulativeeffect of the gain or lossthat was credited directlyto equity now flowsthrough the incomestatement. The effect isan actual gain or loss.
Current
Current ornoncurrent
Current ornoncurrent
Current ornoncurrent
a. Fair value is derived through quoted market prices in an active market; in the absence of an active market, it isderived from internal valuation models. Amortized cost is derived from the initial recognized amount with adjustmentsrelating to principal payments and amortization of discounts and premiums.
10323-02_Ch02.qxd 2/12/07 1:28 PM Page 21

22 I N T E R N A T I O N A L F I N A N C E R E P O R T I N G S T A N D A R D S
What are compound financial instruments?
Compound financial instruments contain elements of both liability and equity (table 2.2).Each element must be classified accordingly at the time of issuance, and no subsequentchange can be made in its classification.
K E Y Q U E S T I O N S
� After identifying the financial instruments, do I understand how each is valued inthe balance sheet?
� Where are the effects of changes in the fair value of trading and derivative instrumentsrecorded?
� What corroborative evidence is used to establish the fair value of the financialinstruments?
● The loan principle is theliability, and the holder’soption to convert into common shares is equity.
● The equity component isassigned the residualamount after deductingthe liability component.
● When a corporation issues pref-erence shares that have featuresof a fixed coupon rate perannum and are to be redeemedat a particular date, they areconsidered a liability becausethe issuer has entered a contractto deliver cash in the future.
● If the preference shares do nothave a fixed maturity and theissuer does not have to delivercash in the future, then they are an equity.
● Put options are instrumentsthat give the holder the right,not the obligation, to returnthe instrument to the issuerin exchange for cash.
● At times stocks may be pur-chased with “put options”embedded as one of the features.
● The “put option” is considereda liability and the residualamount an equity.
Table 2.2 Examples of Compound Financial Instruments
Convertible bond Preferred shares Put options
Note: See the International Finance Corporation’s (IFC’s) corporate valuation guidelines at its “Corporate PortfolioManagement” website.
Analyst’s Role
The analyst should:
� Scrutinize the notes to the financial statements and determine how the valuation ofthe financial instruments is derived. As noted in table 2.1, gains and losses are recordedon income statements, which measure the performance of the portfolios. It may benecessary to provide estimates of the value of these portfolios using internal models.Estimates create the possibility for error and thus the manipulation of earnings.
� Make sure the financial assets have been recorded properly. At each balance sheetdate, an entity should calculate the carrying amount of its financial instruments. Ifthe decline in value is not temporary, the carrying amount is recorded in relation to
10323-02_Ch02.qxd 2/12/07 1:28 PM Page 22

23A N A L Y S I S O F I N T E R N A T I O N A L F I N A N C I A L R E P O R T I N G S T A N D A R D S
the fair value. The recognition of impairment loss affects any decrease in assets and,correspondingly, in earnings.
� Classify liability and equity properly for compound instruments such as convertiblebonds. This is essential. The classification affects financial ratios such as debt ratioand debt-to-equity ratio.
� Include “put option” when calculating any debt ratios or conducting financial analysis.Put option is regarded as a liability from the standpoint of the issuer.
Inventory (IAS 2)
Inventories are company assets that are sold to customers to earn revenue for the company.Some examples are computers, agricultural equipment, agricultural products, and manu-facturing products.
It is important to scrutinize a corporation’s method of valuing inventory because itaffects financial statements (see table 2.3 for U.S. GAAP and IFRS methods). The inventorymethod depends on the flow of inventory costs, which affects income stream. Each methodproduces different financial results. Ultimately, inventories are recorded as the lower of costand net realizable value.
IFRS no longer allows LIFO, mainly because LIFO does not fully represent the inven-tory flow. The strategy for using LIFO is often tax driven; that is, during a period of infla-tion, the LIFO cost of inventory is higher, and therefore the cost of goods sold is higher (seetable 2.4). Consequently, taxable income will be lower and cash savings will be higher. Butadvocates of LIFO argue that this method represents current cost levels, which should bereflected in financial statements.
K E Y Q U E S T I O N S
� How are inventories recorded—as the lower of cost or net realizable value?� What type of inventory costing is used? Each method has different effects in
financial statements.� Is LIFO used? Remember, this method is prohibited under IFRS.� Are the inventories strongly connected to the valuation of the company?� What is the market demand for the company’s inventory?
Table 2.3 Common Methods of Valuing Inventory Used by U.S. GAAP and IFRS
Method U.S. GAAP IFRS
Weighted average Yes Yes
FIFO Yes Yes
LIFO Yes Not allowed
10323-02_Ch02.qxd 2/12/07 1:28 PM Page 23

24 I N T E R N A T I O N A L F I N A N C E R E P O R T I N G S T A N D A R D S
Analyst’s Role
The analyst should:
� Examine the notes relating to inventory in the annual report. They contain vitalinformation.
� Note the impact of varied inventory costing methods when comparing companies.� Pay attention to the inventory turnover ratio, a key measurement of cost inventory.
This ratio shows the average number of times the inventory was sold during a givenperiod; it measures the liquidity of the inventory. This ratio allows the analyst togauge how long it will take to sell the company’s inventory in comparison with theindustry average. Ultimately, the result will affect the cash flow stream.
� Watch for inventories that grow faster than sales from one year to the next. Thisis a warning signal. It could indicate that fewer consumers are buying the com-pany’s product and, therefore, revenue is decreasing and the profit margin is beingsqueezed.
Property, Plant, and Equipment (IAS 16)
PP&E represent a company’s physical or fixed assets; for example, its land, buildings, andequipment. PP&E are used to generate future cash inflows. The valuation of these assets isbased on historical cost.
Initial recording and depreciation
When physical assets are purchased, they are recorded initially at cost on the balance sheet(capitalized). Subsequently, as the asset is utilized, a portion of the original cost is transferredto the income statement as an “expense.” The process of transferring this allocated cost overtime or the loss of the asset’s earning power is called depreciation.
Table 2.4 Effects of FIFO Versus LIFO During a Period of Rising Prices
Affected financial components FIFO LIFO
Working capital (balance sheet) Higher Lower
Liquidity ratio Higher Lower
Cost of goods sold (income statement) Lower Higher
Net income Higher Lower
Profitability ratios Higher Lower
Free cash flow Lower Higher
10323-02_Ch02.qxd 2/12/07 1:28 PM Page 24

25A N A L Y S I S O F I N T E R N A T I O N A L F I N A N C I A L R E P O R T I N G S T A N D A R D S
Subsequent measurement
A company can use either of two methods to indicate the carrying value of a physical asset.The fair-value model integrates cost, changes in fair value, and impairment loss. The costmodel integrates cost, accumulated depreciation, and impairment loss.
Depreciation methods
Countries use various methods of depreciation:
� Straight-line� Sum-of-the-years-digits (accelerated method)� Declining-balance (accelerated method)� Units-of-production (productive output).
Whatever method is used, it must be consistent with the consumption pattern of the oper-ation. Each depreciation method has a different impact on the operation’s net income, bal-ance sheet, and financial ratios (see table 2.5).
Capitalization versus expense
When physical assets are purchased, they are recorded in a designated PP&E account on thebalance sheet. This process, called “capitalization” (see table 2.6), is required by U.S. GAAP.However, IFRS does not indicate whether to capitalize or to record a purchased item as an
Table 2.5 Effects of Depreciation Methods
Effect on Effect on balance sheet Method Expense income statement (book value)
Accelerated (i.e., declining-balance)
Straight-line
During the initial period,when the depreciationexpense is higher, netincome will be lower. Inthe latter period, whenthe depreciation expenseis lower, net income willbe higher.
Because the depreciationexpense is equalthroughout the asset’suseful life, net income isaffected only by what istreated as an expense forthat period.
The book value of theasset would decline at ahigher rate than understraight-line depreciation.
The book value of theasset would not declineat a higher rate thanunder accelerateddepreciation.
Higher depreciationexpense early in theasset’s life; depreciationdeclines in the latter partof its life
Equal amounts of depre-ciation expense through-out the useful life of theasset
10323-02_Ch02.qxd 2/12/07 1:28 PM Page 25

26 I N T E R N A T I O N A L F I N A N C E R E P O R T I N G S T A N D A R D S
expense when initially recognizing an expenditure for a tangible item; the standard does notspecify what constitutes an item of property, plant, and equipment. As a result, some coun-tries may have the flexibility to expense the purchased item instead of recording it as an asset.
K E Y Q U E S T I O N S
� How valuable are the physical assets of the firm?� How profitable are the assets in generating future cash flows? Are they maintainable?
Table 2.6 Effects of Capitalization Versus Expense, Initial Period of Purchase
Financial Capitalization Expense
Net income
Balance sheet
Equity
Total asset turnover
Profit margin
Return on asset (ROA)
Return on commonequity (ROE)
Lower. The entire expenditure onthe asset is deducted in the incomestatement; therefore, net income islower. The expenditure is onlydeducted at the time of purchase.
Lower. The cost of the item is notreflected on the balance sheet;rather, it appears in the incomestatement as an expense.
Lower. With a lower net income,this amount will flow into the equitysection.
Higher. The purchased item has noeffect on the asset account because itis expensed in the income statement.
Lower. The entire expenditure onthe asset is deducted in the incomestatement; therefore, net income islower, which results in a lowerprofit margin.
Lower. Because the percentageincrease in net income is lower thanthe percentage increase in theasset, ROA is lower.
Lower. Because the percentageincrease in net income is lower thanthe percentage increase in equity,ROE is lower.
Higher. The depreciation expense islower; therefore net income ishigher. The depreciation expense isallocated over time, spread acrossthe asset’s useful life.
Higher. The cost of the item is initially recorded as an asset.
Higher. With a higher net income,this amount will flow into theequity section.
Lower. The purchased itemincreases the total asset account.
Higher. The depreciation expense islower; therefore, net income ishigher, which results in a higherprofit margin.
Higher. Because the percentageincrease in net income is higherthan the percentage increase in theasset, ROA is higher.
Higher. Because the percentageincrease in net income is higherthan the percentage increase inequity, ROE is higher.
10323-02_Ch02.qxd 2/12/07 1:28 PM Page 26

27A N A L Y S I S O F I N T E R N A T I O N A L F I N A N C I A L R E P O R T I N G S T A N D A R D S
Analyst’s Role
The analyst should:
� Analyze the footnotes of the annual report. They indicate the types of physical assetsthat generate revenue for the organization.
� Make sure that an independent entity has revalued the assets if a revaluation modelis used after the assets are initially recorded. This measure should be reflected in thefootnotes. Note that increases in revaluation are credited directly to equity. Revalu-ation decreases are offset first against the surpluses in the equity; thereafter, anyexcesses are charged against profit and loss.
� Consider what PP&E mean for management’s future expansion. PP&E is one ofthe vital forces of economic growth. Funds, through capital or reinvestment ofearnings, are needed to implement the projects that affect the valuer’s calculationof free cash flow.
� Understand the important role that depreciation plays in calculating income tax. Alarger depreciation expense contributes to smaller taxable income; thus, a lower taxbill produces higher cash flow to the operation.
� Take into account the ramifications of management’s choice to capitalize or expensean asset. This choice has a significant effect on a financial statement. For example, inthe United States, WorldCom capitalized charges paid to local telephone networksto complete calls amounting to approximately $3.1 billion; the company planned toamortize these costs over a period of time. Because the entire cost was not booked inthe income statement, WorldCom’s net income in 2001 was calculated to be a posi-tive $1.38 billion. However, U.S. GAAP considered the $3.1 billion an operatingexpense, which would have been a deduction in the income statement. Consequently,WorldCom’s net income for 2001 should have been a “loss.” After this discovery,WorldCom filed for bankruptcy.
Investments in Associates (IAS 28)
In today’s dynamic capital markets, capital investments are mobilized across the globe insearch of lucrative investments and growth prospects. These investments in associates arecross-transactional events that must be reported in financial statements.
An associate is an entity in which an investor has significant influence over the entity’sfinancial and operating policy decisions. However, the investor’s influence cannot amount
� Will the expected return be greater than the cost of capital?� How much risk is buried in these assets?� Does the method used provide a strong suggestion that management is manipulating
earnings? A fixed asset’s value is influenced strongly by the method of depreciation.� How much new PP&E is needed to support the forecasted sales?� If excess capacity exists, how will that affect the additional funds needed for expansion?
10323-02_Ch02.qxd 2/12/07 1:28 PM Page 27

28 I N T E R N A T I O N A L F I N A N C E R E P O R T I N G S T A N D A R D S
Table 2.7 Example of Equity Method
Effect on financial statements Date Action (company A’s perspective)
January 1, 2004
December 31, 2004
December 31, 2004
The investment account (asset) onthe balance sheet is increased by$50 million. The payment of thepurchase of common stocksdecreases the cash account (asset)on the balance sheet.
The investment account (asset) onthe balance sheet is increased by$3.5 million ($10 million × 35%)with a corresponding increase on“investee income” that is reflectedin the income statement.
Company A would receive $1.4 mil-lion ($4 million × 35%) in cash. As aresult, cash is increased by $1.4 mil-lion, with a corresponding decreasein the investment account.
Company A purchased $50 millionof Company X’s common stock,which represents 35% of votingshares.
Company X had a net income of$10 million.
Company X paid its shareholders adividend totaling $4 million
to control or joint control over the entity’s financial and operating policy decisions. Aninvestor that directly or indirectly holds 20 percent or more, but less than 50 percent, of anentity’s voting shares is presumed to have significant influence. A shareholding of less than20 percent does not represent significant influence, unless the influence can be demonstrated.
An investor might exert significant influence through any of the following channels:
� Representation on the entity’s governing body� Participation in policy-making processes such as strategic decisions� Material transactions between the investor and the entity� Interchange of managerial personnel� Provision of essential technical information.
Equity method
The equity accounting method (see table 2.7) is used to recognize the initial cost of investmentin associates and any adjustments due to subsequent transactions relating to the investor’s shareof the associate’s (investee’s) net profit or loss.
Effect of investee’s profit or losses
At the end of an operating period, an investor must analyze its percentage share of the investee’sprofit or losses. This allocated share is adjusted to the investment account of the investor’sbalance sheet. For example, if there was a loss, this amount would be deducted (credited) to
10323-02_Ch02.qxd 2/12/07 1:28 PM Page 28

29A N A L Y S I S O F I N T E R N A T I O N A L F I N A N C I A L R E P O R T I N G S T A N D A R D S
the investment account (asset). If there was a profit, this amount would be treated as anincrease (debit) in the investment account.
K E Y Q U E S T I O N S
� Are the associate’s accounting policies the same as those of the investor? Theymust be the same.
� Is the equity method used? If so, how are the results affecting the financial statements?� Has the valuer applied reasonable assumptions that will make it possible to measure
the valuation of the company reliably? Limited market-based data are availablefor valuing unlisted companies.
� Is there an appropriate exit strategy for the investment?
Entered by two or more parties to undertake an
economic activity
Subject to joint control
■ No party to the agreement is able to act unilaterally to control the activity of the entity.■ The parties to the agreement must act together to control
the entity—in other words, must exercise joint control.■ None of the entities can own more than 50 percent of the
voting rights.
Contractual arrangement
Figure 2.1 Features of Joint Ventures
Analyst’s Role
The analyst should:
� Ensure that the investee’s net income or loss is included in the investor’s financialstatements.
� Make sure that an appropriate exit strategy, such as a Put Option, is in the contrac-tual agreement.
Interests in Joint Ventures (IAS 31)
Companies can join forces through mergers or corporate alliances. A joint venture—oneform of corporate alliance—is a way to create an entity from piecemeal byproducts of exist-ing business operations. Examples include a marketing force joint venture or developmentjoint venture. Once a joint venture reaches its objective, it can be dissolved (see figure 2.1).
10323-02_Ch02.qxd 2/12/07 1:28 PM Page 29

30 I N T E R N A T I O N A L F I N A N C E R E P O R T I N G S T A N D A R D S
Equity method
The accounting method used for these transactions is the equity method, the same methodused for “Investments in Associates.”
Analyst’s Role
Joint ventures may take various forms, such as jointly controlled operations and jointly con-trolled assets. The transactions of the joint venture can be perceived as a dumping of trans-actions away from the venturer. For example, if the joint venture acquires debt to financethe building of a warehouse, this transfers the debt portion out of the venturer’s financialstatements. As a result, the venturer’s debt ratio would be lower, debt-to-equity would belower, and times-interest-earned (TIE) would be higher. Ultimately, the venturer’s set offinancial statements would appear to be operating efficiently in terms of debt management.
The analyst should:
� Make sure the financial statements of each party to the venture specify the asset thatthe party controls, its incurred liabilities, its earned income as a result of the jointventure, and its incurred expenses.
� For holding companies, make sure to include the net debt in the analysis if it is notcaptured elsewhere.
Investment Property (IAS 40)
Investment properties are tangible assets that are held for the purpose of earning rentalincome or taking advantage of price appreciation. Examples include:
� Land held for the purpose of selling it when the price is high� Leased buildings that are under operating lease� Vacant buildings held to be leased under operating lease� Land held for undecided future use.
Accounting methods
Two methods are used to account for subsequent changes in an investment property. A com-pany may choose either one. In the cost model, the asset is carried at cost less accumulateddepreciation and impairment. In the revaluation model, the asset is carried at a revaluedamount—its fair value at the date of revaluation less subsequent depreciation—provided that
K E Y Q U E S T I O N S
� What is the objective of the joint venture?� Are the assets, liabilities, income, and expenses appropriately captured in the
venturer’s separate and consolidated financial statements?
10323-02_Ch02.qxd 2/12/07 1:28 PM Page 30

31A N A L Y S I S O F I N T E R N A T I O N A L F I N A N C I A L R E P O R T I N G S T A N D A R D S
fair value can be measured reliably. Note that each method affects financial statements dif-ferently (see table 2.8).
K E Y Q U E S T I O N S
� Is the valuation of the company tied to the investment properties?� Which model is used to value the investment property in the balance sheet?� What is the impact of the model chosen?
Table 2.8 Effects of Revaluation Model versus Cost Model
Effect on Effect on balance sheet Date Transaction revaluation model cost model
1⁄1/Year 1
12/31/Year 1
12/31/Year 2
● The “Investment Prop-erty” asset account onthe balance sheetwould increase by $3 million ($1 million+ $2 million).
● The total asset accounton the balance sheet isincreased.
● The “Investment Prop-erty” is increased by$0.5 million. The bal-ance sheet is increasedby $0.5 million and again is recorded on theincome statement.
● Earnings increase by$0.5 million.
● The “Investment Prop-erty” is decreased by$0.4 million and a lossis recorded on theincome statement.
● Earnings decrease by$0.4 million.
● The “Investment Prop-erty” asset account onthe balance sheetwould increase by $3 million ($1 million+ $2 million).
● The total asset accounton the balance sheet isincreased.
● Depreciation elements:useful life of building(20 years); depreciationmethod (straight-line);annual depreciation ofbuilding ($100,000).
● The $0.5 million gaindoes not affect thecost method.
● Depreciation expenseof $100,000 isrecorded on theincome statements.
● Earnings decrease by$100,000.
● The $0.4 million lossdoes not affect thecost method.
● Depreciation expenseof $100,000 isrecorded on theincome statements.
● Earnings decrease by$100,000.
Company A purchased afacility to be used foroperating lease in theamount of $1 million forland and $2 million forthe building.
An independent valuerdetermined that thevalue of the facility isnow $3.5 million.
An independent valuerdetermined that thevalue of the facility isnow $3.1 million.
10323-02_Ch02.qxd 2/12/07 1:28 PM Page 31

32 I N T E R N A T I O N A L F I N A N C E R E P O R T I N G S T A N D A R D S
Analyst’s Role
The analyst should:
� Recognize that when investment properties are purchased, they are initially recordedin the balance sheet at cost. As a result, the total assets are increased. The analyst mustrecognize that this treatment affects the financial ratios, the future earning power ofthe company (owing to the rental income that will be received from the operatinglease), and the future financial requirements of the company.
� Make adjustments to the original cost after any subsequent changes to the investmentproperty, such as appreciation of value or improvement to the building. As illustratedin table 2.8, the “fair value method” and the “cost model” produce different results,which in turn affect the financial statements and financial analysis.
� Examine the notes to the annual report because they contain information that is valu-able in assessing the company. Pay particular attention to items such as discontinu-ation of operation, reconciliation between the carrying amounts of investmentproperty at the beginning and end of the period, and any inconsistencies in the usingof the various methods.
� Apply the elected subsequent measurement model to all investment properties.
Provisions, Contingent Liabilities, and Contingent Assets (IAS 37)
Provisions
Provisions indicate liabilities arising from uncertain timing or amount. The following con-ditions must be present to record a provision:
There is a present obligation arising frompast events.
Payment is probable (“more likely than not”).
The amount can be estimated reliably.
Because the three conditions are present in the example, a provision should be made fora charge to liability and a corresponding charge to income on the balance sheet. However,management must determine the best estimate of loss.
Provisions must be recognized in a financial report, assuming that the transactions meetthe three conditions. The uncertainties they cover arise from sources such as
� Environmental damages from waste or pollutants� Product warranty� Restructuring of an operation given a formal plan� Threat of asset expropriation� Threatened litigation� Sale of business segment, given a binding sale agreement.
Example: A legal case is mounted when one ofthe company’s product lines malfunctions.
Example: Lawyers believe there is a 90 percentprobability that the case will be settled inthe defendant’s favor.
Example: The probable loss will be in therange of $5 million to $8 million.
10323-02_Ch02.qxd 2/12/07 1:28 PM Page 32

33A N A L Y S I S O F I N T E R N A T I O N A L F I N A N C I A L R E P O R T I N G S T A N D A R D S
Contingent liabilities and contingent assets
Contingent liabilities are either a possible obligation of a company in case of an uncertainfuture event or a current obligation of a company in which payment is not measured reliablyor is not probable. A contingent asset is a possible asset of a company that arises from pastevents and is made manifest by the occurrence or nonoccurrence of uncertain future events.
Financial statements do not recognize contingent assets and liabilities, although theirdisclosure is required unless the possibility of an outflow of resources is remote.
Analyst’s Role
The analyst should:
� Maintain a critical frame of mind when assessing management’s data on provisions.Remember that provisions reflect one’s “best estimate.”
� Ignore any possible gains on the sale of assets.� Identify contingent liabilities by examining the required disclosure in the notes of
the annual report. Contingent liabilities are not recognized in income statements andthey could have an impact on the operation’s cash flow.
� Assess the validity of adjustments. IFRS require that, when studying the historicaltrend of the provisions, these amounts be reviewed at the time each balance sheet isdue and adjusted to reflect current best estimates.
Employee Benefits (IAS 19)
IAS 19 prescribes the scope of “Employee Benefits”; IAS 26 provides information on“Accounting and Reporting by Defined-Benefit Plans.”
Companies provide their employees benefits in various forms, such as wages, profit-sharing plans, and pension plans (see box 2.1). These benefits are available to employeesand, often, to their dependents and may be issued as payments (or goods or services) madedirectly to employees, their spouses, children, or other dependents, or to others, such asinsurance companies.
K E Y Q U E S T I O N S
� Are the provisions reflected in the valuation of the company? Examine the disclosures.� In recognizing provisions, is the amount valid and reliably estimated?
K E Y Q U E S T I O N S
� When calculating enterprise value (EV) or earnings before interest taxes deprecia-tion and amortization (EBITDA), does the entity add the present value of pensionliabilities to EV?
� Are the nonoperating gains and losses pertaining to pension plan assets omittedfrom the valuation calculation?
10323-02_Ch02.qxd 2/12/07 1:28 PM Page 33

34 I N T E R N A T I O N A L F I N A N C E R E P O R T I N G S T A N D A R D S
Analyst’s Role
The analyst should examine the components of actuarial assumptions used to calculate thecurrent value of the pension obligation. Any erroneous estimates could distort the financialstatements (see table 2.9). The following are the actuarial elements:
� Rate used to discount estimated cash flows—should be determined by reference tomarket yields at the balance sheet date on high-quality corporate bonds
� Assumption regarding wage growth—increase or decrease in the number of employ-ees or increases in salaries of employees
� Assumed service life of the employees� Assumed expected long-term rate of return on the plan assets� Age distribution of the employees.
Box 2.1
Defined-Contribution Plan● This is a post-employment benefit plan in which
the employer pays fixed contributions into a separate fund.
● When the employer contributes to the fund for a specific period, the company is no longer obliged toadd more to the fund.
● This fund is invested to earn money on behalf of theemployees’ retirement benefit.
Defined-Benefit Plan● This plan provides employees retirement benefits
based on a formula that is usually linked to employeeearnings.
● The current value of the employer’s obligation is calculated at defined periods on the basis of someactuarial assumptions.
● Once the amount is determined, it is credited as a liability on the balance sheet and as a pensionexpense on the income statements.
Types of Pension Plans
Table 2.9 Effects of Changes in Actuarial Components
Component Increase Decrease
Discount rate
Wage growth rate
Expected long-term rateof return
The valuation of the pension obli-gation would decrease; therefore,an actuarial gain is recognized.
Wage growth affects the service costcomponent of the pension expense.Therefore, an increased service costincreases pension expense.
High expected return affects thelow pension cost. Therefore,income is higher.
The valuation of pension obliga-tion would increase; therefore, anactuarial loss is recognized.
The decreased service cost woulddecrease the pension expense.
Low expected return affects highpension cost. Therefore, income is lower.
Construction Contracts (IAS 11)
A construction contract is an agreement to construct an asset or a group of interrelated assets.A key issue is when to recognize revenue. A company need not wait until construction is
10323-02_Ch02.qxd 2/12/07 1:28 PM Page 34

35A N A L Y S I S O F I N T E R N A T I O N A L F I N A N C I A L R E P O R T I N G S T A N D A R D S
complete to recognize revenue, because it can take years to complete a project. U.S. GAAPuses the “completed-contract” method, which recognizes revenue when construction is com-pleted (or substantially completed). IFRS uses the “percentage-of-completion” approachwhen the outcome of a construction contract can be estimated reliably and recognition ofrevenue and costs is in proportion to the stage of completion of the contract activity.
To estimate the outcome of a contract reliably, the enterprise must be able to make areliable estimate of total contract revenue, stage of completion, and costs to complete thecontract. See figure 2.2 for an illustration.
An advantage of the percentage-of-completion method is the periodic recognition ofincome, which is in keeping with the matching principle. A disadvantage is that amounts arebased on estimates rather than actual results. See table 2.10 for a comparison of methods.
Based on the given information in figure 2.2 coupled with the actual costs incurred eachyear, construction revenue is recognized as follows for Company A.
Company A (contractor) is to build an automobilemanufacturing plant
Company A (contractor) and Company B (client) signed the contract agreement
Terms of the Contract
■ Construction period: 3 years■ Contract price: $90 million■ Installment of payments
(receipts): $30 million a year■ Projected cost: $80 million■ Projected profit: $10 million
Figure 2.2 Estimating the Outcome of a Construction Contract—Company A (Contractor) Agrees to Construct an Automobile
Manufacturing Plant for Company B (Client)
K E Y Q U E S T I O N
� How will the company record receipts from the project? When the outcome of theconstruction contract is not reliably estimated, no revenue should be recognized.
Calculation of annual revenue
Ac= ttual costs for each periodTotal project cosst
Total estimated project price×
10323-02_Ch02.qxd 2/12/07 1:28 PM Page 35

36 I N T E R N A T I O N A L F I N A N C E R E P O R T I N G S T A N D A R D S
Analyst’s Role
The analyst should:
� Be mindful that if construction costs “probably” will exceed the total revenue, theexpected loss should be expensed immediately.
Intangible Assets (IAS 38)
Intangible assets do not have physical substance. Some examples are:
� Computer software� Licenses� Patents� Copyrights
Table 2.10 Effects of Percentage-of-Completion versus Completed-Contract Methods
Financial statement Percentage-of-completion Completed-contract
Income
Equity
Total asset turnover
Profit Margin
Operating cash flows
● Revenue is recorded on the basisof the stage of completion.
● Revenue is based on an esti-mate, rather than actual amount.
● Any estimated loss is recordedimmediately.
Higher. During the initial period,revenue is included in the netincome, and this amount iscarried forward into equity.
Higher. Sales are reported fromthe initial period of the project.
Higher. During the initial period,the pro rata character of revenueis recognized; therefore, netincome is higher.
Operating cash receipt isrecorded the same under eithermethod.
● Revenue is recorded when thecontract is completed orsubstantially completed.
● In the initial period of the con-tract, no income is recorded;therefore, net income is lower.
● In the latter period of the con-tract, income will be higher.
● Any estimated loss is recordedimmediately.
Lower. Because revenue is notincluded in the initial period, netincome is lower.
Lower. Sales are not reported fromthe initial period.
Lower. During the initial period,revenue might not even be recog-nized; therefore, net income islower.
Operating cash receipt is recordedthe same under either method.
10323-02_Ch02.qxd 2/12/07 1:28 PM Page 36

37A N A L Y S I S O F I N T E R N A T I O N A L F I N A N C I A L R E P O R T I N G S T A N D A R D S
� Franchises� Marketing rights� Mortgage servicing rights.
IAS 38 requires an entity to recognize an intangible asset only when the intangible is pur-chased or created by the corporation itself. The intangible asset can be derived through merg-ers and acquisitions, or through the creation or reconfiguration of innovative products andservices (such as computer software). Effective merger and acquisition strategies can positiona company for economic growth.
Analyst’s Role
The analyst should:
� Evaluate the validity of the intangible assets. Appraisals of a company’s market potentialmay be overoptimistic, its synergies overestimated, or its post-acquisition integrationpoor. Substantial doubt about such factors will affect the analysis. If the analyst decidesto eliminate the intangible amount from the analysis report, for example, this will affectthe financial ratios, such as total assets turnover, debt ratio, and return on assets.
� Integrate unrecognized elements (intangible assets such as management skills, brandname, and synergy) into the cash flow projection or valuation of the company.Unrecognized elements might contribute to the company’s forward-looking postureor economic growth.
� Pay attention to the notes of the financial statements because they contain essen-tial details, such as the different types of intangible assets, impairment, and amor-tization amount.
Borrowing Costs (IAS 23)
Borrowing costs consist of the interest and other costs associated with borrowing moneyrelating to a “qualified asset” (see box 2.2). Interest is not necessarily capitalized for everyasset purchased on credit. Capitalization relates only to qualified assets that require substan-tial time to bring them to their intended use or saleable condition (see table 2.11). Examplesof qualified assets include construction of a manufacturing plant; purchase of equipment,such as trucks and bulldozers, for farming; and building of investment property.
Not all the interest paid for the period is capitalized (see figure 2.3).
K E Y Q U E S T I O N S
� Is the enterprise truly earning the economic benefits derived from the intangible?� Are there other intangible elements that are not reflected in the balance sheet but
that add value to the corporation?� Are the research costs charged to expense?� Are the development costs capitalized accordingly?
10323-02_Ch02.qxd 2/12/07 1:28 PM Page 37

Table 2.11 Effects of Interest: Expense versus Capitalization
Financial statement Expense Capitalization
Net income
Balance sheet
Total asset turnover
Debt ratio
Times-interest-earned(TIE)
Profit margin
Lower. The entire interest paymentwill cause a higher reduction ofincome; therefore, net income willbe lower.
Lower. The entire interest pay-ment flows directly to the incomestatement.
Higher. There is no effect on salesor total assets because the entireinterest payment flows directly tothe income statement (expense).
Higher. Total assets are notaffected by the paid interest.
Lower. The interest charge isgreater.
Lower. Interest deduction is higher;as a result, net income is lower.
Higher. A portion, if not all, of the interest paid is capitalized;therefore, the amount is added to the carrying amount of theasset. The remainder of the inter-est payment that is “not” capital-ized will be expensed; thus, netincome will be higher.
Higher. The interest payment thatis capitalized is added to the carry-ing amount of the asset. Therefore,this will increase total asset.
Lower. The capitalized interestincreases the total assets.
Lower. The capitalized interestincreases the total assets.
Higher. The interest charge islower.
Higher. Net income is higherbecause interest paid is capitalized.
38 I N T E R N A T I O N A L F I N A N C E R E P O R T I N G S T A N D A R D S
Box 2.2 Methods Used to Account for Borrowing Cost
Benchmark Treatment
All borrowing costs are expensed in the period they are incurred.
Allowed Alternative Treatment
Borrowing costs are capitalized. The designated interest cost is added to the carrying amount of theasset. This method increases the total assets.
Capitalization of the borrowing costs starts when:● Qualifying assets are purchased.● Interest costs are incurred.● Actions necessary to bring the asset for its intended purposes are in progress.
Capitalization of the borrowing costs ends when● The qualifying asset is ready to be used for its intended purpose.● Active development is suspended for an extended period.● Construction is completed in part and the completed part can be used by the entity.
10323-02_Ch02.qxd 2/12/07 1:28 PM Page 38

39A N A L Y S I S O F I N T E R N A T I O N A L F I N A N C I A L R E P O R T I N G S T A N D A R D S
Analyst’s Role
The analyst should:
� Be aware of the ramifications of the treatment of interest capitalization versus expense.Each component has a different effect in the analysis.
Impairment (IAS 36)
Impairment occurs when the carrying amount of an asset (net book value = cost of item lessaccumulated depreciation) is more than the recoverable amount. This recoverable amountis the higher of the following:
� Net selling price: fair value less costs to sell the item� Value in use: discounted present value of estimated future cash flows from using the
asset until its disposal point.
An impaired asset incurs an impairment loss. Impairment could be due to a marketdecline, negative changes in technology and obsolescence, or physical damage to the asset.Where impairment is identified, a write-down of the carrying value to the recoverable amountshould be charged as an immediate expense in the income statement (see table 2.12).
Derecognition (retirement and disposals)
When an asset is disposed of or withdrawn from use, the item should be removed from thebalance sheet.
$4,000Interest
$3,000Capitalized
(balance sheet)The $5,000 isallocated as
follows:
$1,000Principal
$1,000Expensed
(income statement)
Figure 2.3 Allocation of a Loan Payment—Company A Paid Its Loan Payment for the Month in the Amount of $5,000
K E Y Q U E S T I O N
� Are the borrowing costs that are capitalized directly related to a qualified asset?Otherwise, the costs should be expensed.
10323-02_Ch02.qxd 2/12/07 1:28 PM Page 39

40 I N T E R N A T I O N A L F I N A N C E R E P O R T I N G S T A N D A R D S
Analyst’s Role
The analyst should:
� Recognize impairment loss. Impairment significantly influences financial statements.If impairment loss is not recognized, the value of the company is overstated.
� Make sure that goodwill and other intangible assets with indefinite useful lives are tested for impairment at least annually, even though they are not subject toamortization.
Table 2.12 Effects of Impairment
Financial statement With impairment loss Without impairment loss
Balance sheet
Equity
Income
Total assets turnover
Debt ratio
Profit margin
Debt-to-equity
Lower. The carrying amount (netbook value) of the asset is reducedas a result of the write-down orimpairment loss.
Lower. Impairment loss causes areduction in net income; thisamount flows through the equityaccount as a reduction.
Lower. The impairment loss is animmediate expense.
Higher. Total asset is reduced.
Higher. Because of asset reduction,total assets are decreased.
Lower. The impairment loss woulddecrease the net income.
Higher. Because net income isreduced, this effect would flowthrough the reduction of equity.
Higher. No asset adjustment ismade on the financial statement.
Higher. There is no reduction of netincome.
Higher. No impairment loss isrecorded.
Lower. There is no reduction inasset.
Lower. There is no reduction inasset.
Higher. There is no effect on thenet income.
Lower. There is no effect on thenet income; hence, there is noeffect on equity.
K E Y Q U E S T I O N
� In the dynamic marketplace, the fair value of an asset changes over time becauseof technological advances, obsolescence, and ferocious competition, all of whichaffect pricing. As a result, are the assets reasonably tested for impairment?
10323-02_Ch02.qxd 2/12/07 1:28 PM Page 40

41A N A L Y S I S O F I N T E R N A T I O N A L F I N A N C I A L R E P O R T I N G S T A N D A R D S
� Be cognizant of indicators that cause impairment loss, such as a significant change inthe usage of the asset; a significant adverse change in the legal environment or in thebusiness climate that affects the fair value of the asset; and a projection that indicatesa constant loss with an asset.
Revenue (IAS 18)
Revenue is the gross inflow of cash or accounts receivable to a company as a result of perform-ing a service or selling a product. Such services might consist of technical assistance to a clientin the Philippines in the area of corporate governance; computer maintenance; or auditing.
The product sold might be agricultural equipment sold to a client in Peru; computers;or a power supply unit.
Key components of the accounting standards
Approach every financial statement with a degree of professional skepticism. Recognize thatjust because a revenue number appears on the income statement does not mean that it is cor-rect. A company cannot record a revenue transaction unless IAS 18 criteria are met.
Suppose a contract has been drawn up to sell an air-conditioning unit, as shown below.An integral component is to install the item from Company A (seller) in the building of Com-pany X (buyer). Company X (buyer) receives the unit without the installation. Until the unitis completely installed by Company A (seller), the transaction will not be complete. Becauserevenue is not earned, it is not reflected in the income statement of Company A (see figure 2.4).
Sale of goods
All of the following elements must be met to recognize revenue from the sale of goods:
� The significant risks and rewards of ownership are transferred to the customer.� The seller does not have continuing managerial involvement with or control over the
goods.
Start Company A (seller) delivers the air-conditioning (AC) unit to Company X (buyer)
Company X (buyer) receives the AC unit ìwithout ” installation, which is an integral part of the contract.
Results■ Sale is not complete without the installation of
AC unit.■ Revenue is not earned by Company A.■ No revenue is reflected in Company A’s income
statement.
Figure 2.4 A Revenue-Earning Process
10323-02_Ch02.qxd 2/12/07 1:28 PM Page 41

42 I N T E R N A T I O N A L F I N A N C E R E P O R T I N G S T A N D A R D S
� The amount of the goods can be measured reliably.� It is probable that the economic benefits will flow to the seller.� The costs incurred, or to be incurred, in the transaction can be measured reliably.
Sale of services
Revenue is recognized by reference to the state of completion of the transaction at the balancesheet date (for example, December 31 of a given year). The following criteria must be satisfied:
� The amount of revenue can be measured reliably.� The economic benefits probably will flow to the seller.� The stage of completion at the balance sheet date can be measured reliably.� The costs incurred, or to be incurred, in the transaction can be measured reliably.
It is essential to look for and investigate any clues to actual revenue because a company hasthe ability to manipulate the number. With revenue inflated, net profit would increase,financial ratios would be affected, and the company would appear to have growth potential.On the other hand, a company might understate its revenue with the intention of shiftingthe income at a later period.
K E Y Q U E S T I O N S
� Have the services reflected in the contract been performed?� Are any investment gains erroneously recorded in revenue?� Because of an acquisition, are any revenues being withheld instead of recorded in
the current period? The company might be intending to release the revenues at alater period to show an improvement in its operations as a result of the acquisition.
� Are economies of scale and excess capacity considered in the financial forecast?� Are the company’s revenues attached to one key client?� What are the key drivers or competitive advantage attributed to favorable sales growth?� Is the sales growth sustainable, given the competitive environment?� Is the company able to generate a realistic cash flow stream, given the surrounding
business conditions coupled with macroeconomic variables? The discounted cashflow (DCF) relies heavily on forecasts of future performance, including revenuestream, to determine the present value of an investment.
Analyst’s Role
The analyst should:
� Make further investigations when these questions do not have encouraging answers.� Remember that the revenue trend is a key to the valuation of a firm. The result of the
valuation method, such as DCF or Relative (multiple-based) Valuation through listedindustry comparables strongly depends on the analyst’s forecast.
10323-02_Ch02.qxd 2/12/07 1:28 PM Page 42

43A N A L Y S I S O F I N T E R N A T I O N A L F I N A N C I A L R E P O R T I N G S T A N D A R D S
� Be aware that the higher the company’s sales growth rate, the greater the positive cor-relation in the financing requirements.
� Remain guarded at each level of the valuation stage. After all, management has avested interest in massaging the numbers to impress the public market with a com-pany that is doing well.
� Consider such risks as management misstating revenues to meet an earnings-per-share (EPS) target; or management misstating sales or receivables to improvethe balance sheet or liquidity ratios.
Income Taxes (IAS 12)
During the ordinary course of business, taxes are paid to tax authorities such as the federalgovernment, state agencies, and local institutions. An analyst must recognize that “income taxexpense” in the income statement is different from “income tax payable” on the tax return.In addition, “financial income” on the income statement differs from “taxable income” on thetax returns. These differences arise mainly because the method used for recording certain trans-actions (such as method of depreciation and treatment of prepaid rents) depends on the timeframe considered, which is dictated by IFRS for financial statements and by tax regulators(that is, the federal or state government) for the tax returns.
Because of the timing differences (see table 2.13), future tax liability (deferred taxliabilities) and future tax benefit (deferred tax assets) are incurred and must be accountedfor appropriately in the financial statements. The recording of these calculations affects theanalysis of the financial statements.
K E Y Q U E S T I O N S
� Are the appropriate tax rates used? The “effective tax rate” is used in the incomestatement and the “statutory tax rate” is used in the tax returns. It is located in thefootnotes of the financial statements.
� When forecasting, are the appropriate effective income tax rates used?� Are comparisons made between “actual income tax paid” to tax authorities and
the “income tax expense” reflected on the financial statements for the purpose ofassessing operating cash outflow?
� Are there any indications of an aggressive use of tax shelters?
Analyst’s Role
The analyst should:
� Remember that discounting of deferred tax assets and liabilities is prohibited.� Be aware that deferred taxes are classified as noncurrent taxes in the balance sheet.
Do not include the item in calculating current ratios.
10323-02_Ch02.qxd 2/12/07 1:28 PM Page 43

44 I N T E R N A T I O N A L F I N A N C E R E P O R T I N G S T A N D A R D S
Leases (IAS 17)
A lease is a contract between the owner of a leased asset (lessor) and an entity (lessee) thatagrees to pay rent for using the leased asset on a periodic basis for a specific period of time.
Types of leases
In an operating lease, the lessee pays a periodic rental payment directly to the lessor. In a financelease, the lessee has to obtain debt financing to use the leased asset. The leased equipment istreated as fixed asset.
As an illustration of operating lease, Company A (lessee) agrees to lease a car fromCheaper Car Leasing Company (lessor) for five years (see figure 2.5). During that period,
Table 2.13 Examples of Timing Differences and the Effect of Deferred Tax Asset/Liability
Example Income statement Tax return Net effect
Choice of deprecia-tion method: exam-ple of deferred taxliability
Prepaid rent for$100 (example ofdeferred tax asset)
Installment sales of $100 (exampleof deferred tax liability)
Straight-linemethod, $100 permonth of deprecia-tion expense
No entry in theincome statement;balance sheet entryas a prepaid asset
$100 is recognizedas income.
Double-decliningmethod (acceleratedmethod), $150 permonth of deprecia-tion expense
$100 is included inthe taxable income.
$100 is not includedin the taxableincome.
Current taxable income wouldbe $50 lower. In the future,however, tax liability would beincurred. Because accelerateddepreciation method leads todeferral of taxes, the taxes onthe income reported in financialstatements will generally bemuch greater than the actualtax paid. Deferred tax liability is recorded.
Because of $100 taxableincome, current income taxwould be higher this period. Inthe future, however, tax benefit(asset) would be incurred. Thecorporation’s earnings in thefuture will be greater; the firmis given credit for the deferredtaxes. Deferred tax asset isrecorded.
Because financial income is$100 higher, income taxexpense is higher. However,future tax liability would beincurred. Deferred tax liability is recorded.
10323-02_Ch02.qxd 2/12/07 1:28 PM Page 44

45A N A L Y S I S O F I N T E R N A T I O N A L F I N A N C I A L R E P O R T I N G S T A N D A R D S
Company A (lessee) pays Cheaper Car Leasing Company (lessor) $300 a month. At the endof the lease, Company A can purchase the car for $4,000, which is the expected fair value.Effects of the lease on Company A’s financial statements are shown in table 2.14.
As an illustration of finance lease, Company A (lessee) agrees to lease the heating, ven-tilating, and air-conditioning (HVAC) unit from AC Mechanical (see figure 2.6). To con-summate the agreement, Company A (lessee) must obtain loan financing through MoneyCapital to pay AC Mechanical once the HVAC unit is installed. Once the installation is com-pleted, the payment process of the loan is generated by Company A to pay Money Capitalin the amount of $5,000 a month for a period of eight years at an interest rate of 10 percent.The effect of the finance lease on Company A’s financial statements is shown in table 2.15,and the effect of both the finance and operating lease is shown in table 2.16.
Company A (lessee) Cheaper Car Leasing Company (lessor)Leases a car
Lease:■ $300/month■ 5 years
Figure 2.5 An Operating Lease
Table 2.14 Effects of the Operating Lease on Company A’s Financial Statements
Circumstance Balance sheet Income statement
No valuation of the futureperiodic payments is needed(present value process)
Monthly rental payments of$300 for 5 years
Lease expiration: If Company Adecides to purchase the car atthe end of the lease term for$4,000 cash
● The fixed asset account onthe balance sheet is notaffected in regard to anyrental payments.
● The equity account on thebalance sheet will beaffected indirectly when netincome is carried forwardinto the equity.
● The cash account decreases.
● Increase the equipment(asset) account by $4,000
● Cash decrease
● Rental expense of $300● Decreases net income
● Monthly depreciationexpense of the capitalizedasset ($4,000) over its usefullife
10323-02_Ch02.qxd 2/12/07 1:28 PM Page 45

46 I N T E R N A T I O N A L F I N A N C E R E P O R T I N G S T A N D A R D S
Figure 2.6 A Finance Lease
Company A(lessee)
AC Mechanical(vendor)
Money Capital(loan company)
Company A signs an agreement with AC Mechanical to install an HVAC unit
Money Capital directs the funds to AC Mechanical to pay for the HVAC
Company A signs a loan agreement to pay for the HVAC unit with Money Capital
Table 2.15 Effect of the Finance Lease
Item Balance sheet Income statement
Value of the HVAC unit.The present value (PV) of$329,507 (PV of $5,000 permonth for eight years @ 10 percent)
Monthly $5,000 payment
Monthly depreciation expense:because the leased equipmentwas recorded as a fixed asset,the cost will be depreciatedover the period of the lease.The monthly depreciationexpense is $3,432.
● The asset account (equip-ment) increases by $329,507.
● The liability accountincreases by $329,507.
● The $5,000 will decrease thecash account.
● Based on the amortizationschedule, the initial pay-ments will be allocated tointerest expense (incomestatement).
● Eventually, the monthly pay-ments will be allocated tothe principal, therebydecreasing the liabilityaccount.
● The monthly depreciationexpense will decrease thefixed asset account.
● An account called “accumu-lated depreciation” will keeptrack of this monthly record-ing until the asset is fullydepreciated (8 years or 96 months).
Not affected during the initialstage of the transaction
The amortization schedule allo-cates the payments to interestexpense in the early stage ofthe loan. Interest expensewould be higher and paymentto the loan principal would belower. Eventually, it will be thereverse.
● The depreciation expense of$3,432 will be recorded.
● This amount will decreasenet income.
10323-02_Ch02.qxd 2/12/07 1:28 PM Page 46

47A N A L Y S I S O F I N T E R N A T I O N A L F I N A N C I A L R E P O R T I N G S T A N D A R D S
Table 2.16 Impact of Finance Lease and Operating Lease
Financial statement Finance lease Operating lease
Income
Balance sheet (asset)
Balance sheet (liability)
Statement of cash flow
Allocation of monthlylease payment
Depreciation
Current ratio
Fixed assets turnoverand total assetsturnover
Debt ratio
Times-interest-earned(TIE) ratio
Profit margin
Interest on loan and depreciation expense isdeducted. During the early period of the lease,expenses are higher because of the interest.However, expenses will eventually declineover the life of the lease.
The equipment is recorded as an asset. Overthe life of the lease, the carrying amount willdecrease with depreciation of the asset.
The loan that was used to acquire the asset isbooked as a liability.
The interest payment is operating cash out-flow; the principal repayment is a financingoutflow.
Note: The depreciation expense is a non-cashitem; therefore, it is not a cash outflow.
One portion is to pay for the principal of theloan (balance sheet); the other is to pay for theinterest (income statement).
Depreciation is treated as an expense.
Lower. The current portion of the loan triggersan increase in the current liabilities.
Lower. The leased equipment is recorded as anaddition to the asset of the balance sheet.
Higher
Lower. Because of the recognition of loan forthe leased asset; interest expense is incurred.
Lower. The interest expense and depreciationlower net income; however, the principalrepayment does not affect net income. On theother hand, during the latter period of thelease, net income would be higher becauseinterest expense would be lower.
The periodic lease pay-ment is treated as arental expense over thelease term.
No asset account isrecorded.
No liability account isrecorded.
The rental expense istreated as an operatingcash outflow.
The entire payment isrental expense (incomestatement).
No depreciation
Higher. No debt isincurred.
Higher. No asset isrecorded.
Lower
Higher. No interestexpense is recorded.
Higher. The entire rentalpayment reduces netincome, but it is lowerthan the financingmethod. However, inthe latter period of thelease, net income wouldbe lower.
10323-02_Ch02.qxd 2/12/07 1:28 PM Page 47

48 I N T E R N A T I O N A L F I N A N C E R E P O R T I N G S T A N D A R D S
Why does a company choose to lease?
Tax purposes
Under an operating lease, the entire rental payment is deducted on the income statement.The ramification is, if a company is in the higher tax bracket, the deduction would lowertaxable income. Hence, cash savings are derived.
Debt-ratio effect
Under an operating lease, there is no debt obligation; therefore, debt ratio would not beaffected. The debt ratio is important because it affects the company’s credit rating, whicheventually affects the cost of capital.
Cash flow effect
Under finance leasing, the “Operating Activities” have a higher cash flow.
Analyst’s Role
The analyst should:
� Note that with operating leases, as opposed to finance leases, the leased asset isnot capitalized; therefore the attributable debt is ignored in the balance sheet. Notincluding this off-balance-sheet item in the valuation analysis would not provide abest-estimate valuation of the company. This would affect the enterprise value inthe EV/EBITDA relative valuation.
� Be aware that, if a company signs an operating lease agreement, this is an obliga-tion of future cash outflow. Therefore, include the amount in calculating the truedebt ratio, but note that this will change the appropriate capital structure (leverage)of the company.
Earnings per Share (IAS 33)
Earnings per share is a standard measure used to assess an entity’s performance over time. Itis a consistent measure that helps the analyst compare the entity with other companies.
IAS 33 applies to entities whose stocks are traded publicly or are in the process of beingissued to the public. Other companies that choose to present EPS information must followIAS 33 guidelines.
K E Y Q U E S T I O N
� EV/EBITDA valuation methodology: With operating leases, is the leased-assetdebt added to the calculation of enterprise value?
10323-02_Ch02.qxd 2/12/07 1:28 PM Page 48

49A N A L Y S I S O F I N T E R N A T I O N A L F I N A N C I A L R E P O R T I N G S T A N D A R D S
Financial statements
EPS is located on the income statement. The following two values relate to EPS:
� Basic EPS. Shareholders’ net profit or loss earned for the period. This is the amountavailable to each outstanding share of common stock.
Example of basic EPS
Net income = $100,000Common shares outstanding = 150,000Preference shares outstanding = 10,000; dividend rate = $1/share
� Diluted EPS. “Reduction” of the basic EPS. This occurs because of the assumptionthat the convertible debts, option rights, and warrants are exercised by the holders,then converted into common stocks.
Example of diluted EPS
Net income = $100,000Common shares that are outstanding = 150,000Convertible preference shares outstanding = 10,000; dividend rate = $1/share; each shareis convertible into 2 shares of common stock
Formula
Net profit or loss attributable to
=
ordinary shareholdersless preference dividdends
The weighted average number of ordinarry sharesoutstanding during the period
Calculation:$100,000 − =$ ,
,$ .
10 000150 000
0 60 pper share
Calculation:$100,000 − +( )$ , $ ,
,
10 000 10 000
150 0000 10 000 20 59
+ ×( )=
,$ . per share
Formula
Net profit or loss attributable to
=
oordinary shareholders lesspreference divideends plus dividends on converted securitiess
The weighted average number of ordinary shhares outstandingduring the period (assuminng all dilutive securities are converted
intto common stock)
10323-02_Ch02.qxd 2/12/07 1:28 PM Page 49

50 I N T E R N A T I O N A L F I N A N C E R E P O R T I N G S T A N D A R D S
Analyst’s Role
The analyst should:
� Note that, when using EPS or P/E ratios to gauge the performance of a company overtime, both the operating and nonoperating activities are embedded in the netincome. This affects the EPS calculation. Examples of nonoperating activities includediscontinued operation of a business segment, write-offs, changes in accounting pol-icy, and restructuring costs.
� Eliminate one-time or nonrecurring events while valuing companies. Otherwise, theresults will be misleading.
� Exercise the utmost caution when scrutinizing the P/E ratios of comparable compa-nies, because each company will be subject to problems.
Effects of Changes in Foreign Exchange Rates (IAS 21)
In the dynamic global market, foreign enterprises conduct their transactions using foreigncurrencies for their expenditures, hedging strategies, and investing and financing activities.These business activities must be reflected on the financial statements in the corporation’sreporting currency.
Types of accounting currency
Presentation currency is the currency used to report financial statements. Note that a foreignsubsidiary’s presentation currency may not be the same as its functional currency. Functionalcurrency is the currency of the economic environment in which the entity operates prima-rily, usually the local currency.
As an illustration, Company A, located in the Philippines, and Company B, located inUkraine, are foreign subsidiaries of Company X (parent) (see figure 2.7). Company A usespeso currency for its local operations and Company B uses hryvnia as its local currency.However, the parent Company X, which is based in the United States, must report to theSecurities and Exchange Commission (SEC); therefore, the presentation currency is the U.S.dollar. Company A and B’s financial statements must be translated into U.S. dollars to con-solidate Company X’s financial statement.
Converting functional currency to presentation currency
The financial statements of an entity that uses functional currency other than the presen-tation currency must be converted into the presentation currency. Assets and liabilities are
K E Y Q U E S T I O N S
� In using price/earnings (P/E) multiples to value a company, does the analyst under-stand that both operating and nonoperating activities are commingled in EPS?
� Why are P/E multiples across comparable companies different?� What key drivers of earnings increase or decrease affected EPS?
10323-02_Ch02.qxd 2/12/07 1:28 PM Page 50

51A N A L Y S I S O F I N T E R N A T I O N A L F I N A N C I A L R E P O R T I N G S T A N D A R D S
converted at the spot exchange rate at the balance sheet date. Income and expenses are con-verted at exchange rates at the transactions. All resulting exchange differences should beclassified as a separate component of equity of the reporting entity until disposal of the netinvestment in a foreign entity.
Effect of currency conversion on the balance sheet
Because the gains or losses from currency translation are recorded directly into equity,conversion affects the volatility of the balance sheet, not the income statement.
Transactions denominated in a foreign currency
Currency gains or losses may be incurred through the buying or selling of goods and serviceson different dates. The gains or losses are incorporated into the income statement.
As an illustration, on October 1, 2004, Company A (a U.S.-based company) purchasedmicrochips on credit for 100,000 pesos. Company A paid the invoice on March 31, 2005.Table 2.17 shows the exchange rates and various effects.
Financialstatements areconverted fromhryvnia to U.S.dollars, thepresentationcurrency.
Financialstatements areconverted from
pesos to U.S.dollars, the
presentationcurrency.
Company X(Parent)
■ Incorporated in the United States■ U.S. dollar is the presentation currency
Company A(Subsidiary)
■ Located in the Philippines■ Philippine peso is the functional currency
used in financial statements
Company B(Subsidiary)
■ Located in Ukraine■ Hryvnia (UAH) is the functional currency
used in financial statements
Figure 2.7 Currency Conversion
K E Y Q U E S T I O N S
� What is the functional currency of the subsidiary?� What is the presentation currency of the parent company?� When translating the financial statements to the presentation currency, are the
appropriate exchange rates applied to assets and liabilities and to income andexpenses?
10323-02_Ch02.qxd 2/12/07 1:28 PM Page 51

52 I N T E R N A T I O N A L F I N A N C E R E P O R T I N G S T A N D A R D S
Analyst’s Role
Foreign exchange gains and losses arise in a variety of transactions. The analyst should:
� Identify the sources of these variables and take their effects into account when ana-lyzing historical financial data.
� Gains and losses affect net income, and this trickles down to financial ratios such asprofit margin, return on assets, and return on equity.
Hyperinflationary Economies (IAS 29)
Hyperinflationary environments can also affect financial analysis, cash flow projection, andcomparisons of financial data across companies in the same industry. In some countries,financial statements are not adjusted to take into account the effect of inflation.
For example, because PP&E assets are recorded at cost on the balance sheet, theamount is not adjusted to reflect their estimated value as a result of inflation. Yet it is quiteclear that when a firm maintains a building or equipment for a period of time, the histor-ical cost reflected on the balance sheet is not the same as the market value. The value ofthe fixed assets bought in the past is seriously understated. Consequently, inflation dis-torts the financial statements. To address this matter, IFRS require all financial statements,including cash flow statements, to be restated into current purchasing power at the bal-ance sheet date.
Table 2.17 Effect of Exchange Rates on Financial Statements
Rate Date ($ per peso) Effect
10/1/2004
12/31/2004
3/31/2005
$.10
$.06
$.09
The recording of the purchases would include $10,000 ($.10 ×100,000). This would increase the inventory (asset) and the liability(accounts payable).
12/31/2004 is the balance sheet date of Company A. Appreciation ofthe U.S. dollar translates into a $4,000 (100,000 × $.10 − $.06) gain.This brings a $4,000 decrease to the liability account (accountspayable-balance sheet) and a corresponding $4,000 increase to theforeign exchange transaction gain on the income statement.
On 3/31/2005 the vendor was paid a cash amount of $9,000 ($.09 × 100,000 pesos), with the following impact on the financialstatements:● The liability account (accounts payable) on the balance sheet is
reduced by $6,000 ($10,000 − $4,000).● The foreign exchange transaction produces a loss on the income
statement in the amount of $3,000 ([$.06 − $.09] × 100,000 pesos).
10323-02_Ch02.qxd 2/12/07 1:28 PM Page 52

K E Y Q U E S T I O N S
� Did the analyst examine the insurer’s liability account to make sure that it doesnot include any provisions of possible future claims not in existence in the bal-ance sheet data?
Insurance Contracts (IAS 4)
An insurance contract is an agreement between two parties concerning risk compensation.The insurer agrees to accept significant insurance risk incurred by the policyholder. Theinsurer agrees to compensate the policyholder when a specified and uncertain future eventadversely affects the policyholder.
53A N A L Y S I S O F I N T E R N A T I O N A L F I N A N C I A L R E P O R T I N G S T A N D A R D S
Restatement of financial statements
Financial statements may be restated by the following procedure:
� Select a general price index.� Segregate monetary and nonmonetary items.� Restate nonmonetary items, including deferred tax.� Restate the income statement.� Calculate and prove the monetary gain or loss.� Preparate the cash flow statement recognizing inflationary effects.� Restate corresponding figures.
K E Y Q U E S T I O N S
� Is the appropriate inflation index injected in the cash flow projections?� What is the impact of the inflation rate on the valuation discount rate?
Analyst’s RoleThe analyst should:
� Use both nominal and real terms in the financial statements when valuing companies(see below).
Terms Advantage Disadvantage
Nominal
Real
● Taxes on the financial statementscan be calculated.
● Changes in working capital arecaptured.
● Meaningful ratios are captured,such as return on invested capital(ROIC).
● Valuable capital expenditurebudget is formulated.
● Meaningful ratios are not captured to reflectthe current position or performance of a firm.
● Estimating future capital expenditures fromthe book value of fixed assets is an ineffi-cient approach for cash flow projection.
● Changes in working capital would not becaptured for cash flow projections.
● Taxes would not be calculated on the finan-cial statements based on the designatedaccounting standards.
10323-02_Ch02.qxd 2/12/07 1:28 PM Page 53

54 I N T E R N A T I O N A L F I N A N C E R E P O R T I N G S T A N D A R D S
Analyst’s Role
The analyst should:
� Note that the insurer’s financial statements cannot recognize liabilities on any pro-visions of possible future claims that are not in existence at the reporting date, andthat the insurer cannot remove the insurance liability on the balance sheet unless theobligation is discharged.
� Consider fair value. At each reporting date, the insurer measures the adequacy of theinsurance liabilities. The analyst should consider the validity of current liability esti-mates because it affects future cash outflows along with debt-related financial ratios.Any deficiencies should be reflected on the income statement.
� Be on the lookout for companies that might use the historical record of insurance lia-bilities at subsequent periods. This would distort the financial statements.
� Pay attention to the notes of the financial statements because they reflect relevantinformation on the amount, timing, and uncertainty of future cash flows from insur-ance contracts.
Segment Reporting (IAS 14)
Segment reporting captures the risks and returns relating to an entity’s line of business andgeographical scope. It can be divided into two types: business segment and geographical seg-ment reporting. IAS 14 is used for companies in which securities are traded publicly and forthose that are in the process of issuing their securities publicly.
What is a business segment?
A business segment is a distinct component of an entity that provides a single product orservice or a group of related products and services (such as financial services for a consultingcompany), and is subject to risks and returns different from those of other business segments(such as demand for the product or services).
What is a geographical segment?
A geographic segment is a distinct component of an entity that provides products and serviceswithin a particular economic environment (i.e. the operational results of the Asian division ofa global enterprise), and is subject to risks and returns different from those of components oper-ating in other economic environments (i.e. interest rate risk, currency risk, and country risk).
K E Y Q U E S T I O N S
� Is the company deriving its revenue from a few key customers?� Is the company relying on a single supplier?� Is the company’s revenue tied to one product source?� Is the main focus of the company’s operation overseas?
10323-02_Ch02.qxd 2/12/07 1:28 PM Page 54

55A N A L Y S I S O F I N T E R N A T I O N A L F I N A N C I A L R E P O R T I N G S T A N D A R D S
Analyst’s Role
The analyst should:
� Be cognizant of market conditions that have an impact on value drivers, such aschanges in macroeconomics elements, ferocious competitors, and elasticity ofdemand and prices. These variables affect financial analysis. Segment reporting high-lights factors that generate value in a company’s operation, such as its key products,customers, and suppliers.
Business Combinations (IFRS 3)
Business combination refers to the integration of different business entities into one reportingentity. Business combination is consummated through mergers, acquisitions, and tender offers.
Goodwill
Inherent in business combination is the recognition of goodwill if the cost paid for the acquisi-tion is higher than the fair value of the acquired entity. The derived goodwill amount is reflectedon the balance sheet and is tested periodically for impairment. However, if the fair market valueof the acquired entity is higher than the cost, a “gain” is recognized in the income statement.Example of a goodwill transaction:
Description Amount
Cost price of acquired entity 500,000Fair market value of the acquired entity (400,000)
Difference$100,000 is recorded on the balance sheet as “Goodwill” 100,000
Cost price of acquired entity 500,000Fair market value of the acquired entity (525,000)
Difference$25,000 is recorded on the income statement as a “Gain” (25,000)
K E Y Q U E S T I O N S
� In the midst of business combination, is the goodwill account screened properly?� Is the goodwill amount valid for inclusion in the valuation of the company?
Analyst’s Role
The analyst should:
� Beware of comparing historical trends in periods of business combinations, when thenormal estate of an entity becomes injected with variables from other periods that
10323-02_Ch02.qxd 2/12/07 1:28 PM Page 55

56 I N T E R N A T I O N A L F I N A N C E R E P O R T I N G S T A N D A R D S
cannot be compared reliably. In those circumstances, current financial ratios will notbe meaningful.
� Be cognizant that valuation of goodwill is a subjective exercise because it is based ona valuer’s assumptions. Nevertheless, high goodwill amounts would increase the totalassets on the balance sheet and thus have an impact on the ratio analysis.
� Note that the effect of periodic impairment is reflected on the income statement. It’sa non-cash expense that affects the reduction of net income and is carried forward toaffect the equity account.
� Scrutinize the disclosures on business combinations in the annual report. They willprovide key information on the nature of the combining entities, the elements thatcontributed to the recognition of goodwill, and how fair value is determined on theacquired entity.
Consolidated and Separate Financial Statements (IAS 27)
What are consolidated financial statements?
Consolidated statements integrate a parent company’s financial statements with those of itsrespected subsidiaries, both domestic and foreign, as long as the parent’s voting rights aregreater than 50 percent. As a caveat, make sure that any transactions between the parent andits subsidiaries, such as the sale of goods from the subsidiary company to the parent com-pany, are eliminated from the consolidated statements.
As an illustration, suppose a parent company must consolidate Subsidiary A, Sub-sidiary B, and Subsidiary C (see figure 2.8). On the other hand, it does not consolidateSubsidiary X because the control over the investee is less than 50 percent of the votingrights. The equity method is used to account for Subsidiary X.
Parent company
Subsidiary Alocated in Colombia
(55% voting rights)
Subsidiary Blocated in Senegal(60% voting rights)
Subsidiary Clocated in Philippines
(50% voting rights)
Consolidate subsidiary A, B, C
Subsidiary X located in India (45% voting rights)
�������consolidate.Instead use the equity method.
Figure 2.8 Consolidating Subsidiaries
K E Y Q U E S T I O N S
� Are all the subsidiaries, foreign and domestic, included in the consolidated finan-cial statements?
� Which subsidiaries are the drivers of revenue and cost?
10323-02_Ch02.qxd 2/12/07 1:28 PM Page 56
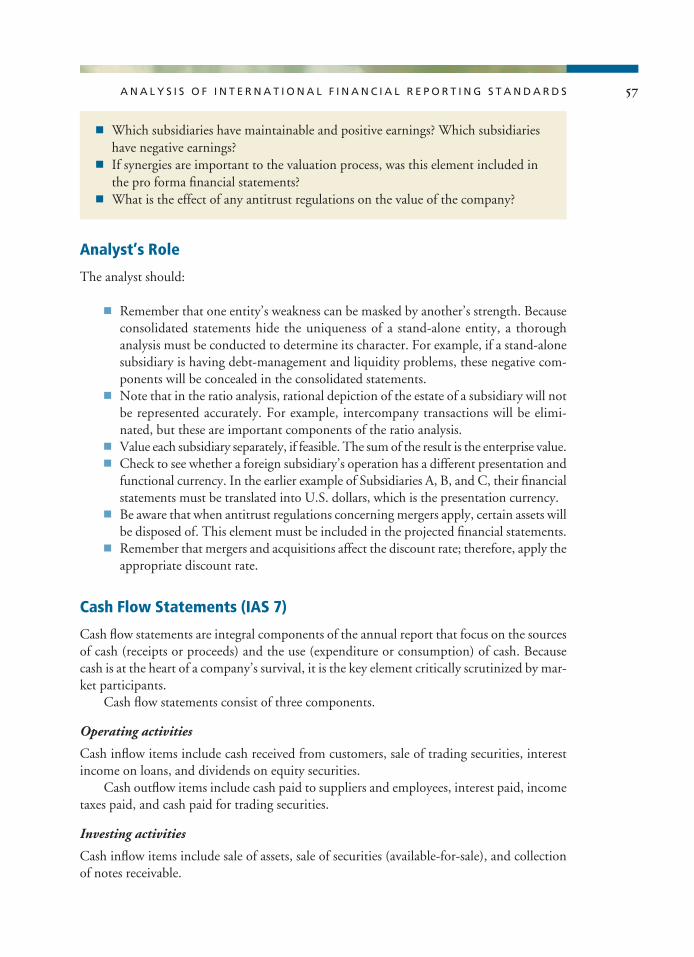
57A N A L Y S I S O F I N T E R N A T I O N A L F I N A N C I A L R E P O R T I N G S T A N D A R D S
Analyst’s Role
The analyst should:
� Remember that one entity’s weakness can be masked by another’s strength. Becauseconsolidated statements hide the uniqueness of a stand-alone entity, a thoroughanalysis must be conducted to determine its character. For example, if a stand-alonesubsidiary is having debt-management and liquidity problems, these negative com-ponents will be concealed in the consolidated statements.
� Note that in the ratio analysis, rational depiction of the estate of a subsidiary will notbe represented accurately. For example, intercompany transactions will be elimi-nated, but these are important components of the ratio analysis.
� Value each subsidiary separately, if feasible. The sum of the result is the enterprise value.� Check to see whether a foreign subsidiary’s operation has a different presentation and
functional currency. In the earlier example of Subsidiaries A, B, and C, their financialstatements must be translated into U.S. dollars, which is the presentation currency.
� Be aware that when antitrust regulations concerning mergers apply, certain assets willbe disposed of. This element must be included in the projected financial statements.
� Remember that mergers and acquisitions affect the discount rate; therefore, apply theappropriate discount rate.
Cash Flow Statements (IAS 7)
Cash flow statements are integral components of the annual report that focus on the sourcesof cash (receipts or proceeds) and the use (expenditure or consumption) of cash. Becausecash is at the heart of a company’s survival, it is the key element critically scrutinized by mar-ket participants.
Cash flow statements consist of three components.
Operating activities
Cash inflow items include cash received from customers, sale of trading securities, interestincome on loans, and dividends on equity securities.
Cash outflow items include cash paid to suppliers and employees, interest paid, incometaxes paid, and cash paid for trading securities.
Investing activities
Cash inflow items include sale of assets, sale of securities (available-for-sale), and collectionof notes receivable.
� Which subsidiaries have maintainable and positive earnings? Which subsidiarieshave negative earnings?
� If synergies are important to the valuation process, was this element included inthe pro forma financial statements?
� What is the effect of any antitrust regulations on the value of the company?
10323-02_Ch02.qxd 2/12/07 1:28 PM Page 57

58 I N T E R N A T I O N A L F I N A N C E R E P O R T I N G S T A N D A R D S
Cash outflow items include cash expenditures (divestiture and acquisition of real assets),loans made to other entities, and purchase of equity securities (other than trading).
Financing activities
Cash inflow items include proceeds from sale of a company’s common stock and proceedsfrom issuance of mortgage bonds.
Cash outflow items include principal payment for bond indenture, purchase of treasurystocks, principal payment under finance lease obligation, and dividend payment.
K E Y Q U E S T I O N S
Regarding operating activities
� Is the company generating sufficient cash from its existing resources and capabilities?� Did the company produce enough cash to pay its debt obligations?� Are there any cash cushions to invest in new projects for future growth?� Is there extra cash to pay dividends to shareholders?� Is the “net cash provided by operating activities” experiencing a shortfall? This is
a negative signal to both management and market participants.� Did management tighten or loosen its credit policy affecting the collectivity of its
accounts receivable?� Do you find a continuous decline in operating cash? If so, what strategic plans is
management developing to address this critical issue?
Regarding investing activities
� Is the investment in the construction of a manufacturing plant enhancing thecapacity level for future demand of the company’s product line?
� Are loans granted to related parties valid?� Is the company selling any assets? What indicates the sale of its business segment?� When operating cash is insufficient, how does the company cover the capital and
investment expenditures?
Regarding financing activities
� Is the company going to issue bonds or stocks to finance its new developments?� Is the company going to issue stocks to finance its new projects?� Is the company able to pay dividends to its shareholders? Is the dividend payment
low or high this year in comparison with other periods?
Analyst’s Role
The analyst should:
� Recognize that the income statement contains recorded revenues that are not actu-ally received and recorded expenses that are not actually paid. This is due mainly to
10323-02_Ch02.qxd 2/12/07 1:28 PM Page 58

59A N A L Y S I S O F I N T E R N A T I O N A L F I N A N C I A L R E P O R T I N G S T A N D A R D S
the fact that transactions are recorded on an accrual rather than cash basis. Further-more, the use of accounting methods such as depreciation produces varied results innet income. Professional skepticism argues that management has the capability tomanipulate earnings and has a vested interest in producing favorable bottom-lineresults. With the apparent transparency of cash in the cash flow statements, this isthe most striking information about a company’s actual performance.
� Know how a company that is expanding its operation—for example, by building afacility to expand production capacity—is financing the project. Will the companyuse its existing free cash flow and issue debt (which affects debt ratio) or issue stocks(which affect equity ratios)? The cash flow statement is an important tool for assess-ing the company’s prospective growth, as well as the needed capital structure to financethe project.
� Examine the cash flow statement; it is a useful objective measure of the free cashflow used to value the firm. The valuation models use the results in their “operat-ing activities.”
� Scrutinize the answers to the questions above; they provide evidence of the com-pany’s lifeline. Close scrutiny is crucial in areas of suspicious activities.
Events after the Balance Sheet Date (IAS 10)
Financial statements must also capture critical events after the balance sheet date (year-end),such as the settlement of an ongoing legal case or acquisition of an entity. They must be takeninto account to provide transparency about whether the operation is a going concern.
What are events after the balance sheet date?
These are events occurring between the end of the accounting year (for example, December 31,for a calendar-year operation) and the date of the auditor’s report.
For example: If Company A’s operating period runs from January 1 to December 31,its financial statements must show the events and adjustments outlined in table 2.18.
Adjusting events
Financial statements should be adjusted to reflect important events after the balance sheetdate. Adjust the appropriate accounts in the balance sheet and income statements. Adjust-ing entries include:
� A discovery of fraud or error making the financial statements incorrect at year-endbefore the adjustments
� The verification after the balance sheet date of the cost of assets purchased, or veri-fication of the proceeds from assets disposed before the balance sheet date
� Resolution after the balance sheet date of a court case that validates a current obli-gation requiring either an adjustment to an existing provision or recognition of aprovision instead of disclosure of a contingent liability.
10323-02_Ch02.qxd 2/12/07 1:28 PM Page 59

60 I N T E R N A T I O N A L F I N A N C E R E P O R T I N G S T A N D A R D S
Table 2.18 Events after the Balance Sheet Date and Adjustmentsto the Financial Statements
Adjustments Date Event Required? explanation
December 31
February 15
February 18
February 22
February 25
February 28
March 10
March 31
Company A’s booksare closed.
Start of audit fieldwork
Ongoing legal casewith a former clientwas settled. A settle-ment of $1 million isto be paid for theentire legal cost.
Declaration date ofdividend: 50 cents pershare payable to hold-ers of record onDecember 31
Sale of mortgagebonds
Last day of auditfieldwork
Annual report is sub-mitted to the client.
Submission date tostock exchangeagency (in the UnitedStates, it is the Securi-ties and ExchangeCommission) forpublic companies.
—
—
Yes
No
No
—
—
—
—
—
Because the settlement amountis known before the issuance ofthe audit report, the December31 financial statement isadjusted to reflect the $1 mil-lion as a liability.
The transaction would berecorded on February 22, notDecember 31.
No adjustments are required, butdisclosure is required in the notesof the financial statements.
The auditor is not required toperform any audit services forthe client after February 28.However, if the auditor isaware of any subsequentevents after this date, theauditor should consider anyneeded adjustments or dis-closures. Note: This is thereport date of the auditedfinancial statement.
—
—
10323-02_Ch02.qxd 2/12/07 1:28 PM Page 60

61A N A L Y S I S O F I N T E R N A T I O N A L F I N A N C I A L R E P O R T I N G S T A N D A R D S
Nonadjusting events
Financial statements should not be adjusted to reflect nonadjusting events after the balancesheet date. Nonadjusting entries include:
� Decline in the market value of investments between the balance sheet date and thedate when financial statements are issued
� Announcement of a plan to discontinue an operation� Entity’s declaration of a dividend after the balance sheet date.
Analyst’s Role
The analyst should:
� Examine disclosures not included in the financial statements. The events to whichthey refer affect future cash flows, which in turn affect the estimate of the business’sfair value.
� Look for events that were not disclosed on the financial statements but which couldaffect the valuation of the company, such as changes in the company’s managementteam, termination of a key client’s contract, or dwindling market demand for theclient’s product.
Extractive Industries (IFRS 6)
Extractive industries include minerals, oil, and natural gas resources.
Costs
The costs associated with extractive industries arise from rights to explore; topographical,geological, geochemical, and geophysical studies; drilling; activities related to evaluatingtechnical feasibility; tunnels; and trenching.
Accounting methods
According to IFRS 6, companies may continue to use their existing accounting policies forexploration costs and evaluation of assets. Companies can defer these costs on the balance
K E Y Q U E S T I O N S
� Have the disclosures subsequent to the balance sheet date been examined? Pocketsof value might be hidden behind these events.
� Does the annual report fail to disclose any significant events that have an impacton the operation, such as the loss of a vital customer, change in the managementteam, or new legislation?
10323-02_Ch02.qxd 2/12/07 1:28 PM Page 61
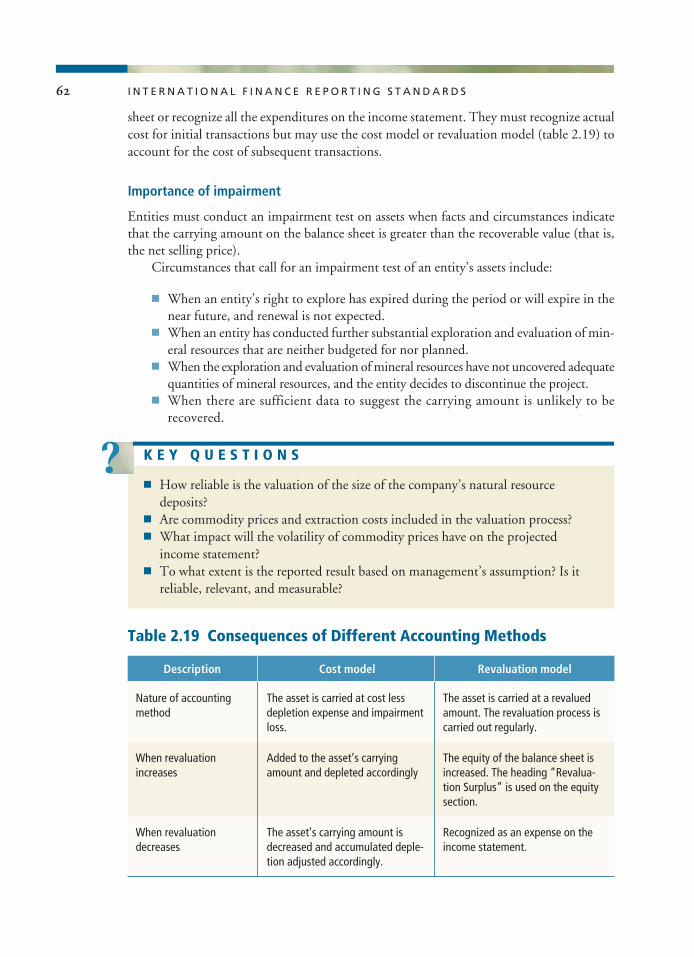
62 I N T E R N A T I O N A L F I N A N C E R E P O R T I N G S T A N D A R D S
sheet or recognize all the expenditures on the income statement. They must recognize actualcost for initial transactions but may use the cost model or revaluation model (table 2.19) toaccount for the cost of subsequent transactions.
Importance of impairment
Entities must conduct an impairment test on assets when facts and circumstances indicatethat the carrying amount on the balance sheet is greater than the recoverable value (that is,the net selling price).
Circumstances that call for an impairment test of an entity’s assets include:
� When an entity’s right to explore has expired during the period or will expire in thenear future, and renewal is not expected.
� When an entity has conducted further substantial exploration and evaluation of min-eral resources that are neither budgeted for nor planned.
� When the exploration and evaluation of mineral resources have not uncovered adequatequantities of mineral resources, and the entity decides to discontinue the project.
� When there are sufficient data to suggest the carrying amount is unlikely to berecovered.
Table 2.19 Consequences of Different Accounting Methods
Description Cost model Revaluation model
Nature of accountingmethod
When revaluationincreases
When revaluationdecreases
The asset is carried at cost lessdepletion expense and impairmentloss.
Added to the asset’s carryingamount and depleted accordingly
The asset’s carrying amount isdecreased and accumulated deple-tion adjusted accordingly.
The asset is carried at a revaluedamount. The revaluation process iscarried out regularly.
The equity of the balance sheet isincreased. The heading “Revalua-tion Surplus” is used on the equitysection.
Recognized as an expense on theincome statement.
K E Y Q U E S T I O N S
� How reliable is the valuation of the size of the company’s natural resourcedeposits?
� Are commodity prices and extraction costs included in the valuation process?� What impact will the volatility of commodity prices have on the projected
income statement?� To what extent is the reported result based on management’s assumption? Is it
reliable, relevant, and measurable?
10323-02_Ch02.qxd 2/12/07 1:28 PM Page 62
63A N A L Y S I S O F I N T E R N A T I O N A L F I N A N C I A L R E P O R T I N G S T A N D A R D S
Analyst’s Role
The analyst should:
� Determine how asset impairment is being measured. If assets are not revalued accord-ingly, this distorts the financial statements. For example, if loss due to asset impair-ment is not recognized, the asset account will be overstated and will fail to depict thefinancial position of the company.
� Note that IFRS 6 does not require or prohibit any specific accounting policies forthe recognition and measurement of exploration and evaluation assets. Therefore,companies are more flexible to choose methods that would ultimately portray abetter financial performance.
� Look at the disclosures to the notes of the financial statements because they will revealthe company’s accounting policies and indicate whether exploration and evaluationexpenditures have been recognized. Make sure that the methodology used across theperiod of operation is consistent.
� Be cognizant that the amount of proven and probable deposits of natural resourcesis a key driver of value, coupled with commodity prices and extraction costs.
Agriculture (IAS 41)
Agriculture consists of the management of biological transformation of plants and animalsinto an end product that may be consumed or processed further. Some examples are live-stock farming, forestry, annual and perennial cropping, the cultivation of orchards, planta-tion, and aquaculture.
Value of agricultural assets
Agricultural assets are valued at fair market value less point-of-sale costs (that is, commis-sions to brokers and dealers and transfer taxes) on the balance sheet. For example, a purchaseof livestock would increase the asset account. The value of agricultural assets may change inrelation to a market index and must be adjusted accordingly. These changes in value arereported in the income statements.
How is the fair value of agricultural produce measured?
One measure is the quoted market price in an active market. If market prices are not avail-able, fair value is estimated using the present value of expected net cash flows derived fromthe use of the asset. See table 2.20 for an example.
K E Y Q U E S T I O N S
� What is the market demand for the agricultural product?� If market-determined prices are not preset in the active market, what method of
valuation has been used? Is it a reliable measure?� If the company receives an unconditional government grant related to the biolog-
ical asset, how will it affect the valuation process?
10323-02_Ch02.qxd 2/12/07 1:28 PM Page 63

64 I N T E R N A T I O N A L F I N A N C E R E P O R T I N G S T A N D A R D S
Analyst’s Role
The analyst should:
� Note how fair value is measured. If reliable market-based prices are not available,evaluate the method used. For example, in calculating the present value of expectednet cash flows, consider the validity of the discount rate that is used.
� Scrutinize the notes to the financial statements, especially the financial risk manage-ment strategies. Agricultural product prices are volatile; ultimately, this affects thecompany’s operation.
� When market-determined prices or values are not available, derive the value by dis-counting the expected net cash flows to present value.
Disclosures in the Financial Statements of Banks and Similar Financial Institutions (IAS 30)
IAS 30 covers the standards of disclosures in the financial statements of banks and similarfinancial institutions. However, effective in 2007, IAS 30 will be superseded by IFRS 7.IAS 30 provides comprehensive disclosures to help users better understand the financialposition and performance of banks.
The following are some of the required presentation and disclosures (see chapter 3,part 2 for an example).
Balance sheet
� Group assets and liabilities by nature� Accounts in terms of liquidity sequence� Loan reserves� Fair value of financial securities.
Income statements
� Group income and expenses by nature (for examples, see chapter 3, part 2).
Table 2.20 Measuring the Fair Value of Livestock
Date Value Effect on financial statements
January 1
March 31
Purchase of livestock at marketprice, $500,000 (200 head ×$2,500 per cow) plus commissioncost of $10,000
Fair value increases to $3,000 perhead in accordance with a quotedmarket price.
The asset account (Dairy Livestock)increases by $490,000 ($500,000 −$10,000) on the balance sheet.
For the same quantity of live-stock, a gain of $100,000 (200 ×[$3,000 − $2,500]) is recorded inthe income statement.
10323-02_Ch02.qxd 2/12/07 1:28 PM Page 64

65A N A L Y S I S O F I N T E R N A T I O N A L F I N A N C I A L R E P O R T I N G S T A N D A R D S
Notes
� Banking risks� Contingencies and commitments� Maturity groupings of assets and liabilities� Related party transactions.
Analyst’s Role
The analyst should:
� Consider transparency. Because banks and other financial institutions play a keyrole in the financial cycle of the global market, their operational transparency isvital to the market participant’s trust. The analyst is relied on to relate concreteinformation about current performance, risks, and growth potential of the bank-ing institutions.
� Study annual reports. They disclose off-balance-sheet transactions such as commit-ments and contingencies, which should be scrutinized because they affect the futurecash flow of the bank, and the valuation of the firm.
� Question the valuation of the financial assets and financial liabilities. Its figures arebased not only on market factors but also on management’s judgments or best esti-mates. Ultimately, management has the power to overestimate the value of assets andthereby deceive innocent investors.
� Assess the financial risk associated with the bank’s operation. Quantitative scrutinyis important and should cover details such as financial ratios, capital adequacy, andloan portfolio quality, coupled with the qualitative factors. Disclosures are amongthe qualitative factors that shed light on how management’s corporate governance,internal control, and information system run the operation.
Related Party Disclosures (IAS 24)
A related party is one of two entities conducting business transactions together. The primaryfeatures of this relationship are:
� Ability to control the other party� Capacity to exercise significant influence in financial and operating decisions� Joint control over the other
K E Y Q U E S T I O N S
� What degree of uncertainty is associated with valuing these assets?� Have the disclosures of contingencies and commitments, including off balance
sheet items, been fully scrutinized? These items have an adverse effect on anentity’s valuation.
10323-02_Ch02.qxd 2/12/07 1:28 PM Page 65

66 I N T E R N A T I O N A L F I N A N C E R E P O R T I N G S T A N D A R D S
� A key role in management of the other entity� Role as a close family member of key management individuals.
Figure 2.9 illustrates Company A’s function as a related party.Types of related party transactions include selling or purchasing goods and services, sell-
ing or purchasing property and other assets, leasing arrangements, and financing.
Analyst’s Role
The analyst should:
� Analyze notes to the annual report to identify the types of related transactions embed-ded in the financial statements. Pay close attention to the transactions near the report-ing periods (such as December 31). These unusual transactions could bolster earningsgreatly but also could send a negative signal to the valuation.
� Do not assume that related-party transactions are conducted at arm’s length. Someexamples are borrowing money at an unusual interest rate or purchasing or sellinggoods at an abnormally low or high price.
K E Y Q U E S T I O N S
� Are any significant related-party transactions materially relevant to the valuationof the firm?
� Will the enterprise remain viable if the related party decides to terminate theservice?
Associates Close familymembers: those
who exertsignificant influence
Venturer:The party is a joint
venture in which theentity is a venturer
Member of keymanagement
position (directorsand officers)
Company A■ Has control or is controlled■ Has significant influence
Figure 2.9 A Related Party
10323-02_Ch02.qxd 2/12/07 1:28 PM Page 66

67A N A L Y S I S O F I N T E R N A T I O N A L F I N A N C I A L R E P O R T I N G S T A N D A R D S
Interim Financial Reporting (IAS 34)
During the interim period, corporations are required to report their financial statements toregulatory agencies (in the U.S., for example, quarterly statements must be submitted to theSecurities and Exchange Commission). International Financial Reporting Standards (IFRS)do not mandate the following:
� Which companies should publish interim financial reports� Frequency of reporting� Deadline of submission.
However, IFRS encourages publicly traded companies to make the interim financial reportsavailable at least 60 days after the end of the interim period.
Contents of an interim financial report
Contents of an interim financial report include a condensed balance sheet, condensedincome statement, condensed statement of changes in equity, condensed cash flow state-ment, and explanatory notes.
Analyst’s Role
The analyst should:
� When using interim financial statements to assess an enterprise in accordance withrelative valuation methodology, make sure the basis of the amount is relevant to thecalculation. For example, if the interim financial statements are dated September 30(covering three quarters) and you want to extract the EBITDA amount using the lat-est financials, you must annualize the amount to cover four quarters.
� Use accounting policies and methods for the interim statements that were used inpreparing the annual reports.
� Note that, in general, interim statements are not audited. Some countries (for exam-ple, the U.S.) require them to be reviewed by independent auditors.
� Make sure the income tax expense is calculated using the estimated annual effectivetax rate applicable for the entire year.
K E Y Q U E S T I O N S
� Are accounting policies and methods consistent with those that will be used forthe next full financial year?
� Are revenues recognized when earned and costs recognized when incurred?� Is the tax charge calculated using the effective tax rate expected for the full year?
10323-02_Ch02.qxd 2/12/07 1:28 PM Page 67

68 I N T E R N A T I O N A L F I N A N C E R E P O R T I N G S T A N D A R D S
Small and Medium-Sized Entities
Currently, there are no specific IFRS pronouncements for small and medium-sized entities(SMEs). However, IASB is keenly aware that SMEs are in dire need of their own customizedaccounting standards.
With IAS 8 (Accounting Policies) as a guide, an entity is expected to develop and applyaccounting policies that are both relevant and reliable. It would not be prudent to apply IFRSin full to SMEs’ financial reporting because of the smaller scale of their operations and,hence, simpler accounting needs. Forcing SMEs to use comprehensive and complex IFRSwould neither be relevant nor ensure reliability.
On a global level, however, IFRS could be used to meet the varied needs of market par-ticipants, for reliable financial information, to assist in cross-border lending, and to stream-line the preparation of financial statements. Indeed, IASB’s customized standards for SMEswould reassure global stakeholders.
For the time being, SMEs could fall back on IFRS concepts and apply them accordingly,given that the financial statements would not be extensive. Obviously, the account categories(chart of accounts) and disclosures would be more limited than for larger corporations.
10323-02_Ch02.qxd 2/12/07 1:28 PM Page 68

In this chapter, the following industries will be highlighted through the presentation ofillustrative financial statements:
� General manufacturing� Banking� Small and medium-sized entities (SMEs)
Part I. General Manufacturing and Commercial Enterprises
This section provides a full set of illustrative financial statements of general manufacturingand commercial enterprises, prepared in accordance with the International Financial Report-ing Standards (IFRS) and US Generally Accepted Accounting Principles (GAAP). They arealso presumed to have been audited in compliance with the International Standards onAuditing (ISA) and the Generally Accepted Auditing Standards (GAAS).
IFC requires that all financial statements submitted to the corporation from client com-panies to be prepared and audited in accordance with IFRS and ISA. However, IFC may acceptthe client’s financial statements prepared on the basis of other national GAAPs (e.g. US GAAP)only if agreed upon in the legal contract audited by a reputable local accounting firm and inter-national firm.
The formats of the illustrative financial statements are tailored to the needs of IFC in orderto facilitate the financial data transfer into our financial analyses applications (e.g. MoodysFinancial Analyst) but they do not deviate from the requirements of the major accounting stan-dards. All IFC clients are to use this formats as applicable in providing their interim and year-end financial statements to IFC.
The illustrative statements have been designed to create a realistic set of the finan-cial statements for a corporate entity. Not all possible transactions have been included onthe statements, as some items may be particular to each entity depending on the nature ofthe business and the industry sector. A company and its auditors may include additionalinformation deemed important to the potential readers of the financial statements. Addi-tional disclosures may also be required by IFC as part of the contractual agreement.
3
Illustrative Set of Financial Statements
C H A P T E R
69
10323-03_Ch03.qxd 2/12/07 1:28 PM Page 69

70 I N T E R N A T I O N A L F I N A N C E R E P O R T I N G S T A N D A R D S70 I N T E R N A T I O N A L F I N A N C E R E P O R T I N G S T A N D A R D S
Exhibit 1. Consolidated Balance Sheet (IFRS)IBI International Holding Company
For Fiscal Ending December 31, XXXX($-in thousands)
As of 31 December
Description Note 2005 2004
ASSETS
Non-current assetsConstruction in Progress . . . . . . . . . . . . . . . . . . . . . . . . . . . . — —Land and Buildings . . . . . . . . . . . . . . . . . . . . . . . . . . . . . . . . 3 95,129 39,330Leasehold Improvements . . . . . . . . . . . . . . . . . . . . . . . . . . . . — —Plant & Equipment (including machinery) . . . . . . . . . . . . . . . 3 58,268 66,903Furniture & Fixtures . . . . . . . . . . . . . . . . . . . . . . . . . . . . . . . . 3 26,927 20,026Vehicles & Transport Equipment . . . . . . . . . . . . . . . . . . . . . . — —Other Fixed Assets . . . . . . . . . . . . . . . . . . . . . . . . . . . . . . . . . — —
Gross fixed assets . . . . . . . . . . . . . . . . . . . . . . . . . . . . . . . . 3 180,324 126,259Accumulated Depreciation & Impairment (–) . . . . . . . . . . . . . (24,983) (27,589)
Net fixed assets . . . . . . . . . . . . . . . . . . . . . . . . . . . . . . . . . . 155,341 98,670Goodwill . . . . . . . . . . . . . . . . . . . . . . . . . . . . . . . . . . . . . . . . 4 15,992 12,000Accumulated Goodwill Impairment (–) . . . . . . . . . . . . . . . . . — —Trademarks and Licenses . . . . . . . . . . . . . . . . . . . . . . . . . . . . 4 14,480 7,710Other Intangible Assets . . . . . . . . . . . . . . . . . . . . . . . . . . . . . 4 1,800 1,300Accumulated Amortization & Impairment (–) . . . . . . . . . . . . 4 (6,850) (1,410)
Net intangibles . . . . . . . . . . . . . . . . . . . . . . . . . . . . . . . . . . 25,422 19,600Investment Property (Net) . . . . . . . . . . . . . . . . . . . . . . . . . . . — —Investments in Associates . . . . . . . . . . . . . . . . . . . . . . . . . . . 5 13,373 13,244Investments in JVs & Partnerships . . . . . . . . . . . . . . . . . . . . . — —Available-for-Sale Financial Assets . . . . . . . . . . . . . . . . . . . . 6 17,420 14,910Due from Related Parties (Net) . . . . . . . . . . . . . . . . . . . . . . . — —Loans to Related Parties (LTP) . . . . . . . . . . . . . . . . . . . . . . . . — —Due from Officer/Shareholder—LTP . . . . . . . . . . . . . . . . . . . . — —Securities & Other Fincl Assets . . . . . . . . . . . . . . . . . . . . . . . . — —Derivatives & Hedging Instruments . . . . . . . . . . . . . . . . . . . . 7 395 245Retirement Plan Actuarial Surplus . . . . . . . . . . . . . . . . . . . . . — —Other Non-Current Assets . . . . . . . . . . . . . . . . . . . . . . . . . . . — —Deferred Income Tax Assets . . . . . . . . . . . . . . . . . . . . . . . . . . 16 3,319 3,110Trade and Other Receivables (Net)—LTP . . . . . . . . . . . . . . . . 8 2,322 1,352Prepayments and Other Accrued Assets—LTP . . . . . . . . . . . . — —Restricted Cash . . . . . . . . . . . . . . . . . . . . . . . . . . . . . . . . . . . — —
Total Investment and other non-current assets . . . . . . . 36,829 32,861
Total non-current assets . . . . . . . . . . . . . . . . . . . . . . . . . . 217,592 151,131
10323-03_Ch03.qxd 2/12/07 1:28 PM Page 70

71I L L U S T R A T I V E S E T O F F I N A N C I A L S T A T E M E N T S 71I L L U S T R A T I V E S E T O F F I N A N C I A L S T A T E M E N T S
Exhibit 1. Consolidated Balance Sheet (IFRS) (Continued )
As of 31 December
Description Note 2005 2004
Current assetsOperating Lease Receivables . . . . . . . . . . . . . . . . . . . . . . . . . — —Inventories . . . . . . . . . . . . . . . . . . . . . . . . . . . . . . . . . . . . . . . 9 24,700 17,740Due from Associates . . . . . . . . . . . . . . . . . . . . . . . . . . . . . . . — —Due from JVs & Partnerships . . . . . . . . . . . . . . . . . . . . . . . . . — —Due from Related Parties (Net)—CP . . . . . . . . . . . . . . . . . . . 8 400 82Due from Officer/Shareholder—CP . . . . . . . . . . . . . . . . . . . . — —Securities & Other Financial Assets . . . . . . . . . . . . . . . . . . . . — —Available-for-Sale Financial Assets . . . . . . . . . . . . . . . . . . . . 6 1,950 —Derivatives & Hedging Instruments—CP . . . . . . . . . . . . . . . . 7 1,069 951Other Financial Assets at Fair Value Thru P&L . . . . . . . . . . . . 10 11,820 7,972Current Tax Receivables . . . . . . . . . . . . . . . . . . . . . . . . . . . . . — —Prepayments and Accrued Assets . . . . . . . . . . . . . . . . . . . . . 8 1,300 1,146Other Current Assets . . . . . . . . . . . . . . . . . . . . . . . . . . . . . . . — —Trade Receivables (Gross) . . . . . . . . . . . . . . . . . . . . . . . . . . . 8 18,174 16,944Allowance for Doubtful Accounts (-) . . . . . . . . . . . . . . . . . . . 8 (109) (70)Other Receivables (Net)—CP . . . . . . . . . . . . . . . . . . . . . . . . . — —Cash and Cash Equivalents . . . . . . . . . . . . . . . . . . . . . . . . . . 11 22,228 36,212
Total current assets . . . . . . . . . . . . . . . . . . . . . . . . . . . . . . 81,532 80,977
Total assets . . . . . . . . . . . . . . . . . . . . . . . . . . . . . . . . . . . . . 299,124 232,108
Equity & reservesShare Capital—Common . . . . . . . . . . . . . . . . . . . . . . . . . . . . 12 25,300 21,000Share Capital—Preferred . . . . . . . . . . . . . . . . . . . . . . . . . . . .Share Premium . . . . . . . . . . . . . . . . . . . . . . . . . . . . . . . . . . . 12 18,656 11,316Reserves—Capital/Restricted . . . . . . . . . . . . . . . . . . . . . . . .
Permanent equity . . . . . . . . . . . . . . . . . . . . . . . . . . . . . . . . 43,956 32,316Reserves—Revaluation . . . . . . . . . . . . . . . . . . . . . . . . . . . . . 13 1,689 1,774Reserves—Hedging . . . . . . . . . . . . . . . . . . . . . . . . . . . . . . . . 13 126 62Other Reserves . . . . . . . . . . . . . . . . . . . . . . . . . . . . . . . . . . . . 13 1,794 1,402Retained Earnings . . . . . . . . . . . . . . . . . . . . . . . . . . . . . . . . . 77,297 57,271Treasury Shares (-) . . . . . . . . . . . . . . . . . . . . . . . . . . . . . . . . . 12 (2,564) —Foreign Currency Translation—Equity . . . . . . . . . . . . . . . . . . 13 5,707 3,787Subordinated Debt—Equity . . . . . . . . . . . . . . . . . . . . . . . . . . 13 5,433 —Other Equity . . . . . . . . . . . . . . . . . . . . . . . . . . . . . . . . . . . . . . — —Accumulated Other Equity Reserve Income . . . . . . . . . . . . . . — —
Equity & reserves . . . . . . . . . . . . . . . . . . . . . . . . . . . . . . . . 89,482 64,296Minority Interests—Equity . . . . . . . . . . . . . . . . . . . . . . . . . . . 7,188 1,766
Total equity & reserves . . . . . . . . . . . . . . . . . . . . . . . . . . . 140,626 98,378
10323-03_Ch03.qxd 2/12/07 1:28 PM Page 71
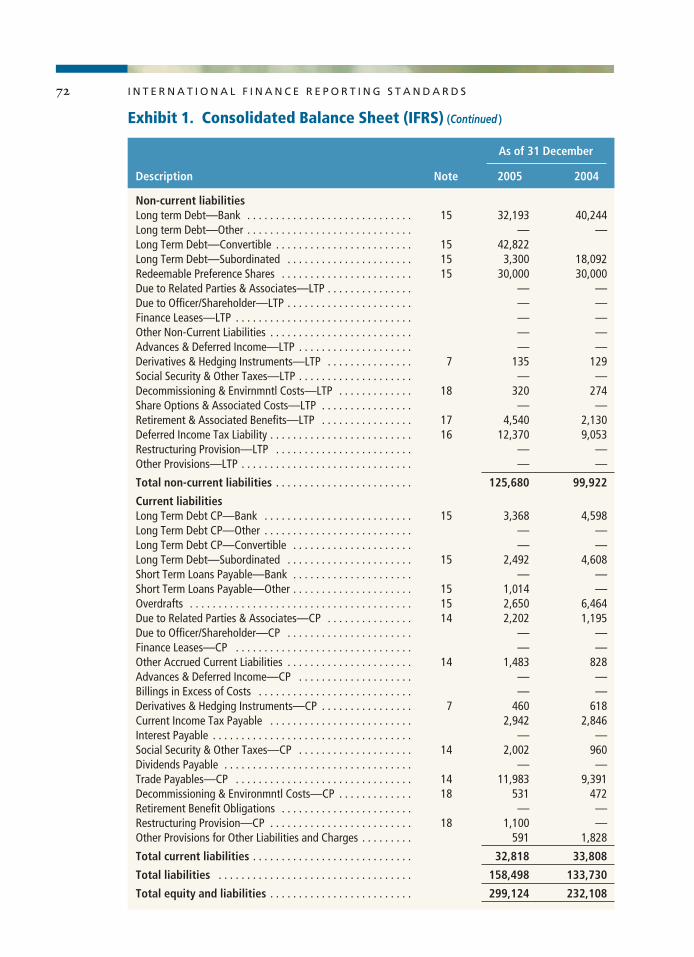
72 I N T E R N A T I O N A L F I N A N C E R E P O R T I N G S T A N D A R D S
Exhibit 1. Consolidated Balance Sheet (IFRS) (Continued )
As of 31 December
Description Note 2005 2004
Non-current liabilitiesLong term Debt—Bank . . . . . . . . . . . . . . . . . . . . . . . . . . . . . 15 32,193 40,244Long term Debt—Other . . . . . . . . . . . . . . . . . . . . . . . . . . . . . — —Long Term Debt—Convertible . . . . . . . . . . . . . . . . . . . . . . . . 15 42,822Long Term Debt—Subordinated . . . . . . . . . . . . . . . . . . . . . . 15 3,300 18,092Redeemable Preference Shares . . . . . . . . . . . . . . . . . . . . . . . 15 30,000 30,000Due to Related Parties & Associates—LTP . . . . . . . . . . . . . . . — —Due to Officer/Shareholder—LTP . . . . . . . . . . . . . . . . . . . . . . — —Finance Leases—LTP . . . . . . . . . . . . . . . . . . . . . . . . . . . . . . . — —Other Non-Current Liabilities . . . . . . . . . . . . . . . . . . . . . . . . . — —Advances & Deferred Income—LTP . . . . . . . . . . . . . . . . . . . . — —Derivatives & Hedging Instruments—LTP . . . . . . . . . . . . . . . 7 135 129Social Security & Other Taxes—LTP . . . . . . . . . . . . . . . . . . . . — —Decommissioning & Envirnmntl Costs—LTP . . . . . . . . . . . . . 18 320 274Share Options & Associated Costs—LTP . . . . . . . . . . . . . . . . — —Retirement & Associated Benefits—LTP . . . . . . . . . . . . . . . . 17 4,540 2,130Deferred Income Tax Liability . . . . . . . . . . . . . . . . . . . . . . . . . 16 12,370 9,053Restructuring Provision—LTP . . . . . . . . . . . . . . . . . . . . . . . . — —Other Provisions—LTP . . . . . . . . . . . . . . . . . . . . . . . . . . . . . . — —
Total non-current liabilities . . . . . . . . . . . . . . . . . . . . . . . . 125,680 99,922
Current liabilitiesLong Term Debt CP—Bank . . . . . . . . . . . . . . . . . . . . . . . . . . 15 3,368 4,598Long Term Debt CP—Other . . . . . . . . . . . . . . . . . . . . . . . . . . — —Long Term Debt CP—Convertible . . . . . . . . . . . . . . . . . . . . . — —Long Term Debt—Subordinated . . . . . . . . . . . . . . . . . . . . . . 15 2,492 4,608Short Term Loans Payable—Bank . . . . . . . . . . . . . . . . . . . . . — —Short Term Loans Payable—Other . . . . . . . . . . . . . . . . . . . . . 15 1,014 —Overdrafts . . . . . . . . . . . . . . . . . . . . . . . . . . . . . . . . . . . . . . . 15 2,650 6,464Due to Related Parties & Associates—CP . . . . . . . . . . . . . . . 14 2,202 1,195Due to Officer/Shareholder—CP . . . . . . . . . . . . . . . . . . . . . . — —Finance Leases—CP . . . . . . . . . . . . . . . . . . . . . . . . . . . . . . . — —Other Accrued Current Liabilities . . . . . . . . . . . . . . . . . . . . . . 14 1,483 828Advances & Deferred Income—CP . . . . . . . . . . . . . . . . . . . . — —Billings in Excess of Costs . . . . . . . . . . . . . . . . . . . . . . . . . . . — —Derivatives & Hedging Instruments—CP . . . . . . . . . . . . . . . . 7 460 618Current Income Tax Payable . . . . . . . . . . . . . . . . . . . . . . . . . 2,942 2,846Interest Payable . . . . . . . . . . . . . . . . . . . . . . . . . . . . . . . . . . . — —Social Security & Other Taxes—CP . . . . . . . . . . . . . . . . . . . . 14 2,002 960Dividends Payable . . . . . . . . . . . . . . . . . . . . . . . . . . . . . . . . . — —Trade Payables—CP . . . . . . . . . . . . . . . . . . . . . . . . . . . . . . . 14 11,983 9,391Decommissioning & Environmntl Costs—CP . . . . . . . . . . . . . 18 531 472Retirement Benefit Obligations . . . . . . . . . . . . . . . . . . . . . . . — —Restructuring Provision—CP . . . . . . . . . . . . . . . . . . . . . . . . . 18 1,100 —Other Provisions for Other Liabilities and Charges . . . . . . . . . 591 1,828
Total current liabilities . . . . . . . . . . . . . . . . . . . . . . . . . . . . 32,818 33,808
Total liabilities . . . . . . . . . . . . . . . . . . . . . . . . . . . . . . . . . . 158,498 133,730
Total equity and liabilities . . . . . . . . . . . . . . . . . . . . . . . . . 299,124 232,108
10323-03_Ch03.qxd 2/12/07 1:28 PM Page 72

73I L L U S T R A T I V E S E T O F F I N A N C I A L S T A T E M E N T S
Exhibit 2. Consolidated Income Statement (IFRS)($-in thousands)
As of 31 December
Description Note 2005 2004
Sales/Revenues . . . . . . . . . . . . . . . . . . . . . . . . . . . . . . . . . . . 211,034 112,360Cost of Sales . . . . . . . . . . . . . . . . . . . . . . . . . . . . . . . . . . . . . (71,538) (48,982)Changes in Inventories & Work-In-Process . . . . . . . . . . . . . . (5,828) 2,300Expenses/Own Work Capitalized . . . . . . . . . . . . . . . . . . . . . . — —
Total cost of sales . . . . . . . . . . . . . . . . . . . . . . . . . . . . . . . . (77,366) (46,682)
Gross profit . . . . . . . . . . . . . . . . . . . . . . . . . . . . . . . . . . . . . 133,668 65,678
Rents, Royalties and Other . . . . . . . . . . . . . . . . . . . . . . . . . . . 19 1,873 2,442Grants & Subsidies . . . . . . . . . . . . . . . . . . . . . . . . . . . . . . . . . — —Selling & Marketing Costs . . . . . . . . . . . . . . . . . . . . . . . . . . . (46,690) (20,648)General & Administrative Expenses . . . . . . . . . . . . . . . . . . . . (28,786) (10,434)Personnel & Benefit Expenses . . . . . . . . . . . . . . . . . . . . . . . . — —Provision for Retirement/Benefit Costs . . . . . . . . . . . . . . . . . — —Share Options & Associated Costs . . . . . . . . . . . . . . . . . . . . . — —Officers’ Compensation . . . . . . . . . . . . . . . . . . . . . . . . . . . . . — —Operating Lease Expenses . . . . . . . . . . . . . . . . . . . . . . . . . . . — —Research and Development . . . . . . . . . . . . . . . . . . . . . . . . . . — —Restructuring Costs & Provisions . . . . . . . . . . . . . . . . . . . . . . — —Bad Debt Expense . . . . . . . . . . . . . . . . . . . . . . . . . . . . . . . . . — —Other Operating Expenses . . . . . . . . . . . . . . . . . . . . . . . . . . . — —Other Non-Cash Oper Expense/Provisions . . . . . . . . . . . . . . . — —
Total operating expenses (excl.deprec. and amort.) . . . (73,603) (28,640)
Earning before interest, tax and depreciation (EBITDA) . . 60,065 37,038Depreciation & Impairment—Tangibles . . . . . . . . . . . . . . . . . — —Amortization & Impairment—Intangibles . . . . . . . . . . . . . . . (800) (565)Impairment—Goodwill . . . . . . . . . . . . . . . . . . . . . . . . . . . . . (4,650) —Capitalized Costs (Excl. Interest) . . . . . . . . . . . . . . . . . . . . . . — —
Earning before interest and tax (EBIT) . . . . . . . . . . . . . . . 54,615 36,473Interest Expense (–) . . . . . . . . . . . . . . . . . . . . . . . . . . . . . . . . 20 (7,803) (7,234)Capitalized Interest Expense . . . . . . . . . . . . . . . . . . . . . . . . . — —Interest Income . . . . . . . . . . . . . . . . . . . . . . . . . . . . . . . . . . . — —Net Foreign Exchange Transactions Gains/(Losses) . . . . . . . . 20 2,594 (1,995)Fair Value Gains/(Losses) on Financial Assets . . . . . . . . . . . . 20 86 119Dividend/Other Income from Financial Assets . . . . . . . . . . . . 20 (1,950) (1,950)Other Gains(Losses) on Financial Assets . . . . . . . . . . . . . . . . — —Adjustments on Securitization Programs . . . . . . . . . . . . . . . . — —
Net interest and other financial costs (income) expenses . . . . . . . . . . . . . . . . . . . . . . . . . . . . . (7,073) (11,060)
Income(Loss) from Associated Entities . . . . . . . . . . . . . . . . . . 5 (174) 145Income(Loss) from JVs & Partnerships . . . . . . . . . . . . . . . . . . — —Income(Loss) from Other Related Parties . . . . . . . . . . . . . . . . — —Gain(Loss) on Disposal of Fixed Assets . . . . . . . . . . . . . . . . . — —Gain(Loss) on Investment Properties . . . . . . . . . . . . . . . . . . . — —
10323-03_Ch03.qxd 2/12/07 1:28 PM Page 73

74 I N T E R N A T I O N A L F I N A N C E R E P O R T I N G S T A N D A R D S
Exhibit 2. Consolidated Income Statement (IFRS) (Continued )
As of 31 December
Description Note 2005 2004
Net interest and other financial costs (income) expenses (continued )
Gain(Loss) on Disp of Discontinued Operations . . . . . . . . . . . — —Exchange Gain(Loss)—Sale of Business . . . . . . . . . . . . . . . . — —Other Non-Operating Income(Expense) . . . . . . . . . . . . . . . . . — —Other Non-Cash Non-Oper Income(Expense) . . . . . . . . . . . . . — —
Other income(expense) . . . . . . . . . . . . . . . . . . . . . . . . . . . (174) 145
Profit(loss) before tax . . . . . . . . . . . . . . . . . . . . . . . . . . . . 47,368 25,558Current Income Taxes . . . . . . . . . . . . . . . . . . . . . . . . . . . . . . 21 14,413 6,230Deferred Income Taxes . . . . . . . . . . . . . . . . . . . . . . . . . . . . . 21 379 2,635Tax Adjustment—Prior Year
Total income tax . . . . . . . . . . . . . . . . . . . . . . . . . . . . . . . . . 14,792 8,865
Profit before extraordinary income . . . . . . . . . . . . . . . . . 32,576 16,693
Extraordinary Gain(Loss)—After Tax . . . . . . . . . . . . . . . . . . . — —Other After Tax Income(Expense) . . . . . . . . . . . . . . . . . . . . . — —Other After Tax Non-Cash Income(Expense) . . . . . . . . . . . . . — —
Net profit(loss) . . . . . . . . . . . . . . . . . . . . . . . . . . . . . . . . . . 32,576 16,693
Attributable to:Equity Holders of the Company . . . . . . . . . . . . . . . . . . . . . . . 31,376 37,635Minority Interests . . . . . . . . . . . . . . . . . . . . . . . . . . . . . . . . . . 1,200 1,201
Total profit . . . . . . . . . . . . . . . . . . . . . . . . . . . . . . . . . . . . . . 32,576 38,836
Earnings per share for profit attributable to the equity holders of the Company during the year (expressed in $ per share)— basic . . . . . . . . . . . . . . . . . . . . . . . . . . . . . . . . . . . . . . Note 26 1.28 0.77— diluted . . . . . . . . . . . . . . . . . . . . . . . . . . . . . . . . . . . . . Note 26 1.16 0.73
10323-03_Ch03.qxd 2/12/07 1:28 PM Page 74

Exhibit 3. Consolidated Statement of Changes in Equity (IFRS)($-in thousands)
Attributable to equityholders of the company
Share Other Retained Minority TotalDescription Note capital reserves earnings interest equity
Balance at 1 January 2004 . . . . . . . . . . . . . 30,424 6,364 57,083 1,500 95,371
Fair value gains and (losses), net of tax:● land and buildings . . . . . . . . . . . . . . . — 759 — — 759● available-for-sale financial assets . . . — 68 — — 68
Depreciation transfer, land and buildings . . — (87) 87 — —Cash flow hedges, net of tax . . . . . . . . . . . — (3) — — (3)Net investment hedge . . . . . . . . . . . . . . . . — 40 — — 40Currency translation differences . . . . . . . . . — (116) — (40) (156)Net income/(expense) recognised
directly in equity . . . . . . . . . . . . . . . . . . . — 661 87 (40) 708Profit for the year . . . . . . . . . . . . . . . . . . . . — — 15,837 856 16,693
Total recognised income for 2004 . . . . . — 661 15,924 816 17,401Employees share option scheme:
● value of employee services . . . . . . . . . 822 — — — 822● proceeds from shares issued . . . . . . . 1,070 — — — 1,070
Dividend relating to 2003 . . . . . . . . . . . . . . — — (15,736) (550) (16,286)
Sub-total . . . . . . . . . . . . . . . . . . . . . . . . . . . 1,892 — (15,736) (550) (14,394)
Balance at 31 December 2004 . . . . . . . . . . 32,316 7,025 57,271 1,766 98,378
Balance at 1 January 2005 . . . . . . . . . . . . . 32,316 7,025 57,271 1,766 98,378
Fair value gains and (losses), net of tax:● available-for-sale financial assets . . . 13 — 406 — — 406
Depreciation transfer, land and buildings . . 13 — (100) 100 — —Cash flow hedges, net of tax . . . . . . . . . . . 13 — 64 — — 64Net investment hedge . . . . . . . . . . . . . . . . 13 — (45) — — (45)Currency translation differences . . . . . . . . . 13 — 1,966 — 252 2,218
Net income recognised directly in equity . . — 2,291 100 252 2,643Profit for the year . . . . . . . . . . . . . . . . . . . . — — 30,028 2,548 32,576
Total recognised income for 2005 . . . . . — 2,291 30,128 2,800 35,219
Employee share option scheme:● value of employee services . . . . . . . . . 12 690 — — — 690● proceeds from shares issued . . . . . . . 12 950 — — — 950
Issue of share capital—business combination . . . . . . . . . . . . . . . 12 10,000 — — — 10,000
Purchase of treasury shares . . . . . . . . . . . . 12 (2,564) — — — (2,564)Convertible bond—equity component . . . . 13 — 5,433 — — 5,433Dividend relating to 2004 . . . . . . . . . . . . . . — — (10,102) (1,920) (12,022)Minority interest arising on business
combinations . . . . . . . . . . . . . . . . . . . . . — — — 4,542 4,542
9,076 5,433 (10,102) 2,622 7,029
Balance at 31 December 2005 . . . . . . . . 41,392 14,749 77,297 7,188 140,626
75I L L U S T R A T I V E S E T O F F I N A N C I A L S T A T E M E N T S
10323-03_Ch03.qxd 2/12/07 1:28 PM Page 75

76 I N T E R N A T I O N A L F I N A N C E R E P O R T I N G S T A N D A R D S
Exhibit 4. Cash Flow Statements (IFRS-Indirect)($-in thousands)
As of 31 December
Description Note 2005 2004
OPERATING ACTIVITIESNet profit . . . . . . . . . . . . . . . . . . . . . . . . . . . . . . . . . . . . . . . 32,576 16,693
Depreciation and Impairment Charge . . . . . . . . . . . . . . . . . . 17,754 9,662Amortization Expense . . . . . . . . . . . . . . . . . . . . . . . . . . . . . . 800 565Goodwill Impairment Charge . . . . . . . . . . . . . . . . . . . . . . . . . 4,650 —Income Tax Paid . . . . . . . . . . . . . . . . . . . . . . . . . . . . . . . . . . . 14,792 8,865(Profit)/Loss on Disposal of Fixed Assets . . . . . . . . . . . . . . . . (17) 8(Profit)/Loss on Disposal of Financial Assets . . . . . . . . . . . . . — —Net Movements in Provisions for Liabilities and Charges . . . . 43 —Fair Value (FV) Gains on Derivative Financial Instruments . . . 172 207FV (Gains)/Losses on other Financial Assets at FV thru P&L . . 506 232Foreign Exchange (Gains)/Losses (non-cash) . . . . . . . . . . . . . (2,594) 1,955Investment Income . . . . . . . . . . . . . . . . . . . . . . . . . . . . . . . . — —Associates—(Gains)/Losses Share (Net of Dividends) . . . . . . 174 (145)Interest Income Received (Operating) . . . . . . . . . . . . . . . . . . (1,180) (1,120)Interest Expense Paid (Operating) . . . . . . . . . . . . . . . . . . . . . 9,753 9,184Dividend Income . . . . . . . . . . . . . . . . . . . . . . . . . . . . . . . . . . (2,230) (1,400)(Gains)/Losses from Extraordinary Items . . . . . . . . . . . . . . . . — —Minority Interests . . . . . . . . . . . . . . . . . . . . . . . . . . . . . . . . . . — —
Changes in working capital . . . . . . . . . . . . . . . . . . . . . . . . — —Chg in Provisions . . . . . . . . . . . . . . . . . . . . . . . . . . . . . . . . . . — —Chg in Post Employ Benefit Obligtns . . . . . . . . . . . . . . . . . . . — —Chg in Trade Receivables . . . . . . . . . . . . . . . . . . . . . . . . . . . . (1,518) (2,966)Chg in Other Receivables . . . . . . . . . . . . . . . . . . . . . . . . . . . . — —Chg in Inventories . . . . . . . . . . . . . . . . . . . . . . . . . . . . . . . . . (6,489) (962)Chg in Prepayments . . . . . . . . . . . . . . . . . . . . . . . . . . . . . . . . — —Chg in Other Current Assets . . . . . . . . . . . . . . . . . . . . . . . . . . — —Chg in Trade Payables and Other Payables . . . . . . . . . . . . . . (9,416) 565Chg in Other Current LiabilitiesChg in Other Financial Instruments Thru P&L . . . . . . . . . . . . . (4,354) (858)Chg in Other Working Capital Items . . . . . . . . . . . . . . . . . . . — —Chg in Income Taxes Payable . . . . . . . . . . . . . . . . . . . . . . . . . (14,517) (10,974)Chg in Deferred Taxes . . . . . . . . . . . . . . . . . . . . . . . . . . . . . . — —Chg in Interest Payable . . . . . . . . . . . . . . . . . . . . . . . . . . . . . (9,170) (9,184)Dividends Received (Operating) . . . . . . . . . . . . . . . . . . . . . . . — —Dividends Paid (Operating) . . . . . . . . . . . . . . . . . . . . . . . . . . — —Other Non-Cash Adjustments (Oper) . . . . . . . . . . . . . . . . . . . — —
Cash flows from operating activities . . . . . . . . . . . . . . . . 29,735 20,327
10323-03_Ch03.qxd 2/12/07 1:28 PM Page 76

77I L L U S T R A T I V E S E T O F F I N A N C I A L S T A T E M E N T S
Exhibit 4. Cash Flow Statements (IFRS-Indirect) (Continued )
As of 31 December
Description Note 2005 2004
INVESTING ACTIVITIESPurchase of Intangible Assets . . . . . . . . . . . . . . . . . . . . . . . . 4 (3,050) (700)Proceeds from Sale of Intangible Assets . . . . . . . . . . . . . . . . — —Purchase of Property, Plant and Equipments . . . . . . . . . . . . . 3 (9,755) (6,042)Proceeds from Sale of Property, Plant and Equipments . . . . . 22 6,354 2,979Purchase of Investment Property . . . . . . . . . . . . . . . . . . . . . . — —Proceeds from Sale of Investment Property . . . . . . . . . . . . . . — —Purchase of Financial Assets . . . . . . . . . . . . . . . . . . . . . . . . . 6 (2,781) (1,126)Proceeds from Sale of Financial Assets . . . . . . . . . . . . . . . . . — —Purchase of Other Assets . . . . . . . . . . . . . . . . . . . . . . . . . . . . — —Proceeds from Sale of Other Assets . . . . . . . . . . . . . . . . . . . . — —Investment in Associates & Affiliates . . . . . . . . . . . . . . . . . . . — —Sale of Associates & Affiliates . . . . . . . . . . . . . . . . . . . . . . . . — —Acquisition of Subsidiaries(Net of Cash Acquired) . . . . . . . . . 23 (3,900) —Proceeds from Sale of Subsidiary . . . . . . . . . . . . . . . . . . . . . . — —Payment of Finance Lease Liabilities . . . . . . . . . . . . . . . . . . . — —Interest Received (Investing) . . . . . . . . . . . . . . . . . . . . . . . . . 1,180 359Dividends Received (Investing) . . . . . . . . . . . . . . . . . . . . . . . 2,230 1,396Loans Granted to Related Parties . . . . . . . . . . . . . . . . . . . . . . 24 (1,343) (112)Loan Repayments Received from Related Parties . . . . . . . . . . 24 63 98Cash Flow from Extraordinary Items (Invest) . . . . . . . . . . . . . — —Cash Flow from Hedging on Investment Securities . . . . . . . . — —Cash Flow Other Investing Activities . . . . . . . . . . . . . . . . . . . — —
Net cash flows from investing activities . . . . . . . . . . . . . (11,002) (3,148)
FINANCING ACTIVITIESNet Proceeds-Issuance of Share Capital . . . . . . . . . . . . . . . . . 12 950 1,070Purchase/Sale of Treasury Stock . . . . . . . . . . . . . . . . . . . . . . . 12 (2,564)Proceeds from Issuance of Convertible Bonds . . . . . . . . . . . . 25 50,000Proceeds from Issuance of Redeemable Preferred Shares . . . — 30,000Proceeds from Borrowings . . . . . . . . . . . . . . . . . . . . . . . . . . . 8,500 18,000Repayments of Borrowings . . . . . . . . . . . . . . . . . . . . . . . . . . (74,302) (37,738)Change in other Current Liabilities . . . . . . . . . . . . . . . . . . . . . — —Interest Paid (Financing) . . . . . . . . . . . . . . . . . . . . . . . . . . . . — —Translation Adjustment Relating to Cash . . . . . . . . . . . . . . . . — —Cash Flows from Extraordinary Items (Fin) . . . . . . . . . . . . . . . — —Cash Flows from Hedging (Fin) . . . . . . . . . . . . . . . . . . . . . . . — —Dividends Paid to the Company’s Shareholders . . . . . . . . . . . (10,102) (15,736)Dividends Paid (Minority Shareholders) . . . . . . . . . . . . . . . . . (1,920) (550)Other Cash Flows from Financing . . . . . . . . . . . . . . . . . . . . . — —
Cash flows from financing activities . . . . . . . . . . . . . . . . (29,438) (4,954)Net (decrease)/increase in cash and bank overdrafts . . (10,705) 12,225Cash and bank overdrafts at the beginning of the year . . 29,748 17,587Net Foreign Exchange Difference . . . . . . . . . . . . . . . . . . . . . . 535 (64)
Cash and bank overdrafts at end of the year . . . . . . . . . 11 19,578 29,748
10323-03_Ch03.qxd 2/12/07 1:28 PM Page 77

78 I N T E R N A T I O N A L F I N A N C E R E P O R T I N G S T A N D A R D S
Notes to Financial Statements
Purpose of notes to the financial statements
The purpose of the notes is to provide information about:
� the basis of preparation of the financial statements and the specific accounting policies� the information required by accounting standards (IFRS) that is not presented on
the face of the balance sheet, income statement, statement of changes in equity andcash flow statement
� additional information that is not presented on the face of the balance sheet, incomestatement, statement of changes in equity and cash flow statement, but is relevant toan understanding of any of them
We suggest to disclose significant accounting policies as a separate note before theremainder of the notes. This way accounting policies are given more prominence and are notlost within the individual notes to the financial statements.
Disclosure of significant accounting policies
An entity should disclose in the summary of its significant accounting policies:
� the measurement basis (or bases) used in preparing the financial statements� the other accounting policies used that are relevant to an understanding of the finan-
cial statements� the judgments used in the process of applying the entity’s accounting policies that
have the most significant effect on the amounts recognized in the financial statements� information about the key assumptions concerning the future, and other key sources of
estimation at the balance sheet date, that have a significant risk of causing a materialadjustment to the carrying amounts of assets and liabilities within the next financial year
IFRS compliance
An entity whose financial statements comply with IFRS must make an explicit and unre-served statement of such compliance in the notes. Financial statements shall not be describedas complying with IFRS unless they comply with all the requirements of IFRS.
Basis of preparation used in preparing the financial statements
It is important for users to be informed of the measurement basis or bases used in the finan-cial statements (for example, historical cost, current cost, net realizable value, fair value orrecoverable amount) because the basis on which the financial statements are prepared signif-icantly affects their analysis. When more than one measurement basis is used in the finan-cial statements, for example when particular classes of assets are revalued, it is sufficient toprovide an indication of the categories of assets and liabilities to which each measurementbasis is applied.
10323-03_Ch03.qxd 2/12/07 1:28 PM Page 78

79I L L U S T R A T I V E S E T O F F I N A N C I A L S T A T E M E N T S
Other significant accounting policies
In deciding whether a particular accounting policy should be disclosed, management con-siders whether disclosure would assist users in understanding how transactions, other eventsand conditions are reflected in the reported financial performance and financial position.Disclosure of particular accounting policies is especially useful to users when those policiesare selected from alternatives that are allowed in Standards and Interpretations. Some Stan-dards specifically require disclosure of particular accounting policies, including choices madeby management between different policies they allow (e.g. IAS 16 requires disclosure of themeasurement bases used for classes of property, plant and equipment).
Each entity considers the nature of its operations and the policies that the users of itsfinancial statements would expect to be disclosed for that type of entity. The accounting poli-cies that an entity might consider presenting include, but are not limited to, the following:
� Revenue recognition� Consolidation principles� Business combinations� Joint ventures� Recognition and depreciation/amortization of tangible and intangible assets� Capitalization of borrowing costs and other expenditure� Employee benefit costs� Foreign currency translation� Hedging� Inflation accounting� Government grants� Impairments for tangible, intangible and financial assets� Taxes, including deferred taxes� Provisions� Definition of cash and cash equivalents� Definition of business and geographical segments and the basis for allocation of costs
between segments� Construction contracts� Investment properties� Financial instruments and investments� Financial and operating leases� Research and development costs� Inventories
Illustrative examples of accounting policies
IBI International Holding Co. is a holding company incorporated in Eastern Europe.
NOTE 1. SUMMARY OF SIGNIFICANT ACCOUNTING POLICIES
Basis of preparation
During the ordinary course of business, events occur that leads to accounting for these trans-actions. Such events maybe in the form of sale of goods or services, purchasing of equipments,
10323-03_Ch03.qxd 2/12/07 1:28 PM Page 79

80 I N T E R N A T I O N A L F I N A N C E R E P O R T I N G S T A N D A R D S
paying employees, acquiring debt financing, and issuing stocks. These events are capturedquantitatively in the financial statements. The accounting standards of capturing these trans-actions are embodied in IFRS. As a component of IFRS, each entity is required to account forthese transactions on a cost basis; subsequently, other accounts, such as derivatives, are reval-ued to reflect the fair value at each reporting/balance sheet date (i.e. December 31, XXXX).
Financial asset
The following are the relevant standards to use:
� IFRS 7 Financial Instruments: Disclosures (effective January 1, 2007)� IAS 32 Financial Instruments: Disclosure and Presentation� IAS 39 Financial Instruments: Recognition and Measurement
Financial assets are items such as common stocks, preferred shares, and debt securities.Financial assets are classified as one of the categories:
� Financial assets at fair value through profit or loss� Available-for-sale� Loans and receivables� Held-to-maturity investments
Based on management’s intention, classification of the financial asset is determined. Subse-quent to the initial recognition of most financial instruments, they are revalued using the fairvalue at the balance sheet date (i.e. December 31, XXXX). The gains and losses derived fromadjustments are reflected in the income statements.
Derivative financial instruments and hedging activities
The following are the relevant standards to use:
� IFRS 7 Financial Instruments: Disclosures (effective January 1, 2007)� IAS 32 Financial Instruments: Disclosure and Presentation� IAS 39 Financial Instruments: Recognition and Measurement
Financial derivatives are initially recognized in the balance sheet at cost and subsequentlymeasured at their fair value. The method of recognizing the resulting gain or loss dependswhether or not the derivative is designated as a hedging instrument, and the nature of theitem being hedged.
The corporation designates certain derivatives as either:
� Fair value hedge. hedges of the fair value of recognized assets or liabilities or a firmcommitment
� Cash flow hedge. hedges of a particular risk associated with a recognized asset or lia-bility or a highly probable forecast transaction
� Net investment hedge. hedges of a net investment in a foreign operation
10323-03_Ch03.qxd 2/12/07 1:28 PM Page 80
81I L L U S T R A T I V E S E T O F F I N A N C I A L S T A T E M E N T S
Certain derivative transactions, while providing effective economic hedges underthe corporation’s risk management policies, do not qualify for hedge accountingunder the specific rules in IAS 39 and therefore changes in the fair value of such non-qualifying hedge instruments are immediately recognized in the income statementunder financial items.
Property, plant and equipment
IAS 16 covers the standards for property, plant and equipment.IAS 36 covers the standards for impairment of assets.
Land and buildings comprise mainly factories, retail outlets and offices. Land and buildingsare shown at fair value, based on periodic valuations by external independent valuers, lesssubsequent depreciation for buildings. All other property, plant and equipment is stated athistorical cost less depreciation. Historical cost includes expenditure that is directly attrib-utable to the acquisition of the items.
Subsequent costs are included in the asset’s carrying amount or recognized as a separateasset, only when it is probable that future economic benefits associated with the item willflow to the Group and the cost of the item can be measured reliably. All other repairs andmaintenance are charged to the income statement during the financial period in which theyare incurred.
Land is not depreciated. Depreciation on other assets is calculated using the straight-line method to allocate their cost or revalued amounts to their residual values over their esti-mated useful lives, as follows:
� Buildings 25–40 years� Machinery 10–15 years� Vehicles 3–5 years� Furniture, fittings and equipment 3–8 years
The assets’ residual values and useful lives are reviewed and adjusted if appropriate at eachbalance sheet date. An asset’s carrying amount is written down immediately to its recover-able amount if the asset’s carrying amount is greater than its estimated recoverable amount.
Gains and losses on disposals are determined by comparing proceeds with carryingamount. These are included in the income statement. When revalued assets are sold, theamounts included in other reserves are transferred to retained earnings.
Intangible assets
IAS 38 covers the standards for intangible assets.
Intangible assets are items such as goodwill, computer software, and patents.
Computer software. Acquired computer software licenses are capitalized on the basis of thecosts incurred to acquire and bring to use the specific software. These costs are amortizedover their estimated useful lives (three to five years).
10323-03_Ch03.qxd 2/12/07 1:28 PM Page 81

82 I N T E R N A T I O N A L F I N A N C E R E P O R T I N G S T A N D A R D S
Costs associated with developing or maintaining computer software programs are recog-nized as an expense incurred. Costs that are directly associated with the production of iden-tifiable and unique software products controlled by the Group and that will probably generateeconomic benefits exceeding costs beyond one year, are recognized as intangible assets.
Goodwill. Represents the excess of the cost of an acquisition over the fair value of theGroup’s share of the net identifiable assets of the acquired subsidiary/associate at the dateof acquisition.
Inventories
IAS 2 covers the standards for inventories.
Inventories are stated at the lower of cost and net realizable value. Cost is determined usingthe first-in, first-out (FIFO) method. The cost of finished goods and work in progress com-prises design costs, raw materials, direct labor, other direct costs and related production over-heads. Net realizable value is the estimated selling price in the ordinary course of business,less applicable variable selling expenses.
Borrowings
The following are the relevant standards to use:
� IFRS 7 Financial Instruments: Disclosures (effective January 1, 2007)� IAS 32 Financial Instruments: Disclosure and Presentation� IAS 39 Financial Instruments: Recognition and Measurement� IAS 23 Borrowing Costs
Borrowings are recognized initially at fair value, net of transaction costs. Borrowings are sub-sequently stated at amortized cost; any difference between the proceeds (net of transaction)and the redemption value is recognized in the income statement over the period of the bor-rowings using the effective interest method.
Employee benefits
IAS 19 covers the standards for employee benefits.IAS 26 covers the standards for accounting and reporting by retirement benefit plans.
Pension obligations. The company has both defined benefit and defined contribution plans.A defined contribution plan is a pension plan under which the Group pays fixed contribu-tions into a separate entity. A defined benefit plan is a pension plan that is not a defined con-tribution plan. Typically, defined benefit plans define an amount of pension benefit that anemployee will receive on retirement, usually dependent on one or more factors such as age,years of service and compensation.
Other post-employment obligations. The company provides post-retirement healthcarebenefits to their retirees.
10323-03_Ch03.qxd 2/12/07 1:28 PM Page 82

83I L L U S T R A T I V E S E T O F F I N A N C I A L S T A T E M E N T S
Provisions
IAS 37 covers the standards for provisions.
Provisions for environmental restoration, restructuring costs and legal claims are recognizedwhen the company has a present legal or constructive obligation as a result of past events; itis more likely than not that an outflow of resources will be required to settle the obligation;and the amount has been reliably estimated.
Provisions are measured at the present value of the expenditures expected to be requiredto settle the obligation using a pre-tax rate that reflects current market assessments of thetime value of money and the risks specific to the obligation. The increase in the provisiondue to passage of time is recognized as interest expense.
Revenue recognition
IAS 18 covers the standards for revenue.
Revenue is recognized as follows:
� Sales of goods� Sales of services� Interest income� Dividend income
NOTE 2. FINANCIAL RISK MANAGEMENT
Financial risk factors
IAS 32 prescribes the disclosure and presentation of financial instruments.
The company’s overall risk management program focuses on the unpredictability of finan-cial markets and seeks to minimize potential adverse effects on the company’s financial per-formance. The company uses derivative financial instruments to hedge certain risk exposures.The company’s activities are exposed to a variety of financial risks: market risk (includingcurrency risk, fair value interest rate risk and price risk), credit risk, liquidity risk and cashflow interest rate risk.
Fair value estimation
IAS 39 provides a hierarchy to be used in determining the fair value for a financial instrument.
The fair value of financial instruments traded in active markets (such as trading and avail-able-for-sale securities) is based on quoted market prices at the balance sheet date. The fairvalue of financial instruments that are not traded in an active market (for example, over-the-counter derivatives) is determined by using valuation techniques. The company uses a vari-ety of methods and makes assumptions that are based on market conditions existing at eachbalance sheet date.
10323-03_Ch03.qxd 2/12/07 1:28 PM Page 83

NOTE 3. PROPERTY, PLANT AND EQUIPMENT($-in thousands)
Land & Vehicles & Furniture & Description buildings machinery fixtures Total
Year ended 31 December 2005Opening net book amount 38,694 47,800 12,176 98,670Exchange differences 1,601 1,280 342 3,223Acquisition of subsidiary 49,072 5,513 13,199 67,784Additions 7,126 427 2,202 9,755Disposals (2,000) (3,729) (608) (6,337)Depreciation charge (3,545) (4,768) (9,441) (17,754)
Closing net book amount 90,948 46,523 17,870 155,341
Revaluation 95,129 58,268 26,927 180,324Accumulated depreciation (4,181) (11,745) (9,057) (24,983)
Net book amount 90,948 46,523 17,870 155,341
If land and buildings were stated on the historical cost basis, the amounts would be as follows:
Cost 81,541Accumulated depreciation (15,512)
Net book amount 66,029
Note: The land and buildings were last revalued on 1 January 2004 by independent valuers.Valuations were made on the basis of market value.
NOTE 4. INTANGIBLE ASSETS($-in thousands)
TrademarksDescription Goodwill & licences Othera Total
Year ended 31 December 2005Opening net book amount 12,000 7,000 600 19,600Exchange differences 341 96 134 571Additions — 2,684 366 3,050Acquisition of subsidiary 3,651 4,000 — 7,651Impairment charge (4,650) — — (4,650)Amortisation charge — (680) (120) (800)
Closing net book amount 11,342 13,100 980 25,422
Cost 15,992 14,480 1,800 32,272Accumulated amortisation and impairment (4,650) (1,380) (820) (6,850)
Net book amount 11,342 13,100 980 25,422
a. Other intangibles include internally generated capitalised software development costs and other costs.
84 I N T E R N A T I O N A L F I N A N C E R E P O R T I N G S T A N D A R D S
10323-03_Ch03.qxd 2/12/07 1:28 PM Page 84

NOTE 5. INVESTMENTS IN ASSOCIATES($-in thousands)
Description 2005
Beginning of the year 13,244Acquisition of subsidiary 389Share of (loss)/profita (174)Exchange differences (74)Other equity movements (12)
End of the year 13,373
a. The company’s share of the results of its principal associates, all of which are unlisted, and its share of the assets(including goodwill and liabilities) are as follows:
Country of Profit/ % Name incorporation Assets Liabilities Revenues (Loss) held
Alfa Limited Cyprus 32,381 25,174 31,123 200 25Beta SA Greece 12,115 5,949 9,001 15 30Delta Limited UK 15,278 15,278 25,741 (389) 42
59,774 46,401 65,865 (174)
NOTE 6. AVAILABLE-FOR-SALE FINANCIAL ASSETS($-in thousands)
Description 2005
Beginning of the year 14,910Exchange differences 646Acquisition of subsidiary 473Additions 2,781Revaluation surplus transfer to equity 560
End of the year 19,370Less: non-current portion (17,420)
Current portion 1,950
Available-for-sale financial assets include the following:
Listed securities:● Equity securities—eurozone countries 8,335● Equity securities—US 5,850● Equity securities—UK 4,550● Debentures with fixed interest of 6.5% and maturity date of 27 August 2010 210● Non-cumulative 9.0% non-redeemable preference shares 78
Unlisted securities:● Debt securities traded on inactive markets with fixed interest ranging from
6.3% to 6.5% and maturity dates between July 2008 and May 2010 347
19,370
85I L L U S T R A T I V E S E T O F F I N A N C I A L S T A T E M E N T S
10323-03_Ch03.qxd 2/12/07 1:28 PM Page 85

86 I N T E R N A T I O N A L F I N A N C E R E P O R T I N G S T A N D A R D S
NOTE 7. DERIVATIVE FINANCIAL INSTRUMENTS($-in thousands)
2005
Description Assets Liabilities
Interest rate swaps—cash flow hedges 351 110Interest rate swaps—fair value hedges 57 37Forward foreign exchange contracts—cash flow hedges 695 180Forward foreign exchange contracts—held-for-trading 361 268
Total 1,464 595
Less non-current portion:Interest rate swaps—cash flow hedges 345 100Interest rate swaps—fair value hedges 50 35
395 135
Current portion 1,069 460
Trading derivatives are classified as a current asset or liability. The full fair value of a hedging derivative isclassified as a non-current asset or liability if the remaining maturity of the hedged item is more than12 months and, as a current asset or liability, if the maturity of the hedged them is less than 12 months.
NOTE 8. TRADE AND OTHER RECEIVABLES($-in thousands)
Description 2005
Trade receivables 18,174Less: provision for impairment of receivables (109)
Trade receivables—net 18,065Prepayments 1,300Receivables from related parties 54Loans to related parties 2,668
22,087Less non-current portion: loans to related parties (2,322)
Current portion 19,765
The fair values of trade and other receivables are as follows:● Trade receivables 18,065● Prepayments 1,300● Receivables from related parties 54● Loans to related parties 2,722
22,141
10323-03_Ch03.qxd 2/12/07 1:28 PM Page 86
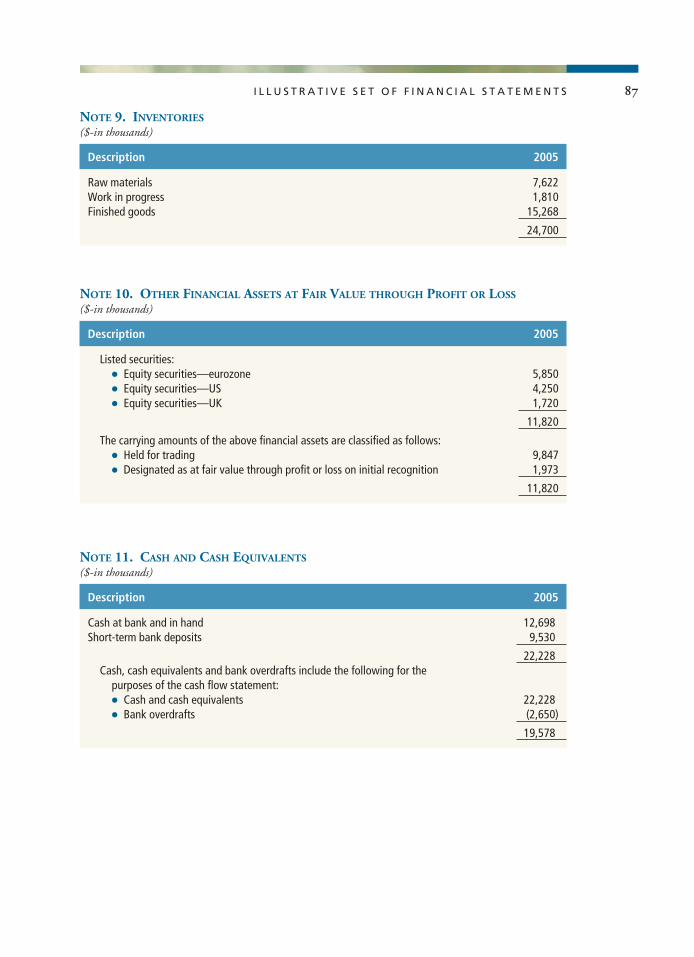
NOTE 9. INVENTORIES($-in thousands)
Description 2005
Raw materials 7,622Work in progress 1,810Finished goods 15,268
24,700
NOTE 10. OTHER FINANCIAL ASSETS AT FAIR VALUE THROUGH PROFIT OR LOSS($-in thousands)
Description 2005
Listed securities:● Equity securities—eurozone 5,850● Equity securities—US 4,250● Equity securities—UK 1,720
11,820
The carrying amounts of the above financial assets are classified as follows:● Held for trading 9,847● Designated as at fair value through profit or loss on initial recognition 1,973
11,820
NOTE 11. CASH AND CASH EQUIVALENTS($-in thousands)
Description 2005
Cash at bank and in hand 12,698Short-term bank deposits 9,530
22,228Cash, cash equivalents and bank overdrafts include the following for the
purposes of the cash flow statement:● Cash and cash equivalents 22,228● Bank overdrafts (2,650)
19,578
87I L L U S T R A T I V E S E T O F F I N A N C I A L S T A T E M E N T S
10323-03_Ch03.qxd 2/12/07 1:28 PM Page 87

NOTE 12. SHARE CAPITAL($-in thousands)
Number of Ordinary Share TreasuryDescription shares shares premium shares Total
At 31 December 2004 21,000 21,000 11,316 — 32,316Employee share option scheme:
● Value of services provided — — 690 — 690● Proceeds from shares issued 750 750 200 — 950
Acquisition of subsidiary 3,550 3,550 6,450 — 10,000Treasury shares purchased (875) — — (2,564) (2,564)
At 31 December 2005 24,425 25,300 18,656 (2,564) 41,392
NOTE 13. OTHER RESERVES($-in thousands)
Land and Available Currency Conv. buildings Hedging for sale trans.
Description bond revaluation reserve inv. adj. Total
Balance at 31 December 2004 — 1,774 62 1,388 3,801 7,025Revaluation—gross — — — 560 — 560Revaluation—tax — — — (142) — (142)Revaluation—associates — — — (12) — (12)Depreciation transfer—gross — (149) — — — (149)Depreciation transfer—tax — 49 — — — 49Cash flow hedges:
● Fair value gains in year — — 368 — — 368● Tax on fair value gains — — (123) — — (123)● Transfers to net profit — — (120) — — (120)● Tax on transfers to net profit — — 40 — — 40● Transfers to inventory — — (151) — — (151)● Tax on transfers to inventory — — 50 — — 50
Net investment hedge — — — — (45) (45)Currency translation differences:
● Group — 15 — — (2,025) 2,040● Associates — — — — (74) (74)
Convertible bond–equity 7,761 — — — — 7,761Tax on equity component (2,328) — — — — (2,328)
Balance at 31 December 2005 5,433 1,689 126 1,794 5,707 14,749
88 I N T E R N A T I O N A L F I N A N C E R E P O R T I N G S T A N D A R D S
10323-03_Ch03.qxd 2/12/07 1:28 PM Page 88

NOTE 14. TRADE AND OTHER PAYABLES($-in thousands)
Description 2005
Trade payables 11,983Amounts due to related parties 2,202Social security and other taxes 2,002Accrued expenses 1,483
17,670
NOTE 15. BORROWINGS($-in thousands)
Description 2005
Non-currentBank borrowings 32,193Convertible bond 42,822Debentures and other loans 3,300Redeemable preference shares 30,000
108,315
CurrentBank overdrafts 2,650Collateralised borrowings 1,014Bank borrowings 3,368Debentures and other loans 2,492
9,524
Total borrowings 117,839
The maturity of non-current borrowings is as follows:● Between 1 and 2 years 5,870● Between 2 and 5 years 74,967● Over 5 years 27,478
108,315
2005
Carrying amounts Fair values
The carrying amounts and fair value of the non-current borrowings are as follows:● Bank borrowings 32,193 32,590● Redeemable preference shares 30,000 28,450● Debentures and other loans 3,300 3,240● Convertible bond 42,822 42,752
108,315 107,032
89I L L U S T R A T I V E S E T O F F I N A N C I A L S T A T E M E N T S
10323-03_Ch03.qxd 2/12/07 1:28 PM Page 89

NOTE 16. DEFERRED INCOME TAX($-in thousands)
Description 2005
Deferred tax assets:● Deferred tax asset to be recovered after more than 12 months (2,672)● Deferred tax asset to be recovered within 12 months (647)
(3,319)
Deferred tax liabilities:● Deferred tax liability to be recovered after more than 12 months 10,743● Deferred tax liability to be recovered within 12 months 1,627
12,370
9,051
NOTE 17. RETIREMENT BENEFIT OBLIGATIONS($-in thousands)
Description 2005
Balance sheet obligations for:Pension benefits 3,138Post-employment medical benefits 1,402
4,540
NOTE 18. PROVISIONS FOR OTHER LIABILITIES AND CHARGES($-in thousands)
Environ. Restruc- Legal Profit-sharing Description restoration turing claims & bonuses Total
At 1 January 2005 746 — 828 1,000 2,574Charged to consolidated
income statement: —● Additional provisions 316 2,087 2,405 500 5,308● Unused amounts reversed (12) (101) (15) (10) (138)
Exchange differences (7) — (68) — (75)Increase in provision–discount
unwinding 41 — — — 41Used during year (233) (886) (3,059) (990) (5,168)
At 31 December 2005 851 1,100 91 500 2,542
Analysis of total provisions: 2005
Non-current (environmental restoration) 320Current (environmental restoration) 531Current 1,691
2,542
90 I N T E R N A T I O N A L F I N A N C E R E P O R T I N G S T A N D A R D S
10323-03_Ch03.qxd 2/12/07 1:28 PM Page 90

NOTE 19. OTHER($-in thousands)
Description 2005
Other financial assets at fair value through profit or loss:● Fair value losses (839)● Dividend income 330● Dividend income 610
Derivative instruments:● Forward contracts: transactions not qualifying as hedges 86
Net foreign exchange gains/(losses) (277)
(90)Other income:Interest income on available-for-sale securities 1,180Dividend income on available-for-sale securities 1,900
Investment income 3,080Other expenses:Expropriation Costs (1,117)
1,873
NOTE 20. FINANCE COSTS($-in thousands)
Description 2005
Interest expense:● Bank borrowings (4,679)● Dividend on redeemable preference shares (1,950)● Convertible bond (3,083)● Provisions: discount unwinding (41)
(9,753)Net foreign exchange transaction gains/(losses) 2,594Fair value gains on financial instruments:
● Interest rate swaps: cash flow hedges, transfer from equity 102● Interest rate swaps: fair value hedges (16)
(7,073)
NOTE 21. INCOME TAX EXPENSE($-in thousands)
Description 2005
Current tax 14,413Deferred tax 379
14,792
91I L L U S T R A T I V E S E T O F F I N A N C I A L S T A T E M E N T S
10323-03_Ch03.qxd 2/12/07 1:28 PM Page 91
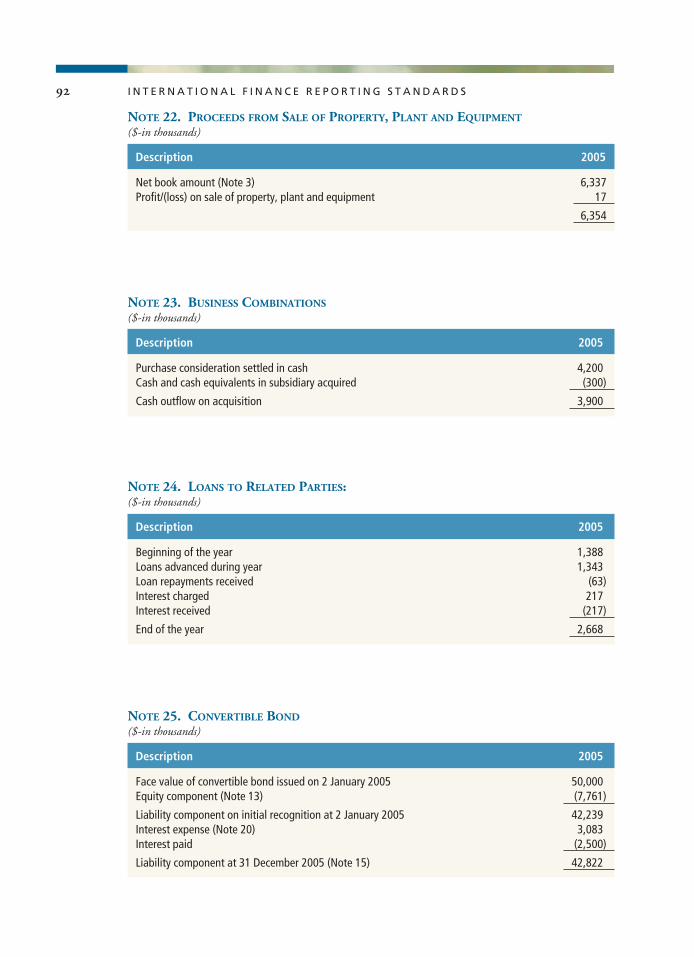
NOTE 22. PROCEEDS FROM SALE OF PROPERTY, PLANT AND EQUIPMENT($-in thousands)
Description 2005
Net book amount (Note 3) 6,337Profit/(loss) on sale of property, plant and equipment 17
6,354
NOTE 23. BUSINESS COMBINATIONS($-in thousands)
Description 2005
Purchase consideration settled in cash 4,200Cash and cash equivalents in subsidiary acquired (300)
Cash outflow on acquisition 3,900
NOTE 24. LOANS TO RELATED PARTIES:($-in thousands)
Description 2005
Beginning of the year 1,388Loans advanced during year 1,343Loan repayments received (63)Interest charged 217Interest received (217)
End of the year 2,668
NOTE 25. CONVERTIBLE BOND($-in thousands)
Description 2005
Face value of convertible bond issued on 2 January 2005 50,000Equity component (Note 13) (7,761)
Liability component on initial recognition at 2 January 2005 42,239Interest expense (Note 20) 3,083Interest paid (2,500)
Liability component at 31 December 2005 (Note 15) 42,822
92 I N T E R N A T I O N A L F I N A N C E R E P O R T I N G S T A N D A R D S
10323-03_Ch03.qxd 2/12/07 1:28 PM Page 92

93I L L U S T R A T I V E S E T O F F I N A N C I A L S T A T E M E N T S
NOTE 26. EARNINGS PER SHARE($-in thousands)
Description 2005 2004
BasicProfit attributable to equity holders of the Company 30,028 15,837
Weighted average number of ordinary shares in issue (thousands) 23,454 20,500
Basic earnings per share 1.28 0.77DilutedProfit attributable to equity holders of the Company 30,028 15,837Interest expense on convertible debt (net of tax) 2,158 —
Profit used to determine diluted earnings per share 32,186 15,837
Weighted average number of ordinary shares in issue (thousands) 23,454 20,500Adjustments for—assumed conversion of convertible debt (thousands) 3,030 —
● share options (thousands) 1,213 1,329
Weighted average number of ordinary shares for diluted earnings per share (thousands) 27,697 21,829
Diluted earnings per share 1.16 0.73
10323-03_Ch03.qxd 2/12/07 1:28 PM Page 93

94 I N T E R N A T I O N A L F I N A N C E R E P O R T I N G S T A N D A R D S
Part II. Banking Industry
The following illustrations relates to the banking industry. They are used as guidelines torelevant users.
Exhibit 1. Consolidated Income Statement
As of 31 December
Description Note 2005 2004
Interest, commissions and Fees on Loans Income . . . . . . . . . 6 7,243 6,483Interest expense and Other Loan Processing charges . . . . . . 6 (4,656) (4,079)
Net interest income . . . . . . . . . . . . . . . . . . . . . . . . . . . . . . 2,587 2,404Fee and commission income—Non-Loan Related . . . . . . . . . 7 1,095 1,044Fee and commission expense—Non-Loan Related . . . . . . . . 7 (48) (52)Other Bank Servicing Charges . . . . . . . . . . . . . . . . . . . . . . . . — —
Net fee and commission income . . . . . . . . . . . . . . . . . . . . 1,047 992Dividend income . . . . . . . . . . . . . . . . . . . . . . . . . . . . . . . . . . 8 87 33Net trading income (Including FX Trading) . . . . . . . . . . . . . . 9 268 251Gains/(losses) from investment securities . . . . . . . . . . . . . . . 21 46 112Gain/(Losses) on Investment Management . . . . . . . . . . . . . . — —Gain (Losses) on Other FX Transactions . . . . . . . . . . . . . . . . . — —Income from Sales of Real Estate Holdings . . . . . . . . . . . . . . — —Other operating income (Non-Interest) . . . . . . . . . . . . . . . . . 130 98Impairment losses on loans and advances . . . . . . . . . . . . . . . 12 (120) (136)Operating expenses (Admin, Deprec. and Amort.) . . . . . . . . . 10 (2,797) (2,558)Other Non-Interest Operating Expenses (Net) . . . . . . . . . . . . — —Provisions on Earning Assets & Commitment
and Contingencies . . . . . . . . . . . . . . . . . . . . . . . . . . . . . . . — —
Operating profit . . . . . . . . . . . . . . . . . . . . . . . . . . . . . . . . . 1,248 1,196Share of profit of associates . . . . . . . . . . . . . . . . . . . . . . . . . . 22 7 7Gain on Sale of Premises and Equipment . . . . . . . . . . . . . . . . — —Gain on Sale of Foreclosed Properties . . . . . . . . . . . . . . . . . . — —Provisions For Decline in Value of Foreclosed Properties . . . . — —
Profit before income tax . . . . . . . . . . . . . . . . . . . . . . . . . . 1,255 1,203Income tax expense . . . . . . . . . . . . . . . . . . . . . . . . . . . . . . . . 13 (377) (375)
Profit for the year . . . . . . . . . . . . . . . . . . . . . . . . . . . . . . . . 878 828
Attributable to:Equity holders of the Company . . . . . . . . . . . . . . . . . . . . . . . 871 820Minority interest . . . . . . . . . . . . . . . . . . . . . . . . . . . . . . . . . . 7 8
Profit for the year . . . . . . . . . . . . . . . . . . . . . . . . . . . . . . . . 878 828Earnings per share for profit attributable to the equity
holders of the Company during the year (expressed in $ per share):● basic . . . . . . . . . . . . . . . . . . . . . . . . . . . . . . . . . . . . . . . Note 14 0.76 0.74● diluted . . . . . . . . . . . . . . . . . . . . . . . . . . . . . . . . . . . . . . Note 14 0.73 0.71
10323-03_Ch03.qxd 2/12/07 1:28 PM Page 94

95I L L U S T R A T I V E S E T O F F I N A N C I A L S T A T E M E N T S
Exhibit 2. Consolidated Balance Sheet($-in thousands)
As of 31 December
Description Note 2005 2004
ASSETSCash and balances with central banks . . . . . . . . . . . . . . . . 15 6,080 4,315Demand Deposits with Other Banks . . . . . . . . . . . . . . . . . — —Treasury bills and other eligible bills . . . . . . . . . . . . . . . . . 16 1,485 771Loans, Placements, and advances to banks . . . . . . . . . . . . 17 8,576 5,502Trading securities . . . . . . . . . . . . . . . . . . . . . . . . . . . . . . . . 18 5,231 8,204Investments in Shares of Stock . . . . . . . . . . . . . . . . . . . . . — —Derivative financial instruments . . . . . . . . . . . . . . . . . . . . 19 5,325 5,442Other financial instruments at fair value through
profit or loss . . . . . . . . . . . . . . . . . . . . . . . . . . . . . . . . . 18 2,520 1,102Loans and advances to customers (incl. Overdrafts) (Net) . 20 59,203 53,208Lease Financing Receivable . . . . . . . . . . . . . . . . . . . . . . . . — —Accrued Interest Receivable . . . . . . . . . . . . . . . . . . . . . . . . — —Investment securities:
● available-for-sale . . . . . . . . . . . . . . . . . . . . . . . . . . . . 21 3,972 1,182● held-to-maturity . . . . . . . . . . . . . . . . . . . . . . . . . . . . 21 3,999 1,009
Pledged assets . . . . . . . . . . . . . . . . . . . . . . . . . . . . . . . . . . 37 1,004 1,083Investments in associated undertakings . . . . . . . . . . . . . . 22 112 108Other Investments . . . . . . . . . . . . . . . . . . . . . . . . . . . . . . . — —Intangible assets (Net of Impairment) . . . . . . . . . . . . . . . . 23 237 312Property, plant and equipment (Net) . . . . . . . . . . . . . . . . . 24 1,519 1,555Foreclosed Properties . . . . . . . . . . . . . . . . . . . . . . . . . . . . . — —Deferred income tax assets . . . . . . . . . . . . . . . . . . . . . . . . 35 273 255Other assets . . . . . . . . . . . . . . . . . . . . . . . . . . . . . . . . . . . . 25 2,003 2,111
Total assets . . . . . . . . . . . . . . . . . . . . . . . . . . . . . . . . . . . . . 101,539 86,159
LIABILITIESDeposits from Other banks . . . . . . . . . . . . . . . . . . . . . . . . 26 15,039 13,633Acceptances, Placements, and Other Deposits . . . . . . . . . 27 16,249 12,031Derivative financial instruments and other
trading liabilities . . . . . . . . . . . . . . . . . . . . . . . . . . . . . . 19 4,039 6,277Customers Deposits . . . . . . . . . . . . . . . . . . . . . . . . . . . . . . 28 51,775 42,698Debt securities in issue . . . . . . . . . . . . . . . . . . . . . . . . . . . 29 1,766 1,232Estimated Losses on Commitment & Contingencies . . . . . — — —Other borrowed funds (Including Subordinated Notes) . . . 30 2,808 2,512Capital Lease Obligations . . . . . . . . . . . . . . . . . . . . . . . . . — — —Other Accrued/Deferred liabilities . . . . . . . . . . . . . . . . . . . 33 2,871 2,224Current income tax liabilities . . . . . . . . . . . . . . . . . . . . . . . 101 173Deferred income tax liabilities . . . . . . . . . . . . . . . . . . . . . . 35 1,109 693Retirement benefit obligations . . . . . . . . . . . . . . . . . . . . . 36 237 221
Total liabilities . . . . . . . . . . . . . . . . . . . . . . . . . . . . . . . . . . 95,994 81,694
10323-03_Ch03.qxd 2/12/07 1:28 PM Page 95

96 I N T E R N A T I O N A L F I N A N C E R E P O R T I N G S T A N D A R D S
Exhibit 2. Consolidated Balance Sheet (Continued )
As of 31 December
Description Note 2005 2004
EQUITYCapital and reserves attributable to theCompany’s equity holdersShare capital—Common (Net of Treasury Shares) . . . . . . . 38 2,010 1,916Share Capital—Preferred . . . . . . . . . . . . . . . . . . . . . . . . . . — —Retained earnings . . . . . . . . . . . . . . . . . . . . . . . . . . . . . . . 39 2,359 1,920Reserves (Revaluation, Capital, Other) . . . . . . . . . . . . . . . 39 1,132 592
Total Equity . . . . . . . . . . . . . . . . . . . . . . . . . . . . . . . . . . . . 5,501 4,428Minority interest . . . . . . . . . . . . . . . . . . . . . . . . . . . . . . . . 44 37
Total equity . . . . . . . . . . . . . . . . . . . . . . . . . . . . . . . . . . . . . 5,545 4,465
Total equity and liabilities . . . . . . . . . . . . . . . . . . . . . . . . . 101,539 86,159
Exhibit 3. Consolidated Statement of Changes in Equity($-in thousands)
Attributable to equityholders of the company
Share Other Retained Minority TotalDescription Note capital reserves earnings interest equity
At 31 December 2004/1 January 2005 . . . . 1,916 592 1,920 37 4,465
Net change in available-for-sale investments, net of tax . . . . . . . . . . . . . . 39 — 128 — — 128
Net change in cash flow hedges, net of tax . . . . . . . . . . . . . . . . . . . . . . . . 39 — 360 — — 360
Currency translation differences . . . . . . . . . 39 — (20) — — (20)Net gains not recognized in the
income statement . . . . . . . . . . . . . . . . . . — — — — —Net profit . . . . . . . . . . . . . . . . . . . . . . . . . . — — 871 7 878
Total recognized income for 2005 . . . . . — 468 871 7 1,346Dividend for 2004 . . . . . . . . . . . . . . . . . . . . — — (360) — (360)Transfer to general banking reserves . . . . . — 58 (58) — —Transfer to statutory reserve . . . . . . . . . . . . — 14 (14) — —Purchases/sales of treasury shares . . . . . . . 14 — — — 14Employee share option scheme:
● value of employee services . . . . . . . . . 30 — — — 30● proceeds from shares issued . . . . . . . 50 — — — 50
At 31 December 2005 . . . . . . . . . . . . . . . 2,010 1,132 2,359 44 5,545
10323-03_Ch03.qxd 2/12/07 1:28 PM Page 96

97I L L U S T R A T I V E S E T O F F I N A N C I A L S T A T E M E N T S
Exhibit 4. Consolidated Cash Flow Statements($-in thousands)
As of 31 December
Description Note 2005 2004
Cash flows from operating activities . . . . . . . . . . . . . . . . . . .Interest and commission received . . . . . . . . . . . . . . . . . . . . . 7,003 6,497Interest received . . . . . . . . . . . . . . . . . . . . . . . . . . . . . . . . . . (4,889) (4,156)Dividends received . . . . . . . . . . . . . . . . . . . . . . . . . . . . . . . . . 89 37Fee and commission received . . . . . . . . . . . . . . . . . . . . . . . . 1,008 1,099Net trading and other income . . . . . . . . . . . . . . . . . . . . . . . . 305 331Recoveries on loans previously written off . . . . . . . . . . . . . . . 29 37Cash payments to employees and suppliers . . . . . . . . . . . . . . (2,506) (2,264)Income taxes paid . . . . . . . . . . . . . . . . . . . . . . . . . . . . . . . . . (390) (307)Cash flows from operating profits before changes in
operating assets and liabilities . . . . . . . . . . . . . . . . . . . . . 649 1,274Changes in operating assets and liabilities:
● net increase in trading securities . . . . . . . . . . . . . . . . . . (160) (552)● net increase in bought and sold options . . . . . . . . . . . . (181) (101)● net decrease/(increase) in loans and advances to banks 81 (119)● net increase in loans and advances to customers . . . . . (5,765) (4,527)● net (increase)/decrease in other assets . . . . . . . . . . . . . (341) 127● net increase in deposits from other banks . . . . . . . . . . . 1,339 1,273● net increase in other deposits . . . . . . . . . . . . . . . . . . . . 4,235 1,819● net increase in trading liabilities . . . . . . . . . . . . . . . . . . 258 —● net increase in amounts due to customers . . . . . . . . . . 9,019 1,175● net increase in other liabilities . . . . . . . . . . . . . . . . . . . . 268 133
Net cash from operating activities . . . . . . . . . . . . . . . . . . 9,402 502Cash flows from investing activities . . . . . . . . . . . . . . . . . . . .Acquisition of subsidiaries, net of cash acquired . . . . . . . . . . (293) —Disposal of subsidiaries, net of cash disposed . . . . . . . . . . . . 46 —Purchase of property and equipment . . . . . . . . . . . . . . . . . . . 24 (431) (382)Proceeds from sale of property and equipment . . . . . . . . . . . 67 79Purchase of securities . . . . . . . . . . . . . . . . . . . . . . . . . . . . . . 21 (5,852) (249)Proceeds from sale and redemption of securities . . . . . . . . . . 469 498
Net cash used in investing activities . . . . . . . . . . . . . . . . (5,994) (54)Cash flows from financing activitiesProceeds from borrowed funds and debt securities . . . . . . . . 1,455 1,269Repayments of borrowed funds and debt securities . . . . . . . . (577) (518)Issue of ordinary shares . . . . . . . . . . . . . . . . . . . . . . . . . . . . . 38 50 30Purchase of treasury shares . . . . . . . . . . . . . . . . . . . . . . . . . . 38 (96) (112)Sale of treasury shares . . . . . . . . . . . . . . . . . . . . . . . . . . . . . . 38 110 121Dividends paid . . . . . . . . . . . . . . . . . . . . . . . . . . . . . . . . . . . . 40 (360) (322)
Net cash from financing activities . . . . . . . . . . . . . . . . . . 582 468Net increase in cash and cash equivalents . . . . . . . . . . . . . . . 3,990 916Cash and cash equivalents at beginning of year . . . . . . . . . . 41 10,840 9,998Effect of exchange rate changes on cash and
cash equivalents . . . . . . . . . . . . . . . . . . . . . . . . . . . . . . . . (180) (74)
Cash and cash equivalents at end of year . . . . . . . . . . . . 14,650 10,840
10323-03_Ch03.qxd 2/12/07 1:28 PM Page 97

98 I N T E R N A T I O N A L F I N A N C E R E P O R T I N G S T A N D A R D S
Notes to Financial Statements
NOTE 1. GENERAL INFORMATION
Universal Banking Group (the Group) provides retail, corporate banking and investmentbanking services in various parts of the world. The Group has operations in over 20 countriesand employs over 22,000 people.
NOTE 2. SUMMARY OF SIGNIFICANT ACCOUNTING POLICIES
Note: each entity considers the nature of its operations and the policies that the users ofits financial statements would expect to be disclosed for that type of entity. The account-ing policies that an entity might consider presenting include, but are not limited to, thefollowing:
� Basis of presentation� Consolidation� Segment reporting� Foreign currency translation� Derivative financial instruments and hedge accounting� Interest income and expense� Fee and commission income� Financial assets� Sale and repurchase agreements� Intangible assets� Property, plant and equipment� Leases� Cash and cash equivalents� Provisions� Employee benefits� Deferred income tax� Borrowings� Share capital
NOTE 3. FINANCIAL RISK MANAGEMENT
This section covers the following components:
� Strategy in using financial instruments� Credit risk� Geographical concentrations of assets, liabilities and off-balance sheet items� Market risk� Currency risk� Interest sensitivity of assets, liabilities and off balance sheet items� Liquidity risk� Fair values of financial assets and liabilities� Fiduciary activities
10323-03_Ch03.qxd 2/12/07 1:28 PM Page 98

99I L L U S T R A T I V E S E T O F F I N A N C I A L S T A T E M E N T S
NOTE 4. CRITICAL ACCOUNTING ESTIMATES AND JUDGMENTS
IN APPLYING ACCOUNTING POLICIES
The Group makes estimates and assumptions that affect the reported amounts of assets andliabilities within the next financial year, such as impairment losses on loans and advances.
NOTE 5. BUSINESS SEGMENTS
The Group is organized on a worldwide basis into three main business segments: Retailbanking, Corporate banking, and Investment banking. (Client provides table with a recon-ciliation of all business segments).
NOTE 6. NET INTEREST INCOME($-in thousands)
Description 2005 2004
Interest incomeCash and short term funds 617 550Investment securities 259 227Securities borrowed and reverse repos. 104 147Loans and advances 5,935 5,242Other 328 317
7,243 6,483
Interest expenseBanks and customers 3,751 3,238Debt securities in issue 105 89Securities lent and repos. 98 84Other borrowed funds 191 199Other 511 469
4,656 4,079
NOTE 7. NET FEE AND COMMISSION INCOME($-in thousands)
Description 2005 2004
Fee and commission incomeCredit related fees and commissions 675 631Corporate finance fees 201 176Portfolio and other management fees 74 98Asset management and related fees 140 135Other fees 5 4
1,095 1,044
Fee and commission expenseBrokerage fees paid 42 48Other fees paid 6 4
48 52
10323-03_Ch03.qxd 2/12/07 1:28 PM Page 99

100 I N T E R N A T I O N A L F I N A N C E R E P O R T I N G S T A N D A R D S
NOTE 8. DIVIDEND INCOME($-in thousands)
Description 2005 2004
Trading securities 64 22Available-for-sale securities 23 11
87 33
NOTE 9. NET TRADING INCOME($-in thousands)
Description 2005 2004
Foreign exchange:● translation gains less losses 100 100● transaction gains less losses 80 76
Interest rate instruments 55 59Equities 33 16
268 251
NOTE 10. OTHER OPERATING EXPENSES($-in thousands)
Description 2005 2004
Staff costs (Note 11) 1,467 1,374Administrative expenses 397 466Depreciation (Note 24) 323 298(Profit)/loss on sale of property and equipment 15 (5)Impairment charges:
● property and equipment (Note 24) 2 —Software costs 14 11Operating lease rentals 198 194Restructuring costs (Note 34) 283 —Other 98 220
2,797 2,558
NOTE 11. STAFF COSTS($-in thousands)
Description 2005 2004
Wages and salaries 995 943Social security costs 264 250Pension costs:
● defined contribution plans 132 114● defined benefit plans (Note 36) 66 58
Other post retirement benefits (Note 36) 10 9
1,467 1,374
10323-03_Ch03.qxd 2/12/07 1:28 PM Page 100

NOTE 12. IMPAIRMENT LOSSES ON LOANS AND ADVANCES($-in thousands)
Description 2005 2004
Amounts due from other banks (Note 17) 7 —Loans and advances to customers (Note 20) 113 136
120 136
NOTE 13. INCOME TAX EXPENSE($-in thousands)
Description 2005 2004
Current tax 312 321Deferred tax (Note 35) 65 54
377 375
NOTE 14. EARNINGS PER SHARE($-in thousands)
Description 2005 2004
BasicProfit attributable to equity holders of the Company 871 820
Weighted average number of ordinary shares in issue (millions) 1,149 1,108
Basic earnings per share (expressed in $ per share) 0.76 0.74
DilutedProfit attributable to equity holders of the Company 871 820Interest expense on convertible debt (net of tax) 8 8
Net profit used to determine diluted earnings per share 879 828
Weighted average number of ordinary shares in issue 1,149 1,108Adjustments for:
● bonus element on conversion of convertible debt 25 25● share options (millions) 23 27
Weighted average number of ordinary shares for diluted earnings per share (millions) 1,197 1,160
Diluted earnings per share (expressed in $ per share) 0.73 0.71
NOTE 15. CASH AND BALANCES WITH CENTRAL BANKS($-in thousands)
Description 2005 2004
Cash in hand 1,778 791Other money-market placements 3,395 2,608Balances with central banks other than mandatory reserve deposits 892 903
Included in cash and cash equivalents 6,065 4,302Mandatory reserve deposits with central banks 15 13
6,080 4,315
101I L L U S T R A T I V E S E T O F F I N A N C I A L S T A T E M E N T S
10323-03_Ch03.qxd 2/12/07 1:28 PM Page 101

NOTE 16. TREASURY BILLS AND OTHER ELIGIBLE BILLS($-in thousands)
Description 2005 2004
Treasury bills 579 228Other eligible bills 906 543
1,485 771
NOTE 17. LOANS AND ADVANCES TO BANKS($-in thousands)
Description 2005 2004
Items in course of collection from other banks 163 109Placements with other banks 4,988 2,982
Included in cash equivalents (Note 41) 5,151 3,091
Loans and advances to other banks 3,432 2,411
Less: allowance for losses on amounts due from other banks (Note 12) (7) —
8,576 5,502
NOTE 18. FINANCIAL ASSETS AT FAIR VALUE THROUGH
PROFIT OR LOSS (INCLUDING TRADING)($-in thousands)
Description 2005 2004
TradingGovernment bonds included in cash equivalents 1,949 2,676Other government bonds 1,180 945Other debt securities 885 3,402Equity securities:
● listed 1,083 1,080● unlisted 134 101
Total trading 5,231 8,204Financial assets at fair value through profit or loss (designated at
initial recognition) 2,520 1,102
7,751 9,306
102 I N T E R N A T I O N A L F I N A N C E R E P O R T I N G S T A N D A R D S
10323-03_Ch03.qxd 2/12/07 1:28 PM Page 102

103I L L U S T R A T I V E S E T O F F I N A N C I A L S T A T E M E N T S
NOTE 19. DERIVATIVE FINANCIAL INSTRUMENTS AND TRADING LIABILITIES($-in thousands)
At 31 December 2005
Contract/notionalFair values
Description amount Assets Liabilities
1) Derivatives held for tradinga) Foreign exchange derivatives
Currency forwards 74,210 1,162 (1,314)Currency swaps 4,580 99 (268)OTC currency options bought
and sold 8,597 37 (57)
Total OTC derivatives 1,298 (1,639)Currency futures 5,531 53 (67)Exchange-traded currency
options—bought and sold 470 3 (26)
1,354 (1,732)b) Interest rate derivatives
Interest rate swaps 57,217 634 (611)Cross-currency interest
rate swaps 28,609 314 (590)Forward rate agreements 54,875 51 (55)OTC interest rate options 5,954 6 —Other interest rate contracts 193 2 —
Total OTC derivatives 1,007 (1,256)Exchange-traded interest
rate futures 38,534 25 (20)Exchange-traded interest
rate options 37,918 74 (31)
99 (51)Total derivative assets/(liabilities)
held for trading 2,460 (3,039)
2) Derivatives held for hedginga) Derivatives designated as
fair value hedgesCurrency futures 4,300 110 (26)Interest rate swaps 25,262 1,286 (311)Cross currency interest rate swaps 11,315 554 (88)
1,950 (425)b) Derivatives designated as
cash flow hedgesCurrency swaps 4,018 803 (313)Exchange traded currency
options bought 5,020 112 —Total derivative assets/(liabilities)
held for hedging 2,865 (738)Total recognized derivative assets/
(liabilities) 5,325 (3,777)
3) Other trading liabilitiesTreasury bills sold not yet
re-purchased (Note 37) (262)Total recognized derivative and
other trading liabilities (4,039)
10323-03_Ch03.qxd 2/12/07 1:28 PM Page 103

104 I N T E R N A T I O N A L F I N A N C E R E P O R T I N G S T A N D A R D S
NOTE 20. LOANS AND ADVANCES TO CUSTOMERS($-in thousands)
Description 2005 2004
Loans to individuals:● overdrafts 2,198 2,432● credit cards 2,817 2,876● term loans 2,827 2,633● mortgages 30,942 30,625
Loans to corporate entities:● direct commercial loans 15,695 12,201● sub-participation loans 4,236 2,348● other 1,431 1,144
Gross loans and advances 60,146 54,259Less: allowance for losses on loans and advances (943) (1,051)
59,203 53,208
NOTE 21. INVESTMENT SECURITIES($-in thousands)
Description 2005 2004
Securities available-for-saleDebt securities—at fair value 2,474 933Equity securities—at fair value 1,498 249
Total securities available-for-sale 3,972 1,182Total securities held-to-maturity 3,999 1,009
Total investment securities 7,971 2,191
Gains and losses from investment securities comprise:Derecognition of available-for-sale financial assets 51 117Impairment of available-for-sale equity securities (5) (5)
46 112
NOTE 22. INVESTMENT IN ASSOCIATES($-in thousands)
Name Profit/(loss) incorporation Country of Assets Liabilities Revenues held % interest
[Associate X] [country] 1,326 1,272 165 7 30[Associate Y] [county] 1,459 1,401 183 5 33
2,785 2,673 348 12
10323-03_Ch03.qxd 2/12/07 1:28 PM Page 104

105I L L U S T R A T I V E S E T O F F I N A N C I A L S T A T E M E N T S
NOTE 23. INTANGIBLE ASSETS($-in thousands)
Description 2005 2004
GoodwillOpening net book amount 204 327Exchange differences (5) (15)Acquisition of a subsidiary 38 —
Closing net book amount 237 312
NOTE 24. PROPERTY, PLANT AND EQUIPMENT($-in thousands)
Land & LeaseholdDescription Building improvements Equipment Total
Year ended December 2005Opening net book amount 776 50 729 1,555Additions 71 10 350 431Disposal (43) — (37) (80)Impairment charge — (2) — (2)Depreciation charge (34) (7) (282) (323)Exchange rate adjustments (30) (3) (29) (62)
Closing net book amount 740 48 731 1,519
NOTE 25. OTHER ASSETS($-in thousands)
Description 2005 2004
Accounts receivable and pre-payments 1,048 1,029Accrued income 615 737Other 340 345
2,003 2,111
NOTE 26. DEPOSITS FROM BANKS($-in thousands)
Description 2005 2004
Items in course of collection 103 197Deposits from other banks 14,936 13,436
15,039 13,633
10323-03_Ch03.qxd 2/12/07 1:28 PM Page 105
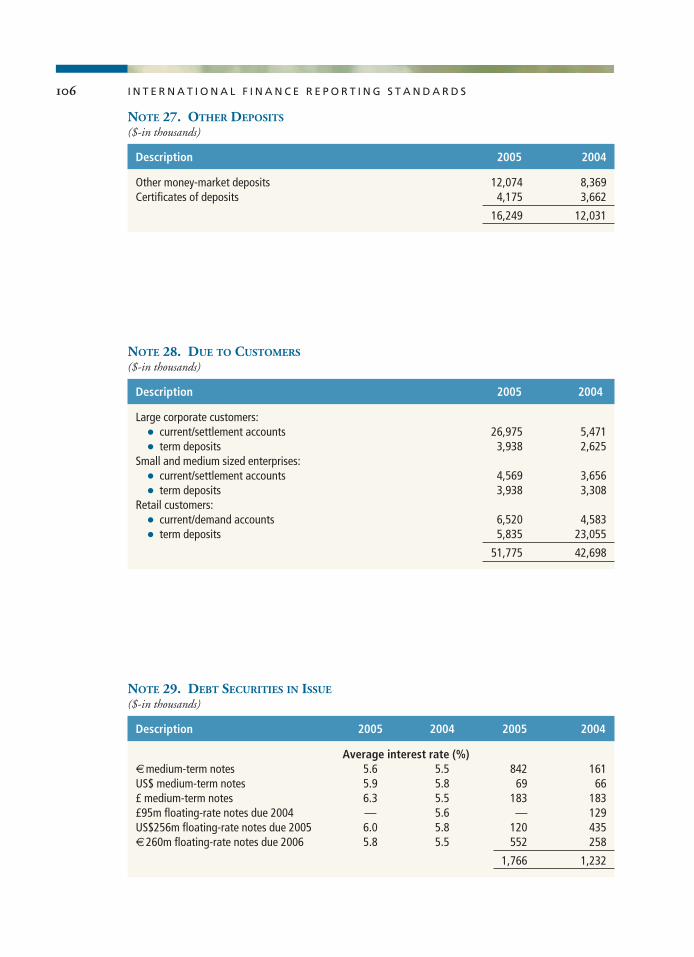
106 I N T E R N A T I O N A L F I N A N C E R E P O R T I N G S T A N D A R D S
NOTE 27. OTHER DEPOSITS($-in thousands)
Description 2005 2004
Other money-market deposits 12,074 8,369Certificates of deposits 4,175 3,662
16,249 12,031
NOTE 28. DUE TO CUSTOMERS($-in thousands)
Description 2005 2004
Large corporate customers:● current/settlement accounts 26,975 5,471● term deposits 3,938 2,625
Small and medium sized enterprises:● current/settlement accounts 4,569 3,656● term deposits 3,938 3,308
Retail customers:● current/demand accounts 6,520 4,583● term deposits 5,835 23,055
51,775 42,698
NOTE 29. DEBT SECURITIES IN ISSUE($-in thousands)
Description 2005 2004 2005 2004
Average interest rate (%)€medium-term notes 5.6 5.5 842 161US$ medium-term notes 5.9 5.8 69 66£ medium-term notes 6.3 5.5 183 183£95m floating-rate notes due 2004 — 5.6 — 129US$256m floating-rate notes due 2005 6.0 5.8 120 435€260m floating-rate notes due 2006 5.8 5.5 552 258
1,766 1,232
10323-03_Ch03.qxd 2/12/07 1:28 PM Page 106

NOTE 30. OTHER BORROWED FUNDS($-in thousands)
Description Interest rate % 2005 2004
Collateralized borrowing 2,056 1,310Subordinated notes40m fixed rate notes due 2004 6.13 — 3525m fixed rate notes due 2005 4.89 38 38100m fixed rate notes due 2004 5.12 — 105460m floating-rate notes due 2004 LIBOR + 0.09 — 311
38 489Redeemable preference shares (Note 32) 6.50 552 552Convertible bond (Note 31)200m due 2012 6.00 162 161
2,808 2,512
NOTE 31. CONVERTIBLE BONDS
($-in thousands)
On 4 January 2004, the Company issued 200 million 6% convertible bonds at a nominalvalue of $1 per bond. The bonds mature 25 years from the issue date at the nominal valueunless converted into the Company’s ordinary shares at the holder’s option at the rate of25 shares per $200.
The convertible bond is presented in the consolidated balance sheet as follows:
Description 2005 2004
Initial recognition:● face value of convertible bond issued — 200● equity conversion component net of deferred tax liability — –24● deferred tax liability — –16
Liability component at 1 January 161 160Interest expense 13 13Interest paid (12) –12
Liability component at 31 December 162 161
Interest on the bond is calculated on the effective yield basis by applying the effective interestrate (7.9%) for an equivalent non-convertible bond to the liability component of the convert-ible bond and for the year ended 31 December 2005 amounted to $12.7 (2004: $12.6).
NOTE 32. REDEEMABLE PREFERENCE SHARES
($-in thousands)
On 4 January 2003, the Company issued 552 million cumulative redeemable preferenceshares with a par value of $1 per share, which are redeemable at the option of the holder atpar on 1 January 2013 or by the Company at any time before that date.
107I L L U S T R A T I V E S E T O F F I N A N C I A L S T A T E M E N T S
10323-03_Ch03.qxd 2/12/07 1:28 PM Page 107

NOTE 33. OTHER LIABILITIES($-in thousands)
Description 2005 2004
Creditors 1,367 1,311Dividends payable 57 44Accruals 796 534Other provisions (Note 34) 467 229Other 184 106
2,871 2,224
NOTE 34. OTHER PROVISIONS($-in thousands)
Description 2005 2004
A+ 1 January 229 —Exchange differences 3 —Additional provisions charged to income statement 283 249Utilized during year (48) (20)
At 31 December 467 229
NOTE 35. DEFERRED INCOME TAXES($-in thousands)
Description 2005 2004
Deferred income tax liabilitiesAccelerated tax depreciation 342 223Convertible bond 15 16Available-for-sale securities 84 86Cash flow hedges 235 272Other temporary differences 433 96
1,109 693Deferred income tax assets
Pensions and other post retirement benefits 62 51Provision for loan impairment 7 34Other provisions 184 92Cash flow hedges — 32Hedged deposits from customers — 4Tax losses carried forward 20 42
273 255
108 I N T E R N A T I O N A L F I N A N C E R E P O R T I N G S T A N D A R D S
10323-03_Ch03.qxd 2/12/07 1:28 PM Page 108

NOTE 36. RETIREMENT BENEFIT OBLIGATIONS($-in thousands)
Description 2005 2004
Pension schemes 182 170Other post retirement benefits 55 51
237 221
NOTE 37. CONTINGENT LIABILITIES AND COMMITMENTS($-in thousands)
Description 2005 2004
a) Legal proceedingsThere were a number of legal proceedings outstanding against the Group at 31 December 2004.No provision has been made as professional advice indicates that it is unlikely that any significant losswill arise.
b) Capital commitmentsThe contractual amounts of the Group’s off-balance sheet financial instruments that commit it to extendcredit to customers are as follows:Bankers acceptances 1,777 898Guarantees and standby letters of credit 2,660 1,789Documentary and commercial letters of credit 415 391Commitments to extend credit:
● Original term to maturity of one year or less 16,965 13,209● Original term to maturity of more than one year 4,836 4,030
26,653 20,317
c) Assets pledgedAssets are pledged as collateral under repurchase agreements with other banks and for security depositsrelating to local futures, options and stock exchange memberships. Mandatory reserve deposits are alsoheld with local central banks in accordance with statutory requirements. These deposits are not availableto finance the Group’s day to day operations.
NOTE 38. SHARE CAPITAL($-in thousands)
Description
The total authorized number of ordinary shares at year end was 1,400 million (2004: 1,400 million) with a par value of $1 per share (2004: $1 per share). All issued shares are fully paid.The total number of treasury shares at the end of 2005 was 24 million (2004: 28 million).
109I L L U S T R A T I V E S E T O F F I N A N C I A L S T A T E M E N T S
10323-03_Ch03.qxd 2/12/07 1:28 PM Page 109

110 I N T E R N A T I O N A L F I N A N C E R E P O R T I N G S T A N D A R D S
NOTE 39. RESERVES AND RETAINED EARNINGS($-in thousands)
Description 2005 2004
General banking risks 175 125Statutory reserve 112 102Convertible bond—equity component 24 24Translation reserves (155) (147)Revaluation reserve—available-for-sale investments 256 128Hedging reserve—cash flow hedges 720 360
Total reserves at 31 December 1,132 592
Movements in retained earnings were as follows:At 1 January 1,920 1,512Net profit for year 871 820Dividend for prior year (360) (322)Transfer to general banking reserve (58) (49)Transfer to statutory reserve (14) (41)
At 31 December 2,359 1,920
NOTE 40. DIVIDENDS PER SHARE($-in thousands)
Final dividends are not accounted for until they have been ratified at the Annual GeneralMeeting. At the meeting on [date] 2005, a dividend in respect of 2005 of $0.33 per share(2004: actual dividend $0.313 per share) amounting to a total of $396 (2004: actual $360)is to be proposed. The financial statements for the year ended 31 December 2005 do notreflect this resolution, which will be accounted for in shareholders’ equity as an appropriationof retained profits in the year ending 31 December 2006.
NOTE 41. CASH AND CASH EQUIVALENTS($-in thousands)
Description 2005 2004
Cash and balances with central banks (Note 15) 6,065 4302Treasury bills and other eligible bills (Note 16) 1,485 771Loans and advances to banks (Note 17) 5,151 3091Trading securities (Note 18) 1,949 2676
14,650 10,840
NOTE 42. RELATED-PARTY TRANSACTIONS($-in thousands)
The Group is controlled by Parent Ltd. (incorporated in [name of country]) which owns 60%of the ordinary shares. The remaining 40% of the shares are widely held. The ultimate par-ent of the Group is Ultimate Parent Ltd. (incorporated in [name of country]). A number ofbanking transactions are entered into with related parties in the normal course of business.
10323-03_Ch03.qxd 2/12/07 1:28 PM Page 110
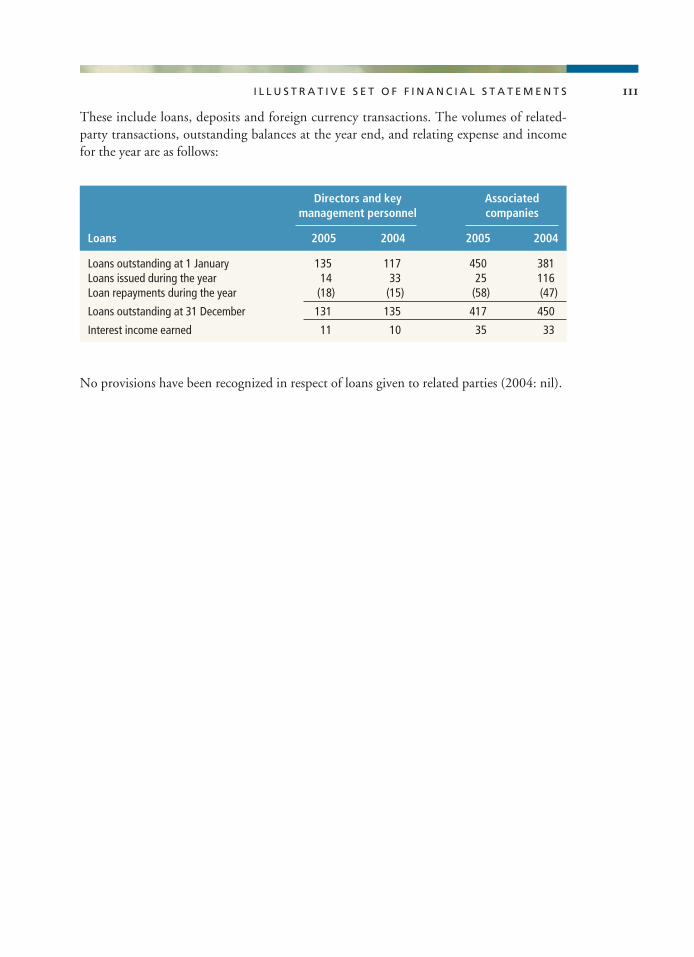
111I L L U S T R A T I V E S E T O F F I N A N C I A L S T A T E M E N T S
These include loans, deposits and foreign currency transactions. The volumes of related-party transactions, outstanding balances at the year end, and relating expense and incomefor the year are as follows:
Directors and key Associated management personnel companies
Loans 2005 2004 2005 2004
Loans outstanding at 1 January 135 117 450 381Loans issued during the year 14 33 25 116Loan repayments during the year (18) (15) (58) (47)
Loans outstanding at 31 December 131 135 417 450
Interest income earned 11 10 35 33
No provisions have been recognized in respect of loans given to related parties (2004: nil).
10323-03_Ch03.qxd 2/12/07 1:28 PM Page 111
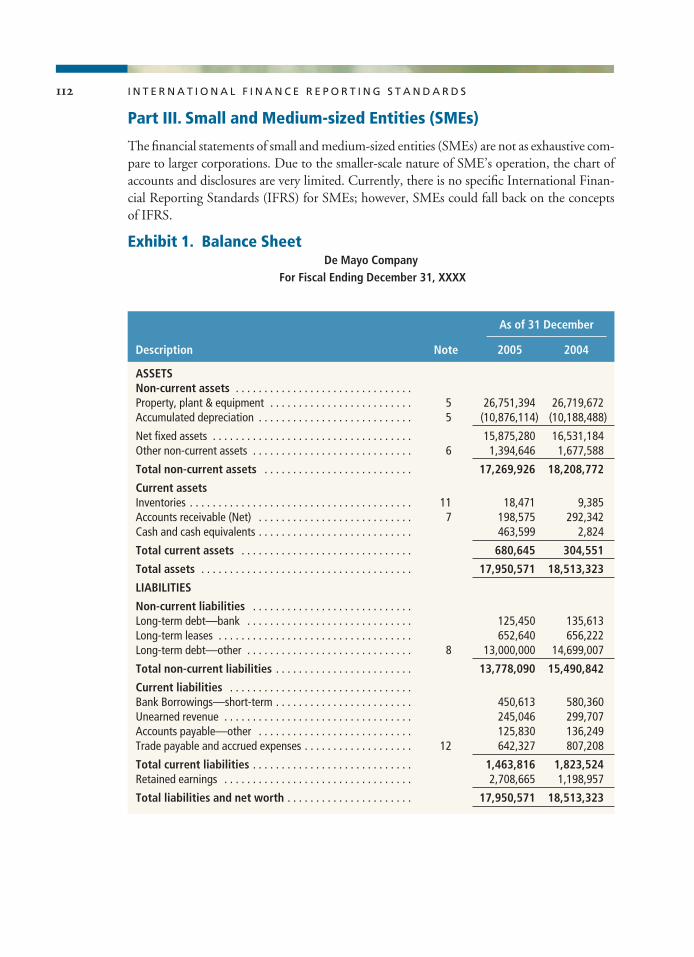
112 I N T E R N A T I O N A L F I N A N C E R E P O R T I N G S T A N D A R D S
Part III. Small and Medium-sized Entities (SMEs)
The financial statements of small and medium-sized entities (SMEs) are not as exhaustive com-pare to larger corporations. Due to the smaller-scale nature of SME’s operation, the chart ofaccounts and disclosures are very limited. Currently, there is no specific International Finan-cial Reporting Standards (IFRS) for SMEs; however, SMEs could fall back on the conceptsof IFRS.
Exhibit 1. Balance SheetDe Mayo Company For Fiscal Ending December 31, XXXX
($-in thousands)
As of 31 December
Description Note 2005 2004
ASSETSNon-current assets . . . . . . . . . . . . . . . . . . . . . . . . . . . . . . .Property, plant & equipment . . . . . . . . . . . . . . . . . . . . . . . . . 5 26,751,394 26,719,672Accumulated depreciation . . . . . . . . . . . . . . . . . . . . . . . . . . . 5 (10,876,114) (10,188,488)
Net fixed assets . . . . . . . . . . . . . . . . . . . . . . . . . . . . . . . . . . . 15,875,280 16,531,184Other non-current assets . . . . . . . . . . . . . . . . . . . . . . . . . . . . 6 1,394,646 1,677,588
Total non-current assets . . . . . . . . . . . . . . . . . . . . . . . . . . 17,269,926 18,208,772
Current assetsInventories . . . . . . . . . . . . . . . . . . . . . . . . . . . . . . . . . . . . . . . 11 18,471 9,385Accounts receivable (Net) . . . . . . . . . . . . . . . . . . . . . . . . . . . 7 198,575 292,342Cash and cash equivalents . . . . . . . . . . . . . . . . . . . . . . . . . . . 463,599 2,824
Total current assets . . . . . . . . . . . . . . . . . . . . . . . . . . . . . . 680,645 304,551
Total assets . . . . . . . . . . . . . . . . . . . . . . . . . . . . . . . . . . . . . 17,950,571 18,513,323
LIABILITIES
Non-current liabilities . . . . . . . . . . . . . . . . . . . . . . . . . . . .Long-term debt—bank . . . . . . . . . . . . . . . . . . . . . . . . . . . . . 125,450 135,613Long-term leases . . . . . . . . . . . . . . . . . . . . . . . . . . . . . . . . . . 652,640 656,222Long-term debt—other . . . . . . . . . . . . . . . . . . . . . . . . . . . . . 8 13,000,000 14,699,007
Total non-current liabilities . . . . . . . . . . . . . . . . . . . . . . . . 13,778,090 15,490,842
Current liabilities . . . . . . . . . . . . . . . . . . . . . . . . . . . . . . . .Bank Borrowings—short-term . . . . . . . . . . . . . . . . . . . . . . . . 450,613 580,360Unearned revenue . . . . . . . . . . . . . . . . . . . . . . . . . . . . . . . . . 245,046 299,707Accounts payable—other . . . . . . . . . . . . . . . . . . . . . . . . . . . 125,830 136,249Trade payable and accrued expenses . . . . . . . . . . . . . . . . . . . 12 642,327 807,208
Total current liabilities . . . . . . . . . . . . . . . . . . . . . . . . . . . . 1,463,816 1,823,524Retained earnings . . . . . . . . . . . . . . . . . . . . . . . . . . . . . . . . . 2,708,665 1,198,957
Total liabilities and net worth . . . . . . . . . . . . . . . . . . . . . . 17,950,571 18,513,323
Exhibit 1. Balance SheetDe Mayo Company
For Fiscal Ending December 31, XXXX
10323-03_Ch03.qxd 3/6/07 1:06 PM Page 112

REVENUESSales . . . . . . . . . . . . . . . . . . . . . . . . . . . . . . . . . . . . . . . . . . . 9 7,738,815 8,638,648Cost of Sales . . . . . . . . . . . . . . . . . . . . . . . . . . . . . . . . . . . . . (4,193,075) (4,800,178)
Gross profit . . . . . . . . . . . . . . . . . . . . . . . . . . . . . . . . . . . . . . 3,545,740 3,838,470
Interest income . . . . . . . . . . . . . . . . . . . . . . . . . . . . . . . . . . . 6,899 432Other revenues . . . . . . . . . . . . . . . . . . . . . . . . . . . . . . . . . . . 284,302 308,425Gain on early extinguishment of bonds . . . . . . . . . . . . . . . . . 2,469,716 —
Total revenues . . . . . . . . . . . . . . . . . . . . . . . . . . . . . . . . . . . 6,306,657 4,147,327
EXPENSESSelling & Marketing Costs . . . . . . . . . . . . . . . . . . . . . . . . . . . (193,075) (208,521)General & Administrative Expenses . . . . . . . . . . . . . . . . . . . . (1,466,030) (1,348,812)Telephone and utility . . . . . . . . . . . . . . . . . . . . . . . . . . . . . . . (517,613) (596,656)
Earning Before Interest, Tax and Depreciation (EBITDA) . . . . 4,129,939 1,993,338
Interest expense . . . . . . . . . . . . . . . . . . . . . . . . . . . . . . . . . . . (1,081,750) (603,862)Depreciation & amortization . . . . . . . . . . . . . . . . . . . . . . . . . (725,561) (679,467)
Profit(loss) before tax . . . . . . . . . . . . . . . . . . . . . . . . . . . . 2,322,628 710,009
Taxes . . . . . . . . . . . . . . . . . . . . . . . . . . . . . . . . . . . . . . . . . . . (812,920) (248,503)
Net profit(loss) . . . . . . . . . . . . . . . . . . . . . . . . . . . . . . . . . . 1,509,708 461,506
113I L L U S T R A T I V E S E T O F F I N A N C I A L S T A T E M E N T S
Exhibit 2. Income Statement
As of 31 December
Description Note 2005 2004
Exhibit 3. Statement of Changes in Equity
Description Note Total equity
Balance at January 1, 2004 . . . . . . . . . . . . . . . . . . . . . . . . . . 737,451Net profit—December 31, 2004 . . . . . . . . . . . . . . . . . . . . . . 461,506
Retained earnings at December 31, 2004 . . . . . . . . . . . . . . . 1,198,957Net profit—December 31, 2005 . . . . . . . . . . . . . . . . . . . . . . 1,509,708
Retained earnings at December 31, 2005 . . . . . . . . . . . . 2,708,665
10323-03_Ch03.qxd 2/12/07 1:28 PM Page 113

114 I N T E R N A T I O N A L F I N A N C E R E P O R T I N G S T A N D A R D S
Exhibit 4. Cash Flow Statements
As of 31 December
Description Note 2005 2004
OPERATING ACTIVITIESNet profit . . . . . . . . . . . . . . . . . . . . . . . . . . . . . . . . . . . . . . . . 1,509,708 461,506Adjustments to reconcile net profit:Depreciation & amortization . . . . . . . . . . . . . . . . . . . . . . . . . 725,561 677,467Amortization of bond discount . . . . . . . . . . . . . . . . . . . . . . . — (303,649)Gain on early extinguishment of bonds . . . . . . . . . . . . . . . . . (2,469,716) —Loss on sale of assets . . . . . . . . . . . . . . . . . . . . . . . . . . . . . . . — 516(Increase) Decrease in accounts receivable . . . . . . . . . . . . . . 93,767 (194,280)(Increase) Decrease in inventory . . . . . . . . . . . . . . . . . . . . . . (9,086) 41,252(Increase) Decrease Other assets . . . . . . . . . . . . . . . . . . . . . . 6 20,050 (15,598)Increase (Decrease) in accounts payable and
accrued expenses . . . . . . . . . . . . . . . . . . . . . . . . . . . . . . . . (305,047) 216,030Increase (Decrease) in deferred revenue . . . . . . . . . . . . . . . . (54,661) (147,345)
Cash flows from operating activities . . . . . . . . . . . . . . . . (489,424) 735,899
INVESTING ACTIVITIESPurchase of property and equipment . . . . . . . . . . . . . . . . . . . (31,722) (369,632)Proceeds from sale of property . . . . . . . . . . . . . . . . . . . . . . . — 1,500
Net cash flows from investing activities . . . . . . . . . . . . . (31,722) (368,132)
FINANCING ACTIVITIESProceeds from issuance of bond obligations . . . . . . . . . . . . . 10 268,948 —Principal payments on bonds . . . . . . . . . . . . . . . . . . . . . . . . . (1,387,291) (2,558,832)Reduction of bond sinking fund . . . . . . . . . . . . . . . . . . . . . . . 6 1,063,009 (43,369)Reduction of bond reserve fund . . . . . . . . . . . . . . . . . . . . . . . 6 300,000 1,781,556Repayment of bank borrowings—short-term . . . . . . . . . . . . 751,000 306,940Long-term leases . . . . . . . . . . . . . . . . . . . . . . . . . . . . . . . . . . (3,582) (3,940)Repayment of long-term debt—bank . . . . . . . . . . . . . . . . . . (10,163) (15,035)
Cash flows from financing activities . . . . . . . . . . . . . . . . 981,921 (532,680)
Net Increase (Decrease) in cash . . . . . . . . . . . . . . . . . . . . . . . 460,775 (164,913)Cash, beginning of year . . . . . . . . . . . . . . . . . . . . . . . . . . . . . 2,824 167,737
Cash at the end of year (December 31, 2005) . . . . . . . . . 463,599 2,824
10323-03_Ch03.qxd 2/12/07 1:28 PM Page 114

115I L L U S T R A T I V E S E T O F F I N A N C I A L S T A T E M E N T S
Notes to Financial Statements
NOTE 1. GENERAL INFORMATION
De Mayo Company is incorporated in Mexico. The company manufactures semiconductorsand sells their products to local corporations.
NOTE 2. SUMMARY OF SIGNIFICANT ACCOUNTING POLICIES
Note: each entity considers the nature of its operations and the policies that the users ofits financial statements would expect to be disclosed for that type of entity. The account-ing policies that an entity might consider presenting include, but are not limited to, thefollowing:
� Basis of presentation� Consolidation� Segment reporting� Foreign currency translation� Derivative financial instruments and hedge accounting� Interest income and expense� Fee and commission income� Financial assets� Sale and repurchase agreements� Intangible assets� Property, plant and equipment� Leases� Cash and cash equivalents� Provisions� Employee benefits� Deferred income tax� Borrowings� Share capital
NOTE 3. FINANCIAL RISK MANAGEMENT
This section covers the following components:
� Strategy in using financial instruments� Credit risk� Geographical concentrations of assets, liabilities and off-balance sheet items� Market risk� Currency risk� Interest sensitivity of assets, liabilities and off balance sheet items� Liquidity risk� Fair values of financial assets and liabilities� Fiduciary activities
10323-03_Ch03.qxd 2/12/07 1:28 PM Page 115

NOTE 4. CRITICAL ACCOUNTING ESTIMATES AND JUDGMENTS IN
APPLYING ACCOUNTING POLICIES
De Mayo Company makes estimates and assumptions that affect the reported amounts ofassets and liabilities within the next financial year.
NOTE 5. PROPERTY, PLANT & EQUIPMENT
Description 2005 2004
Land and improvements 1,522,165 1,522,165Buildings and improvements 23,190,860 23,190,860Furniture, fixtures, and equipment 2,038,369 2,006,647
26,751,394 26,719,672Less accumulated depreciation (10,876,114) (10,188,488)
Net plant and equipment 15,875,280 16,531,184
NOTE 6. OTHER NON-CURRENT ASSETS
Description 2005 2004
Bond issue costs, net 1,100,117 —Bond sinking fund 86,796 1,149,805Bond reserve 200,000 500,000Other 7,733 27,783
Total 1,394,646 1,677,588
NOTE 7. ACCOUNTS RECEIVABLE
Description 2005 2004
Gross accounts receivable 403,107 602,225Less: Allowance for doubtful account (204,532) (309,883)
Accounts receivable (net) 198,575 292,342
NOTE 8. LONG-TERM DEBT—OTHER
Effective March 1, 2005, the Company entered into an agreement with a trust company andissued new bonds as described in the Trust Indenture in the maximum principal amount of$13,000,000. The bonds were used to refinance the previous bonds payable.
Future annual payments to the sinking fund are approximately as follows for the yearending December 31:
2006 1,165,0002007 1,206,0002008 1,206,0002009 1,206,0002010 1,207,0002011 and thereafter 20,545,000
116 I N T E R N A T I O N A L F I N A N C E R E P O R T I N G S T A N D A R D S
10323-03_Ch03.qxd 2/12/07 1:28 PM Page 116
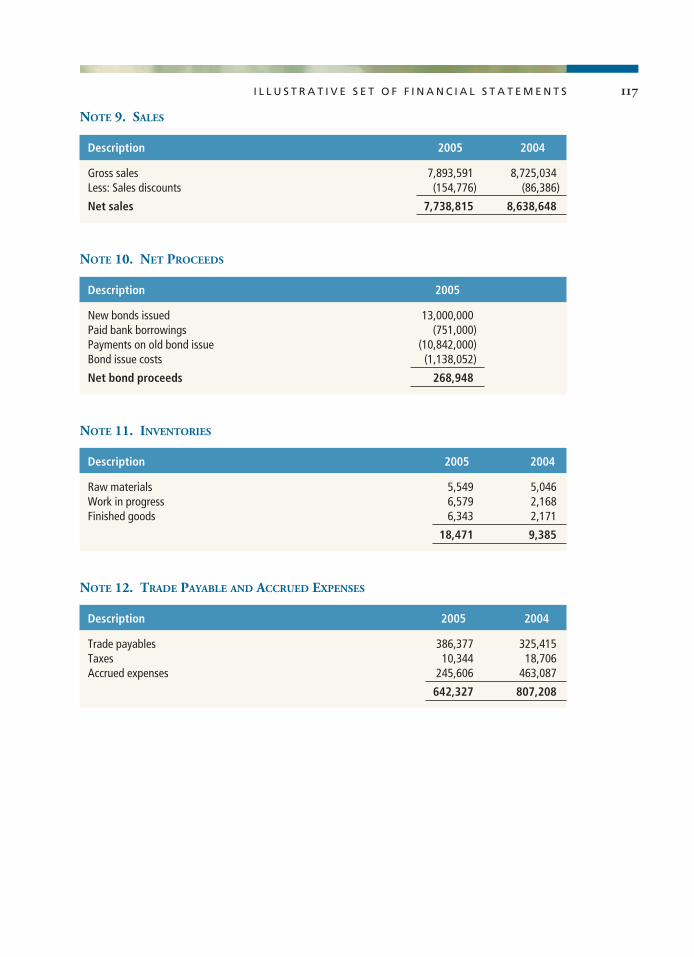
117I L L U S T R A T I V E S E T O F F I N A N C I A L S T A T E M E N T S
NOTE 9. SALES
Description 2005 2004
Gross sales 7,893,591 8,725,034Less: Sales discounts (154,776) (86,386)
Net sales 7,738,815 8,638,648
NOTE 10. NET PROCEEDS
Description 2005
New bonds issued 13,000,000Paid bank borrowings (751,000)Payments on old bond issue (10,842,000)Bond issue costs (1,138,052)
Net bond proceeds 268,948
NOTE 11. INVENTORIES
Description 2005 2004
Raw materials 5,549 5,046Work in progress 6,579 2,168Finished goods 6,343 2,171
18,471 9,385
NOTE 12. TRADE PAYABLE AND ACCRUED EXPENSES
Description 2005 2004
Trade payables 386,377 325,415Taxes 10,344 18,706Accrued expenses 245,606 463,087
642,327 807,208
10323-03_Ch03.qxd 2/12/07 1:28 PM Page 117

10323-03_Ch03.qxd 2/12/07 1:28 PM Page 118

In the wake of scandals such as those involving Enron and WorldCom, the financial worldhas focused much of its attention on restoring public trust in financial reporting. This
focus has triggered many changes in the way companies and audit committees approachreporting, as well as in the recruitment and management of external auditors. Auditors,lawyers, investment bankers, standards-setters, and regulators are also urging the boards ofdirectors and audit committees to play a more active role in overseeing financial reportingactivities in their companies.
Close involvement will enable these boards and audit committees to monitor ethicalconduct, evaluate management performance, set appropriate compensation levels for man-agers, and keep a close watch on and communicate directly with internal and external audi-tors. Whether a company is reporting under the U.S. Generally Accepted AccountingPrinciples (U.S. GAAP) or International Financial Reporting Standards (IFRS), its boardsand audit committees would have greater responsibility for financial reporting and audits.
The Sarbanes-Oxley Act of 2002, which established new and enhanced standards forthe boards and management of all U.S. public companies and for public accounting firms,has made the audit committee directly responsible for selecting, compensating, retaining,overseeing, and evaluating the work of external auditors. The committee is also responsiblefor resolving disagreements between management and external auditors on financial report-ing. Auditors, therefore, must report to the audit committee. Before selecting an auditor,International Finance Corporation (IFC) client companies are required to assess candidates’skills and ability to perform the audits; in addition, IFC must approve and feel comfortablewith the selections. The Controller’s Department (CCB) of IFC can assist the investmentand portfolio staff with the selection process. An auditor evaluator questionnaire and check-list can be obtained from CCBFR’s website.
Assessing External Auditors
Various criteria can be used to assess an external financial auditor, the audit firm, and theengagement partners (see box 4.1).
Because IFC operates in many countries, the auditor for a client company must belicensed to practice in the country in which the project company resides or is incorporated,
4
Audit and the Financial Reporting
C H A P T E R
119
10323-04_Ch04.qxd 2/12/07 1:29 PM Page 119

120 I N T E R N A T I O N A L F I N A N C E R E P O R T I N G S T A N D A R D S
and must be a member in good standing of the national institute that governs auditors’ pro-fessional conduct.
The appointment of external auditors by IFC’s project client companies is subject to IFC’s concurring review. The list of audit firm candidates must be sent to IFC to assesstheir qualifications. A checklist of auditors’ qualifications is available in IFC’s Controller’sDepartment.
Box 4.1 Criteria for Assessing External Auditors
● The accounting firm’s knowledge of and experience inthe company’s industry.
● The engagement team’s overall business insight andknowledge of and experience in the company’s industry.
● The lead partner’s business acumen, knowledge of andexperience in the company’s industry, and the leadpartner’s personal credentials.
● The auditor’s ability to communicate issues and con-cerns to the committee clearly and effectively.
● The committee’s ability to develop a trusting relation-ship and its level of comfort with the lead partner.
● The auditor’s ability to work cooperatively with thecompany’s management team while maintaining objectivity, and the team’s ability to stand up to management on difficult issues.
● The auditor’s ability to meet deadlines and respond toissues in a timely fashion.
● The accounting firm’s quality control procedures.● Significant findings from recent firm inspections, peer
reviews, or other governmental oversight reviews (if publicly available).
● The audit firm’s overall reputation with previous auditclients.
● The scope of the accounting firm’s international net-work and affiliations, if the company has internationaloperations.
● The auditors’ independence and the systems employedto ensure independence (auditors have no connectionto the company, their family members have no director indirect financial interest, and they and their familymembers are not serving as directors, officers, oremployees).
Under “The Code of Ethics,” the fundamental principlesthat apply to all professional accountants are:
● Integrity● Objectivity● Professional competence ● Due care● Confidentiality● Professional behavior● Technical standards.
In addition, auditors in public practice should be, andshould be seen to be, free from any interest that might be considered incompatible with their objectivity andindependence.
The code states that an auditor should be independent infact and in appearance. It provides detailed guidelineson situations that impair independence, such as financialinvolvement with the client, appointments to managerialpositions within the client, the provision of other services(such as consulting or bookkeeping), and personal relationships.
10323-04_Ch04.qxd 2/12/07 1:29 PM Page 120

121A U D I T A N D T H E F I N A N C I A L R E P O R T I N G
Prohibited Non-Audit Services
Once an auditor has been hired, it is prohibited from rendering certain non-audit services,including:
� Bookkeeping or other services related to the accounting records or financial state-ments of the audit client
� Design and implementation of financial information systems � Appraisal or valuation services, fairness opinion, or contribution-in-kind reports� Actuarial services� Internal audit outsourcing services� Management functions or human resources services� Broker-dealer, investment adviser, or investment banking services� Legal and expert services unrelated to the audit.
Objective of an Audit
The objective of an audit of financial statements is to enable the auditor to express an opin-ion on whether those statements give a true and fair view (or are presented fairly, in all mate-rial respects), in accordance with an identified accounting framework.
The auditor performs certain tests of the transactions and balances underlying the finan-cial statements, and evaluates their overall presentation. Just as accounts are prepared inaccordance with a specified framework (such as IFRS), they are audited in accordance withcertain standards. The auditing standards most commonly associated with IFRS financialstatements are the International Standards on Auditing (ISA).
The external auditor’s report is normally is included with the published financial state-ments. The statutory requirements regarding which entities should be subject to audit, andthe precise matters on which the auditor should report, are determined by each national gov-ernments. The rules regarding the training and education of auditors and regulation of theprofession also vary from country to country. As indicated earlier in this chapter I, it is impor-tant for IFC staff to be involved in the recruitment of audit services to ensure that the auditfirm has qualified staff. This chapter does not cover national requirements.
Audit Reports and Opinions
Audit reports (see figure 4.1) and opinions (see figure 4.2) are presented in specific ways andmust include required elements.
10323-04_Ch04.qxd 2/12/07 1:29 PM Page 121

122 I N T E R N A T I O N A L F I N A N C E R E P O R T I N G S T A N D A R D S
Title (“Independent” must be in title)
Addressee (Addressed to the board and shareholders of the company)
Introductory Paragraph—Financial Statements and Mutual Responsibilities
The introductory paragraph contains the following remarks:
● The accounting firm specifies which financial statements have been audited. ● It states clearly that the financial statements are the responsibility of the management. ● The accounting firm’s responsibility is to express an opinion on the financial statements
based on the audit.
Scope Paragraph
The scope paragraph states the following:
● The audit has been conducted in accordance with GAAS or ISA. ● The audit tests and procedures named therein have been applied and provide reasonable
assurance that the financial statements are free of material misstatement.
Opinion/Disclaimer Paragraph—Audit Results
The opinion paragraph indicates: ● The financial statements fairly present their disclosures in conformity with GAAP. ● The financial statements give a true and fair view in conformity with IFRS.● Supplementary information is provided.
Auditor’s Signature
Audit Firm’s Name
FIGURE 4.1 Structure of an Audit Report
10323-04_Ch04.qxd 2/12/07 1:29 PM Page 122

123A U D I T A N D T H E F I N A N C I A L R E P O R T I N G
FIGURE 4.2 Types of Audit Opinions
Unqualified opinion with no explanatory
paragraph
Adverse opinion Disclaimer
Qualified opinionìEx cept for”
Unqualified opinionwith explanatory
paragraph Types of audit opinions
Unqualified opinion with no explanatory paragraph
The financial statements present fairly, in all material respects, the company’s financial position, results of operations, and cash flows in conformity with Accounting Standards
Unqualified opinion with explanatory paragraph
Does not affect the auditor’s unqualified opinion, but draws reader’s attention to a very important condition, transaction or policy which may have a material effect on the Company’s operations or financial viability which is very different from prior years. Explanatory paragraph is required in auditor’s report. Examples of explanatory paragraphs are:
■ Auditor’s opinion is based on the report of another auditor ■ Going concern issue: there is substantial doubt about the
entity’s ability to continue as a going concern. ■ Transactions with related parties ■ Unusually important significant subsequent events ■ Accounting matters
Adverse opinion
Financial statements do not present fairly, in all material respects, the company’s financial position, results of operations, and cash flows in conformity with Accounting Standards. Examples of major Accounting Standards departures may be the following:
■ Consolidations■ Revenue Recognition■ Foreign Currency Transactions
Disclaimer
Auditor does not express opinion of the financial statements. Major scope limitation and/or omitted procedures significantly impair the auditor’s ability to form an opinion on the financial statements. Explanatory paragraph is required in the auditor’s report.
Qualified opinion
“Except for” the effects of the matters for which the qualification relates, the financial statements present fairly, in all material respects, the company’s financial position, results of operations, and cash flows in conformity with Accounting Standards.
10323-04_Ch04.qxd 2/12/07 1:29 PM Page 123

124 I N T E R N A T I O N A L F I N A N C E R E P O R T I N G S T A N D A R D S
TABLE 4.1 Summary of Audit Opinions
Audit Opinion
Unqualified(“clean”)
Adverse
Disclaimer
Qualified(“except for”)
What does it mean?
Financial statements fairly presentresults of operations and financialposition.
Financial statements do not fairlypresent results of operations andfinancial position.
Auditor has not rendered an opin-ion on the financial statements.
Except for the effects of itemsnoted, financial statements fairlypresent results of operations andfinancial position.
How to use
Accept
Reject!
Reject!
Accept, butmore analysisis required
Comments
May have explanatory para-graphs; if so, read them carefullyand note information in them.
Client has failed to comply withIFC financial reporting require-ments.
Client has failed to comply with IFCfinancial reporting requirements.
If auditors quantify magnitude ofthe exceptions, use their numbersin financial statement analysis.
Table 4.1 provides a summary of audit opinions and their outcomes. Exhibits 4.1 through 4.5 provide examples of audit opinions issued under varying
circumstances.
We have audited the accompanying balance sheet of ABC Company as of December 31, 2001,and the related statements of income, retained earnings, and cash flow for the year then ended.These financial statements are the responsibility of the company’s management. Our responsibil-ity is to express an opinion on these financial statements based on our audit.
We conducted our audit in accordance with generally accepted auditing standards. Those stan-dards require that we plan and perform the audit to obtain reasonable assurance about whetherthe financial statements are free of material misstatement. An audit includes an examination, ona test basis, of evidence supporting the amounts and disclosures in the financial statements. Anaudit also includes an assessment of the accounting principles used and significant estimatesmade by management, as well as an evaluation of the overall presentation of the financial state-ments. We believe that our audit provides a reasonable basis for our opinion.
In our opinion, the financial statements referred to above present fairly, in all material respects,the financial position of ABC Company as of December 31, 2001, and the results of its operationsand its cash flows for the year then ended, in conformity with generally accepted accountingprinciples.
Exhibit 4.1 Unqualified Opinion with No Explanatory Paragraph
10323-04_Ch04.qxd 2/12/07 1:29 PM Page 124

125A U D I T A N D T H E F I N A N C I A L R E P O R T I N G
If substantial doubt exists about the company’s ability to continue as a going concernfor a period of one year from the balance sheet date, the auditors will modify their unquali-fied report by adding a final paragraph such as the one in exhibit 4.2.
Review engagement
Auditor applies certain analytical procedures to the financial statements prepared by com-pany management to provide limited negative assurance that there are no material modifi-cations that should be made. Since no audit is performed, there is no audit opinion.
The accompanying financial statements have been prepared assuming that ABC Company willcontinue as a going concern. As discussed in note 1 to the financial statements, ABC Companyhas suffered recurring losses from operations and has a net capital deficiency that raises sub-stantial doubt about the entity’s ability to continue as a going concern. Management’s plans inregard to these matters are also described in note 1. The financial statements do not include anyadjustments that might result from the outcome of this uncertainty.
Exhibit 4.2 Unqualified Opinion with Explanatory Paragraph
We have audited the accompanying balance sheet of ABC Company as of December 31, 2001,and the related statements of income, retained earnings, and cash flow for the year then ended.These financial statements are the responsibility of the company’s management. Our responsibil-ity is to express an opinion on these financial statements based on our audit.
We conducted our audit in accordance with generally accepted auditing standards. Those stan-dards require that we plan and perform the audit to obtain reasonable assurance about whetherthe financial statements are free of material misstatement. An audit includes an examination, on atest basis, of evidence supporting the amounts and disclosures in the financial statements. Anaudit also includes an assessment of the accounting principles used and significant estimatesmade by management, as well as an evaluation of the overall financial statement presentation.We believe that our audit provides a reasonable basis for our opinion.
As a result of the audit, we determine that the company has a material amount of operatingleases that are properly capital leases. Consequently, the company should increase its capitalassets by the amount of equipment it has obtained under the capital leases and increase theamount of long-term debt it records in the liabilities section of the balance sheet.
In our opinion, because of the effects of the matters discussed in the preceding paragraph, thefinancial statements referred to above do not present fairly, in all material respects, the financialposition of ABC Company as of December 31, 2001, and the results of its operations and its cashflows for the year then ended in conformity with generally accepted accounting principles.
Exhibit 4.3 Adverse Opinion
10323-04_Ch04.qxd 2/12/07 1:29 PM Page 125

126 I N T E R N A T I O N A L F I N A N C E R E P O R T I N G S T A N D A R D S
We were engaged to audit the balance sheet of ABC Company as of December 31, 2001, and therelated statements of income, retained earnings, and cash flow for the year then ended. Thesefinancial statements are the responsibility of the company’s company’s management. Our re-sponsibility is to express an opinion on these financial statements based on our audit.
We conducted our audit in accordance with generally accepted auditing standards. Those stan-dards require that we plan and perform the audit to obtain reasonable assurance about whetherthe financial statements are free of material misstatement. An audit includes an examination, ona test basis, of evidence supporting the amounts and disclosures in the financial statements. Anaudit also includes an assessment of the accounting principles used and significant estimatesmade by management, as well as an evaluation of the overall financial statement presentation.We believe that our audit provides a reasonable basis for our opinion.
Because the company did not maintain adequate records with respect to inventory values, wewere unable to verify inventory balances and related expense amounts. The scope of our workwas not sufficient to express an opinion on the financial statements referred to previously.
Exhibit 4.4 Disclaimer Opinion
We have audited the accompanying balance sheet of ABC Company as of December 31, 2001,and the related statements of income, retained earnings, and cash flow for the year then ended.These financial statements are the responsibility of the company’s company’s management. Ourresponsibility is to express an opinion on these financial statements based on our audit.
Except as stated in the following paragraph, we conducted our audit in accordance with gener-ally accepted auditing standards. Those standards require that we plan and perform the audit to obtain reasonable assurance about whether the financial statements are free of materialmisstatement. An audit includes an examination, on a test basis, of evidence supporting theamounts and disclosures in the financial statements. An audit also includes an assessment of theaccounting principles used and significant estimates made by management, as well as an eval-uation of the overall financial statement presentation. We believe that our audit provides a rea-sonable basis for our opinion.
We did not have access to the company’s records prior to 2001 so that we could not properlyverify ending inventory balances for 2000 by means of other auditing procedures.
In our opinion, except for the effects of such inventory adjustments, if any, that might have beendetermined to be necessary had we been able to verify the amounts in question, the financialstatements referred to above present fairly, in all material respects, the financial position of ABCCompany as of December 31, 2001, and the results of its operations and its cash flows for theyear then ended, in conformity with generally accepted accounting principles.
Exhibit 4.5 Qualified Opinion
10323-04_Ch04.qxd 2/12/07 1:29 PM Page 126

127A U D I T A N D T H E F I N A N C I A L R E P O R T I N G
A“'review” is an engagement in which an auditor is asked to carry out procedures thatprovide a moderate level of assurance on financial information–a lower level of assurancethan that provided by an audit. The procedures, consisting primarily of inquiry and analyt-ical review, are performed to provide auditors with a reasonable basis for stating whether any-thing has come to their attention that causes them to believe that the financial statements donot give a true and fair view in accordance with the identified basis of accounting.
Auditors are often engaged to perform reviews of interim (for example, half-yearly orquarterly) financial statements prepared under IAS 34. One of the options available underIAS 34 is to provide condensed interim financial information, rather than full interim finan-cial statements. Condensed information does not, by its nature, provide all the informationnecessary to gain a full understanding of the financial position and results. It is therefore notnormally possible for the auditor to report that such condensed information gives a true andfair view. The auditor instead reports that the information has been properly prepared inaccordance with IAS 34.
Unaudited Financial Statements
Agreed-upon procedures are those adopted when an auditor is engaged to apply proceduresthat the auditor and client have agreed upon. The auditor’s report lists the factual findingsfrom these procedures, but provides no general assurance whether the information complieswith an accounting framework. Examples of this type of service are due diligence reports inthe context of mergers and acquisition activity, and reviews of compliance with contractualarrangements.
Pro forma statements are “what if” financial statements. They are financial statementsprepared with or without the accounting effects of certain transactions, and are generallyone-time procedures. Examples include business combinations, significant write-downs of
TABLE 4.2 Structure of an Audit Report
Comparative level of assuranceNature of service provided by the auditor Nature of service
Auditing
Audit High, but not absolute assurance Positive assurance on assertion(s)
Related Services
Review Moderate assurance Negative assurance on assertion(s)
Agreed-upon procedures No assurance Factual findings of procedures
Compilation No assurance Identification of information
10323-04_Ch04.qxd 2/12/07 1:29 PM Page 127
128 I N T E R N A T I O N A L F I N A N C E R E P O R T I N G S T A N D A R D S
assets, and the like. Pro forma statements do not comply with U.S. GAAP, IAS, or localGAAP. They are not audited.
In a compilation, an accountant engaged is required to collect, classify, and summarizefinancial information. No audit procedures are place, and no assurance is expressed in thereport. An auditor presents the financial information that has been prepared by managementbut does not express an opinion on the financials.
In financial statements that have been restated for hyperinflation, IAS 29 has beenapplied, and statements can be audited.
Client-prepared statements are prepared and presented by management, with no inde-pendent review or involvement.
Projections present a company’s financial position, income statement, and cash flowstatement for future periods based on one or more hypothetical assumptions.
10323-04_Ch04.qxd 2/12/07 1:29 PM Page 128
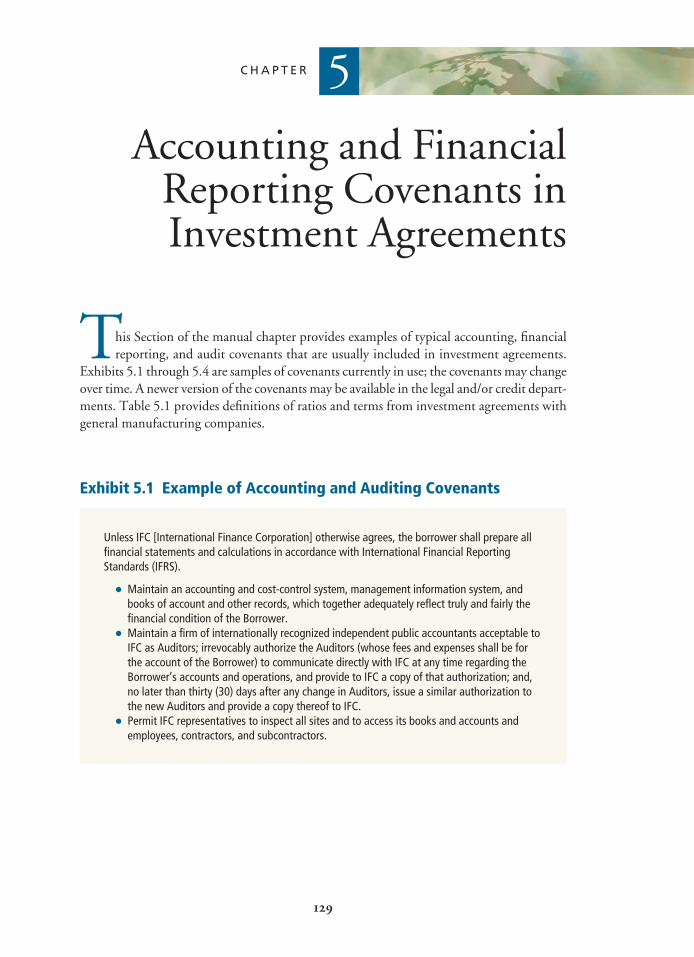
This Section of the manual chapter provides examples of typical accounting, financialreporting, and audit covenants that are usually included in investment agreements.
Exhibits 5.1 through 5.4 are samples of covenants currently in use; the covenants may changeover time. A newer version of the covenants may be available in the legal and/or credit depart-ments. Table 5.1 provides definitions of ratios and terms from investment agreements withgeneral manufacturing companies.
5
Accounting and FinancialReporting Covenants inInvestment Agreements
C H A P T E R
129
Unless IFC [International Finance Corporation] otherwise agrees, the borrower shall prepare allfinancial statements and calculations in accordance with International Financial ReportingStandards (IFRS).
● Maintain an accounting and cost-control system, management information system, andbooks of account and other records, which together adequately reflect truly and fairly thefinancial condition of the Borrower.
● Maintain a firm of internationally recognized independent public accountants acceptable toIFC as Auditors; irrevocably authorize the Auditors (whose fees and expenses shall be forthe account of the Borrower) to communicate directly with IFC at any time regarding theBorrower’s accounts and operations, and provide to IFC a copy of that authorization; and,no later than thirty (30) days after any change in Auditors, issue a similar authorization tothe new Auditors and provide a copy thereof to IFC.
● Permit IFC representatives to inspect all sites and to access its books and accounts andemployees, contractors, and subcontractors.
Exhibit 5.1 Example of Accounting and Auditing Covenants
10323-05_Ch05.qxd 2/12/07 1:29 PM Page 129
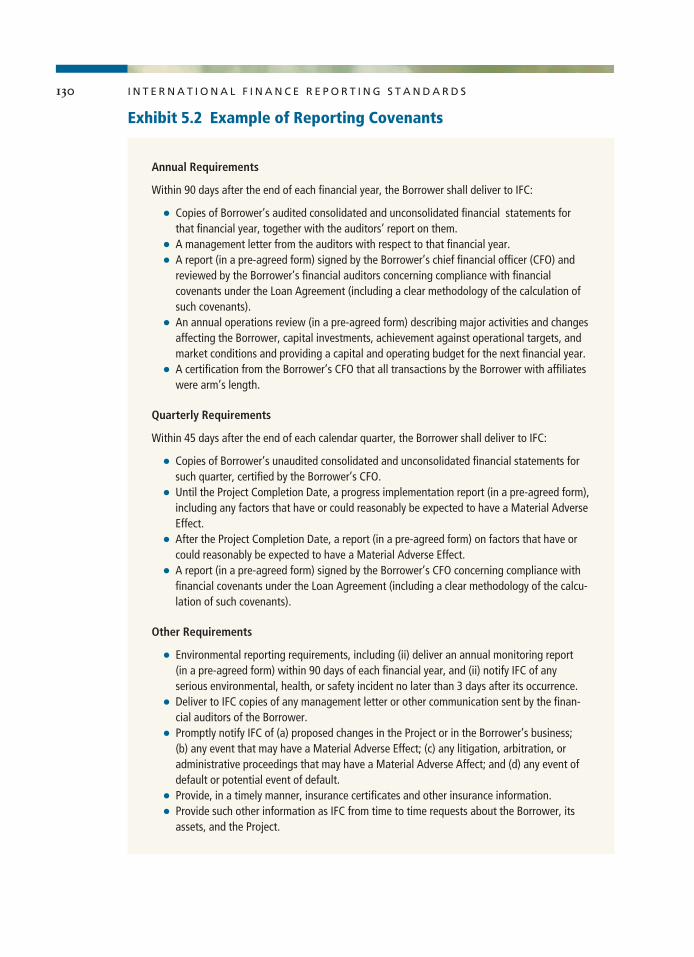
130 I N T E R N A T I O N A L F I N A N C E R E P O R T I N G S T A N D A R D S
Annual Requirements
Within 90 days after the end of each financial year, the Borrower shall deliver to IFC:
● Copies of Borrower’s audited consolidated and unconsolidated financial statements forthat financial year, together with the auditors’ report on them.
● A management letter from the auditors with respect to that financial year.● A report (in a pre-agreed form) signed by the Borrower’s chief financial officer (CFO) and
reviewed by the Borrower’s financial auditors concerning compliance with financialcovenants under the Loan Agreement (including a clear methodology of the calculation ofsuch covenants).
● An annual operations review (in a pre-agreed form) describing major activities and changesaffecting the Borrower, capital investments, achievement against operational targets, andmarket conditions and providing a capital and operating budget for the next financial year.
● A certification from the Borrower’s CFO that all transactions by the Borrower with affiliateswere arm’s length.
Quarterly Requirements
Within 45 days after the end of each calendar quarter, the Borrower shall deliver to IFC:
● Copies of Borrower’s unaudited consolidated and unconsolidated financial statements forsuch quarter, certified by the Borrower’s CFO.
● Until the Project Completion Date, a progress implementation report (in a pre-agreed form),including any factors that have or could reasonably be expected to have a Material AdverseEffect.
● After the Project Completion Date, a report (in a pre-agreed form) on factors that have orcould reasonably be expected to have a Material Adverse Effect.
● A report (in a pre-agreed form) signed by the Borrower’s CFO concerning compliance withfinancial covenants under the Loan Agreement (including a clear methodology of the calcu-lation of such covenants).
Other Requirements
● Environmental reporting requirements, including (ii) deliver an annual monitoring report (in a pre-agreed form) within 90 days of each financial year, and (ii) notify IFC of anyserious environmental, health, or safety incident no later than 3 days after its occurrence.
● Deliver to IFC copies of any management letter or other communication sent by the finan-cial auditors of the Borrower.
● Promptly notify IFC of (a) proposed changes in the Project or in the Borrower’s business; (b) any event that may have a Material Adverse Effect; (c) any litigation, arbitration, oradministrative proceedings that may have a Material Adverse Affect; and (d) any event ofdefault or potential event of default.
● Provide, in a timely manner, insurance certificates and other insurance information.● Provide such other information as IFC from time to time requests about the Borrower, its
assets, and the Project.
Exhibit 5.2 Example of Reporting Covenants
10323-05_Ch05.qxd 2/12/07 1:29 PM Page 130

131A C C O U N T I N G A N D F I N A N C I A L R E P O R T I N G C O V E N A N T S
Negative Covenants
Unless IFC otherwise agrees in writing, the Borrower shall not:
● Declare or pay any dividend or make a payment under any subordinated debt (includingshareholder loans) unless: � the Project Completion Date has occurred;� in the case of dividends, such payment would be made out of retained earnings;� the Prospective Debt Service Coverage Ratio is not less than 1.3;� such payment is made within 30 days after an Interest Payment Date; and� after giving effect to such payment:
i. no event of default or potential event of default exists or is continuingii. the Current Ratio is not less than 1.3iii. the Liabilities to Tangible Net Worth Ratio is not more than 1.7iv. the Balance Sheet Liabilities to Tangible Net Worth Ratio is not more than 1.5
● Incur expenditures other than as required to carry out the Project and conduct operations,except after the Project Completion Date and not in excess of $5,000,000 equivalent perfinancial year.
● Incur or maintain any Financial Debt other than existing Financial Debt, the IFC Loan andadditional Financial Debt provided for in the Financial Plan. The additional Financial Debtwill be a subject to financial ratio tests such as Peak Debt Service Coverage Ratio.
● Guarantee or assume the Liabilities of others.● Enter into leases other than Financial Leases, if the aggregate payments are in excess of
$4,000,000 in any financial year.● Permit liens on property other than the Security and certain tax liens.● Enter into derivative transactions.● Enter into transactions except on an arm’s arm’s length basis.● Enter into exclusive sales or purchasing agency arrangements.● Change its constitutive documents, the Financial Plan, or the nature or scope of the Project.● Amend or waive, any of the Transaction Documents.● Merge, consolidate, reorganize, or dispose of its assets.● Form any subsidiary.● Use proceeds of the IFC Loan in countries that are not members of the World Bank.● Make any payments to government or political officials to influence acts or decisions in
order to obtain improper benefits or advantages.
Exhibit 5.3 Example of Covenants in Investment Agreement withGeneral Manufacturing Company
10323-05_Ch05.qxd 2/12/07 1:29 PM Page 131

132 I N T E R N A T I O N A L F I N A N C E R E P O R T I N G S T A N D A R D S
Subscription AgreementNegative Covenants
Unless IFC otherwise agrees, the Borrower shall not:● Declare or pay any dividend or make any distribution on its share capital, or repurchase or
redeem its shares, except out of profits earned in the preceding financial year, and thenonly if: (1) no Event of Default or Potential Event of Default is occurring; and (2) after thepayment or distribution, the Borrower would be in compliance with the financial covenantsand other terms of this Agreement.
● Create or permit to exist any Lien on any property, revenues or other assets, present orfuture, of the Borrower except any tax or other statutory lien, provided that such lien shallbe discharged within 30 days after the date it is created or arises.
● Enter into any management, partnership, profit sharing, or royalty agreement or other simi-lar arrangement whereby the Borrower’s Borrower’s business or operations are managedby, or its income or profits are shared with, any other Person.
● Enter into any material transaction, except in the ordinary course of business on ordinarycommercial terms and on the basis of arm’s-length arrangements.
● Prepay (whether voluntarily or involuntarily) or repurchase any Long-Term Debt (other thanthe Loan) pursuant to any provision of any agreement or note with respect to that Long-Term Debt unless: (1) that Long-Term Debt is refinanced using new Long-Term Debt onterms and conditions (as to interest rate, other costs, and tenor) at least as favorable to the Borrower as those of the Long-Term Debt being refinanced; or (2) the Borrower givesIFC at least thirty (30) days’ advance notice of its intention to make the proposed prepay-ment and, if IFC so requires, contemporaneously prepays a proportion of the Loan equiva-lent to the proportion of the part of the Long-Term Debt being prepaid, such prepayment to be made in accordance with the provisions of the Prepayment Section of the LegalAgreement, except that there shall be no minimum amount or advance notice period forthat prepayment.
● Change its Foundation Documents in any manner which would be inconsistent with theprovisions of the Legal Agreement, reduce its capital, or change its Financial Year.
● Change the nature or scope of the Project or of the Borrower’s business or operations.● Undertake or permit any merger, spin-off, consolidation, or reorganization; or, except for
assets acquired in the enforcement of security created in favor of the Borrower, sell, trans-fer, lease, or otherwise dispose of all or a substantial part of its assets, whether in a singletransaction or a series of transactions, related or otherwise.
Exhibit 5.4 Example of Covenants in Investment Agreement with a Bank
10323-05_Ch05.qxd 2/12/07 1:29 PM Page 132

133A C C O U N T I N G A N D F I N A N C I A L R E P O R T I N G C O V E N A N T S
● Enter into any arrangement to guarantee or in any way to become obligated for all or anypart of any financial or other obligation of another person, other than any such agreementor arrangement entered into by the Borrower in the ordinary course of its banking business.
● Terminate, amend, or grant any waiver with respect to any provision of the Legal Agree-ment; or
● Enter into any transaction involving, or for the benefit of, any of the individuals or entitieslisted on the UN Lists, or on any other UN sanctions list promulgated pursuant to UN Secu-rity Council resolutions in connection with money laundering or anti-terrorism measures.
Financial Covenants
The Borrower shall ensure that it is in compliance at all times with the following financialcovenants on a consolidated basis (unless more stringent requirements are established by anyAuthority, in which case those shall prevail):
● Risk Weighted Capital Adequacy Ratio shall be no less than four percentage points abovethe minimum required by the BIS Guidelines.
● Classified Loans and other credit exposures, including off–balance sheet items with well-defined credit weaknesses, less loss provisions created on such exposures shall not begreater than 25 percent of the Borrower’s Available Capital.
● The Borrower’s three-month maturity gap, defined as total Liabilities falling due within 90 days less Assets which mature within 90 days, should be less than 100 percent of theBorrower’s Available Capital.
● Aggregate Foreign Currency Short Open Position shall not exceed 25 percent of the Borrower’s Available Capital; netting across currencies shall not be permitted.
● Aggregate exposure (on–balance and off–balance sheet) to all Related Parties shall notexceed 25 percent of Available Capital.
● The Borrower’s single client exposure (on-balance and off-balance sheet) shall not exceed25 percent of the Borrower’s Available Capital.;
● Aggregate Large Exposures shall not exceed 400 percent of Available Capital.● The Borrower’s exposure (on–balance and off–balance sheet items) to any single Economic
Group shall not exceed 25 percent of Borrower’s Available Capital.● The sum of fixed assets and equity participations shall not exceed the Borrower’s Available
Capital.
Exhibit 5.4 Example of Covenants in Investment Agreement with a Bank (Continued )
10323-05_Ch05.qxd 2/12/07 1:29 PM Page 133

134 I N T E R N A T I O N A L F I N A N C E R E P O R T I N G S T A N D A R D S
TABLE 5.1 Selected Definitions of Ratios and Terms from Investment Agreements with General Manufacturing Companies
Term Definition
Balance sheet liabilities Liabilities reflected on the balance sheet of the borrower
Current assets The aggregate of the Borrower’s cash, investments classified as “held for trading,”investments classified as “available for sale,” trade and other receivables realizablewithin one year, inventories and prepaid expenses that are to be charged to incomewithin one year
Current liabilities The aggregate of all liabilities of the Borrower falling due on demand or within one year(including the portion of Long-term Debt falling due within one year)
Current ratio The result obtained by dividing Current Assets (less prepaid expenses) by Current Liabilities
Financial debt Any indebtedness of the Borrower for or in respect of:● Borrowed money● The outstanding principal amount of any bonds, debentures, notes, loan stock,
commercial paper, acceptance credits, bills or promissory notes drawn, accepted,endorsed or issued by the Borrower
● The deferred purchase price of assets or services (except trade accounts that arepayable in the ordinary course of business [within [ ] days of the date they areincurred and which are not overdue]);
● Noncontingent obligations of the Borrower to reimburse any other person foramounts paid by that person under a letter of credit or similar instrument (exclud-ing any letter of credit or similar instrument issued for the benefit of the Borrowerwith respect to trade accounts that are payable in the ordinary course of business[within [ ] days of the date of determination and which are not overdue])
● The amount of any liability in respect of any Financial Lease● Amounts raised under any other transaction having the financial effect of a borrow-
ing and that would be classified as a borrowing (and not as an off–balance sheetfinancing) under the Accounting Standards
● The amount of the Borrower’s obligations under derivative transactions enteredinto in connection with the protection against or benefit from fluctuation in anyrate or price (but only the net amount owing by the Borrower after marking the relevant derivative transactions to market)
● Any premium payable on a [mandatory] redemption or replacement of any of theforegoing items
● The amount of any liability in respect of any guarantee or indemnity for any of theforegoing items incurred by any other person.
Financial lease Any lease or hire purchase contract that would, under the Accounting Standards, betreated as a finance or capital lease
Liabilities The aggregate of all obligations (actual or contingent) of the Borrower to pay or repaymoney, including, without limitation:
1. Financial Debt2. The amount of all liabilities of the Borrower (actual or contingent) under any con-
ditional sale or a transfer with recourse or obligation to repurchase, including,without limitation, by way of discount or factoring of book debts or receivables
10323-05_Ch05.qxd 2/12/07 1:29 PM Page 134

135A C C O U N T I N G A N D F I N A N C I A L R E P O R T I N G C O V E N A N T S
TABLE 5.1 Selected Definitions of Ratios and Terms from Investment Agreements with General Manufacturing Companies (Continued )
Term Definition
3. Taxes (included deferred taxes)4. Trade accounts that are payable in the ordinary course of business (including let-
ters of credit or similar instruments issued for the benefit of the Borrower inrespect of such trade accounts)
5. Accrued expenses, including wages and other amounts due to employees andother services providers
6. The amount of all liabilities of the Borrower howsoever arising to redeem any ofits shares
7. To the extent not included in the definition of Financial Debt, the amount of allliabilities of any person to the extent the Borrower guarantees them or otherwiseobligates itself to pay them.
Long-term debt That part of Financial Debt the final maturity of which, by its terms or the terms of anyagreement relating to it, falls due more than one year after the date of its incurrence
Material adverse effect A material adverse effect on:● The Borrower, its assets, or properties● The Borrower’s business prospects or financial condition● The implementation of the Project, the Financial Plan, or the carrying on of the
Borrower’s business or operations ● The ability of the Borrower to comply with its obligations under this Agreement,
any other Transaction Document or Project Document
Net income For any financial year, the excess (if any) of gross income over total expenses (providedthat income taxes shall be treated as part of total expenses) appearing in the auditedfinancial statements for such financial year
Non-cash items For any financial year, the net aggregate amount (which may be a positive or negativenumber) of all non-cash expenses and non-cash credits that have been subtracted or, asthe case may be, added in calculating Net Income during that financial year, including,without limitation, depreciation, amortization, deferred taxes, provisions for severancepay of staff and workers, and credits resulting from revaluation of the assets’ book value
Peak debt service The ratio obtained by dividing:coverage ratio ● The aggregate, for the financial year most recently ended prior to the relevant date
of calculation for which audited financial statements are available, of (a) Net Incomefor that financial year, (b) Non-Cash Items and (c) the amount of all payments thatwere due during that financial year on account of interest and other charges on Finan-cial Debta (to the extent deducted from Net Income); by
Liabilities (Continued)
a. Financial Debt includes Financial Leases. Lease payments will have been apportioned by the Borrower and its auditors between thefinance charge and the reduction of the outstanding lease liability (essentially corresponding to interest and principal payments). Thenumerator of the Peak or Prospective DSCR should add back to Net Income the finance charge and the amortization of the asset (i.e.,depreciation). The denominator of the Prospective DSCR should include the entire lease payment due in the current financial year, and the denominator of the Peak DSCR should include the entire lease payment due in the financial year with the highest aggregate principalpayments on Long-term Debt (including Financial Leases).
(Continued)
10323-05_Ch05.qxd 2/12/07 1:29 PM Page 135

136 I N T E R N A T I O N A L F I N A N C E R E P O R T I N G S T A N D A R D S
TABLE 5.1 Selected Definitions of Ratios and Terms from Investment Agreements with General Manufacturing Companies (Continued )
Term Definition
● The aggregate of (a) the highest aggregate amount in any financial year, after thefinancial year described in clause (i) above until the final scheduled maturity of theIFC Loan, of all scheduled payments (including balloon payments) falling due onaccount of principal of Long-term Debt and interest and other charges on all Finan-cial Debt and (b) without double counting any payment already counted in the pre-ceding subclause (a), any payment required to be made to any debt service accountin such financial year under the terms of any agreement providing for FinancialDebt where, for the purposes of clause (ii) above:(x) subject to subclause (y), for the computation of interest payable during any
period for which the applicable rate is not yet determined, that interest shall becomputed at the rate in effect at the time of the relevant date of calculation
(y) interest on Short-Term Debt in such financial year shall be computed by refer-ence to the aggregate amount of interest thereon paid during the financial yearin which the relevant date of calculation falls up to the end of the period cov-ered by the latest quarterly financial statements prepared by the Borrowermultiplied by a factor of 4, 2, or 4/3 depending on whether the computation ismade by reference to the financial statements for the first quarter, the first twoquarters or the first three quarters, respectively.
Prospective debt service The ratio obtained by dividing:coverage ratio ● The aggregate, for the financial year most recently ended prior to the relevant date
of calculation for which audited financial statements are available, of (a) NetIncome for that financial year, (b) Non-Cash Items, and (c) the amount of all pay-ments that were due during that financial year on account of interest and othercharges on Financial Debt (to the extent deducted from Net Income); by
● The aggregate of (a) all scheduled payments (including balloon payments) that falldue during the financial year in which the relevant date of calculation falls onaccount of principal of Long-Term Debt and interest and other charges on all Finan-cial Debt and (b) without double counting any payment already counted in the pre-ceding subclause (a), any payment made or required to be made to any debt serviceaccount under the terms of any agreement providing for Financial Debt [but exclud-ing voluntary prepayments]; where, for the purposes of clause (ii) above:(x) subject to subclause (y) below, for the computation of interest payable during
any period for which the applicable rate is not yet determined, that interest shallbe computed at the rate in effect at the time of the relevant date of calculation
(y) interest on Short-Term Debt payable in the financial year in which the relevantdate of calculation falls shall be computed by reference to the aggregateamount of interest thereon paid during that financial year up to the end of theperiod covered by the latest quarterly financial statements prepared by theBorrower multiplied by a factor of 4, 2, or 4/3, depending on whether the com-putation is made with reference to the financial statements for the first quarter,the first two quarters, or the first three quarters, respectively
Peak debt service coverage ratio (Continued)
10323-05_Ch05.qxd 2/12/07 1:29 PM Page 136

137A C C O U N T I N G A N D F I N A N C I A L R E P O R T I N G C O V E N A N T S
TABLE 5.1 Selected Definitions of Ratios and Terms from Investment Agreements with General Manufacturing Companies (Continued )
Term Definition
Short-term debt All Financial Debt other than Long-Term Debt
Tangible net worth The aggregate of:● The amount paid up [or credit as paid up] on the share capital of the Borrower; and
(b) the amount standing to the credit of the reserves of the Borrower (including,without limitation, any share premium account, capital redemption reserve fundsand any credit balance on the accumulated profit and loss account); after deductingfrom that aggregate: (x) any debit balance on the profit and loss account or impairment of the issued
share capital of the Borrower (except to the extent that deduction with respectto that debit balance or impairment has already been made)
(x) amounts set aside for [dividends or] taxation (including deferred taxation)(x) amounts attributable to capitalized items such as goodwill, trademarks,
deferred charges, licenses, patents, and other intangible assets● If applicable, that part of the net results of operations and the net assets of any
subsidiary of the Borrower attributable to interests that are not owned, directly orindirectly, by the Borrower.
10323-05_Ch05.qxd 2/12/07 1:29 PM Page 137

10323-05_Ch05.qxd 2/12/07 1:29 PM Page 138

A
IFRS versus U.S. GAAP
A P P E N D I X
Description IFRS U.S. GAAP
Financial Statements
Balance sheet
Income statement
Extraordinaryitems
Statement ofrecognized incomeand expense(SoRIE)/Other com-prehensive incomeand statement ofaccumulated othercomprehensiveincome
Statement ofchanges in share(stock) holders’equity
Does not prescribe a particularformat. A liquidity presentationof assets and liabilities is used,instead of a current/noncurrentpresentation, only when a liquid-ity presentation provides morerelevant and reliable information.
Does not prescribe a standardformat, although expenditure ispresented in one of two formats(function or nature).
Prohibited.
A SoRIE can be presented as a pri-mary statement, in which case astatement of changes in share-holders’ equity is not presented.Alternatively, it may be disclosedseparately in the primary state-ment of changes in shareholders’equity.
Statement shows capital transac-tions with owners, the movementin accumulated profit and a recon-ciliation of all other components
Entities may present either a clas-sified or nonclassified balancesheet. Items on the the balancesheet are generally presented indecreasing order of liquidity. Pub-lic companies should follow SECregulations.
Present as either a single-step ormultiple-step format. Expendi-tures are presented by function.Public companies should followSEC regulations.
Defined as being both infrequentand unusual, and are rare. Nega-tive goodwill is presented as anextraordinary item.
Total comprehensive income andaccumulated other comprehen-sive income are disclosed, pre-sented either as a separateprimary statement or combinedwith the income statement orwith the statement of changes instockholders’ equity.
Similar to IFRS except statementis presented as a primary state-ment; SEC rules allow certaininformation to be included in the
30776_10323-07_NEW_AppA.qxd 5/4/07 3:58 PM Page 139

I N T E R N A T I O N A L F I N A N C E R E P O R T I N G S T A N D A R D S
Description IFRS U.S. GAAP
Financial Statements (Continued)
Statement ofchanges in share(stock) holders’equity(Continued)
Cash flow state-ments: format andmethod
Assets
Acquired intangi-ble assets
Internallygeneratedintangible assets
Property, plant,and equipment(PP&E)
PP&E: Subsequentmeasurement
of equity. The Statement is pre-sented as a primary statementexcept when a SoRIE is presented;in that case, only disclosureapplies.
Standard headings, limited flexi-bility in content. Use direct or indirect method.
Capitalized if recognition criteriaare met; amortized over usefullife. Intangibles assigned an indef-inite useful life are not amortizedbut reviewed at least annually forimpairment. Revaluations are per-mitted in rare circumstances.
Research costs are expensed asincurred. Development cost is cap-italized and amortized only whenspecific criteria are met.
Historical cost or revaluedamounts are used. Regular valua-tions of entire classes of assetsare required when revaluationoption is chosen.
The cost model requires an assetto be carried at cost less accumu-lated depreciation and impair-ment. However, revaluation ofPPE at fair value is permittedunder the alternative treatment.The revaluation model should beapplied to an entire class ofassets. The increase of an asset’scarrying amount as a result of arevaluation is credited directly toequity under the heading “revalu-ation surplus,” unless it reverses arevaluation decrease for the same
notes and not in the primarystatement.
Headings similar to IFRS, butmore specific guidance for itemsincluded in each category. Director indirect method used; SECencourages the direct method.
Similar to IFRS, except revalua-tions are not permitted.
Research and development costsare expensed as incurred. Somesoftware and website develop-ment costs are capitalized.
Historical cost is used; revalua-tions are not permitted.
PPE is carried at cost less accu-mulated depreciation andimpairment losses. Revaluationsare not permitted. Consistentwith IFRS, impairment testing isperformed whenever events orchanges in circumstances sug-gest the carrying value of anasset is not recoverable
30776_10323-07_AppB.qxd 5/4/07 2:16 PM Page 140

I F R S V E R S U S U . S . G A A P
Description IFRS U.S. GAAP
Assets (Continued)
PP&E: Subsequentmeasurement(Continued)
PP&E: Frequencyof revaluations
Leases:classification
Leases: lessoraccounting
Impairment ofassets
asset, previously recognized as anexpense. In this case, it is recog-nized in the income statement. Arevaluation decrease is chargeddirectly against any related reval-uation surplus for the same asset;any excess is recognized as anexpense. Disclosures of the histor-ical cost equivalent (cost andaccumulated depreciation) ofassets carried at revaluedamounts are required.
Revaluations have to be kept suf-ficiently up to date so that thecarrying amount does not differmaterially from the fair value.This requires regular revaluationsof all PPE in the relevant classwhen the revaluation policy isadopted. At each year-end, man-agement should consider whetherfair value is materially differentfrom carrying value.
A lease is a finance lease if sub-stantially all risks and rewards of ownership are transferred. Substance rather than form isimportant.
Amounts due under financeleases are recorded as a receiv-able. Gross earnings allocated togive constant rate of returnbased on (pre-tax) net invest-ment method.
If impairment is indicated, assetsare written down to higher of fairvalue less costs to sell and valuein use based on discounted cashflows. Reversal of impairmentlosses is required in certain circumstances.
Not applicable.
Similar to IFRS, but with moreextensive form-drivenrequirements.
Similar to IFRS, but with specificrules for leveraged leases.
Impairment is assessed onundiscounted cash flows forassets to be held and used. Ifless than carrying amount,impairment loss is measuredusing market value or dis-counted cash flows. Reversals of losses is prohibited.
30776_10323-07_AppB.qxd 5/4/07 2:16 PM Page 141

I N T E R N A T I O N A L F I N A N C E R E P O R T I N G S T A N D A R D S
Description IFRS U.S. GAAP
Assets (Continued)
Capitalization ofborrowing costs
Inventories
Biological assets
Financial assets:measurement
Held-to-maturityinvestments
Financial assets heldwith a positive intentand ability to hold tomaturity. Includeassets with fixed ordeterminable pay-ments and maturi-ties. Do not includeequity securities, asthey have an indefi-nite life.
Permitted as a policy choice for allqualifying assets, but not required.
Carried at lower of cost and netrealizable value. FIFO or weightedaverage method is used to deter-mine cost. LIFO is prohibited.Reversal is required for subse-quent increase in value of previ-ous write-downs.
Measured at fair value lessestimated point-of-sale costs.
Depends on classification ofinvestment: if held to maturity orloans and receivables, they arecarried at amortized cost; other-wise at fair value. Unrealizedgains/losses on fair valuethrough profit or loss classifica-tion (including trading securities)is recognized in income state-ment. Unrealized gains andlosses on available-for-saleinvestments are recognized in equity.
An entity should have the “posi-tive intent and ability” to hold afinancial asset to maturity, notsimply a present intention. Whenan entity sells more than aninsignificant amount of assets(other than in limited circum-stances), classified as held tomaturity, it is prohibited fromusing the held-to-maturity classi-fication for two full annualreporting periods (known astainting). The entity should alsoreclassify all its held-to-maturityassets as available-for-saleassets.
Measured at amortized cost usingthe effective-yield method.
Required.
Similar to IFRS; however, use ofLIFO is permitted. Reversal ofwrite-down is prohibited.
Not specified. Generallyhistorical cost used.
Accounting model similar toIFRS, with numerous detaileddifferences in application; forexample, no ability to designatefinancial assets at fair valuethrough profit or loss.
Similar to IFRS, although USGAAP is silent about whenassets cease to be tainted. Forlisted companies, the SEC statesthat the taint period for sales ortransfers of held-to-maturitysecurities should be two years.
30776_10323-07_AppB.qxd 5/4/07 2:16 PM Page 142

I F R S V E R S U S U . S . G A A P
Description IFRS U.S. GAAP
Assets (Continued)
Loans andreceivables
Financial assets withfixed or deter-minable paymentsnot quoted in anactive market. Mayinclude loans andreceivables pur-chased, providedtheir intention issimilar, but not inter-ests in pools ofassets (for example,mutual funds).
Financial assets atfair value throughprofit or loss
Two subcategories:financial assets heldfor trading (seebelow), and thosedesignated to thecategory at incep-tion. Any financialasset may, on initialrecognition, be clas-sified as fair valuethrough profit or lossprovided it meetscertain criteria.
Available-for-salefinancial assets
Include debt andequity securities des-ignated as availablefor sale, exceptthose equity securi-ties classified as heldfor trading, andthose not covered byany of the abovecategories.
Measured at amortized cost.
An irrevocable decision to classifya financial asset at fair value, withchanges in fair value recognizedin the income statement, providedit results in more relevant infor-mation because either:(a) it eliminates or significantly
reduces a measurement orrecognition inconsistency;
(b) a group of financial assets,financial liabilities or both ismanaged and performance isevaluated on a fair valuebasis; or
(c) the contract contains one ormore substantive embeddedderivatives.
Measured at fair value.Changes in fair value are recog-nized net of tax effects in equity(i.e., presented in a statement ofchanges in shareholders’ equity orin a SoRIE) and recycled to theincome statement when sold,impaired, or collected.
Foreign exchange gains and losseson debt securities are recognizedin the income statement.
Does not define a loan andreceivable category. Focuses onthe definition of a security.Industry-specific guidance mayalso apply.
No option to designate financialassets at fair value with changesin fair value recognized in theincome statement.
Similar to IFRS, except unlistedequity securities are generallycarried at cost. Exceptions applyfor specific industries. Changesin fair value are reported in othercomprehensive income.
Foreign exchange gains andlosses on debt securities arerecognized in equity.
30776_10323-07_AppB.qxd 5/4/07 2:16 PM Page 143

I N T E R N A T I O N A L F I N A N C E R E P O R T I N G S T A N D A R D S
Description IFRS U.S. GAAP
Liabilities
Provisions: general
Provisions:restructuring
Governmentgrants
Finance leases
Operating leases
Provisions relating to presentobligations from past events arerecorded if outflow of resources isprobable and can be reliablyestimated.
Restructuring provisions are rec-ognized if detailed formal planannounced or implementationeffectively begun.
Recognized as deferred incomeand amortized. Entities may offsetcapital grants against assetvalues.
Requires recognition of an assetheld under a finance lease with acorresponding obligation for futurerentals, at an amount equal to thelower of the fair value of the assetand the present value of the futureminimum lease payments (MLPs)at the inception of the lease. Theasset is depreciated over its usefullife or the lease term if shorter.However, this is only permitted ifthere is no reasonable certainty ofthe lessee obtaining ownership ofthe asset. The interest rate implicitin the lease is normally used to cal-culate the present value of theMLPs. The lessee’s incrementalborrowing rate may be used if theimplicit rate is unknown.
The rental expense under an oper-ating lease is generally recognizedon a straight-line basis over thelease term
Similar to IFRS, with rules forspecific situations such as environmental liabilities, losscontingencies.
Recognition of liability basedsolely on commitment to plan isprohibited. In order to recognize,restructuring plan has to meetthe definition of a liability, includ-ing certain criteria regarding like-lihood that no changes will bemade to plan or that plan will bewithdrawn.
Similar to IFRS, except when con-ditions are attached to grant. Inthis case, revenue recognition isdelayed until such conditions aremet. Long-lived asset contribu-tions recorded as revenue in theperiod received.
Similar to IFRS, except that thelessee’s incremental borrowingrate is used to calculate the pres-ent value of the MLPs, excludingthe portion of payments repre-senting executory costs, unless itis practicable to determine therate implicit in the lease and theimplicit rate is lower than theincremental borrowing rate. Ifthe incremental borrowing rate isused, the amount recorded asthe asset and obligation is lim-ited to the fair value of theleased asset. Asset amortizationis consistent with IFRS.
Similar to IFRS
30776_10323-07_AppB.qxd 5/4/07 2:16 PM Page 144

I F R S V E R S U S U . S . G A A P
Description IFRS U.S. GAAP
Liabilities (Continued)
Leases: lesseeaccounting, saleand leasebacktransactions
Financial liabili-ties: classification
Financial liabilities:measurement
For finance leases, profit arisingon sale and finance leaseback isdeferred and amortized. If anoperating lease arises, profitrecognition depends on whetherthe transaction is at fair value.Substance/linkage of transactionsis considered.
Capital instruments are classified,depending on substance ofissuer’s obligations, as eitherliability or equity.
Mandatorily redeemable prefer-ence shares are classified asliabilities.
Convertible debt is measured atfair value on initial recognition,which is usually the considerationreceived plus incremental anddirectly attributable costs of issuingthe debt. There are two categoriesof financial liabilities: those thatare recognized at fair valuethrough profit or loss (includestrading), and all others. All deriva-tives that are liabilities (exceptqualifying hedging instruments)are trading liabilities. Other tradingliabilities may include a short posi-tion in securities. Financial liabili-ties at fair value through profit orloss (including trading) are mea-sured at fair value (the change isrecognized in the income state-ment for the period). Financial lia-bilities aside from those that aretrading can only be designated atfair value through profit or loss(provided they meet certain crite-ria). All other (nontrading) liabili-ties are carried at amortized costusing the effective interest method.
Timing of profit and loss recogni-tion depends on whether sellerrelinquishes substantially all or a minor part of the use of theasset. Losses are immediatelyrecognized. Specific strict criteriaare considered if the transactioninvolves real estate.
Similar to IFRS but certainredeemable instruments arepermitted to be classified as“mezzanine equity” (i.e., outsideof permanent equity).
Mandatorily redeemable instru-ments with a date or event cer-tain redemption are classified asa liability.
Similar to IFRS. Incremental anddirectly attributable costs of issu-ing debt are deferred as an assetand amortized using the effectiveinterest method. There are alsospecific measurement criteria forcertain financial instruments.Entities cannot use the fair valueoption to designate at initialrecognition a financial liability atfair value through profit or loss.
30776_10323-07_AppB.qxd 5/4/07 2:16 PM Page 145

I N T E R N A T I O N A L F I N A N C E R E P O R T I N G S T A N D A R D S
Description IFRS U.S. GAAP
Liabilities (Continued)
Convertible debt
Equity instruments:recognition andclassification
Revenue recognition
“Split accounting” is used for con-vertible instruments where theconversion is a fixed amount ofcash for a fixed number of shares.The proceeds are allocatedbetween the two components; theequity conversion rights are recog-nized in equity and the liabilityrecognized in liabilities at fairvalue calculated by discounting ata market rate for a nonconvertibledebt. Certain embedded deriva-tives may have to be bifurcated.
An instrument is classified asequity when it does not containan obligation to transfer economicresources. Preference shares thatare not redeemable, or that areredeemable solely at the option ofthe issuer, and for which distribu-tions are at the issuer’s discretion,are classified as equity. Onlyderivative contracts that result inthe delivery of a fixed amount ofcash, or other financial asset for afixed number of an entity’s ownequity instruments, are classifiedas equity instruments. All otherderivatives on the entity’s ownequity are treated as derivatives.
There is a standard on revenuerecognition. The standarddescribes specific criteria for thesale of goods, the rendering ofservices and interest, royalties,and dividends. The revenue recog-nition criteria common to each ofthese are the probability that theeconomic benefits associated withthe transaction will flow to theentity and that the revenue andcosts can be measured reliably.
For conventional convertibledebt, the instrument is treated asone unit and recorded as a liabil-ity in its entirety (no recognitionis given to the equity compo-nent), unless the instrument con-tains a beneficial conversionfeature that requires separation.Similar to IFRS, certain embed-ded derivatives may have to be bifurcated.
Shareholders’ equity is analyzedbetween capital stock (showingseparate categories for non-redeemable preferred stock andcommon stock) and other cate-gories of shareholders’ equity.Mandatorily redeemable financialinstruments (date or event certainredemption), obligations to repur-chase own shares by transferringassets and certain obligations toissue a variable number of sharesare not classified as equity but areconsidered to be liabilities. UnlikeIFRS, certain derivatives of anentity’s own shares that are ormay be net share-settled can beclassified as equity.
The guidance is extensive. Thereare a number of different sourcesof revenue recognition guidance,such as FAS, SABs, SOPs, EITFsand AAERs.
U.S. GAAP focuses more on revenues being realized (eitherconverted into cash or cashequivalents, or the likelihood ofits receipt being reasonably cer-tain) and earned (no materialtransaction pending and therelated performance has
Revenue Recognition
30776_10323-07_AppB.qxd 5/4/07 2:16 PM Page 146
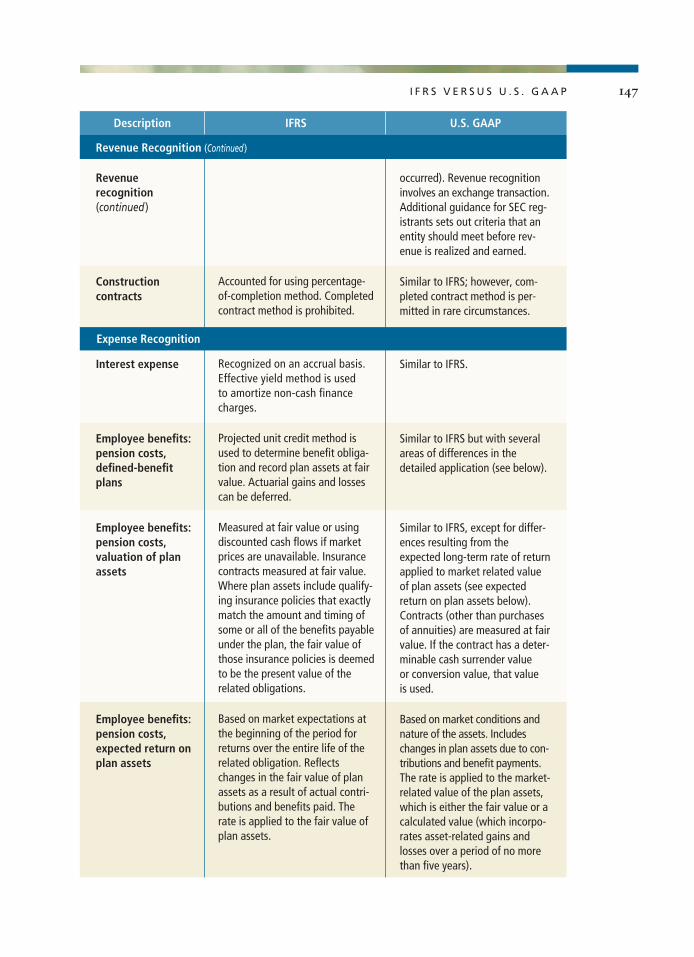
I F R S V E R S U S U . S . G A A P
Description IFRS U.S. GAAP
Revenue Recognition (Continued)
Revenue recognition(continued)
Constructioncontracts
Interest expense
Employee benefits:pension costs,defined-benefitplans
Employee benefits:pension costs,valuation of planassets
Employee benefits:pension costs,expected return onplan assets
Accounted for using percentage-of-completion method. Completedcontract method is prohibited.
Recognized on an accrual basis.Effective yield method is used to amortize non-cash financecharges.
Projected unit credit method isused to determine benefit obliga-tion and record plan assets at fairvalue. Actuarial gains and lossescan be deferred.
Measured at fair value or usingdiscounted cash flows if marketprices are unavailable. Insurancecontracts measured at fair value.Where plan assets include qualify-ing insurance policies that exactlymatch the amount and timing ofsome or all of the benefits payableunder the plan, the fair value ofthose insurance policies is deemedto be the present value of therelated obligations.
Based on market expectations atthe beginning of the period forreturns over the entire life of therelated obligation. Reflectschanges in the fair value of planassets as a result of actual contri-butions and benefits paid. Therate is applied to the fair value ofplan assets.
occurred). Revenue recognitioninvolves an exchange transaction.Additional guidance for SEC reg-istrants sets out criteria that anentity should meet before rev-enue is realized and earned.
Similar to IFRS; however, com-pleted contract method is per-mitted in rare circumstances.
Similar to IFRS.
Similar to IFRS but with severalareas of differences in thedetailed application (see below).
Similar to IFRS, except for differ-ences resulting from theexpected long-term rate of returnapplied to market related valueof plan assets (see expectedreturn on plan assets below).Contracts (other than purchasesof annuities) are measured at fairvalue. If the contract has a deter-minable cash surrender value or conversion value, that value is used.
Based on market conditions andnature of the assets. Includeschanges in plan assets due to con-tributions and benefit payments.The rate is applied to the market-related value of the plan assets,which is either the fair value or acalculated value (which incorpo-rates asset-related gains andlosses over a period of no morethan five years).
Expense Recognition
30776_10323-07_AppB.qxd 5/4/07 2:16 PM Page 147

I N T E R N A T I O N A L F I N A N C E R E P O R T I N G S T A N D A R D S
Description IFRS U.S. GAAP
Expense Recognition (Continued)
Expense for services purchased isrecognized. Correspondingamount is recorded either as a liability or an increase in equity,depending on whether transactionis determined to be cash- orequity-settled. Amount to berecorded is measured at fair valueof shares or share options granted.
Derivatives and hedge instru-ments are measured at fair value;changes in fair value are recog-nized in income statement exceptfor effective portion of cash flowhedges, where the changes aredeferred in equity until effect ofunderlying transaction is recog-nized in income statement.Gains/losses from hedge instru-ments that are used to hedgeforecast transaction may beincluded in cost of nonfinancialasset/liability (basis adjustment).
Effective portion of gains/losseson hedges of net investments isrecognized in equity; ineffectiveportion is recorded in incomestatement. Gains/losses held inequity are transferred to incomestatement on disposal or partialdisposal of investment.
If indicators are mixed and func-tional currency is not obvious,judgment is used to determinefunctional currency that mostfaithfully represents economicresults of entity’s operations byfocusing on currency of primaryeconomic environment in whichentity operates.
Similar model to IFRS. Compen-sation expense is generally rec-ognized based on fair value ofawards at grant date. Severalareas of difference exist inapplication.
Similar to IFRS, except no “basisadjustment” on cash flowhedges of forecast transactions.
Similar to IFRS.Gains/losses are transferred toincome statement upon sale orcomplete or substantially com-plete liquidation of investment.
Similar to IFRS; however, no spe-cific hierarchy of factors to con-sider. In practice, currency inwhich cash flows are settled isoften key consideration.
Employee share compensation
Derivatives and Hedging
Derivatives and other financial instruments: cash flow and fair value hedges
Derivatives and other financial instruments: net investment hedges
Other Information
Functional currency: determination
30776_10323-07_AppB.qxd 5/4/07 2:16 PM Page 148
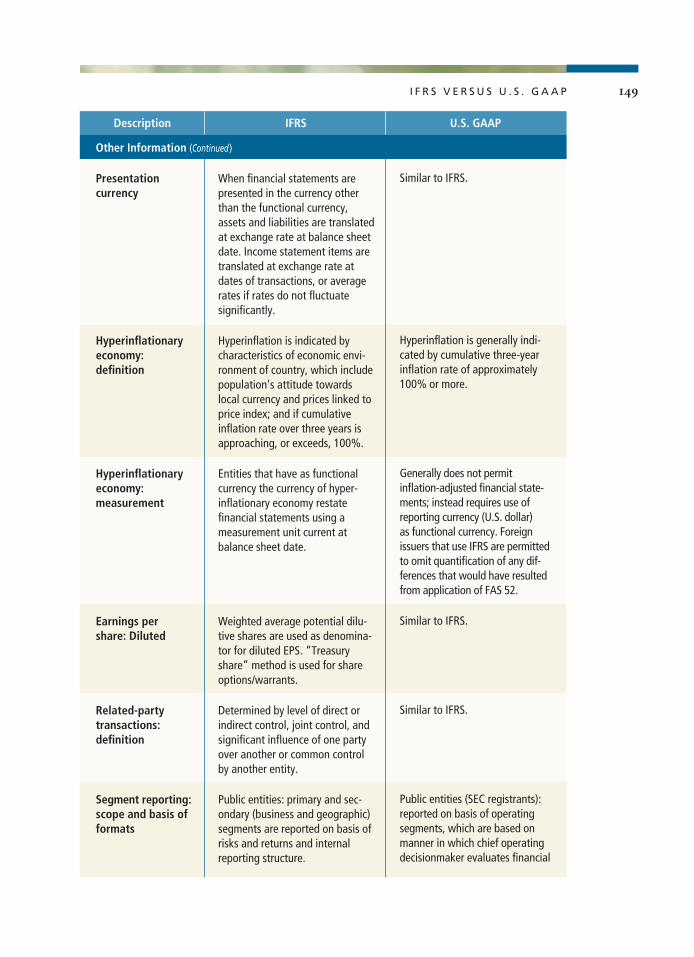
I F R S V E R S U S U . S . G A A P
Description IFRS U.S. GAAP
Other Information (Continued)
Presentation currency
Hyperinflationary economy: definition
Hyperinflationary economy: measurement
Earnings per share: Diluted
Related-party transactions: definition
Segment reporting:scope and basis of formats
When financial statements arepresented in the currency otherthan the functional currency,assets and liabilities are translatedat exchange rate at balance sheetdate. Income statement items aretranslated at exchange rate atdates of transactions, or averagerates if rates do not fluctuatesignificantly.
Hyperinflation is indicated bycharacteristics of economic envi-ronment of country, which includepopulation’s attitude towardslocal currency and prices linked toprice index; and if cumulativeinflation rate over three years isapproaching, or exceeds, 100%.
Entities that have as functionalcurrency the currency of hyper-inflationary economy restatefinancial statements using ameasurement unit current atbalance sheet date.
Weighted average potential dilu-tive shares are used as denomina-tor for diluted EPS. “Treasuryshare” method is used for shareoptions/warrants.
Determined by level of direct orindirect control, joint control, andsignificant influence of one partyover another or common controlby another entity.
Public entities: primary and sec-ondary (business and geographic)segments are reported on basis ofrisks and returns and internalreporting structure.
Similar to IFRS.
Hyperinflation is generally indi-cated by cumulative three-yearinflation rate of approximately100% or more.
Generally does not permit inflation-adjusted financial state-ments; instead requires use ofreporting currency (U.S. dollar) as functional currency. Foreignissuers that use IFRS are permittedto omit quantification of any dif-ferences that would have resultedfrom application of FAS 52.
Similar to IFRS.
Similar to IFRS.
Public entities (SEC registrants):reported on basis of operatingsegments, which are based onmanner in which chief operatingdecisionmaker evaluates financial
30776_10323-07_AppB.qxd 5/4/07 2:16 PM Page 149

I N T E R N A T I O N A L F I N A N C E R E P O R T I N G S T A N D A R D S
Description IFRS U.S. GAAP
Other Information (Continued)
Segment reporting:scope and basis of formats(Continued)
Post–balancesheet events
Interim financialreporting
Insurance andreinsurance con-tract: measure-ment, lossrecognition.income statementpresentation
Oil and gas, andmining
Financial statements are adjustedfor subsequent events, providingevidence of conditions at balancesheet date and materially affectingamounts in financial statements(adjusting events). Nonadjustingevents are disclosed.
Contents are prescribed and basisshould be consistent with full-yearstatements. Frequency of report-ing (e.g., quarterly, half-year) isimposed by local regulator or atdiscretion of entity.
An entity may retain the account-ing policy under previous GAAP(i.e., national GAAP), subject tominimum requirements. Requiresa liability adequacy test. Guaran-teed options are considered in lia-bility adequacy test. “Shadow”adjustments resulting fromassumed realization of unrealizedgains or losses on investmentsrecorded in equity are reflected inequity, if such accounting iselected. Otherwise, any deficiencyresulting from the assumed real-ization of unrealized gains orlosses is reflected through theincome statement. Insurance rev-enues and costs may not be offsetby the effects of reinsurancetransactions.
Entity may choose to capitalizeexploration and evaluation activi-ties under one of two methods:the framework or entity’s existingpolicy if management consider itrelevant and reliable.
information for purposes of allo-cating resources and assessingperformance.
Similar to IFRS.
Similar to IFRS. Additional quar-terly reporting requirementsapply for SEC registrants (domes-tic U.S. entities only) and half-year reporting requirements forcertain foreign private issuers.
Detailed measurement guidanceexists for different types of insur-ance and reinsurance contracts.Similar test is required (referred toas the “premium deficiency” test).
Explicit guidance exists for accruing liabilities for guaranteedlife insurance and annuityoptions; they are also consideredin premium deficiency test.“Shadow” adjustments (including“shadow” premium deficiencyadjustments) resulting fromassumed realization of unrealizedgains or losses on investmentsrecorded in equity are reflected inequity. Insurance revenues andcosts are offset by the effects ofreinsurance transactions.
Entity may choose to capitalizeexploration and evaluation activ-ities under one of two methods:successful efforts or full-costmethod.
30776_10323-07_AppB.qxd 5/4/07 2:16 PM Page 150

I F R S V E R S U S U . S . G A A P
Description IFRS U.S. GAAP
Other Information (Continued)
Historical cost Historical cost is the mainaccounting convention. However,IFRS permits the revaluation ofintangible assets, property, plant,and equipment (PPE) and invest-ment property. IFRS also requirescertain categories of financialinstruments and certain biologicalassets to be reported at fair value.
Prohibits revaluations except forcertain categories of financialinstruments, which have to becarried at fair value.
30776_10323-07_AppB.qxd 5/4/07 2:16 PM Page 151

30776_10323-07_AppB.qxd 5/4/07 2:16 PM Page 152

Ratios Formula Purpose or Use
Liquidity Ratios
B
Financial Ratios
A P P E N D I X
Current ratio
Quick or acid-test ratio
Current cash debt coverage ratio
Asset Management Ratios
Receivables turnover
Inventory turnover
Fixed assets turnover
Coverage Ratios
Debt ratio
Current assetsCurrent liabilities
Cash, marketableSecurities, & receivable (net)
Current liabilities
Net cash provided by operating activities
Average current liabilities
Net salesAverage trade receivables (net)
Cost of goods soldAverage Inventory
Fixed assets turn overAverage net fixed assets
Total debtTotal assets
Measure short-term debt-paying ability
Measures immediate short-term liquidity
Measures a company’sability to pay off its currentliabilities in a given yearfrom its operations
Measures liquidity ofreceivables
Measures liquidity ofinventory
Measures how efficientlyassets are used to generatesales
Measures the percentageof total assets provided bycreditors
30776_10323-09_NEW_AppB.qxd 5/4/07 4:05 PM Page 153

I N T E R N A T I O N A L F I N A N C E R E P O R T I N G S T A N D A R D S
Ratios Formula Purpose or Use
Coverage Ratios (Continued)
Times-interest-earned (TIE) ratio
EBITDA coverage ratio
Cash debt coverage ratio
Book value per share
Profitability Ratios
Profit margin on sales
Return on Asset (ROA)
Return on Common Equity (ROE)
Earnings per share
Price/Earnings (P/E) ratio
Payout ratio
Income beforeinterest charges and taxes (EBIT)
Interest charge
EBITDA + Lease paymentsInterest + Principal + Lease Payments
Net cash provided by operating activities
Average total liabilities
Common stockholders’ equityOutstanding shares
Net income availableto common stockholders
Net sales
Net incomeavailable to common stockholders
Average total assets
Net income availableto common stockholdersAverage Common equity
Net income availableto common stockholders
Weighted shares outstanding
Price per shareEarnings per share
Cash dividendsNet income
Measures ability to meetinterest payments as theycome due
Measures ability to meetfixed financial charges
Measures a company’sability to repay its total liabilities in a given yearfrom its operations
Measures the amount eachshare would receive if thecompany were liquidatedat the amounts reported onthe balance sheet
Measures net income generated by each dollar of sales
Measures overall profitability of assets
Measures profitability ofowners’ investment
Measures net incomeearned on each share ofcommon stock
Measures the ratio of themarket price per share toearnings per share
Measures percentage ofearnings distributed in theform of cash dividends
30776_10323-09_AppD.qxd 5/4/07 2:52 PM Page 154

References
Brigham, F. & Ehrhardt, M. Financial manage-ment: Theory and practice. United States:South-Western Thomson Learning.
Deloitte Touche Tohmatsu. IFRSs in your pocket2006.
Epstein, B. J. (2006). IFRS: Interpretation andapplication of international financial reportingstandards. Hoboken, NJ: Wiley & Sons, Inc.
Greuning, H.V. (2005). International financialreporting standards: A practical guide. Wash-ington, D.C.: The World Bank.
Kieso, D.E., Warfield, T.D., & Weygandt, J.J.(2004). Intermediate accounting. Hoboken,NJ: Wiley & Sons, Inc.
International financial reporting standards: Illus-trative corporate consolidated financial state-ments 2005. Retrieved February 27, 2006, fromhttp://pwc.com/gx/eng/about/svcs/corporatereporting/ICFS2005.
PricewaterhouseCoopers Website. www.pwc.com/ifrs.
Similarities and differences: A comparison of IFRSand US GAAP. Retrieved April 11, 2006, fromhttp://pwc.com/gx/eng/about/svcs/corporatereporting/SandD_05.pdf.
30776_10323-10_Refs.qxd 5/4/07 2:57 PM Page 155

30776_10323-10_Refs.qxd 5/4/07 2:57 PM Page 156