Pseudo-ternary Phase Diagrams of a Drug Delivery System
117
Pseudo-ternary Phase Diagrams of a Drug Delivery System by Ziheng Wang A thesis presented to the University of Waterloo in fulfillment of the thesis requirement for the degree of Master of Applied Science in Chemical Engineering Waterloo, Ontario, Canada, 2009 © Ziheng Wang 2009
Transcript of Pseudo-ternary Phase Diagrams of a Drug Delivery System

Pseudo-ternary Phase Diagrams of a Drug Delivery
System
by
Ziheng Wang
A thesis
presented to the University of Waterloo
in fulfillment of the
thesis requirement for the degree of
Master of Applied Science
in
Chemical Engineering
Waterloo, Ontario, Canada, 2009
© Ziheng Wang 2009

ii
Author's declaration
I hereby declare that I am the sole author of this thesis. This is a true copy of the
thesis, including any required final revisions, as accepted by my examiners.
I understand that my thesis may be made electronically available to the public.
Ziheng Wang

iii
Abstract
The purpose of this research was to develop the pseudo-ternary phase diagrams for a
model drug delivery system consisting of vitamin E (model drug) + soybean oil +
surfactant + co-surfactant (anhydrous glycerol) + water. The model drug (vitamin E)
was loaded in the oil phase. The effects of different surfactants (pure and mixed) on
the phase diagram, especially the microemulsion region, were investigated. The
influence of drug loading level on the phase diagram was also determined. The
surfactants studied were Tween 20, Tween 80, Cremopher EL, and their mixtures. The
size (area) of the microemulsion region of the phase diagram was found to be
dependent on the type of surfactant used and the loading level of drug (vitamin E).
The phenomenon of phase inversion from W/O microemulsion to O/W
microemulsion was also investigated for the drug delivery system consisting of
soybean oil (0% w/w Vitamin E loading or 30% w/w Vitamin E loading) + Tween 80
+ anhydrous glycerol + water. The inversion of phases was detected by observing
changes in the viscosity of the system.

iv
Acknowledgements
Firstly, I would like to show my sincerest appreciation to my supervisor, Professor
Rajinder Pal, for providing me with suggestions, instructions, and financial support
throughout my study.
I would like to thank Professor Pu Chen‟s group, for letting me use the droplet size
analyzer (DLS) in my research. Special appreciation was given to my thesis readers:
Professor Pu Chen and Professor Ali Elkamel, for their kindly reviewing and
suggestions.
I wish to express my gratitude to my family members: Xiuhua Zong and Jun Wang,
for their kind encouragement.
Finally, I would like to acknowledge NSERC for providing financial assistance for the
project.

v
Table of Contents List of Figures………………………………………………………………………viii
List of Tables………………………………………………………………………..xvi
Chapter 1 Introduction and objectives……...………………………………………1
1.1 Introduction….…………………………………………….……………………1
1.2 Objectives...……………………………………………….…………………….3
Chapter 2 Literature Review…...……………………………………………………5
2.1 Emulsion…….…………………………………………….…………………….5
2.1.1 Introduction….……………………………………………………………5
2.1.2 Types of Emulsions……………………………………………………….6
2.2 Microemulsions…………………………………………...…………………….8
2.2.1 Microemulsions are not Nanoemulsions………..…...……………………8
2.2.2 Mechanism of Forming Microemulsions…………..……………………..9
2.2.3 The Application of Microemulsions………………….………………….11
2.2.4 Phase Inversion in Microemulsions………...………..………………….13
2.3 Self-microemulsifying Drug Delivery System……………...…………………17
2.3.1 Drugs Absorption, Distribution, Metabolism and Excretion after Oral
Administration……………...……………………………….…………………17
2.3.2 Self-microemulsifying Drug Delivery System…………..………………19
2.3.3 Drug Capacity in Microemulsions………………………..……………..22
2.3.4 Mechanism of Enhancement of Drugs Absorption in SMEDDS……......23
2.4 Applications of SMEDDS and the Challenges………………..……………….25

vi
2.4.1 Toxicity and Safety of SMEDDS………………………………………..26
2.4.2 Scale-up and Manufacture…………….…………………………………27
Chapter 3 Development of Pseudo-ternary Phase Diagrams..……………...……28
3.1 Selection of Materials.…………………….…………………………………...28
3.2 Experimental Methods…………………………………………………….…..30
3.2.1 Construction of Pseudo-ternary Phase Diagrams.…………………….…30
3.2.2 Particle Size Measurement………………………………………………31
3.3 Experimental Results and Discussion…………………………………………33
Chapter 4 Influence of Drug Loading on the Phase Diagrams..………..……......41
4.1 Introduction……………………………………………………………………41
4.2 Experimental Methods………………………………………………………...43
4.3 Experimental Results and Discussion…………………………………………44
Chapter 5 Phase Inversion Phenomenon in Self-microemulsifying Drug Delivery
System (SMEDDS)……………….…………………………………………………54
5.1 Introduction……………………………………………………………………54
5.2 Experimental Methods………………………………………………………...56
5.2.1 Sample Preparation…………….……………………………………….…56
5.2.2 Viscosity Instrument…….………………………………………………...56
5.3 Experimental Results and Discussion…………………………………………58
Chapter 6 Conclusions and Future Work.……..………………………………….62
6.1 Conclusions……………………………………………………………………62
6.2 Future Work.…………………………………………………………………...64

vii
6.2.1 Mixture Design……………………………………………………………64
6.2.2 Observation of Bicontinuous Microemulsion………………………….....66
Appendices…………………………………………………………………………67
Appendix A Particle Size Distribution…………………………………………67
Appendix B Data for the Phase Inversion………………………………………91
References…………………………………………………………………………93

viii
List of Figures
Figure 2-1: Schematic representation of the dispersed phase structure of micelles,
reverse micelles, o/w microemulsion and w/o microemulsion………..….…….............11
Figure 2-2: Phase inversion Process form W/O emulsion to O/W emulsion……....….14
Figure 2-3: Electron Micrograph of a typical texture of bicontinuous
microemulsions………………………………………………………………………………..15
Figure 2-4: Schematic illustration of phase inversion (up: W/O microemulsion, middle:
bicontinuous microemulsion, down: O/W microemulsion)………………..……….……16
Figure 2-5: The various absorption processes of tablets. Steps A and B: disintegration
to coarse and fine particles respectively. Steps C, D and E: drug dissolution rate C>
D>E. Step F: drug absorption……………………..………………...……………….……19
Figure 2-6: Tie lines of a pseudo-ternary phase diagram……………..……….….…….21
Figure 3-1: The illustration of DLS technique………………………………….......….…31
Figure 3-2: Pseudo-ternary phase diagram for the system: soybean oil (0% w/w
Vitamin E loading in the oil phase) + Tween 80 + anhydrous glycerol + water…..…36
Figure 3-3: Pseudo-ternary phase diagram for the system: soybean oil + Tween 20 +
anhydrous glycerol + water………………………………………………………………....36
Figure 3-4: Pseudo-ternary phase diagram for the system: soybean oil + Cremophor
EL + anhydrous glycerol + water………………..………………………………...………37
Figure 3-5: Pseudo-ternary phase diagrams for the system: soybean oil + Tween 80 +
Tween 20 + anhydrous glycerol + water………………….…………………………….…37

ix
Figure 3-6: Pseudo-ternary phase diagrams for the system: soybean oil + Tween 80 +
Cremophor EL + anhydrous glycerol + water…………...………..……………………..38
Figure 3-7: Pseudo-ternary phase diagrams for the system: soybean oil + Tween 20 +
Cremophor EL + anhydrous glycerol + water……………………………………………38
Figure 4-1: Pseudo-ternary phase diagram for the system: soybean oil (10% w/w
Vitamin E loading in the oil phase) + Tween 80 + anhydrous glycerol + water.…….44
Figure 4-2: Pseudo-ternary phase diagram for the system: soybean oil (20% w/w
Vitamin E loading in the oil phase) + Tween 80 + anhydrous glycerol + water……..45
Figure 4-3: Pseudo-ternary phase diagram for the system: soybean oil (30% w/w
Vitamin E loading in the oil phase) + Tween 80 + anhydrous glycerol + water……..45
Figure 4-4: Pseudo-ternary phase diagram for the system: soybean oil (40% w/w
Vitamin E loading in the oil phase) + Tween 80 + anhydrous glycerol + water..……46
Figure 4-5: Pseudo-ternary phase diagram for the system: soybean oil (50% w/w
Vitamin E loading in the oil phase) + Tween 80 + anhydrous glycerol + water……..46
Figure 4-6: Particle size distribution by intensity for O10S40W50 (oil phase/surfactant
phase/water phase=10%/40%/50%), 20% w/w Vitamin E loading in the oil
phase………………………………………………………………………………………...….50
Figure 4-7: Particle size distribution by intensity for O10S40W50 (oil phase/surfactant
phase/water phase=10%/40%/50%), 30% w/w Vitamin E loading in the oil
phase……………..……………………………………………………………………………..50
Figure 4-8: Particle size distribution by intensity for O10S40W50 (oil phase/surfactant
phase/water phase=10%/40%/50%), 40% w/w Vitamin E loading in the oil

x
phase…………..………………………………………………………………………………..51
Figure 4-9: Particle size distribution by intensity for O15S35W50 (oil phase/surfactant
phase/water phase=15%/35%/50%), 30% w/w Vitamin E loading in the oil
phase……………………….…………………………………………………………………...52
Figure 5-1: Zero shear viscosity of ME in DC (decamethyl cyclopentasiloxane)/CIO
(oil cetyl isooctanoate)/PGMI (polyoxyethylene glyceryl monoisostearate)/15%
Ethanol Aqueous Solution System.……………………..………………………………..…54
Figure 5-2: Viscosity for 10%O (0% Vitamin E loading in the oil phase)/90% S (the
ratio of the oil phase to the surfactant phase is 10%/90% with 0% Vitamin E loading
in the oil phase)…………...……………………………………………..……………..…….58
Figure 5-3: Viscosity for 20%O (0% Vitamin E loading in the oil phase)/80% S (the
ratio of the oil phase to the surfactant phase is 20%/80% with 0% Vitamin E loading
in the oil phase)……..………………………………………………………………...………59
Figure 5-4: Viscosity for 10%O (30% Vitamin E loading in the oil phase)/90% S (the
ratio of the oil phase to the surfactant phase is 10%/90% with 30% Vitamin E loading
in the oil phase)……………………………...…………………….……………………..…..60
Figure 5-5: Viscosity for 20%O (30% Vitamin E loading in the oil phase)/80% S (the
ratio of the oil phase to the surfactant phase is 20%/80% with 30% Vitamin E loading
in the oil phase)……………………………...…………………………………………..…...60
Figure 6-1: Sketch map for mixture design………...……...………………………………65
Figure 6-2: Distribution for each of the run……….………..…………………………….65
Figure A-0-1: Particle size distribution by intensity for O/S=10%/90% (0% w/w
xi
Vitamin E loading) (the ratio of the oil phase to the surfactant phase is 10%/90% with
0% Vitamin E loading in the oil phase)…………………………………………………….68
Figure A-0-2: Particle size distribution by intensity for O/S=20%/80% (0% w/w
Vitamin E loading) (the ratio of the oil phase to the surfactant phase is 20%/80% with
0% Vitamin E loading in the oil phase)…………………………………………………….68
Figure A-0-3: Particle size distribution by intensity for O/S=30%/70% (0% w/w
Vitamin E loading) (the ratio of the oil phase to the surfactant phase is 30%/70% with
0% Vitamin E loading in the oil phase)…………………………………………………....69
Figure A-0-4: Particle size distribution by intensity for O/S=40%/60% (0% w/w
Vitamin E loading) (the ratio of the oil phase to the surfactant phase is 40%/60% with
0% Vitamin E loading in the oil phase)…………………………………………………....69
Figure A-0-5: Particle size distribution by intensity for O/S=50%/50% (0% w/w
Vitamin E loading) (the ratio of the oil phase to the surfactant phase is 50%/50% with
0% Vitamin E loading in the oil phase)………………………………………………..…..70
Figure A-1-1: Particle size distribution by intensity for O/S=10%/90% (10% w/w
Vitamin E loading) (the ratio of the oil phase to the surfactant phase is 10%/90% with
10% Vitamin E loading in the oil phase)…………………………………………………..72
Figure A-1-2: Particle size distribution by intensity for O/S=20%/80% (10% w/w
Vitamin E loading) (the ratio of the oil phase to the surfactant phase is 20%/80% with
10% Vitamin E loading in the oil phase)…………………………………………………..72
Figure A-1-3: Particle size distribution by intensity for O/S=30%/70% (10% w/w
Vitamin E loading) (the ratio of the oil phase to the surfactant phase is 30%/70% with

xii
10% Vitamin E loading in the oil phase)…………………………………………………..73
Figure A-1-4: Particle size distribution by intensity for O/S=40%/60% (10% w/w
Vitamin E loading) (the ratio of the oil phase to the surfactant phase is 40%/60% with
10% Vitamin E loading in the oil phase)………………………………………………..…73
Figure A-1-5: Particle size distribution by intensity for O/S=50%/50% (10% w/w
Vitamin E loading) (the ratio of the oil phase to the surfactant phase is 50%/50% with
10% Vitamin E loading in the oil phase)……………………………………….……….…74
Figure A-2-1: Particle size distribution by intensity for O/S=10%/90% (20% w/w
Vitamin E loading) (the ratio of the oil phase to the surfactant phase is 10%/90% with
20% Vitamin E loading in the oil phase)…………………………………………………..76
Figure A-2-2: Particle size distribution by intensity for O/S=20%/80% (20% w/w
Vitamin E loading) (the ratio of the oil phase to the surfactant phase is 20%/80% with
20% Vitamin E loading in the oil phase)…………………………………………………..76
Figure A-2-3: Particle size distribution by intensity for O/S=30%/70% (20% w/w
Vitamin E loading) (the ratio of the oil phase to the surfactant phase is 30%/70% with
20% Vitamin E loading in the oil phase……………………………………………………77
Figure A-2-4: Particle size distribution by intensity for O/S=40%/60% (20% w/w
Vitamin E loading) (the ratio of the oil phase to the surfactant phase is 40%/60% with
20% Vitamin E loading in the oil phase)......................................................................77
Figure A-2-5: Particle size distribution by intensity for O/S=50%/50% (20% w/w
Vitamin E loading) (the ratio of the oil phase to the surfactant phase is 50%/50% with
20% Vitamin E loading in the oil phase)…………………………………………………..78
xiii
Figure A-3-1: Particle size distribution by intensity for O/S=10%/90% (30% w/w
Vitamin E loading) (the ratio of the oil phase to the surfactant phase is 10%/90% with
30% Vitamin E loading in the oil phase)…………………………………………………..80
Figure A-3-2: Particle size distribution by intensity for O/S=20%/80% (30% w/w
Vitamin E loading) (the ratio of the oil phase to the surfactant phase is 20%/80% with
30% Vitamin E loading in the oil phase)…………………………………………………..80
Figure A-3-3: Particle size distribution by intensity for O/S=30%/70% (30% w/w
Vitamin E loading) (the ratio of the oil phase to the surfactant phase is 30%/70% with
30% Vitamin E loading in the oil phase…………………………………………………....81
Figure A-3-4: Particle size distribution by intensity for O/S=40%/60% (30% w/w
Vitamin E loading) (the ratio of the oil phase to the surfactant phase is 40%/60% with
30% Vitamin E loading in the oil phase…………………………………………………....81
Figure A-3-5: Particle size distribution by intensity for O/S=50%/50% (30% w/w
Vitamin E loading) (the ratio of the oil phase to the surfactant phase is 50%/50% with
30% Vitamin E loading in the oil phase)…………………………………………………..82
Figure A-4-1: Particle size distribution by intensity for O/S=10%/90% (40% w/w
Vitamin E loading) (the ratio of the oil phase to the surfactant phase is 10%/90% with
40% Vitamin E loading in the oil phase)…………………………………………………..84
Figure A-4-2: Particle size distribution by intensity for O/S=20%/80% (40% w/w
Vitamin E loading) (the ratio of the oil phase to the surfactant phase is 20%/80% with
40% Vitamin E loading in the oil phase)…………………………………………………..84
Figure A-4-3: Particle size distribution by intensity for O/S=30%/70% (40% w/w

xiv
Vitamin E loading) (the ratio of the oil phase to the surfactant phase is 30%/70% with
40% Vitamin E loading in the oil phase)…………………………………………………..85
Figure A-4-4: Particle size distribution by intensity for O/S=40%/60% (40% w/w
Vitamin E loading) (the ratio of the oil phase to the surfactant phase is 40%/60% with
40% Vitamin E loading in the oil phase)…………………………………………………..85
Figure A-4-5: Particle size distribution by intensity for O/S=50%/50% (40% w/w
Vitamin E loading) (the ratio of the oil phase to the surfactant phase is 50%/50% with
40% Vitamin E loading in the oil phase)......................................................................86
Figure A-5-1: Particle size distribution by intensity for O/S=10%/90% (50% w/w
Vitamin E loading) (the ratio of the oil phase to the surfactant phase is 10%/90% with
50% Vitamin E loading in the oil phase)…………………………………………………..88
Figure A-5-2: Particle size distribution by intensity for O/S=20%/80% (50% w/w
Vitamin E loading) (the ratio of the oil phase to the surfactant phase is 20%/80% with
50% Vitamin E loading in the oil phase)…………………………………………………..88
Figure A-5-3: Particle size distribution by intensity for O/S=30%/70% (50% w/w
Vitamin E loading) (the ratio of the oil phase to the surfactant phase is 30%/70% with
50% Vitamin E loading in the oil phase)......................................................................89
Figure A-5-4: Particle size distribution by intensity for O/S=40%/60% (50% w/w
Vitamin E loading) (the ratio of the oil phase to the surfactant phase is 40%/60% with
50% Vitamin E loading in the oil phase)…………………………………………………..89
Figure A-5-5: Particle size distribution by intensity for O/S=50%/50% (50% w/w
Vitamin E loading) (the ratio of the oil phase to the surfactant phase is 50%/50% with

xv
50% Vitamin E loading in the oil phase)…………………………………………………..90

xvi
List of Tables
Table 3-1: Vitamin E solubility in different vehicles……..…………………………….…29
Table 4-1: The influence of drug loading on the system ….………..………………...…42
Table 4-2: Mean particle size………………………………..……...……….……………...48
Table 5-1: LV Spindle factor…………………………………………………………………57
Table A-0: Average particle size for 100S0VET80GW (100%w/w Soybean oil in the oil
phase + 0% w/w Vitamin E in the oil phase + Tween 80 + anhydrous glycerol +
water)…………………………………………………………………………………………67
Table A-1: Average particle size for 90S10VET80GW (90%w/w Soybean oil in the oil
phase + 10% w/w Vitamin E in the oil phase + Tween 80 + anhydrous glycerol +
water)………………………………………………………………………………………...…71
Table A-2: Average particle size for 80S20VET80GW (80%w/w Soybean oil in the oil
phase + 20% w/w Vitamin E in the oil phase + Tween 80 + anhydrous glycerol +
water)…………………………………………………………………………………………75
Table A-3: Average particle size for 70S30VET80GW (70%w/w Soybean oil in the oil
phase + 30% w/w Vitamin E in the oil phase + Tween 80 + anhydrous glycerol +
water)…………………………………………………………………………………………79
Table A-4: Average particle size for 60S40VET80GW (60%w/w Soybean oil in the oil
phase + 40% w/w Vitamin E in the oil phase + Tween 80 + anhydrous glycerol +
water)…………………………………………………………………………………………83
Table A-5: Average particle size for 50S50VET80GW (50%w/w Soybean oil in the oil

xvii
phase + 50% w/w Vitamin E in the oil phase + Tween 80 + anhydrous glycerol +
water)…………………………………………………………………………………………...87
Table B-1-1: Dial reading value for 10%O (0% Vitamin E loading)/90%S (the ratio of
oil phase to the surfactant phase is 10%/90% with 0% w/w Vitamin E loading in the
oil phase)………………………………………………………………..……………………..91
Table B-1-2: Dial reading value for 20%O (0% Vitamin E loading)/80%S (the ratio of
oil phase to the surfactant phase is 20%/80% with 0% w/w Vitamin E loading in the
oil phase)…………………………………………..…………………………………..………91
Table B-2-1: Dial reading value for 10%O (30% Vitamin E loading)/90%S (the ratio
of oil phase to the surfactant phase is 10%/90% with 30% w/w Vitamin E loading in
the oil phase)…………..………………………………………………………………………92
Table B-1-2: Dial reading value for 20%O (30% Vitamin E loading)/80%S (the ratio
of oil phase to the surfactant phase is 20%/80% with 30% w/w Vitamin E loading in
the oil phase)…………………………………………………………………………………..92

1
Chapter 1 Introduction and objectives
1.1 Introduction
Oral-based drug delivery system is the most common way to deliver drugs into the
bloodstream. The water-soluble drugs can diffuse freely and easily in gastrointestinal
tract and they have a high bioavailability. However, more and more drugs being
discovered nowadays with the advances in biotechnology and pharmaceutical
technology are oil-soluble [1]. The oil-soluble drugs pose serious problems in that
they cannot diffuse freely and easily in gastrointestinal tract because of their poor
solubility. One way to deliver oil-soluble drugs is to incorporate the drug into an inert
lipid vehicle, such as microemulsions, oils [2], surfactant dispersions [3], and
liposome [4]. At present, at least four drug products are available in the
pharmaceutical market that are delivered in emulsion form; they are: Sandimmune
and Sandimmun Neoral (cyclosporin A), Norvir (ritonavir), and Fortovase
(saquinavir). A significant improvement in the oral bioavailability of these drug
compounds has been demonstrated [5]. Therefore, much attention is focused on using
emulsions as a vehicle to deliver oil-based drugs. Recently, microemulsions have been
used to deliver oil-based drugs. Microemulsions offer several advantages over the
usual (coarse) emulsions. Microemulsions are thermodynamically stable and the
droplets of microemulsions are of very small size. The microemulsion delivery system

2
is also referred to as the “self-microemulsifying drug delivery system (SMEDDS)”.
Self-microemulsifying drug delivery system (SMEDDS) is a pre-mixture of drug, oil,
surfactant and co-surfactant that can be used to deliver oil-based drugs. Upon gentle
shaking and gastric juice dilution in stomach, it can form microemulisons
spontaneously [6]. It is a highly suitable drug delivery system for hydrophobic drugs
because it can be self-emulsified to microemulsion easily and steadily under mild
condition in stomach. The pre-mixture can be stored for a very long period in capsules
because of the high thermodynamic stability. However, a major disadvantage is the
large amount of surfactant needed to form a SMEDDS. Normally the amount of
surfactant required to form a microemulsion is around 4 to 5 times of oil [7]. Another
disadvantage related to large surfactant requirement is the potential toxic effects
associated with the surfactant [8]. Therefore, it is highly desirable to reduce the usage
of surfactants and at the same time, maintain the droplet size at a microemulsion level.

3
1.2 Objectives
The broad objective of this research is to develop the pseudo-ternary phase diagrams
for a drug delivery system. The phase diagrams are needed to identify the
microemulsion region and to find out the optimal composition for the
self-microemulsifying drug within the microemulsion region.
The specific objectives are:
(1) To develop the phase diagrams for the system: Soybean oil (Vitamin E:
dissolved in soybean oil) + Surfactant + Anhydrous Glycerol + Water.
(2) To study the influence of different surfactants on the phase diagram and to
select the optimal surfactant system.
(3) To study the influence of drug loading on the microemulsion region of the
selected system.
(4) To investigate the phase inversion phenomenon occurring in these systems.
Vitamin E, or alpha-tocopherol, is a typical hydrophobic antioxidant that can be used
to treat cardiovascular diseases and cancer [9, 10]. Vitamin E can reach a higher
absorption rate and bioavailability after self-microemulsifying preparation [11] and
was chosen as the model drug in this work. Tween 20, Tween 80, and Cremopher EL
are chosen as surfactants in this research. All of the surfactants are nonionic and are
considered relatively safe. Anhydrous glycerol, which is one of the most common

4
chemicals used in pharmaceutical industry, is the co-surfactant used in this study.
Water was used as the continuous phase.
The particle size is a crucial property to evaluate microemulsion products [12].
Smaller microemulsion particles can ease the drug absorption. Therefore, efforts were
made to minimize the particle size of microemulsions as much as possible.
In the development of the phase diagrams, three types of microemulsion (water-in-oil
microemulsion, oil-in-water microemulsion and bicontinuous microemulsion) were
encountered. A phase inversion from W/O (water-in-oil) microemulsion to O/W
(oil-in-water) microemulsion happened during the titration process involved in the
development of the phase diagrams. The inversion phenomenon was detected by
measuring the viscosity of microemulsions.

5
Chapter 2 Literature Review
2.1 Emulsion
2.1.1 Introduction
Emulsion consists of two immiscible liquids (e.g. oil and water) that are brought
together into one pseudo phase by using surfactants. They are prepared using shearing
force or shaking [13]. The O/W (oil-in-water) emulsion consists of oil droplets
dispersed in the water phase. Oil can be called dispersed phase and water can be
called continuous phase. Similarly, W/O (water-in-oil) emulsion consists of water
droplets dispersed in the oil phase.
The word „emulsion‟ can be found in „macroemulsion‟ as well as in „microemulsion‟
[14]. One major difference between macroemulsion and microemulsion is the particle
size. For macroemulsion, the drop size typically ranges from 0.5μm to 500μm.
These droplets can easily settle down under the influence of gravity. Also,
macroemulsion is thermodynamically unstable system because the interfacial
free-energy is always positive [15-17]. Phase inversion, flocculation, phase separation,
coalescence, and creaming can happen during the storage of macroemulsion.
Microemulsion, on the other hand, can be readily prepared with the diameter of the
droplets in the range of 100nm to 600nm [18]. Compared with macroemulsion,
microemulsion is optically clear (transparent) and thermodynamically stable.

6
Microemulsion is known to have tiny interfacial tension (close to 0), large interfacial
area and zero interfacial free energy [19]. Due to its unique properties, microemulsion
has many applications in industry.
2.1.2 Types of Emulsions
Emulsions can be commonly classified as water-in-oil (W/O) emulsion or oil-in-water
(O/W) emulsion. Generally speaking, hydrophilic surfactant [20] forms O/W
emulsion easily and hydrophobic surfactant [20] is likely to form W/O emulsion.
There are several methods that can be used to distinguish the two types of emulsions:
The first method of testing is called the dying method. A powdered, oil-soluble dye
such as Sudan II is sprinkled in the emulsion. Then the emulsion is inspected under
the microscope. The red background can be seen if the emulsion is W/O type and the
red discrete dots can be detected if the emulsion is O/W type. The second method is
the dilution method. A sample of emulsion is added to both oil and water. W/O
emulsion disperses readily in oil whereas O/W emulsion quickly disperses in water.
The type of emulsion can also be determined by testing electrical conductivity. O/W
emulsion has a much higher conductivity than W/O emulsion. Also note that a sudden
change in viscosity occurs during the phase inversion [20]. With the addition of
aqueous phase liquid to emulsion, the viscosity of O/W emulsion will decrease, and
the viscosity of W/O emulsion will increase.
7
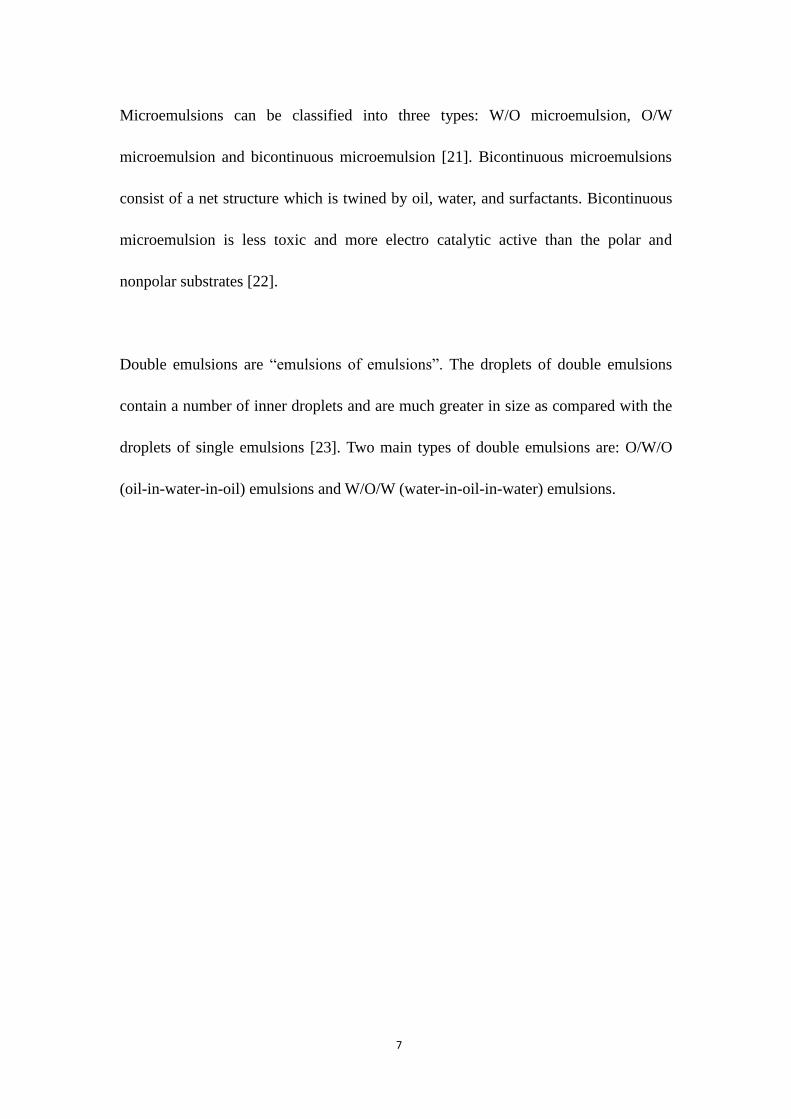
Microemulsions can be classified into three types: W/O microemulsion, O/W
microemulsion and bicontinuous microemulsion [21]. Bicontinuous microemulsions
consist of a net structure which is twined by oil, water, and surfactants. Bicontinuous
microemulsion is less toxic and more electro catalytic active than the polar and
nonpolar substrates [22].
Double emulsions are “emulsions of emulsions”. The droplets of double emulsions
contain a number of inner droplets and are much greater in size as compared with the
droplets of single emulsions [23]. Two main types of double emulsions are: O/W/O
(oil-in-water-in-oil) emulsions and W/O/W (water-in-oil-in-water) emulsions.

8
2.2 Microemulsions
Microemulsions are isotropic, thermodynamically stable systems containing a very
high concentration of surfactant [24]. Microemulsion is an excellent carrier of
oil-based drugs. It has a small particle size, high stability, larger interfacial area and
low interfacial tension and forms spontaneously [25]. A key distinctive property of
microemulsion is its nano-scale particle size.
2.2.1 Microemulsions are not Nanoemulsions
The main difference between microemulsions and nanoemulsions is that
microemulsions are self-assembling nano-scale emulsions whereas nanoemulsions are
nano-scale emulsions formed under intense mechanical shear [26].
Microemulsions are isotropic solutions of oil and water and are prepared using a high
surfactant concentration of around 40 percent under gentle stirring or shaking.
Microemulsions form spontaneously without mechanical shear [27]. An extremely
high concentration of surfactants ensures self-assembling with particle size at the
nano-scale level. Bowcott and Schulman have proved that the
self-microemulsification can happen when the oil-water interfacial tension is zero
[28].
The interfacial tension is given as:

9
γi=γow-π (1)
where γow is the interfacial tension without the presence of surfactant. π is the
spreading pressure of surfactants at the interface. A large amount of surfactant can
result in a high value of π. Therefore, the interfacial tension will reach a negative
value when π>γow. A negative interfacial tension results in negative free energy
and as a consequence microemulsion possesses high stability. Coarse emulsions are
formed when π<γow. The droplets of coarse emulsion tend to coalesce as the
interfacial tension is positive [29].
The preparation of nanoemulsions requires extreme shear in order to rupture large
droplets into nano-scale droplets. The mechanical shear should be intensive enough to
overcome the large interfacial tension [30]. Unlike microemulsions, nanoemulsions
are thermodynamically unstable systems as the interfacial tension between oil and
water phase is high.
2.2.2 Mechanism of Forming Microemulsions
All types of emulsions should be prepared with a certain amount of surfactant.
Surfactants can promote the formation of emulsion as they reduce the interfacial
tension between oil and water by attaching on to the liquid-liquid interface [31].
Surfactants can be thought of as “pollywogs” with hydrophilic head and hydrophobic
tail. There are three types of surfactants: anionic, cationic and nonionic surfactants.
Anionic surfactants have a negative charge on the hydrophilic part and cationic

10
surfactants have a positive charge on the hydrophilic part. Nonionic surfactants have
no charge on the molecules. In the pharmaceutical field, nonionic surfactants are
widely used as they are less irritative than ionic surfactants. Ionic surfactants are used
rarely in special cases [14]. When the surfactant concentration exceeds a certain value,
aggregates of surfactant called “micelle” are formed. The critical concentration of
surfactant where micelles are formed is called critical micelle concentration (CMC).
The surfactant distributes in an energetically favorable way. In water, the hydrophilic
heads of the surfactant molecules are surrounded by water molecules and the
hydrophobic tails of the surfactant molecules are gathered up in the inner portion of
the micelles. In oil, the hydrophilic heads of the surfactant molecules are inside the
micelles (reverse micelles) and the hydrophobic tails of the surfactant molecules
extend away form the core of the micelles to the oil phase [32]. The main difference
between surfactant micelles and emulsion is the liquid phase. Typically, micelles are
formed by adding surfactant to a single liquid phase, either oil (reversed micelles) or
water whereas emulsions are prepared by adding surfactant to a double liquid phase,
such as soybean oil and water.
Micelles have a unique inside structure in that the hydrophobic tails of the surfactant
molecules aggregate in the core center only. When the concentration of the surfactant
reaches CMC, a small amount of the oil droplets can penetrate the hydrophilic
“shield” of the micelles and stabilize into the core center of the micelles [33].
Penetration process results in a spreading of the interface area and consequently
11
increases the spreading pressure of surfactants at the interface. According to equation
(1), when the spreading pressure of surfactant at the interface (π) is greater than the
interfacial tension without the presence of surfactant (γow), the oil-water interfacial
tension (γi) becomes very small (close to zero). Hereby the thermodynamically
stable microemulsions are formed [34-37]. Figure 2-1 shows the structures of typical
micelles and microemulsions.
Figure 2-1: Schematic representation of the dispersed phase structure of micelles, reverse micelles,
o/w microemulsion and w/o microemulsion [55]
2.2.3 The Applications of Microemulsions
Microemulsions have received a lot of attention in both research and industry due to
their unique properties. The characteristic properties of microemulsions are:

12
extremely low interfacial tension, large interfacial area, and capability to solubilize
two immiscible liquids. The distinctive advantages of microemulsions are: small
particle size and high thermodynamic stability [38].
One of the main applications of microemulsions is in the pharmaceutical industry.
Oil-based drugs are easily dissolved in oil but have a very low solubility in water. Due
to this disadvantage, oil-based drugs have a poor bioavailability after oral
administration because of the low solubility and absorption rate in gastrointestinal
lumen. Microemulsions are suitable carriers for oil-based drugs because oil-based
drugs can be dispersed easily in gastrointestinal juice in microemulsion form.
Microemulsions can enhance the oil-based drugs absorption due to their small particle
size. Also the drugs can be stored longer because of the stability of microemulsions
[39]. The only disadvantage of microemulsions as drug carriers is that the toxicity of
the drugs tends to increase due to a large amount of the surfactant utilized in
microemulsion formulation.
Microemulsions have many other applications. For example, hair care product which
contains an amino-functional polyorganosiloxane (a nonionic surfactant) is prepared
in microemulsion form. In microemulsion form, the fragrance and the flavored oils
can be stabilized very well [38]. As microemulsions can easily solubilize organic
components, they can be used as detergents to remove grease, oil and protein during
the cleaning and washing processes [40]. In the oil industry, microemulsions are used

13
to enhance the oil recovery from the reservoir. A lot of oil remains trapped in the
reservoir because of the high interfacial tension between oil and brine. One way to
reduce the interfacial tension and extract the residual oil from the porous media is to
inject surfactant to form microemulsions. This mode of enhanced oil recovery is
called surfactant/microemulsion flooding method [41-43]. Other applications of
microemulsions include: fuels to purge soot, and paint to resist scrub. These
applications show a promising and significant contribution of microemulsion to the
chemical industry.
2.2.4 Phase inversion in microemulsions
Phase inversion is a phenomenon whereby the discrete phase changes into the
continuous phase while the original continuous phase becomes the discrete phase [44].
Figure 2-2 shows the process of the phase inversion schematically [45]. The phase
inversion point, as shown in the Figure 2-2, is the point where the dispersed phase
changes into the continuous phase suddenly. Phase inversion is a severe form of
instability. The inversion can happen when changes are made in the composition of
the system [46]. The physical properties, such as viscosity and conductivity, undergo a
sharp change during the inversion process.

14
Figure 2-2: Phase inversion Process form W/O emulsion to O/W emulsion [45]
Phase inversion can happen during the preparation of microemulsions. O/W
microemulsions and W/O microemulsions can invert from one form to another (O/W
to W/O or W/O to O/W) by going through a third type of microemulison phase called
bicontinuous microemulsions. Bicontinuous microemulsions are a network structure
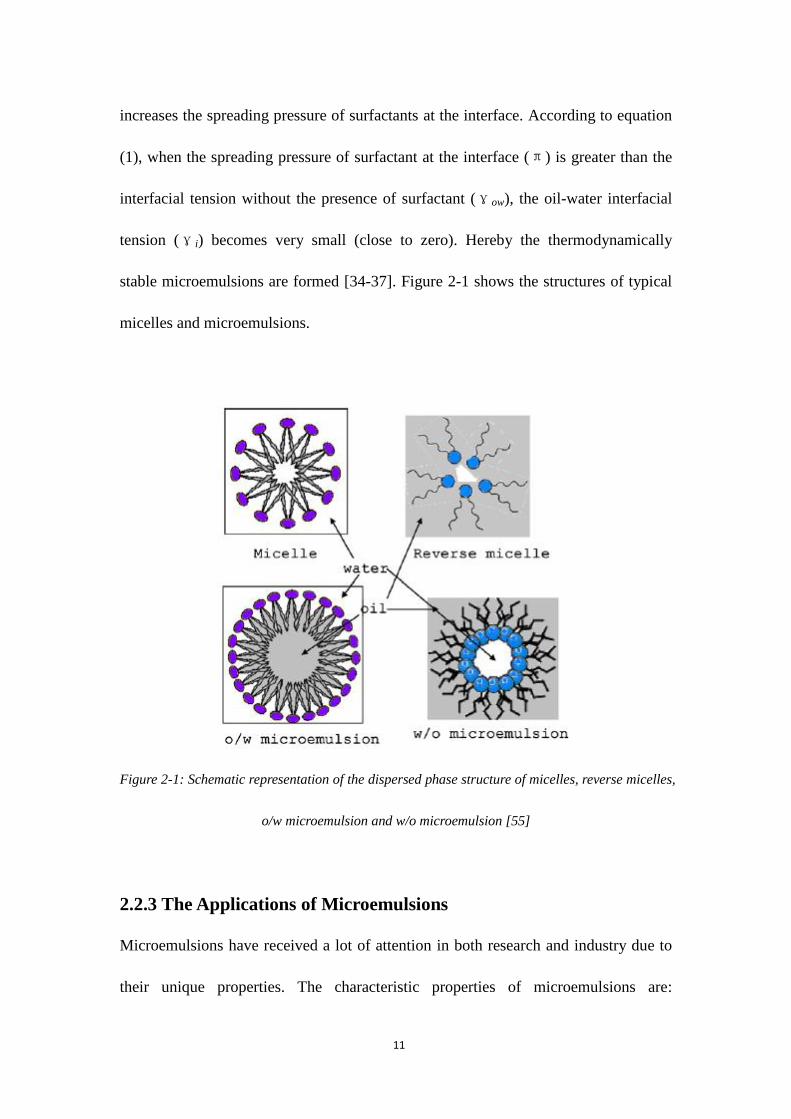
of oil and water twined together with surfactant. Figure 2-3 [21] captured by
Watanabe et al. shows the structure of bicontinuous microemulsions. The micrograph
was obtained by transmission electron microscopy with freeze-fracture replication
method (FF-TEM) [21]. Bicontinuous microemulsions do not have the classical
emulsion structure as there are no aggregates dispersed in the continuous phase. They
are sponge-like structure with intertwined lines of oil and water in the mixture [47].
15
Figure 2-3: Electron Micrograph of a typical texture of bicontinuous microemulsions [21]
Research work carried out by Garti et al. [48] revealed the principle of phase
inversion for microemulsions. These researchers chose Celecosib as the drug, R
(+)-limonene/EtOH (1:2 w/w) as the oil phase, Tween 80 as the surfactant, and
water/glycerol (3:1 w/w) as the aqueous phase. The results showed that W/O
microemulsions invert to O/W microemulsions by going through an intermediate
bicontinuous microemulsion phase. The process is shown in Figure 2-4. The W/O
microemulsion droplets first convert to bicontinuous microemulsion structure when
diluted with water. And then the surfactant molecules re-assemble to form O/W
microemulisons with further dilution. The drug solubilization is lower in O/W
microemulsions as they are more compact [48]. It is important to consider the phase
inversion phenomena in formulating microemulsions as phase inversion can have a
detrimental effect.

16
Figure 2-4: Schematic illustration of phase inversion (up: W/O microemulsion, middle:
bicontinuous microemulsion, down: O/W microemulsion) [1]

17
2.3 Self-microemulsifying Drug Delivery System
Oral administration is a very general way to deliver drugs. Microemulsion-based
drugs can also be delivered orally. Therefore, the general background of drug
absorption and distribution after oral administration is discussed briefly.
2.3.1 Drug Absorption, Distribution, Metabolism and Excretion after
Oral Administration [49]
Drugs can only function when they reach the right organs or tissues. Orally
administrated drugs have a long journey before they can reach the targeted place.
Absorption, distribution and excretion are the main processes that the drugs go
through after oral administration.
After a drug is administrated by mouth, it firstly enters gastrointestinal (GI) tract. The
drug is absorbed in GI tract by diffusing across the cell membrane or mucosal on the
tract. The drug dissolves in gastric juice and stays in stomach for a while. During this
period the drug may be decayed by the digestion process (for example, insulin is
commonly delivered by injection to avoid the digestion process). The drug may also
be destroyed in stomach because of pH environment or due to the attack from
enzymes. The drug may lose activity. From the GI tract, the drug reaches the small
intestine, the main organ for drug absorption, and penetrates across the mucosal on
the small intestine. Water-soluble drugs are more easily absorbed than oil-based drugs

18
because they are easy to disperse in the aqueous gastric juice. The oil-soluble drugs
are always present in the form of droplets in GI tract because of their low solubility. It
is important that the drug is present in the form of small droplets so as to penetrate the
mucosal barriers.
Figure 2-5 shows the process of orally administrated drug entering the blood
circulation after absorption. Normally the drugs are bound by plasma, lipoproteins,
antibody and proteins in the blood stream after absorption. The drugs present in the
portal vein have to enter the hepatic portal system (the liver). The majority of the
drugs will degrade and inactivate or undergo a change in chemical-structure in
endothelial reticulum of the liver cell because of the inhibition from hepatic enzymes.
This phenomenon is called “first pass effect”. The first pass effect can reduce the drug
bioavailability significantly and can be avoided by using other drug delivery systems,
such as transdermal drug delivery system. Drug then goes to systematic circulation.
Inspection of drug loading in oxygen-carried blood at the start of systematic
circulation can interpret the drug bioavailability, which is determined by the drug
absorption rate in GI tract, first pass effect and the metabolism of drug before entering
into systematic system [50]. Only a certain amount of well-designed drug is delivered
to the targeted tissues or organs successfully after the first pass effect with the blood
flow and then metabolize in the targeted place. Some organs, such as brain, can
eliminate most kinds of drugs because of the physical protection of the special barrier.
The delivery rate is highly dependent on the drug itself, the characteristic of the

19
organs or tissues and the way of delivering drugs.
Figure 2-5: The various absorption processes of tablets. Steps A and B: disintegration to coarse
and fine particles respectively. Steps C, D and E: drug dissolution rate C>D>E. Step F: drug
absorption [50]
Most drugs that enter the systematic circulation for treatment are excreted by kidneys.
Renal clearance is the most common way for drug excretion. The drug bioavailability
can be inferred by inspecting the drug recovery in urine samples. Other routes to
eliminate drug are: tears, sweat glands, bile channels, latex, feces or gas. The
excretion rate is related to the ability of the organs (the kidney, bowel, and lungs
function) and the physical property of the drug.
2.3.2 Self-microemulsifying Drug Delivery System
Self-microemulsifying drug delivery system (SMEDDS) is a very promising drug
delivery system for oil-soluble drugs. It is a pre-mixture of drug, oil, surfactants and
co-surfactants and is able to form microemulsion under gentle shaking or stirring

20
spontaneously [51]. Microemulsion is a very clear, isotropic, transparent and
thermodynamically stable system with a very small particle size (below 100nm).
A pseudo-ternary phase diagram of drug, oil, surfactant, co-surfactant, and water can
be very helpful in formulating a suitable composition of SMEDDS. Usually there are
three types of phases encountered in a pseudo-ternary phase diagram: microemulsion
(ME), liquid crystal (LC) and coarse emulsion (EM). Microemulsion (ME) region is
the main region of interest in the formulation of SMEDDS. A large microemulsion
region can offer more flexibility to find the optimal dosage composition.
Microemulsions are identified with their clear and transparent appearance. Liquid
crystal (LC) is a gel-like material that exhibits oil streaks under stirring condition.
They also exhibit birefringence under crossed polarized microscope. Coarse emulsion
(EM) is the traditional thermodynamically unstable emulsion; it appears as milky
white during the preparation and storage. The droplet size of coarse emulsion can
range from sub-microns to microns [52]. The boundary lines between the two
emulsion regions (ME and EM) are drawn out according to the emulsion appearance
and droplet size.
Figure 2-6 is a typical ternary phase diagram. It represents a three component system
(oil, water and surfactant in the present case). Ternary phase diagram can be read
following the solid lines in the figure. For example, point A corresponds to a
composition of 30% water phase, 60% surfactant phase and 10% oil phase. The

21
region to which point A belongs depends on the particle size and the appearance of the
sample. A titration technique is employed for the preparation of the ternary phase
diagrams (In this work, phase diagrams are referred to as “pseudo-ternary” phase
diagrams as the surfactant phase was a mixture of surfactant and co-surfactant). The
titration procedure begins with zero loading of water. The dashed line (tie line) shown
in the figure is followed with the addition of water. The titration procedure ends at a
point of 100% water loading. An infinite number of tie lines can be drawn in any
ternary phase diagram [53]. The titration begins by fixing two components and
varying the third component. In the present work, the titration begins using different
ratios of surfactant phase to the oil phase and following the tie lines with the addition
of water. The mixture of surfactant and co-surfactant (referred to as surfactant phase)
was fixed at 1/1 ratio.
Figure 2-6: Tie lines of a pseudo-ternary phase diagram
22
2.3.3 Drug Capacity in Microemulsions
Self-microemulsifying drug delivery system can be described as oil (with drug) +
surfactant + co-surfactant + water. Water comes from the aqueous phase present in
vivo. No water is loaded in drug preparation. The system with zero water loading is
stored in capsules as reverse micelles before drug administration. The solubilization
or the amount of drug present in reverse micelles is very important to evaluate the
system. The drug solubilization ability of the system is one of the most important
properties in the selection of ingredients.
Drugs are always solubilized at the interface of microemulsion droplets or micelles.
Research work carried out by Spernath et al. [56] showed that reverse micelles have a
higher drug capacity than the individual components. They entrapped lycopene in the
reverse micelle of R-(+)-limonene and polysorbate 60 (Tween 60). The drug capacity
reached 2500ppm (700 ppm in (R)-(+)-limonene and 800 ppm in polysorbate 60) [54].
The reason for increasing capacity of drug solubilization is that the drug can distribute
at the surface of the reverse micelles rather than occupy the core. It is known that the
drug solubilization at reverse micelles surface is highly dependent on the physical
properties of surfactant, co-surfactant, drug, interaction between drug and surfactant,
and Hydrophile-Lipophile Balance Number (HLB) of surfactant. Different
components can result in different solubilization capacity of drugs [55]. However,
drug solubilization reduces after oral administration due to aqueous phase dilution and
structural changes shown in Figure 2-4. Phase inversion also affects solubilization.

23
During the phase inversion, water miscible components, such as co-surfactant, will
move away from the surface and lead to a decrease in drug solubilization [56]. Also
drug solubilization in microemulsions can be influenced by the type of oil, the type of
surfactant, and rate of aqueous phase dilution.
2.3.4 Mechanism of Enhancement of Drugs Absorption in SMEDDS
The droplet size and polarity of oil droplets can influence the bioavailability of
self-microemulsifying drug delivery system. However, the polarity of oil droplets has
a limited impact as the oil droplets are extremely small [57]. An increase in
bioavailability of oil-based drugs delivered in the form of microemulsions is reported
extensively. A decrease in the particle size can enhance the drug absorption to a large
extent.
The factors that influence the bioavailability of self-microemulsifying drugs were
discussed by Gyrsoy and Bentia [5]. The first factor is the surfactant. Surfactants can
increase the drugs permeability. They disrupt the lipid bilayer on the epithelial cell
membrane, a barrier to drug absorption and diffusion, to enhance the dissolution rate
of the drugs [58]. The second factor is the lipids. Oil phase can work not only as a
carrier but also a „shield‟ to protect the attack and degradation from enzymes. Oil
phase is necessary to deliver hydrophilic proteins to lymph systems. The hydrophilic
proteins are incorporated in the water droplets of a W/O microemulsion. Hydrophilic
proteins delivered in the form of W/O microemulsion are called lipoproteins.

24
Lipoproteins are highly lymph-philic and can be transported to lymph systems after
absorption in small intestine. Drugs in lymph systems can reach systematic circulation
directly without the first pass effect. It has been proven that lipoproteins have a higher
bioavailability than non-lipids [59, 60]. The third factor is called P-glycoprotein (P-gp)
inhibition. P-glycoprotein is a type of combined protein existing in normal cells. It
expels the drugs out of the cells as a self-biological defense and can reduce the drugs
absorption. A recent study shows that drugs incorporated in SMEDDS
(self-microemulsifying drug delivery system) can inhibit the activity of
P-glycoprotein which results in an enhancement of oral absorption [61].

25
2.4 Applications of SMEDDS and the Challenges
The O/W microemulsions are mainly used for the delivery of lipophilic peptide, such
as cyclosporine. In recent years, with the commercialization of Sandimmune Neoral®
(Cyclosporine, an oral hydrophobic drug to treat rejection in organ transplant, is
available as a self-microemulsifying drug), a significant amount of research effort is
being directed to this new pursuit of using microemulsion as a vehicle to deliver
hydrophobic drugs. Sandimmune Neoral® is the second generation of Sandimmune®.
It uses self-microemulsifying drug delivery system to enhance the drug absorption.
According to in vivo study, Sandimmune Neoral® increases area under the plasma
concentration time curve (AUC), which gives a measure of how much and how long a
drug exposures occurs in a body [62]. Therefore, a higher bioavailability can be
reached. For pharmaceutical purposes, microemulsion-based drugs are stored in
capsules which contain a low volume of dosage, around 0.5ml [57]. Besides, the
fluidity of the dosage can also influence the drugs absorption. A common
recommendation is to use less viscous digestible oil, such as medium-chain
triglycerides [63]. But it is still unclear how much can the fluidity influence the drugs
bioavailability as compared with other factors. Also the in vivo behavior of drugs is
difficult to predict because of the following reasons: (1) the accurate route of drugs
after absorption is still not clear, (2) whether the drug will stay in microemulsion form
or release out after absorption is not known, (3) when and where the drugs will be
released is not clear, (4) it is also not clear if the drugs can reach the targeted organ,

26
and (5) it is not known if the particle size change occur after absorption [57]. Another
challenge is the toxicity of surfactants used in SMEDDS.
2.4.1 Toxicity and Safety of SMEDDS
As mentioned in the section 2.3.4, surfactants can enhance the drug absorption by
disrupting the lipid bilayer of the epithelial cell membrane. As a large amount of
surfactant is required to form microemulsions, the toxicity of surfactants should be
also taken into account [63]. A large amount of surfactant can cause irritation or tissue
damage because surfactants can disrupt the lipid bilayer and interact with the mucosa.
For the repeated administration, a large dosage of surfactant can also result in serious
toxicological impact on humans and must be carefully evaluated [58].
Toxicity studies can be divided into two parts: acute oral toxicity and chronic oral
toxicity. Swenson et al. [57] studied the effect of different surfactants on a single pass
rat intestinal perfusion system. They uncovered the enhancement ability of drug
absorption for different surfactants (Tween 80, bile salts and sodium dodecyl sulfate)
and studied the damage on the intestinal wall resulting from surfactants [64]. Further
studies have shown that the epithelial cells can repair damage upon termination of
drug administration. However, long-term effects for repeated drug administration not
can be ignored. A study of chronic oral toxicity is necessary for all the
surfactant-containing microemulsion drugs. The study can be executed on a proper
animal model by using gelatin capsules. The results will reveal relations between the

27
therapeutic effects and the toxicity of a specific surfactant [57]. Extensive research is
needed to reduce the usage of surfactants and maintain the drugs absorption rate at the
same time.
2.4.2 Scale-up and Manufacture
Compared to the challenge of reducing the drug toxicity, scale-up and manufacture of
SMEDDS is easier. This is because of the intrinsic properties of SMEDDS. Two
characteristics, spontaneous formation and thermodynamic stability, are helpful in the
scale-up and manufacture processes. Burskirk et al. [65] discussed the general issues
related to the SMEDDS manufacturing. Because of the advantages of SMEDDS, the
manufacturing process only needs very basic mixing equipment to provide mild
agitation to form micelles. And the preparation does not require careful in- process
control needed in the manufacture of other drugs [65].
In batch-by-batch manufacturing, the degree of the purity and the chemical
instabilities should be monitored carefully. The selection of capsules (soft or hard
gelatin capsules), the selection of oil which can maximize drug solubility, the
hygroscopicity of the contents that can either dehydrate or dissolve the gelatin shell,
are also very important in the pharmaceutical manufacture [57]. Furthermore, the
dynamic changes of the drug should be investigated thoroughly before the
manufacture. The manufacturing conditions are highly dependent on the drug.
Different drugs should be considered separately to obtain the optimum conditions.

28
Chapter 3 Development of Pseudo-ternary
Phase Diagrams
3.1 Selection of Materials
Soybean oil was used as the oil phase and anhydrous glycerol was used as the
co-surfactant. These materials are very commonly used in the pharmaceutical industry
and are considered safe. A literature study has shown that no significant differences in
the microemulsion are observed by using water, simulated gastric juice or simulated
intestinal juice as dilution medium [52]. Therefore, deinoized water was used as
aqueous phase in this research. Three different surfactants were employed: Tween 80
(polysorbate 80), Tween 20 (polysorbate 20) and Cremophor EL (polyethoxylated
castor oil). All of the surfactants are non-ionic, less toxic and widely used in the
pharmaceutical industry. For each of the surfactant, a corresponding pseudo-ternary
phase diagram consisting of Soybean Oil + Surfactant (and co-surfactant: anhydrous
glycerol) + Water was developed. Previous research [51] has shown that the
emulsifying effect is good if the ratio of the surfactant to the co-surfactant is higher
than 1/2.5 but stability properties are inferior at this ratio. Fixing the
surfactant/co-surfactant ratio at 1/1 is a better choice from the stability point of view
[51]. In accordance with this conclusion, the ratio of surfactant to co-surfactant
(anhydrous glycerol) was fixed at 1/1 in the present work.

29
As a larger microemulsion region (ME region) given more flexibility to find the
optimal dosage composition, it is important to select components which would lead to
a large microemulsion region. Some studies have shown that mixtures of two
surfactants (Cremophor EL + Tween 20) can enlarge microemulsion region (ME
region) significantly in the pseudo-ternary phase diagram for the system Capmul PG8
+ Surfactant (either single or combined) + Water [52]. Therefore, mixtures of
surfactants were also used in this research to explore an enlargement of ME region.
Vitamin E was employed as a model drug.
The materials used in the research can be summarized as follows: Vitamin E (α
-Tocopherol, HPLC grade), anhydrous glycerol (GC grade) and Cremophor EL, all
purchased from Fluka. Soybean oil, Tween 80, Tween 20, all purchased from Sigma.
The chemicals were used as received. The solubility of Vitamin E in various
components is given in the table 3-1 [66].
Table 3-1: Vitamin E solubility in different vehicles [66]
Vehicles Solubility of Vitamin E (kg/L)
Soybean Oil >5.0
Tween 80 2.0-2.5
Tween 20 <1.0
Cremopher EL 2.5-3.0
Anhydrous Glycerol <1.0

30
3.2 Experimental Methods
3.2.1 Construction of Pseudo-ternary Phase Diagrams
The ratio of surfactant to co-surfactant was fixed at 1:1 on the weight basis. The
mixture of surfactant and co-surfactant is referred to as “surfactant phase” in the
following discussion. Six types of surfactant phases were prepared: Tween 80 +
Anhydrous Glycerol, Tween 20 + Anhydrous Glycerol, Cremophor EL + Anhydrous
Glycerol, Tween 80 + Tween 20 + Anhydrous Glycerol, Tween 80 + Cremophor EL +
Anhydrous Glycerol, Tween 20 + Cremophor EL + Anhydrous Glycerol. The soybean
oil was mixed with each of the surfactant phases in the ratios (weight basis) of 1:9,
2:8, 3:7, 4:6, 5:5, 6:4, 7:3, 8:2 and 9:1 . A titration technique was employed for the
preparation of the pseudo ternary phase diagrams. Deionized water was added in
small increments (less than 5% w/w) to the mixture of soybean oil/surfactant phase at
room temperature. After each water addition, the mixture was stirred in a beaker for
2-3 min using a stirring bar and a magnetic stirring plate. The titration process
followed the tie lines (dash lines) shown in the pseudo-ternary phase diagram of
Figure 2-6. The phases were identified using visual inspection, microscopic inspection,
and measurement of droplet size. The pseudo-ternary phase diagram consisted of
three regions: EM region representing coarse emulsion region, LC region representing
liquid crystal region, and ME region representing microemulsion region. In each of
the titration runs, several points were noted down as critical points between LC region
and ME region or between LC region and EM region. The critical point was a specific

31
composition where a significant change in the appearance of the mixture occurred.
The boundaries between LC and ME regions, and between LC and EM regions were
drawn on the phase diagram by joining together the critical points.
3.2.2 Particle Size Measurement
The particle size distribution was determined using Dynamic Light Scattering (DLS)
technique. DLS technique, also known as Photon Correlation Spectroscopy, is one of
the most widely used methods to measure the size of nanoparticles. This technique
assumes that all the particles are in Brownian motion in the solution and that all the
particles are very small and spherical.
Scattering of light (normally a laser) takes place when particles are hit by light. The
particle size can be determined based on the physical properties of the scattered light:
the angular distribution, frequency shift, the polarization and the intensity of the light.
[67]. Figure 3-1 shows the principle of DLS technique [68].
Figure 3-1: The illustration of DLS technique [68]
Several steps should be implemented to measure the particle size. The first step is the

32
calibration and the purpose of calibration is to confirm that the laser beam is at the
same height in its entire path [68]. The cuvette (container for the sample) should be
clean enough for the measurement. The filtered deionized water is used as the
dispersant phase. Before the measurement, 1ml filtered deionized water was taken in a
disposable sizing cuvette and the cuvette was put into the cell of the DLS instrument.
The refractive index (RI) was set at 1.330, the viscosity was set at 0.8873cP, and
absorption was set at 0.00 based on the physical properties of filtered deionized water.
The cuvette was equilibrated for 3 minutes before the measurement. When the pure
filtered deionized water was employed for the run, a message “Data not suitable for
analysis. Do you wish to continue the measurement?” should be shown on the control
panel, which means the cuvette is clean enough for the measurement.
Then the particle size measurement can be started. A 20μL sample is sucked into the
clean cuvette. 1ml filtered deionized water is added to dilute the sample. It has been
shown by Li et al. [52] that the dilution process does not influence the particle size.
After the dilution, the sample is placed into the cuvette box to measure the particle
size distribution.

33
3.3 Experimental Results and Discussion
As pointed earlier, the phase diagrams were constructed using titration along different
tie lines while following a tie line different regions were encountered as described
below.
(1) Transition from LC (liquid crystal) region to ME (microemulsion) region
This situation happened when the amount of surfactant phase (surfactant and
co-surfactant) was very high, such as 95% surfactant phase and 5% oil phase at the
beginning of titration. As an example, consider the composition ratio at the start of the
titration to be as follows: surfactant phase/oil phase=90%/10%. In this case, the
mixture can finally form microemulsion. The mixture was very clear and transparent
before the titration (before water was added). At the beginning of the titration, a small
amount of white precipitate was observed and the mixture became a little bit turbid.
After approximately 7% to 10% (w/w) water was added, the mixture instantly turned
to a very clear and transparent material. The liquid streaks or liquid lines were visible
under mild stirring at this moment. With further addition of water in small amounts,
the mixture was still very clear and transparent and liquid lines or streaks were present.
After a certain amount of water was titrated, the liquid streaks disappeared completely.
The solution is now transparent and clear. The final product is thermodynamically
very stable for several months. No change can be observed under the optical
microscope.

34
(2) Transition between ME (microemulsion) region and EM (coarse emulsion) region
This situation happened when the surfactant phase (surfactant and co-surfactant)
amount was moderately high, such as 70% surfactant phase and 30% oil phase at the
beginning of titration. In this case too, the mixture can form microemulsion in the end.
The mixture is very clear and transparent before water is added. At the beginning of
the titration, a small amount of white precipitate was observed and the mixture
became turbid. After approximately 7% to 10% (w/w) water was added, the mixture
suddenly turned to a very clear and transparent material. The liquid streaks or liquid
lines were detected under gentle stirring. By continuing the addition of water, the
liquid streaks disappeared. However, unlike the first situation (transition from LC
region to ME region), the mixture was somewhat cloudy. The final product can be
called microemulsion because most of the particles were under 100nm. Strictly
speaking, these products are in transition region between microemulsion and coarse
emulsion.
(3) Transition from LC (liquid crystal) region to EM (coarse emulsion) region
This type of transition happened when the ratio of surfactant phase to oil phase was
60%/40% or less. Similarly to previous situations, the titration led to the formation of
liquid crystal firstly with 5% (w/w) water addition. However, coarse emulsions were
formed by continuing addition of water. The mixture became very cloudy and opaque
after the disappearance of liquid streaks. The coarse emulsions were
thermodynamically unstable and were found to decay (creaming or phase separation

35
occurred) after storage for several days. However, compared with common coarse
emulsions, the self-assembled coarse emulsions have a smaller particle diameter
(around 600nm).
(4) Only EM (coarse emulsion) region with no transition
When the surfactant phase is relatively low in amount (30% w/w or less) before the
titration is started, the titration leads to EM region directly. The coarse emulsions are
milky in appearance and are thermodynamically unstable. The particles size (diameter)
is around 1000nm.
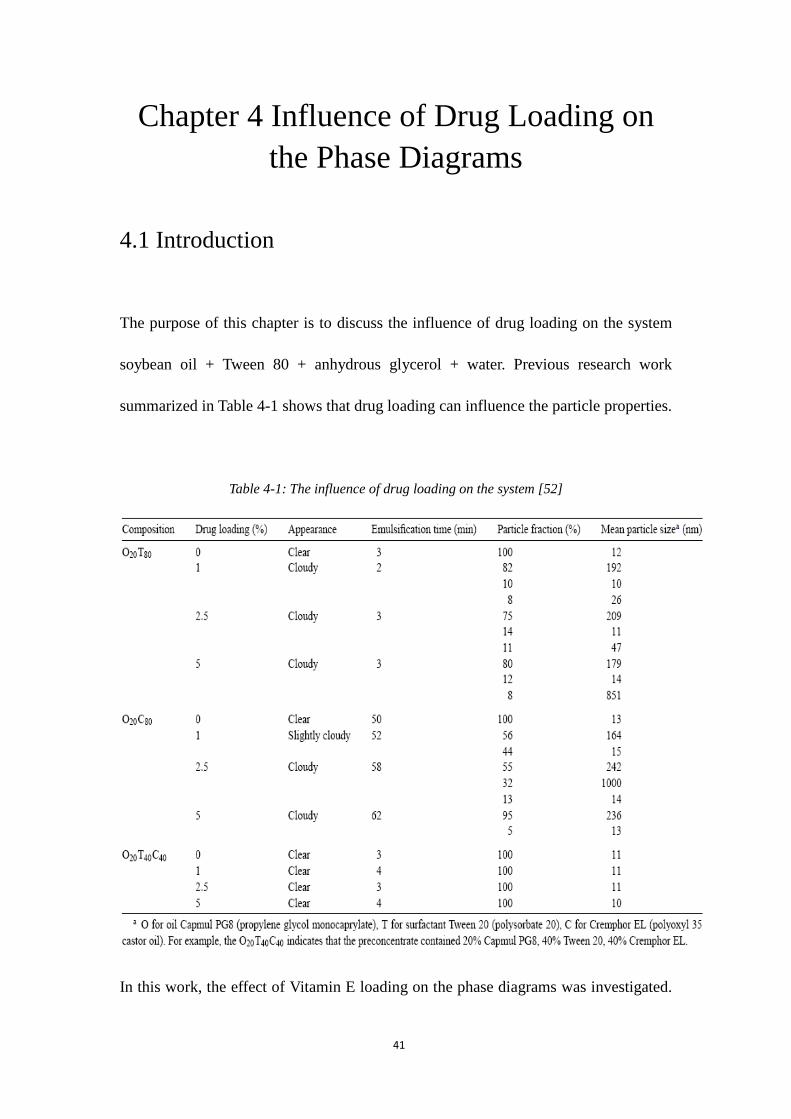
Figure 3-2 to 3-7 show the pseudo-ternary phase diagrams obtained for the system
(soybean oil + surfactant + anhydrous glycerol + water) using different surfactants.
No drug (Vitamin E) was present in the system.
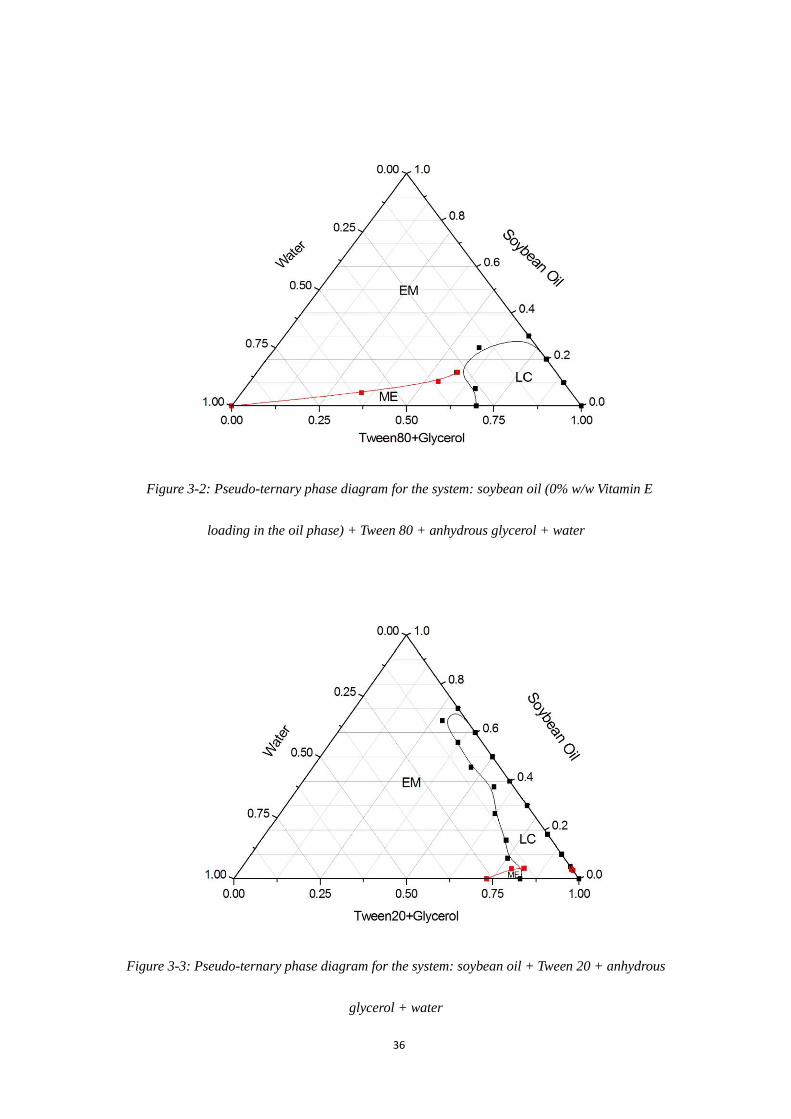
36
Figure 3-2: Pseudo-ternary phase diagram for the system: soybean oil (0% w/w Vitamin E
loading in the oil phase) + Tween 80 + anhydrous glycerol + water
Figure 3-3: Pseudo-ternary phase diagram for the system: soybean oil + Tween 20 + anhydrous
glycerol + water

37
Figure 3-4: Pseudo-ternary phase diagram for the system: soybean oil + Cremophor EL +
anhydrous glycerol + water
Figure 3-5: Pseudo-ternary phase diagrams for the system: soybean oil + Tween 80 + Tween 20 +
anhydrous glycerol + water

38
Figure 3-6: Pseudo-ternary phase diagrams for the system: soybean oil + Tween 80 + Cremophor
EL + anhydrous glycerol + water
Figure 3-7: Pseudo-ternary phase diagrams for the system: soybean oil + Tween 20 + Cremophor
EL + anhydrous glycerol + water

39
Figures 3-2 to 3-4 present the pseudo-ternary phase diagrams using three different
surfactants (Tween 80, Tween 20, Cremophor EL). Apparently, Tween 20 is the worst
surfactant in that it gives a negligibly small ME region. Isotropic microemulsions are
very difficult to form even when Tween 20 + co-surfactant (anhydrous glycerol) is in
high concentration (90% surfactant phase + 10% oil phase). Thus, choosing Tween 20
as the candidate surfactant for self-emulsifying drug delivery system, the potential
toxic risk will be high as an extremely high amount of surfactant will be required.
Furthermore, creaming occurred after few hours of storage. Therefore, Tween 20 is
not a suitable surfactant for the drug delivery system under consideration.
Using Tween 20 in a mixture of surfactants is also not helpful. No enlargement in the
ME region can be found in Figures 3-5 and 3-7. Furthermore, the appearance of
microemulsions prepared from a mixture of Tween 20 and other surfactants is a little
different. Using a single pure surfactant (Tween 80 or Cremophor EL), very clear,
isotropic and transparent microemulsions are formed in ME region. However, the
microemulsions look turbid and cloudy when prepared with mixture of Tween 20 and
other surfactants. In conclusion, Tween 20 has a negative impact on the size of the
ME region for the system: soybean oil + surfactant + anhydrous glycerol + water.
Therefore, Tween 20 was not considered as a candidate surfactant for this specific
system for further studies.
Comparing Figures 3-2, 3-4 and 3-6, one finds that no significant enlargement in ME

40
region occurs when mixture of surfactants Tween 80 and Cremophor EL is used.
Therefore, usage of mixture of different surfactants is not a good choice for the
system under consideration. The combination of two or more surfactants can actually
increase the potential risk of drug administration due to unknown interactions
between chemicals and human body.
Figures 3-2 and 3-4 show that Tween 80 and Cremophor EL have similar ME areas in
the pseudo-ternary phase diagrams. However, Cremophor EL has a lower HLB value
of 13.5 as compared with Tween 80 (HLB of 15). HLB value is a measure of the
degree of hydrophilicity of surfactant [69]. The HLB value ranges from 0 to 20. The
larger the HLB value, more hydrophilic is the surfactant and easier it is for the
surfactant to form oil-in-water emulsions. From HLB point of view, Tween 80 is a
little better than Cremophor EL. Also, Tween 80 is preferred from phase inversion
point of view. As discussed earlier, phase inversion from W/O microemulsion to O/W
microemulsion occurs at the beginning of titration. Tween 80 needed shorter stirring
time to convert to O/W microemulsion than Cremophor EL [12]. This means that
Tween 80 can emulsify the soybean oil faster than Cremophor EL.
In conclusion, the best surfactant (among the pure and mixed ones investigated in this
work) for the system (soybean oil + surfactant + anhydrous glycerol + water) appears
to be Tween 80. Therefore the system soybean oil + Tween 80 + anhydrous glycerol +
water was investigated further for drug loading.
41
Chapter 4 Influence of Drug Loading on
the Phase Diagrams
4.1 Introduction
The purpose of this chapter is to discuss the influence of drug loading on the system
soybean oil + Tween 80 + anhydrous glycerol + water. Previous research work
summarized in Table 4-1 shows that drug loading can influence the particle properties.
Table 4-1: The influence of drug loading on the system [52]
In this work, the effect of Vitamin E loading on the phase diagrams was investigated.

42
Vitamin E is considered as a model drug for the system soybean oil + Tween 80 +
anhydrous glycerol + water. The loading of the drug can result in changes in the
properties of the oil phase and can influence the ME region significantly. Other
properties, such as the particle size, can also be affected because of the drug loading.
To study the influence of Vitamin E loading on the phase diagrams, the titration
method discussed in chapter 3 was used. Water was employed as the aqueous phase.
The surfactant phase consisted of Tween 80 and anhydrous glycerol in the ratio of 1:1
on the weight basis. The oil phase consisted of soybean oil loaded with different
amounts of Vitamin E. The particle size was measured by DLS technique discussed in
chapter 3.

43
4.2 Experimental Methods
The drug (vitamin E) was loaded in the oil phase and the influence of different drug
loadings on the pseudo-ternary phase diagram was determined. The oil phase
contained 10%w/w, 20%w/w, 30%w/w, 40%w/w and 50%w/w of vitamin E
respectively. The ratio of surfactant (Tween 80) to co-surfactant (Anhydrous Glycerol)
was fixed at 1:1. The systems investigated are listed as follow:
(1) Soybean oil (100%) + Tween 80 + Anhydrous Glycerol + Water
(2) Soybean oil, Vitamin E (90%/10%) + Tween 80 + Anhydrous Glycerol + Water
(3) Soybean oil, Vitamin E (80%/20%) + Tween 80 + Anhydrous Glycerol + Water
(4) Soybean oil, Vitamin E (70%/30%) + Tween 80 + Anhydrous Glycerol + Water
(5) Soybean oil, Vitamin E (60%/40%) + Tween 80 + Anhydrous Glycerol + Water
(6) Soybean oil, Vitamin E (50%/50%) + Tween 80 + Anhydrous Glycerol + Water
To construct the pseudo-ternary phase diagrams, the oil phase was prepared by mixing
the soybean oil and Vitamin E together. The same titration method was applied for
each of the systems listed above. The oil phase was mixed with the surfactant phase
(Tween 80 + Anhydrous Glycerol) at ratios of 1/9, 2/8, 3/7, 4/6, 5/5, 6/4, 7/3, 8/2 and
9/1. Titration was carried out by adding a small amount of deionized water (less than
5%) at a time and mixing under gentle stirring for 2 to 3 minutes. The particle size
was measured by DLS.

44
4.3 Experimental Results and Discussion
The pseudo-ternary phase diagrams for different loadings of Vitamin E in the system
are shown in Figure 4-1 to 4-5.
Figure 4-1: Pseudo-ternary phase diagram for the system: soybean oil (10% w/w Vitamin E
loading in the oil phase) + Tween 80 + anhydrous glycerol + water

45
Figure 4-2: Pseudo-ternary phase diagram for the system: soybean oil (20% w/w Vitamin E
loading in the oil phase) + Tween 80 + anhydrous glycerol + water
Figure 4-3: Pseudo-ternary phase diagram for the system: soybean oil (30% w/w Vitamin E
loading in the oil phase) + Tween 80 + anhydrous glycerol + water

46
Figure 4-4: Pseudo-ternary phase diagram for the system: soybean oil (40% w/w Vitamin E
loading in the oil phase) + Tween 80 + anhydrous glycerol + water
Figure 4-5: Pseudo-ternary phase diagram for the system: soybean oil (50% w/w Vitamin E
loading in the oil phase) + Tween 80 + anhydrous glycerol + water

47
Comparing Figure 3-2 and 4-1 to 4-5, it is clear that the influence of drug loading on
the phase diagrams (particularly the microemulsion region) is quite significant. The
microemulsion (ME) region of the phase diagrams undergoes enlargement when the
drug (Vitamin E) loading is increased from 0 to 30% w/w in the oil phase. With
further increase in the drug loading, the microemulsion region tends to shrink. It
should also be noted that for drug loading levels of 40% w/w and 50% w/w, the
microemulsions were not very stable; the samples exhibited phase separation when
left for a few days. Thus, the best loading level of vitamin E is 30% w/w based on the
oil phase (Figure 4-3). At this level of drug loading, the microemulsion region is large
enough to allow some flexibility in choosing an optimal composition for the
SMEDDS (self-microemulsifying drug delivery system). One reason for the variations
in the size of ME region with drug loading is the changes in the properties of the oil
phase. The viscosity of the oil phase was increased significantly with Vitamin E
loading. A gel-like product was formed at the beginning of the titration due to high
viscosity of oil phase. The gentle shaking or stirring lost its effect when the Vitamin E
loading reached 50% w/w (very high viscosity) in the oil phase. Only vigorous
stirring lead to the formation of microemulsion for the system with Vitamin E loading
of 50% w/w based on the oil phase. When pure Vitamin E was used as the oil phase,
microemulsions could not be formed even with vigorous stirring.
The particle size of microemulsions also revealed useful information about the
optimal Vitamin E loading level. The detailed results for different levels of Vitamin E

48
loading are given in appendix A. Table 4-2 presents the mean particle size for
different compositions.
Table 4-2: Mean Particle size
Mean
Particle
Size (nm)
0%
Vitamin E
loading in
the oil
phase
10%
Vitamin E
loading in
the oil
phase
20%
Vitamin E
loading in
the oil
phase
30%
Vitamin E
loading in
the oil
phase
40%
Vitamin E
loading in
the oil
phase
50%
Vitamin E
loading in
the oil
phase
O5S45W50 21.893 20.043 37.393 26.487 16.190 68.157
O10S40W50 101.573 80.263 47.973 27.890 76.093 97.207
O15S35W50 161.233* 117.333 107.433 79.397 93.917 116.233*
O20S30W50 121.533* 140.200 130.800 109.577 110.867* 99.700*
The composition is specified using the notation OxSyWz, where x is % w/w of oil
phase, y is % w/w of surfactant phase, and z is % w/w of water phase. For example,
O5S45W50 represents the composition with 5% w/w of oil phase, 45% w/w of
surfactant phase and 50% w/w of water phase. In any given row of the table, the effect
of drug loading level on the mean droplet size (nm) is shown. The water content of all
compositions shown in Table 4-2 is 50% w/w. The emulsifying time (stirring time)
was kept the same (24 hours) for all the compositions. Phase separation occurred
within a few days of storage in the case of data point with asterisk (see Table 4-2).

49
The measurements in such cases were biased because the particles did not distribute
homogeneously in DLS instrument.
According to Table 4-2, the mean particle size in any column (fixed Vitamin E
loading) increases when the oil concentration is increased and the surfactant
concentration is decreased simultaneously. This is to be expected as less surfactant is
used to emulsify more oil phase. More importantly, the mean particle size is minimum
for 30% Vitamin E loading especially when the oil phase is more than 5% w/w. Thus,
the optimum loading level of drug (Vitamin E) is 30% w/w based on the mean particle
size information.
Figures 4-6 to 4-8 show the particle size distributions of microemulsions for different
loading levels of Vitamin E. The composition of the microemulsions (other than
Vitamin E loading) is the same, that is, 10% w/w oil phase, 20% w/w surfactant phase,
and 50% w/w water phase. The microemulsion at 20% Vitamin E loading (Figure 4-6)
has low polydispersity but the particle size is large. At 40% Vitamin E loading (Figure
4-8), the microemulsion has a high polydispersity. The best distribution in terms of
low mean size and low polydispersity seems to be at 30% Vitamin E loading (Figure
4-7).

50
Figure 4-6: Particle size distribution by intensity for O10S40W50 (oil phase/surfactant phase/water
phase=10%/40%/50%), 20% w/w Vitamin E loading in the oil phase
Figure 4-7: Particle size distribution by intensity for O10S40W50 (oil phase/surfactant phase/water
phase=10%/40%/50%), 30% w/w Vitamin E loading in the oil phase

51
Figure 4-8: Particle size distribution by intensity for O10S40W50 (oil phase/surfactant phase/water
phase=10%/40%/50%), 40% w/w Vitamin E loading in the oil phase
Therefore, the best system is Soybean oil, Vitamin E (70%/30%) + Tween 80 +
Anhydrous Glycerol + Water. The phase diagram of this system is given in Figure 4-3.
The next step is to select the optimal composition in the ME region for the system
with 30% w/w Vitamin E loading in the oil phase. The main factor to be considered is
the initial ratio of the oil phase to the surfactant phase. The target of this research is to
use as little surfactant to emulsify as much drug as possible. Based on the phase
diagram shown in Figure 4-3, five initial starting points are considered as alternative
compositions; they are: oil phase/surfactant phase=10%/90%, 20%/80%, 30%/70%,
35%/65%, 40%/60%. Note that the oil phase of these compositions consisted of 30%
w/w Vitamin E.
It is found that the optimal composition is about 30% w/w oil phase and 70% w/w
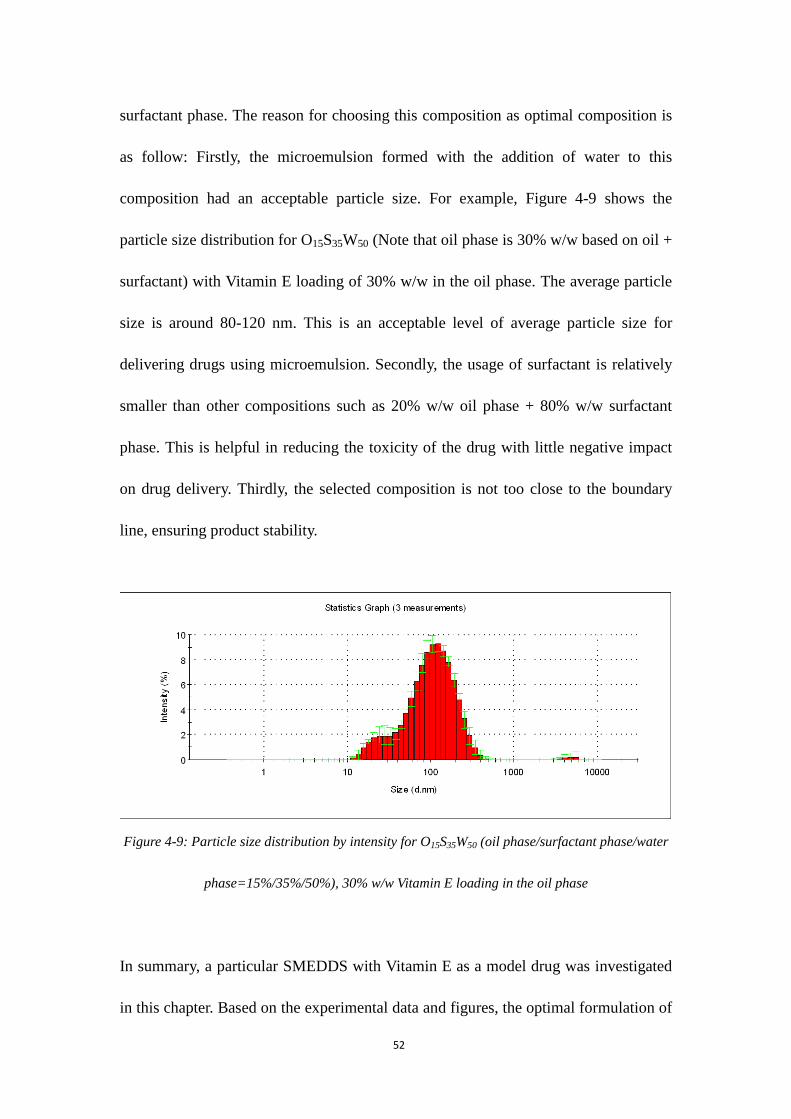
52
surfactant phase. The reason for choosing this composition as optimal composition is
as follow: Firstly, the microemulsion formed with the addition of water to this
composition had an acceptable particle size. For example, Figure 4-9 shows the
particle size distribution for O15S35W50 (Note that oil phase is 30% w/w based on oil +
surfactant) with Vitamin E loading of 30% w/w in the oil phase. The average particle
size is around 80-120 nm. This is an acceptable level of average particle size for
delivering drugs using microemulsion. Secondly, the usage of surfactant is relatively
smaller than other compositions such as 20% w/w oil phase + 80% w/w surfactant
phase. This is helpful in reducing the toxicity of the drug with little negative impact
on drug delivery. Thirdly, the selected composition is not too close to the boundary
line, ensuring product stability.
Figure 4-9: Particle size distribution by intensity for O15S35W50 (oil phase/surfactant phase/water
phase=15%/35%/50%), 30% w/w Vitamin E loading in the oil phase
In summary, a particular SMEDDS with Vitamin E as a model drug was investigated
in this chapter. Based on the experimental data and figures, the optimal formulation of

53
the particular system investigated is: 21% w/w Soybean oil, 9% w/w Vitamin E, 35%
w/w Tween 80 and 35% w/w anhydrous glycerol (this formulation corresponds to the
oil phase to surfactant phase ratio of 30%/70%). The in vitro study reported has used
35% w/w Tween 80 to deliver 9% w/w Vitamin E. Thus, the amount of drug (Vitamin
E) delivered relative to the amount of surfactant required is reasonably good.
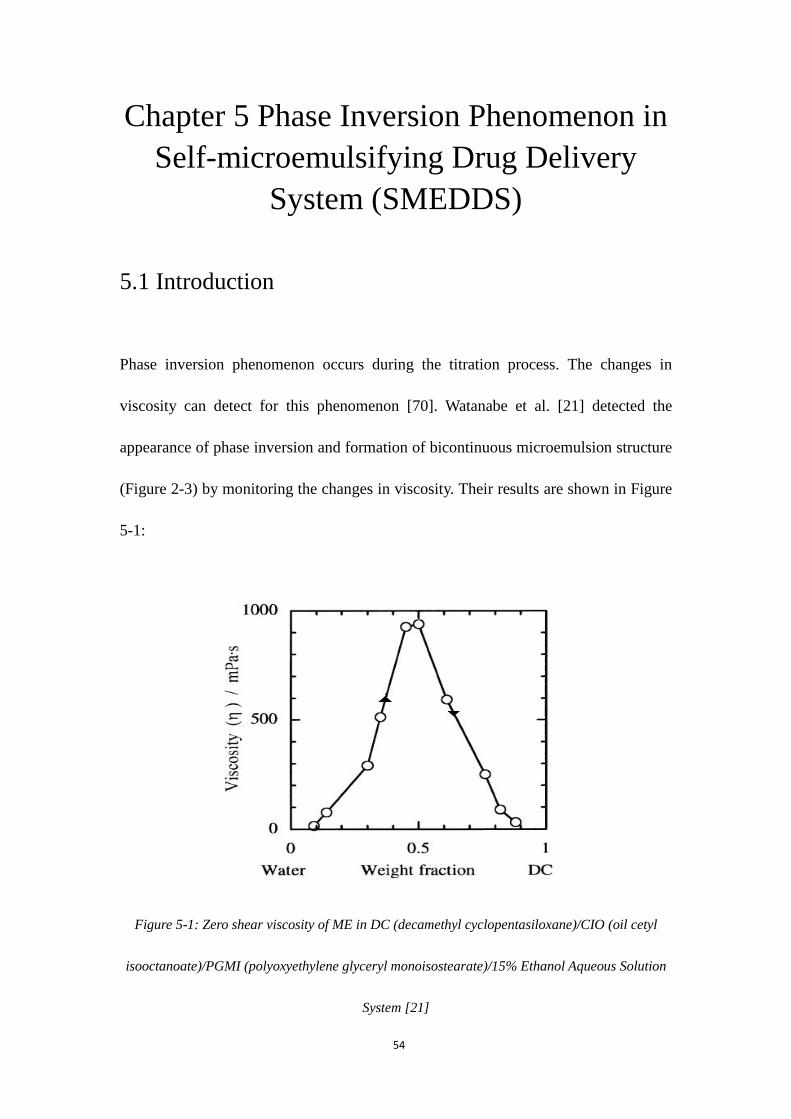
54
Chapter 5 Phase Inversion Phenomenon in
Self-microemulsifying Drug Delivery
System (SMEDDS)
5.1 Introduction
Phase inversion phenomenon occurs during the titration process. The changes in
viscosity can detect for this phenomenon [70]. Watanabe et al. [21] detected the
appearance of phase inversion and formation of bicontinuous microemulsion structure
(Figure 2-3) by monitoring the changes in viscosity. Their results are shown in Figure
5-1:
Figure 5-1: Zero shear viscosity of ME in DC (decamethyl cyclopentasiloxane)/CIO (oil cetyl
isooctanoate)/PGMI (polyoxyethylene glyceryl monoisostearate)/15% Ethanol Aqueous Solution
System [21]

55
The experiment was started with aqueous phase initially. Upon addition of oil phase
(decamethyl cyclopentasiloxane), O/W microemulsion is formed. The viscosity of
O/W microemulsion increases with the increase in oil concentration. The phase
inversion occurs when the viscosity reaches the maximum value. After phase
inversion, the microemulsion was W/O type. Near the phase inversion point, they also
detected the bicontinuous microemulsion structure (Figure 2-3) using FF-TEM [21].
The viscosity of W/O microemulsion decreased with further addition of oil phase.
Other ways to detect phase inversion in emulsions are: conductivity measurement,
dying method and dilution method.

56
5.2 Experimental Methods
5.2.1 Sample Preparation
The objective of this part of our research is to demonstrate that phase inversion occurs
during the titration process involved in the construction of phase diagrams. For this
purposes, two systems (system without drug-Soybean oil (100%) + Tween 80 +
Anhydrous Glycerol + Water and Soybean oil; system with drug-Vitamin E
(70%/30%) + Tween 80 + Anhydrous Glycerol + Water) were selected. For a given
system, two initial compositions (oil phase/surfactant phase=10%/90% and 20%/80%
for both the systems) were selected. The viscosity of the system was measured
progressively with incremental addition of water.
5.2.2 Viscosity Instrument
The viscosity was measured using Brookfield synchro-lectric Viscometer. A disc
shaped spindle (LV 3, see Table 5-1) was used in the measurements. The rotation
speed was fixed at 12 rpm. From Table 5-1, the spindle factor for LV 3 spindle is 100.
The viscosity measurement was conducted after each titration run. The spindle was
cleaned after every run.

57
Table 5-1: LV Spindle factor

58
5.3 Experimental Results and Discussion
Figures 5-2 and 5-3 show the viscometer dial reading as a function of water weight
fraction for systems without drug (Vitamin E). Note that the dial reading can be
converted to viscosity (cP) by multiplying with a factor of 100. For Figure 5-2, the
ratio of oil phase to surfactant phase is 10%/90%. For Figure 5-3, the ratio of oil
phase to surfactant phase is 20%/80%.
0
20
40
60
80
100
0 0.05 0.1 0.15 0.2 0.25 0.3 0.35
Vis
cosi
ty
water fraction (w/w)
Viscosity
Figure 5-2: Viscosity for 10%O (0% Vitamin E loading in the oil phase)/90% S (the ratio of the oil
phase to the surfactant phase is 10%/90% with 0% Vitamin E loading in the oil phase)

59
0
20
40
60
80
100
120
0 0.05 0.1 0.15 0.2 0.25 0.3 0.35
Vis
cosi
ty
water fraction (w/w)
Viscosity
Figure 5-3: Viscosity for 20%O (0% Vitamin E loading in the oil phase)/80% S (the ratio of the oil
phase to the surfactant phase is 20%/80% with 0% Vitamin E loading in the oil phase)
All the data are listed in Appendix B. The mixture was clear at the beginning of the
titration. With the addition of water, the mixture turned cloudy. White precipitate can
be visually detected under stirring. Both the figures (Figure 5-2 and 5-3) exhibit a
drop in viscosity at the beginning of the titration. The mixture became clear and
transparent when the viscosity declined to the lowest point (5%-9% water w/w).
Streaks could also be detected under stirring.
With further addition of water the viscosity begins to increase due to the formation of
W/O microemulsion. The viscosity reaches a maximum value at water fraction of
about 0.167 (Figure 5-2) and 0.13 (Figure 5-3). Near the peak values of viscosity,
phase inversion from W/O to O/W microemulsion occurs. The viscosity of O/W
microemulsion decreases with further increase in water fraction. Also note that the
phase inversion from W/O to O/W microemulsion is delayed in the case of higher

60
surfactant concentration (Figure 5-2, ratio of oil phase to surfactant phase 10%/90%).
0
50
100
150
200
250
0 0.05 0.1 0.15 0.2 0.25 0.3 0.35
Vis
cosi
ty
water fraction (w/w)
Viscosity
Figure 5-4: Viscosity for 10%O (30% Vitamin E loading in the oil phase)/90% S (the ratio of the
oil phase to the surfactant phase is 10%/90% with 30% Vitamin E loading in the oil phase)
0
50
100
150
200
0 0.05 0.1 0.15 0.2 0.25 0.3 0.35
Vis
cosi
ty
water fraction (w/w)
Viscosity
Figure 5-5: Viscosity for 20%O (30% Vitamin E loading in the oil phase)/80% S (the ratio of the
oil phase to the surfactant phase is 20%/80% with 30% Vitamin E loading in the oil phase)
Figure 5-4 and 5-5 show the viscometer reading for systems with 30% drug (Vitamin

61
E) loading. The viscometer reading versus water weight fraction plots of systems with
drug loading are generally similar to those of systems without drug loading. The
initial range of water fraction where the viscosity is either constant or varies slightly
corresponds to liquid crystal region. The region where viscosity reading increases
corresponds to W/O microemulsion region. After the peak value of viscosity, the
region where viscosity decreases with the increase in water fraction corresponds to
O/W microemulsions.
In summary, phase inversion occurred in all water titrating systems. In the initial
water fraction range of about 0 to 0.15, the system was either liquid crystal or W/O
microemulsion. At higher water fraction, the W/O microemulsion inverted to O/W
microemulsion. As the O/W microemulsions are more important from drug delivery
point of view, they are shown as a separate region on the phase diagrams discussed in
previous chapters. The initial water fraction region, where the system is either liquid
crystal or W/O microemulsions, is shown only as one liquid crystal region studied in
this work.

62
Chapter 6 Conclusions and Future Work
6.1 Conclusions
(1) The pseudo-ternary phase diagrams were successfully developed for the following
system: Soybean oil (Vitamin E) + Surfactant + Anhydrous Glycerol + Water.
Special attention was given to identify the microemulsion (ME) region of the
pseudo-ternary phase diagram.
(2) The influence of different surfactants (Tween 20, Tween 80, Cremopher EL) and
their mixtures on the microemulsion region (ME region) of the phase diagrams
was studied. The system: Soybean oil + pure Tween 80 + Anhydrous Glycerol +
Water showed the largest ME region. Consequently, Tween 80 was selected as the
best surfactant for the system.
(3) The effect of drug (Vitamin E) loading on the selected system, Soybean oil +
Tween 80 + Anhydrous Glycerol + Water, was also studied. The loading of
different amounts of Vitamin E in the oil phase resulted in changes of the size of
ME region of the pseudo-ternary phase diagram. The drug (Vitamin E) loading of
30% by weight in the oil phase (Soybean oil/Vitamin E=70%/30%) showed the
largest ME region. Therefore, the system: Soybean oil, Vitamin E (70%/30%) +
Tween 80 + Anhydrous Glycerol + Water was considered as the best system.
(4) The phase inversion phenomenon was investigated at the beginning of the titration
process. The viscosity measurements showed an initial increase and then a large
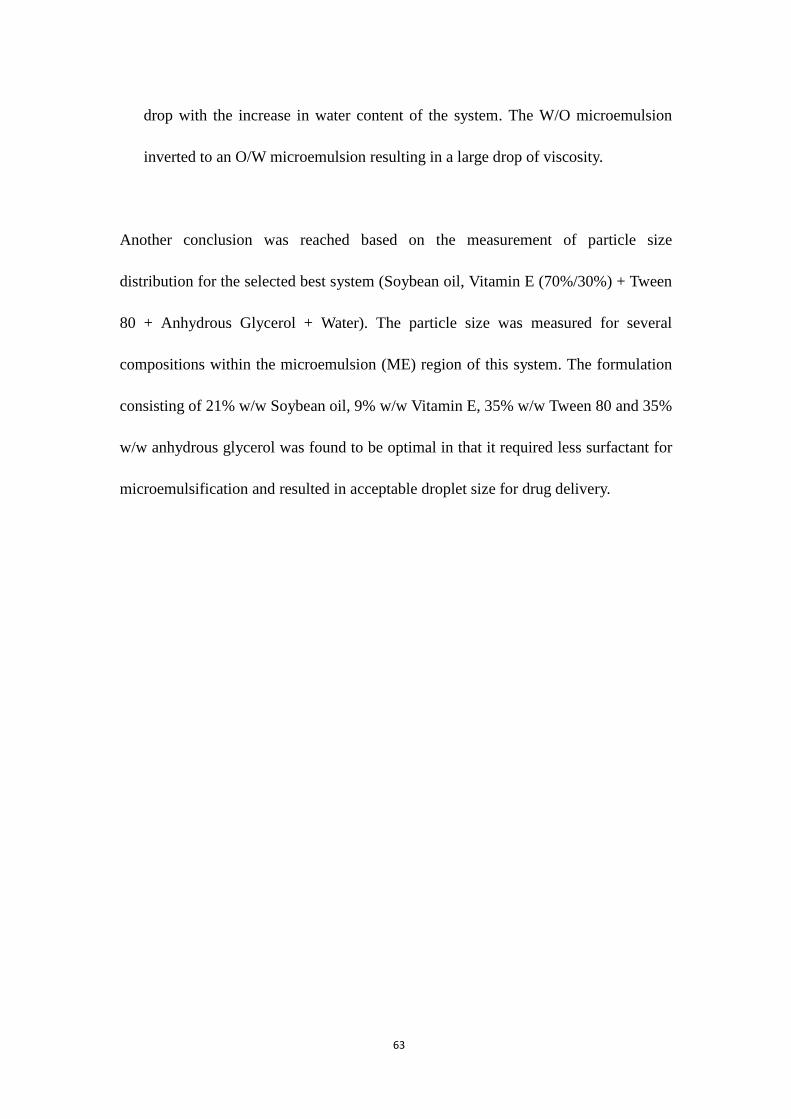
63
drop with the increase in water content of the system. The W/O microemulsion
inverted to an O/W microemulsion resulting in a large drop of viscosity.
Another conclusion was reached based on the measurement of particle size
distribution for the selected best system (Soybean oil, Vitamin E (70%/30%) + Tween
80 + Anhydrous Glycerol + Water). The particle size was measured for several
compositions within the microemulsion (ME) region of this system. The formulation
consisting of 21% w/w Soybean oil, 9% w/w Vitamin E, 35% w/w Tween 80 and 35%
w/w anhydrous glycerol was found to be optimal in that it required less surfactant for
microemulsification and resulted in acceptable droplet size for drug delivery.

64
6.2 Future Work
This research was executed in vitro as a preliminary step to develop an optimal drug
composition. In vivo research is needed in the future as it is critical to select an
optimal composition for the drugs. Some other issues that need to be addressed are:
The modeling of the phase diagrams and the investigation of the structure of
bicontinuous microemulsions. These issues are discussed further in the following
sections.
6.2.1 Mixture Design
The objective of modeling the phase diagrams is to quantify the effect of composition
(different amounts of components) on the particle size. A successful D-optimal design
shows the statistical approach to obtain the relationship between the particle size
distribution and the amounts of various components [71]. Another method called
“mixture design” can also be applied. In this method, the pseudo-ternary phase
diagrams are plotted and several points are selected within the ME region for particle
size measurement. The method can be explained briefly with the help of Figures 6-2
and 6-3.

65
Figure 6-1: Sketch map for mixture design
Figure 6-2: Distribution for each of the run
As shown in Figure 6-1, a triangular region (shaded area) is selected arbitrarily within
the ME region. The constraint that the proportions of different components must sum
to 100% should be satisfied. Note that in the selected triangular region, the oil phase
is less than 20% w/w, the water phase is between 30% w/w and 50% w/w, and the
surfactant phase is between 30% w/w and 50% w/w. Following all these constraints,
the points (composition) can be selected according to Figure 6-2. The particle size

66
distribution can be obtained for each of the composition points. Then the regression
models can be constructed using software called Statistica. The minimum particle size
can be inferred from the regression model and an optimal composition can be
calculated in a statistical way.
6.2.2 Observation of Bicontinuous Microemulsion
The structure of bicontinuous microemulsion is difficult to observe experimentally.
Several instruments (Environmental Scanning Electron Microscope and Atomic Force
Microscopy) were tried to observe the microemulsion but the results were
unsuccessful. The fluidic (liquid) nature of the microemulsion complicated the matter.
A method called freeze-fracture transmission electron microscopy (FF-TEM) has been
used to observe the structure of bicontinuous microemulsion [21]. Generally, the
sample is replicated on a golden disk at first. Then the replica is plunged into liquid
nitrogen and is fractured in a special instrument. The surface structure is then
observed [21]. This method has the limitation that it can be used to observe the
structure of fractured-surface only.

67
Appendices
Appendix A Particle Size Distribution
Table A-0: Average particle size for 100S0VET80GW (100%w/w Soybean oil in the oil phase
+ 0% w/w Vitamin E in the oil phase + Tween 80 + anhydrous glycerol + water)
Sample Name Measurement Date and Time T (°C) Z-Ave (d.nm)
Water 1 06/05/2008 15:21 25 0
*O/S=10%/90% 06/05/2008 15:29 25 21.92
O/S=10%/90% 06/05/2008 15:30 25 22.05
O/S=10%/90% 06/05/2008 15:31 25 21.71
Water 1 06/05/2008 15:40 25 0
O/S=20%/80% 1 06/05/2008 15:49 25 103.9
O/S=20%/80% 2 06/05/2008 15:50 25 101.2
O/S=20%/80% 3 06/05/2008 15:50 25 99.62
Water 1 06/05/2008 16:04 25 0
O/S=30%/70% 1 06/05/2008 16:11 25 158.4
O/S=30%/70% 2 06/05/2008 16:12 25 160.8
O/S=30%/70% 3 06/05/2008 16:13 25 164.5
Water 3 06/05/2008 16:21 25 0
O/S=40%/60% 1 06/05/2008 16:28 25 120.8
O/S=40%/60% 2 06/05/2008 16:29 25 122.2
O/S=40%/60% 3 06/05/2008 16:30 25 121.6
Water 1 06/05/2008 17:03 25 0
O/S=50%50% 1 06/05/2008 17:11 25 172.4
O/S=50%50% 2 06/05/2008 17:12 25 177.4
O/S=50%50% 3 06/05/2008 17:13 25 175
*O/S=10%/90% means the ratio of oil phase to the surfactant phase is 10%/90%

68
Figure A-0-1: Particle size distribution by intensity for O/S=10%/90% (0% w/w Vitamin E
loading) (the ratio of the oil phase to the surfactant phase is 10%/90% with 0% Vitamin E loading
in the oil phase)
Figure A-0-2: Particle size distribution by intensity for O/S=20%/80% (0% w/w Vitamin E
loading) (the ratio of the oil phase to the surfactant phase is 20%/80% with 0% Vitamin E loading
in the oil phase)

69
Figure A-0-3: Particle size distribution by intensity for O/S=30%/70% (0% w/w Vitamin E
loading) (the ratio of the oil phase to the surfactant phase is 30%/70% with 0% Vitamin E loading
in the oil phase)
Figure A-0-4: Particle size distribution by intensity for O/S=40%/60% (0% w/w Vitamin E
loading) (the ratio of the oil phase to the surfactant phase is 40%/60% with 0% Vitamin E loading
in the oil phase)

70
Figure A-0-5: Particle size distribution by intensity for O/S=50%/50% (0% w/w Vitamin E
loading) (the ratio of the oil phase to the surfactant phase is 50%/50% with 0% Vitamin E loading
in the oil phase)

71
Table A-1: Average particle size for 90S10VET80GW (90%w/w Soybean oil in the oil phase +
10% w/w Vitamin E in the oil phase + Tween 80 + anhydrous glycerol + water)
Sample Name Measurement Date and Time T (°C)
Z-Ave
(d.nm)
Water 1 08/05/2008 15:19 25 0
*O/S=10%/90% 1 08/05/2008 15:26 25 20.29
O/S=10%/90% 2 08/05/2008 15:27 25 20.06
O/S=10%/90% 3 08/05/2008 15:28 25 19.78
Water 1 08/05/2008 15:36 25 0
O/S=20%/80% 1 08/05/2008 15:42 25 81.44
O/S=20%/80% 2 08/05/2008 15:43 25 80.09
O/S=20%/80% 3 08/05/2008 15:44 25 79.26
Water 1 08/05/2008 16:14 25 0
O/S=30%/70% 1 08/05/2008 16:21 25 117.7
O/S=30%/70% 2 08/05/2008 16:22 25 116.8
O/S=30%/70% 3 08/05/2008 16:23 25 117.5
Water 1 08/05/2008 16:29 25 0
O/S=40%/60% 1 08/05/2008 16:36 25 140.2
O/S=40%/60% 2 08/05/2008 16:36 25 138.7
O/S=40%/60% 3 08/05/2008 16:37 25 141.7
Water 1 08/05/2008 16:43 25 0
O/S=50%/50% 1 08/05/2008 16:50 25 114.6
O/S=50%/50% 2 08/05/2008 16:51 25 112.4
O/S=50%/50% 3 08/05/2008 16:51 25 112.4
*O/S=10%/90% means the ratio of oil phase to the surfactant phase is 10%/90%

72
Figure A-1-1: Particle size distribution by intensity for O/S=10%/90% (10% w/w Vitamin E
loading) (the ratio of the oil phase to the surfactant phase is 10%/90% with 10% Vitamin E
loading in the oil phase)
Figure A-1-2: Particle size distribution by intensity for O/S=20%/80% (10% w/w Vitamin E
loading) (the ratio of the oil phase to the surfactant phase is 20%/80% with 10% Vitamin E
loading in the oil phase)

73
Figure A-1-3: Particle size distribution by intensity for O/S=30%/70% (10% w/w Vitamin E
loading) (the ratio of the oil phase to the surfactant phase is 30%/70% with 10% Vitamin E
loading in the oil phase)
Figure A-1-4: Particle size distribution by intensity for O/S=40%/60% (10% w/w Vitamin E
loading) (the ratio of the oil phase to the surfactant phase is 40%/60% with 10% Vitamin E
loading in the oil phase)
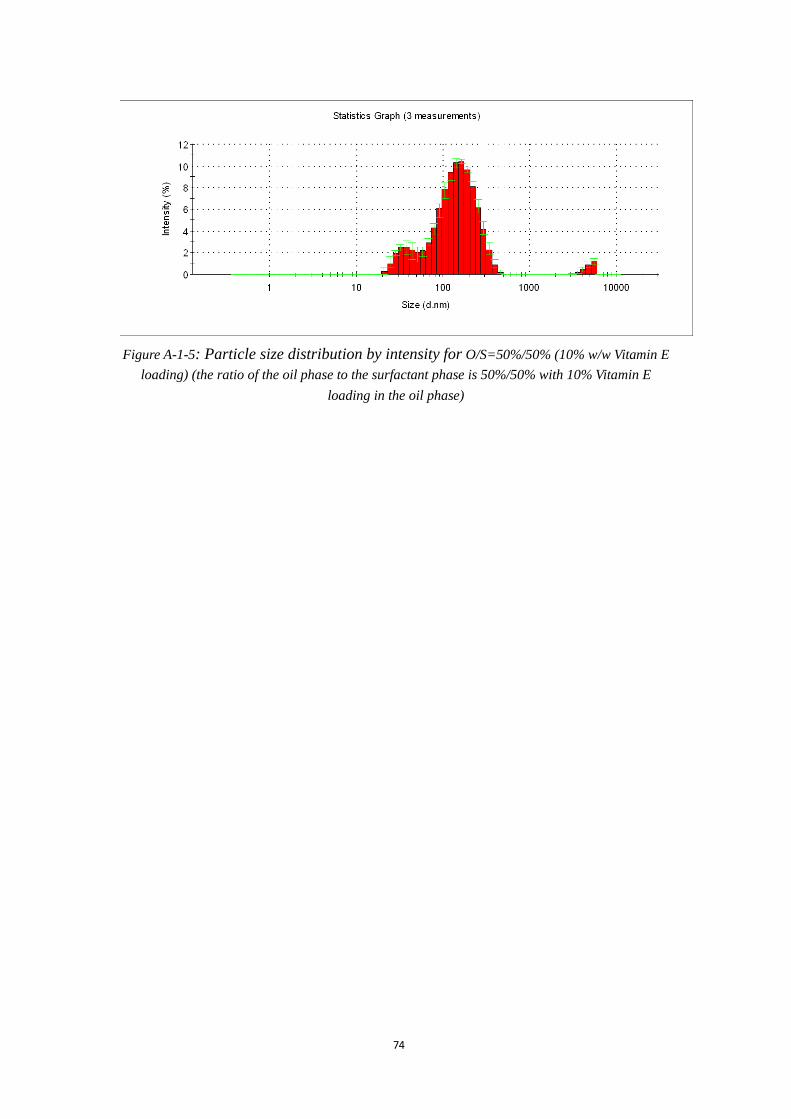
74
Figure A-1-5: Particle size distribution by intensity for O/S=50%/50% (10% w/w Vitamin E
loading) (the ratio of the oil phase to the surfactant phase is 50%/50% with 10% Vitamin E
loading in the oil phase)

75
Table A-2: Average particle size for 80S20VET80GW (80%w/w Soybean oil in the oil phase +
20% w/w Vitamin E in the oil phase + Tween 80 + anhydrous glycerol + water)
Sample Name Measurement Date and Time T (°C)
Z-Ave
(d.nm)
Water 1 15/05/2008 20:17 25 0
*O/S=10%/90% 15/05/2008 20:34 25 37.02
O/S=10%/90% 15/05/2008 20:34 25 36.46
O/S=10%/90% 15/05/2008 20:35 25 38.7
Water 1 15/05/2008 18:39 25 0
O/S=20%/80% 15/05/2008 18:55 25 48.22
O/S=20%/80% 15/05/2008 18:56 25 47.39
O/S=20%/80% 15/05/2008 18:57 25 48.31
Water 1 15/05/2008 19:03 25 0
O/S=30%/70% 1 15/05/2008 19:11 25 109.1
O/S=30%/70% 2 15/05/2008 19:12 25 107.2
O/S=30%/70% 3 15/05/2008 19:13 25 106
Water 1 15/05/2008 19:18 25 0
O/S=40%/60% 15/05/2008 19:32 25 131.4
O/S=40%/60% 15/05/2008 19:33 25 132.5
O/S=40%/60% 15/05/2008 19:34 25 128.5
Water 1 15/05/2008 19:40 25 0
O/S=50%/50% 1 15/05/2008 19:49 25 135.9
O/S=50%/50% 2 15/05/2008 19:50 25 125.7
O/S=50%/50% 3 15/05/2008 19:51 25 129.7
*O/S=10%/90% means the ratio of oil phase to the surfactant phase is 10%/90%

76
Figure A-2-1: Particle size distribution by intensity for O/S=10%/90% (20% w/w Vitamin E
loading) (the ratio of the oil phase to the surfactant phase is 10%/90% with 20% Vitamin E
loading in the oil phase)
Figure A-2-2: Particle size distribution by intensity for O/S=20%/80% (20% w/w Vitamin E
loading) (the ratio of the oil phase to the surfactant phase is 20%/80% with 20% Vitamin E
loading in the oil phase)

77
Figure A-2-3: Particle size distribution by intensity for O/S=30%/70% (20% w/w Vitamin E
loading) (the ratio of the oil phase to the surfactant phase is 30%/70% with 20% Vitamin E
loading in the oil phase)
Figure A-2-4: Particle size distribution by intensity for O/S=40%/60% (20% w/w Vitamin E
loading) (the ratio of the oil phase to the surfactant phase is 40%/60% with 20% Vitamin E
loading in the oil phase)

78
Figure A-2-5: Particle size distribution by intensity for O/S=50%/50% (20% w/w Vitamin E
loading) (the ratio of the oil phase to the surfactant phase is 50%/50% with 20% Vitamin E
loading in the oil phase)

79
Table A-3: Average particle size for 70S30VET80GW (70%w/w Soybean oil in the oil phase +
30% w/w Vitamin E in the oil phase + Tween 80 + anhydrous glycerol + water)
Sample Name Measurement Date and Time T (°C)
Z-Ave
(d.nm)
Water 1 16/05/2008 14:15 25 0
*O/S=10%/90% 1 16/05/2008 14:32 25 34.21
O/S=10%/90% 2 16/05/2008 14:33 25 18.35
O/S=10%/90% 3 16/05/2008 14:34 25 26.9
Water 1 07/02/2008 11:10 25 0
O/S=20%/80% 1 07/02/2008 11:51 25 26.02
O/S=20%/80% 2 07/02/2008 11:53 25 28.83
O/S=20%/80% 3 07/02/2008 11:55 25 28.82
Water 1 07/02/2008 13:36 25 0
O/S=30%/70% 1 07/02/2008 13:44 25 79.01
O/S=30%/70% 2 07/02/2008 13:46 25 78.37
O/S=30%/70% 3 07/02/2008 13:48 25 80.81
Water 1 07/02/2008 14:14 25 0
O/S=40%/60% 1 07/02/2008 14:21 25 98.83
O/S=40%/60% 2 07/02/2008 14:23 25 123.2
O/S=40%/60% 3 07/02/2008 14:25 25 106.7
Water 1 07/02/2008 14:32 25 0
O/S=50%/50% 1 07/02/2008 14:38 25 155.8
O/S=50%/50% 2 07/02/2008 14:40 25 151.6
O/S=50%/50% 3 07/02/2008 14:42 25 149.4
*O/S=10%/90% means the ratio of oil phase to the surfactant phase is 10%/90%

80
Figure A-3-1: Particle size distribution by intensity for O/S=10%/90% (30% w/w Vitamin E
loading) (the ratio of the oil phase to the surfactant phase is 10%/90% with 30% Vitamin E
loading in the oil phase)
Figure A-3-2: Particle size distribution by intensity for O/S=20%/80% (30% w/w Vitamin E
loading) (the ratio of the oil phase to the surfactant phase is 20%/80% with 30% Vitamin E
loading in the oil phase)

81
Figure A-3-3: Particle size distribution by intensity for O/S=30%/70% (30% w/w Vitamin E
loading) (the ratio of the oil phase to the surfactant phase is 30%/70% with 30% Vitamin E
loading in the oil phase)
Figure A-3-4: Particle size distribution by intensity for O/S=40%/60% (30% w/w Vitamin E
loading) (the ratio of the oil phase to the surfactant phase is 40%/60% with 30% Vitamin E
loading in the oil phase)

82
Figure A-3-5: Particle size distribution by intensity for O/S=50%/50% (30% w/w Vitamin E
loading) (the ratio of the oil phase to the surfactant phase is 50%/50% with 30% Vitamin E
loading in the oil phase)

83
Table A-4: Average particle size for 60S40VET80GW (60%w/w Soybean oil in the oil phase +
40% w/w Vitamin E in the oil phase + Tween 80 + anhydrous glycerol + water)
Sample Name Measurement Date and Time T (°C) Z-Ave (d.nm)
Water 1 20/10/2008 14:44 25 0
*O/S=10%/90% 1 20/10/2008 14:56 25 16.42
O/S=10%/90% 2 20/10/2008 14:58 25 15.78
O/S=10%/90% 3 20/10/2008 15:00 25 16.37
Water 1 19/05/2008 14:15 25 0
O/S=20%/80% 1 19/05/2008 14:22 25 73.83
O/S=20%/80% 2 19/05/2008 14:23 25 77.2
O/S=20%/80% 3 19/05/2008 14:24 25 77.25
Water 1 28/02/2008 15:00 25 0
O/S=30%/70% 1 28/02/2008 15:08 25 94.36
O/S=30%/70% 2 28/02/2008 15:10 25 93.62
O/S=30%/70% 3 28/02/2008 15:12 25 93.77
Water 1 28/02/2008 15:41 25 0
O/S=40%/60% 1 28/02/2008 15:48 25 115
O/S=40%/60% 2 28/02/2008 15:50 25 111.6
O/S=40%/60% 3 28/02/2008 15:52 25 106
Water 1 28/02/2008 15:59 25 0
O/S=50%/50% 1 28/02/2008 16:06 25 126.2
O/S=50%/50% 2 28/02/2008 16:08 25 124.1
O/S=50%/50% 3 28/02/2008 16:10 25 122.9
*O/S=10%/90% means the ratio of oil phase to the surfactant phase is 10%/90%
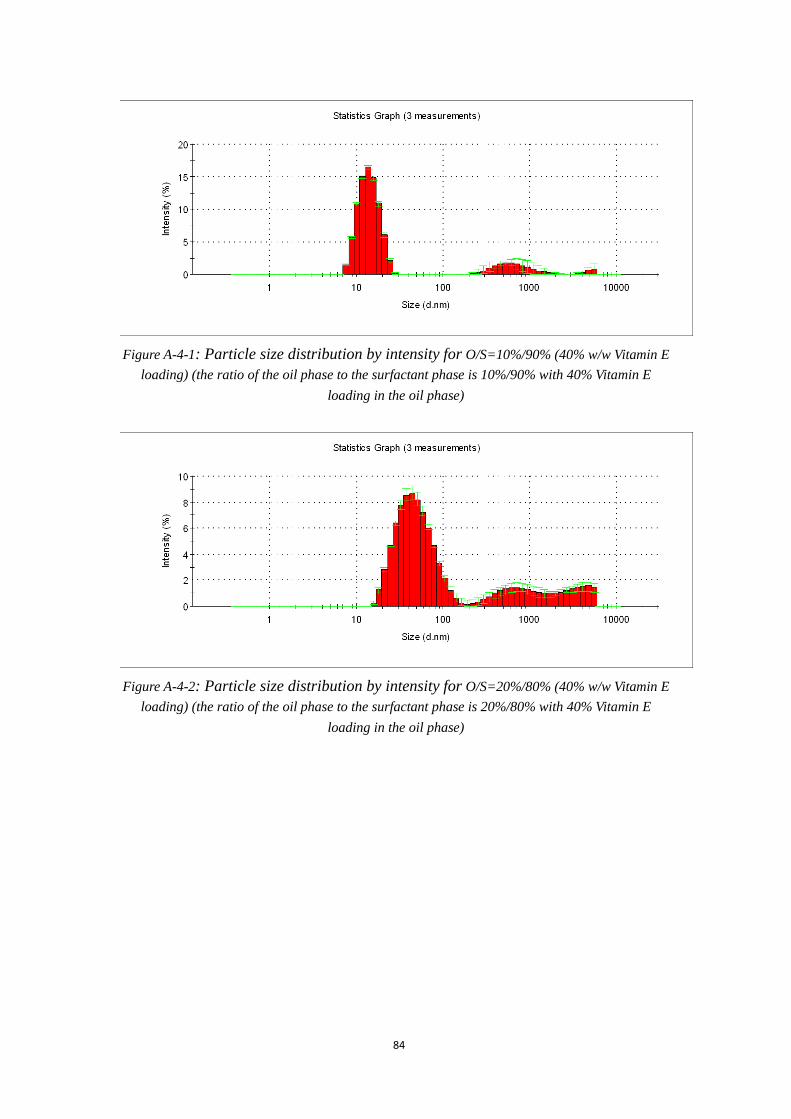
84
Figure A-4-1: Particle size distribution by intensity for O/S=10%/90% (40% w/w Vitamin E
loading) (the ratio of the oil phase to the surfactant phase is 10%/90% with 40% Vitamin E
loading in the oil phase)
Figure A-4-2: Particle size distribution by intensity for O/S=20%/80% (40% w/w Vitamin E
loading) (the ratio of the oil phase to the surfactant phase is 20%/80% with 40% Vitamin E
loading in the oil phase)

85
Figure A-4-3: Particle size distribution by intensity for O/S=30%/70% (40% w/w Vitamin E
loading) (the ratio of the oil phase to the surfactant phase is 30%/70% with 40% Vitamin E
loading in the oil phase)
Figure A-4-4: Particle size distribution by intensity for O/S=40%/60% (40% w/w Vitamin E
loading) (the ratio of the oil phase to the surfactant phase is 40%/60% with 40% Vitamin E
loading in the oil phase)

86
Figure A-4-5: Particle size distribution by intensity for O/S=50%/50% (40% w/w Vitamin E
loading) (the ratio of the oil phase to the surfactant phase is 50%/50% with 40% Vitamin E
loading in the oil phase)

87
Table A-5: Average particle size for 50S50VET80GW (50%w/w Soybean oil in the oil phase +
50% w/w Vitamin E in the oil phase + Tween 80 + anhydrous glycerol + water)
Sample Name Measurement Date and Time T (°C) Z-Ave (d.nm)
Water 1 22/02/2008 13:13 25 0
*O/S=10%/90% 22/02/2008 13:20 25 58.58
O/S=10%/90% 22/02/2008 13:22 25 81.11
O/S=10%/90% 22/02/2008 13:24 25 64.78
Water 1 22/02/2008 13:34 25 0
O/S=20%/80% 1 22/02/2008 13:40 25 83.62
O/S=20%/80% 2 22/02/2008 13:42 25 84.1
O/S=20%/80% 3 22/02/2008 13:44 25 123.9
Water 1 22/02/2008 14:15 25 0
O/S=30%70% 1 22/02/2008 14:22 25 119.9
O/S=30%70% 2 22/02/2008 14:24 25 117.7
O/S=30%70% 3 22/02/2008 14:26 25 111.1
Water 1 22/02/2008 14:31 25 0
O/S=40%/60% 1 22/02/2008 14:37 25 109.1
O/S=40%/60% 2 22/02/2008 14:39 25 96.5
O/S=40%/60% 3 22/02/2008 14:41 25 93.5
Water 1 22/02/2008 14:57 25 0
O/S=50%/50% 1 22/02/2008 15:03 25 127.4
O/S=50%/50% 2 22/02/2008 15:05 25 120
O/S=50%/50% 3 22/02/2008 15:07 25 124.5
*O/S=10%/90% means the ratio of oil phase to the surfactant phase is 10%/90%

88
Figure A-5-1: Particle size distribution by intensity for O/S=10%/90% (50% w/w Vitamin E
loading) (the ratio of the oil phase to the surfactant phase is 10%/90% with 50% Vitamin E
loading in the oil phase)
Figure A-5-2: Particle size distribution by intensity for O/S=20%/80% (50% w/w Vitamin E
loading) (the ratio of the oil phase to the surfactant phase is 20%/80% with 50% Vitamin E
loading in the oil phase)

89
Figure A-5-3: Particle size distribution by intensity for O/S=30%/70% (50% w/w Vitamin E
loading) (the ratio of the oil phase to the surfactant phase is 30%/70% with 50% Vitamin E
loading in the oil phase)
Figure A-5-4: Particle size distribution by intensity for O/S=40%/60% (50% w/w Vitamin E
loading) (the ratio of the oil phase to the surfactant phase is 40%/60% with 50% Vitamin E
loading in the oil phase)

90
Figure A-5-5: Particle size distribution by intensity for O/S=50%/50% (50% w/w Vitamin E
loading) (the ratio of the oil phase to the surfactant phase is 50%/50% with 50% Vitamin E
loading in the oil phase)

91
Appendix B Data for the Phase Inversion
Table B-1-1: Dial reading value for 10%O (0% Vitamin E loading)/90%S (the ratio of oil
phase to the surfactant phase is 10%/90% with 0% w/w Vitamin E loading in the oil phase)
Water (%) Dial Reading Water(g)
0 84 0
0.032258 62 1
0.062793 43 2.01
0.091460 30 3.02
0.118166 40 4.02
0.143347 52 5.02
0.167129 56 6.02
0.189627 44 7.02
0.211149 34 8.03
0.231361 28 9.03
0.250562 22 10.03
0.269362 16 11.06
0.286733 10 12.06
Table B-1-2: Dial reading value for 20%O (0% Vitamin E loading)/80%S (the ratio of oil
phase to the surfactant phase is 20%/80% with 0% w/w Vitamin E loading in the oil phase)
Water (%) Dial reading Water(g)
0 47 0
0.047619 28 1
0.090909 42 2
0.130435 96 3
0.167707 56 4.03
0.202234 36 5.07
0.232835 28 6.07
0.261175 20 7.07
0.287496 10 8.07

92
Table B-2-1: Dial reading value for 10%O (30% Vitamin E loading)/90%S (the ratio of oil
phase to the surfactant phase is 10%/90% with 30% w/w Vitamin E loading in the oil phase)
Water (%) Dial Reading Water (g)
0 84 0
0.032258 64 1
0.062500 57 2
0.090909 52 3
0.117647 95 4
0.143591 50 5.03
0.166667 208 6
0.189189 152 7
0.210526 62 8
0.231360 38 9.03
0.250562 24 10.03
0.268828 18 11.03
0.303783 14 13.09
0.319574 10 14.09
Table B-1-2: Dial reading value for 20%O (30% Vitamin E loading)/80%S (the ratio of oil
phase to the surfactant phase is 20%/80% with 30% w/w Vitamin E loading in the oil phase)
Water (%) Dial Reading Water (g)
0 48 0
0.048525 52 1.02
0.090909 54 2
0.130435 70 3
0.166667 148 4
0.200000 78 5
0.230769 68 6
0.259259 52 7
0.285714 26 8
0.310345 18 9
0.333333 10 10

93
References
[1] Spernath A, Aserin A. (2006). Microemulsion as carriers for drugs and
nutraceuticals, Advances in Colloid and Interface Science 128-130.
[2] Burcham DL, Maurin MB, Hausner EA, Huang SM. (1997). Improved oral
bioavailability of hypocholesterolemic DMP in dogs following dosing in oil and
glycol solutions. Biopharm Drug Dispos; 18:737-42.
[3] Serajuddin ATM, Shee PC, Mufson D, Bernstein DF, Augustine MA. (1988).
Effect of vehicle amphiphilicity on the dissolution and bioavailability of a poorly
water-soluble drug from solid dispersion. J Pharm Sci; 77:414-7.
[4] Schwendener RA, Schott H. (1996). Lipophilic 1-beta-D-arabinofuranosyl
cytosine derivatives in liposomal formations for oral and parenteral antileukemic
therapy in the murine L1210 leukemia model. J Cancer Res Clin Oncol;
122:723-6.
[5] Gursoy RN, Benita S. (2004). Self-emulsifying drug delivery systems
(SEDDS) for improved oral delivery of lipophilic drugs. Biomed Pharmacother.
Apr; 58 (3):173-82.
[6] Shah NH, Carvajal MT, Patel CI, Infeld MH, Malick AW. (1994). Self-emulsifying
drug delivery systems (SEDDS) with polyglycolized glycerides for improving in
vitro dissolution and oral absorption of lipophilic drugs. Int J Pharm; 106: 15-23.
[7] Constantinides PP. (1995). Lipid microemulsions for improving drug dissolution
and oral absorption: physical and biopharmaceutical aspects. Pharm. Res. 12,
94
1561-1572.
[8] Humberstone AJ, Charman WN. (1997). Lipid-based vehicles for the oral delivery
of poorly water soluble drugs. Adv. Drug Deliv. Rev. 25, 103–128.
[9] Newmark HL, Mergens WJ. (1981). Alpha-Tocopherol (vitamin E) and its
relationship to tumor induction and development. In: Zedeck, M.S., Lipkin,
M.(Eds.), Inhibition of Tumor Induction and Development. Plenum Press, New
York, pp. 127-168.
[10] Gey KF, Brubacher GB, Stahelin HB. (1987). Plasma levels of antioxidant
vitamin in relation to ischemic heart disease and cancer. Am. J. Clin. Nutr. 45,
1368-1377.
[11] Julianto T et al. (2000). Improved bioavailability of vitamin E with a self
emulsifying formulation. International Journal of Pharmaceutics 200 53-57.
[12] Mehta SK, Kaur G, Bhasin KK. (2007). Analysis of Tween based microemulsion
in the presence of TB drug rifampicin. Colloids and Surfaces B: Biointerfaces 60
95-104.
[13] Bibette J, Leal-Calderon F, Schmitt V, Poulin P. Emulsion Science. Springer
Tracts in Modern Physics 181. Page 1.
[14] Nielloud F, Marti-Mestres G. Pharmaceutical Emulsion and Suspensions. Drugs
and the pharmaceutical sciences. Page 2-9,20.
[15] Shinoda K, et al. (1967). Solvent Properties of Surfactant Solutions. Marcel
Dekker, New York.
[16] Tanford C. (1973). The Hydrophobic Effect: Formation of Micelles and

95
Biological Membranes, John Wiley, New York.
[17] Mittal K. (1977). Micellization, Solubilization and Related Phenomena, 2 vols.
Plenum Press, New York.
[18] Schulman JH, Montagne JB. (1961). Ann. N.Y. Acad. Sci., 92, Art. 2, 366.
[19] Ruckenstein E, Chi JC. (1975). J. Chem. Soc., Faraday Trans. 2, 71, 1690.
[20] James WM. Colloid Science, page 16-17.
[21] Watanabe K, Noda A, Masuda M, Kimura T, Komatsu K, Nakamura K. (2004).
Bicontinuous microemulsion type cleaning containing silicone oil. II.
Characterization of the solution and its application to cleaning agent. Journal of
oleo science. Vol. 53, No. 11.
[22] Rusling JF. (2001). Pure Appl. Chem. 73 1895.
[23] Pal R. (2008). Viscosity models for multiple emulsions. Food hydrocolloids 22
428-438.
[24] Zabka M, Skoviera F. (2003). Microemulsions as vehicles for transdermal
permeation of drugs. Acta facultatis pbarmaceuticae universityatis comenianae.
Tomus L.
[25] Solans C, Kunieda H. (1997). Industrial applications of microemulsions. Marcel
Dekker, New York.
[26] Whitesides GM, grzybowski B. (2002). Self-assembly at all scales. Science 295
2418.
[27] Mason TG, Wilking JN, Meleson K, Chang CB, Graves SM. (2006).
Nanoemulsions: formation, structure, and physical properties. Journal of physics:

96
condensed matter. Matter 18 R635-R666.
[28] Bowcott JE, Schulman JHZ. (1955). Elektrochrm, 59, 283.
[29] Lloyd IO. (1962). Surface chemistry: theory and industrial applications. Page
338-341.
[30] Miller CA. (2006). Emulsions and Emulsion Stability. J. Colloid Interface Sci. 53
61.
[31] Shinoda K. (1967). Solvent Properties of Surfactant Solutions. 234 – 237.
[32] Becher P. (1966). Emulsions: Theory and Practice. American Chemical Society.
42-46.
[33] McBain ME, Hutchinson E. (1955). Solubilization and Related Phenomena.
Academic Press, New York.
[34] Schulman JH, Stoeckenius W, Prince LM. (1959). J. Phys. Chem. 63: 1677.
[35] Prince LM. (1977). Microemulsions: Theory and Practice. Academic Press, New
York.
[36] Robb ID et al. (1982). Microemulsions. Plenum Press, New York.
[37] Bourrel M, Schechter RS. (1988). Microemulsions and Related Systems. Marcel
Dekker, New York.
[38] Bidyut KP, Satya PM. (2001). Uses and applications of microemulsions. Current
Science, Vol. 80, No. 8, 25 April.
[39] Kumar P, Mittal KL (eds). (1999). Handbook of Microemulsion Science and
Technology. Marcel Dekker Inc., New York. Malmsten M, pp. 755-771; Guo R,
Zhu X, pp. 483-497; Osseo-Asare K, pp. 549-603; Candau F, pp. 679-712;

97
Bunton CA, Romsted LS, pp. 457-482.
[40] Solans C, Kunieda H (eds). (1997). Industrial Applications of Microemulsions.
Marcel Dekker Inc. New York; Tadros TF, p. 199; Dungan SR, pp. 147-174;
Gasco MR, pp 97-122; Garcia-Celma MJ, pp. 123-145; Holmberg K, pp 69-95.
[41] Gilje E, Sonesson L, Hollberg PE, Holmberg K, Svennberg S. (1992). Norwegion
Patent, 170411 and 17097
[42] Baviere M, Glenat P, Plazanet N, Labrod J. (1995). SPE Reservoir Engineering,
10, 387.
[43] Shah DO. (1998). Micelles, Microemulsions and Monolayers: Science and
Technology. Marcel Dekker, New York, p.1.
[44] Yeo LY, Matar OK, Ortiz ES, Hewitt GF. (2000). Phase inversion and associated
phenol: A review.
[45] Arirachakaran S, Oglesby KD, Malinowsky MS, Shoham O, Brill JP, (1989). An
Analysis of Oil/Water Flow Phenomena in Horizontal Pipes. Society of
Petroleum Engineers, Oklahoma. ,Paper SPE 18836.
[46] Matar OK, Hewitt GF, Ortiz ES, Phase Inversion in Liquid-Liquid Dispersions.
Department of Chemical Engineering, Imperial College, London.
[47] Mihailescu M, Monkenbusch M, Endo H, Allgaier J, Gompper G, Stellbrink J,
Richter D. (2001). Dynamic of bicontinuous microemulsion phases with and
without amphiphilic block-copolymers. Journal of Chemical Physics. Volume
115, Number 20.
[48] Garti N, Avrahami M, Aserin A. (2006). J Colloid Interface Sci; 299: 352.

98
[49] Graham JDP. (1979). An introduction to human pharmacy, Oxford University
Press, 3-11
[50] Li RC, Chow AHL, Yip MS, Raymond K. (1995). Basic concepts of
bioavailability. HKMJ; 1:63-8.
[51] Kang BK, Lee JS, Chon SK, Jeong SY, Yuk SH, Khang G, Lee HB, Cho SF.
(2004). Int J Pharm; 274:65.
[52] Li P, Ghosh A, Wagner RF, Krill S, Joshi YM, Serajuddin ATM. (2005). Effect of
combined use of nonionic surfactant on formation of oil-in-water
microemulisons. International Journal of Pharmaceutics 288 27-34.
[53] Barrow GM. Physical chemistry (sixth edition). Page 336-338.
[54] Spernath A, Yaghmur A, Aserin A, Hoffman RE, Garti N. (2002). Food-grade
microemulsions based on nonionic emulsifiers: media to enhance lycopene
solubilization. J. Agri. Food Chem. 50, 6917-6922.
[55] Narang AS, Delmarre D, Gao D. (2007). Stable drug encapsulation in micelles
and microemulsions. International Journal of Pharmaceutics 345 9-25.
[56] Spernath A, Yaghmur A, Aserin A, Hoffman RE, Garti N. (2003). Self-diffusion
nuclear magnetic resonance, microstructure transitions, and solubilization
capacity of phytosterols and cholesterol in Winsor IV food-grade
microemulsions. J. Agri. Food Chem. 51, 2359-2364.
[57] Constantinides PP. (1995). Lipid microemulsions for improving drug dissolution
and oral absorption: physical and biopharmaceutical aspects. Pharm Res; 12:
1561-72.

99
[58] Swenson ES, Curatolo WJ. (1992). Means to enhance penetration. Adv Drug Del
Rev; 8:39-92.
[59] Caliph S, Charman WN, Porter CJH. (2000). Effect of short-, medium- and
long-chain fatty acid-based vehicles on the absolute oral bioavailability and
intestinal lymphatic transport of halofantrine and assessment of mass balance in
lymph-cannulated and non-cannulated rats. J Pharm Sci; 89: 1073-84.
[60] Pocock DME, Vost A. (1974). DDT absorption and chylomicron transport in rat.
Lipids; 9: 374-81.
[61] Dintaman JM, Silverman JA. (1999). Inhibition of P-glycoprotein by
D-alpha-tocopheryl polyethylene glycol 1000 succinate (TPGS). Pharm Res; 16:
1550-6.
[62] Holt DW, Mueller EA, Kovarik JM, Bree JB, Kutz K. (1994). The
pharmacokinetics of Sandimmune Neoral: A new oral formulation of
cyclosporine. Transplant. Proc. 26: 2935-2939.
[63] Swenson EC, Curatolo WJ. (1992). Intestinal permeability enhancement for
proteins, peptides and other polar drugs: mechanisms and potential toxicity. Adv.
Drug Deliv. Rev. 8: 39-92.
[64] Swenson ES, Milisen WB, Curatolo W. (1994). Intestinal permeability
enhancement: efficacy, acute local toxicity and reversibility. Pharm. Res. 11:
1132-1142.
[65] Burskirk GA, Shah VP, Adair D, Arbit HM, Dighe SV, Fawzi M, Feldman T,
Flynn GL, Gonzalez MA, Gray VA, Guy RH, Herd AK, Hem SL, Hoiberg C,

100
Jerussi R, Kaplan AS, Lesko L, Malinowski HM, Meltzer NM, Nedich RL,
Pearce DM, Peck G, Rudman A, Savello D, Schwartz JB, Schwartz P, Skelly JP,
Vanderlaan RK, Wang JCT, Weiner N, Winkel DR, Zatz JL. (1994). Workshop
III Report: Scale-up of liquid and semisolid disperse systems. Eur. J. Pharm.
Biopharm. 40: 251-254.
[66] Li L, Wang Z, Wang J, Wang Z, Mo F, Liang J. (2005). Journal of Shengyang
Pharmaceutical University. Vol. 22 No. 4. Jul. p.245.
[67] Berne, Pecora. (1975). Dynamic Light scattering. John Wiley.
[68] Marta S. Dynamic light scattering to determine the radius of small beads in
Brownian motion in a solution. University of California, San Diego.
[69] Griffin WC. (1954). Calculation of HLB Values of Non-Ionic Surfactants.
Journal of the Society of Cosmetic Chemists 5: 259.
[70] Schowalter WR. (1978). Mechanics of non Newtonian fluids. Pergamon Press,
New York.
[71] Holm R, Jensen IHM, Sonnergaard J. (2006). Optimization of
Self-Microemulsifying Drug Delivery Systems (SMEDDS) Using a D-Optimal
Design and the Desirability Function. Drug Development and Industrial
Pharmacy, 32:1025–1032.