Ternary phase diagrams and experimental investigation … pdfs/PCCC-2_SutterD...investigation of the...
36
| | Institute of Process Engineering September 18, 2013 – PCCC-2, Bergen, Norway Daniel Sutter, Matteo Gazzani, Marco Mazzotti Institute of Process Engineering, ETH Zurich 19-Jan-15 Daniel Sutter, [email protected] 1 Ternary phase diagrams and experimental investigation of the particle formation kinetics for the CO 2 -NH 3 -H 2 O system
Transcript of Ternary phase diagrams and experimental investigation … pdfs/PCCC-2_SutterD...investigation of the...
| | Institute of Process Engineering
September 18, 2013 – PCCC-2, Bergen, Norway
Daniel Sutter, Matteo Gazzani, Marco Mazzotti
Institute of Process Engineering, ETH Zurich
19-Jan-15 Daniel Sutter, [email protected] 1
Ternary phase diagrams and experimental
investigation of the particle formation kinetics
for the CO2-NH3-H2O system
| | Institute of Process Engineering
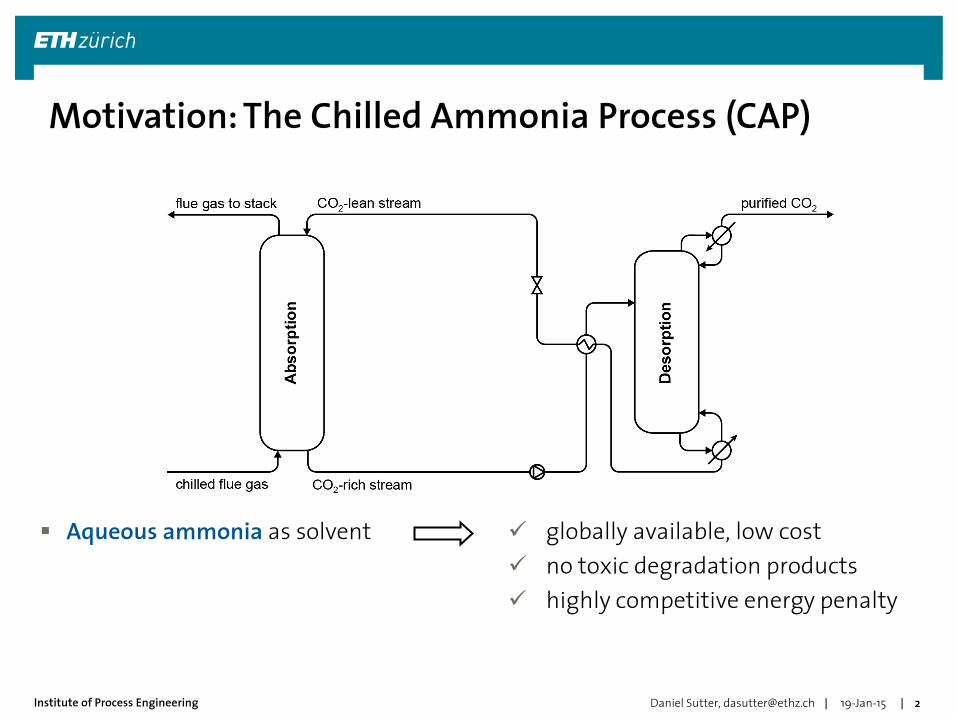
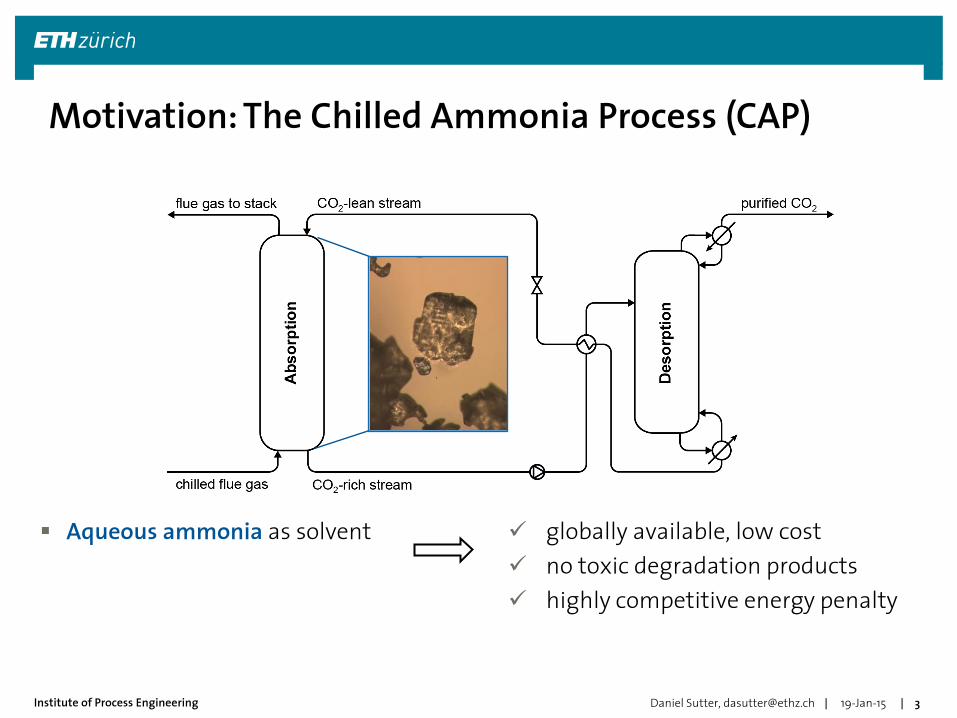
Motivation: The Chilled Ammonia Process (CAP)
Aqueous ammonia as solvent globally available, low cost
no toxic degradation products
highly competitive energy penalty
19-Jan-15 Daniel Sutter, [email protected] 2
| | Institute of Process Engineering
Motivation: The Chilled Ammonia Process (CAP)
Aqueous ammonia as solvent globally available, low cost
no toxic degradation products
highly competitive energy penalty
19-Jan-15 Daniel Sutter, [email protected] 3
| | Institute of Process Engineering
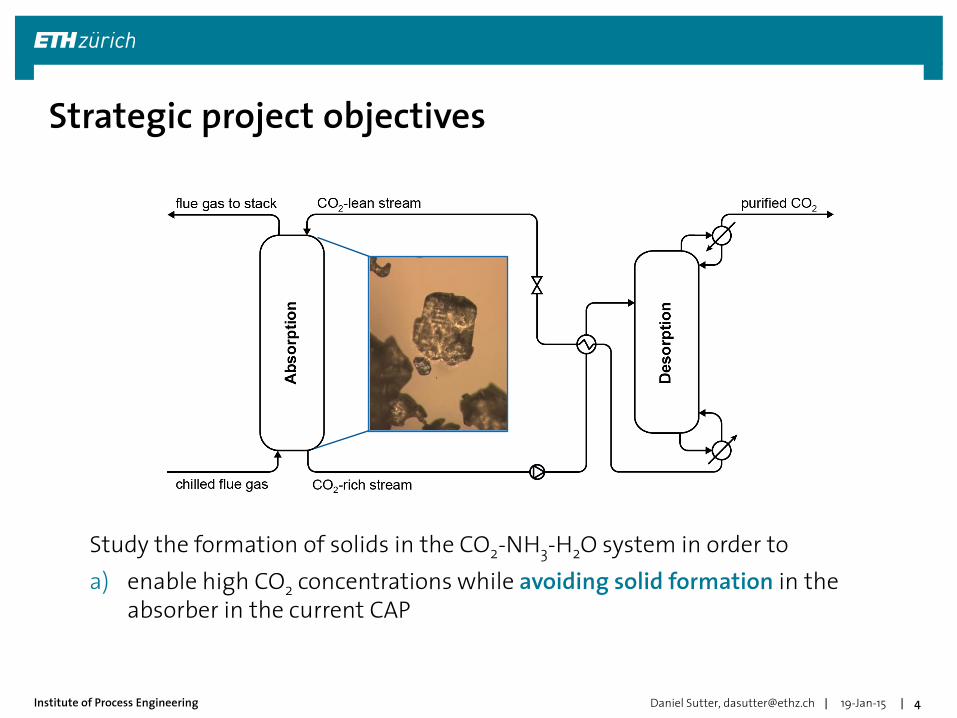
Strategic project objectives
Study the formation of solids in the CO2-NH3-H2O system in order to
a) enable high CO2 concentrations while avoiding solid formation in the absorber in the current CAP
19-Jan-15 Daniel Sutter, [email protected] 4
| | Institute of Process Engineering
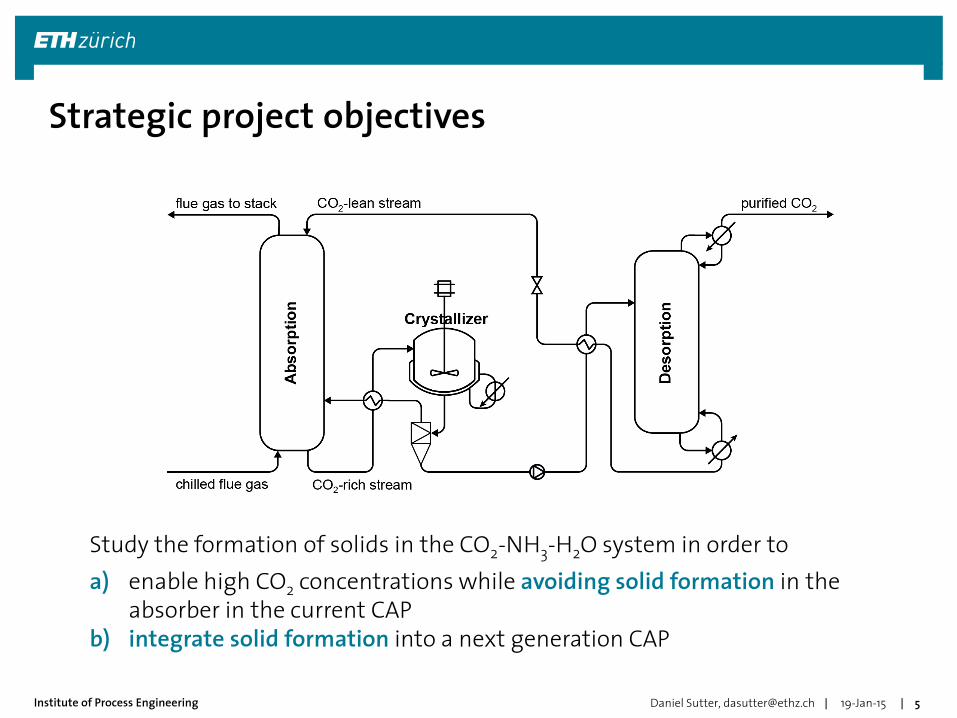
Strategic project objectives
Study the formation of solids in the CO2-NH3-H2O system in order to
a) enable high CO2 concentrations while avoiding solid formation in the absorber in the current CAP
b) integrate solid formation into a next generation CAP
19-Jan-15 Daniel Sutter, [email protected] 5

| | Institute of Process Engineering
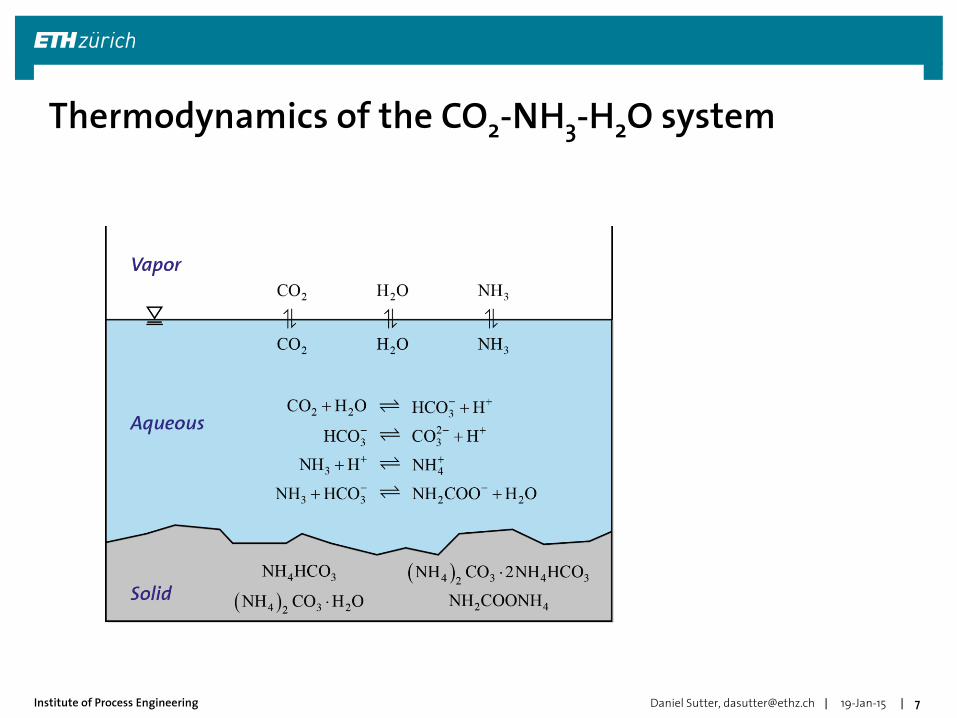
Thermodynamics The system CO2-NH3-H2O
Ternary phase diagrams
Experimental Methodology
Identification of solids by Raman
Process simulations Process model
Comparison of standard CAP & crystallizer-CAP
19-Jan-15 Daniel Sutter, [email protected] 6
Outline
| | Institute of Process Engineering
Thermodynamics of the CO2-NH3-H2O system
19-Jan-15 7 Daniel Sutter, [email protected]
| | Institute of Process Engineering
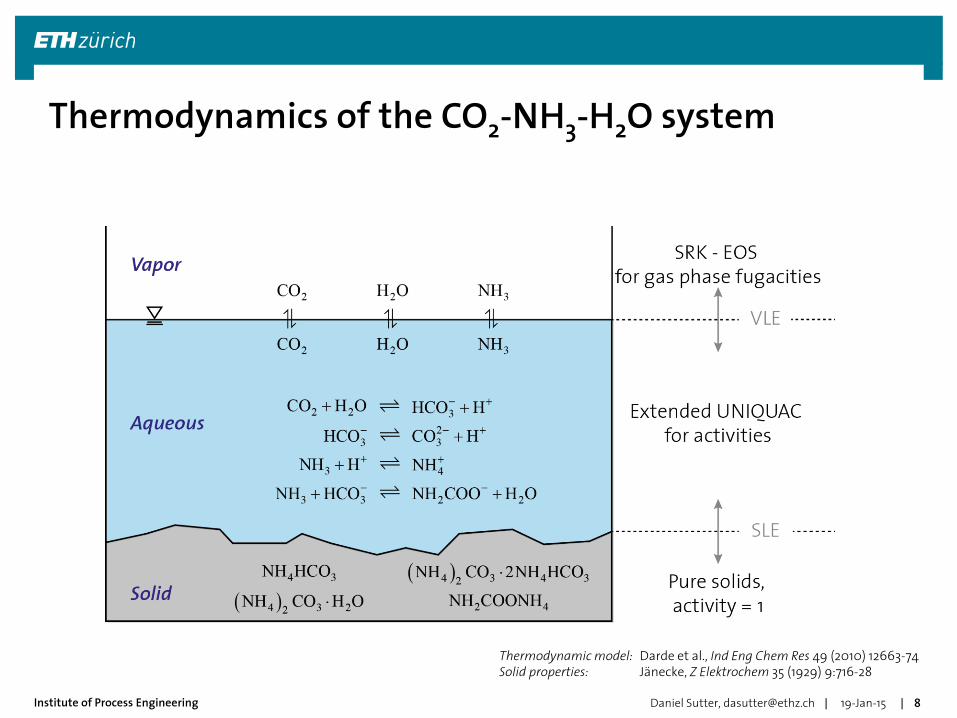
Thermodynamics of the CO2-NH3-H2O system
19-Jan-15 8 Daniel Sutter, [email protected]
Thermodynamic model: Darde et al., Ind Eng Chem Res 49 (2010) 12663-74 Solid properties: Jänecke, Z Elektrochem 35 (1929) 9:716-28
| | Institute of Process Engineering 19-Jan-15 Daniel Sutter, [email protected] 9
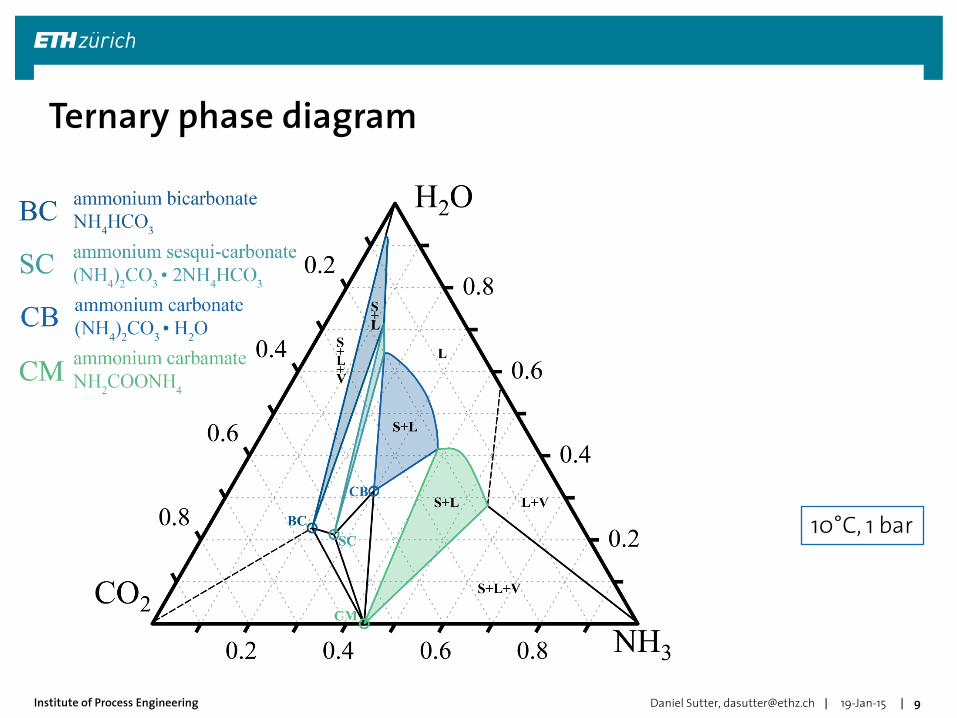
Ternary phase diagram
10°C, 1 bar
| | Institute of Process Engineering 19-Jan-15 Daniel Sutter, [email protected] 10
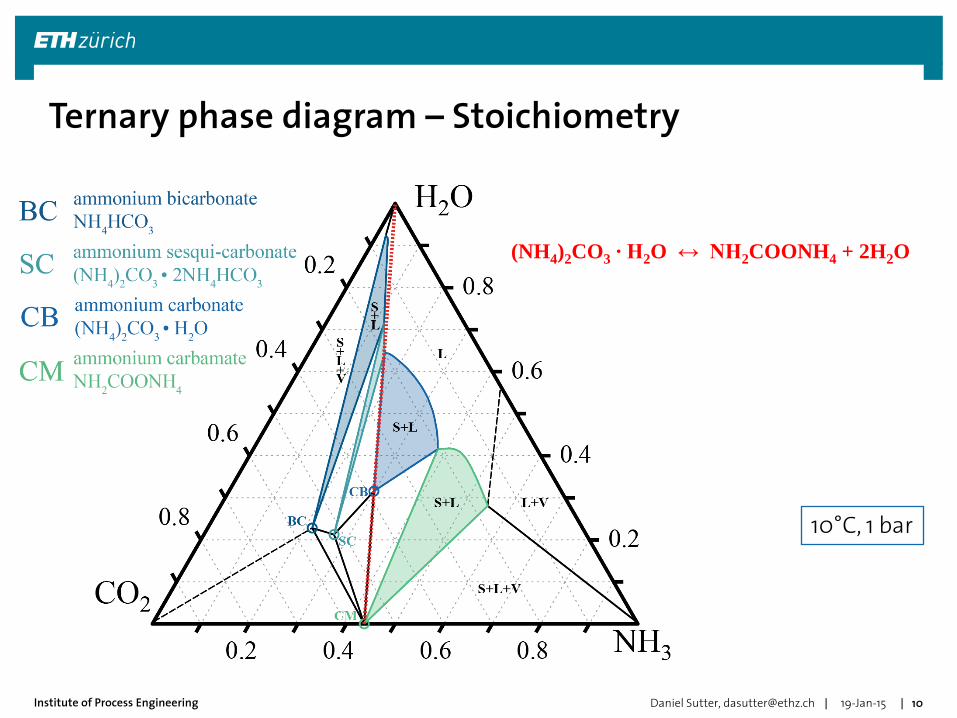
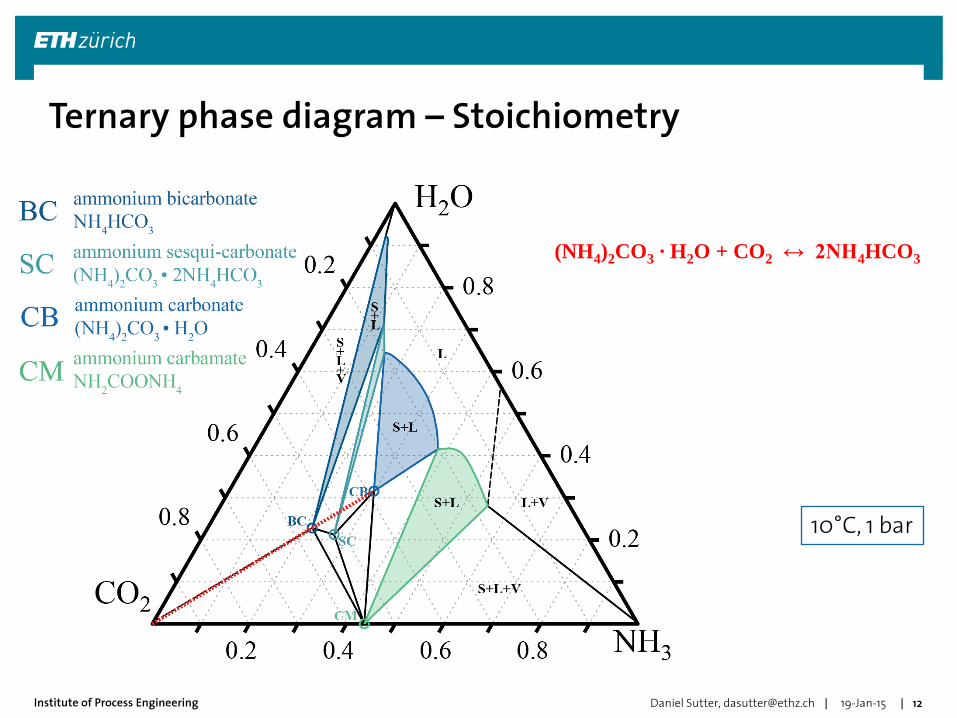
Ternary phase diagram – Stoichiometry
(NH4)2CO3 ∙ H2O ↔ NH2COONH4 + 2H2O
10°C, 1 bar
| | Institute of Process Engineering 19-Jan-15 Daniel Sutter, [email protected] 11
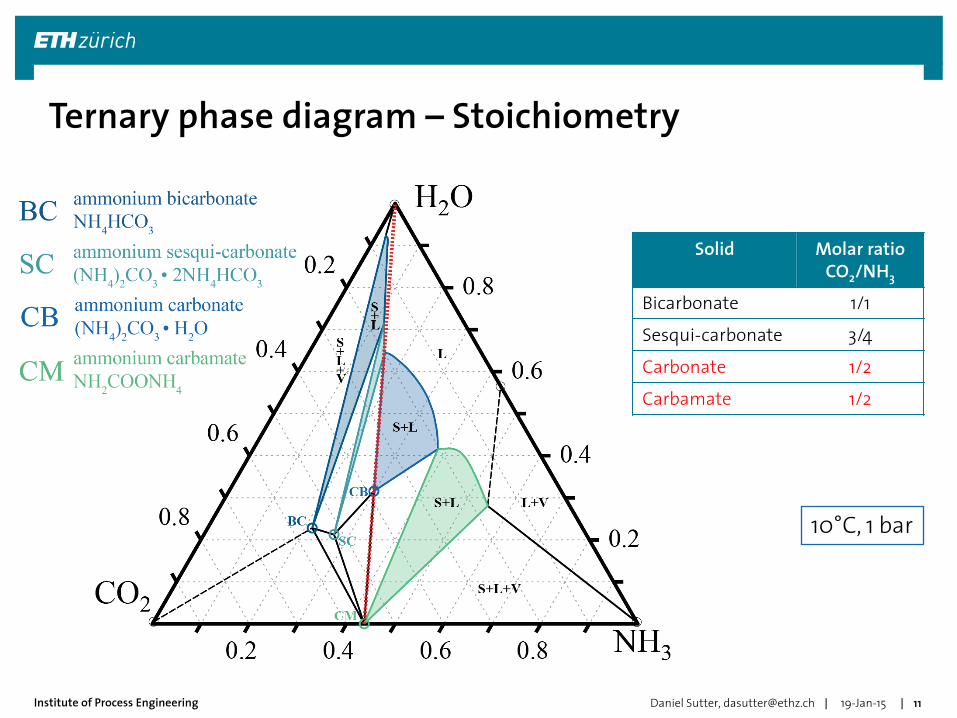
Ternary phase diagram – Stoichiometry
Solid Molar ratio CO2/NH3
Bicarbonate 1/1
Sesqui-carbonate 3/4
Carbonate 1/2
Carbamate 1/2
10°C, 1 bar
| | Institute of Process Engineering 19-Jan-15 Daniel Sutter, [email protected] 12
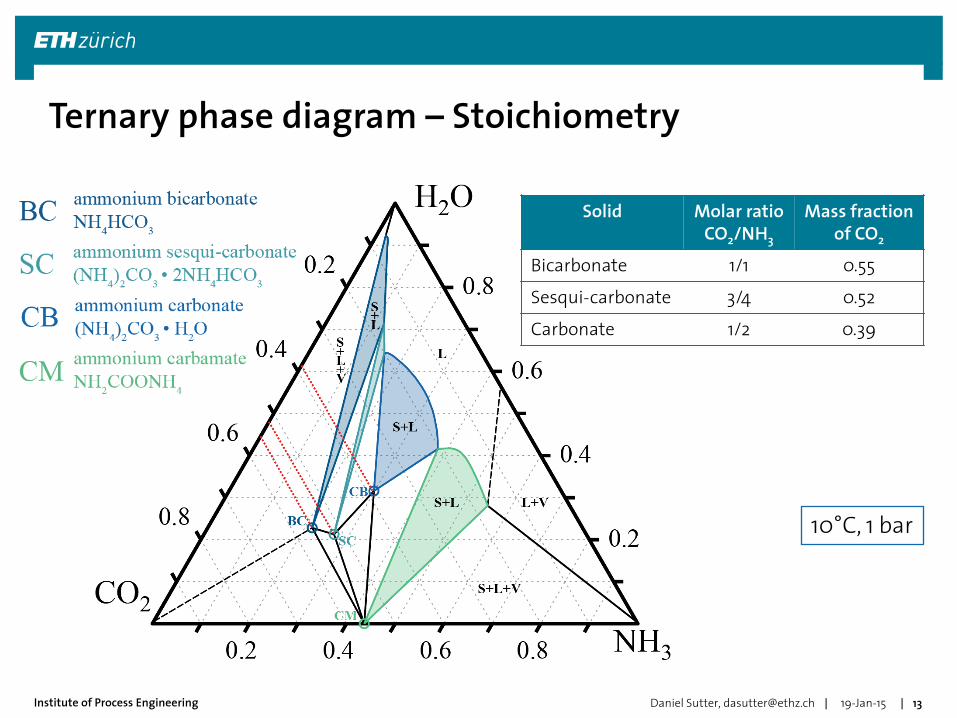
Ternary phase diagram – Stoichiometry
(NH4)2CO3 ∙ H2O + CO2 ↔ 2NH4HCO3
10°C, 1 bar
| | Institute of Process Engineering 19-Jan-15 Daniel Sutter, [email protected] 13
Ternary phase diagram – Stoichiometry
Solid Molar ratio CO2/NH3
Mass fraction of CO2
Bicarbonate 1/1 0.55
Sesqui-carbonate 3/4 0.52
Carbonate 1/2 0.39
10°C, 1 bar
| | Institute of Process Engineering 19-Jan-15 Daniel Sutter, [email protected] 14
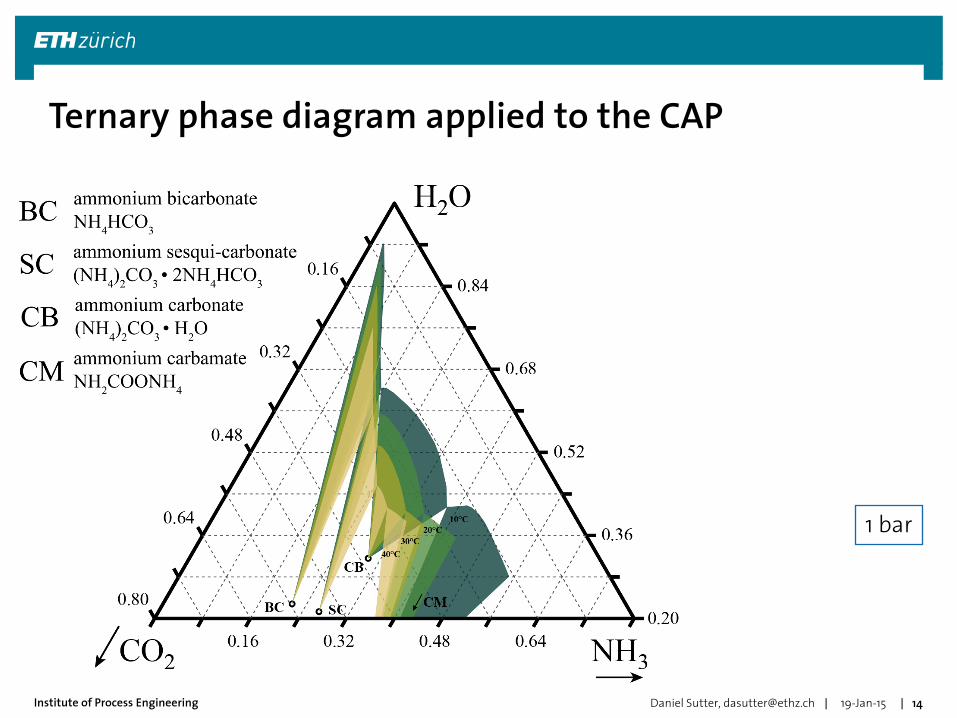
Ternary phase diagram applied to the CAP
1 bar
| | Institute of Process Engineering 19-Jan-15 Daniel Sutter, [email protected] 15
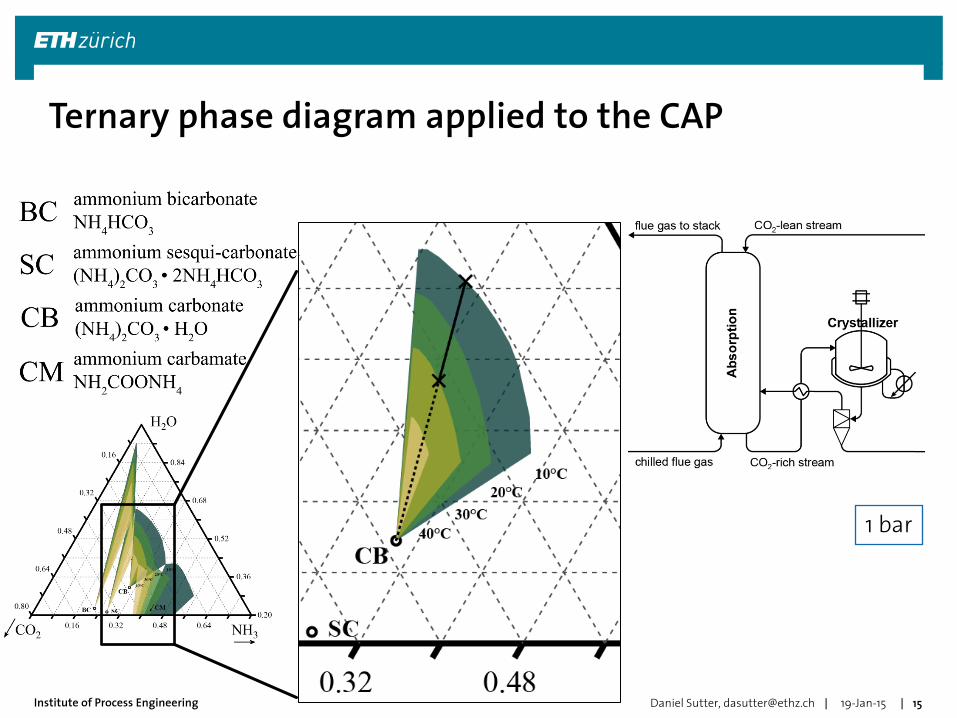
Ternary phase diagram applied to the CAP
1 bar
| | Institute of Process Engineering
Thermodynamics The system CO2-NH3-H2O
Ternary phase diagrams
Experimental Methodology
Identification of solids by Raman
Process simulations Process model
Comparison of standard CAP & crystallizer-CAP
19-Jan-15 Daniel Sutter, [email protected] 16
Outline
| | Institute of Process Engineering
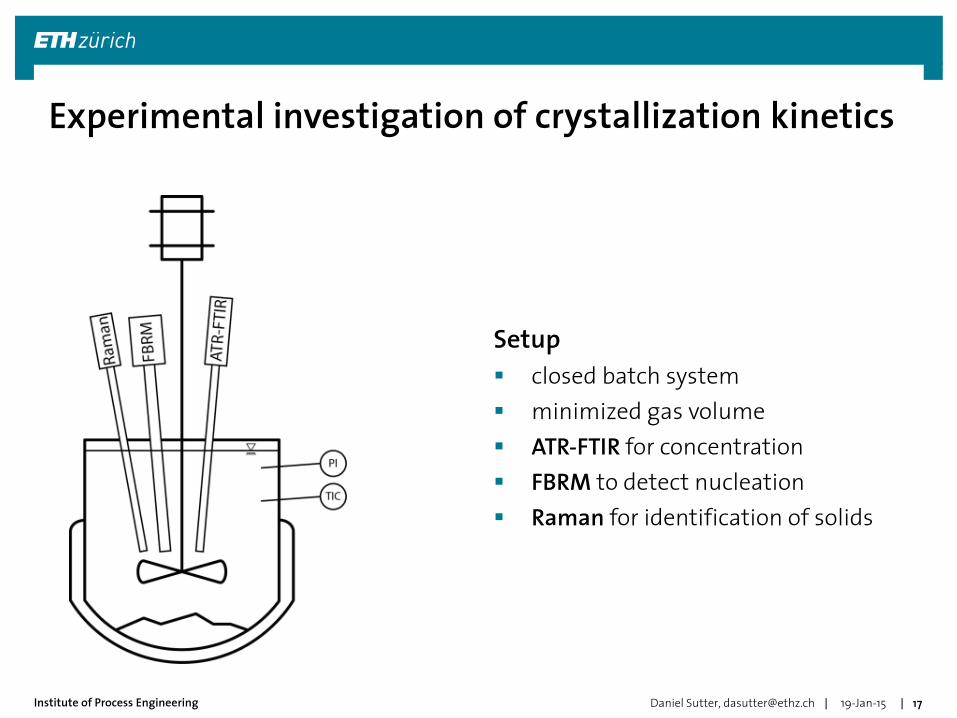
Setup
closed batch system
minimized gas volume
ATR-FTIR for concentration
FBRM to detect nucleation
Raman for identification of solids
19-Jan-15 Daniel Sutter, [email protected] 17
Experimental investigation of crystallization kinetics
| | Institute of Process Engineering
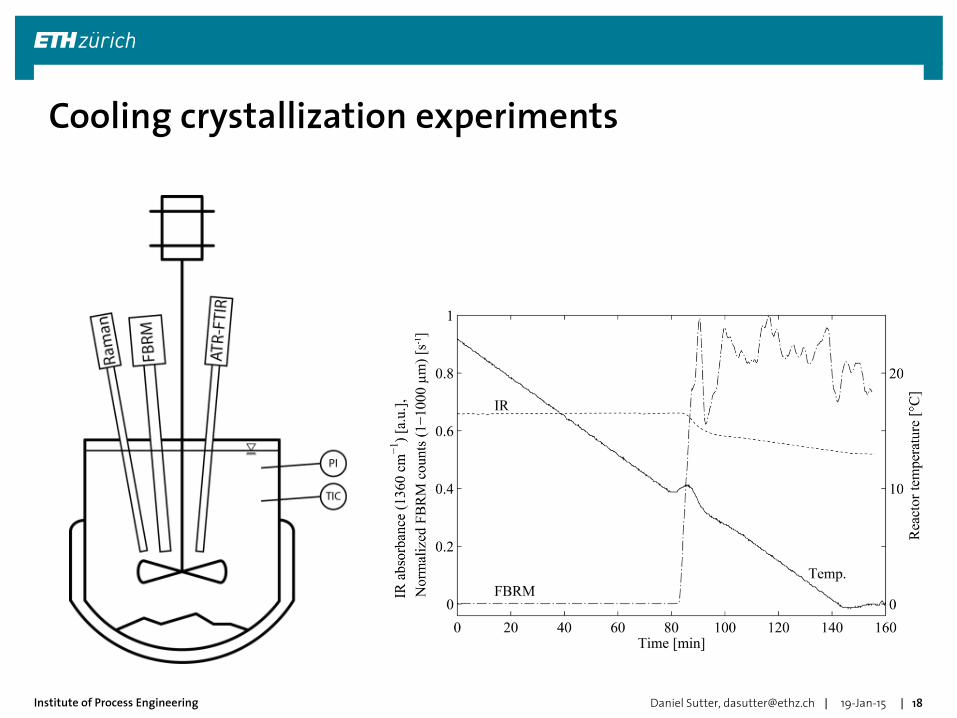
Cooling crystallization experiments
Daniel Sutter, [email protected] 19-Jan-15 18
| | Institute of Process Engineering 19-Jan-15 Daniel Sutter, [email protected] 19
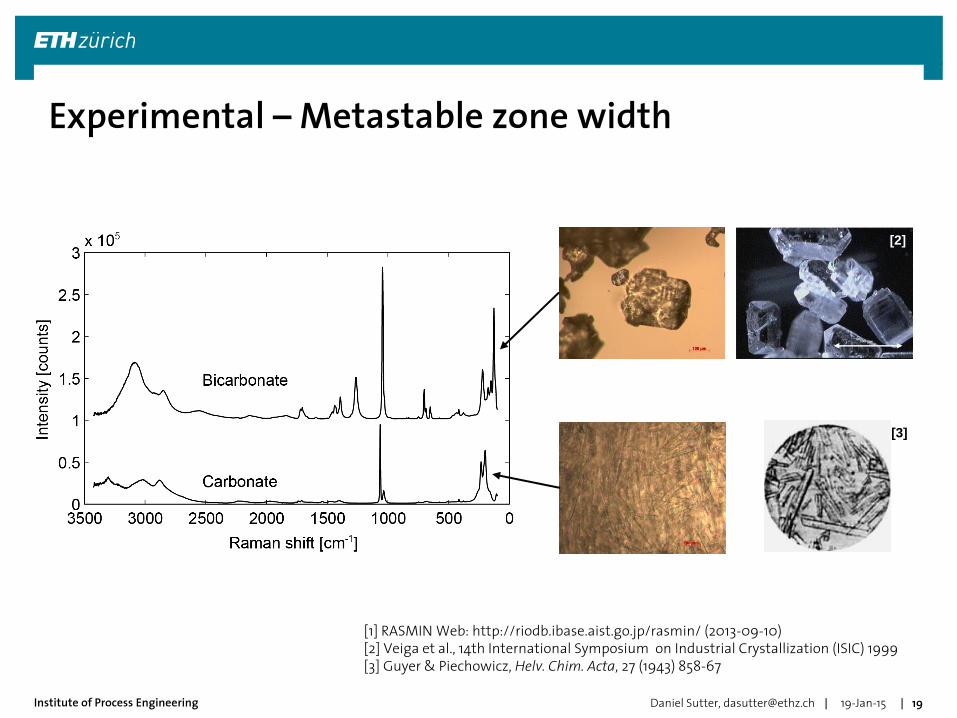
Experimental – Metastable zone width
[1] RASMIN Web: http://riodb.ibase.aist.go.jp/rasmin/ (2013-09-10) [2] Veiga et al., 14th International Symposium on Industrial Crystallization (ISIC) 1999 [3] Guyer & Piechowicz, Helv. Chim. Acta, 27 (1943) 858-67
[3]
[2]

| | Institute of Process Engineering
Thermodynamics The system CO2-NH3-H2O
Ternary phase diagrams
Experimental Methodology
Identification of solids by Raman
Process simulations Process model
Comparison of standard CAP & crystallizer-CAP
19-Jan-15 Daniel Sutter, [email protected] 20
Outline
| | Institute of Process Engineering 19-Jan-15 Daniel Sutter, [email protected] 21
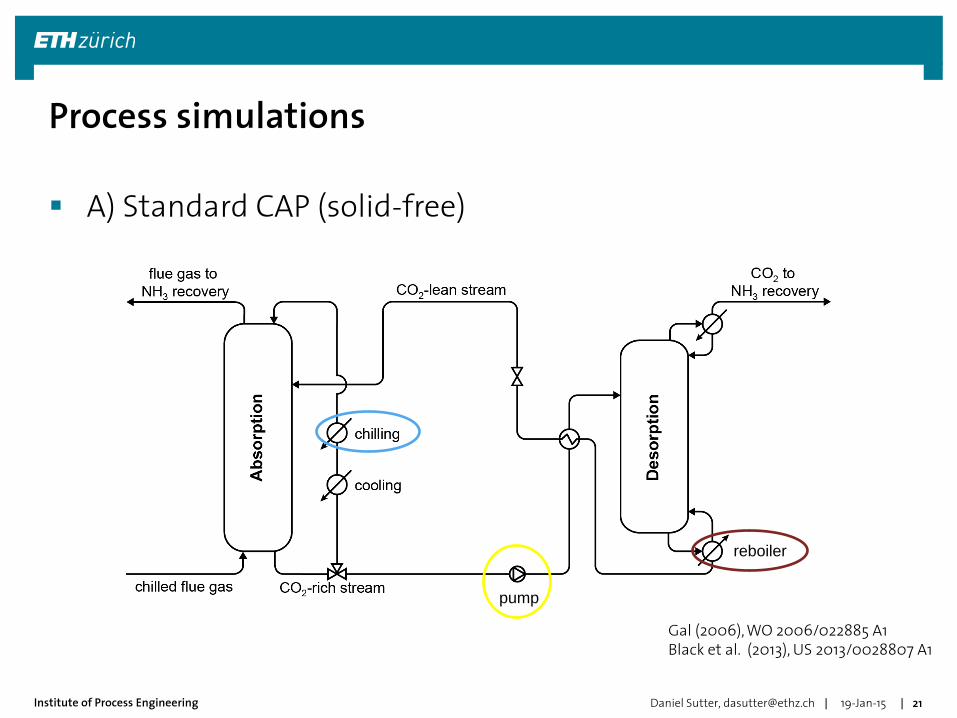
Process simulations
A) Standard CAP (solid-free)
reboiler
pump
Gal (2006), WO 2006/022885 A1 Black et al. (2013), US 2013/0028807 A1
| | Institute of Process Engineering 19-Jan-15 Daniel Sutter, [email protected] 22
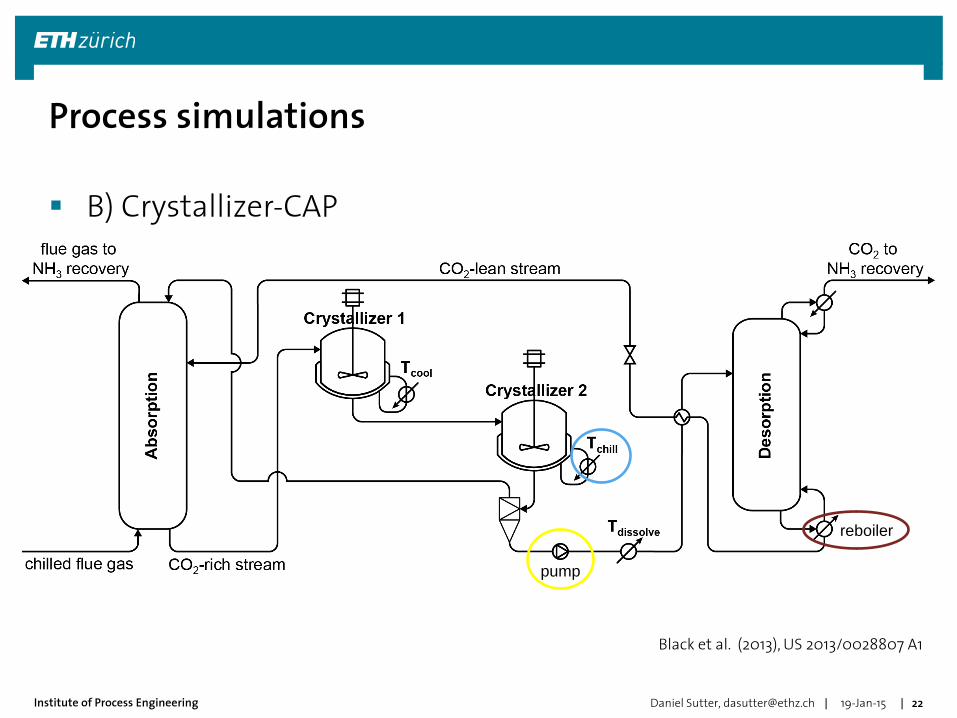
Process simulations
B) Crystallizer-CAP
reboiler
pump
Black et al. (2013), US 2013/0028807 A1
| | Institute of Process Engineering
Implementation of Extended UNIQUAC model in Aspen Plus [1,2]
Absorber Radfrac
30/50 stages
Desorber Radfrac
10 equilibrium stages
10 bar
Crystallizer CSTR
equilibrium-based
benchmarked against simulations published by Thomsen group [1,2]
19-Jan-15 Daniel Sutter, [email protected] 23
Process simulations – Methods
[1] Darde et al., Int J Greenh Gas Con 8 (2012) 61-72 [2] Darde et al., Int J Greenh Gas Con 10 (2012) 74-87
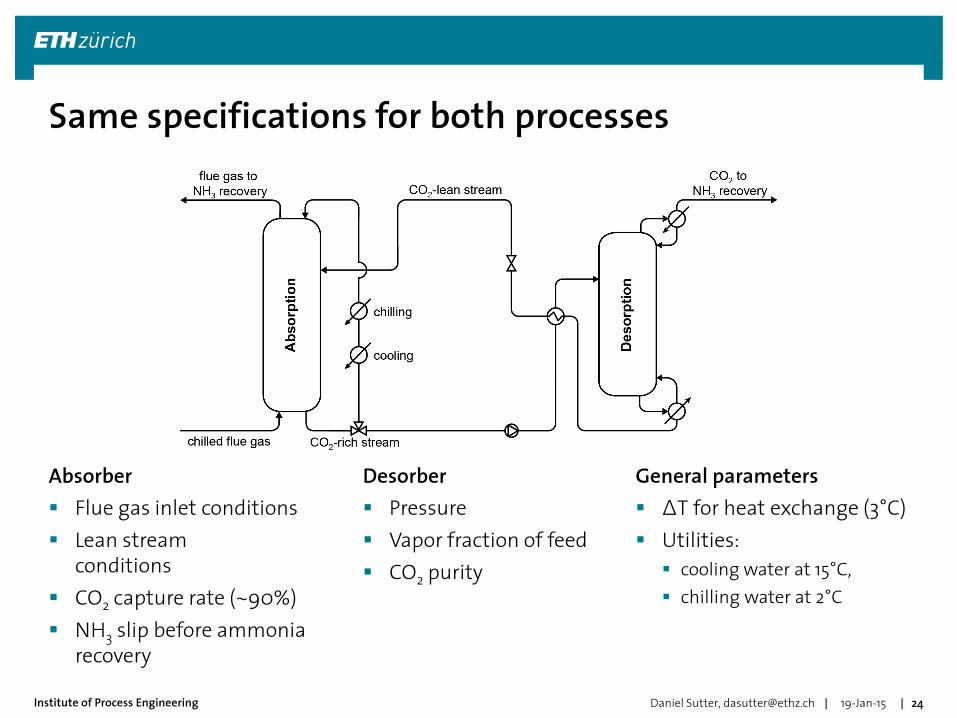
| | Institute of Process Engineering
Absorber
Flue gas inlet conditions
Lean stream conditions
CO2 capture rate (~90%)
NH3 slip before ammonia recovery
19-Jan-15 Daniel Sutter, [email protected] 24
Same specifications for both processes
Desorber
Pressure
Vapor fraction of feed
CO2 purity
General parameters
ΔT for heat exchange (3°C)
Utilities:
cooling water at 15°C,
chilling water at 2°C
| | Institute of Process Engineering 19-Jan-15 Daniel Sutter, [email protected] 25
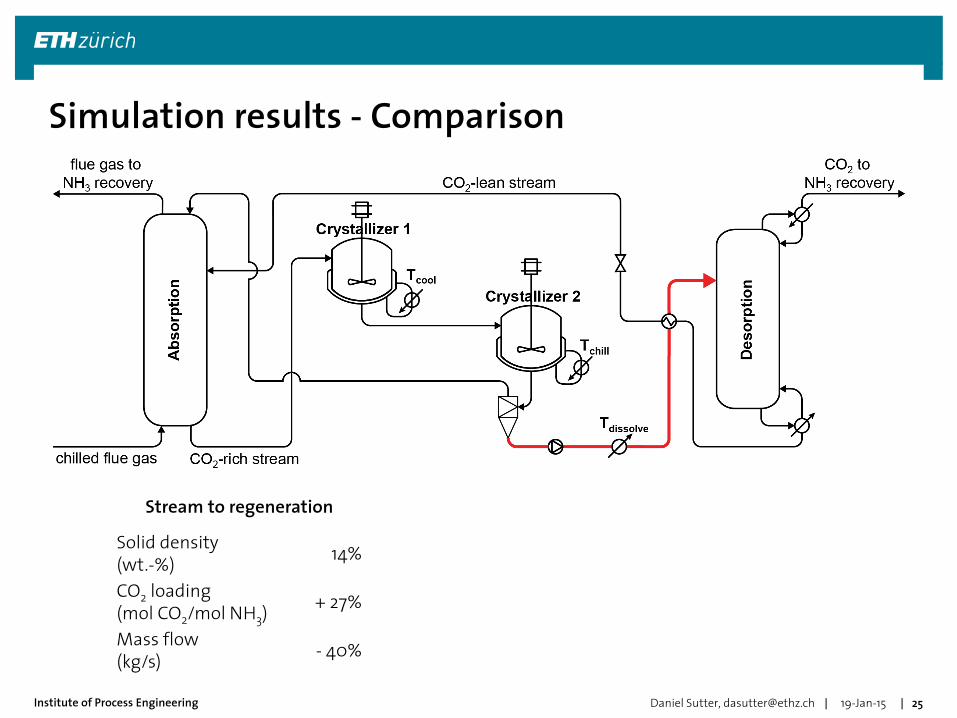
Simulation results - Comparison
Stream to regeneration
Solid density (wt.-%)
14%
CO2 loading (mol CO2/mol NH3)
+ 27%
Mass flow (kg/s)
- 40%
| | Institute of Process Engineering 19-Jan-15 Daniel Sutter, [email protected] 26
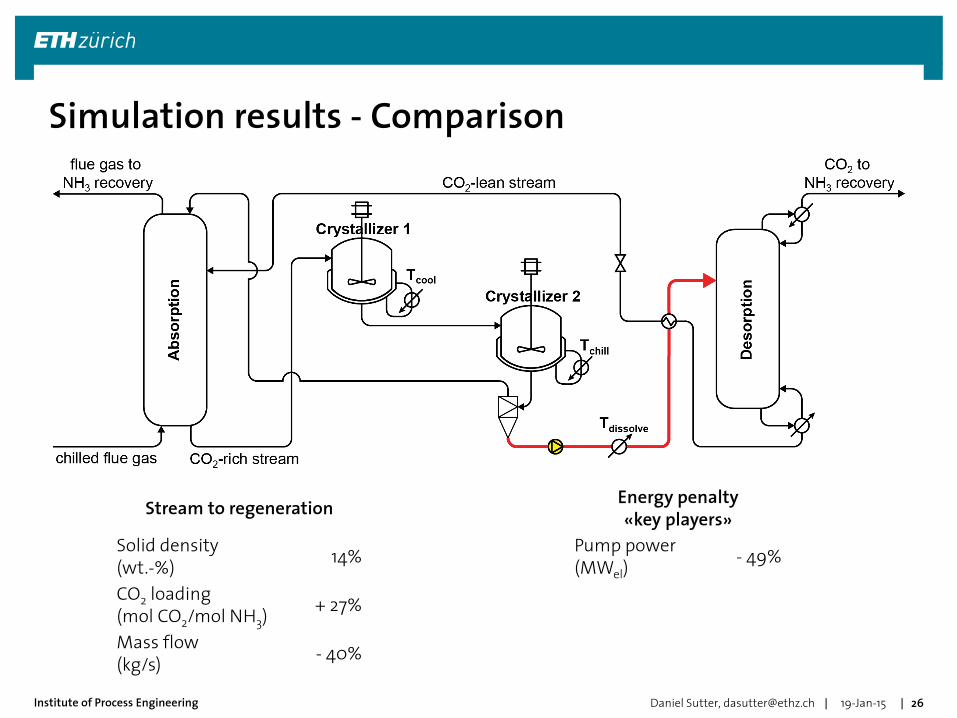
Simulation results - Comparison
Stream to regeneration Energy penalty «key players»
Solid density (wt.-%)
14% Pump power (MWel)
- 49%
CO2 loading (mol CO2/mol NH3)
+ 27%
Mass flow (kg/s)
- 40%
| | Institute of Process Engineering 19-Jan-15 Daniel Sutter, [email protected] 27
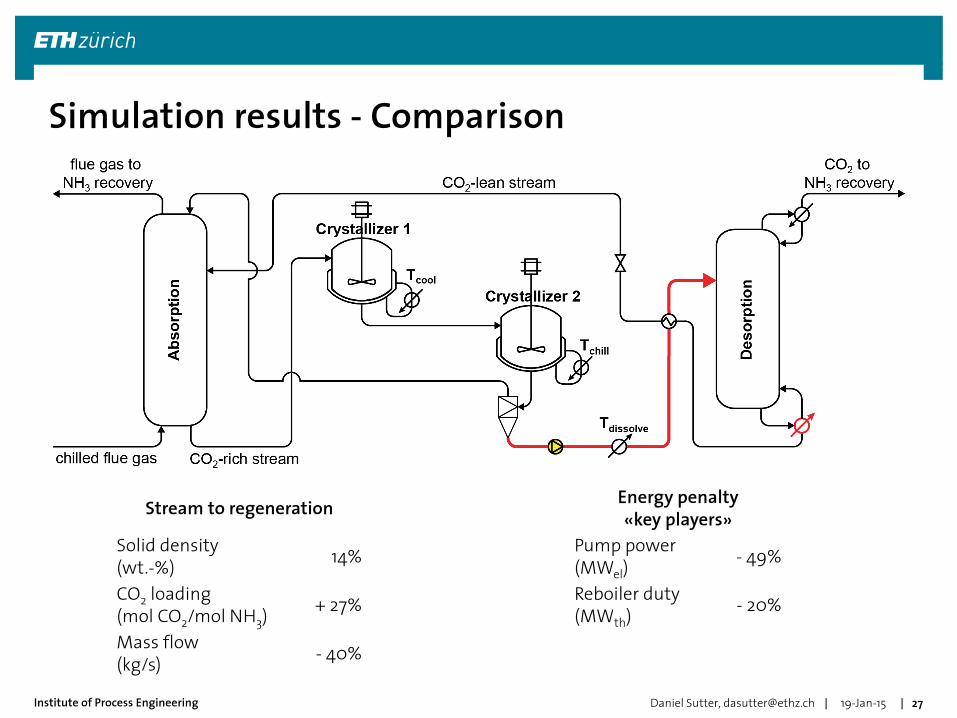
Simulation results - Comparison
Stream to regeneration Energy penalty «key players»
Solid density (wt.-%)
14% Pump power (MWel)
- 49%
CO2 loading (mol CO2/mol NH3)
+ 27% Reboiler duty (MWth)
- 20%
Mass flow (kg/s)
- 40%
| | Institute of Process Engineering 19-Jan-15 Daniel Sutter, [email protected] 28
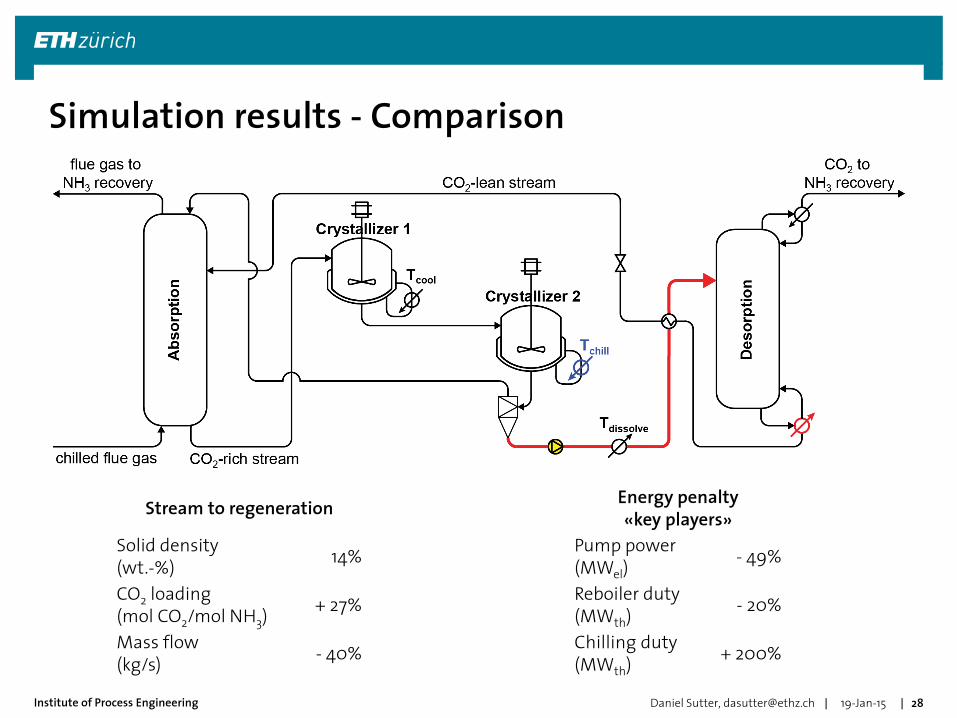
Simulation results - Comparison
Stream to regeneration Energy penalty «key players»
Solid density (wt.-%)
14% Pump power (MWel)
- 49%
CO2 loading (mol CO2/mol NH3)
+ 27% Reboiler duty (MWth)
- 20%
Mass flow (kg/s)
- 40% Chilling duty (MWth)
+ 200%
| | Institute of Process Engineering
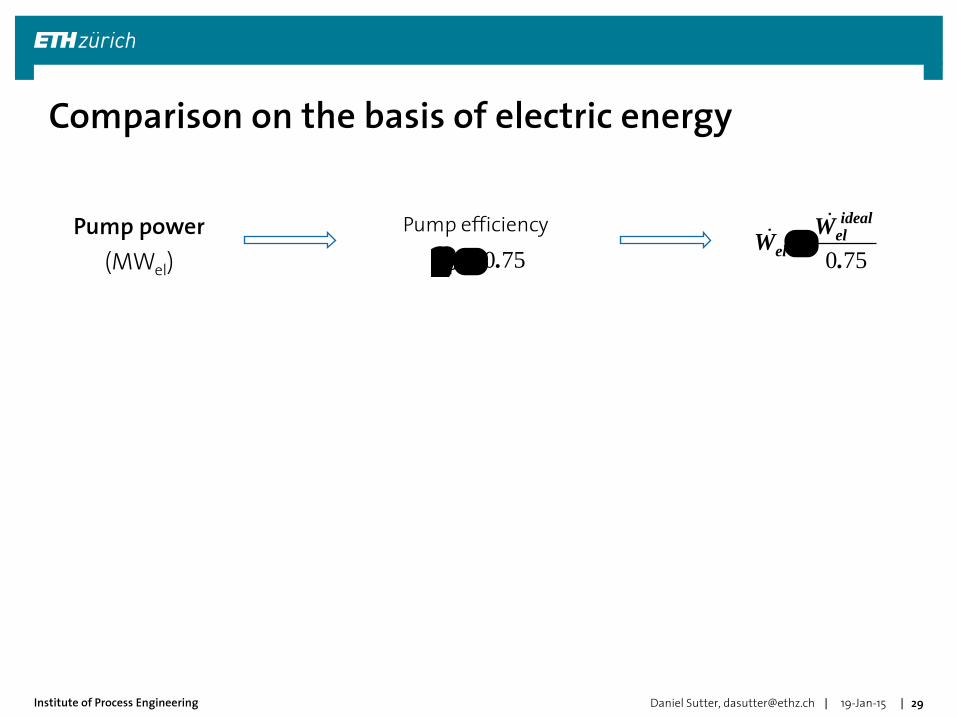
Pump power
(MWel)
Daniel Sutter, [email protected] 19-Jan-15 29
Comparison on the basis of electric energy
Pump efficiency
0 75
idealel
el
WW
.
0 75P .
| | Institute of Process Engineering
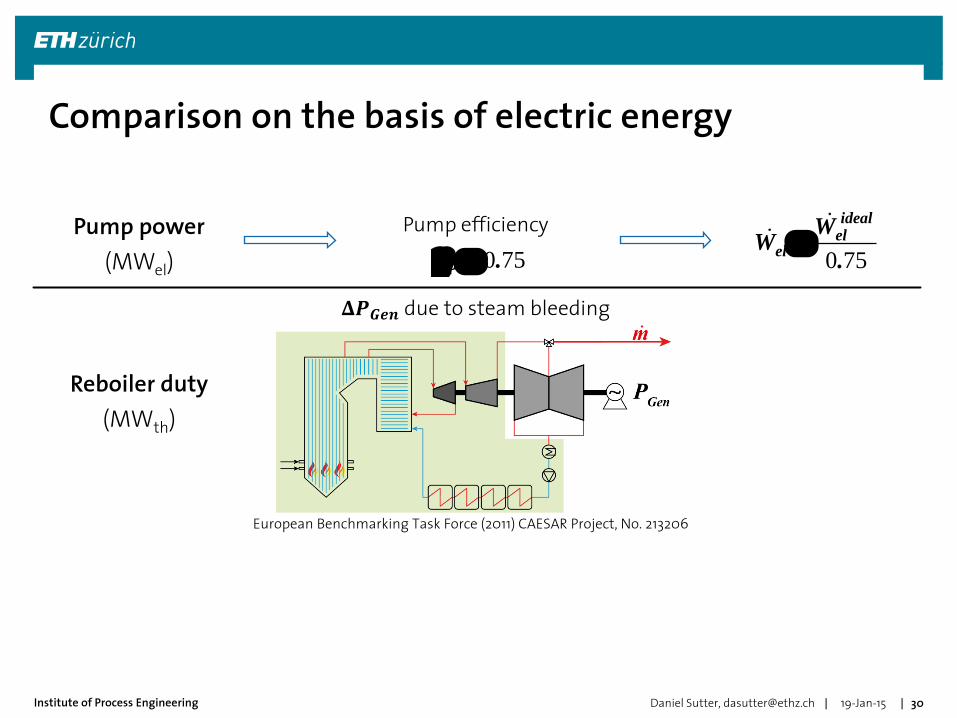
Pump power
(MWel)
Reboiler duty
(MWth)
Daniel Sutter, [email protected] 19-Jan-15 30
Comparison on the basis of electric energy
Pump efficiency
𝚫𝑷𝑮𝒆𝒏 due to steam bleeding
0 75
idealel
el
WW
.
0 75P .
European Benchmarking Task Force (2011) CAESAR Project, No. 213206
| | Institute of Process Engineering
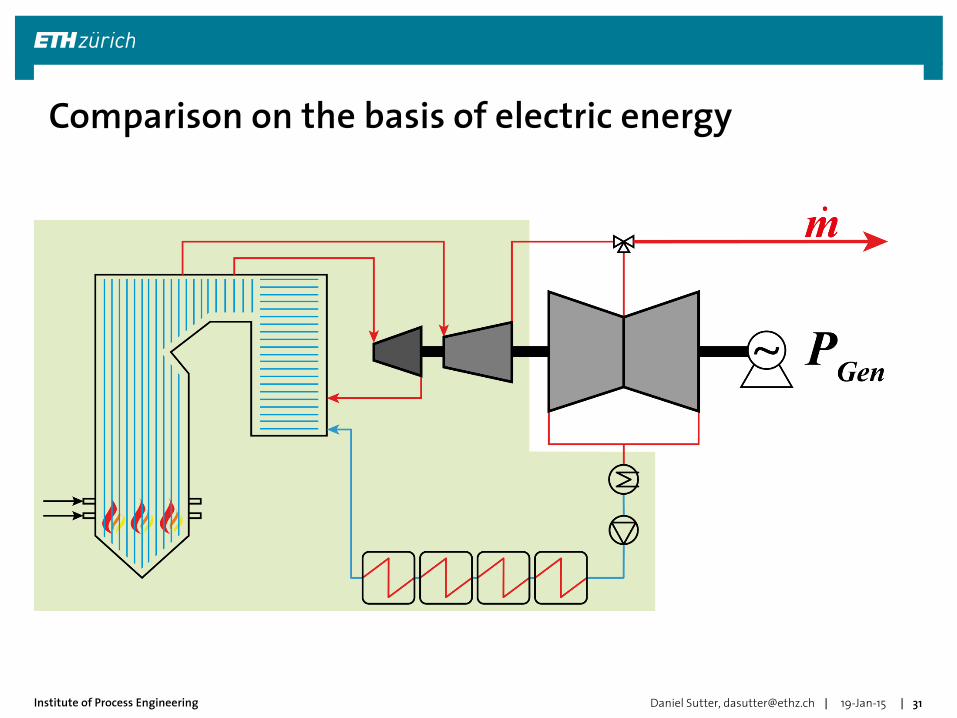
Pump power
(MWel)
Reboiler duty
(MWth)
Daniel Sutter, [email protected] 19-Jan-15 31
Comparison on the basis of electric energy
Pump efficiency
𝚫𝑷𝑮𝒆𝒏 due to steam bleeding
0 75
idealel
el
WW
.
0 75P .
European Benchmarking Task Force (2011) CAESAR Project, No. 213206

| | Institute of Process Engineering
Pump power
(MWel)
Reboiler duty
(MWth)
Chilling duty
(MWth)
Daniel Sutter, [email protected] 19-Jan-15 32
Comparison on the basis of electric energy
Pump efficiency
𝚫𝑷𝑮𝒆𝒏 due to steam bleeding
Coefficient of performance (COP)
0 75
idealel
el
WW
.
0 75P .
0el Gen
w / bleedGenW PP
European Benchmarking Task Force (2011) CAESAR Project, No. 213206
ideal
275KCOP 12 0
298 275 K
c
h c
T.
T T
idealCOP 0 6COP 7 2. .
COP chill
el
QW
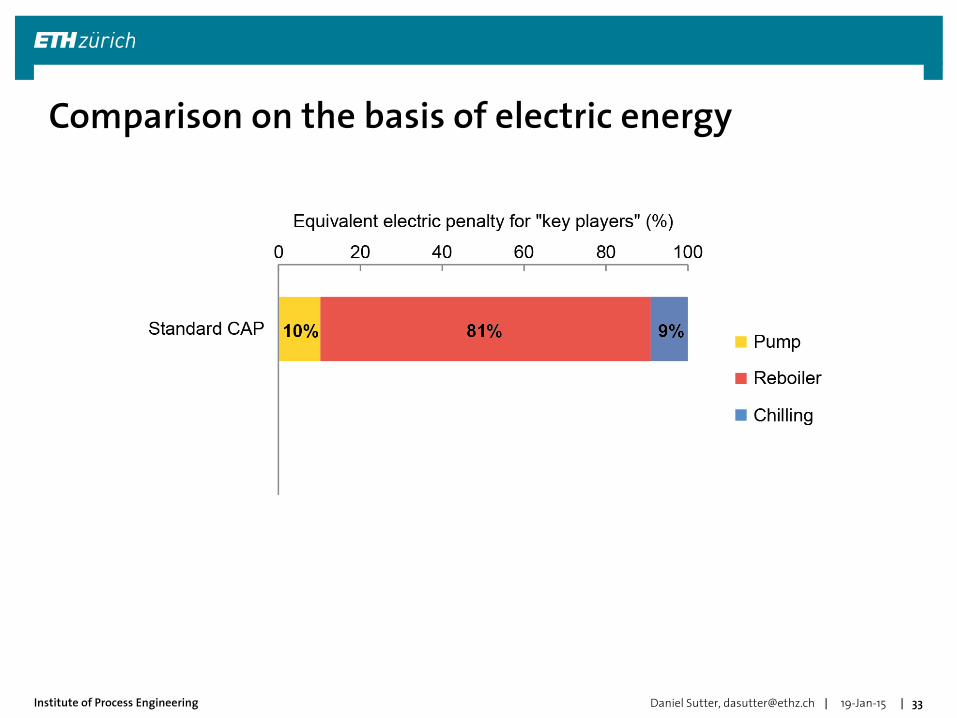
| | Institute of Process Engineering 19-Jan-15 Daniel Sutter, [email protected] 33
Comparison on the basis of electric energy
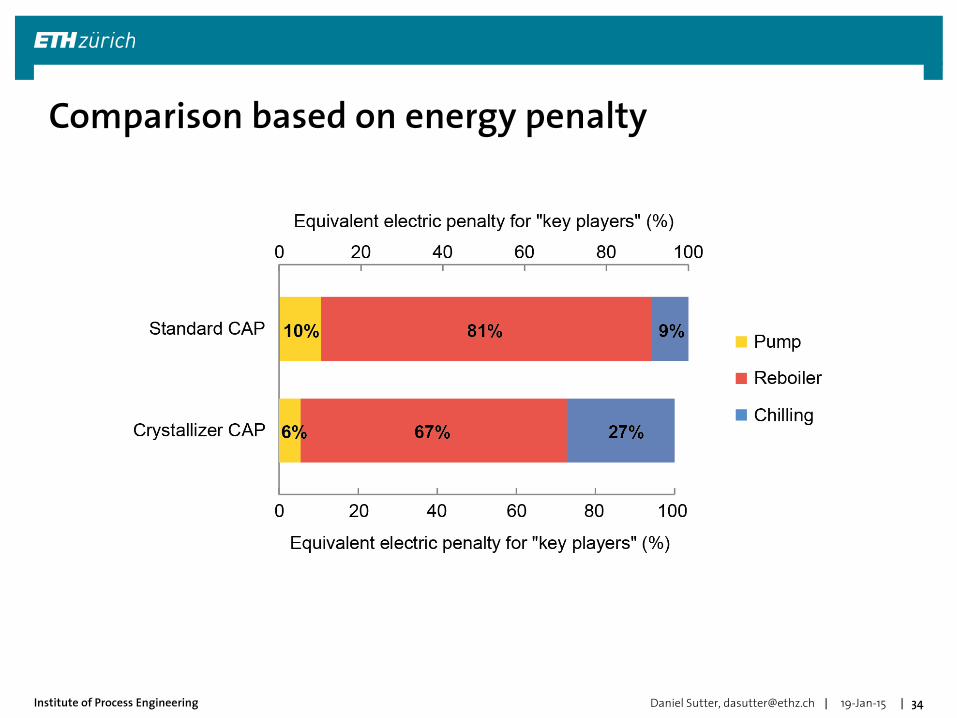
| | Institute of Process Engineering 19-Jan-15 Daniel Sutter, [email protected] 34
Comparison based on energy penalty
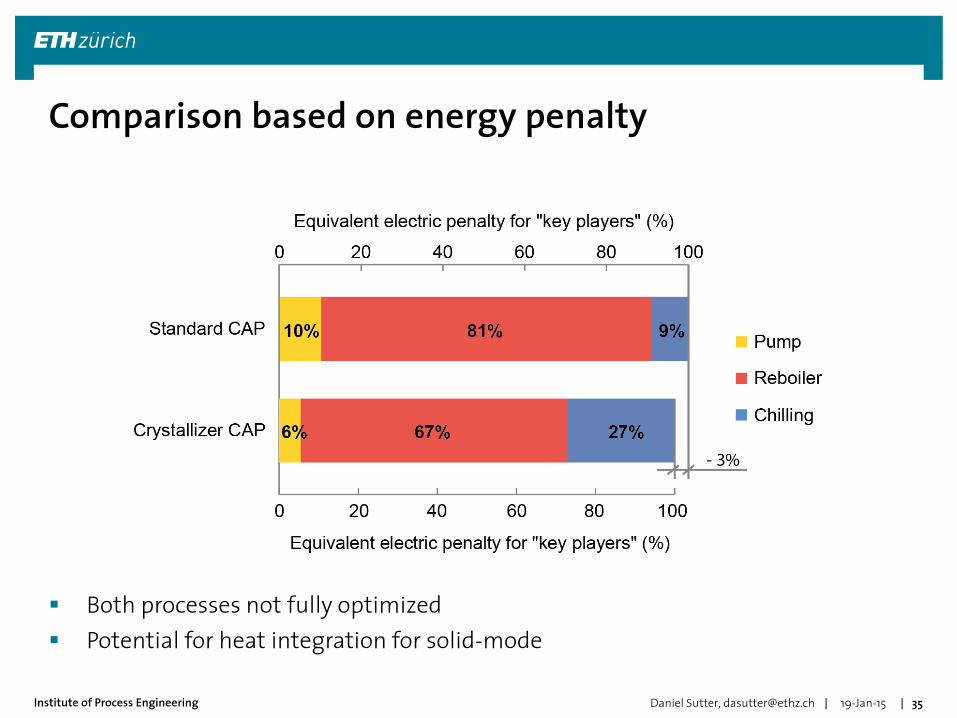
| | Institute of Process Engineering 19-Jan-15 Daniel Sutter, [email protected] 35
Comparison based on energy penalty
Both processes not fully optimized
Potential for heat integration for solid-mode
| | Institute of Process Engineering
Ternary phase diagrams as a tool for the design of a solid-mode CAP
Experimental investigation of solid formation in the CO2-NH3-H2O system Setup and analytical concept
On-line identification of solids by RAMAN
Process simulation of solid-mode CAP
Significant reduction of the reboiler duty (approx. 20%)
Slight reduction of overall energy penalty (based on «key players»)
Potential for further reduction with heat integration
Increase of complexity and CAPEX for absorption section (low pressure)
Decrease of size and CAPEX for regeneration section (high pressure)
19-Jan-15 Daniel Sutter, [email protected] 36
Conclusions