Proving Ground - Roadside Safety Pooled Fund · March 2008 – August 2009 14. Sponsoring Agency...
79
ISO 17025 Laboratory Testing Certificate # 2821.01 Proving Ground Report No. 405160-13-1 Report Date: August 2009 DEVELOPMENT AND TESTING OF A CONCRETE BARRIER DESIGN FOR USE IN FRONT OF SLOPE OR ON MSE WALL by Nauman M. Sheikh Associate Transportation Researcher Roger P. Bligh, P.E. Research Engineer and Wanda L. Menges Research Specialist Contract No.: T4541 Test No.: 405160-13-1 Test Date: 2009-04-16 Sponsored by Roadside Safety Research Program Pooled Fund Study No. TPF-5(114) TEXAS TRANSPORTATION INSTITUTE PROVING GROUND Mailing Address: Located at: Roadside Safety & Physical Security Texas A&M Riverside Campus Texas A&M University System Building 7091 3135 TAMU 3100 State Highway 47 College Station, TX 77843-3135 Bryan, TX 77807
Transcript of Proving Ground - Roadside Safety Pooled Fund · March 2008 – August 2009 14. Sponsoring Agency...
ISO 17025 LaboratoryTesting Certificate # 2821.01
Proving Ground Report No. 405160-13-1 Report Date: August 2009 DEVELOPMENT AND TESTING OF A CONCRETE BARRIER DESIGN FOR USE IN FRONT OF SLOPE OR ON MSE WALL by Nauman M. Sheikh Associate Transportation Researcher Roger P. Bligh, P.E. Research Engineer and Wanda L. Menges Research Specialist Contract No.: T4541 Test No.: 405160-13-1 Test Date: 2009-04-16 Sponsored by Roadside Safety Research Program Pooled Fund Study No. TPF-5(114)
TEXAS TRANSPORTATION INSTITUTE PROVING GROUND Mailing Address: Located at: Roadside Safety & Physical Security Texas A&M Riverside Campus Texas A&M University System Building 7091 3135 TAMU 3100 State Highway 47 College Station, TX 77843-3135 Bryan, TX 77807

DISCLAIMER The contents of this report reflect the views of the authors who are solely responsible for the facts and accuracy of the data, and the opinions, findings and conclusions presented herein. The contents do not necessarily reflect the official views or policies of the Washington State Department of Transportation, the Roadside Pooled Fund Program, The Texas A&M University System, or Texas Transportation Institute. This report does not constitute a standard, specification, or regulation. In addition, the above listed agencies assume no liability for its contents or use thereof. The names of specific products or manufacturers listed herein do not imply endorsement of those products or manufacturers. The results reported herein apply only to the article being tested.
The bogie testing and the full-scale crash test reported herein were performed at Texas Transportation Institute (TTI) Proving Ground. TTI Proving Ground is an International Standards Organization (ISO) 17025 accredited laboratory with American Association for Laboratory Accreditation (A2LA) Mechanical Testing certificate 2821.01. The bogie testing and the full-scale crash test were performed according to TTI Proving Ground quality procedures and according to the MASH08 guidelines and standards, herein referred to as MASH.(3,4)
_______________________________________ Wanda L. Menges, Research Specialist Deputy Quality Manager
________________________________________ Richard A. Zimmer, Senior Research Specialist Test Facility Manager Quality Manager Technical Manager

Technical Report Documentation Page 1. Report No.
2. Government Accession No.
3. Recipient's Catalog No.
4. Title and Subtitle DEVELOPMENT AND TESTING OF A CONCRETE BARRIER DESIGN FOR USE IN FRONT OF SLOPE OR ON MSE WALL
5. Report Date August 2009 6. Performing Organization Code
7. Author(s) Nauman M. Sheikh, Roger P. Bligh, and Wanda L. Menges
8. Performing Organization Report No. 405160-13-1
9. Performing Organization Name and Address Texas Transportation Institute Proving Ground The Texas A&M University System College Station, Texas 77843-3135
10. Work Unit No. (TRAIS) 11. Contract or Grant No. T4541
12. Sponsoring Agency Name and Address Washington State Department of Transportation Transportation Building, MS 47372 Olympia, Washington 98504-7372
13. Type of Report and Period Covered Test Report March 2008 – August 2009 14. Sponsoring Agency Code
15. Supplementary Notes Research Study Title: Task Order #13 – Concrete Barrier Design for Use in Front of a Slope or on MSE Wall Name of Contacting Representative: Dave Olson 16. Abstract The objective of this research was to restrict lateral deflection of a concrete barrier when placed adjacent to steep slopes or on top of Mechanically Stabilized Earth (MSE) walls, without using a concrete moment slab. The final design was required to incorporate 20-ft long single slope barrier segments with grouted rebar grid connection. The researchers first evaluated the performance of the free-standing barrier with grouted rebar-grid connection using a smaller scale bogie impact test and simulation analysis. It was determined that the grouted rebar-grid connection did not provide enough strength to restrict lateral deflections.
The researchers then evaluated restricting the deflection of the barrier by embedding it 10 inches in soil. The barrier was placed in front of a 1.5H:1V slope. The offset of the barrier from the slope break point was restricted to 2 ft. Another phase of bogie testing and simulation analysis was performed to evaluate the performance of the grouted rebar grid connection in the embedded configuration. Results of the simulation analysis showed that the embedded barrier system will result in acceptably reduced lateral deflections.
A 100-ft long installation of the embedded single-slope barrier in front of a 1.5H:1V slope was subsequently crash tested under Manual for Assessing Safety Hardware (MASH) criteria. The design performed acceptably according to the requirements of MASH and the maximum static barrier deflection was 5.5 inches. While the barrier was tested in front of a 1.5H:1V slope, due to a relatively small lateral deflection, it is also recommended for use on top of MSE walls as long as a minimum 2-ft lateral offset is maintained between the back of the barrier and the wall. 17. Key Words Concrete barrier, embedded barrier, restrained barrier, slope, MSE wall, soil, single slope barrier, rebar grid
18. Distribution Statement Copyrighted. Not to be copied or reprinted without consent from Washington DOT.
19. Security Classif.(of this report) Unclassified
20. Security Classif.(of this page) Unclassified
21. No. of Pages 80
22. Price
Form DOT F 1700.7 (8-72) Reproduction of completed page authorized

v
ACKNOWLEDGMENTS
This research project was performed under a pooled fund program between the State of Alaska Department of Transportation and Public Facilities, California Department of Transportation (Caltrans), Louisiana Department of Transportation and Development, Minnesota Department of Transportation, Tennessee Department of Transportation, Texas Department of Transportation and Washington State Department of Transportation, and the Federal Highway Administration. The authors acknowledge and appreciate their guidance and assistance.
Roadside Safety Research Pooled Fund Committee
CONTACTS Revised December 2008
ALASKA Jeff Jeffers Statewide Traffic & Safety Engineering Asst State of Alaska Department of Transportation and Public Facilities 3132 Channel Drive Juneau, AK 99801 (907) 465-8962 [email protected] Clint Adler, P.E. Research Engineer Alaska Department of Transportation and Public Facilities Research and Technology Transfer 2301 Peger Road Fairbanks, AK 99709 (907) 451-5321 [email protected] Kurt Smith, P.E. Statewide Traffic & Safety Engineer Alaska Department of Transportation & Public Facilities 3132 Channel Drive Juneau, AK 99801-7898 (907) 465-6963 [email protected]
CALIFORNIA John Jewell, P.E. Caltrans Office of Materials and Infrastructure Division of Research and Innovation 5900 Folsom Blvd Sacramento, CA 95819 (916) 227-5824 (916) 227-5856 [email protected] LOUISIANA Paul Fossier Bridge and Structural Design Section P.O. Box 94245 Baton Rouge, LA 79084-9245 (225)379-1323 [email protected] Harold “Skip” Paul Associate Director, Research Louisiana Transportation Center 4101 Gourrier Ave. Baton Rouge, LA 70808 (225) 767-9102 [email protected]

vi
MINNESOTA Michael Elle, P.E. Design Standards Engineer Minnesota Department of Transportation 395 John Ireland Blvd, MS 696 St. Paul, MN 55155 (651) 296-4859 [email protected] James Klessig, Pooled Fund Manager Minnesota Department of Transportation Office of Investment Management Research Services Section 395 John Ireland Blvd, MS 330 St. Paul, MN 55155 [email protected] PENNSYLVANIA Mark R. Burkhead, P.E. PA Department of Transportation Bureau of Design Highway Quality Assurance Division 400 North Street Harrisburg, PA 17105 (717) 783-5110 www.dot.state.pa.us TENNESSEE Ali Hangul Director, Design Division Tennessee Department of Transportation Suite 1300 James K. Polk State Office Building Nashville, TN 37243-0348 (615) 741-0840 [email protected]
TEXAS Mark A. Marek Design Division Texas Department of Transportation 125 East 11th Street Austin, TX 78701-2483 (512) 416-2653 [email protected] Charmaine Richardson [email protected] WASHINGTON Dave Olson, Chair Design Policy, Standards, & Research Manager Washington State Department of Transportation (360) 705-7952 [email protected] Rhonda Brooks, Research Manager Washington State Department of Transportation P.O. Box 47372 Olympia, WA 98504-7372 (360) 705-7945 [email protected] FEDERAL HIGHWAY ADMINISTRATION Ken Opiela U.S. Department of Transportation Federal Highway Administration Turner-Fairbanks Highway Research Center Mail Code: HRDS-04 6300 Georgetown Pike McLean, VA 22101 (202) 493-3371 [email protected]

vii
TEXAS TRANSPORTATION INSTITUTE D. Lance Bullard, Jr., P.E. Research Engineer Roadside Safety & Physical Security Div. Texas Transportation Institute Texas A&M University System College Station, TX 77843-3135 (979) 845-6153 [email protected] C. Eugene Buth, Ph.D., P.E. Senior Research Fellow Roadside Safety & Physical Security Div. Texas Transportation Institute Texas A&M University System College Station, TX 77843-3135 (979) 845-6159 [email protected] Roger P. Bligh, Ph.D., P.E. Research Engineer Roadside Safety & Physical Security Div. Texas Transportation Institute Texas A&M University System College Station, TX 77843-3135 (979) 845-4377 [email protected]

ix
TABLE OF CONTENTS Section Page 1. INTRODUCTION ..................................................................................................................... 1
1.1 PROBLEM ...................................................................................................................... 1 1.2 BACKGROUND ............................................................................................................ 1 1.3 OBJECTIVES AND SCOPE OF RESEARCH .............................................................. 2
2. DESIGN AND ANALYSIS ...................................................................................................... 3
2.1 INTRODUCTION .......................................................................................................... 3 2.2 VEHICLE MODEL ........................................................................................................ 4 2.3 FREE-STANDING BARRIER WITH GROUTED REBAR-GRID SLOT CONNECTION .......................................................................... 4 2.4 EMBEDDED BARRIER WITH GROUTED REBAR-GRID SLOT CONNECTION ........................................................................ 10 2.5 CONCLUSIONS........................................................................................................... 12
3. SYSTEM DETAILS ................................................................................................................ 15
3.1 TEST ARTICLE DESIGN AND CONSTRUCTION .................................................. 15 3.2 MATERIAL SPECIFICATIONS ................................................................................. 15
4. TEST REQUIREMENTS AND EVALUATION CRITERIA ................................................ 19
4.1 CRASH TEST MATRIX .............................................................................................. 19 4.2 EVALUATION CRITERIA ......................................................................................... 19
5. TEST CONDITIONS............................................................................................................... 21
5.1 TEST FACILITY .......................................................................................................... 21 5.2 VEHICLE TOW AND GUIDANCE SYSTEM ........................................................... 21 5.3 DATA ACQUISITION SYSTEMS .............................................................................. 21
5.3.1 Vehicle Instrumentation and Data Processing .......................................................... 21 5.3.2 Anthropomorphic Dummy Instrumentation ............................................................. 23 5.3.3 Photographic Instrumentation and Data Processing ................................................. 23
6. CRASH TEST 405160-13-1 (MASH TEST NO. 3-11) ........................................................... 25
6.1 TEST DESIGNATION AND ACTUAL IMPACT CONDITIONS ............................ 25 6.2 TEST VEHICLE ........................................................................................................... 25 6.3 WEATHER CONDITIONS.......................................................................................... 25 6.4 TEST DESCRIPTION .................................................................................................. 25 6.5 TEST ARTICLE AND COMPONENT DAMAGE ..................................................... 28 6.6 TEST VEHICLE DAMAGE ........................................................................................ 28 6.7 OCCUPANT RISK VALUES ...................................................................................... 28 6.8 ASSESSMENT OF TEST RESULTS .......................................................................... 34
6.8.1 Structural Adequacy .................................................................................................. 34 6.8.2 Occupant Risk ........................................................................................................... 34 6.8.3 Vehicle Trajectory .................................................................................................... 35

x
TABLE OF CONTENTS (CONTINUED) Section Page 7. SUMMARY AND CONCLUSIONS ...................................................................................... 37
7.1 SUMMARY .................................................................................................................. 37 7.2 CONCLUSIONS........................................................................................................... 37
REFERENCES ............................................................................................................................. 41 APPENDIX A. DETAILS OF TEST ARTICLE ....................................................................... A-1 APPENDIX B. MATERIAL CERTIFICATION FOR TEST ARTICLE ................................. B-1 APPENDIX C. CONCRETE INFORMATION ........................................................................ C-1 APPENDIX D. CRASH TEST NO. 405160-13-1..................................................................... D-1
D1. VEHICLE PROPERTIES AND INFORMATION ......................................................... D-1 D2. SEQUENTIAL PHOTOGRAPHS .................................................................................. D-4 D3. VEHICLE ANGULAR DISPLACEMENTS ................................................................. D-7 D4. VEHICLE ACCELERATIONS ...................................................................................... D-8
xi
LIST OF FIGURES Page Figure 2.1. Test installation to evaluate strength of the grouted rebar-grid connection. ............. 5 Figure 2.2. Simulation setup for determining lateral force levels for impacts
with rigid single slope barrier. ................................................................................... 6 Figure 2.3. Lateral force comparison of pickup truck and bogie vehicle impacts
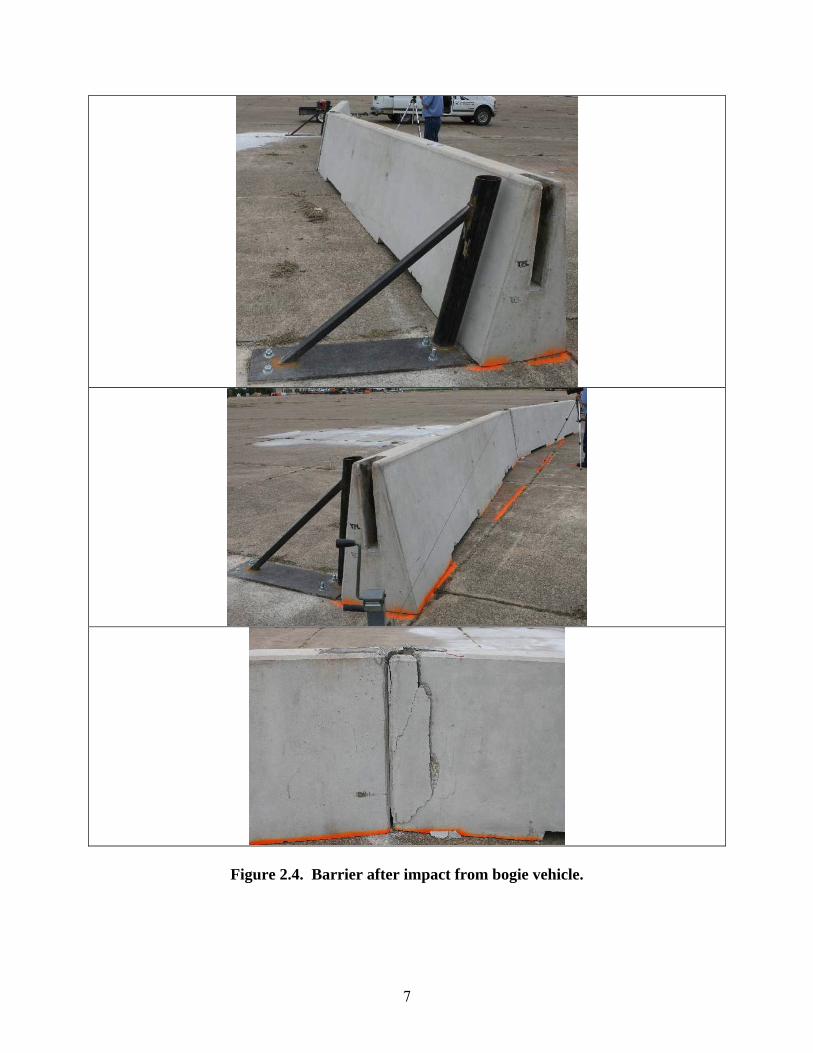
on rigid single slope barrier. ...................................................................................... 6 Figure 2.4. Barrier after impact from bogie vehicle. ................................................................... 7 Figure 2.5. Finite element model of the bogie test. ..................................................................... 8 Figure 2.6. Results of the bogie crash test and simulation analysis. ............................................ 9 Figure 2.7. Finite element model of the 100-ft installation
of free-standing single slope barrier. ......................................................................... 9 Figure 2.8. Bogie test setup for embedded barriers. .................................................................. 10 Figure 2.9: Simulation and test results of bogie test with embedded barriers. ......................... 11 Figure 2.10: Simulation results with soil behind the barrier
(initial (top) and final (bottom) states). .................................................................... 11 Figure 2.11. Simulation results with soil on both sides of barrier
(initial (top) and final (bottom) states). .................................................................... 12 Figure 3.1. Layout of the single-slope barrier in front of 1.5:1 slope. ....................................... 16 Figure 3.2. Single-slope barrier in front of 1.5:1 slope prior to testing. .................................... 17 Figure 6.1. Vehicle/installation geometrics for test 405160-13-1. ............................................ 26 Figure 6.2. Vehicle before test 405160-13-1. ............................................................................ 27 Figure 6.3. Vehicle trajectory path after test 405160-13-1. ....................................................... 29 Figure 6.4. Installation after test 405160-13-1. .......................................................................... 30 Figure 6.5. Vehicle after test 405160-13-1. ............................................................................... 31 Figure 6.6. Interior of vehicle for test 405160-13-1. ................................................................. 32 Figure 6.7. Summary of results for MASH test 3-11 on the single-slope barrier on 1.5:1 slope.
.................................................................................................................................. 33 Figure D1. Vehicle properties for test 405160-13-1. ............................................................... D-1 Figure D2. Sequential photographs for test 405160-13-1 (overhead and frontal views). ........ D-4 Figure D3. Sequential photographs for test 405160-13-1 (rear view). .................................... D-6 Figure D4. Vehicle angular displacements for test 405160-13-1. ........................................... D-7 Figure D5. Vehicle longitudinal accelerometer trace for test 405160-13-1
(accelerometer located at center of gravity). .......................................................... D-8 Figure D6. Vehicle lateral accelerometer trace for test 405160-13-1
(accelerometer located at center of gravity). .......................................................... D-9 Figure D7. Vehicle vertical accelerometer trace for test 405160-13-1
(accelerometer located at center of gravity). ........................................................ D-10 Figure D8. Vehicle longitudinal accelerometer trace for test 405160-13-1
(accelerometer located over rear axle). ................................................................ D-11 Figure D9. Vehicle lateral accelerometer trace for test 405160-13-1
(accelerometer located over rear axle). ................................................................ D-12 Figure D10. Vehicle vertical accelerometer trace for test 405160-13-1
(accelerometer located over rear axle). ................................................................ D-13

xii
LIST OF TABLES Page Table 7.1. Performance evaluation summary for MASH test 3-11
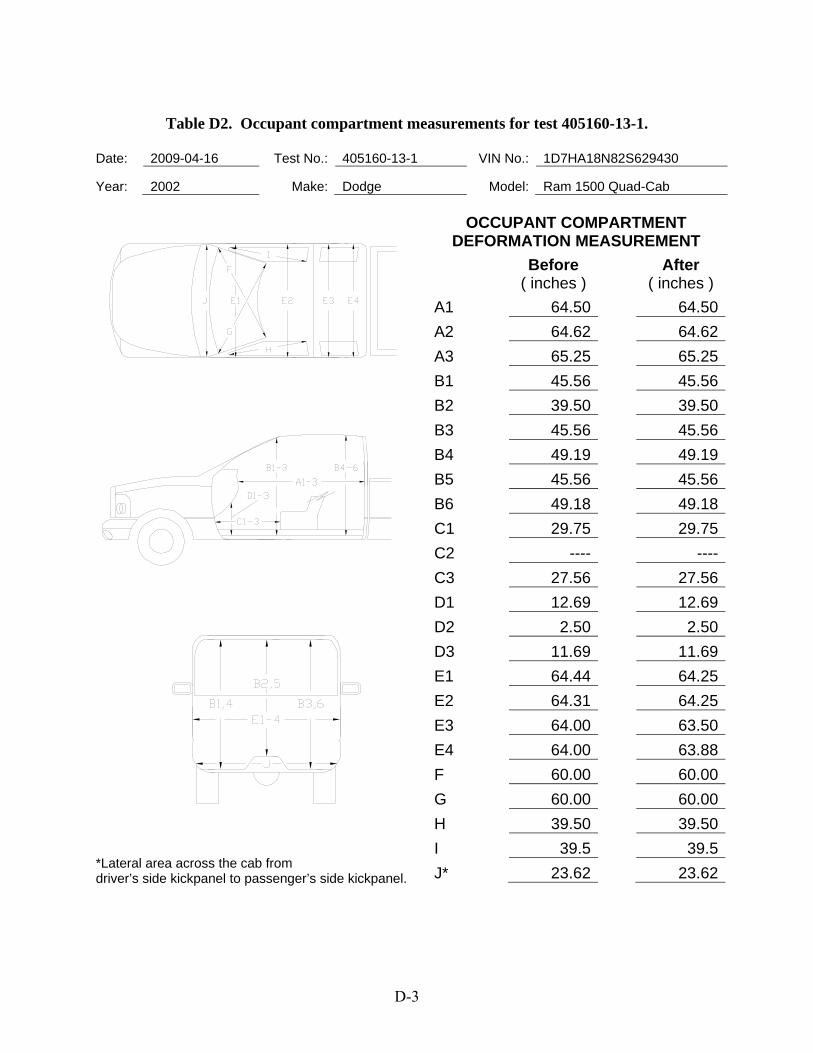
on the single-slope barrier on slope. ........................................................................... 39 Table D1. Exterior crush measurements for test 405160-13-1. ................................................. D-2 Table D2. Occupant compartment measurements for test 405160-13-1. .................................. D-3
1
1. INTRODUCTION 1.1 PROBLEM
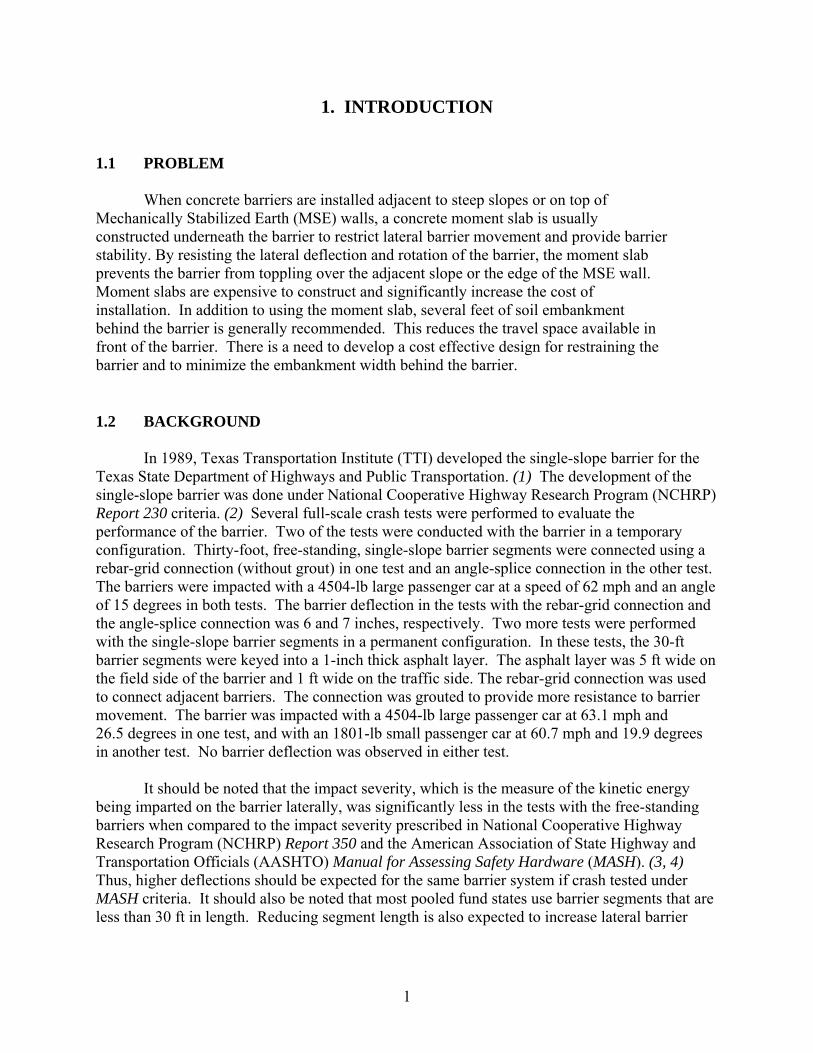
When concrete barriers are installed adjacent to steep slopes or on top of Mechanically Stabilized Earth (MSE) walls, a concrete moment slab is usually constructed underneath the barrier to restrict lateral barrier movement and provide barrier stability. By resisting the lateral deflection and rotation of the barrier, the moment slab prevents the barrier from toppling over the adjacent slope or the edge of the MSE wall. Moment slabs are expensive to construct and significantly increase the cost of installation. In addition to using the moment slab, several feet of soil embankment behind the barrier is generally recommended. This reduces the travel space available in front of the barrier. There is a need to develop a cost effective design for restraining the barrier and to minimize the embankment width behind the barrier. 1.2 BACKGROUND In 1989, Texas Transportation Institute (TTI) developed the single-slope barrier for the Texas State Department of Highways and Public Transportation. (1) The development of the single-slope barrier was done under National Cooperative Highway Research Program (NCHRP) Report 230 criteria. (2) Several full-scale crash tests were performed to evaluate the performance of the barrier. Two of the tests were conducted with the barrier in a temporary configuration. Thirty-foot, free-standing, single-slope barrier segments were connected using a rebar-grid connection (without grout) in one test and an angle-splice connection in the other test. The barriers were impacted with a 4504-lb large passenger car at a speed of 62 mph and an angle of 15 degrees in both tests. The barrier deflection in the tests with the rebar-grid connection and the angle-splice connection was 6 and 7 inches, respectively. Two more tests were performed with the single-slope barrier segments in a permanent configuration. In these tests, the 30-ft barrier segments were keyed into a 1-inch thick asphalt layer. The asphalt layer was 5 ft wide on the field side of the barrier and 1 ft wide on the traffic side. The rebar-grid connection was used to connect adjacent barriers. The connection was grouted to provide more resistance to barrier movement. The barrier was impacted with a 4504-lb large passenger car at 63.1 mph and 26.5 degrees in one test, and with an 1801-lb small passenger car at 60.7 mph and 19.9 degrees in another test. No barrier deflection was observed in either test. It should be noted that the impact severity, which is the measure of the kinetic energy being imparted on the barrier laterally, was significantly less in the tests with the free-standing barriers when compared to the impact severity prescribed in National Cooperative Highway Research Program (NCHRP) Report 350 and the American Association of State Highway and Transportation Officials (AASHTO) Manual for Assessing Safety Hardware (MASH). (3, 4) Thus, higher deflections should be expected for the same barrier system if crash tested under MASH criteria. It should also be noted that most pooled fund states use barrier segments that are less than 30 ft in length. Reducing segment length is also expected to increase lateral barrier
2
deflection. This is because shorter segments have less mass and allow greater relative rotation of adjacent segments due to the presence of more connections. 1.3 OBJECTIVES AND SCOPE OF RESEARCH
The main objective of this research project was to develop and test a design for a restrained concrete barrier that can be placed in front of slopes as steep as 1.5H:1V, or on top of MSE walls. The design would not require a moment slab and would reduce soil embankment width behind the barrier to 2 ft or less. Further, the design feature should incorporate Washington Department of Transportation’s (WSDOT) precast single slope barrier with 20-ft long barrier segments. The design was required to meet Test Level 3 (TL-3) requirements of MASH.
The existing WSDOT single slope barrier uses a grouted rebar-grid connection to connect the 20-ft long barrier segments. The performance of this barrier connection was not known in a free standing condition. It was suggested that if the free standing barrier with grouted rebar-grid connection resulted in small lateral deflection under vehicle impact, it would render the simplest and most cost effective solution to the design problem. The researchers evaluated the performance of this connection in a free-standing single-slope barrier using a surrogate bogie vehicle impact test and finite element analysis. It was determined that using the barrier with existing connection in a free-standing mode would result in large lateral deflections.
The researchers then evaluated restraining the barrier by embedding it 10 inches in soil and providing a 2 ft offset from the slope breakpoint. Another phase of bogie testing and finite element analysis was performed and it was determine that the design would result in acceptable lateral deflection. Subsequently, the new embedded barrier design was crash tested and it successfully met MASH TL-3 requirements. The maximum static deflection of the barrier was 5.5 inches.
Details of the design and analysis are presented in chapter 2 of this report. Chapter 3
presents the description of the test article. Details of the testing criteria and crash test results are presented in chapters 4 through 6. Chapter 7 presents a summary of the results, conclusions, and recommendations emanating from this project.

3
2. DESIGN AND ANALYSIS 2.1 INTRODUCTION
The primary objective of this research was to develop a design for a precast concrete barrier that can be placed in front of slopes as steep as 1.5H:1V or on top of MSE walls, without using a moment slab. The design was required to use 20-ft long single-slope barrier segments, and to restrict the soil embankment behind the barrier to two feet or less.
The pooled-fund states typically use the grouted rebar-grid slot connection to connect single-slope barrier segments. To date, there has been no testing performed with the single slope barrier using the grouted rebar-grid slot connection in a free-standing condition. As a first step, the researchers evaluated the performance of the free-standing single slope barrier. The objective of this evaluation was to determine if the grouted rebar-grid connection provided sufficient connection strength to cause adjacent barriers segments to deflect as a single body during vehicle impact, without significant rotation at the joints. If this could be achieved, it was believed that the impacting vehicle can be contained and redirected without significant barrier deflection simply using the weight of the concrete barrier. This would have also rendered the easiest solution to the design problem and allowed maximum flexibility in the use of the barrier. However, subsequent evaluation of the grouted rebar-grid slot connection in a free-standing condition showed that it is not strong enough to transfer moments between adjacent barrier segments and results in large rotations at the joints, thus resulting in a large overall lateral barrier deflection. The researchers then considered use of different methods for restraining the barrier to prevent large lateral deflection. Among the methods considered were using a stronger barrier connection, pinning or staking the barrier segments with steel pins, using straps or angles to tie adjacent barriers together, etc. However, the participating states expressed interest in keeping the same connection methods and avoiding use of additional hardware if possible. To fulfill these requirements, the researchers evaluated restraining the barriers by embedding them in soil. The height of a typical single-slope barrier is 42 inches. The researchers suggested embedding the single slope barrier 10 inches in soil. This reduces the height of the barrier to 32 inches, which is typical of the common New Jersey and F-shape barrier profiles. The researchers used a combination of component level bogie impact testing, simulation analysis, and full-scale crash testing1 to successfully develop a restraint mechanism for the single slope barrier by embedding it 10 inches in soil. The design uses existing grouted rebar-grid slot connection and requires a 2-ft offset from the slope breakpoint. Details of the analysis are presented in later sections of this chapter. Details of the final design and the results of the full-scale crash testing are presented in subsequent chapters of this report.
1 The bogie testing and the full-scale crash test reported herein were performed at TTI Proving Ground. TTI Proving Ground is an ISO 17025 accredited laboratory with A2LA Mechanical Testing certificate 2821.01. This certificate does not include simulation analysis.
4
2.2 VEHICLE MODEL
In MASH, which is a recent update to the NCHRP Report 350, the pickup truck design vehicle has been changed from a 4409-lb, ¾-ton, standard cab pickup truck to a 5000-lb, ½-ton, 4-door pickup truck. While a public domain finite element model of the 4409-lb pickup truck was available to researchers in the roadside safety community, no such model was available for the 5000-lb, ½-ton, 4-door pickup truck during the period of this research. The Federal Highway Administration (FHWA) had funded the development of a finite element model for a ½-ton, Chevrolet Silverado, 4-door, pickup truck, which meets the design test vehicle requirements of MASH. However, the work on developing this new model was underway but was not completed within the timeframe of this research.
In the past, TTI researchers have made simple modifications to the existing 4409-lb pickup truck model for use in studies where the dynamics of the vehicle were not very critical compared to the higher mass required by MASH. These modifications involve increasing the mass of the existing 4409-lb pickup truck model by distributing additional mass over different parts of the vehicle and bringing the total vehicle mass to 5000-lb. The original 4409-lb pickup truck model was developed by the National Crash Analysis Center with further modifications and improvements by TTI researchers.
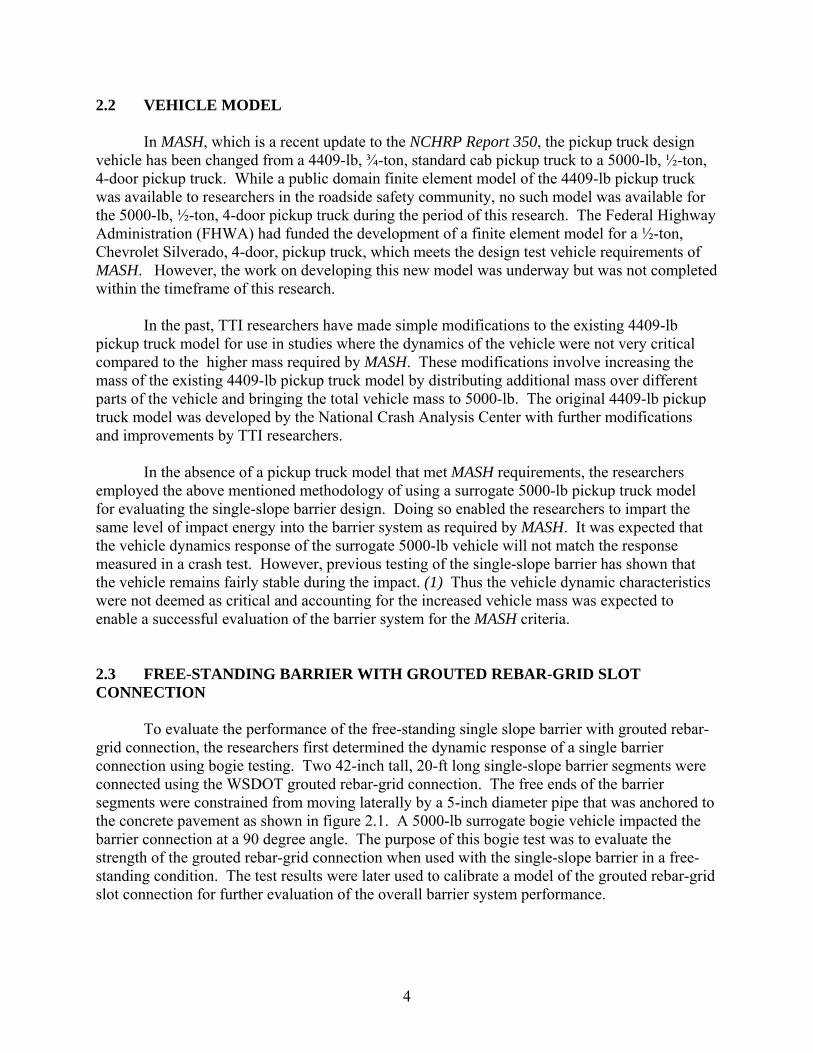
In the absence of a pickup truck model that met MASH requirements, the researchers employed the above mentioned methodology of using a surrogate 5000-lb pickup truck model for evaluating the single-slope barrier design. Doing so enabled the researchers to impart the same level of impact energy into the barrier system as required by MASH. It was expected that the vehicle dynamics response of the surrogate 5000-lb vehicle will not match the response measured in a crash test. However, previous testing of the single-slope barrier has shown that the vehicle remains fairly stable during the impact. (1) Thus the vehicle dynamic characteristics were not deemed as critical and accounting for the increased vehicle mass was expected to enable a successful evaluation of the barrier system for the MASH criteria. 2.3 FREE-STANDING BARRIER WITH GROUTED REBAR-GRID SLOT CONNECTION
To evaluate the performance of the free-standing single slope barrier with grouted rebar-grid connection, the researchers first determined the dynamic response of a single barrier connection using bogie testing. Two 42-inch tall, 20-ft long single-slope barrier segments were connected using the WSDOT grouted rebar-grid connection. The free ends of the barrier segments were constrained from moving laterally by a 5-inch diameter pipe that was anchored to the concrete pavement as shown in figure 2.1. A 5000-lb surrogate bogie vehicle impacted the barrier connection at a 90 degree angle. The purpose of this bogie test was to evaluate the strength of the grouted rebar-grid connection when used with the single-slope barrier in a free-standing condition. The test results were later used to calibrate a model of the grouted rebar-grid slot connection for further evaluation of the overall barrier system performance.

5
Figure 2.1. Test installation to evaluate strength of the grouted rebar-grid connection.
An appropriate impact speed of the bogie vehicle was determined using simulation
analysis. A simulation was performed with the 5000-lb pickup truck vehicle impacting a rigid single slope barrier at 62 mi/h and 25 degree angle (as required by test 3-11 of MASH. See figure 2.2). The force of contact between the vehicle and rigid barrier were measured. Another set of simulations was performed where a finite element model of the 5000-lb surrogate bogie vehicle impacted a rigid single slope barrier at 90 degrees (as shown in figure 2.2). The contact force between the bogie vehicle and the rigid barrier were measured for several impact speeds and then compared to the forces resulting from the pickup truck impact with the barrier (as shown in figure 2.3). The comparison revealed that a 15 mi/h impact at 90 degrees provided forces that were approximately equivalent to those resulting from a 62 mi/h impact of the pickup at 25 degrees. Thus, the impact speed of the bogie vehicle in the test was selected to be 15 mi/h.
The 5000-lb bogie vehicle impacted the barriers at the center of the joint at an impact
speed of 14 mi/h. The impact in the test resulted in a maximum permanent lateral deflection of 22 inches. The grouted rebar-grid connection cracked near the centerline of the connection (see figure 2.4).

6
Figure 2.2. Simulation setup for determining lateral force levels for impacts
with rigid single slope barrier.
Figure 2.3. Lateral force comparison of pickup truck and bogie vehicle impacts on rigid single slope barrier.
7
Figure 2.4. Barrier after impact from bogie vehicle.

8
The researchers then developed a finite element model of the barrier installation used in the bogie test. The single slope barrier segments were modeled with mostly rigid material representation. To improve the distribution of forces at interfaces between adjacent barriers and between the barrier and the ground, elastic material representation was used in these regions. The grouted rebar-grid connection was modeled using bi-linear elastic-plastic material and a rebar-grid comprised of beam elements. A 5000-lb bogie vehicle model impacted the barrier modle at the test speed and location. The model of the barrier bogie test setup is shown in figure 2.5.
Figure 2.5. Finite element model of the bogie test.
The properties of the surrogate grouted rebar-grid connection in the simulation model
were calibrated to match the lateral deflection of the barrier observed in the test. Figure 2.6 shows the calibrated simulation results compared to the crash test results.
Once the response of a single grouted rebar-grid connection was calibrated, the researchers developed a 100-ft long full-scale barrier system model to evaluate the free-standing single slope barrier under MASH TL-3 impact conditions (i.e. impact with a 5000-lb vehicle at 62 mi/h and 25 degrees). The objective of this simulation was to determine if the overall lateral deflection of the free-standing barrier installation was small enough to allow its use adjacent to slopes or on MSE walls without requiring any restraining mechanisms. The barrier system model was comprised of five 20-ft long single slope barrier segments that were connected using the calibrated grouted rebar-grid slot connection model. The 5000-lb vehicle impacted the barrier 4 ft upstream of the connection between the second and the third barrier segment as shown in figure 2.7.
In the simulated impact, the free standing barrier had a deflection greater than 30 inches. This deflection was much higher than acceptable as per the objectives of this research. Hence, the researchers started investigating ways of restraining the barrier to limit lateral deflections.
Surrogate grouted rebar-grid
Rigid material Elastic material

9
Figure 2.6. Results of the bogie crash test and simulation analysis.
Figure 2.7. Finite element model of the 100-ft installation of free-standing single slope barrier.

10
2.4 EMBEDDED BARRIER WITH GROUTED REBAR-GRID SLOT CONNECTION
Various methods of restraining the barriers were considered, such as anchoring with steel pins, using steel straps to tie barrier segments, etc. In consultation with the technical representatives of the participating pooled fund states, it was decided to investigate direct embedment of the barrier in soil. This method allowed the use of existing hardware inventory without any modifications. The embedment depth was 10 inches. A typical single slope barrier used by the sponsoring pooled fund states is 42 inches tall. The states did not perceive any related problems with reducing the effective height of the single slope barrier to 32 inches as a result of the 10-inch embedment. The 32-inch barrier height is typical for other commonly used safety shape barriers such as the New Jersey and the F-shape barriers.
The researchers conducted another bogie impact test with two single-slope barrier
segments connected via grouted rebar-grid slot connection and embedded 10 inches in soil. The width of the soil behind the barrier was 24 inches behind the barrier. A 1.5H:1V slope was used for the soil cut, as shown in the test setup in figure 2.8. The type of soil and the compaction method used were as specified in the MASH gudielines. The 5004-lb bogie vehicle impacted the barrier at the joint at a speed of 14.4 mi/h. The maximum permanent barrier deflection was 4.45 inches at the joint. The researchers then incorporated a 10-inch soil layer into the finite element model and calibrated the soil properties by conducted bogie vehicle impact simulations until the results matched the barrier deflection observed in the test (see figure 2.9).
Figure 2.8. Bogie test setup for embedded barriers.

11
Figure 2.9: Simulation and test results of bogie impacted with embedded barriers.
The researchers used the calibrated embedded barrier to develop a 100-ft long full-scale
barrier system model. The installation was comprised of five 20-ft long single-slope barrier segments, connected using grouted rebar-grid connection and embedded 10 inches in soil behind the barrier (i.e. on the field side). The field side of the barriers was offset 2 ft from the 1.5H:1V slope. A simulation was performed with a 5000-lb vehicle impacting the barrier at 25 degrees and 62 mi/h (see figure 2.10). The vehicle impacted the barrier 4 ft upstream of the connection between the second and the third barrier segment. The vehicle was successfully contained and redirected by the embedded barrier system. The maximum permanent deflection of the barrier was 10 inches. The deflection of the barrier after the impact is shown in figure 2.10.
Figure 2.10: Simulation results with soil behind the barrier
(initial (top) and final (bottom) states).
12
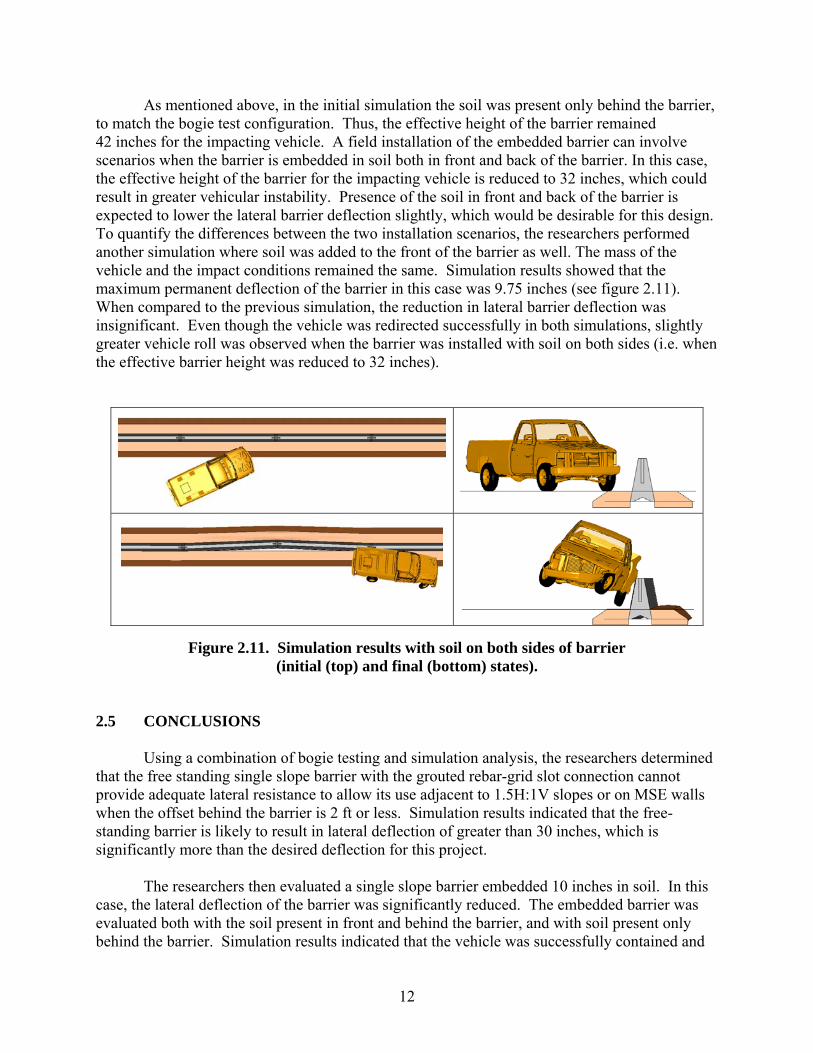
As mentioned above, in the initial simulation the soil was present only behind the barrier, to match the bogie test configuration. Thus, the effective height of the barrier remained 42 inches for the impacting vehicle. A field installation of the embedded barrier can involve scenarios when the barrier is embedded in soil both in front and back of the barrier. In this case, the effective height of the barrier for the impacting vehicle is reduced to 32 inches, which could result in greater vehicular instability. Presence of the soil in front and back of the barrier is expected to lower the lateral barrier deflection slightly, which would be desirable for this design. To quantify the differences between the two installation scenarios, the researchers performed another simulation where soil was added to the front of the barrier as well. The mass of the vehicle and the impact conditions remained the same. Simulation results showed that the maximum permanent deflection of the barrier in this case was 9.75 inches (see figure 2.11). When compared to the previous simulation, the reduction in lateral barrier deflection was insignificant. Even though the vehicle was redirected successfully in both simulations, slightly greater vehicle roll was observed when the barrier was installed with soil on both sides (i.e. when the effective barrier height was reduced to 32 inches).
Figure 2.11. Simulation results with soil on both sides of barrier (initial (top) and final (bottom) states).
2.5 CONCLUSIONS
Using a combination of bogie testing and simulation analysis, the researchers determined that the free standing single slope barrier with the grouted rebar-grid slot connection cannot provide adequate lateral resistance to allow its use adjacent to 1.5H:1V slopes or on MSE walls when the offset behind the barrier is 2 ft or less. Simulation results indicated that the free-standing barrier is likely to result in lateral deflection of greater than 30 inches, which is significantly more than the desired deflection for this project.
The researchers then evaluated a single slope barrier embedded 10 inches in soil. In this
case, the lateral deflection of the barrier was significantly reduced. The embedded barrier was evaluated both with the soil present in front and behind the barrier, and with soil present only behind the barrier. Simulation results indicated that the vehicle was successfully contained and
13
redirected in both cases and the requirement of reduced lateral deflection was met. In the case when soil was present on both sides of the barrier, higher vehicle roll was observed. This was expected because the barrier embedment reduced the height of the barrier from 42 inches to 32 inches. Based on these results, the researchers recommended that the crash test be performed on a single slope barrier using grouted rebar-grid connection embedded 10 inches in soil on both sides. This was considered to be the more critical configuration in regard to impact performance. Thus, a successful test could validate the use of both configurations.

15
3. SYSTEM DETAILS 3.1 TEST ARTICLE DESIGN AND CONSTRUCTION
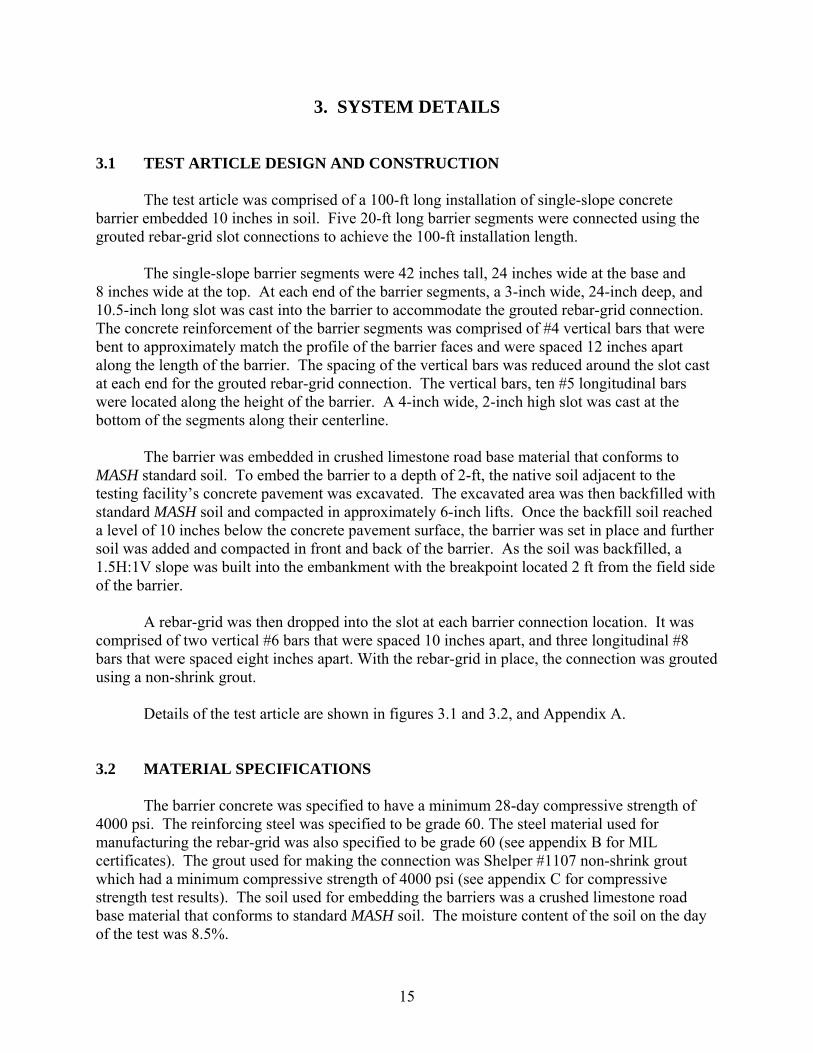
The test article was comprised of a 100-ft long installation of single-slope concrete barrier embedded 10 inches in soil. Five 20-ft long barrier segments were connected using the grouted rebar-grid slot connections to achieve the 100-ft installation length.
The single-slope barrier segments were 42 inches tall, 24 inches wide at the base and
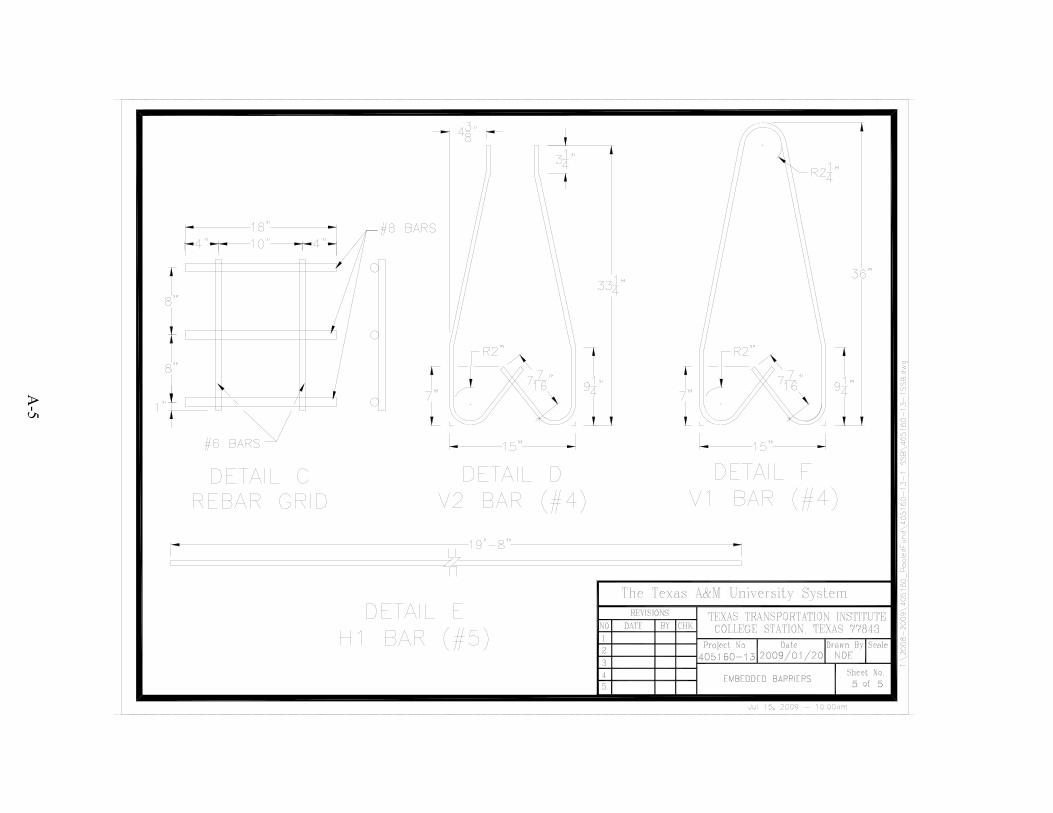
8 inches wide at the top. At each end of the barrier segments, a 3-inch wide, 24-inch deep, and 10.5-inch long slot was cast into the barrier to accommodate the grouted rebar-grid connection. The concrete reinforcement of the barrier segments was comprised of #4 vertical bars that were bent to approximately match the profile of the barrier faces and were spaced 12 inches apart along the length of the barrier. The spacing of the vertical bars was reduced around the slot cast at each end for the grouted rebar-grid connection. The vertical bars, ten #5 longitudinal bars were located along the height of the barrier. A 4-inch wide, 2-inch high slot was cast at the bottom of the segments along their centerline.
The barrier was embedded in crushed limestone road base material that conforms to
MASH standard soil. To embed the barrier to a depth of 2-ft, the native soil adjacent to the testing facility’s concrete pavement was excavated. The excavated area was then backfilled with standard MASH soil and compacted in approximately 6-inch lifts. Once the backfill soil reached a level of 10 inches below the concrete pavement surface, the barrier was set in place and further soil was added and compacted in front and back of the barrier. As the soil was backfilled, a 1.5H:1V slope was built into the embankment with the breakpoint located 2 ft from the field side of the barrier.
A rebar-grid was then dropped into the slot at each barrier connection location. It was
comprised of two vertical #6 bars that were spaced 10 inches apart, and three longitudinal #8 bars that were spaced eight inches apart. With the rebar-grid in place, the connection was grouted using a non-shrink grout.
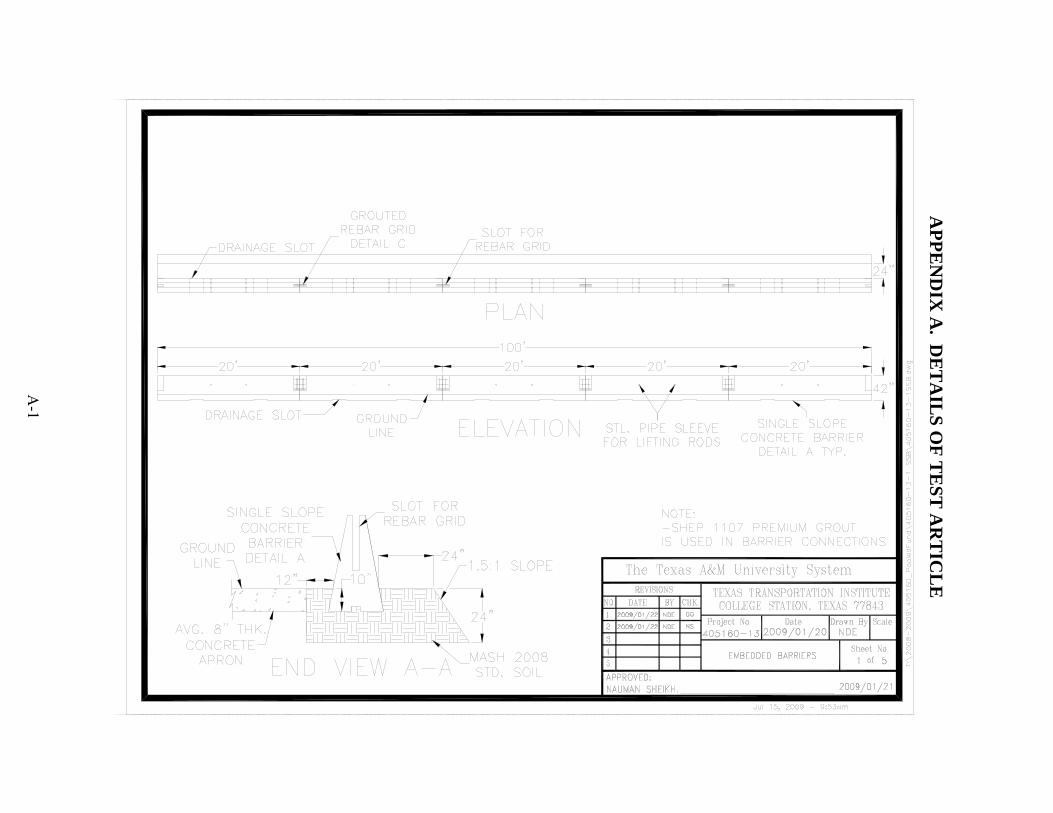
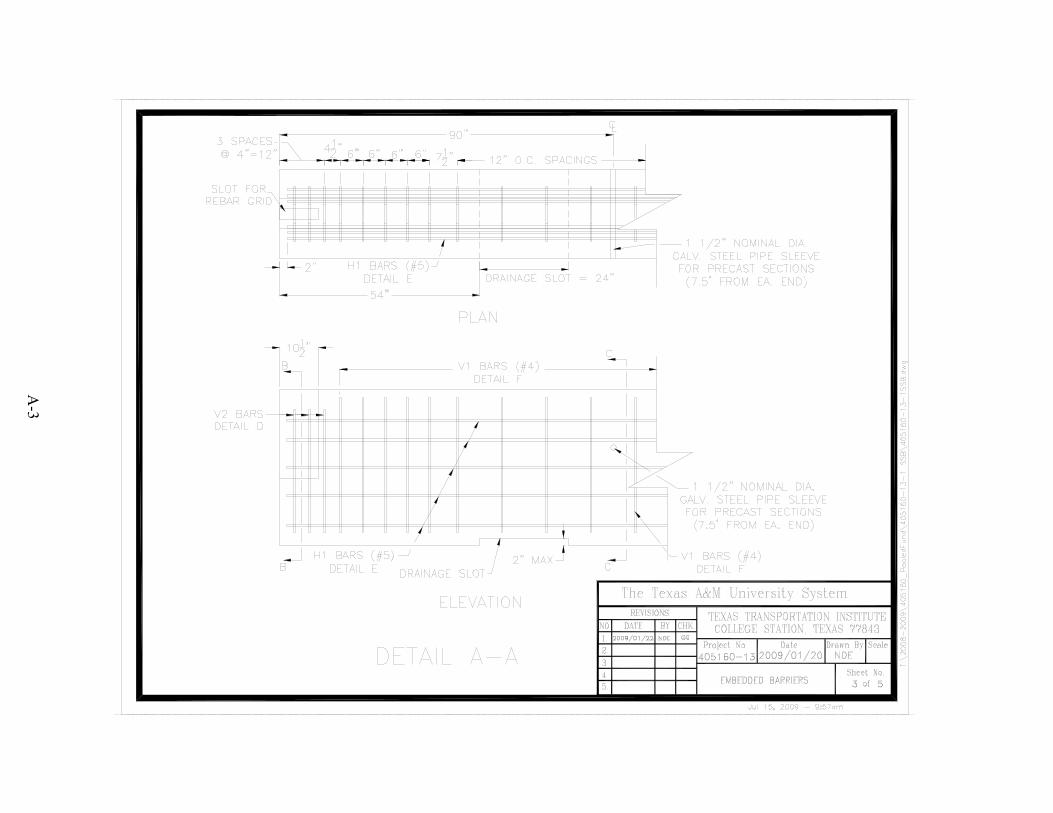
Details of the test article are shown in figures 3.1 and 3.2, and Appendix A.
3.2 MATERIAL SPECIFICATIONS
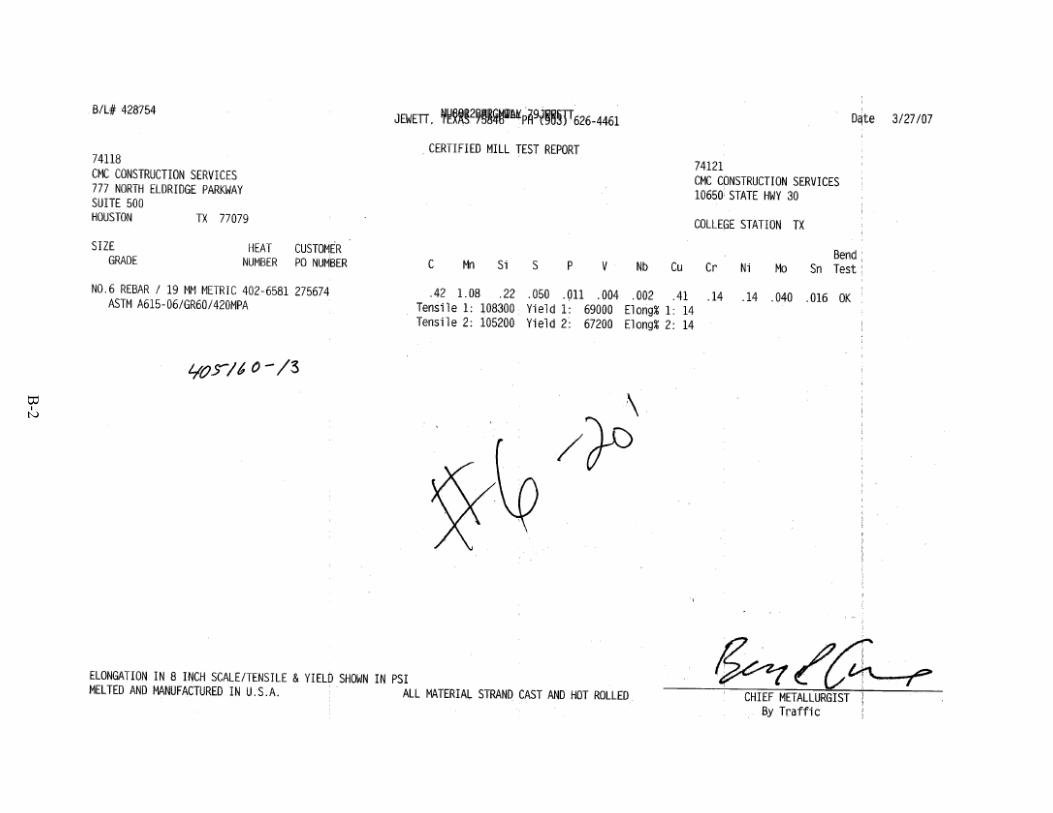
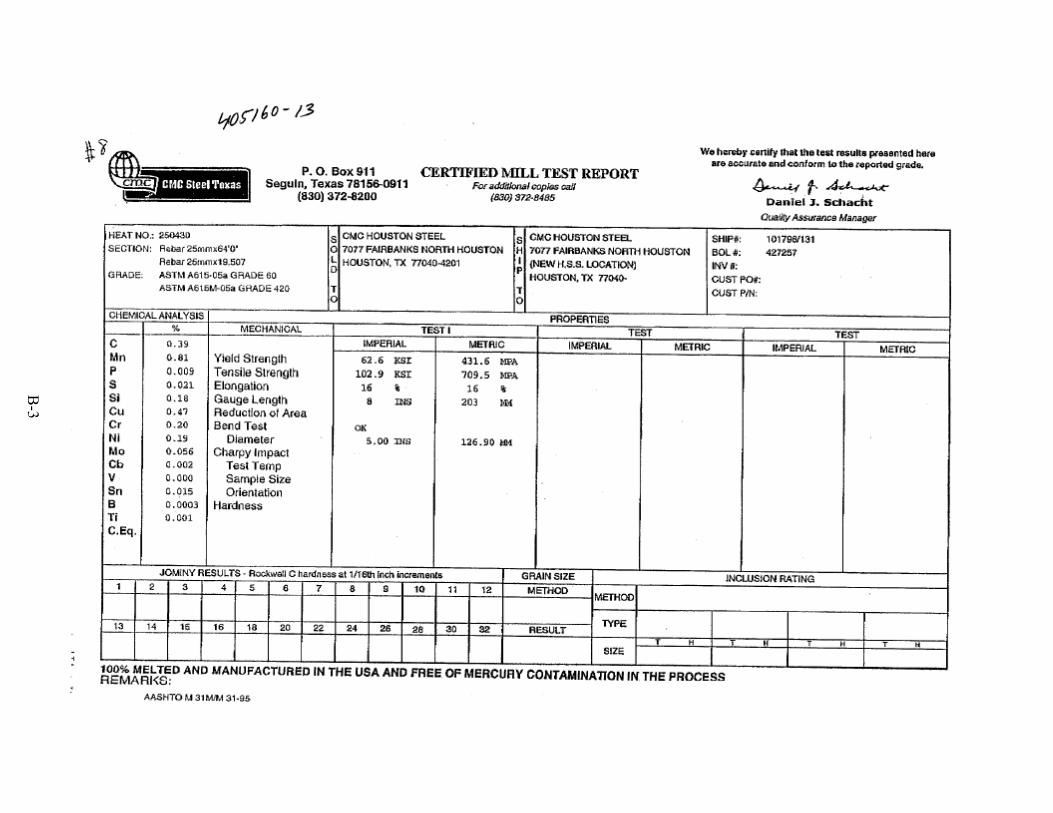
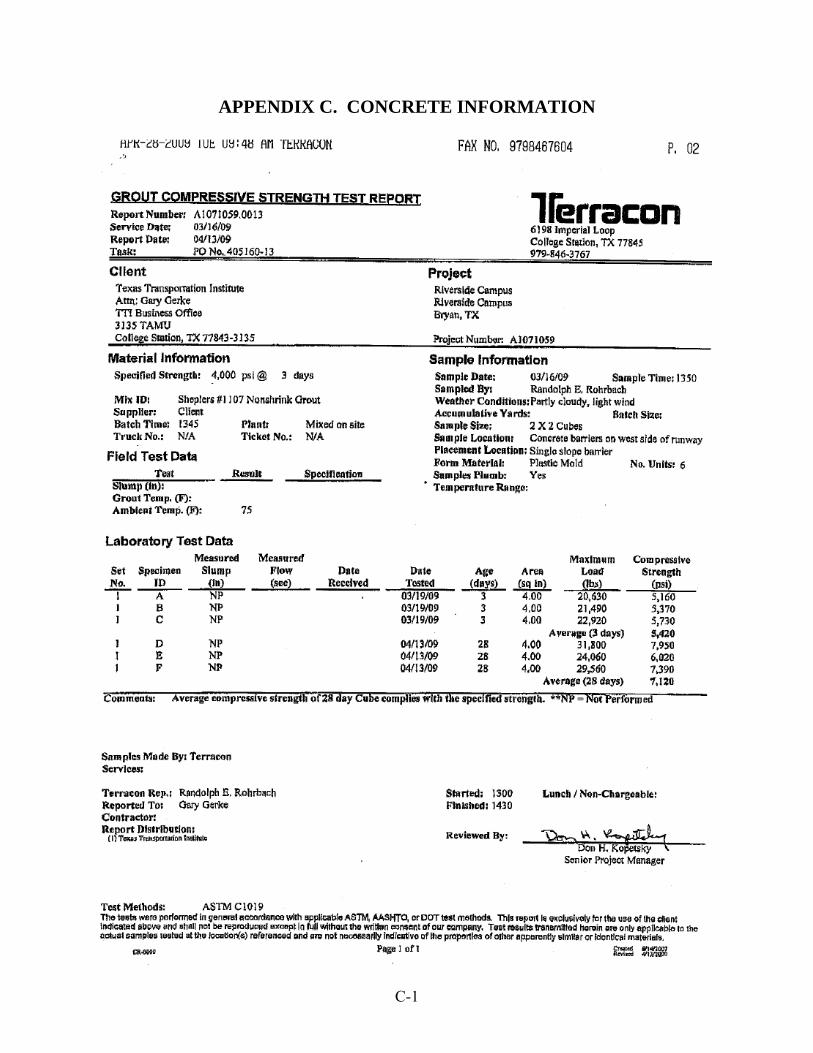
The barrier concrete was specified to have a minimum 28-day compressive strength of 4000 psi. The reinforcing steel was specified to be grade 60. The steel material used for manufacturing the rebar-grid was also specified to be grade 60 (see appendix B for MIL certificates). The grout used for making the connection was Shelper #1107 non-shrink grout which had a minimum compressive strength of 4000 psi (see appendix C for compressive strength test results). The soil used for embedding the barriers was a crushed limestone road base material that conforms to standard MASH soil. The moisture content of the soil on the day of the test was 8.5%.
16
Figure 3.1. Layout of the single-slope barrier in front of 1.5:1 slope.
17
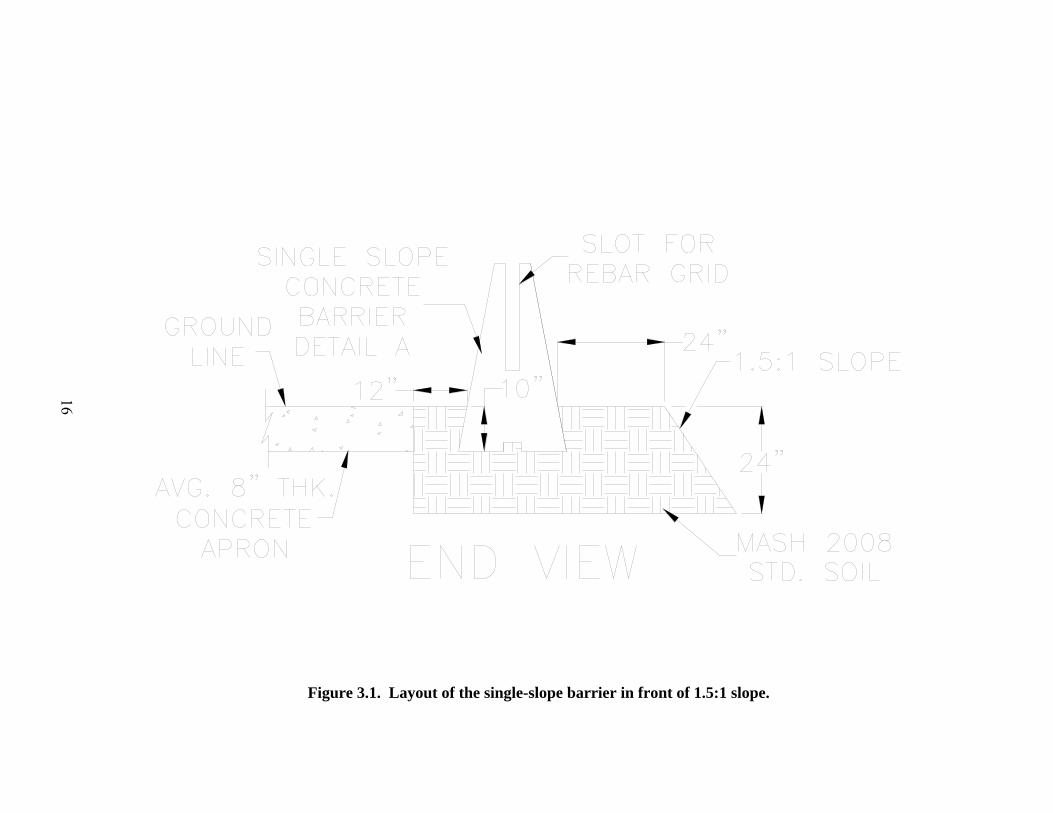
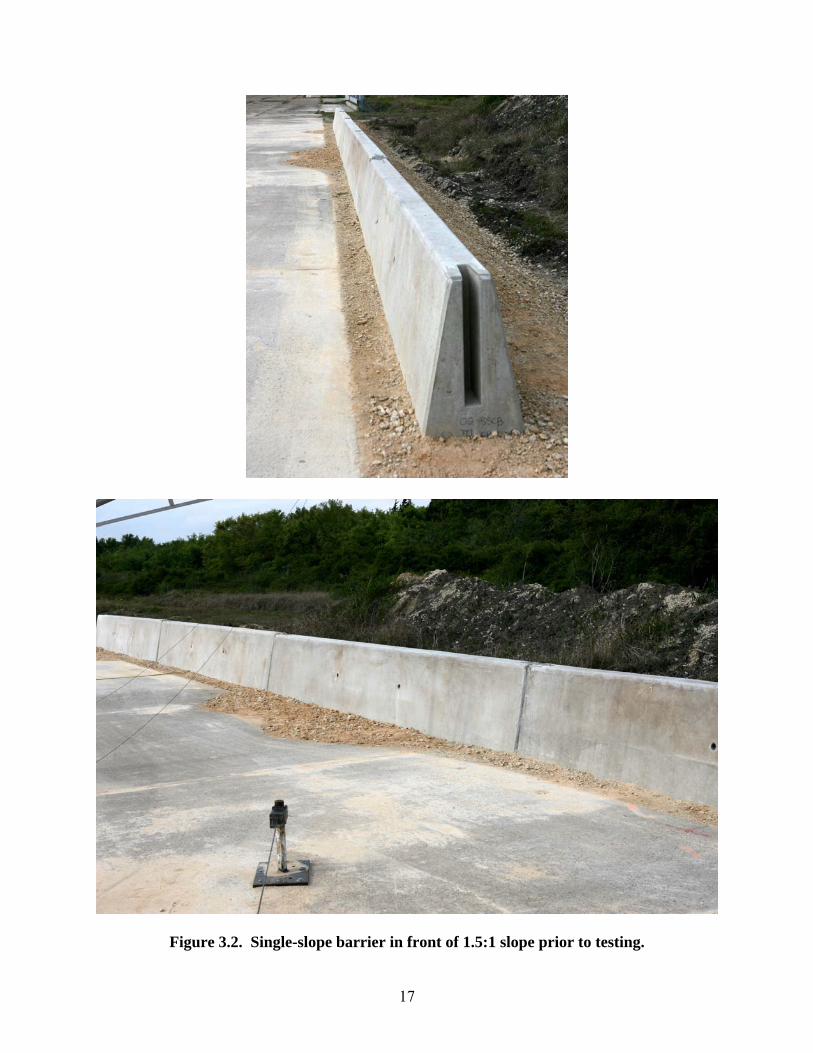
Figure 3.2. Single-slope barrier in front of 1.5:1 slope prior to testing.

19
4. TEST REQUIREMENTS AND EVALUATION CRITERIA 4.1 CRASH TEST MATRIX According to MASH, two tests are recommended to evaluate longitudinal barriers to test level three (TL-3) as described below.
MASH Test Designation 3-10: A 2425 lb vehicle impacting the critical impact point (CIP) of the length of need section at a speed of 62 mi/h and an angle of 25 degrees. MASH Test Designation 3-11: A 5000 lb pickup truck impacting the CIP of the length of need section at a speed of 62 mi/h and an angle of 25 degrees.
The researchers performed test 3-11 of MASH (5000 lb vehicle, 62 mi/h, 25 degrees) on the embedded single-slope barrier system. It is argued that this is the critical test for this design and the test with smaller 2425 lb vehicle is not needed. Due to higher impact energy, the test with the 5000 lb pickup truck will result in greater impact load on the connections and greater lateral deflection. An impact resulting from the lighter 2425 lb passenger car under same impact speed and angle will not result in any increase in lateral deflection of the barrier nor will it impart a higher force on the barrier to evaluate connection strength and barrier rotation. Due to the small deflection expected in the test, the small car impact with the embedded single-slope barrier is expected to be similar to an impact into a rigid single-slope barrier. Thus, the test was conducted with the 5000 lb pickup only. The crash test and data analysis procedures were in accordance with guidelines presented in MASH. Chapter 5 presents brief descriptions of these procedures. 4.2 EVALUATION CRITERIA The crash test was evaluated in accordance with the criteria presented in MASH. The performance of the barrier is judged on the basis of three factors: structural adequacy, occupant risk, and post impact vehicle trajectory. Structural adequacy is judged upon the barrier’s ability to contain and redirect the vehicle, or bring the vehicle to a controlled stop in a predictable manner. Occupant risk criteria evaluate the potential risk of hazard to occupants in the impacting vehicle, and to some extent other traffic, pedestrians, or workers in construction zones, if applicable. Post impact vehicle trajectory is assessed to determine potential for secondary impact with other vehicles or fixed objects, creating further risk of injury to occupants of the impacting vehicle and/or risk of injury to occupants in other vehicles. The appropriate safety evaluation criteria from table 5.1 of MASH were used to evaluate the crash test reported herein, and are listed in further detail under the assessment of the crash test.

21
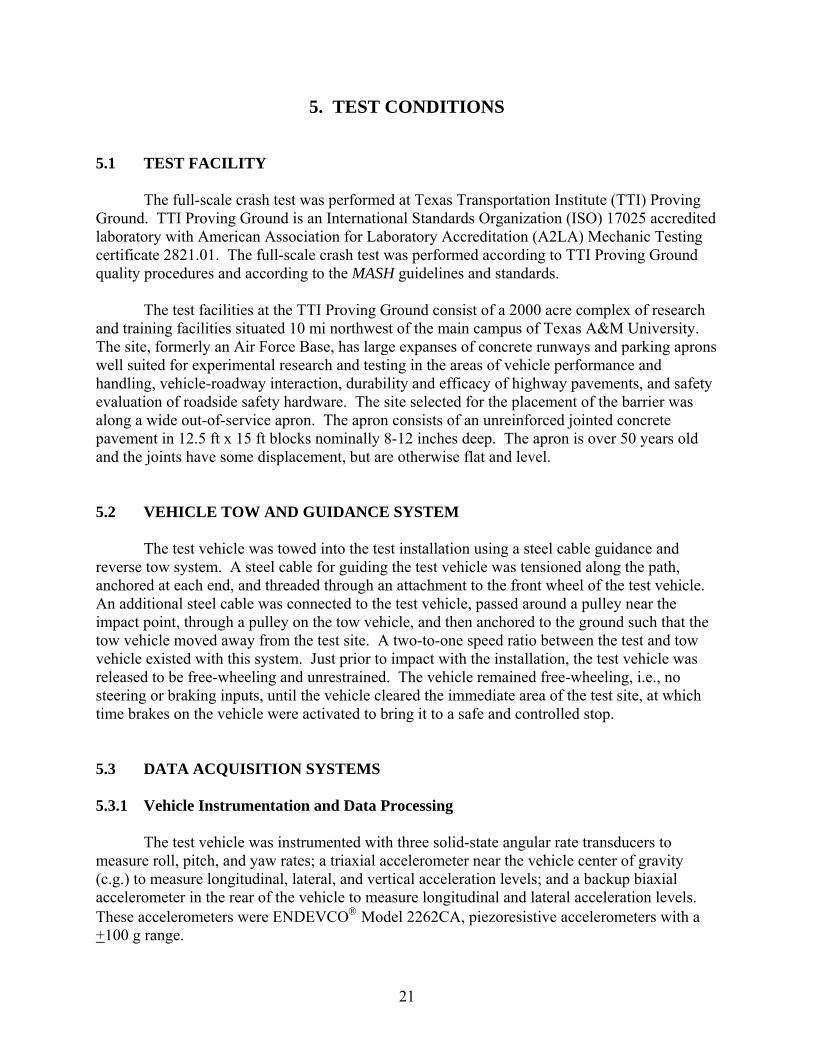
5. TEST CONDITIONS 5.1 TEST FACILITY The full-scale crash test was performed at Texas Transportation Institute (TTI) Proving Ground. TTI Proving Ground is an International Standards Organization (ISO) 17025 accredited laboratory with American Association for Laboratory Accreditation (A2LA) Mechanic Testing certificate 2821.01. The full-scale crash test was performed according to TTI Proving Ground quality procedures and according to the MASH guidelines and standards.
The test facilities at the TTI Proving Ground consist of a 2000 acre complex of research and training facilities situated 10 mi northwest of the main campus of Texas A&M University. The site, formerly an Air Force Base, has large expanses of concrete runways and parking aprons well suited for experimental research and testing in the areas of vehicle performance and handling, vehicle-roadway interaction, durability and efficacy of highway pavements, and safety evaluation of roadside safety hardware. The site selected for the placement of the barrier was along a wide out-of-service apron. The apron consists of an unreinforced jointed concrete pavement in 12.5 ft x 15 ft blocks nominally 8-12 inches deep. The apron is over 50 years old and the joints have some displacement, but are otherwise flat and level. 5.2 VEHICLE TOW AND GUIDANCE SYSTEM The test vehicle was towed into the test installation using a steel cable guidance and reverse tow system. A steel cable for guiding the test vehicle was tensioned along the path, anchored at each end, and threaded through an attachment to the front wheel of the test vehicle. An additional steel cable was connected to the test vehicle, passed around a pulley near the impact point, through a pulley on the tow vehicle, and then anchored to the ground such that the tow vehicle moved away from the test site. A two-to-one speed ratio between the test and tow vehicle existed with this system. Just prior to impact with the installation, the test vehicle was released to be free-wheeling and unrestrained. The vehicle remained free-wheeling, i.e., no steering or braking inputs, until the vehicle cleared the immediate area of the test site, at which time brakes on the vehicle were activated to bring it to a safe and controlled stop. 5.3 DATA ACQUISITION SYSTEMS 5.3.1 Vehicle Instrumentation and Data Processing The test vehicle was instrumented with three solid-state angular rate transducers to measure roll, pitch, and yaw rates; a triaxial accelerometer near the vehicle center of gravity (c.g.) to measure longitudinal, lateral, and vertical acceleration levels; and a backup biaxial accelerometer in the rear of the vehicle to measure longitudinal and lateral acceleration levels. These accelerometers were ENDEVCO® Model 2262CA, piezoresistive accelerometers with a +100 g range.

22
The accelerometers are strain gage type with a linear millivolt output proportional to acceleration. Angular rate transducers are solid state, gas flow units designed for high-“G” service. Signal conditioners and amplifiers in the test vehicle increase the low-level signals to a +2.5 volt maximum level. The signal conditioners also provide the capability of an R-cal (resistive calibration) or shunt calibration for the accelerometers and a precision voltage calibration for the rate transducers. The electronic signals from the accelerometers and rate transducers are transmitted to a base station by means of a 15-channel, constant-bandwidth, Inter-Range Instrumentation Group (IRIG), FM/FM telemetry link for recording and for display. Calibration signals from the test vehicle are recorded before the test and immediately afterwards. A crystal-controlled time reference signal is simultaneously recorded with the data. Wooden dowels actuate pressure-sensitive switches on the bumper of the impacting vehicle prior to impact to indicate the elapsed time over a known distance to provide a measurement of impact velocity. The initial contact also produces an “event” mark on the data record to establish the instant of contact with the installation. The multiplex of data channels, transmitted on one radio frequency, is received and demultiplexed onto TEAC® instrumentation data recorder. After the test, the data are played back from the TEAC® recorder and digitized. A proprietary software program (WinDigit) converts the analog data from each transducer into engineering units using the R-cal and pre-zero values at 10,000 samples per second, per channel. WinDigit also provides Society of Automotive Engineers (SAE) J211 class 180 phaseless digital filtering and vehicle impact velocity. All accelerometers are calibrated annually according to the (SAE) J211 4.6.1 by means of an ENDEVCO® 2901, precision primary vibration standard. This device and its support instruments are returned to the factory annually for a National Institute of Standards Technology (NIST) traceable calibration. The subsystems of each data channel are also evaluated annually, using instruments with current NIST traceability, and the results are factored into the accuracy of the total data channel, per SAE J211. Calibrations and evaluations are made any time data are suspect. The Test Risk Assessment Program (TRAP) uses the data from WinDigit to compute occupant/compartment impact velocities, time of occupant/compartment impact after vehicle impact, and the highest 10-milliseconds (ms) average ridedown acceleration. WinDigit calculates change in vehicle velocity at the end of a given impulse period. In addition, maximum average accelerations over 50-ms intervals in each of the three directions are computed. For reporting purposes, the data from the vehicle-mounted accelerometers are filtered with a 60-Hz digital filter, and acceleration versus time curves for the longitudinal, lateral, and vertical directions are plotted using TRAP.
TRAP uses the data from the yaw, pitch, and roll rate transducers to compute angular displacement in degrees at 0.0001-s intervals and then plots yaw, pitch, and roll versus time. These displacements are in reference to the vehicle-fixed coordinate system with the initial position and orientation of the vehicle-fixed coordinate systems being initial impact.
23
5.3.2 Anthropomorphic Dummy Instrumentation Use of a dummy in the 2270P vehicle is optional according to MASH, and there was no dummy used in the test with the 2270P vehicle. 5.3.3 Photographic Instrumentation and Data Processing Photographic coverage of the test included three high-speed cameras: one overhead with a field of view perpendicular to the ground and directly over the impact point; one placed behind the installation at an angle; and a third placed to have a field of view parallel to and aligned with the installation at the downstream end. A flashbulb activated by pressure-sensitive tape switches was positioned on the impacting vehicle to indicate the instant of contact with the installation and was visible from each camera. The films from these high-speed cameras were analyzed on a computer-linked motion analyzer to observe phenomena occurring during the collision and to obtain time-event, displacement, and angular data. A mini-DV camera and still cameras recorded and documented conditions of the test vehicle and installation before and after the test.


25
6. CRASH TEST 405160-13-1 (MASH TEST NO. 3-11) 6.1 TEST DESIGNATION AND ACTUAL IMPACT CONDITIONS
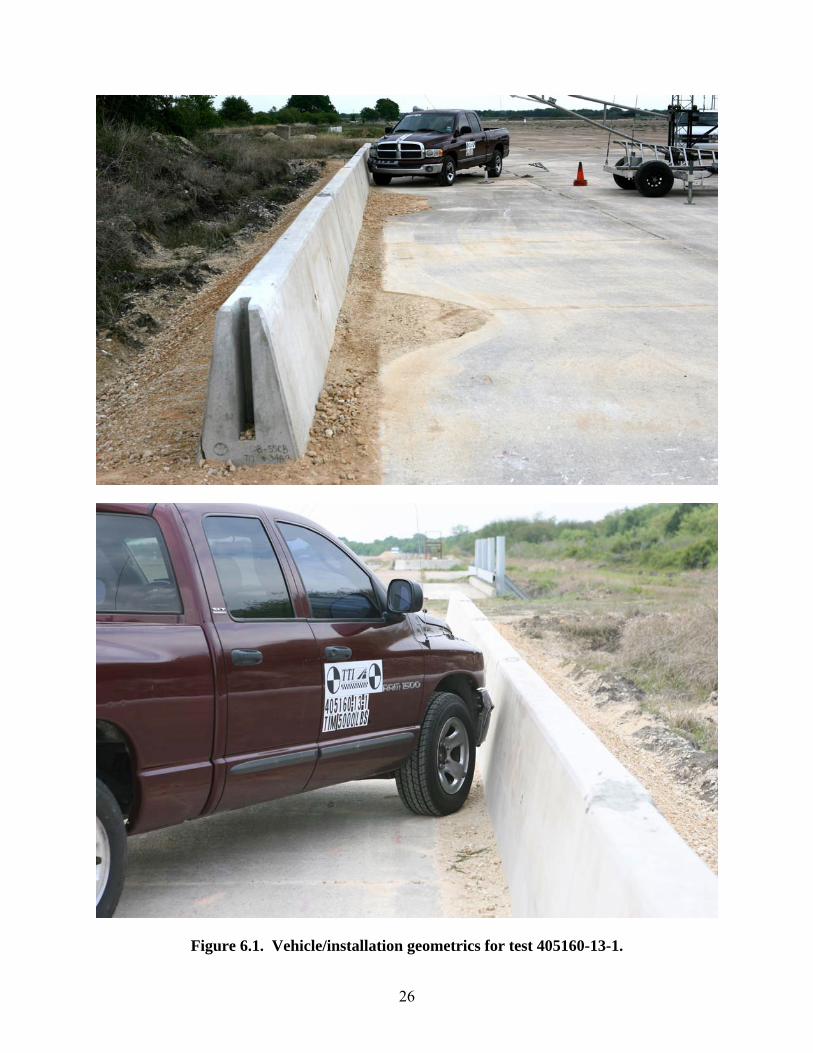
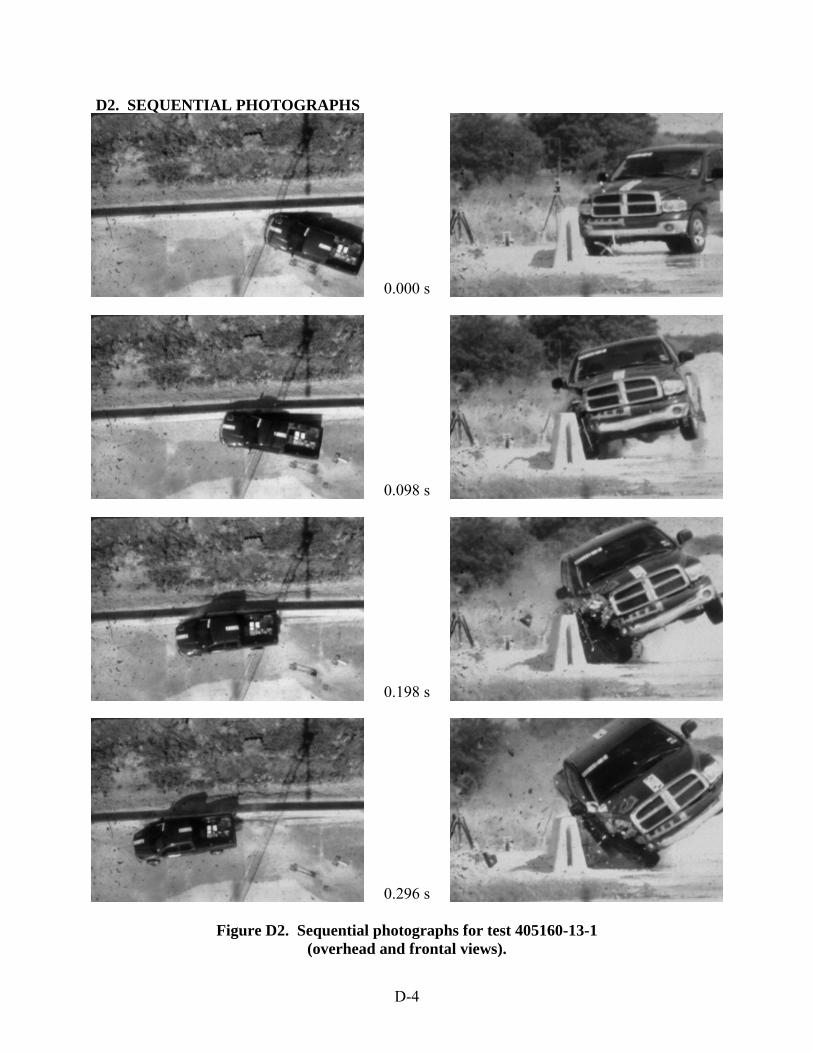
MASH test 3-11 involves a 2270P vehicle weighing 5000 lb ±100 lb and impacting the barrier at an impact speed of 62.2 mi/h ±2.5 mi/h and an angle of 25 degrees ±1.5 degrees. The target impact point was 4 ft upstream of the centerline of the joint located between segments 2 and 3. The 2002 Dodge pickup used in the test weighed 4953 lb and the actual impact speed and angle were 63.1 mi/h and 24.2 degrees, respectively. The actual impact point was 62.0 inches upstream of the joint between segments 2 and 3. 6.2 TEST VEHICLE A 2002 Dodge Ram 1500 quad-cab pickup, shown in figures 6.1 and 6.2, was used for the crash test. Test inertia weight of the vehicle was 4953 lb. The height to the lower edge of the vehicle’s front bumper was 13.5 inches, and the height to the upper edge of the front bumper was 26.0 inches. The height to the center of gravity was 28.12 inches. Additional dimensions and information on the vehicle are given in appendix D, figure D1. The vehicle was directed into the installation using the cable reverse tow and guidance system, and was released to be free-wheeling and unrestrained just prior to impact. 6.3 WEATHER CONDITIONS The crash test was performed the morning of April 16, 2009. Weather conditions at the time of testing were: Wind speed: 7 mi/h; wind direction: 90 degrees with respect to the vehicle (vehicle was traveling in a southwesterly direction); temperature: 70 ºF; relative humidity: 71 percent. 6.4 TEST DESCRIPTION The 2270P vehicle, traveling at an impact speed of 63.1 mi/h, impacted the single-slope barrier 62 inches upstream of the joint between segments 2 and 3, at an impact angle of 24.2 degrees. At approximately 0.042 s, the right front tire began to climb the face of the barrier and the vehicle began to redirect. At 0.169 s, the vehicle was parallel to the barrier and was traveling at a speed of 58.7 mi/h. At 0.173 s, the right rear of the vehicle contacted the barrier, and at 0.176 s, the vehicle began to roll clockwise. The right rear corner of the bed of the vehicle contacted the top of the barrier at 0.616 s, and after that, dust obscured the view in all camera views. Brakes on the vehicle were applied 1.5 s after impact, and the vehicle came to rest 247 ft downstream of impact and 10 ft toward traffic lanes. Sequential photographs of the test period are shown in appendix D, figures D2 and D3.
26
Figure 6.1. Vehicle/installation geometrics for test 405160-13-1.

27
Figure 6.2. Vehicle before test 405160-13-1.
28
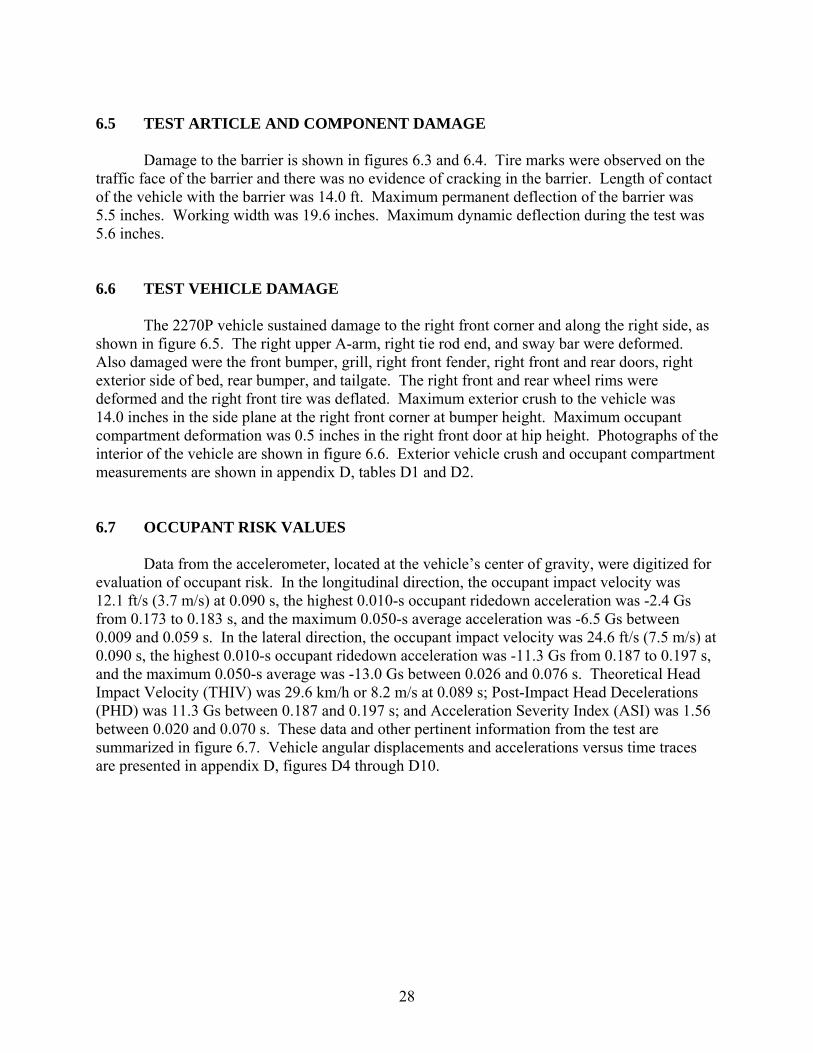
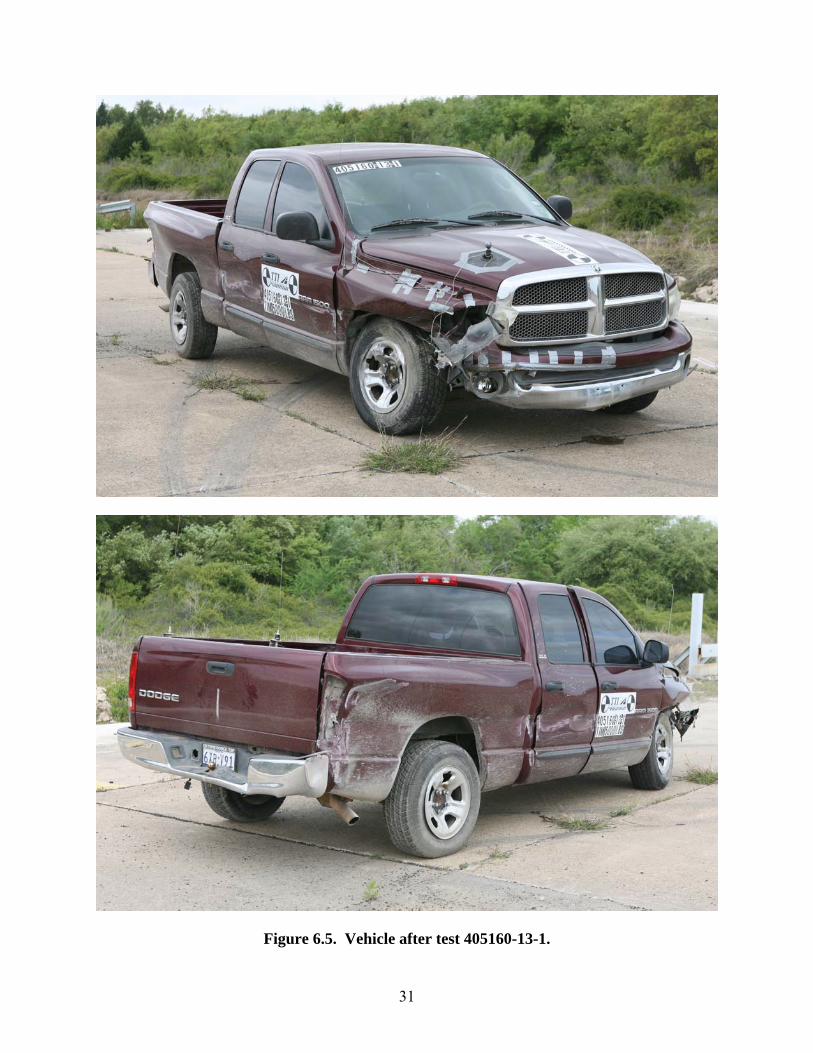
6.5 TEST ARTICLE AND COMPONENT DAMAGE Damage to the barrier is shown in figures 6.3 and 6.4. Tire marks were observed on the traffic face of the barrier and there was no evidence of cracking in the barrier. Length of contact of the vehicle with the barrier was 14.0 ft. Maximum permanent deflection of the barrier was 5.5 inches. Working width was 19.6 inches. Maximum dynamic deflection during the test was 5.6 inches. 6.6 TEST VEHICLE DAMAGE The 2270P vehicle sustained damage to the right front corner and along the right side, as shown in figure 6.5. The right upper A-arm, right tie rod end, and sway bar were deformed. Also damaged were the front bumper, grill, right front fender, right front and rear doors, right exterior side of bed, rear bumper, and tailgate. The right front and rear wheel rims were deformed and the right front tire was deflated. Maximum exterior crush to the vehicle was 14.0 inches in the side plane at the right front corner at bumper height. Maximum occupant compartment deformation was 0.5 inches in the right front door at hip height. Photographs of the interior of the vehicle are shown in figure 6.6. Exterior vehicle crush and occupant compartment measurements are shown in appendix D, tables D1 and D2. 6.7 OCCUPANT RISK VALUES Data from the accelerometer, located at the vehicle’s center of gravity, were digitized for evaluation of occupant risk. In the longitudinal direction, the occupant impact velocity was 12.1 ft/s (3.7 m/s) at 0.090 s, the highest 0.010-s occupant ridedown acceleration was -2.4 Gs from 0.173 to 0.183 s, and the maximum 0.050-s average acceleration was -6.5 Gs between 0.009 and 0.059 s. In the lateral direction, the occupant impact velocity was 24.6 ft/s (7.5 m/s) at 0.090 s, the highest 0.010-s occupant ridedown acceleration was -11.3 Gs from 0.187 to 0.197 s, and the maximum 0.050-s average was -13.0 Gs between 0.026 and 0.076 s. Theoretical Head Impact Velocity (THIV) was 29.6 km/h or 8.2 m/s at 0.089 s; Post-Impact Head Decelerations (PHD) was 11.3 Gs between 0.187 and 0.197 s; and Acceleration Severity Index (ASI) was 1.56 between 0.020 and 0.070 s. These data and other pertinent information from the test are summarized in figure 6.7. Vehicle angular displacements and accelerations versus time traces are presented in appendix D, figures D4 through D10.

29
Figure 6.3. Vehicle trajectory path after test 405160-13-1.

30
Figure 6.4. Installation after test 405160-13-1.
31
Figure 6.5. Vehicle after test 405160-13-1.

32
Before Test After Test
Figure 6.6. Interior of vehicle for test 405160-13-1.

33
0.000 s 0.098 s 0.296 s 0.393 s
General Information Test Agency ............................. Test No. .................................. Date ......................................... Test Article Type ......................................... Name ....................................... Installation Length ................... Material or Key Elements ........ Soil Type and Condition ........... Test Vehicle Type/Designation ..................... Make and Model ...................... Curb ......................................... Test Inertial .............................. Dummy .................................... Gross Static .............................
Texas Transportation Institute 405160-13-1 April 16, 2009 Concrete Barrier Single-Slope Barrier offset 2 ft from 1.5:1 Slope 100 ft 42-inch tall x 20 ft long single-slope concrete barrier embedded 10 inches in soil in front of 1.5H:1V slope Standard Soil, Dry 2270P 2002 Dodge Ram 1500 Pickup 4630 lb 4953 lb No Dummy 4953 lb
Impact Conditions Speed .................................... Angle ..................................... Location/Orientation .............. Exit Conditions Speed .................................... Angle .....................................Occupant Risk Values Impact Velocity Longitudinal ........................ Lateral ................................ Ridedown Accelerations Longitudinal ........................ Lateral ................................ THIV ...................................... PHD .......................................Max. 0.050-s Average Longitudinal ........................ Lateral ................................ Vertical ...............................
63.1 mi/h 24.2 degrees 62 inch upstrm Joint 2-3 Out of view Out of view 12.1 ft/s 24.6 ft/s -2.4 G -11.3 G 29.6 km/h 11.3 G -6.5 G -13.0 G -4.2 G
Post-Impact Trajectory Stopping Distance ......................... Vehicle Stability Maximum Yaw Angle ..................... Maximum Pitch Angle .................... Maximum Roll Angle ...................... Vehicle Snagging ........................... Vehicle Pocketing .......................... Test Article Deflections Dynamic ......................................... Permanent ..................................... Working Width ............................... Vehicle Damage VDS ............................................... CDC ............................................... Max. Exterior Deformation ............. Max. Occupant Compartment Deformation .............................
247 ft dwnstrm 10 ft fwd -42 degrees -11 degrees 44 degrees No No 5.6 inches 5.5 inches 19.6 inches 01RFQ5 01RFEW4 14.0 inches 0.56 inch
Figure 6.7. Summary of results for MASH test 3-11 on the single-slope barrier on 1.5:1 slope.

34
6.8 ASSESSMENT OF TEST RESULTS An assessment of the test was made based on the following applicable MASH safety evaluation criteria. 6.8.1 Structural Adequacy
A. Test article should contain and redirect the vehicle or bring the vehicle to a controlled stop; the vehicle should not penetrate, underride, or override the installation, although controlled lateral deflection of the test article is acceptable.
Results: The single-slope barrier in front of 1.5H:1V slope contained and redirected the
2270P vehicle. The vehicle did not penetrate, underride, or override the installation. Maximum dynamic deflection during the test was 5.6 inches. (PASS)
6.8.2 Occupant Risk
D. Detached elements, fragments, or other debris from the test article should not penetrate or show potential for penetrating the occupant compartment, or present an undue hazard to other traffic, pedestrians, or personnel in a work zone. Deformation of, or intrusions into, the occupant compartment should not exceed limits set forth in Section 5.3 and Appendix E of MASH.
Results: No detached elements, fragments, or other debris were present to penetrate or
show potential to penetrate the occupant compartment, or to present undue hazard to others in the area. (PASS)
Maximum occupant compartment deformation was 5.5 inches. (PASS) F. The vehicle should remain upright during and after collision. The maximum roll
and pitch angles are not to exceed 75 degrees. Results: The 2270P vehicle remained upright during and after the collision event.
Maximum roll was 44 degrees. (PASS) H. Occupant impact velocities should satisfy the following:
Longitudinal and Lateral Occupant Impact Velocity Preferred Maximum 9.0 m/s (30 ft/s) 12.2 m/s (40 ft/s) Results: Longitudinal occupant impact velocity was 12.1 ft/s, and lateral occupant
impact velocity was 24.6 ft/s. (PASS) I. Occupant ridedown accelerations should satisfy the following:
Longitudinal and Lateral Occupant Ridedown Accelerations Preferred Maximum 15.0 Gs 20.49 Gs

35
Results: Longitudinal ridedown acceleration was -2.4 G, and lateral ridedown acceleration was -11.3 G. (PASS)
6.8.3 Vehicle Trajectory
For redirective devices, the vehicle shall exit the barrier within the exit box. Result: The vehicle exited within the exit box. (PASS)


37
7. SUMMARY AND CONCLUSIONS 7.1 SUMMARY To restrict the lateral deflection of a single slope barrier when placed adjacent to 1.5H:1V slope or on top of an MSE wall, a 100-ft installation of the barrier was embedded 10 inches in soil. The effective height of the single slope barrier was thus reduced to 32 inches due to the 10 inch embedment. The barrier was placed at a 2-ft lateral offset from the 1.5H:1V slope break point of the soil embankment. The concrete barrier was comprised of five 20-ft long barrier segments that were connected using the grouted rebar-grid connection. The embedded barrier was crash tested using MASH test level 3 criteria. The embedded single-slope barrier successfully contained and redirected the 2270P vehicle. The vehicle did not penetrate, underride, or override the installation. Maximum dynamic and static deflections of the barrier during the test were 5.6 inches and 5.5 inches, respectively. No detached elements, fragments, or other debris were present to penetrate or show potential to penetrate the occupant compartment, or to present undue hazard to others in the area. Maximum occupant compartment deformation was 5.5 inches. The 2270P vehicle remained upright during and after the collision event. Maximum roll was 44 degrees. Occupant risk factors were within the limits specified in MASH. The vehicle remained within the exit box. 7.2 CONCLUSIONS
The objective of the this research was to restrict lateral deflection of the barrier when placed adjacent to steep slopes such as 1.5H:1V or on top of MSE walls, without using a concrete moment slab.
The final design was required to incorporate 20-ft long single slope barrier segments with grouted rebar grid connection. Since the performance of the grouted rebar-grid connection in a free-standing single slope barrier was not known under MASH evaluation criteria, the researchers evaluated its performance using a smaller scale bogie impact test and simulation analysis. It was determined that the grouted rebar grid connection did not provide enough strength to restrict lateral deflections to acceptable levels for this application. Results of the simulation analysis showed that large lateral deflection was expected with the grouted rebar-grid connection when used with the single slope barrier in a free-standing mode.
The researchers then evaluated restricting the deflection of the barrier by embedding it 10 inches in soil. The barrier was placed in front of a 1.5H:1V slope. The offset of the barrier from the slope break point of the soil embankment was restricted to two feet. Another phase of bogie testing and simulation analysis was performed to evaluate the performance of the grouted rebar grid connection in the embedded barrier configuration. Results of the simulation analysis showed that the embedded barrier system will result in acceptably reduced lateral deflections.

38
The researchers performed simulations of the 100-ft long installation of the embedded barrier with soil present in front and behind the barrier, and with soil present only behind the barrier. Both configurations resulted in a successful redirection of the vehicle. It was determined that there were no significant differences in the lateral barrier deflection resulting from these two configurations. However, simulation results indicated that due the reduced effective height of the barrier when soil layer is present in front of the barrier, the vehicle exhibited slightly higher climb and roll. Thus the researchers recommended performing the crash test in the configuration where soil is present in front and behind the barrier. A full-scale crash test was subsequently performed to validate the design. The embedded single-slope barrier in front of 1.5H:1V slope performed acceptably according to the requirements of MASH, as shown in table 7.1. The permanent lateral deflection of the barrier was 5.5 inches. Based on the successful test of the embedded barrier with soil present in front and behind the barrier, the configuration with soil present only behind the barrier is also considered acceptable provided proper placement and compaction of the soil behind the barrier is achieved. While the embedded barrier design was tested in front of a 1.5H:1V slope, due to the small lateral barrier deflection, it is also considered suitable for use on top of an MSE wall.

39
Table 7.1. Performance evaluation summary for MASH test 3-11 on the single-slope barrier on slope. Test Agency: Texas Transportation Institute Test No.: 405160-13-1 Test Date: 2009-04-16
MASH Evaluation Criteria Test Results Assessment Structural Adequacy A. Test article should contain and redirect the vehicle or bring
the vehicle to a controlled stop; the vehicle should not penetrate, underride, or override the installation although controlled lateral deflection of the test article is acceptable
The single-slope barrier in front of 1.5H:1V slope contained and redirected the 2270P vehicle. The vehicle did not penetrate, underride, or override the installation. Maximum dynamic deflection during the test was 5.6 inches.
Pass
Occupant Risk D. Detached elements, fragments, or other debris from the test
article should not penetrate or show potential for penetrating the occupant compartment, or present an undue hazard to other traffic, pedestrians, or personnel in a work zone.
No detached elements, fragments, or other debris were present to penetrate or show potential to penetrate the occupant compartment, or to present undue hazard to others in the area.
Pass
Deformations of, or intrusions into, the occupant compartment should not exceed limits set forth in Section 5.3 and Appendix E of MASH.
Maximum occupant compartment deformation was 5.5 inches. Pass
F. The vehicle should remain upright during and after collision. The maximum roll and pitch angles are not to exceed 75 degrees.
The 2270P vehicle remained upright during and after the collision event. Maximum roll was 44 degrees. Pass
H. Longitudinal and lateral occupant impact velocities should fall below the preferred value of 9.1 m/s (30 ft/s), or at least below the maximum allowable value of 12.2 m/s (40 ft/s).
Longitudinal occupant impact velocity was 12.1 ft/s, and lateral occupant impact velocity was 24.6 ft/s. Pass
I. Longitudinal and lateral occupant ridedown accelerations should fall below the preferred value of 15.0 Gs, or at least below the maximum allowable value of 20.49 Gs.
Longitudinal ridedown acceleration was -2.4 G, and lateral ridedown acceleration was -11.3 G. Pass
Vehicle Trajectory For redirective devices, the vehicle shall exit the barrier
within the exit box. The vehicle remained within the exit box. Pass
*Criterion K and M are preferable, not required.


41
REFERENCES 1. W.L. Beason, H.E. Ross, Jr., H.S. Perera, W.L. Campise, and D.L. Bullard, Jr. “Development
of a Single-slope Concrete Median Barrier.” Texas Transportation Institute, The Texas A&M University System, College Station, Texas, 1989.
2. J.D. Michie. Recommended Procedures for the Safety Performance Evaluation of Highway
Appurtenances. National Cooperative Highway Research Program Report 230, Transportation Research Board, National Research Council, Washington, D.C., March 1981
3. Ross, Jr., H.E., Sicking, D.L., Zimmer, R.A. and Michie, J.D., “Recommended Procedures
for the Safety Performance Evaluation of Highway Features,” National Cooperative Highway Research Program Report 350, Transportation Research Board, National Research Council, Washington, D.C., 1993.
4. American Association of State Highway and Transportation Officials. Manual for Assessing
Safety Hardware. Ballot Draft, February 2008.

A-1
APPE
ND
IX A
. DE
TA
ILS O
F TE
ST A
RT
ICL
E

A-2
A-3

A-4
A-5


B-1
APPE
ND
IX B
. MA
TE
RIA
L C
ER
TIFIC
AT
ION
FOR
TE
ST A
RT
ICL
EAPPENDIX B. MATERIAL CERTIFICATION FOR TEST ARTICLE
B-2
B-3

C-1
APPENDIX C. CONCRETE INFORMATION

C-2
D-1
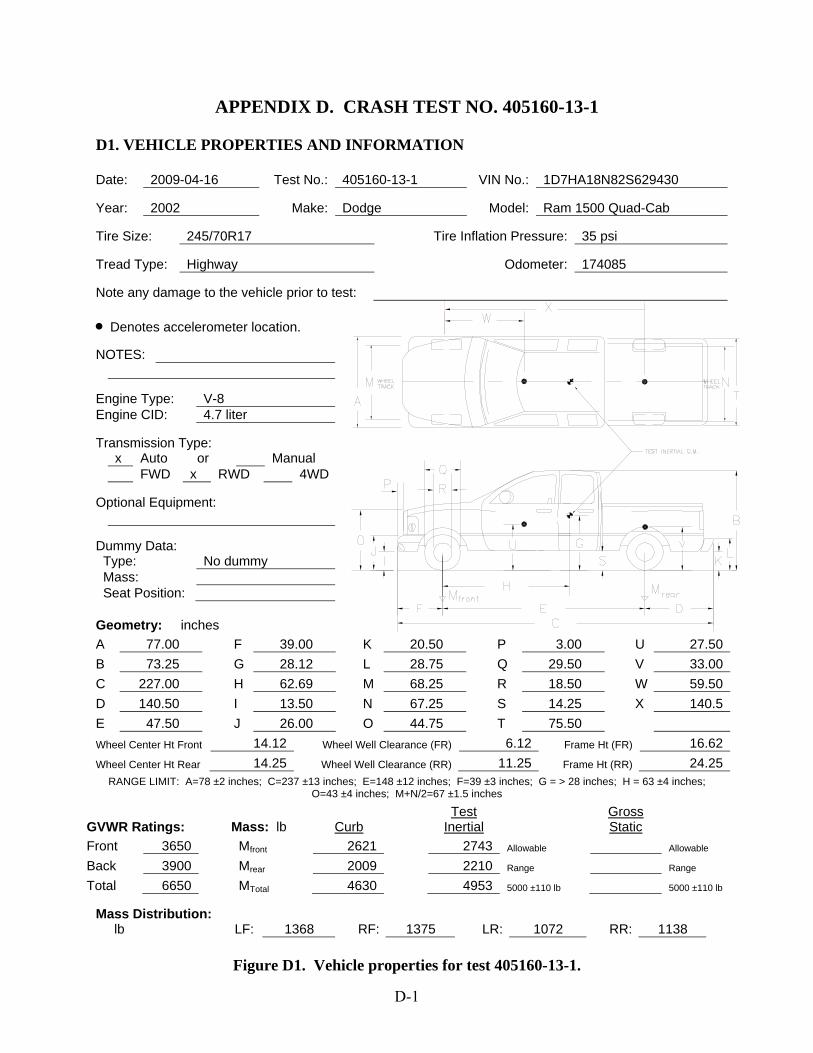
APPENDIX D. CRASH TEST NO. 405160-13-1 D1. VEHICLE PROPERTIES AND INFORMATION Date: 2009-04-16 Test No.: 405160-13-1 VIN No.: 1D7HA18N82S629430 Year: 2002 Make: Dodge Model: Ram 1500 Quad-Cab Tire Size: 245/70R17 Tire Inflation Pressure: 35 psi Tread Type: Highway Odometer: 174085 Note any damage to the vehicle prior to test:
Geometry: inches A 77.00 F 39.00 K 20.50 P 3.00 U 27.50B 73.25 G 28.12 L 28.75 Q 29.50 V 33.00C 227.00 H 62.69 M 68.25 R 18.50 W 59.50D 140.50 I 13.50 N 67.25 S 14.25 X 140.5E 47.50 J 26.00 O 44.75 T 75.50 Wheel Center Ht Front 14.12 Wheel Well Clearance (FR) 6.12 Frame Ht (FR) 16.62Wheel Center Ht Rear 14.25 Wheel Well Clearance (RR) 11.25 Frame Ht (RR) 24.25
RANGE LIMIT: A=78 ±2 inches; C=237 ±13 inches; E=148 ±12 inches; F=39 ±3 inches; G = > 28 inches; H = 63 ±4 inches; O=43 ±4 inches; M+N/2=67 ±1.5 inches
Mass Distribution: lb LF: 1368 RF: 1375 LR: 1072 RR: 1138
Figure D1. Vehicle properties for test 405160-13-1.
• Denotes accelerometer location. NOTES: Engine Type: V-8 Engine CID: 4.7 liter Transmission Type: x Auto or Manual FWD x RWD 4WD Optional Equipment: Dummy Data: Type: No dummy Mass: Seat Position:
GVWR Ratings: Mass: lb Curb Test
Inertial Gross Static
Front 3650 Mfront 2621 2743 Allowable Allowable
Back 3900 Mrear 2009 2210 Range Range
Total 6650 MTotal 4630 4953 5000 ±110 lb 5000 ±110 lb

D-2
Table D1. Exterior crush measurements for test 405160-13-1.
Date: 2009-04-16 Test No.: 405160-13-1 VIN No.: 1D7HA18N82S629430 Year: 2002 Make: Dodge Model: Ram 1500 Quad-Cab
VEHICLE CRUSH MEASUREMENT SHEET1 Complete When Applicable
End Damage Side Damage Undeformed end width ________
Corner shift: A1 ________
A2 ________
End shift at frame (CDC)
(check one)
< 4 inches ________
≥ 4 inches ________
Bowing: B1 _____ X1 _____
B2 _____ X2 _____
Bowing constant
221 XX + = ______
Note: Measure C1 to C6 from Driver to Passenger side in Front or Rear impacts – Rear to Front in Side Impacts.
Specific Impact Number
Plane* of C-Measurements
Direct Damage
Field L**
C1 C2 C3 C4 C5 C6 ±D Width** (CDC)
Max*** Crush
1 Front plane at bumper ht 15 10.5 30 0 0.5 1.5 3 5 10.5 +15
2 Side plane at bumper ht 15 14 54 0 1.5 --- --- 9.75 14 +76.5
Measurements recorded
in inches
1Table taken from National Accident Sampling System (NASS). *Identify the plane at which the C-measurements are taken (e.g., at bumper, above bumper, at sill, above sill, at beltline, etc.) or label adjustments (e.g., free space). Free space value is defined as the distance between the baseline and the original body contour taken at the individual C locations. This may include the following: bumper lead, bumper taper, side protrusion, side taper, etc. Record the value for each C-measurement and maximum crush. **Measure and document on the vehicle diagram the beginning or end of the direct damage width and field L (e.g., side damage with respect to undamaged axle). ***Measure and document on the vehicle diagram the location of the maximum crush. Note: Use as many lines/columns as necessary to describe each damage profile.
D-3
Table D2. Occupant compartment measurements for test 405160-13-1.
Date: 2009-04-16 Test No.: 405160-13-1 VIN No.: 1D7HA18N82S629430 Year: 2002 Make: Dodge Model: Ram 1500 Quad-Cab *Lateral area across the cab from driver’s side kickpanel to passenger’s side kickpanel.
OCCUPANT COMPARTMENT DEFORMATION MEASUREMENT Before After ( inches ) ( inches )
A1 64.50 64.50A2 64.62 64.62A3 65.25 65.25B1 45.56 45.56B2 39.50 39.50B3 45.56 45.56B4 49.19 49.19B5 45.56 45.56B6 49.18 49.18C1 29.75 29.75C2 ---- ----C3 27.56 27.56D1 12.69 12.69D2 2.50 2.50D3 11.69 11.69E1 64.44 64.25E2 64.31 64.25E3 64.00 63.50E4 64.00 63.88F 60.00 60.00G 60.00 60.00H 39.50 39.50I 39.5 39.5J* 23.62 23.62
D-4
D2. SEQUENTIAL PHOTOGRAPHS
0.000 s
0.098 s
0.198 s
0.296 s
Figure D2. Sequential photographs for test 405160-13-1 (overhead and frontal views).
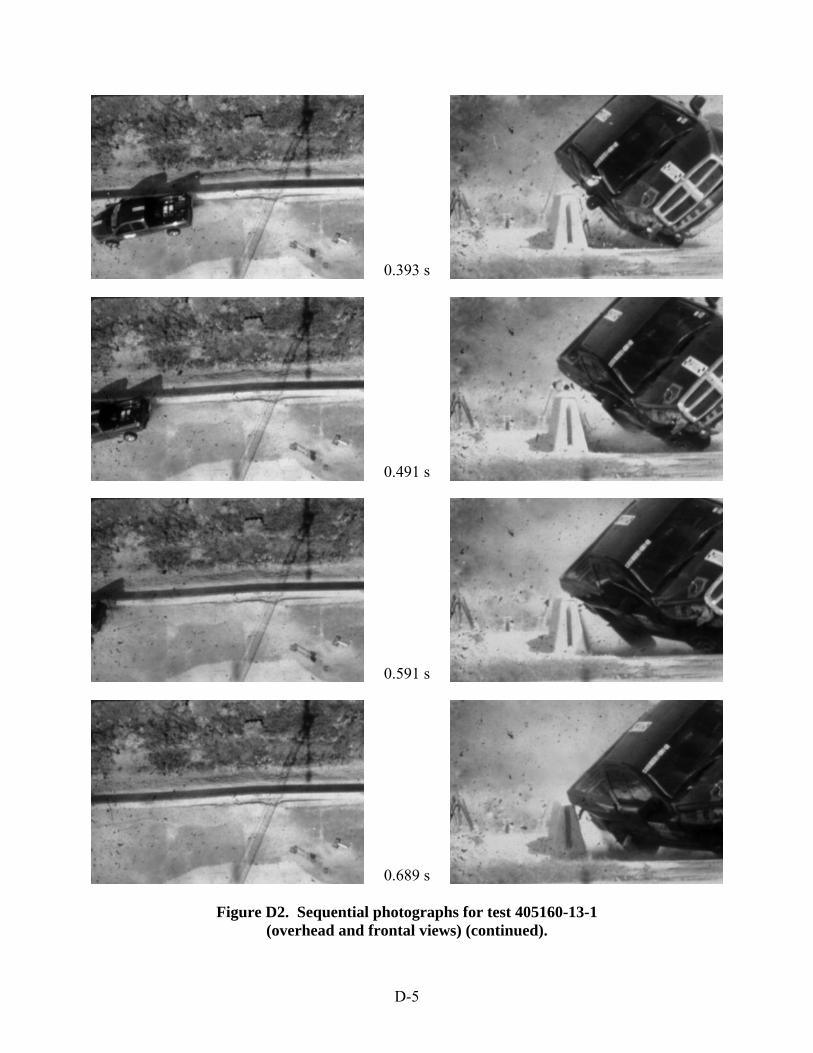
D-5
0.393 s
0.491 s
0.591 s
0.689 s
Figure D2. Sequential photographs for test 405160-13-1 (overhead and frontal views) (continued).
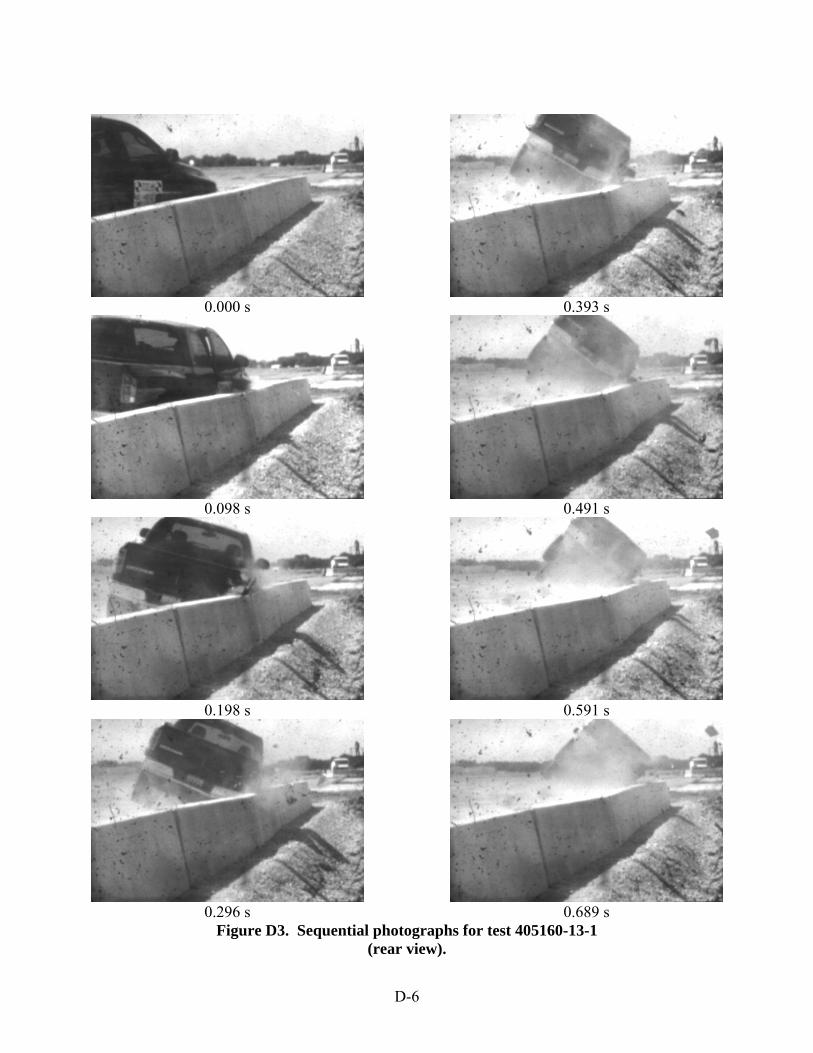
D-6
0.000 s 0.393 s
0.098 s 0.491 s
0.198 s 0.591 s
0.296 s 0.689 s
Figure D3. Sequential photographs for test 405160-13-1 (rear view).

D-7
D3. V
EH
ICL
E A
NG
UL
AR
DISPL
AC
EM
EN
TS
Roll, Pitch, and Yaw Angles
0 0.2 0.4 0.6 0.8 1.0 1.2 1.4 1.6-50
-40
-30
-20
-10
0
10
20
30
40
50
Time (s)
Ang
les
(deg
rees
)
Test Number: 405160-13-1Test Date: April 16, 2009Test Artic le: SSB Embedded in SoilTest Vehicle: 2002 Dodge Ram 1500Inertial Mass: 4953 lbImpact Speed: 63.1 mi/hImpact Angle: 24.2 degrees
Roll Pitch Yaw
Figure D4. Vehicle angular displacements for test 405160-13-1.
Axes are vehicle-fixed. Sequence for determining orientation:
1. Yaw. 2. Pitch. 3. Roll.
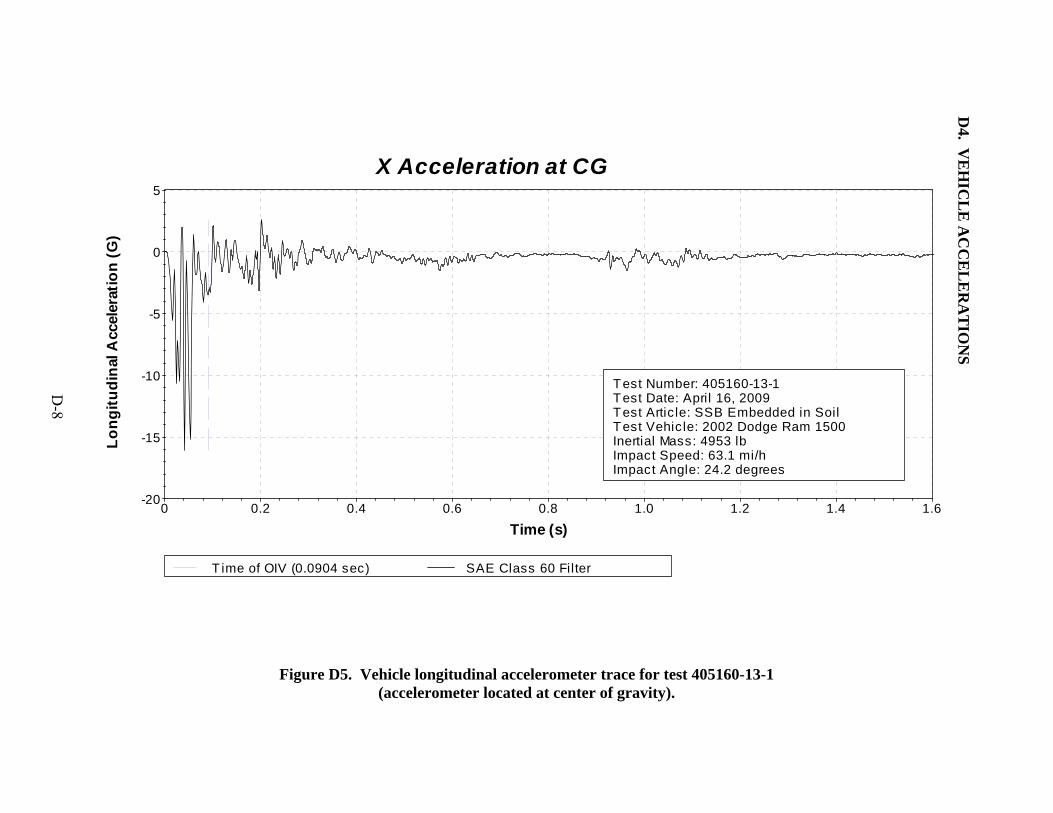
D-8
D4. V
EH
ICL
E A
CC
EL
ER
AT
ION
S
X Acceleration at CG
0 0.2 0.4 0.6 0.8 1.0 1.2 1.4 1.6-20
-15
-10
-5
0
5
Time (s)
Long
itudi
nal A
ccel
erat
ion
(G)
Test Number: 405160-13-1Test Date: April 16, 2009Test Artic le: SSB Embedded in SoilTest Vehic le: 2002 Dodge Ram 1500Inertial Mass: 4953 lbImpact Speed: 63.1 mi/hImpact Angle: 24.2 degrees
T ime of OIV (0.0904 sec) SAE Class 60 Filter
Figure D5. Vehicle longitudinal accelerometer trace for test 405160-13-1 (accelerometer located at center of gravity).

D-9
Y Acceleration at CG
0 0.2 0.4 0.6 0.8 1.0 1.2 1.4 1.6-30
-20
-10
0
10
Time (s)
Late
ral A
ccel
erat
ion
(G)
Test Number: 405160-13-1Test Date: April 16, 2009Test Artic le: SSB Embedded in SoilTest Vehicle: 2002 Dodge Ram 1500Inertial Mass: 4953 lbImpact Speed: 63.1 mi/hImpact Angle: 24.2 degrees
T ime of OIV (0.0904 sec) SAE Class 60 Filter
Figure D6. Vehicle lateral accelerometer trace for test 405160-13-1 (accelerometer located at center of gravity).
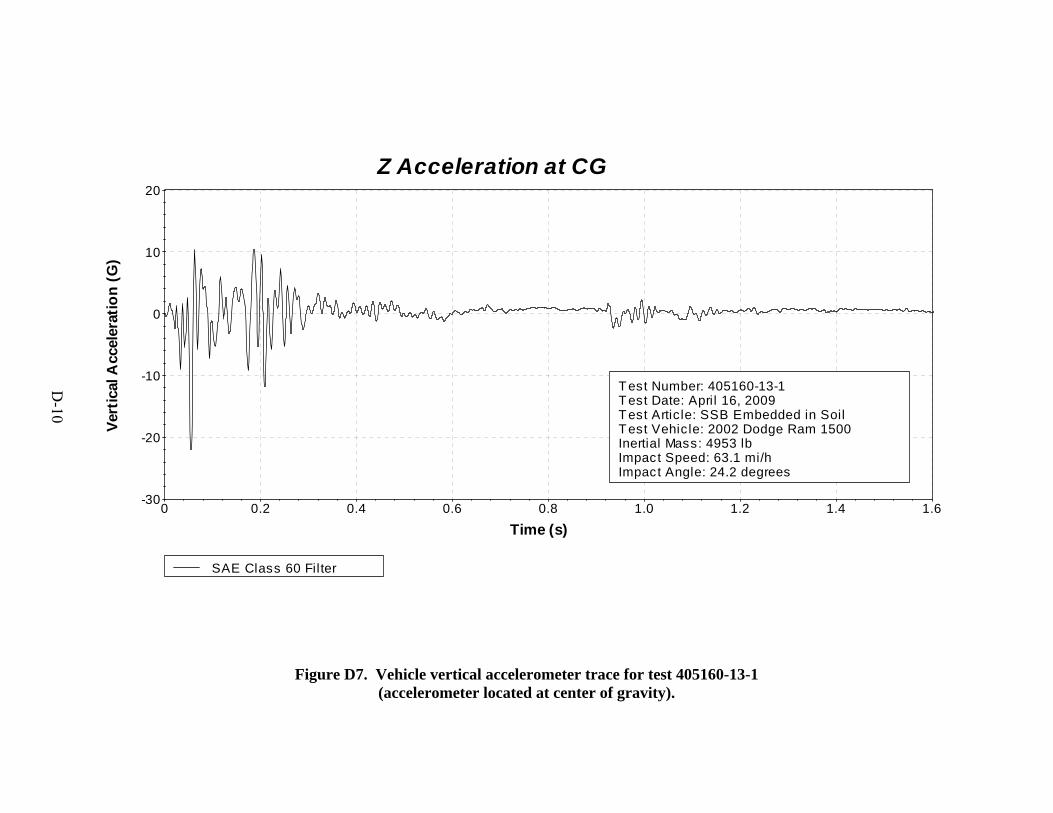
D-10
Z Acceleration at CG
0 0.2 0.4 0.6 0.8 1.0 1.2 1.4 1.6-30
-20
-10
0
10
20
Time (s)
Vert
ical
Acc
eler
atio
n (G
)
Test Number: 405160-13-1Test Date: April 16, 2009Test Artic le: SSB Embedded in SoilTest Vehic le: 2002 Dodge Ram 1500Inertial Mass: 4953 lbImpact Speed: 63.1 mi/hImpact Angle: 24.2 degrees
SAE Class 60 Filter
Figure D7. Vehicle vertical accelerometer trace for test 405160-13-1 (accelerometer located at center of gravity).
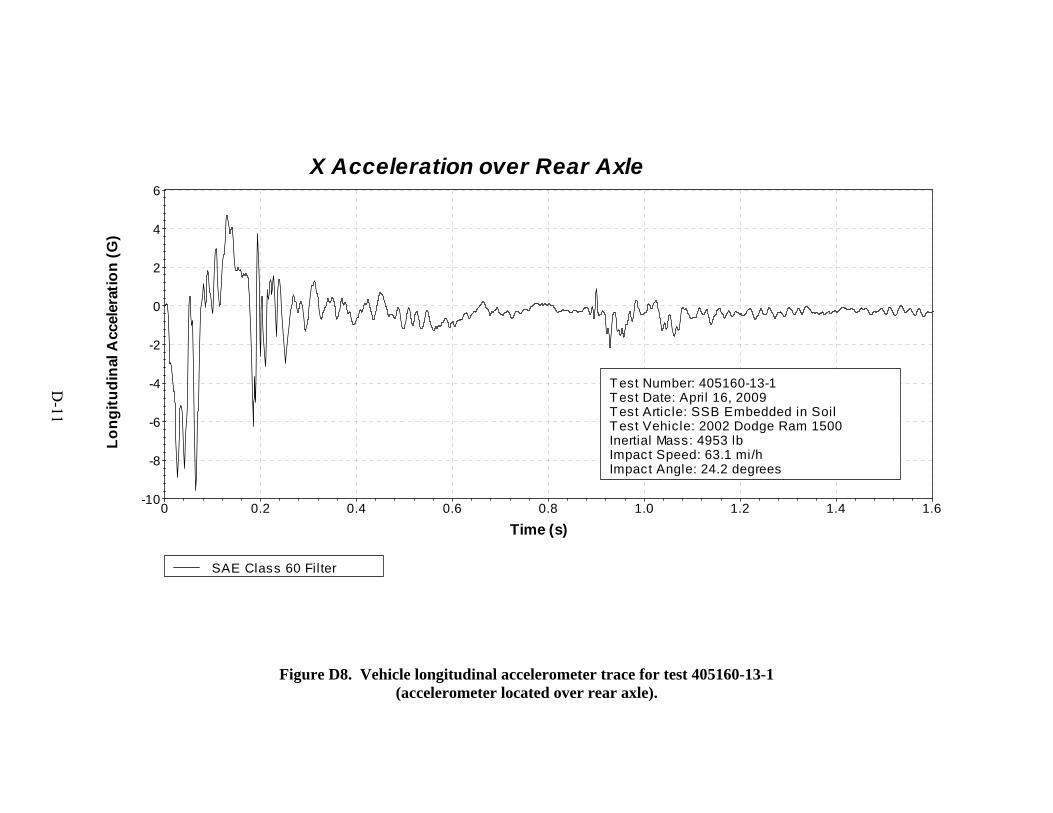
D-11
X Acceleration over Rear Axle
0 0.2 0.4 0.6 0.8 1.0 1.2 1.4 1.6-10
-8
-6
-4
-2
0
2
4
6
Time (s)
Long
itudi
nal A
ccel
erat
ion
(G)
Test Number: 405160-13-1Test Date: April 16, 2009Test Artic le: SSB Embedded in SoilTest Vehicle: 2002 Dodge Ram 1500Inertial Mass: 4953 lbImpact Speed: 63.1 mi/hImpact Angle: 24.2 degrees
SAE Class 60 Filter
Figure D8. Vehicle longitudinal accelerometer trace for test 405160-13-1 (accelerometer located over rear axle).

D-12
Y Acceleration over Rear Axle
0 0.2 0.4 0.6 0.8 1.0 1.2 1.4 1.6-60
-50
-40
-30
-20
-10
0
10
Time (s)
Late
ral A
ccel
erat
ion
(G)
Test Number: 405160-13-1Test Date: April 16, 2009Test Artic le: SSB Embedded in SoilTest Vehicle: 2002 Dodge Ram 1500Inertial Mass: 4953 lbImpact Speed: 63.1 mi/hImpact Angle: 24.2 degrees
SAE Class 60 Filter
Figure D9. Vehicle lateral accelerometer trace for test 405160-13-1 (accelerometer located over rear axle).

D-13
Z Acceleration over Rear Axle
0 0.2 0.4 0.6 0.8 1.0 1.2 1.4 1.6-20
-10
0
10
20
Time (s)
Vert
ical
Acc
eler
atio
n (G
)
Test Number: 405160-13-1Test Date: April 16, 2009Test Artic le: SSB Embedded in SoilTest Vehicle: 2002 Dodge Ram 1500Inertial Mass: 4953 lbImpact Speed: 63.1 mi/hImpact Angle: 24.2 degrees
SAE Class 60 Filter
Figure D10. Vehicle vertical accelerometer trace for test 405160-13-1 (accelerometer located over rear axle).