Proton spectroscopic imaging of brain metabolites in basal...
7
RESEARCH ARTICLE Proton spectroscopic imaging of brain metabolites in basal ganglia of healthy older adults Jehill Parikh • Michael J. Thrippleton • Catherine Murray • Paul A. Armitage • Bridget A. Harris • Peter J. D. Andrews • Joanna M. Wardlaw • John M. Starr • Ian J. Deary • Ian Marshall Received: 1 May 2014 / Revised: 28 August 2014 / Accepted: 23 September 2014 / Published online: 14 October 2014 Ó The Author(s) 2014. This article is published with open access at Springerlink.com Abstract Object We sought to measure brain metabolite levels in healthy older people. Materials and methods Spectroscopic imaging at the level of the basal ganglia was applied in 40 participants aged 73–74 years. Levels of the metabolites N-acetyl aspartate (NAA), choline, and creatine were determined in ‘‘institutional units’’ (IU) corrected for T1 and T2 relaxa- tion effects. Structural imaging enabled determination of grey matter (GM), white matter (WM), and cerebrospinal fluid content. ANOVA analysis was carried out for voxels satisfying quality criteria. Results Creatine levels were greater in GM than WM (57 vs. 44 IU, p \ 0.001), whereas choline and NAA levels were greater in WM than GM [13 vs. 10 IU (p \ 0.001) and 76 versus 70 IU (p = 0.03), respectively]. The ratio of NAA/cre was greater in WM than GM (2.1 vs. 1.4, p = 0.001) as was that of cho/cre (0.32 vs. 0.16, p \ 0.001). A low voxel yield was due to brain atrophy and the difficulties of shimming over an extended region of brain. Conclusion This study addresses the current lack of information on brain metabolite levels in older adults. The normal features of ageing result in a substantial loss of reliable voxels and should be taken into account when planning studies. Improvements in shimming are also required before the methods can be applied more widely. Keywords MR spectroscopy Á Brain metabolites Á Basal ganglia Á Ageing Á Older adults Á Healthy volunteers Abbreviations BGND Background (non-brain tissue and air) CHESS Chemical shift selective CSF Cerebrospinal fluid GM Grey matter LBC Lothian Birth Cohort NAA N-acetyl aspartate PRESS Point-resolved spectroscopy WM White matter Introduction The study of normal brain ageing, neurodegenerative conditions, and age-related cognitive decline is of increasing interest as populations age. Magnetic resonance imaging is proving to be a powerful tool for the evaluation of structural and functional changes [1, 2]. Additionally, magnetic resonance spectroscopy (MRS) can provide J. Parikh Á M. J. Thrippleton Á P. J. D. Andrews Á J. M. Wardlaw Á I. Marshall (&) Centre for Clinical Brain Sciences, University of Edinburgh, Chancellor’s Building, Edinburgh EH16 4SB, UK e-mail: [email protected] C. Murray Á I. J. Deary Department of Psychology, University of Edinburgh, Edinburgh, UK P. A. Armitage Academic Unit of Radiology, Department of Cardiovascular Science, University of Sheffield, Sheffield, UK B. A. Harris Á P. J. D. Andrews Critical Care Medicine, NHS Lothian and University of Edinburgh, Edinburgh, UK J. M. Wardlaw Á J. M. Starr Á I. J. Deary Á I. Marshall Centre for Cognitive Ageing and Cognitive Epidemiology, University of Edinburgh, Edinburgh, UK 123 Magn Reson Mater Phy (2015) 28:251–257 DOI 10.1007/s10334-014-0465-0
Transcript of Proton spectroscopic imaging of brain metabolites in basal...
RESEARCH ARTICLE
Proton spectroscopic imaging of brain metabolites in basal gangliaof healthy older adults
Jehill Parikh • Michael J. Thrippleton • Catherine Murray •
Paul A. Armitage • Bridget A. Harris • Peter J. D. Andrews •
Joanna M. Wardlaw • John M. Starr • Ian J. Deary • Ian Marshall
Received: 1 May 2014 / Revised: 28 August 2014 / Accepted: 23 September 2014 / Published online: 14 October 2014
� The Author(s) 2014. This article is published with open access at Springerlink.com
Abstract
Object We sought to measure brain metabolite levels in
healthy older people.
Materials and methods Spectroscopic imaging at the
level of the basal ganglia was applied in 40 participants
aged 73–74 years. Levels of the metabolites N-acetyl
aspartate (NAA), choline, and creatine were determined in
‘‘institutional units’’ (IU) corrected for T1 and T2 relaxa-
tion effects. Structural imaging enabled determination of
grey matter (GM), white matter (WM), and cerebrospinal
fluid content. ANOVA analysis was carried out for voxels
satisfying quality criteria.
Results Creatine levels were greater in GM than WM (57
vs. 44 IU, p\ 0.001), whereas choline and NAA levels
were greater in WM than GM [13 vs. 10 IU (p\ 0.001)
and 76 versus 70 IU (p = 0.03), respectively]. The ratio of
NAA/cre was greater in WM than GM (2.1 vs. 1.4,
p = 0.001) as was that of cho/cre (0.32 vs. 0.16,
p\ 0.001). A low voxel yield was due to brain atrophy and
the difficulties of shimming over an extended region of
brain.
Conclusion This study addresses the current lack of
information on brain metabolite levels in older adults. The
normal features of ageing result in a substantial loss of
reliable voxels and should be taken into account when
planning studies. Improvements in shimming are also
required before the methods can be applied more widely.
Keywords MR spectroscopy � Brain metabolites � Basal
ganglia � Ageing � Older adults � Healthy volunteers
Abbreviations
BGND Background (non-brain tissue and air)
CHESS Chemical shift selective
CSF Cerebrospinal fluid
GM Grey matter
LBC Lothian Birth Cohort
NAA N-acetyl aspartate
PRESS Point-resolved spectroscopy
WM White matter
Introduction
The study of normal brain ageing, neurodegenerative
conditions, and age-related cognitive decline is of
increasing interest as populations age. Magnetic resonance
imaging is proving to be a powerful tool for the evaluation
of structural and functional changes [1, 2]. Additionally,
magnetic resonance spectroscopy (MRS) can provide
J. Parikh � M. J. Thrippleton � P. J. D. Andrews �J. M. Wardlaw � I. Marshall (&)
Centre for Clinical Brain Sciences, University of Edinburgh,
Chancellor’s Building, Edinburgh EH16 4SB, UK
e-mail: [email protected]
C. Murray � I. J. Deary
Department of Psychology, University of Edinburgh, Edinburgh,
UK
P. A. Armitage
Academic Unit of Radiology, Department of Cardiovascular
Science, University of Sheffield, Sheffield, UK
B. A. Harris � P. J. D. Andrews
Critical Care Medicine, NHS Lothian and University of
Edinburgh, Edinburgh, UK
J. M. Wardlaw � J. M. Starr � I. J. Deary � I. Marshall
Centre for Cognitive Ageing and Cognitive Epidemiology,
University of Edinburgh, Edinburgh, UK
123
Magn Reson Mater Phy (2015) 28:251–257
DOI 10.1007/s10334-014-0465-0
information on brain metabolites such as N-acetyl aspartate
(NAA), choline, creatine, and glutamate. Since metabolites
are related to cellular function, it is understandable that
brain metabolites have been studied for their associations
with cognitive function.
Although brain metabolite levels have been measured in
modest groups of young healthy subjects, there is relatively
little literature concerning older adults. As early as 1993,
Christiansen et al. [3] measured metabolite levels and
relaxation times in healthy young adults (n = 8; age 20–30)
compared with healthy elderly adults (n = 8; age 60–80).
They found a 15 % decline in occipital NAA in the older
group compared with the younger group. In a recent meta-
analysis of the available literature, Haga et al. [4] reported
reduced NAA and raised choline and creatine in healthy
older subjects ([60 years) relative to healthy younger sub-
jects (\60 years). Previously, we used a single-voxel MRS
technique and found an association between raised creatine
and a decline in cognitive ability [5]. Kantarci et al. [6]
reported a decreased NAA/creatine ratio in people with mild
cognitive impairment and Alzheimer’s disease relative to
cognitively normal, age-matched controls.
Magnetic resonance spectroscopic imaging (MRSI)
enables measurement of multiple voxels in a slice across
the brain and thereby opens up the possibility of producing
maps of metabolite distribution.
The objective of the current study was to establish brain
metabolite levels in healthy older adults within a narrow
age range. We employed strict criteria to discard spectro-
scopic voxels that failed various quality tests. We looked
for associations between metabolite levels, brain atrophy,
and cognitive scores.
Materials and methods
Participants
Forty participants (25 female) were recruited from healthy,
community-living people comprising the Lothian Birth
Cohort 1936 (LBC 1936 [7, 8]). All participants were aged
73 or 74 at the time of MRI scanning and formed a sub
group of approximately 650 volunteers who were part of a
longitudinal study on cognitive ageing [7] and for whom
recent detailed structural imaging [9] and cognitive scores
were available. The latter included general fluid intelli-
gence [10] and general memory [11]. An experienced
observer determined brain atrophy, iron, and white matter
(WM) lesion scores [12] from the structural images. Par-
ticipants with the lowest ratings were then selected for the
present spectroscopic study . The study was approved by
the local research ethics committee and all participants
gave informed written consent.
In order to avoid any possible confounding effects from
diurnal variation, all scans were performed at the same
time of day (between 11 a.m. and 1 p.m.).
Imaging
All imaging was performed on a 1.5T clinical research
scanner (HDxt, GE Healthcare, UK). The imaging protocol
for this spectroscopy study used a standard quadrature head
coil and included localiser, coronal T1-weighted (T1w: 3D-
IR-PREP-FAST-GRE), and axial T2-weighted (T2w: FSE)
scans in addition to an MRSI scan for brain metabolite
measurements. Key acquisition parameters for the T1w
scans were 3D inversion recovery-prepared, TI/TR/
TE = 500/10/4 ms, flip angle 8�, matrix 192 9 192, FOV
256 mm slices of 1.3 mm thickness (156 slices total).
Parameters for the T2w scans were TR/TE = 4,000/
102 ms, matrix 256 9 256, FOV 240 mm, slices of 5 mm
thickness (28 slices total), and 2 signal averages.
The T2w images were used to plan a 10 mm thick axial
MRSI slice at a level that included the basal ganglia.
PRESS excitation was used with a volume of interest
(VOI) selected to cover the brain laterally and extend
forward from the posterior edge of the brain, avoiding the
frontal sinuses and orbits (Fig. 1). 24 9 24 phase-encoding
steps were applied over a field of view of 240 mm. Rep-
etition and echo times were 1,000 and 145 ms, respec-
tively. For each phase encode, 512 complex data points
were acquired with a sampling interval of 1 ms. Manu-
facturer-provided (first order) automatic shimming was
employed to reduce the B0 magnetic field inhomogeneity
prior to the MRSI acquisitions. Water suppression used the
default CHESS technique with three selective RF pulses.
Outer volume suppression employed pre-saturation slabs
parallel to the faces of the VOI and an additional four slabs
positioned around the edges of the brain to suppress lipid
artifacts from the scalp (Fig. 1). The total examination time
was approximately 30 min.
Image analysis
MRSI data were processed offline as described previously
[13]. Briefly, a two-dimensional spatial Fourier Transform
with cosine-weighted apodisation was applied to the raw
spectroscopic data, followed by zero-order phase and
eddy-current correction on a voxel-by-voxel basis using
the residual water signals, bringing water to a fixed
nominal chemical shift of 4.70 ppm [14]. The residual
water component was removed from each signal using the
Hankel Lanczos singular value decomposition technique
and the resulting signals quantified using the AMARES
algorithm within the MRUI package (www.mrui.uab.es).
A model consisting of three in-phase Gaussian
252 Magn Reson Mater Phy (2015) 28:251–257
123

components (corresponding to the major metabolite peaks
of choline, creatine, and NAA) and two inverted compo-
nents (corresponding to lactate) was used. Spectra were
automatically discarded if fitted line widths were\1 Hz or
[10 Hz; if the metabolite peaks were more than 0.1 ppm
offset from their nominal values; or if the voxels lay on
the edges of the PRESS excitation region. All spectra
were also inspected visually and discarded if judged to be
of poor quality, for example having a badly elevated
baseline or containing spurious peaks. Spectral peak areas
were corrected for relaxation effects using literature val-
ues for T1 and T2 in basal ganglia in elderly subjects [3]
and normalised according to the number of contributing
protons. The resulting institutional units are directly
related to molecular concentrations and enable compari-
son between studies.
Tissue segmentation maps for grey matter (GM), WM,
cerebrospinal fluid (CSF), and ‘‘background’’ (BGND)
were computed from the T1-weighted images using the
FSL-FAST algorithm (http://www.fmrib.ox.ac.uk). Previ-
ously available T2* (gradient-echo) images [9] were first
registered with the T1w and T2w images and used to create
brain masks. Air and non-brain tissue outside the mask was
classed as BGND. Tissue segmentation maps were then
generated and overlaid on the MRSI grid. For each spec-
troscopic voxel, the percentage of GM, WM, CSF, and
BGND content was calculated based on three contiguous
slices to match the extent of the MRSI acquisition. Spec-
troscopy voxels containing more than 20 % CSF or 5 %
BGND were rejected.
ANOVA (Matlab) and linear mixed effects (PASW
Statistics) analyses were carried out on metabolite levels,
with (%WM–%GM) as a variable and ‘‘subject’’ as a
random factor. Metabolite ratios were also analysed in the
same way. Subject-by-subject associations between
metabolite levels and structural and cognitive scores were
explored.
Results
Imaging and automatic brain segmentation succeeded in all
40 participants. Three participants who had fewer than five
spectroscopic voxels valid for NAA, choline, or creatine
were excluded from the subject-by-subject analysis.
Metabolite levels
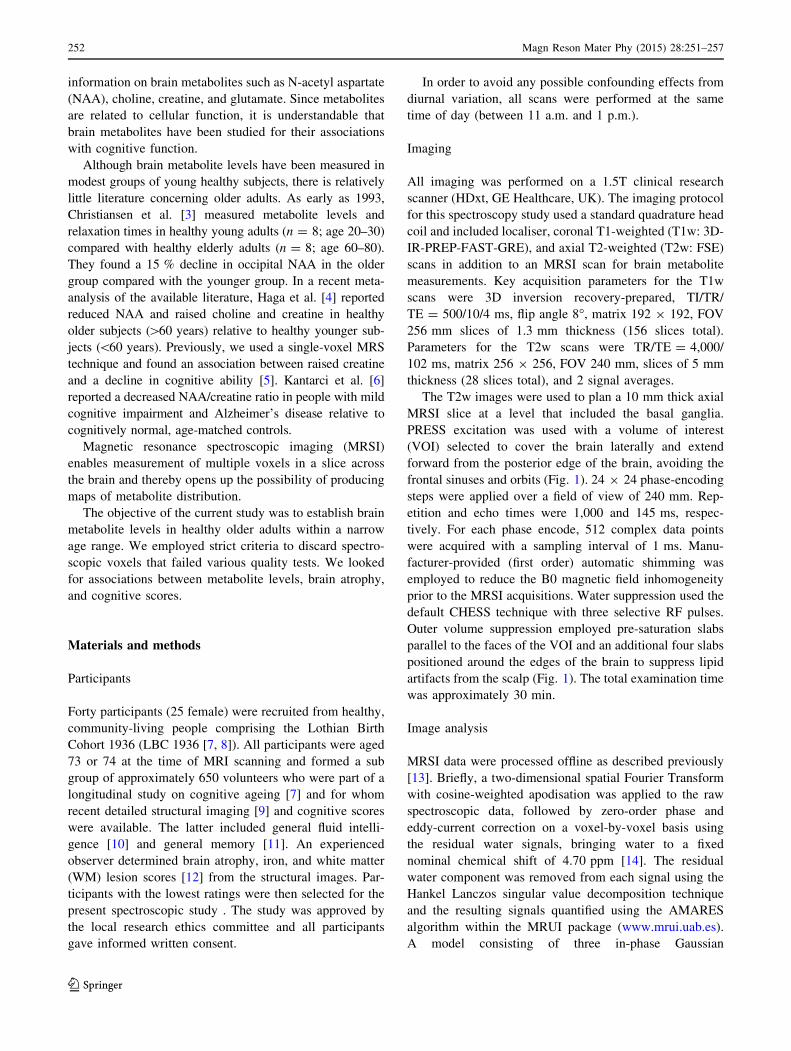
Of the combined total of 6,476 voxels contained within the
MRSI PRESS excitation regions (Fig. 1), 1,432 survived
the spectral tests for NAA, and only 703 survived when
including choline and creatine. These 703 voxels were
included in the full ANOVA analyses reported in Table 1.
Figures 2 and 3 display the reasons for this attrition. There
Fig. 1 Sagittal and axial
localiser scan showing
placement of PRESS–MRSI
slab and additional saturation
bands (hatched) to minimise
lipid contamination
Table 1 Metabolite levels [in institutional units (IU): see text] and
metabolite ratios from ANOVA analysis of spectroscopic voxels in 40
subjects
WM GM p (GM vs WM)
Metabolites (IU)
NAA 76 70 0.03
Choline 13 10 \0.001
Creatine 45 57 \0.001
Metabolite ratios
NAA/Cho 8.2 9.8 0.06
NAA/Cre 2.1 1.4 \0.001
Cho/Cre 0.32 0.16 \0.001
Spectral peak area ratios
NAA/Cho 2.4 2.8 0.06
NAA/Cre 2.4 1.6 \0.001
Cho/Cre 1.3 0.7 \0.001
Ratios of spectral peak areas are also given for comparison with other
studies. Only voxels passing all spectral quality tests (see Figs. 2, 3
and text) are included
WM white matter, GM grey matter
Magn Reson Mater Phy (2015) 28:251–257 253
123

was a significant negative correlation between the per-
centage of valid voxels and the mean NAA line width (of
retained voxels) for each subject (r = -0.44, p = 0.005).
The main metabolite findings are that creatine levels were
significantly higher in GM than WM, whereas choline and
NAA levels were significantly higher in WM than GM.
Choline and creatine levels were highly correlated
(r = 0.55, p\ 0.001), whilst creatine and NAA showed a
weak negative correlation (r = -0.32, p = 0.05). NAA/
cre and cho/cre metabolite ratios were significantly greater
in WM than GM. The NAA/cho ratio was greater in GM
than WM, although this difference did not quite reach
significance (p = 0.06).
Relation to structural and cognitive scores
There was a trend for choline levels to be associated with
WM lesion scores (r = 0.24, p = 0.1). There were no
Fig. 2 MRSI grid superimposed on corresponding T2-weighted
image. The PRESS excitation box is outlined in red. Below is shown
the grid of spectra contained completely within the PRESS box,
colour coded according to: pale grey, ‘background’ (BGND), where
brain comprises \95 % of the voxel volume; grey, CSF more than
20 %; red, fitting of NAA peak failed; blue, failed visual quality test;
green, failed choline and/or creatine fitting but valid for NAA; black,
passed all tests. Tests were applied in the order described. For further
details, refer to text. The spectral range displayed is from 4 to 1 ppm
254 Magn Reson Mater Phy (2015) 28:251–257
123
associations between metabolites and either atrophy or iron
deposition scores. Creatine levels were correlated with
fluid intelligence (r = 0.33, p = 0.05), and NAA showed a
trend towards association with memory scores (r = 0.27,
p = 0.1).
Discussion
In this study we used MRSI to measure brain metabolite
levels in healthy elderly subjects. We looked for evidence
of tissue type differences and for associations with struc-
tural and cognitive scores. The narrow age range of the
Lothian Birth Cohort 1936 removes age as a potential
confounding factor, although it does preclude looking for
age-related effects in a single study such as this.
Our finding of higher creatine levels in GM than WM is
in agreement with previous literature reports, although the
magnitude of the difference varies greatly, being 27 % in
the present study, 11 % in Schuff et al. [15], 30 % in
Hetherington et al. [16], 40 % in Tal et al. [17], and as
much as 70 % in McLean et al. [18]. Our finding of lower
NAA levels in GM than in WM (70 vs. 76 IU) is consistent
with some previous reports [15, 16] but different from
others. For example, Tal et al. [17] averaged metabolite
values over a large centrally placed volume of brain and
found that NAA was 11 % higher in GM than WM. We
found choline levels lower in GM than WM, consistent
with previous reports [16, 18], although others have
reported no significant difference [15, 17]. Christiansen
et al. [3] found no difference in metabolite levels between
basal ganglia and the occipital, temporal, and frontal
regions in healthy elderly subjects. However, they used
large (8 mL) volumes of interest containing unspecified
proportions of GM and WM. Our results for metabolite
ratios are consistent with our findings for individual
metabolite levels. The reasons for the discrepancies in
metabolite findings between various studies are unclear but
will include exact details of the positioning, acquisition
method and quantification, and possible (unknown) dif-
ferences in metabolite T1 and T2 values between GM and
WM.
We used literature values for T1 and T2 correction and
also normalised the results by the number of protons con-
tributing to the spectral peaks (3 for NAA and creatine, 9
for choline). The final results in institutional units are
therefore closely related to molecular concentrations. Other
researchers, including [3] for example, have reported ratios
of spectral peak areas under experimental conditions, and
we have included these ratios in Table 1 to enable com-
parisons with other studies. We did not explore regional
variations because of the relatively low number of valid
voxels in particular regions, especially the frontal and
cortical regions. The chemical shift displacement between
choline and NAA amounted to approximately 0.5 mm
through-plane (i.e. 5 % of the slab thickness), 4 mm
anterior-posterior, and 6 mm left–right. Since we excluded
voxels around the edge of the excitation volume, these
displacements will have had minimal effect.
In this study we found a positive correlation between
creatine and fluid intelligence score, whereas previously [5]
we found a negative correlation between parietal cortex
creatine and memory scores but no association with other
cognitive measures. However, the two studies investigated
different brain regions.
As in recent work by Bainbridge et al. [19], we
employed strict criteria to discard spectroscopic voxels that
failed various quality tests. Although rather conservative,
such criteria can be applied with minimal human inter-
vention, will become important for future clinical studies,
and will be essential when large data sets from whole-brain
spectroscopy [20] become routinely available. The large
loss of voxels (Fig. 3) was caused by a high proportion of
CSF and failures of spectral quantification. In older people
with brain atrophy, it is inevitable that voxels will be lost
due to CSF and enlarged ventricles. Failures of quantifi-
cation were due in part to the problems of shimming over
Fig. 3 Exclusion of spectroscopic voxels for the cohort. 40 subjects
had a potential 6,476 voxels, of which 1,432 were valid for NAA after
spectral quality tests had been applied. Of these, 703 voxels were also
valid for choline and creatine measurement. Reasons for exclusion
were: background more than 5 % of voxel volume (BGND); CSF
more than 20 % (CSF); fitting of NAA peak failed (NAA); failed
visual quality test (Vis); failed choline and/or creatine fitting
(ChoCre), but valid for NAA. Tests were applied in the order
described, and the number of additional voxels failing each test is
given in the figure
Magn Reson Mater Phy (2015) 28:251–257 255
123
an extended region of the brain, which is especially diffi-
cult at the level of the basal ganglia. In some subjects, an
unavoidable tilt of the head relative to the scanner led to
portions of the frontal sinuses, ethmoid sinus, or eyes being
included in the MRSI plane. This is a particular problem in
older people, as they are less able to tilt their heads into the
optimum posture. Only first-order (linear) shimming was
available on the scanner used. In other studies (data not
shown) we have found greater success rates with MRSI
slices at the level of the corpus callosum. The use of
modern scanners with higher-order shims is likely to help,
as are higher field strengths and more sensitive multi-
channel coils enabling higher SNR and hence smaller
voxels with improved line widths. However, some brain
areas, for example the frontal and temporal regions, will
remain challenging in this regard.
A limitation of this study is that time did not permit the
collection of non-suppressed spectroscopic data for water
referencing purposes. Instead we used the residual water
signal for ‘‘self-referencing’’ [14]. Ideally, a rapid inter-
leaved (suppressed/reference) technique would be used, as
demonstrated by the echo-planar acquisition scheme of
Ebel and Maudsley [20].
Conclusions
The measurement of brain metabolites is potentially useful
in studies of healthy ageing and acute and neurodegener-
ative diseases. There is currently a lack of information on
metabolite levels in older adults. The current study of a
moderately sized cohort with a tight age range adds to the
available literature. However, technical challenges such as
shimming across the whole brain and water referencing
need to be resolved before the technique can be more
widely applied in large trials. Future directions include
rapid, three-dimensional, whole-brain coverage and longi-
tudinal studies.
Acknowledgments This study was funded by The University of
Edinburgh Centre for Cognitive Ageing and Cognitive Epidemiology,
part of the Cross Council Lifelong Health and Wellbeing Initiative
(G0700704/84698). Funding from the Biotechnology and Biological
Sciences Research Council (BBSRC), Engineering and Physical
Sciences Research Council (EPSRC), Economic and Social Research
Council (ESRC) and Medical Research Council (MRC) is gratefully
acknowledged. Michael Thrippleton was funded by the Chief Scien-
tist Office of Scotland (CSO: Grant ETM/3). Jehill Parikh was funded
by the SINAPSE (Scottish Imaging Network: A Platform for Scien-
tific Excellence) collaboration, the Tony Watson Scholarship, and a
University of Edinburgh Overseas Research Scholarship. Bridget
Harris acknowledges the financial support of NHS Research Scotland,
through NHS Lothian. MRI scanning was carried out at the Brain
Research Imaging Centre, which is a part of the University of Edin-
burgh Wellcome Trust Clinical Research Facility and the SINAPSE
collaboration, funded by the Scottish Funding Council and the CSO.
Conflict of interest The authors declare that they have no conflicts
of interest.
Ethical standards This study was approved by the local research
ethics committee and all participants gave informed written consent.
Open Access This article is distributed under the terms of the
Creative Commons Attribution License which permits any use, dis-
tribution, and reproduction in any medium, provided the original
author(s) and the source are credited.
References
1. DeCarli C, Massaro J, Harvey D, Hald J, Tullberg M, Au R,
Beiser A, D’Agostino R, Wolf PA (2005) Measures of brain
morphology and infarction in the Framingham heart study:
establishing what is normal. Neurobiol Aging 26(4):491–510.
doi:10.1016/j.neurobiolaging.2004.05.004
2. Ikram MA, van der Lugt A, Niessen WJ, Krestin GP, Koudstaal
PJ, Hofman A, Breteler MMB, Vernooij MW (2011) The Rot-
terdam Scan Study: design and update up to 2012. Eur J Epide-
miology 26(10):811–824. doi:10.1007/s10654-011-9624-z
3. Christiansen P, Toft P, Larsson HBW, Stubgaard M, Henriksen O
(1993) The concentration on N-acetyl aspartate, creatine plus
phosphocreatine, and choline in different parts of the brain in
adulthood and senium. Magn Reson Imag 11(6):799–806. doi:10.
1016/0730-725x(93)90197-l
4. Haga KK, Khor YP, Farrall A, Wardlaw JM (2009) A systematic
review of brain metabolite changes, measured with H-1 magnetic
resonance spectroscopy, in healthy aging. Neurobiol Aging
30(3):353–363. doi:10.1016/j.neurobiolaging.2007.07.005
5. Ferguson KJ, MacLullich AMJ, Marshall I, Deary IJ, Starr JM,
Seckl JR, Wardlaw JM (2002) Magnetic resonance spectroscopy
and cognitive function in healthy elderly men. Brain
125:2743–2749. doi:10.1093/brain/awf278
6. Kantarci K, Weigand SD, Petersen RC, Boeve BF, Knopman DS,
Gunter J, Reyes D, Shiung M, O’Brien PC, Smith GE, Ivnik RJ,
Tangalos EG, Jack CR (2007) Longitudinal H-1 MRS changes in
mild cognitive impairment and Alzheimer’s disease. Neurobiol
Aging 28(9):1330–1339. doi:10.1016/j.neurobiolaging.2006.06.018
7. Deary IJ, Gow AJ, Taylor MD, Corley J, Brett C, Wilson V,
Campbell H, Whalley LJ, Visscher PM, Porteous DJ, Starr JM
(2007) The Lothian Birth Cohort 1936: a study to examine
influences on cognitive ageing from age 11 to age 70 and beyond.
BMC Geriatr 7:28. doi:10.1186/1471-2318-7-28
8. Deary IJ, Gow AJ, Pattie A, Starr JM (2012) Cohort Profile: the
Lothian Birth Cohorts of 1921 and 1936. Int J Epidemiol
41(6):1576–1584. doi:10.1093/ije/dyr197
9. Wardlaw JM, Bastin ME, Hernandez MCV, Maniega SM, Royle
NA, Morris Z, Clayden JD, Sandeman EM, Eadie E, Murray C,
Starr JM, Deary IJ (2011) Brain aging, cognition in youth and old
age and vascular disease in the Lothian Birth Cohort 1936:
rationale, design and methodology of the imaging protocol. Int J
Stroke 6(6):547–559. doi:10.1111/j.1747-4949.2011.00683.x
10. Luciano M, Gow AJ, Harris SE, Hayward C, Allerhand M, Starr
JM, Visscher PM, Deary IJ (2009) Cognitive Ability at Age 11
and 70 Years, Information Processing Speed, and APOE Varia-
tion: the Lothian Birth Cohort 1936 Study. Psychol Aging
24(1):129–138. doi:10.1037/a0014780
11. Corley J, Jia XL, Kyle JAM, Gow AJ, Brett CE, Starr JM,
McNeill G, Deary IJ (2010) Caffeine consumption and cognitive
function at age 70: the Lothian Birth Cohort 1936 study. Psy-
chosom Med 72(2):206–214. doi:10.1097/PSY.0b013e3181
c92a9c
256 Magn Reson Mater Phy (2015) 28:251–257
123

12. Fazekas F, Barkhof F, Wahlund LO, Pantoni L, Erkinjuntti T,
Scheltens P, Schmidt R (2002) CT and MRI rating of white
matter lesions. Cerebrovasc Dis 13(Supp 2):31–36. doi:10.1159/
000049147
13. Marshall I, Karaszewski B, Wardlaw JM, Cvoro V, Wartolowska
K, Armitage PA, Carpenter T, Bastin ME, Farrall A, Haga K
(2006) Measurement of regional brain temperature using proton
spectroscopic imaging: validation and application to acute
ischemic stroke. Magn Reson Imag 24(6):699–706. doi:10.1016/j.
mri.2006.02.002
14. Serrai H, Clayton DB, Senhadji L, Zuo C, Lenkinski RE (2002)
Localized proton spectroscopy without water suppression:
removal of gradient induced frequency modulations by modulus
signal selection. J Magn Reson 154(1):53–59. doi:10.1006/jmre.
2001.2462
15. Schuff N, Ezekiel F, Gamst AC, Amend DL, Capizzano AA,
Maudsley AA, Weiner MW (2001) Region and tissue differences
of metabolites in normally aged brain using multislice 1H mag-
netic resonance spectroscopic imaging. Magn Reson Med
45(5):899–907. doi:10.1002/mrm.1119
16. Hetherington HP, Pan JW, Mason GF, Adams D, Vaughn MJ,
Twieg DB, Pohost GM (1996) Quantitative H-1 spectroscopic
imaging of human brain at 4.1 T using image segmentation.
Magn Reson Med 36(1):21–29. doi:10.1002/mrm.1910360106
17. Tal A, Kirov II, Grossman RI, Gonen O (2012) The role of gray
and white matter segmentation in quantitative proton MR spec-
troscopic imaging. NMR Biomed 25(12):1392–1400. doi:10.
1002/nbm.2812
18. McLean MA, Woermann FG, Barker GJ, Duncan JS (2000)
Quantitative analysis of short echo time H-1-MRSI of cerebral
gray and white matter. Magn Reson Med 44(3):401–411. doi:10.
1002/1522-2594(200009)44:3\401:aid-mrm10[3.0.co;2-w
19. Bainbridge A, Kendall GS, De Vita E, Hagmann C, Kapetanakis
A, Cady EB, Robertson NJ (2013) Regional neonatal brain
absolute thermometry by 1H MRS. NMR Biomed 26(4):416–423.
doi:10.1002/nbm.2879
20. Ebel A, Maudsley AA (2005) Detection and correction of fre-
quency instabilities for volumetric H-1 echo-planar spectroscopic
imaging. Magn Reson Med 53(2):465–469. doi:10.1002/mrm.
20367
Magn Reson Mater Phy (2015) 28:251–257 257
123


![ISOLDE Lecture 2 [tryb zgodnosci]pfutzner/Research/2pDecay/Talks/MPF_ISOLDE_L2.pdf · S–spectroscopic factor. Assuming the proton emitted from the i-th M. Pfützner, ISOLDE Lecture](https://static.fdocuments.us/doc/165x107/5e70bb27f0f416654435773a/isolde-lecture-2-tryb-zgodnosci-pfutznerresearch2pdecaytalksmpfisoldel2pdf.jpg)