Property Review Dubai Real Estate Report - Mashreq Review Dubai Real Estate Report Q2 2017. ... 9...
6
Property map Apartments Rent | Sales Villas Rent | Sales Offices Rent | Sales 2 3 4 5 In the Middle East for over 30 Years Property Review Dubai Real Estate Report Q2 2017
-
Upload
nguyenhuong -
Category
Documents
-
view
218 -
download
1
Transcript of Property Review Dubai Real Estate Report - Mashreq Review Dubai Real Estate Report Q2 2017. ... 9...
Property map
ApartmentsRent | Sales
VillasRent | Sales
OfficesRent | Sales2 3 4 5In the Middle East for over 30 Years
Property Review
Dubai Real Estate ReportQ2 2017
DUBAI2
54
611
611
311
11
11
11
11
44
44
44
311
311
311
611
611
2921
36
3
1433
8
56
26
16
31
46
19
2358
41
50
7
45
1
42
55
37 2
18
24
34
35
27
2238
20
28
57
40
44
52
25
53
49
32
51
15
39
10
309
1348 12
47
4
5
6
43
11
17
To SharjahTo Abu Dhabi
Arabian Gulf
1 Akoya2 Al Barari3 Al Furjan4 Al Nahda5 Al Qusais6 Al Warqaa7 Arabian Ranches8 Barsha9 Bur Dubai10 Business Bay11 Culture Village12 Deira13 DIFC14 Discovery Gardens15 Downtown Dubai16 Downtown Jebel Ali17 Dubai Creek18 Dubai Hills19 Dubai Investment
Park20 Dubaiand
Residential Complex21 Dubai Marina22 Dubai Silicon Oasis23 Dubai Sports City24 Dubailand25 Emirates Hills26 Green Community27 IMPZ28 International City29 JBR30 Jumeirah31 Jumeirah Golf Estates32 Jumeirah Islands
33 Jumeirah Park34 Jumeirah Village
Circle35 Jumeirah Village
Triangle36 Jumeirah
Lakes Towers37 Living Legends38 Liwan39 Meydan40 Mirdif41 MotorCity42 Mudon43 Muhaisnah44 Palm Jumeirah45 Remraam46 Residential City47 Rigga Al Buteen48 Sheikh Zayed Road49 Springs / Meadows50 Studio City51 Tecom C52 The Greens53 The Lakes54 The Villa55 Town Square56 Umm Suqeim57 UptownMirdiff58 Victory Heights
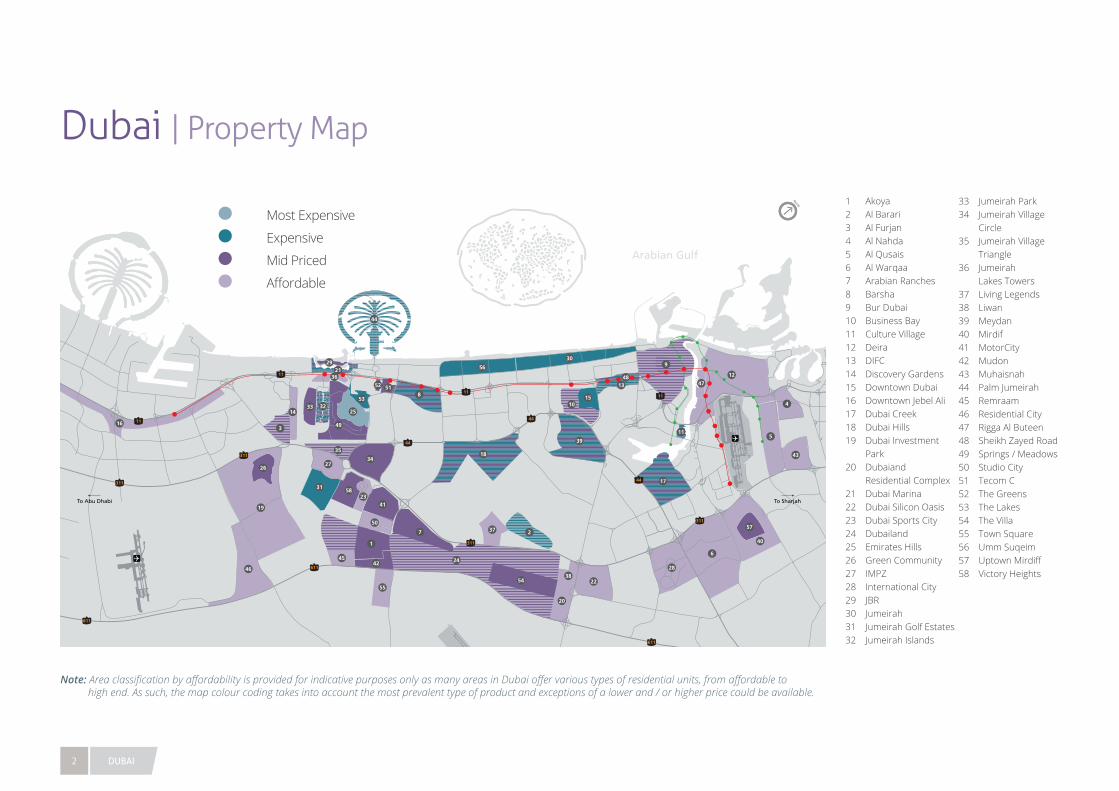
Note: Area classification by affordability is provided for indicative purposes only as many areas in Dubai offer various types of residential units, from affordable to high end. As such, the map colour coding takes into account the most prevalent type of product and exceptions of a lower and / or higher price could be available.
Most Expensive
Expensive
Mid Priced
Affordable
Dubai | Property Map
© Asteco Property Management, 2017 3
Dubai | Apartments-2% -3%-3%
Rental Rates
Sales Prices
-2% -2%
Rental Rates Q-o-Q % Change
Sales Prices Q-o-Q % Change
Mid End Rental Rates
Q-o-Q % Change
High End Rental Rates
Q-o-Q % Change
Affordable Rental Rates
Q-o-Q % Change
TYPE STUDIO 1 BEDROOM 2 BEDROOMS 3 BEDROOMS % CHANGE
AED 000’S PER ANNUM FROM TO FROM TO FROM TO FROM TO Q1 2017 -Q2 2017
Q2 2016 -Q2 2017
HIGH END PROPERTIES
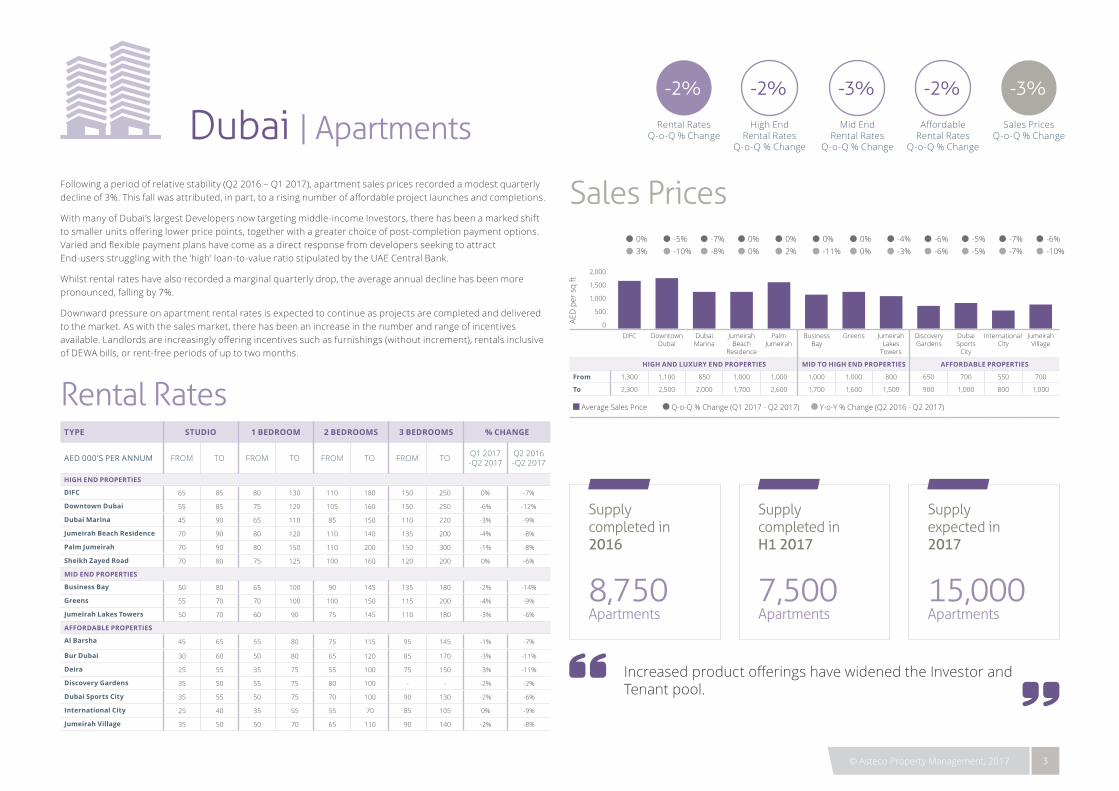
DIFC 65 85 80 130 110 180 150 250 0% -7%
Downtown Dubai 55 85 75 120 105 160 150 250 -6% -12%
Dubai Marina 45 90 65 110 85 150 110 220 -3% -9%
Jumeirah Beach Residence 70 90 80 120 110 140 135 200 -4% -8%
Palm Jumeirah 70 90 80 150 110 200 150 300 -1% -8%
Sheikh Zayed Road 70 80 75 125 100 160 120 200 0% -6%
MID END PROPERTIES
Business Bay 50 80 65 100 90 145 135 180 -2% -14%
Greens 55 70 70 100 100 150 115 200 -4% -9%
Jumeirah Lakes Towers 50 70 60 90 75 145 110 180 -3% -6%
AFFORDABLE PROPERTIES
Al Barsha 45 65 55 80 75 115 95 145 -1% -7%
Bur Dubai 30 60 50 80 65 120 85 170 -3% -11%
Deira 25 55 35 75 55 100 75 150 -3% -11%
Discovery Gardens 35 50 55 75 80 100 - - -2% -2%
Dubai Sports City 35 55 50 75 70 100 90 130 -2% -6%
International City 25 40 35 55 55 70 85 105 0% -9%
Jumeirah Village 35 50 50 70 65 110 90 140 -2% -8%
Supply completed in 2016
8,750Apartments
Supply completed in H1 2017
7,500Apartments
Supply expected in 2017
15,000Apartments
IncreasedproductofferingshavewidenedtheInvestorandTenant pool.
AED
per
sq
ft
2,000
1,500
1,000
500
0
-5%-10%
-7%-8%
0%0%
0%2%
0%-11%
0%0%
-4%-3%
-6%-6%
-5%-5%
-7%-7%
-6%-10%
0%3%
DIFC DowntownDubai
DubaiMarina
Jumeirah Beach
Residence
PalmJumeirah
Business Bay
Greens Jumeirah Lakes
Towers
Discovery Gardens
Dubai Sports
CityCity
Jumeirah Village
HIGH AND LUXURY END PROPERTIES MID TO HIGH END PROPERTIES AFFORDABLE PROPERTIES
From 1,300 1,100 850 1,000 1,000 1,000 1,000 800 650 700 550 700
To 2,300 2,500 2,000 1,700 2,600 1,700 1,600 1,500 900 1,000 800 1,000
Average Sales Price Q-o-Q % Change (Q1 2017 - Q2 2017) Y-o-Y % Change (Q2 2016 - Q2 2017)
International
Following a period of relative stability (Q2 2016 – Q1 2017), apartment sales prices recorded a modest quarterly declineof3%.Thisfallwasattributed,inpart,toarisingnumberofaffordableprojectlaunchesandcompletions.
With many of Dubai’s largest Developers now targeting middle-income Investors, there has been a marked shift tosmallerunitsofferinglowerpricepoints,togetherwithagreaterchoiceofpost-completionpaymentoptions.Variedandflexiblepaymentplanshavecomeasadirectresponsefromdevelopersseekingtoattract End-users struggling with the ‘high’ loan-to-value ratio stipulated by the UAE Central Bank.
Whilst rental rates have also recorded a marginal quarterly drop, the average annual decline has been more pronounced, falling by 7%.
Downward pressure on apartment rental rates is expected to continue as projects are completed and delivered to the market. As with the sales market, there has been an increase in the number and range of incentives available.Landlordsareincreasinglyofferingincentivessuchasfurnishings(withoutincrement),rentalsinclusiveof DEWA bills, or rent-free periods of up to two months.
DUBAI4
Dubai | Villas
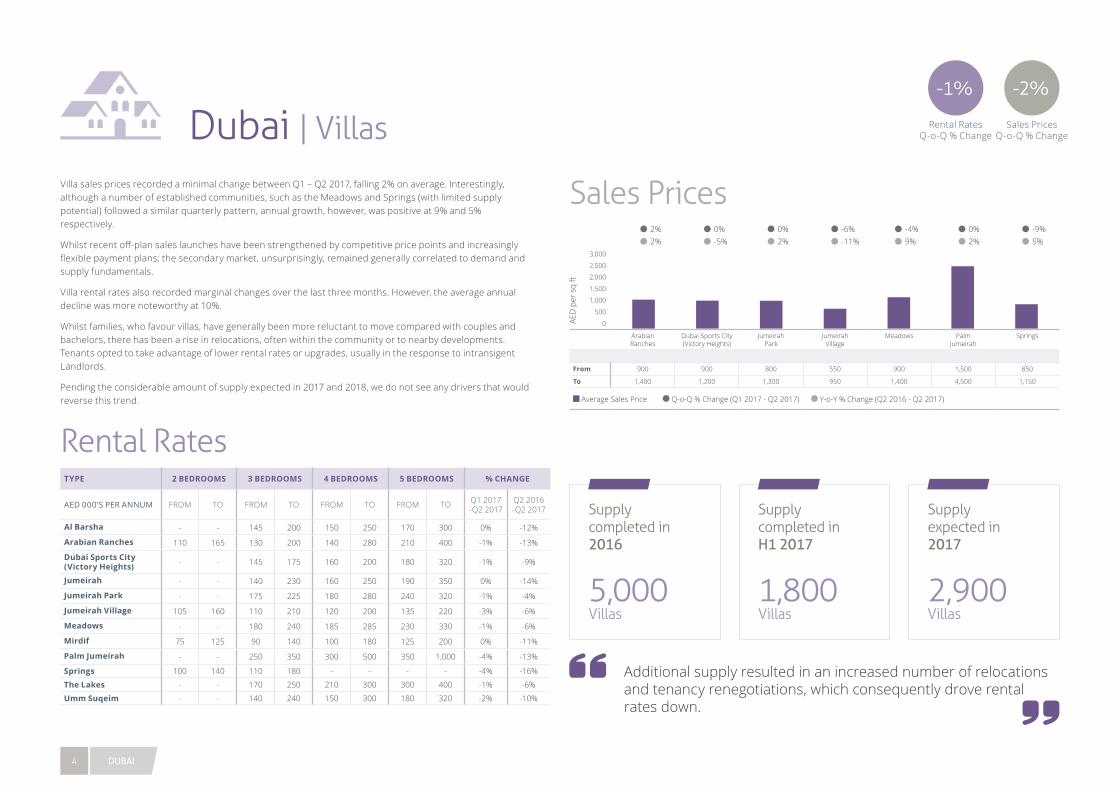
Villa sales prices recorded a minimal change between Q1 – Q2 2017, falling 2% on average. Interestingly, although a number of established communities, such as the Meadows and Springs (with limited supply potential) followed a similar quarterly pattern, annual growth, however, was positive at 9% and 5% respectively.
Whilstrecentoff-plansaleslauncheshavebeenstrengthenedbycompetitivepricepointsandincreasinglyflexiblepaymentplans;thesecondarymarket,unsurprisingly,remainedgenerallycorrelatedtodemandandsupply fundamentals.
Villa rental rates also recorded marginal changes over the last three months. However, the average annual decline was more noteworthy at 10%.
Whilst families, who favour villas, have generally been more reluctant to move compared with couples and bachelors, there has been a rise in relocations, often within the community or to nearby developments. Tenants opted to take advantage of lower rental rates or upgrades, usually in the response to intransigent Landlords.
Pending the considerable amount of supply expected in 2017 and 2018, we do not see any drivers that would reverse this trend.
TYPE 2 BEDROOMS 3 BEDROOMS 4 BEDROOMS 5 BEDROOMS % CHANGE
AED 000’S PER ANNUM FROM TO FROM TO FROM TO FROM TO Q1 2017 -Q2 2017
Q2 2016 -Q2 2017
Al Barsha - - 145 200 150 250 170 300 0% -12%
Arabian Ranches 110 165 130 200 140 280 210 400 -1% -13%
Dubai Sports City (Victory Heights) - - 145 175 160 200 180 320 -1% -9%
Jumeirah - - 140 230 160 250 190 350 0% -14%
Jumeirah Park - - 175 225 180 280 240 320 -1% -4%
Jumeirah Village 105 160 110 210 120 200 135 220 -3% -6%
Meadows - - 180 240 185 285 230 330 -1% -6%
Mirdif 75 125 90 140 100 180 125 200 0% -11%
Palm Jumeirah - - 250 350 300 500 350 1,000 -4% -13%
Springs 100 140 110 180 - - - - -4% -16%
The Lakes - - 170 250 210 300 300 400 -1% -6%
Umm Suqeim - - 140 240 150 300 180 320 -2% -10%
Rental Rates
-2%-1%
Sales Prices Q-o-Q % Change
Rental Rates Q-o-Q % Change
Sales Prices
AED
per
sq
ft
3,000
2,500
2,000
1,500
1,000
500
0
0%-5%
0%2%
-6%-11%
-4%9%
0%2%
-9%5%
2%2%
ArabianRanches
Dubai Sports City (Victory Heights)
JumeirahPark
JumeirahVillage
Meadows PalmJumeirah
Springs
From 900 900 800 550 900 1,500 850
To 1,400 1,200 1,300 950 1,400 4,500 1,150
Average Sales Price Q-o-Q % Change (Q1 2017 - Q2 2017) Y-o-Y % Change (Q2 2016 - Q2 2017)
Supply completed in 2016
5,000Villas
Supply completed in H1 2017
1,800Villas
Supply expected in 2017
2,900Villas
Additional supply resulted in an increased number of relocations and tenancy renegotiations, which consequently drove rental rates down.
© Asteco Property Management, 2017 5
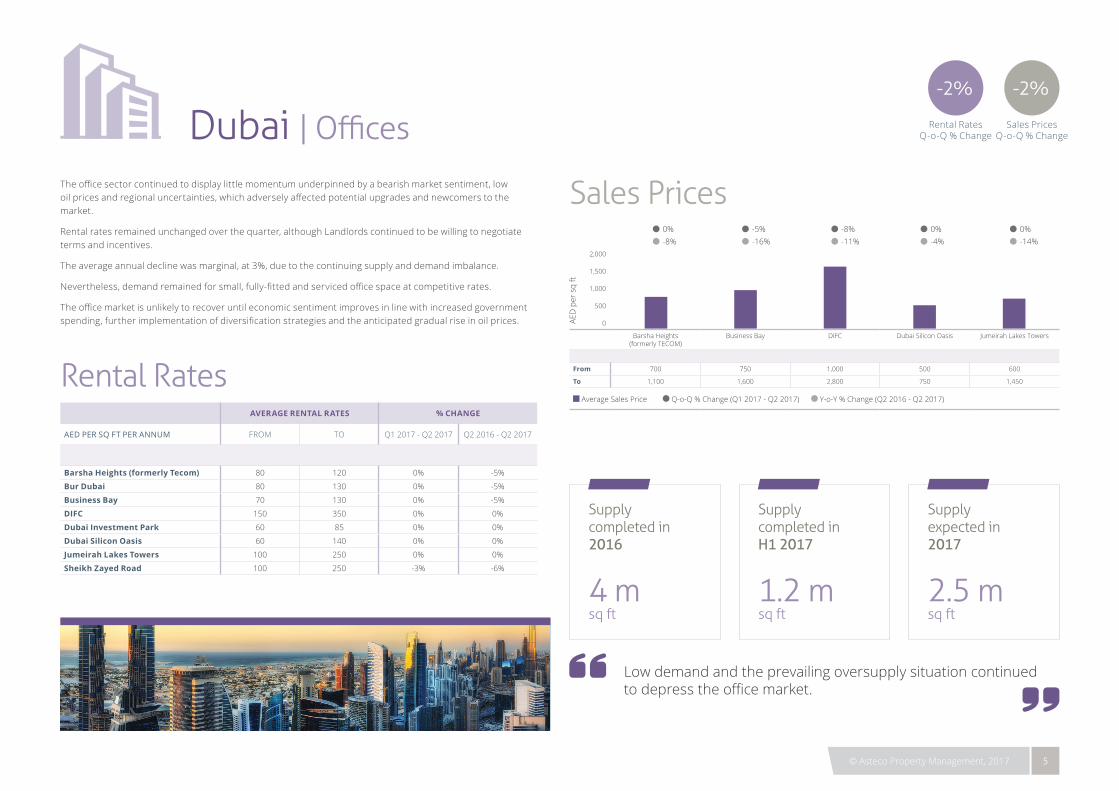
Theofficesectorcontinuedtodisplaylittlemomentumunderpinnedbyabearishmarketsentiment,lowoilpricesandregionaluncertainties,whichadverselyaffectedpotentialupgradesandnewcomerstothemarket.
Rental rates remained unchanged over the quarter, although Landlords continued to be willing to negotiate terms and incentives.
The average annual decline was marginal, at 3%, due to the continuing supply and demand imbalance.
Nevertheless,demandremainedforsmall,fully-fittedandservicedofficespaceatcompetitiverates.
Theofficemarketisunlikelytorecoveruntileconomicsentimentimprovesinlinewithincreasedgovernmentspending,furtherimplementationofdiversificationstrategiesandtheanticipatedgradualriseinoilprices.
Rental RatesAVERAGE RENTAL RATES % CHANGE
AED PER SQ FT PER ANNUM FROM TO Q1 2017 - Q2 2017 Q2 2016 - Q2 2017
Barsha Heights (formerly Tecom) 80 120 0% -5%
Bur Dubai 80 130 0% -5%
Business Bay 70 130 0% -5%
DIFC 150 350 0% 0%
Dubai Investment Park 60 85 0% 0%
Dubai Silicon Oasis 60 140 0% 0%
Jumeirah Lakes Towers 100 250 0% 0%
Sheikh Zayed Road 100 250 -3% -6%
-2%-2%
Sales Prices Q-o-Q % Change
Rental Rates Q-o-Q % ChangeDubai | Offices
Sales Prices
AED
per
sq
ft
2,000
1,500
1,000
500
0
-5%-16%
-8%-11%
0%-4%
0%-14%
0%-8%
Barsha Heights (formerly TECOM)
Business Bay DIFC Dubai Silicon Oasis Jumeirah Lakes Towers
From 700 750 1,000 500 600
To 1,100 1,600 2,800 750 1,450
Average Sales Price Q-o-Q % Change (Q1 2017 - Q2 2017) Y-o-Y % Change (Q2 2016 - Q2 2017)
Supply completed in 2016
4 msq ft
Supply completed in H1 2017
1.2 msq ft
Supply expected in 2017
2.5 msq ft
Low demand and the prevailing oversupply situation continued todepresstheofficemarket.

DISCLAIMER:TheinformationcontainedinthisreporthasbeenobtainedfromandisbaseduponsourcesthatAstecoPropertyManagementbelievestobereliable;however,nowarrantyorrepresentation,expressedorimplied,ismadetothe accuracy or completeness of the information contained herein, and same is submitted subject to errors, omissions, change of price, rental or other conditions, withdrawal without notice, and to any special listing conditions imposed by our principals. Asteco Property Management will not be held responsible for any third-party contributions. All opinions and estimates included in this report constitute Asteco Property Management’s judgment, as of the date of this report and are subject to change without notice. Figures contained in this report are derived from a basket of locations highlighted in this report and therefore represent a snapshot of the UAE market. Averages, however, represent a wider range of areas. Particularly exclusive or unique projects have been excluded from the data to avoid distorting averages. Due care and attention has been used in the preparation of forecast information. However, actual results may vary from forecasts and any variation may be materially positive or negative. Forecasts, by their very nature, involve risk and uncertainty because they relate to future events and circumstances which are beyond Asteco Property Management’s control. For a full in-depth study of the market, please contact Asteco Property Management’s Research team. Asteco Property Management LLC. Commercial License No. 218551. Paid-up Capital AED 4,000,000. | ORN 180
Dubai Real Estate ReportQ2 2017