Prompt Oil Price ($/bbl) $60.20 $2.86 5.0% Prompt Gas ... · 7/15/2019 · 1 July 15, 2019...
15
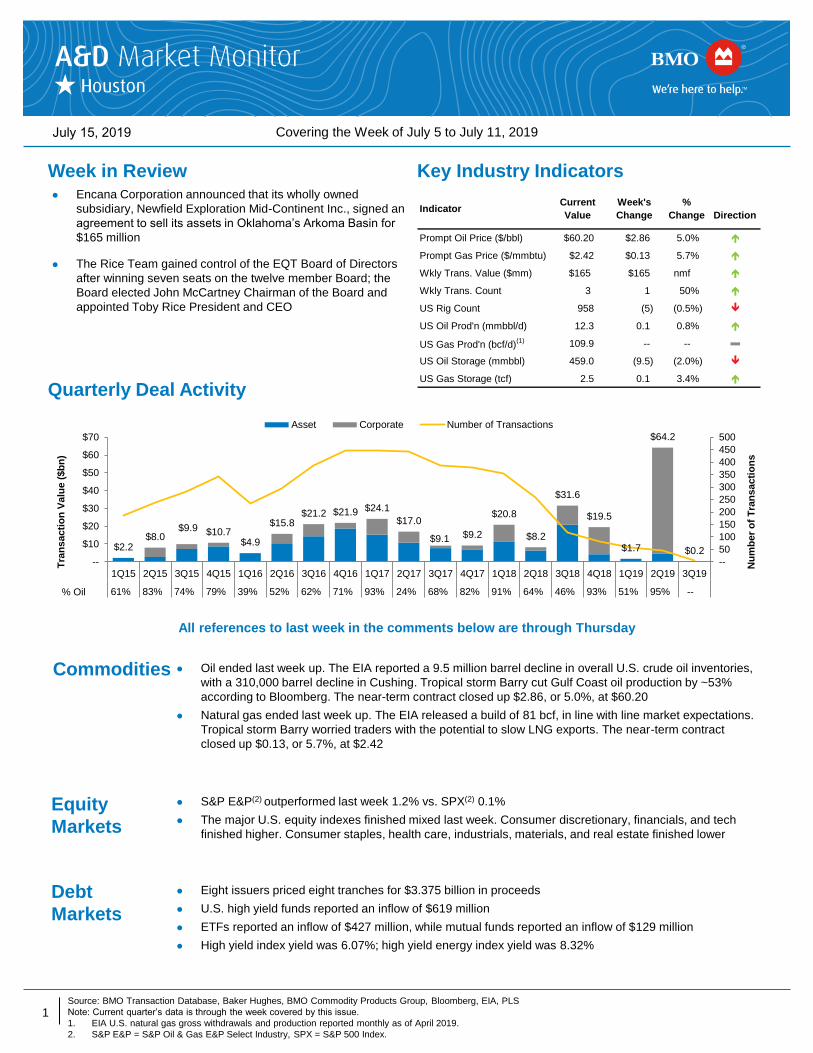
1 July 15, 2019 Indicator Current Value Week's Change % Change Direction Prompt Oil Price ($/bbl) $60.20 $2.86 5.0% Prompt Gas Price ($/mmbtu) $2.42 $0.13 5.7% Wkly Trans. Value ($mm) $165 $165 nmf Wkly Trans. Count 3 1 50% US Rig Count 958 (5) (0.5%) US Oil Prod'n (mmbbl/d) 12.3 0.1 0.8% US Gas Prod'n (bcf/d) (1) 109.9 -- -- US Oil Storage (mmbbl) 459.0 (9.5) (2.0%) US Gas Storage (tcf) 2.5 0.1 3.4% $2.2 $8.0 $9.9 $10.7 $4.9 $15.8 $21.2 $21.9 $24.1 $17.0 $9.1 $9.2 $20.8 $8.2 $31.6 $19.5 $1.7 $64.2 $0.2 -- 50 100 150 200 250 300 350 400 450 500 -- $10 $20 $30 $40 $50 $60 $70 1Q15 2Q15 3Q15 4Q15 1Q16 2Q16 3Q16 4Q16 1Q17 2Q17 3Q17 4Q17 1Q18 2Q18 3Q18 4Q18 1Q19 2Q19 3Q19 61% 83% 74% 79% 39% 52% 62% 71% 93% 24% 68% 82% 91% 64% 46% 93% 51% 95% -- Number of Transactions Transaction Value ($bn) Asset Corporate Number of Transactions % Oil Debt Markets Eight issuers priced eight tranches for $3.375 billion in proceeds U.S. high yield funds reported an inflow of $619 million ETFs reported an inflow of $427 million, while mutual funds reported an inflow of $129 million High yield index yield was 6.07%; high yield energy index yield was 8.32% Source: BMO Transaction Database, Baker Hughes, BMO Commodity Products Group, Bloomberg, EIA, PLS Note: Current quarter’s data is through the week covered by this issue. 1. EIA U.S. natural gas gross withdrawals and production reported monthly as of April 2019. 2. S&P E&P = S&P Oil & Gas E&P Select Industry, SPX = S&P 500 Index. Key Industry Indicators Quarterly Deal Activity S&P E&P (2) outperformed last week 1.2% vs. SPX (2) 0.1% The major U.S. equity indexes finished mixed last week. Consumer discretionary, financials, and tech finished higher. Consumer staples, health care, industrials, materials, and real estate finished lower Equity Markets Oil ended last week up. The EIA reported a 9.5 million barrel decline in overall U.S. crude oil inventories, with a 310,000 barrel decline in Cushing. Tropical storm Barry cut Gulf Coast oil production by ~53% according to Bloomberg. The near-term contract closed up $2.86, or 5.0%, at $60.20 Natural gas ended last week up. The EIA released a build of 81 bcf, in line with line market expectations. Tropical storm Barry worried traders with the potential to slow LNG exports. The near-term contract closed up $0.13, or 5.7%, at $2.42 Commodities Week in Review Covering the Week of July 5 to July 11, 2019 Encana Corporation announced that its wholly owned subsidiary, Newfield Exploration Mid-Continent Inc., signed an agreement to sell its assets in Oklahoma’s Arkoma Basin for $165 million The Rice Team gained control of the EQT Board of Directors after winning seven seats on the twelve member Board; the Board elected John McCartney Chairman of the Board and appointed Toby Rice President and CEO All references to last week in the comments below are through Thursday
Transcript of Prompt Oil Price ($/bbl) $60.20 $2.86 5.0% Prompt Gas ... · 7/15/2019 · 1 July 15, 2019...
1
July 15, 2019
IndicatorCurrent
Value
Week's
Change
%
Change Direction
Prompt Oil Price ($/bbl) $60.20 $2.86 5.0%
Prompt Gas Price ($/mmbtu) $2.42 $0.13 5.7%
Wkly Trans. Value ($mm) $165 $165 nmf
Wkly Trans. Count 3 1 50%
US Rig Count 958 (5) (0.5%)
US Oil Prod'n (mmbbl/d) 12.3 0.1 0.8%
US Gas Prod'n (bcf/d)(1) 109.9 -- --
US Oil Storage (mmbbl) 459.0 (9.5) (2.0%)
US Gas Storage (tcf) 2.5 0.1 3.4%
$2.2 $8.0
$9.9 $10.7 $4.9
$15.8 $21.2 $21.9 $24.1
$17.0
$9.1 $9.2
$20.8
$8.2
$31.6
$19.5
$1.7
$64.2
$0.2 --
50
100
150
200
250
300
350
400
450
500
--
$10
$20
$30
$40
$50
$60
$70
1Q15 2Q15 3Q15 4Q15 1Q16 2Q16 3Q16 4Q16 1Q17 2Q17 3Q17 4Q17 1Q18 2Q18 3Q18 4Q18 1Q19 2Q19 3Q19
61% 83% 74% 79% 39% 52% 62% 71% 93% 24% 68% 82% 91% 64% 46% 93% 51% 95% --
Nu
mb
er
of
Tra
ns
acti
on
s
Tra
ns
acti
on
Valu
e (
$b
n)
Asset Corporate Number of Transactions
% Oil
Debt
Markets
Eight issuers priced eight tranches for $3.375 billion in proceeds
U.S. high yield funds reported an inflow of $619 million
ETFs reported an inflow of $427 million, while mutual funds reported an inflow of $129 million
High yield index yield was 6.07%; high yield energy index yield was 8.32%
Source: BMO Transaction Database, Baker Hughes, BMO Commodity Products Group, Bloomberg, EIA, PLS
Note: Current quarter’s data is through the week covered by this issue.
1. EIA U.S. natural gas gross withdrawals and production reported monthly as of April 2019.
2. S&P E&P = S&P Oil & Gas E&P Select Industry, SPX = S&P 500 Index.
Key Industry Indicators
Quarterly Deal Activity
S&P E&P(2) outperformed last week 1.2% vs. SPX(2) 0.1%
The major U.S. equity indexes finished mixed last week. Consumer discretionary, financials, and tech
finished higher. Consumer staples, health care, industrials, materials, and real estate finished lower
Equity
Markets
Oil ended last week up. The EIA reported a 9.5 million barrel decline in overall U.S. crude oil inventories,
with a 310,000 barrel decline in Cushing. Tropical storm Barry cut Gulf Coast oil production by ~53%
according to Bloomberg. The near-term contract closed up $2.86, or 5.0%, at $60.20
Natural gas ended last week up. The EIA released a build of 81 bcf, in line with line market expectations.
Tropical storm Barry worried traders with the potential to slow LNG exports. The near-term contract
closed up $0.13, or 5.7%, at $2.42
Commodities
Week in Review
Let’s follow these guidelines when sorting articles:
• First priority: Domestic A&D, ranked by size
• Next: Domestic M&A
• Then: US companies doing international deals (like
Noble’s Tamar)
• Then: Others (Cabot’s Lackawanna)
• Then: Prices, rig count, completions, etc.
To paste the arrows with colors,
• FactSet
• Settings
• Presentation Linking and Formatting
• Import
• Colors
• Change Color Font Covering the Week of July 5 to July 11, 2019
[TBU]
[TBU]
[TBU]
[TBU]
[TBU] [TBU]
This is the final issue for 2018. The Market Monitor will
return on Monday, January 7th. Happy Holidays from the
BMO Capital Markets team!
The October issue of BMO Calgary’s A&D (Canadian) Market
Monitor went live last week – read more here
Encana Corporation announced that its wholly owned
subsidiary, Newfield Exploration Mid-Continent Inc., signed an
agreement to sell its assets in Oklahoma’s Arkoma Basin for
$165 million
The Rice Team gained control of the EQT Board of Directors
after winning seven seats on the twelve member Board; the
Board elected John McCartney Chairman of the Board and
appointed Toby Rice President and CEO
All references to last week in the comments below are through Thursday
Persistent tensions in Iran continued alongside the OPEC decision to extend output cuts
through Q1 2020. Gibraltar's government said that it is extending the detention of the Iranian
supertanker seized after obtaining an order from the British territory's Supreme Court. A
former senior Iranian commander then threatened to seize a British ship in retaliation for the
capture of an Iranian oil tanker. BP idled a tanker off the coast of Saudi Arabia that was
scheduled to pick up crude in Iraq due to these threats of retaliation. Sanctions continued to
take their toll on Iran, with output there now at its lowest since 1986. Iran also breached
enrichment limits.
Weather forecasts continued to shift warmer in the Midwest and Northeast. The potential
formation of Tropical Storm Barry in the Gulf of Mexico was monitored as it might impact
GOM supply and LNG facilities
[TBU]
2
July 15, 2019
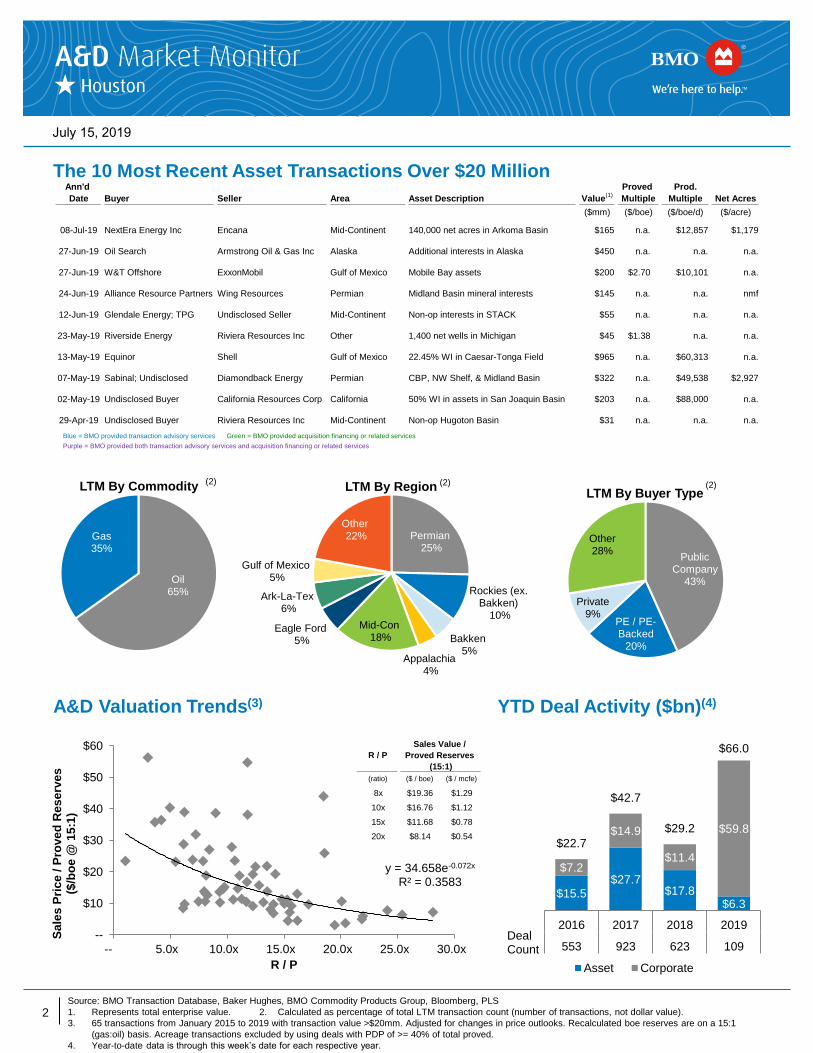
Permian25%
Rockies (ex. Bakken)
10%
Bakken5%
Appalachia4%
Mid-Con18%
Eagle Ford5%
Ark-La-Tex6%
Gulf of Mexico5%
Other22%
LTM By Region
Public Company
43%
PE / PE-Backed
20%
Private9%
Other28%
LTM By Buyer Type
R / P
Sales Value /
Proved Reserves
(15:1)
(ratio) ($ / boe) ($ / mcfe)
8x $19.36 $1.29
10x $16.76 $1.12
15x $11.68 $0.78
20x $8.14 $0.54
y = 34.658e-0.072x
R² = 0.3583
--
$10
$20
$30
$40
$50
$60
-- 5.0x 10.0x 15.0x 20.0x 25.0x 30.0x
Sa
les
Pri
ce
/ P
rove
d R
es
erv
es
($
/bo
e @
15
:1)
R / P
Oil65%
Gas35%
LTM By Commodity
Ann'd
Date Buyer Seller Area Asset Description Value(1)
Proved
Multiple
Prod.
Multiple Net Acres
($mm) ($/boe) ($/boe/d) ($/acre)
08-Jul-19 NextEra Energy Inc Encana Mid-Continent 140,000 net acres in Arkoma Basin $165 n.a. $12,857 $1,179
27-Jun-19 Oil Search Armstrong Oil & Gas Inc Alaska Additional interests in Alaska $450 n.a. n.a. n.a.
27-Jun-19 W&T Offshore ExxonMobil Gulf of Mexico Mobile Bay assets $200 $2.70 $10,101 n.a.
24-Jun-19 Alliance Resource Partners Wing Resources Permian Midland Basin mineral interests $145 n.a. n.a. nmf
12-Jun-19 Glendale Energy; TPG Undisclosed Seller Mid-Continent Non-op interests in STACK $55 n.a. n.a. n.a.
23-May-19 Riverside Energy Riviera Resources Inc Other 1,400 net wells in Michigan $45 $1.38 n.a. n.a.
13-May-19 Equinor Shell Gulf of Mexico 22.45% WI in Caesar-Tonga Field $965 n.a. $60,313 n.a.
07-May-19 Sabinal; Undisclosed Diamondback Energy Permian CBP, NW Shelf, & Midland Basin $322 n.a. $49,538 $2,927
02-May-19 Undisclosed Buyer California Resources Corp California 50% WI in assets in San Joaquin Basin $203 n.a. $88,000 n.a.
29-Apr-19 Undisclosed Buyer Riviera Resources Inc Mid-Continent Non-op Hugoton Basin $31 n.a. n.a. n.a.
Blue = BMO provided transaction advisory services Green = BMO provided acquisition financing or related services
Purple = BMO provided both transaction advisory services and acquisition financing or related services
The 10 Most Recent Asset Transactions Over $20 Million
A&D Valuation Trends(3)
Source: BMO Transaction Database, Baker Hughes, BMO Commodity Products Group, Bloomberg, PLS
1. Represents total enterprise value. 2. Calculated as percentage of total LTM transaction count (number of transactions, not dollar value).
3. 65 transactions from January 2015 to 2019 with transaction value >$20mm. Adjusted for changes in price outlooks. Recalculated boe reserves are on a 15:1
(gas:oil) basis. Acreage transactions excluded by using deals with PDP of >= 40% of total proved.
4. Year-to-date data is through this week’s date for each respective year.
(2) (2) (2)
Confirm number of transactions weekly --->
[TBU]
[TBU]
[TBU]
YTD Deal Activity ($bn)(4)
$15.5 $27.7
$17.8 $6.3
$7.2
$14.9
$11.4
$59.8
$22.7
$42.7
$29.2
$66.0
2016 2017 2018 2019
553 923 623 109
Asset Corporate
Deal Count

3
July 15, 2019
Select Significant Deals on the Market
Disclaimer: The foregoing links are for convenience only and relate to materials that were not prepared or reviewed by BMO Capital Markets. BMO Capital Markets takes
no responsibility for and makes no representations with respect to the contents thereof. These materials may be inconsistent with the views of BMO Capital Markets.
Source of Select Significant Deals on the Market: BMO Transaction Database
Source of Headlines: Press releases
Industry Headlines
Appalachia
1 Deals
Mid-Con
6 Deals
Eagle Ford
9 Deals
Permian
16 Deals
Other
12 Deals
Rockies
5 Deals
(Click headline to link to the full article)
M&A&D Headlines
Bakken
5 Deals
Ark-La-Tex
5 Deals
BMO Deals (Status)
Enerplus Elm Coulee (In Market) – See page 6
U.S. Surpasses 12 Million Barrels a Day, EIA Reports
Tropical Storm Races Toward Louisiana, Curbing Oil
Output
Russian Output Falls to Three-year Low as Oil Rivals
Clash
Oil Tankers Dodge Top Mideast Refueling Hub After
Ship Attacks
EQT Announces Certified Results of 2019 Annual
Meeting of Shareholders
Encana Signs Agreement to Sell its Arkoma Basin
Natural Gas Assets
Talos Energy Announces Full Year 2019 Operating
and Financial Guidance (includes A&D
announcement)
BMO Deals (Status)
Juno Permian (In Market) – See page 4
Rio Glasscock County (In Market) – See page 5
[TBU]
[TBU] [TBU]
7/10/2019
Appalachia 1
Ark-La-Tex 5
Bakken 5
Eagle Ford 9
Mid-Con 6
Other 12
Permian 16
Rockies 5
59
4
July 15, 2019
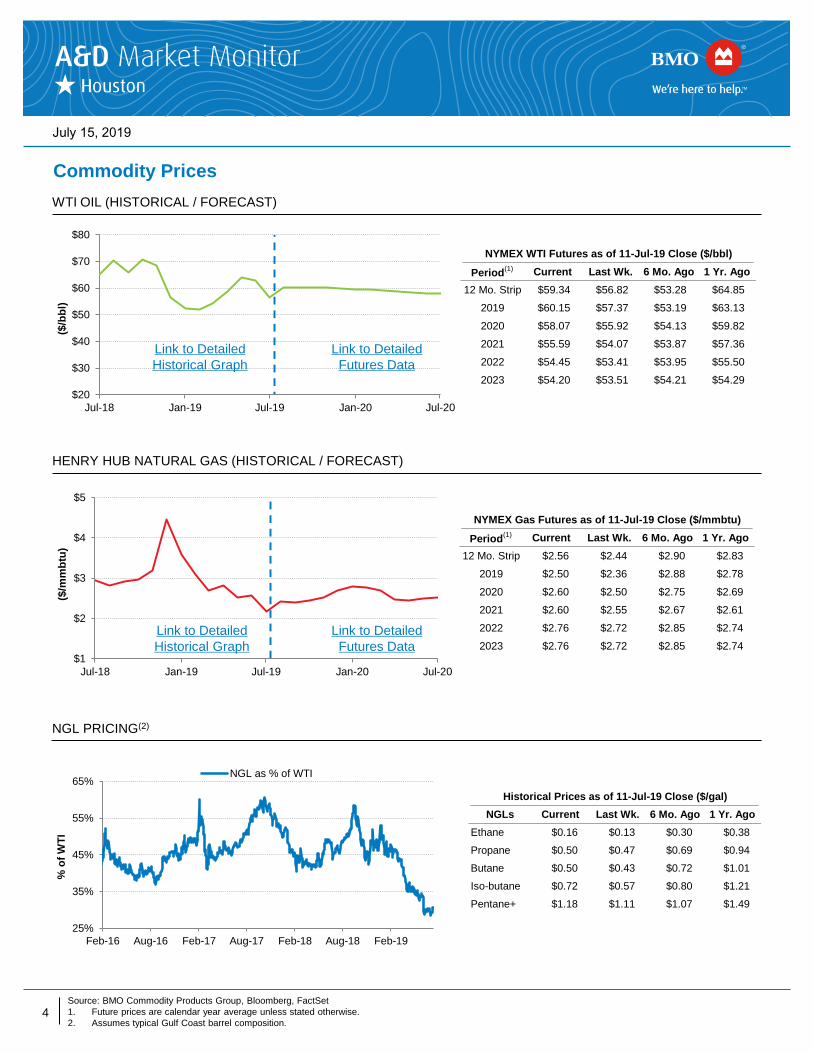
Historical Prices as of 11-Jul-19 Close ($/gal)
NGLs Current Last Wk. 6 Mo. Ago 1 Yr. Ago
Ethane $0.16 $0.13 $0.30 $0.38
Propane $0.50 $0.47 $0.69 $0.94
Butane $0.50 $0.43 $0.72 $1.01
Iso-butane $0.72 $0.57 $0.80 $1.21
Pentane+ $1.18 $1.11 $1.07 $1.49
25%
35%
45%
55%
65%
Feb-16 Aug-16 Feb-17 Aug-17 Feb-18 Aug-18 Feb-19
% o
f W
TI
NGL as % of WTI
$1
$2
$3
$4
$5
Jul-18 Jan-19 Jul-19 Jan-20 Jul-20
($/m
mb
tu)
NYMEX Gas Futures as of 11-Jul-19 Close ($/mmbtu)
Period(1) Current Last Wk. 6 Mo. Ago 1 Yr. Ago
12 Mo. Strip $2.56 $2.44 $2.90 $2.83
2019 $2.50 $2.36 $2.88 $2.78
2020 $2.60 $2.50 $2.75 $2.69
2021 $2.60 $2.55 $2.67 $2.61
2022 $2.76 $2.72 $2.85 $2.74
2023 $2.76 $2.72 $2.85 $2.74
NYMEX WTI Futures as of 11-Jul-19 Close ($/bbl) NYMEX Gas Futures as of 11-Jul-19 Close ($/mmbtu)
Period(1) Current Last Wk. 6 Mo. Ago 1 Yr. Ago
12 Mo. Strip $59.34 $56.82 $53.28 $64.85
2019 $60.15 $57.37 $53.19 $63.13
2020 $58.07 $55.92 $54.13 $59.82
2021 $55.59 $54.07 $53.87 $57.36
2022 $54.45 $53.41 $53.95 $55.50
2023 $54.20 $53.51 $54.21 $54.29
$20
$30
$40
$50
$60
$70
$80
Jul-18 Jan-19 Jul-19 Jan-20 Jul-20
($/b
bl)
NGL PRICING(2)
HENRY HUB NATURAL GAS (HISTORICAL / FORECAST)
Commodity Prices
Source: BMO Commodity Products Group, Bloomberg, FactSet
1. Future prices are calendar year average unless stated otherwise.
2. Assumes typical Gulf Coast barrel composition.
WTI OIL (HISTORICAL / FORECAST)
Links:
http://www.nasdaq.com/markets/crude-oil.aspx
http://www.bloomberg.com/quote/CL1:COM
http://www.nasdaq.com/markets/natural-gas.aspx
http://www.bloomberg.com/quote/NG1:COM
Link to Detailed
Futures Data
Link to Detailed
Historical Graph
Link to Detailed
Futures Data
Link to Detailed
Historical Graph
[TBU]
[TBU]
[TBU]
Historical Prices as of 27-Jun-19 Close ($/gal)
NGLs Current Last Wk. 6 Mo. Ago 1 Yr. Ago
Ethane $0.17 $0.17 $0.29 $0.35
Propane $0.49 $0.46 $0.65 $0.90
Butane $0.46 $0.44 $0.67 $0.99
Iso-butane $0.62 $0.56 $0.75 $1.30
Pentane+ $1.13 $1.12 $0.89 $1.53
NYMEX Gas Futures as of 27-Jun-19 Close ($/mmbtu)
Period(1) Current Last Wk. 6 Mo. Ago 1 Yr. Ago
12 Mo. Strip $2.48 $2.35 $3.06 $2.95
2019 $2.39 $2.24 $3.06 $2.83
2020 $2.55 $2.49 $2.71 $2.69
2021 $2.60 $2.60 $2.61 $2.64
2022 $2.77 $2.77 $2.78 $2.78
2023 $2.77 $2.77 $2.78 $2.78
NYMEX WTI Futures as of 27-Jun-19 Close ($/bbl) NYMEX Gas Futures as of 27-Jun-19 Close ($/mmbtu)
Period(1) Current Last Wk. 6 Mo. Ago 1 Yr. Ago
12 Mo. Strip $58.39 $56.40 $46.30 $67.48
2019 $59.29 $56.92 $46.19 $65.57
2020 $57.10 $55.34 $48.12 $61.72
2021 $54.88 $53.81 $49.41 $59.12
2022 $54.16 $53.38 $50.49 $57.23
2023 $54.22 $53.67 $51.43 $55.85

5
July 15, 2019
Clearbrook
Midland
Cushing
St. James
(LLS)
East Coast
U.S. (Brent)
Midland Sweet-
Sour Spread
EMS
AECO
Northern
California
Sumas
Southern
California
El Paso - SJ
Waha
HSC
Henry Hub
Panhandle
CIG Chicago
Dominion
Transco
NATURAL GAS PRICING & DIFFERENTIALS TO HENRY HUB ($ / MMBTU) – AS OF 11-JUL-19
Commodity Prices (cont’d)
OIL PRICING & DIFFERENTIALS TO CUSHING WTI ($ / BBL) – AS OF 11-JUL-19
Legend
Price
Diff.
Legend
Price
Diff.
Source: BMO Commodity Products Group, Bloomberg
Note: Prices and differentials are for prompt month futures except for Clearbrook which is based on spot prices.
MAPS IN
MASTER VIEW
TBU
[TBU]
[TBU]
$60.20
($0.97) $65.30
$5.10
$2.08
($0.34)
$1.93
($0.49)
$2.42
$2.25
($0.17)
$60.42
$0.22
$66.52
$6.32
$60.30
$0.10
$54.00
($6.20)
$2.15
($0.27)
$2.38
($0.04)
$0.70
($1.72)
$1.76
($0.66)$2.02
($0.40)$2.70
$0.28
$0.90
($1.52)$2.38
($0.04)
$2.88
$0.46

6
July 15, 2019
Item Value Wkly Change Last Week Item Value Wkly Change Last Week
Rig Count 437 (6) 443 Oil Differential ($0.60) ($0.10) ($0.50)
Permitting Activity 104 (70) 174 Gas Differential ($1.73) $0.01 ($1.74)
0%
10%
20%
30%
40%
50%
--
100
200
300
400
500
Jan-15 Jan-16 Jan-17 Jan-18 Jan-19
H V+D % of Total Rigs
--$10,000$20,000$30,000$40,000$50,000$60,000
1Q
15
2Q
15
3Q
15
4Q
15
1Q
16
2Q
16
3Q
16
4Q
16
1Q
17
2Q
17
3Q
17
4Q
17
1Q
18
2Q
18
3Q
18
4Q
18
1Q
19
2Q
19
3Q
19
1 2 8 8 6 6 12 13 15 7 3 2 7 2 5 4 1 2 0
$ /
acre
# Deals
$25,753
--
$50,000
$100,000
$150,000
$200,000
1Q
15
2Q
15
3Q
15
4Q
15
1Q
16
2Q
16
3Q
16
4Q
16
1Q
17
2Q
17
3Q
17
4Q
17
1Q
18
2Q
18
3Q
18
4Q
18
1Q
19
2Q
19
3Q
19
1 2 6 9 5 7 11 9 9 6 1 0 7 2 5 4 1 2 0
$ /
bo
e/d
# Deals
$117,551
-$4.80
-$3.20
-$1.60
$0.00
$1.60
Jan-15 Jan-16 Jan-17 Jan-18 Jan-19
-$18.00
-$12.00
-$6.00
$0.00
$6.00
$ /
mm
btu
$ /
bb
l
Midland Waha
1,148 1,223993
1,212
1,010868
1,247
1,0651,207
1,050
1,256
909
221
Jul-18 Sep-18 Nov-18 Jan-19 Mar-19 May-19 Jul-19
H V+D
5,000
6,000
7,000
8,000
9,000
10,000
11,000
12,000
13,000
14,000
1,000
1,500
2,000
2,500
3,000
3,500
4,000
4,500
Jan-15 Jul-15 Jan-16 Jul-16 Jan-17 Jul-17 Jan-18 Jul-18 Jan-19
mm
cf/
d
mb
bl/
d
Oil Gas
3,895
13,350
Ann'd
Date Buyer Seller Asset Description Value(1)
Proved
Multiple
Prod.
Multiple Net Acres
($mm) ($/boe) ($/boe/d) ($/acre)(2)
24-Jun-19 Alliance Resource Partners Wing Resources Midland Basin mineral interests $145 n.a. n.a. nmf
07-May-19 Sabinal; Undisclosed Diamondback Energy CBP, NW Shelf, & Midland Basin $322 n.a. $49,538 $2,927
08-Apr-19 Sequitur Energy Resources Callon 9,850 net acres in Reagan & Upton, TX $260 n.a. $65,000 $26,396
27-Mar-19 Undisclosed Buyer Rosehill Resources ~880 net acres in Lea Co., NM $22 n.a. n.a. $25,000
26-Feb-19 Ring Energy Inc Wishbone Energy Partners 37,206 net Central Basin Platform acres $300 $8.75 $50,000 $8,063
Mean $210 $8.75 $54,846 $15,597
Median $260 $8.75 $50,000 $16,532
Blue = BMO provided transaction advisory services Green = BMO provided acquisition financing or related services
Purple = BMO provided both transaction advisory services and acquisition financing or related services
GROSS PRODUCTION
TRANSACTION ACTIVITY (EXCLUDES CORPORATE DEALS)
TRANSACTION PRODUCTION MULTIPLES(3) TRANSACTION ADJUSTED NET ACRE MULTIPLES(3,4)
PERMITTING ACTIVITY BY MONTH
DIFFERENTIALS
Permian Snapshot
RIG COUNT
Source: BMO Transaction Database, Baker Hughes, BMO Commodity Products Group, Bloomberg, Drilling Info, PLS
Note: Current quarter’s data is through the week covered by this issue.
1. Represents total enterprise value. Excludes transactions with deal value <$20 million. 2. $/acre multiple not adjusted for value associated with production.
3. Red line denotes average since 01-Jan-17. Calculated as the weighted average of each quarter’s transactions.
4. Production valued at $45,000/boepd in 2014, $30,000/boepd in 2015, $35,000/boepd in 2016 & 2017, and $40,000/boepd in 2018 & 2019.
[TBU]
[TBU]
[TBU] [TBU]
[TBU] [TBU]
[TBU]
7
July 15, 2019
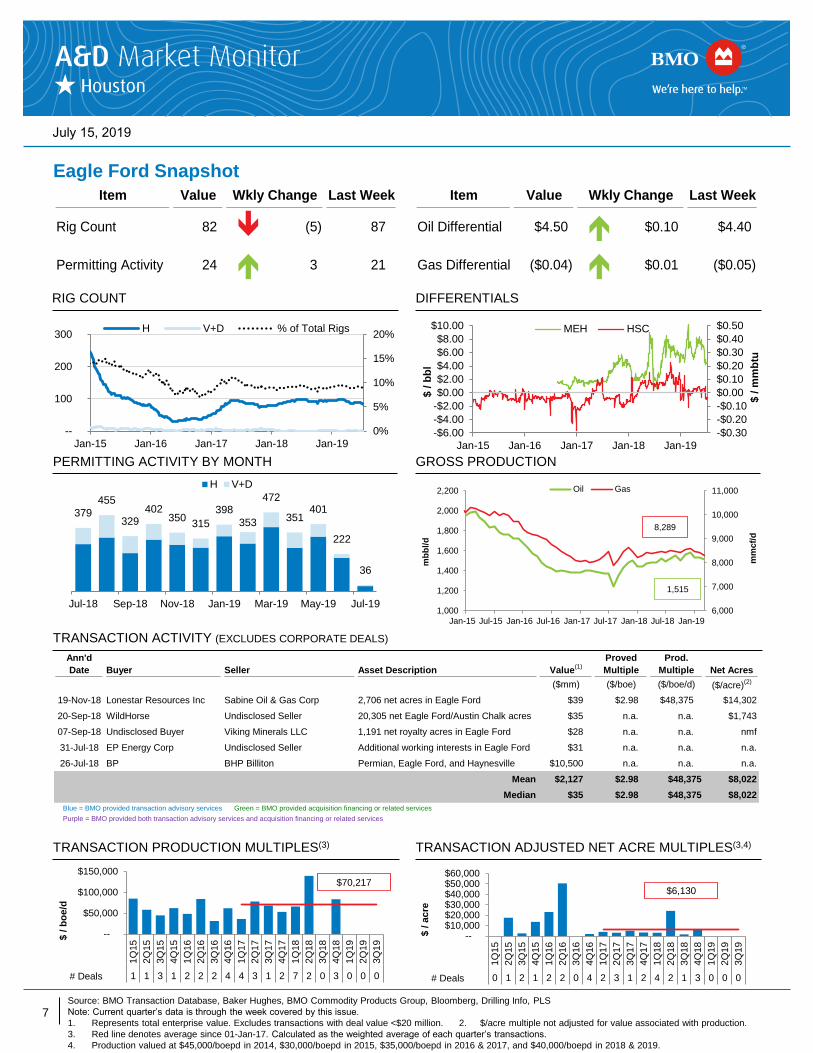
Item Value Wkly Change Last Week Item Value Wkly Change Last Week
Rig Count 82 (5) 87 Oil Differential $4.50 $0.10 $4.40
Permitting Activity 24 3 21 Gas Differential ($0.04) $0.01 ($0.05)
0%
5%
10%
15%
20%
--
100
200
300
Jan-15 Jan-16 Jan-17 Jan-18 Jan-19
H V+D % of Total Rigs
--$10,000$20,000$30,000$40,000$50,000$60,000
1Q
15
2Q
15
3Q
15
4Q
15
1Q
16
2Q
16
3Q
16
4Q
16
1Q
17
2Q
17
3Q
17
4Q
17
1Q
18
2Q
18
3Q
18
4Q
18
1Q
19
2Q
19
3Q
19
0 1 2 1 2 2 0 4 2 3 1 2 4 2 1 3 0 0 0
$ /
acre
# Deals
$6,130
--
$50,000
$100,000
$150,000
1Q
15
2Q
15
3Q
15
4Q
15
1Q
16
2Q
16
3Q
16
4Q
16
1Q
17
2Q
17
3Q
17
4Q
17
1Q
18
2Q
18
3Q
18
4Q
18
1Q
19
2Q
19
3Q
19
1 1 3 1 2 2 2 4 4 3 1 2 7 2 0 3 0 0 0
$ /
bo
e/d
# Deals
$70,217
-$0.30
-$0.20
-$0.10
$0.00
$0.10
$0.20
$0.30
$0.40
$0.50
Jan-15 Jan-16 Jan-17 Jan-18 Jan-19
-$6.00
-$4.00
-$2.00
$0.00
$2.00
$4.00
$6.00
$8.00
$10.00
$ /
mm
btu
$ /
bb
l
MEH HSC
379
455
329402
350315
398
353
472
351401
222
36
Jul-18 Sep-18 Nov-18 Jan-19 Mar-19 May-19 Jul-19
H V+D
6,000
7,000
8,000
9,000
10,000
11,000
1,000
1,200
1,400
1,600
1,800
2,000
2,200
Jan-15 Jul-15 Jan-16 Jul-16 Jan-17 Jul-17 Jan-18 Jul-18 Jan-19
mm
cf/
d
mb
bl/
d
Oil Gas
1,515
8,289
Ann'd
Date Buyer Seller Asset Description Value(1)
Proved
Multiple
Prod.
Multiple Net Acres
($mm) ($/boe) ($/boe/d) ($/acre)(2)
19-Nov-18 Lonestar Resources Inc Sabine Oil & Gas Corp 2,706 net acres in Eagle Ford $39 $2.98 $48,375 $14,302
20-Sep-18 WildHorse Undisclosed Seller 20,305 net Eagle Ford/Austin Chalk acres $35 n.a. n.a. $1,743
07-Sep-18 Undisclosed Buyer Viking Minerals LLC 1,191 net royalty acres in Eagle Ford $28 n.a. n.a. nmf
31-Jul-18 EP Energy Corp Undisclosed Seller Additional working interests in Eagle Ford $31 n.a. n.a. n.a.
26-Jul-18 BP BHP Billiton Permian, Eagle Ford, and Haynesville $10,500 n.a. n.a. n.a.
Mean $2,127 $2.98 $48,375 $8,022
Median $35 $2.98 $48,375 $8,022
Blue = BMO provided transaction advisory services Green = BMO provided acquisition financing or related services
Purple = BMO provided both transaction advisory services and acquisition financing or related services
Eagle Ford Snapshot
TRANSACTION ACTIVITY (EXCLUDES CORPORATE DEALS)
PERMITTING ACTIVITY BY MONTH
DIFFERENTIALS RIG COUNT
Source: BMO Transaction Database, Baker Hughes, BMO Commodity Products Group, Bloomberg, Drilling Info, PLS
Note: Current quarter’s data is through the week covered by this issue.
1. Represents total enterprise value. Excludes transactions with deal value <$20 million. 2. $/acre multiple not adjusted for value associated with production.
3. Red line denotes average since 01-Jan-17. Calculated as the weighted average of each quarter’s transactions.
4. Production valued at $45,000/boepd in 2014, $30,000/boepd in 2015, $35,000/boepd in 2016 & 2017, and $40,000/boepd in 2018 & 2019.
TRANSACTION PRODUCTION MULTIPLES(3) TRANSACTION ADJUSTED NET ACRE MULTIPLES(3,4)
GROSS PRODUCTION

8
July 15, 2019
Item Value Wkly Change Last Week Item Value Wkly Change Last Week
Rig Count 58 1 57 Oil Differential $5.00 $0.30 $4.70
Permitting Activity 9 (9) 18 Gas Differential -- -- --
0%
5%
10%
15%
20%
--
20
40
60
80
Jan-15 Jan-16 Jan-17 Jan-18 Jan-19
H V+D % of Total Rigs
--
$5,000
$10,000
$15,000
$20,000
1Q
15
2Q
15
3Q
15
4Q
15
1Q
16
2Q
16
3Q
16
4Q
16
1Q
17
2Q
17
3Q
17
4Q
17
1Q
18
2Q
18
3Q
18
4Q
18
1Q
19
2Q
19
3Q
19
0 0 3 1 1 2 1 3 0 1 2 0 1 1 1 1 0 1 0
$ /
acre
# Deals
$3,320
--$2,000$4,000$6,000$8,000
$10,000$12,000
1Q
15
2Q
15
3Q
15
4Q
15
1Q
16
2Q
16
3Q
16
4Q
16
1Q
17
2Q
17
3Q
17
4Q
17
1Q
18
2Q
18
3Q
18
4Q
18
1Q
19
2Q
19
3Q
19
0 0 5 1 1 3 2 3 0 2 2 0 1 1 2 1 0 1 0
$ /
mcfe
/d
# Deals
$4,998
--
$2.00
$4.00
$6.00
$8.00
$10.00
Jan-15 Jan-16 Jan-17 Jan-18 Jan-19
--
$2.00
$4.00
$6.00
$8.00
$10.00
$ /
mm
btu
$ /
bb
l
LLS Henry Hub
163 168 177 180
115
105
174
113 116 116132
79
22
Jul-18 Sep-18 Nov-18 Jan-19 Mar-19 May-19 Jul-19
H V+D
5,000
6,000
7,000
8,000
9,000
10,000
11,000
12,000
80
90
100
110
120
130
140
Jan-15 Jul-15 Jan-16 Jul-16 Jan-17 Jul-17 Jan-18 Jul-18 Jan-19
mm
cf/
d
mb
bl/
d
Oil Gas
87
11,226
Ann'd
Date Buyer Seller Asset Description Value(1)
Proved
Multiple
Prod.
Multiple Net Acres
($mm) ($/mcfe) ($/mcfe/d) ($/acre)(2)
19-Dec-18 Comstock Shelby Shale LLC 6,023 net acres in Haynesville $21 n.a. n.a. $3,404
19-Nov-18 Aethon III QEP Resources Inc 49,700 net acres in Haynesville $735 $0.77 $2,475 $14,789
05-Sep-18 Viking Energy Group Multiple Sellers Texas and Louisiana assets $100 n.a. n.a. n.a.
05-Sep-18 Equinor Texegy LLC 60,000 net acres in Austin Chalk $75 n.a. n.a. $1,250
06-Aug-18 Mission Creek Resources Bonanza Creek Energy Inc 11,132 net acres in the Cotton Valley $117 $1.69 $6,500 $10,510
Mean $210 $1.23 $4,487 $7,488
Median $100 $1.23 $4,487 $6,957
Blue = BMO provided transaction advisory services Green = BMO provided acquisition financing or related services
Purple = BMO provided both transaction advisory services and acquisition financing or related services
Ark-La-Tex Snapshot
TRANSACTION ACTIVITY (EXCLUDES CORPORATE DEALS)
PERMITTING ACTIVITY BY MONTH
DIFFERENTIALS RIG COUNT
Source: BMO Transaction Database, Baker Hughes, BMO Commodity Products Group, Bloomberg, Drilling Info, PLS
Note: Current quarter’s data is through the week covered by this issue.
1. Represents total enterprise value. Excludes transactions with deal value <$20 million. 2. $/acre multiple not adjusted for value associated with production.
3. Red line denotes average since 01-Jan-17. Calculated as the weighted average of each quarter’s transactions.
4. Production valued at $3,000/mcfepd in 2014, and $2,000/mcfepd in 2015, 2016, 2017, 2018, and 2019.
TRANSACTION PRODUCTION MULTIPLES(3) TRANSACTION ADJUSTED NET ACRE MULTIPLES(3,4)
GROSS PRODUCTION

9
July 15, 2019
Item Value Wkly Change Last Week Item Value Wkly Change Last Week
Rig Count 77 -- 77 Oil Differential $6.61 $0.13 $6.48
Permitting Activity 11 (70) 81 Gas Differential ($0.19) $0.29 ($0.48)
0%
5%
10%
15%
20%
--
50
100
150
Jan-15 Jan-16 Jan-17 Jan-18 Jan-19
H V+D % of Total Rigs
--$2,000$4,000$6,000$8,000
$10,000$12,000
1Q
15
2Q
15
3Q
15
4Q
15
1Q
16
2Q
16
3Q
16
4Q
16
1Q
17
2Q
17
3Q
17
4Q
17
1Q
18
2Q
18
3Q
18
4Q
18
1Q
19
2Q
19
3Q
19
0 1 0 0 1 2 2 4 2 4 1 3 1 3 2 0 0 0 0
$ /
acre
# Deals
$2,083
--$5,000
$10,000$15,000$20,000$25,000$30,000
1Q
15
2Q
15
3Q
15
4Q
15
1Q
16
2Q
16
3Q
16
4Q
16
1Q
17
2Q
17
3Q
17
4Q
17
1Q
18
2Q
18
3Q
18
4Q
18
1Q
19
2Q
19
3Q
19
0 1 0 0 1 2 2 3 2 5 1 4 3 4 3 1 1 0 0
$ /
mcfe
/d
# Deals
$4,758
-$3.00
-$2.00
-$1.00
$0.00
$1.00
$2.00
$3.00
Jan-15 Jan-16 Jan-17 Jan-18 Jan-19
-$15.00
-$10.00
-$5.00
$0.00
$5.00
$10.00
$15.00
$ /
mm
btu
$ /
bb
l
Brent Dominion
269
493
373 370305
258
397
276
382419
384
255
80
Jul-18 Sep-18 Nov-18 Jan-19 Mar-19 May-19 Jul-19
H V+D
14,000
19,000
24,000
29,000
34,000
50
70
90
110
130
150
Jan-15 Jul-15 Jan-16 Jul-16 Jan-17 Jul-17 Jan-18 Jul-18 Jan-19
mm
cf/
d
mb
bl/
d
Oil Gas
101
30,284
Ann'd
Date Buyer Seller Asset Description Value(1)
Proved
Multiple
Prod.
Multiple Net Acres
($mm) ($/mcfe) ($/mcfe/d) ($/acre)(2)
27-Mar-19 Diversified Gas & Oil HG Energy II LLC Huckleberry assets in Appalachia $400 n.a. $3,227 n.a.
15-Oct-18 Undisclosed Buyer Range Resources Corp Overriding royalty interests in Appalachia $300 n.a. $17,649 nmf
27-Aug-18 PennEnergy Resources Rex Energy Corp 141,026 net acres in PA and OH $601 $0.58 $2,781 $4,258
26-Jul-18 Encino Acquisition Partners Chesapeake 938,000 net acres in the Utica $1,900 $0.66 $2,960 $2,026
29-Jun-18 Ascent Resources LLC Utica Minerals; Undisclosed 35,400 acres in the Utica $700 n.a. $15,217 $19,774
Mean $780 $0.62 $8,367 $8,686
Median $601 $0.62 $3,227 $4,258
Blue = BMO provided transaction advisory services Green = BMO provided acquisition financing or related services
Purple = BMO provided both transaction advisory services and acquisition financing or related services
Appalachia Snapshot
TRANSACTION ACTIVITY (EXCLUDES CORPORATE DEALS)
PERMITTING ACTIVITY BY MONTH
DIFFERENTIALS RIG COUNT
Source: BMO Transaction Database, Baker Hughes, BMO Commodity Products Group, Bloomberg, Drilling Info, PLS
Note: Current quarter’s data is through the week covered by this issue.
1. Represents total enterprise value. Excludes transactions with deal value <$20 million. 2. $/acre multiple not adjusted for value associated with production.
3. Red line denotes average since 01-Jan-17. Calculated as the weighted average of each quarter’s transactions.
4. Production valued at $3,000/mcfepd in 2014, and $2,000/mcfepd in 2015, 2016, 2017, 2018, and 2019.
TRANSACTION PRODUCTION MULTIPLES(3) TRANSACTION ADJUSTED NET ACRE MULTIPLES(3,4)
GROSS PRODUCTION

10
July 15, 2019
Item Value Wkly Change Last Week Item Value Wkly Change Last Week
Rig Count 55 -- 55 Oil Differential $0.10 $0.10 --
Permitting Activity 20 (20) 40 Gas Differential ($0.49) $0.03 ($0.53)
0%
5%
10%
15%
20%
--
50
100
150
200
Jan-15 Jan-16 Jan-17 Jan-18 Jan-19
H V+D % of Total Rigs
--
$5,000
$10,000
$15,000
$20,000
$25,000
1Q
15
2Q
15
3Q
15
4Q
15
1Q
16
2Q
16
3Q
16
4Q
16
1Q
17
2Q
17
3Q
17
4Q
17
1Q
18
2Q
18
3Q
18
4Q
18
1Q
19
2Q
19
3Q
19
0 0 1 2 0 0 2 3 1 0 3 2 0 5 2 0 0 1 0
$ /
acre
# Deals
$2,702
--
$20,000
$40,000
$60,000
$80,000
1Q
15
2Q
15
3Q
15
4Q
15
1Q
16
2Q
16
3Q
16
4Q
16
1Q
17
2Q
17
3Q
17
4Q
17
1Q
18
2Q
18
3Q
18
4Q
18
1Q
19
2Q
19
3Q
19
0 1 1 4 0 2 3 3 0 1 3 3 0 6 3 0 0 1 0
$ /
bo
e/d
# Deals
$43,737
-$1.00
-$0.50
$0.00
$0.50
Jan-15 Jan-16 Jan-17 Jan-18 Jan-19
-$20.00
-$10.00
$0.00
$10.00
$ /
mm
btu
$ /
bb
l
Clearbrook CIG
171 164
127
201
128
96
133114
144 138 145 144
43
Jul-18 Sep-18 Nov-18 Jan-19 Mar-19 May-19 Jul-19
H V+D
1,100
1,300
1,500
1,700
1,900
2,100
2,300
2,500
2,700
2,900
800
900
1,000
1,100
1,200
1,300
1,400
1,500
Jan-15 Jul-15 Jan-16 Jul-16 Jan-17 Jul-17 Jan-18 Jul-18 Jan-19
mm
cf/
d
mb
bl/
d
Oil Gas
1,385
2,884
Ann'd
Date Buyer Seller Asset Description Value(1)
Proved
Multiple
Prod.
Multiple Net Acres
($mm) ($/boe) ($/boe/d) ($/acre)(2)
22-Apr-19 Northern Oil and Gas Flywheel Energy LLC 18,000 net acres in Williston Basin $310 n.a. $47,014 $17,238
31-Jul-18 Northern Oil and Gas W Energy Partners 10,600 net acres in Williston Basin $288 n.a. $42,708 $27,196
18-Jul-18 Northern Oil and Gas Pivotal Petroleum Partners LP Producing assets in Williston Basin $152 n.a. $37,032 n.a.
12-Jul-18 PetroShale Inc Slawson Exploration Co 1,981 net acres in Williston Basin $55 $6.04 $100,000 $27,764
06-Jul-18 Energy Resources 12 LP Bruin E&P Partners LLC 2.8% non-operated WI in Bakken assets $83 n.a. n.a. n.a.
Mean $178 $6.04 $56,688 $24,066
Median $152 $6.04 $44,861 $27,196
Blue = BMO provided transaction advisory services Green = BMO provided acquisition financing or related services
Purple = BMO provided both transaction advisory services and acquisition financing or related services
Bakken Snapshot
TRANSACTION ACTIVITY (EXCLUDES CORPORATE DEALS)
PERMITTING ACTIVITY BY MONTH
DIFFERENTIALS RIG COUNT
Source: BMO Transaction Database, Baker Hughes, BMO Commodity Products Group, Bloomberg, Drilling Info, PLS
Note: Current quarter’s data is through the week covered by this issue.
1. Represents total enterprise value. Excludes transactions with deal value <$20 million. 2. $/acre multiple not adjusted for value associated with production.
3. Red line denotes average since 01-Jan-17. Calculated as the weighted average of each quarter’s transactions.
4. Production valued at $45,000/boepd in 2014, $30,000/boepd in 2015, $35,000/boepd in 2016 & 2017, and $40,000/boepd in 2018 & 2019.
TRANSACTION PRODUCTION MULTIPLES(3) TRANSACTION ADJUSTED NET ACRE MULTIPLES(3,4)
GROSS PRODUCTION

11
July 15, 2019
Item Value Wkly Change Last Week Item Value Wkly Change Last Week
Rig Count 71 2 69 Oil Differential $0.10 $0.10 --
Permitting Activity 14 (41) 55 Gas Differential ($0.49) $0.03 ($0.53)
0%
5%
10%
15%
20%
--
50
100
150
Jan-15 Jan-16 Jan-17 Jan-18 Jan-19
H V+D % of Total Rigs
--
$5,000
$10,000
$15,000
$20,000
1Q
15
2Q
15
3Q
15
4Q
15
1Q
16
2Q
16
3Q
16
4Q
16
1Q
17
2Q
17
3Q
17
4Q
17
1Q
18
2Q
18
3Q
18
4Q
18
1Q
19
2Q
19
3Q
19
0 0 3 3 0 1 1 0 1 0 1 5 2 0 2 1 0 0 0
$ /
acre
# Deals
$4,655
--$20,000$40,000$60,000$80,000
$100,000$120,000
1Q
15
2Q
15
3Q
15
4Q
15
1Q
16
2Q
16
3Q
16
4Q
16
1Q
17
2Q
17
3Q
17
4Q
17
1Q
18
2Q
18
3Q
18
4Q
18
1Q
19
2Q
19
3Q
19
2 0 4 4 1 6 2 0 1 6 3 9 3 1 3 1 1 0 0
$ /
bo
e/d
# Deals
$37,548
-$1.00
-$0.50
$0.00
$0.50
Jan-15 Jan-16 Jan-17 Jan-18 Jan-19
-$20.00
-$10.00
$0.00
$10.00
$ /
mm
btu
$ /
bb
l
Clearbrook CIG
683
526 512
689
829 812
352402
494
328
164 14057
Jul-18 Sep-18 Nov-18 Jan-19 Mar-19 May-19 Jul-19
H V+D
11,500
12,000
12,500
13,000
13,500
14,000
400
500
600
700
800
900
Jan-15 Jul-15 Jan-16 Jul-16 Jan-17 Jul-17 Jan-18 Jul-18 Jan-19
mm
cf/
d
mb
bl/
d
Oil Gas
765
12,587
Ann'd
Date Buyer Seller Asset Description Value(1)
Proved
Multiple
Prod.
Multiple Net Acres
($mm) ($/boe) ($/boe/d) ($/acre)(2)
14-Feb-19 Undisclosed Buyer Harvest Oil & Gas Corp San Juan Basin assets $43 $1.57 $10,835 n.a.
31-Jan-19 Undisclosed Buyer Extraction Oil & Gas 5,000 net acres in Powder River $22 n.a. n.a. $4,480
01-Oct-18 DJR Energy LLC Encana 182,000 net acres in San Juan Basin $480 n.a. $88,889 $2,637
28-Aug-18 Vermilion Energy Inc Massif Oil & Gas LLC 55,000 acres in Powder River Basin $150 n.a. $56,604 $2,727
28-Aug-18 Rebellion Energy II LLC Liberty Resources II LLC 19,000 net acres in Powder River Basin $100 n.a. n.a. $5,263
Mean $159 $1.57 $52,109 $3,777
Median $100 $1.57 $56,604 $3,604
Blue = BMO provided transaction advisory services Green = BMO provided acquisition financing or related services
Purple = BMO provided both transaction advisory services and acquisition financing or related services
TRANSACTION ACTIVITY (EXCLUDES CORPORATE DEALS)
PERMITTING ACTIVITY BY MONTH
DIFFERENTIALS
Rockies (excl. Bakken) Snapshot
RIG COUNT
Source: BMO Transaction Database, Baker Hughes, BMO Commodity Products Group, Bloomberg, Drilling Info, PLS
Note: Current quarter’s data is through the week covered by this issue.
1. Represents total enterprise value. Excludes transactions with deal value <$20 million. 2. $/acre multiple not adjusted for value associated with production.
3. Red line denotes average since 01-Jan-17. Calculated as the weighted average of each quarter’s transactions.
4. Production valued at $45,000/boepd in 2014, $30,000/boepd in 2015, $35,000/boepd in 2016 & 2017, and $40,000/boepd in 2018 & 2019.
TRANSACTION PRODUCTION MULTIPLES(3) TRANSACTION ADJUSTED NET ACRE MULTIPLES(3,4)
GROSS PRODUCTION

12
July 15, 2019
Item Value Wkly Change Last Week Item Value Wkly Change Last Week
Rig Count 103 2 101 Oil Differential -- -- --
Permitting Activity 48 (14) 62 Gas Differential ($0.66) $0.02 ($0.67)
0%
5%
10%
15%
20%
--
100
200
300
400
Jan-15 Jan-16 Jan-17 Jan-18 Jan-19
H V+D % of Total Rigs
--
$5,000
$10,000
$15,000
$20,000
1Q
15
2Q
15
3Q
15
4Q
15
1Q
16
2Q
16
3Q
16
4Q
16
1Q
17
2Q
17
3Q
17
4Q
17
1Q
18
2Q
18
3Q
18
4Q
18
1Q
19
2Q
19
3Q
19
1 3 1 2 0 3 3 2 4 1 2 1 0 0 0 1 0 0 0
$ /
acre
# Deals
$5,760
--
$50,000
$100,000
$150,000
$200,000
1Q
15
2Q
15
3Q
15
4Q
15
1Q
16
2Q
16
3Q
16
4Q
16
1Q
17
2Q
17
3Q
17
4Q
17
1Q
18
2Q
18
3Q
18
4Q
18
1Q
19
2Q
19
3Q
19
1 4 1 3 1 6 3 1 4 2 4 5 2 2 5 4 2 0 1
$ /
bo
e/d
# Deals
$42,527
-$1.00
-$0.75
-$0.50
-$0.25
$0.00
$0.25
Jan-15 Jan-16 Jan-17 Jan-18 Jan-19
-$1.00
-$0.75
-$0.50
-$0.25
$0.00
$0.25
$ /
mm
btu
$ /
bb
l
Cushing Panhandle
465497
449405 382 355
403
339
435389
298348
101
Jul-18 Sep-18 Nov-18 Jan-19 Mar-19 May-19 Jul-19
H V+D
Ann'd
Date Buyer Seller Asset Description Value(1)
Proved
Multiple
Prod.
Multiple Net Acres
($mm) ($/boe) ($/boe/d) ($/acre)(2)
08-Jul-19 NextEra Energy Inc Encana 140,000 net acres in Arkoma Basin $165 n.a. $12,857 $1,179
12-Jun-19 Glendale Energy; TPG Undisclosed Seller Non-op interests in STACK $55 n.a. n.a. n.a.
29-Apr-19 Undisclosed Buyer Riviera Resources Inc Non-op Hugoton Basin $31 n.a. n.a. n.a.
31-Mar-19 Red Wolf Apache 56k net acres in SCOOP/STACK/Merge $245 n.a. $18,421 $4,375
19-Feb-19 Mid-Con Energy Partners Scout Energy Partners Caddo, Grady, and Osage cos., OK $28 n.a. $20,960 n.a.
Mean $105 n.a. $17,413 $2,777
Median $55 n.a. $18,421 $2,777
Blue = BMO provided transaction advisory services Green = BMO provided acquisition financing or related services
Purple = BMO provided both transaction advisory services and acquisition financing or related services
6,000
7,000
8,000
9,000
10,000
11,000
12,000
13,000
400
450
500
550
600
650
700
Jan-15 Jul-15 Jan-16 Jul-16 Jan-17 Jul-17 Jan-18 Jul-18 Jan-19
mm
cf/
d
mb
bl/
d
Oil Gas 520
7,487
Mid-Continent Snapshot
TRANSACTION ACTIVITY (EXCLUDES CORPORATE DEALS)
PERMITTING ACTIVITY BY MONTH
DIFFERENTIALS RIG COUNT
Source: BMO Transaction Database, Baker Hughes, BMO Commodity Products Group, Bloomberg, Drilling Info, PLS
Note: Current quarter’s data is through the week covered by this issue.
1. Represents total enterprise value. Excludes transactions with deal value <$20 million. 2. $/acre multiple not adjusted for value associated with production.
3. Red line denotes average since 01-Jan-17. Calculated as the weighted average of each quarter’s transactions.
4. Production valued at $45,000/boepd in 2014, $30,000/boepd in 2015, $35,000/boepd in 2016 & 2017, and $40,000/boepd in 2018 & 2019.
TRANSACTION PRODUCTION MULTIPLES(3) TRANSACTION ADJUSTED NET ACRE MULTIPLES(3,4)
GROSS PRODUCTION

13
July 15, 2019
Item Value Wkly Change Last Week Item Value Wkly Change Last Week
Rig Count 26 2 24 Oil Differential $5.00 $0.30 $4.70
Permitting Activity 12 8 4 Gas Differential -- -- --
0%
5%
10%
15%
20%
--
10
20
30
40
Jan-15 Jan-16 Jan-17 Jan-18 Jan-19
Deep Water Shelf % of Total Rigs
--
$10
$20
$30
$40
1Q
15
2Q
15
3Q
15
4Q
15
1Q
16
2Q
16
3Q
16
4Q
16
1Q
17
2Q
17
3Q
17
4Q
17
1Q
18
2Q
18
3Q
18
4Q
18
1Q
19
2Q
19
3Q
19
0 0 1 0 0 0 2 1 0 0 0 1 2 1 0 1 1 2 0
$ /
bo
e
# Deals
$16.39
--
$15,000
$30,000
$45,000
$60,000
1Q
15
2Q
15
3Q
15
4Q
15
1Q
16
2Q
16
3Q
16
4Q
16
1Q
17
2Q
17
3Q
17
4Q
17
1Q
18
2Q
18
3Q
18
4Q
18
1Q
19
2Q
19
3Q
19
0 0 1 1 0 0 2 0 0 0 0 1 2 2 2 1 1 3 0
$ /
bo
e/d
# Deals
$32,727
--
$2.00
$4.00
$6.00
$8.00
$10.00
Jan-15 Jan-16 Jan-17 Jan-18 Jan-19
--
$2.00
$4.00
$6.00
$8.00
$10.00
$ /
mm
btu
$ /
bb
l
LLS Henry Hub
2932 33
39
32 30 32 33
2629
26 27
16
Jul-18 Sep-18 Nov-18 Jan-19 Mar-19 May-19 Jul-192,000
2,500
3,000
3,500
4,000
4,500
1,000
1,200
1,400
1,600
1,800
2,000
2,200
Jan-15 Jul-15 Jan-16 Jul-16 Jan-17 Jul-17 Jan-18 Jul-18 Jan-19
mm
cf/
d
mb
bl/
d
Oil Gas
1,864
2,961
Ann'd
Date Buyer Seller Asset Description Value(2)
Proved
Multiple
Prod.
Multiple Net Acres
($mm) ($/boe) ($/boe/d) ($/acre)(3)
27-Jun-19 W&T Offshore ExxonMobil Mobile Bay assets $200 $2.70 $10,101 n.a.
13-May-19 Equinor Shell 22.45% WI in Caesar-Tonga Field $965 n.a. $60,313 n.a.
23-Apr-19 Murphy LLOG Bluewater LLC Mississippi Canyon & Green Canyon $1,375 $20.83 $36,184 n.a.
16-Jan-19 Talos Energy Inc Samson Energy Co LLC Non-op Gulf of Mexico working interest $30 $13.45 $17,939 n.a.
10-Oct-18 Murphy Petrobras Gulf of Mexico joint venture $900 $15.00 $21,951 n.a.
Mean $694 $13.00 $29,298 n.a.
Median $900 $14.23 $21,951 n.a.
Blue = BMO provided transaction advisory services Green = BMO provided acquisition financing or related services
Purple = BMO provided both transaction advisory services and acquisition financing or related services
Gulf of Mexico Snapshot
PERMITTING ACTIVITY BY MONTH(1)
DIFFERENTIALS RIG COUNT
Source: BMO Transaction Database, Baker Hughes, BMO Commodity Products Group, Bloomberg, Drilling Info, PLS
Note: Current quarter’s data is through the week covered by this issue.
1. Permits include directional and unidentified drilling permits. 2. Represents total enterprise value. Excludes transactions with deal value <$20 million.
3. $/acre multiple not adjusted for value associated with production.
4. Red line denotes average since 01-Jan-17. Calculated as the weighted average of each quarter’s transactions.
GROSS PRODUCTION
TRANSACTION ACTIVITY (EXCLUDES CORPORATE DEALS)
TRANSACTION PRODUCTION MULTIPLES(4) TRANSACTION PROVED RESERVE MULTIPLES(4)
14
July 15, 2019
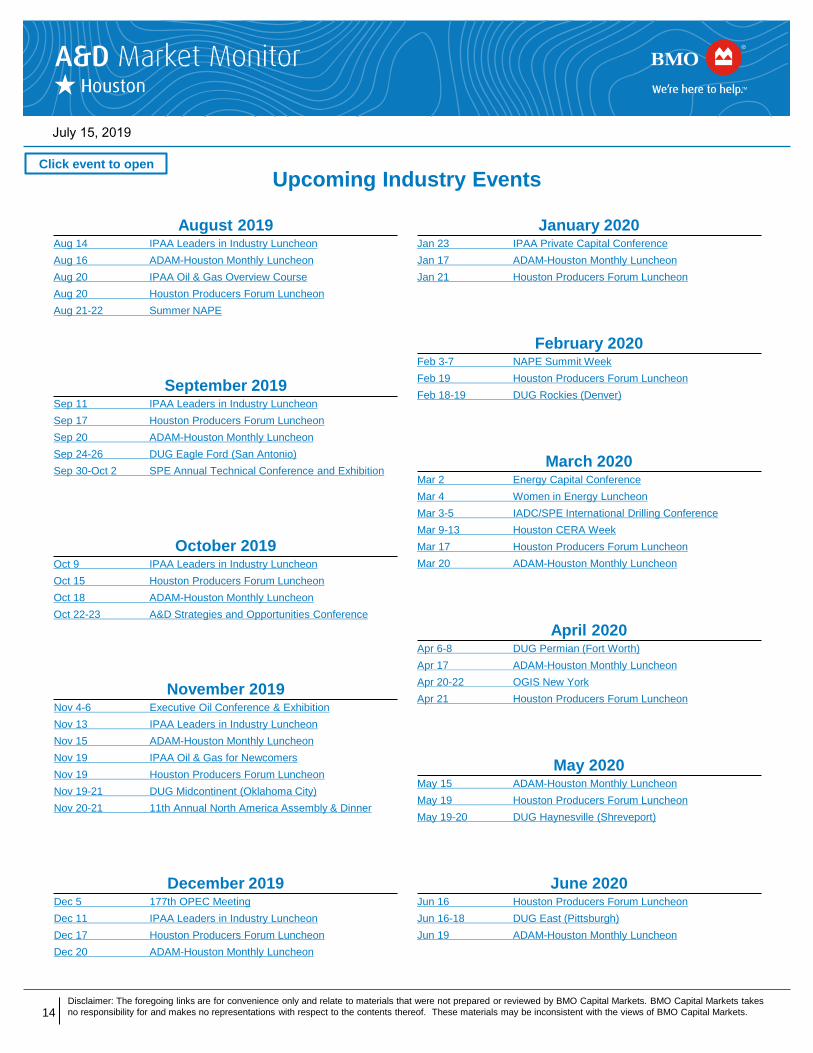
Upcoming Industry Events
Disclaimer: The foregoing links are for convenience only and relate to materials that were not prepared or reviewed by BMO Capital Markets. BMO Capital Markets takes
no responsibility for and makes no representations with respect to the contents thereof. These materials may be inconsistent with the views of BMO Capital Markets.
Click event to open
April 2019 Apr 22-23 Mineral & Royalty Conference
June 2019 Jun 24-26 IPAA Midyear Meeting
August 2019 Aug 14 IPAA Leaders in Industry Luncheon
Aug 16 ADAM-Houston Monthly Luncheon
Aug 20 IPAA Oil & Gas Overview Course
Aug 20 Houston Producers Forum Luncheon
Aug 21-22 Summer NAPE
September 2019 Sep 11 IPAA Leaders in Industry Luncheon
Sep 17 Houston Producers Forum Luncheon
Sep 20 ADAM-Houston Monthly Luncheon
Sep 24-26 DUG Eagle Ford (San Antonio)
Sep 30-Oct 2 SPE Annual Technical Conference and Exhibition
October 2019 Oct 9 IPAA Leaders in Industry Luncheon
Oct 15 Houston Producers Forum Luncheon
Oct 18 ADAM-Houston Monthly Luncheon
Oct 22-23 A&D Strategies and Opportunities Conference
2020
Jul 22-24 SPE Unconventional Resources Technology
Aug 11-14 Enercom Oil & Gas Conference
Sep 8-10 DUG Eagle Ford (San Antonio)
Oct 27-28 A&D Strategies and Opportunities Conference
Nov 2-4 Executive Oil Conference & Exhibition
November 2019 Nov 4-6 Executive Oil Conference & Exhibition
Nov 13 IPAA Leaders in Industry Luncheon
Nov 15 ADAM-Houston Monthly Luncheon
Nov 19 IPAA Oil & Gas for Newcomers
Nov 19 Houston Producers Forum Luncheon
Nov 19-21 DUG Midcontinent (Oklahoma City)
Nov 20-21 11th Annual North America Assembly & Dinner
December 2019 Dec 5 177th OPEC Meeting
Dec 11 IPAA Leaders in Industry Luncheon
Dec 17 Houston Producers Forum Luncheon
Dec 20 ADAM-Houston Monthly Luncheon
January 2019 Jan 15 Houston Producers Forum Luncheon
Jan 25 ADAM-Houston Monthly Luncheon
Jan 24 IPAA Private Capital Conference
May 2019
May 21 Houston Producers Forum Luncheon
May 22 SPE Business Development Group Meeting
March 2019 Mar 26-28 International Petroleum Technology Conference
January 2020 Jan 23 IPAA Private Capital Conference
Jan 17 ADAM-Houston Monthly Luncheon
Jan 21 Houston Producers Forum Luncheon
February 2020 Feb 3-7 NAPE Summit Week
Feb 19 Houston Producers Forum Luncheon
Feb 18-19 DUG Rockies (Denver)
March 2020 Mar 2 Energy Capital Conference
Mar 4 Women in Energy Luncheon
Mar 3-5 IADC/SPE International Drilling Conference
Mar 9-13 Houston CERA Week
Mar 17 Houston Producers Forum Luncheon
Mar 20 ADAM-Houston Monthly Luncheon
April 2020 Apr 6-8 DUG Permian (Fort Worth)
Apr 17 ADAM-Houston Monthly Luncheon
Apr 20-22 OGIS New York
Apr 21 Houston Producers Forum Luncheon
May 2020 May 15 ADAM-Houston Monthly Luncheon
May 19 Houston Producers Forum Luncheon
May 19-20 DUG Haynesville (Shreveport)
June 2020 Jun 16 Houston Producers Forum Luncheon
Jun 16-18 DUG East (Pittsburgh)
Jun 19 ADAM-Houston Monthly Luncheon

15
July 15, 2019
SCOOP/STACK/Merge
DJ-Niobrara
Eagle Ford
Haynesville
Granite Wash
GOM
Permian
Marcellus
Utica
Williston
Gulf Coast Onshore
Piceance
Powder River Green River
Legend
Current
Change
This material is prepared by the BMO Capital Markets’ Investment and Corporate Banking Department, for distribution to BMO Capital Markets’ clientele. It is not a product of
BMO Capital Markets’ Research Department. The views of the Investment and Corporate Banking Department may differ from those of the Research Department.
BMO Capital Markets is a trade name used by BMO Financial Group for the wholesale banking businesses of Bank of Montreal, BMO Harris Bank N.A. (member FDIC), Bank of Montreal
Ireland p.l.c., and Bank of Montreal (China) Co. Ltd and the institutional broker dealer businesses of BMO Capital Markets Corp. (Member FINRA and SIPC) in the U.S., BMO Nesbitt
Burns Inc. (Member Investment Industry Regulatory Organization of Canada and Member Canadian Investor Protection Fund) in Canada and Asia, Bank of Montreal Ireland p.l.c.
(authorised and regulated by the Central bank of Ireland) in Europe and BMO Capital Markets Limited (authorized and regulated by the Financial Conduct Authority) in the UK and
Australia. “Nesbitt Burns” is a registered trademark of BMO Nesbitt Burns Inc., used under license. “BMO Capital Markets” is a trademark of Bank of Montreal, used under license. "BMO
(M-Bar roundel symbol)" is a registered trademark of Bank of Montreal, used under license.
Bank of Montreal or its subsidiaries (“BMO Financial Group”) has lending arrangements with, or provide other remunerated services to, many issuers covered by BMO Capital Markets.
The opinions, estimates and projections contained in this report are those of BMO Capital Markets as of the date of this report and are subject to change without notice. BMO Capital
Markets endeavors to ensure that the contents have been compiled or derived from sources that we believe are reliable and contain information and opinions that are accurate and
complete. However, BMO Capital Markets makes no representation or warranty, express or implied, in respect thereof, takes no responsibility for any errors and omissions contained
herein and accepts no liability whatsoever for any loss arising from any use of, or reliance on, this report or its contents. Information may be available to BMO Capital Markets or its
affiliates that is not reflected in this report. The information in this report is not intended to be used as the primary basis of investment decisions, and because of individual client
objectives, should not be construed as advice designed to meet the particular investment needs of any investor. This material is for information purposes only and is not an offer to sell or
the solicitation of an offer to buy any security. BMO Capital Markets or its affiliates will buy from or sell to customers the securities of issuers mentioned in this report on a principal basis.
BMO Capital Markets or its affiliates, officers, directors or employees have a long or short position in many of the securities discussed herein, related securities or in options, futures or
other derivative instruments based thereon. BMO Capital Markets may act as financial advisor and/or underwriter for the issuers mentioned herein and may receive remuneration for
same. The reader should assume that BMO Capital Markets or its affiliates may have a conflict of interest and should not rely solely on this report in evaluating whether or not to buy or
sell securities of issuers discussed herein.
All values in this document are in US$ unless otherwise specified.
Source of rig count stats: Baker Hughes
Rig Count Summary MAPS IN
MASTER VIEW
Contacts
Disclaimer
Jason Martinez
MD & Head of U.S. A&D
713-546-9771
Howard Barnwell
MD & Transactions Mgr.
713-546-9767
Rob Priske
MD & Transactions Mgr.
713-546-9727
Dan Schockling
Director & Head of Commercial
713-518-1223
Michael Hackett
Vice President
Marian Yu
Associate
Aaron Moeller
Associate
BMO uses updated basin outlines, and the resulting rig counts, to more accurately represent current basin knowledge. The data below reflect these changes
and is different than those shown by Baker Hughes. The totals are the same.
437
(6)
55
--
18
--
59
--27
1
26
2
9
--79
1
58
1
82
(5)
24
1
6
1
21
215
(2)
[TBU]
This
Week Change
Last
Week
Last
Year
Total Rigs 958 (5) 963 1,054
Oil 784 (4) 788 863
Gas 172 (2) 174 189
Miscellaneous 2 1 1 2
Directional 70 4 66 68
Horizontal 831 (8) 839 930
Vertical 57 (1) 58 56
Basin
Permian 437 (6) 443 477
SCOOP/STACK/Merge 79 1 78 113
Granite Wash 9 -- 9 23
Eagle Ford 82 (5) 87 98
Haynesville 58 1 57 59
Marcellus 59 -- 59 53
Utica 18 -- 18 23
Williston 55 -- 55 57
DJ-Niobrara 27 1 26 25
Green River 15 (2) 17 17
Powder River 21 2 19 14
Piceance 6 1 5 8
Gulf Coast Onshore 24 1 23 19
GOM 26 2 24 19
Alaska 8 (1) 9 6
Other 34 -- 34 43
Mid-Con 15 1 14 21
Rockies 2 -- 2 3
Western 17 (1) 18 17
Eastern -- -- -- 2
Chelsea Neville
Transactions Coordinator