Prompt Oil Price ($/bbl) $56.96 $2.55 4.7% Prompt Gas ... · leaking in early February. No...
17
1 February 25, 2019 Indicator Current Value Week's Change % Change Direction Prompt Oil Price ($/bbl) $56.96 $2.55 4.7% Prompt Gas Price ($/mmbtu) $2.70 $0.13 4.9% Wkly Trans. Value ($mm) $283 $272 nmf Wkly Trans. Count 4 3 300% US Rig Count 1,047 (4) (0.4%) US Oil Prod'n (mmbbl/d) 12.0 0.1 0.8% US Gas Prod'n (bcf/d) (1) 107.4 -- -- US Oil Storage (mmbbl) 454.5 3.7 0.8% US Gas Storage (tcf) 1.7 (0.2) (9.4%) $2.2 $8.0 $9.9 $10.7 $4.9 $15.8 $21.2 $21.9 $24.1 $17.0 $9.1 $9.2 $20.8 $8.0 $31.6 $19.2 $0.6 -- 50 100 150 200 250 300 350 400 450 500 -- $5 $10 $15 $20 $25 $30 $35 $40 1Q15 2Q15 3Q15 4Q15 1Q16 2Q16 3Q16 4Q16 1Q17 2Q17 3Q17 4Q17 1Q18 2Q18 3Q18 4Q18 1Q19 61% 83% 74% 79% 39% 52% 62% 71% 93% 24% 68% 82% 91% 64% 46% 93% 78% Number of Transactions Transaction Value ($bn) Asset Corporate Number of Transactions % Oil Debt Markets Five issuers priced five tranches for $3.9 billion in proceeds Year-to-date U.S. volume is down 7% year-on-year U.S. high yield funds reported an inflow of $284 million ETFs reported an inflow of $55.1 million, while mutual funds reported an inflow of $228.8 million High yield index yield was 6.67%; high yield energy index yield was 7.90% Source: BMO Transaction Database, Baker Hughes, BMO Commodity Products Group, Bloomberg, EIA, PLS Note: Current quarter’s data is through the week covered by this issue. 1. EIA U.S. natural gas gross withdrawals and production reported monthly as of November 2018. 2. S&P E&P = S&P Oil & Gas E&P Select Industry, SPX = S&P 500 Index. Key Industry Indicators Quarterly Deal Activity S&P E&P (2) underperformed last week 0.4% vs. SPX (2) 1.1% The major U.S. equity indexes finished higher last week. Consumer discretionary, consumer staples, financials, health care, industrials, materials, real estate, and tech finished higher. Materials performed the best, up 3.3% Equity Markets Oil ended last week up. TransCanada restarted the Nebraska-Illinois portion of Keystone that started leaking in early February. No indication yet of when full flow rates will be able to resume. Alberta announced its crude-by-rail (“CBR”) plan, whereby Alberta plans to lease 4,400 rail cars and reach 120kbpd of CBR capacity in roughly three years. Crude oil imports and exports increased. The near-term contract closed up $2.55, or 4.7%, at $56.96 Natural gas ended last week up. Western basis was extremely volatile as the market traded around recent headlines for summer maintenance on Westcoast pipeline, which drove basis higher. Additionally, warmer weather is expected in the summer for the West Coast. Weather forecasts for early March were more bullish than expectations. The near-term contract closed up $0.13, or 4.9%, at $2.70 Commodities Week in Review Covering the Week of February 15 to February 21, 2019 Mid-Con Energy Partners sold substantially all of its Texas properties for $60 million to Scout Energy Group IV Scout Energy Management sold producing properties in Caddo, Grady, and Osage counties, OK for $27.5 million to Mid-Con Energy Partners QEP Resources announced a review of strategic alternatives. BMO and Evercore are acting as financial advisors BMO is marketing Juno’s divestiture of Permian Basin assets in Crosby and Lubbock counties, TX (see page 4) BMO is also marketing Rio Oil & Gas’ divestiture of Midland Basin assets in Glasscock County, TX (see page 5) All references to last week in the comments below are through Thursday
Transcript of Prompt Oil Price ($/bbl) $56.96 $2.55 4.7% Prompt Gas ... · leaking in early February. No...

1
February 25, 2019
IndicatorCurrent
Value
Week's
Change
%
Change Direction
Prompt Oil Price ($/bbl) $56.96 $2.55 4.7%
Prompt Gas Price ($/mmbtu) $2.70 $0.13 4.9%
Wkly Trans. Value ($mm) $283 $272 nmf
Wkly Trans. Count 4 3 300%
US Rig Count 1,047 (4) (0.4%)
US Oil Prod'n (mmbbl/d) 12.0 0.1 0.8%
US Gas Prod'n (bcf/d)(1) 107.4 -- --
US Oil Storage (mmbbl) 454.5 3.7 0.8%
US Gas Storage (tcf) 1.7 (0.2) (9.4%)
$2.2
$8.0
$9.9 $10.7
$4.9
$15.8
$21.2 $21.9 $24.1
$17.0
$9.1 $9.2
$20.8
$8.0
$31.6
$19.2
$0.6
--
50
100
150
200
250
300
350
400
450
500
--
$5
$10
$15
$20
$25
$30
$35
$40
1Q15 2Q15 3Q15 4Q15 1Q16 2Q16 3Q16 4Q16 1Q17 2Q17 3Q17 4Q17 1Q18 2Q18 3Q18 4Q18 1Q19
61% 83% 74% 79% 39% 52% 62% 71% 93% 24% 68% 82% 91% 64% 46% 93% 78%
Nu
mb
er
of
Tra
ns
acti
on
s
Tra
ns
acti
on
Valu
e (
$b
n)
Asset Corporate Number of Transactions
% Oil
Debt
Markets
Five issuers priced five tranches for $3.9 billion in proceeds
Year-to-date U.S. volume is down 7% year-on-year
U.S. high yield funds reported an inflow of $284 million
ETFs reported an inflow of $55.1 million, while mutual funds reported an inflow of $228.8 million
High yield index yield was 6.67%; high yield energy index yield was 7.90%
Source: BMO Transaction Database, Baker Hughes, BMO Commodity Products Group, Bloomberg, EIA, PLS
Note: Current quarter’s data is through the week covered by this issue.
1. EIA U.S. natural gas gross withdrawals and production reported monthly as of November 2018.
2. S&P E&P = S&P Oil & Gas E&P Select Industry, SPX = S&P 500 Index.
Key Industry Indicators
Quarterly Deal Activity
S&P E&P(2) underperformed last week 0.4% vs. SPX(2) 1.1%
The major U.S. equity indexes finished higher last week. Consumer discretionary, consumer staples,
financials, health care, industrials, materials, real estate, and tech finished higher. Materials performed
the best, up 3.3%
Equity
Markets
Oil ended last week up. TransCanada restarted the Nebraska-Illinois portion of Keystone that started
leaking in early February. No indication yet of when full flow rates will be able to resume. Alberta
announced its crude-by-rail (“CBR”) plan, whereby Alberta plans to lease 4,400 rail cars and reach
120kbpd of CBR capacity in roughly three years. Crude oil imports and exports increased. The near-term
contract closed up $2.55, or 4.7%, at $56.96
Natural gas ended last week up. Western basis was extremely volatile as the market traded around
recent headlines for summer maintenance on Westcoast pipeline, which drove basis higher. Additionally,
warmer weather is expected in the summer for the West Coast. Weather forecasts for early March were
more bullish than expectations. The near-term contract closed up $0.13, or 4.9%, at $2.70
Commodities
Week in Review
In Commodities, ECM and DCM, let’s go to journalism standards, even
though that’s not how we get the text from those groups. Main change is
that any number below 10 is spelled out (one instead of 1). This does not
apply to statistical analyses, percentages, or money, of course.
Let’s follow these guidelines when sorting articles:
• First priority: Domestic A&D, ranked by size
• Next: Domestic M&A
• Then: US companies doing international deals (like
Noble’s Tamar)
• Then: Others (Cabot’s Lackawanna)
• Then: Prices, rig count, completions, etc.
To paste the arrows with colors,
• FactSet
• Settings
• Presentation Linking and Formatting
• Import
• Colors
• Change Color Font
For the primary Commodities bullet points on oil and gas
prices, please start with “The near-term contract opened the
week at $___” and end that same bullet point with “The
near-term contract closed the week at $____, down(up)
$___, or ___%.” You don’t have to use exactly those words
as long as the opening and closing prices are included . For
example, you could write, “Opening the week at $45.21, the
near-term oil contract declined steadily based on …” – you
know, think like a journalist, be creative.
Covering the Week of February 15 to February 21, 2019
The October issue of BMO Calgary’s A&D (Canadian)
Market Monitor went live last week – read more here
[TBU]
[TBU]
[TBU]
[TBU]
[TBU] [TBU]
This is the final issue for 2018. The Market Monitor will
return on Monday, January 7th. Happy Holidays from the
BMO Capital Markets team!
Mid-Con Energy Partners sold substantially all of
its Texas properties for $60 million to Scout Energy Group IV
Scout Energy Management sold producing properties
in Caddo, Grady, and Osage counties, OK for $27.5 million to
Mid-Con Energy Partners
QEP Resources announced a review of strategic alternatives.
BMO and Evercore are acting as financial advisors
BMO is marketing Juno’s divestiture of Permian Basin assets
in Crosby and Lubbock counties, TX (see page 4)
BMO is also marketing Rio Oil & Gas’ divestiture of Midland
Basin assets in Glasscock County, TX (see page 5)
All references to last week in the comments below are through Thursday

2
February 25, 2019
Ann'd
Date Buyer Seller Area Asset Description Value(1)
Proved
Multiple
Prod.
Multiple Net Acres
($mm) ($/boe) ($/boe/d) ($/acre)
19-Feb-19 Scout Energy Partners Mid-Con Energy Partners Other North Texas assets $60 $8.22 n.a. n.a.
19-Feb-19 Mid-Con Energy Partners Scout Energy Partners Mid-Continent Caddo, Grady, and Osage cos., OK $28 n.a. $20,960 n.a.
19-Feb-19 Undisclosed Buyer Noble Energy Permian Non-core acreage in the Delaware Basin $63 n.a. n.a. n.a.
19-Feb-19 Undisclosed Buyer Noble Energy Permian 13,000 net acres in Reeves Co., TX $132 n.a. n.a. $10,154
14-Feb-19 Undisclosed Buyer Harvest Oil & Gas Corp Other Rockies San Juan Basin assets $43 $1.57 $10,835 n.a.
07-Feb-19 Kimbell Royalty Partners EnCap Investments LP Multi-Region 12,200 net royalty acres across the U.S. $151 n.a. $94,563 nmf
16-Jan-19 Talos Energy Inc Samson Energy Co LLC Gulf of Mexico Non-op Gulf of Mexico working interest $30 $13.45 $17,939 n.a.
08-Jan-19 Undisclosed Buyer MCM Energy Partners LLC Permian Midland Basin assets $20 n.a. n.a. n.a.
21-Dec-18 Pantheon Resources Plc Great Bear Petroleum LLC Alaska 250,000 leased acres in the North Slope $49 n.a. n.a. $196
19-Dec-18 Comstock Shelby Shale LLC Ark-La-Tex 6,023 net acres in Haynesville $21 n.a. n.a. $3,404
Blue = BMO provided transaction advisory services Green = BMO provided acquisition financing or related services
Purple = BMO provided both transaction advisory services and acquisition financing or related services
y = 34.083e-0.07x
R² = 0.3524
--
$10.00
$20.00
$30.00
$40.00
$50.00
$60.00
-- 5.0x 10.0x 15.0x 20.0x 25.0x 30.0x
Sale
s P
rice /
Pro
ved
R
eserv
es (
$/b
oe @
15:1
)
R / P
R / P
Sales Value /
Proved Reserves
(15:1)
(ratio) ($ / boe) ($ / mcfe)
8x $19.47 $1.30
10x $16.92 $1.13
15x $11.93 $0.80
20x $8.40 $0.56
Oil70%
Gas30%
LTM By Commodity
Permian39%
Rockies (ex. Bakken)
9%
Bakken5%
Appalachia2%
Mid-Con16%
Eagle Ford6%
Ark-La-Tex4%
Gulf of Mexico3%
Other17%
LTM By Region
Public Company
35%
PE / PE-Backed
26%
Private21%
Other18%
LTM By Buyer Type
The 10 Most Recent Asset Transactions Over $20 Million
A&D Valuation Trends(3)
Source: BMO Transaction Database, Baker Hughes, BMO Commodity Products Group, Bloomberg, PLS
1. Represents total enterprise value.
2. Calculated as percentage of total LTM transaction count (number of transactions, not dollar value).
3. 62 transactions from January 2015 to 2019 with transaction value >$20mm. Adjusted for changes in price outlooks. Recalculated boe reserves are on a 15:1
(gas:oil) basis. Acreage transactions excluded by using deals with PDP of >= 40% of total proved.
Asset descriptions are all hard-coded and need to be
adjusted if new deals are added
(2) (2) (2)
Confirm number of transactions weekly --->
[TBU]
[TBU]
[TBU]

3
February 25, 2019
2/21/2019
Appalachia 2
Ark-La-Tex 9
Bakken 6
Eagle Ford 5
Mid-Con 9
Other 18
Permian 22
Rockies 3
74
Select Significant Deals on the Market
Disclaimer: The foregoing links are for convenience only and relate to materials that were not prepared or reviewed by BMO Capital Markets. BMO Capital Markets takes
no responsibility for and makes no representations with respect to the contents thereof. These materials may be inconsistent with the views of BMO Capital Markets.
Source of Select Significant Deals on the Market: BMO Transaction Database
Industry Headlines
Appalachia
2 Deals
Mid-Con
9 Deals
Eagle Ford
5 Deals
Permian
22 Deals
Other
18 Deals
Rockies
3 Deals
(Click headline to link to the full article)
A&D Headlines
Bakken
6 Deals
Ark-La-Tex
9 Deals
BMO Deals (Status)
Juno Permian (In Market) – See page 4
Rio Glasscock County (In Market) – See page 5
As Westchester Clamors For Gas, ConEd Wants
Others to Cut Back
Natural Gas Moratoriums Around State Due to Lack of
Pipelines
U.S. Shale Boom Keeps Rolling Even as Wildcatters
Save Cash
California's Dirty Oil Gets Pricey Amid Venezuela
Sanctions
The OPEC+ Oil Deal Is Standing on One Wobbly Leg
Permian-Fueled Shale Boom Shows Little Sign of
Abating, Even With Capital Spending Cuts
Official Says Northern Access Pipeline Progress
Would Mean Local Jobs
Oil And Gas Investors Tell Producers to Focus on
Returns, Not Endless Growth
Mid-Con Energy Partners, LP Announces Strategic
Transaction Strengthening Balance Sheet
QEP Resources Announces Review of Strategic
Alternatives
Devon Energy Announces Final Step to Complete
Transformation to U.S. Oil Growth Company
[TBU]
[TBU] [TBU]
[TBU]
Talos Energy Announces Full Year 2019 Operating
and Financial Guidance (includes A&D
announcement)

4
February 25, 2019
Long-life, shallow decline oil assets located in the prolific Clear
Fork Trend of the Permian Basin
Largely contiguous 10,250 net acre position located in the Hoople
Field in Crosby and Lubbock counties, Texas
100% operated with high WI (100%) and NRI (>75%)
Favorable leasehold position with little-to-no drilling
obligations until 2021; >50% of acreage position under two
leases from one landowner
Current production of ~300 net bopd (100% oil) with significant
remaining drilling inventory consisting of ~200+ low-risk Clear Fork
locations
Asset provides substantial, economic running room for organic and
acquisitive growth
Existing Clear Fork acreage only ~15% developed based on
10-acre development plan
– Additional upside through 5-acre development,
secondary recovery and Glorieta development as
demonstrated in offsetting acreage; CO2 and Wolfcamp
potential
Multiple bolt-on acquisition opportunities and new leasing
opportunities
Acreage position largely delineated through existing and offset
development; full-scale development plan in place with drill-ready
infrastructure
VDR available late February
Contact Chelsea Neville at [email protected] or 713-546-
9703 for a Confidentiality Agreement, access to the VDR, and/or to
request a data room presentation
Source: Juno Permian Divestiture announcement
Substantial
Unquantified
Upside
Near-term development potential by exploiting the Glorieta across Juno’s acreage position
Acreage position on trend with offset Glorieta development
Potential development opportunity to co-mingle Clear Fork and Glorieta production, yielding twice the reserves with
little incremental D&C capex
Additional reserve recovery from waterflood operations and 5-acre development; future tertiary recovery
Offset operator testing horizontal Wolfcamp potential in the area
Large,
Contiguous
Acreage Position
in the Prolific
Clear Fork Oil
Trend
High quality anchor asset in the heart of the Midland Basin’s Eastern Shelf with multiple stacked pay potential
Acreage situated in the Hoople Field, one of the most active Clear Fork development areas with >1,000 Clear Fork
producers drilled in the last 10 years
Majority of Juno’s acreage is situated in the core of the field with vertical offset Clear Fork EURs of ~60 MBo
Primary recovery economics provide attractive IRRs with low development costs
Secondary recovery provides an incremental increase of 150% of primary EUR based on analog fields
Clear Fork A STOOIP of up to 13 mmbo per section based on core and log analysis
Increased Oil
Cuts and
Improved
Economics from
Enhanced
Completions
Targeted, optimized fracs providing robust EURs and lower WOR vs. offset results
Fracture growth limited to ~40 feet from perf
Oil cuts have improved by three-fold using selective completions
Prior generation completions took the entirety of the pay zone and pumped excessive volumes, thereby increasing
communication with higher WOR sand bodies
Asset Ready for
Full-Scale
Development
Significant inventory of 200+ economic Clear Fork locations remaining (at 10-acre spacing)
Fast cycle times (~4-5 days spud-to-spud) and favorable land position provides the ability to accelerate development within
the first year
Juno’s predecessor in the Hoople Field grew production by over 25x in less than 3 years
Inexpensive access to water sources and disposal provides for low-cost waterflood and frac’ing operations
Significant investments in infrastructure, including electrical, roads, pipelines, and facilities
No deferred maintenance or P&A issues
Currently on the Market from BMO: Juno Permian Divestiture
ASSET HIGHLIGHTS
ASSET OVERVIEW PROCESS OVERVIEW
LOCATOR MAP

5
February 25, 2019
Opportunity to acquire highly economic and
contiguous 1,064 net acre (1,645 gross acre) position
in the Midland Basin located in west-central Glasscock
County, Texas
Assets provide high degree of operational control
with 98% operated, 74% HBP, and 67% average
WI
Current net production of ~54 boe/d from ten active
vertical wells holds the majority of acreage
Proven development opportunities targeting the Lower
Spraberry, Wolfcamp A, and Wolfcamp D formations
Active development by Parsley, Oxy, Diamondback,
and others highlights robust returns and de-risked
drilling locations
Continued improvement in well performance driven by
completion optimization
VDR available late February / early March 2019
Contact Chelsea Neville ([email protected] or 713-546-
9703) for a Confidentiality Agreement, access to the VDR, and/or
to request a data room presentation
Source: Rio Oil and Gas II Glasscock County Divestiture announcement
Active
Development By
Offset Operators
Producing Robust
Returns
Outstanding position in one of the most active basins in the U.S. with 181 rigs in the Midland Basin and 14 in Glasscock
County
~3,500 feet of porous, brittle, hydrocarbon rich pay available from the top of the Spraberry to the base of the Wolfcamp
Active offsetting development in the Lower Spraberry, Wolfcamp A, Wolfcamp B, and Wolfcamp D by Parsley, OXY,
Crownquest, Cinnabar, Encana, SM, Callon, Diamondback, Hunt, and others
Parsley is actively developing with strong results its directly offsetting Calverley assets in the LS, WCA, and WCB
– Parsley brought 17 wells online in 2018; outperformed historical with peak rates up to
2,000 boepd (84% oil)
– Parsley acquired Calverley position through BTA acquisition ($40,000+/net acre)
OXY recently completed five wells (west of Rio) targeting the WCA and has two additional permits
IP and EURs continue to increase through optimization of completion techniques: predominantly slickwater fracs with
proppant loading at ~1,900 lbs/ft
Over 30 potential stacked locations with additional unquantified upside in the Wolfcamp D
Operated Asset
Set Up For
Efficient, Stacked-
Pay, Long Lateral
Development
Contiguous 1,064 net acres in west-central Glasscock County
75% effective (8/8ths) net revenue interest
74% of net acres HBP from vertical producers with remaining acreage in primary term with 2+ years remaining
Leasehold primed for efficient cube development with 100% of locations expected to support 7,500’+ laterals; 100% of
acreage owns Spraberry through WCA rights and select ownership of WCD
No long term oil and gas sales dedications offer the purchaser marketing flexibility
Full Area Exit
Full area exit for Rio
Rio’s investments have been focused on assembling the position, perfecting subsurface interpretation, and readying the
asset for full-field development
Currently on the Market from BMO: Rio Oil & Gas II Glasscock County Divestiture
ASSET HIGHLIGHTS
ASSET OVERVIEW PROCESS OVERVIEW
LOCATOR MAP

6
February 25, 2019
25%
35%
45%
55%
65%
Feb-16 Aug-16 Feb-17 Aug-17 Feb-18 Aug-18 Feb-19
% o
f W
TI
NGL as % of WTI
$1
$2
$3
$4
$5
Feb-18 Aug-18 Feb-19 Aug-19 Feb-20
($/m
mb
tu)
$20
$30
$40
$50
$60
$70
$80
Feb-18 Aug-18 Feb-19 Aug-19 Feb-20
($/b
bl)
Historical Prices as of 21-Feb-19 Close ($/gal)
NGLs Current Last Wk. 6 Mo. Ago 1 Yr. Ago
Ethane $0.31 $0.30 $0.40 $0.24
Propane $0.72 $0.66 $0.97 $0.83
Butane $0.82 $0.80 $1.02 $0.90
Iso-butane $0.91 $0.92 $1.16 $1.13
Pentane+ $1.19 $1.16 $1.49 $1.35
NYMEX Gas Futures as of 21-Feb-19 Close ($/mmbtu)
Period(1) Current Last Wk. 6 Mo. Ago 1 Yr. Ago
12 Mo. Strip $2.87 $2.78 $2.91 $2.82
2019 $2.82 $2.73 $2.83 $2.78
2020 $2.73 $2.73 $2.66 $2.78
2021 $2.63 $2.65 $2.59 $2.83
2022 $2.81 $2.84 $2.73 $2.97
2023 $2.81 $2.84 $2.73 $2.97
NYMEX WTI Futures as of 21-Feb-19 Close ($/bbl) NYMEX Gas Futures as of 21-Feb-19 Close ($/mmbtu)
Period(1) Current Last Wk. 6 Mo. Ago 1 Yr. Ago
12 Mo. Strip $58.60 $56.33 $64.67 $59.19
2019 $58.48 $56.19 $63.51 $56.31
2020 $58.31 $56.50 $60.47 $53.55
2021 $56.62 $55.12 $58.05 $51.91
2022 $55.35 $54.17 $56.46 $51.24
2023 $54.74 $53.78 $55.57 $51.13
NGL PRICING(2)
HENRY HUB NATURAL GAS (HISTORICAL / FORECAST)
Commodity Prices
Source: BMO Commodity Products Group, Bloomberg, FactSet
1. Future prices are calendar year average unless stated otherwise.
2. Assumes typical Gulf Coast barrel composition.
WTI OIL (HISTORICAL / FORECAST)
Links:
http://www.nasdaq.com/markets/crude-oil.aspx
http://www.bloomberg.com/quote/CL1:COM
http://www.nasdaq.com/markets/natural-gas.aspx
http://www.bloomberg.com/quote/NG1:COM
Link to Detailed
Futures Data
Link to Detailed
Historical Graph
Link to Detailed
Futures Data
Link to Detailed
Historical Graph
[TBU]
[TBU]
[TBU]

7
February 25, 2019
Clearbrook
Midland
Cushing
St. James
(LLS)
East Coast
U.S. (Brent)
Midland Sweet-
Sour Spread
EMS
AECO
Northern
California
Sumas
Southern
California
El Paso - SJ
Waha
HSC
Henry Hub
Panhandle
CIG Chicago
Dominion
Transco
NATURAL GAS PRICING & DIFFERENTIALS TO HENRY HUB ($ / MMBTU) – AS OF 21-FEB-19
Commodity Prices (cont’d)
OIL PRICING & DIFFERENTIALS TO CUSHING WTI ($ / BBL) – AS OF 21-FEB-19
Legend
Price
Diff.
Legend
Price
Diff.
Source: BMO Commodity Products Group, Bloomberg
Note: Prices and differentials are for prompt month futures except for Clearbrook which is based on spot prices.
MAPS IN
MASTER VIEW
TBU
[TBU]
[TBU]
$56.96
$1.33 $64.15
$7.19
$2.49
($0.21)
$2.40
($0.30)
$2.70
$2.70
--
$56.42
($0.54)
$67.07
$10.11
$56.71
($0.25)
$51.46
($5.50)
$2.49
($0.21)
$2.73
$0.03
$1.18
($1.52)
$2.28
($0.42)$2.18
($0.52)$2.88
$0.18
$1.61
($1.09)$6.30
$3.60
$3.80
$1.10

8
February 25, 2019
Item Value Wkly Change Last Week Item Value Wkly Change Last Week
Rig Count 473 -- 473 Oil Differential $0.90 ($0.10) $1.000
Permitting Activity 148 (176) 324 Gas Differential ($1.47) $0.01 ($1.48)
0%
10%
20%
30%
40%
50%
--
100
200
300
400
500
Jan-14 Jan-15 Jan-16 Jan-17 Jan-18 Jan-19
H V+D % of Total Rigs
-$4.80
-$3.20
-$1.60
$0.00
$1.60
Jan-15 Jan-16 Jan-17 Jan-18 Jan-19
-$18.00
-$12.00
-$6.00
$0.00
$6.00
$ /
mm
btu
$ /
bb
l
Midland Waha
5,000
6,000
7,000
8,000
9,000
10,000
11,000
1,000
1,500
2,000
2,500
3,000
3,500
Jan-14 Jul-14 Jan-15 Jul-15 Jan-16 Jul-16 Jan-17 Jul-17 Jan-18
mm
cf/
d
mb
bl/
d
Oil Gas
3,184
10,301
9901,177
1,156
1,294
1,0911,149
1,223
9931,212
1,015871
1,293
781
Feb-18 Apr-18 Jun-18 Aug-18 Oct-18 Dec-18 Feb-19
H V+D
Ann'd
Date Buyer Seller Asset Description Value(1)
Proved
Multiple
Prod.
Multiple Net Acres
($mm) ($/boe) ($/boe/d) ($/acre)(2)
19-Feb-19 Undisclosed Buyer Noble Energy Non-core acreage in the Delaware Basin $63 n.a. n.a. n.a.
19-Feb-19 Undisclosed Buyer Noble Energy 13,000 net acres in Reeves Co., TX $132 n.a. n.a. $10,154
08-Jan-19 Undisclosed Buyer MCM Energy Partners LLC Midland Basin assets $20 n.a. n.a. n.a.
06-Nov-18 Diamondback Energy ExL Pet.; EnergyQuest 3,646 net acres in Midland Basin $313 n.a. $89,286 $85,710
05-Nov-18 Centennial Resource Dev. Undisclosed Seller 820 net acres in Delaware Basin $26 n.a. n.a. $31,707
Mean $111 n.a. $89,286 $42,524
Median $63 n.a. $89,286 $31,707
Blue = BMO provided transaction advisory services Green = BMO provided acquisition financing or related services
Purple = BMO provided both transaction advisory services and acquisition financing or related services
--
$50,000
$100,000
$150,000
$200,000
1Q
15
2Q
15
3Q
15
4Q
15
1Q
16
2Q
16
3Q
16
4Q
16
1Q
17
2Q
17
3Q
17
4Q
17
1Q
18
2Q
18
3Q
18
4Q
18
1Q
19
1 2 6 9 5 7 11 9 9 6 1 0 7 1 5 3 0
$ /
bo
e/d
# Deals
$126,473
--$10,000$20,000$30,000$40,000$50,000$60,000
1Q
15
2Q
15
3Q
15
4Q
15
1Q
16
2Q
16
3Q
16
4Q
16
1Q
17
2Q
17
3Q
17
4Q
17
1Q
18
2Q
18
3Q
18
4Q
18
1Q
19
1 2 8 8 6 6 12 13 15 7 3 2 7 1 5 3 0
$ /
acre
# Deals
$28,151
GROSS PRODUCTION
TRANSACTION ACTIVITY (EXCLUDES CORPORATE DEALS)
TRANSACTION PRODUCTION MULTIPLES(3) TRANSACTION ADJUSTED NET ACRE MULTIPLES(3,4)
PERMITTING ACTIVITY BY MONTH
DIFFERENTIALS
Permian Snapshot
RIG COUNT
Source: BMO Transaction Database, Baker Hughes, BMO Commodity Products Group, Bloomberg, Drilling Info, PLS
Note: Current quarter’s data is through the week covered by this issue.
1. Represents total enterprise value. Excludes transactions with deal value <$20 million. 2. $/acre multiple not adjusted for value associated with production.
3. Red line denotes average since 01-Jan-17. Calculated as the weighted average of each quarter’s transactions.
4. Production valued at $45,000/boepd in 2014, $30,000/boepd in 2015, $35,000/boepd in 2016 & 2017, and $40,000/boepd in 2018 & 2019.
[TBU]
[TBU]
[TBU] [TBU]
[TBU] [TBU]
[TBU]

9
February 25, 2019
Item Value Wkly Change Last Week Item Value Wkly Change Last Week
Rig Count 97 (1) 98 Oil Differential $8.50 ($0.60) $9.10
Permitting Activity 56 (66) 122 Gas Differential $0.02 $0.02 $0.00
0%
5%
10%
15%
20%
--
100
200
300
Jan-14 Jan-15 Jan-16 Jan-17 Jan-18 Jan-19
H V+D % of Total Rigs
-$0.30
-$0.20
-$0.10
$0.00
$0.10
$0.20
$0.30
$0.40
$0.50
Jan-15 Jan-16 Jan-17 Jan-18 Jan-19
-$6.00
-$4.00
-$2.00
$0.00
$2.00
$4.00
$6.00
$8.00
$10.00
$ /
mm
btu
$ /
bb
l
LLS HSC
6,000
6,500
7,000
7,500
8,000
8,500
9,000
9,500
10,000
10,500
1,000
1,200
1,400
1,600
1,800
2,000
2,200
Jan-14 Jul-14 Jan-15 Jul-15 Jan-16 Jul-16 Jan-17 Jul-17 Jan-18
mm
cf/
d
mb
bl/
d
Oil Gas
1,452
8,328
449378
426473
436379
454
328
399342
312
399
268
Feb-18 Apr-18 Jun-18 Aug-18 Oct-18 Dec-18 Feb-19
H V+D
Ann'd
Date Buyer Seller Asset Description Value(1)
Proved
Multiple
Prod.
Multiple Net Acres
($mm) ($/boe) ($/boe/d) ($/acre)(2)
19-Nov-18 Lonestar Resources Inc Sabine Oil & Gas Corp 2,706 net acres in Eagle Ford $39 $2.98 $48,375 $14,302
20-Sep-18 WildHorse Undisclosed Seller 20,305 net Eagle Ford/Austin Chalk acres $35 n.a. n.a. $1,743
07-Sep-18 Undisclosed Buyer Viking Minerals LLC 1,191 net royalty acres in Eagle Ford $28 n.a. n.a. nmf
31-Jul-18 EP Energy Corp Undisclosed Seller Additional working interests in Eagle Ford $31 n.a. n.a. n.a.
26-Jul-18 BP BHP Billiton Permian, Eagle Ford, and Haynesville $10,500 n.a. n.a. n.a.
Mean $2,127 $2.98 $48,375 $8,022
Median $35 $2.98 $48,375 $8,022
Blue = BMO provided transaction advisory services Green = BMO provided acquisition financing or related services
Purple = BMO provided both transaction advisory services and acquisition financing or related services
--$10,000$20,000$30,000$40,000$50,000$60,000
1Q
15
2Q
15
3Q
15
4Q
15
1Q
16
2Q
16
3Q
16
4Q
16
1Q
17
2Q
17
3Q
17
4Q
17
1Q
18
2Q
18
3Q
18
4Q
18
1Q
19
0 1 2 1 2 2 0 4 2 3 1 2 4 2 1 3 0
$ /
acre
# Deals
$6,130
--
$50,000
$100,000
$150,000
1Q
15
2Q
15
3Q
15
4Q
15
1Q
16
2Q
16
3Q
16
4Q
16
1Q
17
2Q
17
3Q
17
4Q
17
1Q
18
2Q
18
3Q
18
4Q
18
1Q
19
1 1 3 1 2 2 2 4 4 3 1 2 7 2 0 3 0
$ /
bo
e/d
# Deals
$70,217
Eagle Ford Snapshot
TRANSACTION ACTIVITY (EXCLUDES CORPORATE DEALS)
PERMITTING ACTIVITY BY MONTH
DIFFERENTIALS RIG COUNT
Source: BMO Transaction Database, Baker Hughes, BMO Commodity Products Group, Bloomberg, Drilling Info, PLS
Note: Current quarter’s data is through the week covered by this issue.
1. Represents total enterprise value. Excludes transactions with deal value <$20 million. 2. $/acre multiple not adjusted for value associated with production.
3. Red line denotes average since 01-Jan-17. Calculated as the weighted average of each quarter’s transactions.
4. Production valued at $45,000/boepd in 2014, $30,000/boepd in 2015, $35,000/boepd in 2016 & 2017, and $40,000/boepd in 2018 & 2019.
TRANSACTION PRODUCTION MULTIPLES(3) TRANSACTION ADJUSTED NET ACRE MULTIPLES(3,4)
GROSS PRODUCTION

10
February 25, 2019
Item Value Wkly Change Last Week Item Value Wkly Change Last Week
Rig Count 68 1 67 Oil Differential $8.50 ($0.60) $9.10
Permitting Activity 17 (10) 27 Gas Differential -- -- --
0%
5%
10%
15%
20%
--
20
40
60
80
Jan-14 Jan-15 Jan-16 Jan-17 Jan-18 Jan-19
H V+D % of Total Rigs
--
$2.00
$4.00
$6.00
$8.00
$10.00
Jan-15 Jan-16 Jan-17 Jan-18 Jan-19
--
$2.00
$4.00
$6.00
$8.00
$10.00
$ /
mm
btu
$ /
bb
l
LLS Henry Hub
5,000
6,000
7,000
8,000
9,000
10,000
11,000
80
90
100
110
120
130
140
Jan-14 Jul-14 Jan-15 Jul-15 Jan-16 Jul-16 Jan-17 Jul-17 Jan-18
mm
cf/
d
mb
bl/
d
Oil Gas
102
10,206
181
247
156 168 154162 165
172174
105 104 9861
Feb-18 Apr-18 Jun-18 Aug-18 Oct-18 Dec-18 Feb-19
H V+D
Ann'd
Date Buyer Seller Asset Description Value(1)
Proved
Multiple
Prod.
Multiple Net Acres
($mm) ($/mcfe) ($/mcfe/d) ($/acre)(2)
19-Dec-18 Comstock Shelby Shale LLC 6,023 net acres in Haynesville $21 n.a. n.a. $3,404
19-Nov-18 Aethon III QEP Resources Inc 49,700 net acres in Haynesville $735 $0.77 $2,475 $14,789
05-Sep-18 Viking Energy Group Multiple Sellers Texas and Louisiana assets $100 n.a. n.a. n.a.
05-Sep-18 Equinor Texegy LLC 60,000 net acres in Austin Chalk $75 n.a. n.a. $1,250
06-Aug-18 Mission Creek Resources Bonanza Creek Energy Inc 11,132 net acres in the Cotton Valley $117 $1.69 $6,500 $10,510
Mean $210 $1.23 $4,487 $7,488
Median $100 $1.23 $4,487 $6,957
Blue = BMO provided transaction advisory services Green = BMO provided acquisition financing or related services
Purple = BMO provided both transaction advisory services and acquisition financing or related services
--$2,000$4,000$6,000$8,000
$10,000$12,000
1Q
15
2Q
15
3Q
15
4Q
15
1Q
16
2Q
16
3Q
16
4Q
16
1Q
17
2Q
17
3Q
17
4Q
17
1Q
18
2Q
18
3Q
18
4Q
18
1Q
19
0 0 5 1 1 3 2 3 0 2 2 0 1 1 2 1 0
$ /
mcfe
/d
# Deals
$5,209
--
$5,000
$10,000
$15,000
$20,000
1Q
15
2Q
15
3Q
15
4Q
15
1Q
16
2Q
16
3Q
16
4Q
16
1Q
17
2Q
17
3Q
17
4Q
17
1Q
18
2Q
18
3Q
18
4Q
18
1Q
19
0 0 3 1 1 2 1 3 0 1 2 0 1 1 1 1 0
$ /
acre
# Deals
$3,349
Ark-La-Tex Snapshot
TRANSACTION ACTIVITY (EXCLUDES CORPORATE DEALS)
PERMITTING ACTIVITY BY MONTH
DIFFERENTIALS RIG COUNT
Source: BMO Transaction Database, Baker Hughes, BMO Commodity Products Group, Bloomberg, Drilling Info, PLS
Note: Current quarter’s data is through the week covered by this issue.
1. Represents total enterprise value. Excludes transactions with deal value <$20 million. 2. $/acre multiple not adjusted for value associated with production.
3. Red line denotes average since 01-Jan-17. Calculated as the weighted average of each quarter’s transactions.
4. Production valued at $3,000/mcfepd in 2014, and $2,000/mcfepd in 2015, 2016, 2017, 2018, and 2019.
TRANSACTION PRODUCTION MULTIPLES(3) TRANSACTION ADJUSTED NET ACRE MULTIPLES(3,4)
GROSS PRODUCTION

11
February 25, 2019
Item Value Wkly Change Last Week Item Value Wkly Change Last Week
Rig Count 81 1 80 Oil Differential $10.32 $0.16 $10.16
Permitting Activity 27 (41) 68 Gas Differential ($0.19) $0.01 ($0.19)
0%
5%
10%
15%
20%
--
50
100
150
Jan-14 Jan-15 Jan-16 Jan-17 Jan-18 Jan-19
H V+D % of Total Rigs
-$3.00
-$2.00
-$1.00
$0.00
$1.00
$2.00
$3.00
Jan-15 Jan-16 Jan-17 Jan-18 Jan-19
-$15.00
-$10.00
-$5.00
$0.00
$5.00
$10.00
$15.00
$ /
mm
btu
$ /
bb
l
Brent Dominion
12,000
14,000
16,000
18,000
20,000
22,000
24,000
26,000
28,000
30,000
50
70
90
110
130
150
Jan-14 Jul-14 Jan-15 Jul-15 Jan-16 Jul-16 Jan-17 Jul-17 Jan-18
mm
cf/
d
mb
bl/
d
Oil Gas
85
26,031367
454
282328 299 269
493
373 370305 307
439
205
Feb-18 Apr-18 Jun-18 Aug-18 Oct-18 Dec-18 Feb-19
H V+D
Ann'd
Date Buyer Seller Asset Description Value(1)
Proved
Multiple
Prod.
Multiple Net Acres
($mm) ($/mcfe) ($/mcfe/d) ($/acre)(2)
15-Oct-18 Undisclosed Buyer Range Resources Corp Overriding royalty interests in Appalachia $300 n.a. $17,649 nmf
27-Aug-18 PennEnergy Resources Rex Energy Corp 141,026 net acres in PA and OH $601 $0.58 $2,781 $4,258
26-Jul-18 Encino Acquisition Partners Chesapeake 938,000 net acres in the Utica $1,900 $0.66 $2,960 $2,026
29-Jun-18 Ascent Resources LLC Utica Minerals; Undisclosed 35,400 acres in the Utica $700 n.a. $15,217 $19,774
29-Jun-18 Ascent Resources LLC CNX Resources; Hess 78,000 acres in the Utica $800 n.a. $4,762 $10,256
Mean $860 $0.62 $8,674 $9,079
Median $700 $0.62 $4,762 $7,257
Blue = BMO provided transaction advisory services Green = BMO provided acquisition financing or related services
Purple = BMO provided both transaction advisory services and acquisition financing or related services
--$2,000$4,000$6,000$8,000
$10,000$12,000
1Q
15
2Q
15
3Q
15
4Q
15
1Q
16
2Q
16
3Q
16
4Q
16
1Q
17
2Q
17
3Q
17
4Q
17
1Q
18
2Q
18
3Q
18
4Q
18
1Q
19
0 1 0 0 1 2 2 4 2 4 1 3 1 3 2 0 0
$ /
acre
# Deals
$2,083
--$5,000
$10,000$15,000$20,000$25,000$30,000
1Q
15
2Q
15
3Q
15
4Q
15
1Q
16
2Q
16
3Q
16
4Q
16
1Q
17
2Q
17
3Q
17
4Q
17
1Q
18
2Q
18
3Q
18
4Q
18
1Q
19
0 1 0 0 1 2 2 3 2 5 1 4 3 4 3 1 0
$ /
mcfe
/d
# Deals
$4,825
Appalachia Snapshot
TRANSACTION ACTIVITY (EXCLUDES CORPORATE DEALS)
PERMITTING ACTIVITY BY MONTH
DIFFERENTIALS RIG COUNT
Source: BMO Transaction Database, Baker Hughes, BMO Commodity Products Group, Bloomberg, Drilling Info, PLS
Note: Current quarter’s data is through the week covered by this issue.
1. Represents total enterprise value. Excludes transactions with deal value <$20 million. 2. $/acre multiple not adjusted for value associated with production.
3. Red line denotes average since 01-Jan-17. Calculated as the weighted average of each quarter’s transactions.
4. Production valued at $3,000/mcfepd in 2014, and $2,000/mcfepd in 2015, 2016, 2017, 2018, and 2019.
TRANSACTION PRODUCTION MULTIPLES(3) TRANSACTION ADJUSTED NET ACRE MULTIPLES(3,4)
GROSS PRODUCTION

12
February 25, 2019
Item Value Wkly Change Last Week Item Value Wkly Change Last Week
Rig Count 57 -- 57 Oil Differential ($0.25) ($0.50) $0.25
Permitting Activity 18 (19) 37 Gas Differential ($0.31) -- ($0.31)
0%
5%
10%
15%
20%
--
50
100
150
200
Jan-14 Jan-15 Jan-16 Jan-17 Jan-18 Jan-19
H V+D % of Total Rigs
-$1.00
-$0.50
$0.00
$0.50
Jan-15 Jan-16 Jan-17 Jan-18 Jan-19
-$20.00
-$10.00
$0.00
$10.00
$ /
mm
btu
$ /
bb
l
Clearbrook CIG
1,100
1,300
1,500
1,700
1,900
2,100
2,300
2,500
800
900
1,000
1,100
1,200
1,300
1,400
Jan-14 Jul-14 Jan-15 Jul-15 Jan-16 Jul-16 Jan-17 Jul-17 Jan-18
mm
cf/
d
mb
bl/
d
Oil Gas
1,195
2,234
104126
108138 126
171 164
127
201
12896
133
85
Feb-18 Apr-18 Jun-18 Aug-18 Oct-18 Dec-18 Feb-19
H V+D
Ann'd
Date Buyer Seller Asset Description Value(1)
Proved
Multiple
Prod.
Multiple Net Acres
($mm) ($/boe) ($/boe/d) ($/acre)(2)
31-Jul-18 Northern Oil and Gas W Energy Partners 10,600 net acres in Williston Basin $288 n.a. $42,708 $27,196
18-Jul-18 Northern Oil and Gas Pivotal Petroleum Partners LP Producing assets in Williston Basin $152 n.a. $37,032 n.a.
12-Jul-18 PetroShale Inc Slawson Exploration Co 1,981 net acres in Williston Basin $55 $6.04 $100,000 $27,764
06-Jul-18 Energy Resources 12 LP Bruin E&P Partners LLC 2.8% non-operated WI in Bakken assets $83 n.a. n.a. n.a.
25-Jun-18 Riverbend Oil & Gas LLC Oasis Petroleum 10,167 net acres in Williston Basin $153 n.a. $49,196 $15,049
Mean $146 $6.04 $57,234 $23,336
Median $152 $6.04 $45,952 $27,196
Blue = BMO provided transaction advisory services Green = BMO provided acquisition financing or related services
Purple = BMO provided both transaction advisory services and acquisition financing or related services
--
$20,000
$40,000
$60,000
$80,000
1Q
15
2Q
15
3Q
15
4Q
15
1Q
16
2Q
16
3Q
16
4Q
16
1Q
17
2Q
17
3Q
17
4Q
17
1Q
18
2Q
18
3Q
18
4Q
18
1Q
19
0 1 1 4 0 2 3 3 0 1 3 3 0 6 3 0 0
$ /
bo
e/d
# Deals
$43,532
--
$5,000
$10,000
$15,000
$20,000
$25,000
1Q
15
2Q
15
3Q
15
4Q
15
1Q
16
2Q
16
3Q
16
4Q
16
1Q
17
2Q
17
3Q
17
4Q
17
1Q
18
2Q
18
3Q
18
4Q
18
1Q
19
0 0 1 2 0 0 2 3 1 0 3 2 0 5 2 0 0
$ /
acre
# Deals
$2,712
Bakken Snapshot
TRANSACTION ACTIVITY (EXCLUDES CORPORATE DEALS)
PERMITTING ACTIVITY BY MONTH
DIFFERENTIALS RIG COUNT
Source: BMO Transaction Database, Baker Hughes, BMO Commodity Products Group, Bloomberg, Drilling Info, PLS
Note: Current quarter’s data is through the week covered by this issue.
1. Represents total enterprise value. Excludes transactions with deal value <$20 million. 2. $/acre multiple not adjusted for value associated with production.
3. Red line denotes average since 01-Jan-17. Calculated as the weighted average of each quarter’s transactions.
4. Production valued at $45,000/boepd in 2014, $30,000/boepd in 2015, $35,000/boepd in 2016 & 2017, and $40,000/boepd in 2018 & 2019.
TRANSACTION PRODUCTION MULTIPLES(3) TRANSACTION ADJUSTED NET ACRE MULTIPLES(3,4)
GROSS PRODUCTION

13
February 25, 2019
Item Value Wkly Change Last Week Item Value Wkly Change Last Week
Rig Count 82 (1) 83 Oil Differential ($0.25) ($0.50) $0.25
Permitting Activity 21 (160) 181 Gas Differential ($0.31) -- ($0.31)
0%
5%
10%
15%
20%
--
50
100
150
Jan-14 Jan-15 Jan-16 Jan-17 Jan-18 Jan-19
H V+D % of Total Rigs
Ann'd
Date Buyer Seller Asset Description Value(1)
Proved
Multiple
Prod.
Multiple Net Acres
($mm) ($/boe) ($/boe/d) ($/acre)(2)
14-Feb-19 Undisclosed Buyer Harvest Oil & Gas Corp San Juan Basin assets $43 $1.57 $10,835 n.a.
01-Oct-18 DJR Energy LLC Encana 182,000 net acres in San Juan Basin $480 n.a. $88,889 $2,637
28-Aug-18 Vermilion Energy Inc Massif Oil & Gas LLC 55,000 acres in Powder River Basin $150 n.a. $56,604 $2,727
28-Aug-18 Rebellion Energy II LLC Liberty Resources II LLC 19,000 net acres in Powder River Basin $100 n.a. n.a. $5,263
09-Aug-18 Undisclosed Buyer Ultra Petroleum ~8,000 net acres in the Uinta $75 n.a. $37,500 $9,375
Mean $170 $1.57 $48,457 $5,001
Median $100 $1.57 $47,052 $3,995
Blue = BMO provided transaction advisory services Green = BMO provided acquisition financing or related services
Purple = BMO provided both transaction advisory services and acquisition financing or related services
-$1.00
-$0.50
$0.00
$0.50
Jan-15 Jan-16 Jan-17 Jan-18 Jan-19
-$20.00
-$10.00
$0.00
$10.00
$ /
mm
btu
$ /
bb
l
Clearbrook CIG
11,500
12,000
12,500
13,000
13,500
14,000
400
500
600
700
800
900
Jan-14 Jul-14 Jan-15 Jul-15 Jan-16 Jul-16 Jan-17 Jul-17 Jan-18
mm
cf/
d
mb
bl/
d
Oil Gas
763
12,887
460
650
327456
551666
523 510
681
824 807
346275
Feb-18 Apr-18 Jun-18 Aug-18 Oct-18 Dec-18 Feb-19
H V+D
--
$5,000
$10,000
$15,000
$20,000
1Q
15
2Q
15
3Q
15
4Q
15
1Q
16
2Q
16
3Q
16
4Q
16
1Q
17
2Q
17
3Q
17
4Q
17
1Q
18
2Q
18
3Q
18
4Q
18
1Q
19
0 0 3 3 0 1 1 0 1 0 1 5 2 0 2 1 0
$ /
acre
# Deals
$4,655
--$20,000$40,000$60,000$80,000
$100,000$120,000
1Q
15
2Q
15
3Q
15
4Q
15
1Q
16
2Q
16
3Q
16
4Q
16
1Q
17
2Q
17
3Q
17
4Q
17
1Q
18
2Q
18
3Q
18
4Q
18
1Q
19
2 0 4 4 1 6 2 0 1 6 3 9 3 1 3 1 1
$ /
bo
e/d
# Deals
$37,548
TRANSACTION ACTIVITY (EXCLUDES CORPORATE DEALS)
PERMITTING ACTIVITY BY MONTH
DIFFERENTIALS
Rockies (excl. Bakken) Snapshot
RIG COUNT
Source: BMO Transaction Database, Baker Hughes, BMO Commodity Products Group, Bloomberg, Drilling Info, PLS
Note: Current quarter’s data is through the week covered by this issue.
1. Represents total enterprise value. Excludes transactions with deal value <$20 million. 2. $/acre multiple not adjusted for value associated with production.
3. Red line denotes average since 01-Jan-17. Calculated as the weighted average of each quarter’s transactions.
4. Production valued at $45,000/boepd in 2014, $30,000/boepd in 2015, $35,000/boepd in 2016 & 2017, and $40,000/boepd in 2018 & 2019.
TRANSACTION PRODUCTION MULTIPLES(3) TRANSACTION ADJUSTED NET ACRE MULTIPLES(3,4)
GROSS PRODUCTION
14
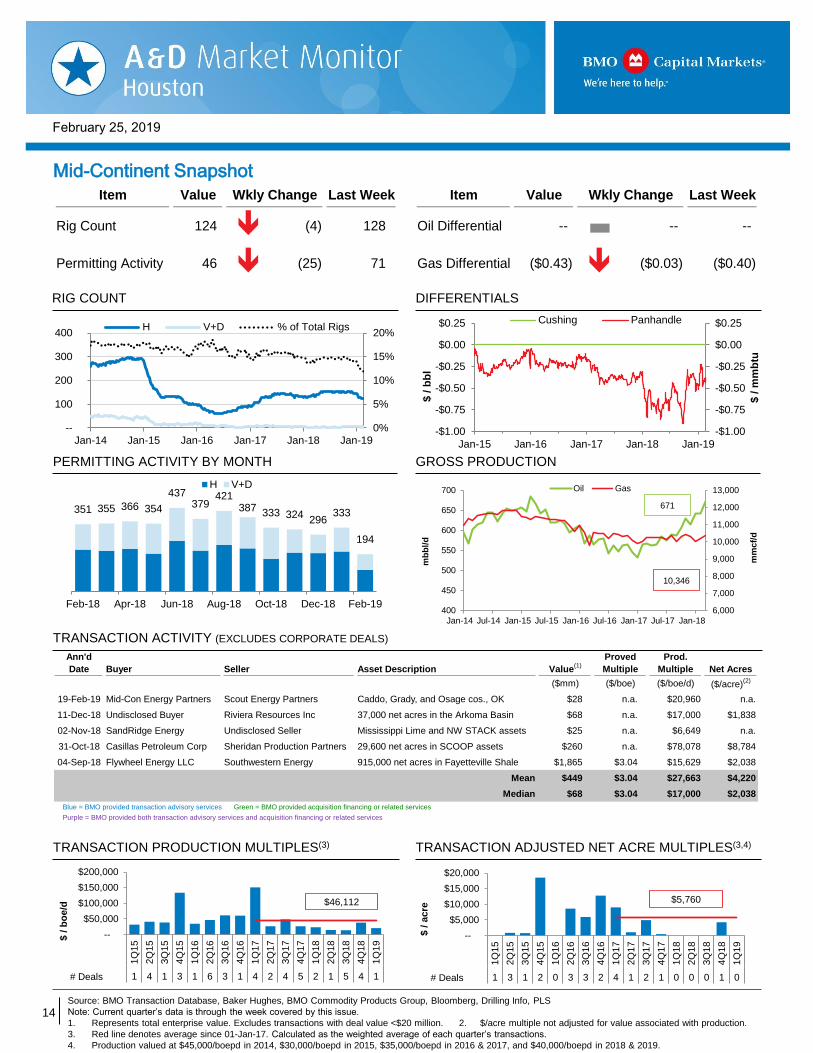
February 25, 2019
Item Value Wkly Change Last Week Item Value Wkly Change Last Week
Rig Count 124 (4) 128 Oil Differential -- -- --
Permitting Activity 46 (25) 71 Gas Differential ($0.43) ($0.03) ($0.40)
0%
5%
10%
15%
20%
--
100
200
300
400
Jan-14 Jan-15 Jan-16 Jan-17 Jan-18 Jan-19
H V+D % of Total Rigs
-$1.00
-$0.75
-$0.50
-$0.25
$0.00
$0.25
Jan-15 Jan-16 Jan-17 Jan-18 Jan-19
-$1.00
-$0.75
-$0.50
-$0.25
$0.00
$0.25
$ /
mm
btu
$ /
bb
l
Cushing Panhandle
6,000
7,000
8,000
9,000
10,000
11,000
12,000
13,000
400
450
500
550
600
650
700
Jan-14 Jul-14 Jan-15 Jul-15 Jan-16 Jul-16 Jan-17 Jul-17 Jan-18
mm
cf/
d
mb
bl/
d
Oil Gas
671
10,346
351 355 366 354
437379
421387 333 324
296333
194
Feb-18 Apr-18 Jun-18 Aug-18 Oct-18 Dec-18 Feb-19
H V+D
Ann'd
Date Buyer Seller Asset Description Value(1)
Proved
Multiple
Prod.
Multiple Net Acres
($mm) ($/boe) ($/boe/d) ($/acre)(2)
19-Feb-19 Mid-Con Energy Partners Scout Energy Partners Caddo, Grady, and Osage cos., OK $28 n.a. $20,960 n.a.
11-Dec-18 Undisclosed Buyer Riviera Resources Inc 37,000 net acres in the Arkoma Basin $68 n.a. $17,000 $1,838
02-Nov-18 SandRidge Energy Undisclosed Seller Mississippi Lime and NW STACK assets $25 n.a. $6,649 n.a.
31-Oct-18 Casillas Petroleum Corp Sheridan Production Partners 29,600 net acres in SCOOP assets $260 n.a. $78,078 $8,784
04-Sep-18 Flywheel Energy LLC Southwestern Energy 915,000 net acres in Fayetteville Shale $1,865 $3.04 $15,629 $2,038
Mean $449 $3.04 $27,663 $4,220
Median $68 $3.04 $17,000 $2,038
Blue = BMO provided transaction advisory services Green = BMO provided acquisition financing or related services
Purple = BMO provided both transaction advisory services and acquisition financing or related services
--
$50,000
$100,000
$150,000
$200,000
1Q
15
2Q
15
3Q
15
4Q
15
1Q
16
2Q
16
3Q
16
4Q
16
1Q
17
2Q
17
3Q
17
4Q
17
1Q
18
2Q
18
3Q
18
4Q
18
1Q
19
1 4 1 3 1 6 3 1 4 2 4 5 2 1 5 4 1
$ /
bo
e/d
# Deals
$46,112
--
$5,000
$10,000
$15,000
$20,000
1Q
15
2Q
15
3Q
15
4Q
15
1Q
16
2Q
16
3Q
16
4Q
16
1Q
17
2Q
17
3Q
17
4Q
17
1Q
18
2Q
18
3Q
18
4Q
18
1Q
19
1 3 1 2 0 3 3 2 4 1 2 1 0 0 0 1 0
$ /
acre
# Deals
$5,760
Mid-Continent Snapshot
TRANSACTION ACTIVITY (EXCLUDES CORPORATE DEALS)
PERMITTING ACTIVITY BY MONTH
DIFFERENTIALS RIG COUNT
Source: BMO Transaction Database, Baker Hughes, BMO Commodity Products Group, Bloomberg, Drilling Info, PLS
Note: Current quarter’s data is through the week covered by this issue.
1. Represents total enterprise value. Excludes transactions with deal value <$20 million. 2. $/acre multiple not adjusted for value associated with production.
3. Red line denotes average since 01-Jan-17. Calculated as the weighted average of each quarter’s transactions.
4. Production valued at $45,000/boepd in 2014, $30,000/boepd in 2015, $35,000/boepd in 2016 & 2017, and $40,000/boepd in 2018 & 2019.
TRANSACTION PRODUCTION MULTIPLES(3) TRANSACTION ADJUSTED NET ACRE MULTIPLES(3,4)
GROSS PRODUCTION

15
February 25, 2019
Item Value Wkly Change Last Week Item Value Wkly Change Last Week
Rig Count 19 (2) 21 Oil Differential $8.50 ($0.60) $9.10
Permitting Activity 6 (1) 7 Gas Differential -- -- --
0%
5%
10%
15%
20%
--
10
20
30
40
Jan-14 Jan-15 Jan-16 Jan-17 Jan-18 Jan-19
Deep Water Shelf % of Total Rigs
--
$2.00
$4.00
$6.00
$8.00
$10.00
Jan-15 Jan-16 Jan-17 Jan-18 Jan-19
--
$2.00
$4.00
$6.00
$8.00
$10.00
$ /
mm
btu
$ /
bb
l
LLS Henry Hub
2,000
2,500
3,000
3,500
4,000
4,500
1,000
1,100
1,200
1,300
1,400
1,500
1,600
1,700
1,800
1,900
Jan-14 Jul-14 Jan-15 Jul-15 Jan-16 Jul-16 Jan-17 Jul-17 Jan-18
mm
cf/
d
mb
bl/
d
Oil Gas1,683
2,647
1319
2733
29 2932 33
39
3230 30
24
Feb-18 Apr-18 Jun-18 Aug-18 Oct-18 Dec-18 Feb-19
Ann'd
Date Buyer Seller Asset Description Value(2)
Proved
Multiple
Prod.
Multiple Net Acres
($mm) ($/boe) ($/boe/d) ($/acre)(3)
16-Jan-19 Talos Energy Inc Samson Energy Co LLC Non-op Gulf of Mexico working interest $30 $13.45 $17,939 n.a.
10-Oct-18 Murphy Petrobras Gulf of Mexico joint venture $900 $15.00 $21,951 n.a.
04-Sep-18 Talos Energy Inc Whistler Energy II LLC Leases in Green Canyon federal waters $91 n.a. $60,667 n.a.
27-Apr-18 Stone Energy Shell; ExxonMobil; Anadarko GOM Ram Powell assets $234 n.a. $38,361 n.a.
28-Mar-18 W&T Offshore Cobalt International Energy 9.375% non-op WI in the Heidelberg unit $31 $23.92 $9,345 n.a.
Mean $257 $17.46 $29,653 n.a.
Median $91 $15.00 $21,951 n.a.
Blue = BMO provided transaction advisory services Green = BMO provided acquisition financing or related services
Purple = BMO provided both transaction advisory services and acquisition financing or related services
--
$10
$20
$30
$40
1Q
15
2Q
15
3Q
15
4Q
15
1Q
16
2Q
16
3Q
16
4Q
16
1Q
17
2Q
17
3Q
17
4Q
17
1Q
18
2Q
18
3Q
18
4Q
18
1Q
19
0 0 1 0 0 0 2 1 0 0 0 1 2 1 0 1 1
$ /
bo
e
# Deals
$18.10
--
$15,000
$30,000
$45,000
$60,000
1Q
15
2Q
15
3Q
15
4Q
15
1Q
16
2Q
16
3Q
16
4Q
16
1Q
17
2Q
17
3Q
17
4Q
17
1Q
18
2Q
18
3Q
18
4Q
18
1Q
19
0 0 1 1 0 0 2 0 0 0 0 1 2 2 2 1 1
$ /
bo
e/d
# Deals
$32,164
Gulf of Mexico Snapshot
PERMITTING ACTIVITY BY MONTH(1)
DIFFERENTIALS RIG COUNT
Source: BMO Transaction Database, Baker Hughes, BMO Commodity Products Group, Bloomberg, Drilling Info, PLS
Note: Current quarter’s data is through the week covered by this issue.
1. Permits include directional and unidentified drilling permits. 2. Represents total enterprise value. Excludes transactions with deal value <$20 million.
3. $/acre multiple not adjusted for value associated with production.
4. Red line denotes average since 01-Jan-17. Calculated as the weighted average of each quarter’s transactions.
GROSS PRODUCTION
TRANSACTION ACTIVITY (EXCLUDES CORPORATE DEALS)
TRANSACTION PRODUCTION MULTIPLES(4) TRANSACTION PROVED RESERVE MULTIPLES(4)

16
February 25, 2019
Upcoming Industry Events
Disclaimer: The foregoing links are for convenience only and relate to materials that were not prepared or reviewed by BMO Capital Markets. BMO Capital Markets takes
no responsibility for and makes no representations with respect to the contents thereof. These materials may be inconsistent with the views of BMO Capital Markets.
Note: Event features a speaker from BMO Houston’s A&D Group.
Click event to open
July 2019 Jul 16 Houston Producers Forum Luncheon
Jul 19 ADAM-Houston Monthly Luncheon
April 2019 Apr 8-9 IPAA Oil & Gas Investment Symposium
Apr 15 DUG Sand (Fort Worth)
Apr 15 DUG Water (Fort Worth)
Apr 15-17 DUG Permian (Fort Worth)
Apr 17 176th OPEC Meeting
Apr 16 Houston Producers Forum Luncheon
Apr 19 ADAM-Houston Monthly Luncheon
ADAM-Houston Monthly Luncheon – 3rd Friday
Houston Producers Forum Luncheon – 3rd Tuesday
May 2019 May 6-9 Offshore Technology Conference
May 10 Petroleum Resources Economics Conference
May 13-17 SPE Electric Submersible Pumps Symposium
May 14-15 DUG Rockies (Denver)
May 14 Houston Producers Forum Luncheon
May 16 IADC Drilling Onshore Conference & Exhibition
May 17 ADAM-Houston Monthly Luncheon
June 2019 Jun 5-6 Midstream Texas Conference & Exhibition
Jun 18 Houston Producers Forum Luncheon
Jun 18-20 DUG East (Pittsburgh)
Jun 19-20 IADC World Drilling Conference & Exhibition
Jun 21 ADAM-Houston Monthly Luncheon
Jun 24-26 IPAA Midyear Meeting
August 2019 Aug 16 ADAM-Houston Monthly Luncheon
Aug 20 IPAA Oil & Gas Overview Course
Aug 20 Houston Producers Forum Luncheon
Aug 21-22 Summer NAPE
September 2019 Sep 17 Houston Producers Forum Luncheon
Sep 20 ADAM-Houston Monthly Luncheon
Sep 24-26 DUG Eagle Ford (San Antonio)
Sep 30-Oct 2 SPE Annual Technical Conference and Exhibition
January 2019 Jan 31 SPE A&D Symposium
October 2019 Oct 9 IPAA Leaders in Industry Luncheon
Oct 15 Houston Producers Forum Luncheon
Oct 18 ADAM-Houston Monthly Luncheon
Oct 22-23 A&D Strategies and Opportunities Conference
2020
Apr 20-22 OGIS New York
Jul 22-24 SPE Unconventional Resources Technology
Aug 11-14 Enercom Oil & Gas Conference
November 2019 Nov 4-6 Executive Oil Conference & Exhibition
Nov 15 ADAM-Houston Monthly Luncheon
Nov 19 IPAA Oil & Gas for Newcomers
Nov 19 Houston Producers Forum Luncheon
Nov 19-21 DUG Midcontinent (Oklahoma City)
December 2019 Dec 17 Houston Producers Forum Luncheon
Dec 20 ADAM-Houston Monthly Luncheon
January 2019 Jan 15 Houston Producers Forum Luncheon
Jan 25 ADAM-Houston Monthly Luncheon
Jan 24 IPAA Private Capital Conference
Jan 31 SPE A&D Symposium
March 2019
Mar 5-7 IADC/SPE Drilling Conference
Mar 15 ADAM-Houston Monthly Luncheon
Mar 19 Houston Producers Forum Luncheon
Mar 26-28 International Petroleum Technology Conference
Mar 5 Hart’s Energy Capital Conference
January 2020 Jan 23 IPAA Private Capital Conference
Jan 17 ADAM-Houston Monthly Luncheon
Jan 21 Houston Producers Forum Luncheon
February 2020 Feb 19 Houston Producers Forum Luncheon
Feb 25-26 DUG Haynesville (Shreveport)

17
February 25, 2019
SCOOP/STACK/Merge
DJ-Niobrara
Eagle Ford
Haynesville
Granite Wash
GOM
Permian
Marcellus
Utica
Williston
Gulf Coast Onshore
Piceance
Powder River Green River
Legend
Current
Change
This material is prepared by the BMO Capital Markets’ Investment and Corporate Banking Department, for distribution to BMO Capital Markets’ clientele. It is not a product of
BMO Capital Markets’ Research Department. The views of the Investment and Corporate Banking Department may differ from those of the Research Department.
BMO Capital Markets is a trade name used by BMO Financial Group for the wholesale banking businesses of Bank of Montreal, BMO Harris Bank N.A. (member FDIC), Bank of Montreal
Ireland p.l.c, and Bank of Montreal (China) Co. Ltd and the institutional broker dealer businesses of BMO Capital Markets Corp. (Member FINRA and SIPC) in the U.S., BMO Nesbitt
Burns Inc. (Member Investment Industry Regulatory Organization of Canada and Member Canadian Investor Protection Fund) in Canada and Asia and BMO Capital Markets Limited
(authorised and regulated by the Financial Conduct Authority) in Europe and Australia. “Nesbitt Burns” is a registered trademark of BMO Nesbitt Burns Inc., used under license. “BMO
Capital Markets” is a trademark of Bank of Montreal, used under license. "BMO (M-Bar roundel symbol)" is a registered trademark of Bank of Montreal, used under license. ® Registered
trademark of Bank of Montreal in the United States, Canada and elsewhere. ™ Trademark of Bank of Montreal in the United States and Canada.
Bank of Montreal or its subsidiaries (“BMO Financial Group”) has lending arrangements with, or provide other remunerated services to, many issuers covered by BMO Capital Markets.
The opinions, estimates and projections contained in this report are those of BMO Capital Markets as of the date of this report and are subject to change without notice. BMO Capital
Markets endeavors to ensure that the contents have been compiled or derived from sources that we believe are reliable and contain information and opinions that are accurate and
complete. However, BMO Capital Markets makes no representation or warranty, express or implied, in respect thereof, takes no responsibility for any errors and omissions contained
herein and accepts no liability whatsoever for any loss arising from any use of, or reliance on, this report or its contents. Information may be available to BMO Capital Markets or its
affiliates that is not reflected in this report. The information in this report is not intended to be used as the primary basis of investment decisions, and because of individual client
objectives, should not be construed as advice designed to meet the particular investment needs of any investor. This material is for information purposes only and is not an offer to sell or
the solicitation of an offer to buy any security. BMO Capital Markets or its affiliates will buy from or sell to customers the securities of issuers mentioned in this report on a principal basis.
BMO Capital Markets or its affiliates, officers, directors or employees have a long or short position in many of the securities discussed herein, related securities or in options, futures or
other derivative instruments based thereon. BMO Capital Markets may act as financial advisor and/or underwriter for the issuers mentioned herein and may receive remuneration for
same. The reader should assume that BMO Capital Markets or its affiliates may have a conflict of interest and should not rely solely on this report in evaluating whether or not to buy or
sell securities of issuers discussed herein.
All values in this document are in US$ unless otherwise specified.
Source of rig count stats: Baker Hughes
Rig Count Summary
MAPS IN
MASTER VIEW
Contacts
Disclaimer
Geoff Roberts
MD & Co-Head of U.S. A&D
713-518-1268
Jason Martinez
MD & Co-Head of U.S. A&D
713-546-9771
Howard Barnwell
MD & Transactions Mgr.
713-546-9767
Rob Priske
MD & Transactions Mgr.
713-546-9727
Marian Yu
Associate
Aaron Moeller
Associate
Jennifer Boudreaux
Analyst
BMO uses updated basin outlines, and the resulting rig counts, to more accurately represent current basin knowledge. The data below reflect these changes
and is different than those shown by Baker Hughes. The totals are the same.
473
--
57
--
19
--
62
132
1
19
(2)
10
188
(4)
68
1
97
(1)
19
--
5
(2)
23
--19
--
[TBU]
Chelsea Neville
Transactions Coordinator
This
Week Change
Last
Week
Last
Year
Total Rigs 1,047 (4) 1,051 978
Oil 853 (4) 857 799
Gas 194 -- 194 179
Miscellaneous -- -- -- --
Directional 68 (2) 70 69
Horizontal 916 1 915 842
Vertical 63 (3) 66 67
Basin
Permian 473 -- 473 435
SCOOP/STACK/Merge 88 (4) 92 101
Granite Wash 10 1 9 18
Eagle Ford 97 (1) 98 86
Haynesville 68 1 67 59
Marcellus 62 1 61 54
Utica 19 -- 19 23
Williston 57 -- 57 50
DJ-Niobrara 32 1 31 26
Green River 19 -- 19 20
Powder River 23 -- 23 17
Piceance 5 (2) 7 7
Gulf Coast Onshore 19 -- 19 18
GOM 19 (2) 21 17
Alaska 13 1 12 9
Other 43 -- 43 38
Mid-Con 26 (1) 27 16
Rockies 3 -- 3 5
Western 12 1 11 14
Eastern 2 -- 2 3