Promoting food security through innovative rural finance and risk management tools
38
www.fao.org/ag/ ags Promoting food security through innovative rural finance and risk management tools Calvin Miller Senior Officer and Group Leader, AGS Emilio Hernandez Agricultural Finance Officer, AGS 15 July 2015 Rome, FAO HQ
-
Upload
food-and-agriculture-organization-of-the-united-nations -
Category
Education
-
view
255 -
download
1
Transcript of Promoting food security through innovative rural finance and risk management tools

www.fao.org/ag/ags
Promoting food securitythrough innovative rural financeand risk management tools
Calvin MillerSenior Officer and Group Leader, AGS
Emilio HernandezAgricultural Finance Officer, AGS
15 July 2015
Rome, FAO HQ
1. Results from FAO-AGS global agenda: A framework to assess trends in rural financial markets in the developing world
2. Lessons from the field: rising innovation in agricultural finance and risk management: an inclusive process?
3. Key takeaways4. Discussant views5. Questions and answers
Content


Source: Author compilation using WASDE, USDA data
World total consumption and supply of grains and oils seeds (in trillions of MT)
An analytical framework: The active search of the agricultural sector to satisfy a growing demand
0
500
1000
1500
2000
2500
3000
3500
1993
/94
1994
/95
1995
/96
1996
/97
1997
/98
1998
/99
1999
/00
2000
/01
2001
/02
2002
/03
2003
/04
2004
/05
2005
/06
2006
/07
2007
/08
2008
/09
2009
/10
2010
/11
2011
/12
2012
/13
Supply
Consumption

The increase in supply has been similar across the world
Total production of different commodities in Asia, LAC and Africa (in thousands of MT)
Source: FAOSTAT 1993
1994
1995
1996
1997
1998
1999
2000
2001
2002
2003
2004
2005
2006
2007
2008
2009
2010
2011
2012
020000400006000080000
100000120000140000160000180000200000
Asia Latin America
Africa
1993
1994
1995
1996
1997
1998
1999
2000
2001
2002
2003
2004
2005
2006
2007
2008
2009
2010
2011
2012
0
50000
100000
150000
200000
250000
Cereals
Fruits and vegetables
Meats
1993
1995
1997
1999
2001
2003
2005
2007
2009
2011
0
200000
400000
600000
800000
1000000
1200000
1400000

Some agricultural products are increasing in value more than others
Total export value of different commodities in Asia, LAC and Africa (in millions of USD)
Source: FAOSTAT
Asia Latin America
Africa1993
1994
1995
1996
1997
1998
1999
2000
2001
2002
2003
2004
2005
2006
2007
2008
2009
2010
2011
0
10000
20000
30000
40000
50000
60000
19931995
19971999
20012003
20052007
20092011
01000020000300004000050000600007000080000
19931995
19971999
20012003
20052007
20092011
0
2000
4000
6000
8000
10000
12000
Cereals
Fruits and vegetables
Meats

Rise in supply strongly determined by a rise in aggregate productivity levels globally
Average yields for different commodities in Asia, LAC and Africa (in thousands of Hg/Ha)
Source: FAOSTAT
Asia Latin America
Africa
Cereals
Fruits and vegetables
19931995
19971999
20012003
20052007
20092011
020406080
100120140160180
19931995
19971999
20012003
20052007
20092011
0
50
100
150
200
1993
1994
1995
1996
1997
1998
1999
2000
2001
2002
2003
2004
2005
2006
2007
2008
2009
2010
2011
2012
0102030405060708090
100

Source: Fuglie, K.O. 2012, “Productivity Growth and Technology Capital in the Global Agricultural Economy”, in Fuglie, K.O., S.L. Wang, and V.E. Ball (eds.) (2012), Productivity Growth in Agriculture: An International Perspective, CAB International, Oxfordshire, UK.
Productivity gains have been the main source of output growth
Sources of agricultural output growth rate globally

A critical determinant of productivity has been long-term investment in agriculture
Agricultural capital stock in Asia, LAC and Africa (in million of 2005 USD)
Source: FAOSTAT
Asia Latin America and the Caribbean
Africa
1990
1991
1992
1993
1994
1995
1996
1997
1998
1999
2000
2001
2002
2003
2004
2005
2006
2007
680000
700000
720000
740000
760000
780000
800000
820000
19931994
19951996
19971998
19992000
20012002
20032004
20052006
200717000001750000180000018500001900000195000020000002050000210000021500002200000
1993
1994
1995
1996
1997
1998
1999
2000
2001
2002
2003
2004
2005
2006
2007
0
100000
200000
300000
400000
500000
600000

Dominance of domestic private investments in total agricultural capital stock
Components of agriculture investment for a sample of 31 developing countries
Source: ODI, 2012

Who has financed the rise in agricultural investments and how?
With important exceptions, the formal financial sector has played a very limited role in the provision of financial services to agriculture in developing countries.
Mounting evidence from global market analyses suggests informal sources of finance mainly from agricultural value chain (AVC) actors (i.e. wholesalers, processors, traders, warehouse operators, producer associations, etc.) have enabled a significant share of investments in agriculture.
These agents who are non-specialized financial service providers, are able to respond to the finance gap thanks to unique informational advantages. From their informal status, they have enabled a ‘quiet revolution’ in agribusiness operations that has effectively responded to the expansion in global demand for agricultural products.References: Reardon et al., 2012; Miller and Jones, 2010; Mildler 2008; Gonzalez-Vega, et al. 2006

Risk managementin rural and agricultural
finance
Agri-business segmentation Social and commercial insurances Traditional farming sector Emerging farming sector Commercial farming sector
Agricultural risk assessmentCapacity and competitiveness assessment Risk identification and quantificationSensitivity analysis
Agricultural risk financing Risk layering Index insurance Insurance pool Technology and
infrastructure (e.g. irrigation and warehouses)
Institutional capacity buildingData managementOrganization and governanceRegulatory/supervisory frameworkInformation and educationTechnical expertiseSavings and equity formation
Agricultural risk management

1991
1992
1993
1994
1995
1996
1997
1998
1999
2000
2001
2002
2003
2004
2005
2006
2007
2008
2009
2010
2011
2012
2013
0
2
4
6
8
10
12
Africa Asia & Pacific EuropeLatin America & Caribbean Other Developed World
Av
era
ge
Ag
ric
ult
ure
Sh
are
of
To
tal C
red
it, %
Agriculture share of credit by region, 1991-2013
Other Developed refers to Australia, New Zealand, Japan and North America
Source: FAO, 2015
The investment trends contrast with a declining share of formal credit to agriculture

The lag of formal financial services to agriculture in LAC from the firm’s perspectiveAg. credit as a share of total credit vs. ag. GDP as a share of total GDP for select countries in Latin America during 2010
Source: FAO, 2011
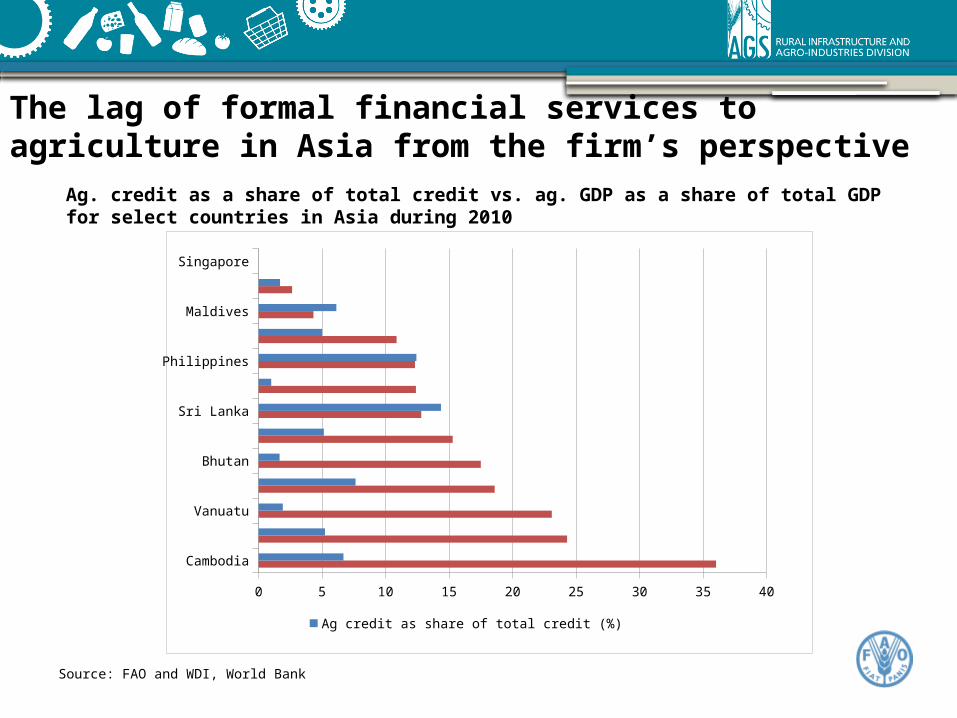
The lag of formal financial services to agriculture in Asia from the firm’s perspective
Ag. credit as a share of total credit vs. ag. GDP as a share of total GDP for select countries in Asia during 2010
Source: FAO and WDI, World Bank
Cambodia
Pakistan
Vanuatu
Bangladesh
Bhutan
Indonesia
Sri Lanka
Thailand
Philippines
Samoa
Maldives
Korea, Republic of
Singapore
0 5 10 15 20 25 30 35 40
Ag credit as share of total credit (%)Ag GDP as share of total GDP (%)

The lag of formal financial services to agriculture in Africa from the firm’s perspective
Ag. credit as a share of total credit vs. ag. GDP as a share of total GDP for select countries in Africa during 2010
Source: FAO and WDI, World Bank
Ethiopia
Liberia
Burundi
Rwanda
Malawi
Ghana
Tanzania
Uganda
Kenya
Sudan
Nigeria
Zambia
Namibia
Botswana
Seychelles
0 5 10 15 20 25 30 35 40 45 50
Ag credit as a share of total credit (%)Ag GDP as a share of total GDP (%)

The prominent role of informal financial services in rural areas of Sub-Saharan Africa
Total vs. formal use of saving and credit services in Sub-Saharan Africa region in 2011(% rural people)
Source: Compiled by author using FINDEX, 2012
0
5
10
15
20
25
30
35
40
45
50
% o
f ru
ral
po
pu
lati
on
Informal savingsmarket
Informal creditmarket

Source: Compiled by author using FINDEX, 2012
Informal credit market
Saved any money in the past year, rural
Saved at a financial institution in the past
year, rural
Loan in the past year, rural
Loan from a financial institution in the past
year, rural
0
5
10
15
20
25
30
35
% r
ural
pop
ulat
ion
Informal savings market
The prominent role of informal financial services in rural areas in East Asia and Pacific and South East Asia
Total vs. formal use of saving and credit services in the EAP and South Asia region in 2011(% rural people)

The prominent role of informal financial services in rural areas in Latin AmericaTotal vs. formal use of saving and credit services in the LAC (developing only) region in 2011 (% rural people)
Source: Compiled by author using FINDEX, 2012
Informal savings market Informal credit market

Limitations of informal finance and opportunities for the formal financial sector to serve rural areas and agriculture
The key limitation of the current scenario is that outreach is limited and the variety, adequacy and cost of financial services from these non-specialized sources are not optimal for clients. The lack of financial specialization comes at the cost of exclusion thus representing a sub-optimal equilibrium.
Motivation for field research: The macro evidence suggests an environment of constant innovation from a number of agricultural value chains actors, financial institutions and government to deliver rural and agricultural financial services by merging specialized knowledge from different actors to deal with complex climatic, production, marketing, and financial risks
References: Reardon et al., 2012; USAID, 2011; Gonzalez-Vega, et al. 2006

Producing Storing
Production
Price
Operational
Financing
Institutional
InfrastructureQuality controlTechnology
Logistics
Seasonal glut
Processing Marketing
InfrastructureStorage
Price
Product loss
Govt. policy
Technology
Product supply
Human resourceProduct qualityGovt. policy
Input Supply
Quality
Availability
InfrastructureKnowledge
Financing
These informal finance actors are able to assess risks that go beyond the individual client and include all aspects in the agricultural value chain
From supply-driven “how we lend” to client driven “how can we
structure finance to address client needs and risks”

Parafinanciera
Service Provider
Bank/
Non-bank Financial Institution
Individual
Producers
Family Groups
Civil Society
90 days 8 days
Financial Institution - Parafinanciera
Line of credit
Parafinanciera - Producer
Individual credit
Producer Organizations
FIRA parafinanciera credit delivery through VC intermediaries
Mexico – Innovations in financing smallholders
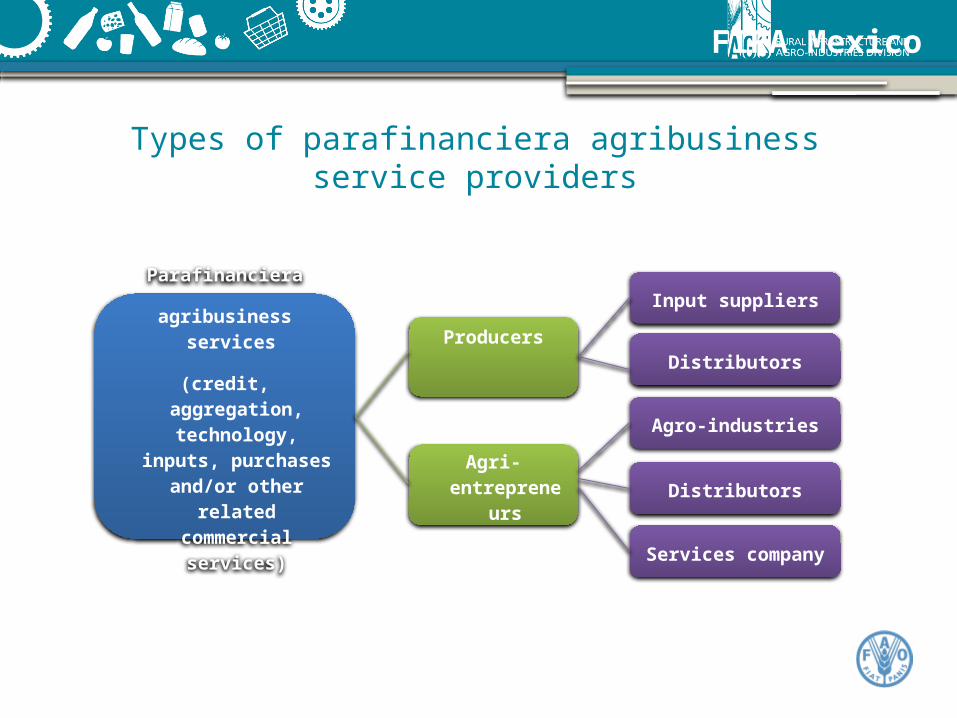
FIRA Mexico
Parafinanciera
agribusiness services
(credit, aggregation, technology, inputs,
purchases and/or other related commercial
services)
Agri-entrepreneurs
Services company
Distributors
Agro-industries
Distributors
Input suppliers
Producers
Types of parafinanciera agribusiness service providers

FIRA Mexico
Summary of the parafinanciera system

BRAC, Bangladesh -
BRAC Bank
BRAC Cold Storage
Potato farmers
Potato seed dealers
Wholesaler
Buyers/Farmers
Home Consumption &
Seeds
Potato production
Sales by Farmers
Seeds &
inputsFinancing
Financing
Financing
Financing LoanRepayments
Payment
Payment (Service Charge)
Seed Payment
Potato production, cold storage, finance and marketing

The ECX WHR Financing -lending
Ethiopian Commodity Exchange – managing market risks
T+1
60 (30) days

A blended approach to AgVCF inclusion
Companies
Farmers / groups
BDS providers
MFIs
Commercial Banks
Terrafina Local NGO
Rabo AdvisoryServices
FAO & Int NGOs
Rabobank (guarantee) Rabobank (loans)
Adapted from Harms
Ethiopian ComEx and WHR

Field level
monitoring
Assistance to farmers
Loan/lease
disbursement
Selection of farmersValue additions:
GuidanceMarket linkages
Problem identificationIntervention
Association
Farmer
Bank/ Mobile
Banking
United Finance Limited – lending, leasing, factoring
UFL, Bangladesh

Bolivia –Innovations led by specialized financial institutions: the case of CIDRE
Long term investment credit
Loan for irrigation
Payment for produce
Irrigation services
Credit payment
Sale of production
TA in irrigation management and governance
Source: Derived from CIDRE information
Irrigation management association
CIDRE
Traders of agricultural produce
for local markets
Member producers in communities
Suppliers of irrigation equipment

Key enablers of financial products offered
CIDRE: Focus on long-term credit products for agricultural irrigation Savvy search for long term funding for the FI Investment in R&D for product design based on modern
irrigation techniques and agricultural value chain dynamics Critical reliance on a regulatory framework allowing for
experimentation in rural finance services Ability to identify alternative collateral requirements:
irrigation shares
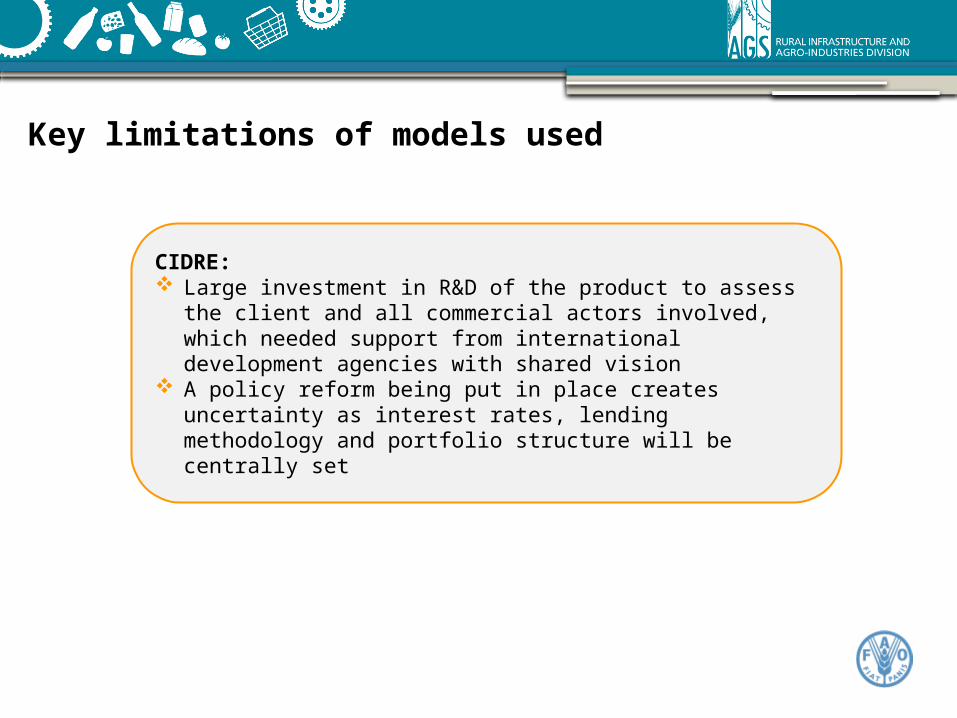
Key limitations of models used
CIDRE: Large investment in R&D of the product to assess the
client and all commercial actors involved, which needed support from international development agencies with shared vision
A policy reform being put in place creates uncertainty as interest rates, lending methodology and portfolio structure will be centrally set

CIDRE results
Fiscal year 2008 2009 2010 2011 2012 2013
Assets (millions of USD) 13.4 15.9 21.1 31.2 38.0 51.9
Number of active borrowers 4,198.0 2,836.0 4,194.0 5,156.0 7,180.0 9,344.0
% of rural borrowers 93.1 76.9 64.0 59.6 58.4 58.3Gross Loan Portfolio (millions of USD) 10.2 11.5 17.0 25.7 34.1 47.5
% PAR (30+ days) - - 2.13 1.91 1.68 0.0149
% gross loan portfolio, rural 81.6 71.9 5.0 52.6 55.0 54.6
Average outstanding balance 2,425.3 4,051.4 4,046.7 4,454.6 4,745.9 5,079.0
Operational self sufficiency 1.1 1.4 1.1 1.2 1.1 1.1
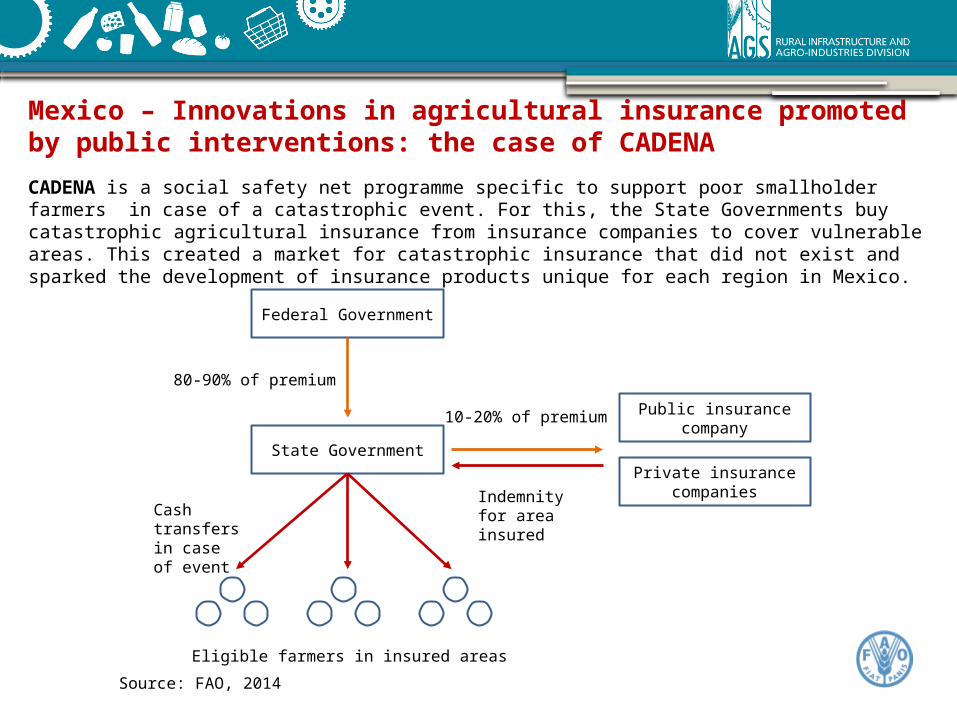
CADENA is a social safety net programme specific to support poor smallholder farmers in case of a catastrophic event. For this, the State Governments buy catastrophic agricultural insurance from insurance companies to cover vulnerable areas. This created a market for catastrophic insurance that did not exist and sparked the development of insurance products unique for each region in Mexico.
Mexico – Innovations in agricultural insurance promoted by public interventions: the case of CADENA
Federal Government
State GovernmentPrivate insurance
companies
Public insurance company
Eligible farmers in insured areas
80-90% of premium
10-20% of premium
Indemnity for area insured
Cash transfers in case of event
Source: FAO, 2014

Key enablers for the agricultural insurance product offered The budget for the program became predictable and fiscally manageable as
premiums are fixed ex-ante.
A national market was created for catastrophic agricultural insurance products (index and multi-peril), inclusive of high-risk and marginalized States, that did not exist before and that is uncommon globally given the challenge of insuring systemic risks.
Public and private insurance companies compete for that market and have the incentive to invest in the development of insurance products tailored to the risk-vulnerability ratio of each Mexican State. This enabled the expansion of the area covered per Peso spent, relative to an ex-post approach
The delivery of index insurance products are meant to insure a portfolio, not an individual farmer. The prevalence of basis risk in index insurance products is spread in a wide area and it is borne by the State so it is easier to tolerate

CADENA results
CADENA has facilitated a wide expansion of agricultural insurance covering 12 mo Ha in 2013 representing 65% of total area under production and covers 98% of the country’s municipalities. This represents a safety net for 3.7 mo smallholders, equivalent to 82% of the estimated smallholder population.
2003 2004 2005 2006 2007 2008 2009 2010 20110%
10%
20%
30%
40%
50%
60%
70%
80%
90%
100%
0
500
1000
1500
2000
2500
CADENA: Number and Percentage of Municipalities Insured
NUMBER OF MUNICIPALITIES INSURED % municipalities insured
Source: FAO, 2014 Source: Data from SAGARPA
Private and public share of the catastrophic insurance market
Coverage of CADENA at the municipality level

Key limitations of model used
Cost-efficiency depends greatly on State Governments building specialized units to determine most appropriate coverage needs, but large federal subsidies are a disincentive to do this. Relying only on coverage advice from insurance companies has not resulted in appropriate coverage for some States, resulting in additional public expenditures
Availability and sustainability of public resources to fund the programme (currently a premium market of over USD 190 m a year)
Pre-existing capacity of public agencies to collect and analyze relevant climatic and production time series data needs to exist in order to facilitate the development of new insurance products in the short term

Key takeaways
There is a favorable global agribusiness environment that motivates innovation mainly among private domestic agricultural actors that are heterogeneous and less organized, who are not well known
Agricultural financing innovations in business models, financial instruments and use of technology are able to include poorer smallholder families
The level of inclusion that is achievable will depend strongly on pre-existing conditions related to the enabling environment and level of local capacities
Depending on this context, different private or public leaders in the design of finance arrangements emerge, all of them forming partnerships between them to merge their unique knowledge on the various types of risks to manage
Barriers to making these partnerships systematic are the key constraint for mainstreaming innovations. These barriers relate to the difficulty of establishing coordination between actors that operate in very different professional networks

Thank you for your attention!
www.fao.org/ag/ags
www.ruralfinanceandinvestment.org