Project Report No. 631
100
September 2020 Project Report No. 631 Managing the resistance risk to retain long-term effectiveness of glyphosate for grass-weed control in UK crop rotations LV Tatnell and SK Cook 1 1 ADAS Boxworth, Battlegate road, Boxworth Cambridge CB23 4NN This is the final report of a 60-month project (21120023) that started in October 2015. The work was funded by Albaugh, FMC (Headland) Nufarm and Monsanto (Bayer) and a contract for £250,000 from AHDB (with in-kind contributions from Syngenta, Agrii, Frontier, Hutchinsons and Agrovista). While the Agriculture and Horticulture Development Board seeks to ensure that the information contained within this document is accurate at the time of printing, no warranty is given in respect thereof and, to the maximum extent permitted by law, the Agriculture and Horticulture Development Board accepts no liability for loss, damage or injury howsoever caused (including that caused by negligence) or suffered directly or indirectly in relation to information and opinions contained in or omitted from this document. Reference herein to trade names and proprietary products without stating that they are protected does not imply that they may be regarded as unprotected and thus free for general use. No endorsement of named products is intended, nor is any criticism implied of other alternative, but unnamed, products. AHDB Cereals & Oilseeds is a part of the Agriculture and Horticulture Development Board (AHDB).
Transcript of Project Report No. 631

September 2020
Project Report No. 631
Managing the resistance risk to retain long-term effectiveness of
glyphosate for grass-weed control in UK crop rotations
LV Tatnell and SK Cook1
1ADAS Boxworth, Battlegate road, Boxworth Cambridge CB23 4NN
This is the final report of a 60-month project (21120023) that started in October 2015. The work was funded by Albaugh, FMC (Headland) Nufarm and Monsanto (Bayer) and a contract for £250,000 from AHDB (with in-kind contributions from Syngenta, Agrii, Frontier, Hutchinsons and Agrovista).
While the Agriculture and Horticulture Development Board seeks to ensure that the information contained within this document is
accurate at the time of printing, no warranty is given in respect thereof and, to the maximum extent permitted by law, the Agriculture and
Horticulture Development Board accepts no liability for loss, damage or injury howsoever caused (including that caused by negligence)
or suffered directly or indirectly in relation to information and opinions contained in or omitted from this document.
Reference herein to trade names and proprietary products without stating that they are protected does not imply that they may be
regarded as unprotected and thus free for general use. No endorsement of named products is intended, nor is any criticism implied of
other alternative, but unnamed, products.
AHDB Cereals & Oilseeds is a part of the Agriculture and Horticulture Development Board (AHDB).


CONTENTS
1. ABSTRACT ....................................................................................................................... 1
2. INTRODUCTION ............................................................................................................... 2
3. MATERIALS AND METHODS .......................................................................................... 5
3.1. Application in stubbles (WP1) ............................................................................. 5
Data review ..................................................................................................... 5
Field experimentation data (WP1.1) ................................................................. 5
3.2. Container experiments (WP1.2 and WP3) ......................................................... 13
Container Experiment 1. The effect of glyphosate dose against weed growth
stage ............................................................................................................. 13
Containers Experiment 2. The effect of glyphosate dose, weed size and
cultivations ..................................................................................................... 16
Container Experiment 3. The effect of glyphosate dose, weed size and
subsequent pre- and post-emergence selective herbicide programmes. ........ 17
3.3. Applications between crop rows (WP2) ............................................................ 20
To investigate the resistance risk of glyphosate applications to larger weed
growth stages (Container experiment) ........................................................... 20
3.4. Resistance testing (Glasshouse and container experiments) (WP3) .............. 21
A glyphosate dose response experiment testing black-grass populations from
a long-term field trial (Glasshouse Experiment 1). ......................................... 21
Annual seed testing for glyphosate resistance (Glasshouse Experiment 2) ... 23
Container experiment seed survivors: Glyphosate dose response testing ..... 24
Whole plant testing of survivors: RISQ test method ....................................... 27
Selection experiments: To determine how quickly black-grass populations shift
their glyphosate tolerance status ................................................................... 28

4. RESULTS ........................................................................................................................ 30
4.1. Application in stubbles (WP1) ........................................................................... 30
Data review ................................................................................................... 30
Field experimentation data (WP1.1) ............................................................... 33
Conclusions ................................................................................................... 49
4.2. Container experiments (WP1.2 and WP3) ......................................................... 50
Container Experiment 1. The effect of glyphosate dose against weed growth
stage ............................................................................................................. 50
Containers Experiment 2. The effect of glyphosate dose, weed size and
cultivations ..................................................................................................... 57
Container Experiment 3. The effect of glyphosate dose, weed size and
subsequent pre- and post-emergence selective herbicide programmes. ........ 62
Overall conclusions from the container experiments ...................................... 66
4.3. Applications between crop rows (WP2) ............................................................ 68
To investigate the resistance risk of glyphosate applications to larger weed
growth stages (Container experiment) ........................................................... 68
Conclusions for the large weed growth stage experiments ............................ 71
4.4. Resistance testing (Glasshouse and container experiments) (WP3) .............. 71
A glyphosate dose response experiment testing black-grass populations from
a long-term field trial (Glasshouse Experiment 1). ......................................... 71
Annual seed testing for glyphosate resistance (Glasshouse Experiment 2). .. 73
Container experiment seed survivors: Glyphosate dose response testing ..... 74
Whole plant testing of survivors: RISQ test method ....................................... 78
Selection experiment: To determine how quickly black-grass populations shift
their glyphosate tolerance .............................................................................. 80

5. DISCUSSION .................................................................................................................. 85
6. ACKNOWLEDGEMENTS ................................................................................................ 90
7. REFERENCES ................................................................................................................ 90
8. APPENDICES ................................................................................................................. 93
8.1. Appendix 1 Weather data for ADAS Boxworth, Cambridge UK ...................... 93
8.2. Appendix 2 Resistant status for weed populations tested .............................. 95

1
1. Abstract
This work improved evidence and provided greater precision on the management of glyphosate
resistance risks in grass weeds. In particular, the project aimed to quantify the four key management
principles: prevent survivors, maximise efficacy, use alternatives and monitor success. The
outcomes filled data gaps identified during the development of the Weed Resistance Action Group
(WRAG) guidelines (first published in June 2015), with respect to greater precision on how much
glyphosate can safely be used (to avoid resistance evolving), at what rates/timings and how that is
mitigated by subsequent management.
The experimental work, which included multiple field-based and container-based experiments, used
black-grass and Italian rye-grass to inform the key objectives. This five-year research project was
required to fully test and verify the objectives. Resistance shifts are less likely to be detected in a
shorter timeframe. However, a key aspect of the work was to establish what cost-effective treatments
result in no survivors becoming resistant. Treatments were practical and field relevant.
The project investigated the two key risk periods of glyphosate application. Firstly (Objective 1),
stubbles/pre-drilling, when multiple applications are applied. Secondly (Objective 2), between crop
rows, when application would potentially be to larger plants and not followed by other risk mitigation.
Additionally, Objective 3 ensured availability of within-season ‘live plant’ and seed tests – to
determine treatment outcomes and assess whether survivors are due to resistance. Finally, practical
management guidelines were agreed and communicated (Objective 4).
The results provided consistent and strong evidence on best application timing, rate and weed
growth stage for optimal efficacy, therefore preventing survivors. Seed survivors, collected from
experiments, showed a trend towards populations requiring a higher glyphosate rate when they had
been exposed to a low rate at a large weed growth stage. In field situations, these survivors are likely
to gradually build up the resistance to glyphosate in a population.
The overall key messages were:
• Optimum application timing for black-grass and Italian rye-grass is GS12–13 • Glyphosate rate >540g is critical for optimal control • If target weeds are tillering (from GS21), a higher glyphosate rate (>720g) is required • Temperature at application is extremely important (enhancing or reducing control) • Cultivation of stale seedbed (depth 5 cm) is essential to increase black-grass control • Maximum of two glyphosate application timings for a stale seedbed
This programme of work provides information to further underpin the WRAG guidelines to manage
resistance, in particular quantifying the four key principles: prevent survivors, maximise efficacy, use
alternatives and monitor success.

2
2. Introduction
The herbicide glyphosate has been commercially available for 40 years. It is one of the most
frequently used herbicides in the UK in all crop production systems, including annual and perennial
crops and non-cropped areas. There are currently no known cases of glyphosate resistance in the
UK, however, globally, resistance to glyphosate has evolved as a result of repeated use and over-
reliance of this herbicide.
Current changes in usage patterns in the UK have increased the risk of glyphosate resistance
development. An over-reliance on a limited group of herbicide modes of action has accelerated the
development of herbicide-resistant grass weeds, particularly black-grass (Alopecurus myosuroides)
and Italian rye-grass (Lolium multiflorum). This has been mainly due to a lack of new herbicides,
regulatory policy changes, a limited crop rotation and the under-exploitation of cultural control
practices. The main threat is in annual arable crops where glyphosate provides a key role in
managing grass-weeds which have developed resistance to selective herbicides.
Glyphosate-tolerant crops were introduced in North and South America and Canada in the mid-
1990s and this inevitably led to an increase in glyphosate resistant weeds in the years that followed.
A clear lesson was that reliance on the use of glyphosate alone was an inappropriate use. Although
there are no glyphosate-tolerant crops approved in the UK, patterns of use and reliance of
glyphosate have led to a heightened risk. With increasing herbicide resistance, especially in grass-
weeds there will be even more use pre-drilling. Additionally it is now possible to use glyphosate
within crops. For example, in the UK there are approvals for glyphosate to be applied in a wide
variety of vegetable and fruit crops and a new approval of a specific glyphosate product to be applied
between wide rows in an oilseed rape crop and more are likely to follow. This has the potential for
the target grass-weeds to be large in size and so the dose rate must be optimum to control weeds
of that size, otherwise a tolerance to glyphosate may evolve rapidly with frequent exposure.
Simulation models developed by Neve et al., (2002) investigating the evolution of glyphosate
resistance risk in rigid ryegrass showed that the greatest risk factors were sole reliance on
glyphosate for pre-drilling control in systems with reduced tillage and in this situation, resistance
could evolve in 10-15 years.
The first case of glyphosate resistance in an arable crop in Europe was reported in Italy (Collavo +
Sattin, 2014) to ryegrass (Lolium spp.), which also showed cross resistance to ACCase and ALS-
inhibitor herbicides. Previous to that glyphosate resistant weeds in Europe were located in perennial
crops (orchards) where usage patterns differ to arable crops as often no additional actives or
cultivations are used. Worldwide there are currently 50 weed species (26 grasses), across 31
different weed families (a total of 324 individual biotypes) with reported glyphosate resistance (Heap,
2020).
3
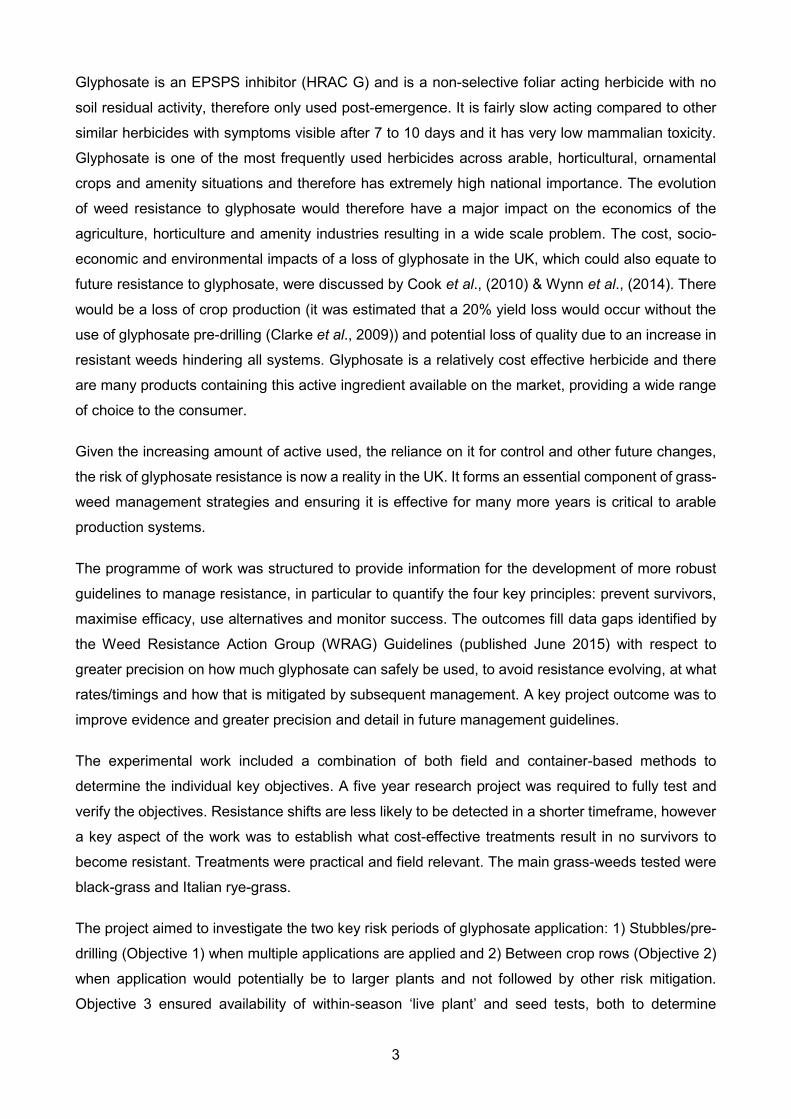
Glyphosate is an EPSPS inhibitor (HRAC G) and is a non-selective foliar acting herbicide with no
soil residual activity, therefore only used post-emergence. It is fairly slow acting compared to other
similar herbicides with symptoms visible after 7 to 10 days and it has very low mammalian toxicity.
Glyphosate is one of the most frequently used herbicides across arable, horticultural, ornamental
crops and amenity situations and therefore has extremely high national importance. The evolution
of weed resistance to glyphosate would therefore have a major impact on the economics of the
agriculture, horticulture and amenity industries resulting in a wide scale problem. The cost, socio-
economic and environmental impacts of a loss of glyphosate in the UK, which could also equate to
future resistance to glyphosate, were discussed by Cook et al., (2010) & Wynn et al., (2014). There
would be a loss of crop production (it was estimated that a 20% yield loss would occur without the
use of glyphosate pre-drilling (Clarke et al., 2009)) and potential loss of quality due to an increase in
resistant weeds hindering all systems. Glyphosate is a relatively cost effective herbicide and there
are many products containing this active ingredient available on the market, providing a wide range
of choice to the consumer.
Given the increasing amount of active used, the reliance on it for control and other future changes,
the risk of glyphosate resistance is now a reality in the UK. It forms an essential component of grass-
weed management strategies and ensuring it is effective for many more years is critical to arable
production systems.
The programme of work was structured to provide information for the development of more robust
guidelines to manage resistance, in particular to quantify the four key principles: prevent survivors,
maximise efficacy, use alternatives and monitor success. The outcomes fill data gaps identified by
the Weed Resistance Action Group (WRAG) Guidelines (published June 2015) with respect to
greater precision on how much glyphosate can safely be used, to avoid resistance evolving, at what
rates/timings and how that is mitigated by subsequent management. A key project outcome was to
improve evidence and greater precision and detail in future management guidelines.
The experimental work included a combination of both field and container-based methods to
determine the individual key objectives. A five year research project was required to fully test and
verify the objectives. Resistance shifts are less likely to be detected in a shorter timeframe, however
a key aspect of the work was to establish what cost-effective treatments result in no survivors to
become resistant. Treatments were practical and field relevant. The main grass-weeds tested were
black-grass and Italian rye-grass.
The project aimed to investigate the two key risk periods of glyphosate application: 1) Stubbles/pre-
drilling (Objective 1) when multiple applications are applied and 2) Between crop rows (Objective 2)
when application would potentially be to larger plants and not followed by other risk mitigation.
Objective 3 ensured availability of within-season ‘live plant’ and seed tests, both to determine

4
treatment outcomes but also to provide a timely assessment of whether survivors are due to
resistance. Practical management guidelines were agreed and communicated (Objective 4).
The AHDB project was managed by ADAS with co-funding and collaborative involvement from the
Glyphosate Task Force (through Monsanto, now Bayer) with members Bayer (formerly Monsanto),
Albaugh, FMC, Nufarm and Syngenta and four distributor companies (Agrii, Agrovista, Frontier and
Hutchinsons) providing data and sites. The Black-grass Research Initiative (BGRI) was represented
on the steering group and close collaboration was maintained through joint activity. All members of
the consortium were involved with knowledge transfer and, in partnership with WRAG, consistent
messages have been agreed and widely communicated, especially to agronomists and farmers.
It is important to note that the same formulation of glyphosate was used throughout every experiment
within the project for consistency. No adjuvants were used but all experiments used deionised water.

5
3. Materials and methods
3.1. Application in stubbles (WP1)
To quantify the need for repeat glyphosate applications in stubbles two key aspects needed to be
quantified:
1. How important is repeat glyphosate use in increasing the number of weed flushes?
2. What is the optimum rate and timing of glyphosate to minimise the number of applications?
Data review
A review was carried out in the first six months of the project building on previous trial data that
include comparisons of glyphosate applications pre-drilling with and without cultivations. The
distributor project partners and some companies agreed to historic data sharing to inform this review.
This helped to build a knowledge base and provide a valuable resource for the production of key
messages and practical guidelines for farmers. It also identified gaps in knowledge where new data
needed to be gained within the project field sites.
Field experimentation data (WP1.1)
Data gaps were identified from the review that then formed the structure of the field experiments.
The field trials started in project year two and ran for four years (2016-2020).
Field experiment 1. Glyphosate and weed flushes (winter wheat cropping 2017 & 2018)
A set of three field trials were established in autumn 2017 and 2018 on sites hosted by the partner
distributor companies known to have a high black-grass population. The aim of the trials was to
evaluate the risk of repeat glyphosate application to stubbles/stale seedbeds prior to crop drilling
and to identify the effects of cultivations and glyphosate treatment timing and dose, on black-grass
control. The CambsA and CambsH trials were located in Cambridgeshire and the LincsF trials in
Lincolnshire in both trial years.
Trial design
Each site received a minimal post-harvest cultivation, but no seed bed established before the trial
was marked out. The trial plots measured 24m x 3m and were replicated three times. The plots were
split in half with a cultivation treatment just before or at the same time as drilling, reducing the overall
plot size to 12m x 3m. There were six glyphosate treatments and timings (Table 1) all were to be
applied before drilling.
6
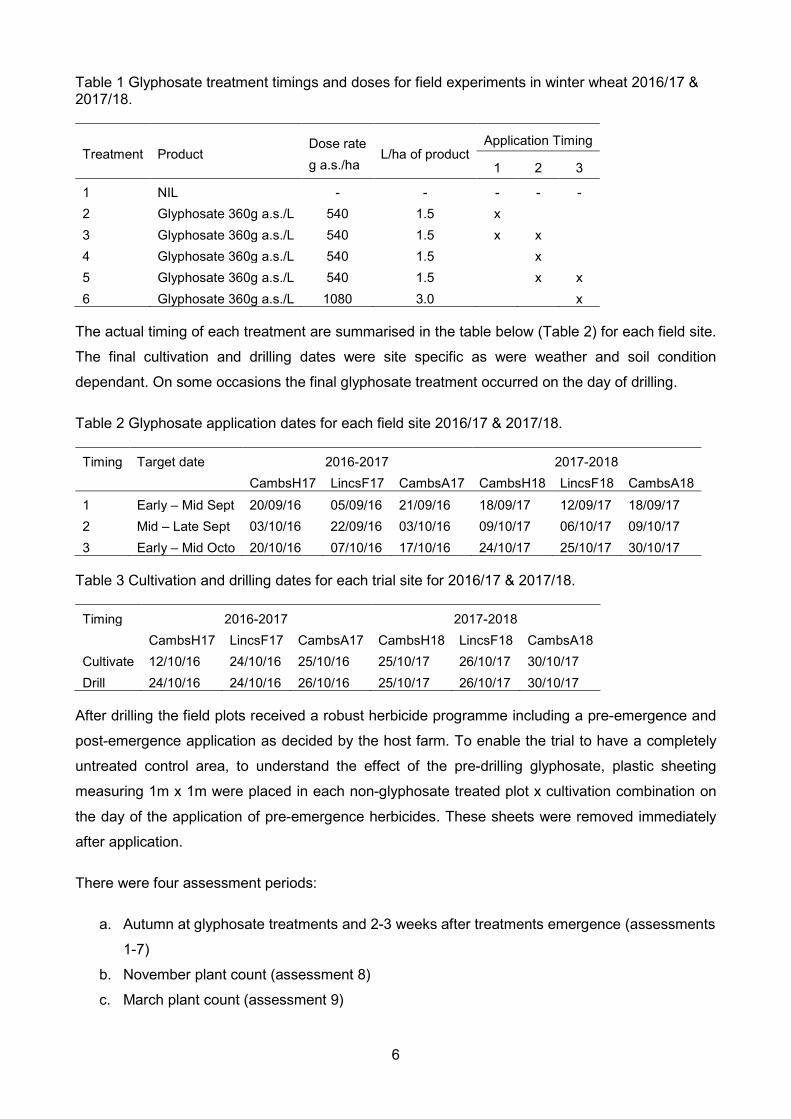
Table 1 Glyphosate treatment timings and doses for field experiments in winter wheat 2016/17 & 2017/18.
Treatment Product Dose rate g a.s./ha
L/ha of product Application Timing
1 2 3
1 NIL - - - - - 2 Glyphosate 360g a.s./L 540 1.5 x 3 Glyphosate 360g a.s./L 540 1.5 x x 4 Glyphosate 360g a.s./L 540 1.5 x 5 Glyphosate 360g a.s./L 540 1.5 x x 6 Glyphosate 360g a.s./L 1080 3.0 x
The actual timing of each treatment are summarised in the table below (Table 2) for each field site.
The final cultivation and drilling dates were site specific as were weather and soil condition
dependant. On some occasions the final glyphosate treatment occurred on the day of drilling.
Table 2 Glyphosate application dates for each field site 2016/17 & 2017/18.
Timing Target date 2016-2017 2017-2018 CambsH17 LincsF17 CambsA17 CambsH18 LincsF18 CambsA18 1 Early – Mid Sept 20/09/16 05/09/16 21/09/16 18/09/17 12/09/17 18/09/17 2 Mid – Late Sept 03/10/16 22/09/16 03/10/16 09/10/17 06/10/17 09/10/17 3 Early – Mid Octo 20/10/16 07/10/16 17/10/16 24/10/17 25/10/17 30/10/17
Table 3 Cultivation and drilling dates for each trial site for 2016/17 & 2017/18.
Timing 2016-2017 2017-2018 CambsH17 LincsF17 CambsA17 CambsH18 LincsF18 CambsA18 Cultivate 12/10/16 24/10/16 25/10/16 25/10/17 26/10/17 30/10/17 Drill 24/10/16 24/10/16 26/10/16 25/10/17 26/10/17 30/10/17
After drilling the field plots received a robust herbicide programme including a pre-emergence and
post-emergence application as decided by the host farm. To enable the trial to have a completely
untreated control area, to understand the effect of the pre-drilling glyphosate, plastic sheeting
measuring 1m x 1m were placed in each non-glyphosate treated plot x cultivation combination on
the day of the application of pre-emergence herbicides. These sheets were removed immediately
after application.
There were four assessment periods:
a. Autumn at glyphosate treatments and 2-3 weeks after treatments emergence (assessments
1-7)
b. November plant count (assessment 8)
c. March plant count (assessment 9)
7
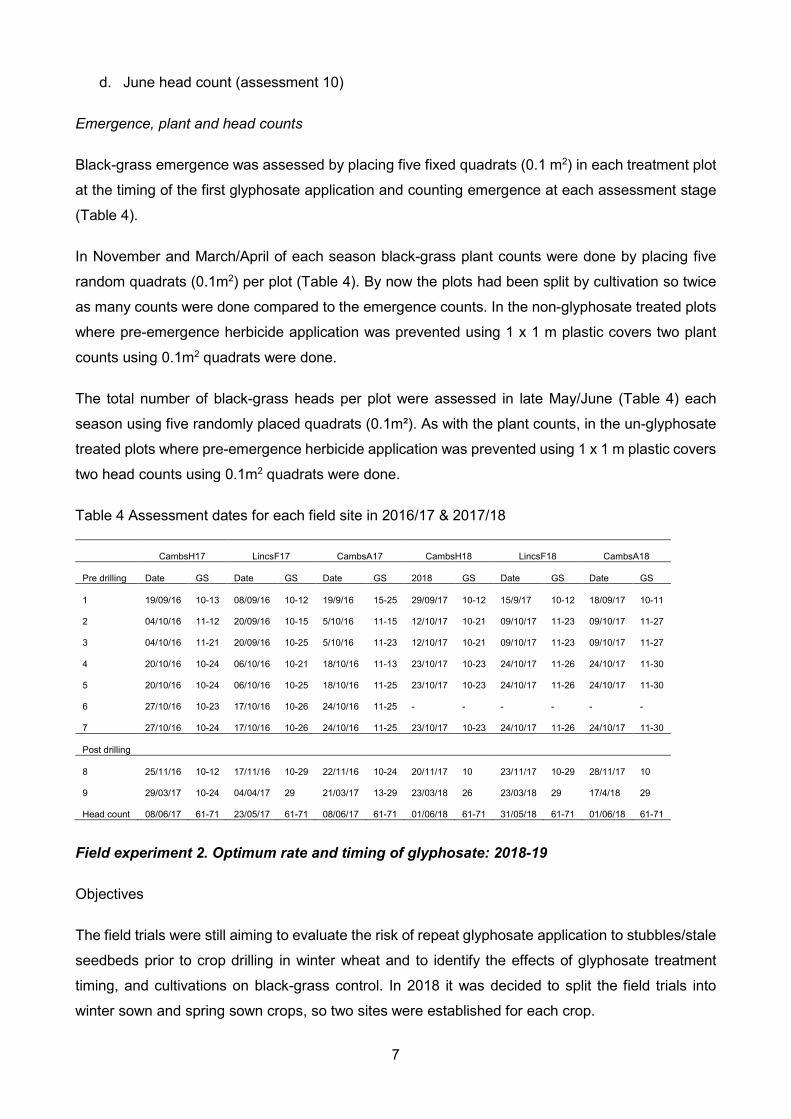
d. June head count (assessment 10)
Emergence, plant and head counts
Black-grass emergence was assessed by placing five fixed quadrats (0.1 m2) in each treatment plot
at the timing of the first glyphosate application and counting emergence at each assessment stage
(Table 4).
In November and March/April of each season black-grass plant counts were done by placing five
random quadrats (0.1m2) per plot (Table 4). By now the plots had been split by cultivation so twice
as many counts were done compared to the emergence counts. In the non-glyphosate treated plots
where pre-emergence herbicide application was prevented using 1 x 1 m plastic covers two plant
counts using 0.1m2 quadrats were done.
The total number of black-grass heads per plot were assessed in late May/June (Table 4) each
season using five randomly placed quadrats (0.1m²). As with the plant counts, in the un-glyphosate
treated plots where pre-emergence herbicide application was prevented using 1 x 1 m plastic covers
two head counts using 0.1m2 quadrats were done.
Table 4 Assessment dates for each field site in 2016/17 & 2017/18
CambsH17 LincsF17 CambsA17 CambsH18 LincsF18 CambsA18
Pre drilling Date GS Date GS Date GS 2018 GS Date GS Date GS
1 19/09/16 10-13 08/09/16 10-12 19/9/16 15-25 29/09/17 10-12 15/9/17 10-12 18/09/17 10-11
2 04/10/16 11-12 20/09/16 10-15 5/10/16 11-15 12/10/17 10-21 09/10/17 11-23 09/10/17 11-27
3 04/10/16 11-21 20/09/16 10-25 5/10/16 11-23 12/10/17 10-21 09/10/17 11-23 09/10/17 11-27
4 20/10/16 10-24 06/10/16 10-21 18/10/16 11-13 23/10/17 10-23 24/10/17 11-26 24/10/17 11-30
5 20/10/16 10-24 06/10/16 10-25 18/10/16 11-25 23/10/17 10-23 24/10/17 11-26 24/10/17 11-30
6 27/10/16 10-23 17/10/16 10-26 24/10/16 11-25 - - - - - -
7 27/10/16 10-24 17/10/16 10-26 24/10/16 11-25 23/10/17 10-23 24/10/17 11-26 24/10/17 11-30
Post drilling
8 25/11/16 10-12 17/11/16 10-29 22/11/16 10-24 20/11/17 10 23/11/17 10-29 28/11/17 10
9 29/03/17 10-24 04/04/17 29 21/03/17 13-29 23/03/18 26 23/03/18 29 17/4/18 29
Head count 08/06/17 61-71 23/05/17 61-71 08/06/17 61-71 01/06/18 61-71 31/05/18 61-71 01/06/18 61-71
Field experiment 2. Optimum rate and timing of glyphosate: 2018-19
Objectives
The field trials were still aiming to evaluate the risk of repeat glyphosate application to stubbles/stale
seedbeds prior to crop drilling in winter wheat and to identify the effects of glyphosate treatment
timing, and cultivations on black-grass control. In 2018 it was decided to split the field trials into
winter sown and spring sown crops, so two sites were established for each crop.

8
Winter wheat sites 2018-19
Site locations
There were two field sites in winter wheat drilled in 2018 and harvested in 2019, CambsA19 in
Cambridgeshire and LincsF19 in Lincolnshire.
Treatments and cultivations
The trials included three glyphosate application timings (Table 5) at a rate of 720g a.s./ha. It was
considered that this rate reflected true field practice. The application timings were applied a minimum
of 10 days apart pre-drilling of the crop (Table 6). The herbicide treatments were fully randomised
within each cultivation block. There were three cultivations (Table 7) that included no soil disturbance
until drilling (C1), a shallow cultivation between glyphosate applications (C2) and a ‘flexible’
treatment (C3) to be decided by the host site to suit their field conditions and establishment
equipment. The cultivation blocks were not randomised for practical reasons.
Table 5 Herbicide treatments for both field sites 2018-19
Treatment Product Dose rate g a.s./ha
L/ha of product
Number of applications
Application Timing
1 2
T1 NIL - - - - - T2 Glyphosate 360g a.s./L 720 2.0 1 T1 - T3 Glyphosate 360g a.s./L 720 2.0 1 - T2 T4 Glyphosate 360g a.s./L 720 2.0 2 T1 T2
Table 6 Actual herbicide application timings for both trial sites in 2018
Field site Application timing Target date LincsF19 CambsA19 T1 Mid-September 24/09/18 13/09/18 T2 Mid-October 19/10/18 11/10/18

9
Table 7 Cultivation dates and timings for both winter wheat sites in 2018-19
Cultivation no.
Cultivation type Timing Cultivation and drilling date at each site
LincsF19 CambsA19 C1 Direct drilling Action of drilling 28/10/18 12/10/18
C2 Shallow cultivation Between glyphosate applications
26/09/18 straw rake
14/09/18
C3 ‘Flexible’ cultivation to suit the site/conditions
Flexible depending on each site
08/10/18 Power harrow
12/10/18 Combi drill
After drilling the field plots received a robust herbicide programme including a pre-emergence and
post-emergence application as decided by the host farm. To enable the trial to have a completely
untreated control area, to understand the effect of the pre-drilling glyphosate, plastic sheeting
measuring 1m x 1m were placed in each non-glyphosate treated plot x cultivation combination on
the day of the application of pre-emergence herbicides. These sheets were removed immediately
after application.
Assessments
There were three assessment periods:
a. Autumn at glyphosate treatments and 2-3 weeks after treatments, emergence counts
(assessments 1-2)
b. November, plant count (assessment 3)
c. June, head count (assessment 4)
Black-grass emergence was assessed by placing ten random quadrats (0.1 m2) in each treatment
plot at the timing of the first glyphosate application and counting emergence at each assessment
stage (Table 8).
In November of each season black-grass plant counts were done by placing five random quadrats
(0.1m2) per plot (Table 8). By now the plots had been split by cultivation so twice as many counts
were done compared to the emergence counts. In the non-glyphosate treated plots where pre-
emergence herbicide application was prevented using 1 x 1 m plastic covers two plant counts using
0.1m2 quadrats were done.
The total number of black-grass heads per plot were assessed in late May/June (Table 8) each
season using five randomly placed quadrats (0.1m²). As with the plant counts, in the un-glyphosate
treated plots where pre-emergence herbicide application was prevented using 1 x 1 m plastic covers
two head counts using 0.1m2 quadrats were done.

10
Table 8 Assessment dates for both field sites 2018/19
Field site Assessment LincsF19 CambsA19 1. Emergence count 27/09/18 14/09/18 2. Emergence count 25/10/18 04/10/18 3. Late autumn count Not done 19/11/18 4. Head count 11/06/19 10/06/19
Spring wheat sites 2018-19
Site locations
There were two field sites in spring wheat crop drilled in 2019 in Cambridgeshire, CambsBx19 and
CambsH19. Plots measured 3m x 12m at CambsBx19 and 6m x 8m at CambsH19, both with two
replicate blocks.
Treatments and cultivations
There were two glyphosate treatments at a higher dose of 720g a.s./ha to be consistent with the
winter wheat trials. The application timings were required in the autumn and at pre-drilling of the crop
in the spring (Table 9, Table 10). The herbicide treatments were fully randomised within each
cultivation block. There were two cultivations (Table 11) that included minimal soil disturbance until
drilling (C1), and a shallow cultivation approximately 10 days after the autumn glyphosate
applications (C2). The cultivation blocks were not randomised for practical reasons.
Table 9 Herbicide treatments
Treatment Product Active
ingredient
Dose rate g a.s./ha
L/ha of
product
No. times
applied
Application Timing
1
(autumn)
2
(spring)
T1 NIL - - - - - -
T2 Glyphosate 360g a.s./L Glyphosate 720 2.0 1 x -
T3 Glyphosate 360g a.s./L Glyphosate 720 2.0 1 - x
The growth stage of the black-grass for the autumn glyphosate application was GS11 and for the
spring application it varied between GS11-29, with the majority of plants over GS21.

11
Table 10 Application timings for both field sites in spring wheat 2018/19
Treatment Product
L/ha of product
Application Timing
Autumn spring
CambsBx19 CambsH19 CambsBx19 CambsH19
T1 NIL - - - - - T2 Glyphosate 360g a.s./L 2.0 19/10/18 17/10/18 - - T3 Glyphosate 360g a.s./L 2.0 - - 22/02/19 15/02/19
The whole trial area was lightly cultivated post-harvest. The following cultivations were then part of
the trial treatments.
Table 11 Cultivations and drilling dates at both spring sown field sites 2018-19
Cultivation no.
Cultivation Timing Cultivation and drilling date at each site
CambsBx19 CambsH19 C1 None Act of drilling only 02/03/19 16/02/19
C2 Shallow cultivation After glyphosate application T2 (10 days minimum) in autumn
09/11/18 25/11/18
A pre-emergence herbicide was applied to the CambsBx19 site on 23/03/19 and the same method
of covering the ground with 1m x1m plastic sheets as described above was repeated. No post-
emergence herbicides were applied.
Assessments
There were three assessment periods with five assessments:
a) Autumn at glyphosate treatments, and 2-3 weeks after treatments, emergence counts (assessments 1-2)
b) Spring glyphosate treatments and 2-3 weeks after treatment/or post cultivation (Assessment 3-4)
c) June, head count (assessment 5)
Black-grass emergence was assessed by placing 10 random quadrats (0.1 m2) in each treatment
plot at the timing of the first glyphosate application in the autumn and counting emergence at each
assessment stage (Table 12).
In spring 2019 black-grass plant counts were done by placing 10 random quadrats (0.1m2) per plot
(Table 12). In the non-glyphosate treated plots where pre-emergence herbicide application was
prevented using 1 x 1 m plastic covers two plant counts using 0.1m2 quadrats were done.

12
The total number of black-grass heads per plot were assessed in late June 2019 (Table 12) each
season using 10 randomly placed quadrats (0.1m²). As with the plant counts, in the un-glyphosate
treated plots where pre-emergence herbicide application was prevented using 1 x 1 m plastic covers
two head counts using 0.1m2 quadrats were done.
Table 12 Assessment dates at both spring sown sites 2018-19
CambsBx19 CambsH19 Assessment Date Growth stage Date Growth stage 1. Emergence 24/10/18 10-13 24/10/18 10-12 2. Emergence 27/11/18 10-23 13/12/18 12-23 3. Spring plant count 25/02/19 11-29 - - 4. Spring plant count 25/03/19 21-29 06/03/19 10-29 5. Black-grass heads 19/06/19 61-71 14/06/19 61-71
Spring cropping 2019-2020
One field trial was located at ADAS Boxworth (CambsBx20), plot size was 6m x 8m with four
replicates. The field crop was spring barley.
Treatments and cultivations
There were two glyphosate treatments at a higher dose of 720g a.s./ha. The application timings were
required in the autumn and at pre-drilling of the crop in the spring (Table 13). The herbicide
treatments were fully randomised within each cultivation block. There were two cultivations (Table
14) that included minimal soil disturbance in October 2019 (C1), and a shallow cultivation on the
same day as the spring glyphosate application in March 2020 (C2). The cultivation blocks were not
randomised for practical reasons and the trial was laid out as a matrix design with cultivation in one
direction and glyphosate treatment in the other (randomised by replicate).
Table 13 Herbicide application timings for spring barley trial 2019-20
Treatment Product Dose rate g a.s./ha
L/ha of product
No. times applied
Application Timing
1 (autumn)
2 (spring)
T1 Glyphosate 360g a.s./L 720 2.0 1 06/11/19 - T2 Glyphosate 360g a.s./L 720 2.0 1 - 19/03/20
Table 14 Cultivations for spring barley trial 2019-20
Cultivation no. Cultivation Timing Date C1 Shallow October 23/10/19 C2 Shallow Spring (pre-glyphosate application) 19/03/20
The spring barley crop was drilled on 22/03/20 and rolled 30/03/20.
13
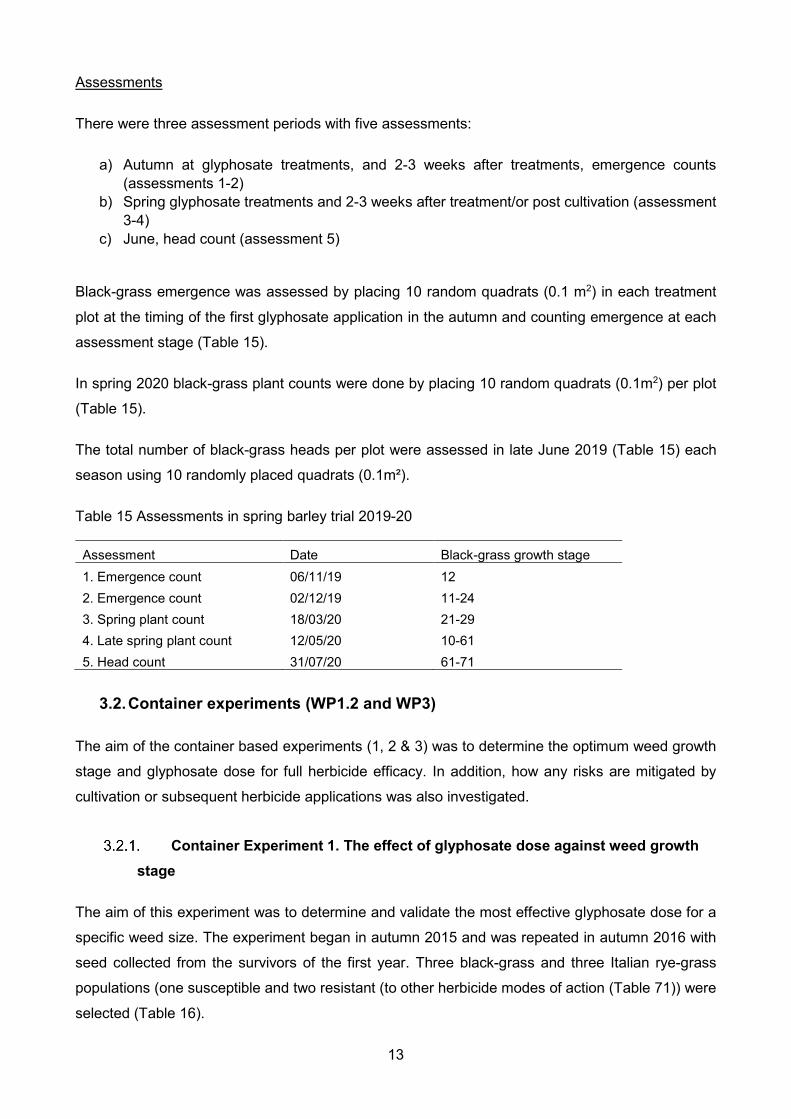
Assessments
There were three assessment periods with five assessments:
a) Autumn at glyphosate treatments, and 2-3 weeks after treatments, emergence counts (assessments 1-2)
b) Spring glyphosate treatments and 2-3 weeks after treatment/or post cultivation (assessment 3-4)
c) June, head count (assessment 5)
Black-grass emergence was assessed by placing 10 random quadrats (0.1 m2) in each treatment
plot at the timing of the first glyphosate application in the autumn and counting emergence at each
assessment stage (Table 15).
In spring 2020 black-grass plant counts were done by placing 10 random quadrats (0.1m2) per plot
(Table 15).
The total number of black-grass heads per plot were assessed in late June 2019 (Table 15) each
season using 10 randomly placed quadrats (0.1m²).
Table 15 Assessments in spring barley trial 2019-20
Assessment Date Black-grass growth stage 1. Emergence count 06/11/19 12 2. Emergence count 02/12/19 11-24 3. Spring plant count 18/03/20 21-29 4. Late spring plant count 12/05/20 10-61 5. Head count 31/07/20 61-71
3.2. Container experiments (WP1.2 and WP3)
The aim of the container based experiments (1, 2 & 3) was to determine the optimum weed growth
stage and glyphosate dose for full herbicide efficacy. In addition, how any risks are mitigated by
cultivation or subsequent herbicide applications was also investigated.
Container Experiment 1. The effect of glyphosate dose against weed growth stage
The aim of this experiment was to determine and validate the most effective glyphosate dose for a
specific weed size. The experiment began in autumn 2015 and was repeated in autumn 2016 with
seed collected from the survivors of the first year. Three black-grass and three Italian rye-grass
populations (one susceptible and two resistant (to other herbicide modes of action (Table 71)) were
selected (Table 16).
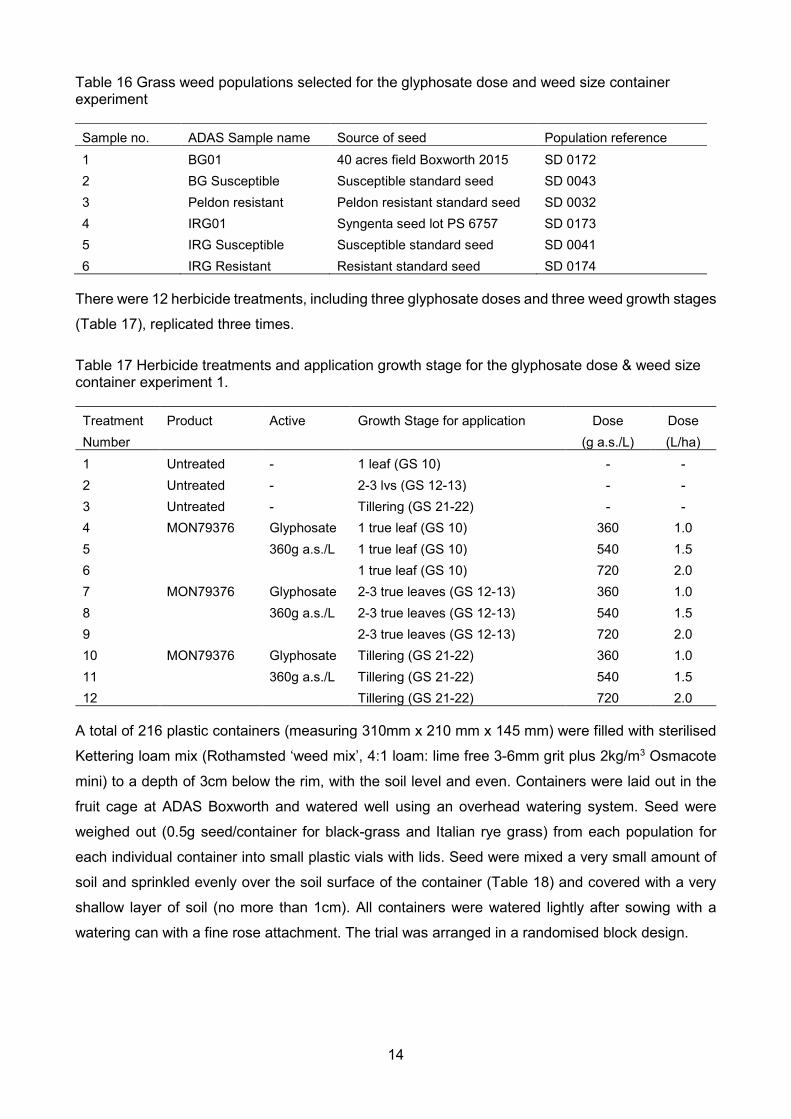
14
Table 16 Grass weed populations selected for the glyphosate dose and weed size container experiment
Sample no. ADAS Sample name Source of seed Population reference 1 BG01 40 acres field Boxworth 2015 SD 0172 2 BG Susceptible Susceptible standard seed SD 0043 3 Peldon resistant Peldon resistant standard seed SD 0032 4 IRG01 Syngenta seed lot PS 6757 SD 0173 5 IRG Susceptible Susceptible standard seed SD 0041 6 IRG Resistant Resistant standard seed SD 0174
There were 12 herbicide treatments, including three glyphosate doses and three weed growth stages
(Table 17), replicated three times.
Table 17 Herbicide treatments and application growth stage for the glyphosate dose & weed size container experiment 1.
Treatment Number
Product Active Growth Stage for application Dose (g a.s./L)
Dose (L/ha)
1 Untreated - 1 leaf (GS 10) - - 2 Untreated - 2-3 lvs (GS 12-13) - - 3 Untreated - Tillering (GS 21-22) - - 4 MON79376 Glyphosate
360g a.s./L 1 true leaf (GS 10) 360 1.0
5 1 true leaf (GS 10) 540 1.5 6 1 true leaf (GS 10) 720 2.0 7 MON79376 Glyphosate
360g a.s./L 2-3 true leaves (GS 12-13) 360 1.0
8 2-3 true leaves (GS 12-13) 540 1.5 9 2-3 true leaves (GS 12-13) 720 2.0 10 MON79376 Glyphosate
360g a.s./L Tillering (GS 21-22) 360 1.0
11 Tillering (GS 21-22) 540 1.5 12 Tillering (GS 21-22) 720 2.0
A total of 216 plastic containers (measuring 310mm x 210 mm x 145 mm) were filled with sterilised
Kettering loam mix (Rothamsted ‘weed mix’, 4:1 loam: lime free 3-6mm grit plus 2kg/m3 Osmacote
mini) to a depth of 3cm below the rim, with the soil level and even. Containers were laid out in the
fruit cage at ADAS Boxworth and watered well using an overhead watering system. Seed were
weighed out (0.5g seed/container for black-grass and Italian rye grass) from each population for
each individual container into small plastic vials with lids. Seed were mixed a very small amount of
soil and sprinkled evenly over the soil surface of the container (Table 18) and covered with a very
shallow layer of soil (no more than 1cm). All containers were watered lightly after sowing with a
watering can with a fine rose attachment. The trial was arranged in a randomised block design.

15
Table 18. Glyphosate dose and weed growth stage experiments summary of application and assessment dates.
Harvest Year Sowing date Herbicide application date Plant count Head count GS10 GS12-13 GS21-22 2016 10/11/15 10/12/15 06/01/16 22/03/16 06/05/16 05/07/16
2017 19/10/16 22/11/16 – IRG* 28/11/16 – BG*
16/01/17 09/03/17 03/05/17 17/07/17
*IRG= Italian rye-grass, BG=Black-grass
At the correct weed growth stages containers were grouped into treatments and moved to the spray
area. Herbicides were applied to containers using a hand-held 2m boom and knapsack sprayer at 2
bar, F110 02 nozzles at a water volume of 80 L/ha. De-ionised water was used. The treatment was
allowed to dry on the foliage before placing the containers back in to the fruit cage and were not
watered for at least six hours post-herbicide application. The number of plants and heads per
container were counted (Table 18) each year. Containers were isolated into mesh cages in their
herbicide treatments (three replicates per cage) in April each year to ensure there was no cross-
pollination. Seeds were collected from all survivors in July 2016. The treatment and population
replicates were bulked together and seed were weighed and re-sown in autumn 2016. As the
quantity of seed from every treatment varied there was not enough seed available to re-sow every
treatment for experiment year two as some treatments had been very effective. For those particular
treatments the baseline seed was used (Table 19).
Table 19 Treatment where baseline seed was required for trial year two as there were no survivors in year one.
Treatment number
BG01 BG Sus BG Peldon resistant
IRG01 IRG Sus IRG Res
1 Baseline Baseline Baseline 3 Baseline 5 Baseline Baseline 6 Baseline Baseline 7 Baseline Baseline Baseline Baseline 8 Baseline Baseline Baseline Baseline Baseline 9 Baseline Baseline Baseline Baseline Baseline Baseline 10 Baseline 11 Baseline 12 Baseline Baseline Baseline
In July 2017 seed were collected from survivors. These seed were used for a glasshouse dose
response experiment presented in Section 3.4.4.

16
Containers Experiment 2. The effect of glyphosate dose, weed size and cultivations
The aim of this experiment was to determine and validate the most effective glyphosate dose for a
specific weed size, with the addition of a simulated cultivation. The experiment began in autumn
2015 and was repeated in autumn 2016. Three black-grass and three Italian rye-grass populations
(one susceptible and two resistant (to other herbicide modes of action (Table 71)) were selected
(Table 16) as in experiment 1.
There were 12 herbicide treatments, including two glyphosate doses, two weed growth stages, two
simulated cultivations (Table 20), replicated three times.
Table 20 Herbicide treatments, cultivation type and application growth stage for the glyphosate dose, weed size and cultivation container experiment 2.
Treatment Number
Product (active)
Cultivation Type Cultivation depth (cm)
Growth stage Dose L/ha
1 Untreated
Deep (C1) 10 GS 12-13 - 2 Shallow (C2) 5
3 None (C3) none 4
Untreated Deep (C1) 10
GS21-22 - 5 Shallow (C2) 5 6 None (C3) none 7 MON79376
(Glyphosate 360g a.s./L)
Deep (C1) 10 GS 12-13 1.0 8 Shallow (C2) 5
9 None (C3) none 10 MON79376
(Glyphosate 360g a.s. /L)
Deep (C1) 10 GS21-22 1.0 11 Shallow (C2) 5
12 None (C3) none
The simulated cultivations were to mimic different types of inversion in the field. A deep cultivation
(C1) was to a depth of 10cm and a shallow cultivation (C2) was to a depth of 5cm.
A total of 216 plastic containers (measuring 310mm x 210 mm x 145 mm) were filled with sterilised
Kettering loam mix (Rothamsted ‘weed mix’, 4:1 loam: lime free 3-6mm grit plus 2kg/m3 Osmacote
mini) to a depth of 3cm below the rim, with the soil level and even. Containers were laid out in the
hard standing area at ADAS Boxworth and watered well using an overhead watering system. Seed
were weighed out (0.5g seed/container for black-grass and Italian rye grass) from each population
for each individual container into small plastic vials with lids. Seed were mixed a very small amount
of soil and sprinkled evenly over the soil surface of the container (Table 21) and covered with a very
shallow layer of soil (no more than 1cm). All containers were watered lightly after sowing with a
watering can with a fine rose attachment. The trial was arranged in a randomised block design.

17
Table 21 Glyphosate dose, weed growth stage & cultivations experiment summary of application and assessment dates.
Harvest Year
Sowing date
Herbicide application and cultivation date Plant count
Head count
GS 12-13 GS 21-22 Spray Cultivation Spray Cultivation 2016 13/11/16 11/01/16 25/01/16 22/03/16 01/04/16 06/05/16 05/07/16
2017 13/10/17 22/11/16* IRG 28/11/16* BG
02/12/16* IRG 09/12/16* BG
19/01/17 30/01/17 n/a 28/06/17
*IRG = Italian ryegrass, BG = black-grass
At the correct weed growth stages containers were grouped into treatments and moved to the spray
area (Table 21). Herbicides were applied to containers using a hand-held 2m boom and knapsack
sprayer at 2 bar, F110 02 nozzles at a water volume of 80 L/ha. De-ionised water was used. The
treatment was allowed to dry on the foliage before placing the containers back in to the hard standing
and were not watered for at least six hours post-herbicide application. The cultivation treatments
(Table 20) were carried out between 10-14 days after herbicide applications to simulate a cultivation
in the field after a stale seedbed technique. The cultivation treatments were disturbed on the soil
surface using a small gardening hand fork to mimic a blade passing through. A small amount of soil
was turned on top of the plants and then additional soil was placed over the plants to cover the
required depth (either 10cm (C1) or 5cm (C2)). One treatment had no disturbance (‘none’ C3). The
number of heads per container were counted (Table 21) each year. In 2016 the number of plants
per container were also counted, however in 2017 this assessment was not carried out due to the
large number of plants making the assessment very difficult to do. It was considered that the head
count data would be a more accurate assessment.
Container Experiment 3. The effect of glyphosate dose, weed size and subsequent pre- and post-emergence selective herbicide programmes.
The aim of this experiment was to determine whether the glyphosate resistance risk is reduced
through getting effective control when a sub-optimal glyphosate dose for a specific weed size has
been used on a population in a stubble but is then followed by a robust herbicide programme with
other modes of action. A pre-emergence and post-emergence herbicide were chosen by the project
steering group to represent these herbicide application timings. They were not applied as a sequence
as it was considered that in the container conditions they would be more active than field conditions.
The treatments selected were to enable the building blocks of a sequence to be understood where
the risk of plants exposed to sub-optimal glyphosate were present. This was only tested on three
black-grass populations (Table 22) and not Italian rye-grass as the trial size was large. The black-
grass populations included one susceptible standard and two populations with known resistance to
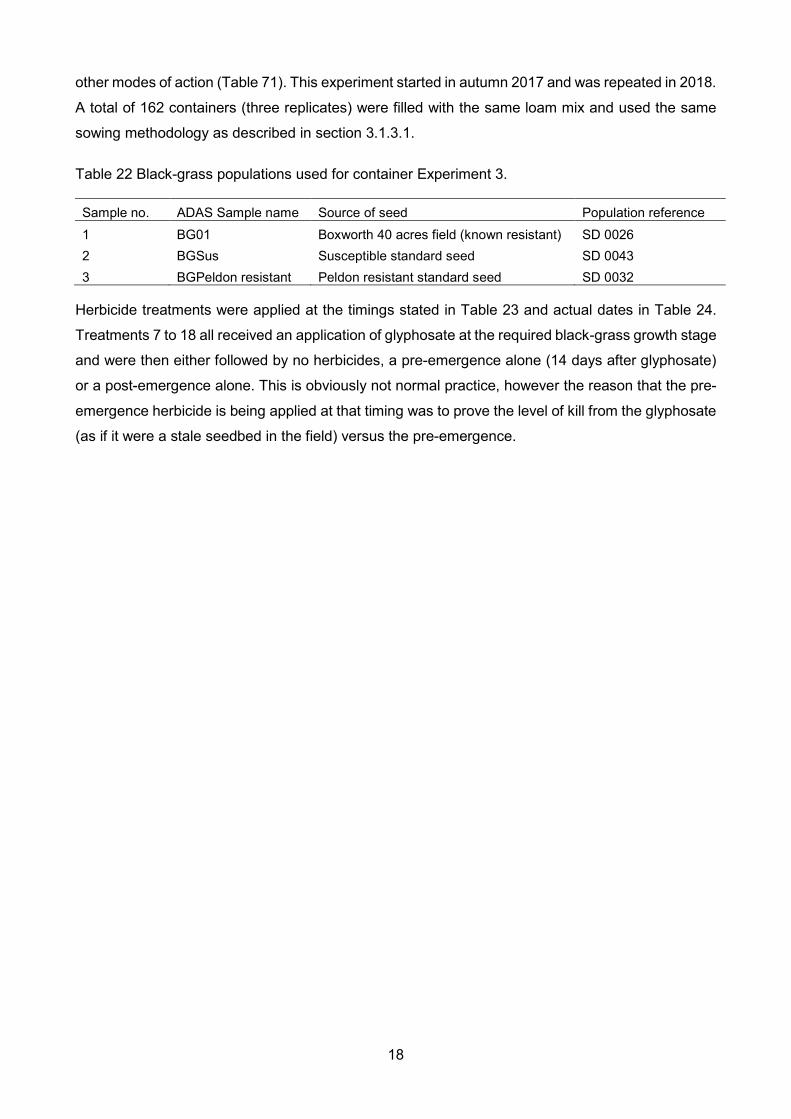
18
other modes of action (Table 71). This experiment started in autumn 2017 and was repeated in 2018.
A total of 162 containers (three replicates) were filled with the same loam mix and used the same
sowing methodology as described in section 3.1.3.1.
Table 22 Black-grass populations used for container Experiment 3.
Sample no. ADAS Sample name Source of seed Population reference 1 BG01 Boxworth 40 acres field (known resistant) SD 0026 2 BGSus Susceptible standard seed SD 0043 3 BGPeldon resistant Peldon resistant standard seed SD 0032
Herbicide treatments were applied at the timings stated in Table 23 and actual dates in Table 24.
Treatments 7 to 18 all received an application of glyphosate at the required black-grass growth stage
and were then either followed by no herbicides, a pre-emergence alone (14 days after glyphosate)
or a post-emergence alone. This is obviously not normal practice, however the reason that the pre-
emergence herbicide is being applied at that timing was to prove the level of kill from the glyphosate
(as if it were a stale seedbed in the field) versus the pre-emergence.

19
Table 23 Herbicide treatments and application timings for container Experiment 3.
Treatment
Number
Glyphosate
Treatment
Growth stage Glyphosate
product dose
(L/ha)
Pre-emergence herbicide
product & dose
14 days post-glyphosate*
Post-emergence herbicide
product & dose
(pre-tillering black-grass)
1
UTC
2-3 lvs (GS 12-13) - - -
2 2-3 lvs (GS 12-13) - Liberator @ 0.6 L/haa -
3 2-3 lvs (GS 12-13) - - Hamlet @1.5 L/hab
4
UTC
Tillering (GS21-22) - - -
5 Tillering (GS21-22) - Liberator @ 0.6 L/haa -
6 Tillering (GS21-22) - - Hamlet @1.5 L/hab
7
MON79376
(Glyphosate
360g a.s./L)
2-3 lvs (GS 12-13) 0.75 - -
8 2-3 lvs (GS 12-13) 0.75 Liberator @ 0.6 L/haa -
9 2-3 lvs (GS 12-13) 0.75 - Hamlet @1.5 L/hab
10 Tillering (GS21-22) 0.75 - -
11 Tillering (GS21-22) 0.75 Liberator @ 0.6 L/haa -
12 Tillering (GS21-22) 0.75 - Hamlet @1.5 L/hab
13
MON79376
(Glyphosate
360g a.s./L)
2-3 lvs (GS 12-13) 1.125 - -
14 2-3 lvs (GS 12-13) 1.125 Liberator @ 0.6 L/haa -
15 2-3 lvs (GS 12-13) 1.125 - Hamlet @1.5 L/hab
16 Tillering (GS21-22) 1.125 - -
17 Tillering (GS21-22) 1.125 Liberator @ 0.6 L/haa -
18 Tillering (GS21-22) 1.125 - Hamlet @1.5 L/hab aLiberator contains flufenacet + diflufenican bHamlet contains mesosulfuron-methyl + iodosulfuron-methyl-sodium + diflufenican
Treatments were applied using the same method and equipment as in section 3.1.3.1.
The number of plants and heads per container were assessed in spring and summer of each testing
year (Table 24).
Table 24 Summary of sowing, application and assessment dates for container Experiment 3.
Harvest Year
Sowing date
Herbicide application date Plant count Head count
Glyphosate Pre-em Post-em 2018
02/11/17 (GS12-13) - 16/01/18 30/01/18 13/02/18
10/05/18 01/06/18 (GS 21-22) - 12/03/18 30/03/18 10/04/18 2019
30/10/18 (GS12-13) – 10/01/19 23/01/19 06/02/19
02/04/19 03/06/19 (GS 21-22) – 12/02/19 26/02/19 13/03/19

20
3.3. Applications between crop rows (WP2)
To determine the implications on resistance risk from use of glyphosate post-emergence, such as
between crop rows.
To investigate the resistance risk of glyphosate applications to larger weed growth stages (Container experiment)
The aim of this experiment was to determine whether a larger weed growth stage (as would be
expected with a post-emergence application such as in-row shielded treatments) was more
susceptible to glyphosate resistance evolution and therefore dependent on the correct rate and
timing. This experiment started in autumn 2017 and was repeated for two years to validate the data.
Two black-grass populations were selected (Susceptible standard and Peldon resistant standard,
with known resistance to other herbicide modes of action (Table 71) (Table 25).
Table 25 Black-grass populations used in the large growth stage container experiment.
Sample no. ADAS Sample Reference Source of seed Population reference 1 BGSus Susceptible standard seed SD 0043 2 BGPeldon resistant Peldon resistant standard seed SD 0032
A total of 42 containers were filled with the same loam mix and used the same sowing methodology
as described in section 3.2.1. Black-grass plants were treated at three different large growth stages
GS 23, GS 25-28 and GS 32, with three glyphosate doses, including an untreated control, and
replicated three times (Table 26 and Table 27). Treatments were applied using the same method
and equipment as in section 3.2.1.
Table 26 Application rates and timings for the large growth stage container experiment.
Treatment Number
Product Active Dose (g
a.s./L)
Dose (product)
L/ha
Application timing (Growth stage)
1 Untreated - - - 2
MON79376 Glyphosate 360g a.s./L
360 1.0 T1 (GS 23)
3 180 0.5 4 360 1.0
T2 (GS 25-28) 5 180 0.5 6 360 1.0
T3 (GS 32) 7 180 0.5
In April of each experiment year the containers were isolated into their different treatments to prevent
cross-pollination. The total number of heads per container were counted (Table 27) and seed were

21
collected from survivors in the July. Seed were tested for resistance status in a glasshouse pot test
in January 2020 (see section 3.4.3).
Table 27 Sowing, application and assessment dates for large growth stage container experiment.
Harvest Year Sowing date Herbicide application date Head count GS23 GS25-28 GS32 2018 27/10/17 14/03/18 12/04/18 26/04/18 06/06/18 2019 25/10/18 20/02/19 06/03/19 02/04/19 27/06/19
3.4. Resistance testing (Glasshouse and container experiments) (WP3)
To determine resistance status (testing) of seeds and rapid within-season whole plant assays.
A glyphosate dose response experiment testing black-grass populations from a long-term field trial (Glasshouse Experiment 1).
Black-grass seed were collected in July 2015 from selected plots within a large long-term (five year)
field trial in Cambridgeshire (CambsA15). Plots were selected based on previous cultivation,
glyphosate use and other herbicide history. The range of cultivations included continuous plough,
continuous minimal tillage or a rotational combination of both. Field blocks were sub-divided with a
range of glyphosate applications pre-drilling and a full pre- and post-emergence herbicide
programme. Seven field populations and two standard reference population were tested (Table 28).
Table 28 Seed populations collected from a long-term glyphosate field experiment and tested in a
glasshouse dose response experiment to glyphosate.
Sample no. Population reference Seed source 1 2015AG01
CambsA15
2 2015AG02 3 2015AG03 4 2015AG04 5 2015AG05 6 2015AG06 7 2015AG07 8 Standard susceptible Herbiseed purchased 2015 9 Standard resistant Peldon resistant
Pre-germination and transplanting of seed
For each of the seed populations, plastic Petri dishes (10 x 90mm) were filled with three Whatmans
no. 1 filter papers size 85 mm, and 1 Whatmans GR/A glass microfibre filter paper size 90mm. A
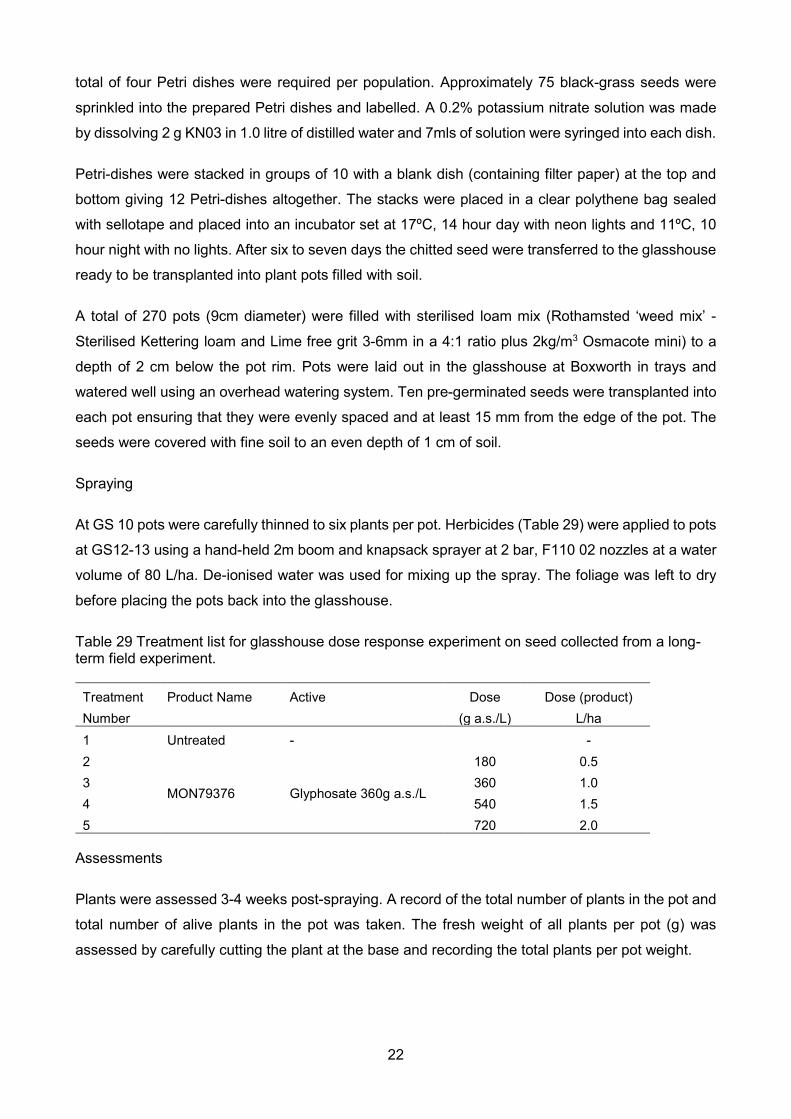
22
total of four Petri dishes were required per population. Approximately 75 black-grass seeds were
sprinkled into the prepared Petri dishes and labelled. A 0.2% potassium nitrate solution was made
by dissolving 2 g KN03 in 1.0 litre of distilled water and 7mls of solution were syringed into each dish.
Petri-dishes were stacked in groups of 10 with a blank dish (containing filter paper) at the top and
bottom giving 12 Petri-dishes altogether. The stacks were placed in a clear polythene bag sealed
with sellotape and placed into an incubator set at 17ºC, 14 hour day with neon lights and 11ºC, 10
hour night with no lights. After six to seven days the chitted seed were transferred to the glasshouse
ready to be transplanted into plant pots filled with soil.
A total of 270 pots (9cm diameter) were filled with sterilised loam mix (Rothamsted ‘weed mix’ -
Sterilised Kettering loam and Lime free grit 3-6mm in a 4:1 ratio plus 2kg/m3 Osmacote mini) to a
depth of 2 cm below the pot rim. Pots were laid out in the glasshouse at Boxworth in trays and
watered well using an overhead watering system. Ten pre-germinated seeds were transplanted into
each pot ensuring that they were evenly spaced and at least 15 mm from the edge of the pot. The
seeds were covered with fine soil to an even depth of 1 cm of soil.
Spraying
At GS 10 pots were carefully thinned to six plants per pot. Herbicides (Table 29) were applied to pots
at GS12-13 using a hand-held 2m boom and knapsack sprayer at 2 bar, F110 02 nozzles at a water
volume of 80 L/ha. De-ionised water was used for mixing up the spray. The foliage was left to dry
before placing the pots back into the glasshouse.
Table 29 Treatment list for glasshouse dose response experiment on seed collected from a long-term field experiment.
Treatment Number
Product Name Active Dose (g a.s./L)
Dose (product) L/ha
1 Untreated - - 2
MON79376 Glyphosate 360g a.s./L
180 0.5 3 360 1.0 4 540 1.5 5 720 2.0
Assessments
Plants were assessed 3-4 weeks post-spraying. A record of the total number of plants in the pot and
total number of alive plants in the pot was taken. The fresh weight of all plants per pot (g) was
assessed by carefully cutting the plant at the base and recording the total plants per pot weight.

23
Annual seed testing for glyphosate resistance (Glasshouse Experiment 2)
Black-grass seed were sent into ADAS Boxworth from any farmers or agronomists who had concerns
with the level of control from glyphosate in the field. Seed were only submitted for testing in 2015
(four populations), 2016 (two populations) and 2018 (three populations).
Pre-germination and transplanting of seed
Seed were pre-germinated as described in section 3.4.1 above.
A total of 180 pots (9cm diameter) were filled with sterilised loam mix (Rothamsted ‘weed mix’ -
Sterilised Kettering loam and Lime free grit 3-6mm in a 4:1 ratio plus 2kg/m3 Osmacote mini) to a
depth of 2 cm below the pot rim. Pots were laid out in the glasshouse at Boxworth in trays and
watered well using an overhead watering system. Ten pre-germinated seeds were transplanted into
each pot ensuring that they were evenly spaced and at least 15 mm from the edge of the pot. The
seeds were covered with fine soil to an even depth of 1 cm of soil.
Spraying
At GS 10 pots were carefully thinned to six plants per pot. Herbicides (Table 30 & Table 31) were
applied to pots at GS12-13 using a hand-held 2m boom and knapsack sprayer at 2 bar, F110 02
nozzles at a water volume of 80 L/ha. De-ionised water was used for mixing up the spray. The foliage
was left to dry before placing the pots back into the glasshouse.
Table 30 Herbicide treatments for 2015 and 2016 commercial resistance testing samples
Treatment Product Active Rate g a.s./ha L/ha of product 1 NIL - - - 2 MON79376 Glyphosate 360g a.s./ha 405 1.125 3 MON79376 Glyphosate 360g a.s./ha 540 1.5
Table 31 Herbicide treatments for 2018 commercial resistance testing samples
Treatment Product Active Rate g a.s./ha of product 1 NIL - - - 2 MON79376 Glyphosate 360g a.s./ha 360 1.0 3 MON79376 Glyphosate 360g a.s./ha 540 1.5 4 MON79376 Glyphosate 360g a.s./ha 720 2.0

24
Assessments
Plants were assessed 3-4 weeks post-spraying. A record of the total number of plants in the pot and
total number of alive plants in the pot was taken. The fresh weight of all plants per pot (g) was
assessed by carefully cutting the plant at the base and recording the total plants per pot weight.
Container experiment seed survivors: Glyphosate dose response testing
Testing seed survivors from first two years of container trials (2018)
Black-grass and Italian rye-grass seed were collected from the container experiment (3.2.1) in July
2017 that had had two years exposure to different glyphosate treatments (see section 3.2.1 for
treatment and population details). There were a total of 21 populations tested, 10 black-grass and
11 Italian rye-grass including standard populations for comparison (Table 32).
Table 32 Seed survivor populations collected from container experiment 3.2.1 and tested in a glasshouse dose response to glyphosate.
Species Population reference Original treatment reference (see Experiment 3.2.1)
Black-grass
SD 0548 BG01, UTC SD 0549 BG01, Glyphosate 720 (GS12-13) SD 0550 BG01, Glyphosate 360 (GS21-22) SD 0551 BG susceptible, UTC SD 0552 BG susceptible, Glyphosate 360 (GS21-22) SD 0553 BG Peldon, UTC SD 0554 BG Peldon, Glyphosate 720 (GS10) SD 0555 BG Peldon, Glyphosate 360 (GS21-22)
Italian rye-grass
SD 0556 IRG01, UTC SD 0557 IRG01, Glyphosate 360 (GS21-22) SD 0558 IRG susceptible, UTC SD 0559 IRG susceptible, Glyphosate 360 (GS21-22) SD 0560 IRG susceptible, Glyphosate 720 (GS21-22) SD 0561 IRG resistant, UTC SD 0562 IRG resistant, Glyphosate 720 (GS10) SD 0563 IRG resistant, Glyphosate 360 (GS21-22) SD 0564 IRG resistant, Glyphosate 540 (GS21-22) SD 0565 IRG resistant, Glyphosate 720 (GS21-22)
Black-grass SD 0200 Peldon resistant population SD 0525 Standard susceptible
Italian rye-grass SD 0215 Standard susceptible
The dose response experiment was a randomised block design with five glyphosate treatments, plus
an untreated control, replicated six times (Table 33).

25
Pre-germination and transplanting
Seed were cleaned using the air-column separator and pre-germinated in the laboratory using the
method described in section 3.4.1. For black-grass and Italian rye-grass six Petri dishes per
population were used for pre-germination (total of 126 dishes). A total of 756 pots (9cm diameter)
were filled with sterilised loam mix (Rothamsted ‘weed mix’ - Sterilised Kettering loam and Lime free
grit 3-6mm in a 4:1 ratio plus 2kg/m3 Osmacote mini) to a depth of 2 cm below the rim. Pots were
laid out in the glasshouse at Boxworth in trays and watered well using an overhead watering system.
Spraying
The same method as described in section 3.4.1 was used for transplanting, thinning seeds and for
the spray application. The glyphosate treatment was applied at GS12-13 (Table 33).
Table 33 Glyphosate dose response treatments
Treatment Product Active Dose a.s./L L/ha of product 1 NIL - - - 2
MON79376 Glyphosate 360g a.s./L
180 0.5 3 360 1.0 4 540 1.5 5 720 2.0 6 1080 3.0
Assessments
Plants were assessed 3-4 weeks post-spraying. A record of the total number of plants in the pot and
total number of alive plants in the pot was taken. The fresh weight of all plants per pot (g) was
assessed by carefully cutting the plant at the base and recording the total plants per pot weight.
Testing seed survivors from the large growth stage container experiment
Black-grass seed were collected from container experiment (3.2.1) in June 2019 that had two years
exposure to different glyphosate treatments (see section 3.2.1 for treatment and population details).
There were a total of 16 populations tested including standard populations for comparison (Table
34). In 2019 some of the populations did not have enough seed for a pot test, so seed from 2018
(only one year of selection) was used and is shown in bold in Table 34.

26
Table 34 Seed survivor populations collected from large growth stage container experiment 3.2.1 and tested in a glasshouse dose response to glyphosate.
Population reference Original treatment reference (see Experiment 3.2.1)
SD 0795 Susceptible UTC, 2019 seed SD 0796 Susceptible, 360g glyphosate, GS23, 2019 seed SD 0683 Susceptible, 180g glyphosate, GS23, 2018 seed SD 0684 Susceptible, 360g glyphosate, GS25-28, 2018 seed SD 0685 Susceptible, 180g glyphosate, GS25-28, 2018 seed SD 0798 Susceptible, 360g glyphosate, GS32, 2019 seed SD 0797 Susceptible, 180g glyphosate, GS32, 2019 seed SD 0805 Rothamsted 19 susceptible SD 0800 Peldon resistant UTC, 2019 seed SD 0799 Peldon resistant, 360g glyphosate, GS23, 2019 seed SD 0690 Peldon resistant, 180g glyphosate, GS23, 2018 seed SD 0691 Peldon resistant, 360g glyphosate, GS25-28, 2018 seed SD 0692 Peldon resistant, 180g glyphosate, GS25-28, 2018 seed SD 0801 Peldon resistant, 360g glyphosate, GS32, 2019 seed SD 0802 Peldon resistant, 180g glyphosate, GS32, 2019 seed SD 0032 Peldon resistant baseline seed, SD 0032
The method of testing and assessing was exactly the same as described in the first glyphosate dose
response experiment (3.4.1). The same treatments were applied (Table 33).
Testing seed survivors from selection containers
Black-grass seed were collected from container experiment (3.4.5) in June 2019 that had four years
exposure to different glyphosate treatments (see section 3.4.5 for treatment and population details).
There were a total of 12 populations tested including standard populations for comparison (Table
35). In 2019 some of the populations did not have enough seed for a pot test, so seed from 2018
(only three years of selection) was used and is shown in bold in Table 35.

27
Table 35 Seed survivor populations collected from selection container experiment 3.3.5 and tested in a glasshouse dose response to glyphosate.
Population reference Original treatment reference (see Experiment 3.3.5)
SD 0790 Susceptible, UTC (2019 seed) SD 0676 Susceptible, 180g Glyphosate (2018 seed) SD 0791 Susceptible, 90g Glyphosate (2019 seed) SD 0805 Rothamsted 2019 susceptible SD 0792 BG01, UTC (2019 seed) SD 0673 BG01, 180g Glyphosate (2018 seed) SD 0793 BG01, 90g Glyphosate (2019 seed) SD 0172 BG01 baseline seed (SD 0172) SD 0794 Peldon resistant, UTC (2019 seed) SD 0679 Peldon resistant, 180g Glyphosate (2018 seed) SD 0680 Peldon resistant, 90g Glyphosate (2018 seed) SD 0032 Peldon resistant baseline seed (SD 0032)
The method of testing and assessing was exactly the same as described in the first glyphosate
dose response experiment (3.4.1). The same treatments were applied (Table 33).
Whole plant testing of survivors: RISQ test method
One of the key challenges for understanding resistance risk is to know whether plants will, or are
surviving, due to evolving resistance. It is difficult with glyphosate to know if plants will die prior to
needing to re-spray. It is therefore important to determine if a rapid/instant test could prevent further
selection within-season. The Syngenta RISQ (Resistance In-Season Quick) test method (Kaundun
et al., 2011) was used to test whole plants that have ‘survived’ a glyphosate application. This followed
on from work by Syngenta (Kaundun et al., 2014) where Italian rye-grass was tested but not black-
grass. Plants either came from the trials sets within the project or via farmer contacts through the
project partners. The RISQ test was carried at ADAS Boxworth and Rosemaund with support and
assessment validation from the resistance team at Syngenta’s International Research Station at
Jealott’s Hill, UK.
Methodology
The standard RISQ test method was used with glyphosate with two aims; Firstly to determine the
optimum glyphosate dose to use in future testing, and secondly to establish whether bigger tillered
plants could be used, and not just small GS10-12 plants.
A series of six different experiments were carried out between 2016-2019 using black-grass and
Italian rye-grass populations to validate the optimal glyphosate dose and plant size methods. Tests
included four rates of glyphosate when plants were GS10-12 or GS12-14, (Table 36), however for
tillering plants only one dose was used (50µM) as early tests on smaller plants showed this rate to

28
be robust and this was the rate suggested by Syngenta. Three replicates were used in each
experiment.
Table 36 Treatment list for the RISQ test method with glyphosate during the testing phase.
Treatment number Treatment Dose Plant growth stage 1 Untreated 0µM
Tillered GS 21-24 2 Glyphosate 360 g a.s. /L 50µM
3 Untreated 0 µM
GS 12-14 4
Glyphosate 360 g a.s. /L 35 µM
5 50 µM 6 75 µM 7 Untreated 0 µM
GS 10-12 8
Glyphosate 360 g a.s. /L 35 µM
9 50 µM 10 75 µM
Assessments
Agar plates can be assessed between 14-21 days after inserting the plants. This requires scoring
the root growth by observing the underneath of the dish and not appearance of leaves. Roots are
assessed on Syngenta scale of 1-3: 1 Alive, lots of new growth, 2 Yellow, some new growth, 3 Dead,
no new growth.
Selection experiments: To determine how quickly black-grass populations shift their glyphosate tolerance status
The aim of this experiment was to determine how quickly different populations of black-grass shift
their tolerance to glyphosate after being repeatedly sprayed with selected low doses of glyphosate
over a three year period. The black-grass populations included a susceptible standard and two
populations resistant to other herbicide modes of action (Table 37).
Table 37 Details of black-grass seed populations used in selection experiments
ADAS Sample Reference Source of seed ADAS seed code Boxworth Boxworth 40 acres field 2015 SD 0172 Susceptible Susceptible standard seed SD 0043 Peldon resistant Resistant standard seed SD 0032
A total of 36 containers were filled with the same loam mix and used the same sowing methodology
as described in section 3.2.1. Black-grass plants were treated with three glyphosate doses (Table
38), including an untreated control, using the same application method as described in 3.2.1, at a
growth stage of GS 14-21 and replicated three times.

29
Table 38 Herbicide treatments and dose used in the selection experiments
Treatment Number
Product Active Dose (g a.s./L)
Dose (product) L/ha
1 Untreated - - - 2 MON79376 Glyphosate 360g a.s./L 360 1.0 3 MON79376 Glyphosate 360g a.s./L 180 0.5 4 MON79376 Glyphosate 360g a.s./L 90 0.25
In April every year the containers were isolated into mesh cages into their respective treatments to
prevent cross-pollination. The total number of heads per container were counted in June or July
(Table 39).
Table 39 Sowing, application and assessment timings for selection experiments
Harvest Year Sowing date Application date Head count 2016 20/11/15 03/05/16 05/07/16 2017 07/10/16 15/12/16 06/07/17 2018 15/11/17 20/03/18 06/06/18 2019 23/10/18 07/02/19 26/06/19
After the head count assessment was complete seed from any survivors were collected when
ripened and re-sown each autumn and re-sprayed with the same treatment. Seed collected in
summer 2019 were tested in a glasshouse dose response experiment to determine any shifts
(Section 4.4.5).

30
4. Results
4.1. Application in stubbles (WP1)
Data review
A summary of the collation of the historic glyphosate trials data provided by distributors and
companies were grouped into rate, timing and number of applications. The data held by the
companies was very variable, with experiments undertaken in different fields with varying levels of
black-grass infestation, over different years. The summary of the data provided is therefore based
on a limited number of very varied trials which should be considered when interpreting the results.
Glyphosate rate
Higher glyphosate rates generally increased black-grass control. The optimum rate being
approximately 1080g a.s./ha (Figure 1). Application rates above 1080g provided no increase in
control.
Figure 1 The total amount of glyphosate applied and the effect on the level of black-grass control. The number of collated trials for each data point is shown along the X axis under the glyphosate rate.
Number of glyphosate treatments
The data show that increasing the number of glyphosate treatments increases black-grass control,
with the optimum being approximately 2-3 application timings (Figure 2).

31
Figure 2 The number of glyphosate applications and the effect on the level of black-grass control.
Rate and number of applications
The data were further analysed to try and determine the optimum rate and timing combination for
effective black-grass control. The data showed that the more application timings the higher the total
amount of glyphosate applied, as would have been expected (Figure 3). There were no data
available on a total of 1080g a.s./ha applied in a single application (it was always a split dose). From
these data there was no more control achieved when more than two applications were made
providing an overall rate of 1080g a.s./ha.
Figure 3 The number of glyphosate applications and the total amount of glyphosate applied on the level of black-grass control.

32
Timing and rate
The collated data set did not include many autumn only applications and were generally a
combination of autumn and spring application timings. For the autumn applications data showed that
maximum control only reached 75% with application rates only up to 750g a.s./ha glyphosate from
these data (Figure 4).
Figure 4 The effect of the total amount of glyphosate applied on black-grass control (%)
The data in Figure 5 indicated that splitting the application rates between autumn and spring a single
glyphosate dose of 1080g a.s./ha to 1440g a.s./ha applied alone was more effective than splitting it.
Figure 5 The effect of splitting glyphosate doses between autumn and spring.
The data sets reviewed were limited with most information available on applications made to stubbles
and a single year fallow and much less on autumn, pre-drilling applications. Two key points were

33
taken through into the project field trial treatments to help validate the following: (1) The optimum
glyphosate application was around 1080g a.s./ha, generally split into two applications. (2) There was
no increase in the level of black-grass control with two applications above or over 1080g a.s./ha.
Field experimentation data (WP1.1)
Field experiment 1. Glyphosate and weed flushes (winter wheat cropping 2017 & 2018)
Three field trials were established in autumn 2017 and 2018. Glyphosate was applied at three timings
– early autumn, mid- autumn and late autumn, either as a single rate of 540g a.s./ha (early and mid),
two applications of 540g (early followed by (fb) mid, mid fb late) or a single application of 1080g (late
only). A cultivation was done just prior to or at drilling.
2017
Table 40 Black-grass population information for 2017 sites
Site name Mean Black-grass/m² Autumn
Mean black-grass/m² Spring
Mean black-grass heads/m²
CambsH17 31 1 3 LincsF17 30 4 10 CambsA17 124 2 9
At the CambsH17 site mean black-grass numbers were 31 plants/m² when the trial was set out. All
applications of glyphosate worked well (Figure 6) and reduced populations. A shallow cultivation was
done on 12 October and had little effect on black-grass numbers, the site was drilled on 24 October.
Figure 6 Emergence of black-grass through the autumn and winter in uncultivated plots,
percentage change compared to initial count – CambsH17

34
At heading the number of heads was very low (Figure 7, Table 41) and there were no significant
differences between treatments.
Table 41 Black-grass head counts CambsH17
Treatment Cultivation No cultivation Mean herbicide None 2 1 1 Early 540g 2 8 5 Early 540g Mid 540g 1 0 1 Mid 540g 3 10 6 Mid 540g Late 540g 2 0 1 Late 1080g 0 7 4 Mean cultivation 2 4 Fpr d.f s.e.d l.s.d Cultivation NS 22 1.88 3.92 Herbicide NS 22 3.27 6.78 Cult x herb NS 22 4.63 9.59
Figure 7 Black-grass head counts – CambsH17
At the LincsF17 black-grass populations were moderate (30 plants/m²) at the start of the trial. Black-
grass numbers increased through September and October (Figure 8) but glyphosate applications
reduced populations. The cultivation was done on the same day as drilling, 24 October 2016.

35
Figure 8 Emergence of black-grass through the autumn and winter in uncultivated
plots, percentage change compared to initial count – LincsF17
There were significantly fewer black-grass plants in November where the cultivation were done
(Table 42) and where glyphosate had been applied at the mid and late timings and where two
applications were made.
Table 42 Mean black-grass plant counts on 25 November 2016 - LincsF17
Treatment Cultivation No cultivation mean herbicide None 15 10 13 Early 540g 11 31 21 Early 540g Mid 540g 1 9 5 Mid 540g 5 7 6 Mid 540g Late 540g 3 11 7 Late 1080g 1 7 4 Mean cultivation 6 12
Fpr d.f s.e.d l.s.d Cultivation 0.021 22 2.56 5.28 Herbicide 0.008 22 4.43 9.14 Cult x herb NS 22 6.27 12.93
The November plant counts were reflected in the final head counts (Table 43, Figure 9), with
significantly fewer black-grass in the cultivated plots. Black-grass populations were significantly
lower in the mid and late glyphosate timings and where two applications were made.

36
Table 43 Black-grass head counts LincsF17
Treatment Cultivation No cultivation mean herbicide None 395 552 474 Early 540g 392 994 693 Early 540g Mid 540g 78 91 84 Mid 540g 63 127 95 Mid 540g Late 540g 14 45 30 Late 1080g 37 62 50 Mean cultivation 163 312
Fpr d.f s.e.d l.s.d Cultivation 0.013 22 54.9 113.8 Herbicide <0.001 22 95.0 197.1 Cult x herb 0.038 22 134.4 278.7
Figure 9 Black-grass head counts – LincsF17
At the CambsA17 site initial black-grass populations were high in September (124 plants/m²), but
there was no indication of further emergence after glyphosate applications (Figure 10). The shallow
cultivation was done on 25 October 2016 and the trial drilled on 26 October 2016. All glyphosate
treatments had reduced black-grass populations to low levels by November 2016 (6 plants/m²).
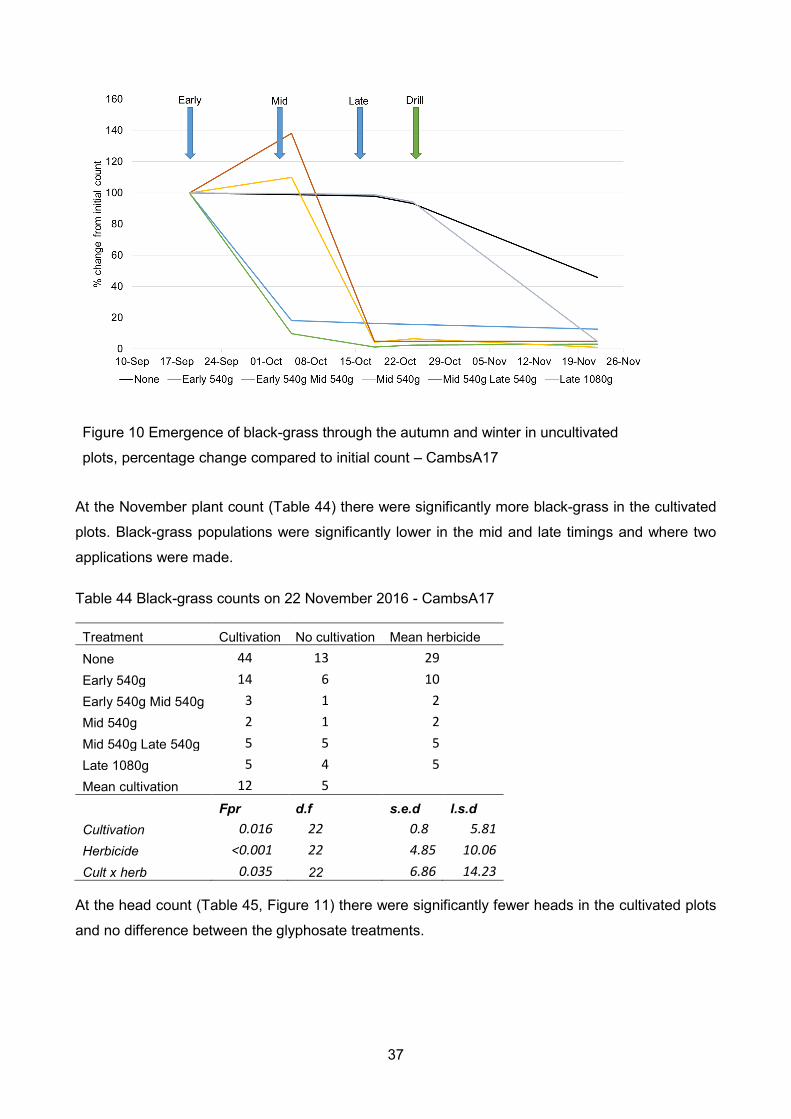
37
Figure 10 Emergence of black-grass through the autumn and winter in uncultivated
plots, percentage change compared to initial count – CambsA17
At the November plant count (Table 44) there were significantly more black-grass in the cultivated
plots. Black-grass populations were significantly lower in the mid and late timings and where two
applications were made.
Table 44 Black-grass counts on 22 November 2016 - CambsA17
Treatment Cultivation No cultivation Mean herbicide None 44 13 29 Early 540g 14 6 10 Early 540g Mid 540g 3 1 2 Mid 540g 2 1 2 Mid 540g Late 540g 5 5 5 Late 1080g 5 4 5 Mean cultivation 12 5 Fpr d.f s.e.d l.s.d Cultivation 0.016 22 0.8 5.81
Herbicide <0.001 22 4.85 10.06
Cult x herb 0.035 22 6.86 14.23
At the head count (Table 45, Figure 11) there were significantly fewer heads in the cultivated plots
and no difference between the glyphosate treatments.

38
Table 45 Black-grass head counts CambsA17
Treatment Cultivation No cultivation mean herbicide None 49 119 84 Early 540g 8 48 28 Early 540g Mid 540g 23 19 21 Mid 540g 9 11 10 Mid 540g Late 540g 16 18 17 Late 1080g 9 15 12 Mean cultivation 19 38 Fpr d.f s.e.d l.s.d Cultivation 0.037 22 8.63 17.91 Herbicide <0.001 22 14.95 31.01 Cult x herb NS
Figure 11 Black-grass head counts – CambsA17
2018
Table 46 Black-grass population information for 2018 sites
Site name Mean Black-grass/m²
Autumn Mean black-grass/m²
Spring Mean black-grass
heads/m² LincsF18 16 0 11 CambsH18 370 21 90
The autumn of 2017 was considerably wetter than in 2016. At the LincsF18 site the shallow
cultivation was done on 26 October 2017, the same day as drilling. Black-grass populations were
low (16 plants/m²) at the start of the trial but there was further emergence which peaked in the

39
untreated in early October (Figure 12). The act of drilling reduced populations in the uncultivated
treatment (Figure 12).
Figure 12 Emergence of black-grass through the autumn and winter in uncultivated plots,
percentage change compared to initial count – LincsF18
Head numbers were low after the low autumn populations of black-grass (Table 47, Figure 13).
Although there were more black-grass heads in the cultivated plots, this was not significantly
different. There were no differences between the herbicide treatments.
Table 47 Black-grass head counts LincsF18
Treatment Cultivation No cultivation Mean herbicide None 67 15 41 Early 540g 6 5 5 Early 540g Mid 540g 4 0 2 Mid 540g 0 1 0 Mid 540g Late 540g 1 0 0 Late 1080g 4 0 2 Mean cultivation 14 3 Fpr d.f s.e.d l.s.d Cultivation NS Herbicide NS Cult x herb NS

40
Figure 13 Black-grass head counts – LincsF18
Initial black-grass populations at the CambsH18 site were very high (370 plants/m²). The shallow
cultivation was done on the same day as drilling 25 October 2017. Black-grass continued to emerge
at this site until drilling (Figure 14), the early application of glyphosate was less effective due to
continued emergence of black-grass. Both drilling and cultivation reduced populations.
Figure 14 Emergence of black-grass through the autumn and winter in uncultivated plots,
percentage change compared to initial count – CambsH18

41
Table 48 Black-grass counts on 20 November 2017 - CambsH18
Treatment Cultivation No cultivation Mean herbicide None 33 36 35 Early 540g 28 25 27 Early 540g Mid 540g 27 17 22 Mid 540g 24 18 21 Mid 540g Late 540g 16 14 15 Late 1080g 28 19 23 Mean cultivation 26 21 Fpr d.f s.e.d l.s.d Cultivation 0.003 22 2.35 4.88 Herbicide NS Cult x herb NS
Black-grass populations were significantly higher in the cultivated treatment in November (Table 49).
There were no differences between the glyphosate treatments at this date.
At the head count (Table 49, Figure 15) there were significant differences between the untreated
and the glyphosate treatments. There were no differences between the glyphosate rates and timings.
Table 49 Black-grass head counts CambsH18
Treatment Cultivation No cultivation mean herbicide None 127 145 136 Early 540g 35 58 46 Early 540g Mid 540g 59 48 53 Mid 540g 38 55 47 Mid 540g Late 540g 30 47 38 Late 1080g 39 39 39 Mean cultivation 55 65 Fpr d.f s.e.d l.s.d Cultivation NS Herbicide 0.001 22 21.39 44.37 Cult x herb NS

42
Figure 15 Black-grass head counts – CambsH18
Conclusions from winter wheat sites 2017-18
• Seasonal differences and seed bank variations had a big effect on these trials, often making
them difficult to compare. There were different starting points in terms of post-harvest
cultivations and seed bed establishment that again must be considered when comparing
these trials.
• A cultivation at or near drilling was effective at reducing black-grass populations in 50% of
cases. It could result in increased black-grass levels (1 case) or have no effect (2 cases).
• An early application (mid-September) of glyphosate was generally ineffective at reducing
black-grass populations due to further emergence of the weed (4 out of 5 sites).
• In all cases a minimum of 540g a.s./ha glyphosate reduced black-grass populations
compared to no glyphosate.
• A split dose of 540g a.s./ha applied at a mid and late (just before drilling) timing was generally
the most effective treatment at reducing the overall black-grass numbers. This treatment also
benefited by having two chances to control any later emerging weeds.
• There was no indication that a higher rate of glyphosate or two doses were more effective
than a well-timed single dose in these particular experiments. However, it should be noted
that the higher rate (1080g a.s./ha) was often applied at the time of drilling due to the window
of opportunity to get all treatments in, making it difficult to distinguish this glyphosate
treatment from the action of drilling.
• In all cases cultivation and/or an effective glyphosate timing has resulted in lower numbers
of black-grass.
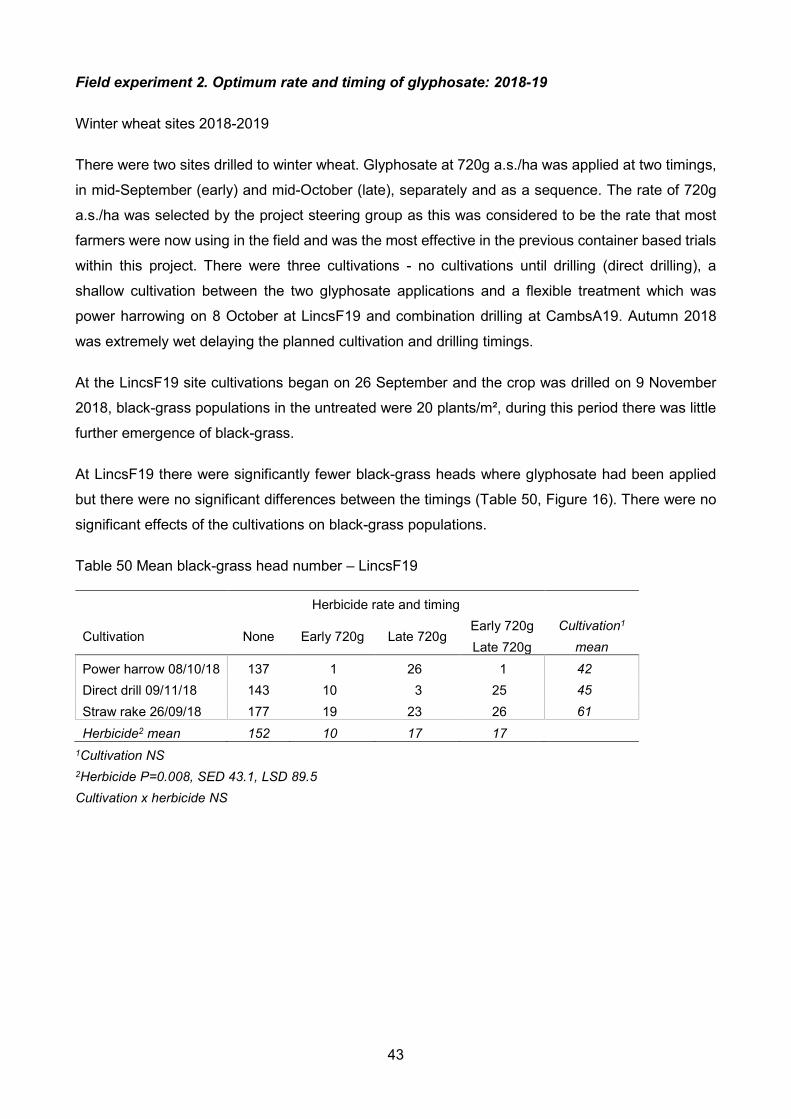
43
Field experiment 2. Optimum rate and timing of glyphosate: 2018-19
Winter wheat sites 2018-2019
There were two sites drilled to winter wheat. Glyphosate at 720g a.s./ha was applied at two timings,
in mid-September (early) and mid-October (late), separately and as a sequence. The rate of 720g
a.s./ha was selected by the project steering group as this was considered to be the rate that most
farmers were now using in the field and was the most effective in the previous container based trials
within this project. There were three cultivations - no cultivations until drilling (direct drilling), a
shallow cultivation between the two glyphosate applications and a flexible treatment which was
power harrowing on 8 October at LincsF19 and combination drilling at CambsA19. Autumn 2018
was extremely wet delaying the planned cultivation and drilling timings.
At the LincsF19 site cultivations began on 26 September and the crop was drilled on 9 November
2018, black-grass populations in the untreated were 20 plants/m², during this period there was little
further emergence of black-grass.
At LincsF19 there were significantly fewer black-grass heads where glyphosate had been applied
but there were no significant differences between the timings (Table 50, Figure 16). There were no
significant effects of the cultivations on black-grass populations.
Table 50 Mean black-grass head number – LincsF19
Herbicide rate and timing
Cultivation None Early 720g Late 720g Early 720g Late 720g
Cultivation1 mean
Power harrow 08/10/18 137 1 26 1 42 Direct drill 09/11/18 143 10 3 25 45 Straw rake 26/09/18 177 19 23 26 61 Herbicide2 mean 152 10 17 17
1Cultivation NS 2Herbicide P=0.008, SED 43.1, LSD 89.5 Cultivation x herbicide NS

44
Figure 16 Mean black-grass head counts – LincsF19
At the CambsA19 site the first application of glyphosate was made on 13 September 2018, and the
late application on 11 October 2018. At this site the black-grass pressure was very high as it
continued to emerge after drilling, with up to 160 plants/m² present in November. As a consequence
black-grass head numbers were high. There were no differences in head numbers between the
untreated and sequenced dose but significantly (p=0.034) less black-grass heads in the early and
late separate treatments. The late treatment having the fewest heads (Table 51, Figure 17). There
were significantly (p=<0.001) fewer black-grass heads in the combi drilled treatment than the other
cultivation treatments alone without any glyphosate.
Table 51 Mean black-grass head number – CambsA19
Herbicide rate and timing
Cultivation None Early 720g Late 720g Early 720g + Late 720g
Cultivation mean
Direct drill 12/10/18 518 461 338 541 465 Shallow 14/09/18 497 474 348 567 472 Combi drill12/10/19 479 366 356 424 406 Herbicide mean 498 434 347 511
1Cultivation P=<0.001, SED 29.4, LSD 61.0 2Herbicide P=0.034, SED 25.5, LSD 52.9 Cultivation x herbicide NS

45
Figure 17 Black-grass head counts – CambsA19
Spring wheat sites 2018-2019
There were two field sites in spring wheat drilled in 2019 in Cambridgeshire, CambsBX19 and
CambsH19. A single application of 720g of glyphosate was made, either in the autumn or in the
spring pre-drilling. One treatment included a single shallow cultivation 10 days after the autumn
glyphosate application, the other treatment remained uncultivated up to drilling.
At Cambs BX19 black-grass populations were high in October (mean 1178 plants/m²). Autumn
cultivation had a significantly decreased black-grass numbers and this effect was enhanced by the
spring application of glyphosate (Figure 18). The effect of cultivation was greater than the effect of
the glyphosate on black-grass populations.
Figure 18 Emergence of black-grass through the autumn and winter, percentage change compared to initial count – CambsBX19

46
At the black-grass head count the value of a shallow cultivation in the autumn compared to no
cultivation was a 59% reduction in black-grass head numbers (Table 52, Figure 19). There were
fewest heads (14 heads/m2) in the autumn cultivated, followed by spring glyphosate before drilling
treatment. However, the spring glyphosate application before drilling with no autumn cultivation was
also extremely effective at reducing the black-grass heads within the crop (40 heads/m2) in this
particular trial. A shallow cultivation was more effective at reducing black-grass head number than
no cultivation and a spring glyphosate application over an autumn one.
Table 52 Mean black-grass head number – CambsBX19
Herbicide rate and timing Cultivation None Autumn 720g Spring 720g Cultivation1 mean
Drill 02/03/19 396 198 40 211 Autumn cultivation 09/11/18 184 86 14 94 Herbicide2 mean 290 142 27
1Cultivation P=<0.001, SED 26.6, LSD 56.7 2Herbicide P=0.034, SED 32.6, LSD 69.4 Cultivation x herbicide P=0.039, SED 46.1, LSD 98.2
Figure 19 Black-grass head counts – CambsBX19
At the CambsH19 site the results were similar although mean black-grass population was lower (128
plants/m²). Autumn cultivation had a significant effect on black-grass numbers and this effect was
enhanced by the spring application of glyphosate (Figure 20). An autumn cultivation was very
effective at reducing black-grass head numbers by 51% (Table 53, Figure 21). In this particular trial
and season the spring application of glyphosate was effective at removing the majority of black-
grass.

47
Figure 20 Emergence of black-grass through the autumn and winter, percentage change compared to initial count – CambsH19
Table 53 Black-grass head number – CambsH19
Herbicide rate and timing
Cultivation None Autumn 720g Spring 720g Cultivation1
mean
Drill 17/02/19 21 17 0 13 Autumn cultivation 25/11/18 9 9 1 6 Herbicide2 mean 15 13 0
1Cultivation P=0.068, SED 3.33, LSD 6.96 2Herbicide P=<0.001, SED 3.84, LSD 8.04 Cultivation x herbicide NS
Figure 21 Black-grass head counts – CambsH19

48
Spring Barley 2019-2020
At the CambsBX20 the value of the autumn cultivation was shown again in a significant reduction
of black-grass populations in combination with a glyphosate application (Figure 22). There was a
flush of black-grass emergence between December and March at this site, more so in the
cultivated treatment. The spring cultivation and application of glyphosate were done on the same
day and this alone or in combination with drilling reduced populations further.
Figure 22 Emergence of black-grass through the autumn and winter, percentage change compared to initial count – CambsBX20
Head numbers followed a similar pattern to the trials in 2019, where autumn cultivation was done
there were significantly reduced numbers (Table 54, Figure 23). There were significantly lower
head numbers in the glyphosate treated plots but no differences between the treatments.
Table 54 Black-grass head number – CambsBX20
Herbicide rate and timing
Cultivation None Autumn 720g Spring 720g Cultivation1 mean
Autumn cultivation 23/10/19 124 12 4 47 Spring cultivation 19/03/20 241 48 123 163 Herbicide2 mean 183 30 63
1Cultivation P=0.007, SED 34.4, LSD 71.16 2Herbicide P=0.007, SED 44.3, LSD 91.7 Cultivation x herbicide NS

49
Figure 23 Black-grass head counts – CambsBx20
Conclusions
Winter wheat sites
• The effect of cultivations was difficult to conclude from the winter crop trial sites as there
were seasonal challenges resulting in the cultivations not showing any significant
differences from each other. At one site cultivation at drilling was effective at reducing
black-grass populations compared to no cultivation.
• All glyphosate applications reduced the black-grass numbers significantly compared to no
glyphosate.
• There was a very big difference in natural black-grass population between the two sites
(one very low, one very high) making the overall interpretation of these results difficult.
Spring cereal sites
• These trials confirmed the value of a cultivation in the autumn for black-grass control, which
reduced numbers (55% reduction on average compared to uncultivated) and selection
pressure for the glyphosate application in the following spring.
• A spring application of glyphosate was the most effective in reducing black-grass numbers
compared to the autumn only application of glyphosate.

50
4.2. Container experiments (WP1.2 and WP3)
Container Experiment 1. The effect of glyphosate dose against weed growth stage
The mean number of black-grass plants and heads per container are summarised in Table 55 for
each of the three populations tested in 2015/16. The percentage reduction from the untreated control
for black-grass plants are summarised in Figure 24.
Table 55 The mean number of black-grass plants and heads per container in 2016
Timing Glyphosate rate g a.s./ha
Population Susceptible Moderate Resistant (BG01) Peldon Resistant
Plants Heads Plants Heads Plants Heads GS10 - 20.33 48.30 13.67 35.70 13.33 58.70 GS 12-13 - 32.67 59.00 13.67 57.70 30.33 73.70 GS 21-22 - 18.00 27.00 10.00 43.30 27.67 52.70 GS10 360 17.00 40.00 6.00 62.30 17.67 89.00 GS10 540 8.33 43.30 8.00 46.00 11.33 25.00 GS10 720 0.00 0.00 0.33 6.70 0.00 0.00 GS 12-13 360 7.33 14.70 6.67 22.00 5.67 61.70 GS 12-13 540 0.00 0.00 0.00 0.00 0.00 3.70 GS 12-13 720 0.00 0.00 0.00 0.00 0.00 0.00 GS 21-22 360 3.00 0.00 1.33 19.30 5.67 62.30 GS 21-22 540 0.33 9.00 0.00 6.00 0.67 7.30 GS 21-22 720 0.33 0.00 0.00 0.30 0.00 0.00
Treatment Population Treatment*population
d.f Plants 70 70 70
Heads 69 69 69
s.e.d Plants 1.386 2.772 4.801
Heads 9.94 4.97 17.22
l.s.d Plants 2.764 5.529 9.576
Heads 19.83 9.91 34.35
Fpr Plants 0.004 <.001 0.126
Heads <.001 0.006 0.267
There was a significant difference between treatments, in this case glyphosate rate and timing of
application, for both the number of plants (F pr 0.004) and highly significant difference for heads (Fpr
<0.001). Glyphosate applied at a rate of 540g a.s./ha and 720g a.s./ha at a black-grass growth stage
of GS12-13 was the most effective overall treatment for all three populations achieving 100% control.
A rate of 720g a.s./ha of glyphosate was required to control the larger weed growth stage of GS21-
22, tillering plants (Figure 24 and Table 55).

51
Figure 24 The percentage reduction from the untreated control of mean number of black-grass plants per container in 2016, treated with glyphosate ate different rates and timings.
The mean number of Italian rye-grass (IRG) plants and heads per container are summarised in Table
56 for each of the three populations tested in 2015/16. The percentage reduction from the untreated
control for IRG plants are summarised in Figure 25.
There was a significant difference between treatment, in this case glyphosate rate and timing of
application, and population of the number of heads (Fpr <0.001). Glyphosate applied at a rate of
720g a.s./ha at a weed growth stage of GS12-13 was the most effective overall treatment for all three
populations achieving 100% control (Table 56 and Figure 25). Glyphosate at 540g a.s./ha at the
same growth stage achieved 100% control of the susceptible and moderately resistant population,
however for the IRG resistant population an extremely low number of surviving plants remained (a
mean of less than one plant/container). A low glyphosate rate to a large weed growth stage achieved
extremely low efficacy in all three IRG populations.

52
Table 56 The mean number of Italian rye-grass plants and heads per container in 2016
Timing Glyphosate Rate g a.s./ha
Population Susceptible Moderate resistance (IRG01) Resistant
Plants Heads Plants Heads Plants Heads GS10 - 40.00 55.30 37.00 79.70 45.00 78.70 GS 12-13 - 36.70 88.30 55.70 68.70 52.30 96.00 GS 21-22 - 30.70 97.00 32.70 34.70 39.70 44.00 GS10 360 25.00 78.70 18.30 14.00 25.00 36.00 GS10 540 22.00 38.30 22.30 28.70 25.70 75.70 GS10 720 6.00 0.00 5.00 0.00 0.00 26.70 GS 12-13 360 0.70 29.00 0.00 0.00 11.00 33.30 GS 12-13 540 0.00 0.00 0.00 0.00 0.70 12.30 GS 12-13 720 0.00 0.00 0.00 0.00 0.00 0.00 GS 21-22 360 23.70 44.70 7.00 36.70 32.30 52.00 GS 21-22 540 1.00 37.30 3.00 2.00 5.30 0.00 GS 21-22 720 2.00 20.30 0.70 12.70 11.00 13.70
Treatment Population Treatment*population d.f
70 70 70
s.e.d Plants 3.59 7.18 12.43
Heads 4.56 9.12 15.8
l.s.d Plants 7.16 14.32 24.8
Heads 9.1 18.19 31.51
Fpr Plants 0.241 <.001 0.996
Heads <.001 <.001 0.004

53
Figure 25 The percentage reduction from the untreated control of mean number of Italian rye-grass plants per container in 2016, treated with glyphosate ate different rates and timings.
The mean number of black-grass plants and heads per container are summarised in Table 57 for
each of the three populations tested in 2016/17. The percentage reduction from the untreated control
for black-grass plants are summarised in Figure 26. Only one untreated control treatment was
included in this year reducing the treatment number to 10. Control of black-grass plants was
generally much higher in this trial year.
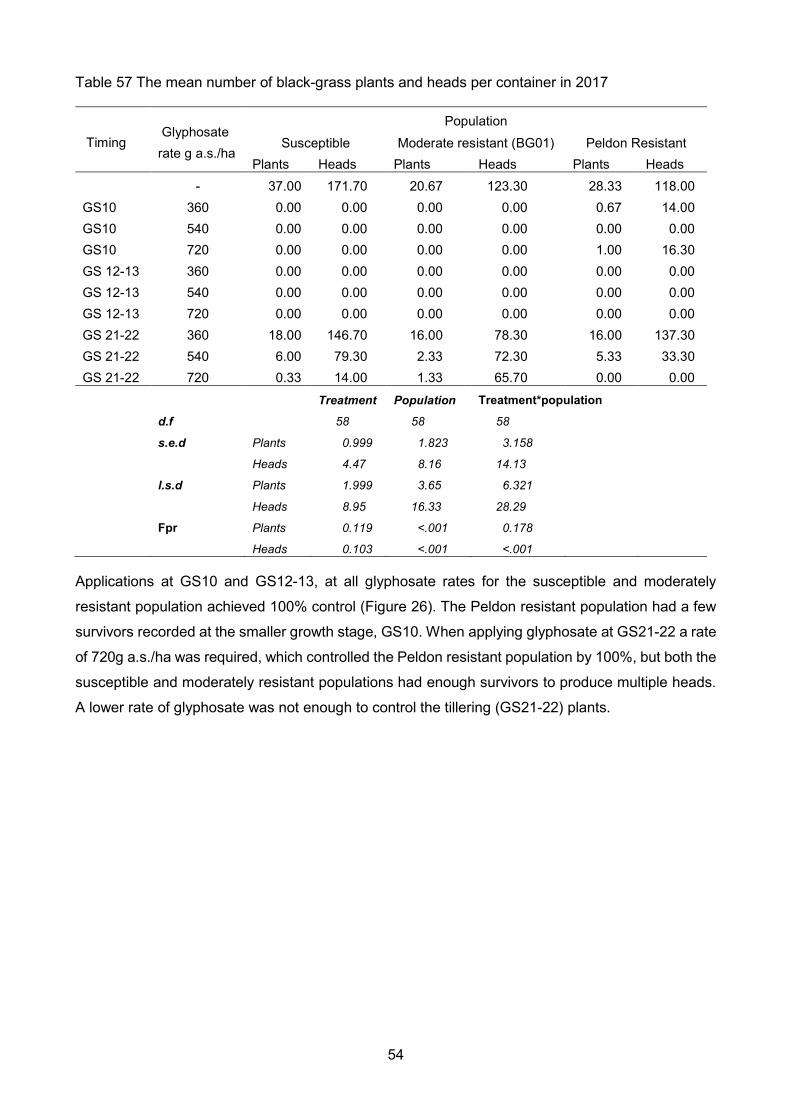
54
Table 57 The mean number of black-grass plants and heads per container in 2017
Timing Glyphosate rate g a.s./ha
Population Susceptible Moderate resistant (BG01) Peldon Resistant
Plants Heads Plants Heads Plants Heads - 37.00 171.70 20.67 123.30 28.33 118.00
GS10 360 0.00 0.00 0.00 0.00 0.67 14.00 GS10 540 0.00 0.00 0.00 0.00 0.00 0.00 GS10 720 0.00 0.00 0.00 0.00 1.00 16.30 GS 12-13 360 0.00 0.00 0.00 0.00 0.00 0.00 GS 12-13 540 0.00 0.00 0.00 0.00 0.00 0.00 GS 12-13 720 0.00 0.00 0.00 0.00 0.00 0.00 GS 21-22 360 18.00 146.70 16.00 78.30 16.00 137.30 GS 21-22 540 6.00 79.30 2.33 72.30 5.33 33.30 GS 21-22 720 0.33 14.00 1.33 65.70 0.00 0.00
Treatment Population Treatment*population d.f
58 58 58
s.e.d Plants 0.999 1.823 3.158
Heads 4.47 8.16 14.13
l.s.d Plants 1.999 3.65 6.321
Heads 8.95 16.33 28.29
Fpr Plants 0.119 <.001 0.178
Heads 0.103 <.001 <.001
Applications at GS10 and GS12-13, at all glyphosate rates for the susceptible and moderately
resistant population achieved 100% control (Figure 26). The Peldon resistant population had a few
survivors recorded at the smaller growth stage, GS10. When applying glyphosate at GS21-22 a rate
of 720g a.s./ha was required, which controlled the Peldon resistant population by 100%, but both the
susceptible and moderately resistant populations had enough survivors to produce multiple heads.
A lower rate of glyphosate was not enough to control the tillering (GS21-22) plants.
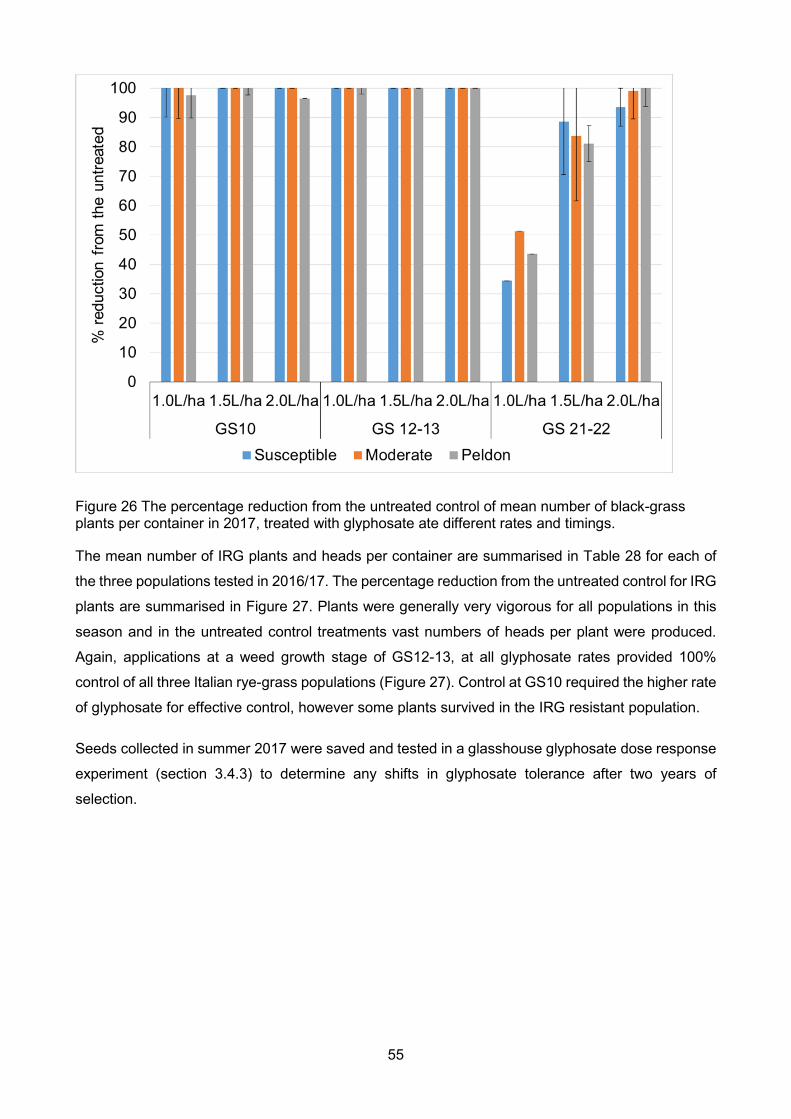
55
Figure 26 The percentage reduction from the untreated control of mean number of black-grass plants per container in 2017, treated with glyphosate ate different rates and timings.
The mean number of IRG plants and heads per container are summarised in Table 28 for each of
the three populations tested in 2016/17. The percentage reduction from the untreated control for IRG
plants are summarised in Figure 27. Plants were generally very vigorous for all populations in this
season and in the untreated control treatments vast numbers of heads per plant were produced.
Again, applications at a weed growth stage of GS12-13, at all glyphosate rates provided 100%
control of all three Italian rye-grass populations (Figure 27). Control at GS10 required the higher rate
of glyphosate for effective control, however some plants survived in the IRG resistant population.
Seeds collected in summer 2017 were saved and tested in a glasshouse glyphosate dose response
experiment (section 3.4.3) to determine any shifts in glyphosate tolerance after two years of
selection.

56
Table 58 The mean number of IRG plants and heads per container in 2017
Timing Glyphosate rate g a.s./ha
Population Susceptible Moderate resistant (IRG01) Resistant
Plants Heads Plants Heads Plants Heads - 23.67 129.00 29.67 170.00 21.00 204.30
GS10 360g 7.67 47.00 1.33 46.30 9.00 234.70 GS10 540g 1.67 49.70 1.33 28.70 2.00 78.30 GS10 720g 0.00 0.00 0.00 0.00 1.00 86.30 GS 12-13 360g 0.00 0.00 0.00 0.00 0.00 0.00 GS 12-13 540g 0.00 0.00 0.00 0.00 0.00 0.00 GS 12-13 720g 0.00 0.00 0.00 0.00 0.00 0.00 GS 21-22 360g 23.33 102.00 27.67 93.70 16.67 191.70 GS 21-22 540g 4.00 30.70 5.00 62.70 5.00 48.70 GS 21-22 720g 1.33 32.70 0.33 14.00 1.33 22.00
Treatment Population Treatment*population d.f 58 58 58
s.e.d Plants 1.069 1.951 3.38
Heads 9.71 17.72 30.7
l.s.d Plants 2.139 3.906 6.765
Heads 19.43 35.48 61.45
Fpr Plants 0.681 <.001 0.231
Heads <.001 <.001 <.001
Figure 27 The percentage reduction from the untreated control of mean number of Italian rye-grass plants per container in 2017, treated with glyphosate ate different rates and timings.

57
Containers Experiment 2. The effect of glyphosate dose, weed size and cultivations
This experiment aimed to investigate the effect of cultivation depth (Deep, 10cm; Shallow 5cm) in
conjunction with glyphosate rate (360g a.s./ha) and growth stage at application timing. In 2016/17
there was a highly significant effect (p= <0.001) of cultivation, treatment and population alone for
both plant and head counts (Table 59), with the exception of population and plant counts where the
significance was less (p = 0.002). All two-way interactions were significant on plant counts (Figure
28) but not on the head count data. The deep cultivation (simulating ploughing) significantly reduced
the number of black-grass plants compared to shallow cultivation and no cultivation across all
populations regardless of glyphosate application or no glyphosate. Shallow cultivation significantly
reduced the number of black-grass plants compared to no cultivation in all treatments and
populations, except the moderately resistant population at GS12-13.
Figure 28 The mean number of plants per container for each black-grass population 2016, with or without glyphosate @ 360g a.s./L, with the addition of no, shallow (5cm) or deep cultivation (10cm).

58
Table 59 The number of black-grass plants and heads per container in 2016
Treatment Population
Herbicide, Cultivation, Growth stage of treatment
Susceptible Moderate resistant
(BG01) Peldon resistant
Plants Heads Plants Heads Plants Heads
UTC, Deep, GS 12-13 1.33 14.00 1.33 18.00 1.67 24.70 UTC, Shallow, GS 12-13 15.33 54.00 9.33 81.00 13.67 84.00 UTC, None, GS 12-13 28.33 43.30 16.67 67.00 21.67 79.30 UTC, Deep, GS 21-22 0.00 0.00 0.00 0.00 0.00 0.00 UTC, Shallow, GS 21-22 11.33 32.00 9.67 64.70 12.00 63.30 UTC, None, GS21-22 19.00 48.70 14.33 107.30 21.67 81.00
Glyphosate, Deep, GS 12-13 0.33 4.00 1.67 35.70 0.00 0.00 Glyphosate, Shallow, GS 12-13 2.67 10.30 3.33 39.70 2.00 29.70 Glyphosate, None, GS 12-13 8.00 40.00 2.67 45.70 5.00 40.70
Glyphosate, Deep, GS 21-22 0.00 0.00 0.00 0.00 0.00 0.00 Glyphosate, Shallow, GS 21-22 2.33 14.00 8.00 60.70 3.33 38.30 Glyphosate, None, GS 21-22 19.33 79.00 15.00 90.70 8.00 67.30
Fpr
Plants
s.e.d
Plants
l.s.d
Plants
Fpr
Heads
s.e.d
Heads
l.s.d
Heads
Cultivation <0.001 1.07 2.14 <0.001 5.92 11.80
Herbicide <0.001 0.62 1.23 <0.001 3.42 6.81
Population 0.02 0.76 1.51 <0.001 4.18 8.34
Cultivation.Herbicide <0.001 1.51 3.02 0.001 8.37 16.69
Cultivation.Population 0.02 1.86 3.70 0.177 10.25 20.44
Herbicide.Population 0.00 1.07 2.14 0.068 5.92 11.80
Cultivation.Herbicide.Population 0.07 2.62 5.23 0.458 14.49 28.90
Similar trends were shown for the IRG experiment (Table 60 & Figure 29). The deep cultivation
always gave the highest level of control compared to the shallow or no cultivation, except for the
resistant population at GS12-13. Glyphosate applied at GS12-13 significantly (p=<0.001) increased
the level of control for every cultivation and for the susceptible and moderately resistant population.
However, the highly resistant (to other modes of action) population showed no additional benefit
from the glyphosate treatment. The rate of glyphosate applied may have been too low to effectively
control this population.

59
Table 60 The mean number of IRG plants and heads per container in 2016
Treatment IRG Population
Herbicide, Cultivation, Growth stage of treatment
Susceptible Moderate resistant (IRG01)
Resistant
Plants Heads Plants Heads Plants Heads
UTC, Deep, GS12-13 0.67 8.70 0.00 0.00 5.67 65.70 UTC, Shallow, GS 12-13 36.67 54.00 17.67 77.70 11.67 78.30 UTC, None, GS 12-13 59.00 69.70 42.67 79.30 30.33 110.00
UTC, Deep, GS 21-22 0.00 0.00 0.00 0.00 0.00 0.00 UTC, Shallow, GS 21-22 21.00 59.30 23.33 53.30 14.00 72.70 UTC, None, GS21-22 56.00 83.30 51.33 74.70 19.00 106.70
Glyphosate, Deep, GS 12-13 0.00 0.00 0.00 0.00 7.67 74.30 Glyphosate, Shallow, GS 12-13 2.67 23.00 0.00 0.00 11.33 70.70 Glyphosate, None, GS 12-13 0.33 3.70 2.00 8.00 8.33 75.00 Glyphosate, Deep, GS 21-22 0.00 0.00 0.00 0.00 0.00 0.00 Glyphosate, Shallow, GS 21-22 19.67 40.00 17.67 39.30 12.33 51.30 Glyphosate, None, GS 21-22 51.00 54.70 48.33 74.70 12.00 100.00
Fpr
Plants
s.e.d
Plants
l.s.d
Plants
Fpr
Heads
s.e.d
Heads
l.s.d Heads
Cultivation <.001 2.71 5.40 <.001 4.53 9.04
Herbicide <.001 1.56 3.12 <.001 2.62 5.22
Population <.001 1.92 3.82 <.001 3.20 6.39
Cultivation.Herbicide <.001 3.83 7.64 <.001 6.41 12.78
Cultivation.Population <.001 4.69 9.36 <.001 7.85 15.65
Herbicide.Population 0.01 2.71 5.40 0.02 4.53 9.04
Cultivation.Herbicide.Population 0.06 6.64 13.23 0.02 11.10 22.14
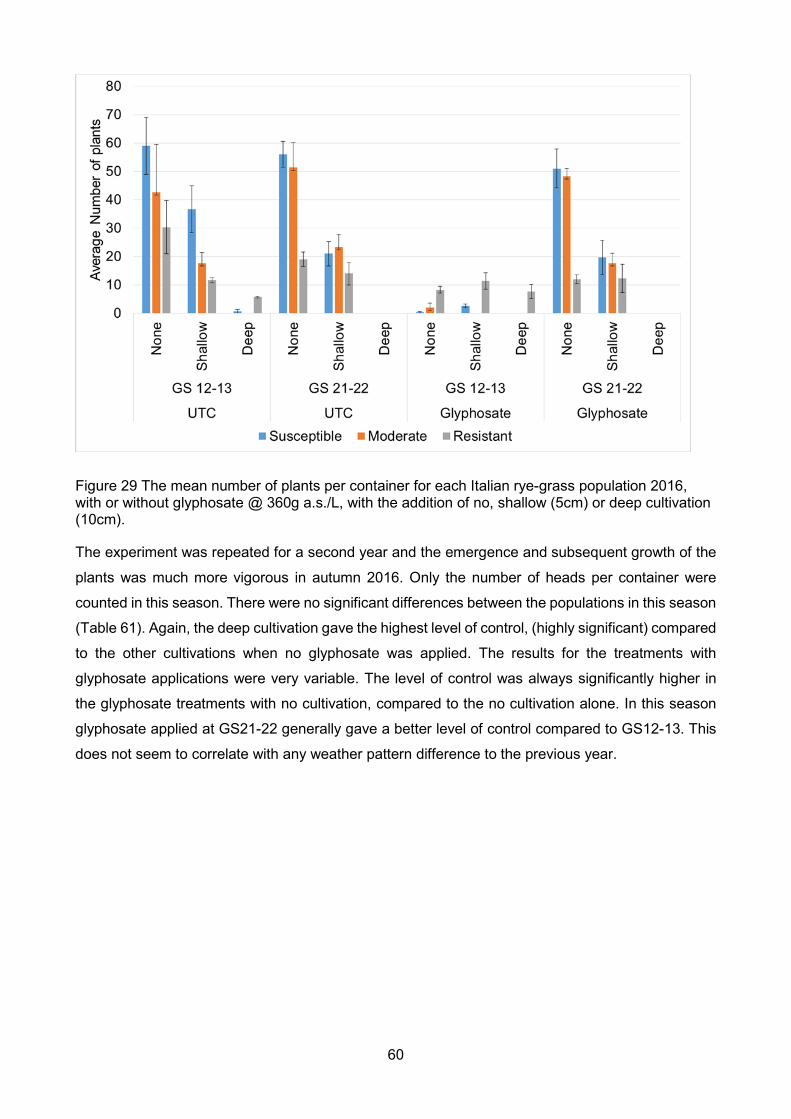
60
Figure 29 The mean number of plants per container for each Italian rye-grass population 2016, with or without glyphosate @ 360g a.s./L, with the addition of no, shallow (5cm) or deep cultivation (10cm).
The experiment was repeated for a second year and the emergence and subsequent growth of the
plants was much more vigorous in autumn 2016. Only the number of heads per container were
counted in this season. There were no significant differences between the populations in this season
(Table 61). Again, the deep cultivation gave the highest level of control, (highly significant) compared
to the other cultivations when no glyphosate was applied. The results for the treatments with
glyphosate applications were very variable. The level of control was always significantly higher in
the glyphosate treatments with no cultivation, compared to the no cultivation alone. In this season
glyphosate applied at GS21-22 generally gave a better level of control compared to GS12-13. This
does not seem to correlate with any weather pattern difference to the previous year.

61
Table 61 The mean number of black-grass heads per container 2017
Treatment Population
Herbicide, Cultivation, Growth stage of treatment
Susceptible Moderate resistant (BG01)
Peldon resistant
UTC, Deep, GS12-13 47.70 63.00 36.70 UTC, Shallow, 12-13 146.30 82.30 148.70 UTC, None, 12-13 154.70 120.30 125.30
UTC, Deep, GS 21-22 0.00 17.00 22.70 UTC, Shallow, GS 21-22 98.00 114.00 153.70 UTC, None, GS21-22 171.00 120.70 134.00
Glyphosate, Deep, GS 12-13 64.30 61.70 8.00 Glyphosate, Shallow, GS 12-13 30.30 41.30 34.70 Glyphosate, None, GS 12-13 30.00 64.30 35.70 Glyphosate, Deep, GS 21-22 0.00 8.70 0.00 Glyphosate, Shallow, GS 21-22 24.70 8.00 0.00 Glyphosate, None, GS 21-22 19.30 22.30 17.30
Fpr df s.e.d l.s.d
Cultivation <.001 70.00 10.06 20.06
Herbicide <.001 70.00 5.81 11.58
Population 0.67 70.00 7.11 14.19
Cultivation.Herbicide <.001 70.00 14.23 28.38
Cultivation.Population 0.24 70.00 17.42 34.75
Herbicide.Population 0.05 70.00 10.06 20.06
Cultivation.Herbicide.Population 0.23 70.00 24.64 49.15
Control levels for the IRG populations in 2017 (Table 62) mirrored those for black-grass, with the
exception of a significant difference between IRG populations. All IRG populations were very
vigorous in this season, however the effect of the deep cultivation with no glyphosate significantly
reduced the number of black-grass heads compared to the shallow or no cultivation treatments. The
overall highest levels of control were achieved with the addition of glyphosate at GS21-22, at all
cultivations and populations.
It can be concluded from these results that the deeper cultivation, with the addition of glyphosate
has always achieved the highest level of black-grass and IRG control. However rate was not
compared in these experiments, so a higher rate than the 360g a.s./ha tested should be investigated
further with the interaction of cultivation depth and population.
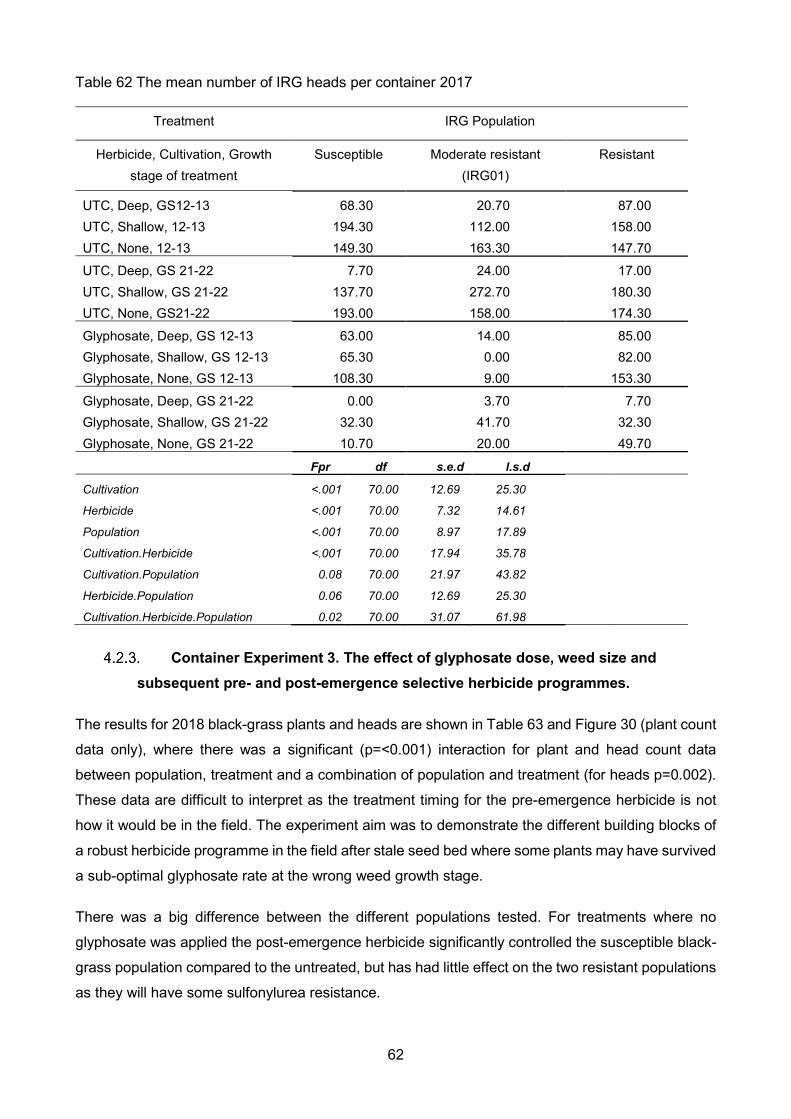
62
Table 62 The mean number of IRG heads per container 2017
Treatment IRG Population
Herbicide, Cultivation, Growth stage of treatment
Susceptible Moderate resistant (IRG01)
Resistant
UTC, Deep, GS12-13 68.30 20.70 87.00 UTC, Shallow, 12-13 194.30 112.00 158.00 UTC, None, 12-13 149.30 163.30 147.70 UTC, Deep, GS 21-22 7.70 24.00 17.00 UTC, Shallow, GS 21-22 137.70 272.70 180.30 UTC, None, GS21-22 193.00 158.00 174.30
Glyphosate, Deep, GS 12-13 63.00 14.00 85.00 Glyphosate, Shallow, GS 12-13 65.30 0.00 82.00 Glyphosate, None, GS 12-13 108.30 9.00 153.30
Glyphosate, Deep, GS 21-22 0.00 3.70 7.70 Glyphosate, Shallow, GS 21-22 32.30 41.70 32.30 Glyphosate, None, GS 21-22 10.70 20.00 49.70
Fpr df s.e.d l.s.d
Cultivation <.001 70.00 12.69 25.30
Herbicide <.001 70.00 7.32 14.61
Population <.001 70.00 8.97 17.89
Cultivation.Herbicide <.001 70.00 17.94 35.78
Cultivation.Population 0.08 70.00 21.97 43.82
Herbicide.Population 0.06 70.00 12.69 25.30
Cultivation.Herbicide.Population 0.02 70.00 31.07 61.98
Container Experiment 3. The effect of glyphosate dose, weed size and subsequent pre- and post-emergence selective herbicide programmes.
The results for 2018 black-grass plants and heads are shown in Table 63 and Figure 30 (plant count
data only), where there was a significant (p=<0.001) interaction for plant and head count data
between population, treatment and a combination of population and treatment (for heads p=0.002).
These data are difficult to interpret as the treatment timing for the pre-emergence herbicide is not
how it would be in the field. The experiment aim was to demonstrate the different building blocks of
a robust herbicide programme in the field after stale seed bed where some plants may have survived
a sub-optimal glyphosate rate at the wrong weed growth stage.
There was a big difference between the different populations tested. For treatments where no
glyphosate was applied the post-emergence herbicide significantly controlled the susceptible black-
grass population compared to the untreated, but has had little effect on the two resistant populations
as they will have some sulfonylurea resistance.

63
Table 63 Black-grass plants and heads per container 2018
Treatments Black-grass populations
Glyphosate treatment (g a.s./ha)
& application timing
Following herbicide
treatment
Susceptible Moderate resistant Peldon resistant
Plants Heads Plants Heads Plants Heads
UTC (GS 12-13)
None 23.67 148.30 20.67 124.30 24.00 109.70
Pre-em 20.33 116.30 13.67 115.30 21.00 121.70
Post-em 4.33 20.30 15.67 106.70 23.00 116.00
UTC (GS21-22)
None 21.33 125.00 13.00 129.00 27.00 135.30
Pre-em 17.67 128.00 16.67 106.00 23.67 106.30
Post-em 8.33 1.70 13.33 90.30 20.67 132.30
MON79376@ 270g, (GS 12-13)
None 12.00 103.00 14.00 92.00 18.33 102.00
Pre-em 15.67 107.00 12.00 101.30 22.33 134.00
Post-em 1.33 6.00 10.00 100.30 18.67 82.70
MON79376@ 270g, (GS21-22)
None 14.00 71.70 10.00 84.00 15.33 48.30
Pre-em 15.74 78.10 11.67 40.00 17.33 77.30
Post-em 6.33 1.70 10.33 40.70 16.00 68.00
MON79376@ 450g, (GS 12-13)
None 7.67 62.30 7.00 41.70 11.67 60.30
Pre-em 10.33 39.70 6.33 21.00 8.67 53.30
Post-em 1.33 6.70 5.33 48.00 12.67 81.70
MON79376@ 450g, (GS21-22)
None 2.33 5.30 1.33 2.30 9.00 15.30
Pre-em 6.67 36.70 1.33 4.30 12.31 41.90
Post-em 0.00 0.00 3.00 1.30 10.00 38.70
df s.e.d l.s.d Fpr
Population 104 0.667 6.11 1.323 12.12 <.001 <.001
Treatment 104 1.634 14.97 3.241 29.68 <.001 <.001
Population x treatment 104 2.831 25.93 5.613 51.41 <.001 0.002
The pre-emergence herbicide alone showed a slight reduction in black-grass plants and heads
compared to the untreated control. However it would be expected that this effect would be greater
in the field when the products were applied at their recommended timing.
When comparing the rate of glyphosate to all other factors, the higher rate of 450g a.s./ha always
gave the highest level of control when compared to the same growth stage at application. There
were no black-grass survivors for the susceptible population when glyphosate at 450g a.s./ha was
applied at a black-grass growth stage of GS21-22 and followed by a post- herbicide.

64
Figure 30 The percentage reduction from the untreated controls for black-grass populations in 2018.
Results for the following season (Table 64 & Figure 31) were very different, with generally higher
levels of control for all treatments where glyphosate had been applied. This can be explained by the
weather conditions at the time of applications in the two different seasons. In February 2019 the
temperature reached an unseasonal 17 oC which is likely to have enhanced the level of glyphosate
control as the weeds would have been actively growing at application (GS21-22) and pre-emergence
applications.
The higher rate of glyphosate applied at GS21-22 resulted in no black-grass survivors despite
population or choice of following herbicide. The addition of the pre-emergence and post-emergence
applications to the 450g a.s./ha glyphosate applied at GS12-13 fully controlled the susceptible and
moderately resistant population. For the same treatment on the Peldon resistant population the pre-
emergence herbicide was highly effectively, however the post-emergence alone did not fully control
the population, which again is due to the resistance to sulfonylurea herbicides in this particular
population.

65
Table 64 Black-grass plants and heads per container 2019
Treatments Black-grass populations
Glyphosate treatment (g a.s./ha) &
application timing
Following herbicide
treatment Susceptible
Moderate
resistant Peldon resistant
Plants Heads Plants Heads Plants Heads
UTC (GS 12-13)
None 21.67 135.70 18.00 120.70 21.67 65.00
Pre-em 8.33 85.30 11.00 60.00 13.00 72.00
Post-em 1.33 12.70 17.00 59.70 23.00 106.00
UTC (GS21-22)
None 23.67 77.30 20.33 71.00 20.33 79.00
Pre-em 17.00 84.30 19.33 89.00 20.67 74.00
Post-em 2.67 14.70 17.67 93.30 23.72 92.90
MON79376@ 270g, (GS 12-13)
None 9.33 68.30 6.67 48.30 11.33 60.70
Pre-em 4.67 7.00 3.67 11.30 7.33 30.00
Post-em 0.00 0.00 6.00 32.70 14.00 66.30
MON79376@ 270g, (GS21-22)
None 0.00 0.00 0.33 2.70 0.00 0.00
Pre-em 0.00 0.00 0.00 0.00 0.00 0.00
Post-em 0.00 0.00 0.00 0.00 1.33 1.30
MON79376@ 450g, (GS 12-13)
None 1.00 15.30 0.00 0.00 2.67 22.70
Pre-em 0.00 0.00 0.00 0.00 0.67 0.30
Post-em 0.00 0.00 0.00 0.00 3.33 23.30
MON79376@ 450g, (GS21-22)
None 0.00 0.00 0.00 0.00 0.00 0.00
Pre-em 0.00 0.00 0.00 0.00 0.00 0.00
Post-em 0.00 0.00 0.00 0.00 0.00 0.00
df s.e.d l.s.d Fpr
Population 104 0.539 2.8 1.069 5.56 <.001 0.001
Treatment 104 1.321 6.87 2.619 13.62 <.001 <.001
Population x treatment 104 2.288 11.89 4.536 23.59 <.001 <.001

66
Figure 31 The percentage reduction from the untreated controls of black-grass populations in 2019.
Overall conclusions from the container experiments
• For black-grass, glyphosate applied at a rate of 540g a.s./ha and 720g a.s./ha at a growth
stage of GS12-13 was the most effective overall treatment for all populations tested.
• For IRG, glyphosate applied at a rate of 720g a.s./ha at a weed growth stage of GS12-13
was the most effective overall treatment for all populations tested. Glyphosate at 540g a.s./ha
at the same growth stage achieved 100% control of the susceptible and moderately resistant
population, however for the IRG resistant population there were survivors.
• A rate of 720g a.s./ha of glyphosate was required to control the larger weed growth stage of
GS21-22, tillering black-grass and IRG plants.
• Deeper cultivation, with the addition of glyphosate always achieved the highest level of black-
grass and IRG control. This was simulating a glyphosate application followed by a cultivation
in a field stale seedbed scenario before drilling. However rate was not compared in these
experiments, so a higher rate than the 360g a.s./ha tested should be investigated further with
the interaction of cultivation depth and population. In practice a more shallow cultivation
within a stale seedbed is more likely, so glyphosate rate is extremely important for effective
control.

67
• Results from the dose, weed size and subsequent herbicide experiment further supported
the evidence that a higher rate of glyphosate is required to effectively control black-grass
populations with a known resistance to other modes of action (such as Peldon resistant). The
higher rate used (450g a.s./ha) was below field rate, but if field rate had been used in these
controlled conditions it would have likely removed all plants preventing the control from
following herbicides to be investigated. This experiment was aiming to demonstrate the need
for effective pre-em and post-em herbicides to remove any black-grass plants that had
potentially been exposed to glyphosate in a stale seedbed and survived.
• The warmer weather conditions in 2019 resulted in a much higher glyphosate efficacy
compared to the previous trial year.
Key output of WP1 (field and container-based experiments):
Field data showed applications of glyphosate as two split rates of 540g a.s./ha provided the overall
highest level of control, ensuring that there are no survivors which could help to prevent resistance
evolution. The addition of a cultivation in a stale seedbed with a glyphosate application increases
control of black-grass and provides an extremely valuable mitigation strategy. A spring –sown cereal
provided the best opportunity to reduce black-grass numbers with an autumn cultivation and
glyphosate application of 720g a.s/ha in the spring ahead of drilling.
Results from all container-based experiments show that the optimum glyphosate rate to control
black-grass or IRG at GS12-13 is a minimum of 540g a.s./ha. When the weed growth stage is at
tillering (GS21-22) a higher rate of glyphosate would be required for effective control. The correct
glyphosate rate for the correct weed growth stage is critical to optimise efficacy and ultimately reduce
the resistance risk.
The weather conditions at the time of glyphosate applications can have a big impact on the level of
control. Warmer temperatures generally mean the weeds will also be actively growing so uptake has
shown to be higher. When conditions are very cold the weeds will not be actively growing so uptake
could be poorer.

68
4.3. Applications between crop rows (WP2)
To investigate the resistance risk of glyphosate applications to larger weed growth stages (Container experiment)
A susceptible and Peldon resistant population were compared with treatments of fairly low
glyphosate rates (<360g a.s./ha) at late weed growth stages (GS23 and above). Results showed a
significant difference (Fpr=<0.001) between treatments but no difference between black-grass
population (Table 65). In 2018 there were survivors for all treatments, as would have been expected
at these relatively low rates. However, in 2019 there was a huge seasonal difference, with very warm
spring weather resulting in complete control of three treatments for both populations. In terms of
resistance evolution this is very beneficial if this had been in the field, but it meant that no seed could
be collected from these treatments in 2019 for a glasshouse dose response experiment.
Table 65 The mean number of black-grass heads per container in 2018 and 2019.
Treatment Population and year
Glyphosate rate (g a.s./ha)
Application timing (Growth stage)
2018 2019
Susceptible Peldon resistant Susceptible Peldon resistant
Untreated - 172.30 162.70 124.00 114.00 360 GS 23 132.70 111.30 9.30 5.00 180 GS 23 162.30 140.30 0.00 0.00 360 GS 25-28 6.30 11.70 0.00 0.00 180 GS 25-28 93.30 78.00 0.00 0.00 360 GS 32 75.00 130.00 19.70 16.70 180 GS 32 128.00 127.00 107.30 90.00 Interactions s.e.d l.s.d Fpr s.e.d l.s.d Fpr
Treatment 7.85 16.13 <.001 9.24 18.99 <.001 Population 4.19 8.62 0.762 4.94 10.15 0.325 Treatment x population 11.1 22.81 <.001 13.07 26.86 0.955
A combination of seed from the 2019 survivors and 2018, where complete control was achieved in
2019, were further investigated in a glasshouse dose response experiment to determine any shifts
in glyphosate tolerance. The list of populations (including their original container experiment
treatments) tested are shown in Table 66 and the survival curve is shown in Figure 32, along with
the ED50 (Figure 33) and ED90 values (Figure 34). The results from the pairwise population
comparisons using R from these figures are showing that generally all populations were controlled
at field rate (540g) of glyphosate. However a few populations where a lower rate (180g) of glyphosate
were used at a larger growth stage of GS25-28 in the container experiment are towards the higher
end of this slope (SD 0685 and SD 0692) requiring a higher glyphosate rate for control. For the

69
susceptible populations six out of the seven populations tested showed a significant shift in the
glyphosate ED50 dose required to control them compared to the baseline population (SD 0805)
(Figure 33). There was a significant (Fpr 0.001) difference between the baseline susceptible and
baseline Peldon resistant populations.
Table 66 Seed survivor populations collected from large growth stage container experiment 3.2.1 and tested in a glasshouse dose response to glyphosate.
Population reference
Original treatment reference (see Experiment 3.2.1) Population, rate, timing
Year of seed collection
SD 0795 Susceptible UTC 2019 SD 0796 Susceptible, 360g glyphosate, GS23 2019 SD 0683 Susceptible, 180g glyphosate, GS23 2018 SD 0684 Susceptible, 360g glyphosate, GS25-28 2018 SD 0685 Susceptible, 180g glyphosate, GS25-28 2018 SD 0798 Susceptible, 360g glyphosate, GS32 2019 SD 0797 Susceptible, 180g glyphosate, GS32 2019 SD 0805 Susceptible baseline SD 0800 Peldon resistant UTC, 2019 seed 2019 SD 0799 Peldon resistant, 360g glyphosate, GS23 2019 SD 0690 Peldon resistant, 180g glyphosate, GS23 2018 SD 0691 Peldon resistant, 360g glyphosate, GS25-28 2018 SD 0692 Peldon resistant, 180g glyphosate, GS25-28 2018 SD 0801 Peldon resistant, 360g glyphosate, GS32 2019 SD 0802 Peldon resistant, 180g glyphosate, GS32 2019 SD 0032 Peldon resistant baseline seed, SD 0032
The susceptible baseline population (SD 0805) is on the far left-hand side of the curves (Figure 32)
showing it is well controlled by glyphosate at 540g a.s./ha. For the susceptible populations six out of
the seven populations tested showed a significant shift in the glyphosate ED50 dose required to
control them after two years selection compared to the baseline population (SD 0805) (Figure 32 &
Figure 33). The biggest significant (Fpr 0.001) shift is from the susceptible population treated with
glyphosate at 180g a.s./ha at a growth stages of 25-28 ((SD 0685) line on the far right-hand side of
the curves Figure 32). The Peldon resistant baseline population (SD 0032) requires a higher dose
of glyphosate to control it and after just two years of exposing plants of the same population to
glyphosate at a low rate of 180g a.s./ha sprayed at a growth stage of 25-28 has resulted in these
plants requiring a significantly (Fpr 0.05) higher rate of glyphosate to now control them ((SD 0692)
line on the far right-hand side of the curves).

70
Figure 32 Survival curve from a glasshouse dose response experiment testing the surviving populations from the large growth stage container experiment. (Glyphosate rate g a.s./ha).
Figure 33 ED50 for populations from the large growth stage container dataset. Values represent the mean ± standard error. Dashed red line represents the recommended field rate of glyphosate.

71
Figure 34 ED90 for populations included from the large growth stage container dataset. Values represent the mean ± standard error. Dashed red line represents the recommended field rate of glyphosate.
Conclusions for the large weed growth stage experiments
It can be concluded from the experiments on the larger black-grass growth stages that shifts in
tolerance to glyphosate can occur very quickly (within two years) in controlled conditions when a
sub-optimal dose for a particular weed growth stage is used. Therefore in practice the correct
glyphosate rate for the weed size is even more critical to optimise efficacy and prevent survivors.
This is particularly important in respect to controlling weeds in perennial crops where they are more
likely to be larger, as well as other grass weed species arable crops.
4.4. Resistance testing (Glasshouse and container experiments) (WP3)
A glyphosate dose response experiment testing black-grass populations from a long-term field trial (Glasshouse Experiment 1).
A set of black-grass seed populations were collected from field plots in summer 2015 from different
treatments from a five-year long-term field trial hosted by one of the project partners. Seed were
tested in a glasshouse dose response to glyphosate (Figure 35). Results show that none of the
populations gave 100% control at the recommended field rate of 540g a.s./ha glyphosate, but ranged
between 55% to 90%. Increasing the glyphosate rate to 720g a.s./ha increased control of all
populations to between 84% to 97% control, except for the Peldon resistant population that only
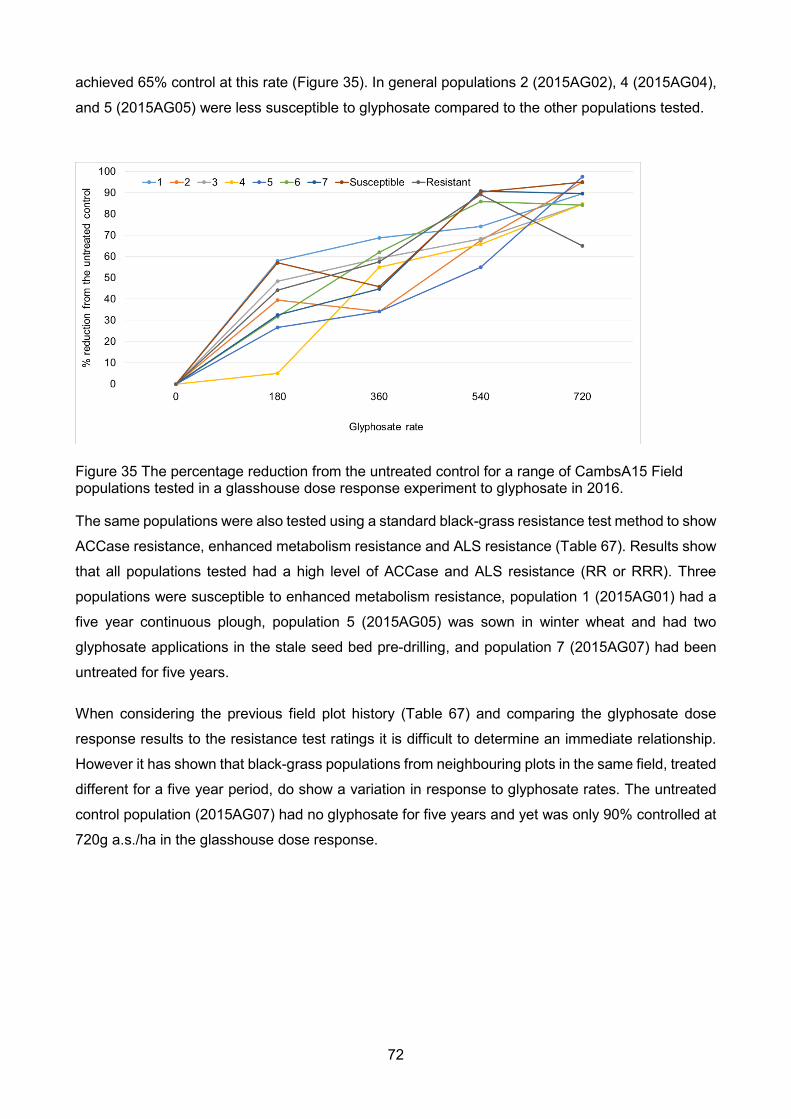
72
achieved 65% control at this rate (Figure 35). In general populations 2 (2015AG02), 4 (2015AG04),
and 5 (2015AG05) were less susceptible to glyphosate compared to the other populations tested.
Figure 35 The percentage reduction from the untreated control for a range of CambsA15 Field populations tested in a glasshouse dose response experiment to glyphosate in 2016.
The same populations were also tested using a standard black-grass resistance test method to show
ACCase resistance, enhanced metabolism resistance and ALS resistance (Table 67). Results show
that all populations tested had a high level of ACCase and ALS resistance (RR or RRR). Three
populations were susceptible to enhanced metabolism resistance, population 1 (2015AG01) had a
five year continuous plough, population 5 (2015AG05) was sown in winter wheat and had two
glyphosate applications in the stale seed bed pre-drilling, and population 7 (2015AG07) had been
untreated for five years.
When considering the previous field plot history (Table 67) and comparing the glyphosate dose
response results to the resistance test ratings it is difficult to determine an immediate relationship.
However it has shown that black-grass populations from neighbouring plots in the same field, treated
different for a five year period, do show a variation in response to glyphosate rates. The untreated
control population (2015AG07) had no glyphosate for five years and yet was only 90% controlled at
720g a.s./ha in the glasshouse dose response.
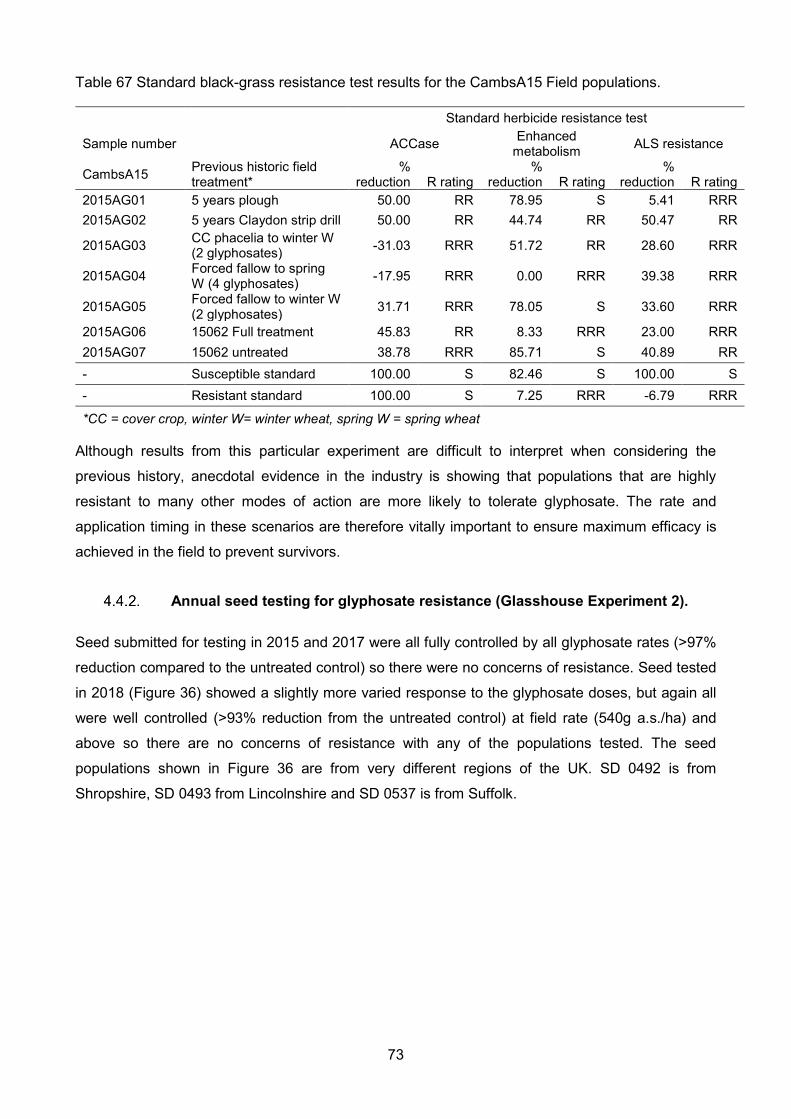
73
Table 67 Standard black-grass resistance test results for the CambsA15 Field populations.
Standard herbicide resistance test
Sample number ACCase Enhanced metabolism ALS resistance
CambsA15 Previous historic field treatment*
% reduction R rating
% reduction R rating
% reduction R rating
2015AG01 5 years plough 50.00 RR 78.95 S 5.41 RRR 2015AG02 5 years Claydon strip drill 50.00 RR 44.74 RR 50.47 RR
2015AG03 CC phacelia to winter W (2 glyphosates) -31.03 RRR 51.72 RR 28.60 RRR
2015AG04 Forced fallow to spring W (4 glyphosates) -17.95 RRR 0.00 RRR 39.38 RRR
2015AG05 Forced fallow to winter W (2 glyphosates) 31.71 RRR 78.05 S 33.60 RRR
2015AG06 15062 Full treatment 45.83 RR 8.33 RRR 23.00 RRR 2015AG07 15062 untreated 38.78 RRR 85.71 S 40.89 RR - Susceptible standard 100.00 S 82.46 S 100.00 S - Resistant standard 100.00 S 7.25 RRR -6.79 RRR
*CC = cover crop, winter W= winter wheat, spring W = spring wheat
Although results from this particular experiment are difficult to interpret when considering the
previous history, anecdotal evidence in the industry is showing that populations that are highly
resistant to many other modes of action are more likely to tolerate glyphosate. The rate and
application timing in these scenarios are therefore vitally important to ensure maximum efficacy is
achieved in the field to prevent survivors.
Annual seed testing for glyphosate resistance (Glasshouse Experiment 2).
Seed submitted for testing in 2015 and 2017 were all fully controlled by all glyphosate rates (>97%
reduction compared to the untreated control) so there were no concerns of resistance. Seed tested
in 2018 (Figure 36) showed a slightly more varied response to the glyphosate doses, but again all
were well controlled (>93% reduction from the untreated control) at field rate (540g a.s./ha) and
above so there are no concerns of resistance with any of the populations tested. The seed
populations shown in Figure 36 are from very different regions of the UK. SD 0492 is from
Shropshire, SD 0493 from Lincolnshire and SD 0537 is from Suffolk.

74
Figure 36 Results of the 2018 glyphosate resistance test in the glasshouse from farmer submitted seed. Glyphosate rate g a.s./ha.
Container experiment seed survivors: Glyphosate dose response testing
There were eight black-grass populations from the glyphosate dose and weed size container
experiment that had enough seed for a dose response to glyphosate after two years of selection.
Four of the populations (SD 0549, SD 0550, SD 0552 and SD 0555) showed a significant
difference in the ED50 value, but not always the ED90 value (Table 68,
Figure 37 and Figure 38) compared to the baseline. Three of these populations had been exposed
to a low rate (360g a.s./ha) of glyphosate at a large weed growth stage (tillering), with the Peldon
resistant population (SD 0555) showing the highest ED90 value of 716.9.
Table 68 The ED50 and ED90 values for black-grass populations tested from container experiment 1 (dose and weed size).
Reference Original population & treatment ED50 Std. Error
Fpr ED90 Std. Error
Fpr
SD 0200 Peldon resistant baseline 393.6 14.8 - 513.6 31.0 - SD 0525 Susceptible standard baseline 240.3 14.4 - 325.2 27.2 - SD 0548 BG01, untreated 286.4 18.4 - 462.9 37.0 - SD 0549 BG01, 720g (GS12-13) 345.8 21.3 0.020 585.3 47.9 0.021 SD 0550 BG01, 360g (GS21-22) 360.0 3.5 >0.001 384.1 289.8 0.823 SD 0551 Susceptible, untreated 236.0 19.3 - 460.1 47.5 - SD 0552 Susceptible, 360g (GS21-22) 333.4 21.4 >0.001 580.7 49.3 0.0498 SD 0553 Peldon resistant, untreated 335.6 20.0 - 540.6 41.5 - SD 0554 Peldon resistant, 720g (GS10) 278.5 17.8 0.051 440.3 35.4 0.003 SD 0555 Peldon resistant, 360g (GS21-22) 420.7 23.6 0.002 716.9 54.8 >0.001
Note: there are only Fpr values when treatments were compared to the original baseline population. The gaps in the Fpr columns indicates an untreated or the baseline population.

75
Figure 37 The ED50 values for black-grass populations
Figure 38 The ED90 values for black-grass populations

76
Results for the same dose response experiment with the survivors of the IRG populations are shown
in Table 69, Figure 39 and Figure 40. Three populations (SD 0557, SD 0559 and SD 0560) out of
the 10 populations tested shown a significant value for ED50 and ED90 (Table 69).
Table 69 The ED50 and ED90 values for IRG populations tested from container experiment 1 (dose and weed size).
Reference Population history ED50 Std. Error
Fpr ED90 Std. Error
Fpr
SD 0215 Susceptible standard 243.3 15.7 - 389.1 26.0 - SD 0556 IRG01, Untreated 316.8 18.3 - 506.6 30.1 - SD 0557 IRG01, 360g (GS21-22) 399.5 20.6 >0.001 638.8 34.5 0.037 SD 0558 Susceptible, untreated 252.8 16.2 - 404.3 26.7 - SD 0559 Susceptible, 360g (GS21-22) 365.3 19.5 >0.001 584.1 32.5 >0.001 SD 0560 Susceptible, 720g (GS21-22) 345.7 19.0 >0.001 552.8 31.5 >0.001 SD 0561 Resistant, untreated 336.3 18.8 - 537.8 31.0 - SD 0562 Resistant, 720g (GS10) 306.6 18.1 0.141 490.3 29.7 0.754 SD 0563 Resistant, 360g (GS21-22) 306.9 18.0 0.047 490.8 29.7 0.209 SD 0564 Resistant, 540g (GS21-22) 375.0 19.8 0.272 599.6 33.1 0.013 SD 0565 Resistant, 720g (GS21-22) 321.6 18.4 0.317 514.4 30.3 0.674
Note: there are only Fpr values when treatments were compared to the original baseline population. The gaps in the Fpr columns indicates an untreated or the baseline population.
Figure 39 The ED50 values for IRG populations

77
Figure 40 The ED90 values for IRG populations
The same trend was shown for IRG as for black-grass, where the previous treatment of a lower
glyphosate rate (360g a.s./ha) at a higher weed growth stage (GS21-22), resulted in the biggest and
most significant shift in glyphosate tolerance.
It can be concluded that both black-grass and IRG exposed to glyphosate at a sub-optimal rate and
at a weed growth stage that is above GS12-13 for two years in controlled conditions required a higher
rate of glyphosate for optimum control. These results are in controlled conditions and it would be
highly unlikely to be detected this quickly in field conditions with the dilution effect of the weed seed
bank and crop competition. However, this is an early warning system and validates the need for the
correct rate and weed growth stage to optimise efficacy and potentially slow or prevent resistance
evolution.

78
Whole plant testing of survivors: RISQ test method
All RISQ test experiments were very successful and provided valuable additional data to verify and
further enhance this method for glyphosate. The test assessment requires scoring the root growth
by observing the underneath of the Petri dish and not the appearance of leaves. Roots are assessed
on Syngenta scale of 1-3: 1 Alive, lots of new growth, 2 Yellow, some new growth, 3 Dead, no new
growth. However, ADAS assessors added a further category (4) as some roots look ‘very’ dead!
Results for the initial comparison of black-grass populations that were susceptible or resistant to
other herbicide modes of action concluded that optimal glyphosate rate is 50 µm and it not effected
by the different populations (Figure 41), which both scored above level 3. This test was repeated to
validate the result.
A second experiment included the same black-grass populations with the addition of plant size as a
factor. It can be concluded from the results (Figure 42) that the larger plants (GS21-22) were equally
well controlled in this test than the smaller plants (GS12-13). In this particular test both the
populations at GS12 did not respond to the rate of 50 µm of glyphosate quite as effectively as in
other tests, however we are still confident with this rate in the repeats of experiment one.
Figure 41 Level of control for the susceptible and resistant black-grass populations tested with different glyphosate rates at a growth stage of GS12 in 2016.

79
Figure 42 Level of control for the susceptible and resistant black-grass populations tested with different glyphosate rates at two different growth stages, GS12 and GS21-22 in 2016.
The RISQ test method was also used on IRG populations to validate dose and plant growth stage.
The first experiment included a susceptible standard population and a known ALS-inhibitor resistant
population. The results for the growth stage experiment (Figure 43) has shown that both of the
populations respond better when tested at the larger growth stage of GS21-22 compared to GS12.
The test was then repeated a final time using a glyphosate resistant IRG population sourced from
Australia, to demonstrate the effectiveness of the test method for detecting glyphosate resistance.
Results show (Figure 44) that the glyphosate resistant population produced new root growth at all
doses tested. The susceptible populations tested required the higher dose of 75 µm to fully control
both of them, so this higher rate should be used for further IRG testing.
Figure 43 Level of control for the susceptible and ALS-resistant Italian rye-grass populations tested with different glyphosate rates at two different growth stages, GS12 and GS21-22 in 2018.

80
Figure 44 Level of control for IRG populations, included two herbicide susceptible and one glyphosate resistant in 2020.
Results from this project have further validated the use of the RISQ test method for black-grass and
IRG with glyphosate. The optimum glyphosate rate for testing has been confirmed and the successful
inclusion of larger plants will now enhance the practicalities of the test. It will provide a further option
for a quick test method when resistance is suspected, but should be followed up with a glasshouse
pot test if any resistance is detected.
Selection experiment: To determine how quickly black-grass populations shift their glyphosate tolerance
The selection experiments ran for a four-year period in containers. In 2016 and 2017 three
glyphosate rates were tested, however by 2018 there were not enough survivors from the 360g
a.s./ha rate to continue with this selection line so it was removed. The mean number of heads per
container are shown for each year in Figure 45. Control levels were extremely high in 2018/19
resulting in some seed lots from 2018 being required for the dose response experiments, particularly
for the 180g a.s./ha rate.

81
Figure 45 The mean number of black-grass heads per container for black-grass populations tested in the selection experiment for four-years, 2016-2019.

82
The populations tested in the glasshouse dose response experiment are show in Table 70. The
survival curves, along with the ED50 and ED90 values are shown in Figure 46, Figure 47 and Figure
48 respectively.
Table 70 Population reference and original seed source for the selection experiment
Population reference Population & historic treatment rate and timing Year of seed collection SD 0032 Peldon resistant baseline seed Baseline SD 0172 BG01 baseline seed Baseline SD 0673 BG01, 180g Glyphosate 2018 SD 0676 Susceptible, 180g Glyphosate 2018 SD 0679 Peldon resistant, 180g Glyphosate 2018 SD 0680 Peldon resistant, 90g Glyphosate 2018 SD 0790 Susceptible, UTC 2019 SD 0791 Susceptible, 90g Glyphosate 2019 SD 0792 BG01, UTC 2019 SD 0793 BG01, 90g Glyphosate 2019 SD 0794 Peldon resistant, UTC 2019 SD 0805 Rothamsted susceptible 2019
The results from the pairwise population comparisons using R from these figures are showing that
generally all populations were controlled at field rate (540g) of glyphosate (Figure 46, Figure 47 &
Figure 48). The baseline Peldon resistant population (SD 0032) required the highest glyphosate rate
compared to the other populations tested, which was significantly different (Fpr 0.001) compared to
the baseline susceptible population (SD 0805). The Peldon resistant populations that had been
exposed to 90g (SD 0680) and 180g (SD 0679) for three-years were the next highest ED50 and ED90
levels (Figure 47 & Figure 48) showing that they required a significantly higher glyphosate rate (90g
Fpr=0.1 and 180g Fpr =0.05) to control them after repeated low rate exposure in controlled
conditions. There were no significant shifts from the baseline population for the BG01 population or
the susceptible population in this particular experiment.
These results have not shown a very high shift in population tolerance to glyphosate, as we might
have expected over four-years in controlled conditions, but have indicated a trend towards a
repeated lower rate, on a black-grass population with known resistance to other herbicide modes of
action (such as Peldon resistant), to then require a higher glyphosate rate for optimum control.

83
Figure 46 Survival curve for the populations included in the selection container experiment
Figure 47 ED50 for populations included in the “Selection” dataset. Values represent the mean ± standard error. Dashed red line represents the recommended field rate of glyphosate

84
Figure 48 ED90 for populations included in the selection containers dataset. Values represent the mean ± standard error. Dashed red line represents the recommended field rate of glyphosate

85
5. Discussion
This project began when the WRAG guidelines were put together in 2015. They were a collation of
the best knowledge of the experts at the time, but often presumptions were based on limited, or no,
evidence, so tended to be risk averse. The initial project phase included a more in depth review of
data available, but unpublished by some of the partner companies. These data enabled us to
determine the gaps in knowledge or highlighted areas where further validation were required to
optimise glyphosate efficacy and at the same time reduce the risk of resistance evolution. As the
project developed experimental evidence showed that the majority of information in the guidelines
was correct, but vitally provided increased confidence in the measures to ensure glyphosate
stewardship.
Results of the multiple field and container-based experiments concluded consistent strong evidence
on correct application timing, rate and weed growth stage for optimal efficacy, therefore preventing
survivors. Seed collected from the dose and weed size experiment, the four-year selection
experiment and the large growth stage experiments, showed a trend towards populations requiring
a higher glyphosate rate when they had been exposed to a low rate at a large weed growth stage.
In field situations these survivors are likely to gradually build up the resistance to glyphosate in a
population over time.
The overall key messages were:
o Optimum glyphosate application timing for black-grass & Italian ryegrass GS12-13.
o Glyphosate rate >540g critical for optimal control (maximum efficacy).
o If target weeds are tillering (>GS21-22) a higher glyphosate rate (720g +) required.
o Temperature at application is extremely important, enhancing or inhibiting control.
o Cultivation of stale seedbed essential to increase black-grass control.
o Maximum of two glyphosate application timings for a stale seedbed.
o In controlled conditions a shift in glyphosate sensitivity was detected in seed survivors of treatments at low rates and at large growth stages, therefore validating the need for optimal control to prevent survivors and reduce resistance risk.
Field experiments were variable across the years with seasonal differences affecting the results. It
was not always possible to practically get as many stale seedbeds in, or spread apart, due to the
weather in a given season, or, for example, the soil was too wet to cultivate when we had planned.
Therefore being too prescriptive of the number of cultivations or glyphosate applications in a stale
seedbed is not practical in reality. We have been able to suggest ‘best practice’ based on the
evidence that has been generated through the experiments, but soil type, geographic location,
previous cropping and weather conditions during this phase will all have a large impact on overall
success. Results from the spring sown experiments showed very strong evidence that an autumn

86
cultivation was vital to reduce black-grass numbers ahead of a spring sown crop. All field
experiments have been limited to black-grass only, so further work on Italian rye-grass is required.
Container-based experiments strongly concluded the importance of correct weed size and
glyphosate rate, for both black-grass and Italian rye-grass populations, despite resistance status to
other herbicide modes of action. The populations for both grassweeds that were most highly resistant
to other modes of action were most often showed a higher level of tolerance to glyphosate than other
populations. This was most evident in the Italian rye-grass populations tested.
The use of the RISQ test for early detection of glyphosate tolerant populations would be a very
valuable and quick method for early detection, followed by a robust glasshouse pot test. The
monitoring of grassweed patches of concern and immediate removal is recommended to reduce the
risk of glyphosate resistance evolution, especially where glyphosate usage is high and continual.
Evidence on development of resistance evolution was more difficult to demonstrate within the
experimental timeframes. One glasshouse dose response experiment did conclude that for selected
populations, the use of a low dose at a higher weed growth stage, for both black-grass and Italian
ryegrass, resulted in a higher rate of glyphosate required to control those survivors. It is important to
note that this was from seed collected from controlled conditions with no dilution effect from a weed
seed bank or crop competition. It is a concern, and due warning, that these shifts in glyphosate
tolerance can be detected in just two years in controlled conditions, but within a field scenario it
would be many years before these tolerance shifts would be detected. This is in line with the work
by Neve et al., (2002) where simulation models for rigid rye-grass predicted that resistance could
evolve in the field in 10-15 years, in reduced tillage situations reliant on glyphosate pre-drilling.
Results from the dose response of seed collected from the four-year selection container experiment
did not show any clear shifts in glyphosate tolerance. It is a positive result that glyphosate resistance
evolution is evidently not a quick process, so further enhances the messages of optimising control
from glyphosate at all stages of a crop rotation.
It can be concluded that this programme of work provides information to further underpin the WRAG
guidelines to manage resistance, in particular quantifying the four key principles:
Prevent survivors: Container-based experiments of repeated low glyphosate rate or applications
at the wrong weed growth stage (too large for the rate used) lead to plant survivors. Seed collected
from those survivors were further tested in glasshouse dose response pot experiments. Results from
some of the populations tested concluded that plants exposed to a low rate applied at a large weed
growth stage then required a higher rate of glyphosate for optimal control than previously. This has
validated this principle.

87
Maximise efficacy: Container-based experiments quantifying the optimum glyphosate rate and
application timing for both black-grass and Italian ryegrass successfully validated this principle. Data
generated consistent conclusions that using the correct glyphosate rate at the correct weed growth
stage for that target weed optimised control. Weather factors at the time of application were also
important in maximising efficacy, as in one trial year a very warm spring enhanced the glyphosate
efficacy. It is important to note that this was in outdoor container-based experiments where water
was not limited, but may not have been exactly the same in field due to the dry weather conditions.
Use alternatives: Multiple field experiments integrating cultivations in conjunction with glyphosate
applications proved that that the cultivation increased the level of black-grass suppression in the
stale seed bed. This alternative method of control is important as a non-chemical input helping to
reduce the reliance on glyphosate alone. This principle will be modified in the guidelines.
Monitor success: Conclusions from this project will now be used to update the WRAG guidelines.
Continued promotion of the key messages will highlight the importance of monitoring future weed
control programmes, in respect to glyphosate and how effective individual treatments are.
The WRAG guidelines will now require some minor modifications to include the evidence generated.
The key area is stale seedbed management, which should say a maximum of two timings is ideal
rather than >2 timings as currently included. However, on occasion three timings (or even just one
timing) could be beneficial and this would be very seasonally dependant. The addition of a cultivation
within a stale seedbed again can be complicated depending on the timing of that action. If it is early
in the phase of the stale seedbed, allowing a big enough window for any flush of grassweeds to be
controlled by a glyphosate application pre-drilling then it has been proven to be extremely valuable.
If it is a very dry, or extremely wet autumn there may be very few weeds emerging, so advice would
need to be tailored to the seasonal conditions. However, even the act of drilling can move the soil
enough for another flush of grassweeds to emerge into the crop. The depth of cultivation is most
beneficial when it is no more than 5cm deep. The guidelines will be reviewed to see if this can be
any clearer.
There are still no glyphosate resistant grassweeds in the UK, but populations have been highlighted
where sub-optimal rates show a rapid decline in control ((Davies et al., 2017; Davies et al., 2018).
This was shown in some of the container-based experiments in this project, including the selection
experiment, where the Peldon resistant black-grass population (resistant to other herbicide modes
of action) exposed to either 90g or 180g of glyphosate for three-years in controlled conditions
required a higher glyphosate rate for optimum control.
The environmental consequence of the loss of glyphosate due to resistance or legislative changes
are highlighted in Clarke, 2018, including an increase in greenhouse gas emissions due to cultivation
and inputs changes, increased land requirements and reductions in yield. The first cases of

88
glyphosate resistant grassweeds were recorded in Australia (Powles et al., 1998) in Lolium rigidum
in arable crops. In New Zealand cases of glyphosate resistance Italian rye-grass (Lolium multiflorum)
and perennial rye-grass (Lolium perenne) were recorded in 2013 in perennial vineyard (Ghanizadeh
et al., 2013). Further work on the ryegrass populations in New Zealand (Ghanizadeh et al., 2016)
showed that the mechanism of glyphosate resistance loses its efficacy in cooler conditions, so
practical advice there has been to spray glyphosate when cooler. However our work has shown that
warmer conditions enhances the glyphosate efficacy, so where no glyphosate resistant populations
exist optimising control should be best advice. A resistance management and prevention strategy
has been produced in New Zealand (Harrington et al., 2016), similar to our UK WRAG guidelines,
although they are now in a reactive mode to a problem that has already begun. The guide includes
control in perennial crops such as vineyards and orchards, amenity areas, arable cropping and
pasture land, which is something the UK should now consider to increase advice beyond arable
cropping. The first case of glyphosate resistance in an arable crop in Europe was reported in Italy
(Collavo + Sattin, 2014) to ryegrass (Lolium spp.), which also showed cross resistance to ACCase
and ALS-inhibitor herbicides.
One of the conclusions from a recent survey carried out by the ENDURE project (Antier et al., 2020)
highlighted the need for more research to fully capture the total glyphosate use in arable cropping
across the EU, including the UK, as data are currently very variable and difficult to extrapolate exact
use area, as it may be underestimated to date. It is therefore vital that in the UK accurate records of
glyphosate use, including rates and timings are recorded.
The key part of optimal glyphosate management is reducing survivors and maximising the outcome
of any glyphosate application. Any survivors will go on to generate a resistance risk. The stale
seedbed phase is often not considered part of the herbicide inputs for that next crop. Therefore, it
must be promoted clearly to arable growers that it is an extremely important phase of the cropping
year that can have a huge impact on the weed pressure and subsequent herbicide choices and cost
inputs in the crop. The whole glyphosate strategy has to become part of an overall integrated weed
management plan and be considered across a cropping rotation.
Future work should include focus on communicating the key messages from this project and to
update the WRAG guidelines as outlined, continuing to pro-actively highlight the risk of glyphosate
resistance. This was discussed further by Clarke (2018). The glyphosate label, or technical
supporting literature, would benefit from including specific details on optimum growth stage for
application for key weeds. The labels state the risk of glyphosate resistance is low, but perhaps this
should be increased to a medium risk with evidence from these results. This project has only included
two grassweeds in arable crops, so investigations on other high risk weed species, other crops,
particularly perennial crops need to be considered. Perennial crops may involve weeds being at
much larger growth stages when treated, so optimising glyphosate rate will be essential. Only one

89
glyphosate formulation has been used within the project for consistency, but in reality farmers will
be using a wide range of different product choices, water conditions and adjuvants, so all these
factors would need further investigation to be more specific about their impact. As weather conditions
have such a large influence on soil, weed emergence, crop establishment and herbicide efficacy,
there needs to be further work to continue to validate the optimum stale seed bed advice over multi-
seasons.
Glyphosate is essential to grassweed control in arable crops in the UK. It can be maintained as a
key tool for grassweed management through resistance prevention and good stewardship to prevent
loss through legislation, if it is respected and used wisely.

90
6. Acknowledgements
We would like to thank AHDB and the partner companies (Albaugh, FMC (Headland), Nufarm and
Bayer CropScience Ltd) for funding the project. We are really grateful to the partner companies
(Agrii, Hutchinsons and Frontier) that provided field sites and their staff and equipment to enable the
field experiments to be delivered and to Agrovista for additional practical input. Thank you to
Syngenta Jealott’s Hill staff for training us with the RISQ test method and providing support and
guidance throughout the project. Thank you to all ADAS staff who have supported this project, in
particular to Kerry Boardman at Boxworth for her patience with the hundreds of pots and containers
that were processed over the years along with many field counts! We would also like to thank Dr
Laura Davies, with her support on the field experiments and to Laura Davies and Daniel Leybourne
for their statistical expertise with the R analysis of the dose response experiments. Thanks to Chris
Dyer for all other statistical support. Thanks to James Clarke for chairing the steering group and
report editing and all partner companies for steering group meeting attendance and input.
7. References
Antier, C, Andersson, R, Auskalnienė, O, Barić, K, Baret, P, Besenhofer, G, Calha, I, Carrola Dos Santos,
S, De Cauwer, B, Chachalis, D, Dorner, Z, Follak, S, Forristal, D, Gaskov, S, Gonzalez Andujar, JL, Hull,
R, Jalli, H, Kierzek, R, et al. (2020). A survey on the uses of glyphosate in European countries. INRAE.
https://doi.org/10.15454/A30K-D531
Clarke J, Wynn S, Twining S, Berry P, Cook S, Ellis S & Gladders P (2009) Pesticide availability for
cereals and oilseeds following revision of Directive 91/414/EEC; effects of losses and new research
priorities. HGCA research Review No 70.
Clarke JH (2018) Protecting glyphosate efficacy on combinable crops: resistance, residues and
responsible use. Outlooks in Pest Management. 258-261. DOI: 10.1564/v29_dec_06
Collavo A & Sattin M (2014) First glyphosate-resistant Lolium spp. Biotype found in a European annual
arable cropping system also affected by ACCase and ALS resistance. Weed Research, 54, 325-334.
Cook SK, Wynn SC, Clarke JH (2010) How valuable is glyphosate to UK agriculture and the environment?
Outlooks on Pest Management 21 (6), December 2010, 280-284.
Davies LR, Hull R, Moss S, Neve P (2018) The first cases of evolving glyphosate resistance in UK poverty
brome (Bromus sterilis) populations. Weed Science. doi: 10.1017/wsc.2018.61

91
Davies LR., Neve P (2017) Inter-population variability and adaptive potential for reduced glyphosate
sensitivity in Alopecurus myosuroides. Weed Research, 57, 323-332
Davies LR, Walker C & Tatnell LV (2017) Using the Syngenta RISQ test to improve the detection of
possible glyphosate resistance in Alopecurus myosuroides. Aspects of Applied Biology 134, Crop
Production in Southern Britain, 97-104.
Ghanizadeh H, Harrington KC & James TK (2016) Glyphosate-resistant Italian ryegrass and perennial
ryegrass in New Zealand – a review. New Zealand Plant Protection 69: 246 - 251 (2016)
Ghanizadeh H, Harrington KC, James TK & Woolley DJ (2013). Confirmation of glyphosate resistance in
two species of ryegrass from New Zealand vineyards. New Zealand Plant Protection 66: 89-93.
Harrington KC, James TK, Parker MD & Ghanizadeh H (2016) Strategies to manage the evolution of
glyphosate resistance in New Zealand. New Zealand Plant Protection 69: 252 - 257 (2016)
Heap I (2020) - The International Survey of Herbicide Resistant Weeds. http://www.weedscience.org
Kaundun, SS, Hutchings, SJ, Dale, RP, Bailly, GC, & Glanfield, P (2011). Syngenta ‘RISQ’ test: a novel in‐
season method for detecting resistance to post‐emergence ACCase and ALS inhibitor herbicides in grass
weeds. Weed Research, 51(3), 284-293.
Kaundun, SS, Hutchings SJ, Harris Suzanne C., Jackson LV, Shashi-Kiran R, Dale RP, & McIndoe E
(2014) A Simple In-Season Bioassay for Detecting Glyphosate Resistance in Grass and Broadleaf Weeds
Prior to Herbicide Application in the Field. Weed Science 2014 62:597–607.
Moss, SR, Clarke, JH, Blair, AM, Culley, TN, Read, MA, Ryan, PJ & Turner, M (1999). The occurrence of
herbicide-resistant grass-weeds in the United Kingdom and a new system for designating resistance in
screening assays. In: Proceedings 1999 Brighton Conference - Weeds, 179-184.
Moss, SR (2007). Managing herbicide-resistant black-grass (Alopecurus myosuroides): theory and
practice. Weed Technology, 21, 300-309.
Neve P, Diggle AJ, Smith FP & Powles SB (2003) Simulating evolution of glyphosate resistance in Lolium
rigidum I: population biology of a rare resistance trait. Weed Research, 43, 404-417.
Powles SB, Lorraine-Colwill DF, Dellow JF & Preston C (1998) Evolved resistance to glyphosate in rigid
ryegrass (Lolium rigidum) in Australia. Weed Science 46, 604-607.

92
Wynn S, Cook SK. & Clarke JH (2014) Glyphosate use on combinable crops in Europe: implications for
agriculture and the environment. Outlooks on Pest Management 25 (5). 327-331.

93
8. Appendices
8.1. Appendix 1 Weather data for ADAS Boxworth, Cambridge UK
0
20
40
60
80
100
0
5
10
15
20
25
30
Sep Oct Nov Dec Jan Feb Mar Apr May Jun Jul Aug
Rai
nfal
l (m
m)
Tem
pera
ture
°C
2016-2017
Rain (mm) Max Min

94

95
8.2. Appendix 2 Resistant status for weed populations tested
Table 71 Resistant status of the black-grass and Italian rye-grass populations used in experiments
Weed population name
and reference code
Herbicide tested and R Rating*
Cycloxydim** Pendimethalin*** Mesosulfuron
+ Iodosulfuron Pinoxaden Chlorotoluron
Peldon resistant (SD0032) S RRR RRR - -
BG 01 (SD0040/2014C81) RRR S RR - -
IRG 01
(PS6757/SYN2011IRG003) RRR - RRR RRR S
IRG resistant
(SD0388/2015C33) RRR RRR RR RRR -
*The R rating system for resistance testing classification is explained in Moss et al., 1999 & Moss,
2007.
** Cycloxydim is used to indicate ACCase target site resistance.
***Pendimethalin is used to indicate enhanced metabolism resistance.