Project Report - Damith Final
68
FACTORS DETERMINING THE ADOPTION OF MOBILE ENTERPRISE SOLUTIONS IN SME SECTOR Special Reference to Etisalat Lanka Private Limited By A.B.G.D.C.Jayawardana 5266FM2013028 An Independent project Report Submitted to the University of Sri Jayewardenepura In partial fulfilment of the requirement or the degree of Master of Business Administration June, 2016 Department of Marketing Faculty of Management Studies and Commerce University of Sri Jayewardenepura Nugegoda
-
Upload
damith-jayawardana -
Category
Documents
-
view
21 -
download
0
Transcript of Project Report - Damith Final

FACTORS DETERMINING THE ADOPTION OF MOBILE ENTERPRISE
SOLUTIONS IN SME SECTOR
Special Reference to Etisalat Lanka Private Limited
By
A.B.G.D.C.Jayawardana
5266FM2013028
An Independent project Report
Submitted to the University of Sri Jayewardenepura
In partial fulfilment of the requirement or the degree of
Master of Business Administration
June, 2016
Department of Marketing
Faculty of Management Studies and Commerce
University of Sri Jayewardenepura
Nugegoda
This is to certify that the Project Report on
FACTORS DETERMINING THE ADOPTION OF MOBILE ENTERPRISE
SOLUTIONS IN SME SECTOR
Special Reference to Etisalat Lanka Private Limited
By
A.B.G.D.C.Jayawardana
5266FM2013028
has been accepted by the University of Sri Jayewardenepura, in partial fulfilment of
requirements of the Master of Business Administration Degree
-------------------------------------
Supervisor
------------------------------------
Date

Declaration
I certify that this project report does not incorporate without acknowledgement, any
material previously submitted for a degree or diploma in any university, and to the best of
my knowledge and belief it does not contain any material previously published or written
by another person, except where due reference is made in the text.
A.B.G.D.C.Jayawardana
February 5th , 2016

i
TABLE OF CONTENTS
TABLE OF CONTENTS ...................................................................................................... i
LIST OF FIGURES ............................................................................................................ iv
LIST OF TABLES ............................................................................................................... v
LIST OF ABBREVIATIONS ............................................................................................. vi
Acknowledgement ............................................................................................................. vii
Executive Summary ......................................................................................................... viii
Chapter 1 .............................................................................................................................. 1
INTRODUCTION ............................................................................................................... 1
1.1 Industry Overview ................................................................................................. 1
1.1.1 Mobile Telecommunications industry ................................................................ 1
1.1.2 Small and Medium Enterprise ............................................................................ 3
1.1.3 Organisation ........................................................................................................ 4
1.2 Background of the study ....................................................................................... 6
1.3 Identification of the issues..................................................................................... 7
1.4 Objectives of the Study ......................................................................................... 8
1.5 Research Questions ............................................................................................... 9
1.6 Significance of the Study .................................................................................... 10
1.7 Limitations of the study....................................................................................... 11
1.8 Chapter Framework ............................................................................................. 11
Chapter 2 ............................................................................................................................ 13
LITRATURE REVIEW ..................................................................................................... 13
2.1 Introduction .............................................................................................................. 13
2.2 Adoption of Mobile Enterprise Solutions by SME sector ....................................... 13
ii
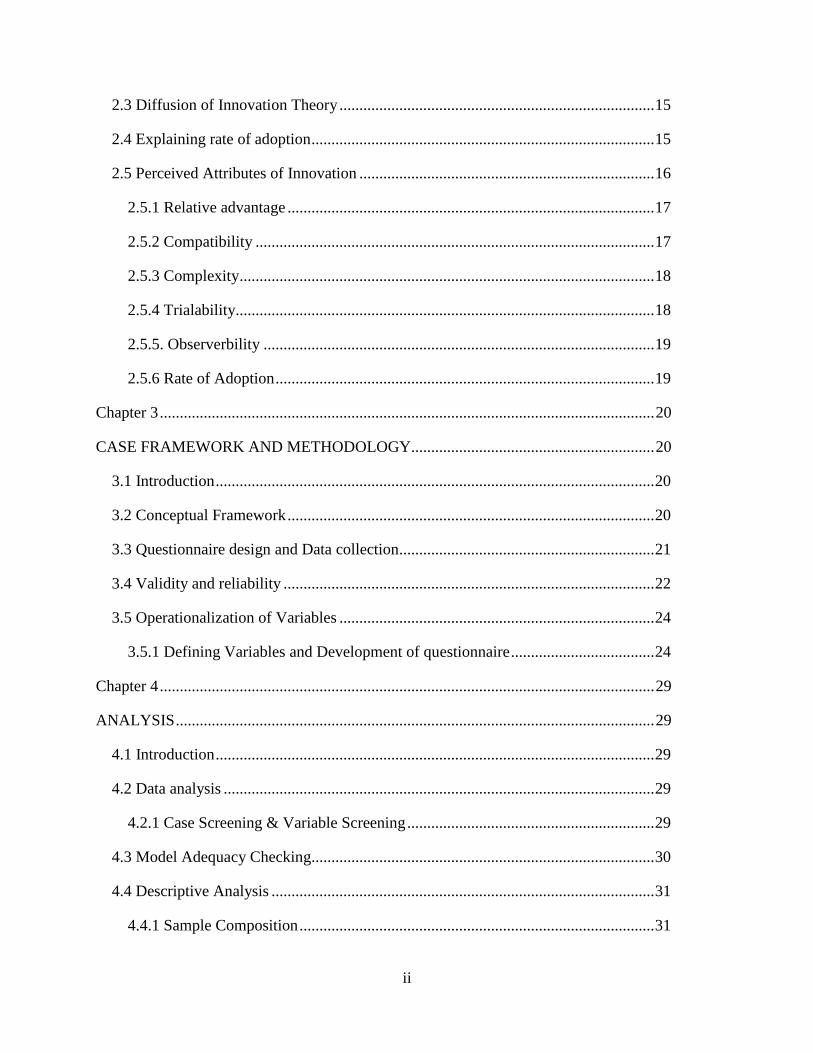
2.3 Diffusion of Innovation Theory ............................................................................... 15
2.4 Explaining rate of adoption ...................................................................................... 15
2.5 Perceived Attributes of Innovation .......................................................................... 16
2.5.1 Relative advantage ............................................................................................ 17
2.5.2 Compatibility .................................................................................................... 17
2.5.3 Complexity ........................................................................................................ 18
2.5.4 Trialability......................................................................................................... 18
2.5.5. Observerbility .................................................................................................. 19
2.5.6 Rate of Adoption ............................................................................................... 19
Chapter 3 ............................................................................................................................ 20
CASE FRAMEWORK AND METHODOLOGY............................................................. 20
3.1 Introduction .............................................................................................................. 20
3.2 Conceptual Framework ............................................................................................ 20
3.3 Questionnaire design and Data collection................................................................ 21
3.4 Validity and reliability ............................................................................................. 22
3.5 Operationalization of Variables ............................................................................... 24
3.5.1 Defining Variables and Development of questionnaire .................................... 24
Chapter 4 ............................................................................................................................ 29
ANALYSIS ........................................................................................................................ 29
4.1 Introduction .............................................................................................................. 29
4.2 Data analysis ............................................................................................................ 29
4.2.1 Case Screening & Variable Screening .............................................................. 29
4.3 Model Adequacy Checking...................................................................................... 30
4.4 Descriptive Analysis ................................................................................................ 31
4.4.1 Sample Composition ......................................................................................... 31
iii
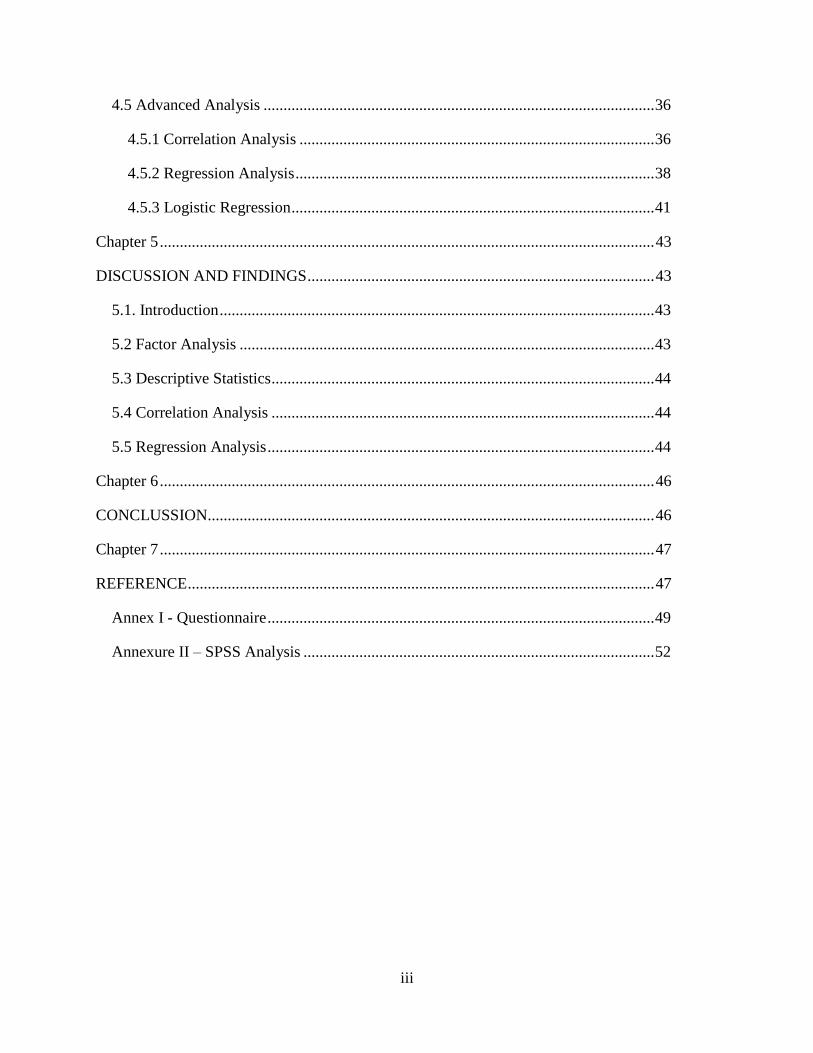
4.5 Advanced Analysis .................................................................................................. 36
4.5.1 Correlation Analysis ......................................................................................... 36
4.5.2 Regression Analysis .......................................................................................... 38
4.5.3 Logistic Regression ........................................................................................... 41
Chapter 5 ............................................................................................................................ 43
DISCUSSION AND FINDINGS ....................................................................................... 43
5.1. Introduction ............................................................................................................. 43
5.2 Factor Analysis ........................................................................................................ 43
5.3 Descriptive Statistics ................................................................................................ 44
5.4 Correlation Analysis ................................................................................................ 44
5.5 Regression Analysis ................................................................................................. 44
Chapter 6 ............................................................................................................................ 46
CONCLUSSION................................................................................................................ 46
Chapter 7 ............................................................................................................................ 47
REFERENCE ..................................................................................................................... 47
Annex I - Questionnaire ................................................................................................. 49
Annexure II – SPSS Analysis ........................................................................................ 52
iv
LIST OF FIGURES
Figure 1: market share of Mobile Telecom Operators in Sri Lanka ............................................... 2
Figure 2: Technology acceptance model ...................................................................................... 14
Figure 3: Variables determining the rate of adoption of innovation ............................................. 16
Figure 4: Conceptual framework .................................................................................................. 21

v
LIST OF TABLES
Table 1: Statistical Overview of the Telecommunication Sector as at end of Dec 2014................ 3
Table 2: Distribution of persons engaged and establishments across SME groups ........................ 4
vi
LIST OF ABBREVIATIONS
SME – Small and Medium Enterprise
MES – Mobile Enterprise Solutions
TRCSL – Telecommunications Regulatory Commission Sri Lanka
VPN – Virtual Private Network
MPABX – Mobile Private Automatic Branch Exchange
GSM- Global System for Mobile Communication
GDP- Gross Domestic production
3G – Third generation Mobile technology

vii
Acknowledgement
I am highly indebted to my supervisor Dr. Lalith Chandralal, for his guidance, advice and constant
supervision on this case study throughout its course. And Prof. Rohini Samarasinghe who always
guided me being a panel member during the project presentations.
Further I would like to convey my sincere gratitude to Dr Janak Kumarasinghe, Coordinator Msc,
MBA, MPM programme and all the lecturers whom have taught me during the MBA programme.
Without your guidance and support I wouldn’t be succeeded.
I would also like to forward my appreciation to the Mr. Eomal Munasinha (Head of HR - Etisalat
Lanka Private Limited) for giving me the permission to carry out this Project about the
organisation. Head of Enterprise, Mr. Ranjith Fernando who encourage me to select this topic for
my project and was extremely helpful in giving the necessary inputs and guidance for conducting
the survey.
Moreover, my sincere gratitude goes to all the participants who represent Small and Medium
Enterprises actively took part in the research through the questionnaires.
A special acknowledgement is extended to my parents, who brought me up to this stage and being
with me in the journey of life all throughout in the times of ups and downs and helping me always
with all the endeavours in my life. Also I would like to thank my wife, for all her sacrifices, inputs
and encouragement given.

viii
Executive Summary
This project study “Factors determining the adoption of mobile enterprise solutions in SME sector
– Special reference to Etisalat Lanka Pvt Ltd” is focus on the latest ‘Mobile solutions’ range
introduced by Enterprise division of Etisalat lanka Pvt Ltd, one of the five mobile
telecommunication service providers in Sri Lanka. Etisalat Lanka Private limited is third largest
telecommunications operator in Sri Lanka today, serving more than four million subscribers
(TRCSL, 2014).
Celltel Lanka Private Limited (Rebranded as Etisalat Lanka Private Limited, later) is the first
operator to start mobile telecommunication operations in the country, commenced its operations
in 1989. However with time Celltel Lanka Private Limited lost its market leadership mainly due
to the reactive strategic actions. Being in an industry, where the continuous innovation is the key
to survival and failing to invest on latest innovations in a timely manner can be seen as the main
reason for the loss of market leadership and the market share.
With the new brand changeover from Celltel to Tigo to Etisalat, company was able to introduce
few new innovations to Srilankan market. Especially 3.75G Mobile broadband, Mobile VPN,
Mobile MPABX etc. which differentiate Etisalat from other operators in terms of Enterprise
solution provider.
The objective of this study is to analyse what factors are determining the adoption of these Mobile
enterprise solutions in Small and Medium Enterprises. Based on the E.M Roger’s (1964)
Innovation adoption theory a conceptual framework was developed and information was collected
to validate that framework. The study analysed, whether there any correlation between Perceived
attributes of innovation (Relative advantage, Compatibility, Complexity, Trialability and
Observerbility) and the rate of adoption.
In the data collection, an online survey being carried out with the respective decision makers of
the Small & Medium Enterprises in Colombo & Suburbs. Questionnaire was content 30 questions
which tested 5 dimensions of “perceived attributes of innovations”

ix
Analysing the information it was found that recent innovative efforts that the company has made
has succeeded and has helped the company to outperform the competitors’. It also showed that the
company had been able to gain a position in the consumers mind above Mobitel, the second player
in the market, with its innovator platform.
The key findings are arrived at analysing the information collected and the literature. It is evident
that by branding the innovation of a company, it would be able to gain a competitive advantage
and improve the main brand’s image.
People, is a key deciding factor in driving the company in the innovator platform. The level of
empowerment, training had helped the organisation in achieving the state that it is in today. Also,
the strong culture that is present in the organisation and the steps that the company had taken to
improve the strength of the culture in favour of driving the organisation towards the goals has
succeeded for Etisalat.
However there are shortcomings identified in the last chapter of the study and suitable
recommendations to overcome those are suggested by the author. Key recommendations were,
company to invest in new technologies more proactively and with a long-term plan, improve the
synergies as a Etisalat group, provide cross geographical training are some of the key
recommendations.
1
Chapter 1
INTRODUCTION
1.1 Industry Overview
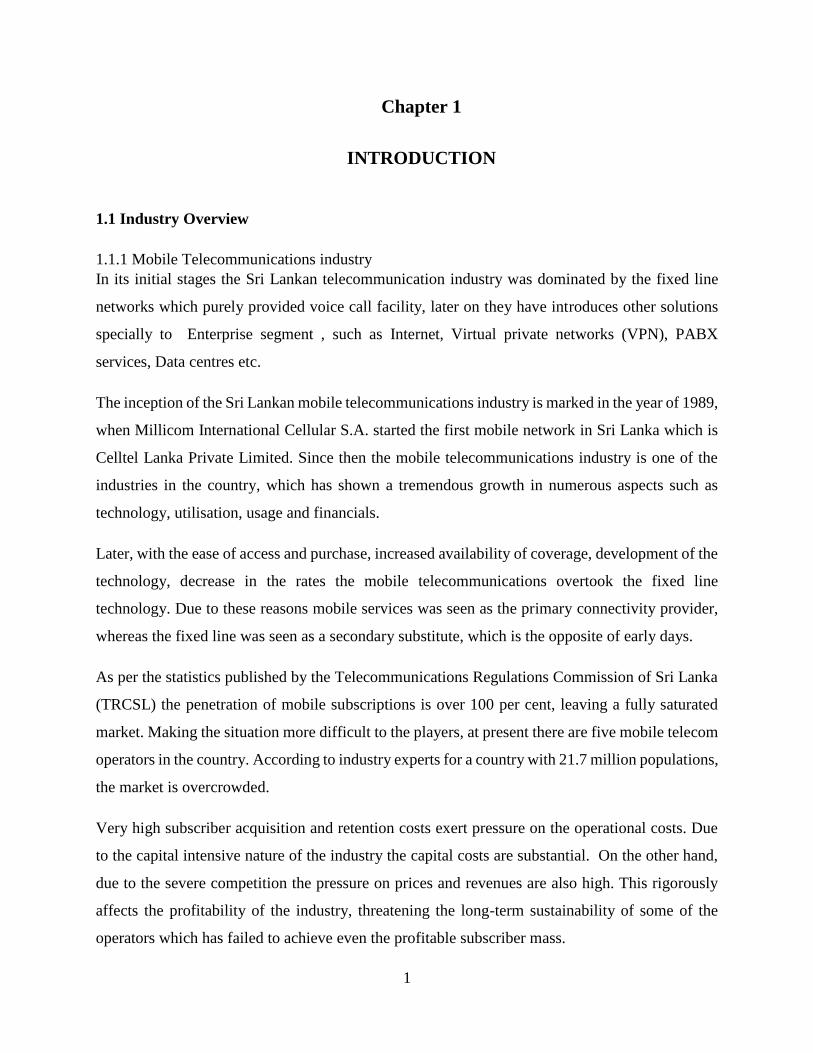
1.1.1 Mobile Telecommunications industry
In its initial stages the Sri Lankan telecommunication industry was dominated by the fixed line
networks which purely provided voice call facility, later on they have introduces other solutions
specially to Enterprise segment , such as Internet, Virtual private networks (VPN), PABX
services, Data centres etc.
The inception of the Sri Lankan mobile telecommunications industry is marked in the year of 1989,
when Millicom International Cellular S.A. started the first mobile network in Sri Lanka which is
Celltel Lanka Private Limited. Since then the mobile telecommunications industry is one of the
industries in the country, which has shown a tremendous growth in numerous aspects such as
technology, utilisation, usage and financials.
Later, with the ease of access and purchase, increased availability of coverage, development of the
technology, decrease in the rates the mobile telecommunications overtook the fixed line
technology. Due to these reasons mobile services was seen as the primary connectivity provider,
whereas the fixed line was seen as a secondary substitute, which is the opposite of early days.
As per the statistics published by the Telecommunications Regulations Commission of Sri Lanka
(TRCSL) the penetration of mobile subscriptions is over 100 per cent, leaving a fully saturated
market. Making the situation more difficult to the players, at present there are five mobile telecom
operators in the country. According to industry experts for a country with 21.7 million populations,
the market is overcrowded.
Very high subscriber acquisition and retention costs exert pressure on the operational costs. Due
to the capital intensive nature of the industry the capital costs are substantial. On the other hand,
due to the severe competition the pressure on prices and revenues are also high. This rigorously
affects the profitability of the industry, threatening the long-term sustainability of some of the
operators which has failed to achieve even the profitable subscriber mass.

2
Compared to the global technological trends, telecom industry in Sri Lanka is in the forefront of
technology with the rapid adoption of technology to stay competitive in the highly competitive
market.
Growth in internet penetration of the country is another factor that would affect the growth in the
telecommunication industry of Sri Lanka. Mobile voice services are becoming a commodity and
the profits from this service for the organisation are very low. Therefore the focus of the industry
is moving towards the Mobile Enterprise Solutions (MES). In addition, though the mobile
subscription penetration is well above 100 per cent, the penetration of the internet is less than 10%
and penetration of mobile broadband internet and MES are further less. Therefore there is an
opportunity for the operators in this segment. Growth in smart phones in Sri Lanka following the
same global trend has further increase the focus of the Sri Lankan telecom operators on mobile
internet & Enterprise solutions.
As per the latest published records in December 2014, the mobile market is dominated by Dialog
with a subscriber market share of 38 per cent, followed by Mobitel with 23 per cent, Etisalat at 21
per cent, Airtel at 11 per cent and Hutch with 07 per cent.
Figure 1: market share of Mobile Telecom Operators in Sri Lanka
Source: Telecommunication Regulatory Commission Sri Lanka (TRCSL)
Dialog, 38%
Mobitel, 23%
Etisalat, 21%
Airtel, 11%
Hutch, 7%
MARKET SHARE

3
Table 1: Statistical Overview of the Telecommunication Sector as at end of Dec 2014
Category of Service
Licensed under Section 17 of the Act.
2014 Dec
Fixed Access Telephone service 3
Cellular Mobile phones 5
Data Communications (Facility based) 5
Data Communications (Non-facility based) & ISP’s 10
Trunk Mobile Radio 1
Leased Circuit Providers 1
Licensed Payphone Service Providers 1
1.1 External Gateway Operators 06
1.2 Direct-to-Home Satellite Broadcasting Service 03
1.3 Cable TV Distribution Network 03
1.4 Satellite Services 01
Sub Total 39
Source: Telecommunication Regulatory Commission Sri Lanka (TRCSL)
This project will analyse the factors which determining the adoption of Mobile Enterprise
Solutions (MES). MES are new technological innovations and direct substitutes for fix solutions
offered by operators such as SLT, Lanka Bell and Suntel.
Based on E.M.Roger’s Innovation adoption model, author will discuss the Perceived attributes of
innovations namely, Relative advantage, Compatibility, Complexity, Trialability and
Observerbility and how they relate to the rate of adoption. Also how the company achieved,
facilitated and sustained the technological innovation and how it capitalise them to create a
competitive advantage over the other competition.
1.1.2 Small and Medium Enterprise
The small and medium enterprise (SME) sector is well recognised for its contribution to
employment, innovation and economic dynamism and is considered as an engine of growth and is
considered as an engine of growth and an essential part of a healthy economy (Wickramasinghe,
2011). Currently, Sri Lanka doesn’t have a generally accepted criteria for SMEs, instead different
4
agencies use deferent criteria based on their objectives and there is no consistency between them.
Identifying SMEs on a commonly acceptable criteria was a long felt need of the country, and
number of forums were organized and different surveys were conducted by different agencies in
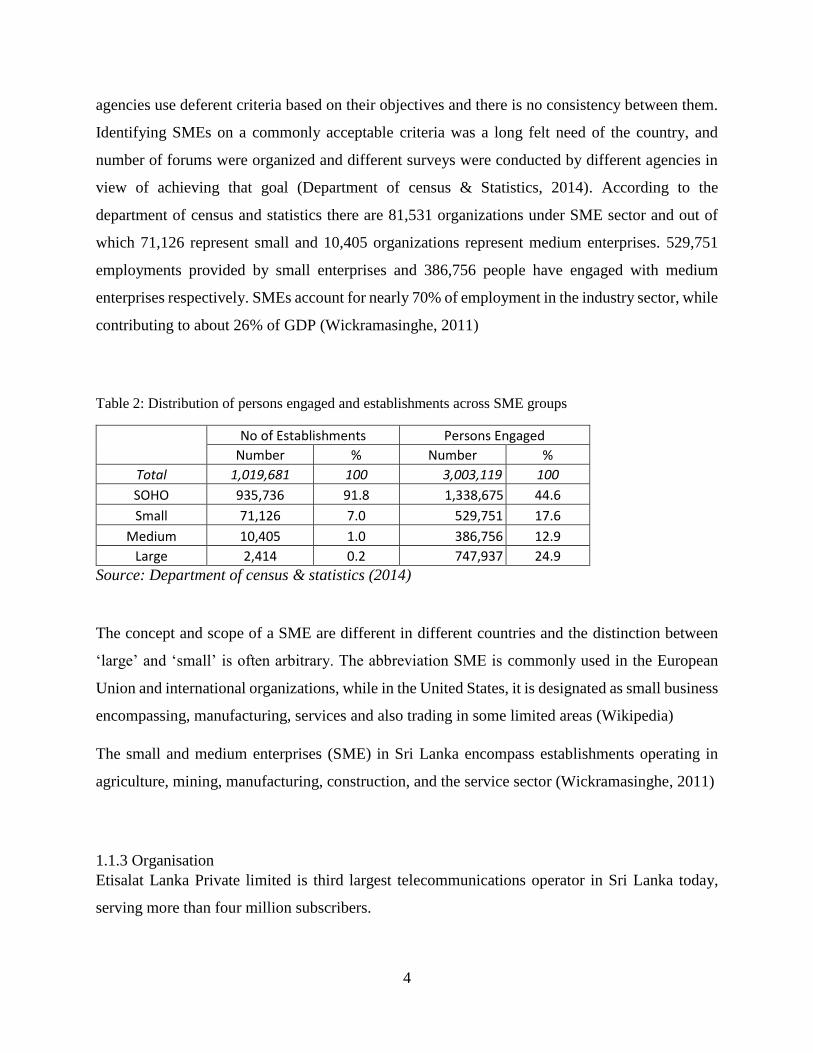
view of achieving that goal (Department of census & Statistics, 2014). According to the
department of census and statistics there are 81,531 organizations under SME sector and out of
which 71,126 represent small and 10,405 organizations represent medium enterprises. 529,751
employments provided by small enterprises and 386,756 people have engaged with medium
enterprises respectively. SMEs account for nearly 70% of employment in the industry sector, while
contributing to about 26% of GDP (Wickramasinghe, 2011)
Table 2: Distribution of persons engaged and establishments across SME groups
No of Establishments Persons Engaged
Number % Number %
Total 1,019,681 100 3,003,119 100
SOHO 935,736 91.8 1,338,675 44.6
Small 71,126 7.0 529,751 17.6
Medium 10,405 1.0 386,756 12.9
Large 2,414 0.2 747,937 24.9
Source: Department of census & statistics (2014)
The concept and scope of a SME are different in different countries and the distinction between
‘large’ and ‘small’ is often arbitrary. The abbreviation SME is commonly used in the European
Union and international organizations, while in the United States, it is designated as small business
encompassing, manufacturing, services and also trading in some limited areas (Wikipedia)
The small and medium enterprises (SME) in Sri Lanka encompass establishments operating in
agriculture, mining, manufacturing, construction, and the service sector (Wickramasinghe, 2011)
1.1.3 Organisation
Etisalat Lanka Private limited is third largest telecommunications operator in Sri Lanka today,
serving more than four million subscribers.
5
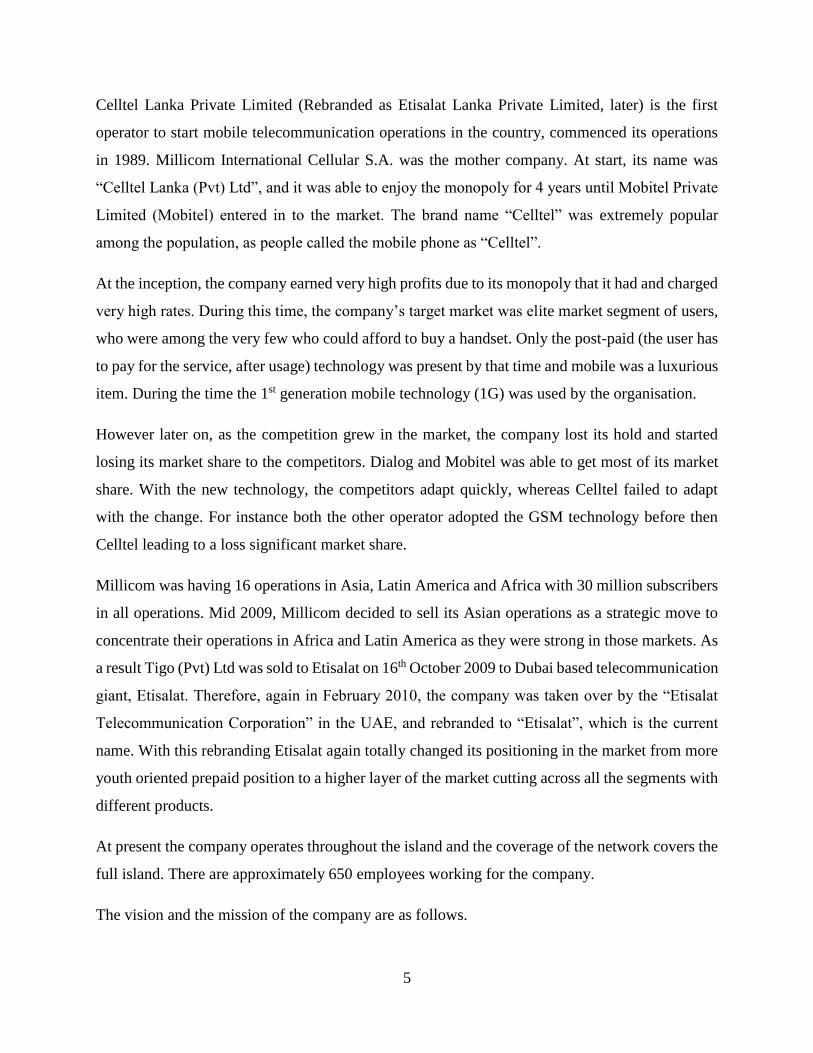
Celltel Lanka Private Limited (Rebranded as Etisalat Lanka Private Limited, later) is the first
operator to start mobile telecommunication operations in the country, commenced its operations
in 1989. Millicom International Cellular S.A. was the mother company. At start, its name was
“Celltel Lanka (Pvt) Ltd”, and it was able to enjoy the monopoly for 4 years until Mobitel Private
Limited (Mobitel) entered in to the market. The brand name “Celltel” was extremely popular
among the population, as people called the mobile phone as “Celltel”.
At the inception, the company earned very high profits due to its monopoly that it had and charged
very high rates. During this time, the company’s target market was elite market segment of users,
who were among the very few who could afford to buy a handset. Only the post-paid (the user has
to pay for the service, after usage) technology was present by that time and mobile was a luxurious
item. During the time the 1st generation mobile technology (1G) was used by the organisation.
However later on, as the competition grew in the market, the company lost its hold and started
losing its market share to the competitors. Dialog and Mobitel was able to get most of its market
share. With the new technology, the competitors adapt quickly, whereas Celltel failed to adapt
with the change. For instance both the other operator adopted the GSM technology before then
Celltel leading to a loss significant market share.
Millicom was having 16 operations in Asia, Latin America and Africa with 30 million subscribers
in all operations. Mid 2009, Millicom decided to sell its Asian operations as a strategic move to
concentrate their operations in Africa and Latin America as they were strong in those markets. As
a result Tigo (Pvt) Ltd was sold to Etisalat on 16th October 2009 to Dubai based telecommunication
giant, Etisalat. Therefore, again in February 2010, the company was taken over by the “Etisalat
Telecommunication Corporation” in the UAE, and rebranded to “Etisalat”, which is the current
name. With this rebranding Etisalat again totally changed its positioning in the market from more
youth oriented prepaid position to a higher layer of the market cutting across all the segments with
different products.
At present the company operates throughout the island and the coverage of the network covers the
full island. There are approximately 650 employees working for the company.
The vision and the mission of the company are as follows.
6
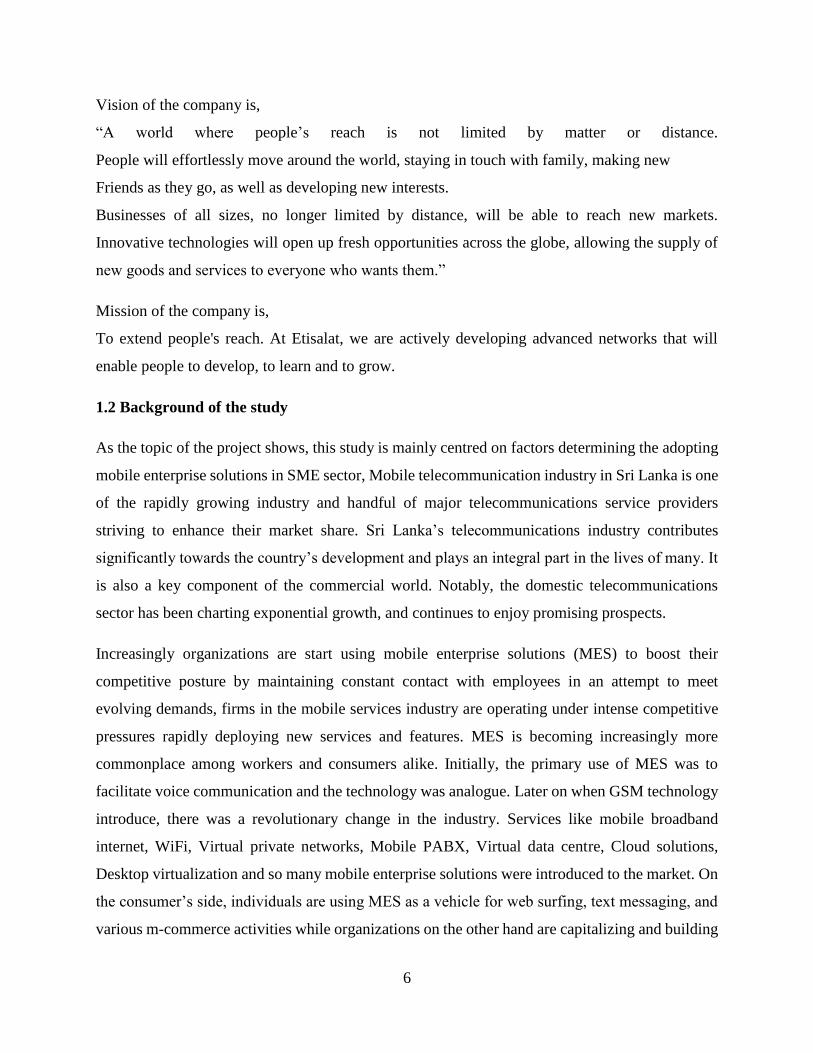
Vision of the company is,
“A world where people’s reach is not limited by matter or distance.
People will effortlessly move around the world, staying in touch with family, making new
Friends as they go, as well as developing new interests.
Businesses of all sizes, no longer limited by distance, will be able to reach new markets.
Innovative technologies will open up fresh opportunities across the globe, allowing the supply of
new goods and services to everyone who wants them.”
Mission of the company is,
To extend people's reach. At Etisalat, we are actively developing advanced networks that will
enable people to develop, to learn and to grow.
1.2 Background of the study
As the topic of the project shows, this study is mainly centred on factors determining the adopting
mobile enterprise solutions in SME sector, Mobile telecommunication industry in Sri Lanka is one
of the rapidly growing industry and handful of major telecommunications service providers
striving to enhance their market share. Sri Lanka’s telecommunications industry contributes
significantly towards the country’s development and plays an integral part in the lives of many. It
is also a key component of the commercial world. Notably, the domestic telecommunications
sector has been charting exponential growth, and continues to enjoy promising prospects.
Increasingly organizations are start using mobile enterprise solutions (MES) to boost their
competitive posture by maintaining constant contact with employees in an attempt to meet
evolving demands, firms in the mobile services industry are operating under intense competitive
pressures rapidly deploying new services and features. MES is becoming increasingly more
commonplace among workers and consumers alike. Initially, the primary use of MES was to
facilitate voice communication and the technology was analogue. Later on when GSM technology
introduce, there was a revolutionary change in the industry. Services like mobile broadband
internet, WiFi, Virtual private networks, Mobile PABX, Virtual data centre, Cloud solutions,
Desktop virtualization and so many mobile enterprise solutions were introduced to the market. On
the consumer’s side, individuals are using MES as a vehicle for web surfing, text messaging, and
various m-commerce activities while organizations on the other hand are capitalizing and building

7
upon the ease of use, efficiency and cost effectiveness, MES provides employees with greater
mobility, flexibility and communication options in their day to day operations (Kim and
Garrison,2009)
The dynamic nature of the telecommunications sector allows little respite for industry operators.
The government’s liberalisation of this industry can be seen as the main driving force behind the
rapid development of the country’s telecommunication infrastructure and services.
Small & Medium Enterprises in Sri Lanka account for 70% of employment, contribute around
26% to the GDP, and the 90% of the industry sector consist with SME’s. (Wickramasinghe, 2011)
as published in the department of census & statistics in 2014 there are 81,531 registered SME’s in
Sri Lanka. Therefore the mobile telecommunication industry has a huge potential to penetrate in
to Small & medium sector. In the current context connectivity / communication is one of the
essential part of the business. Therefore an organizations which are operating with a business will
be using some kind of a connectivity media to communicate within and out of the organization,
transfer data / Information etc; In this backdrop mobile telecommunication companies could play
a major role.
Also this study will further emphasis how the management of Etisalat should develop strategies
to acquire new SMEs. And also study will try to find out the relationship between the Perceived
attributes of innovations (Relative advantage, Compatibility, Complexity, Trialability, and
Observerbility) and the rate of adoption.
1.3 Identification of the issues
Mobile telecommunication industry is a highly volatile and competitive industry in Sri Lankan
economy. Exsisting 5 players trying their level best to retain their market shares and subscriber
base without losing. Since the market is highly saturated and there is no growth, only way of
increasing the base and revenue by acquiring customers from competitors. Since the regulator
(TRCSL) has impose certain restrictions on tariffs, operators unable to competing on price factor.
Only way of acquire new customers or increase revenue could be done though new innovations,
differentiation, Excellent customer care, and better coverage. Voice service being a conventional

8
and basic feature all the service providers trying to differentiate themselves from others by
introducing new innovative technologies like mobile enterprise solutions.
Small & medium enterprise sector is predominantly contribute towards the development of the
national economy, which accounts for providing nearly 70% of employments, represent 90% in
industrial sector, and contributing 26% of GDP. Hence the SME sector would be very much vital
and lucrative prospect market for any business.
Therefore, it is quite essential for the mobile operators to find out the relationship between various
factors that are affecting for the Rate of adoption of a new innovations. Based on the past literature
available, in the servicing sector, suggested that perceived attributes of innovations ( Relative
advantage, Compatibility, Complexity, Trialability and Observerbility) has a relationship between
rate of adoption.
Considering the above, mobile operators needs to focus on the areas which has the direct impact
of customer’s adoption rate and manage and align the resources accordingly.
Etisalat has introduced its Mobile enterprise solutions portfolio to SME sector few years back and
still it’s generating a constant monthly revenue without any positive growth rate, that’s indicate
that there are no new acquisition on solutions front and it’s just a matter of continuing with
exsisting customers and current revenue. Therefore management of Etisalat need to analyse what
factors affecting the adoption of new innovations and work out strategies and execute action plans
accordingly.
1.4 Objectives of the Study
It is quite important for any telecommunication company to significantly capture the market
share of Small & medium enterprise segments. Therefore telecommunication companies should
focus on appropriate strategies to acquire SME organizations. In order to do that they have to have
a solid understanding on the factors determining the adoption rate of an innovation. Therefore the
study focus on the following objectives.
1. To understand the relationship between Relative advantage and the rate of adoption of a
Mobile Enterprise Solutions.
9
2. To understand the relationship between Compatibility and the rate of adoption of a
Mobile Enterprise Solutions.
3. To understand the relationship between Complexity and the rate of adoption of a Mobile
Enterprise Solutions.
4. To understand the relationship between Trialability and the rate of adoption of a Mobile
Enterprise Solutions.
5. To understand the relationship between Observerbility and the rate of adoption of a
Mobile Enterprise Solutions.
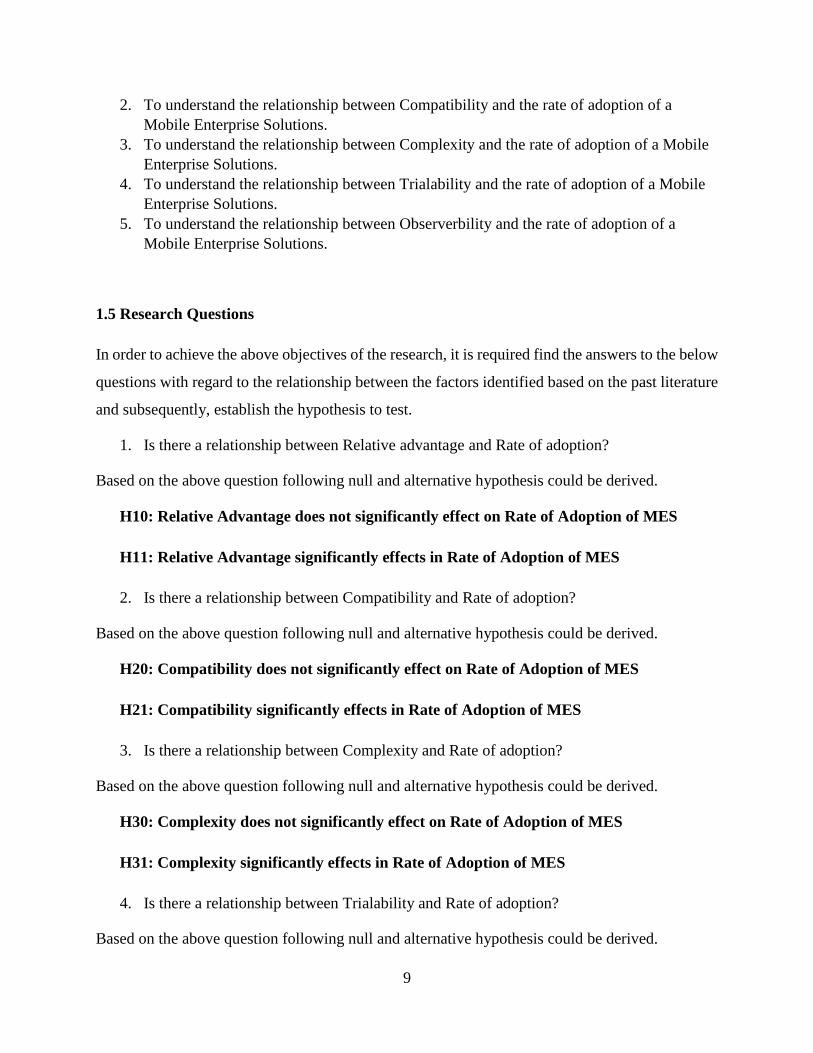
1.5 Research Questions
In order to achieve the above objectives of the research, it is required find the answers to the below
questions with regard to the relationship between the factors identified based on the past literature
and subsequently, establish the hypothesis to test.
1. Is there a relationship between Relative advantage and Rate of adoption?
Based on the above question following null and alternative hypothesis could be derived.
H10: Relative Advantage does not significantly effect on Rate of Adoption of MES
H11: Relative Advantage significantly effects in Rate of Adoption of MES
2. Is there a relationship between Compatibility and Rate of adoption?
Based on the above question following null and alternative hypothesis could be derived.
H20: Compatibility does not significantly effect on Rate of Adoption of MES
H21: Compatibility significantly effects in Rate of Adoption of MES
3. Is there a relationship between Complexity and Rate of adoption?
Based on the above question following null and alternative hypothesis could be derived.
H30: Complexity does not significantly effect on Rate of Adoption of MES
H31: Complexity significantly effects in Rate of Adoption of MES
4. Is there a relationship between Trialability and Rate of adoption?
Based on the above question following null and alternative hypothesis could be derived.

10
H40: Trialability does not significantly effect on Rate of Adoption of MES
H41: Trialability significantly effects in Rate of Adoption of MES
5. Is there a relationship between Observerbility and Rate of adoption?
Based on the above question following null and alternative hypothesis could be derived.
H50: Observerbility does not significantly effect on Rate of Adoption of MES
H51: Observerbility significantly effects in Rate of Adoption of MES
1.6 Significance of the Study
Mobile Enterprise Solutions are the emerging trend in contemporary mobile telecommunication
industry. Since the market is saturated and overcrowded there is no any significant growth in voice
component. Which further supressed by the competition and lower tariff rates imposed by the
regulator. But the Mobile Enterprise Solutions market is rapidly growing and there are potential
markets available in different industries.
Due to the advantages such as Flexibility, Mobility and Affordability many organizations are
switching from fixed solutions to Mobile solutions. Which has created virtual office and business
environment generating more profits while reducing wastage, improving efficiency and increasing
productivity. Many organizations encourage their employees to work from where they located
rather than coming to office. By using a Virtual private network this has become a popular practice
in other countries. Mobile PABX, Virtual Data centres, Desktop virtualization, Cloud solutions,
Wi-Fi hot spots and Mobile VPN are few of popular mobile solutions available.
Small & Medium Enterprises are the highest contributor to GDP and national economy which
contribute approximately 80% to the Sri Lanka’s economy. SME’s has spread across the country
and there are 81,581 registered SME organisations island wide. SME’s have provided 26% of the
total employments in various industries.
All five mobile Telco operators are trying to grab the market share from the large enterprises but
doesn’t really focus on the SME sector. It is very important fact that there will be a huge potential
for the Telco companies in SME sector with adopting Mobile Enterprise Solutions.

11
1.7 Limitations of the study
However in the process of doing the study, number of limitations can be foreseen with regard to
the case study.
Due to the very nature of the corporate information, the confidentiality of some information
becomes a limitation in drawing a clear picture to determine the success of the organisation.
The definitions of some information are different from an operator to operator. For instance, the
way that a particular operator defines its active base might be different from another. This becomes
a barrier when analysing the results against the competition, to measure the success of the
organisation.
This study involves information collected through questionnaire, Due to the specialisation of their
job roles, the individual understanding about other areas will be limited.
Some of the investments that the company had made to achieve the continuous innovation are long
term investments. To generate the results of them, it will take a longer period of time, beyond the
duration of doing the case study. For instance Etisalat recently invested in the 3.75G dual carrier
technology. However to establishment of the positioning of the market will take more time and the
generation of results will take further more time. Therefore there is a possibility that some
information with regard to the results might not be captured in this study.
1.8 Chapter Framework
The objective of this chapter was to provide the user a prologue to the study to be followed. This
provided a background to the project and an overview of the company, Etisalat Lanka Private
Limited. Moreover, the chapter conveyed the Issue, objectives, scope and the limitation of the
study to the reader.
Etisalat Lanka Private limited is third largest telecommunications operator in Sri Lanka today,
serving more than four million subscribers. Small & medium enterprise are significant sector in
national economy which is very lucrative to any telco operator in terms of increasing revenue as
well as market share. Even few years after introducing Mobile enterprise solutions to SME sector,

12
company hasn’t shown any significant growth in terms of revenue, and market share. The objective
of the study is to analyse some of the factors which could have helped this exercise.
13
Chapter 2
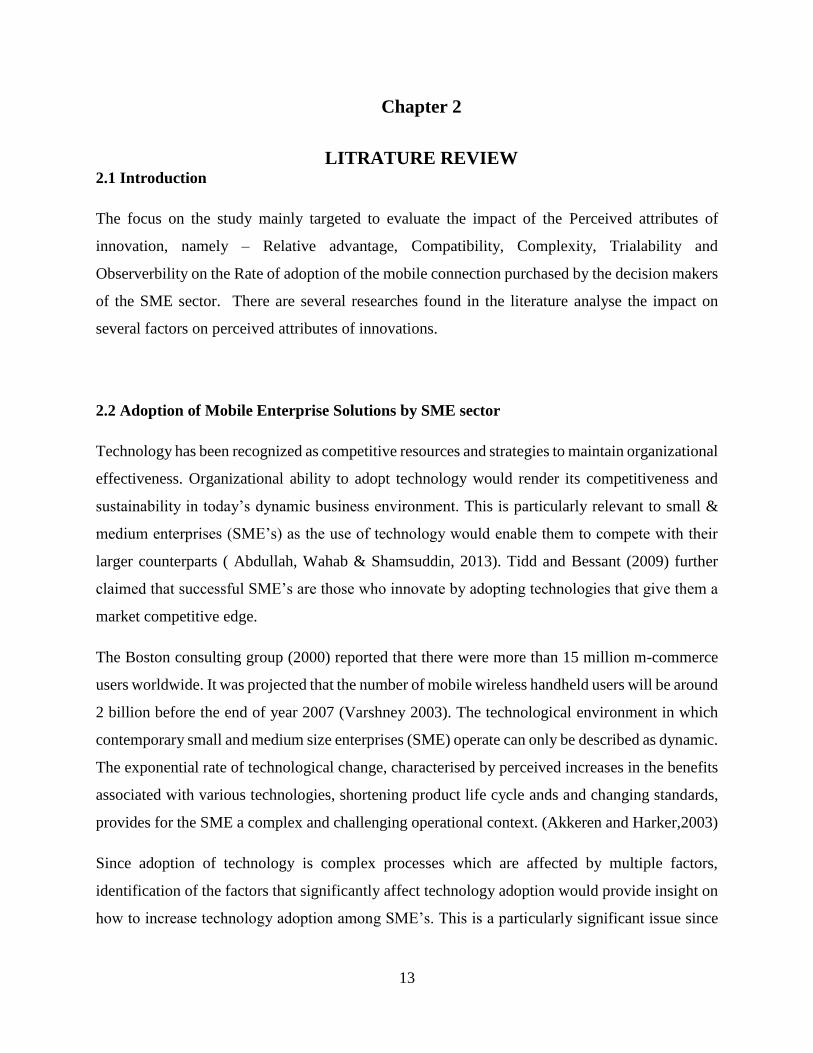
LITRATURE REVIEW 2.1 Introduction
The focus on the study mainly targeted to evaluate the impact of the Perceived attributes of
innovation, namely – Relative advantage, Compatibility, Complexity, Trialability and
Observerbility on the Rate of adoption of the mobile connection purchased by the decision makers
of the SME sector. There are several researches found in the literature analyse the impact on
several factors on perceived attributes of innovations.
2.2 Adoption of Mobile Enterprise Solutions by SME sector
Technology has been recognized as competitive resources and strategies to maintain organizational
effectiveness. Organizational ability to adopt technology would render its competitiveness and
sustainability in today’s dynamic business environment. This is particularly relevant to small &
medium enterprises (SME’s) as the use of technology would enable them to compete with their
larger counterparts ( Abdullah, Wahab & Shamsuddin, 2013). Tidd and Bessant (2009) further
claimed that successful SME’s are those who innovate by adopting technologies that give them a
market competitive edge.
The Boston consulting group (2000) reported that there were more than 15 million m-commerce
users worldwide. It was projected that the number of mobile wireless handheld users will be around
2 billion before the end of year 2007 (Varshney 2003). The technological environment in which
contemporary small and medium size enterprises (SME) operate can only be described as dynamic.
The exponential rate of technological change, characterised by perceived increases in the benefits
associated with various technologies, shortening product life cycle ands and changing standards,
provides for the SME a complex and challenging operational context. (Akkeren and Harker,2003)
Since adoption of technology is complex processes which are affected by multiple factors,
identification of the factors that significantly affect technology adoption would provide insight on
how to increase technology adoption among SME’s. This is a particularly significant issue since
14
SMEs have been recognized as the economic impetus in both developed and developing countries
(La Rovere 1998, Normah 2006)
Adoption refers to the stage in which technology is selected for use by an individual or
organization. Consequently, theories or models on technology adoption tend to cluster around
individual and organizational levels. However at the individual level, technology adoption is
commonly referred to as technology acceptance. (Abdullah, Wahab & Shamsuddin, 2013)
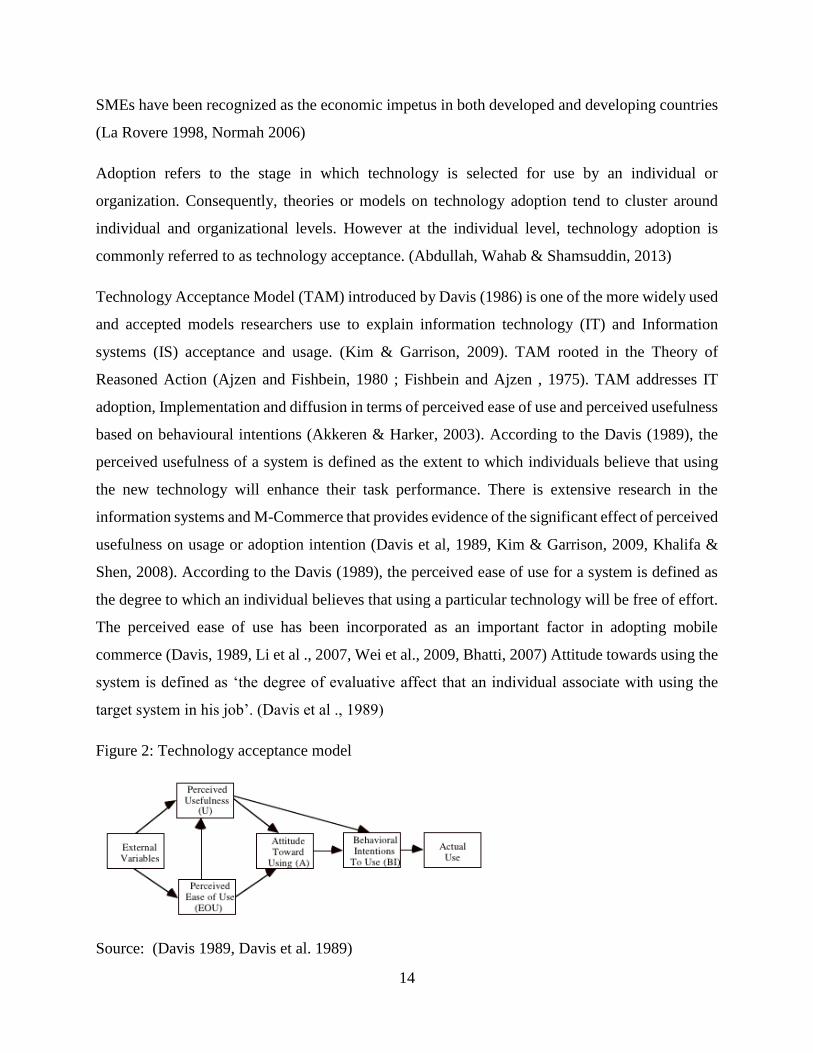
Technology Acceptance Model (TAM) introduced by Davis (1986) is one of the more widely used
and accepted models researchers use to explain information technology (IT) and Information
systems (IS) acceptance and usage. (Kim & Garrison, 2009). TAM rooted in the Theory of
Reasoned Action (Ajzen and Fishbein, 1980 ; Fishbein and Ajzen , 1975). TAM addresses IT
adoption, Implementation and diffusion in terms of perceived ease of use and perceived usefulness
based on behavioural intentions (Akkeren & Harker, 2003). According to the Davis (1989), the
perceived usefulness of a system is defined as the extent to which individuals believe that using
the new technology will enhance their task performance. There is extensive research in the
information systems and M-Commerce that provides evidence of the significant effect of perceived
usefulness on usage or adoption intention (Davis et al, 1989, Kim & Garrison, 2009, Khalifa &
Shen, 2008). According to the Davis (1989), the perceived ease of use for a system is defined as
the degree to which an individual believes that using a particular technology will be free of effort.
The perceived ease of use has been incorporated as an important factor in adopting mobile
commerce (Davis, 1989, Li et al ., 2007, Wei et al., 2009, Bhatti, 2007) Attitude towards using the
system is defined as ‘the degree of evaluative affect that an individual associate with using the
target system in his job’. (Davis et al ., 1989)
Figure 2: Technology acceptance model
Source: (Davis 1989, Davis et al. 1989)
15
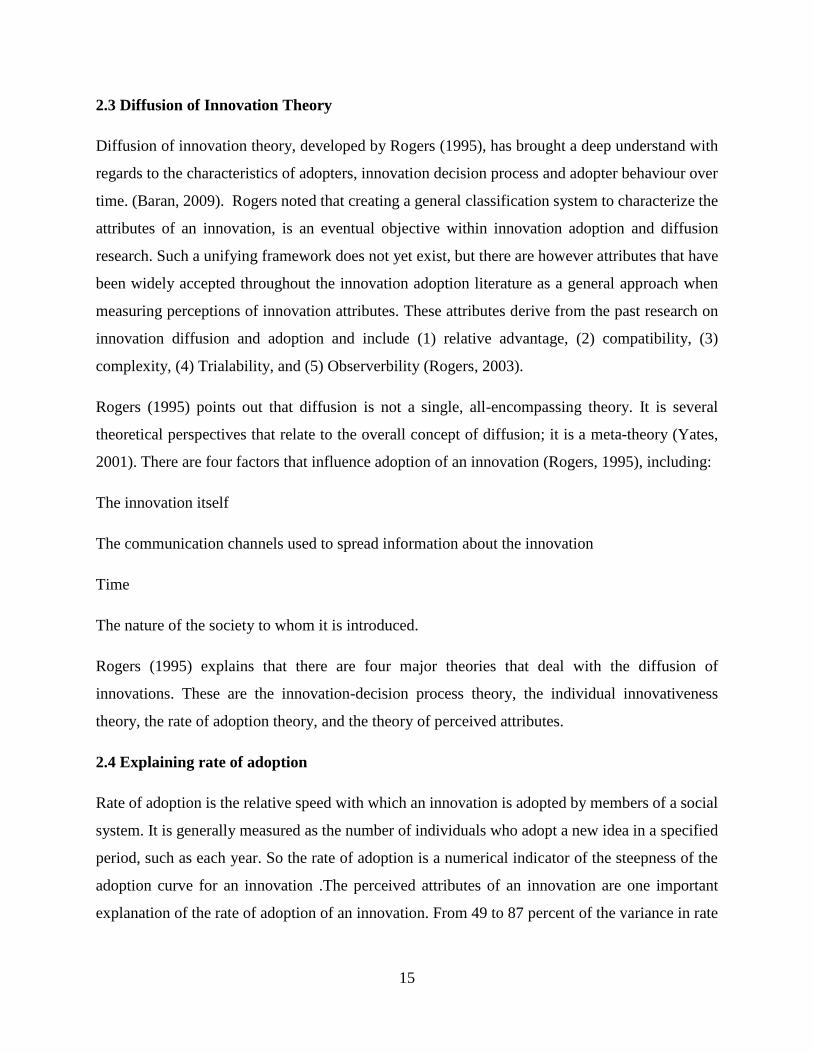
2.3 Diffusion of Innovation Theory
Diffusion of innovation theory, developed by Rogers (1995), has brought a deep understand with
regards to the characteristics of adopters, innovation decision process and adopter behaviour over
time. (Baran, 2009). Rogers noted that creating a general classification system to characterize the
attributes of an innovation, is an eventual objective within innovation adoption and diffusion
research. Such a unifying framework does not yet exist, but there are however attributes that have
been widely accepted throughout the innovation adoption literature as a general approach when
measuring perceptions of innovation attributes. These attributes derive from the past research on
innovation diffusion and adoption and include (1) relative advantage, (2) compatibility, (3)
complexity, (4) Trialability, and (5) Observerbility (Rogers, 2003).
Rogers (1995) points out that diffusion is not a single, all-encompassing theory. It is several
theoretical perspectives that relate to the overall concept of diffusion; it is a meta-theory (Yates,
2001). There are four factors that influence adoption of an innovation (Rogers, 1995), including:
The innovation itself
The communication channels used to spread information about the innovation
Time
The nature of the society to whom it is introduced.
Rogers (1995) explains that there are four major theories that deal with the diffusion of
innovations. These are the innovation-decision process theory, the individual innovativeness
theory, the rate of adoption theory, and the theory of perceived attributes.
2.4 Explaining rate of adoption
Rate of adoption is the relative speed with which an innovation is adopted by members of a social
system. It is generally measured as the number of individuals who adopt a new idea in a specified
period, such as each year. So the rate of adoption is a numerical indicator of the steepness of the
adoption curve for an innovation .The perceived attributes of an innovation are one important
explanation of the rate of adoption of an innovation. From 49 to 87 percent of the variance in rate

16
of adoption is explained by five attributes: Relative advantage, compatibility, complexity,
Trialability, and Observerbility (Rogers, 1983).
Figure 3: Variables determining the rate of adoption of innovation
Source: Rogers (1995)
2.5 Perceived Attributes of Innovation
The attributes of an innovation refers to the characteristics of the innovation that affects the rate at
which it is adopted. Rogers defined rate of adoption as “the relative speed with which an innovation
is adopted by members of a social system” (Worum, 2014).
“The perceived attributes of an innovation are one important explanation of the rate of adoption of
an innovation” (Rogers, 1995, p. 206).The theory of perceived attributes holds that individuals or
a social unit will adopt an innovation if they perceive it to have particular attributes. Although
some researchers have identified as many as 25 perceived attributes (Kearns, 1992); it is obvious
that these attributes can be subsumed in Rogers’ five perceived attributes. Rogers (2003) identifies
relative advantage, payoffs associated with the innovation; compatibility, the ease with which it
17
fits current ways of doing things; complexity, the ease or difficulty associated with learning the
innovation; Trialability, the ease or difficulty associated with trying it out; and Observerbility, the
extent to which results of adopting the innovation are visible to others, as the characteristics which
when judged by potential adopters, will differentiate easily adopted innovations from those that
fail to be adopted.
2.5.1 Relative advantage
Rogers (1995) has stated that the Relative advantage is the degree to which an innovation is
perceived as being better than the idea it supersedes. The degree of relative advantage is often
expressed as economic profitability, social prestige, or other benefits. The nature of the innovation
determines what specific type of relative advantage (such as economic, social, and the like) is
important to adopters, although the characteristics of the potential adopters also affect which sub
dimensions of relative advantage are most important.
“Relative advantage is the degree to which an innovation is perceived as being better than the idea
it supersedes” (Rogers, 2003, p.229). Relative advantage is often expressed in terms of economic
gains, social prestige, and other benefits. While the type of the innovation influences the particular
relative advantage that is important to the potential adopters, the characteristics of the potential
adopters also determines what particular elements of relative advantage are important (Rogers,
1995).
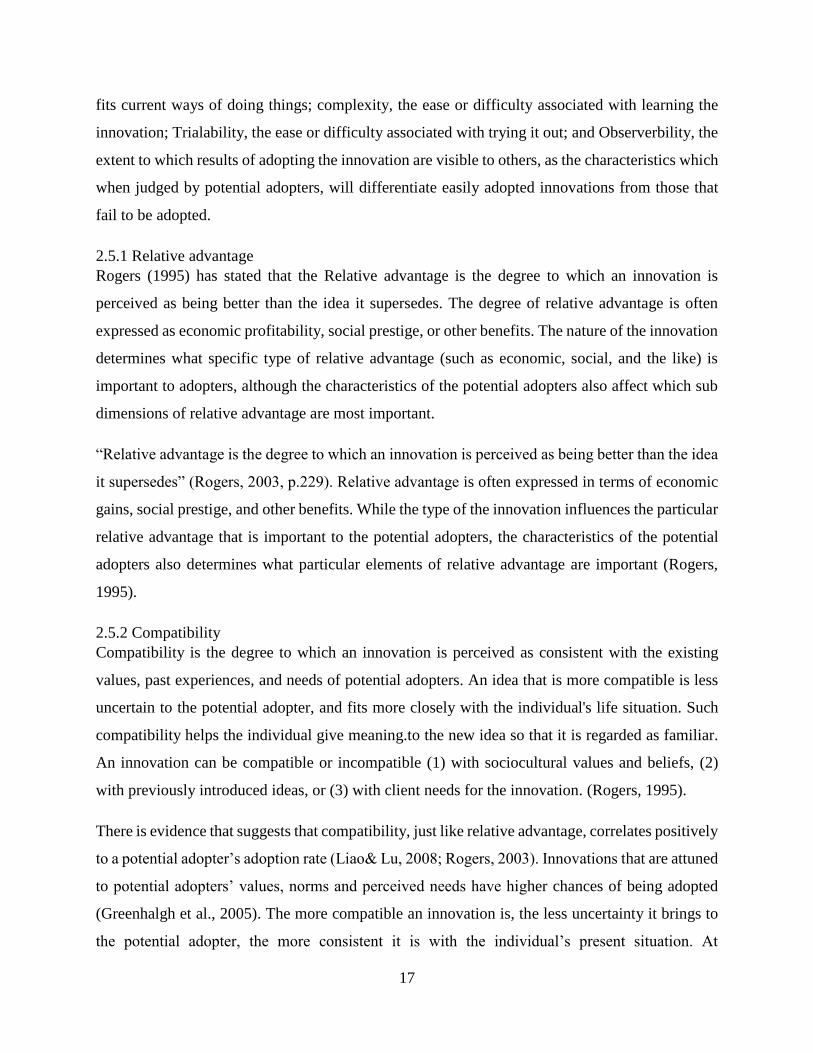
2.5.2 Compatibility
Compatibility is the degree to which an innovation is perceived as consistent with the existing
values, past experiences, and needs of potential adopters. An idea that is more compatible is less
uncertain to the potential adopter, and fits more closely with the individual's life situation. Such
compatibility helps the individual give meaning.to the new idea so that it is regarded as familiar.
An innovation can be compatible or incompatible (1) with sociocultural values and beliefs, (2)
with previously introduced ideas, or (3) with client needs for the innovation. (Rogers, 1995).
There is evidence that suggests that compatibility, just like relative advantage, correlates positively
to a potential adopter’s adoption rate (Liao& Lu, 2008; Rogers, 2003). Innovations that are attuned
to potential adopters’ values, norms and perceived needs have higher chances of being adopted
(Greenhalgh et al., 2005). The more compatible an innovation is, the less uncertainty it brings to
the potential adopter, the more consistent it is with the individual’s present situation. At
18
organizational level, the more compatible an innovation is with the organizations norms and
values, the more easily it will be assimilated. Hence, customs, beliefs, religion, personal and
political factors are likely to influence an individual or a social system’s likelihood of adopting an
innovation irrespective of it being a needed innovation (Rogers, 2003).
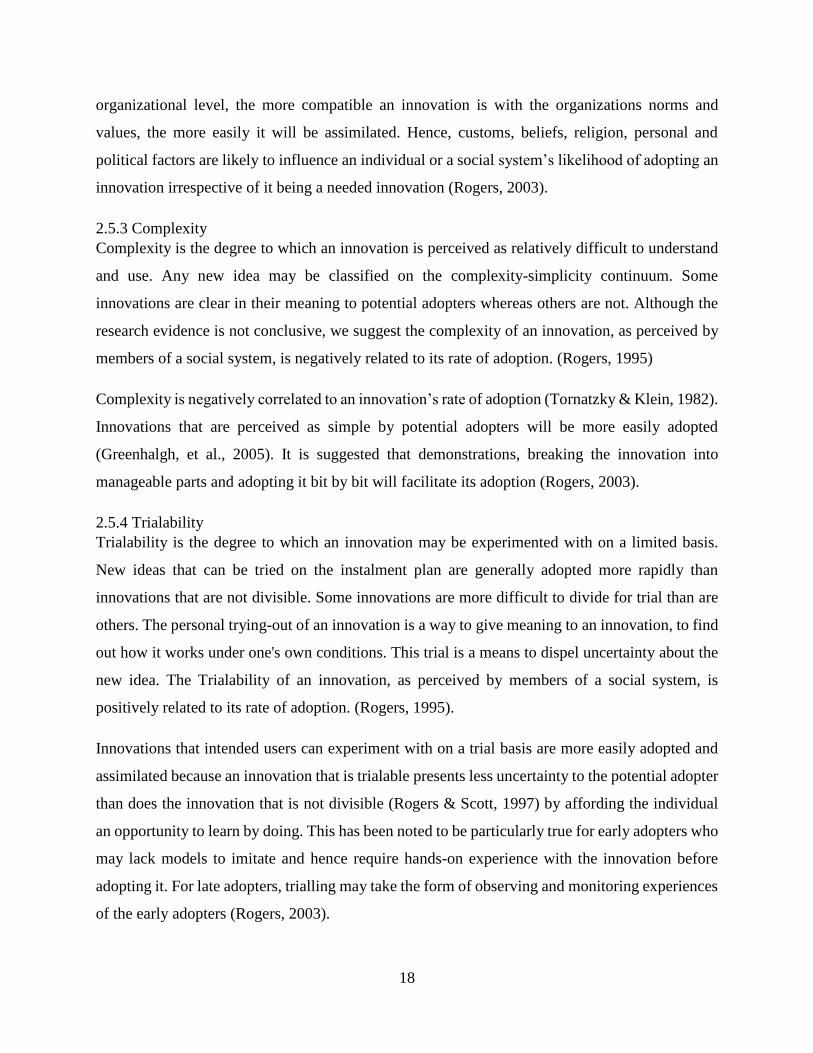
2.5.3 Complexity
Complexity is the degree to which an innovation is perceived as relatively difficult to understand
and use. Any new idea may be classified on the complexity-simplicity continuum. Some
innovations are clear in their meaning to potential adopters whereas others are not. Although the
research evidence is not conclusive, we suggest the complexity of an innovation, as perceived by
members of a social system, is negatively related to its rate of adoption. (Rogers, 1995)
Complexity is negatively correlated to an innovation’s rate of adoption (Tornatzky & Klein, 1982).
Innovations that are perceived as simple by potential adopters will be more easily adopted
(Greenhalgh, et al., 2005). It is suggested that demonstrations, breaking the innovation into
manageable parts and adopting it bit by bit will facilitate its adoption (Rogers, 2003).
2.5.4 Trialability
Trialability is the degree to which an innovation may be experimented with on a limited basis.
New ideas that can be tried on the instalment plan are generally adopted more rapidly than
innovations that are not divisible. Some innovations are more difficult to divide for trial than are
others. The personal trying-out of an innovation is a way to give meaning to an innovation, to find
out how it works under one's own conditions. This trial is a means to dispel uncertainty about the
new idea. The Trialability of an innovation, as perceived by members of a social system, is
positively related to its rate of adoption. (Rogers, 1995).
Innovations that intended users can experiment with on a trial basis are more easily adopted and
assimilated because an innovation that is trialable presents less uncertainty to the potential adopter
than does the innovation that is not divisible (Rogers & Scott, 1997) by affording the individual
an opportunity to learn by doing. This has been noted to be particularly true for early adopters who
may lack models to imitate and hence require hands-on experience with the innovation before
adopting it. For late adopters, trialling may take the form of observing and monitoring experiences
of the early adopters (Rogers, 2003).
19
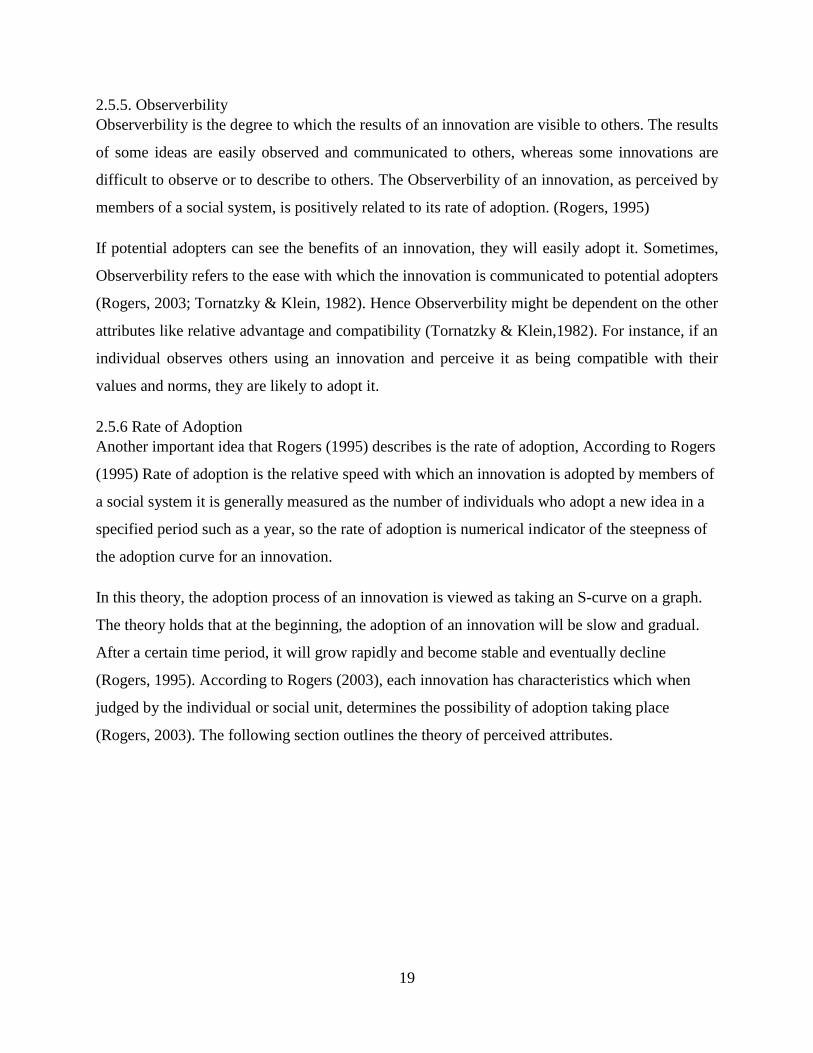
2.5.5. Observerbility
Observerbility is the degree to which the results of an innovation are visible to others. The results
of some ideas are easily observed and communicated to others, whereas some innovations are
difficult to observe or to describe to others. The Observerbility of an innovation, as perceived by
members of a social system, is positively related to its rate of adoption. (Rogers, 1995)
If potential adopters can see the benefits of an innovation, they will easily adopt it. Sometimes,
Observerbility refers to the ease with which the innovation is communicated to potential adopters
(Rogers, 2003; Tornatzky & Klein, 1982). Hence Observerbility might be dependent on the other
attributes like relative advantage and compatibility (Tornatzky & Klein,1982). For instance, if an
individual observes others using an innovation and perceive it as being compatible with their
values and norms, they are likely to adopt it.
2.5.6 Rate of Adoption
Another important idea that Rogers (1995) describes is the rate of adoption, According to Rogers
(1995) Rate of adoption is the relative speed with which an innovation is adopted by members of
a social system it is generally measured as the number of individuals who adopt a new idea in a
specified period such as a year, so the rate of adoption is numerical indicator of the steepness of
the adoption curve for an innovation.
In this theory, the adoption process of an innovation is viewed as taking an S-curve on a graph.
The theory holds that at the beginning, the adoption of an innovation will be slow and gradual.
After a certain time period, it will grow rapidly and become stable and eventually decline
(Rogers, 1995). According to Rogers (2003), each innovation has characteristics which when
judged by the individual or social unit, determines the possibility of adoption taking place
(Rogers, 2003). The following section outlines the theory of perceived attributes.

20
Chapter 3
CASE FRAMEWORK AND METHODOLOGY
3.1 Introduction
Developing the conceptual framework is the most important and the most fundamental step in any
research or project. Objective of this chapter is to discuss and elaborate the conceptual framework
based upon which this project is developed.
Analysing the literature review carried out in the previous chapter in this chapter will arrive at the
framework which will be discussed in the project as mentioned below. (Figure 4)
3.2 Conceptual Framework
Rogers (1995) has proposed a model ‘Attributes of Innovations and their rate of adoption’ there
he discussed 5 variables which determined the rate of adoption of an innovations.
1. Perceived attributes of Innovation
2. Type of innovation decision
3. Communication Channel
4. Nature of the Social System
5. Extent of change agent’s promotion efforts.
Out of above 5 variables Perceived attributes of innovation having 5 items that Rogers has explain
in details.
1. Relative advantage
2. Compatibility
3. Complexity
4. Trialability
5. Observerbility

21
Based on above 5 attributes I have developed a frame work to check the relationship between
Relative advantage, Compatibility, complexity, Trialability and Observerbility with the Rate
of adoption of an innovation. There I have taken Perceived attributes as Independent variable
and Rate of adoption as Dependent variable.
Figure 4: Conceptual framework
Independent Variable Dependent Variable
P
H1
H2
H3
H4
H5
3.3 Questionnaire design and Data collection
Data were collected using an online survey to test and validate the “Perceived attributes of an
innovation and their rate of adoption with regards to Mobile Enterprise solutions”. Items used to
assess Relative advantage, Compatibility, Complexity, Trialability and Observerbility (Rogers,
1995) were adopted from Atkinson (2007) but were modified to reflect a Mobile Enterprise
Perceived Attributes of
innovation Rate of Adoption
Relative Advantage
Compatibility
Complexity
Trialability
Observerbility
Rate of Adoption

22
Solutions context. All questionnaire items were assessed using a 5-point Likert-type scale
ranging from (1) Strongly Disagree to (5) strongly Agree.
Online questionnaire was sent to a 250 base which was randomly pick, which include
professionals from finance, service, IT, manufacturing, construction, Apparel, Hospitality and
other sectors. There were 63 participants has responded and out of them 54 despondence
qualified for analysis.
Data Collection method – Online Survey
Type of Questions – Likert scale question
Scale of measurement - 1 to 5 with the responses of strongly disagree, disagree, neither
agree nor disagree, agree and strongly agree.
No. of questionnaires emailed – 250
Total No. of respondents – 63
Sample method – Simple Random sampling
3.4 Validity and reliability
Factor analysis was performed to check the convergent validity and discriminant validity.
Principle component method has been used as the extraction method and Promax method used as
the rotation method in this factor analysis. Factor loadings on factor components in the pattern
matrix were examined for this validity analysis. First the factor analysis was performed for all
the items and the pattern matrix is shown in the appendix. From this found that some items had
cross loadings and negative loadings, and some items from deferent constructs loaded into same
component. These issues deviates the validity. But, by removing some items (T3 and T4), we
could improve the pattern matrix as shown below.

23
Pattern Matrixa
Component
1 2 3 4 5 6
Co5 1.136 .301
Co2 .924
Co7 .839
Co4 .827
Co3 .792
Co6 .742 .342
Co1 .738 .328
RoA3 .755
RoA2 .716
RoA1 .652 .346
RA2 .967
RA1 .918
RA6 .750
RA3 .670
RA4 .655
RA5 .511
C3 .814
C1 .798
C2 .313 .669
C6 .648
C5 .311 .619
C4 .539 .391
T5 .984
T1 .744
T2 .583
O2 .923
O3 .850
O4 .789
O1 .317 .667
O5 .574
O6 .339 .567
Extraction Method: Principal Component Analysis.
Rotation Method: Promax with Kaiser Normalization.
a. Rotation converged in 15 iterations.
24
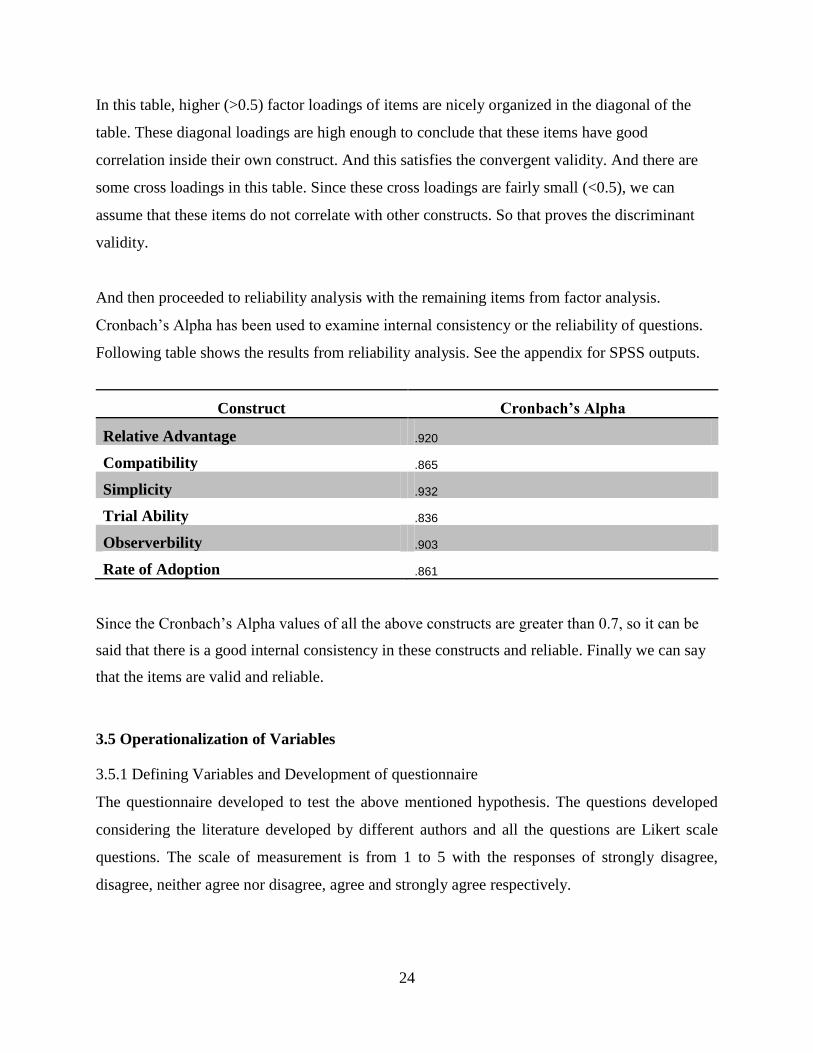
In this table, higher (>0.5) factor loadings of items are nicely organized in the diagonal of the
table. These diagonal loadings are high enough to conclude that these items have good
correlation inside their own construct. And this satisfies the convergent validity. And there are
some cross loadings in this table. Since these cross loadings are fairly small (<0.5), we can
assume that these items do not correlate with other constructs. So that proves the discriminant
validity.
And then proceeded to reliability analysis with the remaining items from factor analysis.
Cronbach’s Alpha has been used to examine internal consistency or the reliability of questions.
Following table shows the results from reliability analysis. See the appendix for SPSS outputs.
Construct Cronbach’s Alpha
Relative Advantage .920
Compatibility .865
Simplicity .932
Trial Ability .836
Observerbility .903
Rate of Adoption .861
Since the Cronbach’s Alpha values of all the above constructs are greater than 0.7, so it can be
said that there is a good internal consistency in these constructs and reliable. Finally we can say
that the items are valid and reliable.
3.5 Operationalization of Variables
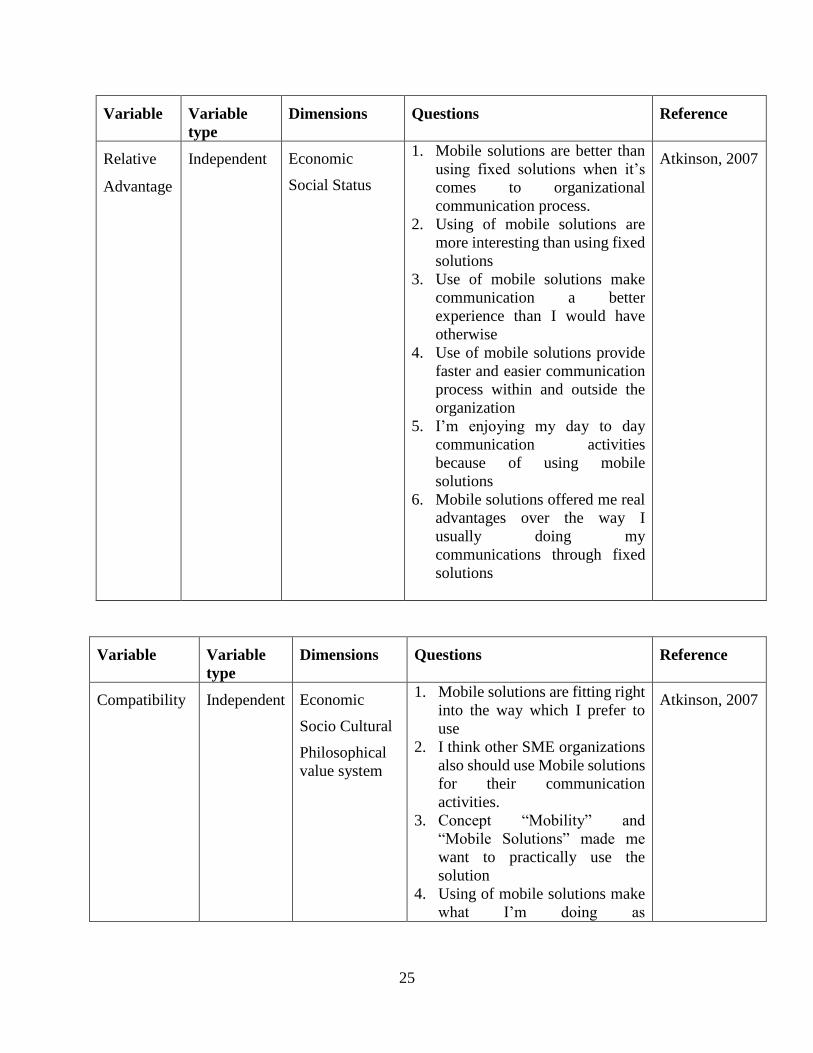
3.5.1 Defining Variables and Development of questionnaire
The questionnaire developed to test the above mentioned hypothesis. The questions developed
considering the literature developed by different authors and all the questions are Likert scale
questions. The scale of measurement is from 1 to 5 with the responses of strongly disagree,
disagree, neither agree nor disagree, agree and strongly agree respectively.
25
Variable Variable
type
Dimensions Questions Reference
Relative
Advantage
Independent Economic
Social Status
1. Mobile solutions are better than
using fixed solutions when it’s
comes to organizational
communication process.
2. Using of mobile solutions are
more interesting than using fixed
solutions
3. Use of mobile solutions make
communication a better
experience than I would have
otherwise
4. Use of mobile solutions provide
faster and easier communication
process within and outside the
organization
5. I’m enjoying my day to day
communication activities
because of using mobile
solutions
6. Mobile solutions offered me real
advantages over the way I
usually doing my
communications through fixed
solutions
Atkinson, 2007
Variable Variable
type
Dimensions Questions Reference
Compatibility Independent Economic
Socio Cultural
Philosophical
value system
1. Mobile solutions are fitting right
into the way which I prefer to
use
2. I think other SME organizations
also should use Mobile solutions
for their communication
activities.
3. Concept “Mobility” and
“Mobile Solutions” made me
want to practically use the
solution
4. Using of mobile solutions make
what I’m doing as
Atkinson, 2007

26
communication activities in day
to day, more relevant to me.
5. Mobile solutions help to learn
more about my business area
while using it or communication
activities
6. Mobile solutions help me to
learn more about Technology
while using it for
communication activities.
Variable Variable
type
Dimensions Questions Reference
Complexity Independent Simplicity 1. There is no difficulty in
handling Mobile solutions.
2. There is no difficulty in
understanding how to get
around in Mobile solutions.
3. There is no difficulty in
understanding how mobile
solutions work.
4. There are no difficulties in
getting the mobile solutions
working on a computers and
mobile phones.
5. There are no difficulties in using
available options under
particular mobile solutions.
6. There is no difficulty in
controlling attributes of voice
and Data segments.
7. There is no difficulty in
understanding the information
in Mobile solutions.
Atkinson, 2007

27
Variable Variable
type
Dimensions Questions Reference
Trialability Independent Experience of
Peers
Vicarious trials
1. Being able to testing
mobile solutions most
important in deciding
whether or not to purchase
it.
2. Being able to try out
Mobile solutions is
important in deciding to
use it.
3. Im more likely to want to
use Mobile solutions
because of being part of
this survey.
4. There is not much of lose
by trying out mobile
solutions even if I don’t
like it.
5. I like being able to try out
Mobile Solutions before
deciding whether I like it
or not.
Atkinson, 2007
Variable Variable type Dimensions Questions Reference
Observerbili
ty
Independent Model 1. Other SME organizations seemed
interested in mobile solutions
when they see us using it.
2. Employees of other SME”s can
tell that we do our
communication efficient and
effectively since we are using
mobile solution.
3. Other organizations which are
currently using Mobile solutions
like using it.
4. There is no difficulty in telling
others what Mobile solutions are
like.
5. I would have no difficulty in
promoting Mobile solutions with
the other organizations how it
Atkinson,
2007

28
improve the communication
within my organization.
6. Regulators and other relevant
stakeholders whom control the
organizational activities are
seemed to like using Mobile
Solutions.
Variable Variable type Dimensions Questions Reference
Rate of
Adoption
Dependent 1. Assuming I have access to mobile
enterprise solutions, I intend to use
it.
2. Given that I had access to Mobile
enterprise solutions, I predict that
I would use it.
3. Assuming I have an opportunity
to recommend mobile enterprise
solutions to my friends, I would
do it
Kim and
Garrison,
2008
29
Chapter 4
ANALYSIS
4.1 Introduction
This chapter analysis the statistical data gathered in this study to find out the relationship between
Relative advantage, Compatibility, Complexity, Trialability and Observerbility with Rate of
adoption of an innovation.
4.2 Data analysis
4.2.1 Case Screening & Variable Screening
Before the analysis, data was screened for missing data and outliers, case and variable wise. First
we looked at the standard deviations of responses (cases) to check whether they are really engaged
with the questionnaire or not. Four cases which had lower standard deviations (<0.4) were removed
assuming that they are not really engaged with the questions in the questionnaire. Other cases had
good standard deviations which we can assume that those respondents have involved well with the
questions or have good variance in their responses. Another three cases also removed which are
useless since it had over 50% missing values.
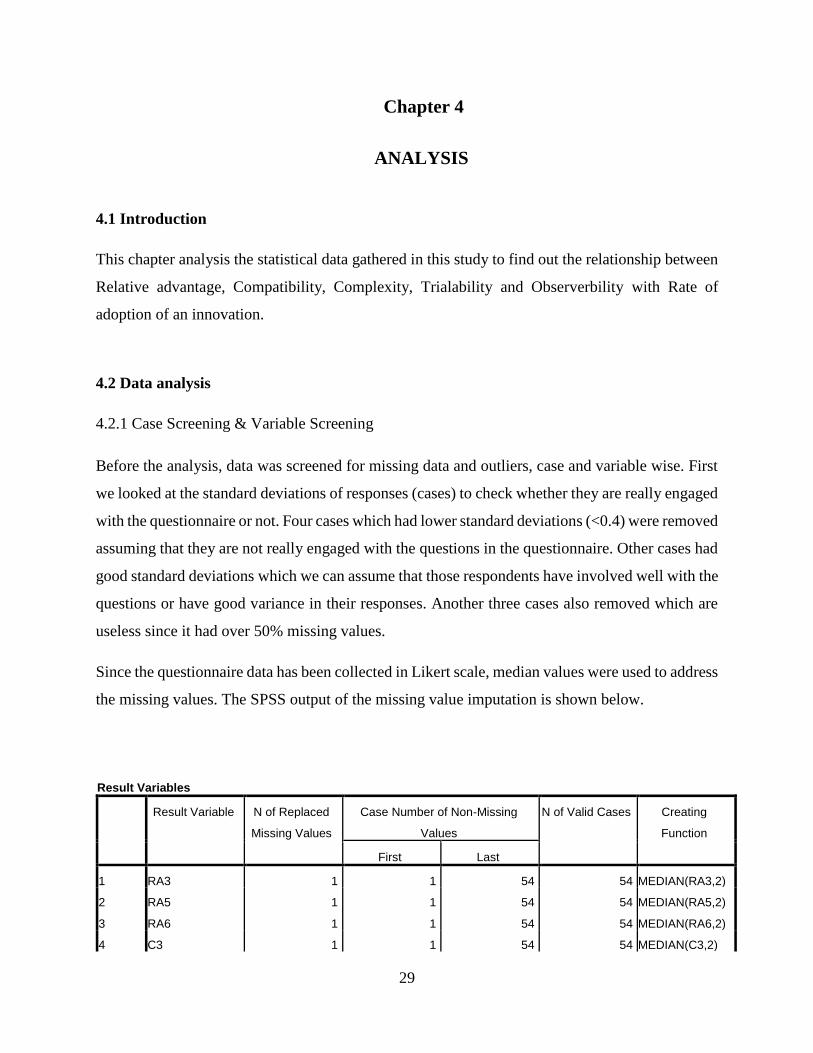
Since the questionnaire data has been collected in Likert scale, median values were used to address
the missing values. The SPSS output of the missing value imputation is shown below.
Result Variables
Result Variable N of Replaced
Missing Values
Case Number of Non-Missing
Values
N of Valid Cases Creating
Function
First Last
1 RA3 1 1 54 54 MEDIAN(RA3,2)
2 RA5 1 1 54 54 MEDIAN(RA5,2)
3 RA6 1 1 54 54 MEDIAN(RA6,2)
4 C3 1 1 54 54 MEDIAN(C3,2)

30
5 C4 2 1 54 54 MEDIAN(C4,2)
6 C5 2 1 54 54 MEDIAN(C5,2)
7 C6 1 1 54 54 MEDIAN(C6,2)
8 Co2 1 1 54 54 MEDIAN(Co2,2)
9 Co4 1 1 53 53 MEDIAN(Co4,2)
10 Co5 1 1 54 54 MEDIAN(Co5,2)
11 Co6 1 1 54 54 MEDIAN(Co6,2)
12 Co7 2 1 54 54 MEDIAN(Co7,2)
13 T3 1 1 54 54 MEDIAN(T3,2)
14 O1 2 1 54 54 MEDIAN(O1,2)
15 O2 1 1 54 54 MEDIAN(O2,2)
16 O3 1 1 54 54 MEDIAN(O3,2)
17 O6 2 1 54 54 MEDIAN(O6,2)
18 RoA2 2 1 54 54 MEDIAN(RoA2,2
)
Since there were only 1 respondent in less than 25 years age group, it was included to 26-35
members group and renamed the group as less than 35 members. Also since there were only 3
cases in 1-10 number of employees group, those were included to 11-100 number of employees
group and renamed the group as less than 100 number of employees.
4.3 Model Adequacy Checking
In regression we build models under some assumption about the error term of the model. So, it is
a must to check whether the assumptions are not violated before we use regression model.
Assumptions,
1. Random error terms are normally distributed with mean zero and constant variance.
2. Random error terms are uncorrelated.
31
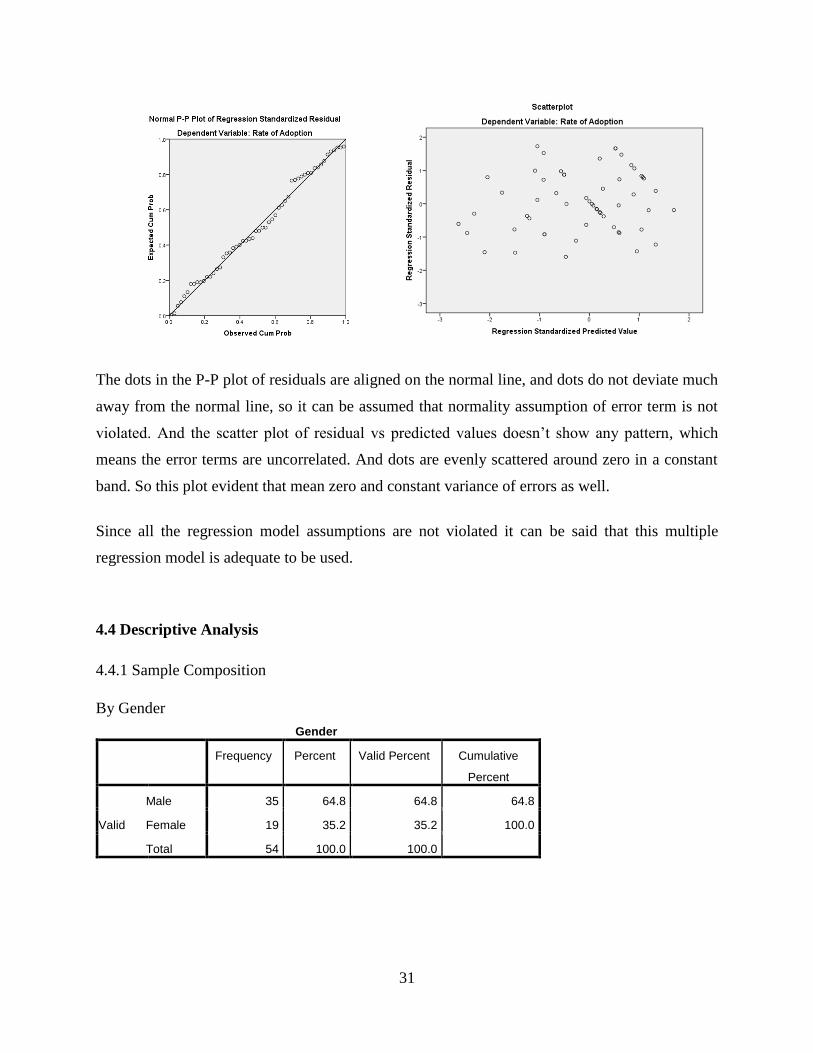
The dots in the P-P plot of residuals are aligned on the normal line, and dots do not deviate much
away from the normal line, so it can be assumed that normality assumption of error term is not
violated. And the scatter plot of residual vs predicted values doesn’t show any pattern, which
means the error terms are uncorrelated. And dots are evenly scattered around zero in a constant
band. So this plot evident that mean zero and constant variance of errors as well.
Since all the regression model assumptions are not violated it can be said that this multiple
regression model is adequate to be used.
4.4 Descriptive Analysis
4.4.1 Sample Composition
By Gender
Gender
Frequency Percent Valid Percent Cumulative
Percent
Valid
Male 35 64.8 64.8 64.8
Female 19 35.2 35.2 100.0
Total 54 100.0 100.0

32
By Age Group
Age Group
Frequency Percent Valid Percent Cumulative
Percent
Valid
<= 35 years 44 81.5 81.5 81.5
36 - 45 years 10 18.5 18.5 100.0
Total 54 100.0 100.0
By Region
Region
Frequency Percent Valid Percent Cumulative
Percent
Valid
Colombo & Suburbs 44 81.5 81.5 81.5
Other Regions 10 18.5 18.5 100.0
Total 54 100.0 100.0

33
By whether using MES or not
Using MES?
Frequency Percent Valid Percent Cumulative
Percent
Valid
Yes 43 79.6 79.6 79.6
No 11 20.4 20.4 100.0
Total 54 100.0 100.0
By Industry
Industry
Frequency Percent Valid Percent Cumulative Percent
Valid
IT 12 22.2 22.2 22.2
Manufacturing 11 20.4 20.4 42.6
Construction 3 5.6 5.6 48.1
Apparel 3 5.6 5.6 53.7
Finance 4 7.4 7.4 61.1
Service 8 14.8 14.8 75.9

34
Hospitality 2 3.7 3.7 79.6
Other 11 20.4 20.4 100.0
Total 54 100.0 100.0
By Legal Definition
Legal Definition
Frequency Percent Valid Percent Cumulative
Percent
Valid
Public Limited 15 27.8 27.8 27.8
Private Limited 25 46.3 46.3 74.1
Partnership 2 3.7 3.7 77.8
Sole Propriotor 4 7.4 7.4 85.2
Other 8 14.8 14.8 100.0
Total 54 100.0 100.0
By number of employees

35
No of Employees
Frequency Percent Valid Percent Cumulative
Percent
Valid
<= 100 10 18.5 18.5 18.5
> 100 44 81.5 81.5 100.0
Total 54 100.0 100.0
By Annual Turnover
Annual Turnover
Frequency Percent Valid Percent Cumulative
Percent
Valid
<= 30 Million 11 20.4 20.4 20.4
30 - 250 Million 14 25.9 25.9 46.3
> 250 Million 29 53.7 53.7 100.0
Total 54 100.0 100.0
36
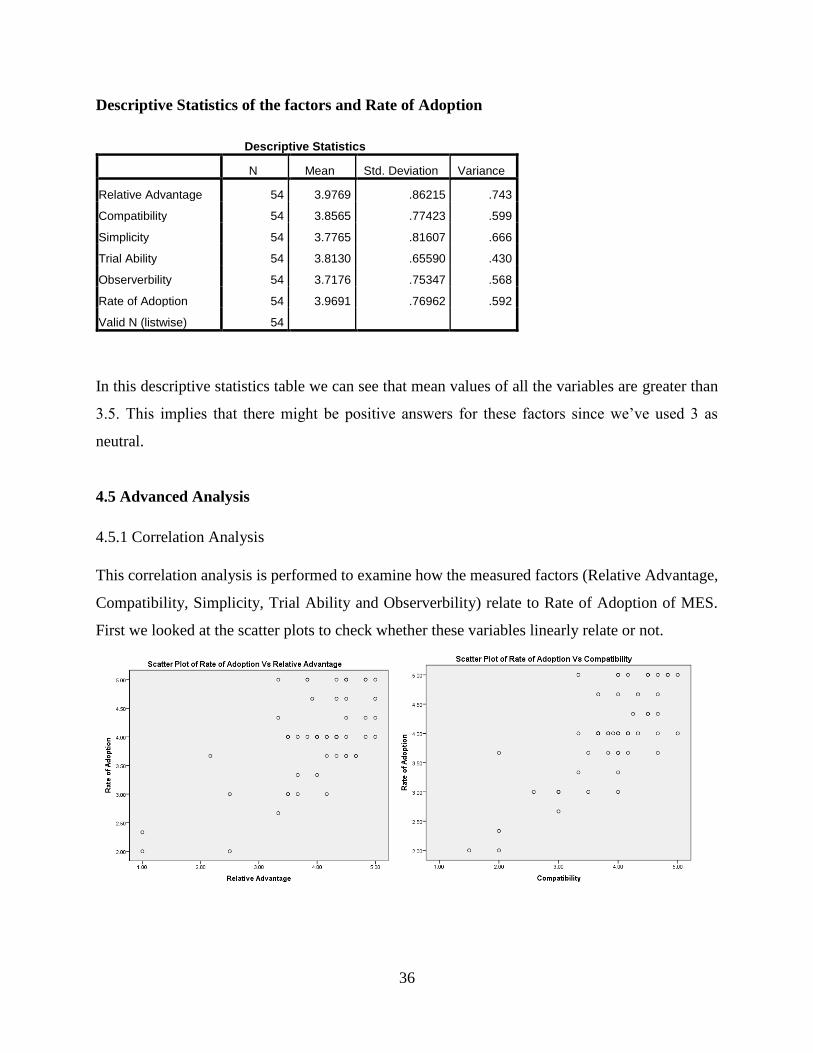
Descriptive Statistics of the factors and Rate of Adoption
Descriptive Statistics
N Mean Std. Deviation Variance
Relative Advantage 54 3.9769 .86215 .743
Compatibility 54 3.8565 .77423 .599
Simplicity 54 3.7765 .81607 .666
Trial Ability 54 3.8130 .65590 .430
Observerbility 54 3.7176 .75347 .568
Rate of Adoption 54 3.9691 .76962 .592
Valid N (listwise) 54
In this descriptive statistics table we can see that mean values of all the variables are greater than
3.5. This implies that there might be positive answers for these factors since we’ve used 3 as
neutral.
4.5 Advanced Analysis
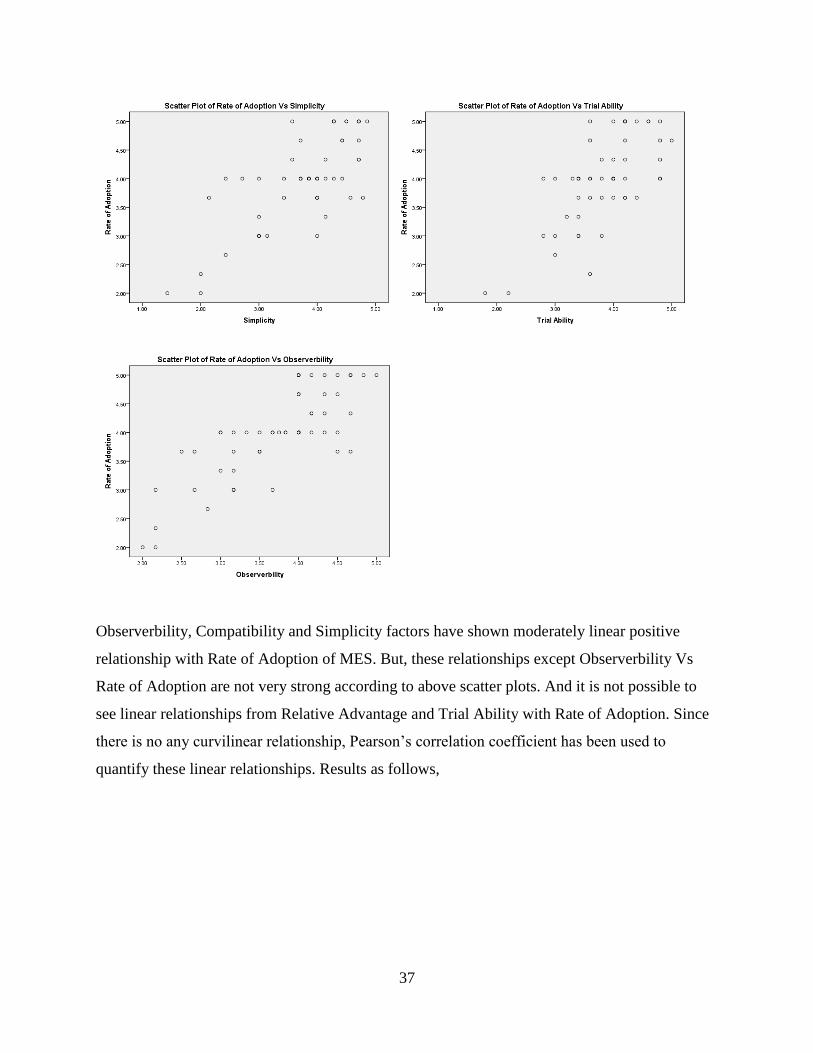
4.5.1 Correlation Analysis
This correlation analysis is performed to examine how the measured factors (Relative Advantage,
Compatibility, Simplicity, Trial Ability and Observerbility) relate to Rate of Adoption of MES.
First we looked at the scatter plots to check whether these variables linearly relate or not.
37
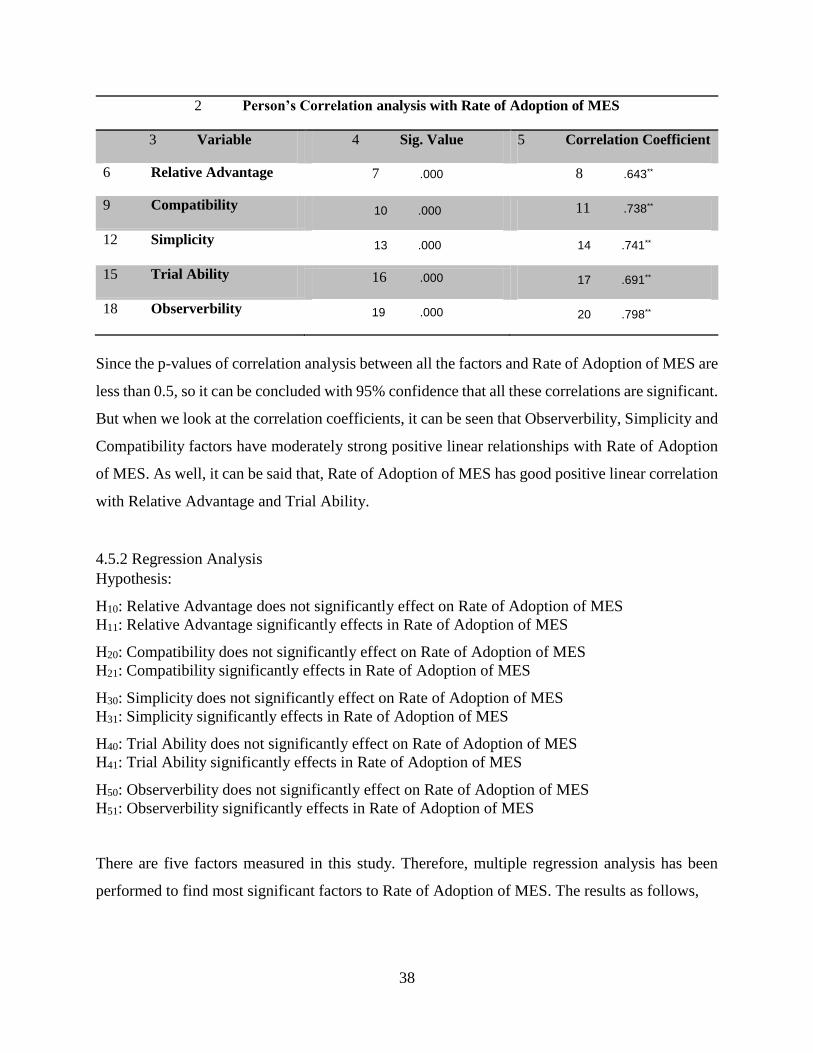
Observerbility, Compatibility and Simplicity factors have shown moderately linear positive
relationship with Rate of Adoption of MES. But, these relationships except Observerbility Vs
Rate of Adoption are not very strong according to above scatter plots. And it is not possible to
see linear relationships from Relative Advantage and Trial Ability with Rate of Adoption. Since
there is no any curvilinear relationship, Pearson’s correlation coefficient has been used to
quantify these linear relationships. Results as follows,
38
2 Person’s Correlation analysis with Rate of Adoption of MES
3 Variable 4 Sig. Value 5 Correlation Coefficient
6 Relative Advantage 7 .000 8 .643**
9 Compatibility 10 .000 11 .738**
12 Simplicity 13 .000 14 .741**
15 Trial Ability 16 .000 17 .691**
18 Observerbility 19 .000 20 .798**
Since the p-values of correlation analysis between all the factors and Rate of Adoption of MES are
less than 0.5, so it can be concluded with 95% confidence that all these correlations are significant.
But when we look at the correlation coefficients, it can be seen that Observerbility, Simplicity and
Compatibility factors have moderately strong positive linear relationships with Rate of Adoption
of MES. As well, it can be said that, Rate of Adoption of MES has good positive linear correlation
with Relative Advantage and Trial Ability.
4.5.2 Regression Analysis
Hypothesis:
H10: Relative Advantage does not significantly effect on Rate of Adoption of MES
H11: Relative Advantage significantly effects in Rate of Adoption of MES
H20: Compatibility does not significantly effect on Rate of Adoption of MES
H21: Compatibility significantly effects in Rate of Adoption of MES
H30: Simplicity does not significantly effect on Rate of Adoption of MES
H31: Simplicity significantly effects in Rate of Adoption of MES
H40: Trial Ability does not significantly effect on Rate of Adoption of MES
H41: Trial Ability significantly effects in Rate of Adoption of MES
H50: Observerbility does not significantly effect on Rate of Adoption of MES
H51: Observerbility significantly effects in Rate of Adoption of MES
There are five factors measured in this study. Therefore, multiple regression analysis has been
performed to find most significant factors to Rate of Adoption of MES. The results as follows,
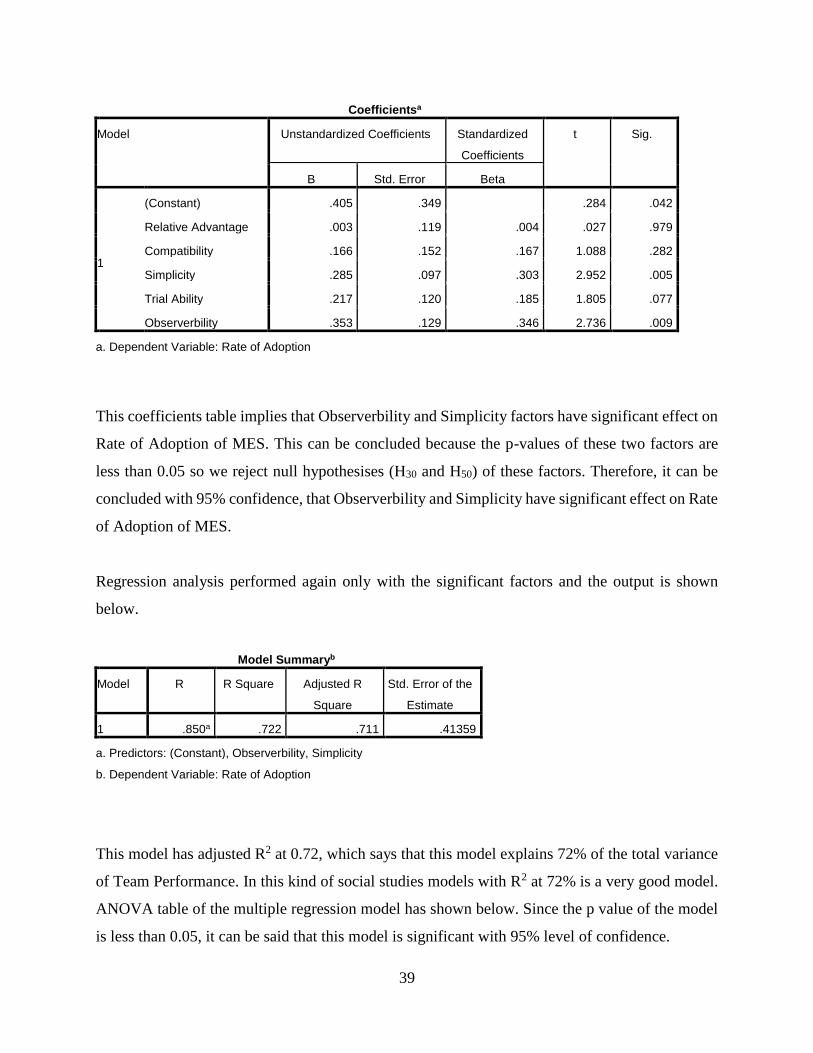
39
Coefficientsa
Model Unstandardized Coefficients Standardized
Coefficients
t Sig.
B Std. Error Beta
1
(Constant) .405 .349 .284 .042
Relative Advantage .003 .119 .004 .027 .979
Compatibility .166 .152 .167 1.088 .282
Simplicity .285 .097 .303 2.952 .005
Trial Ability .217 .120 .185 1.805 .077
Observerbility .353 .129 .346 2.736 .009
a. Dependent Variable: Rate of Adoption
This coefficients table implies that Observerbility and Simplicity factors have significant effect on
Rate of Adoption of MES. This can be concluded because the p-values of these two factors are
less than 0.05 so we reject null hypothesises (H30 and H50) of these factors. Therefore, it can be
concluded with 95% confidence, that Observerbility and Simplicity have significant effect on Rate
of Adoption of MES.
Regression analysis performed again only with the significant factors and the output is shown
below.
Model Summaryb
Model R R Square Adjusted R
Square
Std. Error of the
Estimate
1 .850a .722 .711 .41359
a. Predictors: (Constant), Observerbility, Simplicity
b. Dependent Variable: Rate of Adoption
This model has adjusted R2 at 0.72, which says that this model explains 72% of the total variance
of Team Performance. In this kind of social studies models with R2 at 72% is a very good model.
ANOVA table of the multiple regression model has shown below. Since the p value of the model
is less than 0.05, it can be said that this model is significant with 95% level of confidence.
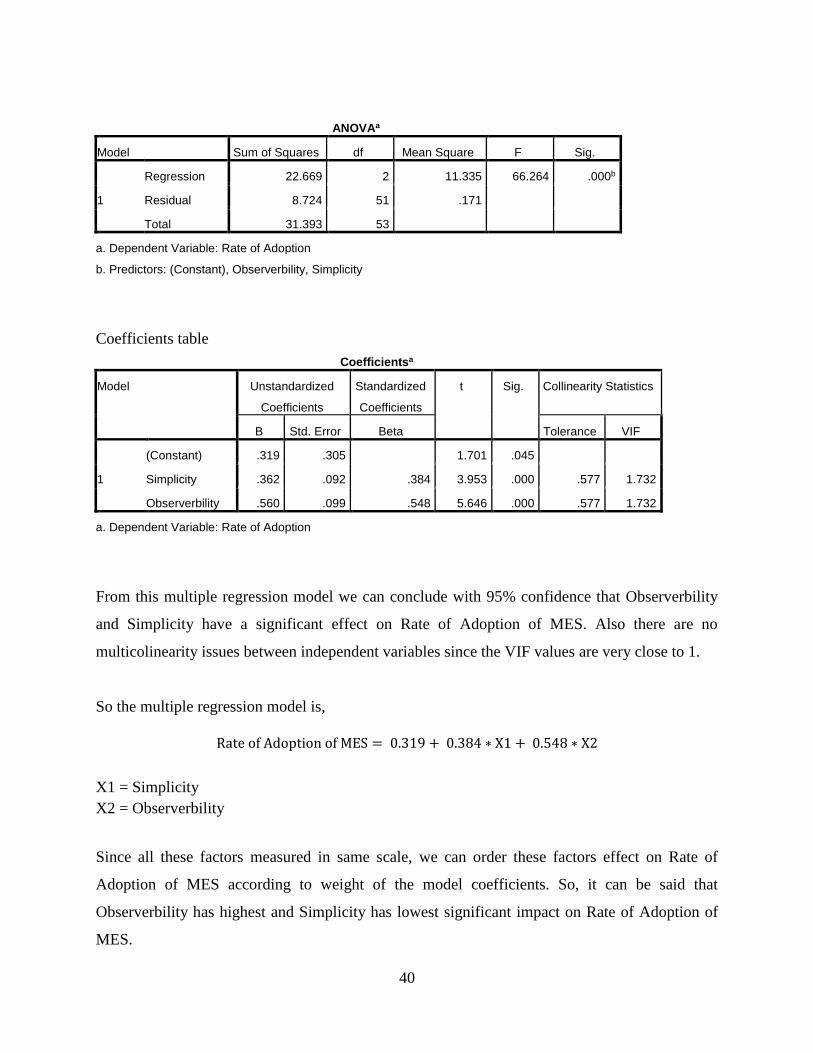
40
ANOVAa
Model Sum of Squares df Mean Square F Sig.
1
Regression 22.669 2 11.335 66.264 .000b
Residual 8.724 51 .171
Total 31.393 53
a. Dependent Variable: Rate of Adoption
b. Predictors: (Constant), Observerbility, Simplicity
Coefficients table
Coefficientsa
Model Unstandardized
Coefficients
Standardized
Coefficients
t Sig. Collinearity Statistics
B Std. Error Beta Tolerance VIF
1
(Constant) .319 .305 1.701 .045
Simplicity .362 .092 .384 3.953 .000 .577 1.732
Observerbility .560 .099 .548 5.646 .000 .577 1.732
a. Dependent Variable: Rate of Adoption
From this multiple regression model we can conclude with 95% confidence that Observerbility
and Simplicity have a significant effect on Rate of Adoption of MES. Also there are no
multicolinearity issues between independent variables since the VIF values are very close to 1.
So the multiple regression model is,
Rate of Adoption of MES = 0.319 + 0.384 ∗ X1 + 0.548 ∗ X2
X1 = Simplicity
X2 = Observerbility
Since all these factors measured in same scale, we can order these factors effect on Rate of
Adoption of MES according to weight of the model coefficients. So, it can be said that
Observerbility has highest and Simplicity has lowest significant impact on Rate of Adoption of
MES.

41
Since the coefficients of Simplicity and Observerbility are positive, we can say that these factors
have positive effect on Rate of Adoption of MES.
4.5.3 Logistic Regression
Since whether using MES or not variable measured in dichotomous (yes or no) type, logistic
regression was performed to make a model to predict whether using MES or not according to other
independent variables. Following is the results of the analysis.
Variables in the Equation
B S.E. Wald df Sig. Exp(B)
Step 1a
Relative Advantage -.009 .761 .000 1 .990 .991
Simplicity 1.292 .970 1.773 1 .023 .275
Compatibility -.476 .652 .534 1 .465 .621
Trial Ability .760 .791 .923 1 .337 2.139
Observerbility 1.021 .993 1.057 1 .034 2.777
Constant 1.418 2.083 .463 1 .006 .242
a. Variable(s) entered on step 1: Relative Advantage, Simplicity, Compatibility, Trial Ability,
Observerbility.
Above table implies that Simplicity and Observerbility factors have significant effect on whether
using MES or not. This can be concluded because the p-values of these two factors are less than
0.05. Therefore, it can be concluded with 95% confidence, that Observerbility and Simplicity have
significant effect on whether using MES or not.
Regression analysis performed again only with the significant factors and the output is shown
below.
Model Summary
Step -2 Log likelihood Cox & Snell R
Square
Nagelkerke R
Square
1 66.652a .287 .518

42
a. Estimation terminated at iteration number 5 because
parameter estimates changed by less than .001.
This model has a R2 value at 0.518 so, it can be concluded that this logistic regression model
explains 52% of the total variability of whether using MES or not.
Variables in the Equation
B S.E. Wald df Sig. Exp(B)
Step 1a
Simplicity .534 .940 .920 1 .028 .586
Observerbility .422 .983 .441 1 .037 1.525
Constant .948 1.784 .283 1 .015 .387
a. Variable(s) entered on step 1: Simplicity, Observerbility.
From this logistic regression model we can conclude with 95% confidence that Observerbility and
Simplicity have a significant effect on whether using MES or not.
So the logistic regression model is,
Using MES or not = 0.948 + 0.534 ∗ X1 + 0.422 ∗ X2
X1 = Simplicity
X2 = Observerbility
Since all these factors measured in same scale, we can order these factors effect on whether using
MES or not according to weight of the model coefficients. So, it can be said that Simplicity has
highest and Observerbility has lowest significant impact on whether using MES or not.
Since the coefficients of Simplicity and Observerbility are positive, we can say that these factors
have positive effect on whether using MES or not.

43
Chapter 5
DISCUSSION AND FINDINGS
5.1. Introduction
The objective of this chapter is to discuss the findings of the exercise in details. This will be
structured according to the conceptual framework and will go in to detail of each aspect that was
highlighted in the framework. Further support will be obtained from the data collected through the
questionnaire will be referred wherever applicable.
5.2 Factor Analysis
Convergent validity and discriminant validity were checked by performing Factor analysis.
Principle component method has been used as the extraction method and Promax method used as
the rotation method in this factor analysis. It was revealed that, some items had cross loadings and
negative loadings, and some items from deferent constructs loaded into same component. These
issues deviates the validity. But, by removing some items (T3 and T4),. Factor loadings of items
are nicely organized in the diagonal of the table. These diagonal loadings are high enough to
conclude that these items have good correlation inside their own construct. And this satisfies the
convergent validity. And there are some cross loadings in this table. Since these cross loadings are
fairly small (<0.5), we can assume that these items do not correlate with other constructs. So that
proves the discriminant validity.
And then proceeded to reliability analysis with the remaining items from factor analysis.
Cronbach’s Alpha has been used to examine internal consistency or the reliability of questions.
Since the Cronbach’s Alpha values of all the above constructs are greater than 0.7, so it can be
said that there is a good internal consistency in these constructs and reliable. Finally we can say
that the items are valid and reliable.

44
5.3 Descriptive Statistics
In descriptive statistics analysis it revealed that the mean values of all the variables are greater than
3.5. This implies that there might be positive answers for these factors since we’ve used 3 as
neutral.
5.4 Correlation Analysis
This correlation analysis is performed to examine how the measured factors (Relative Advantage,
Compatibility, Simplicity, Trial Ability and Observerbility) relate to Rate of Adoption of MES.
First we looked at the scatter plots to check whether these variables linearly relate or not.
Observerbility, Compatibility and Simplicity factors have shown moderately linear positive
relationship with Rate of Adoption of MES. But, these relationships except Observerbility Vs Rate
of Adoption are not very strong according to above scatter plots. And it is not possible to see linear
relationships from Relative Advantage and Trial Ability with Rate of Adoption. Since there is no
any curvilinear relationship, Pearson’s correlation coefficient has been used to quantify these linear
relationships. Since the p-values of correlation analysis between all the factors and Rate of
Adoption of MES are less than 0.5, so it can be concluded with 95% confidence that all these
correlations are significant. But when we look at the correlation coefficients, it can be seen that
Observerbility, Simplicity and Compatibility factors have moderately strong positive linear
relationships with Rate of Adoption of MES. As well, it can be said that, Rate of Adoption of MES
has good positive linear correlation with Relative Advantage and Trial Ability.
5.5 Regression Analysis
There are five factors measured in this study. Therefore, multiple regression analysis has been
performed to find most significant factors to Rate of Adoption of MES. This coefficients table
implies that Observerbility and Simplicity factors have significant effect on Rate of Adoption of
MES. This can be concluded because the p-values of these two factors are less than 0.05 so we
reject null hypothesises (H30 and H50) of these factors. Therefore, it can be concluded with 95%
confidence, that Observerbility and Simplicity have significant effect on Rate of Adoption of MES.
Regression analysis performed again only with the significant factors and the model has adjusted
R2 at 0.72, which says that this model explains 72% of the total variance of Team Performance. In

45
this kind of social studies models with R2 at 72% is a very good model. ANOVA table of the
multiple regression model has shown below. Since the p value of the model is less than 0.05, it
can be said that this model is significant with 95% level of confidence. From this multiple
regression model we can conclude with 95% confidence that Observerbility and Simplicity have a
significant effect on Rate of Adoption of MES. Also there are no multicolinearity issues between
independent variables since the VIF values are very close to 1.
So the multiple regression model is,
Rate of Adoption of MES = 0.319 + 0.384 ∗ X1 + 0.548 ∗ X2
X1 = Simplicity
X2 = Observerbility
Since all these factors measured in same scale, we can order these factors effect on Rate of
Adoption of MES according to weight of the model coefficients. So, it can be said that
Observerbility has highest and Simplicity has lowest significant impact on Rate of Adoption of
MES. Since the coefficients of Simplicity and Observerbility are positive, we can say that these
factors have positive effect on Rate of Adoption of MES.

46
Chapter 6
CONCLUSSION
In the reliability and validity analysis we could conclude that the measured data are reliable and
valid. In the descriptive statistics analysis we can see that mean values of all the variables are
greater than 3.5. This implies that there might be positive answers for all five factors since we’ve
used 3 as neutral. In another words its proving that there is a positive relationship between the
‘Perceived attributes of innovation and Rate of Adoption.
It was found in the correlation analysis that Observerbility, Simplicity and Compatibility factors
have moderately strong positive linear significant correlations with Rate of Adoption of MES. As
well other factors also have significant positive correlations with Rate of Adoption of MES.
Regression analysis also has proved that only Observerbility and Simplicity factors have
significant effect on Rate of Adoption of MES. As well it could be said that Observerbility has
highest and Simplicity has lowest significant impact on Rate of Adoption of MES according to
regression coefficients. Since the coefficients of Observerbility and Simplicity are positive, we can
say that these factors have positive effect on Team Performance. This positive effect is also proved
by the correlation analysis.
It is evident that Relative advantage, Compatibility, Complexity (Simplicity), Trialability and
Observerbility directly effect on the rate of adoption of Mobile Enterprise Solutions. Hence it is
advisable to Etisalat that whenever they approach a SME client to use their MES, highlight the
advantages of Etisalat MES over to competitors, and highlight the fact that it doesn’t make any
additional burden to the operational level staff as it highly compatible with the exsisting fixed
solutions. Always explain clients that its simplicity of the usage. Arranging testing or practical
demonstrations for a stipulated period will enable client use the new innovations without any
charge or commitment. Giving the referrals or evidence of the current users and share their success
stories will inspire new customers to ignite their purchasing decision.
47
Chapter 7
REFERENCE
Abdulla, N.H., Wahab,E & Shamsuddin, A. (2013). Exploring the Technology Adoption Enablers
among Malaysian SMEs: Qualitative Findings. Journal of Management and Sustainability, l.3,
no.4, pp.78-91
Akkeren, J.V and harker,D. (2003). The Mobile Internet and Small business: An exploratory Study
of Needs, Uses and Adoption with Full- Adopters of technology. Journal of Research and practice
in Information Technology. Vol.35, no.3, pp. 205-220.
Atkinson,N.L. (2007). Developing a questionnaire to measure Perceived Attributes of eHealth
Innovations, American medical Journal of health Behaviour,Vol.31, No 6,pp.612-621
Bhatti,T.(2007), Exploring Factors influencing the adoption of Mobile Commerce, journal of
Internet Banking and Commerce, vol.12,no.3 (Available at
http://www.arraydev.com/commerce/jibc/)
Davis,F.D. (1989). Perceived Usefulness, Perceived Ease of use, and user acceptance of
information technology. MIS quarterly. Vol.13, No.3. pp.319-340
Elogie, A.A.(2015),Factors Influencing the Adoption of Smartphones among Undergraduate
Students in Ambrose Alli University, Ekpoma, Nigeria. Library Philosophy and Practice (e-
journal)
Greenhalgh, T., Robert, G., Bate, P., Macfarlane, F. & Kyriakidou, O. (2005). Diffusion of
innovations in health service organizations. (1st edition.). India: Blackwell Publishing Ltd
Kearns, K. P. (1992). Innovations in local government: A sociocognitive network approach.
Knowledge and Policy, vol.5,No.2, pp.45-67.
Khalifa,M & Shen,K.N, (2006). Determinants of M-Commerce adoption: An Integrated approach,
European and Mediterranean Conference on Information systems (EMCIS), Costa Blanca,
Alicante, Spain.
Kim, S & Garrison,G.(2009). Investigating mobile wireless technology adoption: An extension of
the technology acceptance model, Springer Science + Business Media, LLC 2008.
Liao, H.L., & Lu, H.P. (2008). The Role of Experience and Innovation Characteristics in the
Adoption and Continued Use of E-Learning Websites. Computers & Education, vol.51No.4,
pp.1405-1416.
48
Naqvi,S.J,Shihi, H.L.(2014) Factors Affecting M-commerce Adoption in Oman using Technology
Acceptance Modelling Approach, TEM Journal,Vol.3, no.4, pp. 315-322
Rogers, E. M. (1962). Diffusion of innovations (1st ed.). New York: Free Press.
Rogers, E.M. (1986). Communication: The new media in society. New York: The Free Press.
Rogers, E.M. (1995). Diffusion of innovations (4th ed.). New York: The Free Press.
Rogers, E.M., & Scott, K.L. (1997). The diffusion of innovations model and outreach from the
National Network of Libraries of Medicine to Native American communities. Retrieved April 27,
2005, from http://nnlm.gov/ pnr/eval/rogers.html.
Rogers, E.M. (1962).Diffusion of Innovation, A Division of Macmillan Publishing Co., Inc.
Tornatzky, L. G., & Klein, K. J. (1982). Innovation characteristics and innovation adoption-
implementation: A meta-analysis of findings. IEEE Transactions on Engineering Management,
Vol.29, No1, pp.28-45.
Wickremasinghe, S.I. (2011). The Status of SMEs in Sri Lanka and promotion of their innovation
output,
Worum, H. (2014), Innovation adoption in a hospital the role of perceived innovation attributes in
the adoption intention, Master’s Thesis in Leadership, Innovation, and Marketing.
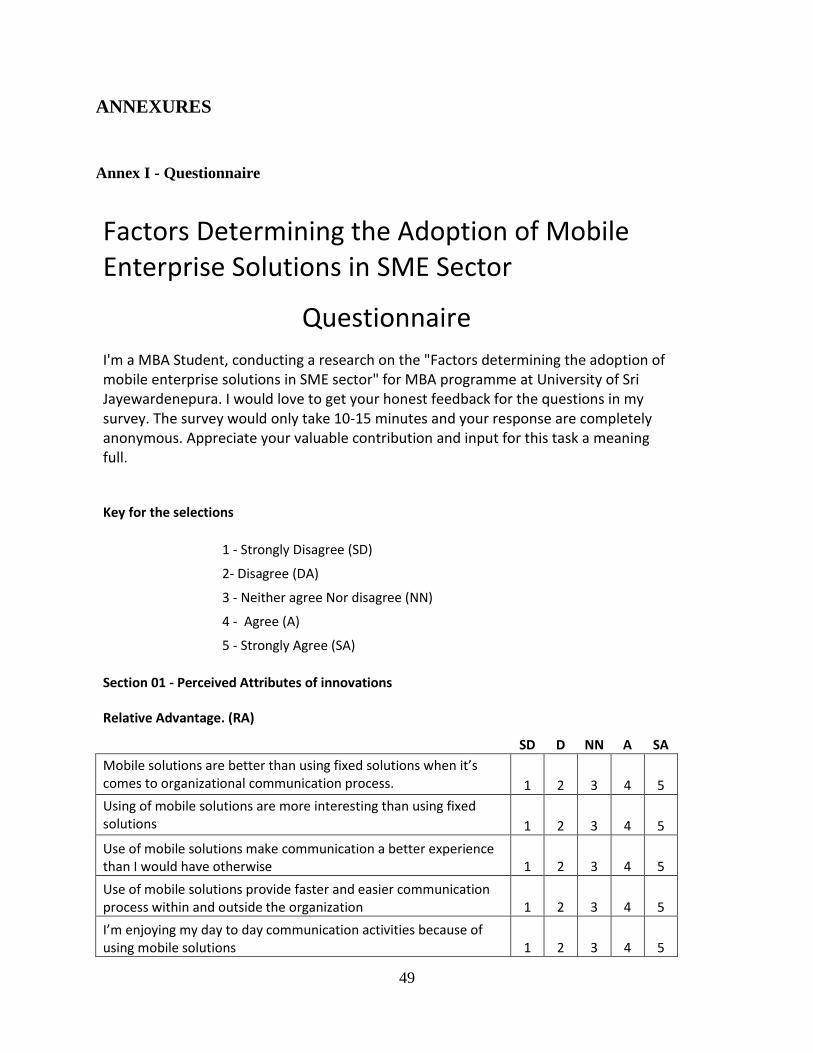
49
ANNEXURES
Annex I - Questionnaire
Factors Determining the Adoption of Mobile Enterprise Solutions in SME Sector
Questionnaire
I'm a MBA Student, conducting a research on the "Factors determining the adoption of mobile enterprise solutions in SME sector" for MBA programme at University of Sri Jayewardenepura. I would love to get your honest feedback for the questions in my survey. The survey would only take 10-15 minutes and your response are completely anonymous. Appreciate your valuable contribution and input for this task a meaning full.
Key for the selections
1 - Strongly Disagree (SD)
2- Disagree (DA)
3 - Neither agree Nor disagree (NN)
4 - Agree (A)
5 - Strongly Agree (SA)
Section 01 - Perceived Attributes of innovations
Relative Advantage. (RA)
SD D NN A SA
Mobile solutions are better than using fixed solutions when it’s comes to organizational communication process. 1 2 3 4 5
Using of mobile solutions are more interesting than using fixed solutions 1 2 3 4 5
Use of mobile solutions make communication a better experience than I would have otherwise 1 2 3 4 5
Use of mobile solutions provide faster and easier communication process within and outside the organization 1 2 3 4 5
I’m enjoying my day to day communication activities because of using mobile solutions 1 2 3 4 5

50
Mobile solutions offered me real advantages over the way I usually doing my communications through fixed solutions 1 2 3 4 5
Compatibility (C)
SD D NN A SA
Mobile solutions are fitting right into the way which I prefer to use 1 2 3 4 5
I think other SME organizations also should use Mobile solutions for their communication activities. 1 2 3 4 5
Concept “Mobility” and “Mobile Solutions” made me want to practically use the solution 1 2 3 4 5
Using of mobile solutions make what I’m doing as communication activities in day to day, more relevant to me. 1 2 3 4 5
Mobile solutions help to learn more about my business area while using it or communication activities 1 2 3 4 5
Mobile solutions help me to learn more about Technology while using it for communication activities. 1 2 3 4 5
Complexity (Co)
SD D NN A SA
There is no difficulty in handling Mobile solutions. 1 2 3 4 5
There is no difficulty in understanding how to get around in Mobile solutions. 1 2 3 4 5
There is no difficulty in understanding how mobile solutions work. 1 2 3 4 5
There are no difficulties in getting the mobile solutions working on a computers and mobile phones. 1 2 3 4 5
There are no difficulties in using available options under particular mobile solutions. 1 2 3 4 5
There is no difficulty in controlling attributes of voice and Data segments. 1 2 3 4 5
There is no difficulty in understanding the information in Mobile solutions. 1 2 3 4 5
Trial ability (T)
SD D NN A SA
Being able to testing mobile solutions most important in deciding whether or not to purchase it. 1 2 3 4 5
Being able to try out Mobile solutions is important in deciding to use it. 1 2 3 4 5

51
Im more likely to want to use Mobile solutions because of being part of this survey. 1 2 3 4 5
There is not much of lose by trying out mobile solutions even if I don’t like it. 1 2 3 4 5
I like being able to try out Mobile Solutions before deciding whether I like it or not. 1 2 3 4 5
Observerbility (O)
SD D NN A SA
Other SME organizations seemed interested in mobile solutions when they see us using it. 1 2 3 4 5
Employees of other SME”s can tell that we do our communication efficient and effectively since we are using mobile solution.
1 2 3 4 5
Other organizations which are currently using Mobile solutions like using it. 1 2 3 4 5
There is no difficulty in telling others what Mobile solutions are like. 1 2 3 4 5
I would have no difficulty in promoting Mobile solutions with the other organizations how it improve the communication within my organization. 1 2 3 4 5
Regulators and other relevant stakeholders whom control the organizational activities are seemed to like using Mobile Solutions. 1 2 3 4 5
Section 02 - Rate of adoption (RoA)
Assuming I have access to mobile enterprise solutions, I intend to use it. 1 2 3 4 5
Given that I had access to Mobile enterprise solutions, I predict that I would use it. 1 2 3 4 5
Assuming I have an opportunity to recommend mobile enterprise solutions to my friends, I would do it 1 2 3 4 5
Section 03 - Demographic Information
Designation :-
Age :-
Gender :-
Industry Sector :-
Area :-
Legal definition of the organization :-
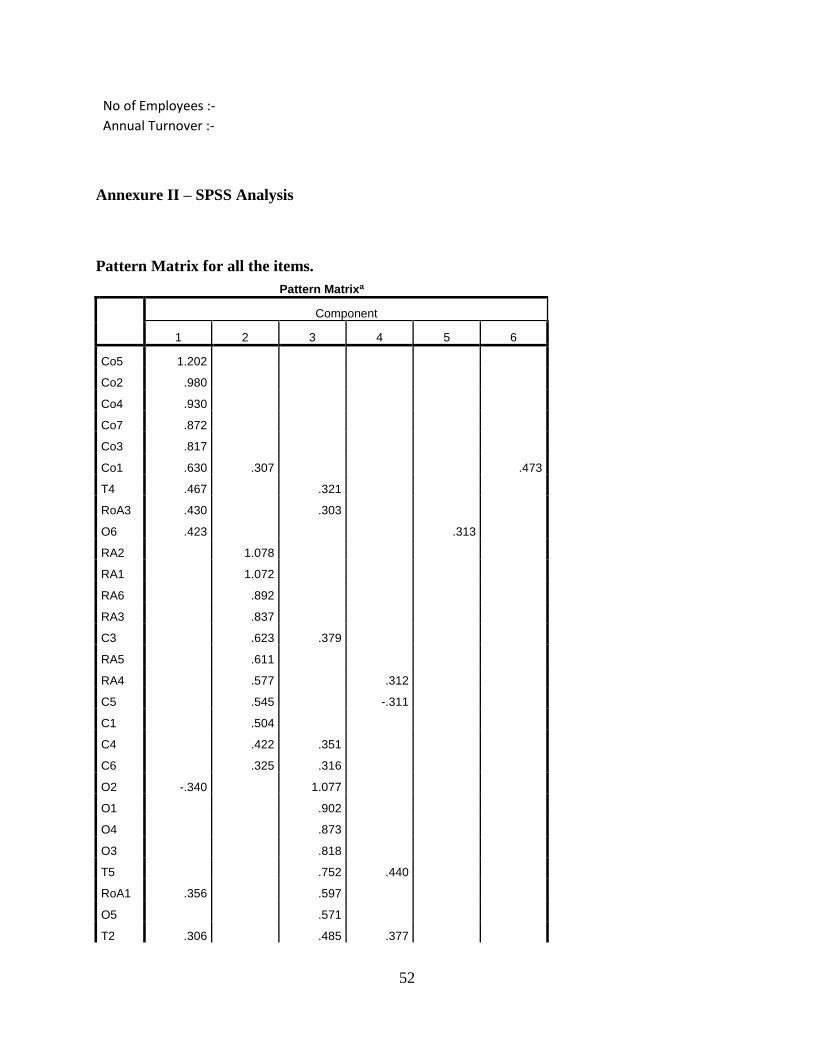
52
No of Employees :-
Annual Turnover :-
Annexure II – SPSS Analysis
Pattern Matrix for all the items.
Pattern Matrixa
Component
1 2 3 4 5 6
Co5 1.202
Co2 .980
Co4 .930
Co7 .872
Co3 .817
Co1 .630 .307 .473
T4 .467 .321
RoA3 .430 .303
O6 .423 .313
RA2 1.078
RA1 1.072
RA6 .892
RA3 .837
C3 .623 .379
RA5 .611
RA4 .577 .312
C5 .545 -.311
C1 .504
C4 .422 .351
C6 .325 .316
O2 -.340 1.077
O1 .902
O4 .873
O3 .818
T5 .752 .440
RoA1 .356 .597
O5 .571
T2 .306 .485 .377

53
RoA2 .430 .447
T1 .917
C2 .378 .509
T3 1.067
Co6 .523 .730
Extraction Method: Principal Component Analysis.
Rotation Method: Promax with Kaiser Normalization.
a. Rotation converged in 9 iterations.
SPSS output from reliability analysis for Communication
Reliability Statistics
Cronbach's
Alpha
N of Items
.920 6
Item-Total Statistics
Scale Mean if
Item Deleted
Scale Variance
if Item Deleted
Corrected Item-
Total
Correlation
Cronbach's
Alpha if Item
Deleted
RA1 19.94 17.906 .842 .896
RA2 19.92 18.922 .769 .906
RA3 19.98 18.886 .796 .903
RA4 19.68 19.671 .694 .916
RA5 19.84 19.093 .745 .909
RA6 19.95 18.795 .788 .903
SPSS output from reliability analysis for Mutual Support
Reliability Statistics
Cronbach's
Alpha
N of Items
.865 6

54
Item-Total Statistics
Scale Mean if
Item Deleted
Scale Variance
if Item Deleted
Corrected Item-
Total
Correlation
Cronbach's
Alpha if Item
Deleted
C1 19.21 16.326 .690 .840
C2 19.06 16.010 .581 .856
C3 19.37 15.492 .611 .851
C4 19.25 15.696 .724 .833
C5 19.44 14.066 .724 .831
C6 19.36 14.749 .671 .841
SPSS output from reliability analysis for Cohesion
Reliability Statistics
Cronbach's
Alpha
N of Items
.932 7
Item-Total Statistics
Scale Mean if
Item Deleted
Scale Variance
if Item Deleted
Corrected Item-
Total
Correlation
Cronbach's
Alpha if Item
Deleted
Co1 22.69 24.012 .775 .923
Co2 22.56 23.429 .878 .912
Co3 22.63 23.819 .889 .912
Co4 22.62 24.268 .738 .927
Co5 22.54 25.450 .814 .920
Co6 22.73 27.073 .634 .935
Co7 22.67 24.682 .769 .923

55
SPSS output from reliability analysis for Value Diversity
Reliability Statistics
Cronbach's
Alpha
N of Items
.836 3
Item-Total Statistics
Scale Mean if
Item Deleted
Scale Variance
if Item Deleted
Corrected Item-
Total
Correlation
Cronbach's
Alpha if Item
Deleted
T1 8.07 2.674 .625 .845
T2 7.94 2.733 .728 .748
T5 7.98 2.434 .749 .720
SPSS output from reliability analysis for Trust
Reliability Statistics
Cronbach's
Alpha
N of Items
.903 6
Item-Total Statistics
Scale Mean if
Item Deleted
Scale Variance
if Item Deleted
Corrected Item-
Total
Correlation
Cronbach's
Alpha if Item
Deleted
O1 18.55 15.116 .678 .894
O2 18.62 14.216 .789 .878
O3 18.60 14.353 .747 .884
O4 18.56 13.812 .783 .878
O5 18.56 13.793 .808 .874
O6 18.63 15.521 .602 .904
SPSS output from reliability analysis for Coordination of Expertise
Reliability Statistics
Cronbach's
Alpha
N of Items
.861 3
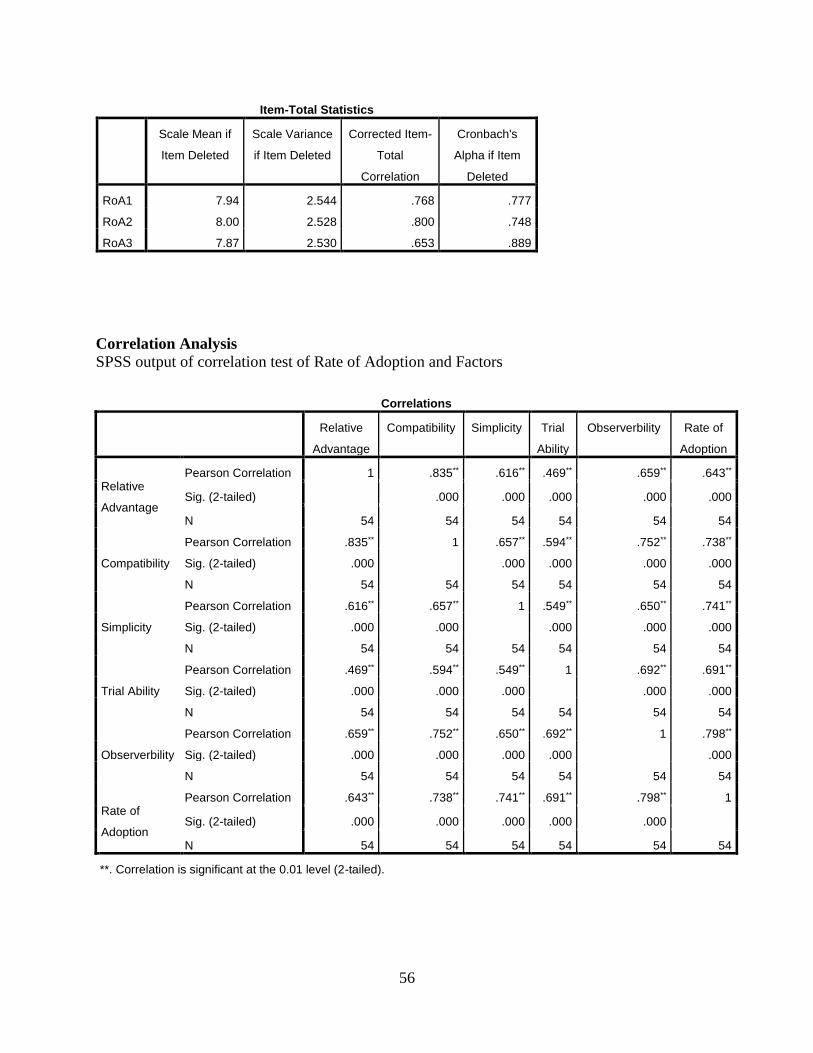
56
Item-Total Statistics
Scale Mean if
Item Deleted
Scale Variance
if Item Deleted
Corrected Item-
Total
Correlation
Cronbach's
Alpha if Item
Deleted
RoA1 7.94 2.544 .768 .777
RoA2 8.00 2.528 .800 .748
RoA3 7.87 2.530 .653 .889
Correlation Analysis
SPSS output of correlation test of Rate of Adoption and Factors
Correlations
Relative
Advantage
Compatibility Simplicity Trial
Ability
Observerbility Rate of
Adoption
Relative
Advantage
Pearson Correlation 1 .835** .616** .469** .659** .643**
Sig. (2-tailed) .000 .000 .000 .000 .000
N 54 54 54 54 54 54
Compatibility
Pearson Correlation .835** 1 .657** .594** .752** .738**
Sig. (2-tailed) .000 .000 .000 .000 .000
N 54 54 54 54 54 54
Simplicity
Pearson Correlation .616** .657** 1 .549** .650** .741**
Sig. (2-tailed) .000 .000 .000 .000 .000
N 54 54 54 54 54 54
Trial Ability
Pearson Correlation .469** .594** .549** 1 .692** .691**
Sig. (2-tailed) .000 .000 .000 .000 .000
N 54 54 54 54 54 54
Observerbility
Pearson Correlation .659** .752** .650** .692** 1 .798**
Sig. (2-tailed) .000 .000 .000 .000 .000
N 54 54 54 54 54 54
Rate of
Adoption
Pearson Correlation .643** .738** .741** .691** .798** 1
Sig. (2-tailed) .000 .000 .000 .000 .000
N 54 54 54 54 54 54
**. Correlation is significant at the 0.01 level (2-tailed).