Kerosene Heater Wicks | Kerosene Wicks · Created Date: 11/18/2010 5:52:55 PM
Project: Kerosene Vale Ash Dam and Dry Ash Repository Water Quality Assessment from April, 2015 to March, 2016 in relation to the Decommissioned Wallerawang Power Station
Reference: 208562
Prepared for: EnergyAustralia NSW
Revision: 4
14 November 2016

Project 208562| File KVAD&R LC and SSCAD Water Quality Assessment 2016 Final
Report.docx | 14 November 2016 | Revision 4
Document Control Record
Document prepared by:
Aurecon Australiasia Pty Ltd
ABN 54 005 139 873
Level 2, 116 Military Road Neutral Bay NSW 2089
PO Box 538 Neutral Bay NSW 2089 Australia T F E W
+61 2 9465 5599 +61 2 9465 5598 [email protected] aurecongroup.com
A person using Aurecon documents or data accepts the risk of:
a) Using the documents or data in electronic form without requesting and checking them for accuracy against the original hard copy version.
b) Using the documents or data for any purpose not agreed to in writing by Aurecon.
Report Title Water Quality Assessment from April, 2015 to March, 2016 in relation to the Decommissioned Wallerawang Power Station
Document ID Project Number 208562
File Path P:\ENERGY\7053\Mount Piper & Wang WQ 2440\Wang\KVAR 2016 Report\KVAD&R LC and SSCAD Water Quality Assessment 2016 initial draft.docx
Client EnergyAustralia NSW Client Contact Alicia de Vos
Rev Date Revision Details/Status Prepared by Author Verifier Approver
0 15 September 2016 Initial Draft B Hodgson B Hodgson
1 4 October 2016 Hydrological Review B Hodgson B Hodgson Joe Keane
2 19 October 2016 Internal Review B Hodgson B Hodgson Mike Luger Mike Luger
3 31 October 2016 Final Draft for comment by EANSW
B Hodgson B Hodgson Mike Luger Mike Luger
4 14 November 2016 Final Report B Hodgson B Hodgson Mike Luger Mike Luger
Current Revision 4

Page i
Contents 1. Introduction 3
1.1 Background 4
1.2 KVAD Subsurface Drains 5
1.3 Scope 7
1.4 Aims and Objectives 7
1.5 Previous Report 8
1.6 Information provided by EnergyAustralia NSW 8
1.7 Data Quality 9
1.8 Structure of the Report 9
2. Surface and Groundwater Quality Monitoring 10
2.1 Monitoring Design for Differentiation of Water Quality Sources 10
2.2 Groundwater Monitoring 12
2.3 Surface Water Monitoring 13
2.3.1 Sampling in Upper Sawyers Swamp Creek 13
2.4 KVAR Site Monitoring and Runoff Management 14
2.5 Tracers for Dry Ash leachates 14
2.6 Groundwater Levels 15
2.7 Climatic Conditions 15
2.8 Methods 15
2.9 Guidelines 16
2.9.1 Receiving Waters 20
2.9.2 Early Warning of Water Quality Changes 20
2.10 Control Charts 21
3. Review of Groundwater Quality 22
3.1 Groundwater Level Changes and Flow Directions 22
3.2 Groundwater Quality changes at Background Bores and SSCAD Seepage Bores 23
3.3 Groundwater Quality changes at KVAR/KVAD and Seepage Bores 25
3.3.1 Long-term changes at groundwater seepage detection bores 27
3.4 KVAR effects on local Groundwater Quality 30
3.5 KVAD effects on local Groundwater Quality 30
3.6 Long-term changes for Lidsdale Cut Water Quality 32
3.7 Distribution of Aluminium between groundwater sampling sites 34
4. Review of Surface Water Quality 38

Page ii
4.1 Sawyers Swamp Creek Ash Dam effects on Surface water Quality 38
4.2 KVAR/KVAD Groundwater Seepage Effects on Sawyers Swamp Creek 42
5. Discussion 44
6. Conclusions 46
7. Recommendations 47
8. References 48
Tables Table 1: Pre-dry Ash Placement Water Quality Baseline 90th Percentile at Background and
Receiving Water Sites and resulting Guidelines or Goals for KVAD/R Groundwater, Lidsdale Cut and Sawyers Swamp Creek
Table 2: Wallerawang Power Station flyash leachates and potential increase in Sawyers
Swamp Creek and local groundwater compared to KVAD groundwater seepage, WX7 concentrations with and without Springvale coal mine discharges, the coal mine water quality and surface and groundwater quality ANZECC (2000) Guidelines or Local Goals
Table 3: Water Quality for SSCAD Seepage detection Groundwater bores WGM1/D3 and D4 during Stage 2 to 2014/15 and the decommissioned KVAR period compared to the Groundwater Background bore D2, Bore D4 90th Percentile Baseline and Groundwater Guidelines or Goals
Table 4: Average Water Quality for KVAD Groundwater Quality compared to KVAR receiving
water bores D5 and D6 as well as in the Lidsdale Cut during 2015/16 Table 5: Long-term Groundwater Quality changes for KVAD groundwater seepage bores
WGM1/D5 and D6 from Initial Stage 2 to current decommissioned period compared to background Bore D2, Bore D5 90th Percentile Baseline and Groundwater Guidelines or Goals
Table 6: Estimated local groundwater quality increases due to groundwater seepage from the KVAR/KVAD for the previous 2014/15 and the current periods compared to Bore D5 receiving water quality and the groundwater ANZECC (2000) Guidelines or Local Goals
Table 7: Long-term Groundwater Quality changes for Lidsdale Cut Water Quality from Stage 1
and its Capping and Initial Stage 2 to the current decommissioned period compared to the pre-placement conditions and the Groundwater Guidelines or Goals
Table 8: Water Quality in SSCAD for Pre-placement and Stage 2 Periods to 2014/15 and the V-notch Seepage Compared to Sawyers Swamp Creek Up- and Downstream of the V-notch and Surface Water Guidelines or Goals
Table 9: Estimated water quality increases in Sawyers Swamp Creek at WX7 due to groundwater seepage from the KVAR/KVAD without Springvale coal mine discharges for the previous 2014/15 and the current periods compared to recent Sawyers Swamp Creek concentrations and ANZECC (2000) Guidelines or Local Goals

Page iii
Figures Figure 1: Schematic of Kerosene Vale Dry Ash Placement Area Seepage Diversion works Figure 2: Surface and Groundwater Monitoring Sites for Sawyers Swamp Creek Ash Dam and
Kerosene Vale Dry Ash Placement Area
Figure 3: Location of original Kerosene Vale Ash Dam open-cut mine void used to store ash (hashed to right), Lidsdale Cut open-cut mine void filled with coal waste/chitter (hashed to left) and north of the Sawyers Swamp Creek: Centennial Coal surface coal emplacement on top of filled open-cut mine (hash to right, bordered by coal waste/chitter filled open-cut hashed to left) and plan of underground coal mine workings
Figure 4: Long-term Groundwater Elevation changes at background bores WGM1/D1 and D2 and SSCAD seepage detection bores D3 and D4 compared to receiving water bores D5 and D6 down-gradient of the KVAD/R ash placement area (vertical line indicates pumping from Lidsdale Cut began June, 2012)
Figure 5: Average concentrations of trace metals and aluminium at bore D5 for each reporting period since 2010/2012.
Figure 6: Average concentrations of trace metals and aluminium in the Lidsdale Cut Pond from the pre-KVAR placement period and each reporting period since 2003/2010
Figure 7: Signature plot of Aluminium concentration compared to pH for each groundwater bore and seepage points at the KVAD and at Bore D5 and Lidsdale Cut
Figure 8: Signature plot of Aluminium concentration compared to Sulphate for each groundwater bore and seepage points at the KVAD and at Bore D5 and Lidsdale Cut
Figure 9: Kerosene Vale Ash Dam and Stage 1 and Stage 2 Dry Ash Repository Groundwater Level (RL m) Contours with Inferred Flow Directions (from sketch provided by Lend Lease Infrastructure to EnergyAustralia NSW)
Figure 10: Long-term trends in conductivity, sulphate and trace metals in SSCAD Pond from periods of wet ash placement to 2003, dry ash placement at KVAR from 2003 to 2014 and pumping from Lidsdale Cut since 2012
Attachments Attachment 1: Lithgow Rainfall Data from January, 2000 to March, 2016 (mm/month) from
Bureau of Meteorology Attachment 2: Wallerawang Power Station Ash Dam, Surface Water and Groundwater Quality
Stage 2 Data from April, 2013 to March, 2015 and April, 2015 to March, 2016.
Attachment 3: Construction drawing of KVAD wall showing chitter used to construct the benches

Page iv

Page 1
Summary
This annual assessment report for 2015/16 reporting period has been prepared for the decommissioned and partly capped Kerosene Vale Ash Repository (KVAR) to address the requirements of the NSW Department of Planning and Environment’s Consent conditions for monitoring to be undertaken to ascertain whether there have been any significant effects of the dry ash placement on the local surface or groundwater quality. Due to the complex, locally mineralised conditions, the assessment attempts to take these conditions into account, including any residual effects of the Kerosene Vale Ash Dam (KVAD) and Sawyers Swamp Creek Ash Dam (SSCAD). The assessment found no significant effects on surface and groundwater quality due to the now decommissioned ash repository. This finding is consistent with that from previous reports and the predictions of the Stage 2 Environmental Assessment on the basis of limited rainfall infiltration into the dry ash placement. The assessment of effects of the residual wet ash in the Kerosene Vale Ash Dam, which is beneath the Kerosene Vale Ash Repository, found no significant effects of its groundwater seepage on the local surface or groundwater. This was found to be due to the relatively low concentrations of ash related leachates from the long-held ash, leaving mainly leachates from the pre-existing coal waste/chitter in the mine void beneath the KVAD. The local water table inside the KVAD and at the KVAR receiving groundwater bore WGM1/D5 has shown a noticeable decrease since 2012, possibly due to the effects of the KVAR subsurface drain and pumping from Lidsdale Cut, together with the effects of prolonged dry weather. This revealed the process whereby high concentrations of salts and trace metals, including aluminium, are released from pyrites in the coal waste/chitter in the area. The Lidsdale Cut pond showed a significant decrease in salinity, trace metals and aluminium during the current period. This indicates a reduction in pyrite oxidation in the coal waste/chitter that forms the Lidsdale Cut mine void. It appears that the current management of maintaining a target water level in the pond is providing the observed improvements in water quality. The distribution of aluminium in groundwater in the area was investigated and the most likely source is coal pyrites in the local Lidsdale Cut and KVAD coal mine voids, as well as in the benches used to support the KVAD walls. From these observations, it was suggested that the rare events of aluminium precipitation in Sawyers Swamp Creek appear to be due to leachates from the coal waste/chitter in the area being mobilised during high rainfall runoff events under coal pyrite oxidation conditions with the prevailing acidic conditions. Due to the effects of the Springvale coal mine discharge, the Sawyers Swamp Creek Ash Dam (SSCAD) was shown to have no significant effects on the surface water quality of Sawyers Swamp Creek.. During periods with only natural stream flows and no mine water, both the KVAR and the KVAD seepages were estimated to be too small to have a significant effect on the local groundwater quality or on Sawyers Swamp Creek water quality. The SSCAD seepage to the creek through the v-notch was also found to have no significant effects on the creek under natural flow conditions. Some trace metals in the ash dam pond, notably zinc, showed an increase during the current period and it is recommended that the current low dissolved oxygen concentrations in the SSCAD pond be investigated as a possible cause.

Page 2
Groundwater seepage from the SSCAD was also found to have no significant effects on the groundwater up-gradient of the Kerosene Vale Ash Repository. However, some seepage from the northern section of the SSCAD wall was evident, but the changes in salinity during 2014/15 and 2015/16 indicated that most of the salinity may be from the wider catchment rather than the ash dam.

Page 3
1. Introduction EnergyAustralia NSW previously advised that Wallerawang Power Station, including the Kerosene Vale Ash Repository (KVAR), ceased operation and subsequent ash production in March, 2014. Aurecon undertook the first surface and groundwater quality assessment report for the decommissioned KVAR in 2014/15 (Aurecon, 2015) and has been engaged to undertake the annual assessment report over the period April, 2015 to March, 2016, which includes changes in water quality over the time since decommissioning. Aurecon’s scope also requires examination of long-term water quality changes from pre-dry ash placement to Stages 1 and II and during the decommissioned period to March, 2016. The 2015/16 report is required for the NSW Department of Planning and Environment’s Development Consent conditions for the Kerosene Vale Ash Repository because the Wallerawang Power Station Environment Protection Licence (EPL) L766 of 11th January, 2016 has been retained by EnergyAustralia NSW. To assess the effects, if any, of the dry ash KVAR placement, it is necessary to also consider the effects of other sources of surface and groundwater on the receiving waters of Sawyers Swamp Creek. These include the residual effects of the previous wet slurry Kerosene Vale Ash Dam (KVAD), which is under the KVAR, seepage from Sawyers Swamp Creek Ash Dam, and to allow for other, non-ash related catchment inputs, including the local mineralised background conditions. The previous report (Aurecon, 2015) indicated that most of the leachates appearing in the local groundwater and in Sawyers Swamp Creek are from the pre-existing coal waste/chitter in the mine void beneath the Repository, rather than from the ash placement in the KVAD, or from rainfall infiltration through the KVAR into the KVAD. The 2014/15 report findings are in agreement with that of previous reports, which found that the Stage 1 and Stage 2 dry ash placements of the KVAR were not measurably affecting the groundwater quality, when assessed in the context of the local coal area mineral effects (Connell Wagner, 2008 and Aurecon, 2014, 2015). In addition, although seepage due to limited rainfall infiltration through the KVAR dry ash may have combined with seepage from the KVAD, beneath the KVAR, and entered Sawyers Swamp Creek, no significant effects on the creek receiving water quality has been indicated. Recently, the dominant water quality and flow effects of the Springvale Mine water discharge0F
1 has made the effects, if any, of seepage from the KVAD/R and Lidsdale Cut (before seepage diversion in July, 2012), as well as from the Sawyers Swamp Creek Ash Dam (SSCAD), essentially undetectable in Sawyers Swamp Creek (Aurecon, 2013, 2014, 2015). The 2014/15 report also noted that the Lidsdale Cut open-cut mine void is filled with coal waste/chitter because the mine void was back-filled with coal waste/chitter, as were other areas around Sawyers Swamp Creek (see Figure 3). It was suggested that an aluminium deposit in Sawyers Swamp Creek after heavy rainfall in May, 2012 did not originate from the pond in Lidsdale Cut, but from coal waste/chitter leachates previously placed over the wider area of Kerosene Vale. The reason for this view was that the aluminium concentration in the Lidsdale Cut pond did not increase until after the appearance of aluminium in the creek.
1 The Springvale Mine water discharge to Sawyers Swamp Creek was intermittent since 2009, increased in 2012 and has been continuous since 2013

Page 4
In recent years, it has been necessary to assess influences of the Springvale Mine water discharge of about 18 ML/day to Sawyers Swamp Creek, which was found to dominate the water quality in Sawyers Swamp Creek (Aurecon, 2014, 2015). The mine water discharge dilutes seepage from the Sawyers Swamp Creek Ash Dam (SSCAD) wall, such that the water quality in the creek reflects that of the mine water. The approach of assessing potential effects of the KVAR on surface and groundwater by taking into account the background conditions has been continued in the 2015/16 report.
1.1 Background In 2002, Delta Electricity (now EnergyAustralia NSW) obtained approval for conversion of the wet slurry ash (KVAD) placement process at Wallerawang Power Station to dry ash. The dry placement is called the Kerosene Vale Ash Repository (KVAR). Stage 1 of the placement was completed and capped in February, 2009. Approval was obtained for further placement in the Stage 2 Area at the KVAR in November, 2008. The Stage 2 Area placement began in April, 2009 and its second phase began in January, 2012. This placement was ongoing until cessation of operations in March, 2014. Two major issues related to the water quality in Sawyers Swamp Creek became evident in the 2013/14 report (Aurecon, 2014). EnergyAustralia NSW advised Aurecon that all the Springvale Coal mine water has flowed into the creek since 1st July 2013. This change occurred because the mine water was no longer required to be sent directly to the power station for cooling water, so the emergency Springvale Coal mine water discharge point to upper Sawyers Swamp Creek (LDP20, see Figure 2) was removed from the Wallerawang Power Station licence on 2nd August, 2012 and became part of the Springvale Colliery licence. This discharge meant that ash related seepage effects from the KVAR, KVAD and SSCAD, if any, on the water quality in Sawyers Swamp Creek became essentially undetectable, due to the large volume of Springvale Mine Water within the system. It also meant that the creek monitoring site, WX7, has been compromised as the overall receiving water site for the ash placement area. The other main issue at that time was that the Lidsdale Cut discharge to Sawyers Swamp Creek was stopped since July, 2012 in response to an aluminium incident in the creek, which was thought to originate from the Lidsdale Cut pond water quality, and by implication to seepage from the wet ash placed in the KVAD, beneath the KVAD, rather than from the naturally mineralised surrounding coal mine areas (see Figure 3, Section 2. Since then, the pond water has been pumped to the truck wash and then to the ash return canal (shown in Figure 1) and is treated at the station. These changes mean that the Lidsdale Cut pond has ceased to be part of the groundwater receiving waters for seepages from the KVAD/R area, and only the groundwater bore D5 has been considered since then as a groundwater receiving water site. The 2014/15 report noted that the groundwater levels in the KVAD had been drawn down, apparently by a general reduction in levels due to the combined effects of pumping water from Lidsdale Cut, together with the initial drawdown by earlier installation of subsurface drains shown in Figure 1. It was suggested that the increased concentrations of trace metals in the KVAD groundwater, as well as at bore D5, in recent years was related to the groundwater level decreases and resulting chemical changes in the coal waste/chitter that forms the KVAD void and its presence in the wider area of Kerosene Vale.

Page 5
The database from April, 2015 to March, 2016 has been included with that from previous years to examine changes since decommissioning and the current water quality and trace metal concentrations, including aluminium, in the KVAD groundwater, the KVAR groundwater bores, in Lidsdale Cut and influence of the groundwater inflows, SSCAD seepage and Springvale mine water on Sawyers Swamp Creek.
1.2 KVAD Subsurface Drains As a result of the placement of dry ash on top of the KVAD, groundwater from the KVAD rose up into the KVAR dry ash through cracks in the clay capping, so a subsurface drain was installed in October, 2010. A schematic of the seepage diversion system is shown in Figure 1. The subsurface drains lowered the groundwater level so it did not reach the dry ash, and seepage from the KVAD was collected and sent to Lidsdale Cut pond via the existing KVAD toe drains. Figure 1 also shows bores GW10 and GW11, which sample the groundwater in the KVAD, under the KVAR, on the western side. During 2011/12 the ground water level at bore GW10 was drawn down by about 1.5m following installation of the subsurface drains (Aurecon, 2014) and EnergyAustralia NSW advised Aurecon that GW10 bore was dry in 2014/15, apparently due to the additional effects of pumping water from Lidsdale Cut. Groundwater seepage flows are still occurring from the northern section of the KVAD wall to Sawyers Swamp Creek and water levels and water quality are sampled by piezometers AP9 and AP17 in that area (Figure 1). Most of this groundwater is directed to Lidsdale Cut by the toe drain pipes. In combination with the KVAD seepage diversion system, EnergyAustralia NSW also installed a new seepage collection and return system at the Sawyers Swamp Creek Ash Dam to minimise seepage from the ash dam into Sawyers Swamp Creek. The system commenced operating in May, 2010 returning seepage water from the ash dam seepage v-notch, the main seepage point (see Figure 1), and back to the SSCAD.

Page 6
Figure 1: Schematic of Kerosene Vale Dry Ash Placement Area Seepage Divers ion works

Page 7
1.3 Scope EnergyAustralia NSW advised Aurecon that, although Wallerawang Power Station had ceased operating, an annual water quality report is required for the NSW Planning and Environment’s Development Consent conditions for the KVAR, so Aurecon has been requested to undertake the surface and groundwater quality report for 2015/16. EnergyAustralia NSW has advised that they expect the EPA will require evidence that the KVAR during the decommissioning period has not significantly affected surface and groundwater in the area.
Accordingly, the study requires an update of the Kerosene Vale Ash Repository (KVAR) surface and groundwater database from April, 2015 to March, 2016. The groundwater monitoring results are to be assessed to determine any impacts on Sawyers Swamp Creek (SSC) due to groundwater seepage into the creek. This will involve undertaking an assessment of water quality effects of the KVAD which is beneath the KVAR, its effects on the water quality in Lidsdale Cut, and taking into account possible effects of leachates from coal waste/chitter in the Kerosene Vale area. In addition, the water quality effects of the SSCAD pond and the Lidsdale Cut pond on Sawyers Swamp Creek are to be assessed, as well as effects of the Springvale coal mine water discharges to the creek.
Clause 2.0 in the Scope requires the water quality data to be compared to the baseline data and against the baseline condition as assessed in the Environmental Assessment with the ANZECC 2000 – Freshwater Aquatic Ecosystems guidelines (95% PL) to be used as a reference point. However, previous Aurecon reports use locally derived guidelines for elements that are naturally elevated due to the mineralised nature of the area and use Freshwater Aquatic Ecosystems guidelines for mercury and selenium for the ANZECC (2000) required 99% PL. These were previously approved by Delta Electricity and are proposed to be used in the 2015/16 report. In addition, as previously approved by Delta Electricity, previous Aurecon reports, showed that the OEMP requirement to use the groundwater beneath the KVAR as the receiving waters is not relevant to the site, so the 2015/16 report is proposed to continue to use the receiving water sites set out in previous reports, including WX7 in Sawyers Swamp Creek, taking into account that it is affected by the Springvale coal mine discharge. Aurecon will endeavour to use the relevant parts of the OEMP in the assessment of the water quality data.
1.4 Aims and Objectives The aims and objectives of this report are to assess the effects of the decommissioned KVAR with the understanding that the power station has been decommissioned and that the Lidsdale Cut water is being pumped to the return canal.
One of the primary objectives of the design and operation of the KVAR is to have no adverse impact on the local ground or surface water quality. More specifically, this means that leachates from the dry ash placement should not increase concentrations of the various water quality characteristics in the receiving waters by more than the locally derived guidelines (based on the 90th percentile of the background, pre-placement sites) or the ANZECC (2000) guidelines for protection of aquatic life, whichever is higher. As noted in all the reports since 2008, the ANZECC (2000) guideline approach of assessing the likely impact of water quality and trace metals in the seepages from the KVAR and KVAD on the receiving surface and groundwater was continued to be used in this report. This included local guidelines for some elements, due to the effects of mineralisation (coal bearing strata and coal wastes/chitter) in the

Page 8
ash placement area. The ANZECC (2000) guideline default trigger values and the locally derived guidelines are shown in Table 1, Section 2.7.
1.5 Previous Report Aurecon (2015) undertook the 2014/15 annual water quality report, to May, 2015, for assessment of potential effects, if any, of the Kerosene Vale Ash Repository (KVAR) dry ash placement on the local surface and groundwater. The assessment included the effects of seepage diversion from the previous wet ash placement in the KVAD, located under the KVAR, on Sawyers Swamp Creek. The assessment found no likely effects on surface and groundwater quality of the KVAR. This finding is consistent with that from previous reports and the predictions of the Stage 2 Environmental Assessment on the basis of limited rainfall infiltration into the dry ash placement. In addition, the 2014/15 report found that the sub-surface drains and diversion of the Lidsdale Cut discharge from Sawyers Swamp Creek to the return canal by pumping of water from Lidsdale Cut caused groundwater level decreases, which revealed that the KVAD, beneath the KVAR, contained mainly leachates from the pre-existing coal waste/chitter in the mine void. Accordingly, it was likely that there were no significant effects of the KVAR or the KVAD on the local surface or groundwater (including Lidsdale Cut) by ash related leachates. Coal waste/chitter leachates, including aluminium, were also found to be present in the Lidsdale Cut pond water. In relation to the Lidsdale Cut seepage, it was suggested (Aurecon, 2014 and 2015) that the increased aluminium and trace metals in Sawyers Swamp Creek in May, 2012, shortly after the February/March, 2012 flood, originated from the local coal mine groundwater or coal waste/chitter in the area and was unlikely to be related to the KVAR or KVAD.
1.6 Information provided by EnergyAustralia NSW In connection with the assignment, EnergyAustralia NSW has provided copies of:
• Surface and groundwater quality data from April 2015 to March, 2016, including water quality data collected in Sawyers Swamp Creek from upstream and downstream of the SSCAD spillway and v-notch and at the receiving water site, WX7
• Groundwater quality and levels in the SSCAD and KVAD seepage detection bores • Groundwater quality and levels in the KVAD at bores A9, A17 and GW10 and GW11 as well
as the groundwater flow rate (litres/minute) in the KVAD toe drain into Lidsdale Cut • Water quality data from the SSCAD pond to define the pond water quality • Water quality data from the Lidsdale Cut pond • Background surface and groundwater data • Relevant Lend Lease Infrastructure (LLI) KVAR management reports and water quality data in
runoff collection ponds • Relevant information on the status of the non-operating power station that may affect the local
water quality conditions • Location of any new water quality sampling sites established as part of the decommissioning
studies for the power station • Relevant correspondence with EPA on the water quality expectations in Sawyers Swamp
Creek.

Page 9
1.7 Data Quality The data contained in this report was provided by EnergyAustralia NSW. The data was checked for outliers using the ANZECC (2000) protocol. In accordance with the protocol, outliers of three times the standard deviation from the mean were removed from the dataset, provided that no environmental changes had occurred that could account for such a significant change. Outliers have an asterisk next to the data in Attachment 2, thereby stopping the result from being used in statistical analyses by Excel. As the database covers a long period of observations, it is likely that apparent changes in concentrations for trace metals such as silver, cadmium, chromium, copper and mercury may in fact be due to changes in the accuracy or detection limits of the analytical techniques used. The OEMP requires the existing monitoring program to continue, with the addition of low detection limit analysis for trace metals (to ensure that the detection limit is lower than guideline values). All of the metals tested, except for silver, met these criteria. As the laboratory has not been able to test at the required detection limit, and in the absence of any reason to suppose that silver might be an issue in this case, it is suggested that silver be removed from the sampling program. Note that some of the data provided had concentrations recorded as less than the detection limit. If the detection limit was less than ANZECC (2000) guideline concentration, it was determined that there was no reason to alter the concentration, so the < sign was removed to allow the spreadsheet to use the data. If the detection limit was higher than the ANZECC (2000) guideline, the concentration was halved.
1.8 Structure of the Report Section 2 describes the surface and groundwater monitoring program and the ANZECC (2000) and locally derived guideline trigger values. The assessment of the KVAR on surface and groundwater is shown in Section 3. The estimated effects of the KVAD is shown in Section 4 and the Sawyers Swamp Creek Ash Dam surface and groundwater effects is presented in Section 5.

Page 10
2. Surface and Groundwater Quality Monitoring This Section provides an overview of the groundwater levels and surface and groundwater quality monitoring at the KVAR used for assessment of effects, if any, of leachates on the local surface and groundwater quality. The water quality sampling sites are shown in Figure 2. Due to the inputs from the KVAD, which has the long-held wet ash placed in a coal mine void, containing coal waste and chitter in the bottom of the void, as well as from the local mining activities in the area (Figure 32 F
2), the assessment takes into account the background conditions and provides the locally derived and ANZECC (2000) guideline trigger values, which apply as assessment criteria to the receiving waters. The discharge of Springvale Mine water to Sawyers Swamp Creek has also been taken into account.
2.1 Monitoring Design for Differentiation of Water Quality Sources As the KVAR is a dry ash placement with compaction of the ash to minimise rainfall infiltration, the effects on the surface and groundwater quality at the receiving water sites should be, and has been shown to be limited. Due to the KVAR being located in a mineralised area, the assessment of effects has been by examination of the residual effects after allowing for the effects of the mineralised inputs. These inputs are the local coal mine voids containing coal waste/chitter, the KVAD imbedded in its void and Lidsdale Cut void groundwater seepage into Sawyers Swamp Creek. In addition to these inputs, is the SSCAD seepage to the creek. The water quality monitoring is undertaken to ascertain whether the local/ANZECC (2000) guidelines (as applicable) are met in the groundwater receiving water bores D5 and D6 and in Sawyers Swamp Creek at the final surface water receiving water site, WX7 (see Figure 2). The results of the monitoring are to enable contingency actions and investigations to be initiated in a timely manner if these limits are approached.
2 Note that the mine area plan shown in Figure 3 was provided without a legend so the areas have been described in the Figure name based on discussions with EnergyAustralia NSW.

Page 11
Figure 2: Surface and Groundwater Monitoring Sites for Sawyers Swamp Creek Ash Dam and Kerosene Vale D ry Ash Placement Area

Page 12
Figure 3 shows coal mine voids containing coal waste/chitter. The void under the KVAD was filled with ash and then capped and the dry ash KVAR placed on top. The Lidsdale Cut open-cut mine void was filled with coal waste/chitter and only a small pond was left to collect local groundwater and the KVAD groundwater seepage via a toe drain. It is considered likely that coal waste/chitter was placed historically over the whole Kerosene Vale area.
Figure 3. Location of original Kerosene Vale Ash Da m open-cut mine void used to store ash (hashed to right), Lidsdale Cut open-cut mine void filled with coal waste/chitter (hashed to left) and north of the Sawyers Swamp Creek: Centennial Co al surface coal emplacement on top of filled open-cut mine (hash to right, bordered by co al waste/chitter filled open-cut hashed to left) and plan of underground coal mine workings
2.2 Groundwater Monitoring Piezometers installed in the Stage 2 area of the KVAR measure the amount of rainfall infiltration, accumulating above the KVAD clay capping. The previous report found that some rainfall infiltration was occurring but the piezometer bores are too small to sample for water quality and trace metals, so assessment of the potential effects on the local groundwater and surface water receiving waters had to be estimated (see Section 3). To allow for the effects of various local sources of groundwater flowing under the KVAR into the KVAD and SSCAD areas, the up-gradient bores (WGM4/D1 and D2) are used as background. The down-gradient bores (WGM4/D3 and D4) are located for detection of the SSCAD seepage. Figure 6 indicates that the groundwater at bore D4 mainly flows to Sawyers Swamp Creek. However, as the

Page 13
groundwater seepage is expected to be slower than that from the much higher hydraulic head in the SSCAD, the SSCAD seepage effects on the creek, if any, would be expected to override any groundwater effects.
Bores WGM4/D5 and D6 are the seepage detection bores for the KVAD, as well as potential for rainfall infiltration and surface runoff from the KVAR to enter and mix with the KVAD groundwater seepage. It is understood that surface runoff from the KVAR is contained on site and in unlined collection ponds (see Section 2.4), so the potential for effects of the KVAR are for limited amounts of surface water to seep into the KVAD beneath the KVAR. These down-gradient bores also sample the combined effects of the local coal mine up-gradient inputs as well as those from the SSCAD and the KVAD and the KVAR. Details of the monitoring design were set out in Aurecon (2012).
2.3 Surface Water Monitoring The surface water monitoring sites comprise:
• Lidsdale Cut (WX5), which discharged to Sawyers Swamp Creek until July, 2012
• The final receiving water site, WX7, in Sawyers Swamp Creek, which is downstream of Lidsdale Cut and the local background site, WX11, in Dump Creek and upstream of the junction with Sawyers Swamp Creek and the upper Coxs River (Figure 2).
Site WX5 samples the Lidsdale Cut pond which receives groundwater inflows from the local coal mine open-cut, surface runoff and the KVAD toe drains. EnergyAustralia NSW has advised Aurecon that sampling the water quality in the Lidsdale Cut pond from July, 2012 to September, 2013 was not undertaken due to drawdown of the void water level by the pumps that direct the water to the return canal. Sampling of the pond recommenced in October, 2013. 2.3.1 Sampling in Upper Sawyers Swamp Creek Due to the discharge of mine water from the Springvale Coal Mine into Sawyers Swamp Creek, EnergyAustralia NSW began monitoring at the following five sites in the creek, which are shown as the green squares in Figure 2. The sites are:
• upstream of the SSCAD (site 92) • at the SSCAD spillway (site 225) • where the SSCAD v-notch seepage previously entered the creek (EnergyAustraliaNSW has
advised that the seepage is now pumped back to the return canal) – site 79 • downstream of the v-notch (site 93) • Downstream of KVAD (site 83).
These data, together with the routine, long-term Sawyers Swamp Creek data collected by EnergyAustralia NSW at the receiving water site, WX7, were used to identify any further changes, above that found in the previous report in water quality in Sawyers Swamp Creek as a result of the many changes mentioned above. The monitoring data are shown in spread-sheet format in Attachment 2, including the minimums, maximums, means and post-dry ash median as well as the estimated baseline (pre-placement 90th percentile) and environmental goal concentrations. The data for the current reporting period from April, 2015 to March, 2016 is included with that from the previous report from 2013 to March, 2015 so the

Page 14
changes that have taken place can be seen in one report. The 2015/16 data are also summarised in Tables in the body of the report.
2.4 KVAR Site Monitoring and Runoff Management Rainfall runoff from the KVAR dry placement area is collected by an ash perimeter drain which directs the runoff to a Collection Pond in the south-eastern corner of the Stage 1A area, as well as a more recent pond to the north-east of the Stage 2 area (Figure 2). It is understood that water pumped from the Lidsdale Cut pond water is directed to the south-eastern corner Collection Pond where it joins the KVAR runoff water. This water is understood to be returned to the power station and treated in the caustic injection plant. It then can be discharged to the Coxs River or pumped back to the SSCAD. It is also understood that some of the collected runoff water is reused for dust suppression by spraying on the dry ash deposit. The collection ponds are normally kept at a low level by pumping water to the power station return canal to prevent it from spilling into Sawyers Swamp Creek (Figure 2). EnergyAustralia NSW’s contractor for ash placement at the KVAR, Lend Lease Infrastructure has installed piezometers at the site for sampling the groundwater height of groundwater infiltration which accumulates above the clay capping on top of the KVAD. The previous report noted that some piezometers in the KVAR Stage 2 area showed groundwater levels above that of the clay cap, which indicated rainwater infiltration. However, the piezometer bores were too narrow to be sampled for water quality, so the assessment of the potential effects on seepage to Sawyers Swamp Creek, leaking through cracks in the clay cap into the KVAD groundwater, as well as the local groundwater, was undertaken by estimation of the rainfall infiltration, as described in Section 3.1. The bores GW10 and GW11 and AP9 and AP17, shown in Figure 2, sample the groundwater in the KVAD beneath the KVAR. The data from these bores, together with the local groundwater monitoring, as well as surface water quality monitoring in Sawyers Swamp Creek, was used to assess the surface and groundwater quality at the receiving water sites. The assessment was undertaken for the conditions of no surface discharge from Lidsdale Cut to Sawyers Swamp Creek and the Springvale Mine water discharge as the main flow in the creek.
2.5 Tracers for Dry Ash leachates As mentioned in previous reports, the main trace metals and elements of interest in the rainfall runoff from the KVAR ash placement area are selenium, sulphate, boron, nickel and zinc. The background conditions in Sawyers Swamp Creek, upstream of the SSCAD at site WX1 (also known as site 92, see Figure 2) shows that aluminium is naturally elevated in the area. The ANZECC (2000) guideline trigger value is 0.055 mg/L for slightly to moderately disturbed systems but averaged 0.37 mg/L prior to the continuous discharge from Springvale since August, 2012 and averaged 1.37 mg/L during 2014/15 (Attachment 2, Section 7), so it has not been used as a tracer for the dry ash placement. However, as mentioned above, aluminium concentrations in Lidsdale Cut, the KVAD and in the local groundwater bores, as well as in groundwater at KVAR have been examined to determine the source of aluminium that appears occasionally in Sawyers Swamp Creek after heavy rainfall events. The elements used as ash leachate tracers, except selenium, are also present in the local mineralised coal geology of the area and are mainly due to the placement of mine spoil and chitter in the catchment. Chitter contains pyrites, which release sulphate and trace metals into the local groundwater and surface

Page 15
waters. Hence, selenium is used here as a tracer of the direct effects of the KVAR, as well as the previous wet ash systems in the KVAD and SSCAD on the local surface and groundwater. Long-term trends in surface and groundwater quality generally use conductivity to trace salinity effects, which in the mineralised area, tends to follow that of sulphate. Sulphate and boron trends are used to show changes due to coal mining activities and selenium concentrations are used as an indicator of flyash management effects. Selenium concentrations are examined for trends if they consistently exceed the ANZECC (2000) guideline of 0.005 mg/L. Boron is used to monitor the effects of coal mining activities and can be used to represent potential effects of other trace metals.
2.6 Groundwater Levels The water levels in the groundwater bores inside the KVAD (AP9, AP17 and GW11, note that GW10 is dry), as well as at the receiving water bores D5 and D6 (between the KVAD and Lidsdale Cut) are monitored to allow identification of seepage from the KVAD. Bores WGM1/D5 and D6 are situated down-gradient of the ash placement and up-gradient of the Lidsdale Cut to provide early detection of leachates from the KVAR placement area. Effects of the KVAR on groundwater level changes at these bores are also monitored. The bores up-gradient of the KVAD are used to define the concentration of dissolved elements and the direction of water movement in the areas from up-gradient of the ash placement areas to Lidsdale Cut. Their interaction with the groundwater under the dry ash placement and inside the KVAD are shown in Figure 6, Section 4.4. The groundwater level data are also used to monitor any rainfall infiltration accumulating above the clay capping in the KVAR, as well as confirming that the groundwater level in the KVAD is not reaching the dry ash placement above it since the subsurface drains were installed.
2.7 Climatic Conditions
The average annual rainfall at the Lithgow gauge over the period of KVAR ash placement from 2003 to March, 2016 decreased from 770 mm/year in 2014/15 to 741 mm/year (Attachment 1), which is 86% of the long-term average annual rainfall of 863 mm/year. During the period April, 2015 to March, 2016, the monthly average rainfall was only 61.8 mm/month and was below the long-term average of 72 mm/month every month, except during April, 2015 and January, 2016 when high rainfall events occurred of 184 and 167 mm, respectively. Since the Stage 2A placement began in April, 2010, there has been a series of wet summers due to above average rainfall events. The most recent occurred in February/March, 2012 with a total of 342 mm, February/March, 2013 (total of 297 mm), 299mm in December and January, 2015 and 270mm in summer 2015/16 while the 2014 summer was relatively dry (see Attachment 1).
2.8 Methods Routine surface and groundwater water quality monitoring in the area is undertaken monthly on behalf of EnergyAustralia NSW by Nalco Analytical Resources who measure conductivity, pH and temperature in the field with a calibrated instrument.

Page 16
In house methods3F
3 based upon Standard Methods (APHA, 1998) are used for the general water quality characteristics of alkalinity, sulphate, chloride, calcium, magnesium, sodium, potassium, total dissolved solids (TDS) and total suspended solids (TSS, also known as non-filterable residue, NFR). The trace metals and elements monitored are the same for surface and groundwater: copper, cadmium, chromium, lead, zinc, iron, manganese, mercury, selenium, silver, arsenic, barium, boron and fluoride. Molybdenum, nickel and beryllium have been monitored since July, 2007 but beryllium was stopped in April, 2010 and aluminium has been monitored since July, 2010.
EnergyAustralia NSW has advised that the in-house methods are equivalent to those specified in DEC (2004), which also uses Standard Methods. (In this regard, it is relevant to note that the groundwater and Sawyers Swamp Creek monitoring is not required under the POEO licence). Trace metals were unfiltered, except for iron and manganese.
Groundwater bores are bailed and sampled after allowing time for the water level in the bore to re-establish. The depth to the water level from the top of the bore pipe is measured using a dip meter and the water surface elevation is calculated to AHD(m) after allowing for the pipe height.
Since April, 2006 the detection limits (DL) for routine monitoring of most trace metals tested were lower than the ANZECC (2000) guidelines (Table 1). Particular attention has been directed at the trace metals arsenic, cadmium, chromium, copper, mercury, nickel and lead, as well as the trace element selenium, which have been analysed with a low detection limit. However, due to sample matrix interference, silver has continued to be analysed above the ANZECC guideline trigger value of 0.00005mg/L since November, 2001 (see Attachment 2).
2.9 Guidelines As used in previous reports since 2008, the principle of the ANZECC (1995) guidelines for protection of groundwater, where the potential future use of the water resource is considered, has been taken into account. In this regard, the Irrigation, Ecosystem and additional guidelines for protection of livestock or drinking water has been used, where appropriate, to provide a wider context of the ANZECC (2000) guidelines, to define acceptable ambient water quality at the KVAR Stage 2 receiving water sites. The ANZECC Guidelines for Groundwater Protection in Australia (1995) and the NEPC (1999, update in May, 2013) require the background water quality in groundwater bores to be taken into account. As the NEPC (1999), and the updated 2013 version, did not define the meaning of “background” concentrations for groundwater, the baseline concentrations were continued to be defined as the 90th percentile of the pre-placement concentrations, or the ANZECC guideline default trigger values, whichever is higher. Use of the background 90th percentiles is taken from the ANZECC (2000) guideline procedure for condition 3, highly modified catchments, which generally occur in mineralised areas.
Local guidelines are based on the ANZECC (2000) guideline approach of estimating local guidelines using the 90th percentile for naturally mineralised, highly disturbed groundwater. Hence, the background 90th percentiles that are higher than the default trigger values, are used as the local guidelines. The local and ANZECC guideline trigger values used are called the Environmental Goals and are shown in Table 1.
The groundwater background concentrations use the pre-placement data from the background bore, WGM1/D2, and elevated concentrations at the seepage detection bore WGM1/D5 and Lidsdale Cut
3 Nalco has NATA accreditation Number 1099 and accredited for ISO/IEC 17025

Page 17
(WX5) were also taken into account. The surface water background concentrations use the pre-placement data at Dump Creek, WX11, which is the local background for the mineralised area. The pre-KVAR data at WX7 was also taken into account. The 90th percentile baseline concentrations for all the water quality characteristics monitored are shown in bold in Table 1.
As discussed in Section 2.1, the surface water guideline goals apply to the receiving waters of Sawyers Swamp Creek at WX7 (Figure 1). The groundwater goals apply to the seepage detection bore WGM1/D5, but not Lidsdale Cut (WX5) since July, 2012 (see Section 4.5), and these are used for early warning of potential effects on the Sawyers Swamp Creek receiving waters. These goals are used for assessment of the Stage 2 effects in this report. In recent times, the level of groundwater in bore D5 has decreased due to lowering of the groundwater under the KVAR by the toe drains and sub-surface drains and sample collection has been limited at times (see Section 4.4). Aluminium is not included in Table 1 due to the elevated concentrations in the 90th percentile of 5.7 mg/L at background groundwater bore WGM1/D1, which is located up-gradient of the SSCAD, and lack of KVAR pre-placement data to establish a baseline at bores D5 and D6. The source of aluminium in Sawyers Swamp Creek is investigated in Section 4.3 in relation to the water quality changes that have occurred in Lidsdale Cut since pumping began. A hydrological flow chart which explains how the various flows and discharges enter Sawyers Swamp Creek and the local groundwater is shown in Figure 6, Section 4.

Page 18
Table 1: Pre-dry Ash Placement Water Quality Baseli ne 90th Percentile at Background and Receiving Water Sites and resulting Guidelines or Goals for KVAD/R Groundwater, Lidsdale Cut and Sawyers Swamp Creek
Groundwater Surface Water
Element
(mg/L)
Background
Groundwater
(WGM1/D2)
KVAD & KVAR
Groundwater
(WGM1/D5)
Lidsdale Cut
(WX5)
Dump Creek
(WX11)
Sawyers Swamp
Creek (WX7)
Pre-
Placement
(1988-2003)
90th Percentile
Pre-Placement
(1988-2003)
90th Percentile
Pre-Placement
(1992-2003) 90th
Percentile
Groundwater
Guidelines#
or Goals
Pre-
placement
(1991-2003)
90th Percentile
Pre-placement
(1991-2003) 90th
Percentile
Surface Water
Guidelines# or
Goals
pH 5.4 4.5 6.9 6.5 – 8.0 8.0 7.6 6.5 – 8.0
Cond/
(µS/cm) 310 810 952 2600^ 770 760 2200
TDS 258 550 650 2000++ 772 584 1500^
SO4 61 328 359 1000 325 323 1000 ++
CI 48 24 34 350 39 27 350 +
As <0.001 0.008 <0.001 0.024 <0.001 <0.001 0.024
Ag <0.001* <0.001* <0.001* 0.00005 <0.001 <0.001* 0.00005
Ba 0.114 0.148 0.054 0.7 0.050 0.043 0.7 +++
Be - 0.006 - 0.1 - - 0.1
B 0.10 1.7 2.16 1.7 1.45 2.33 1.25
Cd 0.001 0.004 <0.001 0.001 <0.001 <0.001 0.0015
Cr 0.041 0.041 <0.006 0.004 <0.001 <0.001 0.005
Cu 0.010 0.058 <0.005 0.005 0.002 <0.007 0.005
F 0.28 0.65 1.99 1.5 1.1 1.1 1.5+++
Fe 1.7 14.7 0.7 1.7 2.38 0.507 0.3+++
Hg <0.0007* <0.0006 <0.0002* 0.00006 <0.0002* <0.0002* 0.00006
Mn 0.44 2.5 2.12 1.9 1.94 0.829 1.9
Mo - - - 0.01 - - 0.01 +
Ni 0.031 0.137 - 0.137 - - 0.05
Pb 0.010 0.021 0.004 0.01 <0.001 0.003 0.005
Se <0.001 0.001 0.001 0.005 0.003 0.003 0.005
Zn 0.114 0.505 0.304 0.505 0.28 0.153 0.153

Page 19
Notes:
* Detection limit used was higher than ANZECC guidelines; Concentrations highlighted in blue to indicate sampling sites with elements higher than
the locally derived or ANZECC guidelines
^ ^ Groundwater conductivity derived from TDS 90th percentile of 2000 mg/L TDS/0.77; Creek TDS derived from 0.68 x 2200 µS/cm, which is the
ANZECC (2000) low land river conductivity for protection of aquatic life
# ANZECC (2000) guidelines for protection of freshwaters, livestock or irrigation water.
Cadmium, Chromium, Copper, lead, nickel and zinc adjusted for effects of hardness: Ca, Mg in WGM1/D5 22.3, 29.0 mg/L: in Sawyers Swamp
Creek 51.6, 38.0 mg/L, respectively
Note: Chromium guideline is 1 ug/L for CrVI and adjusted for hardness effect
Local guidelines using 90th percentile of pre-dry placement data in bold (Note: Fe guideline of 0.3 mg/L only marginally lower than
WX7 90th percentile so used ANZECC (2000) guideline
+ Irrigation water moderately tolerant crops; irrigation. Note: Molybdenum drinking is 0.05 mg/L
++ Livestock
+++ drinking water
As set out in Connell Wagner (2008), the adoption of the surface water conductivity guideline of 2,200µS/cm shown in Table 1 was based on the background Dump Creek site, WX11, and the Sawyers Swamp Creek receiving water site, WX7, both having 90th percentile conductivity of more than twice the ANZECC (2000) guideline default upland river trigger value of 350 µS/cm (upland rivers are defined as above 150m altitude). The 90th percentile concentration at the Dump Creek site demonstrates that this was caused by local mineralisation effects, so use of the upland value was not considered appropriate. As a result, the higher ANZECC (2000) lowland (altitude below 150m) river conductivity trigger value of 2,200 µS/cm was used for protection of aquatic life in Sawyers Swamp Creek (Connell Wagner, 2008). This approach has proven to be appropriate because the background conductivity at WX11 increased to about 1400 uS/cm in the 2010/12 reporting period, apparently due to diffuse effects of coal mining activities in the area (Aurecon, 2012). Although the background groundwater bore, D2, 90th percentile conductivity was lower than the upland river trigger value of 350 µS/cm, the pre-dry ash placement 90th percentiles at the KVAD groundwater bore D5, as well as the Lidsdale Cut conductivities, were higher than in the creeks. As groundwater seepage into Sawyers Swamp Creek would be slow, use of the creek trigger value was not considered appropriate for groundwater. Hence, the approach adopted was the ANZECC (1995) guidelines for protection of groundwater, where the potential future use of the water resource is taken into account. As shown in Table 1, the livestock drinking water guideline for salinity, of 2,000 mg/L TDS, was considered relevant to the assessment of groundwater in the area, should the groundwater be used for watering livestock in the future (Connell Wagner, 2008). The TDS was converted to the conductivity local trigger value of 2,600 µS/cm by dividing by the conversion factor 0.77, which was derived from the measured groundwater conductivity and TDS.

Page 20
2.9.1 Receiving Waters As discussed in Section 2.1 and Aurecon (2012), the following receiving water sites for assessment of ash leachate effects from the KVAR dry ash placement were identified:
• Groundwater bore WGM1/D5
• Lidsdale Cut (sampling site WX5)
• Sawyers Swamp Creek at site WX7.
However, as explained in Section 1.1, WX5 and WX7 have ceased to be receiving water sites in this report due to blocking of the Lidsdale Cut discharge (WX5) and its pumping to the return canal, and the dominant effects of the Springvale coal mine discharge on Sawyers Swamp Creek water quality (WX7). This only leaves bore D5 as the receiving water site, so the following provides clarification of how the receiving water site is used to assess effects of the SSCAD and KVAR. With the various collection systems in place, bore WGM1/D5 represents the groundwater receiving water site for seepage from the KVAD/R that was not collected by the KVAD toe drains or the KVAR sub-surface drains that are directed to Lidsdale Cut via the KVAD toe drains. Consequently, the groundwater quality at bore D5, has continued to be used for early warning of potential effects of groundwater on the water quality in Sawyers Swamp Creek, if the Springvale mine water flow was to cease in the future. However, due to the large changes that have taken place, the current assessment of effect of the KVAR on surface and groundwater has been undertaken by a direct method by estimating the rainfall infiltration through the dry ash and the effects of the resulting seepage on Sawyers Swamp Creek with no Springvale mine water flow (see Section 3). Section 3 also assesses the effects of the KVAR leachates on the groundwater at bore D5. A similar approach has been used to assess the effects of the KVAD seepage on bore D5, as well as its effects on Sawyers Swamp Creek with no Springvale mine water flow in Section 4. As EnergyAustralia NSW has begun routine monitoring of the water quality in the upper Sawyers Swamp Creek where it flows through the coal measures upstream of the KVAR, changes in surface water quality at WX7 were assessed by comparison with these upstream sites, as well as the catchment background water quality in Dump Creek at WX11. 2.9.2 Early Warning of Water Quality Changes An early warning of changes in water quality that may potentially approach the relevant local guidelines set out in Table 1 is required for the ash repository management to allow time for investigations of the causes of changes and controls to be implemented if necessary. The approach used is the ANZECC (2000) guideline procedure for developing triggers for investigations of the cause of changes, and possible management actions. This approach involves comparing the 50th percentile (median) in receiving waters with the 90th percentile of the background or pre-KVAR water quality at the receiving water sites. An early warning of changes is signalled when the post-placement 50th percentile exceeds the pre-placement 90th percentile water quality conditions. This approach is supplemented by the use of Control Charts to show concentration changes relative to local/ANZECC trigger values and the 90th percentile pre-KVAR conditions.

Page 21
These procedures are applied to each down-gradient groundwater bore, the Lidsdale Cut (until July, 2012) and Sawyers Swamp Creek at WX7 to assess long-term changes that are approaching the local/ANZECC trigger values.
2.10 Control Charts In previous reports, the long-term plots of the water quality data were used to allow the identification of trends against the baseline and environmental goals. The trends are tracked using Control Charts (APHA Standard Methods, 1995 and ANZECC guidelines for Monitoring and Reporting, 2000) and the significance of any changes is determined by comparison with the criteria of pre-placement 90th percentiles, post-placement medians, ANZECC (2000) guidelines or local guidelines. Due to Springvale mine water discharge, the ANZECC guidelines cease to apply to the receiving waters of Sawyers Swamp Creek. In addition, pumping of the water from Lidsdale Cut has been found to affect the water quality in the seepage detection bore D5, so the recent changes are shown in relevant tables in the report, as well as some of the changes by control charts. The data are summarised in Tables in this report, or in spreadsheet format in Attachment 2, including the minimum, maximum and mean as well as the 90th percentile baseline, median post-placement, ANZECC guidelines and local guideline concentrations.

Page 22
3. Review of Groundwater Quality This Section reviews the groundwater quality during 2015/16 at the KVAR/KVAD. The approach taken for the 2015/16 assessment is to review the groundwater quality at:
• Bores sampling the groundwater in the long-held wet ash in the KVAD (AP9, AP17, GW11) and the KVAD north and western seepage points
• Seepage detection bores MPGM4/D5 and D6 • The Lidsdale Cut pond.
The review of this data took into account the water quality at the background bores D1 and D2, as well as effects of seepage from the SSCAD on its seepage detection bores D3 and D4, which are part of the background for the KVAR/KVAD. As indicated in Sections 1 and 2, significant changes during 2015/16 that could not be accounted for have been examined to see if they influence the previous report findings of no significant effects of the KVAR. That is, the groundwater quality is compared with that in 2014/15 to confirm that the effects of the KVAR/KVAD, summarised from the previous report in Section 3, have remained essentially unchanged. Review of the 2015/16 data begins with changes in the groundwater levels in the various bores as they determine the direction of groundwater flows in the area.
3.1 Groundwater Level Changes and Flow Directions Figure 4 shows an overall long-term trend for groundwater elevation changes at the receiving water bores D5 and D6 down-gradient of the KVAD ash placement, compared to the background bores and those up-gradient of the KVAD. Changes in groundwater levels have been relatively small since before dry ash placement began in 2003, but with increased variability in recent years, even at the background bores D1 and D2 up-gradient of the SSCAD. The greatest variability has been for bore D5 in recent years with the level decreasing to be the same as at bore D6 during dry weather, and often having no groundwater in the bore. The increased variability appears to be due to the prolonged period of below average rainfall since 2012 with intermittent high rainfall events (Attachment 1).

Page 23
Figure 4. Long-term Groundwater Elevation changes at background bores W GM1/D1 and D2 and SSCAD seepage detection bores D3 and D4 compared to receiving water bores D5 and D6 down-gradient of the KVAD/R ash placement area (vertical line indicates pumping from Lidsdale Cut began June, 2012) The groundwater flow directions are used to help explain why groundwater quality changes occur in the groundwater under and around the KVAD/R, as well as potential effects of seepage into Sawyers Swamp Creek. Figure 6 shows the indicative KVAD seepage flow paths to the KVAD toe drains and toward the low point of the Lidsdale Cut. Seepage from the KVAD, under the KVAR that is intercepted by the toe drains, is also shown. Any seepage that is not collected by the subsurface drains or the toe drains is shown as flowing to the local groundwater. Following installation of the subsurface drains in 2010 and pumping of the water from the Lidsdale Cut pond from June, 2012, the groundwater at bore GW10, in the south-west of the KVAD, has become dry (Aurecon, 2015). In addition to the subsurface drain effects, it appears that pumping of the groundwater out of the Lidsdale Cut pond is drawing down the surrounding groundwater levels, as seen in Figure 5 at Bore D5, which is near the open-cut area that forms the Lidsdale Cut.
3.2 Groundwater Quality changes at Background Bores and SSCAD Seepage Bores
To understand groundwater quality changes, if any, at the KVAR/KVAD and bore D5 and D6 that have occurred since 2014/15, it is necessary to examine changes at the background bores, D1 and D2, as well as at the SSCAD seepage detection bores D3 and D4. The SSCAD dam wall seepage that does not enter Sawyers Swamp Creek, but flows under it, is shown as flowing to the local groundwater sampled by bore D3 in Figure 6. These inflows are from the ash dam pond flowing under the ash dam wall due to hydrostatic pressure of the water height stored in the pond.

Page 24
Table 3 shows there were no significant changes at the background bore D2. At bore D3, all the water quality and trace metals, except for iron had concentrations lower than the ANZECC/Local groundwater trigger values, while pH was acidic at 5.6. Bore D4 had similar low concentrations but iron and manganese were much higher than the guidelines and boron was marginally higher than its guideline. The pH was slightly acidic, but less so than at D3. There were no significant changes in water quality at both bores since 2014/15 relative to the ANZECC/Local groundwater trigger values. The groundwater inflows from the northern end of the dam wall are mostly from the v-notch seepage point. Flows not collected and pumped back to the ash dam from the seepage collection pond, or those that enter Sawyers Swamp Creek, are sampled by bore D4. The groundwater quality at D4 was originally thought to be from the ash dam, but since 2014 the salinity in the ash dam pond has decreased to be lower than in D4 (Aurecon, 2015). This is confirmed in 2015/16 in Table 3. Hence, it appears likely that some groundwater from outside the wider area of the ash dam pond, possibly from under the nearby escarpment, is influencing the salinity at bore D4. Other than the historically high iron and manganese concentrations at D4, there were no trace metals showing significant increases in 2015/16 and all the other characteristics were lower than the ANZECC/Local groundwater trigger values. From these observations, it is clear that the seepage from the SSCAD to the groundwater at the seepage detection bores up-gradient of the KVAD/R areas are not the source of the elevated concentrations of sulphate, boron, nickel and zinc at bore AP17 at the KVAD north wall, or sulphate, boron, cadmium, copper, nickel and zinc at the KVAD south-western seepage (site 94) or at bore D5 (Table 4 in Section 4.3).

Page 25
Table 3: Water Quality for SSCAD Seepage detection Groundwater bores WGM1/D3 and D4 during Stage 2 to 2014/15 and the decommissioned KV AR period compared to the Groundwater Background bore D2, Bore D4 90 th Percentile Baseline and Groundwater Guidelines or Goals
Element
(mg/L)
SSCAD Seepage Affected Bores Back-
ground
(April, 2015
to March,
2016)
D4 Baseline
(Pre-Stage I
90th
Percentile)
ANZECC
Guideline
Goals for
Ground-
water
Stage 2A Post-
placement
(April, 2010 to
January, 2012)
Stage 2 Post-
placement
(February, 2012 to
March, 2013)
Stage 2 Post-
placement (April,
2014 to March,
2015)
Decommissioned
KVAR (April, 2015
to March, 2016)
D3 D4 D3 D4 D3 D4 D3 D4 D2 D4
pH 5.9 5.8 6.1 5.7 5.8 5.9 5.6 6.2 4 6.8 6.5-8.0
Cond
(µS/cm) 746 1500 540 1500 668 1658 637 1548 486 728 2600
TDS 450 1200 330 1200 403 1358 373 1186 292 510 2000
SO4 115 770 68 770 153 849 155 757 160 201 1000
Cl 105 33 66 35 74 45 67 32 26 45 350
Al 0.12 0.05 0.2 0.03 0.21 5.25
As 0.001 0.002 0.002 0.002 <0.001 0.024
Cd 0.0002 <0.0002 0.0001 <0.0001 <0.0002 0.001
Cr 0.001 <0.001 0.001 0.001 0.001 0.004
Cu 0.002 0.001 0.004 0.003 0.0019 0.0013 0.001 0.001* 0.001 0.010 0.005
Fe 0.03 43.0 4.2 39.0 2.37 47.7 4.1 51.7 0.89 86 1.7
Mn 0.73 18.0 0.80 16.5 0.73 15.8 0.6 14.3 0.51 6.5 1.9
B 0.03 1.50 0.02 1.55 0.04 1.75 <0.05 1.72 0.08 0.49 1.7
F 0.05 0.10 0.10 0.10 0.10 0.10 0.05 0.04 0.04 0.24 1.5
Mo 0.001 <0.001 <0.001 <0.001 <0.001 0.01
Ni 0.130 0.050 0.12 0.040 0.108 0.032 0.103 0.03 0.057 0.023 0.137
Pb 0.0015 0.001 0.002 0.001 0.002 0.005
Se 0.002 0.002 0.002 0.002 0.001 <0.002 <0.001 <0.001 <0.001 0.002 0.005
Zn 0.140 0.080 0.070 0.065 0.140 0.049 0.075 0.038 0.08 0.060 0.505
3.3 Groundwater Quality changes at KVAR/KVAD and Se epage Bores The groundwater quality at the bores inside the KVAD and at its seepage points are compared with the water quality at the seepage detection bores D5 and D6, as well as Lidsdale Cut, during 2015/16 in Table 4. Although the Local/ANZECC trigger concentrations only apply to bores D5 and D6, the characteristics at all the sampling sites that had higher concentrations are highlighted in blue to indicate potential sources of salts and trace metals to the local groundwater, other than from the KVAR/KVAD area. The following description of water quality characteristics begins for the bores inside the KVAD and seepage from the KVAD walls. These are then compared to the water quality conditions in bores D5 and D6 and at the Lidsdale Cut pond.

Page 26
Table 4: Average Water Quality for KVAD Groundwater Quality compared to KVAR receiving water bores D5 and D6 as well as in the Lidsdale Cu t during 2015/16
Element (mg/L)
Lidsdale Cut
ground-water
Quality in 2015/16
Bore D5 ground-water
Quality in 2015/16
Bore D6 ground-water
Quality in 2015/16
KVAD Groundwater Quality 2015/16
AP09 GW11 AP17
KVAD Ground-
water Seepage
North Wall (Site 86)
KVAD Ground-
water Seepage
South-west Wall
(Site 94)
Ground-water
Guidelines or Goals*
pH 3.4 4.0 3.8 6.1 7.6 3.9 3.0 3.4 6.5-8.0 Cond (µS/cm)
2549 1020 1328 2240 318 4934 4096 3770 2600
TDS 2089 752 1010 1720 266 4710 3110 3440 2000
SO4 1529 495 678 1159 45 3319 2400 2406 1000
CI 21.1 26.1 29.2 41.4 27.2 16.7 18.6 36.3 350
Al 61.1 18.9 4.5 0.25 9.2 62.1 5.58 93.8 5.10**
As 0.013 0.005 0.003 0.071 0.003 0.004 0.004 0.019 0.024
B 6.6 1.76 0.76 2.1 0.05 11.7 8.1 9.65 1.7
Cd 0.0156 0.036 0.002 <0.0001 0.0001 0.0007 0.0002 0.025 0.001
Cr 0.006 0.0046 0.002 <0.0001 0.004 0.001 0.001 0.009 0.004
Cu 0.016 0.045 0.008 0.001 0.015 0.017 0.001 0.022 0.005
F 13.2 0.67 0.46 0.61 0.04 101.6 4.1 17.2 1.5
Fe 8.27 1.83 66.6 53.9 0.076 213 72.1 18.1 1.7
Mn 8.48 5.12 3.4 7.27 0.02 14.4 16.1 15.9 1.9
Mo 0.001 0.002 <0.001 0.121 <0.001 0.029 0.001 0.002 0.01
Ni 0.752 0.354 0.50 0.303 0.01 1.84 1.04 1.46 0.137
Pb 0.013 0.072 0.015 0.001 0.025 0.001 0.001 0.004 0.010
Se 0.022 0.002 <0.001 <0.001 0.001 0.001 0.001 0.018 0.005
Zn 1.62 2.07 1.30 0.127 0.102 5.51 1.56 2.59 0.505 * From Table 1
** Dump Creek 90th Percentile and bore D6 90th percentile (data for both from April, 2012 to March, 2015). These sites used as background for period since
Lidsdale Cut discharge to SSC stopped (see Sections 4.2 and 4.3 for explanation).
Bore AP09 samples the groundwater inside the KVAD near the north wall (Figure 2) and had an increase in salinity during 2015/16, such that sulphate exceeded 1,000 mg/L (Table 4). The pH of 6.1 was higher than in the groundwater at D5 and as a result, the trace metals were much lower than at the receiving water bore, other than nickel which had a similar concentration, as well as iron, manganese and molybdenum which were much higher than at D5. Due to its low solubility in flyash (Kapoor and Christian, 2016) and its slightly acidic pH, the aluminium concentration was low at 0.25mg/L. There was only one measurement at bore GW11, which was taken in July, 2016. The bore samples the KVAD groundwater on its western side. The pH at this bore is neutral at 7.6. Other than a small increase in salinity, the only increases seen since 2014/15 for trace metals were for lead (but was nearly 3-fold lower than at bore D5), as well as zinc, which remained at a low concentration. It was

Page 27
noted that the aluminium concentration at this bore increased from 2.5 mg/L in 2014/15 to 9.2 mg/L in 2015/2016 but remained below that at D5 and Lidsdale Cut, as well as at bore AP17 that samples the groundwater in the bench under the KVAD north wall. Bore AP17 has an acidic pH of 3.9 and continued to have a very high salinity. There was a moderate increase in salinity at this bore since 2014/15 and the sulphate concentration was twice that in Lidsdale Cut. The associated high concentrations of boron, copper, fluoride, iron, nickel and zinc continued in 2015/16, with significant increases since 2014/15 for copper, nickel and zinc. These groundwater metal concentrations reflect the local mineralised conditions in the area because the benches supporting the dam wall are constructed of coal waste/chitter taken from the Lidsdale cut (see Attachment 3). Hence, the aluminium concentration of 62 mg/L at AP17 is similar to that in the Lidsdale cut but much lower than at Bore D5 (Table 4). Groundwater seepage from the KVAD North Wall (Site 86) occurs at a higher level than the groundwater sampled by AP17 but is also highly acidic at pH 3.0. The high salinity and sulphate continued since 2014/15 with moderate increases since the previous year. Of the trace metals, significant increases were noted for the local mineralised elements of boron, fluoride, manganese, nickel and zinc. The aluminium concentration increased from 2.0 mg/L in 2014/15 to 5.6 mg/L during the current period. The apparent reasons for the lower aluminium concentration in the seepage compared to the AP17 groundwater is discussed in Section 4.3.2. Table 4 shows that the seepage from the south-western wall (Site 94) of the KVAD during 2015/16 was acidic, while salinity and sulphate were high and similar to that at the north wall seepage. Most of the trace metals were elevated and had similar concentrations to those in either bore D5 or Lidsdale Cut or both. There were elevated concentrations of cadmium and chromium in the south-western KVAD seepage that did not occur in the KVAD groundwater or the north wall seepage. Furthermore, the elevated south-western concentrations were similar to those in D5 and Lidsdale Cut, suggesting a common source, possibly from coal pyrites, because the south-western seepage originates from beneath the KVAD, which was built on top of a coal mine void (see Figure 3). The lack of effects of the KVAD groundwater on cadmium and chromium concentrations at bore D5 and Lidsdale Cut is supported by the low selenium concentrations at D5 as well as in the KVAD groundwater and the north wall seepage. The low selenium at D5 indicates no overall effects of the KVAR/KVAD groundwater on the water quality at D5.
3.3.1 Long-term changes at groundwater seepage dete ction bores
The long-term changes at bore D5 and Lidsdale Cut are shown in Tables 5 and 6 to assist with understanding the effects of the groundwater level changes and its associated increase in salinity, trace metals and aluminium concentrations. To put the above assessments into the context of the long-term changes, Table 5 summarises the long-term groundwater quality changes at the KVAR/KVAD seepage detection groundwater bores, D5 and D6, during the Stage 2 dry ash placement from its initial placement in 2010 to the decommissioned KVAR in 2015/16. Significant increases occurred for cadmium, chromium, copper, lead and zinc at both the D5 and D6 bores in 2014/15, which have persisted in the current period. Over the entire period, there were no

Page 28
significant changes in salinity, sulphate and selenium at either bore, as well as for aluminium (other than a decrease during the 2013/14 period). Figure 5 shows the average concentrations at bore D5 during each period since 2010/12 and the large increases in cadmium, copper and lead since 2013/14. The Local/ANZECC (2000) guidelines concentration for copper and selenium, which are the same, of 0.005 mg/L, is shown for comparative purposes. By comparison, the copper, cadmium and lead concentrations in the KVAD bores were either lower than their Local/ANZECC (2000) guidelines or much lower than at bore D5, indicating another source of these metals at Bore D5, potentially from coal pyrites in the area. Other than a decrease during the 2013/14 period, the aluminium essentially remained unchanged since 2010/12 at a moderate concentration of mostly less than 20 mg/L.
Figure 5: Average concentrations of trace metals an d aluminium at bore D5 for each reporting period since 2010/2012.

Page 29
Table 5: Long-term Groundwater Quality changes for KVAD groundwater seepage bores WGM1/D5 and D6 from Initial Stage 2 to current deco mmissioned period compared to background Bore D2, Bore D5 90 th Percentile Baseline and Groundwater Guidelines or Goals
Element
(mg/L)
KVAD & KVAR Dry Ash Placement Monitoring Bores Back-
ground
April,
2013 to
March,
2015
D5
Baseline
(Pre-
Stage I
90th
Percent-
ile)
ANZECC
Guideline
Goals for
Ground-
water
Stage 2A April,
2010 to January,
2012
Stage 2 February,
2012 to March, 2013
Stage 2 April, 2014
to March, 2015
Decommissioned
KVAR (April, 2015
to March, 2016)
D5 D6 D5 D6 D5 D6 D5 D6 D2 D5
pH 3.6 3.2 3.7 3.4 3.9 3.3 4.0 3.8 4.0 4.5 6.5-8.0
Cond
(µS/cm) 1356 1216 580 1300 717 1475 1020 1328 503 810
2600
TDS 1000 730 430 885 533 1007 752 1010 290 550 2000
SO4 680 485 240 530 330 658 495 678 159 328 1000
Cl 15 48 13 47 19.2 40 26.1 29.2 30 24 350
Al 21.0 3.6 7.5 1.85 16.7 3.55 18.9 4.5 0.27 - 5.1
As 0.001 0.001 0.001 0.002 0.007 0.005 0.005 0.003 0.001 0.008 0.024
B 2.2 0.74 0.80 0.63 1.06 0.85 1.76 0.76 0.1 1.7 1.7
Cd 0.002 0.001 0.001 0.0002 0.0334 0.002 0.036 0.002 0.0001 0.004 0.001
Cr 0.001 0.002 0.002 0.0015 0.005 0.002 0.0046 0.002 0.0014 0.041 0.004
Cu 0.008 0.005 0.003 0.005 0.034 0.005 0.045 0.008 0.0036 0.058 0.005
Fe 1.7 14.5 0.35 54.5 0.79 80.7 1.83 66.6 1.2 14.7 1.7
Mn 7.5 3.5 3.5 4.45 4.13 4.75 5.12 3.4 0.63 2.5 1.9
Mo 0.010 0.010 0.01 0.010 0.007 0.001 0.002 <0.001 0.001 - 0.010
F 0.80 0.40 0.60 0.30 1.28 0.51 0.67 0.46 0.09 0.65 1.5
Ni 0.540 0.350 0.230 0.345 0.316 0.496 0.354 0.50 0.068 0.137 0.137
Pb 0.007 0.012 0.002 0.002 0.0625 0.012 0.072 0.015 0.002 0.021 0.010
Se 0.002 0.002 <0.002 0.002 0.003 0.001 0.002
<0.001 0.001 0.002 0.005
Zn 1.10 0.895 0.560 0.920 1.62 1.30 2.07 1.30 0.094 0.505 0.505
Table 5 shows the current average pH at Bore D5 is 4.0 and similar to that in 2014/15. There was a moderate increase in salinity since 2014/15 but remained well below the guideline concentrations. No significant changes in trace metal concentrations occurred from 2014/15 to 2015/16, other than an increase in zinc. Most of the metals remained above the Local/ANZECC trigger concentrations but chromium was only marginally above it. There was only a small increase in aluminium at bore D5 from 16.7mg/L in 2014/15 to 18.9mg/L in 2015/16. The long-term changes at bore D6 are also shown in Table 5. Figure 9 shows that, although bore D6 is located to sample the KVAD seepage from the south-western wall as it flows to Lidsdale Cut, it is diluted by background groundwater inflows giving relatively low salinity and sulphate concentrations. Even with these inflows the pH is acidic, and there have been moderate increases for nickel and zinc but notable increases for lead, cadmium and copper since 2012/13. The salinity and sulphate

Page 30
concentrations have remained essentially unchanged, as has the aluminium concentration, which was 4.5 mg/L in 2015/16.
3.4 KVAR effects on local Groundwater Quality The potential effects of KVAR groundwater seepage on the local groundwater was assessed in 2014/15 by using the Wallerawang Power Station ash leachate results of (Ward, et al., 2009) together with the estimated rainfall infiltration into the KVAD beneath the KVAR. The estimated increases in groundwater concentrations from 2014/15 are shown in Table 7. As the average groundwater quality concentrations in the KVAD increased from 2014/15 to 2015/16 (Table 7), it was conservatively assumed that the increases were due to increased ash leachates from the KVAR. That is, the ash leachates of 2014/15 were increased by the ratio of the KVAD concentrations in 2015/16 to the KVAD concentrations in 2014/15. The resulting local groundwater concentration increases during 2015/16 are shown in Table 7. Table 7 also shows all of the increased concentrations, including salinity, sulphate and trace metals were expected to be lower than the Local/ANZECC (2000) guideline concentrations, other than for iron. Application of the higher concentrations during 2015/16 gave similarly low concentrations, indicating no effect of the KVAR on the local groundwater during the current reporting period.
3.5 KVAD effects on local Groundwater Quality As the groundwater concentrations at bore D5 mostly do not meet the guidelines, the cause was investigated by the following approach used by the UTS groundwater modelling at Mt Piper Power station (Merrick, 1999). The slow rate of movement of groundwater from the KVAD to the low point of the Lidsdale Cut is sampled at bore D5, together with other non-KVAD inputs, so the D5 and average KVAD groundwater quality concentrations are compared in Table 7. The salinity (total dissolved solids, TDS) at D5, at 752 mg/L, is about 3-fold lower than currently in the KVAD groundwater at 2232 mg/L. Changes in TDS concentrations from the Mt Piper ash placement area to the receiving water groundwater concentrations were used as an indicator of parallel changes in trace metals for the UTS groundwater model. Losses or gains in trace metal concentrations as the groundwater flowed through the surrounding mine spoil were adjusted, if necessary, by using the results of adsorption tests (PPI, 1999). Similarly, the trace metal concentrations expected at bore D5 due to groundwater seepage from the KVAD were estimated using the TDS differences between the two locations and by initially assuming that there were no losses or gains as the groundwater flowed through the KVAD dam wall benches to D5. The expected concentrations at D5 were estimated, assuming the same 3-fold decrease in TDS, and the results are shown in Table 7. The effects of losses by adsorption on to the local soils, as well as gains in trace metal concentrations as the groundwater flowed through areas containing coal pyrites were subsequently examined to identify the effects of these sources on the concentrations at bore D5. In the case of KVAR ash leachates entering the underlying KVAD by infiltration through the dry ash and the clay layer beneath it, some of the trace metals could be expected to be adsorbed onto the clay.

Page 31
Table 6 shows that all the bore D5 trace metal concentrations during the current period were higher than the estimated increases (except iron, fluoride and molybdenum, which are highlighted in yellow). This indicates another source of the trace metal inputs to D5 other than in the groundwater in the KVAD flyash. The other source is most likely due to releases from local coal pyrites, including those in the KVAD benches and seepage from the KVAD coal mine void. The elements of iron, fluoride and molybdenum, were estimated to give an increase that was an order of magnitude higher than the concentrations at bore D5, indicating losses by adsorption onto the local soils as the KVAD groundwater flowed towards D5. This is consistent with the soil adsorption of 93% for fluoride and 98% for molybdenum (PPI, 1999). The lack of effects of the KVAD iron concentrations on bore D5 is unknown but indicates loss of dissolved iron in the seepage flow path from the KVAD to D5. Table 6: Estimated local groundwater quality increa ses due to groundwater seepage from the KVAR/KVAD for the previous 2014/15 and the current periods compared to Bore D5 receiving water quality and the groundwater ANZECC (2000) Gui delines or Local Goals
Element (mg/L)
Bore D5 Ground-
water (2015/16)
Average KVAD
Groundwater Quality
2014/15
Average KVAD
Groundwater Quality
2015/16
KVAD Ground-
water Increase
due to ash Leachates in 2014/15
KVAD Ground-
water Increase
due to ash Leachates in 2015/16
Expected Bore D5
Groundwater quality due to
current average KVAD
Groundwater Quality
Ground-water
Guidelines or Goals*
pH 4.0 5.7 5.9 0.3 0.3 4.0 6.5-8.0
Cond (µS/cm)
1020 2057 2497 92 112 841 2600
TDS 752 1942 2232 77 88 752 2000
SO4 495 1243 1508 43 52 508 1000
CI 26.1 19.7 28.4 - 4.8 9.7 350
Al 18.9 13.79 23.9 2.3 4.0 8.05 5.10**
As 0.005 0.022 0.026 0.005 0.006 0.009 0.024
B 1.76 4.2 4.6 0.3 0.33 1.55 1.7
Cd 0.036 0.0003 0.0003 <0.0001 <0.0001 0.0001 0.001
Cr 0.0046 0.048 0.0017 0.0007 <0.0001 0.001 0.004
Cu 0.045 0.007 0.011 0.0016 0.0025 0.004 0.005
F 0.67 - 34.1 - 5.8 11.5 1.5
Fe 1.83 87.5 89 8.5 8.6 30.0 1.7
Mn 5.12 7.53 7.2 0.73 0.70 2.43 1.9
Mo 0.002 0.063 0.050 0.0007 0.0006 0.017 0.01
Ni 0.354 0.572 0.720 0.012 0.015 0.243 0.137
Pb 0.072 0.003 0.009 - 0.005 0.005 0.010
Se 0.002 0.001 0.001 0.001 0.001 0.0003 0.005
Zn 2.07 1.28 1.91 0.064 0.096 0.644 0.505
** bore D6 90th percentile

Page 32
3.6 Long-term changes for Lidsdale Cut Water Qualit y To examine the water quality changes in Lidsdale Cut since pumping began, Table 7 summarises the data from Stage 1 during May, 2003 to March, 2010 and the initial Stage 2 period to the current decommissioned period. The significant changes that took place over that time were: increases in salinity and sulphate to an elevated condition since 2013/14. For the trace metals, aluminium increased from less than 10 mg/L to 155 mg/L in 2013/14, to 198 mg/L in 2014/15 and decreased in the current period. Cadmium, began to increase in 2013/14 and was high during 2014/15 but had a significant decrease in the current period. As well as the changes observed for aluminium and cadmium, all the metals, including selenium, but except for molybdenum and manganese, showed similar increases within the previous reporting periods and then decreased during 2015/16. The only increases observed during 2015/16 were for iron and manganese and a minor increase for lead. The possible reasons for these changes were examined further and it was noted that the water in the Lidsdale Cut pond has remained highly acidic, but the water quality greatly improved in 2015/16 compared to that during the previous period. There were significant decreases in salinity such that the conductivity is now lower than the local guideline concentration. Of the trace metals, significant decreases occurred for arsenic, boron, cadmium, chromium, copper, nickel, selenium and zinc, while iron and manganese significantly increased. The decrease in chromium was such that it is now only marginally above the guideline concentration. Aluminium decreased by about 70% from 198mg/L to 61mg/L. The changes over time for aluminium, copper, cadmium, chromium and selenium are shown in Figure 6. Figure 6 shows large increases in concentrations for selenium, cadmium, copper, chromium and aluminium from 2012 to their peak in 2014/15 and large reductions in concentrations during 2015/16. The reductions may be due to maintaining a defined level of water in the pond.
Figure 6: Average concentrations of trace metals an d aluminium in the Lidsdale Cut Pond from the pre-KVAR placement period and each reporting pe riod since 2003/2010
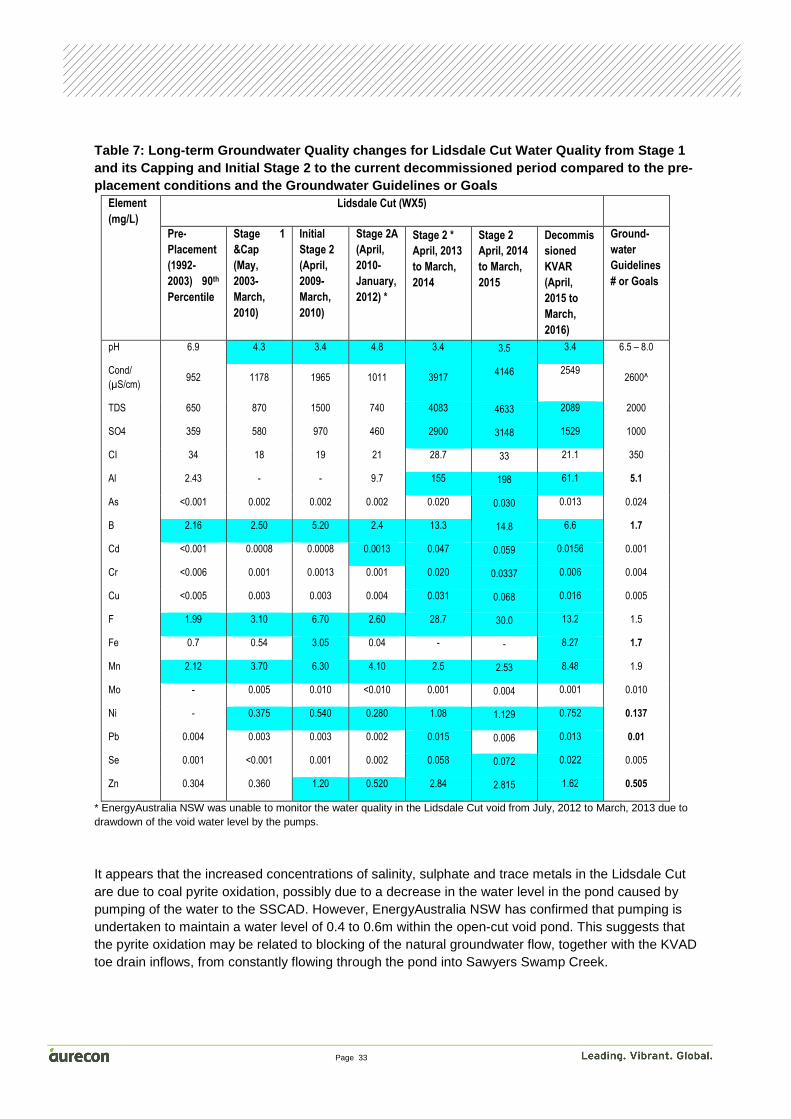
Page 33
Table 7: Long-term Groundwater Quality changes for Lidsdale Cut Water Quality from Stage 1 and its Capping and Initial Stage 2 to the current decommissioned period compared to the pre- placement conditions and the Groundwater Guidelines or Goals
Element
(mg/L)
Lidsdale Cut (WX5)
Pre-
Placement
(1992-
2003) 90th
Percentile
Stage 1
&Cap
(May,
2003-
March,
2010)
Initial
Stage 2
(April,
2009-
March,
2010)
Stage 2A
(April,
2010-
January,
2012) *
Stage 2 *
April, 2013
to March,
2014
Stage 2
April, 2014
to March,
2015
Decommis
sioned
KVAR
(April,
2015 to
March,
2016)
Ground-
water
Guidelines
# or Goals
pH 6.9 4.3 3.4 4.8 3.4 3.5 3.4 6.5 – 8.0
Cond/
(µS/cm) 952 1178 1965 1011 3917
4146 2549 2600^
TDS 650 870 1500 740 4083 4633 2089 2000
SO4 359 580 970 460 2900 3148 1529 1000
CI 34 18 19 21 28.7 33 21.1 350
Al 2.43 - - 9.7 155 198 61.1 5.1
As <0.001 0.002 0.002 0.002 0.020 0.030 0.013 0.024
B 2.16 2.50 5.20 2.4 13.3 14.8 6.6 1.7
Cd <0.001 0.0008 0.0008 0.0013 0.047 0.059 0.0156 0.001
Cr <0.006 0.001 0.0013 0.001 0.020 0.0337 0.006 0.004
Cu <0.005 0.003 0.003 0.004 0.031 0.068 0.016 0.005
F 1.99 3.10 6.70 2.60 28.7 30.0 13.2 1.5
Fe 0.7 0.54 3.05 0.04 - - 8.27 1.7
Mn 2.12 3.70 6.30 4.10 2.5 2.53 8.48 1.9
Mo - 0.005 0.010 <0.010 0.001 0.004 0.001 0.010
Ni - 0.375 0.540 0.280 1.08 1.129 0.752 0.137
Pb 0.004 0.003 0.003 0.002 0.015 0.006 0.013 0.01
Se 0.001 <0.001 0.001 0.002 0.058 0.072 0.022 0.005
Zn 0.304 0.360 1.20 0.520 2.84 2.815 1.62 0.505
* EnergyAustralia NSW was unable to monitor the water quality in the Lidsdale Cut void from July, 2012 to March, 2013 due to drawdown of the void water level by the pumps.
It appears that the increased concentrations of salinity, sulphate and trace metals in the Lidsdale Cut are due to coal pyrite oxidation, possibly due to a decrease in the water level in the pond caused by pumping of the water to the SSCAD. However, EnergyAustralia NSW has confirmed that pumping is undertaken to maintain a water level of 0.4 to 0.6m within the open-cut void pond. This suggests that the pyrite oxidation may be related to blocking of the natural groundwater flow, together with the KVAD toe drain inflows, from constantly flowing through the pond into Sawyers Swamp Creek.

Page 34
As well as the release of cadmium, aluminium and the other metals released into solution, selenium release in acid mine drainage is also known to occur (see Förstner and Wittmann, 2012). Its release from the Lidsdale Cut chitter suggests that the selenium was accumulated as the insoluble sulphide over the long-term from the KVAD flyash, when it was an active ash dam (Aurecon, 2015). Its release as the soluble selenium may have occurred due to the change from reducing to oxidation of the pyrites as a result the changed groundwater flow conditions in the Lidsdale Cut pond. The view that the source of elevated concentrations of salts, trace metals and aluminium is most likely due to releases from the local coal pyrites is further investigated in the next Section by examination of the aluminium distribution among the KVAR/KVAD groundwater bores, KVAD seepage points and bore D5 and Lidsdale Cut.
3.7 Distribution of Aluminium between groundwater s ampling sites The following graphs show the differences in aluminium concentrations between all the sampling sites in the KVAR/KVAD area by using pH/aluminium and sulphate/aluminium signatures. Aluminium is known to come into solution under acidic conditions generated as a result of pyrite oxidation, and from the above review of the water quality at each site, it is apparent that elevated aluminium concentrations are associated with the presence of coal pyrites. Pyrite (FeS) oxidation also generates sulphate and acidic conditions, so the aluminium concentration was graphed against pH for each groundwater bore inside the KVAD and at bore D5 and Lidsdale Cut in Figure 6. Figure 7 shows that the bores, AP09 and GW11, which sample the KVAD groundwater have near neutral pH and low aluminium concentrations, so they are separated from the other samples by their pH/aluminium signatures. All the other sites have acidic pH from 3.0 to 4.0. At these pH’s, the KVAD south-western wall seepage (Site 94), bore AP17 at the northern wall and Lidsdale Cut have high aluminium concentrations, while bore D5 has a moderate concentration and the north wall seepage (Site 86) had a similarly low concentration to that at bores AP09 and GW11.
Figure 7. Signature plot of Aluminium concentration compared to pH for each groundwater bore and seepage points at the KVAD and at Bore D5 and Lidsdale Cut
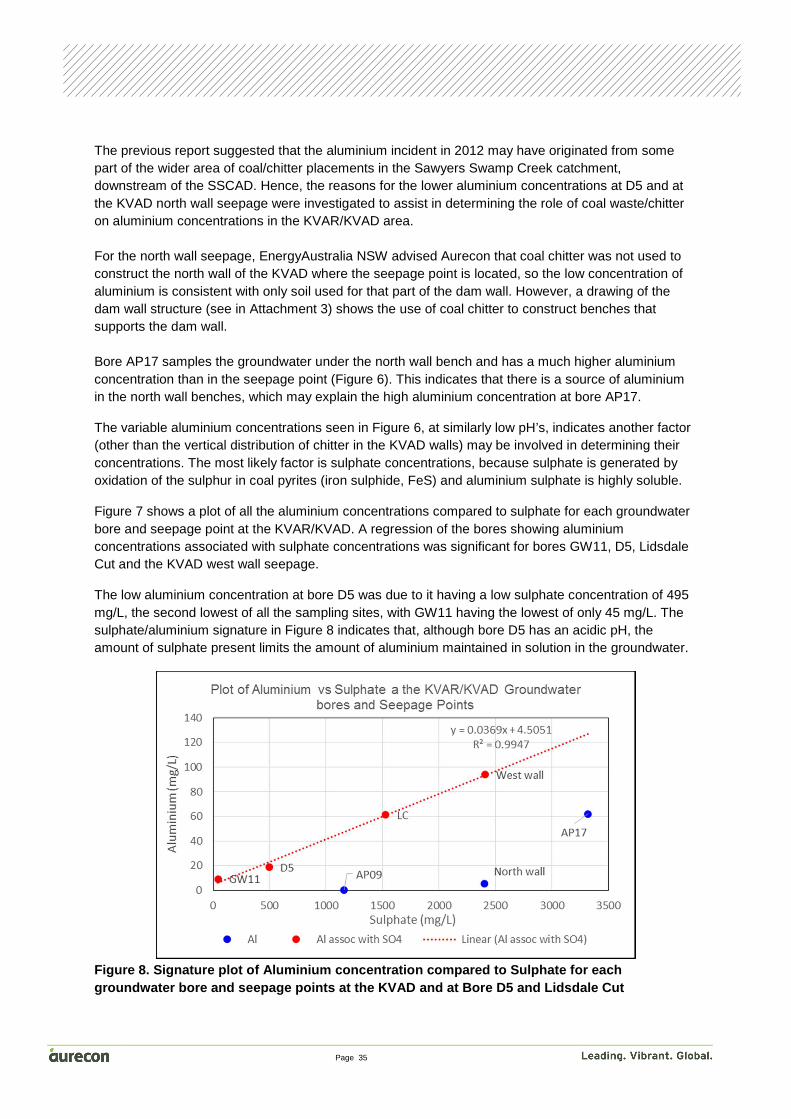
Page 35
The previous report suggested that the aluminium incident in 2012 may have originated from some part of the wider area of coal/chitter placements in the Sawyers Swamp Creek catchment, downstream of the SSCAD. Hence, the reasons for the lower aluminium concentrations at D5 and at the KVAD north wall seepage were investigated to assist in determining the role of coal waste/chitter on aluminium concentrations in the KVAR/KVAD area. For the north wall seepage, EnergyAustralia NSW advised Aurecon that coal chitter was not used to construct the north wall of the KVAD where the seepage point is located, so the low concentration of aluminium is consistent with only soil used for that part of the dam wall. However, a drawing of the dam wall structure (see in Attachment 3) shows the use of coal chitter to construct benches that supports the dam wall. Bore AP17 samples the groundwater under the north wall bench and has a much higher aluminium concentration than in the seepage point (Figure 6). This indicates that there is a source of aluminium in the north wall benches, which may explain the high aluminium concentration at bore AP17.
The variable aluminium concentrations seen in Figure 6, at similarly low pH’s, indicates another factor (other than the vertical distribution of chitter in the KVAD walls) may be involved in determining their concentrations. The most likely factor is sulphate concentrations, because sulphate is generated by oxidation of the sulphur in coal pyrites (iron sulphide, FeS) and aluminium sulphate is highly soluble.
Figure 7 shows a plot of all the aluminium concentrations compared to sulphate for each groundwater bore and seepage point at the KVAR/KVAD. A regression of the bores showing aluminium concentrations associated with sulphate concentrations was significant for bores GW11, D5, Lidsdale Cut and the KVAD west wall seepage.
The low aluminium concentration at bore D5 was due to it having a low sulphate concentration of 495 mg/L, the second lowest of all the sampling sites, with GW11 having the lowest of only 45 mg/L. The sulphate/aluminium signature in Figure 8 indicates that, although bore D5 has an acidic pH, the amount of sulphate present limits the amount of aluminium maintained in solution in the groundwater.
Figure 8. Signature plot of Aluminium concentration compared to Sulphate for each groundwater bore and seepage points at the KVAD and at Bore D5 and Lidsdale Cut

Page 36
Figure 8 also shows that, although the south-west wall seepage has a similar sulphate concentration as the north wall, the south-western seepage has the highest aluminium concentration of all the sites. Examination of the location of the south-western seepage point in Figure 3 indicates that the high concentration occurs because the seepage is from under the KVAD, and the seepage is draining coal waste/chitter from the south-western area. The above view that bore AP17 is sampling coal chitter used to construct benches is supported by the sulphate/aluminium signature in Figure 8. Although AP17 has a similar pH and similar aluminium concentration as in the Lidsdale Cut, a much higher sulphate concentration was required to maintain the aluminium concentration at AP17 (about double that at Lidsdale Cut). The most likely reason is that the dam wall at AP17 is not fully constructed of coal chitter, but the Lidsdale Cut void consists mostly, if not all, of coal waste/chitter. This indicates that more aluminium is released from the more abundant coal pyrites in Lidsdale Cut than at AP17, where coal pyrites are less abundant.
Before updating the potential effects of seepage from the KVAR/KVAD on Sawyers Swamp Creek, in addition to that undertaken in 2015/16, by using the recent water quality data, a review of the effects of the SSCAD on the water quality on the creek is undertaken in the next Section.

Page 37
Figure 9: Kerosene Vale Ash Dam and Stage 1 and Sta ge 2 Dry Ash Repository Groundwater Level (RL m) Co ntours with Inferred Flow Directions (from sketch provided by Lend Lease Infr astructure to EnergyAustralia NSW)

Page 38
4. Review of Surface Water Quality This Section reviews the effects of seepage from under the Sawyers Swamp Creek Ash Dam wall on the water quality in Sawyers Swamp Creek, as well as the effects of seepage from the KVAR/KVAD further downstream. Previous reports have shown that, prior to the Springvale coal mine water discharge into the creek since it became continuous in 2013, the SSCAD seepage was causing a moderate increase in salinity but there was no significant effect on trace metals. Although the mine water discharge now dominates the water quality in the creek, EnergyAustralia NSW has continued to monitor the water quality in the ash dam pond and at the main v-notch seepage point so significant changes can be related to the pre-mine water flow conditions. In addition, a seepage return water system was installed in May, 2010, so most of the v-notch seepage has been prevented from entering the creek since then. In addition, water from the Lidsdale Cut pond has been pumped into the return canal since June, 2012, so changes in water quality in the SSCAD pond are examined in this Section. The effects of seepage from the KVAR/KVAD on Sawyers Swamp Creek were assessed as not significant in the previous report. Those potential effects are updated in Section 5.2.
4.1 Sawyers Swamp Creek Ash Dam effects on Surface water Quality The previous report mentioned the dominant effects of the water quality in Sawyers Swamp Creek by the discharge of water from the Springvale Mine and the same conditions have persisted during the current period. Table 8 shows the long-term changes in water quality in the SSCAD pond and the current v-notch seepage, compared to the differences in the creek water quality from upstream to downstream of the v-notch seepage in 2015/16. Note that elements in the pond and the seepage with higher concentrations than the local guidelines are highlighted in blue to indicate potential sources of salts and trace metals, the guidelines actually apply to the receiving water site at WX7 and not the pond or the v-notch seepage. The upstream site is located in the creek just downstream of the ash dam spillway. Catchment runoff from upstream of the ash dam enters the creek, via a pipe, that discharges over the spillway and joins the normal creek flow just upstream of the sampling location. Hence, the water quality differences from upstream to downstream covers the length of the entire dam wall. In this way, any seepage from the dam wall that enters the creek along its length could be addressed. Previous reports have shown that trace metals are removed from the SSCAD pond water as it passes through the dam wall soils and exits into the creek at the v-notch. It is assumed that a similar removal process occurred for the whole length of the dam wall. The significant changes in the SSCAD pond water quality concentrations shown in Table 8 were observed for:
• Conductivity and sulphate were moderately elevated during 2012 to 2015 but have reduced to about the same levels as during the wet ash period (before dry ash placement began at KVAR)
• Aluminium increased from 2.2 mg/L in 2014/15 to 7.8 mg/L in 2015/16 • Cadmium has increased since 2012 but is 4-fold lower than when the ash dam was used for
wet ash placement

Page 39
• Nickel has increased since 2012 and reached its highest concentration in 2015/16, but is still lower than during wet ash placement
• Selenium decreased by an order of magnitude from 0.15 mg/L to be less than the ANZECC (2000) guideline of 0.005 mg/L since 2014/15
Changes in the SSCAD v-notch discharge water quality concentrations were: • The trace metals, including aluminium, showed significant reductions at the v-notch except
nickel (remained about the same as in the pond) and manganese increased, possibly by release to the flow by soil material in the dam wall.
• Salinity increased at the v-notch, while sulphate was similar to that in the SSCAD pond and the pH increase from acidic to neutral in response to the increase in alkalinity, also indicating effects of passing through soil material in the dam wall.

Page 40
Table 8: Water Quality in SSCAD for Pre-placement a nd Stage 2 Periods to 2014/15 and the V-notch Seepage Compared to Sawyers Swamp Creek Up- a nd Downstream of the V-notch and Surface Water Guidelines or Goals
Element (mg/L)
Pre-Placement (1996-2003)
Stage 2A
(April, 2010-
January 2012)
Stage 2 February, 2012 to March, 2013
Stage 2 during April, 2013-March 2015
Decommissioned KVAR (April,
2015 to March, 2016)
V-Notch Seepage 2015/16
SSC Upstream V-Notch Seepage
April,2015 to March,
2016
SSC Down-
stream V-Notch
Seepage April, 2015 to March,
2016
Spring-vale Mine
water discharge
ANZECC (2000)
Guidelines & Goals for SSC
SSCAD SSCAD SSCAD SSCAD SSCAD SSCAD v-notch
SSC SSC Springvale Mine Water
pH 5.4 4.8 4.8 6.1 4.8 7.2 8.3 8.7 8.1 6.5-8.0
Cond (µS/cm)
1219 1912 1457 1496 1169 1502 1169 1169 1163 2200
TDS 858 1418 1066 1083 820 1155 662 645 907* 1500
SO4 553 910 674 710 563 645 39 40.5 39.9 1000
Cl 18 30 20 19 13.9 27 7.0 6.6 6.0 350
Alk 18 19 25 28 3.6 151 580 577 581 -
Al - 2.3 4.5 2.16 7.77 4.3 0.36 0.26 0.37 5.25
As 0.016 0.0013 0.002 0.002 0.002 0.003 0.024 0.022 0.023 0.024
Cd 0.012 0.0021 0.0042 0.0038 0.0046 0.003 0.0001 <0.0001 <0.001 0.0015
Cr 0.005 0.0014 0.0028 0.001 0.001 0.002 <0.001 <0.001 - 0.005
Cu 0.007 0.0115 0.0203 0.0055 0.011 0.003 <0.001 <0.001 0.002 0.005
Fe 0.17 0.21 0.08 0.10 0.13 0.086 0.008 0.025 0.004 0.3
Mn 1.2 1.34 1.17 1.23 1.64 2.28 0.008 0.012 0.007 1.9
B 4.7 2.01 1.82 2.07 2.15 1.31 0.108 0.095 0.073 1.25
F 9.3 2.15 2.21 2.19 2.73 1.89 0.96 0.97 1.17 1.5
Mo 0.152 0.033 0.013 0.024 0.004 0.008 0.045 0.046 0.046 0.01
Ni 0.129 0.041 0.071 0.076 0.108 0.097 0.004 0.003 0.004 0.05
Pb 0.002 0.001 0.003 0.001 0.001 0.002 <0.001 <0.001 <0.001 0.005
Se 0.151 0.006 0.009 0.004 0.003 0.001 <0.001 <0.001 <0.001 0.005
Zn 0.426 0.136 0.263 0.196 0.360 0.153 0.008 0.008 0.009 0.153
*Springvale TDS estimated from TDS=0.78xconductivity
To clarify the SSCAD long-term changes, Figure 10 shows the changes in conductivity and sulphate, as well as the trace metals boron, manganese, nickel and zinc since the wet ash placement to conversion to dry ash at the KVAR.

Page 41
Figure 10: Long-term trends in conductivity, sulpha te and trace metals in SSCAD Pond from periods of wet ash placement to 2003, dry ash place ment at KVAR from 2003 to 2014 and pumping from Lidsdale Cut since 2012.
Figure 10 shows significant improvements in conductivity, sulphate and boron concentrations since diversion of ash placement in the SSCAD to the dry ash at KVAR. The conductivity has become highly variable in 2015/16, apparently due to capping of the unused areas and diversion of rainfall runoff into the reduced size of the pond at the dam wall. There has been a trend for increase since 2010 for nickel and manganese, while zinc has increased significantly in recent years. The zinc increase may be related to release from the pond sediments, so it is suggested that the pond be examined for possible loss of dissolved oxygen in the bottom waters. Dissolved oxygen measurements in the surface water of the pond (Attachment 2) showed a large decrease from an average of about 14 mg/L to less than 6 mg/L since January, 2016. Due to the dominant flow of the Springvale mine water, Table 8 shows the water quality and trace metals in Sawyers Swamp Creek are the same as the mine water and there is no difference in the creek from upstream to downstream of the v-notch seepage point. In terms of assessing the effects of the ash dam seepage on the creek without any mine water flows, just natural stream flows, Table 7 shows that all the water quality and trace metal concentrations at the v-notch, other than cadmium, manganese, boron, fluoride and nickel had lower concentrations than the Local/ANZECC (2000) Guidelines for Sawyers Swamp Creek at the receiving water site WX7. The amount of dilution to reduce the trace metals to less than the guideline concentrations was examined by comparing the stream flow in Sawyers Swamp Creek of 4.5 ML/day (see Section 3.2) with the v-notch seepage flow, which averages 0.069 ML/day, which is about a 60-fold dilution. As the cadmium concentration at the v-notch is twice as high as its guideline, and zinc is similar, a 2-fold dilution would be required to meet the guideline concentrations for these metals. The other metals

Page 42
require a lower rate of dilution. Hence, the V-notch inputs (even if they were not pumped back into SSCAD) are not expected to increase the concentrations in the creek above their guideline levels. This amount of dilution is also expected to be sufficiently high enough to allow for the unknowns of seepage along the whole length of the dam wall. As the Sawyers Swamp Creek Ash Dam is unlikely to have had a significant effect on water quality or trace metals, the effects of KVAR/KVAD groundwater seepage on the creek further downstream are examined in the next Section.
4.2 KVAR/KVAD Groundwater Seepage Effects on Sawyer s Swamp Creek The following estimates of effects of the KVAR/KVAD groundwater seepage on Sawyers Swamp Creek are based on using creek concentrations from May, 2003 to July, 2007 (prior to any Springvale mine water discharges). These earlier creek concentrations are shown in Table 9.
The main KVAR/KVAD seepage point into Sawyers Swamp Creek is from the north wall near bore GW6 (Figure 2) and its water quality data for 2015/16 is shown in Table 9. As there is no reliable water quality data available for the creek upstream of the seepage, without the effects of mine water, the effects of the seepage were assessed by using the estimated seepage flows as well as the natural creek flows (Aurecon, 2015). Following that approach, the assessment of effects has been updated with the current decommissioned period north wall seepage data for 2015/16 in Table 9 (the current KVAR north wall seepage and the estimated increase in concentrations at WX7 are highlighted in grey).
Table 9 shows that all of the estimated increases in Sawyers Swamp Creek concentrations, including salinity, sulphate and trace metals, caused by the KVAR/KVAD seepage are expected to be lower than the Local/ANZECC (2000) guideline concentrations, other than for iron. The iron concentration in the north wall seepage at 72.1 mg/L was similar to the average of all the KVAD bores during 2014/15 of 87.5 mg/L, which was predicted to increase the creek concentrations by 7.4 mg/L. Consequently, the increase in the creek during 2015/16 was estimated to be 6.1 mg/L. However, high iron concentrations have existed for a long time and are widespread in the area (see Tables 3,4 and 5), and the iron concentration at WX7 averaged only 0.065 mg/L during the pre-mine water period, indicating that the iron does not stay in solution in the oxygenated creek waters.

Page 43
Table 9: Estimated water quality increases in Sawye rs Swamp Creek at WX7 due to groundwater seepage from the KVAR/KVAD without Springvale coal mine discharges for the previous 2014/15 and the current periods compared to recent Sawyers Swamp Creek concentrations and ANZECC (2000) Guidelines or Local Goals
Sawyers Swamp Creek (WX7) North Wall KVAD/R
Seepage to SSC Sawyers Swamp Creek prior to Mine
water Discharge
Element (mg/L)
Pre-placement (1991-2003) 90th Percentile
Stage 2A (April, 2010-January, 2012) Median
Ongoing Stage 2 (February, 2012-March, 2013)
Stage 2 during April, 2013-March 2015
Decommissioned
KVAR (April,
2015 to March, 2016)
Stage 2
(April,
2014 to
March,
2015)
Decommissioned KVAR (April, 2015-March, 2016)
WX7 Increase due to
Decommissioned KVAR
Leachate
WX7 Increase due to KVAR
Leachate in
2014/15^
WX7 Pre-
Spring-vale Mine
Water Discharge
#
Surface Water Guide- lines or Goals
pH 7.6 7.3 7.5 8.7 8.8 2.9 3.0 -0.1 -0.1 6.3 6.5 – 8.0
Cond (µS/cm)
760 1100 828 1129 1154 3336 4096 18.7 15.2 1070 2200
TDS 584 690 553 696 659 2736 3110 14.5 12.8 774 1500^
SO4 323 300 156 36 38 1918 2400 9.0 7.2 496 1000 ++
CI 27 16 11 5.3 5.9 18.7 18.6 0.1 0.1 26.5 350 +
Alkalinity 20 162* 257* 557 590 - - - - 20 -
Al 0.20 0.42 2.0 5.58 1.06 0.38 0.274 5.25
As <0.001 0.004 0.007 0.022 0.023 0.001 0.004 0.004 <0.001 0.015 0.024
B 2.33 1.4 0.634 0.091 0.143 5.8 8.1 0.067 0.048 2.26 1.25
Cd <0.001 0.0007 0.0011 0.0001 0.0001 <0.0002 0.0002 0.0003 0.0003 0.0006 0.0015
Cr <0.001 0.0025 0.0128 0.0013 0.001 0.0008 0.001 0.0001 <0.0001 0.0003 0.005
Cu <0.007 0.003 0.0099 0.0021 0.001 0.001 0.001 0.001 <0.001 0.0004 0.005
F 1.1 1.7 1.7 1.10 1.17 0.5 4.1 0.16 - 0.89 1.5+++
Fe 0.507 0.02 0.26 - 0.025 - 72.1 6.1^ - 0.065 0.3+++
Mn 0.829 1.7 0.72 - 0.017 0.68 16.1 1.37 0.06^ 1.12 1.9
Mo - 0.02 0.014 0.043 0.045 <0.01 0.001 0.0001 <0.0001 0.005 0.01 +
Ni - 0.16 0.059 0.006 0.005 0.43 1.04 0.0001 0.002 0.142 0.05
Pb 0.003 0.002 0.003 0.0011 0.001 0.0006 0.001 0.001 - 0.004 0.005
Se 0.003 <0.002 <0.001 0.001 <0.001 0.001 0.001 <0.001 <0.001 0.002 0.005
Zn 0.153 0.45 0.035 0.025 0.012 0.26 1.56 0.066 0.011 0.144 0.153
*averages used to allow for effects of periods of mine water pipeline leakage or the recent discharge
** Mine emergency discharge data from Aurecon (2010) for 17th Feb to 7th Aug09
#Averages for KVAR Stage I period May, 2003 to July, 2007 from Connell Wagner (2008) before Springvale discharge into Sawyers Swamp Creek from 17th
February, 2009
^from Aurecon (2015); Estimated from average of KVAD Groundwater Quality in 2014/15
Page 44
5. Discussion This current review of the KVAR related surface and groundwater quality attempts to take into account the complex, locally mineralised conditions in which the KVAR is placed. The assessment of the effects of the decommissioned and partly capped KVAR has found similar results to those in 2014/15 of:
• Although the concentrations of some coal pyrite related trace metals increased in the seepage from the KVAD wall during 2015/16, no significant effects of rainfall infiltration through the KVAD on the water quality in Sawyers Swamp Creek is expected, even without the Springvale mine water discharge.
• As the rainfall infiltration seepage rate is small, and it has to pass through the clay capping under the KVAR to enter the KVAD, the trace metal concentrations in the KVAD are reduced in concentration, by adsorption onto the clay, to be less than the Local/ANZECC (2000) guideline concentrations. Although the selenium concentration in the receiving water bore D5 is also lower than the guideline, most of the other trace metals in the local groundwater have elevated concentrations due to releases from the local coal pyrites. Hence, no significant effects of the KVAR on local groundwater quality, is considered likely.
Significant decreases in salinity and trace metal concentrations occurred in the Lidsdale Cut pond during 2015/16 compared to the elevated concentrations during the previous period. Last year’s report recommended that pumping from the Lidsdale Cut pond be reduced because it was considered that pumping caused a drawdown of the water level in the pond and allowed coal pyrite oxidation and release of trace metals and creation of sulphate. EnergyAustralia NSW has confirmed that pumping was not reduced, other than maintaining a water level of approximately 0.4 to 0.6m within the open-cut void pond. It was also advised that the Lidsdale Cut water is pumped to the truck wash area, from there to the ash return canal for pH adjustment at the power station caustic injection plant. The 2014/15 report suggested that the precipitation of aluminium in Sawyers Swamp Creek in mid-2012 after a significant rainfall event appeared to be due to coal waste/chitter pyrites in the area, rather than due to the groundwater concentrations inside the KVAD. This view has been made clearer, having shown that the likely source of the aluminium is the result of pyrite oxidation of the local coal waste or chitter. It was found that coal waste/chitter is present in the KVAD benches, the open-cut coal mine void under the KVAD and in the Lidsdale Cut open-cut coal mine void, which is much larger than the pond area. Although the concentrations of some trace metals, including aluminium, have increased in the SSCAD pond since the last report, the concentrations in the v-notch seepage have mostly decreased possibly due to adsorption onto soils in the dam wall. Due to the slow rate of seepage into Sawyers Swamp Creek (especially as flows from the v-notch seepage are captured and returned to the ash dam pond, all the water quality, trace metals and aluminium concentrations are expected to be lower than the Local/ANZECC (2000) guideline concentrations in the creek, even without the diluting effects of the current Springvale mine water discharge. The observed increases in cadmium, aluminium and zinc in the SSCAD pond are unknown but may possibly be due to release from the pond sediments by low dissolved oxygen concentrations. Hence, it may be prudent for EnergyAustralia NSW to monitor dissolved oxygen concentrations near the bottom of the pond and investigate aeration of the waters to maintain the dissolved oxygen levels.

Page 45
It is also suggested that EnergyAustralia NSW maintain monthly monitoring of the SSCAD pond and the v-notch seepage, as well as the Lidsdale Cut pond to assist in confirming the benefits of any management actions taken to limit mobilisation of metals from the Lidsdale Cut coal waste/chitter fill. Due to the reduced and now relatively stable salinity and relatively low concentrations of most of the trace metals in SSCAD, as well as adsorption of the trace metals as they pass through the dam wall soils, no significant effects have been seen at the seepage detection bore D3. In addition, although there has been a steady increase in salinity at bore D4, no effects on trace metals have been seen.
Page 46
6. Conclusions The overall conclusions of this assessment for the 2015/16 study is that:
• The KVAR is not having a significant effect on the local surface and groundwater quality • Leachates from the long-held ash in the KVAD have been largely depleted given the current
conditions (as indicated by the very low selenium concentrations in the KVAD groundwater) and the remaining metal leachates, including aluminium, are from pre-existing coal waste/chitter in the void and benches that form the KVAD
• The slow rate of movement of groundwater from the KVAD had no significant effects on the receiving water groundwater at bore D5
• Salinity, trace metals and aluminium decreased in the Lidsdale Cut pond, possibly due to improved water management in the pond to minimise the effects of coal pyrite oxidation
• The elevated salinity, trace metals and aluminium at Lidsdale Cut are unrelated to groundwater seepage from the KVAD due to the overriding effects of coal pyrites in the open-cut mine void area that forms the Lidsdale Cut pond
• The SSCAD seepage is not having a significant effect on the local groundwater up-gradient of the KVAD. Seepage at the northern part of the dam wall has increased salinity above the MPGM4/D4 background levels, indicating that the increases are due to another source.
Page 47
7. Recommendations Based on the findings of this study, including the effects of pumping from Lidsdale Cut and the domination of the water quality in Sawyers Swamp Creek by the discharge of water from the Springvale Mine, the following recommendations are made:
• Continue monthly water quality monitoring at the EnergyAustralia NSW routine surface water and groundwater monitoring sites until the relevant Authorities advise on the decommissioning conditions for the site
• EnergyAustralia NSW continue to monitor the water quality in the Lidsdale Cut pond to see if the current decrease in concentrations continues
• EnergyAustralia NSW investigate the dissolved oxygen in the SSCAD pond bottom waters to see if it is maintaining sufficient levels to minimise release of trace metals from the pond sediments.

Page 48
8. References ANZECC,1995. Guidelines for Groundwater Protection in Australia. National Water Quality Management Strategy, Commonwealth of Australia. Australian and New Zealand Environmental Conservation Council, ACT.
ANZECC, 2000. Australian Water Quality Guidelines for Fresh and Marine Waters. Australian and New Zealand Environmental Conservation Council, ACT.
APHA, 1998. American Public Health Association, 1998. Standard Methods for the Examination of Water and Wastewater. 20th Edition.
Aurecon, 2010. KVAD Stage II Water Quality Assessment October, 2007 to March, 2010. Draft Report to Energy Delta Electricity Western 18th June, 2010
Aurecon, 2012. Kerosene Vale Ash Dam and Dry Ash Repository KVAR Stage 2A Water Quality Assessment April, 2010 to January, 2012. Report to Delta Electricity Western 9th October, 2012
Aurecon, 2014. Kerosene Vale Ash Dam and Dry Ash Repository KVAR Stage 2 Water Quality Assessment February, 2012 to March, 2013. Report to EnergyAustralia NSW 16th January, 2014
Connell Wagner, 2008. Kerosene Vale Ash Dam Groundwater November, 2001 to July, 2007. Report to EnergyAustralia NSW Western, 15th February, 2008
DEC, 2004. Approved Methods for the Sampling and Analysis of Water Pollutants in New South Wales. Prepared by NSW Environment Protection Authority (EPA) and is published by Department of Environment and Conservation, NSW (DEC) on behalf of the EPA. March, 2004
Department of the Environment, 2012. Methods for estimating groundwater discharge to streams – summary of field trials. Summary Report Final, 2012. Summary of Australian Government funded study, through the Water for the Future – Water Smart Australia program, by Sinclair Knight Merz (SKM) and the Commonwealth Scientific and Industrial Research Organisation (CSIRO)
http://www.environment.gov.au/system/files/pages/f4c0c901-66bc-46ba-94cb-056dfb54b69d/files/methods-estimating-groundwater-discharge-streams.doc
Förstner, U and G.T.W. Wittmann, 2012. Metal Pollution in the Aquatic Environment. Published by Springer Science & Business Media, 6th December, 2012.
Forster, 1999. Mt Piper ash/brine co-disposal pilot field test. Pacific Power International report GO 129, 1999 to Delta Electricity
NEPC, 1999 (updated in May, 2013). National Environment Protection (Assessment of Site Contamination) Measure, National Environment Protection Council, Canberra.
Parsons Brinckerhoff, 2008. Kerosene Vale Stage 2 Ash Repository Area Environmental Assessment Technical Reports 1 – Groundwater and 2 – Surface Water. Parsons Brinckerhoff Australia Report to EnergyAustralia NSW , April, 2008
PPI, 1999. Mount Piper Power Station Brine Conditioned flyash Co-placement Statement of Environmental Effects. Pacific Power International August, 1999 for Delta Electricity
Ward, CR, D French, J Jankowski, M Dubikova, Z Li, K Riley, 2009. Element mobility from fresh and long-stored acidic fly ashes associated with an Australian power station. International Journal of Coal Geology 80: 224–236

Attachment 1 Lithgow Rainfall Data
Lithgow Rainfall Data from January, 2000 to March, 2013 (mm/month) from Bureau of Meteorology
Year(s) January February March April May June July August September October November December Annual
2000 57 22.2 271.4 50.6 53.4 32.2 37.4 51.2 43 75 119.2 59 871.6
2001 105.4 90.6 89.6 84.4 28.8 9 63.2 30.8 46.4 58.8 80 26.6 713.6
2002 87.8 187 69.4 40.2 67.6 22.6 16.8 17 21.2 3 22 47.2 601.8
2003 3.6 135 41.8 38.4 54 43.2 20.6 0 18.6 82.4 121 68.8 627.4
2004 35 98.2 22.4 10.4 35.2 16.2 30.2 50.8 34.8 118.4 113.8 88.6 654
2005 102.8 104.6 55.8 28.6 14.2 117.2 59.2 24.6 87.6 116.5 159.4 48.4 918.9
2006 146.6 32.6 6.4 6.8 6.8 6.8 54.2 5.8 59.2 3.2 32.2 72.7 433.3
2007 92.6 141.4 72.1 44.6 56.6 223 24.9 65.4 9 37.8 134.7 67 969.1
2008 102 84.6 47.6 59.8 11 60.9 37.1 43.6 88.2 66.2 83.3 113.2 797.5
2009 25.2 165.8 28 74.5 80.9 44.5 35.9 48.8 63 69 23.6 81.5 740.7
2010 76.4 119.2 85.1 35.8 54.4 40.9 73.5 73.5 52.4 70.9 122.8 164.6 969.5
2011 114 57.2 77.2 41.2 51.2 72.4 24.6 58.7 78.4 46.2 168 96 885.1
2012 57.1 152.6 189.8 44.4 30.6 81.8 49.8 21.2 48.6 20.8 30.9 64.1 791.7
2013 64.1 113.2 184.2 66.2 28.1 29 24.4 23.2 36.8 21.8 95.2 34.2 720.4
2014 13.6 74 143.8 63 14 43.2 24.2 24.2 27.9 60.7 21.8 174.3 684.7
2015 124.8 31 35 184 31 26 44.6 31.6 12.6 37.2 67.2 57.2 682.2
2016 166.6 46.6 36.8

Attachment 2 Wallerawang Power Station Ash Dam Surface Water and Groundwater Quality Stage 2 from February, 2012 to March, 2015 and April, 2015 to March, 2016 Attachment also contains:
� Pre-Dry Ash Placement Summary data before April, 2003 and;
� LLI Sawyers Swap Creek Data from February, 2010 to March, 2016
NOTE: Post-Dry Ash Placement Stage 1 and initial Stage 2 Raw Data and Summary statistics are in previous reports:
� Stage 1 Data from May, 2003 to July, 2007 in Connell Wagner, 2008
� Initial Stage 2 data from August/October, 2007 to April, 2010 in Aurecon, 2010)
� Stage 2A Water Quality Assessment from April, 2010 to January, 2012 in Aurecon (2012)
Post Dry Ash Placement Stage 2 Raw Data and Summary Statistics from February, 2012 to March, 2016:
1. Water Quality Data and Summary for Sawyers Swamp Creek WX7 and Background at Dump Creek WX11 2. Water Quality Data and Summary for Lidsdale Cut WX5
3. Water Quality Data and Summary for Sawyers Swamp Creek at WX1, upstream of SSCAD. EANSW site 92 4. Water Quality Data and Summary for SSCAD Groundwater Seepage Detection Bores WGM1/D3 and 1/D4 5. Water Quality Data and Summary for Background Groundwater Bore WGM1/D2
6. Water Quality Data and Summary for KVAD and KVAR Stage I and II Dry Ash Placements Seepage Detection Groundwater Bores WGM1/D5 and 1/D6 7. Water Quality Data and Summary for SSCAD (includes data from April, 2010 to January, 2012)
8. Water Quality Data and Summary for Sawyers Swamp Creek Monitoring from SSCAD Spillway to near WGM4/D5 Sawyers Swamp Creek EANSW & LLI WQ monitoring February, 2010 to March, 2015, including:
− Sawyer Swamp Creek at WX1, upstream SSCAD. EANSW Site 92
− Sawyers Swamp creek upstream @0 m where SSCAD diversion and Springvale Mine Water from August, 2012 enters SSC at spillway

− Sawyers Swamp Creek Ash Dam Seepage from V-notch (water collected and recycling back into dam)
− Sawyers Swamp Creek at @850m - upstream seepage from KVAD wall and Below SSCAD v-notch Seepage Point. EANSW Site 93 from June, 2012
− Sawyers Swamp Creek at 1250 m near GW Bore D5. EANSW Site 83
− KVAD/R Seepage water Northern wall collection pit near GW6 Groundwater from the KVAD on the northside drains
− KVAD southwestern seepage at Site 94
− KVAD groundwater Bores GW11, AP09 and AP17

1. Water Quality Data and Summary for Sawyers Swamp Creek WX7 and Background at Dump Creek WX11
a) SAWYERS SWAMP CEEK AT WOLGAN ROAD BRIDGE WX7 (mg/L)
Sawyers Swamp Creek WX7 Pre-Dry Ash Placement Summa ry 1991-April, 2003 (mg/L)
Ag Al ALK As B Ba Be Ca Cd Cl COND Cr Cu F Fe Hg K Mg
Average 0.001 0.274 22 0.001 0.919 0.037 20 0.001 19 44042 0.001 0.004 0.612 0.291 0.0001 12 15
Maximum <0.01 0.647 84 <0.05 2.900 0.045 57 <0.002 82 147800 <0.01 0.009 3.100 0.927 0.0002 36 39
Minimum 0.001 0.105 5 0.001 0.205 0.030 4 0.001 6 3000 0.001 0.001 0.110 0.050 0.0001 1 4
90th
Percentile 0.001 0.4927 33 0.001 2.331 0.043 38 0.001 27 76000 0.001 0.007 1.1 0.507 0.0002 27 22
*Outliers
Continued…………Sawyers Swamp Creek WX7 Pre-Dry Ash Pl acement Summary 1991-April, 2003 (mg/L)
Mn Mo NO2+NO3 Na NFR Ni Ortho P Pb pH Se SiO2 SO4 TDS TOT P Zn
Average 0.635 0.061 40 21 0.006 0.002 7.0 0.002 12.2 160 308 0.017 0.099
Maximum 1.510 0.199 120 326 0.031 <0.01 9.3 <0.006 75.0 540 800 0.093 0.342
Minimum 0.153 0.009 11 2 0.001 0.001 6.1 0.001 0.1 38 20 0.001 0.004
90th
Percentile 0.829 0.1158 86 23 0.013 0.003 7.6 0.003 22.4 323 584 0.047 0.153
*Outliers

Sawyers Swamp Creek WX7 Post-Stage 2A Ash Placement Data (mg/l) February, 2012 to March, 2015.
Date Ag Al ALK As B Ba Be Ca Cd Cl COND Cr Cu F Fe Hg K Mg Mn Mo NO2+NO3 Na NFR Ni
Ortho
P Pb pH Se SiO2 SO4
22-Feb-12 0.001 20.5 114 0.004 0.66 0.043
24 0.0019 12 601 0.003 0.006 1.5 0.005 0.00005 14.5 13.1 0.604 0.003 0.25 85.2 102 0.076 0.004 7.61 <0.002 157
8-Mar-12 0.001 3.4 24 <0.001 0.38 0.036
13.7 0.00055 11 313 <0.001 0.002 0.5 0.01 0.00005 8.96 7.19 0.468 0.005 0.3 30.8 26.5 0.037 <0.001 7.11 <0.002 95
19-Apr-12 0.001 18.2 4 0.001 1.63 0.034
37.2 0.0029 16 800 0.002 0.005 2.9 0.08 0.00005 29 17.5 1.88 0.003 0.25 91.2 51.2 0.143 0.001 5.24 0.001 351
23-May-12 0.001 272 12 0.01 3.16 0.056
68.5 0.0075 19 1342 0.055 0.026 8.9 0.034 0.00005 54.4 30.7 3.67 0.01 0.25 132 1088 0.281 0.015 4.6 0.002 648
21-Jun-12 0.001 2.7 38 <0.001 0.77 0.034
26.8 0.0003 18 612 <0.001 0.002 0.6 0.015 0.00005 11.2 20.8 1.6 0.003 0.25 63.4 20.9 0.084 0.001 7.08 <0.002 229
27-Jul-12 0.001 1.2 272 0.002 0.34 0.025
14.3 0.0002 12 763 <0.001 0.002 0.7 0.049 0.00005 8.87 10.6 0.648 0.009 0.3 142 34 0.034 <0.001 8.14 <0.002 118
15-Aug-12 0.001 6.3 97 0.006 0.46 0.046
18.6 0.0002 16 555 0.002 0.004 0.7 0.031 0.00005 8.83 12 0.602 <0.001 0.25 79.7 67.1 0.059 0.002 7.34 0.001 158
13-Sep-12 0.001 5.8 148 0.003 0.45 0.046
20.2 0.0002 16 647 0.002 0.004 0.9 0.025 0.00005 10.4 11.2 0.001 0.001 0.25 115 45.2 0.032 0.003 7.63 <0.002 148
11-Oct-12 0.001 1.3 395 0.003 0.31 0.023
13.5 0.0002 10 883 <0.001 0.003 1.0 3.04 0.00005 11.1 8.19 0.341 0.018 0.3 211 23.8 0.021 0.001 8.16 0.001 88
14-Nov-12 0.001 0.4 479 0.006 0.33 0.019
12.3 0.0002 7 1061 <0.001 0.002 1.4 0.073 0.00005 12.8 8.25 0.158 0.022 0.3 239 7.1 0.026 0.001 8.2 <0.002 83
12-Dec-12 0.001 0.3 513 0.013 0.09 0.018
5.97 0.0002 6 1032 <0.001 0.001 1.2 0.009 0.00005 11.8 2.98 0.014 0.025 0.55 238 12.6 0.007 <0.001 8.63 0.001 29
17-Jan-13 0.001 0.3 515 0.011 0.10 0.017
5.8 0.0002 5 998 <0.001 0.002 1.1 0.087 0.00005 11.3 2.73 0.001 0.042 0.45 222 6.79 0.004 0.002 8.16 0.001 27
21-Feb-13 0.001 0.2 512 0.012 0.11 0.014
6.35 0.0002 5 1011 <0.001 0.001 1.3 0.085 0.00005 10.5 2.91 0.016 0.031 0.4 284 3 0.007 <0.001 8.47 0.001 29
13-Mar-13 0.001 0.2 481 0.011 0.10 0.017
5.86 0.0002 5 977 <0.001 0.078 1.3 0.084 0.00005 11.9 3.32 0.033 0.024 0.25 240 3.73 0.009 0.004 8.47 0.001 31

Sawyers Swamp Creek WX7 Post-Stage 2A Ash Placement Data (mg/l) April, 2013 to March, 2015
Date Ag Al Al_Filt ALK As B Ba Be Ca Cd Cl COND Cr Cu Cu_Filt F Fe Hg K Mg Mn Mo NO2+NO3 Na NFR Ni Ortho
P Pb pH Se SiO2 SO4 TDS TKN TN TOT
P Zn Zn_filt
10-Apr-13 0.0005 0.15 0.04 510 0.012 0.1 0.019 5.5 0.0001 5 1000 0.0005 0.0005 0.0005 1.4 0.00003 12.00 3.00 0.033 230 0.005 0.001 8.6 0.001 28 550 0.4 0.028 0.009
17-May-13 0.0005 0.24 0.03 510 0.014 0.08 0.02 5.7 0.0001 5 1000 0.0005 0.029 0.0005 1.3 0.00003 11.00 2.90 0.034 230 0.005 0.003 8.5 0.001 27 640 0.55 0.037 0.008
13-Jun-13 0.0005 0.22 0.06 550 0.017 0.09 0.019 6.5 0.0001 6 1000 0.0005 0.003 0.0005 1.2 0.00003 10.00 3.00 0.034 240 0.005 0.001 8.6 0.001 32 680 0.55 0.03 0.011
11-Jul-13 0.0005 0.08 0.03 560 0.014 0.11 0.018 5.8 0.0001 5 1100 0.0005 0.0005 0.0005 1.2 0.00003 12.00 4.00 0.034 260 0.004 0.0005 8.7 0.001 30 650 0.55 0.025 0.007
23-Aug-13 0.0005 0.2 0.02 600 0.013 0.09 0.022 5.2 0.0001 5 1100 0.001 0.0005 0.0005 0.05 0.00003 11.00 3.00 0.034 260 0.004 0.0005 8.7 0.001 27 670 0.6 0.02 0.007
26-Sep-13 0.0005 0.33 0.16 550 0.016 0.08 0.027 6.1 0.0001 5 1100 0.002 0.001 0.0005 0.1 0.00003 11.00 4.00 0.035 250 0.005 0.001 8.6 0.001 38 740 0.65 0.03 0.025
23-Oct-13 0.0005 0.12 0.02 590 0.018 0.11 0.021 4.9 0.0001 6 1200 0.002 0.0005 0.0005 1.2 0.00003 11.00 3.00 0.037 270 0.005 0.0005 8.7 0.001 40 800 0.5 0.023 0.007
6-Nov-13 0.0005 0.12 0.06 580 0.025 0.1 0.022 4.5 0.0001 5 1200 0.002 0.0005 0.0005 1.1 0.00003 11.00 3.00 0.037 260 0.005 0.0005 8.7 0.001 37 710 0.6 0.025 0.009
5-Dec-13 0.0005 0.14 0.08 540 0.024 0.11 0.022 5.1 0.0001 5 1200 0.002 0.0005 0.0005 1.5 0.00003 10.00 3.00 0.036 250 0.007 0.0005 8.7 0.001 45 680 0.6 0.029 0.006
15-Jan-14 0.0005 0.17 0.05 560 0.024 0.1 0.026 5 0.0001 5 1200 0.002 0.001 0.0005 1.2 0.00003 11.00 3.00 0.04 260 0.007 0.0005 8.7 0.001 39 660 0.65 0.021 0.0025
5-Feb-14 0.0005 0.13 0.04 560 0.025 0.09 0.025 4.5 0.0001 5 1200 0.002 0.0005 0.0005 1.1 0.00003 10.00 3.00 0.045 230 0.008 0.0005 8.7 0.001 41 660 0.6 0.024 0.007
5-Mar-14 0.0005 0.2 0.05 530 0.025 0.1 0.027 5 0.0001 5 1100 0.002 0.001 0.0005 1 0.00003 12.00 3.00 0.042 250 0.008 0.0005 8.7 0.001 42 700 0.6 0.031 0.008
3-Apr-14 0.0005 0.46 0.04 520 0.02 0.1 0.029 5.7 0.0001 6 1100 0.002 0.0005 0.0005 1.2 0.00003 12.00 3.00 0.04 260 0.008 0.001 8.7 0.001 42 730 0.35 0.028 0.008
1-May-14 0.0005 0.15 0.03 570 0.021 0.09 0.024 5.1 0.0001 5 1100 0.0005 0.0005 0.0005 1 0.00003 10.00 3.00 0.04 240 0.006 0.0005 8.7 0.001 39 720 0.4 0.032 0.01
12-Jun-14 0.0005 0.26 0.17 580 0.022 0.08 0.028 5.1 0.0001 5 1200 0.0005 0.0005 0.0005 1 0.00003 11.00 3.00 0.04 260 0.007 0.001 8.8 0.001 36 700 0.6 0.04 0.019
10-Jul-14 0.0005 0.16 0.04 530 0.021 0.1 0.024 6 0.0001 5 1200 0.0005 0.0005 0.0005 1.1 0.00003 11.00 3.00 0.04 260 0.007 0.001 8.7 0.001 39 740 0.55 0.031 0.009
14-Aug-14 0.0005 0.16 0.03 560 0.025 0.08 0.019 3.8 0.0001 5 1100 0.0005 0.0005 0.0005 1.3 0.00003 7.00 1.00 0.11 250 0.005 0.0005 8.7 0.001 31 680 0.5 0.03 0.0025
11-Sep-14 0.0005 0.23 0.07 560 0.029 0.08 0.027 4.8 0.0001 5 1100 0.0005 0.0005 0.0005 1.2 0.00003 10.00 3.00 0.04 240 0.005 0.0005 8.8 0.001 35 670 0.5 0.01 0.0025
23-Oct-14 0.0005 0.2 0.11 580 0.024 0.09 0.027 5 0.0001 5 1200 0.0005 0.0005 0.0005 1.2 0.00003 11.00 3.00 0.049 270 0.005 0.0005 8.8 0.001 38 700 0.6 0.03 0.006
13-Nov-14 0.0005 0.11 0.05 600 0.026 0.08 0.026 5.1 0.0001 6 1200 0.0005 0.0005 0.0005 1.3 0.00003 12.00 3.00 0.053 290 0.003 0.0005 8.8 0.001 38 720 0.35 0.024 0.0025
11-Dec-14 0.0005 0.2 0.06 580 0.028 0.08 0.029 5.4 0.0001 6 1100 0.0005 0.0005 0.0005 1.2 0.00003 12.00 3.00 0.06 280 0.006 0.0005 8.7 0.001 41 740 0.6 0.012 0.006
15-Jan-15 0.0005 0.17 0.06 580 0.029 0.09 0.028 5.6 0.0001 5 1100 0.0005 0.0005 0.0005 1.2 0.00003 12.00 4.00 0.045 280 0.005 0.0005 8.7 0.001 39 730 0.6 0.011 0.0025
12-Feb-15 0.0005 0.94 0.03 540 0.032 0.09 0.039 4.9 0.0001 6 1200 0.0005 0.001 0.0005 1.2 0.00003 12.00 3.00 0.058 270 0.005 0.002 8.8 0.001 39 730 0.75 0.011 0.0025
11-Mar-15 0.0005 0.43 0.06 520 0.012 0.07 0.021 4.5 0.0001 6 1100 0.0005 0.002 0.0005 1.2 0.00003 8.00 2.00 0.027 260 0.004 0.0005 8.8 0.001 31 710 0.5 0.015 0.009
Sawyers Swamp Creek WX7 Post-Stage 2A Ash Placement Data (mg/l) April, 2013 to March, 2015
Ag Al Al_Filt ALK As B Ba Be Ca Cd Cl COND Cr Cu Cu_Filt F Fe Hg K Mg Mn Mo NO2+NO3 Na NFR Ni Ortho P Pb pH Se SiO2 SO4 TDS TKN TN TOT P Zn Zn_filt
Average <0.001 0.2 0.058 556.7 0.022 0.091 0.025 5 0.0001 5.2917 1126 0.0010 0.0019 0.0005 1.10 0.00003 11 3 0.043 256 0.006 0.0008 8.7 0.001 36 696 0.55 0.025 0.0078
Maximum <0.001 0.9 0.170 600.0 0.032 0.110 0.039 7 0.0001 6.0000 1200 0.0020 0.0290 0.0005 1.50 0.00003 12 4 0.110 290 0.008 0.0030 8.8 0.001 45 800 0.75 0.040 0.0250
Minimum <0.001 0.08 0.020 510.0 0.012 0.070 0.018 4 0.0001 5.0000 180 0.0005 0.0005 0.0005 0.05 0.00003 7 1 0.027 230 0.003 0.0005 8.5 0.001 27 550 0.35 0.010 0.0025
50th Percentile 0.001 0.17 0.050 560.0 0.024 0.090 0.026 5 0.0001 5.0000 1100 0.0005 0.0005 0.0005 1.20 0.00003 11 3 0.040 260 0.005 0.0005 8.7 0.001 39 710 0.60 0.025 0.0070

Sawyers Swamp Creek WX7 Post-Stage 2A Ash Placement Data (mg/l) April, 2015 to March, 2016
Date Ag Al Al_Filt ALK As B Ba Be Ca Cd Cl COND Cr Cu Cu_Filt F Fe Hg K Mg Mn Mo NO2+NO3 Na NFR Ni Ortho
P Pb pH Se SiO2 SO4 TDS TKN TN TOT
P Zn Zn_filt
9-Apr-15 0.0005 0.43 0.05 520 0.014 0.12 0.034 6.6 0.0001 7 1100 0.001 0.001 0.001 1.2 0.05 0.00003 11.00 4.00 0.064 0.041 2 250 0.007 0.001 8.8 0.001 46 700 250 0.60 0.016 0.006
28-May-15 0.0005 0.27 0.02 560 0.016 0.06 0.033 4.8 0.0001 7 1100 0.001 0.001 0.001 1.1 0.02 0.00002 11.00 3.00 0.009 0.044 2 220 0.003 0.001 8.8 0.001 37 680 220 0.55 0.009 0.006
17-Jun-15 0.0005 0.31 0.06 618 0.015 0.08 0.031 4.5 0.0001 7 1100 0.001 0.001 0.001 1.1 0.05 0.00002 11.00 3.00 0.026 0.043 2 240 0.005 0.001 8.8 0.001 37 620 240 0.60 0.014 0.006
15-Jul-15 0.0005 0.43 0.03 619 0.023 0.09 0.028 4.44 0.0001 6.06 1100 0.001 0.001 0.001 1.4 0.011 0.00002 12.30 3.25 0.008 0.043 0.43 260 0.003 0.001 8.8 0.0001 55.1 611 260 0.70 0.01 0.005
19-Aug-15 0.0005 0.28 0.03 629 0.021 0.24 0.025 4.33 0.0001 5.8 1100 0.001 0.001 0.001 0.991 0.019 0.00002 12.20 3.10 0.008 0.044 0.54 262 0.004 0.001 8.8 0.0001 36.2 530 262 0.70 0.008 0.005
16-Sep-15 0.0005 0.31 0.04 606 0.019 0.07 0.031 4.79 0.0001 6.01 1100 0.001 0.001 0.001 0.714 0.01 0.00002 13.50 3.40 0.006 0.044 0.59 282 0.004 0.001 8.8 0.0001 34.9 630 282 0.80 0.011 0.005
21-Oct-15 0.0005 0.5 0.09 550 0.017 0.08 0.029 4.51 0.0001 6.31 1200 0.001 0.001 0.001 1.29 0.023 0.00002 14.80 3.33 0.006 0.043 0.550 259 0.004 0.001 8.8 0.0003 37.5 674 259 1.00 0.011 0.005
18-Nov-15 0.0005 0.46 0.09 536 0.029 0.18 0.034 5.12 0.0001 5.18 1200 0.001 0.001 0.001 1.03 0.024 0.00002 14.10 3.50 0.019 0.05 0.660 252 0.006 0.001 8.8 0.0004 35.3 702 252 1.10 0.012 0.005
9-Dec-15 0.0005 0.35 0.25 562 0.027 0.33 0.03 5.43 0.0001 5.22 1200 0.001 0.001 0.001 1.32 0.019 0.00002 14.10 3.70 0.038 0.042 0.660 301 0.009 0.001 8.7 0.0003 34.3 736 301 1.00 0.016 0.008
20-Jan-16 0.0005 0.46 0.06 654 0.028 0.08 0.029 4.69 0.0001 5.02 1300 0.001 0.001 0.001 1.43 0.02 0.00002 12.50 3.14 0.009 0.048 0.5 318 0.003 0.001 8.7 0.0003 35 672 318 0.80 0.006 0.006
11-Feb-16 0.0005 0.25 0.04 575 0.036 0.26 0.044 5.14 0.0001 5.51 1200 0.001 0.001 0.001 1.34 0.038 0.00002 13.00 3.51 0.007 0.047 0.57 281 0.008 0.001 8.8 0.0003 35 737 281 2.60 0.026 0.005
16-Mar-16 0.0005 1.18 0.05 649 0.028 0.12 0.028 4.08 0.0001 4.74 1200 0.001 0.001 0.001 1.13 0.018 0.00002 10.50 2.85 0.007 0.045 0.53 313 0.004 0.001 8.7 0.0002 33.7 614 313 0.80 0.009 0.005
Sawyers Swamp Creek WX7 Post-Stage 2A Ash Placement Data (mg/l) April, 2015 to March, 2016
Ag Al Al_Filt ALK As B Ba Be Ca Cd Cl COND Cr Cu Cu_Filt F Fe Hg K Mg Mn Mo NO2+NO3 Na NFR Ni Ortho P Pb pH Se SiO2 SO4 TDS TKN TN TOT P Zn Zn_filt
Average 0.0005 0.4 0.068 589.8 0.023 0.143 0.031 5 0.0001 5.9042 1158 0.0010 0.0010 0.001 1.17
0.03
0.00002 13 3
0.02 0.045 0.919 270 0.005 0.0010 8.8
0.000
4 38 659 0.94 0.012 0.0056
Maximum 0.0005 1.2 0.250 654.0 0.036 0.330 0.044 7 0.0001 7.0000 1300 0.0010 0.0010 0.001 1.43
0.05
0.00003 15 4
0.06 0.050 2.000 318 0.009 0.0010 8.8
0.001 55 737 2.60 0.026 0.0080
Minimum
0.0005 0.3 0.020 520.0 0.014 0.060 0.025 4 0.0001 4.7400 1100 0.0010 0.0010 0.001 0.71 0.01
0.00002 11 3
0.01 0.041 0.430 220 0.003 0.0010 8.7
0.000
1 34 530 0.55 0.006 0.0050
50th Percentile 0.0005 0.3 0.050 590.5 0.022 0.105 0.031 5 0.0001 5.9050 1150 0.0010 0.0010 0.001 1.17
0.02
0.00002 12 3
0.01 0.044 0.580 261 0.004 0.0010 8.8
0.000
3 36 673 0.80 0.011 0.0050

b) Water Quality Data and Summary for Background at Dump Creek WX11
Dump Creek WX11 Pre-Dry Ash Placement Background Su mmary 1991-April, 2003 (mg/L)
Ag Al ALK As B Ba Be Ca Cd Cl COND Cr Cu F Fe Hg K Mg Mn Mo Na NFR Ni Pb pH Se SO4 TDS Zn Mn
Average 0.001 0.13 7 0.001 0.64 0.03 32 0.001 23 56732 0.001 0.002 0.539 1.36 0.0002 23 24 0.63 76 5 0.001 6.6 0.002 209 559 0.09 0.63
Maximum 0.001 0.38 16 0.001 3.30 0.05 71 0.001 83 137113 0.001 0.002 1.200 11.00 0.0002 36 42 2.20 156 12 0.001 8.0 0.003 593 984 0.32 2.20
Minimum 0.001 0.04 0 0.001 0.04 0.02 18 0.001 8 32000 0.001 0.001 0.200 0.03 0.0002 14 14 0.09 39 2 0.001 3.6 0.001 88 362 0.00 0.09
90th Percentile 0.001 0.30 15 0.001 1.45 0.05 58 0.001 39 77000 0.001 0.002 1.100 2.38 0.0002 31 35 1.94 110 8 0.001 8.0 0.003 325 772 0.28 1.94

Dump Creek WX11 Post-Dry Ash Placement Data (mg/l) April, 2013 to March, 2015
Date Ag Al ALK As B Ba Be Ca Cd Cl COND Cr Cu F Fe Hg K Mg Mn Mo Na NFR Ni Pb pH Se SO4 TDS Zn
10-Apr-13 0.0005 3 12.5 0.0005 3.2 0.02 78 0.0005 24 1800 0.0005 0.006 2.3 0.000025 33 76 0.01 120 0.5 0.005 3.1 0.001 868 1200 1.6
17-May-13 0.0005 3.7 12.5 0.0005 1.8 0.02 59 0.0008 25 1500 0.0005 0.007 1.8 0.000025 25 61 0.01 90 0.42 0.005 3.2 0.001 640 960 1.1
13-Jun-13 0.0005 2.4 12.5 0.0005 1.2 0.012 39 0.0008 18 1000 0.0005 0.004 1 0.000025 15 39 0.00 58 0.29 0.003 3.3 0.001 420 590 1
11-Jul-13 0.0005 3.2 12.5 0.0005 2.8 0.017 69 0.0008 24 1500 0.0005 0.004 1.9 0.000025 28 69 0.00 110 0.47 0.004 3.3 0.001 720 1100 1.2
23-Aug-13 0.0005 3.6 12.5 0.0005 2.2 0.017 64 0.0007 26 1400 0.002 0.005 1.5 0.000025 23 67 0.00 98 0.36 0.005 3.2 0.001 660 970 1.1
26-Sep-13 0.0005 3.2 12.5 0.0005 2 0.022 59 0.0007 27 1400 0.002 0.013 1.5 0.000025 22 60 0.00 93 0.41 0.005 3.3 0.001 660 1000 1.2
23-Oct-13 0.0005 4 12.5 0.0005 2.7 0.025 70 0.0008 28 1700 0.002 0.009 2.1 0.000025 27 71 0.00 110 0.47 0.009 3.1 0.001 810 1200 1.4
6-Nov-13 0.0005 4.1 12.5 0.001 3 0.024 81 0.0009 27 1800 0.003 0.014 2.4 0.000025 33 80 0.00 130 0.62 0.009 3.2 0.001 950 1300 1.7
5-Dec-13 0.0005 4.1 12.5 0.0005 3.3 0.021 86 0.0009 26 1900 0.003 0.006 2.9 0.000025 35 84 0.00 130 0.65 0.007 3.1 0.001 980 1200 1.5
15-Jan-14 0.0005 3.6 12.5 0.0005 3.6 0.027 89 0.0007 25 2000 0.002 0.016 2.5 0.000025 39 86 0.00 130 0.67 0.008 3.1 0.001 1000 1400 1.6
5-Feb-14 0.0005 3.4 12.5 0.0005 3.6 0.025 93 0.0006 24 2000 0.002 0.008 2.4 0.000025 39 88 0.00 120 0.67 0.006 3 0.001 1000 1400 1.8
5-Mar-14 0.0005 3.6 12.5 0.0005 3.4 0.025 91 0.0009 24 2000 0.002 0.007 2.1 0.000025 36 82 0.00 120 0.66 0.006 3.1 0.001 980 1500 1.6
3-Apr-14 0.0005 3.7 12.5 0.0005 3.6 0.023 94 0.0008 24 2000 0.002 0.01 2.1 0.000025 40 88 0.00 120 0.65 0.007 3.1 0.001 1100 1500 1.5
1-May-14 0.0005 3.9 12.5 0.0005 3.3 0.017 90 0.0007 22 2000 0.001 0.003 2.5 0.000025 36 86 0.00 110 0.62 0.006 3.1 0.001 1000 1400 1.4
12-Jun-14 0.0005 4.1 12.5 0.0005 3 0.016 88 0.0008 21 2000 0.001 0.005 2.2 0.000025 34 83 0.00 120 0.63 0.006 3.1 0.001 840 1400 1.7
10-Jul-14 0.0005 4.5 12.5 0.0005 3.9 0.017 110 0.0006 20 2100 0.001 0.003 3.1 0.000025 38 98 0.00 130 0.72 0.006 3.1 0.001 1000 1100 1.8
14-Aug-14 0.0005 5.2 12.5 0.001 3.4 0.016 97 0.0008 24 2100 0.001 0.003 3.1 0.000025 34 93 0.00 120 0.7 0.007 3.1 0.001 1200 1500 2.1
11-Sep-14 0.0005 1.7 12.5 0.0005 0.73 0.017 28 0.0005 14 690 0.001 0.009 0.8 0.000025 10 24 0.00 38 0.17 0.003 3.6 0.001 280 380 0.6
23-Oct-14 0.0005 5.3 12.5 0.0005 3.3 0.017 89 0.0008 24 1900 0.001 0.006 2.7 0.000025 32 84 0.00 110 0.61 0.008 3.1 0.001 920 1300 1.6
13-Nov-14 0.0005 6.9 12.5 0.001 3.8 0.031 110 0.0009 34 2200 0.001 0.011 3.9 0.000025 38 100 0.00 140 0.64 0.009 3.1 0.004 1200 1600 1.8
11-Dec-14 0.0005 2.7 12.5 0.0005 1.7 0.019 51 0.0007 15 1200 0.0005 0.004 1.8 0.000025 22 47 0.00 68 0.38 0.004 3.3 0.001 510 740 0.96
15-Jan-15 0.0005 4.2 12.5 0.0005 3.3 0.024 86 0.0006 20 1800 0.0005 0.007 2.6 0.000025 35 78 0.00 110 0.56 0.006 3.2 0.001 880 1300 1.3
12-Feb-15 0.0005 5.7 12.5 0.001 3.4 0.028 88 0.0009 26 2000 0.001 0.009 3.1 0.000025 36 84 0.00 120 0.61 0.009 3.1 0.001 980 1500 1.5
11-Mar-15 0.0005 5.7 12.5 0.001 2.8 0.025 88 0.0009 27 2000 0.001 0.006 3.3 0.000025 37 85 0.00 120 0.59 0.009 3.1 0.002 1100 1400 1.5
Dump Creek WX11 Post-Stage 2 Dry Ash Placement Post-Stage 2 Dry Ash Placement April, 2013 to March, 2015 (mg/l)
Ag Al ALK As B Ba Be Ca Cd Cl COND Cr Cu F Fe Hg K Mg Mn Mo Na NFR Ni Pb pH Se SO4 TDS Zn
Average 0.0 4.0 12.5 0.0 2.9 0.0 79.0 0.0 23.7 1749.6 0.0 0.0 2.3 0.0 31.1 75.5 0.0 109.0 0.5 0.0 3.2 0.0 862.4 1205.8 1.4
Maximum 0.0 6.9 12.5 0.0 3.9 0.0 110.0 0.0 34.0 2200.0 0.0 0.0 3.9 0.0 40.0 100.0 0.0 140.0 0.7 0.0 3.6 0.0 1200.0 1600.0 2.1
Minimum 0.00 1.70 12.50 0.00 0.73 0.01 28.00 0.00 14.00 690.00 0.00 0.00 0.80 0.00 10.00 24.00 0.00 38.00 0.17 0.00 3.00 0.00 280.00 380.00 0.60
50th Percentile 0.00 3.80 12.50 0.00 3.25 0.02 87.00 0.00 24.00 1900.00 0.00 0.01 2.35 0.00 34.00 82.50 0.00 120.00 0.61 0.01 3.10 0.00 935.00 1300.00 1.50

Dump Creek WX11 Post-Dry Ash Placement Data (mg/l) April, 2015 to March, 2016
Date Ag Al ALK As B Ba Be Ca Cd Cl COND Cr Cu F Fe Hg K Mg Mn Mo Na NFR Ni Pb pH Se SO4 TDS Zn
9-Apr-15 0.0005 3.9 12.5 0.001 2.5 0.023 67 0.0008 21 1600 0.001 0.007 2.3 0.00005 26 63 5.8 0.0005 86 0.44 0.006 3.2 0.001 730 1100 1.1
28-May-15 0.0005 3.6 12.5 0.001 1.9 0.018 66 0.0008 24 1500 0.001 0.005 1.7 0.00002 23 63 5.2 0.0005 83 0.39 0.005 3.3 0.001 690 980 1.1
17-Jun-15 0.0005 3.3 12.5 0.001 1.8 0.017 60 0.0006 24 1300 0.001 0.007 1.7 0.00002 24 55 4.6 0.0005 83 0.35 0.005 3.4 0.001 610 800 0.89
15-Jul-15 0.0005 1.42 0.5 0.001 0.65 0.013 28.8 0.0004 18.9 728 0.001 0.004 0.5 0.00002 10.6 24.4 2.01 0.0005 46.5 0.132 0.0005 3.75 0.0002 284 446 0.446
19-Aug-15 0.0005 4.23 0.5 0.001 2.76 0.016 63.6 0.0006 26.5 1580 0.001 0.007 0.857 0.00002 26.4 59.6 5.12 0.0005 95.2 0.46 0.005 3.31 0.0006 744 974 1.36
16-Sep-15 0.0005 3.43 0.5 0.001 2.3 0.017 67.3 0.0005 34.8 1462 0.001 0.006 1.08 0.00002 25.3 59.8 4.66 0.0005 104 0.335 0.003 3.48 0.0004 708 644 1.26
21-Oct-15 0.0005 1.14 0.5 0.001 0.53 0.018 21.7 0.0002 11.5 562 0.001 0.004 0.575 0.00002 12.2 15.7 1.49 0.0005 32.8 0.106 0.002 3.68 0.0001 224 346 0.376
18-Nov-15 0.0005 4.35 0.5 0.001 3.18 0.02 84.2 0.0007 19 1921 0.001 0.002 2.49 0.00002 37 71.6 7.04 0.0005 110 0.592 0.006 3.1 0.0005 948 1340 1.61
9-Dec-15 0.0005 4.13 0.5 0.001 3.76 0.02 95.8 0.0008 20.4 2098 0.001 0.008 2.78 0.00002 43.2 85.4 6.41 0.0005 126 0.663 0.005 2.92 0.0005 993 1400 1.7
20-Jan-16 0.0005 3.56 0.5 0.001 2.78 0.024 71 0.0005 20.8 1734 0.001 0.004 2.26 0.00002 32 67.1 5.94 0.0005 104 0.452 0.005 3.13 0.0004 806 1230 1.23
11-Feb-16 0.0005 4.34 0.5 0.001 3.23 0.02 81.2 0.0006 23.6 1889 0.001 0.006 2.26 0.00002 35.4 73.8 6.07 0.0005 112 0.515 0.005 2.94 0.0004 878 1090 1.42
16-Mar-16 0.0005 3.95 0.5 0.001 2.98 0.027 71.5 0.0007 20.3 1669 0.001 0.005 1.95 0.00002 29.9 65.4 5.61 0.0005 98.7 0.452 0.005 3.09 0.0004 777 1080 1.19
Dump Creek WX11 Post-Stage 2 Dry Ash Placement Post-Stage 2 Dry Ash Placement April, 2015 to March, 2016 (mg/l)
Ag Al ALK As B Ba Be Ca Cd Cl COND Cr Cu F Fe Hg K Mg Mn Mo Na NFR Ni Pb pH Se SO4 TDS Zn
Average 0.0005 3.9 10.5 0.0 2.7 0.0 76.4 0.0 23.2 1684.3 0.0013 0.0070 2.2 0.00004 30 71.27 4.13 0.001 103 0.515 0.006 3.2 0.001 830 1134 1.354
Maximum 0.0005 6.9 12.5 0.0 3.9 0.0 110.0 0.0 34.8 2200.0 0.0030 0.0160 3.9 0.00005 40 100.00 5.80 0.001 140 0.720 0.009 3.8 0.004 1200 1600 2.100
Minimum 0.0005 1.14 0.50 0.00 0.53 0.01 21.70 0.00 11.50 562.00 0.0010 0.0030 0.50 0.00002 10 15.70 1.49 0.001 33 0.106 0.001 3.00 0.000 224 346 0.376
50th Percentile 0.0005 3.90 12.50 0.00 3.15 0.02 87.00 0.00 24.00 1900.00 0.0010 0.0065 2.35 0.00005 34 82.50 4.66 0.001 115 0.610 0.006 3.10 0.001 935 1300 1.500

2. Water Quality Data and Summary for Lidsdale Cut WX5
Lidsdale Cut WX5 Pre-Dry Ash Placement Summary 1992 -April, 2003 (mg/L) Ag Al ALK As B Ba Be Ca Cd Cl COND Cr Cu F Fe Hg K Mg Mn Mo Na NFR Ni Pb pH Se SO4 TDS Zn Mn
Average 0.001 2.43 14 0.001 1.70 0.042 28 0.001 26 74991 0.003 0.003 1.50 0.51 0.0002 39 17 1.41 62 7 0.003 4.7 0.001 266 518 0.219 1.41
Maximum 0.001 3.17 50 0.001 2.17 0.060 32 0.001 78 113402 0.010 0.005 2.20 1.00 0.0002 53 21 2.34 84 15 0.004 6.9 0.001 400 671 0.397 2.34
Minimum 0.001 0.70 1 0.001 0.54 0.030 24 0.001 15 37800 0.001 0.002 0.98 0.07 0.0002 16 8 0.21 31 3 0.002 3.2 0.001 92 400 0.072 0.21
90th Percentile 0.001 3.08 38 0.001 2.16 0.054 31 0.001 34 95200 0.006 0.005 1.99 0.70 0.0002 51 20 2.12 77 13 0.004 6.9 0.001 359 650 0.304 2.12
Lidsdale Cut WX5 Post-Dry Ash Placement Data (mg/l) April, 2013 to March. 2015
Date Ag Al ALK As B Ba Be Ca Cd Cl COND Cr Cu F Fe Hg K Mg Mn Mo Na NFR Ni Pb pH Se SO4 TDS Zn
10-Apr-13
16-May-13
13-Jun-13
10-Jul-13
22-Aug-13
26-Sep-13 2.5
24-Oct-13 0.0005 220 12.5 0.031 19 0.025 340 0.084 32 4900 0.036 0.05 38 0.00005 270 120 2.5 0.0005 330 1.6 0.033 3.3 0.086 3700 5300 3.9
7-Nov-13 0.0005 220 12.5 17 0.018 340 0.065 34 4900 0.03 0.05 37 0.00005 290 120 2.5 0.0005 350 1.6 0.024 3.3 0.068 3900 5800 4.3
5-Dec-13 0.0005 180 12.5 0.026 14 0.048 280 0.044 31 4200 0.023 0.04 36 0.0001 230 91 2.5 0.0005 270 1.2 0.014 3.3 0.063 3300 4200 3.2
16-Jan-14 0.0005 120 12.5 0.015 12 0.032 220 0.036 27 3700 0.01 0.017 24 0.00005 200 72 2.5 0.0005 320 0.87 0.008 3.5 0.046 2500 3500 2.3
6-Feb-14 0.0005 140 12.5 0.017 13 0.026 260 0.034 32 4000 0.012 0.017 28 0.00005 220 85 2.5 0.0005 320 0.84 0.008 3.4 0.062 3000 4200 2.5
6-Mar-14 0.0005 52 12.5 0.009 4.9 0.075 97 0.017 16 1800 0.006 0.013 9 0.00005 73 28 2.5 0.0005 87 0.35 0.004 3.5 0.024 1000 1500 0.81
3-Apr-14 0.0005 18 12.5 0.004 2.1 0.062 49 0.0067 14 960 0.003 0.006 4.1 0.00005 37 19 2.5 0.0005 54 0.18 0.002 3.9 0.008 460 720 0.41
1-May-14 0.0005 66 12.5 0.012 6.6 0.042 140 0.016 19 2400 0.006 0.015 14 0.00005 100 52 2.5 0.0005 130 0.5 0.012 3.4 0.027 1400 2100 1.1
12-Jun-14 0.0005 150 12.5 0.017 12 0.025 260 0.039 25 3800 0.013 0.03 21 0.00005 180 85 2.5 0.0005 230 0.78 0.02 3.5 0.048 2400 3900 1.8
10-Jul-14 0.0005 180 12.5 0.037 13 0.021 290 0.042 29 4000 0.016 0.048 24 0.00005 190 92 2.5 0.0005 240 1.1 0.011 3.6 0.069 2600 4300 2.4
14-Aug-14 0.0005 120 12.5 0.02 10 0.029 240 0.035 28 3300 0.01 0.04 24 0.00005 150 86 2.5 0.0005 210 0.94 0.03 3.6 0.048 4900 3600 2.5
11-Sep-14 0.0005 33 12.5 0.004 3 0.11 68 0.009 13 1200 0.004 0.009 6.6 0.00005 47 24 2.5 0.0005 63 0.28 0.004 3.9 0.013 690 930 0.7
23-Oct-14 0.0005 40 12.5 0.005 4 0.021 90 0.01 13 1600 0.004 0.012 8.1 0.00005 63 31 2.5 0.0005 83 0.35 0.013 3.6 0.012 850 1200 0.78
13-Nov-14 0.0005 140 12.5 0.03 13 0.02 280 0.031 35 4000 0.013 0.032 29 0.00005 180 96 2.5 0.0005 240 1.1 0.028 3.3 0.046 3000 4100 2.8
11-Dec-14 0.0005 15 12.5 0.004 1.9 0.079 50 0.0047 10 890 0.001 0.006 3.8 0.00005 34 18 0.5 0.0005 49 0.19 0.003 3.8 0.006 420 600 0.37
15-Jan-15 0.0005 23 12.5 0.004 2.7 0.058 61 0.0055 11 1100 0.002 0.006 4.9 0.00005 43 25 2.5 0.0005 64 0.24 0.004 3.8 0.008 560 1000 0.48
12-Feb-15 0.0005 99 12.5 0.014 9.9 0.029 220 0.022 28 3400 0.008 0.02 19 0.00005 140 86 2.5 0.0005 200 0.9 0.036 3.2 0.04 2100 3200 2.5
11-Mar-15 0.0005 79 12.5 0.018 5.6 0.08 140 0.021 19 2200 0.009 0.023 15 0.00005 100 44 2.5 0.0005 130 0.52 0.008 3.5 0.041 1500 2000 1.3
Lidsdale Cut WX5 Post-Dry Ash Placement Data (mg/l) April, 2013 to March, 2015 (mg/l)
Ag al ALK As B Ba Be Ca Cd Cl COND Cr Cu F Fe Hg K Mg Mn Mo Na Mn Ni Pb pH Se SO4 TDS Zn
Average 0.0005 105 12.5 0.016 9.1 0.044 190 0.0290 23 2908 0.011 0.024 19.2 5.3E-05 142 65 2.4 0.0005 187 0.75 0.015 3.5 0.040 2127 2897 1.9
Maximum 0.0005 220 12.5 0.037 19.0 0.110 340 0.0840 35 4900 0.036 0.050 38.0 1.0E-04 290 120 2.5 0.0005 350 1.60 0.036 3.9 0.086 4900 5800 4.3
Minimum 0.0005 15 12.5 0.004 1.9 0.018 49 0.0047 10 890 0.001 0.006 3.8 5.0E-05 34 18 0.5 0.0005 49 0.18 0.002 3.2 0.006 420 600 0.4
50th Percentile 0.0005 110 12.5 0.015 10.0 0.031 220 0.0265 26 3350 0.010 0.019 20.0 5.0E-05 145 79 2.5 0.0005 205 0.81 0.012 3.5 0.044 2250 3350 2.1
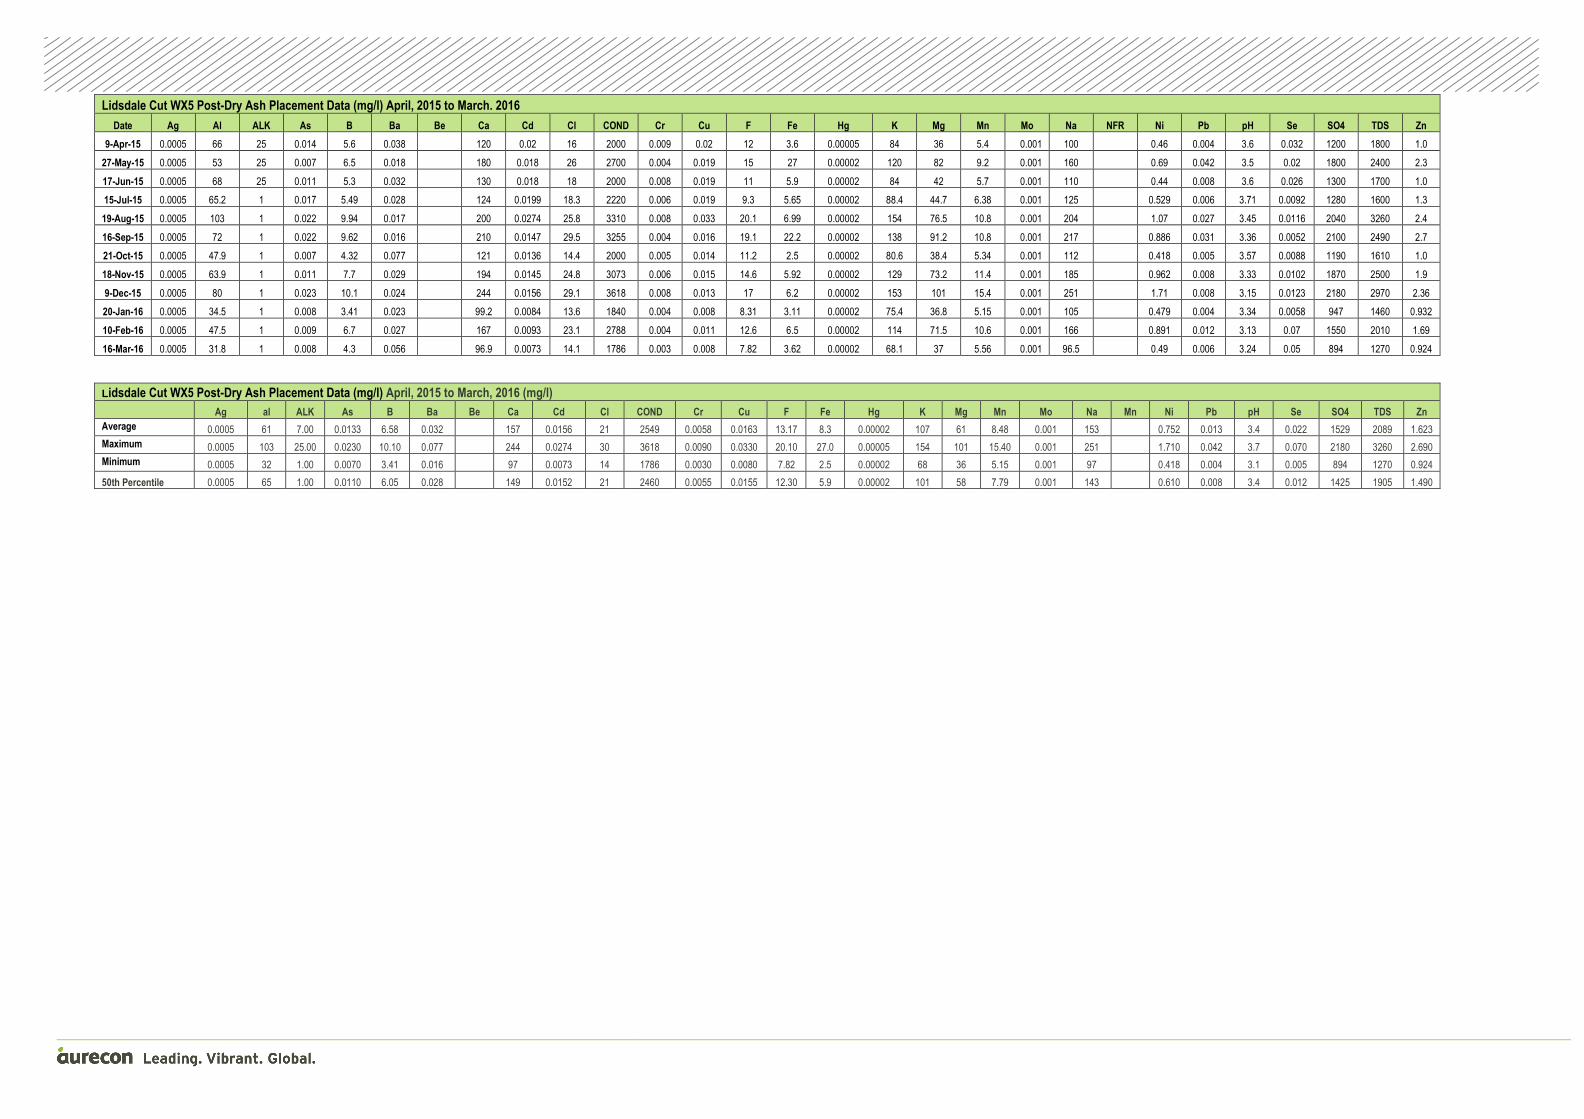
Lidsdale Cut WX5 Post-Dry Ash Placement Data (mg/l) April, 2015 to March. 2016
Date Ag Al ALK As B Ba Be Ca Cd Cl COND Cr Cu F Fe Hg K Mg Mn Mo Na NFR Ni Pb pH Se SO4 TDS Zn
9-Apr-15 0.0005 66 25 0.014 5.6 0.038 120 0.02 16 2000 0.009 0.02 12 3.6 0.00005 84 36 5.4 0.001 100 0.46 0.004 3.6 0.032 1200 1800 1.0
27-May-15 0.0005 53 25 0.007 6.5 0.018 180 0.018 26 2700 0.004 0.019 15 27 0.00002 120 82 9.2 0.001 160 0.69 0.042 3.5 0.02 1800 2400 2.3
17-Jun-15 0.0005 68 25 0.011 5.3 0.032 130 0.018 18 2000 0.008 0.019 11 5.9 0.00002 84 42 5.7 0.001 110 0.44 0.008 3.6 0.026 1300 1700 1.0
15-Jul-15 0.0005 65.2 1 0.017 5.49 0.028 124 0.0199 18.3 2220 0.006 0.019 9.3 5.65 0.00002 88.4 44.7 6.38 0.001 125 0.529 0.006 3.71 0.0092 1280 1600 1.3
19-Aug-15 0.0005 103 1 0.022 9.94 0.017 200 0.0274 25.8 3310 0.008 0.033 20.1 6.99 0.00002 154 76.5 10.8 0.001 204 1.07 0.027 3.45 0.0116 2040 3260 2.4
16-Sep-15 0.0005 72 1 0.022 9.62 0.016 210 0.0147 29.5 3255 0.004 0.016 19.1 22.2 0.00002 138 91.2 10.8 0.001 217 0.886 0.031 3.36 0.0052 2100 2490 2.7
21-Oct-15 0.0005 47.9 1 0.007 4.32 0.077 121 0.0136 14.4 2000 0.005 0.014 11.2 2.5 0.00002 80.6 38.4 5.34 0.001 112 0.418 0.005 3.57 0.0088 1190 1610 1.0
18-Nov-15 0.0005 63.9 1 0.011 7.7 0.029 194 0.0145 24.8 3073 0.006 0.015 14.6 5.92 0.00002 129 73.2 11.4 0.001 185 0.962 0.008 3.33 0.0102 1870 2500 1.9
9-Dec-15 0.0005 80 1 0.023 10.1 0.024 244 0.0156 29.1 3618 0.008 0.013 17 6.2 0.00002 153 101 15.4 0.001 251 1.71 0.008 3.15 0.0123 2180 2970 2.36
20-Jan-16 0.0005 34.5 1 0.008 3.41 0.023 99.2 0.0084 13.6 1840 0.004 0.008 8.31 3.11 0.00002 75.4 36.8 5.15 0.001 105 0.479 0.004 3.34 0.0058 947 1460 0.932
10-Feb-16 0.0005 47.5 1 0.009 6.7 0.027 167 0.0093 23.1 2788 0.004 0.011 12.6 6.5 0.00002 114 71.5 10.6 0.001 166 0.891 0.012 3.13 0.07 1550 2010 1.69
16-Mar-16 0.0005 31.8 1 0.008 4.3 0.056 96.9 0.0073 14.1 1786 0.003 0.008 7.82 3.62 0.00002 68.1 37 5.56 0.001 96.5 0.49 0.006 3.24 0.05 894 1270 0.924
Lidsdale Cut WX5 Post-Dry Ash Placement Data (mg/l) April, 2015 to March, 2016 (mg/l)
Ag al ALK As B Ba Be Ca Cd Cl COND Cr Cu F Fe Hg K Mg Mn Mo Na Mn Ni Pb pH Se SO4 TDS Zn
Average 0.0005 61 7.00 0.0133 6.58 0.032 157 0.0156 21 2549 0.0058 0.0163 13.17 8.3 0.00002 107 61 8.48 0.001 153 0.752 0.013 3.4 0.022 1529 2089 1.623
Maximum 0.0005 103 25.00 0.0230 10.10 0.077 244 0.0274 30 3618 0.0090 0.0330 20.10 27.0 0.00005 154 101 15.40 0.001 251 1.710 0.042 3.7 0.070 2180 3260 2.690
Minimum 0.0005 32 1.00 0.0070 3.41 0.016 97 0.0073 14 1786 0.0030 0.0080 7.82 2.5 0.00002 68 36 5.15 0.001 97 0.418 0.004 3.1 0.005 894 1270 0.924
50th Percentile 0.0005 65 1.00 0.0110 6.05 0.028 149 0.0152 21 2460 0.0055 0.0155 12.30 5.9 0.00002 101 58 7.79 0.001 143 0.610 0.008 3.4 0.012 1425 1905 1.490
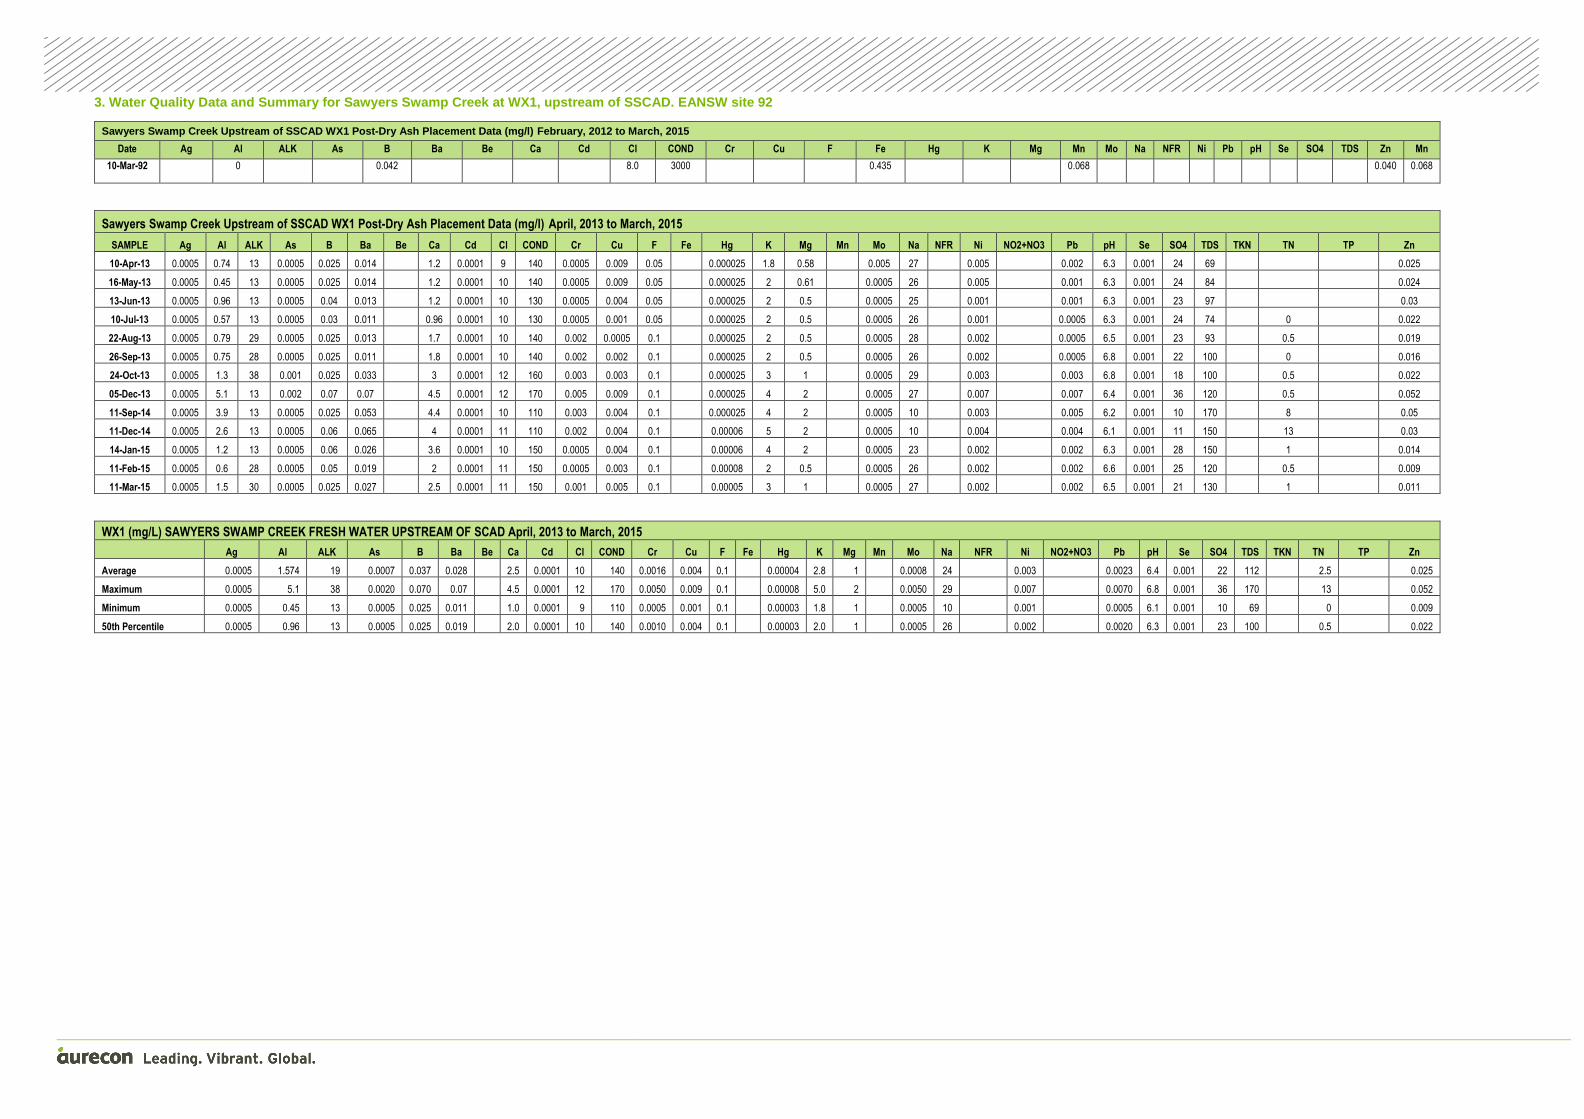
3. Water Quality Data and Summary for Sawyers Swamp Creek at WX1, upstream of SSCAD. EANSW site 92
Sawyers Swamp Creek Upstream of SSCAD WX1 Post-Dry Ash Placement Data (mg/l) February, 2012 to March, 2015
Date Ag Al ALK As B Ba Be Ca Cd Cl COND Cr Cu F Fe Hg K Mg Mn Mo Na NFR Ni Pb pH Se SO4 TDS Zn Mn
10-Mar-92 0 0.042 8.0 3000 0.435 0.068 0.040 0.068
Sawyers Swamp Creek Upstream of SSCAD WX1 Post-Dry Ash Placement Data (mg/l) April, 2013 to March, 2015
SAMPLE Ag Al ALK As B Ba Be Ca Cd Cl COND Cr Cu F Fe Hg K Mg Mn Mo Na NFR Ni NO2+NO3 Pb pH Se SO4 TDS TKN TN TP Zn
10-Apr-13 0.0005 0.74 13 0.0005 0.025 0.014 1.2 0.0001 9 140 0.0005 0.009 0.05 0.000025 1.8 0.58 0.005 27 0.005 0.002 6.3 0.001 24 69 0.025
16-May-13 0.0005 0.45 13 0.0005 0.025 0.014 1.2 0.0001 10 140 0.0005 0.009 0.05 0.000025 2 0.61 0.0005 26 0.005 0.001 6.3 0.001 24 84 0.024
13-Jun-13 0.0005 0.96 13 0.0005 0.04 0.013 1.2 0.0001 10 130 0.0005 0.004 0.05 0.000025 2 0.5 0.0005 25 0.001 0.001 6.3 0.001 23 97 0.03
10-Jul-13 0.0005 0.57 13 0.0005 0.03 0.011 0.96 0.0001 10 130 0.0005 0.001 0.05 0.000025 2 0.5 0.0005 26 0.001 0.0005 6.3 0.001 24 74 0 0.022
22-Aug-13 0.0005 0.79 29 0.0005 0.025 0.013 1.7 0.0001 10 140 0.002 0.0005 0.1 0.000025 2 0.5 0.0005 28 0.002 0.0005 6.5 0.001 23 93 0.5 0.019
26-Sep-13 0.0005 0.75 28 0.0005 0.025 0.011 1.8 0.0001 10 140 0.002 0.002 0.1 0.000025 2 0.5 0.0005 26 0.002 0.0005 6.8 0.001 22 100 0 0.016
24-Oct-13 0.0005 1.3 38 0.001 0.025 0.033 3 0.0001 12 160 0.003 0.003 0.1 0.000025 3 1 0.0005 29 0.003 0.003 6.8 0.001 18 100 0.5 0.022
05-Dec-13 0.0005 5.1 13 0.002 0.07 0.07 4.5 0.0001 12 170 0.005 0.009 0.1 0.000025 4 2 0.0005 27 0.007 0.007 6.4 0.001 36 120 0.5 0.052
11-Sep-14 0.0005 3.9 13 0.0005 0.025 0.053 4.4 0.0001 10 110 0.003 0.004 0.1 0.000025 4 2 0.0005 10 0.003 0.005 6.2 0.001 10 170 8 0.05
11-Dec-14 0.0005 2.6 13 0.0005 0.06 0.065 4 0.0001 11 110 0.002 0.004 0.1 0.00006 5 2 0.0005 10 0.004 0.004 6.1 0.001 11 150 13 0.03
14-Jan-15 0.0005 1.2 13 0.0005 0.06 0.026 3.6 0.0001 10 150 0.0005 0.004 0.1 0.00006 4 2 0.0005 23 0.002 0.002 6.3 0.001 28 150 1 0.014
11-Feb-15 0.0005 0.6 28 0.0005 0.05 0.019 2 0.0001 11 150 0.0005 0.003 0.1 0.00008 2 0.5 0.0005 26 0.002 0.002 6.6 0.001 25 120 0.5 0.009
11-Mar-15 0.0005 1.5 30 0.0005 0.025 0.027 2.5 0.0001 11 150 0.001 0.005 0.1 0.00005 3 1 0.0005 27 0.002 0.002 6.5 0.001 21 130 1 0.011
WX1 (mg/L) SAWYERS SWAMP CREEK FRESH WATER UPSTREAM OF SCAD April, 2013 to March, 2015
Ag Al ALK As B Ba Be Ca Cd Cl COND Cr Cu F Fe Hg K Mg Mn Mo Na NFR Ni NO2+NO3 Pb pH Se SO4 TDS TKN TN TP Zn
Average 0.0005 1.574 19 0.0007 0.037 0.028 2.5 0.0001 10 140 0.0016 0.004 0.1 0.00004 2.8 1 0.0008 24 0.003 0.0023 6.4 0.001 22 112 2.5 0.025
Maximum 0.0005 5.1 38 0.0020 0.070 0.07 4.5 0.0001 12 170 0.0050 0.009 0.1 0.00008 5.0 2 0.0050 29 0.007 0.0070 6.8 0.001 36 170 13 0.052
Minimum 0.0005 0.45 13 0.0005 0.025 0.011 1.0 0.0001 9 110 0.0005 0.001 0.1 0.00003 1.8 1 0.0005 10 0.001 0.0005 6.1 0.001 10 69 0 0.009
50th Percentile 0.0005 0.96 13 0.0005 0.025 0.019 2.0 0.0001 10 140 0.0010 0.004 0.1 0.00003 2.0 1 0.0005 26 0.002 0.0020 6.3 0.001 23 100 0.5 0.022

Sawyers Swamp Creek Upstream of SSCAD WX1 Post-Dry Ash Placement Data (mg/l) April, 2015 to March, 2016
SAMPLE Ag Al ALK As B Ba Be Ca Cd Cl COND Cr Cu F Fe Hg K Mg Mn Mo Na NFR Ni NO2+NO3 Pb pH Se SO4 TDS TKN TN TP Zn
11-Mar-15 0.0005 1.5 30 0.001 0.025 0.027 2.5 0.0001 11 150 0.001 0.005 0.1 0.00005 3 1 0.001 27 0.002 0.002 6.5 0.001 21 130 0.011
11-Mar-15 0.0005 1.5 30
09-Apr-15 0.0005 0.92 31 0.001 0.025 0.02 2 0.0001 10 160 0.001 0.002 0.1 0.63 0.00005 2 0.5 0.15 0.001 25 0.002 0.001 6.6 0.001 24 82 0.019 09-Apr-15 0.0005 0.92 31
27-May-15 0.0005 1 12.5 0.001 0.025 0.016 1.7 0.0001 10 150 0.001 0.002 0.1 0.76 0.00002 2 0.5 0.087 0.001 24 0.001 0.001 6.4 0.001 25 110 0.008 27-May-15 0.0005 1 12.5
17-Jun-15 0.0005 0.88 12.5 0.001 0.025 0.014 1.7 0.0001 10 140 0.001 0.002 0.1 0.59 0.00002 2 0.5 0.11 0.001 24 0.001 0.001 6.5 0.001 23 98 0.008 17-Jun-15 0.0005 0.88 12.5
15-Jul-15 0.0005 0.89 28 0.001 0.06 0.015 2.44 0.0001 10.1 141 0.001 0.001 0.05 0.588 0.00002 1.65 0.806 0.117 0.001 26.3 0.001 0.001 6.68 0.0001 24 106 0.009 15-Jul-15 0.0005 0.89 28
19-Aug-15 0.0005 0.97 26 0.001 0.025 0.012 2.15 0.0001 9.99 151 0.001 0.001 0.018 0.626 0.00002 1.51 0.68 0.093 0.001 26.9 0.001 0.001 6.97 0.0001 23.4 100 0.006 19-Aug-15 0.0005 0.97 26
16-Sep-15 0.0005 1.35 32 0.001 0.025 0.043 4.28 0.0001 10.3 143 0.001 0.001 0.01 0.496 0.00002 2.19 1.03 0.072 0.001 29.8 0.002 0.001 6.42 0.0001 24.5 94 0.018 16-Sep-15 0.0005 1.35 32
21-Oct-15 0.0005 3.52 34 0.002 0.025 0.064 2.87 0.0001 10 162 0.003 0.004 0.014 2.64 0.00016 3.39 1.25 0.445 0.001 28 0.003 0.005 6.3 0.0001 23.6 131 0.017 21-Oct-15 0.0005 3.52 34
18-Nov-15 0.0005 1.45 30 0.001 0.06 0.025 2.61 0.0001 9.8 150 0.001 0.003 0.01 0.551 0.00002 2.8 1.01 0.225 0.001 26.1 0.002 0.002 6.46 0.0001 21.8 104 0.012 18-Nov-15 0.0005 1.45 30
Dec 2015
Jan 2016
Feb 2016
Mar 2016
WX1 (mg/L) SAWYERS SWAMP CREEK FRESH WATER UPSTREAM OF SCAD April, 2015 to March, 2016
Ag Al ALK As B Ba Be Ca Cd Cl COND Cr Cu F Fe Hg K Mg Mn Mo Na NFR Ni NO2+NO3 Pb pH Se SO4 TDS TKN TN TP Zn
Average 0.0005 1.373 25.8 0.00113 0.034 0.026 2.5 0.0001 10 150 0.001 0.002 0.1 0.86 4.1E-05 2.2 1 0.1624 0.001 26 0.002 0.0016 6.5 0.000 24 103 0.012 0.0005 1.373 25.8 0.00113
Maximum 0.0005 3.520 34 0.002 0.060 0.064 4.3 0.0001 10 162 0.003 0.004 0.1 2.64 0.00016 3.4 1 0.445 0.001 30 0 0.003 0.005 6.97 0.001 25 131 0.019 0.0005 3.520 34 0.002
Minimum 0.0005 0.880 12.5 0.001 0.025 0.012 1.7 0.0001 10 140 0.001 0.001 0.0 0.496 0.00002 1.5 1 0.072 0.001 24 0 0.001 0.001 6.3 0.0001 21.8 82 0.006 0.0005 0.880 12.5 0.001
50th Percentile 0.0005 0.985 29 0.001 0.025 0.018 2.3 0.0001 10 150 0.001 0.002 0.0 0.608 0.00002 2.0 1 0.114 0.001 26 0.002 0.001 6.48 0.0001 23.8 102 0.011 0.0005 0.985 29 0.001

4. Water Quality Data and Summary for SSCAD Groundwate r Seepage Detection Bores WGM1/D3 and 1/D4
a) Water Quality Data and Summary for WGM1/D3
WGM1/D3 Pre-Dry Ash Placement Summary 1988- April, 2003 (mg/L)
Ag ALK Al As B Ba Be Ca Cd Cl COND Cr Cu F Fe Hg K Mg Mn Mo Na Ni Pb pH Se SO4 TDS WL1
WL
AHD Zn
Average 0.001 115 0.010 0.05 0.292 18.7 0.001 64 62308 0.009 0.005 0.19 4.9 0.0004 8 20.0 0.592 69 0.080 0.008 6.0 0.001 94 349 10.0 920.2 0.061
Maximum 0.001 229 0.043 0.22 5.700 31.0 0.001 140 77320 0.026 0.040 0.73 21.0 0.0009 38 28.0 1.930 109 0.092 0.074 6.9 0.003 144 660 11.1 921.5 0.200
Minimum 0.001 8 0.001 0.005 0.080 6.3 0.001 25 34200 0.001 0.001 0.040 0.5 0.0001 1 2.0 0.080 31 0.071 0.001 4.6 0.001 20 125 8.7 919.1 0.010
90th Percentile 0.001 154 0.027 0.19 0.150 24.0 0.001 77 72000 0.020 0.010 0.33 9.4 0.0007 9 25.0 0.710 85 0.089 0.014 6.4 0.002 116 470 10.9 921.3 0.110
WGM1/D3 Post-Dry Ash Placement Data (mg/L) April, 2013 to March 2015
Date Ag ALK Al As B Ba Be Ca Cd Cl Co COND Cr Cu F Fe Hg K Li Mg Mn Mo Na Ni Pb pH Se SO4 TDS WL1 WL AHD Zn
10-Apr-13 0.001 90 0.09 0.004 0.025 0.08 14 0.0002 75 560 0.001 0.011 0.05 11 0.00005 6.2 17 0.92 0.005 56 0.099 0.0005 6.1 0.001 69 350 9.5 920.70 0.038
17-May-13 0.001 58 0.07 0.003 0.025 0.064 12 0.0002 78 520 0.001 0.012 0.05 0.005 0.00005 6 16 0.42 0.005 61 0.05 0.004 5.8 0.001 66 300 9.6 920.60 0.13
13-Jun-13 0.001 55 0.1 0.002 0.07 0.069 13 0.0002 55 460 0.003 0.005 0.05 0.34 0.00005 5 18 0.55 0.001 52 0.087 0.001 5.7 0.001 71 280 9.3 920.90 0.096
10-Jul-13 0.001 64 0.08 0.003 0.07 0.076 15 0.0003 54 480 0.001 0.007 0.05 1.9 0.00005 6 20 0.57 0.001 56 0.098 0.001 5.8 0.001 83 260 9.4 920.80 0.17
22-Aug-13 0.001 100 0.09 0.003 0.025 0.078 18 0.0002 75 580 0.002 0.002 0.05 5 0.0009 6 24 0.66 0.001 66 0.097 0.0005 6 0.001 74 340 9.7 920.50 0.049
26-Sep-13 0.001 100 0.51 0.004 0.025 0.084 16 0.0002 73 570 0.002 0.003 0.1 11 0.00005 6 21 0.62 0.001 66 0.099 0.003 6 0.001 75 380 9.8 920.40 0.044
24-Oct-13 0.001 100 0.06 0.006 0.025 0.09 19 0.0002 85 660 0.004 0.003 0.1 0.74 0.00005 8 25 0.58 0.003 81 0.1 0.0005 5.9 0.001 90 400 10.4 919.80 0.041
7-Nov-13 0.001 87 0.04 0.002 0.025 0.086 18 0.0002 89 660 0.003 0.002 0.1 0.02 0.00005 7 23 0.61 0.001 75 0.098 0.0005 6 0.001 98 380 10.6 919.60 0.039
5-Dec-13 0.001 84 0.12 0.004 0.025 0.097 21 0.0002 97 710 0.003 0.003 0.1 0.08 0.00005 7 27 0.79 0.001 79 0.11 0.0005 6.1 0.001 130 380 9.5 920.70 0.051
16-Jan-14 0.001 90 0.07 0.004 0.025 0.094 20 0.0002 85 680 0.002 0.011 0.1 0.51 0.00005 7 26 0.67 0.001 78 0.13 0.005 6 0.001 120 360 9.9 920.30 0.055
6-Feb-14 0.001 95 0.14 0.003 0.025 0.099 20 0.0002 85 680 0.002 0.006 0.1 1.5 0.00005 7 26 0.63 0.001 75 0.12 0.004 5.9 0.001 110 370 9.9 920.30 0.042
6-Mar-14 0.001 59 0.08 0.001 0.025 0.093 18 0.0002 80 660 0.002 0.002 0.1 0.03 0.00005 7 23 0.93 0.001 65 0.1 0.001 5.7 0.001 130 400 8.9 921.30 0.069
3-Apr-14 0.001 33 0.14 0.001 0.09 0.1 19 0.0002 84 750 0.001 0.003 0.1 0.07 0.00005 7 29 1.4 0.001 82 0.21 0.001 5.5 0.001 190 470 8.6 921.60 0.14
2-May-14 0.001 44 0.04 0.002 0.025 0.096 20 0.0002 80 700 0.001 0.001 0.1 0.01 0.00005 7 26 0.7 0.001 76 0.082 0.002 5.6 0.001 160 430 9.4 920.80 0.18
13-Jun-14 0.001 46 0.08 0.001 0.025 0.074 14 0.0002 67 610 0.001 0.0005 0.1 0.005 0.00005 7 18 0.48 0.001 69 0.061 0.001 5.7 0.001 100 360 9.9 920.30 0.18
11-Jul-14 0.001 46 0.06 0.001 0.025 0.073 15 0.0002 71 610 0.001 0.001 0.1 0.005 0.00005 7 20 0.47 0.001 69 0.066 0.002 5.7 0.001 100 360 10.1 920.10 0.23
15-Aug-14 0.001 58 0.07 0.001 0.025 0.088 17 0.0002 82 620 0.001 0.0005 0.1 0.005 0.00005 7 21 0.51 0.001 70 0.061 0.001 5.8 0.001 110 370 10.5 919.70 0.18
12-Sep-14 0.001 44 0.12 0.001 0.025 0.093 20 0.0002 78 670 0.001 0.001 0.1 2.9 0.00005 7 23 0.67 0.001 68 0.08 0.002 6 0.001 170 400 9.3 920.90 0.15
24-Oct-14 0.001 52 0.06 0.001 0.025 0.085 20 0.0002 73 680 0.001 0.002 0.1 2.3 0.00005 7 24 0.6 0.001 72 0.076 0.0005 6.1 0.001 150 370 9.7 920.50 0.11
14-Nov-14 0.001 74 0.09 0.001 0.025 0.094 22 0.0002 87 710 0.001 0.002 0.1 6.2 0.00005 7 27 0.73 0.001 80 0.11 0.001 6.1 0.001 160 410 10 920.20 0.15
12-Dec-14 0.001 12.5 0.16 0.001 0.1 0.08 16 0.0002 55 660 0.001 0.003 0.1 0.75 0.00005 7 26 0.76 0.001 66 0.21 0.004 5.6 0.001 180 380 8.7 921.50 0.15
15-Jan-15 0.001 50 0.13 0.002 0.025 0.11 24 0.0002 69 740 0.001 0.003 0.1 10 0.00005 8 30 0.9 0.001 78 0.14 0.002 5.8 0.001 190 470 8.4 921.80 0.076
12-Feb-15 0.001 29 0.09 0.001 0.025 0.096 21 0.0002 70 640 0.001 0.002 0.1 3.3 0.00005 8 25 0.76 0.001 66 0.11 0.001 5.5 0.001 170 450 8.8 921.40 0.076
12-Mar-15 0.001 32 0.4 0.001 0.025 0.089 20 0.0002 73 620 0.001 0.004 0.1 2.9 0.00005 7 24 0.74 0.001 66 0.095 0.001 5.6 0.001 150 370 8.8 921.40 0.057
WGM1/D3 Post-Dry Ash Placement Data (mg/L) April, 2013 to March 2015
Ag ALK Al As B Ba Be Ca Cd Cl Co COND Cr Cu F Fe Hg K Li Mg Mn Mo Na Ni Pb pH Se SO4 TDS WL1 WL AHD Zn Average <0.001 63 0.12 0.001 0.037 0.087 18 0.0002 74 668 0.001 0.002 0.1 2.37 0.00009 7 23 0.73 0.001 70 0.108 0.002 5.8 0.001 153 403 9.5 920.67 0.140
Maximum <0.001 100 0.51 0.006 0.100 0.110 24 0.0003 97 750 0.004 0.012 0.1 11.00 0.00090 8 30 1.40 0.005 82 0.210 0.005 6.1 0.001 190 470 10.6 921.80 0.230
Minimum <0.001 13 0.04 0.001 0.025 0.064 12 0.0002 54 460 0.001 0.001 0.05 0.01 0.00005 5 16 0.42 0.001 52 0.050 0.001 5.5 0.001 66 260 8.4 919.60 0.038
50th Percentile <0.001 58 0.09 0.002 0.025 0.089 19 0.0002 77 660 0.001 0.003 0.1 0.75 0.00005 7 24 0.67 0.001 69 0.099 0.001 5.8 0.001 115 375 9.6 920.65 0.086

WGM1/D3 Post-Dry Ash Placement Data (mg/L) April, 2015 to March 2016
Date Ag ALK Al As B Ba Be Ca Cd Cl Co COND Cr Cu F Fe Hg K Li Mg Mn Mo Na Ni Pb pH Se SO4 TDS WL1 WL AHD Zn
10-Apr-15 0.0005 32 0.37 0.001 0.025 0.064 14 0.0001 60 610 0.001 0.002 0.1 1.8 0.00005 6 20 0.71 0.001 62 0.14 0.002 5.6 0.001 160 370 8.5 921.70 0.099
28-May-15 0.0005 31 0.12 0.001 0.025 0.096 21 0.0004 64 630 0.001 0.002 0.1 3.2 0.00002 7 24 0.64 0.001 58 0.085 0.001 5.7 0.001 160 370 8.8 921.40 0.091
18-Jun-15 0.0005 32 0.49 0.001 0.025 0.08 18 0.0001 74 600 0.001 0.001 0.1 2.5 0.00002 6 21 0.57 0.001 61 0.092 0.002 5.6 0.001 140 300 9 921.20 0.069
16-Jul-15 0.0005 32 0.3 0.001 0.025 0.089 17 0.0001 58.6 620 0.001 0.001 0.05 3.3 0.00002 6.6 19.2 0.58 0.001 55.7 0.082 0.002 6.01 0.0001 150 354 8.6 921.60 0.072
20-Aug-15 0.0005 34 0.11 0.0005 0.025 0.093 19.7 0.0001 68.9 659 0.001 0.001 0.05 4.43 0.00002 7.34 21 0.613 0.001 61.4 0.084 0.001 6.29 0.0001 162 386 9.1 921.10 0.068
17-Sep-15 0.0005 47 0.12 0.002 0.025 0.093 22.3 0.0001 67.3 678 0.001 0.001 0.05 5.58 0.00002 8.04 24.4 0.614 0.001 65.5 0.085 0.001 5.45 0.0001 177 390 9.3 920.90 0.067
22-Oct-15 0.0005 60 0.16 0.002 0.025 0.074 17.9 0.0001 67.4 607 0.001 0.001 0.05 5.93 0.00002 8.38 19.8 0.49 0.001 62 0.062 0.001 5.66 0.0001 137 392 9.6 920.60 0.036
19-Nov-15 0.0005 38 0.06 0.003 0.025 0.094 27.9 0.0001 58.3 641 0.001 0.001 0.05 5.86 0.00002 10.4 28.8 0.546 0.001 82.2 0.092 0.001 5.47 0.0001 160 368 9.1 921.10 0.054
10-Dec-15 0.0005 67 0.04 0.002 0.025 0.089 20.6 0.0002 65.6 643 0.001 0.001 0.005 5.32 0.00002 7.75 22.5 0.458 0.001 75.3 0.074 0.001 5.48 0.0001 148 472 9.5 920.70 0.056
21-Jan-16 0.0005 48 0.2 0.002 0.025 0.094 20.1 0.0001 68 689 0.001 0.002 0.038 6.82 0.00002 7.61 23.8 0.633 0.001 57.8 0.113 0.001 5.46 0.0001 164 353 8.5 921.70 0.059
11-Feb-16 0.0005 28 0.17 0.001 0.025 0.072 17.6 0.0001 72.6 652 0.001 0.001 0.036 2.87 0.00002 7.27 21.8 0.713 0.001 63.4 0.166 0.002 5.2 0.0001 166 337 8.6 921.60 0.11
17-Mar-16 0.0005 25 0.27 0.002 0.025 0.06 13.8 0.0001 74.6 620 0.001 0.001 0.022 1.79 0.00002 6.28 19.4 0.654 0.001 67 0.164 0.003 5.1 0.0001 140 379 8.6 921.60 0.123
WGM1/D3 Post-Dry Ash Placement Data (mg/L) April, 2015 to March 2016
Ag ALK Al As B Ba Be Ca Cd Cl Co COND Cr Cu F Fe Hg K Li Mg Mn Mo Na Ni Pb pH Se SO4 TDS WL1 WL AHD Zn Average 0.0005 39.5 0.20 0.0015 0.025 0.083 19 0.0001 67 637 0.0010 0.0013 0.05 4.1 0.00002 7 22 0.60 0.001 64 0.103 0.002 5.6 0.000 155 373 8.9 921.3 0.075
Maximum 0.0005 67 0.49 0.0030 0.025 0.096 28 0.0004 75 689 0.0010 0.0020 0.10 6.8 0.00005 10 29 0.71 0.001 82 0.166 0.003 6.3 0.001 177 472 9.6 921.7 0.123
Minimum 0.0005 25 0.04 0.0005 0.025 0.060 14 0.0001 58 600 0.0010 0.0010 0.01 1.8 0.00002 6 19 0.46 0.001 56 0.062 0.001 5.1 0.000 137 300 8.5 920.6 0.036
50th Percentile 0.0005 33 0.17 0.0015 0.025 0.089 19 0.0001 67 636 0.0010 0.0010 0.05 3.9 0.00002 7 21 0.61 0.001 62 0.089 0.001 5.5 0.000 160 370 8.9 921.3 0.069

b) Water Quality Data and Summary for WGM1/D4
WGM1/D4 Pre-Dry Ash Placement Summary 1988- April, 2003 (mg/L) Ag ALK As B Ba Be Ca Cd Cl COND Cr Cu F Fe Hg K Mg Mn Mo Na Ni Pb pH Se SO4 TDS WL1 WL AHD Zn
Average 0.001 96 0.003 0.27 0.372 30.0 0.002 30 58408 0.005 0.012 0.15 54.6 0.0009 6 18.9 4.588 29 0.018 0.006 6.3 0.009 118 327 1.3 905.8 0.041
Maximum 0.001 282 0.012 0.61 6.700 58.0 0.004 86 98969 0.019 0.100 0.72 120.0 0.0033 46 47.0 12.000 82 0.024 0.022 7.3 0.100 350 768 1.5 906.3 0.100
Minimum 0.001 20.60 0.001 0.07 0.050 16.0 0.001 6.00 16100 0.001 0.001 0.001 0.1 0.0002 0 1.8 0.094 4 0.011 0.001 5.2 0.001 11 96 0.8 905.3 0.004
90th Percentile 0.001 168 0.006 0.49 0.330 43.8 0.003 45 72780 0.012 0.036 0.24 86.0 0.0020 7 26.8 6.500 42 0.023 0.011 6.8 0.002 201 510 1.4 906.0 0.060
WGM1/D4 Post-Dry Ash Placement Data April, 2013 to March 2015 (mg/l)
Date Ag ALK Al As B Ba Be Ca Cd Cl Co COND Cr Cu F Fe Hg K Li Mg Mn Mo Na Ni Pb pH Se SO4 TDS WL1 WL
AHD Zn
10-Apr-13 0.0005 35 0.01 0.002 1.9 0.023 85 0.0002 32 1600 0.001 0.004 0.05 49 0.00005 10 75 19 0.01 130 0.035 0.001 6 0.002 846 1300 1 906.12 0.05
16-May-13 0.0005 38 0.005 0.003 1.7 0.023 110 0.0002 33 1500 0.001 0.026 0.05 33 0.00005 10 79 19 0.01 130 0.03 0.002 5.8 0.002 820 1200 1 906.12 0.066
13-Jun-13 0.0005 50 0.025 0.003 1.8 0.009 110 0.0002 33 1500 0.001 0.001 0.05 22 0.00005 10 77 18 0.001 130 0.037 0.001 5.9 0.002 830 1200 0.9 906.22 0.064
10-Jul-13 0.0005 12.5 0.025 0.003 1.8 0.022 110 0.0002 33 1400 0.001 0.002 0.05 38 0.00005 9 75 17 0.001 120 0.034 0.001 5.5 0.002 790 1200 1 906.12 0.053
22-Aug-13 0.0005 40 0.04 0.003 1.8 0.023 110 0.0002 33 1500 0.001 0.001 0.05 28 0.00005 9 78 18 0.001 130 0.03 0.001 5.7 0.002 820 1200 1 906.12 0.044
26-Sep-13 0.0005 30 0.03 0.005 1.8 0.021 110 0.0002 33 1500 0.002 0.001 0.1 79 0.00005 9 76 18 0.001 130 0.033 0.001 5.7 0.002 830 1300 1 906.12 0.053
24-Oct-13 0.0005 60 0.005 0.004 2 0.02 110 0.0002 34 1600 0.002 0.001 0.1 27 0.00005 10 81 18 0.001 140 0.035 0.001 6 0.002 910 1300 1 906.12 0.059
7-Nov-13 0.0005 38 0.005 0.002 1.8 0.02 110 0.0002 33 1500 0.002 0.001 0.1 21 0.00005 9 77 18 0.001 130 0.033 0.001 5.8 0.002 830 1300 1 906.12 0.055
5-Dec-13 0.0005 32 0.04 0.003 1.8 0.018 100 0.0002 34 1600 0.003 0.003 0.1 16 0.00005 9 74 18 0.001 130 0.032 0.001 5.9 0.002 880 1200 1 906.12 0.06
16-Jan-14 0.0005 33 0.01 0.003 1.8 0.019 100 0.0002 32 1600 0.002 0.002 0.1 15 0.00005 10 72 17 0.001 130 0.036 0.001 5.8 0.002 820 1200 1 906.12 0.064
6-Feb-14 0.0005 35 0.005 0.003 1.7 0.02 96 0.0002 32 1500 0.001 0.001 0.1 16 0.00005 9 68 16 0.001 120 0.035 0.001 5.8 0.002 800 1200 1 906.12 0.05
6-Mar-14 0.0005 40 0.005 0.003 1.9 0.021 95 0.0002 32 1400 0.001 0.001 0.1 17 0.00005 9 66 17 0.001 120 0.033 0.001 5.9 0.002 780 1300 0.9 906.22 0.049
3-Apr-14 0.0005 48 0.02 0.002 1.7 0.048 240 0.0002 120 2700 0.001 0.001 0.1 13 0.00005 12 110 13 0.001 270 0.029 0.001 6 0.002 1500 2400 0.9 906.22 0.051
1-May-14 0.0005 50 0.3 0.003 1.7 0.019 120 0.0002 39 1600 0.001 0.001 0.1 30 0.00005 10 73 15 0.001 130 0.029 0.002 5.9 0.002 840 1400 0.9 906.22 0.054
12-Jun-14 0.0005 53 0.06 0.002 1.6 0.018 95 0.0002 28 1600 0.001 0.001 0.1 32 0.00005 10 64 16 0.001 120 0.033 0.001 6 0.002 700 1200 1 906.12 0.059
11-Jul-14 0.0005 56 0.005 0.002 1.9 0.019 100 0.0002 29 1600 0.001 0.001 0.1 30 0.00005 10 68 17 0.001 120 0.032 0.001 6 0.002 720 1300 0.9 906.22 0.052
14-Aug-14 0.0005 68 0.03 0.002 1.7 0.02 98 0.0002 32 1500 0.001 0.001 0.1 35 0.00005 9 69 17 0.001 120 0.032 0.001 6.1 0.002 780 1200 1 906.12 0.054
11-Sep-14 0.0005 38 0.04 0.002 1.6 0.021 110 0.0002 44 1600 0.001 0.001 0.1 66 0.00005 9 69 16 0.001 130 0.03 0.001 6.1 0.002 910 1300 0.9 906.22 0.05
23-Oct-14 0.0005 12.5 0.03 0.002 1.8 0.017 100 0.0002 32 1500 0.001 0.001 0.1 67 0.00005 9 68 16 0.001 120 0.031 0.001 5.4 0.002 760 1200 0.9 906.22 0.043
13-Nov-14 0.0005 34 0.02 0.002 1.8 0.018 98 0.0002 33 1500 0.001 0.001 0.1 62 0.00005 9 67 17 0.001 130 0.032 0.001 6 0.002 880 1200 1 906.12 0.075
11-Dec-14 0.0005 45 0.01 0.002 1.7 0.018 97 0.0002 33 1500 0.001 0.001 0.1 61 0.00005 10 67 16 0.001 130 0.036 0.001 6 0.002 760 1200 0.9 906.22 0.04
14-Jan-15 0.0005 44 0.06 0.002 2 0.021 130 0.0002 89 1800 0.001 0.001 0.1 58 0.00005 10 80 15 0.001 180 0.029 0.001 6 0.002 880 1500 0.9 906.22 0.034
11-Feb-15 0.0005 33 0.02 0.002 1.8 0.019 96 0.0002 32 1500 0.001 0.001 0.1 60 0.00005 9 63 15 0.001 120 0.035 0.001 5.8 0.002 730 1200 1 906.12 0.035
11-Mar-15 0.0005 38 0.02 0.002 1.7 0.022 98 0.0002 31 1500 0.001 0.005 0.1 59 0.00005 10 68 16 0.001 130 0.033 0.001 5.8 0.002 730 1200 1 906.12 0.04
WGM1/D4 Post-Dry Ash Placement Data April, 2013 to March 2015 (mg/l)
Ag ALK Al As B Ba Be Ca Cd Cl Co COND Cr Cu F Fe Hg K Li Mg Mn Mo Na Ni Pb pH Se SO4 TDS WL1 WL
AHD Zn
Average <0.001 40 0.05 0.0021 1.75 0.021 110 0.0002 45 1658 0.0010 0.0013 0.10 47.8 0.00005 10 74 15.75 0.001 135 0.032 0.001 5.9 0.002 849 1358 1.0 906.2 0.049
Maximum <0.001 68 0.30 0.0050 2.00 0.048 240 0.0002 120 2700 0.0030 0.0260 0.10 79.0 0.0001 12 110 19.00 0.010 270 0.037 0.002 6.1 0.002 1500 2400 1.0 906.2 0.075
Minimum <0.001 13 0.01 0.0020 1.60 0.009 85 0.0002 28 1400 0.0010 0.0010 0.05 13.0 0.00005 9 63 13.00 0.001 120 0.029 0.001 5.4 0.002 700 1200 0.9 906.1 0.034
50th Percentile <0.001 38 0.02 0.0020 1.80 0.020 100 0.0002 33 1500 0.0010 0.0010 0.10 32.5 0.00005 10 73 17.00 0.001 130 0.033 0.001 5.9 0.002 820 1200 1.0 906.1 0.053

WGM1/D4 Post-Dry Ash Placement Data April, 2015 to March 2016 (mg/l)
Date Ag ALK Al As B Ba Be Ca Cd Cl Co COND Cr Cu F Fe Hg K Li Mg Mn Mo Na Ni Pb pH Se SO4 TDS WL1 WL
AHD Zn
10-Apr-15 0.0005 43 0.005 0.002 1.8 0.017 92 0.0001 32 1500 0.001 0.001 0.1 57 0.00005 10 65 16 0.001 120 0.032 0.001 5.9 0.001 760 1200 1.1 906.02 0.038
28-May-15 0.0005 70 0.02 0.001 1.4 0.021 110 0.0001 44 1600 0.001 0.0005 0.1 50 0.00002 9 66 12 0.001 130 0.025 0.001 6.2 0.001 800 1300 1.0 906.12 0.028
18-Jun-15 0.0005 60 0.02 0.002 1.6 0.018 100 0.0001 33 1400 0.002 0.74 0.1 53 0.00002 9 62 13 0.001 120 0.029 0.001 6.1 0.009 750 1200 1.0 906.12 0.039
16-Jul-15 0.0005 54 0.01 0.001 1.66 0.018 86 0.0001 32.5 1560 0.001 0.0005 0.05 38 0.00002 9.02 57 14 0.001 113 0.028 0.001 6.38 0.0001 832 1170 1.0 906.12 0.036
20-Aug-15 0.0005 36 0.005 0.002 1.92 0.017 92.1 0.0001 30 1560 0.001 0.0005 0.05 58.6 0.00002 10.2 60.6 14.2 0.001 122 0.034 0.001 6.32 0.0001 766 1190 1.0 906.12 0.041
17-Sep-15 0.0005 58 0.08 0.001 1.71 0.016 99.5 0.0001 31.3 1585 0.001 0.0005 0.05 55.6 0.00002 10.8 65.2 14.8 0.001 130 0.026 0.001 6.2 0.0001 654 1180 1.0 906.12 0.04
22-Oct-15 0.0005 59 0.04 0.002 1.63 0.016 91.7 0.0001 31.2 1596 0.001 0.0005 0.05 44.2 0.00002 12.1 61.1 15 0.001 124 0.027 0.001 6.16 0.0001 802 1270 1.0 906.12 0.039
19-Nov-15 0.0005 14 0.08 0.002 1.67 0.018 92.1 0.0001 27.6 1513 0.001 0.0005 0.05 53 0.00002 10.7 58.8 15.4 0.001 114 0.031 0.001 6.18 0.0001 758 1160 1.0 906.12 0.039
10-Dec-15 0.0005 68 0.02 0.002 1.97 0.017 116 0.0001 27.1 1575 0.001 0.001 0.005 55.3 0.00002 13.1 76 15.3 0.001 153 0.032 0.001 6.12 0.0001 784 1110 1.1 906.02 0.041
21-Jan-16 0.0005 46 0.04 0.002 1.7 0.016 88.7 0.0001 29.5 1575 0.001 0.003 0.005 51.9 0.00002 10.4 62 14.1 0.001 129 0.03 0.001 6.15 0.0001 731 1200 1.0 906.12 0.035
11-Feb-16 0.0005 56 0.005 0.002 1.68 0.015 91.9 0.0001 31.4 1551 0.001 0.0005 0.005 53.2 0.00002 10.5 60.1 14.2 0.001 122 0.031 0.001 6.1 0.0001 718 1170 1.0 906.12 0.038
17-Mar-16 0.0005 68 0.06 0.002 1.87 0.016 93.2 0.0001 30.6 1568 0.001 0.0005 0.019 51 0.00002 9.86 63.1 13.6 0.001 131 0.032 0.001 6.17 0.0001 728 1080 1.0 906.12 0.04
WGM1/D4 Post-Dry Ash Placement Data April, 2015 to March 2016 (mg/l)
Ag ALK Al As B Ba Be Ca Cd Cl Co COND Cr Cu F Fe Hg K Li Mg Mn Mo Na Ni Pb pH Se SO4 TDS WL1 WL
AHD Zn
Average 0.001 53 0.03 0.0018 1.72 0.017 96 0.0001 32 1549 0.0011 0.0624 0.05 51.7 0.00002 10 63 14.30 0.001 126 0.030 0.001 6.1650 0.001 757 1186 1.0 906.1 0.038
Maximum 0.001 70 0.08 0.0020 1.97 0.021 116 0.0001 44 1600 0.0020 0.7400 0.10 58.6 0.00005 13 76 16.00 0.001 153 0.034 0.001 6.3800 0.009 832 1300 1.1 906.1 0.041
Minimum 0.001 14 0.01 0.0010 1.40 0.015 86 0.0001 27 1400 0.0010 0.0005 0.01 38.0 0.00002 9 57 12.00 0.001 113 0.025 0.001 5.9000 0.000 654 1080 1.0 906.0 0.028
50th Percentile 0.001 57 0.02 0.0020 1.69 0.017 92 0.0001 31 1564 0.0010 0.0005 0.05 53.0 0.00002 10 62 14.20 0.001 123 0.031 0.001 6.1650 0.000 759 1185 1.0 906.1 0.039

5. Water Quality Data and Summary for Background Groun dwater Bore WGM1/D1 and WGM1/D2
WGM1/D1 Pre-Dry Ash Placement Background Summary 19 88- April, 2003 (mg/L)
Ag ALK As B Ba Be Ca Cd Cl Co COND Cr Cu F Fe Hg K Mg Mn Mo Na Ni Pb pH Se SO4 TDS WL1
WL
AHD Zn Mn
Average 0.001 16 0.002 0.05 0.156 2.4 0.001 48 210 0.016 0.016 0.19 2.3 0.0002 3 2.5 0.37 27 0.010 5.3 0.002 4 143 4.0 944.0 0.078 0.37
Maximum 0.001 32 0.006 0.35 2.000 19.0 0.003 92 394 0.045 0.170 0.66 15.7 0.0006 10 15.0 1.00 65 0.035 6.8 0.003 31 302 6.1 946.3 0.230 1.00
Minimum 0.001 1.50 0.001 0.01 0.030 0.0 0.001 15 99 0.001 0.001 0.001 0.0 0.0001 0 0.0 0.05 8 0.001 4.2 0.001 0 50 1.9 942.1 0.012 0.05
90th Percentile 0.001 24 0.004 0.10 0.090 5.1 0.002 78 305 0.041 0.035 0.41 5.6 0.0004 6 5.0 0.66 44 0.018 5.9 0.002 9 215 5.3 945.0 0.122 0.66
WGM1/D1 Post-Dry Ash Placement Data April, 2013 to March 2015
SAMPLE Ag ALK Al As B Ba Be Ca Cd Cl Co COND Cr Cu F Fe Hg K Li Mg Mn Mo Na Ni Pb pH Se SO4 TDS WL1 WL AHD Zn
10-Apr-13 0.0005 12.5 0.23 0.0005 0.05 0.063 1.1 0.0001 21 140 0.001 0.002 0.05 0.01 0.000025 3.5 3.5 0.088 0.005 17 0.005 0.0005 5.8 0.001 20 48 1.9 946.22 0.029
16-May-13 0.0005 12.5 0.1 0.0005 0.05 0.044 1 0.0001 16 120 0.001 0.008 0.05 0.02 0.000025 3 3.5 0.03 0.005 15 0.005 0.0005 5.8 0.001 14 64 2.9 945.22 0.033
13-Jun-13 0.0005 12.5 0.13 0.0005 0.06 0.038 1.6 0.0001 19 130 0.001 0.003 0.05 0.04 0.000025 3 3 0.1 0.0005 16 0.002 0.0005 5.7 0.001 15 73 3 945.12 0.054
10-Jul-13 0.0005 12.5 0.59 0.0005 0.04 0.036 1.4 0.0001 21 130 0.001 0.004 0.05 0.24 0.000025 3 3 0.06 0.0005 18 0.002 0.0005 5.6 0.001 11 73 2.9 945.22 0.082
22-Aug-13 0.0005 12.5 1.3 0.0005 0.025 0.034 1.2 0.0001 24 130 0.002 0.004 0.05 0.09 0.000025 2 2 0.043 0.0005 20 0.002 0.002 5.7 0.001 9 96 3.1 945.02 0.05
26-Sep-13 0.0005 12.5 1.5 0.0005 0.025 0.031 1.3 0.0001 23 130 0.002 0.004 0.1 0.24 0.000025 2 2 0.079 0.0005 21 0.003 0.001 5.5 0.001 8 140 3.5 944.62 0.068
24-Oct-13 0.0005 12.5 0.74 0.0005 0.025 0.03 1.3 0.0001 26 140 0.003 0.003 0.1 0.02 0.000025 2 2 0.26 0.0005 21 0.003 0.001 5.5 0.001 8 100 3.8 944.32 0.075
7-Nov-13 0.0005 12.5 0.69 0.0005 0.025 0.027 1.3 0.0001 27 140 0.002 0.002 0.1 0.02 0.000025 2 2 0.34 0.0005 21 0.003 0.0005 5.6 0.001 8 110 3.9 944.22 0.078
5-Dec-13 0.0005 12.5 0.46 0.0005 0.025 0.032 1.3 0.0001 27 140 0.003 0.006 0.1 0.04 0.000025 2 2 0.48 0.0005 20 0.004 0.0005 5.7 0.001 8 78 3.9 944.22 0.1
16-Jan-14 0.0005 12.5 0.14 0.0005 0.28 0.029 15 0.0001 28 390 0.002 0.004 0.1 0.54 0.000025 3 12 2.9 0.0005 35 0.009 0.0005 5.6 0.001 120 200 4.4 943.72 0.085
6-Feb-14 4.7 943.42
6-Mar-14 4.9 943.22
3-Apr-14 4.5 943.62
2-May-14 0.0005 12.5 0.5 0.0005 0.025 0.03 1.6 0.0001 18 110 0.002 0.006 0.1 0.06 0.00015 2 2 0.52 0.0005 13 0.003 0.0005 5.5 0.001 5 69 2.6 945.52 0.099
13-Jun-14 0.0005 12.5 0.85 0.0005 0.025 0.028 0.99 0.0001 19 110 0.001 0.002 0.1 0.09 0.000025 2 1 0.095 0.0005 15 0.002 0.002 5.5 0.001 6 80 3.3 944.82 0.061
11-Jul-14 0.0005 12.5 0.89 0.0005 0.025 0.031 1 0.0001 22 120 0.001 0.002 0.1 0.07 0.000025 2 2 0.071 0.0005 17 0.002 0.001 5.4 0.001 6 98 3.8 944.32 0.061
15-Aug-14 0.0005 12.5 0.76 0.0005 0.025 0.032 0.9 0.0001 26 120 0.002 0.004 0.1 0.04 0.000025 2 1 0.068 0.0005 17 0.003 0.002 5.3 0.001 6 100 4.2 943.92 0.064
12-Sep-14 0.0005 12.5 1.6 0.0005 0.025 0.031 1.1 0.0001 29 120 0.001 0.002 0.1 0.04 0.000025 2 2 0.062 0.0005 18 0.002 0.001 5.7 0.001 6 72 3.9 944.22 0.07
24-Oct-14 0.0005 12.5 1.6 0.0005 0.025 0.039 0.99 0.0001 24 120 0.002 0.008 0.1 0.06 0.000025 2 2 0.21 0.0005 16 0.004 0.005 5.6 0.001 5 120 4.3 943.82 0.089
14-Nov-14 0.0005 12.5 0.52 0.0005 0.025 0.032 1.8 0.0001 28 140 0.001 0.004 0.1 0.31 0.000025 2 2 0.42 0.0005 19 0.004 0.001 5.6 0.001 10 74 4.3 943.82 0.11
12-Dec-14 0.0005 12.5 0.32 0.0005 0.025 0.031 1.7 0.0001 22 120 0.001 0.013 0.1 2.9 0.000025 4 2 0.31 0.0005 15 0.004 0.001 5.6 0.001 5 62 3.4 944.72 0.14
15-Jan-15 0.0005 12.5 0.08 0.0005 0.07 0.082 1.6 0.0001 24 180 0.001 0.001 0.1 0.02 0.000025 5 6 0.039 0.0005 21 0.001 0.0005 5.5 0.001 14 120 1.7 946.42 0.034
12-Feb-15 0.0005 12.5 0.27 0.0005 0.07 0.059 0.96 0.0001 11 120 0.001 0.001 0.1 0.02 0.000025 3 4 0.052 0.0005 13 0.001 0.0005 5.5 0.001 20 100 1.9 946.22 0.021
12-Mar-15 0.0005 12.5 0.42 0.0005 0.06 0.053 1.1 0.0001 10 110 0.002 0.44 0.1 0.03 0.000025 3 3 0.06 0.0005 13 0.002 0.0005 5.5 0.005 19 80 3 945.12 0.032
WGM1/D1 Post-Dry Ash Placement Data April, 2013 to March 2015
Ag ALK Al As B Ba Be Ca Cd Cl Co COND Cr Cu F Fe Hg K Li Mg Mn Mo Na Ni Pb pH Se SO4 TDS WL1 WL
AHD Zn
Average 0.0005 13 0.65 0.0005 0.05 0.039 2 0.0001 22 141 0.0016 0.0249 0.09 0.2 0.00003 3 3 0.30 0.001 18 0.003 0.001 5.6 0.001 15 93 3.5 944.6 0.068
Maximum 0.0005 13 1.60 0.0005 0.28 0.082 15 0.0001 29 390 0.0030 0.4400 0.10 2.9 0.00015 5 12 2.90 0.005 35 0.009 0.005 5.8 0.005 120 200 4.9 946.4 0.140
Minimum 0.0005 13 0.08 0.0005 0.03 0.027 1 0.0001 10 110 0.0010 0.0010 0.05 0.0 0.00003 2 1 0.03 0.001 13 0.001 0.001 5.3 0.001 5 48 1.7 943.2 0.021
50th Percentile 0.0005 13 0.52 0.0005 0.03 0.032 1 0.0001 23 130 0.0010 0.0040 0.10 0.0 0.00003 2 2 0.09 0.001 17 0.003 0.001 5.6 0.001 8 80 3.7 944.5 0.068

WGM1/D1 Post-Dry Ash Placement Data April, 2015 to March 2016
SAMPLE Ag ALK Al As B Ba Be Ca Cd Cl Co COND Cr Cu F Fe Hg K Li Mg Mn Mo Na Ni Pb pH Se SO4 TDS WL1 WL AHD Zn
10-Apr-15 0.0005 12.5 0.91 0.001 0.05 0.041 0.92 0.0001 17 110 0.001 0.003 0.1 0.08 0.00005 2 2 0.091 0.001 15 0.002 0.001 5.5 0.001 12 96 3.5 944.62 0.037
28-May-15 0.0005 12.5 0.24 0.001 0.06 0.07 1.4 0.0001 18 150 0.001 0.001 0.1 0.01 0.00002 3 5 0.024 0.001 13 0.001 0.001 5.5 0.001 14 90 1.8 946.32 0.028
18-Jun-15 0.0005 12.5 0.46 0.001 0.05 0.054 0.89 0.0001 15 120 0.001 0.002 0.1 0.02 0.00002 3 3 0.017 0.001 13 0.001 0.001 5.4 0.001 16 10 1.9 946.22 0.027
16-Jul-15 0.0005 6 0.88 0.001 0.05 0.041 0.821 0.0001 16 116 0.001 0.002 0.05 0.022 0.00002 2.17 2.33 0.021 0.001 14.2 0.001 0.001 5.88 0.0001 13.9 91 2.8 945.32 0.035
20-Aug-15 0.0005 7 1.73 0.001 0.05 0.038 0.807 0.0001 20.6 127 0.001 0.003 0.01 0.072 0.00002 2.15 1.89 0.023 0.001 17 0.002 0.002 6.24 0.0001 11 149 3.4 944.72 0.047
17-Sep-15 0.0005 12 1.63 0.001 0.05 0.034 0.881 0.0001 24.4 129 0.001 0.002 0.01 0.031 0.00002 2.04 1.91 0.034 0.001 20.7 0.001 0.002 5.27 0.0001 9.65 106 3.5 944.62 0.058
22-Oct-15 0.0005 10 0.96 0.001 0.05 0.032 1.03 0.0001 25.2 130 0.001 0.003 0.01 0.129 0.00002 2.63 1.77 0.05 0.001 20.8 0.002 0.001 5.2 0.0001 9 105 3.9 944.22 0.069
19-Nov-15 0.0005 10 0.52 0.001 0.05 0.036 1.2 0.0001 24.5 129 0.001 0.007 0.01 0.152 0.00002 2.46 1.85 0.132 0.001 19.4 0.002 0.001 5.09 0.0001 7.22 97 4 944.12 0.1
10-Dec-15 0.0005 9 0.68 0.001 0.05 0.036 1.18 0.0001 28.8 135 0.001 0.006 0.016 0.159 0.00002 2.09 1.96 21.5 0.001 22.4 0.002 0.001 5.06 0.0001 6.73 93 4.3 943.82 0.111
21-Jan-16 0.0005 10 2.38 0.001 0.05 0.047 1.03 0.0001 30.4 143 0.002 0.01 0.014 0.724 0.00002 2.39 1.95 0.094 0.001 20.8 0.003 0.003 5.03 0.0001 5.14 131 4.7 943.42 0.071
11-Feb-16 0.0005 11 0.61 0.001 0.05 0.03 2.97 0.0001 9.99 81 0.001 0.022 0.031 0.519 0.00002 3.05 1.48 0.047 0.001 7.96 0.002 0.001 5.12 0.0001 4.19 64 4.4 943.72 0.119
17-Mar-16 0.0005 11 0.49 0.001 0.05 0.028 3.37 0.0001 9.2 87 0.001 0.019 0.027 0.307 0.00002 4.21 1.61 0.105 0.001 6.93 0.003 0.001 5.26 0.0001 7.38 64 4.3 943.82 0.198
WGM1/D1 Post-Dry Ash Placement Data April, 2015 to March 2016
Ag ALK Al As B Ba Be Ca Cd Cl Co COND Cr Cu F Fe Hg K Li Mg Mn Mo Na Ni Pb pH Se SO4 TDS WL1 WL
AHD Zn
Average 0.0005 10 0.96 0.0010 0.05 0.041 1 0.0001 20 121 0.0011 0.0067 0.04 0.2 0.00002 3 2 1.84 0.001 16 0.002 0.001 5.4 0.000 10 91 3.5 944.6 0.075
Maximum 0.0005 13 2.38 0.0010 0.06 0.070 3 0.0001 30 150 0.0020 0.0220 0.10 0.7 0.00005 4 5 21.50 0.001 22 0.003 0.003 6.2 0.001 16 149 4.7 946.3 0.198
Minimum 0.0005 6 0.24 0.0010 0.05 0.028 1 0.0001 9 81 0.0010 0.0010 0.01 0.0 0.00002 2 1 0.02 0.001 7 0.001 0.001 5.0 0.000 4 10 1.8 943.4 0.027
50th Percentile 0.0005 11 0.78 0.0010 0.05 0.037 1 0.0001 19 128 0.0010 0.0030 0.02 0.1 0.00002 2 2 0.05 0.001 16 0.002 0.001 5.3 0.000 9 95 3.7 944.4 0.064

WGM1/D2 Pre-Dry Ash Placement Background Summary 19 88- April, 2003 (mg/L)
Ag ALK As B Ba Be Ca Cd Cl Co COND Cr Cu F Fe Hg K Mg Mn Mo Na Ni Pb pH Se SO4 TDS WL1
WL AHD
Zn Mn
Average 0.007 14 0.001 0.05 0.173 1.6 0.001 36 0.017 25534 0.013 0.007 0.17 1.1 0.0003 2 5.2 0.301 32 0.027 0.008 4.6 0.001 45 160 5.9 914.3 0.067 0.301
Maximum 0.020 138 0.002 0.30 3.000 13.0 0.001 104 0.021 44536 0.048 0.080 0.75 13.0 0.0009 5 16.0 0.800 66 0.032 0.074 5.6 0.001 102 345 8.7 917.6 0.180 0.800
Minimum 0.001 0.00 0.001 0.005 0.010 0.0 0.001 9.00 0.014 9720 0.001 0.001 0.001 0.03 0.0001 0 0.0 0.035 11 0.023 0.001 2.9 0.001 6 10 2.7 911.5 0.012 0.035
90th Percentile 0.016 24 0.001 0.10 0.114 5.0 0.001 48 0.020 31000 0.041 0.010 0.28 1.7 0.0007 4 9.0 0.442 42 0.031 0.010 5.4 0.001 61 258 7.3 917.2 0.114 0.442
WGM1/D2 Post-Dry Ash Placement Data April, 2013 to March 2015
Date Ag ALK Al As B Ba Be Ca Cd Cl Co COND Cr Cu F Fe Hg K Li Mg Mn Mo Na Ni Pb pH Se D2 SO4 TDS WL1 WL
AHD Zn
10-Apr-13 0.0005 12.5 0.22 0.001 0.025 0.045 1.1 0.0002 32 360 0.001 0.004 0.05 0.17 0.000025 4.2 16 0.4 0.01 35 0.049 0.001 4.8 0.002 113 260 7.8 912.4 0.06
17-May-13 0.0005 12.5 0.3 0.001 0.1 0.04 2.7 0.0002 29 480 0.001 0.008 0.05 2 0.000025 4 25 0.78 0.01 47 0.08 0.003 4.1 0.002 160 270 7.9 912.3 0.11
13-Jun-13 0.0005 12.5 0.28 0.001 0.05 0.047 1.8 0.0002 29 400 0.003 0.004 0.05 0.1 0.000025 4 20 0.49 0.001 39 0.058 0.002 4.2 0.002 130 300 7 913.2 0.092
10-Jul-13 0.0005 12.5 0.2 0.001 0.03 0.04 1.5 0.0002 25 380 0.001 0.009 0.05 0.04 0.000025 4 23 0.48 0.001 39 0.054 0.001 4.6 0.002 120 190 7.6 912.6 0.075
22-Aug-13 0.0005 12.5 0.27 0.001 0.1 0.038 2.3 0.0002 34 480 0.002 0.004 0.05 1.7 0.00005 3 24 0.71 0.001 49 0.068 0.002 3.9 0.002 160 290 7.8 912.4 0.087
26-Sep-13 0.0005 12.5 0.27 0.001 0.09 0.036 2.2 0.0002 36 510 0.002 0.007 0.1 4.7 0.000025 3 21 0.69 0.001 56 0.075 0.002 3.8 0.002 160 350 7.7 912.5 0.097
24-Oct-13 0.0005 12.5 0.24 0.001 0.14 0.035 2.5 0.0002 38 590 0.003 0.006 0.1 3.2 0.000025 3 22 0.78 0.001 55 0.086 0.003 3.7 0.002 190 350 7.9 912.3 0.12
7-Nov-13 0.0005 12.5 0.24 0.001 0.15 0.033 2.8 0.0002 39 650 0.003 0.005 0.1 0.69 0.000025 3 22 0.81 0.001 59 0.094 0.003 3.5 0.002 190 370 7.9 912.3 0.13
5-Dec-13 0.0005 12.5 0.28 0.001 0.13 0.033 2.5 0.0002 41 590 0.003 0.006 0.1 0.73 0.000025 3 20 0.75 0.001 57 0.086 0.003 3.5 0.002 180 300 7.7 912.5 0.12
16-Jan-14 0.0005 12.5 0.2 0.001 0.16 0.034 2.5 0.0002 42 630 0.002 0.004 0.1 0.63 0.000025 3 19 0.75 0.001 60 0.086 0.003 3.4 0.002 190 310 7.9 912.3 0.12
6-Feb-14 0.0005 12.5 0.18 0.001 0.15 0.035 2.6 0.0002 39 640 0.001 0.004 0.1 0.76 0.000025 3 19 0.75 0.001 58 0.08 0.002 3.4 0.002 190 330 8 912.2 0.1
6-Mar-14 0.0005 12.5 0.2 0.001 0.15 0.036 2.4 0.0002 40 610 0.002 0.009 0.1 3.8 0.000025 3 18 0.76 0.001 53 0.081 0.002 3.6 0.002 180 320 7.8 912.4 0.12
3-Apr-14 0.0005 12.5 0.63 0.001 0.025 0.044 1.1 0.0002 20 380 0.002 0.002 0.1 0.02 0.000025 4 17 0.4 0.001 36 0.044 0.001 4.5 0.002 130 240 5.8 914.4 0.059
2-May-14 0.0005 12.5 0.24 0.001 0.06 0.026 1.4 0.0002 22 390 0.001 0.002 0.1 0.06 0.000025 4 17 0.47 0.001 39 0.048 0.002 4.3 0.002 120 240 7.5 912.7 0.075
13-Jun-14 0.0005 12.5 0.32 0.001 0.14 0.032 2.5 0.0002 28 570 0.001 0.002 0.1 0.37 0.000025 4 20 0.77 0.001 54 0.077 0.002 3.7 0.002 160 320 7.8 912.4 0.12
11-Jul-14 0.0005 12.5 0.28 0.001 0.17 0.031 2.8 0.0002 31 620 0.001 0.001 0.1 1.1 0.000025 4 22 0.87 0.001 57 0.087 0.003 3.6 0.002 180 340 7.7 912.5 0.12
15-Aug-14 0.0005 12.5 0.28 0.001 0.18 0.032 2.8 0.0002 35 620 0.001 0.001 0.1 2.9 0.000025 3 23 0.85 0.001 59 0.084 0.003 3.6 0.002 200 350 7.8 912.4 0.12
12-Sep-14 0.0005 12.5 0.34 0.001 0.025 0.041 1.3 0.0002 21 410 0.001 0.001 0.1 0.1 0.000025 4 20 0.45 0.001 42 0.05 0.002 4.9 0.002 150 250 5 915.2 0.08
24-Oct-14 0.0005 12.5 0.25 0.001 0.12 0.034 2.3 0.0002 29 540 0.001 0.001 0.1 1.5 0.000025 3 20 0.69 0.001 52 0.071 0.003 3.7 0.002 170 270 7.6 912.6 0.096
14-Nov-14 0.0005 12.5 0.35 0.001 0.18 0.029 3 0.0002 38 640 0.001 0.001 0.1 3.9 0.000025 4 23 0.84 0.001 62 0.083 0.003 3.5 0.002 210 330 7.9 912.3 0.12
12-Dec-14 0.0005 12.5 0.19 0.001 0.025 0.029 1.1 0.0002 15 380 0.001 0.001 0.1 0.02 0.000025 5 17 0.39 0.001 40 0.046 0.002 5 0.002 130 210 3.9 916.3 0.054
15-Jan-15 0.0005 12.5 0.16 0.001 0.025 0.028 1.1 0.0002 15 370 0.001 0.001 0.1 0.01 0.000025 4 17 0.38 0.001 39 0.039 0.002 5 0.002 130 250 3.1 917.1 0.048
12-Feb-15 0.0005 12.5 0.17 0.001 0.025 0.031 1.1 0.0002 20 360 0.001 0.001 0.1 0.02 0.000025 4 15 0.36 0.001 40 0.043 0.002 4.5 0.002 120 240 7.3 912.9 0.05
12-Mar-15 0.0005 12.5 0.31 0.001 0.09 0.037 2 0.0002 29 470 0.001 0.003 0.1 0.37 0.000025 4 19 0.57 0.001 52 0.061 0.002 4 0.002 160 290 7.7 912.5 0.071
WGM1/D2 Post-Dry Ash Placement Data April, 2013 to March 2015
Ag ALK Al As B Ba Be Ca Cd Cl Co COND Cr Cu F Fe Hg K Li Mg Mn Mo Na Ni Pb pH Se SO4 TDS WL1 WL
AHD Zn
Average 0.0005 13 0.29 0.0010 0.0888 0.035 2 0.0002 25.2500 479.1667 0.0011 0.0014 0.1000 0.8642 0.00003 4 20 0.5867 0.0010 49 0.0611 0.0023 4.1917 0.0020 155.0000 277.5000 7.2 913.0 0.0844
Maximum 0.0005 13 0.63 0.0010 0.18 0.047 3 0.0002 42 650 0.0030 0.0090 0.10 4.7 0.00005 5 25 0.87 0.010 62 0.094 0.003 5.0 0.002 210 370 8.0 917.1 0.130
Minimum 0.0005 13 0.16 0.0010 0.03 0.026 1 0.0002 15 360 0.0010 0.0010 0.05 0.0 0.00003 3 15 0.36 0.001 35 0.039 0.001 3.4 0.002 113 190 3.1 912.2 0.048
50th Percentile 0.0005 13 0.26 0.0010 0.10 0.035 2 0.0002 30 495 0.0010 0.0035 0.10 0.7 0.00003 4 20 0.70 0.001 52 0.073 0.002 3.9 0.002 160 295 7.7 912.5 0.097

WGM1/D2 Post-Dry Ash Placement Data April, 2015 to March 2016
Date Ag ALK Al As B Ba Be Ca Cd Cl Co COND Cr Cu F Fe Hg K Li Mg Mn Mo Na Ni Pb pH Se D2 SO4 TDS WL1 WL
AHD Zn
10-Apr-15 0.0005 12.5 0.19 0.001 0.1 0.029 1.9 0.0001 27 500 0.001 0.001 0.1 0.53 0.00005 3 18 0.58 0.001 48 0.062 0.002 3.8 0.001 160 290 7.3 912.9 0.073
28-May-15 0.0005 12.5 0.16 0.001 0.06 0.03 1.4 0.0001 22 430 0.001 0.001 0.1 0.24 0.00002 4 16 0.45 0.001 42 0.046 0.001 4.3 0.001 140 270 7.5 912.7 0.058
18-Jun-15 0.0005 12.5 0.26 0.001 0.12 0.031 2 0.0001 29 510 0.001 0.001 0.1 2.3 0.00002 3 19 0.61 0.001 54 0.065 0.002 3.8 0.001 180 240 7.8 912.4 0.074
16-Jul-15 0.0005 0.5 0.2 0.001 0.025 0.032 1.24 0.0001 17.9 405 0.001 0.001 0.1 0.135 0.00002 3.07 14.8 0.419 0.001 44.5 0.048 0.001 4.74 0.0001 152 250 5.9 914.3 0.061
20-Aug-15 0.0005 0.5 0.31 0.001 0.14 0.033 2.17 0.0001 28.5 562 0.001 0.001 0.025 1.01 0.00002 3.76 19.3 0.642 0.001 54.7 0.075 0.002 3.85 0.0001 184 364 7.8 912.4 0.094
17-Sep-15 0.0005 0.5 0.22 0.001 0.09 0.029 2.01 0.0001 28.1 505 0.001 0.001 0.01 0.542 0.00002 3.79 19.7 0.558 0.001 55.5 0.054 0.001 4.03 0.0001 146 292 7.6 912.6 0.084
22-Oct-15 0.0005 0.5 0.25 0.001 0.16 0.028 2.61 0.0001 37.6 630 0.001 0.001 0.025 4.08 0.00002 4.18 18.5 0.725 0.001 60.4 0.073 0.002 3.61 0.0001 209 400 7.9 912.3 0.099
19-Nov-15 0.0005 0.5 0.15 0.001 0.025 0.027 1.45 0.0001 17.8 419 0.001 0.001 0.01 0.059 0.00002 3.55 13.2 0.396 0.001 44.9 0.049 0.001 3.97 0.0001 145 236 7 913.2 0.063
10-Dec-15 0.0005 0.5 0.26 0.001 0.14 0.032 2.76 0.0002 34.9 601 0.001 0.003 0.037 1.24 0.00002 3.74 20.4 0.598 0.001 62.6 0.081 0.002 3.56 0.0001 199 393 8 912.2 0.173
21-Jan-16 0.0005 0.5 0.15 0.001 0.025 0.024 1.28 0.0001 16.9 402 0.001 0.002 0.01 0.06 0.00002 3.38 12.7 0.365 0.001 40.9 0.041 0.001 3.89 0.0001 131 261 6.5 913.7 0.055
11-Feb-16 0.0005 0.5 0.12 0.001 0.05 0.027 1.08 0.0001 22.3 392 0.001 0.001 0.016 0.059 0.00002 3.41 12.7 0.312 0.001 44 0.038 0.001 4.12 0.0001 124 230 7.7 912.5 0.047
17-Mar-16 0.0005 0.5 0.21 0.001 0.08 0.028 1.52 0.0001 24.6 476 0.001 0.001 0.01 0.416 0.00002 2.97 14.7 0.467 0.001 51.6 0.056 0.002 3.77 0.0001 144 289 7.7 912.5 0.076
WGM1/D2 Post-Dry Ash Placement Data April, 2015 to March 2016
Ag ALK Al As B Ba Be Ca Cd Cl Co COND Cr Cu F Fe Hg K Li Mg Mn Mo Na Ni Pb pH Se SO4 TDS WL1 WL
AHD Zn
Average 0.0005 4 0.21 0.0010 0.08 0.029 2 0.0001 26 486 0.0010 0.0013 0.0 0.9 0.00002 3 17 0.51 0.0010 50.258 0.057 0.002 4.0 0.000 160 293 7.4 912.8 0.080
Maximum 0.0005 13 0.31 0.0010 0.16 0.033 3 0.0002 38 630 0.0010 0.0030 0.1 4.1 0.00005 4 20 0.73 0.0010 62.600 0.081 0.002 4.7 0.001 209 400 8.0 914.3 0.173
Minimum 0.0005 1 0.12 0.0010 0.03 0.024 1 0.0001 17 392 0.0010 0.0010 0.0 0.1 0.00002 3 13 0.31 0.0010 40.900 0.038 0.001 3.6 0.000 124 230 5.9 912.2 0.047
50th Percentile 0.0005 1 0.21 0.0010 0.09 0.029 2 0.0001 26 488 0.0010 0.0010 0.0 0.5 0.00002 3 17 0.51 0.0010 49.800 0.055 0.002 3.9 0.000 149 280 7.7 912.6 0.074

6. Water Quality Data and Summary for KVAD/R Dry Ash P lacement Area Seepage Detection Groundwater Bores W GM1/D5 and 1/D6
a) Groundwater Bore WGM1/D5
WGM1/D5 Pre-Dry Ash Placement Background Summary 19 88-April, 2003 (mg/L)
Ag ALK As B Ba Be Ca Cd Cl Co COND Cr Cu F Fe Hg K Mg Mn Mo Na Ni Pb pH Se SO4 TDS WL1
WL
AHD Zn Mn
Average 0.001 18 0.004 1.29 0.166 0.006 12.4 0.002 20 0.061 701 0.017 0.019 0.41 6.9 0.0003 16 20.3 1.630 61 0.125 0.010 3.8 0.001 259 470 4.8 899.6 0.338 1.630
Maximum 0.001 90 0.013 2.00 1.700 0.006 23.0 0.005 90 0.075 1050 0.055 0.080 1.02 17.0 0.0007 23 34.0 3.970 127 0.140 0.050 5.4 0.002 380 1913 8.8 902.0 2.630 3.970
Minimum 0.001 1 0.001 0.08 0.010 0.006 5.2 0.001 8 0.047 283 0.003 0.001 0.10 0.1 0.0002 7 8.0 0.520 7 0.110 0.002 2.8 0.001 92 48 2.3 895.4 0.032 0.520
90th Percentile 0.001 51 0.008 1.70 0.148 0.006 19.7 0.004 24 0.072 810 0.041 0.058 0.65 14.7 0.0006 19 26.0 2.500 70 0.137 0.021 4.5 0.002 328 550 8.3 901.7 0.505 2.500
WGM1/D5 Post-Dry Ash Placement Date April, 2013 to March 2015
Date Ag ALK Al As B Ba Be Ca Cd Cl Co COND Cr Cu F Fe Hg K Li Mg Mn Mo Na Ni Pb pH Se SO4 TDS WL
AHD WL1 Zn
10-Apr-13
17-May-13
13-Jun-13 0.001 12.5 4 0.0005 0.2 0.02 17 0.0006 5 340 0.004 0.009 0.4 0.09 0.00005 7 10 1.7 0.0005 9 0.097 0.003 3.7 0.001 130 200 900.49 3.7 0.25
10-Jul-13 0.001 12.5 6.6 0.0005 0.7 0.027 24 0.0007 11 520 0.003 0.003 0.5 0.55 0.00005 10 21 2.9 0.0005 24 0.18 0.003 3.8 0.001 220 350 896.49 7.7 0.35
22-Aug-13 895.99 8.2
26-Sep-13 896.19 8
24-Oct-13 895.89 8.3
7-Nov-13 0.001 130 27 0.007 1.4 0.086 33 0.013 36 840 0.01 0.044 0.1 2.9 0.00018 20 39 4.8 0.003 59 0.3 0.042 6.1 0.01 280 540 895.79 8.4 2.2
5-Dec-13 895.89 8.3
16-Jan-14 895.79 8.4
6-Feb-14 895.79 8.4
6-Mar-14 0.001 12.5 3.9 0.0005 0.27 0.025 16 0.0007 6 400 0.002 0.006 0.4 0.12 0.00005 7 10 1.6 0.0005 10 0.1 0.003 3.7 0.001 140 240 900.19 4 0.23
3-Apr-14 0.001 12.5 5.8 0.0005 0.22 0.036 19 0.001 4 370 0.002 0.003 0.5 0.87 0.00005 6 10 2.1 0.0005 8 0.14 0.002 3.8 0.001 150 250 901.09 3.1 0.34
2-May-14 0.001 12.5 8.9 0.0005 0.88 0.031 26 0.0006 15 590 0.004 0.002 0.7 1.9 0.00005 11 23 3.7 0.0005 23 0.23 0.002 3.9 0.001 260 420 897.29 6.9 0.3
13-Jun-14 0.001 12.5 61 0.029 1.7 0.17 43 0.11 30 1000 0.021 0.12 1.3 0.78 0.00033 19 44 6.2 0.006 59 0.72 0.22 4 0.01 440 780 895.99 8.2 6.4
11-Jul-14 0.001 12.5 24 0.013 2 0.052 44 0.071 33 1100 0.005 0.034 1.1 0.28 0.00005 20 50 6.7 0.001 67 0.55 0.11 4 0.003 500 870 896.09 8.1 2
15-Aug-14 0.001 12.5 16 0.008 1.4 0.036 34 0.068 29 920 0.004 0.017 0.9 0.27 0.00005 19 41 5.5 0.0005 49 0.33 0.086 4.1 0.002 460 720 895.69 8.5 2.5
12-Sep-14 0.001 12.5 7 0.0005 0.65 0.017 23 0.0024 11 550 0.002 0.015 0.5 0.16 0.00005 12 21 2.8 0.0005 24 0.17 0.008 3.8 0.001 250 340 898.49 5.7 0.43
24-Oct-14 0.001 12.5 8.9 0.007 0.76 0.034 23 0.022 12 590 0.004 0.045 0.5 1.2 0.00008 14 24 3.1 0.001 27 0.24 0.061 4.1 0.001 250 370 896.09 8.1 1.3
14-Nov-14 0.001 12.5 25 0.015 1.8 0.05 45 0.11 37 1100 0.009 0.13 1.2 0.93 0.00016 20 50 6.4 0.003 69 0.43 0.21 4 0.006 590 860 895.79 8.4 3.8
12-Dec-14 0.001 12.5 2.1 0.0005 0.28 0.014 13 0.0005 4 330 0.0005 0.003 0.1 0.08 0.00005 9 10 1.5 0.0005 10 0.094 0.003 3.8 0.001 110 200 900.89 3.3 0.16
15-Jan-15 0.001 12.5 6.7 0.0005 0.27 0.035 18 0.001 4 330 0.0005 0.003 0.4 0.12 0.00005 6 11 1.9 0.0005 8 0.18 0.002 4.1 0.001 140 250 901.29 2.9 0.45
12-Feb-15 0.001 12.5 9.4 0.001 0.94 0.034 27 0.0009 17 620 0.002 0.005 0.8 3.8 0.00005 11 21 3.3 0.0005 24 0.29 0.004 3.7 0.001 260 470 896.59 7.6 0.61
12-Mar-15 0.001 12.5 26 0.004 1.8 0.06 45 0.013 34 1100 0.005 0.033 1.5 5 0.00011 22 48 6.4 0.008 65 0.42 0.042 3.9 0.004 550 860 896.09 8.1 1.2
WGM1/D5 Post-Dry Ash Placement Date April, 2013 to March 2015
Ag ALK Al As B Ba Be Ca Cd Cl Co COND Cr Cu F Fe Hg K Li Mg Mn Mo Na Ni Pb pH Se SO4 TDS WL1 WL
AHD Zn
Average 0.0010 20 15.14 0.0055 0.95 0.045 28 0.0260 18 669 0.0049 0.0295 0.68 1.2 0.00009 13 27 3.79 0.002 33 0.279 0.050 4.0 0.003 296 483 897.3 6.9 1.408
Maximum 0.0010 130 61.00 0.0290 2.00 0.170 45 0.1100 37 1100 0.0210 0.1300 1.50 5.0 0.00033 22 50 6.70 0.008 69 0.720 0.220 6.1 0.010 590 870 901.3 8.5 6.400
Minimum 0.0010 13 2.10 0.0005 0.20 0.014 13 0.0005 4 330 0.0005 0.0020 0.10 0.1 0.00005 6 10 1.50 0.001 8 0.094 0.002 3.7 0.001 110 200 895.7 2.9 0.160
50th Percentile 0.0010 13 8.90 0.0008 0.82 0.035 25 0.0017 14 590 0.0040 0.0120 0.50 0.7 0.00005 12 22 3.20 0.001 24 0.235 0.006 3.9 0.001 255 395 896.1 8.1 0.530

WGM1/D5 Post-Dry Ash Placement Date April, 2015 to March 2016
Date Ag ALK Al As B Ba Be Ca Cd Cl Co COND Cr Cu F Fe Hg K Li Mg Mn Mo Na Ni Pb pH Se SO4 TDS WL
AHD WL1 Zn
10-Apr-15 0.0005 12.5 21 0.006 2 0.05
39 0.051 30 1100 0.005 0.049 1.3 1.7 0.00011 20 47 6.2 0.003 64 0.39 0.084 4 0.005 560 870 896.09 8.1 1.7
28-May-15 0.0005 12.5 14 0.002 1.4 0.044 34 0.071 22 920 0.003 0.024 0.8 2.1 0.00002 14 36 4.8 0.001 42 0.33 0.08 3.9 0.002 430 650 896.19 8 2.3
18-Jun-15 0.0005 12.5 29 0.004 2.6 0.041 49 0.051 36 1300 0.003 0.051 1.5 0.31 0.00002 23 59 7.5 0.001 81 0.5 0.1 3.8 0.005 710 1000 896.09 8.1 2.5
16-Jul-15 0.0005 0.5 26.4 0.006 2.27 0.05 39.8 0.0353 29.2 1260 0.007 0.055 0.3 0.849 0.00009 23.3 48.4 6.61 0.002 65.2 0.446 0.09 3.78 0.0023 616 850 896.29 7.9 2.15
20-Aug-15 0.0005 0.5 30.5 0.007 2.67 0.042 46 0.0531 33.5 1310 0.006 0.067 0.674 0.541 0.00009 24.8 53.6 6.73 0.001 76.2 0.559 0.12 3.79 0.0026 649 919 895.89 8.3 3.2
17-Sep-15 0.0005 0.5 25.7 0.006 2.07 0.043 44.8 0.0444 31.4 1153 0.006 0.049 1.02 0.239 0.00005 26.8 51.2 5.86 0.001 61.6 0.401 0.099 3.78 0.0017 600 876 895.89 8.3 3.18
22-Oct-15 0.0005 0.5 29.8 0.005 2.08 0.066 49.8 0.0451 38.5 1363 0.01 0.1 0.917 1.07 0.0001 29.7 56.2 6.72 0.003 86.7 0.438 0.104 3.84 0.0036 703 1140 895.89 8.3 2.81
19-Nov-15 0.0005 0.5 8.27 0.005 0.97 0.036 23.2 0.0251 15.2 696 0.002 0.032 0.333 1.02 0.00002 21 22.4 2.95 0.001 35.2 0.209 0.048 3.97 0.0016 299 464 895.99 8.2 1.35
10-Dec-15 0.0005 0.5 12 0.005 1.16 0.029 31.6 0.0343 22.6 841 0.002 0.028 0.394 0.6 0.00002 22.5 33.6 3.34 0.001 50.6 0.335 0.057 3.81 0.0009 382 610 895.79 8.4 3.37
21-Jan-16 0.0005 3 4.31 0.002 0.99 0.026 21.6 0.0023 16.8 632 0.003 0.026 0.164 6.24 0.00002 16.6 24.3 2.88 0.001 34.5 0.126 0.009 4.82 0.0005 250 450 896.49 7.7 0.212
11-Feb-16 0.0005 0.5 12.6 0.005 1.33 0.067 32.5 0.0118 18.9 797 0.005 0.032 0.243 4.71 0.00006 16.5 28.7 3.59 0.008 41.6 0.233 0.041 4.39 0.0014 340 560 895.89 8.3 0.931
17-Mar-16 0.0005 0.5 13.8 0.005 1.54 0.041 31.3 0.0115 18.8 866 0.003 0.021 0.39 2.53 0.00002 18.3 33.7 4.25 0.003 54 0.276 0.03 4.28 0.0013 401 630 896.09 8.1 1.19
WGM1/D5 Post-Dry Ash Placement Date April, 2015 to March 2016
Ag ALK Al As B Ba Be Ca Cd Cl Co COND Cr Cu F Fe Hg K Li Mg Mn Mo Na Ni Pb pH Se SO4 TDS WL1 WL
AHD Zn
Average 0.0005 4 18.95 0.0048 1.76 0.045 37 0.0363 26 1020 0.0046 0.0445 0.67 1.8 0.00005 21 41 5.12 0.002 58 0.354 0.072 4.0 0.002 495 752 896.0 8.1 2.074
Maximum 0.0005 13 30.50 0.0070 2.67 0.067 50 0.0710 39 1363 0.0100 0.1000 1.50 6.2 0.00011 30 59 7.50 0.008 87 0.559 0.120 4.8 0.005 710 1140 896.5 8.4 3.370
Minimum 0.0005 1 4.31 0.0020 0.97 0.026 22 0.0023 15 632 0.0020 0.0210 0.16 0.2 0.00002 14 22 2.88 0.001 35 0.126 0.009 3.8 0.001 250 450 895.8 7.7 0.212
50th Percentile 0.0005 1 17.50 0.0050 1.77 0.043 37 0.0399 26 1010 0.0040 0.0405 0.53 1.0 0.00004 22 42 5.33 0.001 58 0.363 0.082 3.9 0.002 495 750 896.0 8.2 2.225

b) Groundwater Bore WGM1/D6
WGM1/D6 Pre-Dry Ash Placement Background Summary 19 88-April, 2003 (mg/L)
Ag ALK As B Ba Be Ca Cd Cl COND Cr Cu F Fe Hg K Mg Mn Mo Na Ni Pb pH Se SO4 TDS WL1
WL
AHD Zn
Average 0.001 27 0.003 0.78 0.184 22.3 0.002 53 94830 0.011 0.016 0.14 93.3 0.0004 7 25.4 4.005 45 0.117 0.007 4.5 0.016 340 603 10.8 896.2 0.107
Maximum 0.001 390 0.015 1.10 1.900 33.0 0.009 160 143000 0.032 0.260 0.65 174.2 0.0009 48 34.0 5.400 90 0.210 0.023 5.8 0.100 536 902 11.4 896.9 0.566
Minimum 0.001 0 0.001 0.27 0.021 14.0 0.001 23 60100 0.001 0.001 0.001 0.1 0.0001 4 17.0 1.390 26 0.023 0.001 1.4 0.001 190 320 10.1 895.6 0.004
90th Percentile 0.001 39 0.005 0.98 0.210 27.0 0.003 65 110000 0.020 0.021 0.28 123.0 0.0007 9 30.0 4.810 55 0.191 0.013 5.5 0.043 381 736 11.2 896.6 0.232
WGM1/D6 Post-Dry Ash Placement Data April, 2013 to March 2015
Date Ag ALK Al As B Ba Be Ca Cd Cl Co COND Cr Cu F Fe Hg K Li Mg Mn Mo Na Ni Pb pH Se SO4 TDS WL1 WL AHD Zn
10-Apr-13 0.001 12.5 1.1 0.002 0.4 0.017 9.3 0.0001 53 810 0.001 0.009 0.3 3.9 0.00005 5.6 34 1.9 0.005 69 0.23 0.001 4.4 0.001 281 580 10.8 896.15 0.24
17-May-13 0.001 12.5 1.5 0.005 0.32 0.02 13 0.0014 60 950 0.002 0.01 0.05 37 0.00005 6 37 2.5 0.005 72 0.27 0.01 3.3 0.001 300 540 11.2 895.75 0.7
13-Jun-13 0.001 12.5 4.1 0.002 0.45 0.019 8.7 0.0006 32 1000 0.004 0.005 0.6 1.5 0.00005 6 59 1.5 0.0005 82 0.5 0.003 3.4 0.001 560 660 11.1 895.85 1.6
10-Jul-13 0.001 12.5 4.8 0.002 0.51 0.022 5.2 0.0005 26 930 0.002 0.006 0.6 0.76 0.00005 6 65 0.76 0.0005 86 0.52 0.002 3.6 0.001 400 630 11 895.95 1.1
22-Aug-13 0.001 12.5 3.6 0.002 0.41 0.017 6.3 0.0001 26 880 0.002 0.001 0.5 0.74 0.00005 6 59 1 0.0005 77 0.39 0.0005 3.5 0.001 370 560 11.2 895.75 0.9
26-Sep-13 0.001 12.5 2.8 0.002 0.4 0.019 8.8 0.0001 31 1000 0.003 0.002 0.5 25 0.00005 6 55 1.6 0.0005 79 0.46 0.0005 3.3 0.001 410 680 11.2 895.75 1.1
24-Oct-13 0.001 12.5 2.4 0.002 0.44 0.022 10 0.0001 35 980 0.004 0.003 0.5 10 0.00005 6 53 1.9 0.0005 79 0.45 0.0005 3.6 0.001 440 660 11.2 895.75 0.99
7-Nov-13 0.001 12.5 2.5 0.003 0.87 0.022 29 0.0002 36 1400 0.007 0.01 0.5 15 0.00005 14 61 3.5 0.002 89 0.52 0.005 3.1 0.001 610 860 11.1 895.85 1.1
5-Dec-13 0.001 12.5 4 0.006 0.77 0.027 22 0.0028 45 1600 0.004 0.009 0.8 16 0.00005 8 72 4 0.0005 92 0.63 0.008 3 0.001 660 870 10.7 896.25 2
16-Jan-14 0.001 12.5 3.8 0.007 0.82 0.028 23 0.0009 44 1600 0.004 0.006 0.7 22 0.00005 8 74 4.2 0.0005 96 0.65 0.004 3 0.001 680 920 10.7 896.25 1.6
6-Feb-14 0.001 12.5 3.1 0.006 0.9 0.026 29 0.0006 44 1700 0.004 0.009 0.6 40 0.00005 8 75 5.3 0.0005 86 0.56 0.003 2.9 0.001 750 1000 10.7 896.25 1.2
6-Mar-14 0.001 12.5 3.9 0.008 1 0.027 29 0.0007 46 1800 0.004 0.005 0.5 57 0.00005 8 74 6 0.0005 83 0.61 0.004 3 0.001 770 1200 10.8 896.15 1.3
3-Apr-14 0.001 12.5 6.5 0.004 0.7 0.023 20 0.0009 56 1700 0.003 0.005 0.1 10 0.00005 8 88 3.7 0.0005 130 0.67 0.005 3 0.001 750 1100 10.7 896.25 1.8
2-May-14 0.001 12.5 3 0.007 0.87 0.019 27 0.0008 47 1500 0.003 0.004 0.4 80 0.00005 8 70 5.4 0.0005 96 0.45 0.009 3.3 0.001 690 1000 10.9 896.05 0.6
13-Jun-14 0.001 12.5 2.6 0.007 1.1 0.022 36 0.0007 42 1600 0.003 0.002 0.5 130 0.00005 8 70 7.1 0.0005 94 0.4 0.009 3.6 0.001 720 1200 11.1 895.85 0.69
11-Jul-14 0.001 12.5 3.3 0.006 1.1 0.025 36 0.0014 44 1600 0.003 0.004 0.4 120 0.00005 8 72 7.3 0.0005 89 0.43 0.015 3.5 0.001 720 1200 10.9 896.05 0.99
15-Aug-14 0.001 12.5 2.1 0.006 0.94 0.019 31 0.003 44 1400 0.002 0.008 0.4 110 0.00005 8 61 6.4 0.0005 89 0.35 0.011 3.7 0.001 710 1100 11.2 895.75 1.3
12-Sep-14 0.001 12.5 5.4 0.003 0.4 0.017 5 0.0015 26 900 0.002 0.003 0.7 5.5 0.00005 5 53 0.74 0.0005 74 0.47 0.01 3.7 0.001 410 590 11.1 895.85 1.4
24-Oct-14 0.001 12.5 4.2 0.005 0.92 0.023 26 0.0022 37 1700 0.003 0.005 0.6 90 0.00005 7 71 4.9 0.001 85 0.55 0.016 2.9 0.001 660 950 11.2 895.75 1.8
14-Nov-14 0.001 12.5 4.2 0.006 1.1 0.026 34 0.0041 45 1600 0.002 0.008 0.6 130 0.00005 8 76 6.5 0.0005 94 0.54 0.02 3.2 0.001 880 1200 11.4 895.55 2
12-Dec-14 0.001 12.5 5.5 0.004 0.75 0.023 21 0.004 35 1500 0.002 0.006 0.6 69 0.00005 8 72 3.8 0.0005 93 0.66 0.018 3.1 0.001 610 880 10.8 896.15 1.9
15-Jan-15 0.001 12.5 5.7 0.003 0.58 0.018 8.2 0.001 33 1200 0.001 0.002 0.8 15 0.00005 7 65 1.1 0.0005 110 0.54 0.007 3.4 0.001 460 780 10.7 896.25 1.2
12-Feb-15 0.001 12.5 2.6 0.004 0.73 0.021 20 0.0036 32 1400 0.002 0.007 0.4 69 0.00005 7 58 3.6 0.0005 92 0.45 0.017 3 0.001 540 880 11.1 895.85 0.99
12-Mar-15 0.001 12.5 2.4 0.004 0.95 0.028 35 0.0025 40 1600 0.002 0.008 0.6 140 0.00005 8 74 6.5 0.0005 98 0.44 0.011 3.4 0.001 750 1200 11.2 895.75 0.93
WGM1/D6 Post-Dry Ash Placement Data April, 2013 to March 2015
Ag ALK Al As B Ba Be Ca Cd Cl Co COND Cr Cu F Fe Hg K Li Mg Mn Mo Na Ni Pb pH Se SO4 TDS WL1 WL
AHD Zn
Average 0.0010 13 3.55 0.0044 0.73 0.022 21 0.0014 40 1348 0.0029 0.0057 0.51 49.9 0.00005 7 65 3.80 0.001 89 0.489 0.008 3.3 0.001 589 885 11.0 896.0 1.226
Maximum 0.0010 13 6.50 0.0080 1.10 0.028 36 0.0041 60 1800 0.0070 0.0100 0.80 140.0 0.00005 14 88 7.30 0.005 130 0.670 0.020 4.4 0.001 880 1200 11.4 896.3 2.000
Minimum 0.0010 13 1.10 0.0020 0.32 0.017 5 0.0001 26 810 0.0010 0.0010 0.05 0.7 0.00005 5 34 0.74 0.001 69 0.230 0.001 2.9 0.001 281 540 10.7 895.6 0.240
50th Percentile 0.0010 13 3.45 0.0040 0.76 0.022 22 0.0009 41 1450 0.0030 0.0055 0.50 31.0 0.00005 8 68 3.75 0.001 89 0.485 0.008 3.3 0.001 635 880 11.1 895.9 1.150

WGM1/D6 Post -Dry Ash Placement Dat a April, 2015 to March 2016
Date Ag ALK Al As B Ba Be Ca Cd Cl Co COND Cr Cu F Fe Hg K Li Mg Mn Mo Na Ni Pb pH Se SO4 TDS WL1 WL AHD Zn
10-Apr-15 0.0005 12.5 3.9 0.005 0.91 0.023 27 0.0045 37 1600 0.002 0.008 0.7 100 0.000025 8 72 5.2 0.001 94 0.54 0.021 3.3 0.001 740 1200 11.1 895.85 1.40
28-May-15 0.0005 12.5 3.5 0.003 0.51 0.019 13 0.0039 29 1300 0.001 0.007 0.4 38 0.00002 6 59 2 0.001 89 0.43 0.019 3.3 0.001 510 740 11.3 895.65 1.00
18-Jun-15 0.0005 12.5 6 0.002 0.43 0.019 4.9 0.0023 22 1000 0.0005 0.007 0.5 2 0.00002 6 56 0.62 0.001 94 0.53 0.018 3.7 0.001 480 650 11.3 895.65 1.20
16-Jul-15 0.0005 0.5 5.05 0.002 0.43 0.017 5.29 0.0051 17.3 1010 0.001 0.015 0.4 6.69 0.00002 6.08 49.8 0.67 0.001 83.3 0.441 0.028 3.57 0.0001 431 658 11.3 895.65 1.21
20-Aug-15 0.0005 0.5 4.26 0.003 0.85 0.021 19.7 0.0035 28.6 1420 0.002 0.01 0.262 57.3 0.00002 7.84 68.8 3.09 0.001 103 0.586 0.014 3.72 0.0001 695 1030 11.3 895.65 1.57
17-Sep-15 0.0005 0.5 4.58 0.002 0.68 0.019 15.4 0.0005 24.2 1204 0.0005 0.005 0.292 40.4 0.00002 7.39 67.4 2.16 0.001 102 0.458 0.005 4.14 0.0001 631 922 11.4 895.55 1.48
22-Oct-15 0.0005 0.5 4.14 0.003 0.78 0.019 24.7 0.0007 32.9 1144 0.002 0.002 0.575 74.8 0.00002 9.57 69.5 3.83 0.001 100 0.487 0.006 4.18 0.0001 783 1130 11.3 895.65 1.35
19-Nov-15 0.0005 0.5 5.27 0.004 0.62 0.019 17.4 0.0014 24.7 1281 0.002 0.005 0.526 54.4 0.00002 7.82 62.2 2.83 0.001 95.9 0.538 0.016 3.98 0.0002 620 925 10.9 896.05 1.44
10-Dec-15 0.0005 0.5 4.37 0.002 1.24 0.023 37.7 0.0015 38.4 1626 0.003 0.006 0.436 143 0.00002 9.36 82.3 6.66 0.001 106 0.558 0.013 4.1 0.0002 967 1380 11 895.95 1.34
21-Jan-16 0.0005 0.5 6.12 0.002 0.99 0.022 34.9 0.0014 40 1747 0.003 0.014 0.641 123 0.00002 9.15 90.5 6.09 0.001 122 0.604 0.014 4.05 0.0002 930 1490 11 895.95 1.51
11-Feb-16 0.0005 0.5 2.86 0.002 0.51 0.012 12 0.001 18.4 1027 0.001 0.009 0.382 33.4 0.00002 6.56 47 1.86 0.001 89.3 0.374 0.009 3.94 0.0001 491 619 11.1 895.85 1.02
17-Mar-16 0.0005 4.32 0.5 0.001 1.12 0.02 34.4 0.0022 38.1 1587 0.002 0.009 0.0005 4.32 0.349 126 0.00002 7.94 76.4 5.96 0.001 103 0.478 0.016 4.16 7.94 0.0002 854 1370 11.1 895.85 1.13
WGM1/D6 Post-Dry Ash Placement Data April, 2015 to March 2016
Ag ALK Al As B Ba Be Ca Cd Cl Co COND Cr Cu F Fe Hg K Li Mg Mn Mo Na Ni Pb pH Se SO4 TDS WL1 WL
AHD Zn
Average 0.0005 4 4.53 0.0026 0.76 0.019 21 0.0023 29 1329 0.0017 0.0081 0.46 66.6 0.00002 8 67 3.41 0.001 98 0.502 0.015 3.8 0.000 678 1010 11.2 895.8 1.304
Maximum 0.001 13 6.12 0.0050 1.24 0.023 38 0.0051 40 1747 0.0030 0.0150 0.70 143.0 0.00003 10 91 6.66 0.001 122 0.604 0.028 4.2 0.001 967 1490 11.4 896.1 1.570
Minimum 0.0005 1 2.86 0.0010 0.43 0.012 5 0.0005 17 1000 0.0005 0.0020 0.26 2.0 0.00002 6 47 0.62 0.001 83 0.374 0.005 3.3 0.000 431 619 10.9 895.6 1.000
50th Percentile 0.001 1 4.35 0.0020 0.73 0.019 19 0.0019 29 1291 0.0020 0.0075 0.42 55.9 0.00002 8 68 2.96 0.001 98 0.509 0.015 4.0 0.000 663 978 11.2 895.8 1.345
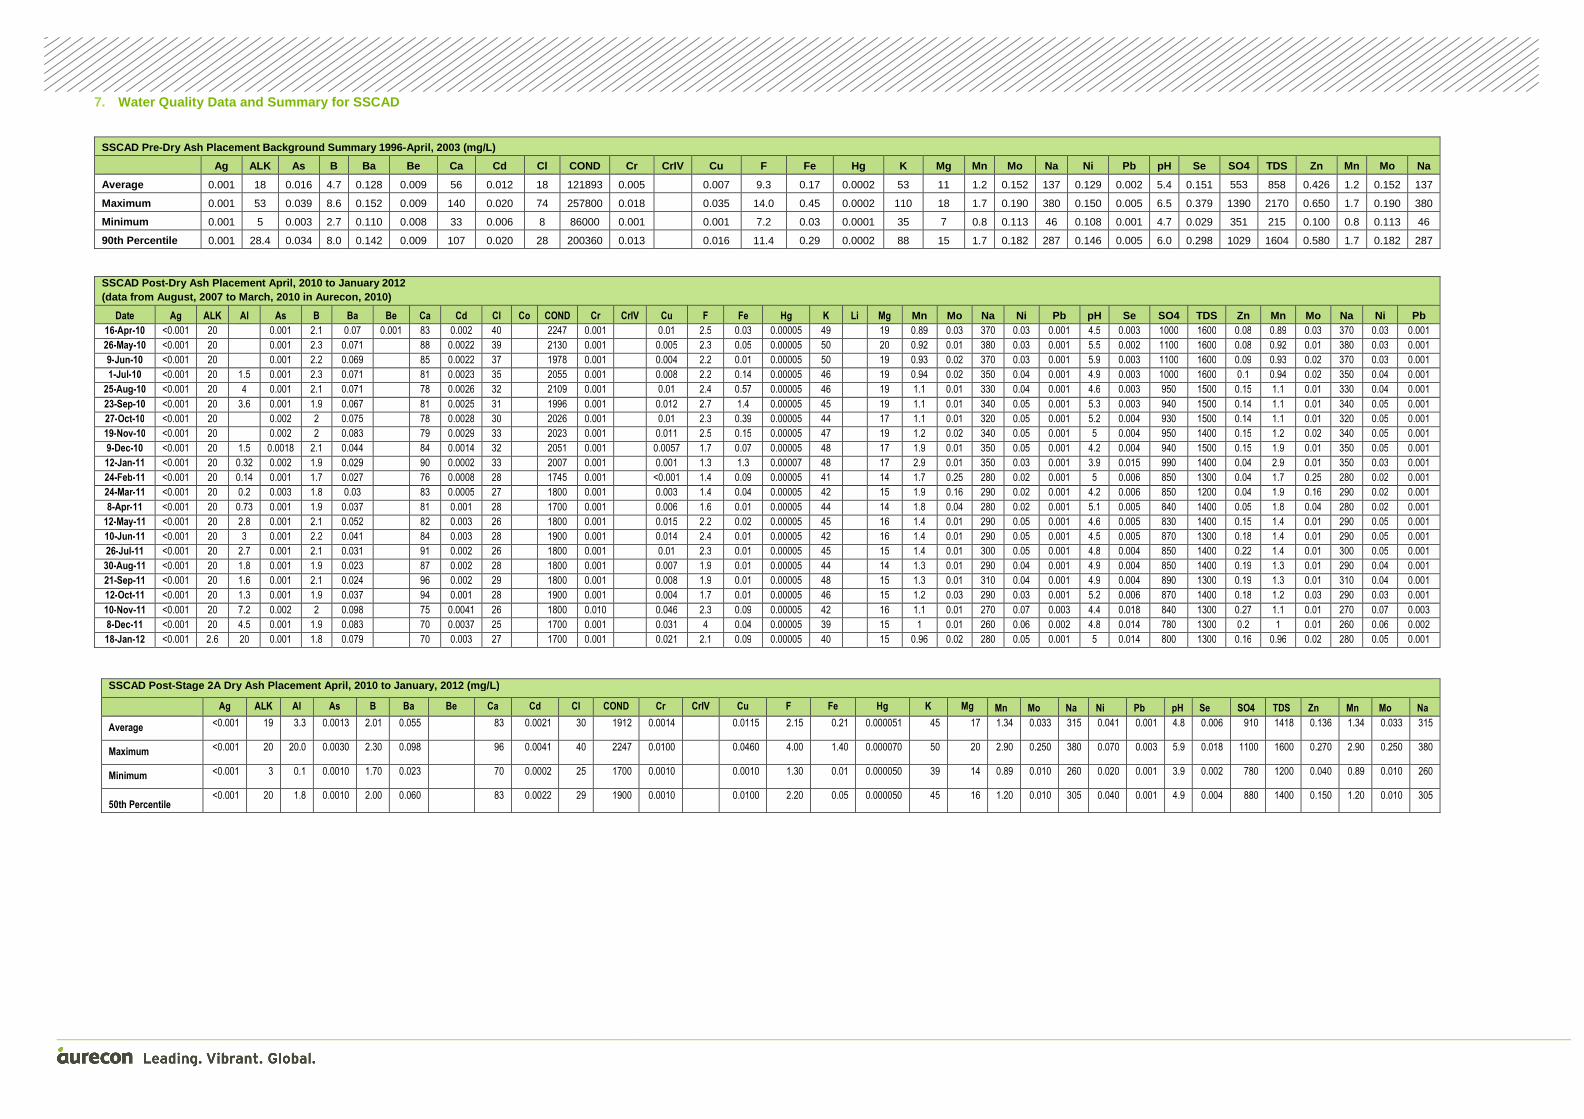
7. Water Quality Data and Summary for SSCAD
SSCAD Pre-Dry Ash Placement Background Summary 1996 -April, 2003 (mg/L)
Ag ALK As B Ba Be Ca Cd Cl COND Cr CrIV Cu F Fe Hg K Mg Mn Mo Na Ni Pb pH Se SO4 TDS Zn Mn Mo Na
Average 0.001 18 0.016 4.7 0.128 0.009 56 0.012 18 121893 0.005 0.007 9.3 0.17 0.0002 53 11 1.2 0.152 137 0.129 0.002 5.4 0.151 553 858 0.426 1.2 0.152 137
Maximum 0.001 53 0.039 8.6 0.152 0.009 140 0.020 74 257800 0.018 0.035 14.0 0.45 0.0002 110 18 1.7 0.190 380 0.150 0.005 6.5 0.379 1390 2170 0.650 1.7 0.190 380
Minimum 0.001 5 0.003 2.7 0.110 0.008 33 0.006 8 86000 0.001 0.001 7.2 0.03 0.0001 35 7 0.8 0.113 46 0.108 0.001 4.7 0.029 351 215 0.100 0.8 0.113 46
90th Percentile 0.001 28.4 0.034 8.0 0.142 0.009 107 0.020 28 200360 0.013 0.016 11.4 0.29 0.0002 88 15 1.7 0.182 287 0.146 0.005 6.0 0.298 1029 1604 0.580 1.7 0.182 287
SSCAD Post -Dry Ash Placement April, 2010 to January 2012 (data from August, 2007 to March, 2010 in Aurecon, 2010)
Date Ag ALK Al As B Ba Be Ca Cd Cl Co COND Cr CrIV Cu F Fe Hg K Li Mg Mn Mo Na Ni Pb pH Se SO4 TDS Zn Mn Mo Na Ni Pb 16-Apr-10 <0.001 20 0.001 2.1 0.07 0.001 83 0.002 40 2247 0.001 0.01 2.5 0.03 0.00005 49 19 0.89 0.03 370 0.03 0.001 4.5 0.003 1000 1600 0.08 0.89 0.03 370 0.03 0.001
26-May-10 <0.001 20 0.001 2.3 0.071 88 0.0022 39 2130 0.001 0.005 2.3 0.05 0.00005 50 20 0.92 0.01 380 0.03 0.001 5.5 0.002 1100 1600 0.08 0.92 0.01 380 0.03 0.001
9-Jun-10 <0.001 20 0.001 2.2 0.069 85 0.0022 37 1978 0.001 0.004 2.2 0.01 0.00005 50 19 0.93 0.02 370 0.03 0.001 5.9 0.003 1100 1600 0.09 0.93 0.02 370 0.03 0.001
1-Jul-10 <0.001 20 1.5 0.001 2.3 0.071 81 0.0023 35 2055 0.001 0.008 2.2 0.14 0.00005 46 19 0.94 0.02 350 0.04 0.001 4.9 0.003 1000 1600 0.1 0.94 0.02 350 0.04 0.001
25-Aug-10 <0.001 20 4 0.001 2.1 0.071 78 0.0026 32 2109 0.001 0.01 2.4 0.57 0.00005 46 19 1.1 0.01 330 0.04 0.001 4.6 0.003 950 1500 0.15 1.1 0.01 330 0.04 0.001
23-Sep-10 <0.001 20 3.6 0.001 1.9 0.067 81 0.0025 31 1996 0.001 0.012 2.7 1.4 0.00005 45 19 1.1 0.01 340 0.05 0.001 5.3 0.003 940 1500 0.14 1.1 0.01 340 0.05 0.001
27-Oct-10 <0.001 20 0.002 2 0.075 78 0.0028 30 2026 0.001 0.01 2.3 0.39 0.00005 44 17 1.1 0.01 320 0.05 0.001 5.2 0.004 930 1500 0.14 1.1 0.01 320 0.05 0.001
19-Nov-10 <0.001 20 0.002 2 0.083 79 0.0029 33 2023 0.001 0.011 2.5 0.15 0.00005 47 19 1.2 0.02 340 0.05 0.001 5 0.004 950 1400 0.15 1.2 0.02 340 0.05 0.001
9-Dec-10 <0.001 20 1.5 0.0018 2.1 0.044 84 0.0014 32 2051 0.001 0.0057 1.7 0.07 0.00005 48 17 1.9 0.01 350 0.05 0.001 4.2 0.004 940 1500 0.15 1.9 0.01 350 0.05 0.001
12-Jan-11 <0.001 20 0.32 0.002 1.9 0.029 90 0.0002 33 2007 0.001 0.001 1.3 1.3 0.00007 48 17 2.9 0.01 350 0.03 0.001 3.9 0.015 990 1400 0.04 2.9 0.01 350 0.03 0.001
24-Feb-11 <0.001 20 0.14 0.001 1.7 0.027 76 0.0008 28 1745 0.001 <0.001 1.4 0.09 0.00005 41 14 1.7 0.25 280 0.02 0.001 5 0.006 850 1300 0.04 1.7 0.25 280 0.02 0.001
24-Mar-11 <0.001 20 0.2 0.003 1.8 0.03 83 0.0005 27 1800 0.001 0.003 1.4 0.04 0.00005 42 15 1.9 0.16 290 0.02 0.001 4.2 0.006 850 1200 0.04 1.9 0.16 290 0.02 0.001
8-Apr-11 <0.001 20 0.73 0.001 1.9 0.037 81 0.001 28 1700 0.001 0.006 1.6 0.01 0.00005 44 14 1.8 0.04 280 0.02 0.001 5.1 0.005 840 1400 0.05 1.8 0.04 280 0.02 0.001
12-May-11 <0.001 20 2.8 0.001 2.1 0.052 82 0.003 26 1800 0.001 0.015 2.2 0.02 0.00005 45 16 1.4 0.01 290 0.05 0.001 4.6 0.005 830 1400 0.15 1.4 0.01 290 0.05 0.001
10-Jun-11 <0.001 20 3 0.001 2.2 0.041 84 0.003 28 1900 0.001 0.014 2.4 0.01 0.00005 42 16 1.4 0.01 290 0.05 0.001 4.5 0.005 870 1300 0.18 1.4 0.01 290 0.05 0.001
26-Jul-11 <0.001 20 2.7 0.001 2.1 0.031 91 0.002 26 1800 0.001 0.01 2.3 0.01 0.00005 45 15 1.4 0.01 300 0.05 0.001 4.8 0.004 850 1400 0.22 1.4 0.01 300 0.05 0.001
30-Aug-11 <0.001 20 1.8 0.001 1.9 0.023 87 0.002 28 1800 0.001 0.007 1.9 0.01 0.00005 44 14 1.3 0.01 290 0.04 0.001 4.9 0.004 850 1400 0.19 1.3 0.01 290 0.04 0.001
21-Sep-11 <0.001 20 1.6 0.001 2.1 0.024 96 0.002 29 1800 0.001 0.008 1.9 0.01 0.00005 48 15 1.3 0.01 310 0.04 0.001 4.9 0.004 890 1300 0.19 1.3 0.01 310 0.04 0.001
12-Oct-11 <0.001 20 1.3 0.001 1.9 0.037 94 0.001 28 1900 0.001 0.004 1.7 0.01 0.00005 46 15 1.2 0.03 290 0.03 0.001 5.2 0.006 870 1400 0.18 1.2 0.03 290 0.03 0.001
10-Nov-11 <0.001 20 7.2 0.002 2 0.098 75 0.0041 26 1800 0.010 0.046 2.3 0.09 0.00005 42 16 1.1 0.01 270 0.07 0.003 4.4 0.018 840 1300 0.27 1.1 0.01 270 0.07 0.003
8-Dec-11 <0.001 20 4.5 0.001 1.9 0.083 70 0.0037 25 1700 0.001 0.031 4 0.04 0.00005 39 15 1 0.01 260 0.06 0.002 4.8 0.014 780 1300 0.2 1 0.01 260 0.06 0.002
18-Jan-12 <0.001 2.6 20 0.001 1.8 0.079 70 0.003 27 1700 0.001 0.021 2.1 0.09 0.00005 40 15 0.96 0.02 280 0.05 0.001 5 0.014 800 1300 0.16 0.96 0.02 280 0.05 0.001
SSCAD Post -Stage 2A Dry Ash Pl acement April, 2010 to January, 2012 (mg/L )
Ag ALK Al As B Ba Be Ca Cd Cl COND Cr CrIV Cu F Fe Hg K Mg Mn Mo Na Ni Pb pH Se SO4 TDS Zn Mn Mo Na
Average <0.001 19 3.3 0.0013 2.01 0.055 83 0.0021 30 1912 0.0014 0.0115 2.15 0.21 0.000051 45 17 1.34 0.033 315 0.041 0.001 4.8 0.006 910 1418 0.136 1.34 0.033 315
Maximum <0.001 20 20.0 0.0030 2.30 0.098 96 0.0041 40 2247 0.0100 0.0460 4.00 1.40 0.000070 50 20 2.90 0.250 380 0.070 0.003 5.9 0.018 1100 1600 0.270 2.90 0.250 380
Minimum <0.001 3 0.1 0.0010 1.70 0.023 70 0.0002 25 1700 0.0010 0.0010 1.30 0.01 0.000050 39 14 0.89 0.010 260 0.020 0.001 3.9 0.002 780 1200 0.040 0.89 0.010 260
50th Percentile <0.001 20 1.8 0.0010 2.00 0.060 83 0.0022 29 1900 0.0010 0.0100 2.20 0.05 0.000050 45 16 1.20 0.010 305 0.040 0.001 4.9 0.004 880 1400 0.150 1.20 0.010 305

SSCAD Post-Dry Ash Placement April, 2013 to March 2 015
Date Ag ALK Al As B Ba Be Ca Cd Cl Co COND Cr CrIV Cu F Fe Hg K Li Mg Mn Mo Na Ni Pb pH Se SO4 TDS Zn
10-Apr-13 0.001 12.5 2 0.002 2 0.073 58 0.005 21 1500 0.0005 0.018 2.4 0.050 0.00005 35 15 1.2 0.005 230 0.078 0.0005 5.5 0.006 691 940 0.24
16-May-13 0.001 12.5 2.5 0.002 1.7 0.071 59 0.0053 19 1500 0.0005 0.01 2.3 0.16 0.00005 38 16 1.5 0.005 220 0.09 0.0005 5.2 0.007 730 1100 0.25
13-Jun-13 0.001 12.5 1.7 0.002 2 0.065 61 0.0051 20 1500 0.0005 0.009 0.05 0.040 0.00005 37 16 1.5 0.014 210 0.083 0.0005 5.5 0.007 740 1100 0.29
10-Jul-13 0.001 12.5 1.6 0.002 2.2 0.066 60 0.005 20 1400 0.0005 0.009 2.1 0.03 0.00005 37 17 1.5 0.015 230 0.084 0.0005 5.4 0.006 710 1000 0.25
22-Aug-13 0.001 12.5 0.3 0.001 1.9 0.063 55 0.0038 19 1300 0.001 0.0005 1.7 0.005 0.00005 34 15 1.4 0.018 210 0.072 0.0005 6.8 0.003 650 990 0.19
26-Sep-13 0.001 12.5 1.2 0.002 2 0.066 59 0.0041 19 1400 0.002 0.003 1.9 0.1 0.00005 35 16 1.5 0.02 220 0.094 0.0005 5.6 0.004 720 1100 0.23
24-Oct-13 0.001 12.5 1.6 0.003 2.2 0.067 62 0.0044 20 1600 0.002 0.004 2.2 0.070 0.00005 36 16 1.5 0.016 230 0.087 0.0005 5.4 0.004 800 1100 0.25
7-Nov-13 0.001 12.5 1 0.002 1.9 0.078 61 0.0048 20 1500 0.002 0.003 2 0.02 0.00005 37 16 1.5 0.027 240 0.087 0.0005 5.8 0.006 820 1100 0.24
5-Dec-13 0.001 12.5 1.4 0.002 2 0.077 63 0.0043 22 1700 0.002 0.006 2.1 0.080 0.00005 38 17 1.5 0.03 240 0.084 0.0005 5.3 0.006 820 1200 0.24
16-Jan-14 0.001 99 0.08 0.004 1.7 0.061 52 0.0023 19 1600 0.002 0.002 1.8 0.005 0.00005 34 14 0.84 0.037 260 0.051 0.0005 8 0.003 690 1100 0.073
6-Feb-14 0.001 98 0.04 0.003 1.6 0.054 51 0.0014 19 1500 0.001 0.004 1.7 0.010 0.00005 32 14 0.43 0.043 240 0.029 0.0005 8.1 0.003 640 1100 0.025
6-Mar-14 0.001 81 0.15 0.002 1.7 0.05 54 0.0013 18 1500 0.002 0.002 1.8 0.01 0.00005 33 14 0.41 0.042 230 0.027 0.0005 7.9 0.003 650 1100 0.032
3-Apr-14 0.001 58 0.36 0.002 1.9 0.045 60 0.0014 19 1600 0.002 0.002 2.3 0.005 0.00005 38 16 0.41 0.04 240 0.028 0.0005 7.7 0.003 720 1100 0.035
1-May-14 0.001 61 0.24 0.001 1.8 0.045 57 0.0014 18 1500 0.001 0.002 1.9 0.03 0.00005 36 16 0.52 0.041 220 0.031 0.0005 7.8 0.002 660 1100 0.044
12-Jun-14 0.001 43 0.16 0.0005 1.9 0.045 63 0.0018 17 1600 0.001 0.002 1.7 0.050 0.00005 41 17 0.74 0.04 240 0.043 0.0005 7.6 0.002 620 1100 0.073
10-Jul-14 0.001 12.5 0.1 0.0005 2.1 0.043 64 0.0016 18 1500 0.001 0.002 1.8 0.005 0.00005 40 17 0.82 0.035 220 0.045 0.0005 7.3 0.002 640 1100 0.072
14-Aug-14 0.001 12.5 0.12 0.0005 1.8 0.034 58 0.0016 18 1300 0.001 0.002 2 0.040 0.00005 34 15 0.33 0.024 190 0.03 0.0005 7.3 0.002 650 1000 0.07
11-Sep-14 0.001 12.5 2.7 0.001 2.5 0.044 69 0.004 21 1600 0.001 0.003 2.6 0.04 0.00005 44 20 1.4 0.03 200 0.09 0.0005 5.4 0.004 800 1200 0.24
23-Oct-14 0.001 12.5 1.6 0.001 2.5 0.034 70 0.0046 19 1600 0.001 0.004 2.2 0.220 0.00005 43 19 1.4 0.013 210 0.11 0.0005 5.3 0.003 730 1100 0.25
13-Nov-14 0.001 12.5 2 0.002 2.6 0.038 73 0.0044 21 1600 0.001 0.004 2.7 0.09 0.00005 46 20 1.6 0.024 220 0.094 0.0005 5.4 0.003 860 1200 0.25
11-Dec-14 0.001 12.5 7.2 0.002 1.2 0.054 32 0.0046 9 710 0.001 0.01 2.2 0.070 0.00005 21 10 1.2 0.0005 61 0.095 0.002 4.6 0.004 310 460 0.28
14-Jan-15 0.001 12.5 6.5 0.002 2.9 0.045 79 0.0053 19 1600 0.001 0.007 3.3 0.09 0.00005 52 22 2 0.026 220 0.11 0.0005 4.8 0.006 760 1200 0.39
11-Feb-15 0.001 12.5 8 0.003 2.9 0.05 77 0.0063 20 1600 0.001 0.01 3.6 0.360 0.00005 49 21 2.1 0.022 200 0.13 0.001 4.6 0.005 780 1300 0.34
11-Mar-15 0.001 12.5 9.3 0.003 2.6 0.053 81 0.0067 20 1700 0.001 0.014 4.2 0.29 0.00005 53 23 2.3 0.005 210 0.14 0.001 4.4 0.008 840 1200 0.36
SSCAD Post-Stage 2 Dry Ash Placement April, 2013 to March, 2015 (mg/l) Ag ALK Al As B Ba Be Ca Cd Cl Co COND Cr Cu F Fe Hg K Li Mg Mn Mo Na Ni Pb pH Se SO4 TDS Zn
Average 0.0010 28 2.16 0.0019 2.07 0.055 62 0.0038 19 1496 0.0012 0.0055 2.19 0.1 0.00005 38 17 1.23 0.024 216 0.076 0.001 6.1 0.004 710 1083 0.196
Maximum 0.0010 99 9.30 0.0040 2.90 0.078 81 0.0067 22 1700 0.0020 0.0180 4.20 0.4 0.00005 53 23 2.30 0.043 260 0.140 0.002 8.1 0.008 860 1300 0.390
Minimum 0.0010 13 0.04 0.0005 1.20 0.034 32 0.0013 9 710 0.0005 0.0005 0.05 0.0 0.00005 21 10 0.33 0.001 61 0.027 0.001 4.4 0.002 310 460 0.025
50th Percentile 0.0010 13 1.50 0.0020 2.00 0.054 61 0.0044 19 1500 0.0010 0.0040 2.10 0.0 0.00005 37 16 1.40 0.024 220 0.084 0.001 5.5 0.004 720 1100 0.240

SSCAD Post-Dry Ash Placement April, 2015 to March 2 016
Date Ag ALK Al As B Ba Be Ca Cd Cl Co COND Cr CrIV Cu F Fe Hg K Li Mg Mn Mo Na Ni Pb pH Se SO4 TDS Zn
9-Apr-15 0.0005 12.5 13 0.002 3 0.053 80 0.0075 23 1700 0.001 0.015 4.5 0.17 0.000025 50 22 2.5 0.0005 200 0.14 0.001 4.3 0.009 860 1300 0.36
27-May-15 0.0005 12.5 12 0.002 2.4 0.046 72 0.0067 19 1600 0.001 0.012 4.4 0.14 0.00002 44 21 2.3 0.002 160 0.13 0.0005 4.4 0.006 810 1100 0.38
17-Jun-15 0.0005 12.5 2.1 0.001 0.75 0.023 26 0.0014 6 460 0.001 0.005 0.7 0.03 0.00002 15 5 0.42 0.002 55 0.032 0.0005 5.4 0.001 195 250 0.12
15-Jul-15 0.0005 0.5 12.7 0.004 2.88 0.043 73.7 0.0066 18.1 1650 0.001 0.012 2.3 0.142 0.00002 50 20 2.24 0.008 181 0.147 0.0005 4.43 0.0039 803 1110 0.452
19-Aug-15 0.0005 0.5 13.6 0.004 3.52 0.04 79.2 0.007 18.3 1660 0.001 0.016 5.06 0.361 0.00002 53.1 21.2 2.3 0.007 195 0.172 0.0005 4.53 0.0035 776 1250 0.518
16-Sep-15 0.0005 0.5 11.2 0.004 3.17 0.037 82.7 0.0058 19.2 1591 0.001 0.012 4.5 0.416 0.00002 54.9 21 2.25 0.007 192 0.13 0.0005 4.74 0.0032 828 1150 0.506
21-Oct-15 0.0005 0.5 4.26 0.002 1.5 0.03 38.9 0.0028 9.58 855 0.001 0.012 1.82 0.048 0.00002 28.9 9.44 1.1 0.003 92.4 0.066 0.0005 4.72 0.002 406 601 0.318
18-Nov-15 0.0005 0.5 0.86 0.001 1.07 0.03 28.8 0.0017 7.78 581 0.001 0.003 0.691 0.04 0.00002 20.2 5.51 0.714 0.004 58.7 0.046 0.0005 5.45 0.0012 255 419 0.19
9-Dec-15 0.0005 2 2.29 0.003 1.5 0.026 53.8 0.0029 8.61 848 0.001 1.81 1.18 0.024 0.00002 28.1 9.75 1.17 0.004 91.7 0.076 0.051 5.4 0.0023 408 572 1.13
20-Jan-16 0.0005 0.5 1.27 0.001 1.29 0.028 36.2 0.0023 9.47 714 0.001 0.004 1.07 0.036 0.00002 25.5 7.78 0.834 0.004 65 0.056 0.0005 5.26 0.0012 298 382 0.198
10-Feb-16 0.0005 0.5 4.6 0.002 2.26 0.027 55.8 0.0042 14.5 1184 0.001 0.012 2.43 0.051 0.00002 39.6 13.1 1.51 0.002 129 0.104 0.0005 4.74 0.0028 537 800 0.373
16-Mar-16 0.0005 0.5 15.3 0.004 2.47 0.048 67.6 0.0065 12.9 1181 0.002 0.022 4.16 0.106 0.00002 39.4 19.1 2.4 0.001 101 0.196 0.002 4.27 0.0041 582 910 0.546
SSCAD Post-Stage 2 Dry Ash Placement April, 2015 to March, 2016 (mg/l) Ag ALK Al As B Ba Be Ca Cd Cl Co COND Cr Cu F Fe Hg K Li Mg Mn Mo Na Ni Pb pH Se SO4 TDS Zn
Average 0.0005 4 7.77 0.0025 2.15 0.036 58 0.0046 14 1169 0.0011 0.1613 2.73 0.1 0.00002 37 15 1.64 0.004 127 0.108 0.005 4.8 0.003 563 820 0.424
Maximum 0.0005 13 15.30 0.0040 3.52 0.053 83 0.0075 23 1700 0.0020 1.8100 5.06 0.4 0.00003 55 22 2.50 0.008 200 0.196 0.051 5.5 0.009 860 1300 1.130
Minimum 0.0005 1 0.86 0.0010 0.75 0.023 26 0.0014 6 460 0.0010 0.0030 0.69 0.0 0.00002 15 5 0.42 0.001 55 0.032 0.001 4.3 0.001 195 250 0.120
50th Percentile 0.0005 1 7.90 0.0020 2.33 0.034 62 0.0050 14 1183 0.0010 0.0120 2.37 0.1 0.00002 40 16 1.88 0.004 115 0.117 0.001 4.7 0.003 560 855 0.377

8.
Water Quality Data and Summary for Sawyers Swamp Creek Monitoring from SSCAD Spillway to near WGM4/D5
Sawyers Crk upstream 0 m where SSCAD diversion and Springvale Mine Water from April, 2013 to March, 20 15 enters SSC at spillway
Date Ag Al Alk As B Ba Be Ca Cd Cl Cond Cr Cu F Fe Hg K Mg Mn Mo Na Ni NO2+NO3 Pb pH PO4 se So4 TDS TKN TN TP TSS Turbidity
(NTU) Zn
10/04/2013 0.0005 0.59 510 0.015 0.10 0.026 4.8 0.0001 4 1000 0.0005 0.0005 1.5 0.000025 10 2.3 0.036 250 0.005 0.002 8.3 0.001 25 580 3.4 0.022
16/05/2013 0.0005 1.3 520 0.019 0.09 0.035 4.5 0.0001 5 1000 0.0005 0.001 1.3 0.000025 11 2.4 0.038 230 0.005 0.003 8.2 0.001 23 700 40 0.022
13/06/2013 0.0005 0.13 560 0.018 0.07 0.021 5.2 0.0001 5 1000 0.0005 0.001 1.2 0.000025 10 3 0.033 230 0.005 0.001 8.4 0.001 25 650 5 0.024
10/07/2013 0.0005 0.34 570 0.019 0.08 0.03 5 0.0001 5 1000 0.0005 0.001 1.2 0.000025 11 3 0.04 260 0.005 0.002 8.4 0.001 25 600 0 17 0.025
22/08/2013 0.0005 0.2 580 0.014 0.07 0.025 4.7 0.0001 5 1000 0.002 0.0005 0.1 0.000025 11 3 0.5 0.032 250 0.004 0.0005 8.5 0.001 23 660 0 7.1 0.015
26/09/2013 0.0005 0.43 560 0.02 0.08 0.028 5.1 0.0001 5 1100 0.002 0.001 1.1 0.000025 11 3 0.5 0.037 260 0.004 0.001 8.5 0.001 30 770 0.5 14 0.023
24/10/2013 0.0005 0.09 600 0.024 0.08 0.022 3.9 0.0001 5 1200 0.002 0.0005 1.3 0.000025 11 2 0.5 0.037 280 0.005 0.0005 8.5 0.001 35 670 0.5 6.6 0.027
7/11/2013 0.0005 0.19 570 0.027 0.07 0.029 4 0.0001 5 1100 0.002 0.0005 1.2 0.000025 10 3 0.5 0.041 260 0.005 0.0005 8.5 0.001 33 650 0 9.7 0.025
5/12/2013 0.0005 0.07 530 0.026 0.08 0.024 4.5 0.0001 5 1100 0.003 0.0005 1.2 0.000025 10 3 0.5 0.039 260 0.006 0.0005 8.6 0.001 35 690 2 0.3 0.032
16/01/2014 0.0005 0.18 560 0.025 0.08 0.027 4.6 0.0001 5 1100 0.002 0.001 1.2 0.000025 11 3 0.5 0.044 240 0.006 0.0005 8.5 0.001 38 710 2 5 0.028
6/02/2014 0.0005 0.2 530 0.029 0.07 0.028 4.3 0.0001 5 1100 0.002 0.0005 1.2 0.000025 10 3 0.5 0.03 230 0.006 0.0005 8.6 0.001 40 700 2 4 0.022
6/03/2014 0.0005 0.14 540 0.026 0.08 0.026 3.9 0.0001 5 1100 0.002 0.0005 1.1 0.000025 11 3 0.5 0.043 240 0.005 0.0005 8.5 0.001 36 700 2 3.8 0.021
3/04/2014 0.0005 0.39 540 0.02 0.08 0.026 5.2 0.0001 5 1100 0.002 0.0005 1.3 0.000025 13 3 0.5 0.04 270 0.005 0.0005 8.4 0.001 43 760 2 5.6 0.026
1/05/2014 0.0005 0.18 570 0.02 0.07 0.024 4.7 0.0001 5 1100 0.0005 0.0005 1.3 0.000025 11 3 0.5 0.044 240 0.005 0.0005 8.5 0.001 36 690 2 7 0.034
12/06/2014 0.0005 0.14 530 0.019 0.08 0.025 5.2 0.0001 5 1100 0.0005 0.0005 1.1 0.000025 12 3 0.5 0.045 280 0.005 0.0005 8.5 0.001 38 690 1 3.4 0.029
10/07/2014 0.0005 0.17 530 0.029 0.08 0.026 5.2 0.0001 5 1200 0.001 0.002 1.2 0.000025 11 3 0.5 0.042 260 0.005 0.001 8.5 0.001 37 750 1 13 0.03
14/08/2014 0.0005 0.11 560 0.019 0.07 0.01 3.8 0.0001 5 1100 0.0005 0.0005 1.2 0.000025 7 0.5 0.5 0.039 250 0.003 0.001 8.6 0.001 28 680 1 3.6 0.028
11/09/2014 0.0005 0.14 560 0.029 0.07 0.03 4.4 0.0001 5 1100 0.0005 0.0005 1.1 0.000025 10 3 0.5 0.041 240 0.004 0.0005 8.5 0.001 31 660 1 6.9 0.01
23/10/2014 0.0005 0.21 580 0.025 0.08 0.026 4.7 0.0001 5 1200 0.0005 0.0005 1.3 0.000025 11 3 0.5 0.051 270 0.004 0.0005 8.6 0.001 36 760 1 6.8 0.012
13/11/2014 0.0005 0.1 600 0.028 0.07 0.027 5 0.0001 5 1200 0.0005 0.0005 1.1 0.000025 13 3 0.5 0.054 290 0.004 0.0005 8.5 0.001 35 730 0.5 2.9 0.024
11/12/2014 0.0005 0.28 580 0.026 0.07 0.03 5 0.0001 6 1200 0.0005 0.001 1.2 0.000025 12 3 0.5 0.067 280 0.004 0.0005 8.7 0.001 38 710 2 10 0.007
14/01/2015 0.0005 0.07 580 0.028 0.08 0.03 4.6 0.0001 5 1200 0.0005 0.0005 1.1 0.000025 12 3 0.5 0.05 270 0.004 0.0005 8.4 0.001 34 720 2 2.8 0.006
11/02/2015 0.0005 0.31 540 0.027 0.07 0.033 4.5 0.0001 6 1100 0.0005 0.001 1.1 0.000025 12 3 0.5 0.064 260 0.004 0.0005 8.5 0.001 37 730 2 11 0.008
11/03/2015 0.0005 0.38 510 0.009 0.07 0.013 4.2 0.0001 6 1100 0.0005 0.003 1.1 0.000025 8 1 0.5 0.028 260 0.002 0.0005 8.5 0.001 30 690 2 5.1 0.013
Sawyers Crk upstream 0 m where SSCAD diversion and Springvale Mine Water from April, 2013 to March, 20 15 enters SSC at spillway
Ag Al Alk As B Ba Be Ca Cd Cl Cond Cr Cu F Fe Hg K Mg Mn Mo Na Ni NO2+NO3 Pb pH PO4 se So4 TDS TKN TN TP TSS Turbidity (NTU) Zn
Average <0.001 0.26 555 0.023 0.08 0.026 4.6 0.0001 5 1104 0.001 0.001 1.2 0.00003 10.8 2.7 0.500 0.04 257 0.005 0.001 8.5 0.001 33 694 1.26 8.1 0.021
Maximum <0.001 1.30 600 0.029 0.10 0.035 5.2 0.0001 6 1200 0.003 0.003 1.5 0.00003 13.0 3.0 0.500 0.07 290 0.006 0.003 8.7 0.001 43 770 2.00 40.0 0.034
Minimum <0.001 0.07 510 0.009 0.07 0.010 3.8 0.0001 4 1000 0.001 0.001 0.1 0.00003 7.0 0.5 0.500 0.03 230 0.002 0.001 8.2 0.001 23 580 0.00 0.3 0.006
50th Percentile <0.001 0.19 560 0.025 0.08 0.026 4.7 0.0001 5 1100 0.001 0.001 1.2 0.00003 11.0 3.0 0.500 0.04 260 0.005 0.001 8.5 0.001 35 695 1.00 6.1 0.024

Sawyers Crk upstream 0 m where SSCAD diversion and Springvale Mine Water from April, 2015 to March, 20 16 enters SSC at spillway
Date Ag Al Alk As B Ba Be Ca Cd Cl Cond Cr Cu F Fe Hg K Mg Mn Mo Na Ni NO2+NO3 Pb pH PO4 se So4 TDS TKN TN DO TSS Turbidity
(NTU) Zn
9/04/2015 0.0005 0.19 510 0.013 0.07 0.027
5 0.0001 7 1100 0.001 0.001
1.1 0.02 0.000025 11 3 0.021 0.046 240 0.007
2 0.001 8.6
0.001 36 670
0.55 10.5 2.6 0.015
27/05/2015 0.0005 0.38 540 0.02 0.06 0.031
4.8 0.0001 21 1100 0.001 0.001 0.2 0.005 0.00002 11 3 0.008 0.043 240 0.003 0.5 0.001 8.4
0.001 100 680 0.55 6.3
2.6 0.011
17/06/2015 0.0005 0.33 540 0.017 0.07 0.035
4.1 0.0001 6 1100 0.001 0.001 0.9 0.005 0.00002 11 3 0.011 0.048 260 0.004 1 0.001 8.2
0.001 33 580 0.6 7.2
1.9 0.01
15/07/2015 0.0005 0.38 631 0.021 0.1 0.028
4.3 0.0001 5.93 1140 0.001 0.001 1.3 0.006 0.00002 12.1 3.19 0.007 0.044 259 0.003 0.28 0.001 8.47
0.0001 37.4 626 0.7 20.7
2.6 0.009
19/08/2015 0.0005 0.41 543 0.023 0.12 0.026
4.24 0.0001 6.33 1130 0.001 0.001 1.32 0.006 0.00002 12.4 3.11 0.004 0.048 268 0.004 0.38 0.001 8.59
0.0001 33.4 618 0.8 8.5
1.9 0.013
16/09/2015 0.0005 0.54 598 0.024 0.11 0.03
4.54 0.0001 5.86 1162 0.001 0.001 0.584 0.006 0.00002 13.1 3.3 0.004 0.045 278 0.002 0.46 0.001 8.31
0.0001 32.2 652 0.8 7.3
2.9 0.009
21/10/2015 0.0005 0.3 561 0.02 0.06 0.028
4.38 0.0001 6.24 1185 0.001 0.001 0.962 0.009 0.00002 14.7 3.27 0.008 0.041 258 0.003 0.42 0.001 8.24
0.0002 35 691 0.9 4.8
2.5 0.0025
18/11/2015 0.0005 0.39 567 0.03 0.15 0.033
4.72 0.0001 5.03 1203 0.001 0.001 0.985 0.004 0.00002 13.6 3.33 0.007 0.049 248 0.004 0.5 0.001 8.28
0.0003 33.5 718 1.1 12.5
2.1 0.007
9/12/2015 0.0005 0.3 612 0.028 0.15 0.032
4.97 0.0001 5.2 1218 0.001 0.001 1.03 0.008 0.00002 13.7 3.54 0.005 0.044 301 0.003 0.48 0.001 8.27
0.0003 32.4 702 0.9 7.7
2.8 0.0025
20/01/2016 0.0005 0.32 641 0.03 0.08 0.03
4.65 0.0001 5.14 1225 0.001 0.001 1.12 0.004 0.00002 11.5 3.05 0.01 0.05 335 0.004 0.27 0.001 8.21
0.0003 34.5 636 0.7 5.7
5.4 0.008
10/02/2016 0.0005 0.36 578 0.028 0.15 0.029
4.54 0.0001 5.47 1229 0.001 0.001 0.996 0.01 0.00002 12.3 3.21 0.007 0.044 266 0.002 0.4 0.001 8.2
0.0001 33.5 617 0.7 4.9
3.2 0.006
16/03/2016 0.0005 0.41 640 0.03 0.17 0.028
4.11 0.0001 4.65 1233 0.001 0.001 1.07 0.007 0.00002 11.1 2.84 0.008 0.043 333 0.004 0.35 0.001 8.16
0.0002 32.1 754 0.8 8.6
3.6 0.01
Sawyers Crk upstream 0 m where SSCAD diversion and Springvale Mine Water from April, 2015 to March, 20 16 enters SSC at spillway
Ag Al Alk As B Ba Be Ca Cd Cl Cond Cr Cu F Fe Hg K Mg Mn Mo Na Ni NO2+NO3 Pb pH PO4 se So4 TDS TKN TN DO TSS Turbidity (NTU) Zn
Average 0.0005 0.54 641 0.03 0.15 0.035
5 0.0001 21 1229 0.001 0.001
1.32 0.02 3.54 0.021 0.05 335 0.007
3.54 0.021
2 0.001 8.6
0.001 100 718
1.1 10.5 5.4 0.015
Maximum 0.0005 0.54 641 0.03 0.17 0.035
5 0.0001 21 1233 0.001 0.001 1.32 0.02 3.54 0.021 0.05 335 0.007 3.54 0.021 2 0.001 8.6
0.001 100 754
1.1 6.3
5.4 0.015
Minimum 0.0005 0.19 510 0.013 0.06 0.026
4.1 0.0001 4.65 1100 0.001 0.001 0.2 0.004 2.84 0.004 0.041 240 0.002 2.84 0.004 0.27 0.001 8.16
0.0001 32.1 580
0.55 7.2
1.9 0.0025
50th Percentile 0.0005 0.37 572.5 0.0235 0.105 0.0295
4.54 0.0001 5.895 1173.5 0.001 0.001 1.013 0.006 3.15 0.0075 0.0445 263 0.0035 3.15 0.0075 0.44 0.001 8.275
0.00025 33.5 661
0.75 20.7
2.6 0.009

Sawyers Creek Ash Dam Seepage from V-notch (water collected and recycling back into dam) from April, 2013 to March, 2015
Date ag Al Alk As B Ba Be Ca Cd Cl Cond Cr Cu F Fe Hg K Mg Mn Mo Na Ni Pb pH PO4 se So4 TDS TKN TN TSS Turbidity
(NTU) Zn
10/04/2013 0.0005 0.04 77 0.0005 2.3 0.021 91 0.0001 39 1700 0.0005 0.003 1.5 0.000025 29 45 0.005 220 0.005 0.0005 7.2 0.002 825 1200 0.25 0.025
16/05/2013 0.0005 0.06 77 0.0005 2 0.023 99 0.0002 40 1700 0.0005 0.011 1.3 0.000025 30 48 0.005 210 0.005 0.0005 6.8 0.001 740 1300 0.95 0.034
13/06/2013 0.0005 0.1 77 0.0005 2 0.021 95 0.0001 38 1600 0.0005 0.004 1.2 0.000025 29 46 0.0005 210 0.009 0.0005 7 0.001 730 1200 1.9 0.04
10/07/2013 0.0005 0.025 79 0.0005 2.5 0.02 100 0.0001 38 1600 0.0005 0.0005 1.3 0.000025 31 51 0.0005 230 0.01 0.0005 7 0.001 760 1100 0 1.1 0.034
22/08/2013 0.0005 0.21 86 0.0005 2.2 0.037 100 0.0001 40 1600 0.002 0.0005 1.2 0.000025 31 49 0.5 0.0005 230 0.01 0.0005 7.1 0.001 760 1200 0 3.7 0.034
26/09/2013 0.0005 0.14 530 0.016 0.15 0.028 8.6 0.0001 7 1100 0.002 0.0005 1.1 0.000025 12 5 0.5 0.038 260 0.006 0.001 8.6 0.001 58 790 0 3.2 0.027
24/10/2013 0.0005 0.07 470 0.016 0.68 0.022 30 0.0001 14 1300 0.002 0.0005 1.3 0.000025 16 15 0.5 0.027 260 0.005 0.0005 8.4 0.001 230 950 2 1 0.025
7/11/2013 0.0005 0.05 450 0.015 0.64 0.026 30 0.0001 14 1300 0.002 0.0005 1.2 0.000025 16 15 0.5 0.028 260 0.005 0.0005 8.4 0.001 250 650 2 1.8 0.026
5/12/2013 0.0005 0.13 360 0.013 0.91 0.025 40 0.0001 20 1400 0.003 0.0005 1.3 0.000025 17 20 0.5 0.023 240 0.007 0.0005 8.2 0.001 350 840 2 3.1 0.037
16/01/2014 0.0005 0.14 560 0.022 0.1 0.028 5.2 0.0001 5 1100 0.002 0.0005 1.2 0.000025 11 3 0.5 0.042 250 0.005 0.0005 8.5 0.001 42 670 3 2.5 0.025
6/02/2014 0.0005 0.22 560 0.018 0.09 0.027 5.4 0.0001 5 1100 0.002 0.0005 1.2 0.000025 10 3 0.5 0.041 240 0.005 0.0005 8.5 0.001 38 710 0.5 3.6 0.019
6/03/2014 0.0005 0.05 76 0.0005 2.1 0.023 96 0.0001 36 1600 0.002 0.0005 1.1 0.000025 30 43 0.5 0.0005 190 0.011 0.0005 7.3 0.001 810 1300 2 0.45 0.04
3/04/2014 0.0005 0.67 250 0.005 0.46 0.025 25 0.0001 16 830 0.002 0.002 0.9 0.000025 12 12 0.5 0.02 140 0.007 0.0005 8.1 0.001 140 570 0.5 18 0.022
1/05/2014 0.0005 0.41 520 0.007 0.19 0.019 11 0.0001 9 1100 0.0005 0.001 1.2 0.000025 10 6 0.5 0.034 230 0.007 0.0005 8.5 0.001 57 700 0.5 5.6 0.029
12/06/2014 0.0005 0.16 390 0.007 0.37 0.022 19 0.0001 14 1100 0.0005 0.001 1 0.000025 13 11 0.5 0.027 220 0.011 0.0005 8.7 0.001 180 690 0.5 3.3 0.043
10/07/2014 0.0005 0.15 420 0.013 0.52 0.023 25 0.0001 13 1300 0.0005 0.0005 1.1 0.000025 15 14 0.5 0.032 270 0.008 0.0005 8.6 0.001 190 840 1 3.4 0.031
14/08/2014 0.0005 0.21 480 0.011 0.33 0.024 18 0.0004 14 1100 0.0005 0.001 1.3 0.000025 13 9 0.5 0.04 240 0.006 0.0005 8.6 0.001 150 810 0.5 4.9 0.02
11/09/2014 0.0005 0.39 77 0.0005 1.9 0.025 110 0.0003 35 1600 0.002 0.0005 1.2 0.000025 29 48 0.5 0.0005 190 0.013 0.0005 7.4 0.001 760 1300 2 3.7 0.05
23/10/2014 0.0005 0.18 77 0.0005 2.2 0.022 120 0.0005 37 1800 0.001 0.0005 1.5 0.000025 32 52 0.5 0.0005 210 0.037 0.0005 7.6 0.001 870 1400 2 1.9 0.073
13/11/2014 0.0005 0.12 80 0.0005 2.3 0.024 130 0.0008 38 1800 0.0005 0.0005 1.4 0.000025 34 54 0.5 0.001 220 0.05 0.0005 7.2 0.001 930 1500 2 0.65 0.11
11/12/2014 0.0005 2.8 58 0.0005 1.6 0.038 87 0.0006 28 1300 0.002 0.004 1.1 0.000025 28 39 0.5 0.0005 160 0.039 0.003 7.3 0.001 610 1000 2 110 0.072
14/01/2015 0.0005 0.4 74 0.0005 1.9 0.033 110 0.0019 33 1600 0.0005 0.001 1.4 0.000025 30 47 0.5 0.0005 180 0.092 0.0005 7.4 0.001 720 1200 2 11 0.13
11/02/2015 0.0005 0.45 67 0.0005 2.3 0.032 150 0.0048 41 2000 0.0005 0.0005 1.7 0.000025 36 60 0.5 0.0005 220 0.19 0.0005 7.2 0.001 990 1600 2 1.6 0.24
11/03/2015 0.0005 1.6 67 0.001 1.7 0.059 140 0.0048 37 1900 0.0005 0.004 1.8 0.000025 32 55 0.5 0.001 200 0.18 0.001 7.1 0.001 910 1500 2 50 0.2
Sawyers Creek Ash Dam Seepage from V-notch (water collected and recycling back into dam) from April, 2013 to March, 2015
ag Al Alk As B Ba Be Ca Cd Cl Cond Cr Cu F Fe Hg K Mg Mn Mo Na Ni Pb pH PO4 se So4 TDS TKN TN TSS Turbidity (NTU) Zn
Average <0.001 0.3 188 <0.001 1.64 0.027 79 0.0006 32 1509 0.0013 0.002 1.250 0.05 <0.00005 26 37 0.31 <0.01 217 0.028961538 <0.001 7.6 0.001 581 1099 1 9.9 0.05
Maximum <0.001 2.8 560 <0.001 2.60 0.059 150 0.0048 53 2000 0.0030 0.011 1.800 0.22 <0.00005 38 60 0.50 <0.01 270 0.190 <0.001 8.7 0.002 990 1600 3 110.0 0.24
Minimum <0.001 0.0 58 <0.001 0.09 0.019 5 0.0001 5 830 0.0005 0.001 0.200 0.01 0.00006 10 3 0.00 <0.01 140 0.005 0.001 6.8 0.001 38 570 0 0.3 0.02
50th Percentile <0.001 0.2 85 <0.001 2.00 0.024 96 0.0001 38 1600 0.0010 0.002 1.250 0.03 <0.00005 29 45 0.50 <0.01 220 0.0095 <0.001 7.4 0.001 725 1200 2 3.2 0.03

Sawyers Creek Ash Dam Seepage from V-notch (water collected and recycling back into dam) from April, 2015 to March, 2016
Date Ag Al Alk As B Ba Be Ca Cd Cl Cond Cr Cu F Fe Hg K Mg Mn Mo Na Ni NO2+NO3 Pb pH PO4 se So4 TDS TKN TN DO TSS Turbidity
(NTU) Zn
9/04/2015 0.0005 1.3 50 0.0005 2.2 0.029
170 0.01 37 2300 0.0001 0.0001
2.9 0.05 0.000025 35 66 5.6 0.001 210 0.32
3 0.001 6.9
0.001 1200 1800
0.55 13.3 5.8 0.41
27/05/2015 0.0005 1.2 54 0.0005 1.8 0.031
180 0.0077 41 2100 0.0001 0.0001 2.7 0.02 0.00002 34 71 6.6 0.001 200 0.27 3 0.001 6.7
0.001 1200 1700 0.55 9.7
5.6 0.39
17/06/2015 0.0005 29 12.5 0.006 2.6 0.09
100 0.012 32 1500 0.016 0.018 4.9 0.59 0.00002 40 38 2.6 0.001 120 0.16 1 0.001 4.5
0.012 830 1100 0.6 12.1
21 0.51
15/07/2015 0.0005 1.78 106 0.002 0.7 0.037
43.3 0.0007 29.3 920 0.0001 0.002 0.8 0.166 0.00002 12.3 21.6 0.923 0.004 88.5 0.03 0.14 0.001 7.39
0.0006 324 614 0.6 25.3
74 0.062
19/08/2015 0.0005 0.21 407 0.005 0.7 0.019
40.4 0.0001 38.1 1370 0.0001 0.0001 1.71 0.005 0.00002 15.9 21.9 0.033 0.025 218 0.006 0.08 0.001 8.44
0.0002 291 994 0.3 13.4
3.3 0.005
16/09/2015 0.0005 0.22 467 0.006 0.7 0.027
40 0.0001 14 1374 0.0001 0.0001 0.788 0.013 0.00002 20 17.8 0.116 0.032 266 0.005 0.33 0.001 8.15
0.0001 270 912 0.3 9.9
3.7 0.006
21/10/2015 0.0005 9.81 97 0.005 0.51 0.089
42.3 0.0001 15.6 776 0.005 0.007 1.09 0.073 0.00002 16.1 18.5 0.841 0.004 89.7 0.014 0.06 0.01 7.37
0.0007 267 728 1.2 5.6
713 0.04
18/11/2015 0.0005 0.24 281 0.003 0.84 0.035
57.1 0.0001 16.1 1369 0.0001 0.0001 1.15 0.012 0.00002 20.1 24.5 0.329 0.016 192 0.007 0.05 0.001 7.88
0.0003 380 858 0.2 10.3
8.3 0.0025
9/12/2015 0.0005 0.6 82 0.002 2.14 0.031
236 0.0038 35.1 2452 0.0001 0.0001 2.42 0.004 0.00002 50.5 92.7 8.74 0.004 302 0.228 0.27 0.001 7.02
0.0004 1330 2060 0.4 8.1
5.3 0.299
20/01/2016 0.0005 0.76 111 0.002 0.66 0.017
52 0.0001 13.1 887 0.0001 0.001 1.56 0.048 0.00002 14.3 20.3 0.232 0.004 103 0.009 0.01 0.001 7.39
0.0002 301 620 0.2 6.2
21.8 0.014
10/02/2016 0.0005 0.16 153 0.0005 1.62 0.027
144 0.0002 30 2147 0.0001 0.0001 2.11 0.009 0.00002 34.1 59.4 1.19 0.005 230 0.016 0.005 0.001 7.62
0.0003 976 1680 0.1 5.1
4.3 0.012
16/03/2016 0.0005 9.05 78 0.004 0.27 0.072
26.4 0.0001 13.2 430 0.004 0.006 0.594 0.084 0.00002 6.91 12.6 1.12 0.002 41.3 0.013 0.08 0.007 6.85
0.0005 105 453 0.7 4.6
346 0.035
Sawyers Creek Ash Dam Seepage from V-notch (water collected and recycling back into dam) from April, 2015 to March, 2016
Ag Al Alk As B Ba Be Ca Cd Cl Cond Cr Cu F Fe Hg K Mg Mn Mo Na Ni NO2+NO3 Pb pH PO4 se So4 TDS TKN TN DO TSS Turbidity
(NTU) Zn
Average 0.0005 3.91 157 0.003 1.35 0.041
103 0.0033 28.19 1591.25 0.0018 0.0027 1.99 0.09 0.00002 27.03 42.2 2.38 0.008 184.93 0.104 0.83 0.002 7.21
0.0015 689 1213
0.47 10.9
76 0.163
Maximum 0.0005 29 467 0.006 2.6 0.09
236 0.012 41 2452 0.016 0.018 1.32 0.02 0.000025 50.5 92.7 8.74 0.032 302 0.32 3 0.01 8.44
0.012 1330 2060
1.2 25.3
713 0.51
Minimum 0.0005 0.16 12.5 0.0005 0.27 0.017
26.4 0.0001 13.1 430 0.0001 0.0001 0.2 0.004 0.00002 6.91 12.6 0.033 0.001 41.3 0.005 0.005 0.001 4.5
0.0001 105 453
0.1 4.6
3.3 0.0025
50th Percentile 0.0005 0.98 101.5 0.0025 0.77 0.031
54.55 0.00015 29.65 1372 0.0001 0.0001 1.013 0.006 0.00002 20.05 23.2 1.0215 0.004 196 0.015 0.11 0.001 7.38
0.00045 352 953
0.475 9.8
7.05 0.0375

Sawyer Creek @850m - upstream seepage from KVAD wall and Below v-notch Seepage Point. Detailed data from April, 2013 to March, 2015 is at Site 93
Date Ag Al Alk As B Ba Be Ca Cd Cl Cond Cr Cu F Fe Hg K Mg Mn Mo Na Ni Pb pH PO4 se So4 TDS TKN TN TSS Turbidity (NTU) Zn
10/04/2013 0.0005 0.16 500 0.12 0.02 7.1 0.0001 5 1000 0.0005 1.40 0.000025 11.0 3.3 0.03 250 0.005 0.002 8.5 0.001 35 600 3 0.022
16/05/2013 0.0005 0.77 510 0.017 0.10 0.03 6.7 0.0001 6 1000 0.0005 0.001 1.30 0.000025 11.0 3.5 0.04 240 0.005 0.002 8.5 0.001 36 650 23 0.019
13/06/2013 0.0005 0.10 550 0.018 0.11 0.02 7.9 0.0001 6 1000 0.0005 0.0005 1.20 0.000025 10.0 4.0 0.04 240 0.005 0.001 8.6 0.001 42 650 3 0.024
10/07/2013 0.0005 0.07 550 0.015 0.13 0.02 7.1 0.0001 6 1000 0.0005 0.0005 1.10 0.000025 11.0 4.0 0.04 250 0.004 0.0005 8.5 0.001 41 640 0.0 3 0.017
22/08/2013 0.0005 0.19 570 0.013 0.11 0.02 6.4 0.0001 6 1100 0.001 0.0005 1.10 0.000025 11.0 4.0 0.5 0.03 250 0.003 0.0005 8.7 0.001 37 650 1.0 3 0.015
26/09/2013 0.0005 0.43 550 0.017 0.11 0.03 7.1 0.0001 6 1100 0.002 0.002 1.10 0.000025 11.0 4.0 0.5 0.04 260 0.004 0.001 8.6 0.001 47 790 0.0 8 0.023
24/10/2013 0.0005 0.14 580 0.022 0.12 0.02 6.1 0.0001 6 1200 0.002 0.0005 1.20 0.000025 11.0 4.0 0.5 0.04 280 0.004 0.0005 8.7 0.001 49 690 2.0 4 0.02
7/11/2013 0.0005 0.25 570 0.027 0.10 0.03 5.7 0.0001 5 1100 0.002 0.0005 1.20 0.000025 11.0 3.0 0.5 0.04 260 0.005 0.0005 8.6 0.001 46 640 0.0 11 0.025
5/12/2013 0.0005 0.22 520 0.025 0.12 0.03 6.4 0.0001 6 1100 0.003 0.0005 1.30 0.000025 10.0 4.0 0.5 0.04 260 0.007 0.001 8.7 0.001 54 700 3.0 24 0.032
16/01/2014 0.0005 0.17 570 0.026 0.08 0.03 4.6 0.0001 5 1100 0.002 0.0005 1.20 0.000025 11.0 3.0 0.5 0.04 250 0.006 0.0005 8.7 0.001 37 700 3.0 10 0.023
6/02/2014 0.0005 0.11 540 0.024 0.08 0.03 4.4 0.0001 5 1100 0.002 0.0005 1.10 0.000025 10.0 3.0 0.5 0.04 230 0.005 0.0005 8.7 0.001 40 700 3.0 3 0.019
6/03/2014 0.0005 0.24 530 0.028 0.11 0.03 5.7 0.0001 6 1100 0.002 0.0005 1.10 0.000025 11.0 4.0 0.5 0.04 230 0.005 0.001 8.7 0.001 53 700 3.0 10 0.021
3/04/2014 0.0005 0.25 530 0.020 0.09 0.03 5.6 0.0001 5 1100 0.001 0.0005 1.30 0.000025 13.0 3.0 0.5 0.03 280 0.005 0.0005 8.7 0.001 42 760 3.0 6 0.022
1/05/2014 0.0005 0.13 570 0.020 0.07 0.03 5.0 0.0001 5 1100 0.0005 0.0005 1.10 0.000025 11.0 3.0 0.5 0.04 250 0.004 0.0005 8.7 0.001 37 680 0.5 6 0.032
12/06/2014 0.0005 0.17 530 0.019 0.07 0.03 5.0 0.0001 5 1200 0.0005 0.0005 1.10 0.000025 11.0 3.0 0.5 0.04 260 0.004 0.0005 9.0 0.001 38 700 2.0 5 0.028
10/07/2014 0.0005 0.06 530 0.021 0.07 0.02 5.1 0.0001 5 1200 0.0005 0.0005 1.20 0.000025 11.0 3.0 0.5 0.04 260 0.003 0.0005 8.7 0.001 37 740 2.0 3 0.02
14/08/2014 0.0005 0.15 560 0.021 0.07 0.02 3.6 0.0001 5 1100 0.0005 0.0005 1.30 0.000025 7.0 1.0 0.5 0.03 260 0.003 0.001 8.8 0.001 29 700 2.0 7 0.028
11/09/2014 0.0005 0.24 540 0.024 0.12 0.03 7.2 0.0001 6 1100 0.001 0.0005 1.10 0.000025 11.0 4.0 0.5 0.04 250 0.004 0.0005 8.6 0.001 49 660 2.0 5 0.02
23/10/2014 0.0005 0.15 570 0.024 0.09 0.03 5.4 0.0001 5 1200 0.0005 0.0005 1.20 0.000025 11.0 3.0 0.5 0.05 260 0.004 0.0005 8.7 0.001 42 760 3.0 2 0.011
13/11/2014 0.0005 0.29 590 0.030 0.08 0.03 5.6 0.0001 5 1200 0.0005 0.001 1.10 0.000025 12.0 4.0 0.5 0.05 280 0.006 0.0005 8.7 0.001 39 760 0.5 22 0.032
11/12/2014 0.0005 0.37 560 0.024 0.09 0.03 6.6 0.0001 7 1100 0.0005 0.001 1.20 0.000025 13.0 4.0 0.5 0.06 270 0.005 0.0005 8.8 0.001 48 740 3.0 15 0.008
14/01/2015 0.0005 0.14 560 0.027 0.09 0.03 6.0 0.0001 6 1200 0.0005 0.0005 1.00 0.000025 12.0 4.0 0.5 0.05 280 0.003 0.0005 8.6 0.001 40 730 3.0 6 0.007
11/02/2015 0.0005 0.41 540 0.030 0.08 0.04 5.2 0.0001 6 1100 0.0005 0.001 1.10 0.000025 12.0 3.0 0.5 0.06 260 0.005 0.001 8.7 0.001 40 740 3.0 17 0.009
11/03/2015 0.0005 0.36 520 0.010 0.07 0.02 4.6 0.0001 6 1100 0.0005 0.002 1.10 0.000025 8.0 2.0 0.5 0.03 250 0.011 0.0005 8.7 0.001 32 700 2.0 9 0.012
Sawyer Creek @850m - upstream seepage from KVAD wall and Below v-notch Seepage Point. Detailed data from April, 2013 to March, 2015 is at Site 93
Ag Al Alk As B Ba Be Ca Cd Cl Cond Cr Cu F Fe Hg K Mg Mn Mo Na Ni Pb pH PO4 se So4 TDS TKN TN TSS Turbidity (NTU) Zn
Average <0.001 0.23 548 0.022 0.10 0.03 5.8 0.0001 6 1108 0.001 0.001 1.17 0.000025 10.9 3.4 0.50 0.04 257 0.005 0.001 8.7 0.001 41 699 2.0 9 0.020
Maximum <0.001 0.77 590 0.030 0.13 0.04
7.9 0.0001 7 1200 0.003 0.002 1.40
0.000025 13.0 4.0 0.50 0.06 280 0.011 0.002 9.0
0.001 54 790
3.0
24 0.032
Minimum <0.001 0.06 500 0.010 0.07 0.02
3.6 0.0001 5 1000 0.0005 0.001 1.00
0.000025 7.0 1.0 0.50 0.03 230 0.003 0.001 8.5
0.001 29 600
0.0
2 0.007
50th Percentile <0.001 0.18 550 0.022 0.09 0.03 5.7 0.0001 6 1100 0.0005 0.001 1.15 0.000025 11.0 3.4 0.50 0.04 260 0.005 0.001 8.7 0.001 40 700 2.0 6 0.021
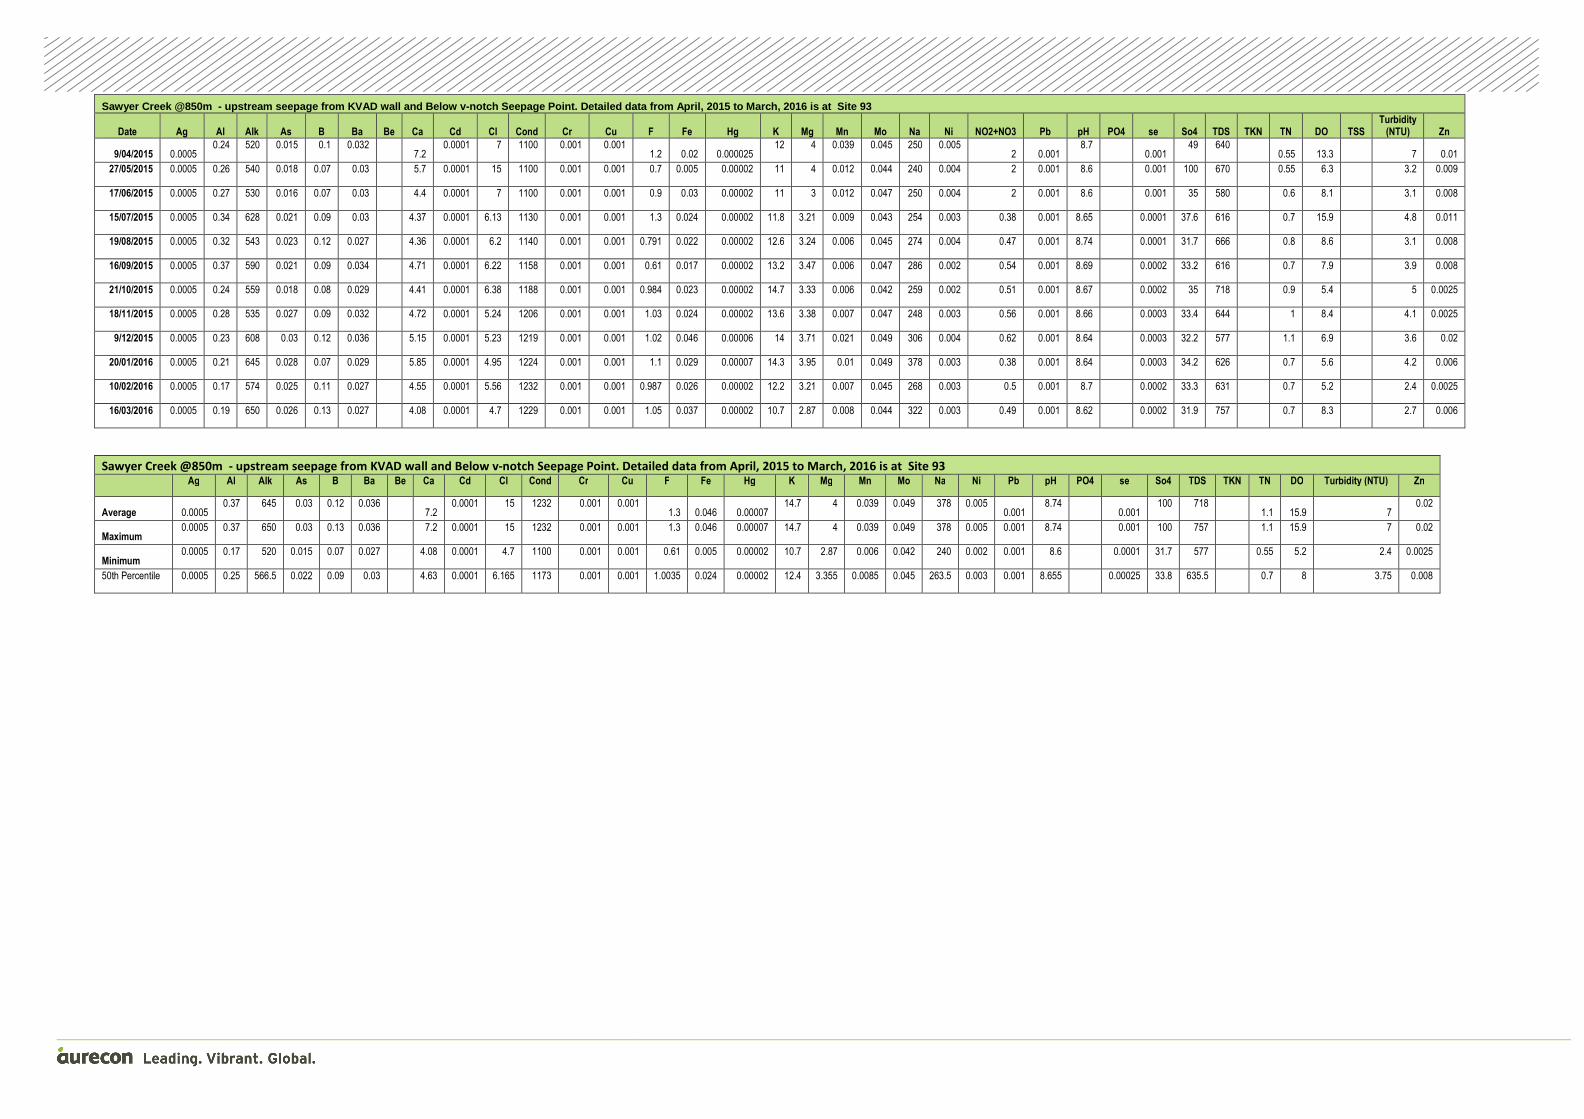
Sawyer Creek @850m - upstream seepage from KVAD wa ll and Below v-notch Seepage Point. Detailed data f rom April, 2015 to March, 2016 is at Site 93
Date Ag Al Alk As B Ba Be Ca Cd Cl Cond Cr Cu F Fe Hg K Mg Mn Mo Na Ni NO2+NO3 Pb pH PO4 se So4 TDS TKN TN DO TSS Turbidity
(NTU) Zn
9/04/2015 0.0005 0.24 520 0.015 0.1 0.032
7.2 0.0001 7 1100 0.001 0.001
1.2 0.02 0.000025 12 4 0.039 0.045 250 0.005
2 0.001 8.7
0.001 49 640
0.55 13.3 7 0.01
27/05/2015 0.0005 0.26 540 0.018 0.07 0.03
5.7 0.0001 15 1100 0.001 0.001 0.7 0.005 0.00002 11 4 0.012 0.044 240 0.004 2 0.001 8.6
0.001 100 670 0.55 6.3
3.2 0.009
17/06/2015 0.0005 0.27 530 0.016 0.07 0.03
4.4 0.0001 7 1100 0.001 0.001 0.9 0.03 0.00002 11 3 0.012 0.047 250 0.004 2 0.001 8.6
0.001 35 580 0.6 8.1
3.1 0.008
15/07/2015 0.0005 0.34 628 0.021 0.09 0.03
4.37 0.0001 6.13 1130 0.001 0.001 1.3 0.024 0.00002 11.8 3.21 0.009 0.043 254 0.003 0.38 0.001 8.65
0.0001 37.6 616 0.7 15.9
4.8 0.011
19/08/2015 0.0005 0.32 543 0.023 0.12 0.027
4.36 0.0001 6.2 1140 0.001 0.001 0.791 0.022 0.00002 12.6 3.24 0.006 0.045 274 0.004 0.47 0.001 8.74
0.0001 31.7 666 0.8 8.6
3.1 0.008
16/09/2015 0.0005 0.37 590 0.021 0.09 0.034
4.71 0.0001 6.22 1158 0.001 0.001 0.61 0.017 0.00002 13.2 3.47 0.006 0.047 286 0.002 0.54 0.001 8.69
0.0002 33.2 616 0.7 7.9
3.9 0.008
21/10/2015 0.0005 0.24 559 0.018 0.08 0.029
4.41 0.0001 6.38 1188 0.001 0.001 0.984 0.023 0.00002 14.7 3.33 0.006 0.042 259 0.002 0.51 0.001 8.67
0.0002 35 718 0.9 5.4
5 0.0025
18/11/2015 0.0005 0.28 535 0.027 0.09 0.032
4.72 0.0001 5.24 1206 0.001 0.001 1.03 0.024 0.00002 13.6 3.38 0.007 0.047 248 0.003 0.56 0.001 8.66
0.0003 33.4 644 1 8.4
4.1 0.0025
9/12/2015 0.0005 0.23 608 0.03 0.12 0.036
5.15 0.0001 5.23 1219 0.001 0.001 1.02 0.046 0.00006 14 3.71 0.021 0.049 306 0.004 0.62 0.001 8.64
0.0003 32.2 577 1.1 6.9
3.6 0.02
20/01/2016 0.0005 0.21 645 0.028 0.07 0.029
5.85 0.0001 4.95 1224 0.001 0.001 1.1 0.029 0.00007 14.3 3.95 0.01 0.049 378 0.003 0.38 0.001 8.64
0.0003 34.2 626 0.7 5.6
4.2 0.006
10/02/2016 0.0005 0.17 574 0.025 0.11 0.027
4.55 0.0001 5.56 1232 0.001 0.001 0.987 0.026 0.00002 12.2 3.21 0.007 0.045 268 0.003 0.5 0.001 8.7
0.0002 33.3 631 0.7 5.2
2.4 0.0025
16/03/2016 0.0005 0.19 650 0.026 0.13 0.027
4.08 0.0001 4.7 1229 0.001 0.001 1.05 0.037 0.00002 10.7 2.87 0.008 0.044 322 0.003 0.49 0.001 8.62
0.0002 31.9 757 0.7 8.3
2.7 0.006
Sawyer Creek @850m - upstream seepage from KVAD wall and Below v-notch Seepage Point. Detailed data from April, 2015 to March, 2016 is at Site 93
Ag Al Alk As B Ba Be Ca Cd Cl Cond Cr Cu F Fe Hg K Mg Mn Mo Na Ni Pb pH PO4 se So4 TDS TKN TN DO Turbidity (NTU) Zn
Average 0.0005 0.37 645 0.03 0.12 0.036
7.2 0.0001 15 1232 0.001 0.001
1.3 0.046 0.00007 14.7 4 0.039 0.049 378 0.005
0.001 8.74
0.001 100 718
1.1 15.9 7 0.02
Maximum 0.0005 0.37 650 0.03 0.13 0.036
7.2 0.0001 15 1232 0.001 0.001 1.3 0.046 0.00007 14.7 4 0.039 0.049 378 0.005 0.001 8.74
0.001 100 757
1.1 15.9 7 0.02
Minimum 0.0005 0.17 520 0.015 0.07 0.027
4.08 0.0001 4.7 1100 0.001 0.001 0.61 0.005 0.00002 10.7 2.87 0.006 0.042 240 0.002 0.001 8.6
0.0001 31.7 577
0.55 5.2 2.4 0.0025
50th Percentile 0.0005 0.25 566.5 0.022 0.09 0.03 4.63 0.0001 6.165 1173 0.001 0.001 1.0035 0.024 0.00002 12.4 3.355 0.0085 0.045 263.5 0.003 0.001 8.655 0.00025 33.8 635.5 0.7 8 3.75 0.008

Sawyers Creek at @1250 m near GWD5 (site 83) data from April, 2013 to March, 2015 is at Site 83
Date ag Al Alk As B Ba Be Ca Cd Cl Cond Cr Cu F Fe Hg K Mg Mn Mo Na Ni Pb pH PO4 se So4 TDS TKN TN TSS Turbidity (NTU) Zn
10/04/2013 0.0005 0.14 510 0.014 0.1 0.021 5.3 0.0001 5 1000 0.0005 0.0005 1.5 0.000025 9.5 2.8 0.034 250 0.005 0.002 8.5 0.001 26 580 2 0.024
16/05/2013 0.0005 1.4 520 0.016 0.1 0.029 5.1 0.0001 5 1000 0.0005 0.0005 1.3 0.000025 11 2.8 0.036 250 0.005 0.002 8.4 0.001 27 670 22 0.016
13/06/2013 0.0005 0.15 550 0.018 0.1 0.02 6.4 0.0001 5 1000 0.0005 0.0005 1.2 0.000025 10 3 0.034 230 0.006 0.0005 8.6 0.001 31 660 3.4 0.029
10/07/2013 0.0005 0.13 570 0.014 0.11 0.022 5.5 0.0001 5 1000 0.0005 0.0005 1.2 0.000025 11 3 0.038 250 0.005 0.0005 8.5 0.001 30 580 0 2 0.024
22/08/2013 0.0005 0.24 580 0.014 0.09 0.024 5.2 0.0001 5 1100 0.002 0.0005 1.1 0.000025 11 3 0.5 0.031 250 0.005 0.0005 8.7 0.001 27 650 0 5.8 0.022
26/09/2013 0.0005 0.31 560 0.018 0.08 0.027 5.4 0.0001 5 1100 0.002 0.003 1.1 0.000025 11 3 0.5 0.035 250 0.006 0.001 8.7 0.001 33 790 0 8.4 0.024
24/10/2013 0.0005 0.14 590 0.021 0.1 0.022 4.5 0.0001 5 1200 0.002 0.0005 1.3 0.000025 11 3 0.5 0.036 280 0.005 0.0005 8.7 0.001 40 760 2 2.6 0.028
7/11/2013 0.0005 0.13 580 0.025 0.09 0.027 4.4 0.0001 5 1100 0.002 0.0005 1.2 0.000025 11 3 0.5 0.039 270 0.005 0.0005 8.6 0.001 35 660 3 4.1 0.025
5/12/2013 0.0005 0.16 540 0.024 0.1 0.024 4.9 0.0001 5 1100 0.002 0.0005 1.3 0.000025 10 3 0.5 0.039 260 0.005 0.0005 8.7 0.001 39 660 3 1.7 0.027
16/01/2014 0.0005 0.19 560 0.025 0.08 0.03 4.5 0.0001 5 1100 0.002 0.0005 1.2 0.000025 11 3 0.5 0.042 250 0.006 0.0005 8.7 0.001 37 660 4 3.7 0.022
6/02/2014 0.0005 0.14 530 0.026 0.08 0.025 4.5 0.0001 5 1100 0.002 0.0005 1.1 0.000025 10 3 0.5 0.03 240 0.006 0.0005 8.7 0.001 40 650 3 2 0.026
6/03/2014 0.0005 0.22 540 0.026 0.09 0.03 4.6 0.0001 5 1100 0.002 0.0005 1.1 0.000025 12 3 0.5 0.042 240 0.006 0.0005 8.7 0.001 39 720 3 6.9 0.021
3/04/2014 0.0005 0.28 540 0.023 0.09 0.03 5.3 0.0001 6 1100 0.017 0.001 1 0.000025 13 3 0.5 0.04 280 0.006 0.0005 8.6 0.001 41 760 0.5 5.9 0.022
1/05/2014 0.0005 0.12 570 0.021 0.08 0.025 4.8 0.0001 5 1100 0.0005 0.0005 1 0.000025 10 3 0.5 0.039 240 0.007 0.0005 8.7 0.001 37 710 0.5 5.4 0.03
12/06/2014 0.0005 0.24 570 0.02 0.08 0.027 5 0.0001 5 1100 0.0005 0.0005 1.2 0.000025 11 3 0.5 0.043 270 0.016 0.001 8.7 0.001 38 680 2 7.8 0.041
10/07/2014 0.0005 0.18 530 0.022 0.09 0.024 5.4 0.0001 6 1200 0.001 0.001 1.3 0.000025 11 3 0.5 0.04 280 0.005 0.001 8.7 0.001 40 730 2 4 0.032
14/08/2014 0.0005 0.13 570 0.021 0.08 0.019 3.6 0.0001 5 1100 0.0005 0.0005 1.4 0.000025 7 1 0.5 0.037 260 0.004 0.0005 8.8 0.001 31 700 2 7.2 0.02
11/09/2014 0.0005 0.22 560 0.029 0.09 0.029 4.9 0.0001 5 1100 0.0005 0.0005 1.2 0.000025 11 3 0.5 0.036 250 0.005 0.0005 8.7 0.001 34 660 2 6 0.01
23/10/2014 0.0005 0.18 580 0.025 0.09 0.026 4.9 0.0001 5 1200 0.0005 0.0005 1.3 0.000025 11 3 0.5 0.051 270 0.005 0.0005 8.7 0.001 37 710 3 2.8 0.028
13/11/2014 0.0005 0.1 590 0.027 0.08 0.027 5 0.0001 5 1100 0.0005 0.001 1.1 0.000025 12 3 0.5 0.053 290 0.006 0.0005 8.7 0.001 36 740 0.5 2.1 0.032
11/12/2014 0.0005 0.18 580 0.025 0.08 0.029 4.8 0.0001 6 1200 0.0005 0.0005 1.2 0.000025 12 3 0.5 0.05 270 0.004 0.0005 8.7 0.001 40 740 3 6.2 0.014
14/01/2015 0.0005 0.15 560 0.029 0.08 0.03 5 0.0001 5 1100 0.0005 0.0005 1 0.000025 12 3 0.5 0.047 270 0.003 0.0005 8.7 0.001 36 740 0.5 6.3 0.005
11/02/2015 0.0005 0.32 540 0.03 0.08 0.032 4.5 0.0001 6 1200 0.0005 0.0005 1.2 0.000025 12 3 0.5 0.06 250 0.005 0.0005 8.5 0.001 38 740 3 16 0.008
11/03/2015 0.0005 0.45 520 0.012 0.08 0.02 4.4 0.0001 6 1100 0.0005 0.001 1.1 0.000025 8 2 0.5 0.028 270 0.005 0.0005 8.7 0.001 31 700 2 10 0.016
Sawyers Creek at @1250 m near GWD5 (site 83) data from April, 2013 to March, 2015 is at Site 83
ag Al Alk As B Ba Be Ca Cd Cl Cond Cr Cu F Fe Hg K Mg Mn Mo Na Ni Pb pH PO4 se So4 TDS TKN TN TSS Turbidity (NTU) Zn
Average <0.001 0.25 556 0.022 0.09 0.026 5 0.0001 5 1104 0.0017 0.001 1.192 0.000025 11 3 0.50 0.04 259 0.006 0.001 8.7 0.001 35 694 1.9 6.0 0.02
Maximum <0.001 1.40 590 0.030 0.11 0.032 6 0.0001 6 1200 0.0170 0.003 1.500 0.000025 13 3 0.50 0.06 290 0.016 0.002 8.8 0.001 41 790 4.0 22.0 0.04
Minimum <0.001 0.10 510 0.012 0.08 0.019 4 0.0001 5 1000 0.0005 0.001 1.000 0.000025 7 1 0.50 0.03 230 0.003 0.001 8.4 0.001 26 580 0.0 1.7 0.01
50th Percentile <0.001 0.18 560 0.023 0.09 0.027 5 0.0001 5 1100 0.0005 0.001 1.200 0.000025 11 3 0.50 0.04 255 0.005 0.001 8.7 0.001 37 700 2.0 5.6 0.02

Sawyers Creek at @1250 m near GWD5 (site 83) data f rom April, 2015 to March, 2016 is at Site 83
Date Ag Al Alk As B Ba Be Ca Cd Cl Cond Cr Cu F Fe Hg K Mg Mn Mo Na Ni NO2+NO3 Pb pH PO4 se So4 TDS TKN TN DO TSS Turbidity
(NTU) Zn
9/04/2015 0.0005 0.22 550 0.013 0.11 0.037
6.3 0.0001 7 1100 0.0005 0.0005
1.1 0.13 0.000025 11 4 0.046 0.036 250 0.004
2 0.0005 8.5
0.001 38 730
0.55 11.8 7 0.009
27/05/2015 0.0005 0.29 570 0.017 0.07 0.031
4.8 0.0001 6 1100 0.0005 0.0005 1.1 0.02 0.00002 11 3 0.002 0.041 230 0.004 2 0.0005 8.8
0.001 37 700 0.6 8.7
5.5 0.008
17/06/2015 0.0005 0.37 510 0.015 0.08 0.029
4.3 0.0001 7 1100 0.0005 0.0005 1.1 0.05 0.00002 11 3 0.013 0.043 240 0.009 2 0.0005 8.6
0.001 34 640 0.6 11.7
11 0.016
15/07/2015 0.0005 0.36 635 0.023 0.11 0.03
4.48 0.00005 6.24 1130 0.0005 0.0005 1.5 0.013 0.00002 12.5 3.34 0.007 0.043 268 0.003 0.43 0.0005 8.68
0.0001 42.2 626 0.6 20.7
4.4 0.007
19/08/2015 0.0005 0.26 637 0.021 0.07 0.025
4.28 0.00005 6.28 1140 0.0005 0.0005 1.33 0.01 0.00002 12.4 3.15 0.004 0.044 267 0.004 0.49 0.0005 8.75
0.0001 32.2 595 0.8 8.8
4.3 0.007
16/09/2015 0.0005 0.52 596 0.019 0.07 0.03
4.51 0.00005 6.02 1172 0.0005 0.0005 0.911 0.009 0.00002 12.9 3.26 0.007 0.043 277 0.007 0.57 0.0005 8.71
0.0001 38.6 558 0.8 8.8
4.8 0.015
21/10/2015 0.0005 0.5 557 0.017 0.07 0.03
4.56 0.00005 7.49 1192 0.0005 0.0005 1.62 0.02 0.00002 14.9 3.33 0.022 0.044 260 0.008 0.58 0.0005 8.7
0.0003 47.4 722 1 7.7
8.7 0.014
18/11/2015 0.0005 0.32 534 0.028 0.27 0.034
4.77 0.00005 5.06 1219 0.0005 0.0005 1.13 0.016 0.00002 13.9 3.38 0.006 0.051 252 0.005 0.61 0.0005 8.71
0.0004 33.7 682 0.9 7.3
5.6 0.008
9/12/2015 0.0005 0.24 607 0.028 0.1 0.032
5.19 0.00005 5.24 1232 0.0005 0.0005 1.19 0.018 0.00002 14.2 3.7 0.004 0.044 305 0.015 0.62 0.0005 8.72
0.0004 33.3 552 0.8 7.6
5.7 0.02
20/01/2016 0.0005 0.3 626 0.032 0.08 0.03
4.45 0.00005 4.93 1245 0.0005 0.0005 1.14 0.014 0.00002 13.9 3.71 0.01 0.051 335 0.003 0.45 0.0005 8.72
0.0003 34.1 688 0.8 5.8
4 0.007
10/02/2016 0.0005 0.17 577 0.024 0.11 0.029
4.64 0.00005 5.48 1229 0.0005 0.0005 1.35 0.018 0.00002 12.3 3.24 0.005 0.044 269 0.002 0.53 0.0005 8.61
0.0002 36.2 654 0.8 3.9
3.5 0.0025
16/03/2016 0.0005 0.52 648 0.03 0.11 0.03
4.03 0.00005 4.68 1244 0.0005 0.002 1.26 0.012 0.00002 10.5 2.79 0.009 0.044 311 0.006 0.5 0.001 8.69
0.0003 35 770 0.8 6.8
13.5 0.013
Sawyers Creek at @1250 m near GWD5 (site 83) data from April, 2015 to March, 2016 is at Site 83
Ag Al Alk As B Ba Be Ca Cd Cl Cond Cr Cu F Fe Hg K Mg Mn Mo Na Ni NO3 Pb pH se So4 TDS TKN TN DO Turbidity (NTU) Zn
Average 0.0005 0.52 637 0.032 0.27 0.037
6.3 0.0001 7.49 1245 0.0005 0.0005 1.62 0.13 0.000025 14.9 4 0.046 0.051 335 0.015 2 0.0005 8.8 0.001 47.4 730
1 20.7 11 0.02
Maximum 0.0005 0.52 648 0.032 0.27 0.037
6.3 0.0001 7.49 1245 0.0005 0.002 1.62 0.13 0.000025 14.9 4 0.046 0.051 335 0.015 2 0.001 8.8 0.001 47.4 770
1 20.7 13.5 0.02
Minimum 0.0005 0.17 510 0.013 0.07 0.025
4.03 0.00005 4.68 1100 0.0005 0.0005 0.911 0.009 0.00002 10.5 2.79 0.002 0.036 230 0.002 0.43 0.0005 8.5 0.0001 32.2 552
0.55 3.9 3.5 0.0025
50th Percentile 0.0005 0.31 586.5 0.022 0.09 0.03
4.535 0.00005 6.01 1182 0.0005 0.0005 1.165 0.017 0.00002 12.45 3.295 0.007 0.044 267.5 0.0045 0.575 0.0005 8.705 0.0003 35.6 668
0.8 8.2 5.55 0.0085

Seepage Water Northern wall collection pit near GW6
Site 86 Seepage water Northern wall collection pit near GW6 Groundwater from the KVAD on the northside drains from April, 2013 to March, 2015 . All water reports to the pipe out to the Lisdale Cut.
Date ag Al Alk As B Ba Be Ca Cd Cl Cond Cr Cu F Fe Hg K Mg Mn Mo Na Ni
Pb pH PO4 se So4 TDS TKN TN TSS Turbidity (NTU)
10-Apr-13 0.0005 1.1 12.5 0.001 3.5 0.014
98 0.0001 11 2400 0.0005 0.033 0.6
0.000025 85 61
0.005 160 0.14
0.003 2.9
0.001 1280 1700
2.3 0.14
17-May-13 0.0005 1.2 12.5 0.001 3 0.013
140 0.0001 17 2400 0.0005 0.0005 0.5
0.000025 89 68
0.005 160 0.14
0.001 3
0.001 1300 1900
4.8 0.1
13-Jun-13 0.0005 1.4 12.5 0.001 3 0.002
130 0.0001 17 2300 0.0005 0.0005 0.05
0.000025 74 65
0.0005 140 0.14
0.001 3
0.001 1100 1100
11 0.15
10-Jul-13 0.0005 1.3 12.5 0.0005 3.7 0.009
150 0.0001 18 2400 0.0005 0.0005 0.05
0.000025 84 74
0.0005 170 0.15
0.0005 3
0.001 1400 1700
0 45 0.14
22-Aug-13 0.0005 1 12.5 0.0005 4 0.006
170 0.0001 18 2600 0.002 0.0005 0.05
0.000025 93 81 0.5 0.0005 190 0.14
0.0005 2.9
0.001 1400 2000
0 4.9 0.13
26-Sep-13 0.0005 1.4 12.5 0.001 4.1 0.005
160 0.0001 19 2700 0.002 0.001 0.4
0.000025 91 77 0.5 0.001 190 0.16
0.001 2.9
0.001 1500 2300
0 7.3 0.16
24-Oct-13 0.0005 1.6 12.5 0.002 5 0.006
200 0.0001 20 3100 0.002 0.0005 0.5
0.000025 110 88 0.5 0.002 220 0.18
0.001 2.9
0.001 2000 2300
0.5 3.3 0.2
7-Nov-13 0.0005 1.7 12.5 0.002 4.7 0.005
200 0.0001 20 3100 0.002 0.001 0.4
0.000025 110 88 0.5 0.002 230 0.2
0.001 2.9
0.001 2300 2500
0 3.3 0.21
5-Dec-13 0.0005 2.4 12.5 0.002 5 0.003
200 0.0001 21 3200 0.003 0.002 0.6
0.000025 110 93 0.5 0.004 220 0.2
0.001 2.9
0.001 1800 2400
0.5 5.9 0.21
16-Jan-14 0.0005 1.7 12.5 0.003 5.5 0.004
210 0.0001 21 3400 0.003 0.001 0.6
0.000025 120 92 0.5 0.002 230 0.26
0.0005 2.9
0.001 2000 3000
0.5 21 0.19
6-Feb-14 0.0005 1.2 12.5 0.002 5.3 0.003
210 0.0001 21 3300 0.002 0.0005 0.4
0.000025 130 90 0.5 0.002 250 0.25
0.0005 2.8
0.001 1900 2600
0.5 2.7 0.15
6-Mar-14 0.0005 2.3 12.5 0.002 4.7 0.002
180 0.0001 19 3100 0.002 0.002 0.5
0.000025 97 73 0.5 0.0005 180 0.22
0.0005 2.8
0.001 1600 2400
0.5 1.4 0.15
3-Apr-14 0.0005 2.1 12.5 0.001 4.7 0.002
180 0.0001 20 2900 0.002 0.004 0.3
0.000025 110 79 0.5 0.0005 190 0.23
0.0005 2.9
0.001 1600 2200
0.5 1.1 0.15
1-May-14 0.0005 1.4 12.5 0.001 5.3 0.002
210 0.0001 20 3100 0.0005 0.001 0.5
0.000025 110 92 0.5 0.0005 200 0.27
0.0005 2.9
0.001 1700 2600
2 4.6 0.15
12-Jun-14 0.0005 1.6 12.5 0.0005 4.9 0.001
220 0.0001 19 3300 0.001 0.0005 0.5
0.000025 110 92 0.5 0.0005 220 0.28
0.0005 2.9
0.001 1800 2600
0.5 7.3 0.15
10-Jul-14 0.0005 1.7 12.5 0.001 5.9 0.001
240 0.0001 19 3300 0.001 0.0005 0.5
0.000025 120 97 0.5 0.0005 230 0.33
0.0005 2.9
0.001 2000 2700
0.5 40 0.16
14-Aug-14 0.0005 1.4 12.5 0.001 5.5 0.001
230 0.0001 21 3200 0.001 0.0005 0.4
0.000025 110 98 0.5 0.0005 220 0.37
0.0005 3.1
0.001 2100 2900
2 19 0.19
11-Sep-14 0.0005 2 12.5 0.001 5.1 0.002
200 0.0001 16 3000 0.001 0.0005 0.4
0.000025 96 84 0.5 0.0005 200 0.34
0.0005 2.9
0.001 1600 2300
0.5 25 0.19
23-Oct-14 0.0005 2 12.5 0.001 6.4 0.001
250 0.0001 18 3500 0.001 0.001 0.6
0.000025 120 99 0.5 0.0005 240 0.46
0.0005 2.9
0.001 2000 2800
0.5 1.1 0.24
13-Nov-14 0.0005 1.8 12.5 0.002 7.1 0.001
280 0.0001 21 3700 0.0005 0.0005 0.4
0.000025 140 110 0.5 0.0005 280 0.53
0.0005 2.9
0.001 2300 3300
0.5 0.8 0.32
11-Dec-14 0.0005 2.7 12.5 0.002 5 0.002
210 0.0001 17 3000 0.0005 0.002 0.5
0.000025 110 82 2.5 0.0005 200 0.45
0.0005 2.9
0.001 1700 2400
14 3.6 0.28
14-Jan-15 0.0005 2.4 12.5 0.001 5.5 0.001
210 0.0001 16 3100 0.0005 0.001 0.6
0.000025 110 81 0.5 0.0005 210 0.41
0.0005 2.9
0.001 1700 2400
0.5 1.4 0.26
11-Feb-15 0.0005 1.9 12.5 0.002 7.1 0.001
270 0.0001 19 3700 0.0005 0.001 0.4
0.000025 140 100 0.5 0.0005 250 0.64
0.0005 2.9
0.001 2000 3000
0.5 0.55 0.4
11-Mar-15 0.0005 2.8 12.5 0.002 6.1 0.005
280 0.0001 20 3800 0.001 0.004 0.6
0.000025 150 110 0.5 0.0005 260 0.68
0.002 2.9
0.002 2200 3100
0.5 6.7 0.5
Site 86 Seepage water Northern wall collection pit near GW6 Groundwater from the KVAD on the north side drains from April, 2013 to March, 2015 . All water reports to the asbestos pipe out to the Lidsdale Cut (site 86)
Ag Al Alk As B Ba Be Ca Cd Cl Cond Cr Cu F Fe Hg K Mg Mn Mo Na Ni Pb pH PO4 se So4 TDS TKN TN TSS Turbidity (NTU)
Average 0.0005 1.75 13 0.001 5.0 0.004 201 0.0001 19 3067 0.0013 0.002 0.43 0.00 109.1 86.4 0.60 0.00 210 0.299 0.001 2.9 0.001 1762 2425 1.2 9.3 0.21
Maximum 0.0005 2.80 13 0.003 7.1 0.014 280 0.0001 21 3800 0.003 0.033 0.60 0.00 150.0 110.0 2.50 0.01 280 0.680 0.003 3.1 0.002 2300 3300 14.0 45.0 0.50
Minimum 0.0005 1.00 13 0.001 3.0 0.001 98 0.0001 11 2300 0.0005 0.001 0.05 0.00 74.0 61.0 0.50 0.00 140 0.140 0.001 2.8 0.001 1100 1100 0.0 0.6 0.10
50th Percentile 0.0005 1.70 13 0.001 5.0 0.002 205 0.0001 19 3100 0.001 0.001 0.50 0.00 110.0 88.0 0.50 0.00 215 0.255 0.001 2.9 0.001 1750 2400 0.5 4.7 0.18

Site 86 Seepage water Northern wall coll ection pit near GW6 Groundwater from the KVAD on th e northside drains from April, 201 5 to March, 2016 . All water reports to the pipe out to the Lisdale Cut.
Date ag Al Alk As B Ba Be Ca Cd Cl Cond Cr Cu F Fe Hg K Mg Mn Mo Na Ni DO Pb pH NO3 se So4 TDS TKN TN Turbidity (NTU) Zn
9/04/2015 0.0005 2.3 12.5 0.002 7 0.0005 270 0.0001 20 3800 0.001 0.001
0.001 0.4 48 0.000025 140 100 16 0.001 250 0.75
9.7 0.001 2.9
0.5 0.001 2100 3000
3.9 1.2 0.63
27/05/2015 0.0005 1 12.5 0.002 5.9 0.001 280 0.0001 20 3600 0.001 0.001 0.001 0.4 89 0.00002 140 100 16 0.001 230 0.81 7.5 0.001 3.1 0.5 0.001 2100 3200 4 15 0.82
17/06/2015 0.0005 1.8 12.5 0.002 6.3 0.002 260 0.0001 18 3400 0.001 0.001 0.001 0.6 69 0.00002 130 96 15 0.001 240 0.68 12.9 0.001 3 0.5 0.001 2100 2800 3.2 6.2 0.67
15/07/2015 0.0005 2.01 0.5 0.003 6.91 0.007 314 0.0003 17.5 4040 0.002 0.001 0.001 0.4 166 0.00002 168 119 15.9 0.001 294 0.817 8.1 0.001 3.18 0.025 0.0005 2540 3230 3.2 7.6 1.12
19/08/2015 0.0005 2.81 0.5 0.003 9.29 0.002 311 0.0001 18.9 4250 0.001 0.001 0.001 2.26 120 0.00002 170 110 16.7 0.001 282 1.2 7.2 0.001 3.05 0.05 0.0008 2570 3130 4.2 0.8 1.58
16/09/2015 0.0005 3.76 0.5 0.003 9.2 0.006 318 0.0001 19.1 4311 0.001 0.001 0.001 1.01 98.2 0.00002 165 114 16.1 0.002 295 0.999 6.8 0.001 3.03 0.05 0.0007 2630 2430 3.7 22.8 1.82
21/10/2015 0.0005 5.23 0.5 0.003 7.2 0.003 277 0.0001 17 4003 0.001 0.001 0.001 2.92 52
0.00002 142 94.4 14.6 0.001 254 0.846 6.9 0.002 2.87 0.05 0.0016 2250 3150 3.8 2.3 1.44
18/11/2015 0.0005 5.98 0.5 0.003 8.68 0.0005 310 0.0002 16.5 4263 0.001 0.001 0.001 3.74 57.6 0.00002 153 104 16.8 0.001 269 1 9.2 0.001 2.96 0.05 0.0013 2590 3720 4.1 2.6 1.69
9/12/2015 0.0005 7.04 0.5 0.006 12 0.001 363 0.0002 18.3 4604 0.0005 0.001 0.001 5.64 68.5 0.00002 178 124 18.3 0.001 337 1.66 4.6 0.001 2.83 0.02 0.0016 2860 3340 3.7 1.6 2.09
20/01/2016 0.0005 10.8 0.5 0.007 6.63 0.001 341 0.0003 19.4 4346 0.001 0.001 0.001 10.2 33.6 0.00002 153 111 15.6 0.003 312 1.3 6.2 0.001 2.96 0.01 0.002 2480 3500 4.4 1 2.39
10/02/2016 0.0005 10.2 0.5 0.004 8.28 0.0005 315 0.0002 18.5 4217 0.001 0.001 0.001 8.08 34.7 0.00002 151 103 16.3 0.001 275 1.15 3.4 0.001 2.81 0.01 0.0021 2280 2830 3.3 0.8 2.14
16/03/2016 0.0005 14 0.5 0.006 9.45 0.002 333 0.0003 19.5 4322 0.002 0.002 0.002 13.1 28.6 0.00002 154 109 16 0.001 316 1.24 3.4 0.001 2.84 0.02 0.0025 2310 3000 4.6 11.4 2.27
Site 86 Seepage water Northern wall collection pit near GW6 Groundwater from the KVAD on the north side drains from April, 2015 to March, 2016 . All water reports to the asbestos pipe out to the Lidsdale Cut (site 86)
Ag Al Alk As B Ba Be Ca Cd Cl Cond Cr Cu F Fe Hg K Mg Mn Mo Na Ni Pb pH NO3 se So4 TDS TKN TN Turbidity (NTU) Zn
Average 10.8 12.5 0.007 12 0.007 363 0.0003 20 4604 0.002 0.001
10.8 12.5
10.2 166 0.000025 178 124 18.3 0.003 337 1.66
0.002 3.18
0.5 0.0021 2860 3720
4.4 22.8
2.39
Maximum 14 12.5 0.007 12 0.007 363 0.0003 20 4604 0.002 0.002 14 12.5 13.1 166 0.000025 178 124 18.3 0.003 337 1.66 0.002 3.18 0.5 0.0025 2860 3720
4.6 22.8 2.39
Minimum 1 0.5 0.002 5.9 0.0005 260 0.0001 16.5 3400 0.0005 0.001 1 0.5 0.4 28.6 0.00002 130 94.4 14.6 0.001 230 0.68 0.001 2.81 0.01 0.0005 2100 2430
3.2 0.8 0.63
50th Percentile 4.495 0.5 0.003 7.74 0.0015 312.5 0.00015 18.7 4233.5 0.001 0.001 4.495 0.5 2.59 63.05 0.00002 153 106.5 16 0.001 278.5 0.9995 0.001 2.96 0.05 0.00115 2395 3140
3.85 2.45 1.635

Seepage Water Southwest wall at end of seepage line before entering Lidsdale Cut at Site 94
Site 94 Seepage wat er south -west wall groundwater seepage from the KVAD on from April, 2015 to March, 2016. All water reports to t he pipe out to the Lisd ale Cut. All water reports to the Lidsdale Cut (site 86)
Ag Al Alk As B Ba Be Ca Cd Cl Cond Cr Cu F Fe Hg K Mg Mn Mo Na Ni Pb pH NO3 se So4 TDS TKN TN Turbidity (NTU) Zn
Average 0.0005
93.825 12.5 0.079 21.7 0.044 382 0.0768 42.3 5601 0.038 0.072
93.825 46.1 27.5 0.000025 316 138 22.4 0.003 369 2.8
0.004 3.84
0.5 0.072 4080 6140
4.4 22.8
5.7
Maximum 0.0005 293 12.5 0.079 21.7 0.044 382 0.0768 42.3 5601 0.038 0.072 293 46.1 32 0.000025 316 138 22.4 0.003 369 2.8 0.005 3.84 0.5 0.072 4080 6140
4.6 22.8 5.7
Minimum 0.0005 18.3 0.5 0.002 3 0.007 78 0.0039 13 1200 0.001 0.004 18.3 6.2 3.7 0.00002 47 22 3.1 0.001 63 0.27 0.002 3.02 0.01 0.0017 690 910
3.2 0.8 0.65
50th Percentile 0.0005 41.9 0.5 0.007 9.395 0.018 255 0.0122 38.7 3734 0.004 0.013 41.9 11.95 20.25 0.00002 146 110 16.25 0.002 259.5 1.36 0.004 3.4 0.05 0.00885 2220 3245
3.85 2.45 2.405
Site 94 Seepage water south -west wall groundwater seepage from the KVAD on from April, 2015 to March, 2016 . All water reports to the pipe out to the Lisdale Cut.
Date ag Al Alk As B Ba Be Ca Cd Cl Cond Cr Cu F Fe Hg K Mg Mn Mo Na Ni DO Pb pH NO3 se So4 TDS TKN TN Turbidity (NTU) Zn
9/04/2015 0.0005 160 12.5 13 0.023 290
290 0.051 35 4300
28 12 0.000025 180 100 15 0.002 240 1.2
12.4 0.004 3.5
2.5 2900 4100
0.004 2.9 110 2.7
27/05/2015 0.0005 30 12.5 0.004 6.4 0.019 230 230 0.0096 42 3200 0.002 0.007 12 6.3 0.00002 120 110 15 0.001 230 1.3 11.7 0.003 3.3 2.5 1900 2800 0.003 3.75 28 2
17/06/2015 0.0005 42 12.5 0.007 3 0.044 78 78 0.011 13 1200 0.007 0.013 6.2 3.7 0.00002 47 22 3.1 0.001 63 0.27 15.7 0.004 3.8 5 690 910 0.004 2.5 130 0.65
15/07/2015 0.0005 41.8 0.5 0.01 7.24 0.02 209 209 0.0134 38.1 3380 0.004 0.02 6.4 20.6 0.00002 126 100 14.7 0.002 240 1.16 19.1 0.003 3.44 0.39 1940 2810 0.003 2.3 124 1.93
19/08/2015 0.0005 23.2 0.5 0.004 7.78 0.017 228 228 0.0057 42.3 3390 0.001 0.004 7.28 22.6 0.00002 130 112 17.7 0.002 256 1.58 10.9 0.004 3.44 0.49 1900 2530 0.004 2.9 50.9 2.11
16/09/2015 0.0005 78.4 0.5 0.025 8.98 0.023 256 256 0.0254 41 3469 0.008 0.022 6.94 11.7 0.00002 135 99.8 13.6 0.003 269 0.845 10.7 0.002 3.84 0.42 2250 3240 0.002 2 53.1 2.09
21/10/2015 0.0005 18.3 0.5 0.002 6.4 0.016 221 221 0.0044 41.8 3452 0.001 0.004 7.23 19.9 0.00002 134 111 15.3 0.002 244 1.16 9.7 0.003 3.36 0.41 2000 3250 0.003 2.9 52 1.76
18/11/2015 0.0005 160 0.5 0.025 11.3 0.019 289 289 0.0411 33.9 4243 0.017 0.041 24.1 14.8 0.00002 186 108 17.4 0.002 274 1.42 8.8 0.004 3.53 0.47 3160 4490 0.004 3.5 52.5 2.9
9/12/2015 0.0005 293 0.5 0.079 21.7 0.011 382 382 0.0768 34.4 5601 0.038 0.072 46.1 24.2 0.00002 316 137 17.2 0.001 369 2.8 7.9 0.004 3.23 0.24 4080 6140 0.004 4.5 24.4 5.7
20/01/2016 0.0005 217 0.5 0.047 10.2 0.013 294 294 0.0493 32.6 4860 0.023 0.047 34.5 22.3 0.00002 227 110 17.8 0.003 286 1.77 7.3 0.004 3.22 0.22 3500 4080 0.004 4 8.7 3.5
10/02/2016 0.0005 31.5 0.5 0.003 9.97 0.007 254 254 0.0039 41.6 4150 0.001 0.004 15.6 27.5 0.00002 163 138 22.4 0.001 263 2.07 5.5 0.004 3.02 0.3 2360 3190 0.004 3.9 1.2 2.91
16/03/2016 0.0005 30.7 0.5 0.005 9.81 0.011 257 257 0.0047 39.3 3999 0.001 0.006 11.9 32 0.00002 157 138 21.5 0.001 295 1.99 9.5 0.005 3.09 0.22 2190 3740 0.005 3.6 2.4 2.79

KVAD groundwater Bores GW11, AP09 and AP17
KVAD groundwater bore G W11 April, 2015 to March 2016
Date ag Al Alk As B Ba Be Ca Cd Cl Cond Cr Cu F Fe Hg K Mg Mn Mo Na Ni DO Pb pH NO3 se So4 TDS TKN TN Turbidity (NTU) Zn WL (m)
27/05/2015
3.5
16/07/2015 0.0005 9.22 61 0.003 0.05 0.088 27.7 0.0001 27.2 318 0.004 0.015 0.0005 0.4 0.076 0.00002 3.26 5.27 0.02 0.0005 28.5 0.01 0.025 7.55 0.001 45 266 0.102 2.2
16/09/2015 3.3
18/11/2015 3.4
10/02/2016 3.4
KVAD groundwater bore AP09 April, 2015 to March 201 6
Date Ag ALK Al As B Ba Be Ca Cd Cl Co COND Cr Cu F Fe Hg K Li Mg Mn Mo Na Ni Pb pH Se SO4 TDS WL
AHD WL1 Zn
10-Apr-15 0.0005 0.18 55 0.049 2.1 0.022 120 0.0001 37
2100 0.0001 0.0001
0.9 48 0.000025 96 62 7.1 0.13 140 0.21 0.001 6.2
0.001 1000 1600
2.8 0.079
28-May-15 0.0005 0.16 61 0.052 1.8 0.019 140 0.0001 41
2100 0.0001 0.0001 0.7 39 0.00002 100
68 7.1 0.1 140 0.24 0.001 6.2 0.001 1200 1700
2.8 0.094
18-Jun-15 0.0005 0.21 30 0.06 2 0.019 140 0.0001 42
1900 0.0001 0.0001 0.9 49 0.00002 100
66 7 0.12 150 0.27 0.001 5.9 0.001 1200 1600
2.8 0.11
16-Jul-15 0.0005 0.25 36 0.081 2.08 0.02 138 0.0001 41.7
2250 0.0001 0.0001 0.9 51.2 0.00002 111
70.4 7.07 0.125 161 0.3 0.001 6.33 0.0001 1140 1560
2.8 0.136
20-Aug-15 0.0005 0.28 60 0.088 2.59 0.018 133 0.0001 42.9
2320 0.0001 0.0001 0.124 51.6 0.00002 112
65 7 0.134 155 0.365 0.001 6.41 0.0001 1150 1150
2.8 0.149
17-Sep-15 0.0005 0.37 33 0.095 2.3 0.02 137 0.0001 44.2
2232 0.0001 0.0001 0.19 53.2 0.00002 116
67.3 7.15 0.127 161 0.262 0.001 6.13 0.0001 1150 1740
2.8 0.144
22-Oct-15 0.0005 0.33 36 0.089 1.88 0.017 130 0.0001 45
2278 0.0001 0.004 0.432 50.4 0.00002 115
63.4 6.87 0.124 153 0.291 0.001 6.02 0.0002 1180 1770
2.8 0.131
19-Nov-15 0.0005 0.25 25 0.07 2.03 0.019 137 0.0001 40.8
2311 0.0001 0.0001 0.737 65.2 0.00002 117
64.9 8.17 0.13 145 0.337 0.001 6 0.0002 1200 1990
2.9 0.138
10-Dec-15 0.0005 0.26 56 0.072 2.07 0.019 148 0.0001 41.6
2309 0.0001 0.002 0.571 49 0.00002 132
71.1 5.93 0.105 169 0.354 0.001 5.94 0.0001 1220 1610
2.9 0.134
21-Jan-16 0.0005 0.25 42 0.068 1.99 0.017 139 0.0001 40.6
2369 0.0001 0.006 0.783 68.7 0.00002 128
70.3 9.24 0.131 171 0.336 0.001 5.99 0.0001 1150 2010
2.9 0.133
11-Feb-16 0.0005 0.24 54 0.064 2.1 0.017 152 0.0001 40.8
2345 0.0001 0.0001 0.569 61.6 0.00002 138
75.7 7.58 0.106 173 0.328 0.001 5.88 0.0001 1170 2040
2.9 0.135
17-Mar-16 0.0005 0.27 58 0.064 2.19 0.017 140 0.0001 38.6
2367 0.0001 0.0001 0.489 59.6 0.00002 125
69.9 7.05 0.114 168 0.346 0.001 5.95 0.0002 1150 1870
2.9 0.138
KVAD groundwater bore AP09 April, 2015 to March 201 6
Ag ALK Al As B Ba Be Ca Cd Cl Co COND Cr Cu F Fe Hg K Li Mg Mn Mo Na Ni Pb pH Se SO4 TDS WL1 WL
AHD Zn
Average 0.0005 0.37 61 0.095 2.59 0.022
152 0.0001 45
2369 0.0001 0.006 68.7 0.9 0.000025
138 75.7 9.24 0.134 173 0.365 0.001 6.41
0.001 1220 2040
2.9 0.149
Maximum 0.0005 0.37 61 0.095 2.59 0.022
152 0.0001 45
2369 0.0001 0.006 68.7 0.9 0.000025 138
75.7 9.24 0.134 173 0.365 0.001 6.41 0.001 1220 2040 2.9
0.149
Minimum 0.0005 0.16 25 0.049 1.8 0.017
120 0.0001 37
1900 0.0001 0.0001 39 0.124 0.00002 96
62 5.93 0.1 140 0.21 0.001 5.88 0.0001 1000 1150 2.8
0.079
50th Percentile 0.0005 0.25 48 0.069 2.075 0.019
138.5 0.0001 41.3
2293.5 0.0001 0.0001 51.4 0.6355 0.00002 115.5
67.65 7.085 0.1245 158 0.314 0.001 6.01 0.00015 1160 1720 2.8
0.1345

KVAD groundwater bore AP17 April, 2015 to March 201 6
Date Ag ALK Al As B Ba Be Ca Cd Cl Co COND Cr Cu F Fe Hg K Li Mg Mn Mo Na Ni Pb pH Se SO4 TDS WL
AHD WL1 Zn
10-Apr-15 0.0005 52 12.5 0.003 12 0.021
390 0.0006 17
5000 0.001 0.002
88 240 0.000025 270 95 16 0.052 300 1.7 0.0005 4.3
0.002 3500 4800
2.4 4.7
28-May-15 0.0005 52 12.5 0.002 9.9 0.007 420 0.0006 17
4800 0.002 0.003 89 190 0.00002 270
100 15 0.013 300 1.6 0.002 3.2 0.002 3100 4400
2.3 5.1
18-Jun-15 0.0005 59 12.5 0.002 11 0.007 430 0.0005 17
4300 0.001 0.002 93 220 0.00002 280
100 15 0.037 340 1.7 0.001 3.3 0.002 3300 4400
2.3 5.1
16-Jul-15 0.0005 61.1 0.5 0.004 11.3 0.01 430 0.0006 18.5
5030 0.001 0.003 103 206 0.00002 266
104 14.4 0.021 349 1.76 0.001 3.46 0.001 3440 4170
2.4 5.38
20-Aug-15 0.0005 70.1 0.5 0.004 13.8 0.007 423 0.0007 17.7
5150 0.001 0.004 93.8 177 0.00002 274
98.3 14.2 0.024 334 2.23 0.002 3.5 0.0009 3240 4310
2.4 5.94
17-Sep-15 0.0005 68.7 0.5 0.004 13.2 0.008 439 0.0008 14.3
4978 0.001 0.024 94 188 0.00002 277
107 13.5 0.034 365 1.71 0.002 3.58 0.0008 3220 4050
2.3 6.21
22-Oct-15 0.0005 57.8 0.5 0.003 10.8 0.006 409 0.0006 17.1
5074 0.001 0.016 108 162 0.00002 255
97.6 13.2 0.006 337 1.6 0.003 3.34 0.0012 3480 4680
2.4 4.93
19-Nov-15 0.0005 65.4 0.5 0.005 10.5 0.01 417 0.0008 15.7
5001 0.001 0.001 107 228 0.00002 261
95.8 14.1 0.041 339 1.7 0.0005 4.18 0.0011 3440 5190
2.4 5.59
10-Dec-15 0.0005 68.5 0.5 0.005 12.6 0.01 452 0.0008 15.3
5006 0.001 0.006 118 259 0.00002 291
106 15.6 0.035 376 2.56 0.0005 4.45 0.0012 3480 4970
2.2 7.25
21-Jan-16 0.0005 62.1 0.5 0.006 8.93 0.012 412 0.0009 15.6
4966 0.001 0.106 111 230 0.00002 282
96.8 14 0.057 360 1.76 0.0005 4.66 0.0012 3240 5250
2.4 5.13
11-Feb-16 0.0005 64.6 2 0.005 13.4 0.01 426 0.0009 17.4
4943 0.001 0.01 108 236 0.00002 277
99.1 14.5 0.022 348 1.9 0.0005 4.65 0.0013 3230 5210
2.4 5.48
17-Mar-16 0.0005 64 0.5 0.003 13.1 0.012 415 0.0011 17.7
4965 0.001 0.021 106 220 0.00002 272
96.4 13.8 0.004 362 1.85 0.002 3.93 0.0017 3160 5090
2.4 5.35
KVAD groundwater bore AP17 April, 2015 to March 201 6
Ag ALK Al As B Ba Be Ca Cd Cl Co COND Cr Cu F Fe Hg K Li Mg Mn Mo Na Ni Pb pH Se SO4 TDS WL1 WL
AHD Zn
Average 0.0005 70.1 12.5 0.006 13.8 0.021
452 0.0009 18.5
5150 0.002 0.106 68.7 0.9
0.000025 138 107 16 0.057 376 2.56 0.003 4.66
0.002 3500 5250
2.9 0.149
Maximum 0.0005 70.1 12.5 0.006 13.8 0.021
452 0.0011 18.5
5150 0.002 0.106 68.7 0.9 0.000025 138
107 16 0.057 376 2.56 0.003 4.66 0.002 3500 5250 2.9
0.149
Minimum 0.0005 52 0.5 0.002 8.93 0.006
390 0.0005 14.3
4300 0.001 0.001 39 0.124 0.00002 96
95 13.2 0.004 300 1.6 0.0005 3.2 0.0008 3100 4050 2.8
0.079
50th Percentile 0.0005 63.05 0.5 0.004 11.65 0.01
421.5 0.00075 17
4989 0.001 0.005 51.4 0.6355 0.00002 115.5
98.7 14.3 0.029 344 1.735 0.001 3.755 0.0012 3270 4740 2.8
0.1345

Attachment 3 Construction drawing of KVAD wall showing chitter used to construct the benches


Aurecon Australiasia Pty Ltd ABN 54 005 139 873
Level 2, 116 Military Road Neutral Bay NSW 2089
PO Box 538 Neutral Bay NSW 2089 Australia
T +61 2 9465 5599 F +61 2 9465 5598 E [email protected] W aurecongroup.com
Aurecon offices are located in: Angola, Australia, Botswana, China, Ethiopia, Hong Kong, Indonesia, Lesotho, Libya, Malawi, Mozambique, Namibia, New Zealand, Nigeria, Philippines, Singapore, South Africa, Swaziland, Tanzania, Thailand, Uganda, United Arab Emirates, Vietnam.