Project for Master Plan on Logistics in Northern Economic … · 2017. 10. 17. · Solve future...
534
JR EI 17-053 Project for Master Plan on Logistics in Northern Economic Corridor Final Report Annex - Data Book - Volume 2 March 2017 Japan International Cooperation Agency (JICA) Nippon Koei Co., Ltd. Eight-Japan Engineering Consultants Inc. PADECO Co., Ltd. The Republic of Kenya Ministry of Transport, Infrastructure, Housing and Urban Development The Republic of Uganda Ministry of Works and Transport
Transcript of Project for Master Plan on Logistics in Northern Economic … · 2017. 10. 17. · Solve future...

JREI
17-053
Project for Master Plan on Logisticsin Northern Economic Corridor
Final ReportAnnex - Data Book -
Volume 2
March 2017
Japan International Cooperation Agency (JICA)
Nippon Koei Co., Ltd.Eight-Japan Engineering Consultants Inc.
PADECO Co., Ltd.
The Republic of KenyaMinistry of Transport, Infrastructure, Housing and Urban DevelopmentThe Republic of UgandaMinistry of Works and Transport


Project for Master Plan on Logistics in Northern Economic Corridor
Annex - Databook - Volume 2
i
Table of Contents
Data 5: Strategic Environmental Assessment (Kenya)


Data 5:
Strategic
Environmental
Assessment
(Kenya)

ERM consulting services worldwide www.erm.com
Strategic Environmental Assessment (SEA) for
the Formulation of a Master Plan on Logistics in
the Northern Economic Corridor, Kenya
Volume I: Final SEA Report
February 2017
www.erm.com

Proponent: Ministry of Transport and Infrastructure Report Title: Final SEA Report for the Strategic Environmental
Assessment (SEA) for the Formulation of a Master Plan on Logistics in the Northern Economic Corridor, Kenya.
Name and Address of Firm of Experts: ERM East Africa Limited P. O. Box 100798-00101 Nairobi, Kenya Tel. + 254 20 49 38 113/4 Registration No. of Firm of Exerts: 7264
Signed: Date: 03rd February 2017 For: ERM East Africa Ltd
Michael Jon Everett Lead EIA/Audit Expert No 7263
Name and Address of Proponent: Ministry of Transport and Infrastructure, PO Box 30260-00100, Transcom House, Ngong Road, Nairobi, Kenya. Signed: ___________________________ Date: 03rd February 2017 For: Eng. Francis Gitau, State Department of Infrastructure
ACRONYMS
ACZ Agro Climatic Zone
AEZ Agro-Ecological Zones
ASAL Arid and Semi-Arid Land
AZE Alliance for Zero Extinction
BID Background Information Document
CBD Central Business District
CR Critically Endangered
DD Data Deficient
DEM Digital Elevation Model
DOSHS Department of Occupational Safety and Health
DUV Direct Use Value
E&S Environmental and Social
EACC East African Coastal Current
EAM Eastern Afromontane Biodiversity
EARS East African Rift System
EBAs Endemic Bird Areas
ECC Equatorial Counter Current
EHS Environmental, Health and Safety
EIA Environmental Impact Assessment
EMCA Environmental Management Coordination Act (1999)
EN Endangered
ERM Environmental Resources Management
ESIA Environmental and Social Impact Assessment
ESMMP Environmental and Social Management and Monitoring Plan
EV Existence Value
EX Extinct
FAO Food and Agriculture Organization of the United Nations
FR Forest Reserve
GCA Groundwater Conservation Area
GDP Gross Domestic Product
GHG Green House Gas
GIIP Good International Industry Practice
GISD Global Invasive Species Database
GoK Government of Kenya
GR Game Reserve
IBA Important Bird Area
IFC International Finance Corporation
ITCZ Inter Tropical Convergence Zone
IUCN International Union for Conservation of Nature
IUV Indirect Use Value
I&APs Interested & Affected Parties
JICA Japan International Cooperation Agency
JST JICA Study Team
KBA Key Biodiversity Area
KFS Kenya Forest Service
KIPPRA Kenya Institute for Public Policy Research and Analysis

KNBS Kenya National Bureau of Statistics
KWS Kenya Wildlife Service
KWTA Kenya Water Tower Agency
LC Least Concern
MAB Man and Biosphere Reserve
MGR Meter Gauge Railway
MoTI Ministry of Transport and Infrastructure
MoWT Ministry of Works and Transport
MP Master Plan
MPA Marine Protected Area
MR Main Arterial Road
NASA National Aeronautics and Space Administration
NCTTCA Northern Corridor Transit Transport Coordination Authority
ND GAIN (University of) Notre Dame Global Adaptation Index
NEC Northern Economic Corridor
NEMA National Environment Management Authority
NOAA National Oceanic and Atmospheric Administration
NP National Park
NR National Reserve
NT Near Threatened
PA Protected Area
PPP Policy, Plan or Program
SC Somali Current
SEA Strategic Environmental Assessment
SEP Stakeholder Engagement Plan
TEV Total Economic Value
ToR Terms of Reference
UNEP United Nations Environment Program
UNEP FI United Nations Environment Program Finance Initiative
UNESCO United Nations Educational, Scientific and Cultural
Organization
USGS United States Geological Survey
VU Vulnerable
WCMA World Conservation Monitoring Centre
WHO World Health Organization
WHS World Heritage Site
WRMA Water Resources Management Authority
WS Wildlife Sanctuary
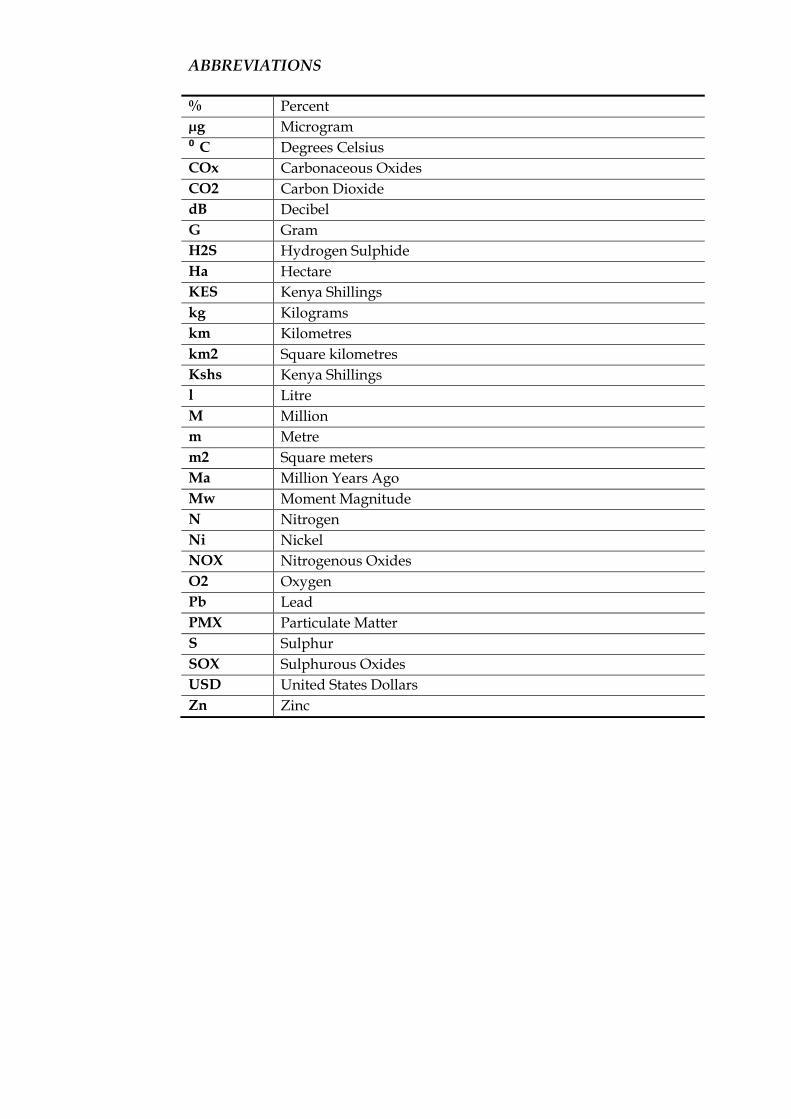
ABBREVIATIONS
% Percent
µg Microgram
⁰ C Degrees Celsius
COx Carbonaceous Oxides
CO2 Carbon Dioxide
dB Decibel
G Gram
H2S Hydrogen Sulphide
Ha Hectare
KES Kenya Shillings
kg Kilograms
km Kilometres
km2 Square kilometres
Kshs Kenya Shillings
l Litre
M Million
m Metre
m2 Square meters
Ma Million Years Ago
Mw Moment Magnitude
N Nitrogen
Ni Nickel
NOX Nitrogenous Oxides
O2 Oxygen
Pb Lead
PMX Particulate Matter
S Sulphur
SOX Sulphurous Oxides
USD United States Dollars
Zn Zinc

ENVIRONMENTAL RESOURCES MANAGEMENT JST/MOTI
I
NON-TECHNICAL SUMMARY
PPP: Master Plan on Logistics for the Northern Economic Corridor
(NEC), along with an integrated regional development strategy
consistent with sub-regional and national development plans in Kenya.
PPP Owner: Ministry of Transport and Infrastructure (MoTI).
Master Plan Study Team
The Japan International Cooperation Agency (JICA) Study Team (JST),
consisting of the following 16 experts, undertook the Master Plan study:
Team Leader/ Development Planning;
Logistics Plan;
Infrastructure Development;
Logistics Infrastructure 1;
Logistics Infrastructure 2 (Railway);
Freight Traffic Analysis and Demand Forecasting;
Industrial Development and Investment Promotion;
Public-Private Partnership;
Mineral Resources and Energy;
Power;
Agriculture and Agri-Business;
Urban Development/Land Use Specialist;
Water;
Economist (Socio Economic Analysis);
Environmentalist (Social and Environmental Considerations); and
Coordinator/Human Resource Development.
Northern Economic Corridor
The Northern Economic Corridor (NEC) is a multi-modal corridor,
consisting of road, rail, pipeline, and inland waterways transport, and is
recognized as a significant corridor for logistics in East Africa. The main
road network runs from Mombasa Sea Port through Kenya and
Uganda, to Rwanda and Burundi, and to the Democratic Republic of
Congo (DRC). The road network also links Kenya and Uganda to Juba
in South Soudan.
There are some obstacles presently in the NEC that have led to an
increase in transport costs and significant time delays within the NEC
ENVIRONMENTAL RESOURCES MANAGEMENT JST/MOTI
II
and have hindered the economic development of the region, specifically
inland areas. These obstacles include:
inadequate infrastructure;
poor connectivity of modes;
long delays of cargo at the port and border posts; and
lack of goods to transport for the return trip from the inland area to
Mombasa port.
Based on these obstacles, the overall objective of the Master Plan is to
improve logistics for the NEC as well as to provide an integrated
regional development strategy consistent with sub-regional and
national development plans. It is hoped that this will:
spur regional economic development within Kenya, as well as
Uganda,
improve the development of the industrial, agricultural, mining,
petroleum, manufacturing and tourism sectors,
lead to transport and logistics infrastructure development,
result in an efficient and integrated multi-modal transportation
system,
result in the diversification of financial sources for infrastructure
through PPP arrangements and infrastructure bonds, and
reduce the bottlenecks to efficient cargo transportation, such as
road and port congestion, as well as cross border delays.
Master Plan Development Vision and Strategies
The development vision for the NEC is: ‘to be the leading economic
corridor with integrated transport and logistics systems in Africa’. The
Development Vision has four key words/phrases which make the NEC
distinct from other corridors, and these are:
leading, to be the leading, most efficient and reliable in Africa and
the success can be applied to other corridors,
integrated transportation system, which offers diversified and
multi-modal options (road, rail, waterway, and pipeline) and
facilitates regional integration in East Africa,
integrated logistic hub, in which multi-modal options are available,
and industrial areas connected and promoted by transport and
logistic infrastructure,
economic corridor, stimulate regional economic development in
the area surrounding the corridor through development of

ENVIRONMENTAL RESOURCES MANAGEMENT JST/MOTI
III
transport infrastructure, logistic facilities and creating industries
(JST, 2016).
The proposed Development Vision will be attained through the
implementation of 5 strategies, namely regional, industrial, and
transport strategies, which will be strengthened by organizational and
policy strategy as illustrated in
Figure 0.1 below.
Figure 0.1 Proposed Five Strategies for the NEC
Source: JST, 2016
Master Plan Target Areas:
The target area of the Master Plan study covers the following routes
and surrounding areas (1):
Main route
o Mombasa – Nairobi – Tororo –Kampala – Katuna – Kigali
(Rwanda)
Sub-routes
o Eldoret – Nadapal – Juba (South Sudan)
o Tororo – Gulu – Elegu – Juba
o Kampala – Gulu – Elegu – Juba
o Mbarara – Mpondwe – Kisangani (DRC)
(1) It is important to note that an SEA is also being carried out in Uganda, under consultation with NEMA Uganda

ENVIRONMENTAL RESOURCES MANAGEMENT JST/MOTI
IV
Overall Implementation Strategy
The JST has selected 23 flagship projects that can contribute to
continued logistics improvement along the NEC, to future economic
development of Kenya and Uganda, as well as the region. The primary
aim of these flagship projects is to:
Solve future logistics bottlenecks along the NEC including at the
port, roads, and logistic hubs,
Contribute to cross border infrastructure, such as pipelines and
transmission lines,
Develop key industrial areas along the NEC,
Ensure power and water supply to identified key industrial
areas, and
Support agribusiness and mining business developments.
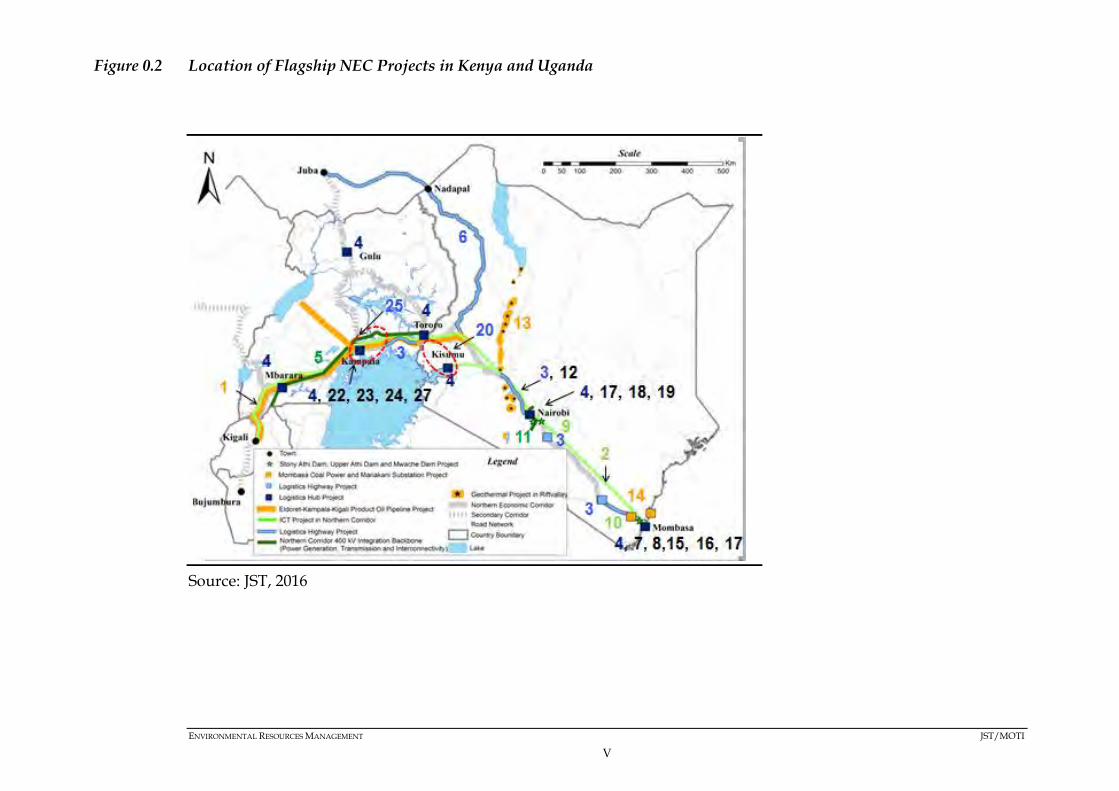
The locations of the 23 NEC flagship projects are shown in Figure 0.2 and Table 0.1 below:
ENVIRONMENTAL RESOURCES MANAGEMENT JST/MOTI
V
Figure 0.2 Location of Flagship NEC Projects in Kenya and Uganda
Source: JST, 2016

ENVIRONMENTAL RESOURCES MANAGEMENT JST/MOTI
VI
Table 0.1 Location of Flagship NEC Projects in Kenya and Uganda
No. Sector Project Title
1 Mining Eldoret-Kampala-Kigali Oil Pipeline Project
2 Mining ICT Project in Northern Corridor
3 Road Logistics Highway Project
4 Logistics Logistic Hub Project
5 Power Northern Corridor Integration Backbone (Power Generation, Transmission and
Interconnectivity)
6 Road Eldoret-Juba Highway Project
7 Port Mombasa Port Development Project
8 Urban Dev’t Project for Support of Re-organizing Logistics Facilities around Mombasa Port Area
9 Water Stony Athi Dam and Upper Athi Dam Project
10 Water Mwache Dam Project
11 Power Isinya-Nairobi East Transmission Line Project
12 Industry Geothermal Energy Based Regional Industrial Development in Rift Valley
13 Power Geothermal Project in Rift Valley
14 Power Mombasa Coal Power and Mariakani Substation Project
15 Power Dongo Kundu-Mariakani Transmission Project

ENVIRONMENTAL RESOURCES MANAGEMENT JST/MOTI
VII
16 Industry Mombasa Special Economic Zone Project
17 Industry Project for Building Up Competitiveness of Construction Materials and Machinery
Industry in Kenya
18 Agriculture Agricultural Financing Improvement Project in Nairobi
19 Agriculture Value Chain of Agriculture Development Pilot Project in Kenya
20 Urban Dev’t Logistics Based Kisumu-Kakamega Metropolitan Area Development Project
21 Mining Study on Mining Master Plan in Uganda
22 Industry Project for Building Up Competitiveness of Construction Materials and Machinery
Industry in Uganda
23 Agriculture Value Chain of Agriculture Development Pilot Project in Uganda
24 Power Kampala-North-Namungona-Mutundwe 132 kV Transmission Line Refurbishment
25 Urban Dev’t Great Kampala (including Jinja) Logistic Based Urban Development Project
26 Urban Dev’t Study on master Plan for Urban Transport Development for Regional cities
27 Industry SEZ Development Project in Kampala
Source: JST, 2016

ENVIRONMENTAL RESOURCES MANAGEMENT JST/MOTI
VIII
Objectives of the Strategic Environmental Assessment (SEA) Study
To identify the potentially significant environmental and social issues
relating to the Master Plan that will need to be addressed.
SEA Consultants
ERM East Africa Ltd. was appointed by JST to undertake the SEA for
the Master Plan. ERM (and specialists appointed by ERM during the
course of this SEA) have no financial ties to, nor are they a subsidiary,
legally or financially, of JST.
ERM is a global environmental consulting organisation with over 150
offices in 40 countries employing more than 5,000 people. ERM, the
world’s leading sustainability consultancy, has operated throughout
Africa for over thirty-five years, and our Sub-Saharan Africa Business
Division with over 200 employees, is currently based in South Africa
(Cape Town, Durban and Johannesburg), Mozambique (Maputo) and
East Africa (Nairobi). Environmental Resources Management East
Africa is registered with NEMA as a Firm of EIA/Audit Experts, Reg.
No 7264.
SEA Methodology and Approach
The SEA was undertaken in fulfilment of:
JICA Guidelines for Environmental and Social Considerations
(2010) ,
Kenyan Environmental Management Coordination Act of 1999
and 2015 (EMCA), and
National Guidelines for SEA in Kenya (2012).
Screening
Screening is carried out to establish whether an SEA is appropriate and
relevant to the development of a plan policy or program (PPP). It is
used to determine the potential of a PPP to result in significant impacts
on the environment and to determine if a SEA is required.
A PPP Brief was submitted to NEMA in June 2015 by the JST on behalf
of MoTI. The screening results were thereafter communicated to the
Ministry, i.e., the decision by NEMA that an SEA was necessary, and

ENVIRONMENTAL RESOURCES MANAGEMENT JST/MOTI
IX
was to be carried out in accordance with the National Guidelines for
SEA in Kenya (2012).
Scoping
The scoping stage establishes the focus and content of the SEA and the
relevant criteria for assessment. The scoping study identified the
potentially significant environmental and social impacts relating to the
PPP that needed to be addressed as part of the SEA Study. The scoping
study was carried out by ERM between October 2015 and February
2016. The Scoping Report was submitted to NEMA on the 02nd March
2016 and the Report was approved by NEMA on 06th April 2016.
Reference number NEMA/SEA/5/2/043.
Baseline Data Collection and Constraints Mapping
Due to the extensive coverage of the Master Plan, the level of baseline
data was collected at County and City levels from secondary data,
mainly the most recent County Integrated Development Plans (CIDPs),
Strategic Plans and the Kenya National Bureau of Statistics. Baseline
data was collected as per the National Guidelines for SEA in Kenya
(NEMA, 2012), as indicated in Box 0.1.
Box 0.1 Baseline Data Collected
Document Review
A detailed literature review was undertaken based on the findings of
the scoping process, which involved reviewing legislation, policies,
County Development Plans, and previous studies carried out in the
area to determine the baseline conditions and establish the legal,
institutional and biophysical and socio-economic environmental setting
of the proposed project.
Physical environment - including climate, air quality, water resources
and water quality, noise, topography, soils, geology, hydrology
including risks of natural disasters.
Biological conditions - biodiversity, ecology and nature conservation
in which issues of endangered species, protected ecosystems, habitat,
species of commercial importance, invasive species and their impacts
are assessed.
Social-economic conditions and human health – including
archaeology and cultural heritage landscape and facial aspects,
recreational, social-economic aspects, land use, transportation,
infrastructure, agricultural development, tourism, and human health.

ENVIRONMENTAL RESOURCES MANAGEMENT JST/MOTI
X
The desk based study also included the development of Key Informant
Interview (KII) questionnaires/guided discussions, as well as the
approach to continued stakeholder engagement as outlined in the
Stakeholder Engagement Plan (SEP).
Identifying Constraints and Opportunities
Constraints are features which limit the potential transport options
available. Constraints identified by the SEA experts included:
areas with extensive development within urban areas through to
landscape and environmental constraints in most rural areas,
physical features which exert special constraints on the shape of the
logistics strategy, such as sensitive areas of landscape or heritage
importance, areas of fertile soils with higher agricultural potential,
water sources, groundwater conservation zones, built-up areas, hilly
terrain, rivers and railways that are expensive to bridge, etc.,
biological features, which most importantly include national parks,
forest reserves, areas of conservation importance (such as wetlands,
Important Bird Areas, areas of endemism), sites of international
importance (recognised UNESCO and Ramsar sites and biodiversity
hot-spots), and
Institutional or legal constraints which are important to take into
account, e.g., the provision of elements of the public transport
system by private operators who will have their own commercial
objectives. The extent to which these institutional and legal
constraints have a material bearing on the outcome of the SEA
depend on the extent to which the recommendations are developed
with the private suppliers of transport.
In parallel with listing constraints, any opportunities to improve the
transport and logistic system more widely or to have positive impacts
on issues of wider concern, such as regeneration, were noted. Examples
of opportunities include:
ways of making better use of the existing infrastructure or existing
underused assets (e.g. reopening rail lines),
transport that opens up development land for regeneration or
housing,
enhancements to the environment,
employment,
contribution to the economy,
ENVIRONMENTAL RESOURCES MANAGEMENT JST/MOTI
XI
opportunities to plan for better social infrastructure such as housing,
schooling, health facilities, and
the NEC Master Plan making tourism and heritage sites more
accessible,.
Impact Assessment and Mitigation
The significance of the impact was formulated as a function of the
receptor or resource environmental value (or sensitivity) and the
magnitude of project impact (change). In other words, significance
criteria are used to report the effect of the impact.
The approach to assigning the significance of impacts was based on
reasoned arguments, professional judgement and taking on board the
advice and views of appropriate Stakeholders.
Significance categories were used for positive (beneficial) as well as
negative (adverse) effects. Applying the formula, the greater the
environmental sensitivity or value of the receptor or resource, and the
greater the magnitude of impact, the more significant the effect.
Determining the Significance of Cumulative Impacts
Five categories were e used as a framework for determining
significance of cumulative effects, as follows:
Severe - effects that the decision-maker must take into account as
the receptor/resource is irretrievably compromised
Major - effects that may become a key decision-making issue
Moderate - effects that are unlikely to become issues on whether
the project design should be selected, but where future work
may be needed to improve on current performances
Minor - effects that are locally significant
Not significant - effects that are beyond the current forecasting
ability or are within the ability of the resource to absorb such
change.
Stakeholder Engagement
The objectives of engaging stakeholders and the general public during
the SEA process and beyond include:
Ensuring understanding: An open, inclusive and transparent
process of engagement and communication was undertaken to
ensure that stakeholders were well informed about the Master Plan
ENVIRONMENTAL RESOURCES MANAGEMENT JST/MOTI
XII
as it developed. Information was disclosed as early and as
comprehensively as possible and appropriate.
Involving stakeholders in the assessment: Stakeholders were
included in the scoping of issues as well as the SEA Study. They also
played an important role in providing local knowledge and
information for the baseline to inform the impact assessment.
Building relationships: Through supporting open dialogue,
engagement helped establish and maintain a productive
relationship between the Master Plan and stakeholders. This
supports not only an effective SEA, but also strengthens the existing
relationships and builds new relationships between MoTI and
stakeholders.
Ensuring compliance: The process was designed to ensure
compliance with both national regulatory requirements and
international best practice
Stakeholder Identification and Mapping
Stakeholder identification was undertaken through a brainstorming
process and to guide the exercise, the following questions were asked:
Which people/groups/institutions would be interested in the
Master Plan development and implementation? What is/would be
their role?
Who are the potential beneficiaries of the NEC?
Who might be adversely impacted? Who has constraints about the
initiative?
Who may impact the Master Plan? Who has the power to influence?
Thereafter, a list of stakeholder’s organizations was developed and
grouped as government, civil society, NGOs and private sector.
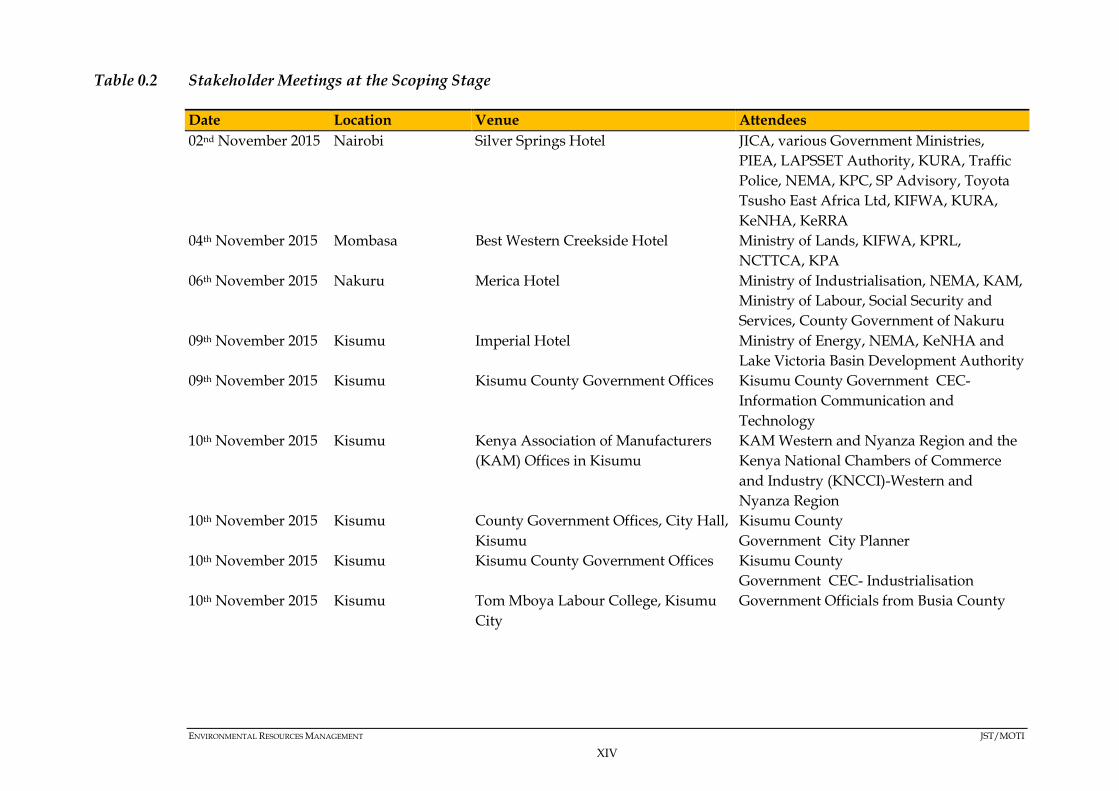
Stakeholder Meetings
Various stakeholder meetings were then held as shown in Table 0.2 and
Table 0.3 below. It is important to note that since the coverage area of
the Master Plan is so extensive:
the target participants was limited to high level officials, and

ENVIRONMENTAL RESOURCES MANAGEMENT JST/MOTI
XIII
the places where the stakeholder meetings were conducted was
limited to major cities/towns along the Corridor, namely
Nairobi, Mombasa, Nakuru, Kisumu and Malaba (1) .
Baseline Phase Engagement
Two sets of opinion surveys/questionnaires were administered during
the stakeholder meetings. The results were used to inform the baseline
data.
Key Informant Interviews (KIIs) were held with stakeholders in April
and May 2016, where the interviewees were taken through a guided
discussion for the interview schedule. The interviews were held one on
one between Stakeholders and individual SEA team members.
Website
A website for the purpose of information disclosure of the activities
related to SEA was also developed. The website has been used for the
advertisement of events such as stakeholder meetings but also reports
and documents related to the Master Plan and SEA are kept there for
download and review by the public. This website is hosted on the
server of the MoTI and as such will continue to be updated after the
SEA study by the Ministry. The address for the website is:
http://www.transport.go.ke/Projects.html
SEA Validation
The Draft Report was submitted to NEMA on 28th October 2016.
Thereafter, advertisements were placed in the media (the Daily Nation
and the Kenya Gazette adverts) calling for the public to submit their
comments.
The Draft SEA Report was then made available for inspection at the
Ministry of Environmental and Natural Resources and NEMA offices.
The Report was also made available for download at the NEMA and
MoTI websites.
The validation workshop was held on Tuesday 24th January 2017,
where the Draft Report was presented to Stakeholders. Table 0.4
provides a summary of the comments received on the Draft SEA
Report.
(1) This was agreed in consultative meetings between NEMA/JST/MoTI.
ENVIRONMENTAL RESOURCES MANAGEMENT JST/MOTI
XIV
Table 0.2 Stakeholder Meetings at the Scoping Stage
Date Location Venue Attendees
02nd November 2015 Nairobi Silver Springs Hotel JICA, various Government Ministries,
PIEA, LAPSSET Authority, KURA, Traffic
Police, NEMA, KPC, SP Advisory, Toyota
Tsusho East Africa Ltd, KIFWA, KURA,
KeNHA, KeRRA
04th November 2015 Mombasa Best Western Creekside Hotel Ministry of Lands, KIFWA, KPRL,
NCTTCA, KPA
06th November 2015 Nakuru Merica Hotel Ministry of Industrialisation, NEMA, KAM,
Ministry of Labour, Social Security and
Services, County Government of Nakuru
09th November 2015 Kisumu Imperial Hotel Ministry of Energy, NEMA, KeNHA and
Lake Victoria Basin Development Authority
09th November 2015 Kisumu Kisumu County Government Offices Kisumu County Government CEC-
Information Communication and
Technology
10th November 2015 Kisumu Kenya Association of Manufacturers
(KAM) Offices in Kisumu
KAM Western and Nyanza Region and the
Kenya National Chambers of Commerce
and Industry (KNCCI)-Western and
Nyanza Region
10th November 2015 Kisumu County Government Offices, City Hall,
Kisumu
Kisumu County
Government City Planner
10th November 2015 Kisumu Kisumu County Government Offices Kisumu County
Government CEC- Industrialisation
10th November 2015 Kisumu Tom Mboya Labour College, Kisumu
City
Government Officials from Busia County

ENVIRONMENTAL RESOURCES MANAGEMENT JST/MOTI
XV
Date Location Venue Attendees
11th November 2015 Malaba Hotel Lavantes Sub County Officers - Busia County, Kenya
Urban Roads Authority (KURA), Kenya
National Highways Authority (KeNHA),
Kenya National Chambers of Commerce
and Industry (KNCCI), NEMA, Customs
and Revenue Business Owners Association,
Amagoro Motor Cycle Boda-Boda
Association, Community of Malaba.

ENVIRONMENTAL RESOURCES MANAGEMENT JST/MOTI
XVI
Table 0.3 Stakeholder Meetings at the SEA Study Stage
Date Location Venue Attendees
04th May 2016 Kisumu Imperial Hotel MoTI, JST, KeNHA, LBDA, NIB, Maseno
University, NEMA, KMFRI, AFFA
06th May 2016 Malaba Hotel Lavantes MoTI, JST, County Government of Busia,
KeRRA, Ministry of Agriculture, Livestock
and Fisheries, FOPPS SACCO, Immigration
Malaba Border. KeNHA, KeRRA, NEMA
09th May 2016 Mombasa Best Western Creekside Hotel MoTI, JST, Immigration Department,
CORDIO East Africa, Coast Water Services
Board, KPRL, KMA, NEMA, KeRRA,
KNCC, KFS, NCTTCA
11th May 2016 Nakuru Merica Hotel MoTI, JST, KeNHA, MOEID, Department of
Immigration, KeRRA, Egerton University,
NEMA
13th May 2016 Nairobi Silver Springs Hotel MoTI, JST, KARA, AFIPEK, Kenya Water
Institute, JICA Kenya, FEAFFA, KWS,
PIEA, Green Belt Movement, LAPSSET,
KeRRA, Nature Kenya. RVR, Kenya
Pipeline Company, KNCCI, KFWG,
Transport Union, National Museums of
Kenya
01st September 2016 Nairobi CS Board Room, Works Building, MoTI Principal Secretary (PS) Representatives
from the following State Departments:
Planning and Statistics, Water, Devolution,
Public Work, MoTI, JST
22nd September 2016 Nairobi Panafric Hotel Representative from the Council of
Governors, Ministry of Devolution and
Planning, MoTI, JST.
The SEA Report will also be presented at future meetings, during the disclosure/validation process.

ENVIRONMENTAL RESOURCES MANAGEMENT JST/MOTI
XVII
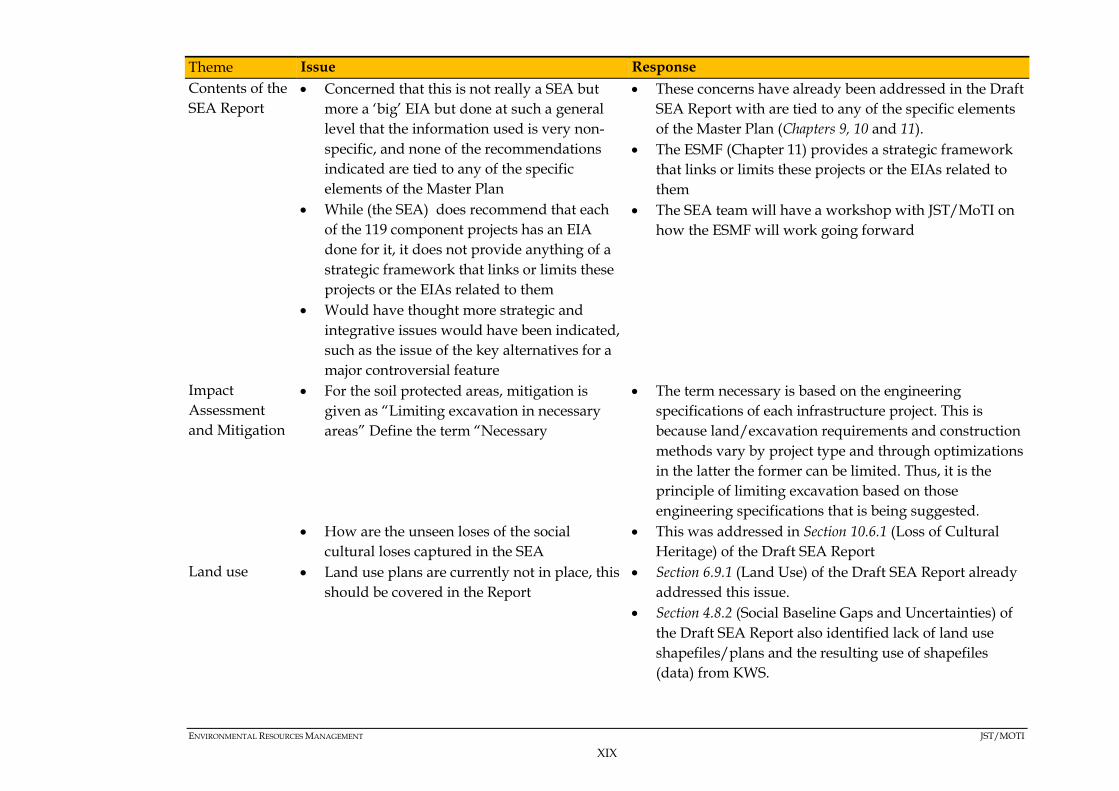
Table 0.4 Summary of Comments Raised on the Draft SEA Report
Theme Issue Response
Biophysical
issues
Consultants to update their information on
biodiversity
Four species of vulture now considered
critically endangered on a global scale were
not included in the Draft SEA Report
Provided a list of IBAs in the NEC and their
threatened species
Information on vultures had already been provided in
Section 5.4.2 of the Draft SEA Report wherein the species
of vulture likely to be found in the NEC are identified
IBAs were already included in Section 5.4.4 of the Draft
SEA Report under IBAs and EBAs.
The classification of the Negative Impact on
air pollution as “moderate” is not true, since
we do not have sufficient data
The impact of air pollution on biophysical features is
classed as moderate based on available information.
Each project within the NEC Master Plan should
monitor emissions since this will support the
development of baseline data on air quality to address
the observed information gaps.
Climate change No information on the environmental and
climate change impacts associated with the
Mombasa Coal Power and Mariakani sub-
station project
These have been added in Sections 5.3, 9.6, 9.10.2 and 9.12
of the Final SEA Report
Cumulative impacts of the Master Plan’s potential
contribution to global warming and climate change is
already classed as severe.

ENVIRONMENTAL RESOURCES MANAGEMENT JST/MOTI
XVIII
Theme Issue Response
Comparison of
Alternatives
No examination of alternatives to the
inclusion of the Mombasa coal fired power
plant in the NEC MP as opposed to
individual projects that would generate the
same quantity of power but from renewable
energy sources
Chapter 7 (Alternative Policy, Options and Strategies)
examines alternatives to the Master Plan at a strategic
level. Scenario analysis is used to present alternative
futures of the Multi-Core with Regional Industrial
Development Type, i.e., the preferred alternative and the
focus of the SEA Study
Chapter 11 (ESMF) outlines requirements for detailed
ESIA to be carried on projects developed under the NEC
Master Plan. These project-level ESIA's will examine
alternatives to NEC projects including the Mombasa coal
fired power plant.
Stakeholder
Engagement
Wider consultations within the stakeholders
involved with the leather industry e.g., the
Athi River Ecosystem and downstream
communities
As the coverage area of the Master Plan is so extensive,
the interests of many stakeholders can only be
represented by umbrella bodies rather than specific
organizations. The leather industry and Athi River
ecosystem communities were represented by the
Ministry of Industrialization and Enterprise
Development and NGOs respectively.
The National Land Commission (NLC)
should be included as a key institution to
implement the SEA
NLC was identified as important stakeholder (see Annex
E1, Stakeholder Database) as well as an Institution
involved in the implementation of the ESMF (Chapter
11).
Was Kenya National Human Rights
Commission (KNHCR) mapped in
considering socio economic factors
KNHCR was identified as important stakeholder (see
Annex E1, Stakeholder Database) as well as an Institution
involved in the implementation of the ESMF (Chapter
11).
How are all the communities supposed to
benefit from the NEC MP?
The SEA engaged in high level consultations, which
were meant to be cascaded downwards. The process
was a top-bottom engagement as opposed to bottom –
top engagement
Communities will benefit at the project-level
ENVIRONMENTAL RESOURCES MANAGEMENT JST/MOTI
XIX
Theme Issue Response
Contents of the
SEA Report
Concerned that this is not really a SEA but
more a ‘big’ EIA but done at such a general
level that the information used is very non-
specific, and none of the recommendations
indicated are tied to any of the specific
elements of the Master Plan
While (the SEA) does recommend that each
of the 119 component projects has an EIA
done for it, it does not provide anything of a
strategic framework that links or limits these
projects or the EIAs related to them
Would have thought more strategic and
integrative issues would have been indicated,
such as the issue of the key alternatives for a
major controversial feature
These concerns have already been addressed in the Draft
SEA Report with are tied to any of the specific elements
of the Master Plan (Chapters 9, 10 and 11).
The ESMF (Chapter 11) provides a strategic framework
that links or limits these projects or the EIAs related to
them
The SEA team will have a workshop with JST/MoTI on
how the ESMF will work going forward
Impact
Assessment
and Mitigation
For the soil protected areas, mitigation is
given as “Limiting excavation in necessary
areas” Define the term “Necessary
The term necessary is based on the engineering
specifications of each infrastructure project. This is
because land/excavation requirements and construction
methods vary by project type and through optimizations
in the latter the former can be limited. Thus, it is the
principle of limiting excavation based on those
engineering specifications that is being suggested.
How are the unseen loses of the social
cultural loses captured in the SEA
This was addressed in Section 10.6.1 (Loss of Cultural
Heritage) of the Draft SEA Report
Land use Land use plans are currently not in place, this
should be covered in the Report
Section 6.9.1 (Land Use) of the Draft SEA Report already
addressed this issue.
Section 4.8.2 (Social Baseline Gaps and Uncertainties) of
the Draft SEA Report also identified lack of land use
shapefiles/plans and the resulting use of shapefiles
(data) from KWS.
ENVIRONMENTAL RESOURCES MANAGEMENT JST/MOTI
XX
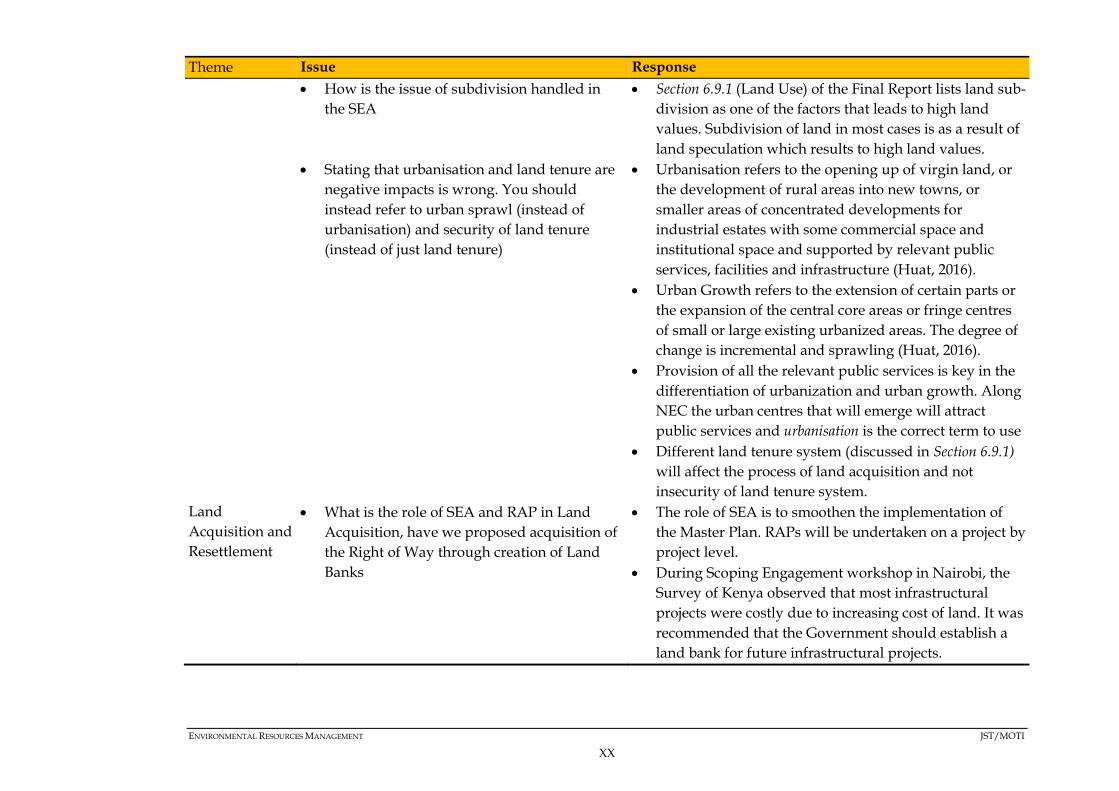
Theme Issue Response
How is the issue of subdivision handled in
the SEA
Section 6.9.1 (Land Use) of the Final Report lists land sub-
division as one of the factors that leads to high land
values. Subdivision of land in most cases is as a result of
land speculation which results to high land values.
Stating that urbanisation and land tenure are
negative impacts is wrong. You should
instead refer to urban sprawl (instead of
urbanisation) and security of land tenure
(instead of just land tenure)
Urbanisation refers to the opening up of virgin land, or
the development of rural areas into new towns, or
smaller areas of concentrated developments for
industrial estates with some commercial space and
institutional space and supported by relevant public
services, facilities and infrastructure (Huat, 2016).
Urban Growth refers to the extension of certain parts or
the expansion of the central core areas or fringe centres
of small or large existing urbanized areas. The degree of
change is incremental and sprawling (Huat, 2016).
Provision of all the relevant public services is key in the
differentiation of urbanization and urban growth. Along
NEC the urban centres that will emerge will attract
public services and urbanisation is the correct term to use
Different land tenure system (discussed in Section 6.9.1)
will affect the process of land acquisition and not
insecurity of land tenure system.
Land
Acquisition and
Resettlement
What is the role of SEA and RAP in Land
Acquisition, have we proposed acquisition of
the Right of Way through creation of Land
Banks
The role of SEA is to smoothen the implementation of
the Master Plan. RAPs will be undertaken on a project by
project level.
During Scoping Engagement workshop in Nairobi, the
Survey of Kenya observed that most infrastructural
projects were costly due to increasing cost of land. It was
recommended that the Government should establish a
land bank for future infrastructural projects.

ENVIRONMENTAL RESOURCES MANAGEMENT JST/MOTI
XXI
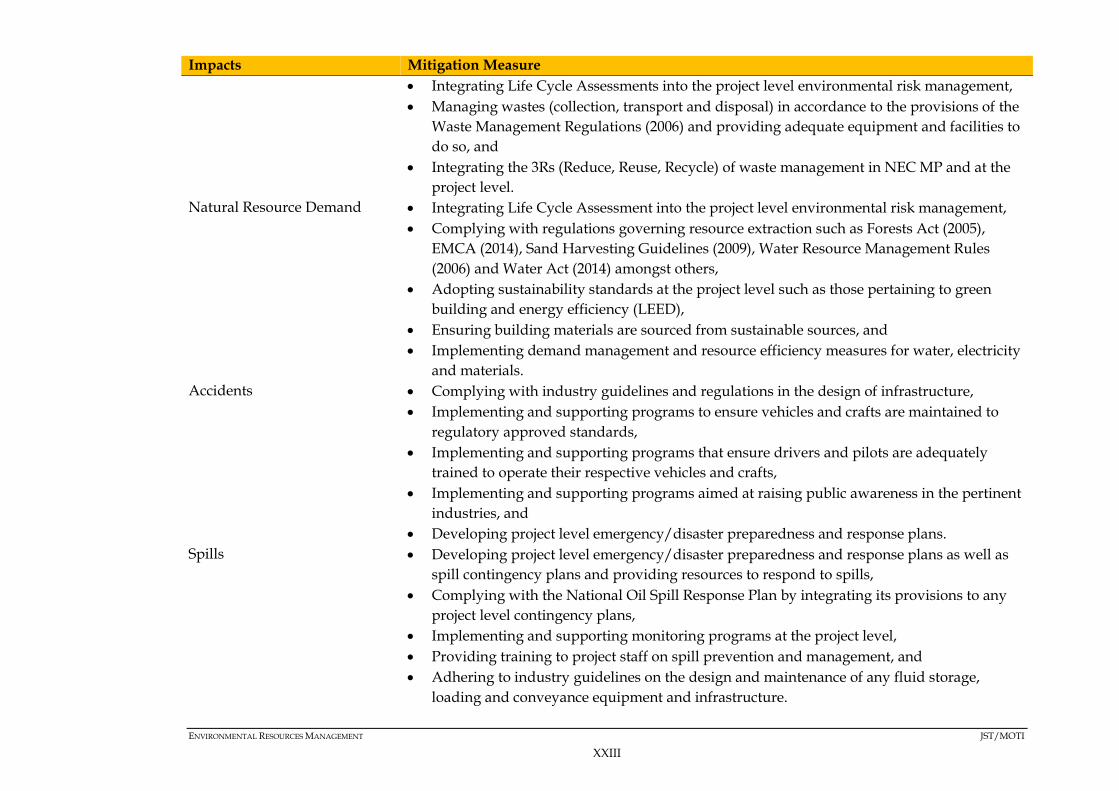
Key Impacts and Mitigation Measures Table 0.5 below provides a summary of the key environmental and
social impacts as well as mitigation measures identified during the SEA
Study.

ENVIRONMENTAL RESOURCES MANAGEMENT JST/MOTI
XXII
Table 0.5 Key Environmental and Social Impacts and Mitigation Measures
Impacts Mitigation Measure
Environmental
Habitat Alteration and
Biodiversity Impacts
Avoiding all high value biological constraints
Aligning new infrastructure with existing RoWs or defined corridors,
Limiting the size of construction RoWs where possible, and
Complying with existing land use and PA management plans
Air Emissions Complying with the Air Quality Regulations (2014) and emission standards as provided in
KS 1515,
Using cleaner energy sources and promoting their use,
Limiting land conversion to only necessary areas, and
Managing wastes according to regulations in addition to employing the 3Rs to ensure they
are managed sustainably.
Landscape Modification Locating infrastructure with existing land use plans,
Complying with ecosystem management plans of protected areas,
Limiting the size of construction RoWs, and
Avoiding protected areas and settlements
Soil Limiting excavations to only necessary areas,
Implementing soil conservation strategies in areas with high Soil Erosion Potential,
Complying with waste management regulations,
Complying with regulations and guidelines on soil conservation such as those provided by
land use plan, ecosystem management plans and those gazetted by the Agriculture and
Food Authority, and
Implementing run-off and water management measures
Hydrology and Hydrogeology Avoiding wetlands, water towers, groundwater conservation areas and flood plains,
Implementing water ingress management measures as appropriate, and
Controlling run-off from infrastructure and implementing sustainable drainage systems
(SUDS) which mimic or allow natural percolation of water.
Pollution Developing complementary waste management facilities including a sanitary landfill and a
hazardous waste disposal facility,
ENVIRONMENTAL RESOURCES MANAGEMENT JST/MOTI
XXIII
Impacts Mitigation Measure
Integrating Life Cycle Assessments into the project level environmental risk management,
Managing wastes (collection, transport and disposal) in accordance to the provisions of the
Waste Management Regulations (2006) and providing adequate equipment and facilities to
do so, and
Integrating the 3Rs (Reduce, Reuse, Recycle) of waste management in NEC MP and at the
project level.
Natural Resource Demand Integrating Life Cycle Assessment into the project level environmental risk management,
Complying with regulations governing resource extraction such as Forests Act (2005),
EMCA (2014), Sand Harvesting Guidelines (2009), Water Resource Management Rules
(2006) and Water Act (2014) amongst others,
Adopting sustainability standards at the project level such as those pertaining to green
building and energy efficiency (LEED),
Ensuring building materials are sourced from sustainable sources, and
Implementing demand management and resource efficiency measures for water, electricity
and materials.
Accidents Complying with industry guidelines and regulations in the design of infrastructure,
Implementing and supporting programs to ensure vehicles and crafts are maintained to
regulatory approved standards,
Implementing and supporting programs that ensure drivers and pilots are adequately
trained to operate their respective vehicles and crafts,
Implementing and supporting programs aimed at raising public awareness in the pertinent
industries, and
Developing project level emergency/disaster preparedness and response plans.
Spills Developing project level emergency/disaster preparedness and response plans as well as
spill contingency plans and providing resources to respond to spills,
Complying with the National Oil Spill Response Plan by integrating its provisions to any
project level contingency plans,
Implementing and supporting monitoring programs at the project level,
Providing training to project staff on spill prevention and management, and
Adhering to industry guidelines on the design and maintenance of any fluid storage,
loading and conveyance equipment and infrastructure.

ENVIRONMENTAL RESOURCES MANAGEMENT JST/MOTI
XXIV
Impacts Mitigation Measure
Natural Hazard Avoiding construction in flood plains in line with industry guidelines,
Integrating considerations for seismicity in the engineering design of infrastructure in
seismically active areas,
Complying with industry guidelines for the design and maintenance of dams such as those
published by the International Commission for Large Dams (ICOLD),
Avoidance of fault zones,
Incorporating landslide prevention measures for any construction in landslide prone areas,
Implementing and supporting disaster/emergency preparedness and response plans and
programs at the project level,
Implementing and supporting programs aimed at raising personnel and public awareness
on potential hazards, and
Integrating the provisions of the National Disaster Response Plan into project level
disaster/emergency preparedness and response plans, and coordinating with the pertinent
authorities.
Socio-Economic
Loss of Cultural Heritage The presence of cultural heritage assets would need to be confirmed in detailed studies
associated with each potential project; this could influence the design and location of
infrastructure, commercial enterprises and industrial facilities.
Incorporation of heritage sites into tourism master plans as a way of preserving such sites
Projects associated with the construction and operation of infrastructure should be subject
to Environmental and Social Impact Assessment (ESIA) commensurate with the scale of the
project and impacts which includes consideration of cultural heritage and the development
of appropriate mitigation and management plans.
In terms of locally important cultural heritage sites, any loss or alteration to such sites
should be consulted on, and agreed, with the local communities and the custodians of the
site. If necessary, appropriate rituals should be undertaken to move the cultural asset, or to
otherwise expiate disturbance or loss of the site.
A framework “chance finds procedure” should be developed to support the Master Plan
which involves and references all relevant ministries, other agencies and major cultural
heritage stakeholders in the country. The framework procedure should be deployed within
the construction and management planning for all developments implemented under the

ENVIRONMENTAL RESOURCES MANAGEMENT JST/MOTI
XXV
Impacts Mitigation Measure
auspices of the Plan.
Livelihood Institutional strengthening and capacity building for agencies across the NEC who are
responsible for promoting and coordinating commercial developments to ensure that social
risks are adequately understood and addressed through mitigation
Rural Urban Migration Infrastructure projects should be subject to Environmental and Social Impact Assessment
(ESIA) undertaken in line with international standards such as those of the World Bank or
the International Finance Corporation (IFC). The scope of the ESIA should always include
consideration of rural – urban migration.
Urban development plans / CIDP should also cater for rural-urban migration.
Public Health Infrastructure projects should be subject to Environmental and Social Impact Assessment
(ESIA) undertaken in line with international standards such as those of the World Bank or
the International Finance Corporation (IFC). The scope of the ESIA should always include
consideration of health related impacts. For large Projects this may require that
appropriately qualified international experts are appointed to address impacts on health.
The development and implementation of HIV/AIDS/malaria policies and information
documents for all workers directly related NEC projects. The information document will
address factual health issues as well as behaviour change issues around the transmission
and infection of HIV/AIDS as well as malaria.
All projects should have a Worker Code of Conduct for all project personnel that include
guidelines on worker-worker interactions, worker-community interactions and
development of personal relationships with members of the local communities. As part of
the Worker Code of Conduct, all project personnel should be prohibited from engaging in
illegal activities including the use of commercial sex workers and transactional sex.
Anyone caught engaging in illegal activities will be subject to disciplinary proceedings. If
workers are found to be in contravention of the Code of Conduct, which they will be
required to sign at the commencement of their contract, they will face disciplinary
procedures that could result in dismissal.
Working in conjunction with relevant partners (eg health authorities, NGOs, development
agencies), information, education and communication campaigns around diseases and
health practices should be developed as part of the Master Plan implementation
Insecurity The successful implementation of the NEC Master Plan Strategies will require the active

ENVIRONMENTAL RESOURCES MANAGEMENT JST/MOTI
XXVI
Impacts Mitigation Measure
participation of the Ministry of Interior and Coordination of National Government.
Land Acquisition and
resettlement
Formulation and implementation of a land title management project to establish a land title
database with cadastral map information, and
Arrangement of technical assistance for a land acquisition and resettlement program
Any physical and/or economic resettlement of communities should be subject to the
development of Resettlement Action Plans/ Livelihood Restoration Plans which should be
prepared in line with Kenyan regulations and international best practice as defined by the
World Bank or International Finance Corporation.
Institutional strengthening and capacity building for agencies across the NEC who are
responsible for promoting and coordinating commercial developments to ensure that social
risks are adequately understood and addressed through mitigation
The budgeting process for any of the NEC initiatives must also include a budget for
resettlement and compensation, as these costs can be quite significant
Land use and settlement
pattern
Institutions responsible for land use plans should ensure that they contain measures
relating to infrastructure provision that are robust and fit for purpose, with a focus on the
poorest and most vulnerable communities
Avoidance of conservation areas, national parks, wetlands, protected areas
Urbanisation Any physical and/or economic resettlement of communities should be subject to the
development of Resettlement Action Plans/ Livelihood Restoration Plans which should be
prepared in line with Kenyan regulations and international best practice as defined by the
World Bank or International Finance Corporation.
Institutional strengthening and capacity building for agencies across the NEC who are
responsible for promoting and coordinating commercial developments to ensure that social
risks are adequately understood and addressed through mitigation
Regional and/or County Integrated Development Plans (CIDP) to plan for such
urbanisation
Land tenure Formulation and implementation of a land title management project to establish a land title
database with cadastral map information.
ENVIRONMENTAL RESOURCES MANAGEMENT JST/MOTI
XXVII
Recommendations
Recommended Alternative
The Multi-Core with Regional Industrial Development Type alternative
aims at balanced growth and efficient logistics in the NEC region by
promoting urban functions of 18 Secondary Cites, including 6
Secondary cum Regional Production Centres (see Figure 0.3).
This alternative promotes:
decentralizing urban functions to Secondary Cities,
the urbanization of Secondary Cities and the concentration of
population on them from surrounding regions,
regional production centres, as demand for commercial and
services in urban area (which results from surrounding regional
area) will promote the demand of Secondary Cities.
These Secondary Cities will serve as regional urban centres supplying
urban services and logistics hub connecting Regional Production
Centres and Primary Cities as consumption areas. In this alternative,
the involvement of local Government is also essential.
It is important to note however, this structure plan requires more public
engagement and management capacity for urban management and
development control to avoid unnecessary development.
This is the preferred alternative because it is consistent with Vision
2030, the MoTI Strategic Plan and the goals of the Master Plan, which
are to improve logistics for the NEC as well as provide an integrated
regional development strategy consistent with sub-regional
development plans and national development plans.
ENVIRONMENTAL RESOURCES MANAGEMENT JST/MOTI
XXVIII
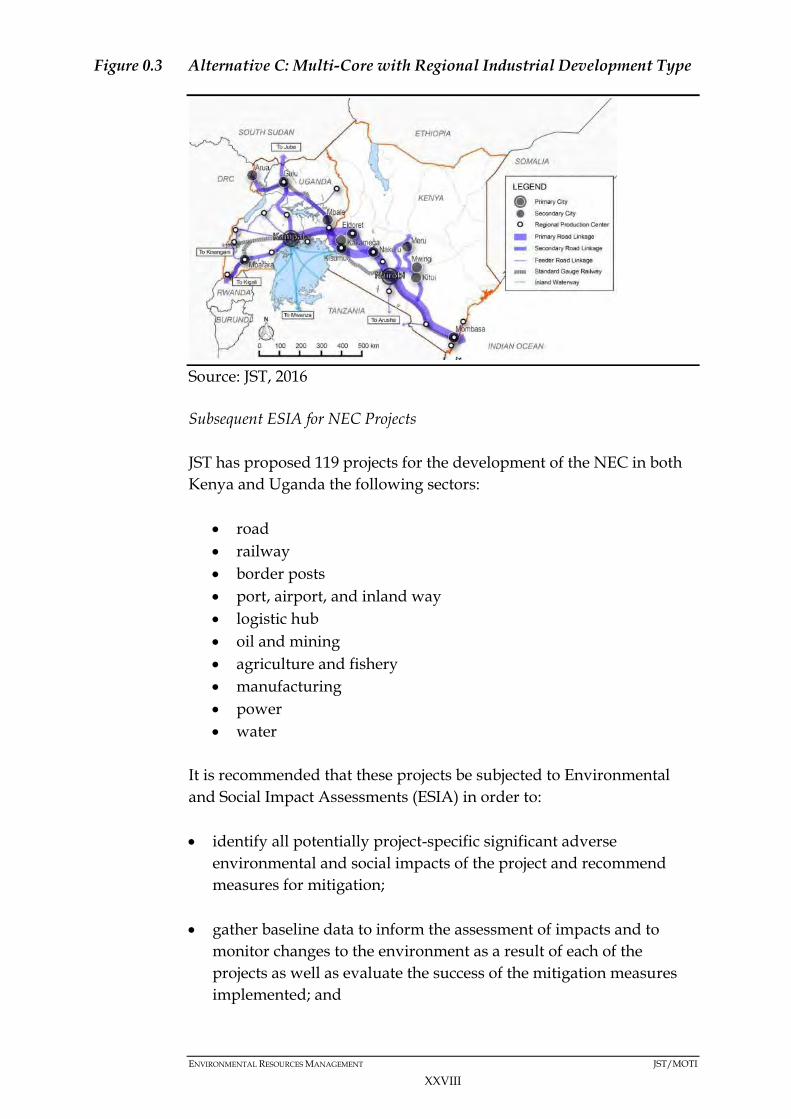
Figure 0.3 Alternative C: Multi-Core with Regional Industrial Development Type
Source: JST, 2016
Subsequent ESIA for NEC Projects
JST has proposed 119 projects for the development of the NEC in both
Kenya and Uganda the following sectors:
road
railway
border posts
port, airport, and inland way
logistic hub
oil and mining
agriculture and fishery
manufacturing
power
water
It is recommended that these projects be subjected to Environmental
and Social Impact Assessments (ESIA) in order to:
identify all potentially project-specific significant adverse
environmental and social impacts of the project and recommend
measures for mitigation;
gather baseline data to inform the assessment of impacts and to
monitor changes to the environment as a result of each of the
projects as well as evaluate the success of the mitigation measures
implemented; and

ENVIRONMENTAL RESOURCES MANAGEMENT JST/MOTI
XXIX
recommend measures to be used to avoid or reduce the anticipated
negative impacts and enhance the positive impacts.
For each project the ESIA should be carried out in line with Kenyan
regulations as well as international best practice as defined by the
World Bank or International Finance Corporation (IFC).
The ESIA reports should also consider environmental impacts and also
include the following socio-economic impacts, where possible:
cultural heritage,
loss of livelihoods,
health, and
rural – urban migration
It is also recommended that any physical and/or economic resettlement
of communities should be subject to the development of Resettlement
Action Plans/ Livelihood Restoration Plans which should be prepared
in line with Kenyan regulations and international best practice as
defined by the World Bank or International Finance Corporation

CONTENTS
NON-TECHNICAL SUMMARY I
1 INTRODUCTION 1-1
1.1 OVERVIEW 1-1
1.2 THE NORTHERN ECONOMIC CORRIDOR 1-1
1.3 OBJECTIVES OF THE MASTER PLAN STUDY 1-2
1.4 PPP OWNER 1-2
1.5 DECISION TO UNDERTAKE THE SEA 1-2
1.6 OBJECTIVES OF THE SEA 1-3
1.7 MASTER PLAN STUDY TEAM 1-4
1.8 SEA CONSULTANTS 1-5
1.9 REPORT STRUCTURE 1-7
2 DESCRIPTION OF THE NEC 2-1
2.1 BOTTLENECKS TO EFFICIENT CARGO TRANSPORTATION 2-1
2.1.1 Road Congestion 2-1
2.1.2 Mombasa Port Operations 2-1
2.1.3 Cross Border Delays 2-1
2.2 OBJECTIVES OF THE NEC MASTER PLAN 2-2
2.3 TARGET AREAS 2-2
2.4 REGIONAL STRUCTURE PLAN 2-4
2.5 SECTOR DEVELOPMENT IN KENYA AND UGANDA 2-4
2.5.1 Industrial Development 2-4
2.5.2 Agriculture Development 2-5
2.5.3 Mining and Petroleum Sector Development 2-5
2.5.4 Manufacturing Sector Development 2-5
2.5.5 Tourism Sector Development 2-6
2.6 KEY GROWTH DRIVERS 2-7
2.7 TRANSPORT AND LOGISTICS INFRASTRUCTURE DEVELOPMENT 2-9
2.7.1 Overview 2-9
2.7.2 Current and Future Gaps 2-9
2.7.3 Future Total Freight Forecasting 2-12
2.7.4 Future Traffic Forecasting 2-12
2.8 DEVELOPMENT SCENARIO FOR TRANSPORT AND LOGISTICS INFRASTRUCTURE
DEVELOPMENT 2-13
2.8.1 Scenario Modelling 2-13
2.8.2 Transport Network Improvements 2-14
2.9 DEVELOPMENT VISION AND STRATEGIES 2-15
2.9.1 Regional Strategy: Linking Production Centres and Corridors 2-16
2.9.2 Industrial Strategy: Effective and Efficient Logistical System for Industry
and Trade 2-17
2.9.3 Major Suggested Projects for the Industrial Strategy 2-19
2.10 TRANSPORT STRATEGY: EFFICIENT AND INTEGRATED MULTI-MODAL
TRANSPORTATION SYSTEM 2-23
2.10.1 Modal Shift from truck to railway and pipeline 2-23
2.10.2 Reduction of Bottlenecks of freight traffic and logistics 2-23
2.10.3 Enhancement of existing transport infrastructure 2-24
2.10.4 Major Suggested Projects for Transport Strategies 2-25
2.11 FINANCIAL STRATEGY 2-27
2.11.1 Financial Capacity in Kenya and Uganda 2-27
2.11.2 Diversifying Financial Sources 2-28
2.11.3 Expanding the revenue sources of the governments for cost recovery 2-28
2.12 ORGANISATIONAL AND POLICY STRATEGY 2-29
2.12.1 Regional Coordination for logistics improvement 2-29
2.12.2 Proposed Organisational Framework 2-29
2.13 OVERALL IMPLEMENTATION STRATEGY 2-29
3 LEGAL AND INSTITUTIONAL FRAMEWORK 3-1
3.1 GENERAL OVERVIEW 3-1
3.2 PLANS, POLICIES AND PROGRAMS (PPPS) 3-1
3.3 LEGAL FRAMEWORK 3-11
3.3.1 East African Regional Legal Framework 3-11
3.3.2 National Legal Framework 3-15
3.4 INSTITUTIONAL FRAMEWORK 3-22
3.4.1 National Institutions 3-22
3.4.2 Regional Institutions 3-28
3.4.3 International Institutions 3-30
3.5 INTERNATIONAL REGULATIONS 3-30
3.5.1 The Japan International Co-operation Agency (JICA) Guidelines for
Environmental and Social Considerations, 2010 3-30
3.5.2 The Organisation for Economic Co-operation and Development (OECD)
Guidelines and Reference Series for Applying Strategic Environmental
Assessment, 2006 3-30
3.6 COMPARATIVE ANALYSIS OF THE MASTER PLAN WITH OTHER PPPS 3-31
3.6.1 Comparative Analysis of the Master Plan with other Polices 3-31
3.6.2 Comparative Analysis of the Master Plan with other Plans 3-35
3.6.3 Comparative Analysis of the Master Plan with other Programmes 3-54
4 METHODOLOGY AND APPROACH 4-1
4.1 SEA STUDY AREA 4-1
4.2 SCREENING 4-3
4.3 SCOPING 4-3
4.4 BASELINE DATA COLLECTION AND CONSTRAINTS MAPPING 4-4
4.4.1 Baseline Data Collection 4-4
4.4.2 Document Review 4-5
4.4.3 Stakeholder Consultation 4-5
4.4.4 Identifying Constraints and Opportunities 4-6
4.5 IMPACT ASSESSMENT AND MITIGATION 4-7
4.5.1 Assessing the Significance of Impacts 4-7
4.5.2 Determining the Significance of Cumulative Effects 4-11
4.5.3 Impact Mitigation 4-12
4.6 APPRAISING STRATEGIC ALTERNATIVES 4-12
4.7 REPORTING 4-16
4.7.1 Draft SEA Report 4-16
4.7.2 Validation Workshop 4-16

4.7.3 Final SEA Report 4-16
4.8 GAPS, UNCERTAINTIES AND LIMITATIONS TO THE SEA STUDY 4-16
4.8.1 Environmental Baseline Gaps and Uncertainties 4-16
4.8.2 Social Baseline Gaps and Uncertainties 4-17
4.8.3 Limitations 4-18
5 ENVIRONMENTAL BASELINE 5-1
5.1 INTRODUCTION AND OVERVIEW 5-1
5.1.1 Master Plan Components and Layout 5-1
5.1.2 Methodology 5-2
5.1.3 Data Sources 5-3
5.2 GENERAL SETTING 5-4
5.3 PHYSICAL BASELINE 5-6
5.3.1 Climate and Air Quality 5-6
5.3.2 Topography 5-17
5.3.3 Geological Characterisations 5-20
5.3.4 Hydrology and Hydrogeology 5-26
5.3.5 Oceanography 5-37
5.3.6 Natural Hazards 5-42
5.4 BIOLOGICAL BASELINE 5-54
5.4.1 Ecosystems and Agro-ecological Zones 5-55
5.4.2 Biodiversity 5-60
5.4.3 Land Cover 5-81
5.4.4 Sensitive and Designated Features 5-84
5.4.5 Anthropogenic Hazards 5-144
6 SOCIO-ECONOMIC BASELINE 6-1
6.1 INTRODUCTION 6-1
6.2 PEOPLE AND CULTURE 6-2
6.3 DEMOGRAPHIC PROFILE 6-3
6.3.1 Population 6-3
6.3.2 Population Density 6-5
6.3.3 Rural to Urban Migration 6-7
6.4 EDUCATION PROFILE 6-8
6.5 HEALTH PROFILE 6-11
6.6 SOCIAL INFRASTRUCTURE 6-13
6.6.1 Water and Sanitation 6-13
6.6.2 Energy 6-15
6.6.3 Housing 6-15
6.7 TRANSPORTATION INFRASTRUCTURE 6-16
6.7.1 Roads 6-16
6.7.2 Railway 6-17
6.7.3 Pipeline 6-20
6.7.4 Airports 6-21
6.7.5 Port Facilities 6-23
6.7.6 Inland Waterways 6-24
6.8 URBANISATION 6-25
6.9 LAND ISSUES 6-27
6.9.1 Land Use 6-27

6.9.2 Land Tenure 6-28
6.9.3 Land Values along the NEC 6-29
6.9.4 Settlement Patterns along the NEC 6-32
6.10 ECONOMIC ACTIVITIES 6-35
6.10.1 Agriculture 6-35
6.10.2 Livestock Production 6-37
6.10.3 Mining and Quarrying 6-37
6.10.4 Fishing 6-38
6.10.5 Industries/Manufacturing 6-40
6.10.6 Tourism 6-42
6.10.7 Employment 6-44
6.10.8 Unemployment 6-45
6.10.9 Gini Coefficient 6-45
6.10.10 Regional Integration and Preferential Trade Arrangements 6-46
6.10.11 Challenges to Kenya’s Economy 6-47
6.11 POLITICAL ENVIRONMENT 6-50
6.12 HERITAGE SITES AND MONUMENTS 6-51
6.12.1 Archaeological Sites 6-51
6.12.2 Historical Sites and Monuments 6-53
7 ALTERNATIVE POLICY, OPTIONS AND STRATEGIES 7-1
7.1 ALTERNATIVES 7-1
7.1.1 Alternative A: Super Double Core Type 7-1
7.1.2 Alternative B: Double Core with Regional Industrial Promotion Type 7-2
7.1.3 Alternative C: Multi-Core with Regional Industrial Development Type 7-3
7.1.4 Alternative D: No Go Alternative 7-5
7.2 ALTERNATIVE SCENARIO ANALYSIS 7-5
7.2.1 Overview 7-5
7.2.2 Economic Framework for the NEC and East Africa Community 7-6
7.2.3 Scenario Analysis 7-7
8 STAKEHOLDER ENGAGEMENT 8-1
8.1 OVERVIEW 8-1
8.2 OBJECTIVES OF STAKEHOLDER ENGAGEMENT 8-1
8.3 STAKEHOLDER IDENTIFICATION AND MAPPING 8-2
8.3.1 Stakeholder Identification 8-2
8.3.2 Stakeholder Mapping 8-5
8.4 STAKEHOLDER ENGAGEMENT 8-7
8.4.1 Stakeholder Meetings 8-7
8.4.2 Baseline Phase Engagement 8-12
8.4.3 Website 8-18
8.5 OUTCOMES OF STAKEHOLDER ENGAGEMENT DURING THE SEA PROCESS 8-18
8.5.1 Area Specific Concerns 8-18
8.5.2 Cross-Cutting Issues 8-20
8.6 SEA VALIDATION 8-24
8.6.1 Submission of Draft SEA Report and Advertisements in the Media 8-24
8.6.2 Validation Workshop 8-24
9 KEY ENVIRONMENTAL IMPACTS AND MITIGATION STRATEGIES 9-1
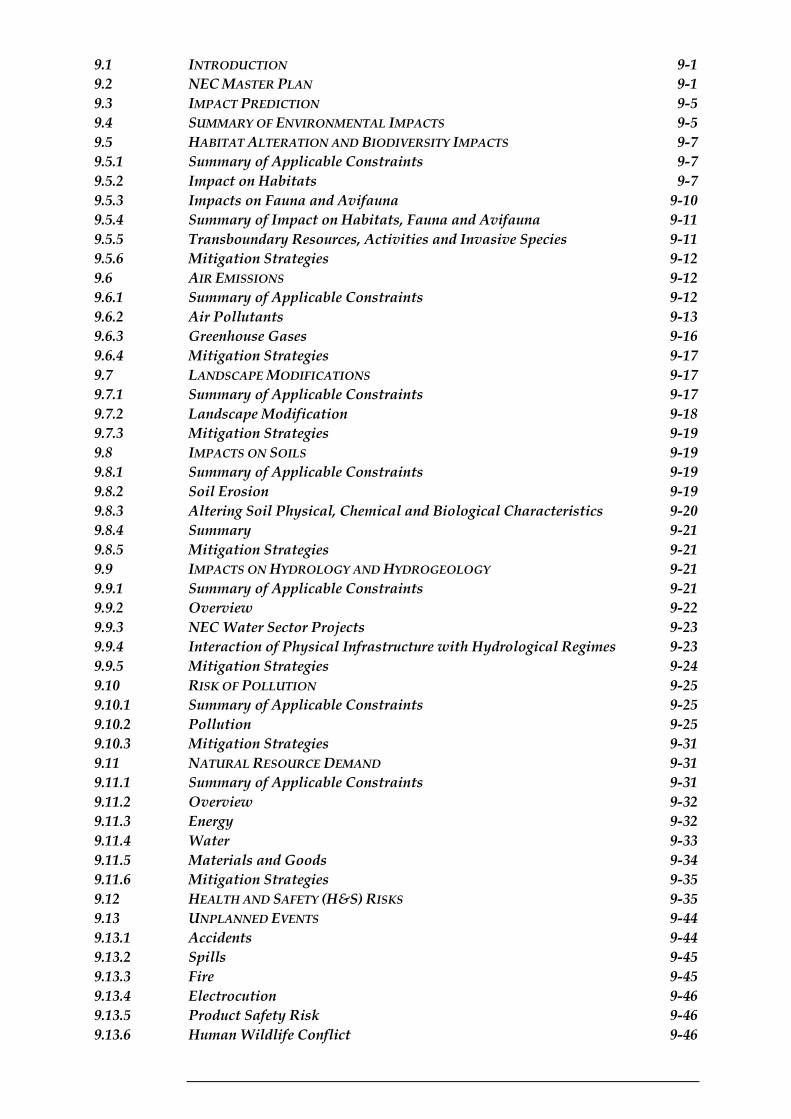
9.1 INTRODUCTION 9-1
9.2 NEC MASTER PLAN 9-1
9.3 IMPACT PREDICTION 9-5
9.4 SUMMARY OF ENVIRONMENTAL IMPACTS 9-5
9.5 HABITAT ALTERATION AND BIODIVERSITY IMPACTS 9-7
9.5.1 Summary of Applicable Constraints 9-7
9.5.2 Impact on Habitats 9-7
9.5.3 Impacts on Fauna and Avifauna 9-10
9.5.4 Summary of Impact on Habitats, Fauna and Avifauna 9-11
9.5.5 Transboundary Resources, Activities and Invasive Species 9-11
9.5.6 Mitigation Strategies 9-12
9.6 AIR EMISSIONS 9-12
9.6.1 Summary of Applicable Constraints 9-12
9.6.2 Air Pollutants 9-13
9.6.3 Greenhouse Gases 9-16
9.6.4 Mitigation Strategies 9-17
9.7 LANDSCAPE MODIFICATIONS 9-17
9.7.1 Summary of Applicable Constraints 9-17
9.7.2 Landscape Modification 9-18
9.7.3 Mitigation Strategies 9-19
9.8 IMPACTS ON SOILS 9-19
9.8.1 Summary of Applicable Constraints 9-19
9.8.2 Soil Erosion 9-19
9.8.3 Altering Soil Physical, Chemical and Biological Characteristics 9-20
9.8.4 Summary 9-21
9.8.5 Mitigation Strategies 9-21
9.9 IMPACTS ON HYDROLOGY AND HYDROGEOLOGY 9-21
9.9.1 Summary of Applicable Constraints 9-21
9.9.2 Overview 9-22
9.9.3 NEC Water Sector Projects 9-23
9.9.4 Interaction of Physical Infrastructure with Hydrological Regimes 9-23
9.9.5 Mitigation Strategies 9-24
9.10 RISK OF POLLUTION 9-25
9.10.1 Summary of Applicable Constraints 9-25
9.10.2 Pollution 9-25
9.10.3 Mitigation Strategies 9-31
9.11 NATURAL RESOURCE DEMAND 9-31
9.11.1 Summary of Applicable Constraints 9-31
9.11.2 Overview 9-32
9.11.3 Energy 9-32
9.11.4 Water 9-33
9.11.5 Materials and Goods 9-34
9.11.6 Mitigation Strategies 9-35
9.12 HEALTH AND SAFETY (H&S) RISKS 9-35
9.13 UNPLANNED EVENTS 9-44
9.13.1 Accidents 9-44
9.13.2 Spills 9-45
9.13.3 Fire 9-45
9.13.4 Electrocution 9-46
9.13.5 Product Safety Risk 9-46
9.13.6 Human Wildlife Conflict 9-46
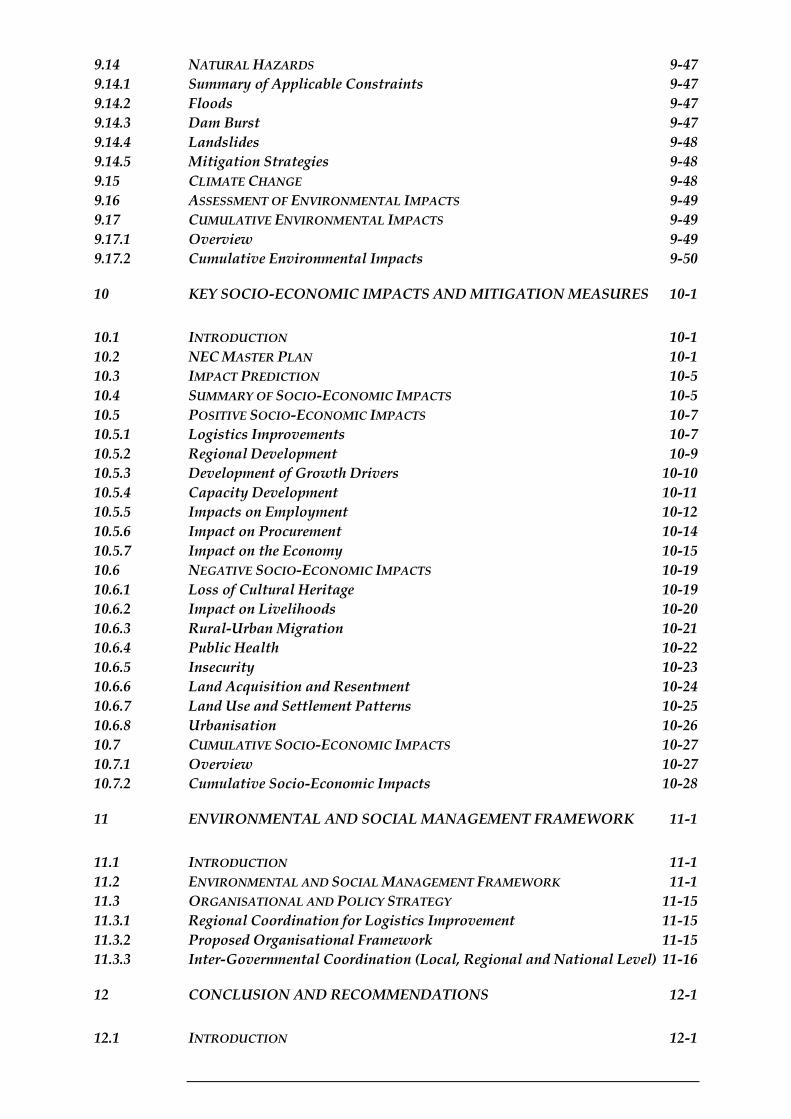
9.14 NATURAL HAZARDS 9-47
9.14.1 Summary of Applicable Constraints 9-47
9.14.2 Floods 9-47
9.14.3 Dam Burst 9-47
9.14.4 Landslides 9-48
9.14.5 Mitigation Strategies 9-48
9.15 CLIMATE CHANGE 9-48
9.16 ASSESSMENT OF ENVIRONMENTAL IMPACTS 9-49
9.17 CUMULATIVE ENVIRONMENTAL IMPACTS 9-49
9.17.1 Overview 9-49
9.17.2 Cumulative Environmental Impacts 9-50
10 KEY SOCIO-ECONOMIC IMPACTS AND MITIGATION MEASURES 10-1
10.1 INTRODUCTION 10-1
10.2 NEC MASTER PLAN 10-1
10.3 IMPACT PREDICTION 10-5
10.4 SUMMARY OF SOCIO-ECONOMIC IMPACTS 10-5
10.5 POSITIVE SOCIO-ECONOMIC IMPACTS 10-7
10.5.1 Logistics Improvements 10-7
10.5.2 Regional Development 10-9
10.5.3 Development of Growth Drivers 10-10
10.5.4 Capacity Development 10-11
10.5.5 Impacts on Employment 10-12
10.5.6 Impact on Procurement 10-14
10.5.7 Impact on the Economy 10-15
10.6 NEGATIVE SOCIO-ECONOMIC IMPACTS 10-19
10.6.1 Loss of Cultural Heritage 10-19
10.6.2 Impact on Livelihoods 10-20
10.6.3 Rural-Urban Migration 10-21
10.6.4 Public Health 10-22
10.6.5 Insecurity 10-23
10.6.6 Land Acquisition and Resentment 10-24
10.6.7 Land Use and Settlement Patterns 10-25
10.6.8 Urbanisation 10-26
10.7 CUMULATIVE SOCIO-ECONOMIC IMPACTS 10-27
10.7.1 Overview 10-27
10.7.2 Cumulative Socio-Economic Impacts 10-28
11 ENVIRONMENTAL AND SOCIAL MANAGEMENT FRAMEWORK 11-1
11.1 INTRODUCTION 11-1
11.2 ENVIRONMENTAL AND SOCIAL MANAGEMENT FRAMEWORK 11-1
11.3 ORGANISATIONAL AND POLICY STRATEGY 11-15
11.3.1 Regional Coordination for Logistics Improvement 11-15
11.3.2 Proposed Organisational Framework 11-15
11.3.3 Inter-Governmental Coordination (Local, Regional and National Level) 11-16
12 CONCLUSION AND RECOMMENDATIONS 12-1
12.1 INTRODUCTION 12-1
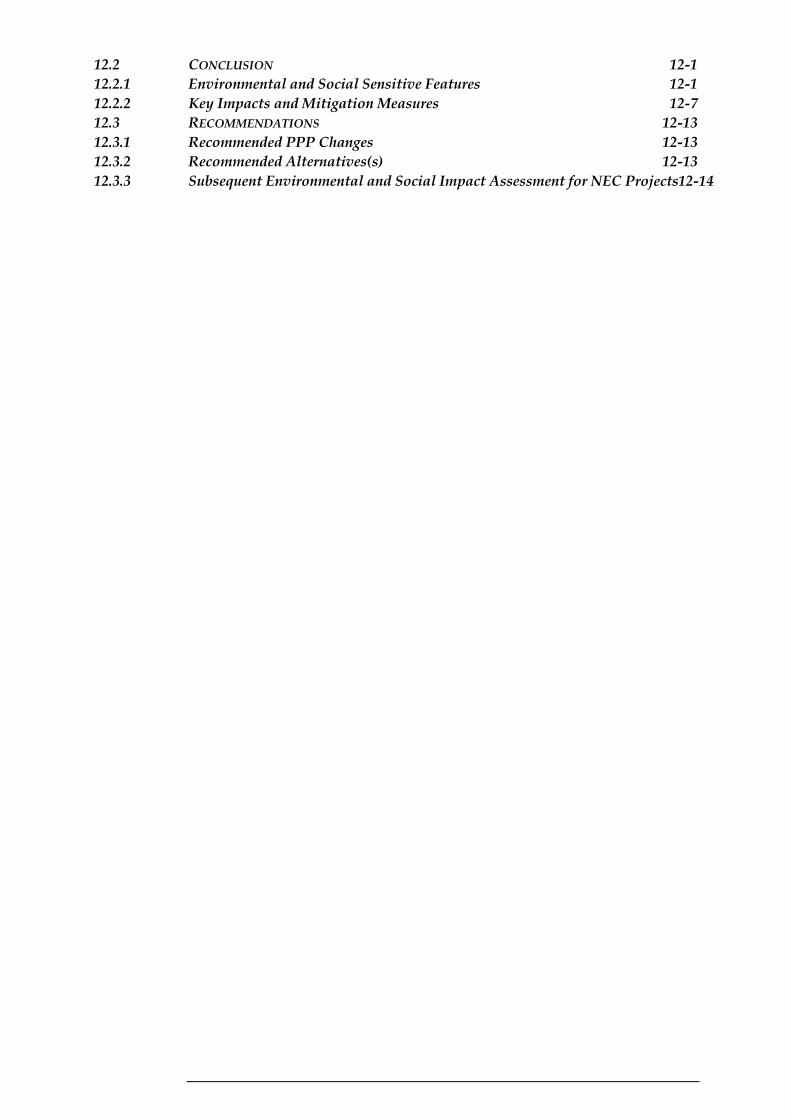
12.2 CONCLUSION 12-1
12.2.1 Environmental and Social Sensitive Features 12-1
12.2.2 Key Impacts and Mitigation Measures 12-7
12.3 RECOMMENDATIONS 12-13
12.3.1 Recommended PPP Changes 12-13
12.3.2 Recommended Alternatives(s) 12-13
12.3.3 Subsequent Environmental and Social Impact Assessment for NEC Projects12-14
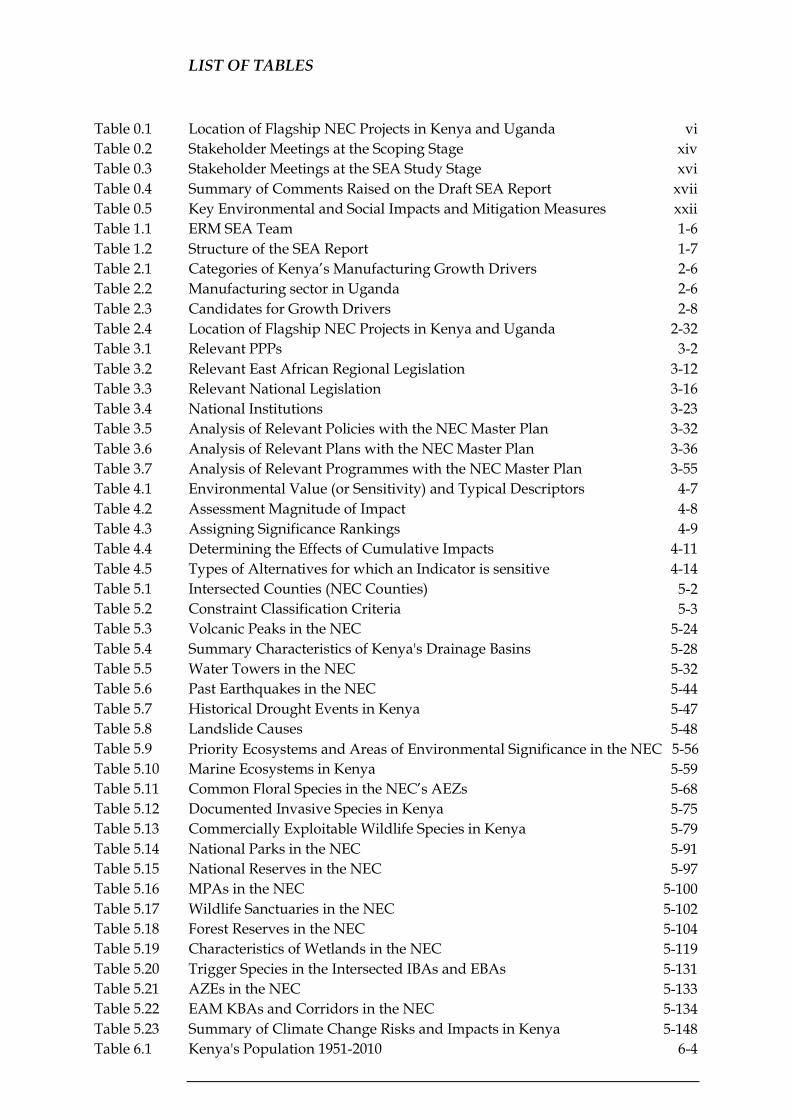
LIST OF TABLES
Table 0.1 Location of Flagship NEC Projects in Kenya and Uganda vi
Table 0.2 Stakeholder Meetings at the Scoping Stage xiv
Table 0.3 Stakeholder Meetings at the SEA Study Stage xvi
Table 0.4 Summary of Comments Raised on the Draft SEA Report xvii
Table 0.5 Key Environmental and Social Impacts and Mitigation Measures xxii
Table 1.1 ERM SEA Team 1-6
Table 1.2 Structure of the SEA Report 1-7
Table 2.1 Categories of Kenya’s Manufacturing Growth Drivers 2-6
Table 2.2 Manufacturing sector in Uganda 2-6
Table 2.3 Candidates for Growth Drivers 2-8
Table 2.4 Location of Flagship NEC Projects in Kenya and Uganda 2-32
Table 3.1 Relevant PPPs 3-2
Table 3.2 Relevant East African Regional Legislation 3-12
Table 3.3 Relevant National Legislation 3-16
Table 3.4 National Institutions 3-23
Table 3.5 Analysis of Relevant Policies with the NEC Master Plan 3-32
Table 3.6 Analysis of Relevant Plans with the NEC Master Plan 3-36
Table 3.7 Analysis of Relevant Programmes with the NEC Master Plan 3-55
Table 4.1 Environmental Value (or Sensitivity) and Typical Descriptors 4-7
Table 4.2 Assessment Magnitude of Impact 4-8
Table 4.3 Assigning Significance Rankings 4-9
Table 4.4 Determining the Effects of Cumulative Impacts 4-11
Table 4.5 Types of Alternatives for which an Indicator is sensitive 4-14
Table 5.1 Intersected Counties (NEC Counties) 5-2
Table 5.2 Constraint Classification Criteria 5-3
Table 5.3 Volcanic Peaks in the NEC 5-24
Table 5.4 Summary Characteristics of Kenya's Drainage Basins 5-28
Table 5.5 Water Towers in the NEC 5-32
Table 5.6 Past Earthquakes in the NEC 5-44
Table 5.7 Historical Drought Events in Kenya 5-47
Table 5.8 Landslide Causes 5-48
Table 5.9 Priority Ecosystems and Areas of Environmental Significance in the NEC 5-56
Table 5.10 Marine Ecosystems in Kenya 5-59
Table 5.11 Common Floral Species in the NEC’s AEZs 5-68
Table 5.12 Documented Invasive Species in Kenya 5-75
Table 5.13 Commercially Exploitable Wildlife Species in Kenya 5-79
Table 5.14 National Parks in the NEC 5-91
Table 5.15 National Reserves in the NEC 5-97
Table 5.16 MPAs in the NEC 5-100
Table 5.17 Wildlife Sanctuaries in the NEC 5-102
Table 5.18 Forest Reserves in the NEC 5-104
Table 5.19 Characteristics of Wetlands in the NEC 5-119
Table 5.20 Trigger Species in the Intersected IBAs and EBAs 5-131
Table 5.21 AZEs in the NEC 5-133
Table 5.22 EAM KBAs and Corridors in the NEC 5-134
Table 5.23 Summary of Climate Change Risks and Impacts in Kenya 5-148
Table 6.1 Kenya's Population 1951-2010 6-4

Table 6.2 Kenya's Projected Population 2020-2050 6-4
Table 6.3 Percentage of Residents by Level of Education (in %) 6-10
Table 6.4 Percentage of Residents Using Improved and Unimproved Water Sources by
NEC County 6-14
Table 6.5 Percentage Energy Use for Cooking by NEC County 6-15
Table 6.6 Percentage of Residents in the NEC Counties by Roofing Materials 6-16
Table 6.7 Summary of Existing Pipeline Infrastructure 6-21
Table 6.8 Population within Urban Centres in the NEC 6-25
Table 6.9 Advantages and Disadvantages of Linear Settlement Patterns along the NEC6-32
Table 6.10 Advantages and Disadvantages of Clustered Settlement Patters along the NEC6-33
Table 6.11 Advantages and Disadvantages of Dispersed Settlement Patterns along the
NEC 6-34
Table 6.12 Crops Grown in the NEC Counties 6-36
Table 6.13 Livestock Production within the NEC 6-37
Table 6.14 Mining and Quarrying Activities in the NEC 6-38
Table 6.15 Industries and Manufacturing Enterprises in Urban Centres in the NEC 6-40
Table 6.16 Percentage of Residents Working for Pay by NEC County 6-44
Table 6.17 Gini Coefficient by County 6-46
Table 6.18 Important Archaeological Sites within the NEC 6-52
Table 6.19 Historical Sites and Monuments in the NEC 6-54
Table 7.1 Advantages and Disadvantages of the Super Double Core Type 7-2
Table 7.2 Advantages and Disadvantages of Alternative B 7-3
Table 7.3 Advantages and Disadvantages of Alternative C 7-4
Table 7.1 Future Gross Domestic Product (GDP) Projection in Kenya 2015-2020 7-7
Table 7.2 Scenario Analysis of the Multi-Core with Regional Industrial Development
Type 7-8
Table 8.1 List of Identified Stakeholders 8-4
Table 8.2 Approaches and Methods for Engaging Stakeholders 8-7
Table 8.3 Stakeholder Meetings at the Scoping Stage 8-9
Table 8.4 Stakeholder Meetings at the SEA Study Stage 8-11
Table 8.5 KII Discussion Topics 8-13
Table 8.6 Key Informant Interviews Schedule 8-16
Table 8.7 Summary of Cross Cutting Engagement Raised During the SEA 8-21
Table 8.8 Summary of Comments Raised on the Draft SEA Report 8-25
Table 9.1 Location of Flagship NEC Projects in Kenya and Uganda 9-3
Table 9.2 NEC MP Sectoral Distribution of Infrastructure Projects 9-5
Table 9.3 Environmental Impact Identification Matrix 9-6
Table 9.4 Potential Air Emissions from the NEC MP 9-13
Table 9.5 NEC MP Pollution Risk Factors 9-26
Table 9.6 Construction and Decommissioning H&S Hazards 9-36
Table 9.6 Industry Specific H&S Hazards 9-38
Table 9.7 Impact Significance Assessment 9-49
Table 9.9 Determining the Effects of Cumulative Impacts 9-50
Table 9.10 Cumulative Environmental Effects/Impacts 9-51
Table 10.1 Location of Flagship NEC Projects in Kenya and Uganda 10-3
Table 10.2 NEC MP Sectoral Distribution of Infrastructure Projects 10-5
Table 10.3 Socio-Economic Identification Matrix 10-6
Table 10.4 Summary of Estimated Reduction of Inland Transport Cost (per container) 10-8
Table 10.5 Projection of Reduction of Inland Transport Cost and Production Cost 10-8
Table 10.5 Necessary Actions for Capacity Development 10-12

Table 10.6 Determining the Effects of Cumulative Impacts 10-28
Table 10.7 Cumulative Socio-Economic Impacts 10-29
Table 11.1 Environmental and Social Management Framework 11-2
Table 12.1 Summary of Environmental Constraints 12-2
Table 12.2 Summary of Social Constraints 12-4
Table 12.3 Key Environmental and Social Impacts and Mitigation Measures 12-8
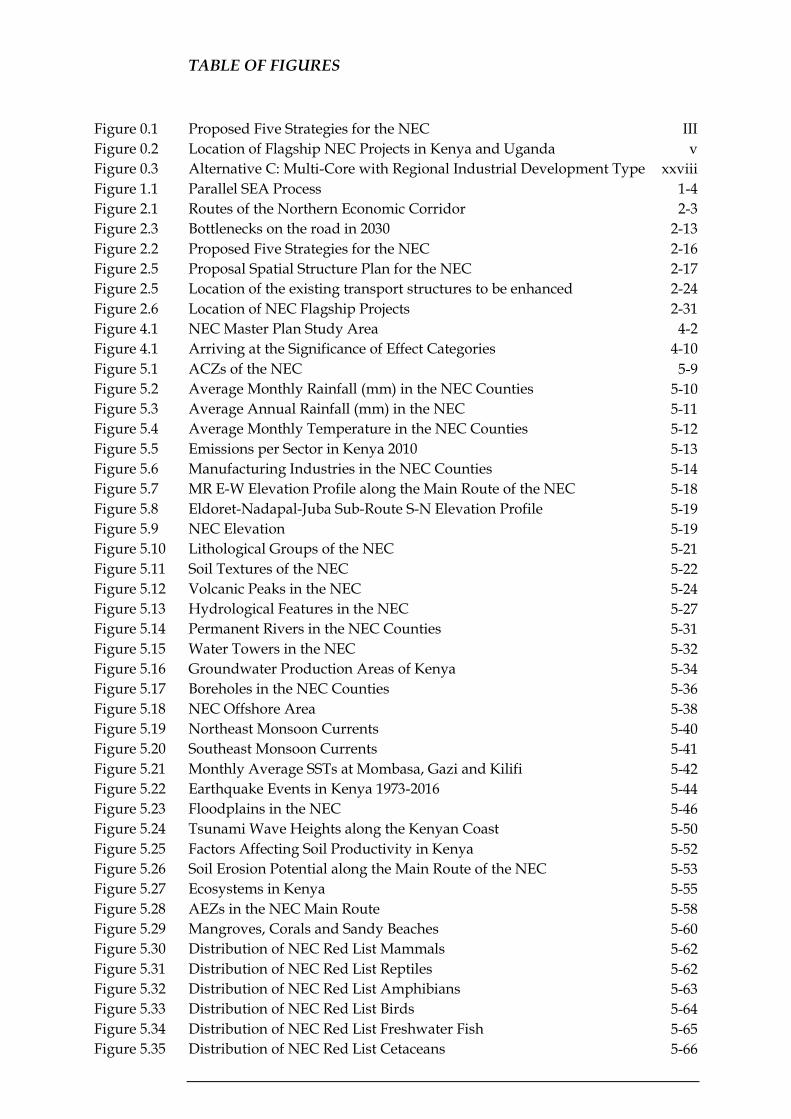
TABLE OF FIGURES
Figure 0.1 Proposed Five Strategies for the NEC III
Figure 0.2 Location of Flagship NEC Projects in Kenya and Uganda v
Figure 0.3 Alternative C: Multi-Core with Regional Industrial Development Type xxviii
Figure 1.1 Parallel SEA Process 1-4
Figure 2.1 Routes of the Northern Economic Corridor 2-3
Figure 2.3 Bottlenecks on the road in 2030 2-13
Figure 2.2 Proposed Five Strategies for the NEC 2-16
Figure 2.5 Proposal Spatial Structure Plan for the NEC 2-17
Figure 2.5 Location of the existing transport structures to be enhanced 2-24
Figure 2.6 Location of NEC Flagship Projects 2-31
Figure 4.1 NEC Master Plan Study Area 4-2
Figure 4.1 Arriving at the Significance of Effect Categories 4-10
Figure 5.1 ACZs of the NEC 5-9Figure 5.2 Average Monthly Rainfall (mm) in the NEC Counties 5-10Figure 5.3 Average Annual Rainfall (mm) in the NEC 5-11Figure 5.4 Average Monthly Temperature in the NEC Counties 5-12Figure 5.5 Emissions per Sector in Kenya 2010 5-13Figure 5.6 Manufacturing Industries in the NEC Counties 5-14Figure 5.7 MR E-W Elevation Profile along the Main Route of the NEC 5-18Figure 5.8 Eldoret-Nadapal-Juba Sub-Route S-N Elevation Profile 5-19Figure 5.9 NEC Elevation 5-19Figure 5.10 Lithological Groups of the NEC 5-21Figure 5.11 Soil Textures of the NEC 5-22Figure 5.12 Volcanic Peaks in the NEC 5-24Figure 5.13 Hydrological Features in the NEC 5-27Figure 5.14 Permanent Rivers in the NEC Counties 5-31Figure 5.15 Water Towers in the NEC 5-32Figure 5.16 Groundwater Production Areas of Kenya 5-34Figure 5.17 Boreholes in the NEC Counties 5-36Figure 5.18 NEC Offshore Area 5-38Figure 5.19 Northeast Monsoon Currents 5-40Figure 5.20 Southeast Monsoon Currents 5-41Figure 5.21 Monthly Average SSTs at Mombasa, Gazi and Kilifi 5-42Figure 5.22 Earthquake Events in Kenya 1973-2016 5-44Figure 5.23 Floodplains in the NEC 5-46Figure 5.24 Tsunami Wave Heights along the Kenyan Coast 5-50Figure 5.25 Factors Affecting Soil Productivity in Kenya 5-52Figure 5.26 Soil Erosion Potential along the Main Route of the NEC 5-53Figure 5.27 Ecosystems in Kenya 5-55Figure 5.28 AEZs in the NEC Main Route 5-58Figure 5.29 Mangroves, Corals and Sandy Beaches 5-60Figure 5.30 Distribution of NEC Red List Mammals 5-62Figure 5.31 Distribution of NEC Red List Reptiles 5-62Figure 5.32 Distribution of NEC Red List Amphibians 5-63Figure 5.33 Distribution of NEC Red List Birds 5-64Figure 5.34 Distribution of NEC Red List Freshwater Fish 5-65Figure 5.35 Distribution of NEC Red List Cetaceans 5-66

Figure 5.36 Distribution of NEC Red List Groupers 5-67Figure 5.37 NEC Counties Distribution of Percentage Forest Cover 5-71Figure 5.38 Forests, Forest Ranges and Mangrove Forests in the NEC 5-72Figure 5.39 Value of Marine Fish Landings 2010-2014 5-80Figure 5.40 Land Cover Distribution in the NEC 2012 5-82Figure 5.41 NEC Land Cover 2012 5-83Figure 5.42 Land Potential the NEC 5-84Figure 5.43 5-87Figure 5.44 5-88Figure 5.45 5-88Figure 5.46 5-96Figure 5.47 5-99Figure 5.48 5-101Figure 5.49 5-115Figure 5.50 5-116Figure 5.51 5-117Figure 5.52 5-118Figure 5.53 5-124Figure 5.54 5-126Figure 5.55 5-128Figure 5.56 5-129Figure 5.57 5-130Figure 5.58 5-135Figure 5.59 5-137Figure 5.60 5-139Figure 5.61 5-140Figure 5.62 5-141Figure 5.63 5-142Figure 5.64 5-143Figure 5.65 5-144Figure 6.1 6-2
Figure 6.2 6-6
Figure 6.3 6-7
Figure 6.4 6-9
Figure 6.5 6-10
Figure 6.6 6-18
Figure 6.7 6-19
Figure 6.8 6-20
Figure 6.9 6-22
Figure 6.10 6-22
Figure 6.11 6-24
Figure 6.12 6-26
Figure 6.13 6-26
Figure 6.14 6-28
Figure 6.16 6-31
Figure 6.17 6-33
Figure 6.18 6-35
Figure 7.1 7-2
Figure 7.2 7-3
Figure 7.3
Visitors to PAs in the NEC 2010-2014 (1)Distribution of PAs in the NEC
PAs in the NEC
National Parks in the NEC
National Reserves in the NEC
MPAs in the NEC
Forest Reserves in the NEC
PCAs and CCAs in the NEC
Wetland Vegetation in Relation to Wetness Gradient
Wetlands in the NEC
Distribution of Water Surface Areas in the NEC Counties
Ramsar Sites in the NEC
WHSs in the NEC
Kenyan Section of the Mt Elgon MAB Reserve
IBAs and EBAs in the NEC
EAM KBAs and Corridors Intersected by the NEC
Distribution of Red List Corals
Sandy Beaches and Turtle Nesting Sites
Lake Victoria Catchment
Mt Elgon Protected Areas
Sio-Siteko Wetland
Indian Ocean PAs
Tsavo West and Mkomazi National Parks
NEC Counties within the Main Route
Population Density in the NEC Main Route
Rural and Urban Population in Kenya
Education Levels in Kenya
Education Levels in Kenya, 1970-2050
The SGR and MGR Lines
Inventory of Railway Line Operating Facilities
Pipeline Network
Location of Major Airports
Constraints - Airports
Proposed and Existing Facilities at the Port of Mombasa
Cities, Municipalities and Towns found along the NEC Main Route
Trends of urban growth in Kenya (1948-2009)
Land Use along the NEC Main Route
Land Values along the NEC
Linear settlement along the corridor in Nakuru
Dispersed settlements in Makueni County
Alternative A: Super Double Core Type
Alternative B: Double Core with Regional Industrial Promotion Type
Alternative C: Multi-Core with Regional Industrial Development Type 7-4
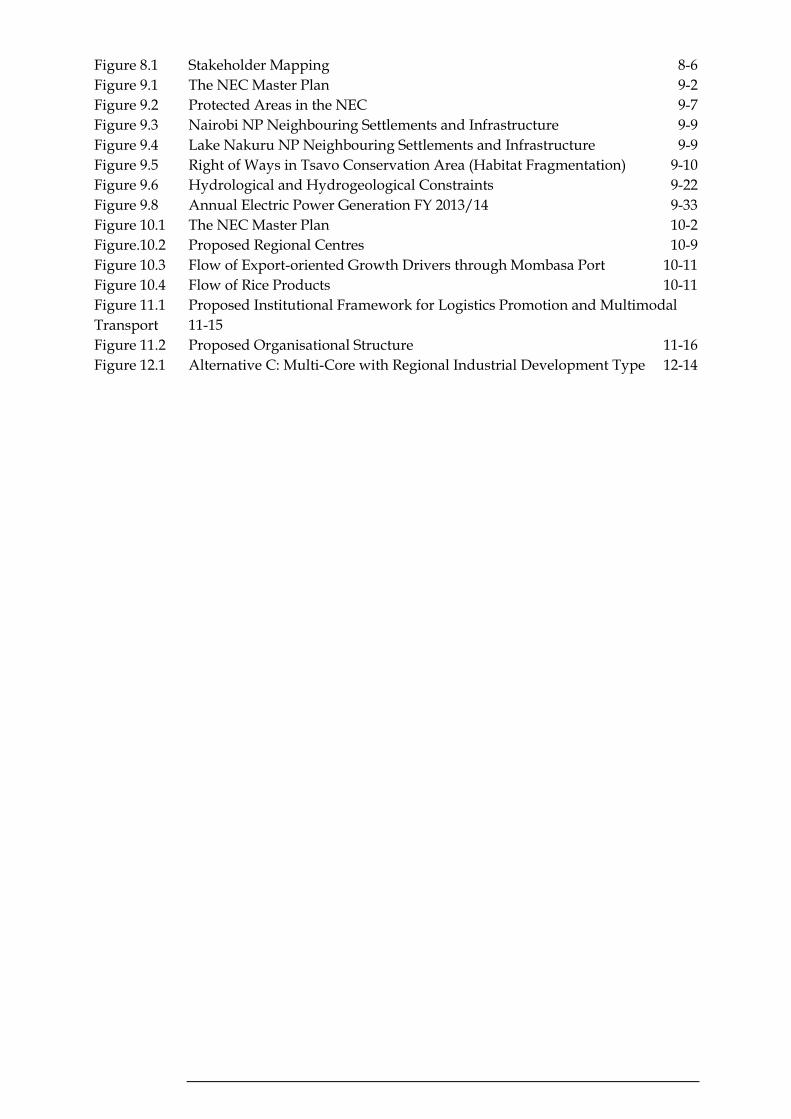
Figure 8.1 Stakeholder Mapping 8-6
Figure 9.1 The NEC Master Plan 9-2
Figure 9.2 Protected Areas in the NEC 9-7
Figure 9.3 Nairobi NP Neighbouring Settlements and Infrastructure 9-9
Figure 9.4 Lake Nakuru NP Neighbouring Settlements and Infrastructure 9-9
Figure 9.5 Right of Ways in Tsavo Conservation Area (Habitat Fragmentation) 9-10
Figure 9.6 Hydrological and Hydrogeological Constraints 9-22
Figure 9.8 Annual Electric Power Generation FY 2013/14 9-33
Figure 10.1 The NEC Master Plan 10-2
Figure.10.2 Proposed Regional Centres 10-9
Figure 10.3 Flow of Export-oriented Growth Drivers through Mombasa Port 10-11
Figure 10.4 Flow of Rice Products 10-11
Figure 11.1 Proposed Institutional Framework for Logistics Promotion and Multimodal
Transport 11-15
Figure 11.2 Proposed Organisational Structure 11-16
Figure 12.1 Alternative C: Multi-Core with Regional Industrial Development Type 12-14

LIST OF ANNEXURES
Annex A Communication with NEMA
Annex A1 NEMA SEA Scoping Report Submission Acknowledgement
Annex A2 NEMA SEA Scoping Report Approval
Annex A3 NEMA SEA Draft Report Submission Acknowledgement
Annex B ERM NEMA Certificate and 2017 Practicing Licence
Annex C NEC Proposed Project List
Annex D Environmental Baseline Constraints and Maps
Annex E Stakeholder Engagement Plan (SEP)
Annex E1 Stakeholder Database
Annex E2 Meeting Minutes and Signing in Sheets
Annex E3 Photos of the Consultations
Annex E4 PowerPoint Presentations
Annex E5 Letters of Invitation
Annex E6 Draft NEC SEA Report Advertisements in the Media
Annex E7 Comments on the Draft SEA Report
Annex E8 BID
Annex F List of Historical Sites and Monuments along the NEC

ENVIRONMENTAL RESOURCES MANAGEMENT JST/MOTI
1-1
1 INTRODUCTION
1.1 OVERVIEW
The JICA Study Team (JST) on behalf of the Ministry of Transport and
Infrastructure (MoTI) appointed Environmental Resources Management
East Africa Limited (ERM) as independent environmental and social
consultants to undertake a Strategic Environmental Assessment (SEA)
for the Master Plan on Logistics in the Northern Economic Corridor
hereafter referred to as “the Master Plan”.
This SEA is applicable for the entire Master Plan which covers both
Kenya and Uganda, and as such, this SEA will be provided in two
distinct parts; one document applicable for Kenya and one for Uganda.
Both SEA documents will have many commonalities, but each will
describe specifics separately for both Kenya and Uganda, and will be
submitted separately to the applicable authorities in both countries.
1.2 THE NORTHERN ECONOMIC CORRIDOR
The Northern Economic Corridor (NEC) is a multi-modal corridor,
consisting of road, rail, pipeline, and inland waterways transport, and is
recognized as a significant corridor for logistics in East Africa. The main
road network runs from Mombasa Sea Port through Kenya and
Uganda, to Rwanda and Burundi, and to the Democratic Republic of
Congo (DRC). The road network also links Kenya and Uganda to Juba
in South Soudan.
There are some obstacles presently in the NEC that include:
inadequate infrastructure;
poor connectivity of modes;
long delays of cargo at the port and border posts; and
lack of goods to transport for the return trip from the inland area to
Mombasa port.
These obstacles have led to an increase in transport costs and significant
time delays within the NEC and have hindered the economic
development of the region, specifically inland areas.
The Governments of Uganda and Kenya therefore requested the
Government of Japan (GoJ) to implement a project to formulate a
master plan on logistics in the NEC in order to promote regional
development. In response to these requests, the Japan International

ENVIRONMENTAL RESOURCES MANAGEMENT JST/MOTI
1-2
Cooperation Agency (JICA) dispatched a ‘Detail Design Formulation
Team for the Project’ in October and November 2014. The Team
proposed to develop a concept that would cover not only logistics, but
also regional development along the NEC. The Governments of Kenya
and Uganda agreed with the concept and signed the Record of
Discussion with JICA for the implementation of the Project for
Formulation of the Master Plan on Logistics in the Northern Economic
Corridor (the Master Plan).
1.3 OBJECTIVES OF THE MASTER PLAN STUDY
The objective is to formulate a Master Plan on Logistics for the NEC,
along with an integrated regional development strategy consistent with
sub-regional and national development plans. The target year of this
Master Plan is 2030.
1.4 PPP OWNER
The Plan Policy Program (PPP) Owner for the NEC in Kenya is the
Ministry of Transport and Infrastructure (MoTI). A key task of this
Ministry is to position Kenya as the logistics hub of the region by
creating a modern and efficient transport system for goods and services
within the Counties and also with other countries in the region (1) . The
Ministry has two Departments, namely the State Department of
Transport and the State Department of Infrastructure. This Master Plan
falls under the latter.
1.5 DECISION TO UNDERTAKE THE SEA
In order to decide whether an SEA was appropriate and relevant to the
development of the Master Plan, a Policy, Plan or Program (PPP) Brief
was submitted to the National Environment Management Authority
(NEMA) in June 2015 by the JST on behalf of the Ministry of Transport
and Infrastructure (MoTI) as the PPP Owner. The screening results
were thereafter communicated to MoTI, i.e., the decision to undertake
an SEA.
Thereafter, ERM was contracted as the SEA Expert and commenced
with a Scoping Study between October 2015 and February 2016 to
establish the focus and the content of the SEA, as well as the relevant
criteria for assessment. The objectives of the Scoping Study were to:
(1) Source: http://www.kenyans.co.ke/government/ministry-transport-infrastructure

ENVIRONMENTAL RESOURCES MANAGEMENT JST/MOTI
1-3
Determine whether significant environmental and social impacts are
likely to arise from implementing the Master Plan;
Develop a Stakeholder Engagement Plan (SEP) and provide a record
of comments and responses received from Stakeholders;
Communicate the results of the SEA scoping process; and
Facilitate an informed, transparent and accountable decision-
making process by the relevant authorities.
ERM submitted the SEA Scoping Report to NEMA on the 02nd March
2016 and the Report was thereafter approved by NEMA on 06th April
2016, Reference number NEMA/SEA/5/2/043, (see Annex A for the
correspondence with NEMA). The outcomes of this Scoping Report,
agreed to by NEMA, have been used in this SEA study.
1.6 OBJECTIVES OF THE SEA
The objective of the SEA is to identify the potentially significant
environmental and social issues relating to the Master Plan that will
need to be addressed as part of the SEA Study. The SEA will therefore
be conducted in order to:
Ensure that the Master Plan is compatible with sustainable planning
and environmental management;
Enhance the consistency of the Master Plan across different Policy,
Plan, or Program (PPP) sectors;
Identify the potential environmental, socioeconomic and cultural
impacts of the Master Plan; and
Support decision-making and incorporate emerging environmental
issues into sustainable development.
The SEA is being undertaken in parallel with the Master Plan
formulation process (see Figure 1.1). This way, environmental and social
considerations will be addressed in a proactive manner so as to better
inform the decision making processes.

ENVIRONMENTAL RESOURCES MANAGEMENT JST/MOTI
1-4
Figure 1.1 Parallel SEA Process
1.7 MASTER PLAN STUDY TEAM
The JST, consisting of the following 16 experts, is currently undertaking
the Master Plan study in both Kenya and Uganda:
Team Leader/ Development Planning;
Logistics Plan;
Infrastructure Development;
Logistics Infrastructure 1;
Logistics Infrastructure 2 (Railway);
Freight Traffic Analysis and Demand Forecasting;
Industrial Development and Investment Promotion;
Public-Private Partnership;
Mineral Resources and Energy;
Power;
Agriculture and Agri-Business;
Urban Development/Land Use Specialist;
Master Plan Process SEA Process
Source: Partidário, 2007

ENVIRONMENTAL RESOURCES MANAGEMENT JST/MOTI
1-5
Water;
Economist (Socio Economic Analysis);
Environmentalist (Social and Environmental Considerations); and
Coordinator/Human Resource Development.
1.8 SEA CONSULTANTS
ERM East Africa Ltd. was appointed by JST to undertake the SEA for
the Master Plan. ERM (and specialists appointed by ERM during the
course of this SEA) have no financial ties to, nor are they a subsidiary,
legally or financially, of the JST.
ERM is a global environmental consulting organisation with over 150
offices in 40 countries employing more than 5,000 people. ERM, the
world’s leading sustainability consultancy, has operated throughout
Africa for over thirty-five years, and our Sub-Saharan Africa Business
Division with over 200 employees, is currently based in South Africa
(Cape Town, Durban, Johannesburg and Pretoria), Mozambique
(Maputo) and East Africa (Nairobi).
ERM East Africa Ltd. is registered with NEMA as a Firm of EIA/Audit
Experts, Reg. No 7264 (see Annex B for the NEMA Certificate of
Registration and 2016 Practicing Licence). The SEA team is presented in
Table 1.1:
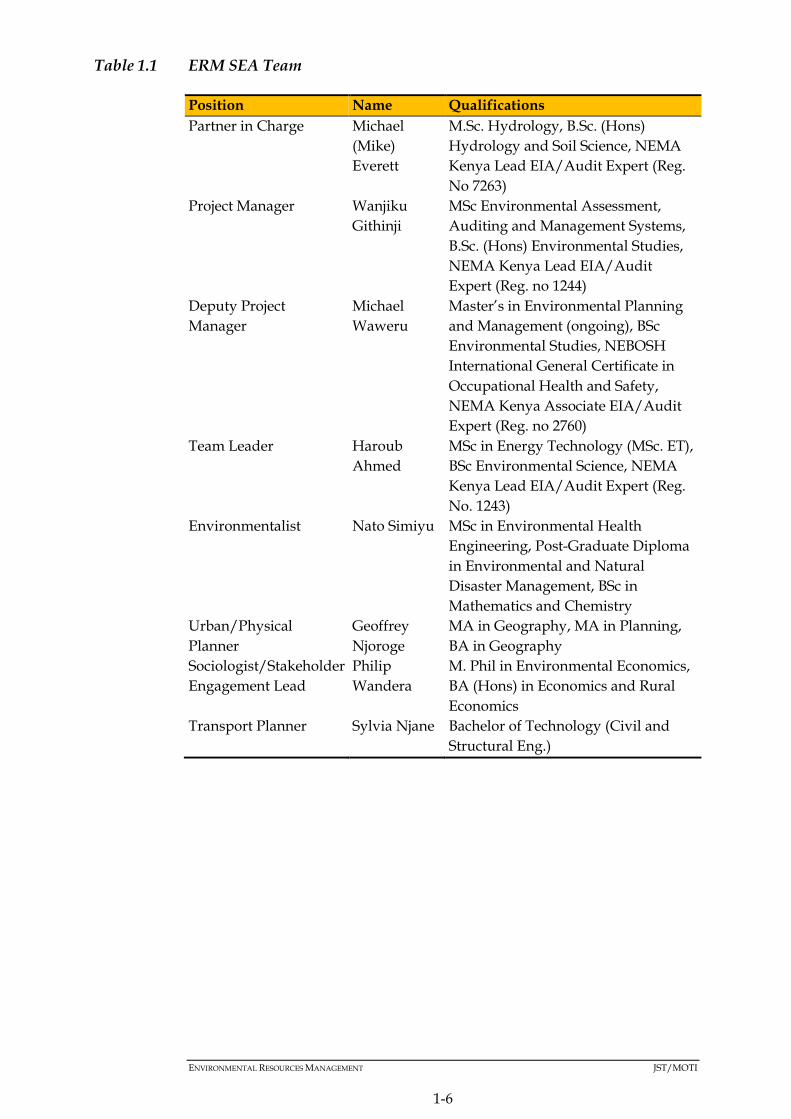
ENVIRONMENTAL RESOURCES MANAGEMENT JST/MOTI
1-6
Table 1.1 ERM SEA Team
Position Name Qualifications
Partner in Charge Michael
(Mike)
Everett
M.Sc. Hydrology, B.Sc. (Hons)
Hydrology and Soil Science, NEMA
Kenya Lead EIA/Audit Expert (Reg.
No 7263)
Project Manager Wanjiku
Githinji
MSc Environmental Assessment,
Auditing and Management Systems,
B.Sc. (Hons) Environmental Studies,
NEMA Kenya Lead EIA/Audit
Expert (Reg. no 1244)
Deputy Project
Manager
Michael
Waweru
Master’s in Environmental Planning
and Management (ongoing), BSc
Environmental Studies, NEBOSH
International General Certificate in
Occupational Health and Safety,
NEMA Kenya Associate EIA/Audit
Expert (Reg. no 2760)
Team Leader Haroub
Ahmed
MSc in Energy Technology (MSc. ET),
BSc Environmental Science, NEMA
Kenya Lead EIA/Audit Expert (Reg.
No. 1243)
Environmentalist Nato Simiyu MSc in Environmental Health
Engineering, Post-Graduate Diploma
in Environmental and Natural
Disaster Management, BSc in
Mathematics and Chemistry
Urban/Physical
Planner
Geoffrey
Njoroge
MA in Geography, MA in Planning,
BA in Geography
Sociologist/Stakeholder
Engagement Lead
Philip
Wandera
M. Phil in Environmental Economics,
BA (Hons) in Economics and Rural
Economics
Transport Planner Sylvia Njane Bachelor of Technology (Civil and
Structural Eng.)

ENVIRONMENTAL RESOURCES MANAGEMENT JST/MOTI
1-7
1.9 REPORT STRUCTURE
The Structure of this SEA Report is as follows:
Table 1.2 Structure of the SEA Report
Section Contents
Executive Summary Non-technical summary
Chapter 1
Introduction
Contains a brief overview of the
Northern Economic Corridor, SEA,
purpose of the report, PPP owner,
Master Plan consultant, SEA
consultant and an outline of the report
structure.
Chapter 2
Description of the NEC
Includes a description of the proposed
Master Plan
Chapter 3
Legal and Institutional Framework
Outlines the legislative and policy
requirements applicable to the PPP
Chapter 4
Methodology and Approach
Outlines the approach to the SEA and
summarises the process undertaken to
date.
Chapter 5
Environmental Baseline
Describes the receiving environmental
baseline environment.
Chapter 6
Socio-Economic Baseline
Describes the receiving socio-
economic baseline environment.
Chapter 7
Alternatives
Describes the alternatives that have
been considered and the reasons for
the selection of the preferred
alternative
Chapter 8
Stakeholder Engagement
Describes the approach to and
outcomes of the stakeholder
engagement process
Chapter 9
Key Environmental Impacts
Describes and assesses the potential
physical and biological impacts
Chapter 10
Key Socio-Economic Impacts
Describes and assesses the potential
social, cultural, economic and human
health impacts
Chapter 11
Mitigation and Management
Specifies the mitigation and
management measures to be
undertaken
Chapter 12
Conclusion and Recommendations
Summarises the key findings of the
SEA and provides recommendations
for the mitigation of potential impacts
and the management of the proposed
plan.
In addition the Report includes the following annexures:

ENVIRONMENTAL RESOURCES MANAGEMENT JST/MOTI
1-8
Annex A: Communication with NEMA
Annex B: ERM NEMA Certificate of Registration and Practicing Licence
(2017)
Annex C: NEC Proposed Project List
Annex D: Environmental Baseline Constraints
Annex E: Stakeholder Engagement Plan (SEP)
Annex F: List of Historical Sites and Monuments along the NEC
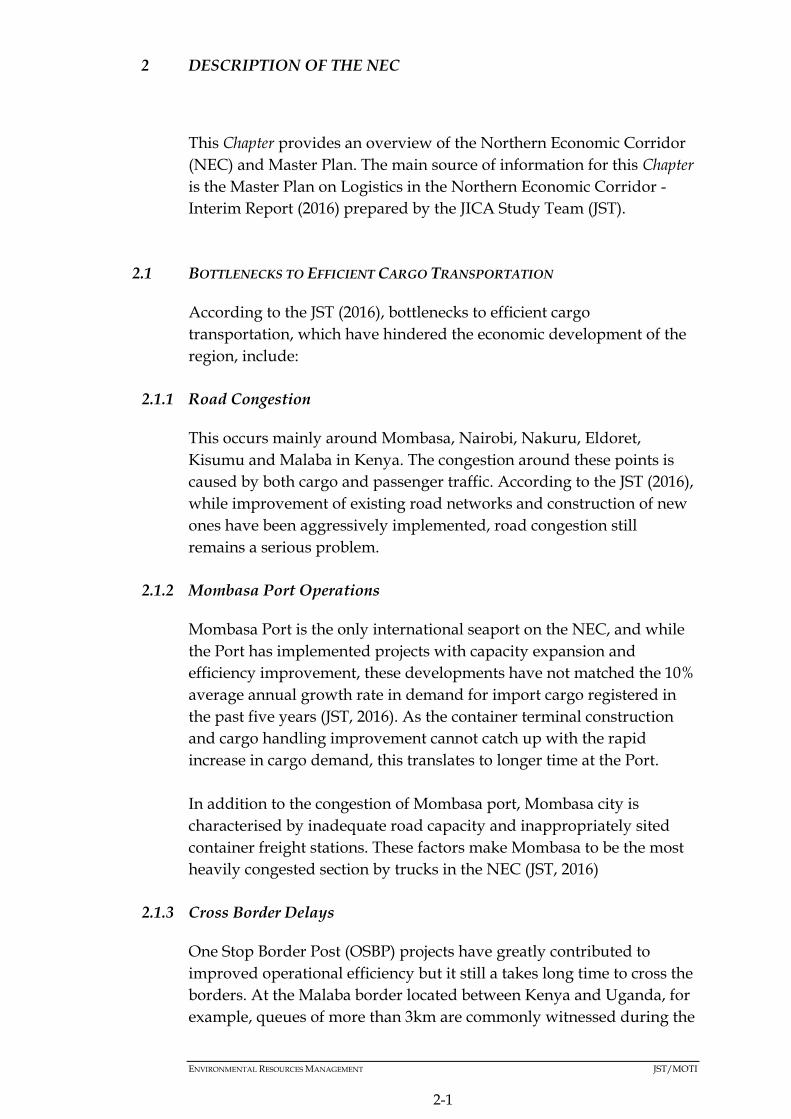
ENVIRONMENTAL RESOURCES MANAGEMENT JST/MOTI
2-1
2 DESCRIPTION OF THE NEC
This Chapter provides an overview of the Northern Economic Corridor
(NEC) and Master Plan. The main source of information for this Chapter
is the Master Plan on Logistics in the Northern Economic Corridor -
Interim Report (2016) prepared by the JICA Study Team (JST).
2.1 BOTTLENECKS TO EFFICIENT CARGO TRANSPORTATION
According to the JST (2016), bottlenecks to efficient cargo
transportation, which have hindered the economic development of the
region, include:
2.1.1 Road Congestion
This occurs mainly around Mombasa, Nairobi, Nakuru, Eldoret,
Kisumu and Malaba in Kenya. The congestion around these points is
caused by both cargo and passenger traffic. According to the JST (2016),
while improvement of existing road networks and construction of new
ones have been aggressively implemented, road congestion still
remains a serious problem.
2.1.2 Mombasa Port Operations
Mombasa Port is the only international seaport on the NEC, and while
the Port has implemented projects with capacity expansion and
efficiency improvement, these developments have not matched the 10%
average annual growth rate in demand for import cargo registered in
the past five years (JST, 2016). As the container terminal construction
and cargo handling improvement cannot catch up with the rapid
increase in cargo demand, this translates to longer time at the Port.
In addition to the congestion of Mombasa port, Mombasa city is
characterised by inadequate road capacity and inappropriately sited
container freight stations. These factors make Mombasa to be the most
heavily congested section by trucks in the NEC (JST, 2016)
2.1.3 Cross Border Delays
One Stop Border Post (OSBP) projects have greatly contributed to
improved operational efficiency but it still a takes long time to cross the
borders. At the Malaba border located between Kenya and Uganda, for
example, queues of more than 3km are commonly witnessed during the
ENVIRONMENTAL RESOURCES MANAGEMENT JST/MOTI
2-2
daytime. In addition, custom clearance procedures are still inefficient
due to a lack of human capacity, electricity, internet communication,
inadequate parking lots, and access roads, amongst others
2.2 OBJECTIVES OF THE NEC MASTER PLAN
Based on the bottlenecks described in Section 2.1, the overall objective of
the Master Plan is to therefore to improve logistics for the NEC as well
as to provide an integrated regional development strategy consistent
with sub-regional and national development plans. It is hoped that this
will spur regional economic development within Kenya and Uganda.
2.3 TARGET AREAS
The target area of the Master Plan study covers the following routes
and surrounding areas (see Figure 2.1 below):
Main route
o Mombasa – Nairobi – Tororo –Kampala – Katuna – Kigali
(Rwanda)
Sub-routes
o Eldoret – Nadapal – Juba (South Sudan)
o Tororo – Gulu – Elegu – Juba
o Kampala – Gulu – Elegu – Juba
o Mbarara – Mpondwe – Kisangani (DRC)
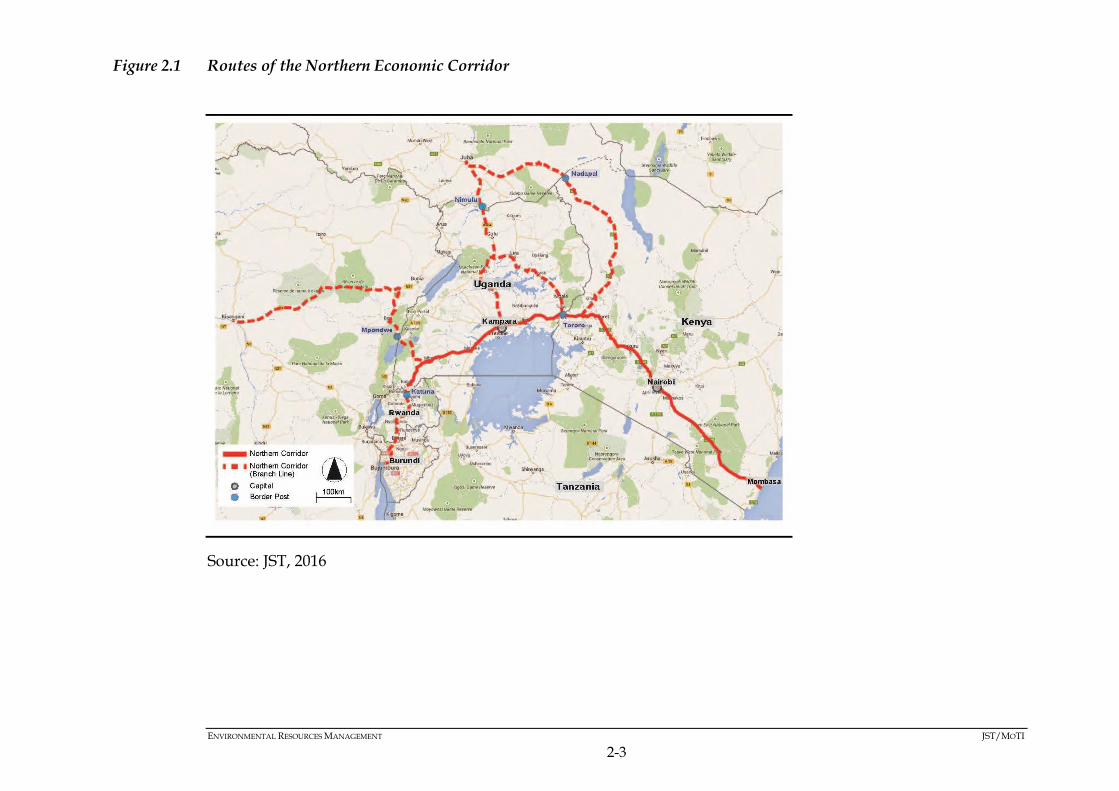
ENVIRONMENTAL RESOURCES MANAGEMENT JST/MOTI
2-3
Figure 2.1 Routes of the Northern Economic Corridor
Source: JST, 2016

ENVIRONMENTAL RESOURCES MANAGEMENT JST/MOTI
2-4
2.4 REGIONAL STRUCTURE PLAN
The significant issues with regards to the current spatial structure
include an excess of imports and the concentration of functions on
the country’s capitals. The rate of import and export of East African
Community (EAC) countries are 92% and 8% respectively, meaning
that most of the income is outflowing to outside of the region.
The area within a 50 km radius o f N airobi and Kampala
accounts for 33% and 37% of the urban population in Kenya and
Uganda respectively. Nairobi for instance, generates 40-50% of the
GDP in Kenya, according to Kenya Vision 2030.
Three alternative spatial structures for the NEC were examined,
taking into account the following factors:
i) regional industrial development: promoting regional
industrial development;
ii) urban centers of the region: centralizing urban functions or
decentralizing; and
iii) Transport network: promoting regional linkage.
These alternatives are discussed separately in the Alternatives
Chapter of this report (Chapter 7). The preferred alternative for the
NEC, as concluded by the JST (2016) is described in this Chapter in
Section 2.9 below.
2.5 SECTOR DEVELOPMENT IN KENYA AND UGANDA
2.5.1 Industrial Development
Despite primary commodities production from both the agricultural
and mining sectors in Kenya and Uganda, value-addition within
both countries is limited. Some products consumed in the domestic
and/or regional market are processed; these products include
primarily dairy and meat products and cement production, based on
limestone deposits.
Kenya does have a relatively developed system of industries and a
connection to the export market through the Port of Mombasa, as
well as a relatively well facilitated air cargo network. The
connectivity advantage further gives Kenya opportunities for an
increased share in the domestic and regional markets. As such,
Kenya’s industrial development should expand the production not

ENVIRONMENTAL RESOURCES MANAGEMENT JST/MOTI
2-5
only of currently available products, but also of products which
can serve the multiple sectors across the region.
Uganda’s value addition activities are still at the infancy stage.
Manufacturing using imported materials does occur, and this
serves both the domestic and export market in the other corridor
countries, such as the DRC and South Sudan.
2.5.2 Agriculture Development
With regards agricultural development in Kenya, the candidate
agricultural products selected as growth drivers for the Project
include tea, coffee, cut flowers, processed fruits and vegetables,
rice, and meat products.
With regards agricultural development in Uganda, the candidate
agricultural products selected as growth drivers for the Project
include coffee, oil seed, palm oil, rice, meat production, and maize.
These growth drivers were selected based on future demand from
the global, regional, and domestic markets.
2.5.3 Mining and Petroleum Sector Development
Coal, crude oil, natural gas, soda ash, niobium and rare earth
elements will be growth drivers for the mining and energy sectors in
the NEC region in Kenya.
Petroleum and crude oil will be growth drivers in the NEC region
for Uganda.
With regards to the expansion and extension of the regional oil
product pipeline, construction of an oil product pipeline in the East
African Community (EAC) member nations has been endorsed by
EAC member nations, and the project is considered to have t h e
potential to contribute to the economic development, as well as
energy security, in the region.
The pipeline system in Kenya will be extended further and tied
into Uganda’s system, and further extended to Kigali in Rwanda,
and/or Tanzania.
2.5.4 Manufacturing Sector Development
Growth drivers for Kenya’s and Uganda’s manufacturing sector

ENVIRONMENTAL RESOURCES MANAGEMENT JST/MOTI
2-6
are provided in Table 2.1 and Table 2.2 below:
Table 2.1 Categories of Kenya’s Manufacturing Growth Drivers
Category Timeframe for
Development
Examples of Industries
Processing for domestic
and regional market
Short to mid-term Construction materials
(e.g., iron and steel,
glass), consumer goods
(e.g., soaps and
detergents, processed
foods), plastics
packaging
Note: It can be both heavy
and light industry.
Export-oriented light
manufacturing
Short to mid-term Textile and apparel,
Leather
Source: JST, 2016
Table 2.2 Manufacturing sector in Uganda
Industries Production and Income Increase
Construction materials (e.g., iron and
steel)
The demand in domestic and regional
markets will provide the income
through the industry.
Consumer goods (e.g., soaps and
detergents)
The demand in domestic and regional
markets will provide the income
through the industry.
Leather World market is growing.
Source: JST, 2016
2.5.5 Tourism Sector Development
Kenya Vision 2030 has identified tourism as one of the six priority
sectors. However, limited resources, poor infrastructure and
facilities in and around the national parks, and security
concerns have been cited as barriers for the sector’s development.
The development of cities as tourism hubs will generate additional
flow of goods and passengers along the NEC, and the Corridor will
also serve as a key infrastructure to tourist sites.
In Uganda, the total number of visitors has largely increased in
recent years, although the rate of increase in tourism numbers year-
on year has become slow and unstable. Six Tourism Development
Areas (TDAs) are designated according to the current major and

ENVIRONMENTAL RESOURCES MANAGEMENT JST/MOTI
2-7
potential destination locations. TDAs will be connected to each other
by air or by road, and the NEC will act as the necessary
infrastructure to ensure access to most of these TDAs, which will
serve to boost regional development.
2.6 KEY GROWTH DRIVERS
Key growth drivers considered in both Kenya and Uganda include
those which will:
i) expand domestic and regional, and international markets for
net profit;
ii) produce strategic products or industries which provide
significant solutions for industrial structure upgrading,
and
iii) Includes industries with strong forward and backward
linkages.
Growth drivers categorized for both Kenya and Uganda are
shown in Table 2.3 below.
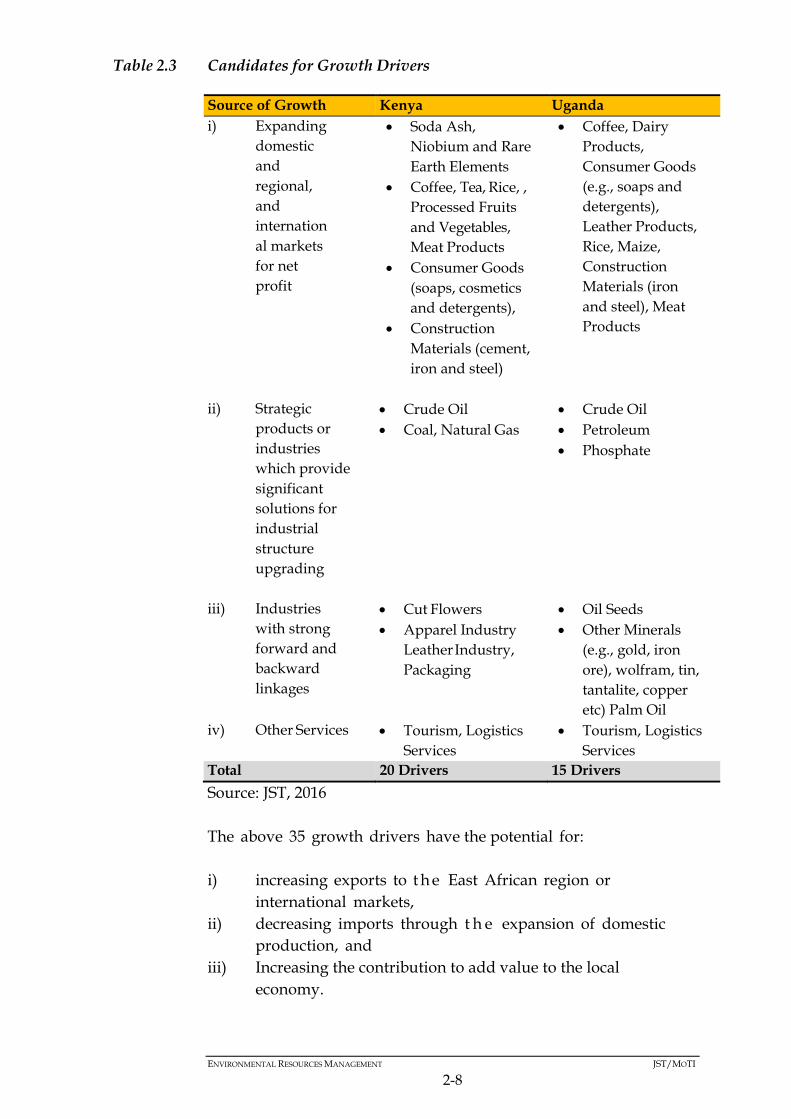
ENVIRONMENTAL RESOURCES MANAGEMENT JST/MOTI
2-8
Table 2.3 Candidates for Growth Drivers
Source of Growth Kenya Uganda
i) Expanding
domestic
and
regional,
and
internation
al markets
for net
profit
Soda Ash,
Niobium and Rare
Earth Elements
Coffee, Tea, Rice, ,
Processed Fruits
and Vegetables,
Meat Products
Consumer Goods
(soaps, cosmetics
and detergents),
Construction
Materials (cement,
iron and steel)
Coffee, Dairy
Products,
Consumer Goods
(e.g., soaps and
detergents),
Leather Products,
Rice, Maize,
Construction
Materials (iron
and steel), Meat
Products
ii) Strategic
products or
industries
which provide
significant
solutions for
industrial
structure
upgrading
Crude Oil
Coal, Natural Gas
Crude Oil
Petroleum
Phosphate
iii) Industries
with strong
forward and
backward
linkages
Cut Flowers
Apparel Industry
Leather Industry,
Packaging
Oil Seeds
Other Minerals
(e.g., gold, iron
ore), wolfram, tin,
tantalite, copper
etc) Palm Oil
iv) Other Services Tourism, Logistics
Services
Tourism, Logistics
Services
Total 20 Drivers 15 Drivers
Source: JST, 2016
The above 35 growth drivers have the potential for:
i) increasing exports to t h e East African region or
international markets,
ii) decreasing imports through t h e expansion of domestic
production, and
iii) Increasing the contribution to add value to the local
economy.

ENVIRONMENTAL RESOURCES MANAGEMENT JST/MOTI
2-9
2.7 TRANSPORT AND LOGISTICS INFRASTRUCTURE DEVELOPMENT
2.7.1 Overview
The current transport and logistics situation for the NEC is that the
movement of cargo is heavily influenced by road traffic congestion,
the operation of the Mombasa Port, and cross border operations.
For future operations, other important aspects such as how the
corridor interacts with both the central and Lamu Port Southern
Sudan-Ethiopia Transport (LAPSSET) corridors, how to deal with
an increasing demand in logistics for minerals from Uganda, DRC
and South Sudan to the port of Mombasa, and how to develop local
industries and promote local products for export, needs to be
considered.
2.7.2 Current and Future Gaps
2.7.2.1 Roads in Kenya
Major bottlenecks for road traffic are witnessed in the city centers
of Mombasa, Nairobi, Nakuru, Eldoret, Kisumu and their
surrounding areas, as well as around the borders of Malaba (in
Kenya) and Busia (in Uganda), Mombasa Port and at railway
stations.
Currently very long queues of trucks and trailers of more than 2km
can be seen in both Mombasa urban areas and at Malaba’s border
area during the day.
Although the road surface on the main route is generally good,
heavy trucks cause a deterioration in the road surface over
relatively short periods of time. There is a need, therefore for
continuous improvement and maintenance of the road network, to
meet increasing traffic demand, for both safe and efficient logistics
and passenger transport.
2.7.2.2 Roads in Uganda
In Uganda, bottleneck points for road traffic can be seen in the city
centers of Kampala, Entebbe and Jinja. Passenger car demand is
greater than cargo truck demand. Therefore, such bottlenecks
should be dealt wi t h through an urban transport management
plan, rather than through cargo traffic management.

ENVIRONMENTAL RESOURCES MANAGEMENT JST/MOTI
2-10
Bottleneck points also exist at the Malaba border with Kenya, and
around the Inland Container Depots (ICDs) and railway cargo
station in Kampala. In order to unlock the bottlenecks, it will be
necessary to expand network capacity by construction of new
expressways, bypasses, ring roads, over/under passes, additional
climbing lanes and conducting traffic demand management.
2.7.2.3 Railways
Rift Valley Railways (RVR) has invested in infrastructure and
equipment but overall, it appears to have lost market share of
cargo transportation to trucking. Further strengthening of track
and infrastructure and additions to rolling stock should be
considered to enable RVR to increase its cargo share.
The project to implement a standard gauge railway (SGR) serving the
NEC has been commissioned, with the line between Mombasa and
Nairobi expected to be complete, and in operation, by June 2017.
The SGR project has as its objective, the provision of a world class
railway service along the NEC, and to increase its competitive
advantage by increasing its market share of cargo from trucking to
rail.
2.7.2.4 Port
Although dwell time and loading/unloading times in the
Mombasa Port have significantly reduced, it still takes too long to
import and export cargo, to clear customs and to move cargo out of
the port. Dwell time and loading/unloading times are the
dominant factors in the total travel time for cargo in and out of the
Mombasa port.
The roads within the Mombasa urban area are also heavily
congested, resulting in cargo traffic rendered immobile during the
day-time. The most fundamental problem is an inadequate road
network and the capacity of the trunk road, with an urgent need to
construct the Southern by-pass. Moreover, relocation of Container
Freight Station (CFSs) services outside the port should be considered
in the short term in order to avoid a concentration of cargo traffic on
the Mombasa Port road.
2.7.2.5 Waterways
Currently only one ferry is in operation and very few boats come
to Port Bell (in Uganda) from Kisumu port (in Kenya). Cargo
throughput at Port Bell in Uganda has rapidly declined since 2005,

ENVIRONMENTAL RESOURCES MANAGEMENT JST/MOTI
2-11
with only 8,100 tons of cargo handled in Port Bell in 2014; this in
relation to the peak figure of 478,115 tons of cargo handled in 2002.
Strategic targeting of several cargos with potential demand for lake
transport as a form of transport should be considered. In this
regard, inter-regional trade or Expected Further Clearance (EFCs’)
trade with both Uganda and Tanzania, as well as international
trade, should be investigated. Kisumu and Port Bell should be well
linked with Mwanza port (in Tanzania), through an improvement
in infrastructure of wagon/car ferry ports, as well as through the
provision of new vessels, including car ferries and passenger
vessels.
2.7.2.6 Pipelines
Demand for petroleum products has increased significantly and a
further increase is forecast. In addition, transit oil products to
inland countries adjacent to Kenya, including Uganda, South
Sudan, the DRC, etc. are also increasing. The majority of these
transit oils are transported via Kenya’s pipeline system. In order to
meet the increasing demand, the capacity of the pipeline needs to
be expanded. Currently, Line 5 is under construction so as to
increase the capacity of the oil pipeline from Mombasa to Nairobi,
replacing the old (Line 1) system. The Line 3, from Sinendet to
Kisumu, will also be replaced with Line 6. Line 2 will also be
decommissioned at the time of upgrading of Line 4.
2.7.2.7 Border Posts
The most serious bottleneck is the east side border between
Kenyan and Uganda, especially at the Malaba border, where the
largest number and longest queues of heavy goods vehicles are
witnessed. Projected future bottlenecks are also expected to occur
on the DRC borders, such as the Mpondwe and Goli border posts,
where border infrastructure is insufficient, despite the fact that
future cargo demand will probably increase due to DRC’s
envisaged increases in mineral and timber export.
2.7.2.8 Inland Container Depots (ICDs)
Although the Kenya Ports Authority (KPA) currently operates two
Inland Container Depots (ICDs), namely one in Nairobi (in
Embaski) and the other in Kisumu, their performance is relatively
low. The Embaski ICD for instance, has an annual handling capacity
of 180 000 Twenty Foot Equivalent Unit (TEU’s), but less than 10%
of this capacity is utilized. The Kisumu ICD has almost stopped

ENVIRONMENTAL RESOURCES MANAGEMENT JST/MOTI
2-12
operations due to the collapse of the railway service to Western
Kenya from 1994. The low performances of ICDs are due mainly to
poor railway performance, delays, unreliable service, and low
frequency of trains, amongst other factors.
Construction of the new Mukono ICD in Uganda was completed in
July 2015 and as such, all container cargo handling will be shifted
from the current Kampala railway terminal from the beginning of
2016. The location of the new Mukono ICD is strategically located
along the Kampala-Jinja highway, allowing for ease of access for
both the Kampala city and industrial areas.
2.7.3 Future Total Freight Forecasting
Total freight forecasting shows that total import freight
(tonnage/year) from the port of Mombasa is projected at 57 million
tons in 2030, growing 2.4 times from the 24 million tons of freight in
2015. Total export freight in 2030 is e s t i m a t e d a t 4,650 thousand
tons, growing 1.9 times from the 2,451 thousand tons in 2015.
From the forecast results, it is predicted that the SGR and MGR
railway share will become at least 50% between the Mombasa port
and those zones with main railway stations.
2.7.4 Future Traffic Forecasting
Figure 2.2 indicates shows the main bottlenecks on the
road by 2030, where:
Maximum traffic for the cubic feet (CBFT) in 2030 is estimated at 21,000 pcu/day, on the section between Nairobi and Mombasa;
In the future, total traffic will exceed 30,000 passenger car units per day (pcu/day) between Nairobi and Nakuru, and around the Kampala area.

ENVIRONMENTAL RESOURCES MANAGEMENT JST/MOTI
2-13
Figure 2.2 Bottlenecks on the road in 2030
Source: JST, 2016
2.8 DEVELOPMENT SCENARIO FOR TRANSPORT AND LOGISTICS
INFRASTRUCTURE DEVELOPMENT
2.8.1 Scenario Modelling
Several scenarios emerge from the future demand
forecasting, which are described below:
In the Base case in 2030, railway is forecasted to carry 20.4 million
tons of cargo per year, and will achieve a market share of 33%
between truck carrying cargo, railways and pipelines, for cargo at
the Mombasa port. If the pipeline is excluded, railway will
achieve a market share of 42%, with the truck cargo’s share at
58%.
In the Optimistic case for 2030, railway is forecasted to carry 28.5
million tons per year, obtaining a 46% share amongst truck
carrying cargo, railways and pipelines for cargo at Mombasa port.
If the pipeline is excluded, the share is 59% for railways, whereas
truck carrying cargo’s share is 33%. The Optimistic case is as
highly effective case for controlling truck use, even though total
ton-kilometers by trucks will increase by 22%, from 19,809 million
ton kilometers to 24,283 million ton- kilometers.
In the Pessimistic case for 2030, railways are forecasted to carry
9.2 million tons per year, obtaining a market share of 15%
amongst truck carrying cargo, railways and pipelines for cargo at
ENVIRONMENTAL RESOURCES MANAGEMENT JST/MOTI
2-14
Mombasa port. If the pipeline is excluded, the market share for
railways is 19%, whereas for truck carrying cargo it is 81%.
2.8.2 Transport Network Improvements
Based on these scenarios, the following improvement scenarios for
the NEC, to result in transport improvements, should be achieved:
The NEC should be built as a Comprehensive Multimodal
Transport System consisting of road transport, railways,
airways, waterways and pipelines in order to effectively utilize
the existing and planned assets of infrastructure, to maximize
efficiencies and to provide for eco-friendly transport in the
future.
A Modal shift from truck to rail and other modes of transport
is a key issue on the Northern Corridor in the near future.
Currently 95% of cargo from Mombasa port to EACs is reported
to be carried by truck. Railway is usually a cost-efficient mode
for long distance, heavy and large volumes of freight (such as
coal, cement, construction materials etc.) In future, railways (an
in particular, the SGR) should be used more for cargo transport.
Moreover, the pipeline should be promoted for oil transport;
and inland water transport on Lake Victoria should be revived
as an eco-friendly transport means, especially between Kenya,
Uganda and Tanzania.
Improvement of the bottlenecks and safety on roads is urgently required; particularly in Mombasa, Nairobi, Nakuru, Eldoret, Kisumu, Kampala and their surrounding areas. There is an increasing traffic demand, and bottlenecks of road traffic around these areas is steadily worsening; it is therefore necessary to expand the capacity of the road network through road widening.
Logistics hubs near the Mombasa port, railway and airport
cargo terminals, at the junction of major roads, at ICDs and
borders, and within industrial park developments (for
manufacturing, warehousing, fishery /agricultural/ timber
processing etc.) should be planned. Such development can be
referred as Cargo-Oriented Development (COD), and will
activate regional economic vitality, will create jobs and
effectively promote international trade. As a result, it would
lead to an improvement between the import and export of
cargo, and will decrease the number of unloaded trucks and
empty containers on the road back to the Mombasa port.

ENVIRONMENTAL RESOURCES MANAGEMENT JST/MOTI
2-15
Transit times for import must be improved through improved
customs procedures at both the Mombasa port and border
posts.
2.9 DEVELOPMENT VISION AND STRATEGIES
The development vision for the NEC is: ‘to be the leading economic
corridor with integrated transport and logistics systems in Africa’. The
Development Vision has four key words/phrases which make the
NEC distinct from other corridors, and these are:
leading, to be the leading, most efficient and reliable in Africa
and the success can be applied to other corridors,
integrated transportation system, which offers diversified and
multi-modal options (road, rail, waterway, and pipeline) and
facilitates regional integration in East Africa,
integrated logistic hub, in which multi-modal options are
available, and industrial areas connected and promoted by
transport and logistic infrastructure,
economic corridor, stimulate regional economic development in
the area surrounding the corridor through development of
transport infrastructure, logistic facilities and creating
industries (JST, 2016).
The proposed Development Vision will be attained through the
implementation of 5 strategies, namely regional, industrial, and
transport strategies, which will be strengthened by organizational
and policy strategy as illustrated in Figure 2.3 below and summarised
in the Sections below.

ENVIRONMENTAL RESOURCES MANAGEMENT JST/MOTI
2-16
Figure 2.3 Proposed Five Strategies for the NEC
Source: JST, 2016
2.9.1 Regional Strategy: Linking Production Centres and Corridors
2.9.1.1 Linking Agriculturally Productive Areas and Mineral Resources
through the Development of Secondary Cities
Major cities and economic activities have been developed along the
NEC, and it is essential to link potential agricultural productive
areas and mineral resources through feeder roads. In this regard,
the JST proposes, as a spatial structure of the NEC, the
development of multi-centers with regional development
(distributing urban functions with a regional industries system),
considering the distribution of growth drivers. The spatial
structure plan has the following characteristics:
i) balanced growth and efficient logistics in the NEC region
through promoting urban functions of 12 “Secondary
Cities”, and
ii) secondary Cities that serve as regional urban centers, which
supply urban services and act as logistics hubs, which
connects Regional Production Centers and Primary Cities as
consumption areas.
The expected impact of this regional strategy is to realize
smooth movement of products and the balanced development of
the NEC region. This strategy is depicted in Figure 2.4 below.

ENVIRONMENTAL RESOURCES MANAGEMENT JST/MOTI
2-17
Figure 2.4 Proposal Spatial Structure Plan for the NEC
Source: JST, 2016
2.9.2 Industrial Strategy: Effective and Efficient Logistical System for
Industry and Trade
2.9.2.1 Promotion of Growth Drivers to increase export, reduce import
and develop the Local Economy
From an industrial development viewpoint within the NEC region,
35 growth drivers consisting of manufacturing, agriculture and
livestock, and energy and mining products etc. are nominated.
The JST deduced that growth drivers have the potential for:
i) increasing export to the East African region or the
international market,
ii) decreasing imports through the expansion of domestic
production, and
iii) contributing by adding value to the local economy.
Candidates for growth drivers are shown in Table 2.3
2.9.2.2 Connecting Industrial Areas To Logistics Hubs through Cargo
Orientated Development (COD)
Logistic hubs can be constructed at strategic locations such as at
SGR stations, strategic cities, key industrial areas, and so on. The
harmonization of such developments with industrial plans,
mineral resource developments, and agricultural developments is
key for transport and logistics planning. Such developments can

ENVIRONMENTAL RESOURCES MANAGEMENT JST/MOTI
2-18
be referred to as Cargo-Oriented Developments (COD). The
expected impact of such CODs is to realize an efficient and reliable
logistics network for industry.
Special Economic Zones (SEZs) in Mombasa, Naivasha, Eldoret,
and Kisumu), Industrial Parks (at Voi and Athi River) and Inland
Container Depots (ICDs) atKonza City) are planned to be
implemented along the NEC in Kenya.
Currently, ICDs are operational in Embakasi (Nairobi), Kisumu,
and Eldoret. SGR stations will be constructed in Mombasa,
Mariakani, Voi, Mtito Andei, Sultan Hamud, Athi River, Nairobi,
Longonot, Narok, Bomet, Sondu, Ahero, Kisumu, Yala, Mumias
and Malaba, and will be significant for transport and logistics
activities in future.
If a logistic hub’s catchment area is assumed to be 200km in
diameter, requiring approximately 3 hours of travel time, making
it possible to do a one days’ round-trip, it becomes logical to
install logistic hubs in at least 3 locations (namely Nairobi,
Kisumu and Voi/Mombasa) in Kenya.
In Uganda, seven economic areas (Gulu, Moroto, Kabale,
Mohondwe, Kampala, Nakasongolaa, Hoima) and three trade
zones are proposed in the Vision 2040 document. In addition, the
Vision 2040 document identifies four regional cities (Gulu, Arua,
Mbale, and Mbarara) and f i v e strategic cities (Jinja, Moroto,
Fort Portal, Hoima, and Nakasongola). Cross border markets are
also proposed in five border cities (Nimule, Mpondwe, Kabale,
Busia, Bubulo) while ICDs are located in Mukono, Jinja, and
Tororo. Gulu will be a strategic and regional location for
transportation to South Sudan and Northern Uganda. Mbarara
can serve as a strategic location to link with mining areas and
border trade with both Rwanda and DRC. Pakwach can be a
strategic and regional location to link DRC and inland waterways
connecting to the oil and gas areas in Lake Albert. Soroto or
Tororo/Mbale can be a strategic location for mineral resource
transport from Moroto.
As in the case of Kenya, if the catchment area for the logistics
hub is 200km, it is log ica l to install a logistic hub in at least four
locations (Kampala (Mukono), Tororo, Gulu, and Mbarara) in
Uganda.

ENVIRONMENTAL RESOURCES MANAGEMENT JST/MOTI
2-19
2.9.2.3 Establishment of Logistics Hubs with ICD and Logistics Centre
A logistic hub is defined as a center or specific area designated
to deal with activities related to transportation, collection,
distribution, and storage of goods for national and international
transit, where traffic is exchanged across several modes of
transport.
A potential logistic hub could have multi-modal facilities such as
a n ICD that connects railway to road, inland water, and/or an
airport. In addition to multi-modal facilities, a logistic hub
provides a logistic center with facilities and services such as
warehousing, a distribution center, and a “one-stop shop”.
Logistics Hubs therefore connect roads and railways through an
ICD to domestic “door” delivery through a logistics center. Logistic
hubs with ICDs and logistics centers are designed to connect with
industrial parks, mineral resource areas, and agricultural zones in
order to facilitate economic activities and investment opportunities.
The expected impacts of such logistics hubs will be to:
i) establish effective linkages between rail and truck
modes,
ii) reduce empty container movement (by 7% in
Mombasa), and
iii) Expand local logistics service providers, based on
c l i e n t s ’ needs.
2.9.3 Major Suggested Projects for the Industrial Strategy
2.9.3.1 Agricultural Projects
The following projects are identified in both Kenya and Uganda
for agricultural and fishery development, and agribusiness
development.

ENVIRONMENTAL RESOURCES MANAGEMENT JST/MOTI
2-20
Kenya Uganda
1) Agricultural financing
improvement
2) Food processing hub development
program
3) Distribution improvement
program of commercial crop
4) Fertilizer promotion
5) Specialty coffee export promotion
6) Tea brand development
7) Flower export promotion
8) Value chain of livestock
development
9) Mwea Irrigation
1) Agricultural union
commercialization support
2) Irrigation Scheme
Development project in
Central and Eastern Uganda
3) Fertilizer Promotion
4) Superior seed production
enhancement projects for
small scale sesame farmers
support
5) Rice Production Promotion
6) Maize promotion support
7) Specialty coffee export promotion
8) Livestock processed products
promotion
9) Kalangala PPP
Source: JST, 2016
2.9.3.2 Industrial Development Projects
The following projects are identified in both Kenya and Uganda
for industrial development.
2.9.3.3 Kenya
Special Economic
Zone
Development
The concept of Special Economic Zones (SEZ) is to
provide quality infrastructure as well as a good
business environment, together with fiscal incentives
within designated areas. The locations include Dongo
Kundu SEZ, Naivasha Industrial Park, Athi River
Industrial Park, Machacos-Kajiado Leather Industrial
Park, and Konza Tech City.
Packaging
industry
development for
food-processing
The project is to assist local packaging industries to be
able to supply quality packaging materials with
functions such as keeping stability of processed foods
or with aesthetic appearance. The project can comprise
training for packing industries, research and
development institutions, and agro-processing operators.
Source: JST, 2016
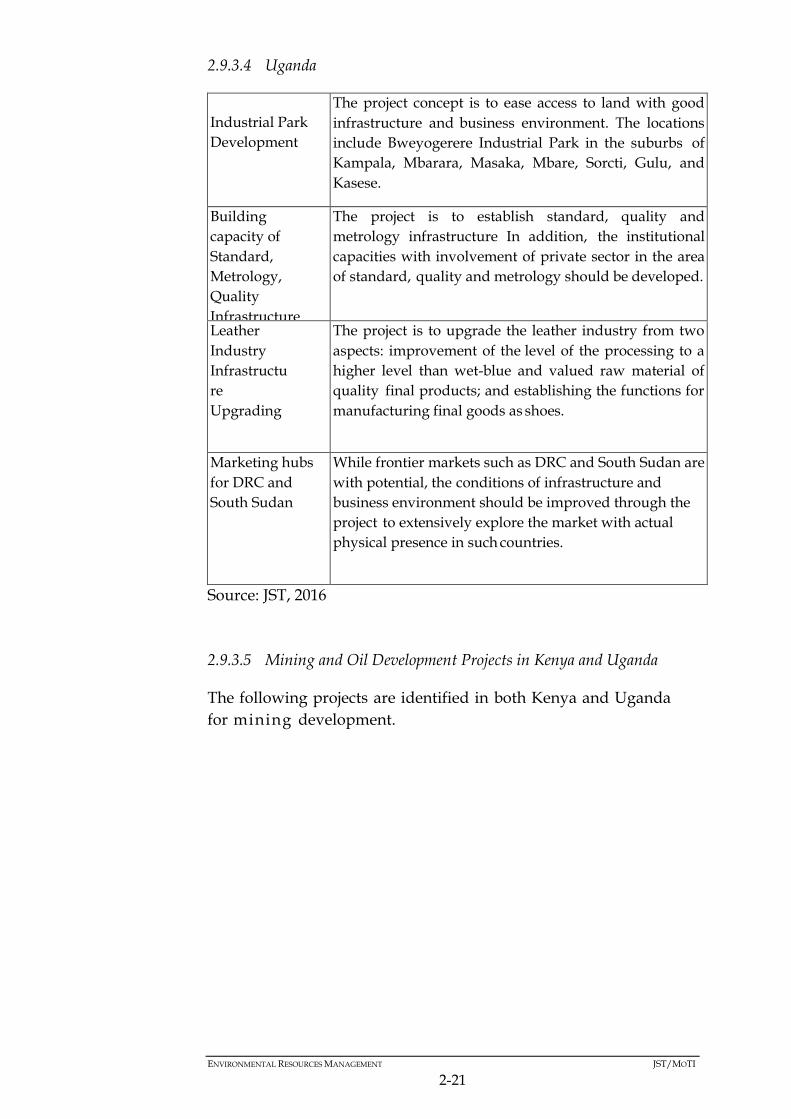
ENVIRONMENTAL RESOURCES MANAGEMENT JST/MOTI
2-21
2.9.3.4 Uganda
Industrial Park
Development
The project concept is to ease access to land with good
infrastructure and business environment. The locations
include Bweyogerere Industrial Park in the suburbs of
Kampala, Mbarara, Masaka, Mbare, Sorcti, Gulu, and
Kasese.
Building
capacity of
Standard,
Metrology,
Quality
Infrastructure
The project is to establish standard, quality and
metrology infrastructure In addition, the institutional
capacities with involvement of private sector in the area
of standard, quality and metrology should be developed.
Leather
Industry
Infrastructu
re
Upgrading
The project is to upgrade the leather industry from two
aspects: improvement of the level of the processing to a
higher level than wet-blue and valued raw material of
quality final products; and establishing the functions for
manufacturing final goods as shoes.
Marketing hubs
for DRC and
South Sudan
While frontier markets such as DRC and South Sudan are
with potential, the conditions of infrastructure and
business environment should be improved through the
project to extensively explore the market with actual
physical presence in such countries.
Source: JST, 2016
2.9.3.5 Mining and Oil Development Projects in Kenya and Uganda
The following projects are identified in both Kenya and Uganda
for mining development.

ENVIRONMENTAL RESOURCES MANAGEMENT JST/MOTI
2-22
2.9.3.6 Kenya
Name of Project Outline
Coal
Transportation
Infrastructure
Construction of a railway branch line from the main rail
line to the coal mines in Kitui is a priority infrastructure
project. The feasibility study on the coal transportation
system including coal terminals should be carried out.
Expansion/
Extension of Oil
Product
Pipeline
Kenya has operated an oil product pipeline from Mombasa
to Nairobi since 1978, and it was further extended to
Eldoret and Kisumu. Due to rapid growth of imported oil
product, the replacement and expansion as well as
additional pipelines should be carried out.
Source: JST, 2016
2.9.3.7 Uganda
Name of Project Outline
Refinery and Oil
Product Tailing
Pipeline
Construction
Refinery Project consists of refining facilities and oil
product shipping pipeline from the refinery to an oil
product terminal near Kampala. Project entity will be
founded through a PPP scheme.
Cross Border
Product Oil
Pipeline
With the economic development of these land locked
countries, demand of product oils has increased
significantly and road traffic is started to be over loaded.
To mitigate the road traffic situation, and to enhance the
traffic safety, extension of the pipeline to Kampala, and to
Kigali will be constructed.
Mining Master
Plan
The Project objective is to maximize the value of mineral
resources and boost initial part of the economic
development of the country. The master plan include: i)
Mineral Strategy , ii) List of Strategic Minerals and Target
area, iii) Development of Strategic Mineral Mapping and
Database, vi) Mineral Identification Capability, etc.
Source: JST, 2016
ENVIRONMENTAL RESOURCES MANAGEMENT JST/MOTI
2-23
2.9.3.8 Logistics Hub Projects
Logistic Hubs should be constructed at Mombasa, Nairobi,
Kisumu, Tororo, Kampala, Gulu, and Mbarara.
Most of the logistics hubs have two common functions, namely:
i) ICD function for modal shift and empty container depot
service as far as SGR extension is expected, and
ii) Logistics center function, which focuses on inventory and
delivery service whose catchment area is set up at
approximately a 200km radius, in order to achieve one-day
delivery.
2.10 TRANSPORT STRATEGY: EFFICIENT AND INTEGRATED MULTI-MODAL
TRANSPORTATION SYSTEM
2.10.1 Modal Shift from truck to railway and pipeline
In both Kenya and Uganda, around 95% of cargo freight is
transported by trucks, while other transport modes such as
railways and inland waterways, contribute less than 5% of total
freight. Currently, trucks carry all types of goods from bulk
cargo, mineral resources and liquid fuels. I t is more efficient to
transport large amounts of heavy freight such as coal, cement, and
construction materials over long distances by railway. As such,
railways should be used more for cargo transport through the SGR
project, as opposed through rail. According to the result of
preliminary freight traffic demand forecasting, the transit cost by
SGR is almost 50% of a truck’s transit cost, and total railway
demand of MGR and SGR can be nearly 40% of all freight tonnage
via Mombasa port. This means that the service level of SGR,
including the cargo transport charge, is a key success factor in
order to realize a modal shift from truck to rail.
Furthermore, the GoK plans to replace old pipelines and establish
new ones with an expanded capacity to meet increasing demand
for petroleum products in future. It is, therefore important that
the pipeline should be constructed and operated as planned.
2.10.2 Reduction of Bottlenecks of freight traffic and logistics
Based on the Origin and Destination survey, together with the traffic
survey for cross border traffic on the roads, bottlenecks caused by

ENVIRONMENTAL RESOURCES MANAGEMENT JST/MOTI
2-24
cargo traffic are identified, particularly in sections around Mombasa
port and the Malaba border.
2.10.3 Enhancement of existing transport infrastructure
In addition to roads and the new SGR, existing transport structures
such as the MGR, the Mombasa port, Lake Victoria waterway, and
international airports should be enhanced. Promotion of these
modes of transport can contribute to the improvement of logistics
along the NEC. The expected impact is to realize a multi modal
system, covering sea port, air, existing rail, and waterways for the
NEC in addition to truck, new rail and pipelines. The location of
the existing transport structures to be enhanced is illustrated in
Figure 2.5 below.
Figure 2.5 Location of the existing transport structures to be enhanced
Source: JST, 2016
ENVIRONMENTAL RESOURCES MANAGEMENT JST/MOTI
2-25
2.10.4 Major Suggested Projects for Transport Strategies
2.10.4.1 Roads
Logistics Highway Project
The main route of the NEC from Mombasa, Nairobi, Kampala, Kigali
and Bujumbura should have at least a dual carriageway. This is due
to the fact that most sections of this route will require four lane
capacity, at least up to 2030. A double carriageway with a median
strip is much safer than a single carriageway without a median strip.
Truck Service Stations Project:
Truck Service Stations should be established which must be large
enough to accommodate at least 100 trucks, as more than 100 heavy
goods vehicles heading in one direction are currently witnessed
during the daytime on many sections of the NEC. In addition,
sufficient accommodation, open 24 hours a day, should be
provided for long distance drivers. Traffic restriction information
should also be provided to drivers before selecting a border to
pass.
2.10.4.2 Railways
The Base case railway strategy has several elements:
Short term:
Determine an operating format for the Mombasa-Nairobi SGR:
Implement SGR from Nairobi to Malaba and Malaba to Kampala.
Involve the private sector in railway investments such as in ICDs or terminals or smaller initiatives, such as leasing rail wagons and locomotives to the railways and shippers.
Medium term:
Implement SGR to Gulu, Pakwach and Nimule.
Implement ICDs and railway yards and obtain operators.
Develop a plan for meter gauge and standard gauge side-by-side operations.
Use policies and regulations to support the shift of cargo from road to rail.
ENVIRONMENTAL RESOURCES MANAGEMENT JST/MOTI
2-26
Long term:
Invest in and maintain the standard gauge railway.
It is expected that Kenya and Uganda will retain ownership of the
SGR infrastructure and contract operations to a private company.
The two countries should closely monitor the condition of the
railway and ensure that sufficient time and expenditure is devoted
to maintenance.
2.10.4.3 Port
The Mombasa port is expected to be one of the hub ports in the
world in the long term, and will need to be able to handle more
than 3 million TEUs per year. The following projects should be
completed in the short to medium term in order to at least
accommodate such volumes:
Construction of Second Container Terminal (depth: 15m and 11m; 2xberths);
Construction of an access road (approx. 1.6km);
Dredging works (dredging volume: approx. 3 million cubic meters);
Construction of a new SGR linking Mombasa with Nairobi, Kampala and other hinterland destinations; and
Construction of a southern by-pass for Mombasa linking the south to north coasts.
2.10.4.4 Airport
Jomo Kenyatta International Airport (JKIA) is improving capacity
to deal with increasing passenger and cargo demand through an
on-going project. JKIA already has 5 cargo terminals which are
privatized. Air carriers can choose cargo terminals depending on
the service standard and cost performance. The service
improvement will be a key factor to becoming an Air-Air Cargo
Hub in the region.
The Eldoret International Airport runway and cargo handling
facilities will be expanded to start export of fresh agricultural
produce. This runway will be extended to 4.3km, from its present
length of 3.5km.
The Entebbe International Airport will improve its air cargo
facilities. Considering the current (good) JKIA performance, the
Entebbe International Airport should adopt a fresh strategy, such as
an air and truck services with good cross border facilitation, to for

ENVIRONMENTAL RESOURCES MANAGEMENT JST/MOTI
2-27
example, facilitate the cross border movement of higher value
goods into the DRC.
2.10.4.5 Waterways
From a cargo and tourist transport point of view, several
alternatives for Lake Victoria waterways should be examined.
Currently, the rehabilitation of Port Bell in Uganda is being
supported by the World Bank and EU, and is underway.
Development of Mwambani port in Tanga, Musoma Port and New
Kampala Port at Bukasa are also projects under consideration. The
Bukasa Port development project, as the new port, was proposed
in the past to realize better port functions, expand port-areas, and
to add not only wagon ferries but also roll-on/roll-off (RORO)
boats. Further review of the project should be considered.
2.10.4.6 Border Posts
Malaba border is the main border crossing for several countries and
therefore its congestion is a serious bottleneck for the whole of the
EAC region. In order to reduce the risks of congestion, the
following two interventions should be considered:
(i) Establishing multiple lanes
It is a common practice in the world to set up multiple lanes
at the border as they help in reducing congestion;
(ii) Designated lanes for specific commodities/transporters (fast
lanes).
Dedicated lanes (fast lanes) will be an incentive for Authorized
Economic Operators (AEO). A dedicated lane for petroleum
products will be beneficial for speeding up its border crossing,
also to be considered for other commodities.
2.11 FINANCIAL STRATEGY
2.11.1 Financial Capacity in Kenya and Uganda
2.11.1.1 Kenya
The Government of Kenya established a Railway Development
Fund, which collects 1.5% as Railway Development Levy (RDL) on
all imports. It is projected that the RDL will increase from Ksh 19.7
billion in 2013/14 to Ksh 32.3 billion in 2017/18. The RDL is to be
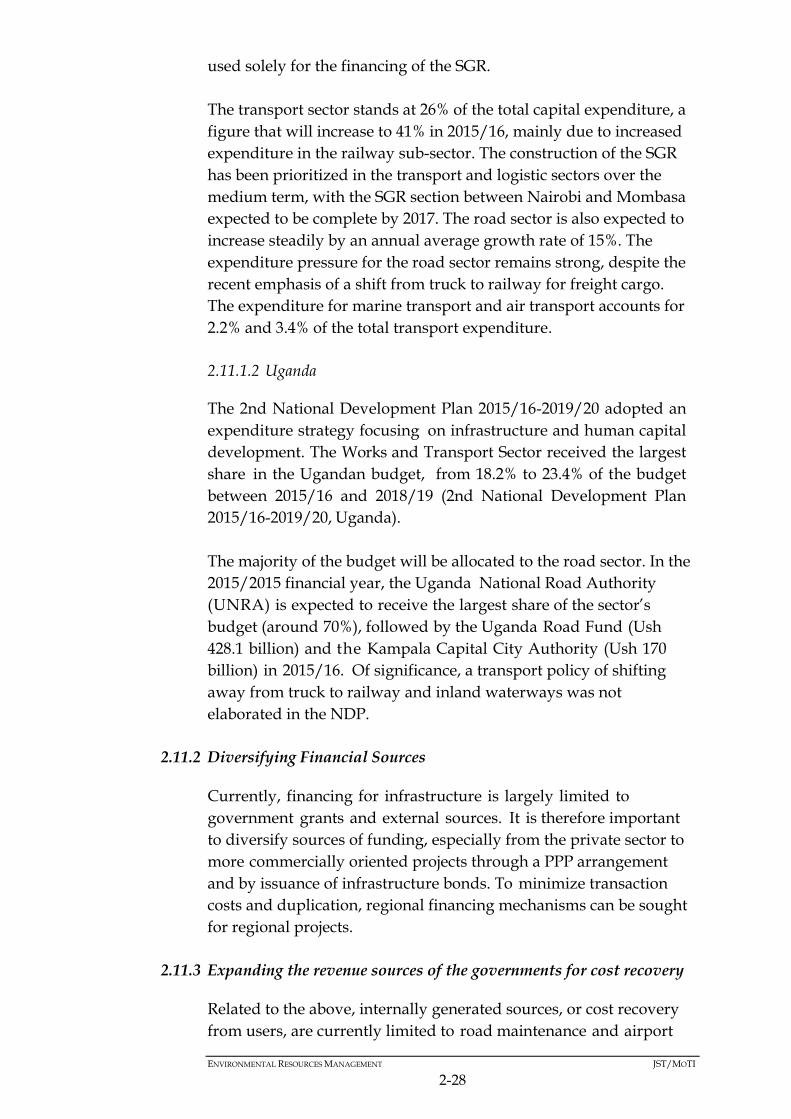
ENVIRONMENTAL RESOURCES MANAGEMENT JST/MOTI
2-28
used solely for the financing of the SGR.
The transport sector stands at 26% of the total capital expenditure, a
figure that will increase to 41% in 2015/16, mainly due to increased
expenditure in the railway sub-sector. The construction of the SGR
has been prioritized in the transport and logistic sectors over the
medium term, with the SGR section between Nairobi and Mombasa
expected to be complete by 2017. The road sector is also expected to
increase steadily by an annual average growth rate of 15%. The
expenditure pressure for the road sector remains strong, despite the
recent emphasis of a shift from truck to railway for freight cargo.
The expenditure for marine transport and air transport accounts for
2.2% and 3.4% of the total transport expenditure.
2.11.1.2 Uganda
The 2nd National Development Plan 2015/16-2019/20 adopted an
expenditure strategy focusing on infrastructure and human capital
development. The Works and Transport Sector received the largest
share in the Ugandan budget, from 18.2% to 23.4% of the budget
between 2015/16 and 2018/19 (2nd National Development Plan
2015/16-2019/20, Uganda).
The majority of the budget will be allocated to the road sector. In the
2015/2015 financial year, the Uganda National Road Authority
(UNRA) is expected to receive the largest share of the sector’s
budget (around 70%), followed by the Uganda Road Fund (Ush
428.1 billion) and the Kampala Capital City Authority (Ush 170
billion) in 2015/16. Of significance, a transport policy of shifting
away from truck to railway and inland waterways was not
elaborated in the NDP.
2.11.2 Diversifying Financial Sources
Currently, financing for infrastructure is largely limited to
government grants and external sources. It is therefore important
to diversify sources of funding, especially from the private sector to
more commercially oriented projects through a PPP arrangement
and by issuance of infrastructure bonds. To minimize transaction
costs and duplication, regional financing mechanisms can be sought
for regional projects.
2.11.3 Expanding the revenue sources of the governments for cost recovery
Related to the above, internally generated sources, or cost recovery
from users, are currently limited to road maintenance and airport
ENVIRONMENTAL RESOURCES MANAGEMENT JST/MOTI
2-29
operations in the transport sector. Cost recovery from users
should be expanded to the extent possible, in order to respond to
increasing financing needs and for financial sustainability. The
largest financing needs for the NEC is the SGR investment in the
medium to long term, and a principle of cost recovery should be
analyzed to the extent possible for this investment.
2.12 ORGANISATIONAL AND POLICY STRATEGY
2.12.1 Regional Coordination for logistics improvement
The organizational and regulatory framework for logistics and
multi-modal transportation needs to be established at the regional
level. Regional coordination for planning and monitoring for the
NEC is so far being implemented by the Northern Corridor Transit
Transport Coordination Authority (NCTTCA). NCTTCA’s function
with coordination of ministries concerned for both Kenya and
Uganda should be maintained. On the other hand, regional
coordination mechanisms and private sector involvement are being
developed through the Northern Corridor Integration Projects
(NCIP).
2.12.2 Proposed Organisational Framework
Considering the current situation, some recommendations for
organizational framework as well as organizational structure are
proposed.
Once the Management Plan is approved and implementation
thereof has commenced, there must be a monitoring and evaluation
mechanism. It is essential therefore, under the initiative of MoTI /
Ministry of Works and Transport (MoWT) in Uganda, to establish a
taskforce covering various ministries/agencies in charge of
transport, finance, trade, industry, agriculture, mining, energy,
water etc. as well as private sector organizations and NCTTCA, to
monitor and evaluate the implementation of this Plan.
It is recommended that the working group and steering committee
should be maintained after the JICA study as a further monitoring
and implementation mechanism.
2.13 OVERALL IMPLEMENTATION STRATEGY
Out of all the suggested 119 projects for the development of the

ENVIRONMENTAL RESOURCES MANAGEMENT JST/MOTI
2-30
NEC (see Annex C for a detailed list of these projects and the
respective maps of their location), the JST has selected 23 flagship
projects that can contribute to continued logistics improvement
along the NEC, and to future economic development of each
country, as well as the region. The locations of the 23 NEC flagship
projects are shown in Figure 2.6 and Table 2.4 below:
The primary aim of these flagship projects is to:
• Solve future logistics bottlenecks along the NEC including at the port, roads, and logistic hubs,
• Contribute to cross border infrastructure, such as pipelines and transmission lines,
• Develop key industrial areas along the NEC, • Ensure power and water supply to identified key industrial areas,
and • Support agribusiness and mining business developments.

ENVIRONMENTAL RESOURCES MANAGEMENT JST/MOTI
2-31
Figure 2.6 Location of NEC Flagship Projects
Source: JST, 2016

ENVIRONMENTAL RESOURCES MANAGEMENT JST/MOTI
2-32
Table 2.4 Location of Flagship NEC Projects in Kenya and Uganda
No. Sector Project Title
1 Mining Eldoret-Kampala-Kigali Oil Pipeline Project
2 Mining ICT Project in Northern Corridor
3 Road Logistics Highway Project
4 Logistics Logistic Hub Project
5 Power Northern Corridor Integration Backbone (Power Generation, Transmission and
Interconnectivity)
6 Road Eldoret-Juba Highway Project
7 Port Mombasa Port Development Project
8 Urban Dev’t Project for Support of Re-organizing Logistics Facilities around Mombasa Port Area
9 Water Stony Athi Dam and Upper Athi Dam Project
10 Water Mwache Dam Project
11 Power Isinya-Nairobi East Transmission Line Project
12 Industry Geothermal Energy Based Regional Industrial Development in Rift Valley
13 Power Geothermal Project in Rift Valley
14 Power Mombasa Coal Power and Mariakani Substation Project
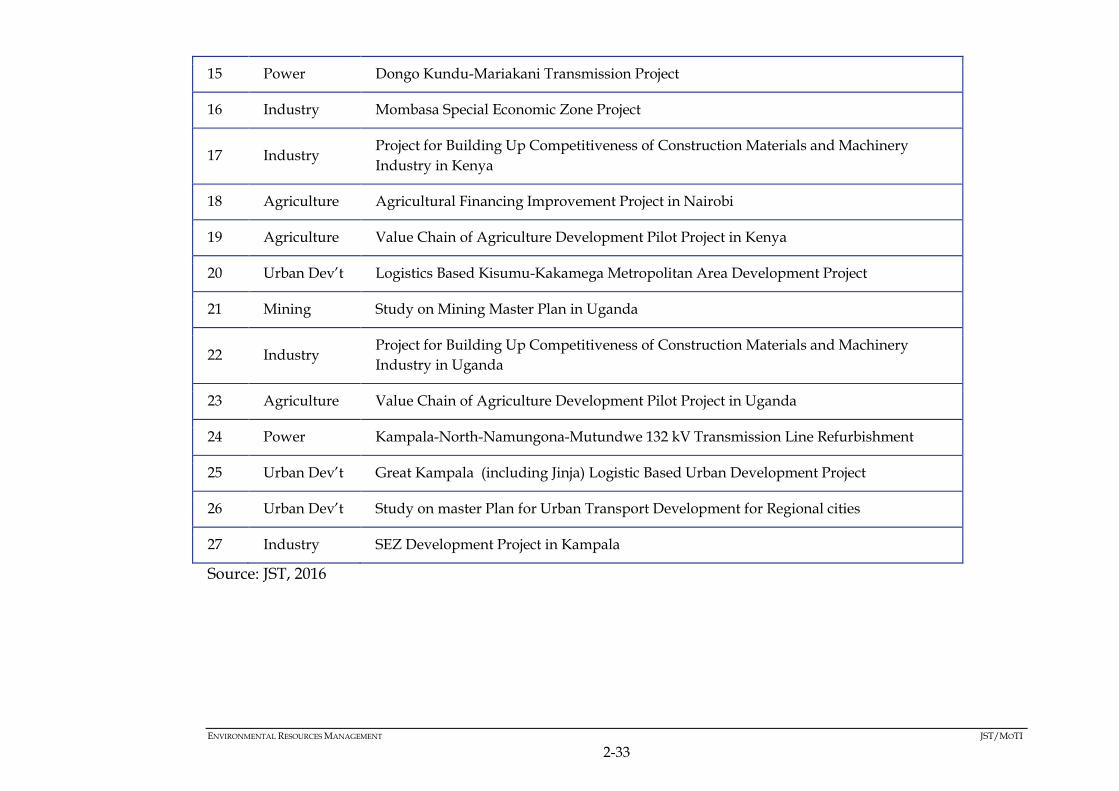
ENVIRONMENTAL RESOURCES MANAGEMENT JST/MOTI
2-33
15 Power Dongo Kundu-Mariakani Transmission Project
16 Industry Mombasa Special Economic Zone Project
17 Industry Project for Building Up Competitiveness of Construction Materials and Machinery
Industry in Kenya
18 Agriculture Agricultural Financing Improvement Project in Nairobi
19 Agriculture Value Chain of Agriculture Development Pilot Project in Kenya
20 Urban Dev’t Logistics Based Kisumu-Kakamega Metropolitan Area Development Project
21 Mining Study on Mining Master Plan in Uganda
22 Industry Project for Building Up Competitiveness of Construction Materials and Machinery
Industry in Uganda
23 Agriculture Value Chain of Agriculture Development Pilot Project in Uganda
24 Power Kampala-North-Namungona-Mutundwe 132 kV Transmission Line Refurbishment
25 Urban Dev’t Great Kampala (including Jinja) Logistic Based Urban Development Project
26 Urban Dev’t Study on master Plan for Urban Transport Development for Regional cities
27 Industry SEZ Development Project in Kampala
Source: JST, 2016

ENVIRONMENTAL RESOURCES MANAGEMENT JST/MOTI
3-1
3 LEGAL AND INSTITUTIONAL FRAMEWORK
3.1 GENERAL OVERVIEW
This Chapter addresses the relevant legislative framework and related
PPP documents as well as the gap analysis.
3.2 PLANS, POLICIES AND PROGRAMS (PPPS)
Table 3.1 below lists the PPPs that are relevant to the Master Plan.

ENVIRONMENTAL RESOURCES MANAGEMENT JST/MOTI
3-2
Table 3.1 Relevant PPPs
PPPs Brief Description Relevance to the NEC Master Plan
Policies
Vision 2030 Long-term development blueprint for the
country. It aims to transform Kenya into
“a newly industrialized, middle-income
country providing a high quality of life to
all its citizens.
Contribution to economic and social
development along the NEC is among the
key objectives of the Master Plan and this
is in tandem with Kenya’s transformation
theme of Vision 2030.
Regional Development Policy The policy revolves around four key
pillars namely; the establishment of a
sound institutional framework for
implementing the policy; the formulation
of integrated regional plans; reforms in
the legal environment in order to create a
more cohesive framework for regional
development and a robust monitoring
framework that will develop and monitor
the achievement of key indicators
and milestones of regional development
The implementation of this Master Plan
will need to be consistent with the
provisions of this Policy in order to avoid
conflicts with development in the various
regions and counties.
Development and Management of the
Roads Sub-Sector for Sustainable
Economic Growth, Sessional Paper No 5
of 2006
Management of the roads sub-sector for
sustainable economic growth and being
implemented by the Roads’ Authorities,
specifically Kenya Rural Roads Authority
(KeRRA), Kenya Urban Roads Authority
(KURA) and Kenya National Highways
Authority (KeNHA)
The NEC includes the development of
roads infrastructure and the Sessional
Paper presents various policies for the
roads sub-sector

ENVIRONMENTAL RESOURCES MANAGEMENT JST/MOTI
3-3
PPPs Brief Description Relevance to the NEC Master Plan
Integrated National Transport Policy,
2010
This Policy identifies a number of
challenges inhibiting the transport sector
from performing its facilitative role in
respect of national and regional
economies.
The document proposes measures aimed
at “Consolidation of Urban Public
Transport”, through encouraging a shift
to high occupancy vehicles amongst other
measures.
These measures will have to be
considered in the implementation of the
Master Plan.
National Land Policy, Sessional Paper No.
3 of 2009
The National Land Policy provides a
platform for addressing current issues
such as access to land, land use planning,
restitution of historical injustices,
environmental degradation, conflicts,
unplanned proliferation of informal
settlements, out-dated legal framework,
institutional framework and information
management.
The implementation of the Master Plan
will need to be consistent with the
provisions of this Policy in order to avoid
conflicts. Among the issues that will have
to be addressed, are the modalities for the
acquisition of land in order to
accommodate activities prescribed by the
Master Plan.
The Agricultural Sector Development
Strategy 2010-2020
This is the overall national policy
document for the agricultural sector. The
strategy promotes sustainable food
production and agroforestry. There are
also broad implications for the forestry
sector that are detailed in one of the six
sub-sectors of the agriculture sector
All guiding principles in this policy that
promotes sustainable development of the
agricultural sector will be considered in
the development and implementation of
the Master Plan.
Environment and Sustainable
Development Policy, Sessional Paper No.
6 of 1999
This Policy aims to harmonize
environmental and developmental goals
for sustainability. It also provides
comprehensive guidelines and strategies
for government action on the
environment and development.
Activities associated with the
implementation of the Master Plan could
give rise to both environmental and social
impacts. Therefore the specific projects
within the Master Plan should be
developed in a sustainable manner.

ENVIRONMENTAL RESOURCES MANAGEMENT JST/MOTI
3-4
PPPs Brief Description Relevance to the NEC Master Plan
Wildlife Policy, Sessional Paper No. 3 of
1975
This Policy governs wildlife management
in Kenya and its goal is "to optimize
returns from this resource, taking account
of returns from other land use". The
policy not only recognises economic
benefits from tourism and consumptive
uses but also the intangible benefits that
include the aesthetic, cultural and
scientific gains that accrue from
conservation of habitats and the fauna
within them.
The NEC traverses some protected areas
such as the Tsavo East and Tsavo West
National Parks. Potential impacts on these
protected areas will need to be assessed
and minimised.
National Disaster Management Policy,
2009
This Policy establishes the guiding
principles and architecture for disaster
management in Kenya by presenting the
institutional structures, roles,
responsibilities, authorities, and key
processes required to achieve a
coordinated, coherent, and consistent
approach.
Both the SEA and Master Plan will
address the risks of natural disasters to
the various infrastructure projects.
Energy Policy, 2005 The Energy Policy seeks to ensure an
adequate, quality, cost-effective and
affordable supply of energy to meet
development needs, while protecting and
conserving the environment, with a bias
towards the exploitation of green energy
The NEC is traversed by energy
infrastructure that could be impacted by
activities related to the Master Plan. Some
infrastructure projects of the NEC will
also require energy to power them.
Sessional Paper on Energy, 2004 The broad objective of the energy policy is
to ensure adequate, quality, cost effective
and affordable supply of energy to meet
development needs, while protecting and
conserving the environment.
The need and demand for energy is at the
core of all three development strategies
being considered in the NEC Master Plan,
being the key driver to economic growth
being led by the Industrial Strategy.
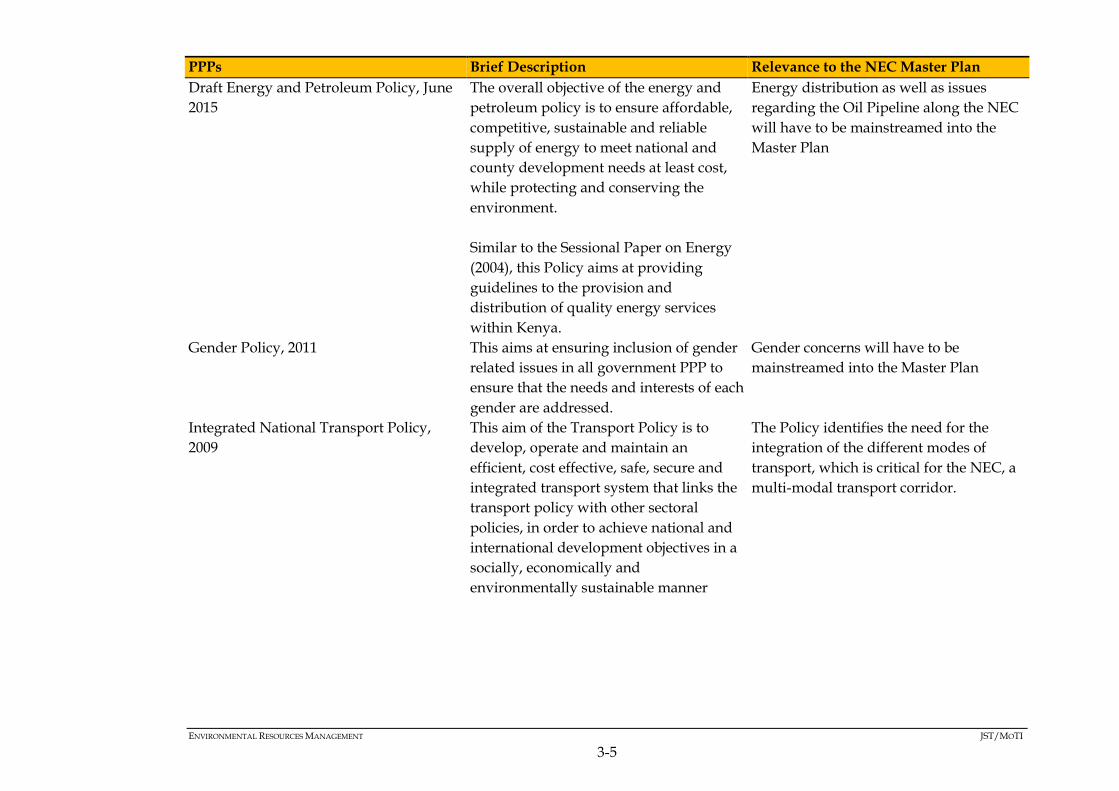
ENVIRONMENTAL RESOURCES MANAGEMENT JST/MOTI
3-5
PPPs Brief Description Relevance to the NEC Master Plan
Draft Energy and Petroleum Policy, June
2015
The overall objective of the energy and
petroleum policy is to ensure affordable,
competitive, sustainable and reliable
supply of energy to meet national and
county development needs at least cost,
while protecting and conserving the
environment.
Similar to the Sessional Paper on Energy
(2004), this Policy aims at providing
guidelines to the provision and
distribution of quality energy services
within Kenya.
Energy distribution as well as issues
regarding the Oil Pipeline along the NEC
will have to be mainstreamed into the
Master Plan
Gender Policy, 2011 This aims at ensuring inclusion of gender
related issues in all government PPP to
ensure that the needs and interests of each
gender are addressed.
Gender concerns will have to be
mainstreamed into the Master Plan
Integrated National Transport Policy,
2009
This aim of the Transport Policy is to
develop, operate and maintain an
efficient, cost effective, safe, secure and
integrated transport system that links the
transport policy with other sectoral
policies, in order to achieve national and
international development objectives in a
socially, economically and
environmentally sustainable manner
The Policy identifies the need for the
integration of the different modes of
transport, which is critical for the NEC, a
multi-modal transport corridor.

ENVIRONMENTAL RESOURCES MANAGEMENT JST/MOTI
3-6
PPPs Brief Description Relevance to the NEC Master Plan
National Policy on Water Resources
Management and Development, Sessional
Paper No. 1 of 1999,
This Policy recognizes that water is one of
the most important resources for human
survival and is guided by four specific
policy as follows:
1) Preserve, conserve and protect
available water resources and allocate
it in a sustainable, rational, and
economic way.
2) Supply water of good quality in
sufficient quantities to meet the
various water needs, including
poverty alleviation, while ensuring
the safe disposal of wastewater and
environmental protection.
3) Establish an efficient and effective
institutional framework to achieve a
systematic development and
management of the water sector.
4) Develop a sound and sustainable
financing system for effective water
resources management, water supply
and sanitation development.
The implementation of the Master Plan
should conform to sound integrated
water resource management practices.
Kenya Health Policy 2014- 2030 The goal of the Kenya Health Policy 2014–
2030 is attainment of the highest standard
of health in a manner responsive to the
needs of the Kenya population. This
Policy stands on the principle of equitable
distribution of health services within the
Country.
The majority of the County’s population
is currently along the NEC thus having an
inclusive health strategy is key to the
implementation of the Master Plan.
Plans
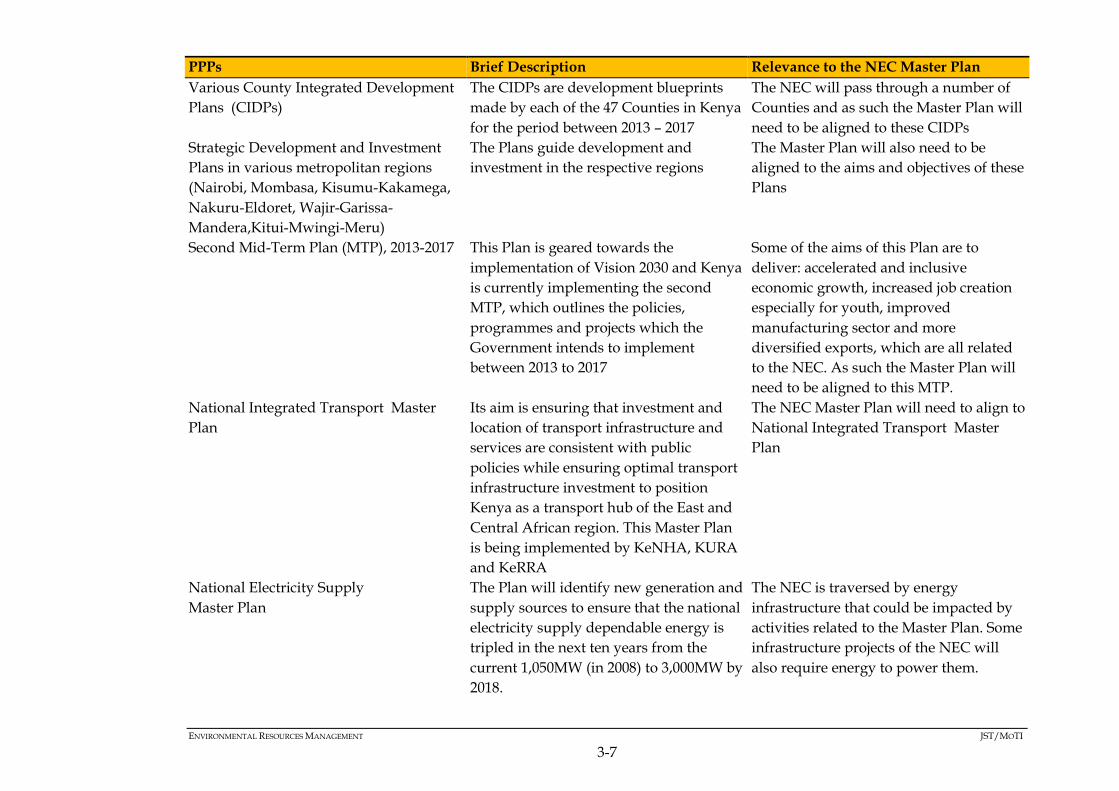
ENVIRONMENTAL RESOURCES MANAGEMENT JST/MOTI
3-7
PPPs Brief Description Relevance to the NEC Master Plan
Various County Integrated Development
Plans (CIDPs)
The CIDPs are development blueprints
made by each of the 47 Counties in Kenya
for the period between 2013 – 2017
The NEC will pass through a number of
Counties and as such the Master Plan will
need to be aligned to these CIDPs
Strategic Development and Investment
Plans in various metropolitan regions
(Nairobi, Mombasa, Kisumu-Kakamega,
Nakuru-Eldoret, Wajir-Garissa-
Mandera,Kitui-Mwingi-Meru)
The Plans guide development and
investment in the respective regions
The Master Plan will also need to be
aligned to the aims and objectives of these
Plans
Second Mid-Term Plan (MTP), 2013-2017 This Plan is geared towards the
implementation of Vision 2030 and Kenya
is currently implementing the second
MTP, which outlines the policies,
programmes and projects which the
Government intends to implement
between 2013 to 2017
Some of the aims of this Plan are to
deliver: accelerated and inclusive
economic growth, increased job creation
especially for youth, improved
manufacturing sector and more
diversified exports, which are all related
to the NEC. As such the Master Plan will
need to be aligned to this MTP.
National Integrated Transport Master
Plan
Its aim is ensuring that investment and
location of transport infrastructure and
services are consistent with public
policies while ensuring optimal transport
infrastructure investment to position
Kenya as a transport hub of the East and
Central African region. This Master Plan
is being implemented by KeNHA, KURA
and KeRRA
The NEC Master Plan will need to align to
National Integrated Transport Master
Plan
National Electricity Supply
Master Plan
The Plan will identify new generation and
supply sources to ensure that the national
electricity supply dependable energy is
tripled in the next ten years from the
current 1,050MW (in 2008) to 3,000MW by
2018.
The NEC is traversed by energy
infrastructure that could be impacted by
activities related to the Master Plan. Some
infrastructure projects of the NEC will
also require energy to power them.

ENVIRONMENTAL RESOURCES MANAGEMENT JST/MOTI
3-8
PPPs Brief Description Relevance to the NEC Master Plan
Kenya ICT Master Plan 2014 - 2018 The purpose of this Master Plan is to
review and update the Connected Kenya
Master Plan launched in February 2013
with a view to extend stakeholders
participation
The NEC will include the installation of
fibre optic cables, which will need to be
aligned to the National ICT Master Plan
Kenya National Climate Change Action
Plan, 2013-2017
This comprehensive National Climate
Change Action Plan (NCCAP) takes
forward the implementation of Kenya’s
Climate Change Strategy. The NCCAP is
expected to inform national development
and policy decisions in all sectors of the
economy. A wide range of actors
including Government agencies, private
sector and civil society organizations will
contribute to the implementation of the
NCCAP.
The Master Plan for the NEC will need to
consider aspects of Climate Variability,
Resilience and Vulnerability in
agricultural sector development.
Agriculture is the backbone of the Kenyan
economy directly contributing 24% of the
GDP valued at KSh342 billion in 2009 (1)
and another 27% indirectly, valued at
KSsh.385 billion.
Programs
Rural Electrification Program (REP) A Rural Electrification Program financed
to the tune of Kshs. 2.7 billion to cover
various parts of the Country. Upon
completion the project will facilitate
connection of power to 460 trading
centres and 110 secondary schools, among
other public amenities
The NEC is traversed by energy
infrastructure that could be impacted by
activities related to the Master Plan. Some
infrastructure projects of the NEC will
also require energy to power them.
(1) This is as analysed in the Kenya National Bureau of Statistics. 2012. Economic Survey 2011. Nairobi: Government of Kenya.
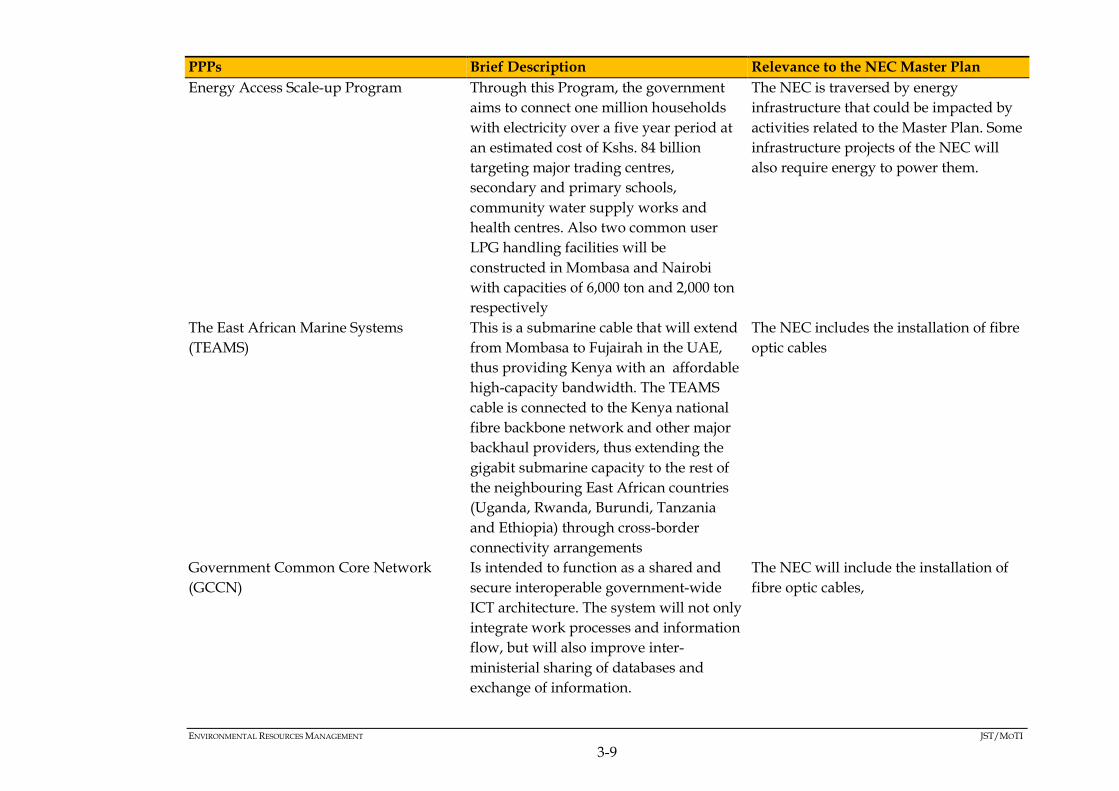
ENVIRONMENTAL RESOURCES MANAGEMENT JST/MOTI
3-9
PPPs Brief Description Relevance to the NEC Master Plan
Energy Access Scale-up Program Through this Program, the government
aims to connect one million households
with electricity over a five year period at
an estimated cost of Kshs. 84 billion
targeting major trading centres,
secondary and primary schools,
community water supply works and
health centres. Also two common user
LPG handling facilities will be
constructed in Mombasa and Nairobi
with capacities of 6,000 ton and 2,000 ton
respectively
The NEC is traversed by energy
infrastructure that could be impacted by
activities related to the Master Plan. Some
infrastructure projects of the NEC will
also require energy to power them.
The East African Marine Systems
(TEAMS)
This is a submarine cable that will extend
from Mombasa to Fujairah in the UAE,
thus providing Kenya with an affordable
high-capacity bandwidth. The TEAMS
cable is connected to the Kenya national
fibre backbone network and other major
backhaul providers, thus extending the
gigabit submarine capacity to the rest of
the neighbouring East African countries
(Uganda, Rwanda, Burundi, Tanzania
and Ethiopia) through cross-border
connectivity arrangements
The NEC includes the installation of fibre
optic cables
Government Common Core Network
(GCCN)
Is intended to function as a shared and
secure interoperable government-wide
ICT architecture. The system will not only
integrate work processes and information
flow, but will also improve inter-
ministerial sharing of databases and
exchange of information.
The NEC will include the installation of
fibre optic cables,
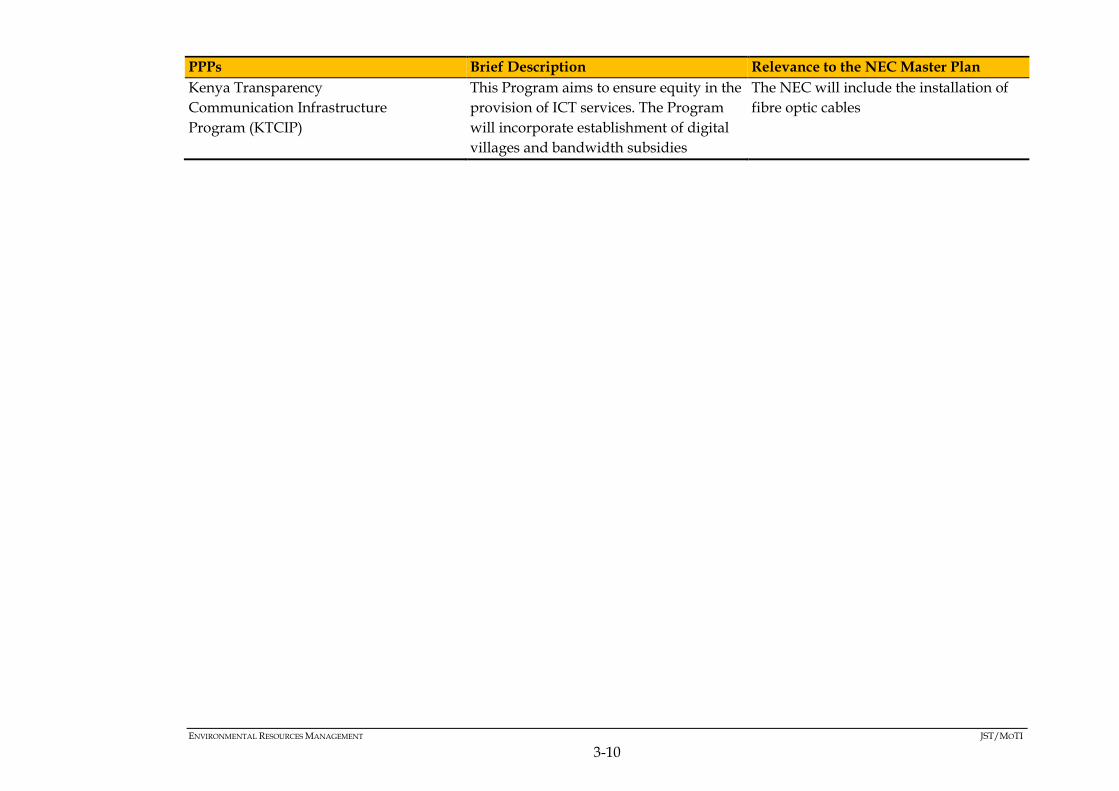
ENVIRONMENTAL RESOURCES MANAGEMENT JST/MOTI
3-10
PPPs Brief Description Relevance to the NEC Master Plan
Kenya Transparency
Communication Infrastructure
Program (KTCIP)
This Program aims to ensure equity in the
provision of ICT services. The Program
will incorporate establishment of digital
villages and bandwidth subsidies
The NEC will include the installation of
fibre optic cables

ENVIRONMENTAL RESOURCES MANAGEMENT JST/MOTI
3-11
3.3 LEGAL FRAMEWORK
3.3.1 East African Regional Legal Framework
Table 3.2 discusses the East Africa Regional Legislation that is relevant to the
Master Plan.

ENVIRONMENTAL RESOURCES MANAGEMENT JST/MOTI
3-12
Table 3.2 Relevant East African Regional Legislation
Regional Legislation Brief Description Relevance to the Master Plan
The Constitutive Act of the African
Union, 2000
This Act establishes the African Union to
achieve several objectives, including:
Accelerate the political and socio-
economic integration of the
continent.
Establish the necessary conditions
which enable the continent to play its
rightful role in the global economy
and in international negotiations.
Coordinate and harmonize the
policies between the existing and
future Regional Economic
Communities for the gradual
attainment of the objectives of the
Union.
The NEC will need to consider the
objective set by the African Union to
coordinate and harmonise policies (such
as the Master Plan) between existing and
future regional communities (i.e. East
African Communities) in order to attain
the goal of accelerated harmonised
political and socio economic integration.

ENVIRONMENTAL RESOURCES MANAGEMENT JST/MOTI
3-13
Regional Legislation Brief Description Relevance to the Master Plan
Treaty for the Common Market for
Eastern and Southern Africa, 1993;
This Treaty establishes the Common
Market of the Eastern and Southern
Regions of Africa.
The Treaty has the objective to attain
sustainable growth and development of
the Member States by promoting a more
balanced and harmonious development of
its production and marketing structures.
In addition, the Treaty aims to co-operate
in the creation of an enabling
environment for foreign, cross border and
domestic investment including the joint
promotion of research and adaptation of
science and technology for development.
As noted above, the Treaty for Common
market for Eastern and Southern Africa
aims to harmonise regional economic
growth and increase regional trade and
industry. As such the NEC aims to create
an enabling environment for foreign cross
border investments, industry and trade.
Treaty for the establishment of the East
African Community (EAC), 1999
This treaty establishes the East African
Community (EAC).
The NEC aims to increase efficient trade
and industry between the three countries
within the EAC i.e. Rwanda, Uganda and
Kenya among others.
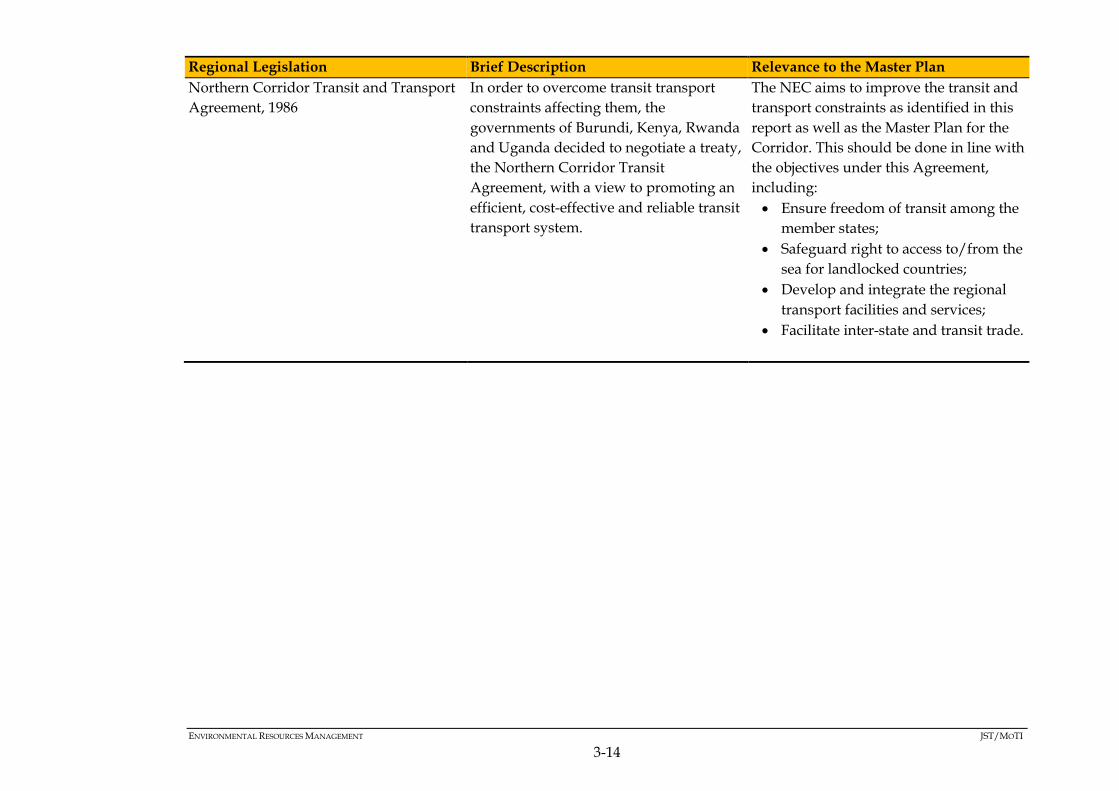
ENVIRONMENTAL RESOURCES MANAGEMENT JST/MOTI
3-14
Regional Legislation Brief Description Relevance to the Master Plan
Northern Corridor Transit and Transport
Agreement, 1986
In order to overcome transit transport
constraints affecting them, the
governments of Burundi, Kenya, Rwanda
and Uganda decided to negotiate a treaty,
the Northern Corridor Transit
Agreement, with a view to promoting an
efficient, cost-effective and reliable transit
transport system.
The NEC aims to improve the transit and
transport constraints as identified in this
report as well as the Master Plan for the
Corridor. This should be done in line with
the objectives under this Agreement,
including:
Ensure freedom of transit among the
member states;
Safeguard right to access to/from the
sea for landlocked countries;
Develop and integrate the regional
transport facilities and services;
Facilitate inter-state and transit trade.

ENVIRONMENTAL RESOURCES MANAGEMENT JST/MOTI
3-15
3.3.2 National Legal Framework
Table 3.3 discusses the National Legislation that is relevant to the Master Plan
in Kenya.
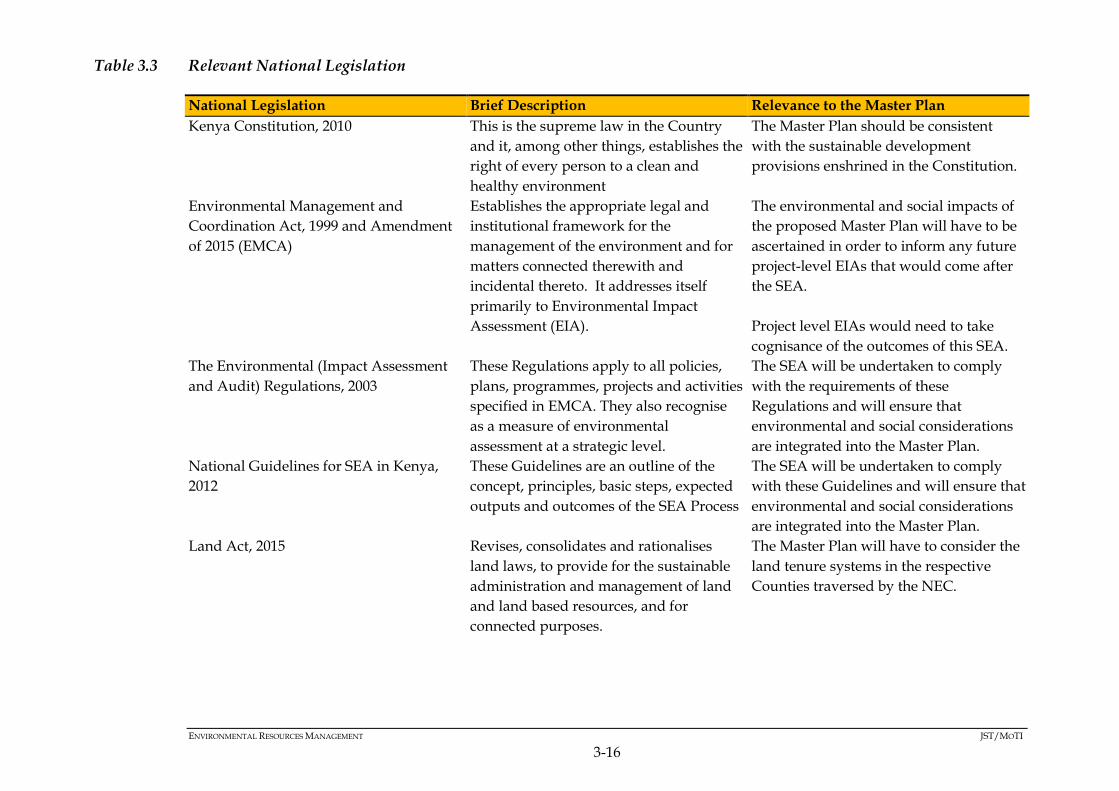
ENVIRONMENTAL RESOURCES MANAGEMENT JST/MOTI
3-16
Table 3.3 Relevant National Legislation
National Legislation Brief Description Relevance to the Master Plan
Kenya Constitution, 2010 This is the supreme law in the Country
and it, among other things, establishes the
right of every person to a clean and
healthy environment
The Master Plan should be consistent
with the sustainable development
provisions enshrined in the Constitution.
Environmental Management and
Coordination Act, 1999 and Amendment
of 2015 (EMCA)
Establishes the appropriate legal and
institutional framework for the
management of the environment and for
matters connected therewith and
incidental thereto. It addresses itself
primarily to Environmental Impact
Assessment (EIA).
The environmental and social impacts of
the proposed Master Plan will have to be
ascertained in order to inform any future
project-level EIAs that would come after
the SEA.
Project level EIAs would need to take
cognisance of the outcomes of this SEA.
The Environmental (Impact Assessment
and Audit) Regulations, 2003
These Regulations apply to all policies,
plans, programmes, projects and activities
specified in EMCA. They also recognise
as a measure of environmental
assessment at a strategic level.
The SEA will be undertaken to comply
with the requirements of these
Regulations and will ensure that
environmental and social considerations
are integrated into the Master Plan.
National Guidelines for SEA in Kenya,
2012
These Guidelines are an outline of the
concept, principles, basic steps, expected
outputs and outcomes of the SEA Process
The SEA will be undertaken to comply
with these Guidelines and will ensure that
environmental and social considerations
are integrated into the Master Plan.
Land Act, 2015 Revises, consolidates and rationalises
land laws, to provide for the sustainable
administration and management of land
and land based resources, and for
connected purposes.
The Master Plan will have to consider the
land tenure systems in the respective
Counties traversed by the NEC.
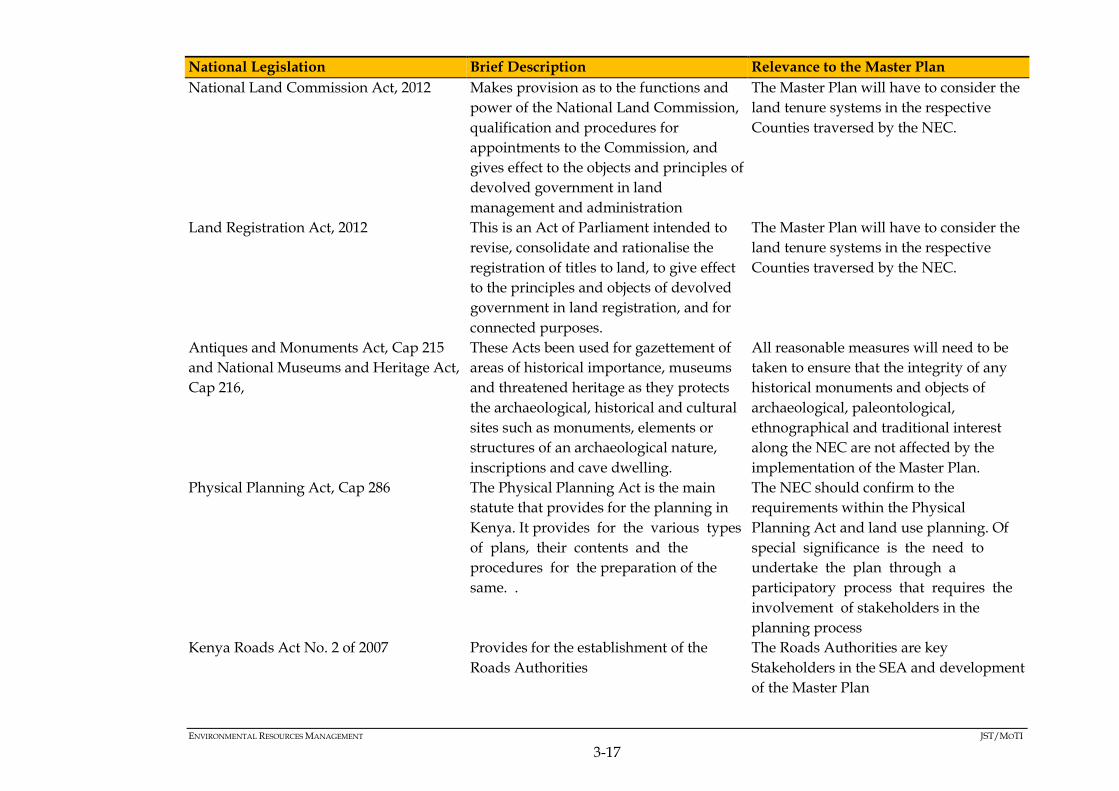
ENVIRONMENTAL RESOURCES MANAGEMENT JST/MOTI
3-17
National Legislation Brief Description Relevance to the Master Plan
National Land Commission Act, 2012 Makes provision as to the functions and
power of the National Land Commission,
qualification and procedures for
appointments to the Commission, and
gives effect to the objects and principles of
devolved government in land
management and administration
The Master Plan will have to consider the
land tenure systems in the respective
Counties traversed by the NEC.
Land Registration Act, 2012 This is an Act of Parliament intended to
revise, consolidate and rationalise the
registration of titles to land, to give effect
to the principles and objects of devolved
government in land registration, and for
connected purposes.
The Master Plan will have to consider the
land tenure systems in the respective
Counties traversed by the NEC.
Antiques and Monuments Act, Cap 215
and National Museums and Heritage Act,
Cap 216,
These Acts been used for gazettement of
areas of historical importance, museums
and threatened heritage as they protects
the archaeological, historical and cultural
sites such as monuments, elements or
structures of an archaeological nature,
inscriptions and cave dwelling.
All reasonable measures will need to be
taken to ensure that the integrity of any
historical monuments and objects of
archaeological, paleontological,
ethnographical and traditional interest
along the NEC are not affected by the
implementation of the Master Plan.
Physical Planning Act, Cap 286 The Physical Planning Act is the main
statute that provides for the planning in
Kenya. It provides for the various types
of plans, their contents and the
procedures for the preparation of the
same. .
The NEC should confirm to the
requirements within the Physical
Planning Act and land use planning. Of
special significance is the need to
undertake the plan through a
participatory process that requires the
involvement of stakeholders in the
planning process
Kenya Roads Act No. 2 of 2007 Provides for the establishment of the
Roads Authorities
The Roads Authorities are key
Stakeholders in the SEA and development
of the Master Plan
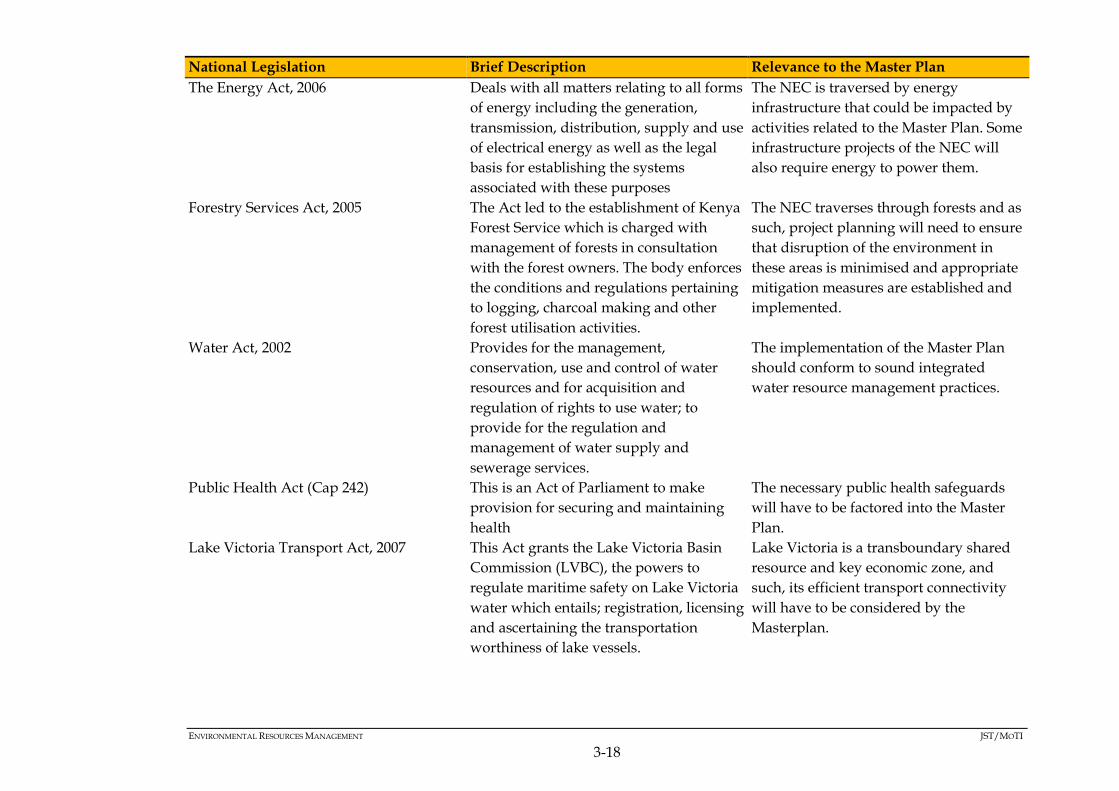
ENVIRONMENTAL RESOURCES MANAGEMENT JST/MOTI
3-18
National Legislation Brief Description Relevance to the Master Plan
The Energy Act, 2006 Deals with all matters relating to all forms
of energy including the generation,
transmission, distribution, supply and use
of electrical energy as well as the legal
basis for establishing the systems
associated with these purposes
The NEC is traversed by energy
infrastructure that could be impacted by
activities related to the Master Plan. Some
infrastructure projects of the NEC will
also require energy to power them.
Forestry Services Act, 2005 The Act led to the establishment of Kenya
Forest Service which is charged with
management of forests in consultation
with the forest owners. The body enforces
the conditions and regulations pertaining
to logging, charcoal making and other
forest utilisation activities.
The NEC traverses through forests and as
such, project planning will need to ensure
that disruption of the environment in
these areas is minimised and appropriate
mitigation measures are established and
implemented.
Water Act, 2002 Provides for the management,
conservation, use and control of water
resources and for acquisition and
regulation of rights to use water; to
provide for the regulation and
management of water supply and
sewerage services.
The implementation of the Master Plan
should conform to sound integrated
water resource management practices.
Public Health Act (Cap 242) This is an Act of Parliament to make
provision for securing and maintaining
health
The necessary public health safeguards
will have to be factored into the Master
Plan.
Lake Victoria Transport Act, 2007 This Act grants the Lake Victoria Basin
Commission (LVBC), the powers to
regulate maritime safety on Lake Victoria
water which entails; registration, licensing
and ascertaining the transportation
worthiness of lake vessels.
Lake Victoria is a transboundary shared
resource and key economic zone, and
such, its efficient transport connectivity
will have to be considered by the
Masterplan.
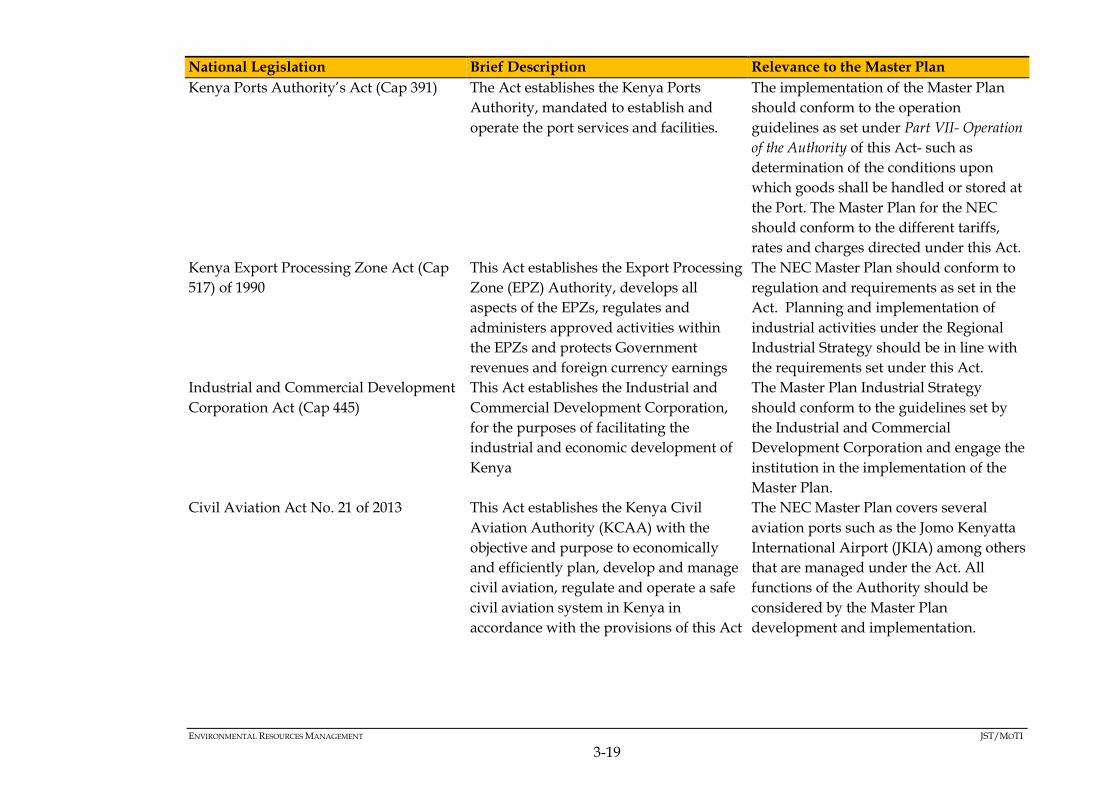
ENVIRONMENTAL RESOURCES MANAGEMENT JST/MOTI
3-19
National Legislation Brief Description Relevance to the Master Plan
Kenya Ports Authority’s Act (Cap 391) The Act establishes the Kenya Ports
Authority, mandated to establish and
operate the port services and facilities.
The implementation of the Master Plan
should conform to the operation
guidelines as set under Part VII- Operation
of the Authority of this Act- such as
determination of the conditions upon
which goods shall be handled or stored at
the Port. The Master Plan for the NEC
should conform to the different tariffs,
rates and charges directed under this Act.
Kenya Export Processing Zone Act (Cap
517) of 1990
This Act establishes the Export Processing
Zone (EPZ) Authority, develops all
aspects of the EPZs, regulates and
administers approved activities within
the EPZs and protects Government
revenues and foreign currency earnings
The NEC Master Plan should conform to
regulation and requirements as set in the
Act. Planning and implementation of
industrial activities under the Regional
Industrial Strategy should be in line with
the requirements set under this Act.
Industrial and Commercial Development
Corporation Act (Cap 445)
This Act establishes the Industrial and
Commercial Development Corporation,
for the purposes of facilitating the
industrial and economic development of
Kenya
The Master Plan Industrial Strategy
should conform to the guidelines set by
the Industrial and Commercial
Development Corporation and engage the
institution in the implementation of the
Master Plan.
Civil Aviation Act No. 21 of 2013 This Act establishes the Kenya Civil
Aviation Authority (KCAA) with the
objective and purpose to economically
and efficiently plan, develop and manage
civil aviation, regulate and operate a safe
civil aviation system in Kenya in
accordance with the provisions of this Act
The NEC Master Plan covers several
aviation ports such as the Jomo Kenyatta
International Airport (JKIA) among others
that are managed under the Act. All
functions of the Authority should be
considered by the Master Plan
development and implementation.

ENVIRONMENTAL RESOURCES MANAGEMENT JST/MOTI
3-20
National Legislation Brief Description Relevance to the Master Plan
The Kenya Railways Corporations Act
(Cap 397)
This Act establishes the Kenya Railways
Corporation also known as Kenya
Railways (KR). The Act gives KR the
mandate to manage and own both
movable and immovable assets on behalf
of the Kenya Government. The Act also
allows KR to enter into an agreement/
concession to operate the railway
transport in the country.
The NEC Master Plan should consider all
agreements and established functions by
the KR as well as expansion of railway
transport led by the Corporation.
Wildlife Conservation and Management
Act (2013)
This Act establishes the different
strategies to conserve and protect Kenya’s
Wildlife. In the Act, conservation
measures and management principles are
guided by effective public participation
and ecosystem approach.
It is important that the Master Plan
considers participatory approach to
implementing the different strategies in
order to ensure sustainable development
along the NEC where several Wildlife
Conservation regions are located-
including the Nairobi National Park and
Nakuru National Park among others that
are managed by the Kenya Wildlife
Service (KWS) - mandated by
Government under this act.

ENVIRONMENTAL RESOURCES MANAGEMENT JST/MOTI
3-21
National Legislation Brief Description Relevance to the Master Plan
Agriculture, Fisheries and Food Authority
Act (2013)
This Act establishes an authority to be
known as the Agriculture, Fisheries and
Food Authority. That is mandated to
promote best practices in, and regulate,
the production, processing, marketing,
grading, storage, collection,
transportation and warehousing of
agricultural and aquatic products
excluding livestock, livestock products as
may be provided for under the Crops Act,
and the Fisheries Act. The Authority is
also mandated to give advice the national
government and the county governments
on agricultural and aquatic levies for
purposes of planning, enhancing
harmony and equity in the sector.
The necessary agricultural and fisheries
industrial development strategies will
have to be factored into the Master Plan in
consultation with the Authority.

ENVIRONMENTAL RESOURCES MANAGEMENT JST/MOTI
3-22
3.4 INSTITUTIONAL FRAMEWORK
3.4.1 National Institutions
Table 3.4 discusses the National Legislation relevant to the Master Plan
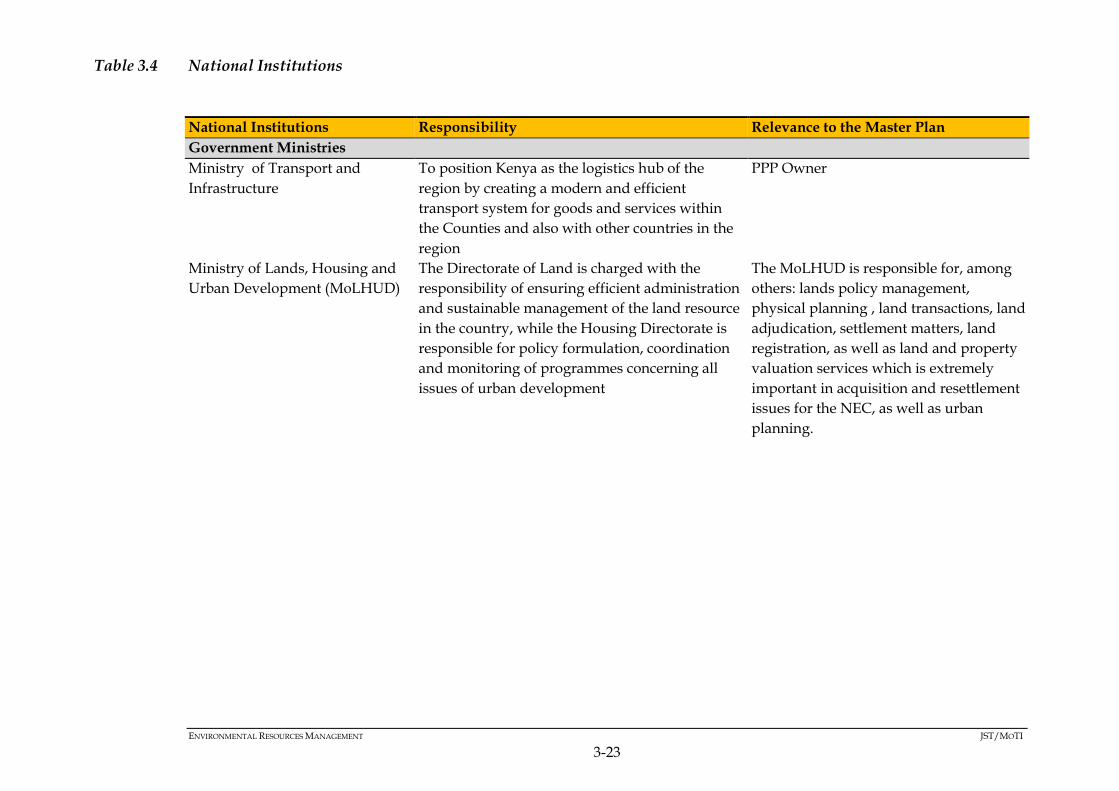
ENVIRONMENTAL RESOURCES MANAGEMENT JST/MOTI
3-23
Table 3.4 National Institutions
National Institutions Responsibility Relevance to the Master Plan
Government Ministries
Ministry of Transport and
Infrastructure
To position Kenya as the logistics hub of the
region by creating a modern and efficient
transport system for goods and services within
the Counties and also with other countries in the
region
PPP Owner
Ministry of Lands, Housing and
Urban Development (MoLHUD)
The Directorate of Land is charged with the
responsibility of ensuring efficient administration
and sustainable management of the land resource
in the country, while the Housing Directorate is
responsible for policy formulation, coordination
and monitoring of programmes concerning all
issues of urban development
The MoLHUD is responsible for, among
others: lands policy management,
physical planning , land transactions, land
adjudication, settlement matters, land
registration, as well as land and property
valuation services which is extremely
important in acquisition and resettlement
issues for the NEC, as well as urban
planning.

ENVIRONMENTAL RESOURCES MANAGEMENT JST/MOTI
3-24
National Institutions Responsibility Relevance to the Master Plan
The National Land Commission The National Land Commission:
Manages public land on behalf of the national
and county governments;
Advises the national government on a
comprehensive programme for the
registration of land titles;
Investigates present or historical land
injustices, and recommends appropriate
redress;
Encourages the application of traditional
dispute resolution mechanisms in land
conflicts;
Monitors/oversees land use planning
throughout the country;
Ensures that public land/land under the
management of designated state agencies is
sustainably managed;
Manages and administers all unregistered
trust land and unregistered community land
on behalf of the county government; and
Develops and encourages alternative dispute
resolution mechanisms in land dispute
handling and management.
This Commission will be integral in the
land acquisition and compensation
processes as the entire procedure will be
coordinated by it.
Ministry of Industrialization and
Enterprise Development
This Ministry is formulating an industrialization
policy in line with vision 2030, and is
instrumental in ensuring that Kenyan goods and
services find ready market in both national and
County Governments
The Master Plan will have to align with
the principles of Vision 2030 as well as the
County Governments
Ministry of Information,
Communication and Technology
This Ministry is responsible for policy
formulation for the telecommunication,
broadcasting and postal sectors.
The NEC will include the installation of
ICT which will need to be aligned to that
of the Ministry
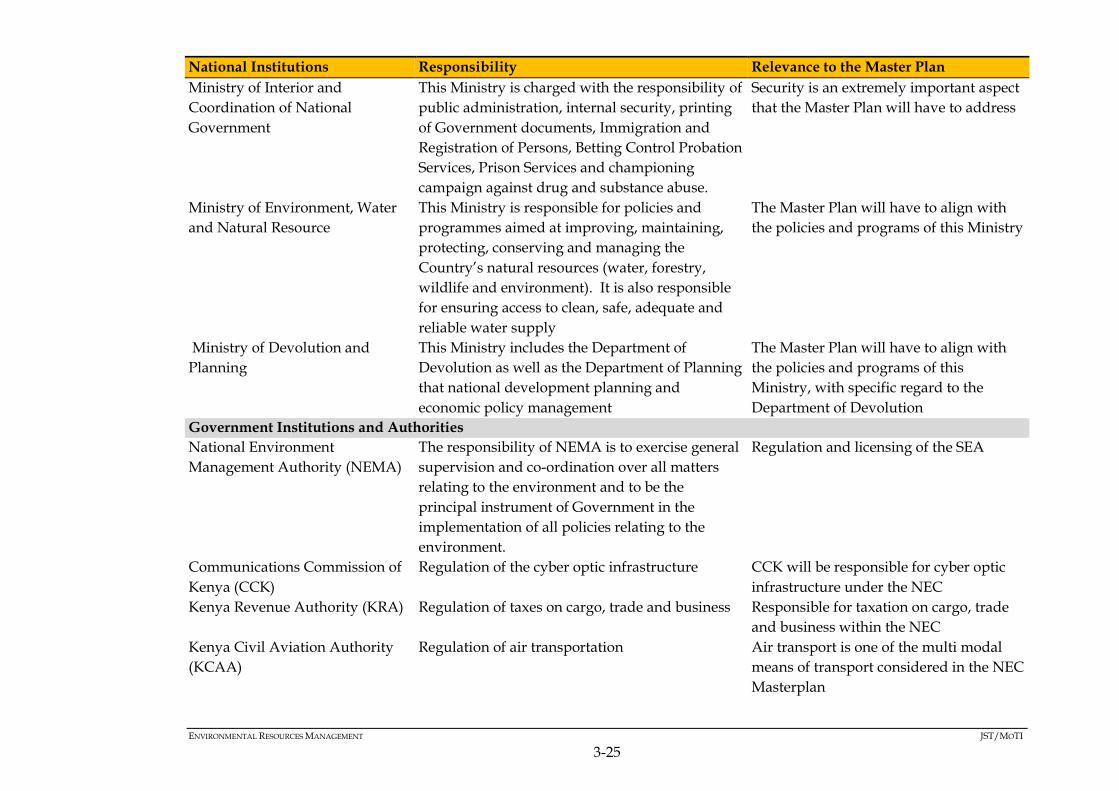
ENVIRONMENTAL RESOURCES MANAGEMENT JST/MOTI
3-25
National Institutions Responsibility Relevance to the Master Plan
Ministry of Interior and
Coordination of National
Government
This Ministry is charged with the responsibility of
public administration, internal security, printing
of Government documents, Immigration and
Registration of Persons, Betting Control Probation
Services, Prison Services and championing
campaign against drug and substance abuse.
Security is an extremely important aspect
that the Master Plan will have to address
Ministry of Environment, Water
and Natural Resource
This Ministry is responsible for policies and
programmes aimed at improving, maintaining,
protecting, conserving and managing the
Country’s natural resources (water, forestry,
wildlife and environment). It is also responsible
for ensuring access to clean, safe, adequate and
reliable water supply
The Master Plan will have to align with
the policies and programs of this Ministry
Ministry of Devolution and
Planning
This Ministry includes the Department of
Devolution as well as the Department of Planning
that national development planning and
economic policy management
The Master Plan will have to align with
the policies and programs of this
Ministry, with specific regard to the
Department of Devolution
Government Institutions and Authorities
National Environment
Management Authority (NEMA)
The responsibility of NEMA is to exercise general
supervision and co-ordination over all matters
relating to the environment and to be the
principal instrument of Government in the
implementation of all policies relating to the
environment.
Regulation and licensing of the SEA
Communications Commission of
Kenya (CCK)
Regulation of the cyber optic infrastructure CCK will be responsible for cyber optic
infrastructure under the NEC
Kenya Revenue Authority (KRA) Regulation of taxes on cargo, trade and business Responsible for taxation on cargo, trade
and business within the NEC
Kenya Civil Aviation Authority
(KCAA)
Regulation of air transportation Air transport is one of the multi modal
means of transport considered in the NEC
Masterplan
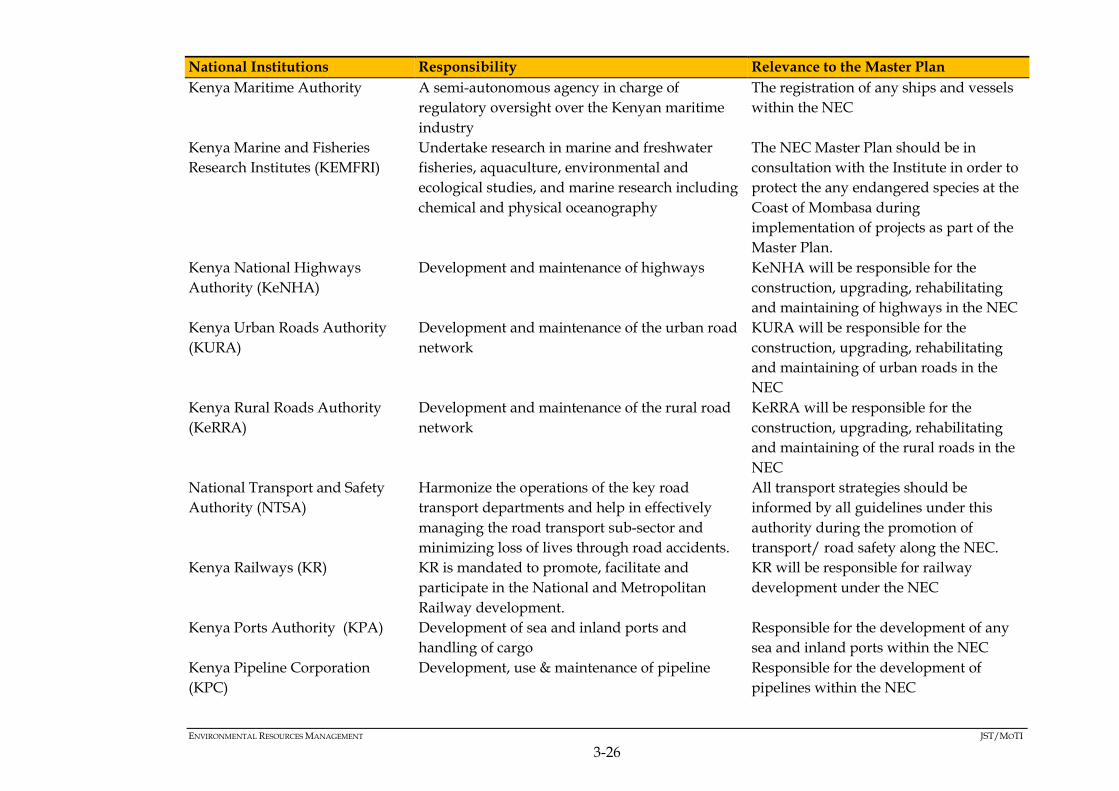
ENVIRONMENTAL RESOURCES MANAGEMENT JST/MOTI
3-26
National Institutions Responsibility Relevance to the Master Plan
Kenya Maritime Authority A semi-autonomous agency in charge of
regulatory oversight over the Kenyan maritime
industry
The registration of any ships and vessels
within the NEC
Kenya Marine and Fisheries
Research Institutes (KEMFRI)
Undertake research in marine and freshwater
fisheries, aquaculture, environmental and
ecological studies, and marine research including
chemical and physical oceanography
The NEC Master Plan should be in
consultation with the Institute in order to
protect the any endangered species at the
Coast of Mombasa during
implementation of projects as part of the
Master Plan.
Kenya National Highways
Authority (KeNHA)
Development and maintenance of highways KeNHA will be responsible for the
construction, upgrading, rehabilitating
and maintaining of highways in the NEC
Kenya Urban Roads Authority
(KURA)
Development and maintenance of the urban road
network
KURA will be responsible for the
construction, upgrading, rehabilitating
and maintaining of urban roads in the
NEC
Kenya Rural Roads Authority
(KeRRA)
Development and maintenance of the rural road
network
KeRRA will be responsible for the
construction, upgrading, rehabilitating
and maintaining of the rural roads in the
NEC
National Transport and Safety
Authority (NTSA)
Harmonize the operations of the key road
transport departments and help in effectively
managing the road transport sub-sector and
minimizing loss of lives through road accidents.
All transport strategies should be
informed by all guidelines under this
authority during the promotion of
transport/ road safety along the NEC.
Kenya Railways (KR) KR is mandated to promote, facilitate and
participate in the National and Metropolitan
Railway development.
KR will be responsible for railway
development under the NEC
Kenya Ports Authority (KPA) Development of sea and inland ports and
handling of cargo
Responsible for the development of any
sea and inland ports within the NEC
Kenya Pipeline Corporation
(KPC)
Development, use & maintenance of pipeline Responsible for the development of
pipelines within the NEC
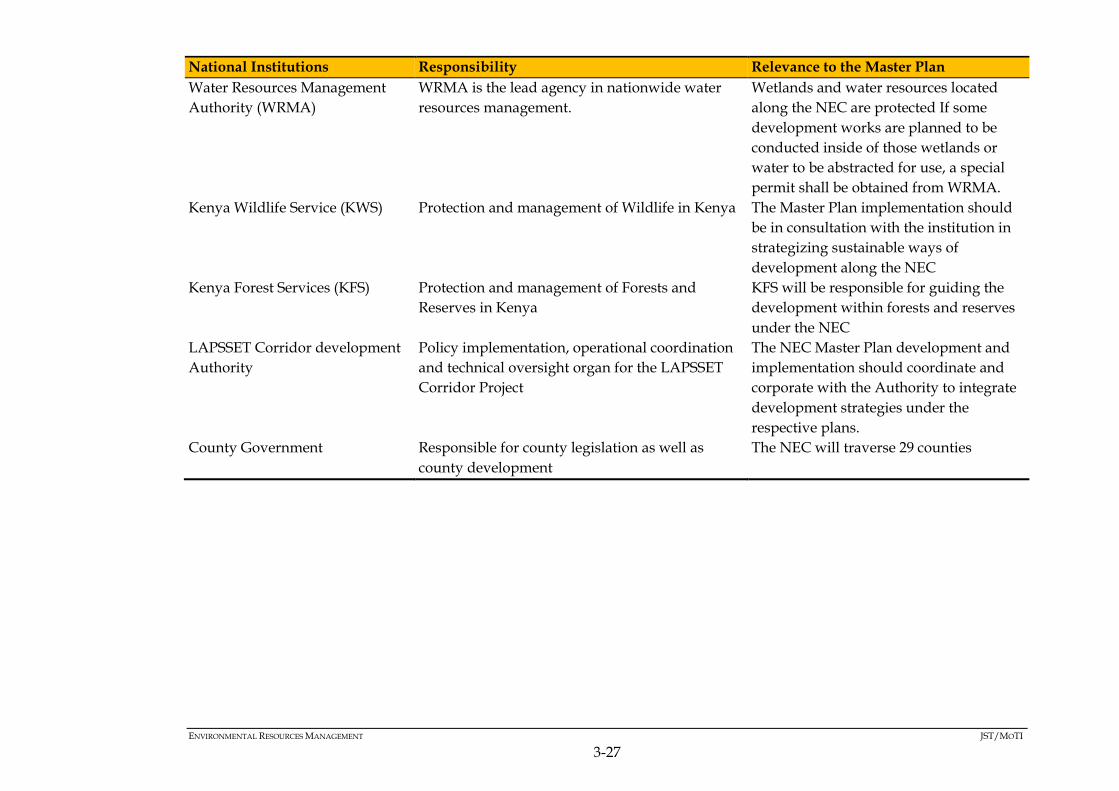
ENVIRONMENTAL RESOURCES MANAGEMENT JST/MOTI
3-27
National Institutions Responsibility Relevance to the Master Plan
Water Resources Management
Authority (WRMA)
WRMA is the lead agency in nationwide water
resources management.
Wetlands and water resources located
along the NEC are protected If some
development works are planned to be
conducted inside of those wetlands or
water to be abstracted for use, a special
permit shall be obtained from WRMA.
Kenya Wildlife Service (KWS) Protection and management of Wildlife in Kenya The Master Plan implementation should
be in consultation with the institution in
strategizing sustainable ways of
development along the NEC
Kenya Forest Services (KFS) Protection and management of Forests and
Reserves in Kenya
KFS will be responsible for guiding the
development within forests and reserves
under the NEC
LAPSSET Corridor development
Authority
Policy implementation, operational coordination
and technical oversight organ for the LAPSSET
Corridor Project
The NEC Master Plan development and
implementation should coordinate and
corporate with the Authority to integrate
development strategies under the
respective plans.
County Government Responsible for county legislation as well as
county development
The NEC will traverse 29 counties
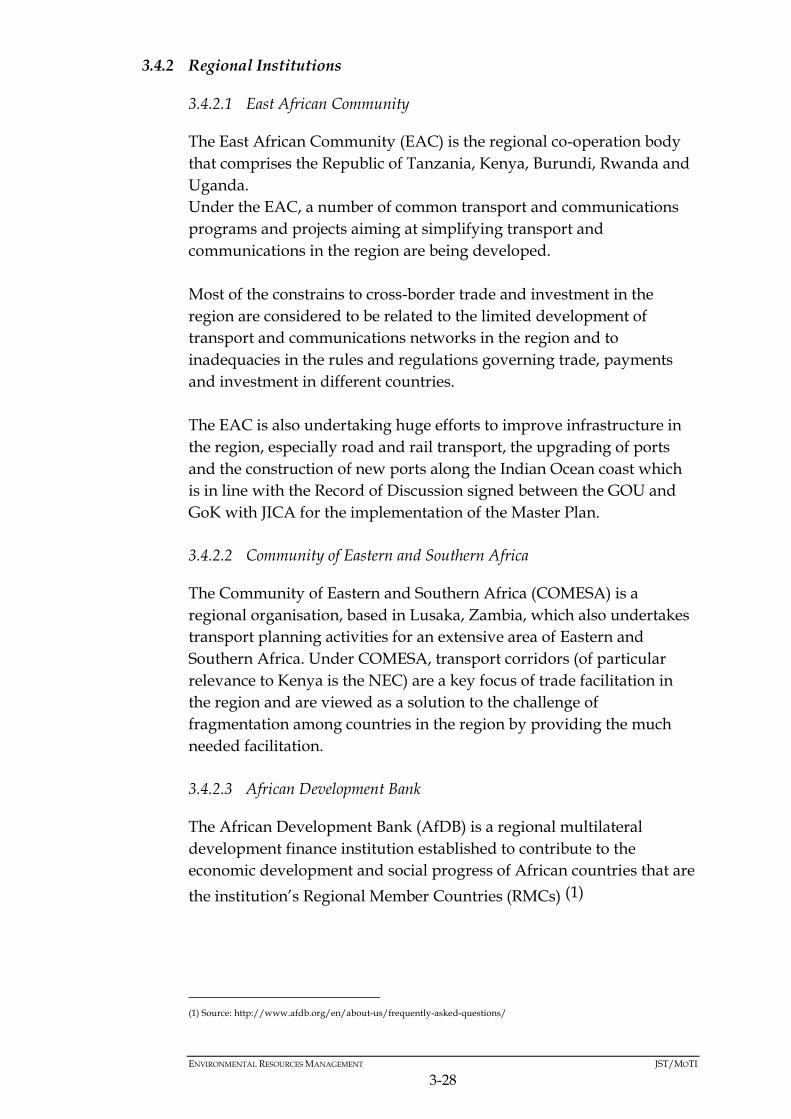
ENVIRONMENTAL RESOURCES MANAGEMENT JST/MOTI
3-28
3.4.2 Regional Institutions
3.4.2.1 East African Community
The East African Community (EAC) is the regional co-operation body
that comprises the Republic of Tanzania, Kenya, Burundi, Rwanda and
Uganda.
Under the EAC, a number of common transport and communications
programs and projects aiming at simplifying transport and
communications in the region are being developed.
Most of the constrains to cross-border trade and investment in the
region are considered to be related to the limited development of
transport and communications networks in the region and to
inadequacies in the rules and regulations governing trade, payments
and investment in different countries.
The EAC is also undertaking huge efforts to improve infrastructure in
the region, especially road and rail transport, the upgrading of ports
and the construction of new ports along the Indian Ocean coast which
is in line with the Record of Discussion signed between the GOU and
GoK with JICA for the implementation of the Master Plan.
3.4.2.2 Community of Eastern and Southern Africa
The Community of Eastern and Southern Africa (COMESA) is a
regional organisation, based in Lusaka, Zambia, which also undertakes
transport planning activities for an extensive area of Eastern and
Southern Africa. Under COMESA, transport corridors (of particular
relevance to Kenya is the NEC) are a key focus of trade facilitation in
the region and are viewed as a solution to the challenge of
fragmentation among countries in the region by providing the much
needed facilitation.
3.4.2.3 African Development Bank
The African Development Bank (AfDB) is a regional multilateral
development finance institution established to contribute to the
economic development and social progress of African countries that are
the institution’s Regional Member Countries (RMCs) (1)
(1) Source: http://www.afdb.org/en/about-us/frequently-asked-questions/
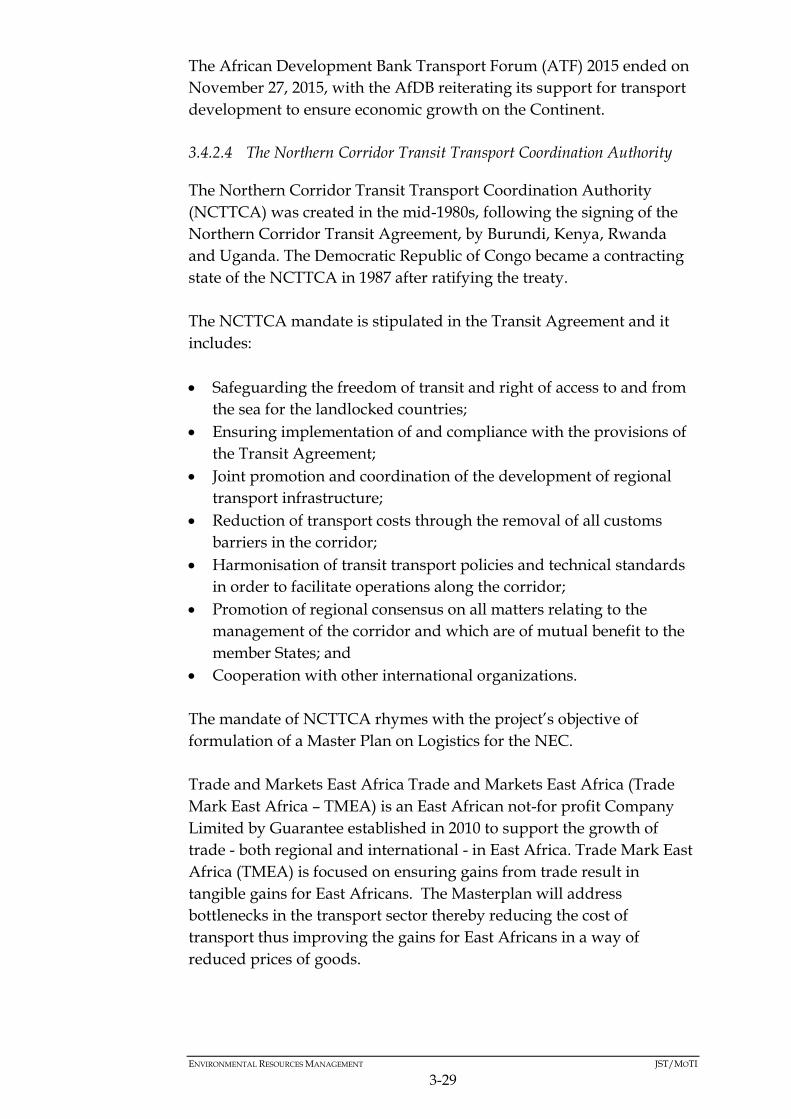
ENVIRONMENTAL RESOURCES MANAGEMENT JST/MOTI
3-29
The African Development Bank Transport Forum (ATF) 2015 ended on
November 27, 2015, with the AfDB reiterating its support for transport
development to ensure economic growth on the Continent.
3.4.2.4 The Northern Corridor Transit Transport Coordination Authority
The Northern Corridor Transit Transport Coordination Authority
(NCTTCA) was created in the mid-1980s, following the signing of the
Northern Corridor Transit Agreement, by Burundi, Kenya, Rwanda
and Uganda. The Democratic Republic of Congo became a contracting
state of the NCTTCA in 1987 after ratifying the treaty.
The NCTTCA mandate is stipulated in the Transit Agreement and it
includes:
Safeguarding the freedom of transit and right of access to and from
the sea for the landlocked countries;
Ensuring implementation of and compliance with the provisions of
the Transit Agreement;
Joint promotion and coordination of the development of regional
transport infrastructure;
Reduction of transport costs through the removal of all customs
barriers in the corridor;
Harmonisation of transit transport policies and technical standards
in order to facilitate operations along the corridor;
Promotion of regional consensus on all matters relating to the
management of the corridor and which are of mutual benefit to the
member States; and
Cooperation with other international organizations.
The mandate of NCTTCA rhymes with the project’s objective of
formulation of a Master Plan on Logistics for the NEC.
Trade and Markets East Africa Trade and Markets East Africa (Trade
Mark East Africa – TMEA) is an East African not-for profit Company
Limited by Guarantee established in 2010 to support the growth of
trade - both regional and international - in East Africa. Trade Mark East
Africa (TMEA) is focused on ensuring gains from trade result in
tangible gains for East Africans. The Masterplan will address
bottlenecks in the transport sector thereby reducing the cost of
transport thus improving the gains for East Africans in a way of
reduced prices of goods.

ENVIRONMENTAL RESOURCES MANAGEMENT JST/MOTI
3-30
3.4.3 International Institutions
3.4.3.1 Japan International Cooperation Agency
Japan International Cooperation Agency (JICA) is a governmental
agency that coordinates Official Development Assistance (ODA) for the
Government of Japan. JICA aims to contribute to the promotion of
international development cooperation and addressing the global
agenda by supporting the socioeconomic development, recovery and
economic stability of developing countries. The Official Development
Assistance coordinated by JICA is broadly divided into bilateral aid, in
which assistance is given directly to developing countries, and
multilateral aid, provided through international organizations.
JICA is responsible for the implementation of the Project to formulate
the Master Plan.
3.5 INTERNATIONAL REGULATIONS
3.5.1 The Japan International Co-operation Agency (JICA) Guidelines for
Environmental and Social Considerations, 2010
The objectives of these Guidelines are to encourage PPP owners to have
appropriate consideration for environmental and social impacts, as well
as to ensure that JICA’s support for and examination of environmental
and social considerations are conducted accordingly. The guidelines
outline JICA’s responsibilities and procedures, along with its
requirements for project proponents etc., in order to facilitate the
achievement of these objectives. In doing so, JICA endeavours to ensure
transparency, predictability, and accountability in its support for and
examination of environmental and social considerations.
The requirements in JICA’s guidelines were fulfilled by the SEA Study.
3.5.2 The Organisation for Economic Co-operation and Development
(OECD) Guidelines and Reference Series for Applying Strategic
Environmental Assessment, 2006
The Organization for Economic Cooperation and Development is a
unique forum where the governments of 34 democracies with market
economies work with each other, as well as with more than 70 non-
member economies to promote economic growth, prosperity, and
sustainable development. The OECD Guidelines for Multinational
Enterprises are far reaching recommendations for responsible business
conduct that 44 adhering governments – representing all regions of the

ENVIRONMENTAL RESOURCES MANAGEMENT JST/MOTI
3-31
world and accounting for 85% of foreign direct investment – encourage
their enterprises to observe wherever they operate. The ultimate
objectives of the guidelines are to ensure that:
Environmental considerations, and their linkages with social and
economic factors, are adequately understood, recognising the
contribution of environmental management to economic growth
and poverty reduction.
Environmental and social considerations are appropriately analysed
and taken into account in development policy, planning and
strategic decision making at the formative stage and appropriate
response measures, effectively integrated into the development of
PPPs and projects.
As a result of the above, the outcomes of PPPs have better prospects
to contribute to sustainable development and attainment of the
MDGs.
The OECD guidelines will supplement the JICA and National SEA
Guidelines.
3.6 COMPARATIVE ANALYSIS OF THE MASTER PLAN WITH OTHER PPPS
3.6.1 Comparative Analysis of the Master Plan with other Polices

ENVIRONMENTAL RESOURCES MANAGEMENT JST/MOTI
3-32
Table 3.5 Analysis of Relevant Policies with the NEC Master Plan
Policy Environmental and Social
Considerations within the
Policy
Opportunities for the Master
Plan
Potential areas of Conflict
Vision 2030 Building a just and cohesive
society with social equity in a
clean and secure environment
Social, economic and political
pillars in vision 2030 will be of
great importance when it
comes to implementation of
the Master Plan
None
Regional Development Policy To reform in the legal
environment in order to create
a more cohesive framework for
regional development
Prevents conflicts with
development in the various
regions and counties
None
Development and
Management of the Roads Sub-
Sector for Sustainable
Economic Growth, Sessional
Paper No 5 of 2006
Management of the roads sub-
sector for sustainable economic
growth
Various policies for the roads
sub-sector will be availed
None
National Land Policy,
Sessional Paper No. 3 of 2009
To address environmental
degradation and look into land
access.
Detailed information on how
to go about acquisition of land
will be availed
None
Environment and Sustainable
Development Policy, Sessional
Paper No. 6 of 1999
To provide comprehensive
guidelines and strategies for
government action on the
environment and
development.
Specific projects within the
Master Plan will be carried out
sustainably
None

ENVIRONMENTAL RESOURCES MANAGEMENT JST/MOTI
3-33
Policy Environmental and Social
Considerations within the
Policy
Opportunities for the Master
Plan
Potential areas of Conflict
Wildlife Policy, Sessional
Paper No. 3 of 1975
To optimize the benefits that
include the aesthetic, cultural
and scientific gains from
conservation of habitats and
the fauna within them.
Able to prevent the impact
caused to the wildlife.
Where the corridor transverses
through forest and other
protected areas
National Disaster Management
Policy, 2009
Pays attention to
environmental concerns in the
design and management of
disaster programmes,
constantly reviewing the
changing status and trends of
the environment to ensure
sustainable compliance
Addresses the risks of natural
disasters to the various
infrastructure projects.
The Master Plan will use the
policy to curb any disaster that
is likely to occur along the
NEC
None
Energy Policy, 2005 To protect and conserve the
environment, with a bias
towards the exploitation of
green energy
Infrastructure projects of the
NEC will require energy
None
Gender Policy, 2011 To ensure the needs of each
gender is addressed.
Gender concerns will be
considered by the Master Plan
None
Integrated National Transport
Policy, 2009
To develop, operate and
maintain an efficient, cost
effective, safe, secure and
integrated transport system
Different modes of transport
will be integrated in the master
plan
None

ENVIRONMENTAL RESOURCES MANAGEMENT JST/MOTI
3-34
Policy Environmental and Social
Considerations within the
Policy
Opportunities for the Master
Plan
Potential areas of Conflict
National Policy on Water
Resources Management and
Development, Sessional Paper
No. 1 of 1999,
To preserve, conserve and
protect available water
resources and allocate it in a
sustainable, rational, and
economic way.
Water Resources along NEC
will be managed
None

ENVIRONMENTAL RESOURCES MANAGEMENT JST/MOTI
3-35
3.6.2 Comparative Analysis of the Master Plan with other Plans
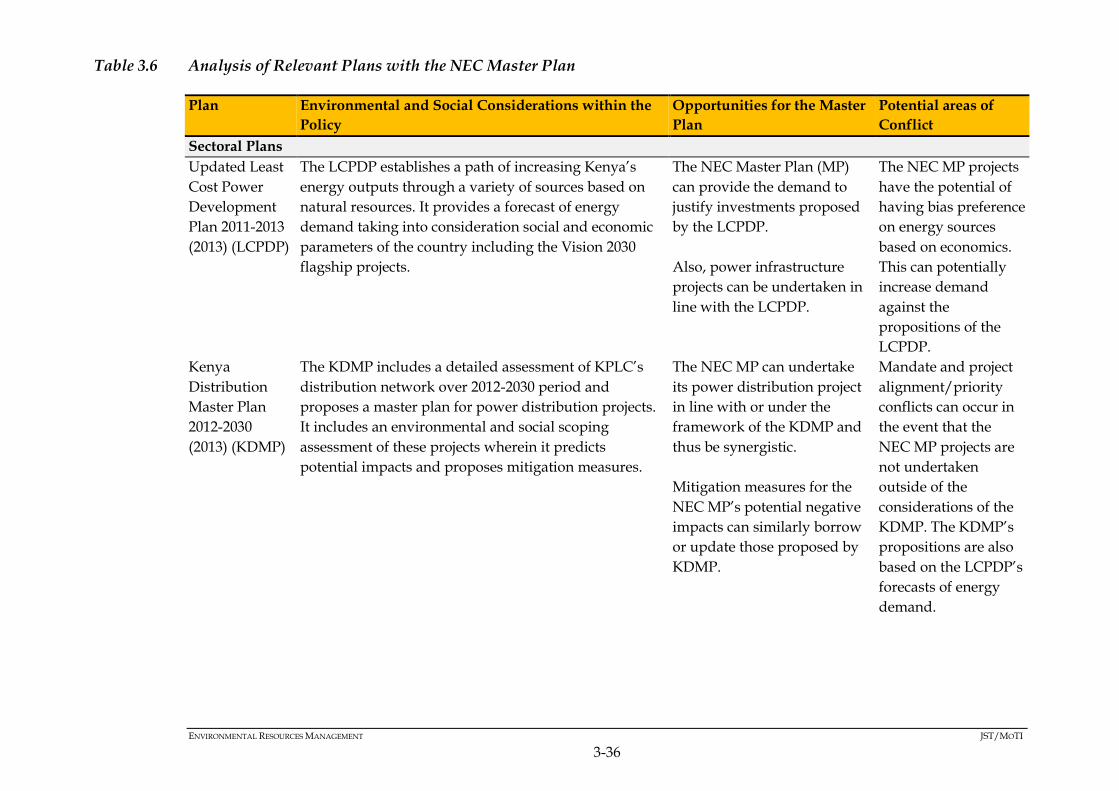
ENVIRONMENTAL RESOURCES MANAGEMENT JST/MOTI
3-36
Table 3.6 Analysis of Relevant Plans with the NEC Master Plan
Plan Environmental and Social Considerations within the
Policy
Opportunities for the Master
Plan
Potential areas of
Conflict
Sectoral Plans
Updated Least
Cost Power
Development
Plan 2011-2013
(2013) (LCPDP)
The LCPDP establishes a path of increasing Kenya’s
energy outputs through a variety of sources based on
natural resources. It provides a forecast of energy
demand taking into consideration social and economic
parameters of the country including the Vision 2030
flagship projects.
The NEC Master Plan (MP)
can provide the demand to
justify investments proposed
by the LCPDP.
Also, power infrastructure
projects can be undertaken in
line with the LCPDP.
The NEC MP projects
have the potential of
having bias preference
on energy sources
based on economics.
This can potentially
increase demand
against the
propositions of the
LCPDP.
Kenya
Distribution
Master Plan
2012-2030
(2013) (KDMP)
The KDMP includes a detailed assessment of KPLC’s
distribution network over 2012-2030 period and
proposes a master plan for power distribution projects.
It includes an environmental and social scoping
assessment of these projects wherein it predicts
potential impacts and proposes mitigation measures.
The NEC MP can undertake
its power distribution project
in line with or under the
framework of the KDMP and
thus be synergistic.
Mitigation measures for the
NEC MP’s potential negative
impacts can similarly borrow
or update those proposed by
KDMP.
Mandate and project
alignment/priority
conflicts can occur in
the event that the
NEC MP projects are
not undertaken
outside of the
considerations of the
KDMP. The KDMP’s
propositions are also
based on the LCPDP’s
forecasts of energy
demand.

ENVIRONMENTAL RESOURCES MANAGEMENT JST/MOTI
3-37
Plan Environmental and Social Considerations within the
Policy
Opportunities for the Master
Plan
Potential areas of
Conflict
Kenya
Petroleum
Master Plan
(2015) (KPMP)
The Kenya Petroleum Master Plan (KPMP) provides a
development plan of up to the year 2040 for the
petroleum sector. It identifies projects in each sub-sector
and provides a framework for managing environmental
and social issues of these projects and the sector. A
Strategic Environmental and Social Assessment (SESA)
is also being prepared for the petroleum sector as part
of the Kenya Petroleum Technical Assistance Project.
Petroleum sector projects can
be implemented under
planning framework of the
KPMP thereby being
synergistic. Other sectoral
projects can also create
demand for petroleum
products.
On implementation,
petroleum sector projects can
implement mitigation
measures in line with the
petroleum sector SESA’s
propositions once the study is
completed.
Mandate and priority
conflicts are possible
with the institutional
realignments
proposed by draft
regulations in the
energy sector. These
are institutions such
as ERC (ERC) will be
key in implementing
and regulating the
KPMP projects.

ENVIRONMENTAL RESOURCES MANAGEMENT JST/MOTI
3-38
Plan Environmental and Social Considerations within the
Policy
Opportunities for the Master
Plan
Potential areas of
Conflict
Kenya National
ICT Master
Plan (2014)
(KNIMP)
The KNIMP presents a roadmap to develop the
country’s knowledge economy that leads to
socioeconomic growth. Amongst its guiding principles
it requires all institutions involved in its
implementation to adhere to the green ICT concept.
The implementers of the NEC
MP can integrate the green
ICT into their respective
projects.
Integration of ICT into the
NEC MP projects and
providing industry related
data can promote the
attainment of the KNIMP
goals.
Direct ICT projects such as the
SCADA system will add to the
infrastructure available in the
country increasing
connectivity.
Potential negative
impacts associated
with ICT equipment
can undermine the
achievement of the
green ICT concept at
the project level.
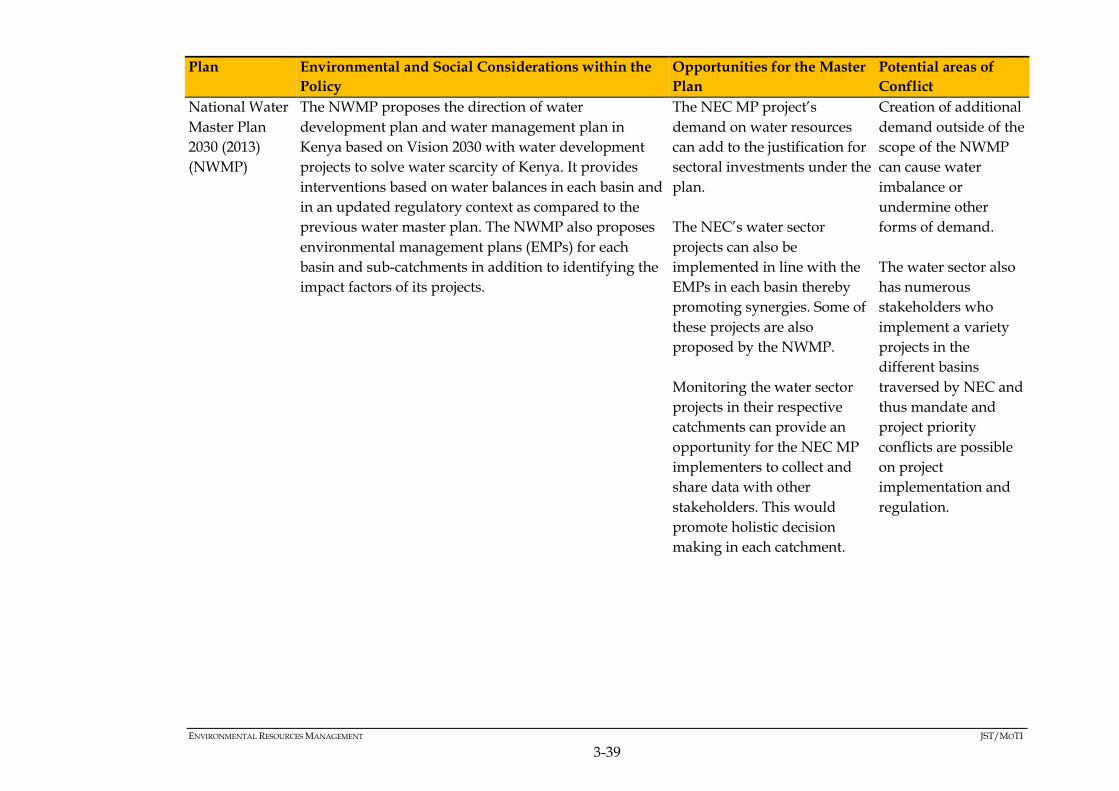
ENVIRONMENTAL RESOURCES MANAGEMENT JST/MOTI
3-39
Plan Environmental and Social Considerations within the
Policy
Opportunities for the Master
Plan
Potential areas of
Conflict
National Water
Master Plan
2030 (2013)
(NWMP)
The NWMP proposes the direction of water
development plan and water management plan in
Kenya based on Vision 2030 with water development
projects to solve water scarcity of Kenya. It provides
interventions based on water balances in each basin and
in an updated regulatory context as compared to the
previous water master plan. The NWMP also proposes
environmental management plans (EMPs) for each
basin and sub-catchments in addition to identifying the
impact factors of its projects.
The NEC MP project’s
demand on water resources
can add to the justification for
sectoral investments under the
plan.
The NEC’s water sector
projects can also be
implemented in line with the
EMPs in each basin thereby
promoting synergies. Some of
these projects are also
proposed by the NWMP.
Monitoring the water sector
projects in their respective
catchments can provide an
opportunity for the NEC MP
implementers to collect and
share data with other
stakeholders. This would
promote holistic decision
making in each catchment.
Creation of additional
demand outside of the
scope of the NWMP
can cause water
imbalance or
undermine other
forms of demand.
The water sector also
has numerous
stakeholders who
implement a variety
projects in the
different basins
traversed by NEC and
thus mandate and
project priority
conflicts are possible
on project
implementation and
regulation.
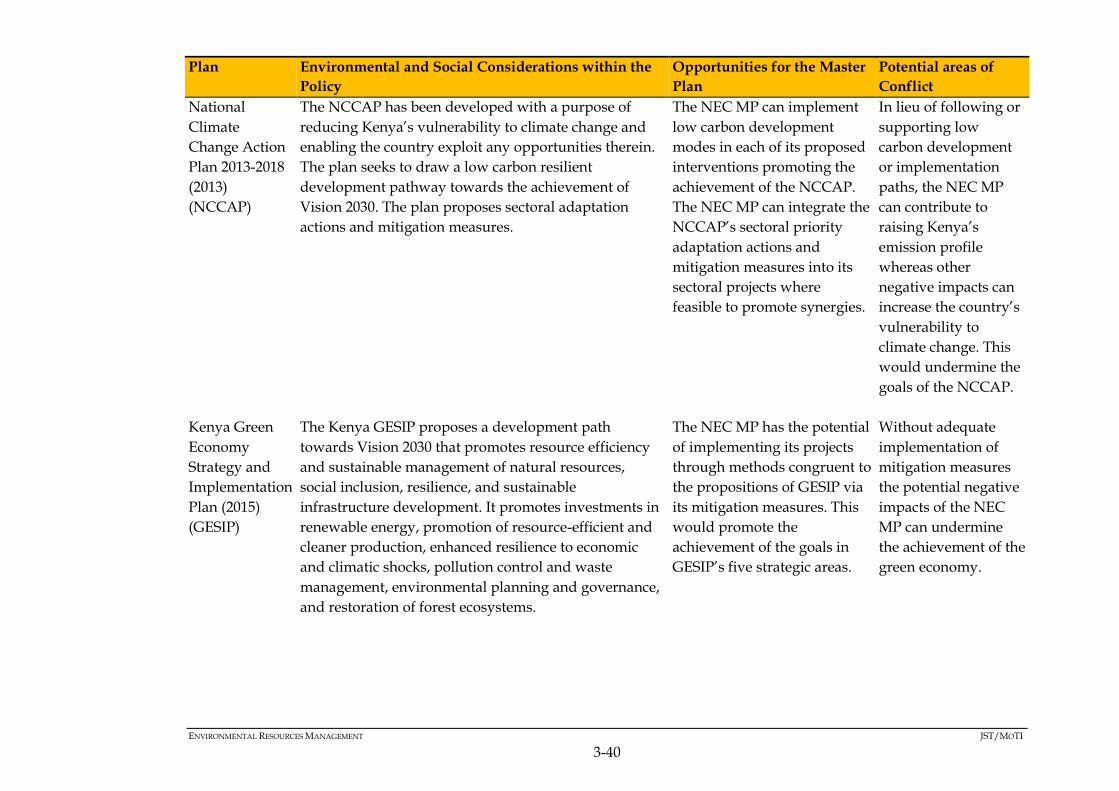
ENVIRONMENTAL RESOURCES MANAGEMENT JST/MOTI
3-40
Plan Environmental and Social Considerations within the
Policy
Opportunities for the Master
Plan
Potential areas of
Conflict
National
Climate
Change Action
Plan 2013-2018
(2013)
(NCCAP)
The NCCAP has been developed with a purpose of
reducing Kenya’s vulnerability to climate change and
enabling the country exploit any opportunities therein.
The plan seeks to draw a low carbon resilient
development pathway towards the achievement of
Vision 2030. The plan proposes sectoral adaptation
actions and mitigation measures.
The NEC MP can implement
low carbon development
modes in each of its proposed
interventions promoting the
achievement of the NCCAP.
The NEC MP can integrate the
NCCAP’s sectoral priority
adaptation actions and
mitigation measures into its
sectoral projects where
feasible to promote synergies.
In lieu of following or
supporting low
carbon development
or implementation
paths, the NEC MP
can contribute to
raising Kenya’s
emission profile
whereas other
negative impacts can
increase the country’s
vulnerability to
climate change. This
would undermine the
goals of the NCCAP.
Kenya Green
Economy
Strategy and
Implementation
Plan (2015)
(GESIP)
The Kenya GESIP proposes a development path
towards Vision 2030 that promotes resource efficiency
and sustainable management of natural resources,
social inclusion, resilience, and sustainable
infrastructure development. It promotes investments in
renewable energy, promotion of resource-efficient and
cleaner production, enhanced resilience to economic
and climatic shocks, pollution control and waste
management, environmental planning and governance,
and restoration of forest ecosystems.
The NEC MP has the potential
of implementing its projects
through methods congruent to
the propositions of GESIP via
its mitigation measures. This
would promote the
achievement of the goals in
GESIP’s five strategic areas.
Without adequate
implementation of
mitigation measures
the potential negative
impacts of the NEC
MP can undermine
the achievement of the
green economy.
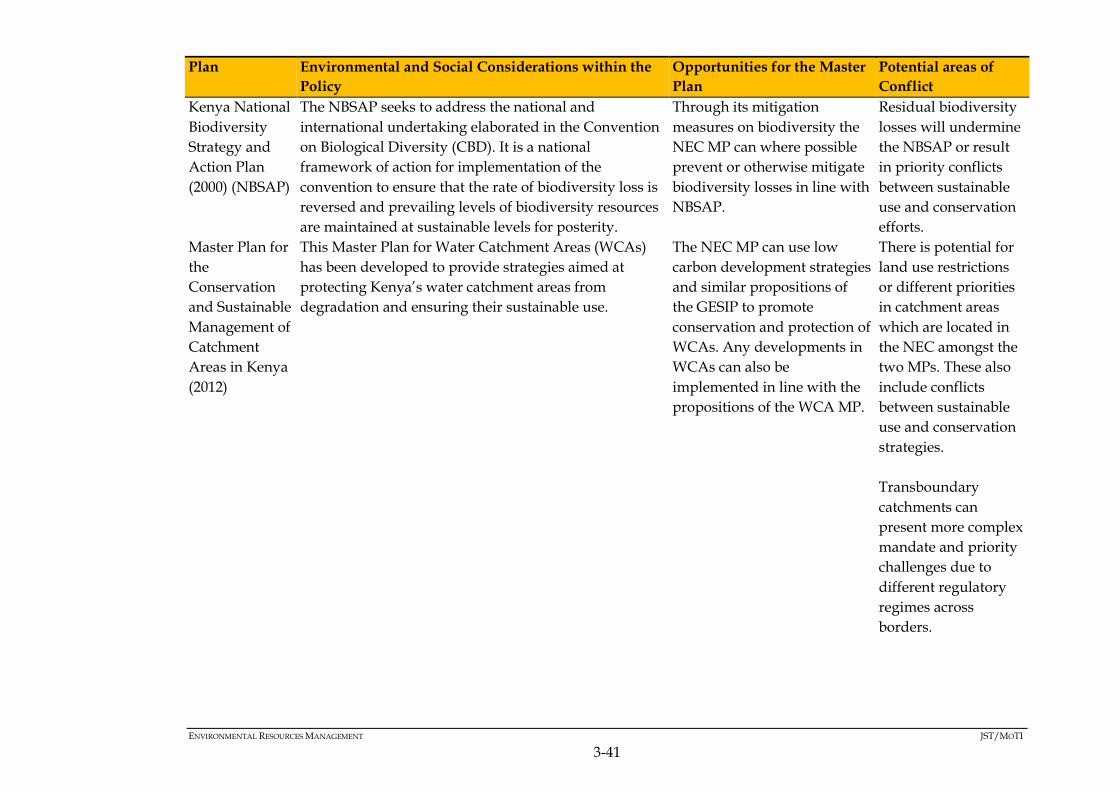
ENVIRONMENTAL RESOURCES MANAGEMENT JST/MOTI
3-41
Plan Environmental and Social Considerations within the
Policy
Opportunities for the Master
Plan
Potential areas of
Conflict
Kenya National
Biodiversity
Strategy and
Action Plan
(2000) (NBSAP)
The NBSAP seeks to address the national and
international undertaking elaborated in the Convention
on Biological Diversity (CBD). It is a national
framework of action for implementation of the
convention to ensure that the rate of biodiversity loss is
reversed and prevailing levels of biodiversity resources
are maintained at sustainable levels for posterity.
Through its mitigation
measures on biodiversity the
NEC MP can where possible
prevent or otherwise mitigate
biodiversity losses in line with
NBSAP.
Residual biodiversity
losses will undermine
the NBSAP or result
in priority conflicts
between sustainable
use and conservation
efforts.
Master Plan for
the
Conservation
and Sustainable
Management of
Catchment
Areas in Kenya
(2012)
This Master Plan for Water Catchment Areas (WCAs)
has been developed to provide strategies aimed at
protecting Kenya’s water catchment areas from
degradation and ensuring their sustainable use.
The NEC MP can use low
carbon development strategies
and similar propositions of
the GESIP to promote
conservation and protection of
WCAs. Any developments in
WCAs can also be
implemented in line with the
propositions of the WCA MP.
There is potential for
land use restrictions
or different priorities
in catchment areas
which are located in
the NEC amongst the
two MPs. These also
include conflicts
between sustainable
use and conservation
strategies.
Transboundary
catchments can
present more complex
mandate and priority
challenges due to
different regulatory
regimes across
borders.

ENVIRONMENTAL RESOURCES MANAGEMENT JST/MOTI
3-42
Plan Environmental and Social Considerations within the
Policy
Opportunities for the Master
Plan
Potential areas of
Conflict
National
Marine Spills
Response
Contingency
Plan
(NMSRCP)
The NMSRCP provides procedures for responding to oil
and HNS spills in the marine environment of Kenya. It
is updated bi-annually or after any major oil spill.
Oil spill contingency measures
can be developed in line with
the NMSRCP.
Limitations on
technology approved
under the NMSRCP
and the response
efficiency of spill
response agencies can
limit the effectiveness
of spill response
procedures.
National
Nutrition
Action Plan
2012-2017
(2013)
This plan has been developed with a purpose of
providing a framework for coordinated implementation
of nutrition interventions activities by its stakeholders.
The plan is focussed on High Impact Nutrition
Interventions which were aimed at supporting the
achievement of MDGs 1, 2, 3, 4, 5 and 6.
The NEC MP’s benefits of
improving access to services
will promote the achievement
of the NNAP since there will
be better access to markets for
produce.
The potential negative
impacts of the NEC
MP can compromise
the achievement of the
NNAP’s strategic
objectives.

ENVIRONMENTAL RESOURCES MANAGEMENT JST/MOTI
3-43
Plan Environmental and Social Considerations within the
Policy
Opportunities for the Master
Plan
Potential areas of
Conflict
National
Spatial Plan
2015-2045
(2016) (NSP)
The NSP) has been developed with a purpose of
providing a national spatial structure that defines how
the national space is utilized to ensure optimal and
sustainable use of land. The plan itself is a Vision 2030
flagship project and it is anticipated to promote the
attainment of national, social, economic and
environmental goals and objectives. This plan aims at
achieving an organized, integrated, sustainable and
balanced development of the country.
Location of the NEC MP’s
projects according to the
NSP’s regional development
proposals will be synergistic.
The NSP’s strategic objectives
can also be integrated into the
NEC MP. Some of these are
already integrated into the
NEC MP such as promoting
regional growth centres;
decentralizing development
from the existing major cities,
and linking production and
tourism areas.
There is potential of
spatial development
priority conflicts
between the two
plans.
Sustainable
Tourism Master
Plan (STMP) for
the Inter-
Governmental
Authority on
Development
(IGAD) Region
2013-2023
(2013)
The STMP’s main aim is to provide IGAD member
states with a regional framework for sustainable
tourism development with a view to contributing to
socio-economic development and poverty alleviation as
well as promoting regional integration. Amongst its
underlying principles include ensuring that tourism
development is sustainable, providing equity for both
inter-generational, whereby the current exploitation of
tourism resources should not compromise the ability of
future generations, and intra-generations, taking into
account issues relating to enhancing social justice and
poverty alleviation.
The NEC MP has direct
benefits to the STMP and
tourism sector as a growth
driver in Kenya. The NEC MP
can increase Kenya’s global
competitiveness in the
industry. Infrastructure
development is amongst the
strategic areas of intervention
identified by the STMP.
Potential for conflict
on priorities between
conservation and
sustainable use with
respect to natural and
cultural resources
which are tourist
attractions. The NEC
MP’s potential
adverse impacts (land
use and landscape
changes) can threaten
these resources.
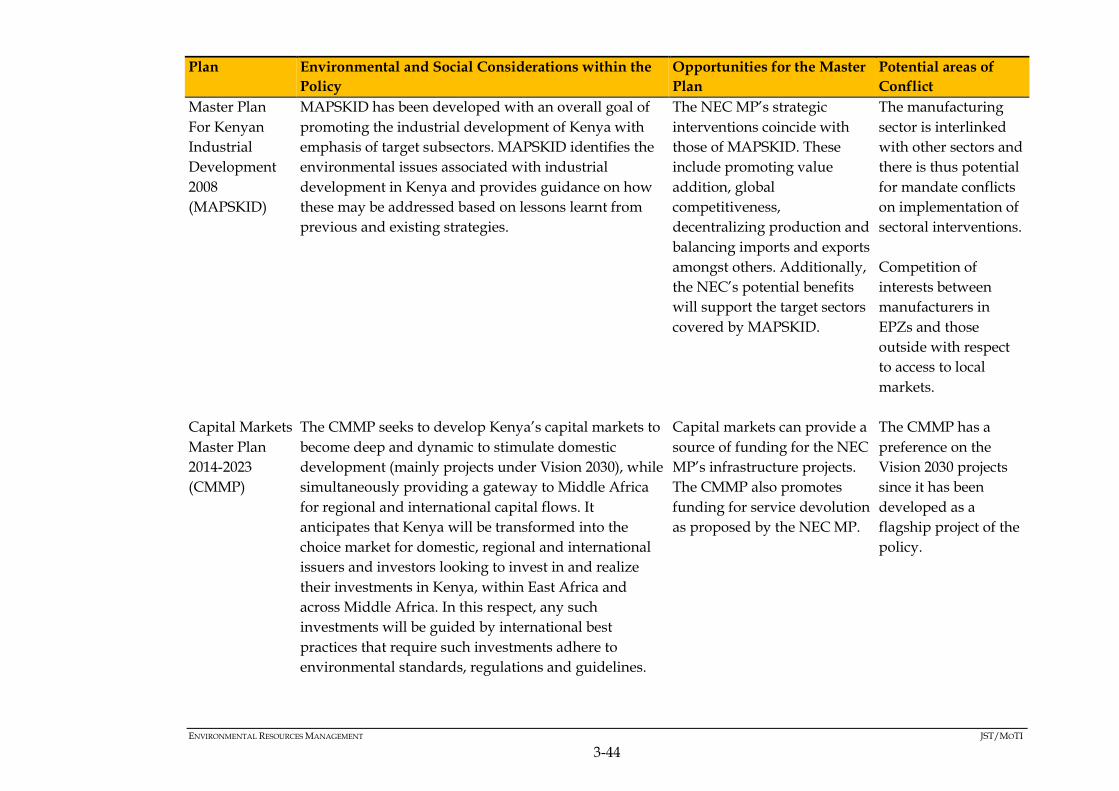
ENVIRONMENTAL RESOURCES MANAGEMENT JST/MOTI
3-44
Plan Environmental and Social Considerations within the
Policy
Opportunities for the Master
Plan
Potential areas of
Conflict
Master Plan
For Kenyan
Industrial
Development
2008
(MAPSKID)
MAPSKID has been developed with an overall goal of
promoting the industrial development of Kenya with
emphasis of target subsectors. MAPSKID identifies the
environmental issues associated with industrial
development in Kenya and provides guidance on how
these may be addressed based on lessons learnt from
previous and existing strategies.
The NEC MP’s strategic
interventions coincide with
those of MAPSKID. These
include promoting value
addition, global
competitiveness,
decentralizing production and
balancing imports and exports
amongst others. Additionally,
the NEC’s potential benefits
will support the target sectors
covered by MAPSKID.
The manufacturing
sector is interlinked
with other sectors and
there is thus potential
for mandate conflicts
on implementation of
sectoral interventions.
Competition of
interests between
manufacturers in
EPZs and those
outside with respect
to access to local
markets.
Capital Markets
Master Plan
2014-2023
(CMMP)
The CMMP seeks to develop Kenya’s capital markets to
become deep and dynamic to stimulate domestic
development (mainly projects under Vision 2030), while
simultaneously providing a gateway to Middle Africa
for regional and international capital flows. It
anticipates that Kenya will be transformed into the
choice market for domestic, regional and international
issuers and investors looking to invest in and realize
their investments in Kenya, within East Africa and
across Middle Africa. In this respect, any such
investments will be guided by international best
practices that require such investments adhere to
environmental standards, regulations and guidelines.
Capital markets can provide a
source of funding for the NEC
MP’s infrastructure projects.
The CMMP also promotes
funding for service devolution
as proposed by the NEC MP.
The CMMP has a
preference on the
Vision 2030 projects
since it has been
developed as a
flagship project of the
policy.
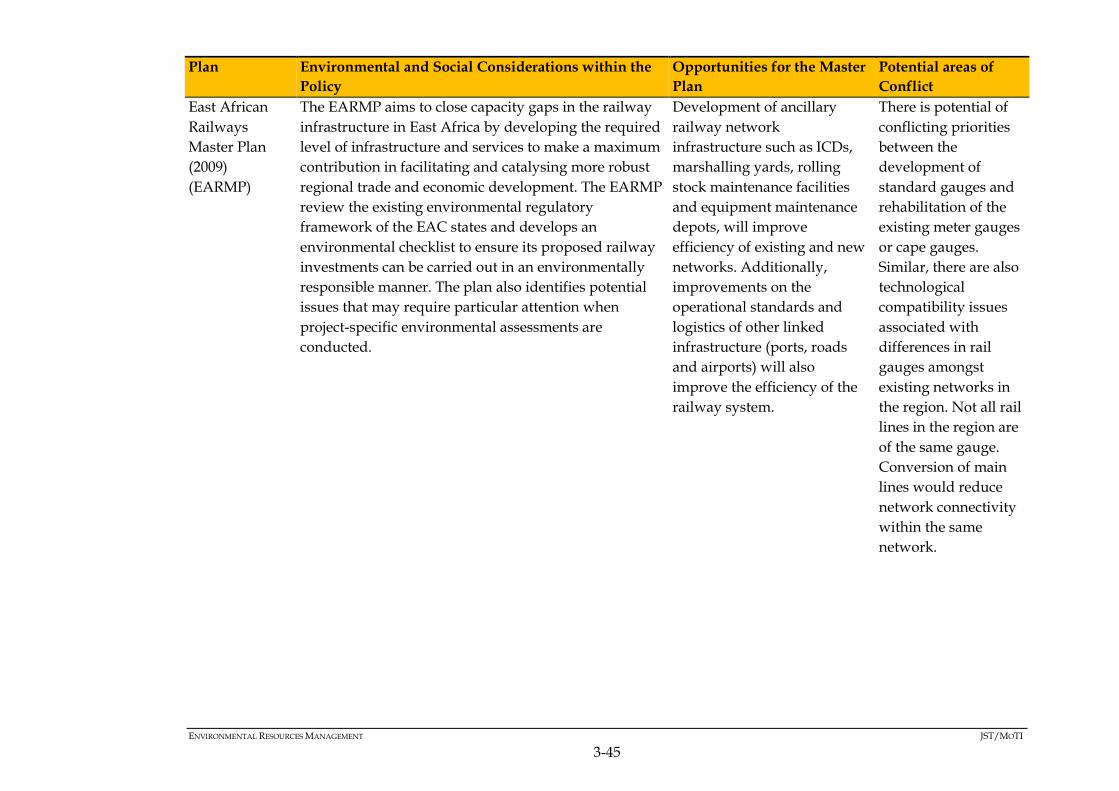
ENVIRONMENTAL RESOURCES MANAGEMENT JST/MOTI
3-45
Plan Environmental and Social Considerations within the
Policy
Opportunities for the Master
Plan
Potential areas of
Conflict
East African
Railways
Master Plan
(2009)
(EARMP)
The EARMP aims to close capacity gaps in the railway
infrastructure in East Africa by developing the required
level of infrastructure and services to make a maximum
contribution in facilitating and catalysing more robust
regional trade and economic development. The EARMP
review the existing environmental regulatory
framework of the EAC states and develops an
environmental checklist to ensure its proposed railway
investments can be carried out in an environmentally
responsible manner. The plan also identifies potential
issues that may require particular attention when
project-specific environmental assessments are
conducted.
Development of ancillary
railway network
infrastructure such as ICDs,
marshalling yards, rolling
stock maintenance facilities
and equipment maintenance
depots, will improve
efficiency of existing and new
networks. Additionally,
improvements on the
operational standards and
logistics of other linked
infrastructure (ports, roads
and airports) will also
improve the efficiency of the
railway system.
There is potential of
conflicting priorities
between the
development of
standard gauges and
rehabilitation of the
existing meter gauges
or cape gauges.
Similar, there are also
technological
compatibility issues
associated with
differences in rail
gauges amongst
existing networks in
the region. Not all rail
lines in the region are
of the same gauge.
Conversion of main
lines would reduce
network connectivity
within the same
network.

ENVIRONMENTAL RESOURCES MANAGEMENT JST/MOTI
3-46
Plan Environmental and Social Considerations within the
Policy
Opportunities for the Master
Plan
Potential areas of
Conflict
Kenya Scaling-
Up Renewable
Energy
Program
(SREP)
Investment
Plan (2011)
This plan outlines how Kenya will invest in renewable
projects under SREP. It identifies renewable energy
projects to be scaled up and for which Sectoral
Environmental Impact Assessments (SEAI) were carried
out. These SEIAs identified cumulative environmental
and social risks and proposed mitigation measures.
The NEC MP’s increased
energy demand can add to the
justification of the investments
under this plan.
Energy preference is
typically decided at
project design stage.
Economics often
dictates energy
preference whilst
users have little
influence on energy
supplied by
regulators.
Kenya
Integrated
Water
Resources
Management
and Water
Efficiency Plan
(2009) (IWRM
and WE Plan)
The IWRM and WE Plan’s long-term objective is to
achieve optimum, long-term, environmentally
sustainable social and economic benefit from the
nation’s water resources for society from their use. In
the short-term is aims to accelerate action towards
addressing key water
resources-related challenges in national development in
a more effective and comprehensive manner especially
in environmental flows, social development, tourism,
agriculture, industry, health and energy among others.
The NEC MP’s water sector
projects can contribute to the
achievement of the objective
of the IWRM and WE Plan by
adopting its guiding
principles.
There is potential for
mandate conflicts in
the water sector due
conflicting mandates
in the sector.
Similarly, there is
potential for project
priority conflicts.
The potential negative
impacts on
hydrological regimes
can undermine the
objectives of the
IWRM and WE Plan.
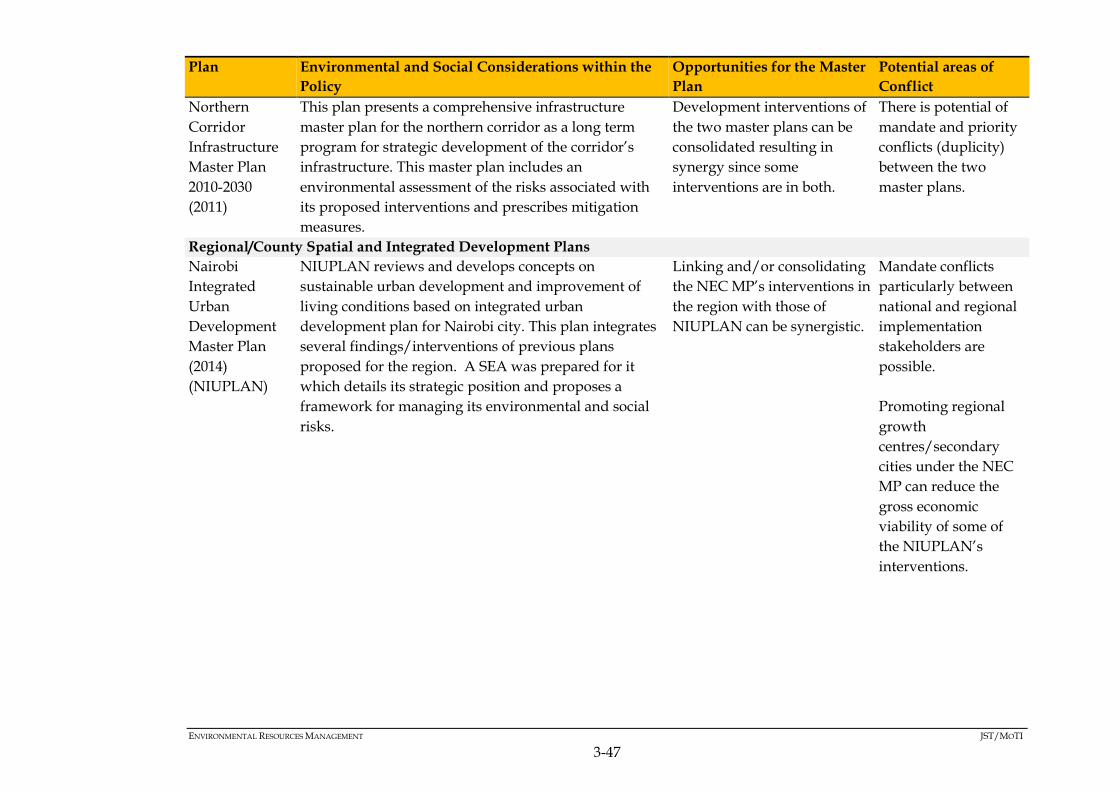
ENVIRONMENTAL RESOURCES MANAGEMENT JST/MOTI
3-47
Plan Environmental and Social Considerations within the
Policy
Opportunities for the Master
Plan
Potential areas of
Conflict
Northern
Corridor
Infrastructure
Master Plan
2010-2030
(2011)
This plan presents a comprehensive infrastructure
master plan for the northern corridor as a long term
program for strategic development of the corridor’s
infrastructure. This master plan includes an
environmental assessment of the risks associated with
its proposed interventions and prescribes mitigation
measures.
Development interventions of
the two master plans can be
consolidated resulting in
synergy since some
interventions are in both.
There is potential of
mandate and priority
conflicts (duplicity)
between the two
master plans.
Regional/County Spatial and Integrated Development Plans
Nairobi
Integrated
Urban
Development
Master Plan
(2014)
(NIUPLAN)
NIUPLAN reviews and develops concepts on
sustainable urban development and improvement of
living conditions based on integrated urban
development plan for Nairobi city. This plan integrates
several findings/interventions of previous plans
proposed for the region. A SEA was prepared for it
which details its strategic position and proposes a
framework for managing its environmental and social
risks.
Linking and/or consolidating
the NEC MP’s interventions in
the region with those of
NIUPLAN can be synergistic.
Mandate conflicts
particularly between
national and regional
implementation
stakeholders are
possible.
Promoting regional
growth
centres/secondary
cities under the NEC
MP can reduce the
gross economic
viability of some of
the NIUPLAN’s
interventions.

ENVIRONMENTAL RESOURCES MANAGEMENT JST/MOTI
3-48
Plan Environmental and Social Considerations within the
Policy
Opportunities for the Master
Plan
Potential areas of
Conflict
Master Plan for
Urban
Transport in
The Nairobi
Metropolitan
Area (2006)
(NUTRANS)
This MP has been developed with an aim of solving the
transport challenges experienced in the Nairobi
Metropolitan area (Nairobi City and its environs). It
includes a SEA which establishes a management
framework for environmental and social risks of its
proposed interventions.
The NEC MP’s interventions
in the region can be linked or
consolidated with those of
NUTRANS.
There is potential for
priority and mandate
conflicts. Primary
mandate conflicts are
between national and
regional authorities.
Comprehensive
Development
Master Plan for
Mombasa Gate
City (2016)
This MP aims to ensure that Mombasa contributes to
economic and social development along the NEC, with
a target year of 2040. The MP seeks to strengthen the
urban function of Mombasa as the gate city of the NEC.
A SEA has been prepared alongside the MP for the
management of the environmental and social risks of its
interventions.
Synergies are possible
through integration and
consolidation of the
interventions of the two
master plans.
Mandate conflicts are
also possible between
national and regional
implementation
authorities.
Decentralization of
economic activities as
proposed by the NEC
MP can lower gross
incentives for
investing in the Gate
City MP’s proposed
interventions.
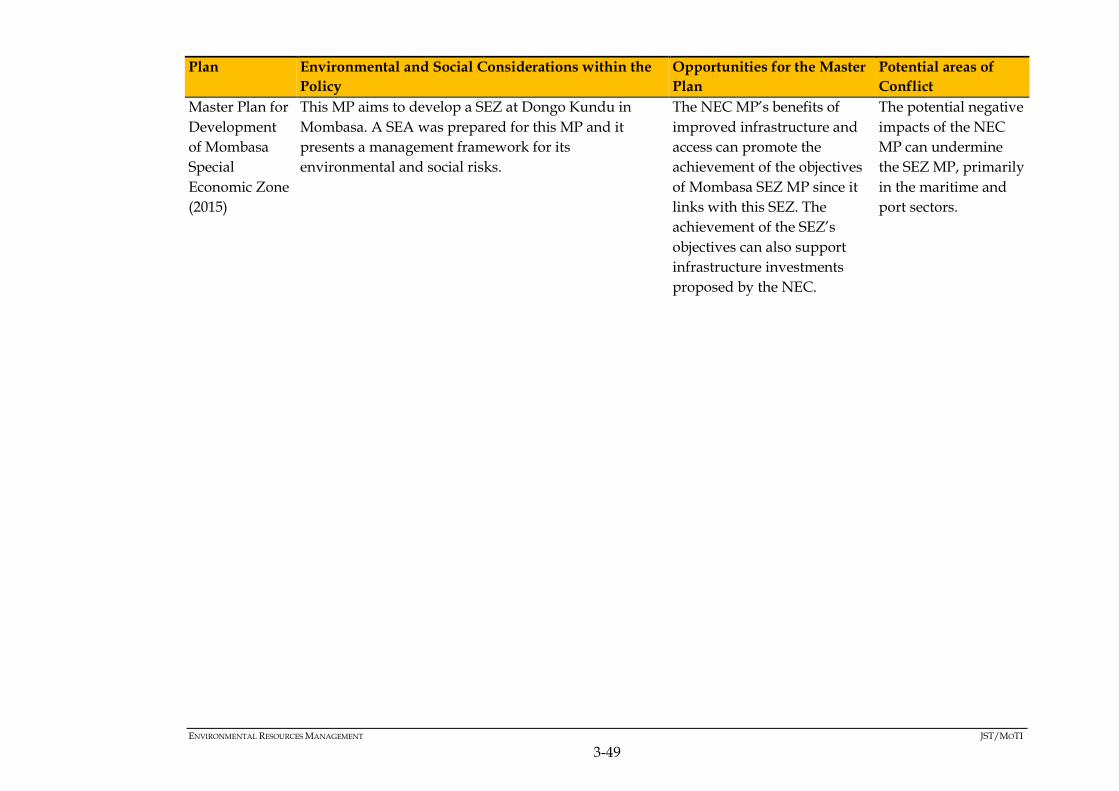
ENVIRONMENTAL RESOURCES MANAGEMENT JST/MOTI
3-49
Plan Environmental and Social Considerations within the
Policy
Opportunities for the Master
Plan
Potential areas of
Conflict
Master Plan for
Development
of Mombasa
Special
Economic Zone
(2015)
This MP aims to develop a SEZ at Dongo Kundu in
Mombasa. A SEA was prepared for this MP and it
presents a management framework for its
environmental and social risks.
The NEC MP’s benefits of
improved infrastructure and
access can promote the
achievement of the objectives
of Mombasa SEZ MP since it
links with this SEZ. The
achievement of the SEZ’s
objectives can also support
infrastructure investments
proposed by the NEC.
The potential negative
impacts of the NEC
MP can undermine
the SEZ MP, primarily
in the maritime and
port sectors.
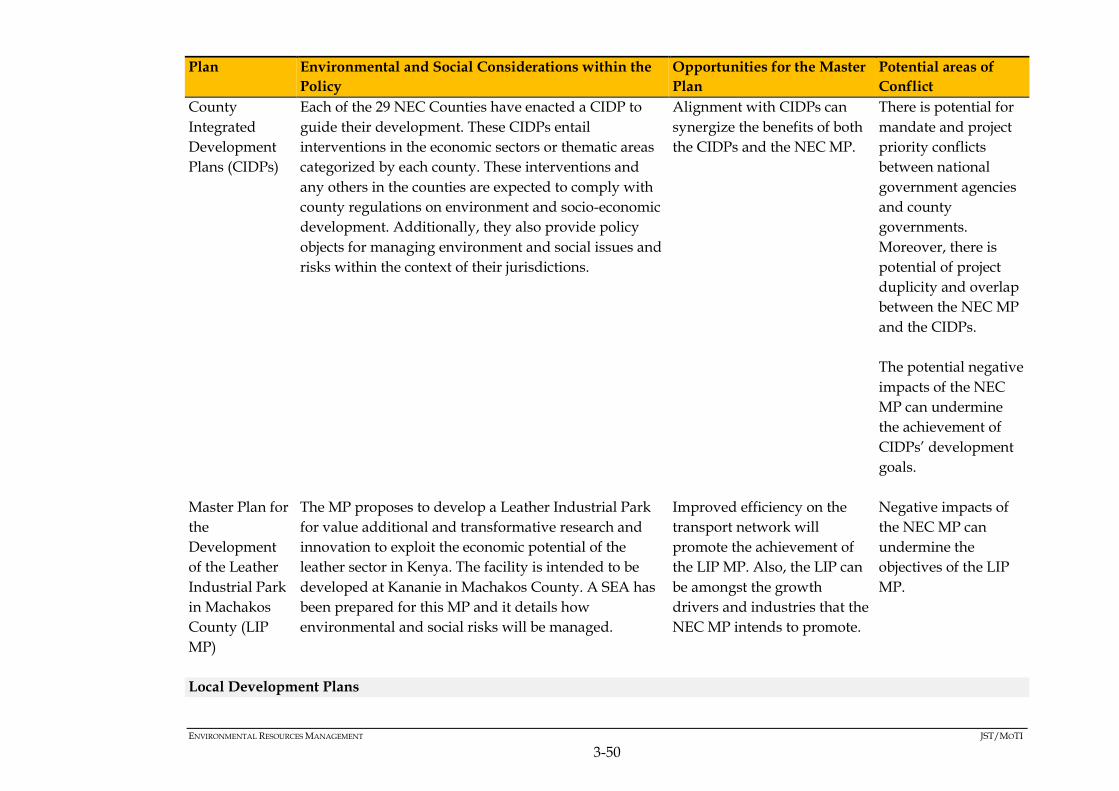
ENVIRONMENTAL RESOURCES MANAGEMENT JST/MOTI
3-50
Plan Environmental and Social Considerations within the
Policy
Opportunities for the Master
Plan
Potential areas of
Conflict
County
Integrated
Development
Plans (CIDPs)
Each of the 29 NEC Counties have enacted a CIDP to
guide their development. These CIDPs entail
interventions in the economic sectors or thematic areas
categorized by each county. These interventions and
any others in the counties are expected to comply with
county regulations on environment and socio-economic
development. Additionally, they also provide policy
objects for managing environment and social issues and
risks within the context of their jurisdictions.
Alignment with CIDPs can
synergize the benefits of both
the CIDPs and the NEC MP.
There is potential for
mandate and project
priority conflicts
between national
government agencies
and county
governments.
Moreover, there is
potential of project
duplicity and overlap
between the NEC MP
and the CIDPs.
The potential negative
impacts of the NEC
MP can undermine
the achievement of
CIDPs’ development
goals.
Master Plan for
the
Development
of the Leather
Industrial Park
in Machakos
County (LIP
MP)
The MP proposes to develop a Leather Industrial Park
for value additional and transformative research and
innovation to exploit the economic potential of the
leather sector in Kenya. The facility is intended to be
developed at Kananie in Machakos County. A SEA has
been prepared for this MP and it details how
environmental and social risks will be managed.
Improved efficiency on the
transport network will
promote the achievement of
the LIP MP. Also, the LIP can
be amongst the growth
drivers and industries that the
NEC MP intends to promote.
Negative impacts of
the NEC MP can
undermine the
objectives of the LIP
MP.
Local Development Plans
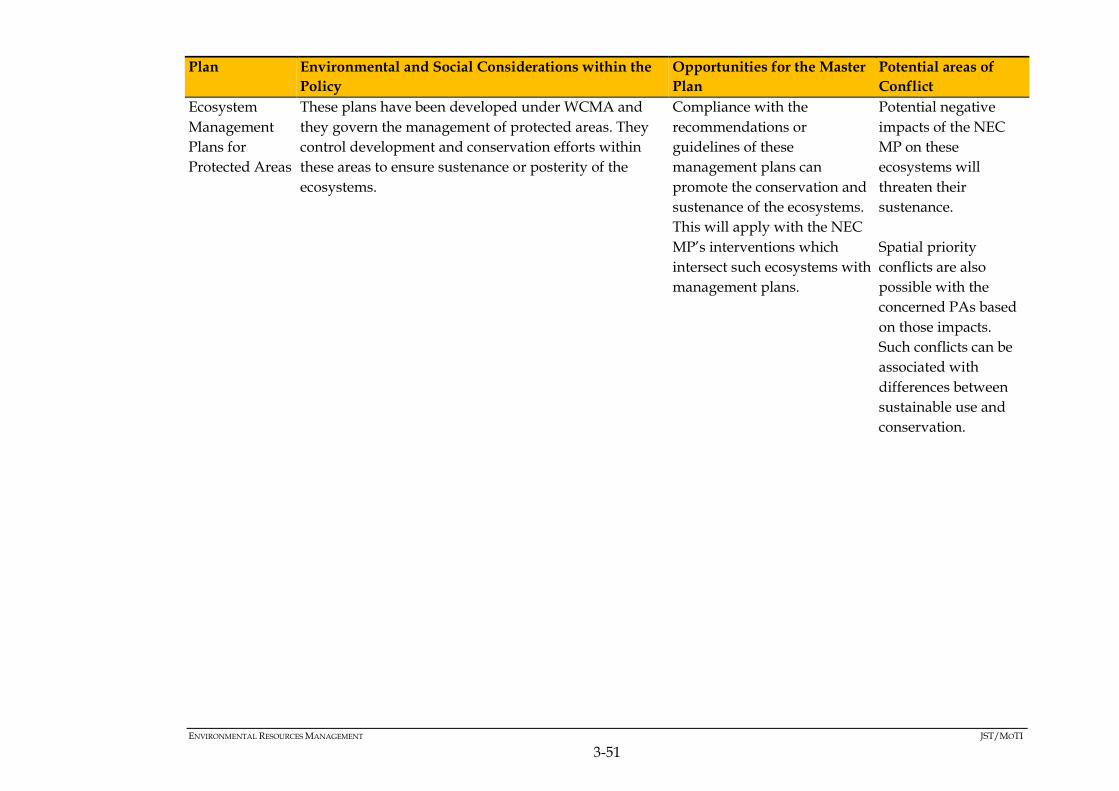
ENVIRONMENTAL RESOURCES MANAGEMENT JST/MOTI
3-51
Plan Environmental and Social Considerations within the
Policy
Opportunities for the Master
Plan
Potential areas of
Conflict
Ecosystem
Management
Plans for
Protected Areas
These plans have been developed under WCMA and
they govern the management of protected areas. They
control development and conservation efforts within
these areas to ensure sustenance or posterity of the
ecosystems.
Compliance with the
recommendations or
guidelines of these
management plans can
promote the conservation and
sustenance of the ecosystems.
This will apply with the NEC
MP’s interventions which
intersect such ecosystems with
management plans.
Potential negative
impacts of the NEC
MP on these
ecosystems will
threaten their
sustenance.
Spatial priority
conflicts are also
possible with the
concerned PAs based
on those impacts.
Such conflicts can be
associated with
differences between
sustainable use and
conservation.
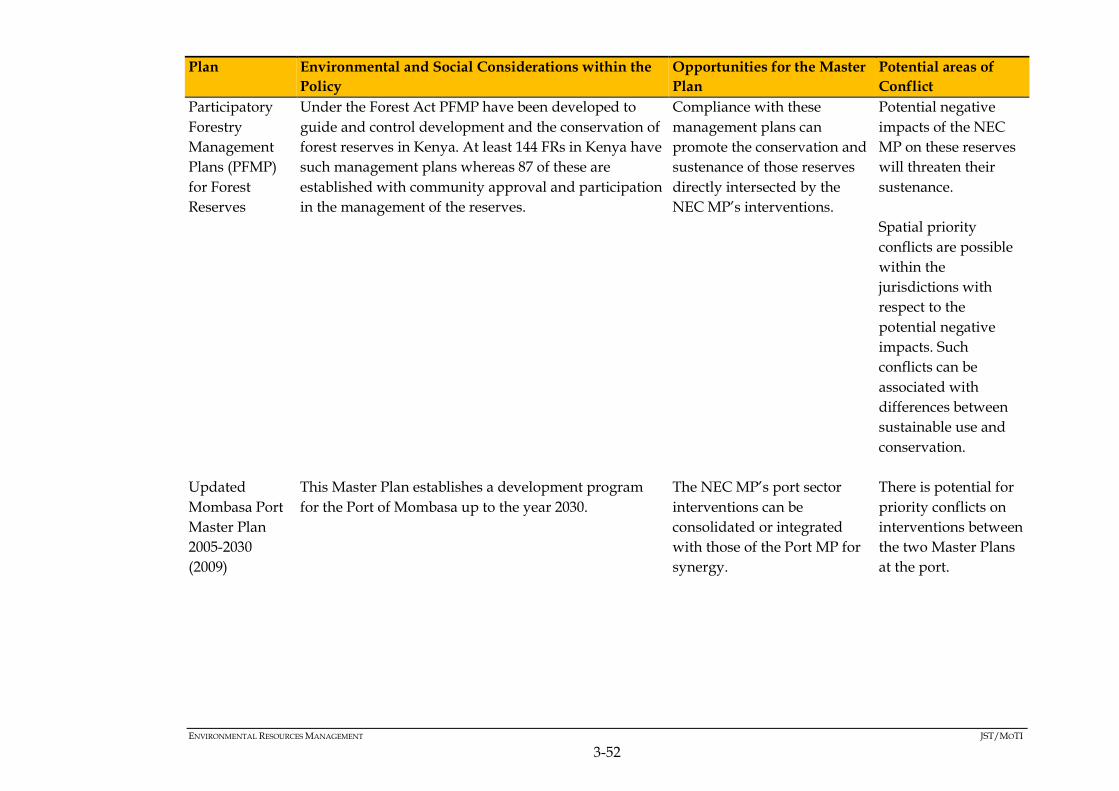
ENVIRONMENTAL RESOURCES MANAGEMENT JST/MOTI
3-52
Plan Environmental and Social Considerations within the
Policy
Opportunities for the Master
Plan
Potential areas of
Conflict
Participatory
Forestry
Management
Plans (PFMP)
for Forest
Reserves
Under the Forest Act PFMP have been developed to
guide and control development and the conservation of
forest reserves in Kenya. At least 144 FRs in Kenya have
such management plans whereas 87 of these are
established with community approval and participation
in the management of the reserves.
Compliance with these
management plans can
promote the conservation and
sustenance of those reserves
directly intersected by the
NEC MP’s interventions.
Potential negative
impacts of the NEC
MP on these reserves
will threaten their
sustenance.
Spatial priority
conflicts are possible
within the
jurisdictions with
respect to the
potential negative
impacts. Such
conflicts can be
associated with
differences between
sustainable use and
conservation.
Updated
Mombasa Port
Master Plan
2005-2030
(2009)
This Master Plan establishes a development program
for the Port of Mombasa up to the year 2030.
The NEC MP’s port sector
interventions can be
consolidated or integrated
with those of the Port MP for
synergy.
There is potential for
priority conflicts on
interventions between
the two Master Plans
at the port.
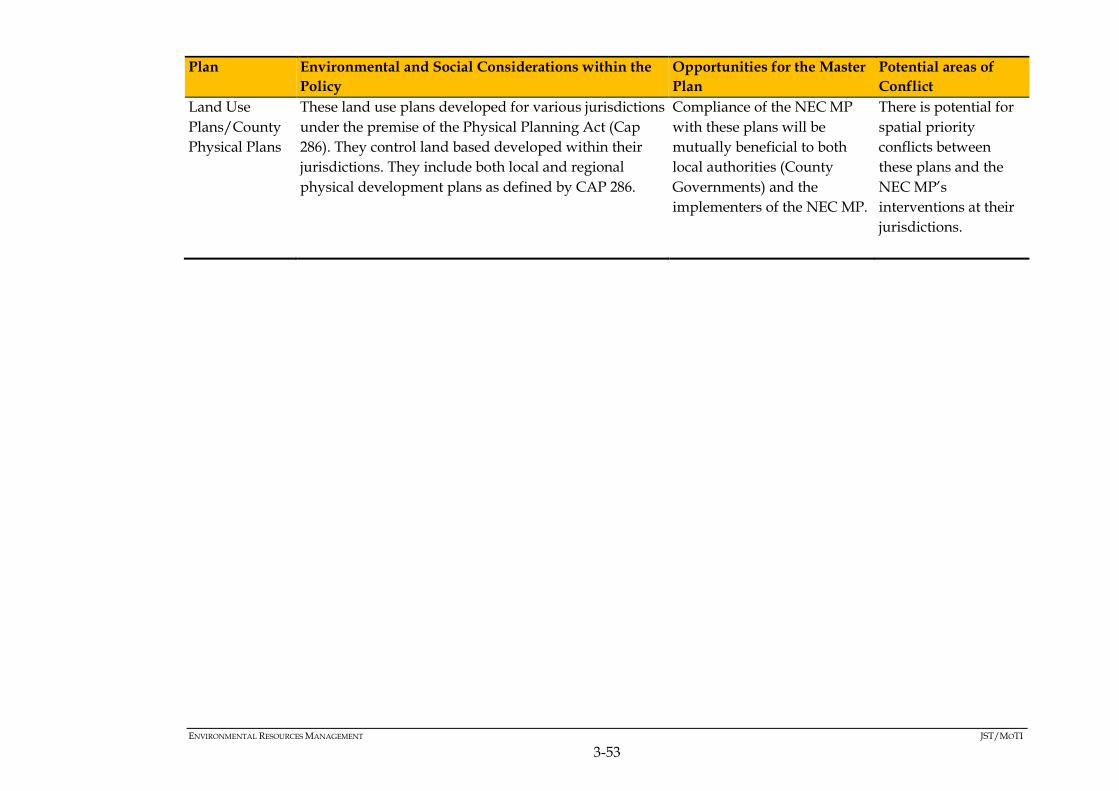
ENVIRONMENTAL RESOURCES MANAGEMENT JST/MOTI
3-53
Plan Environmental and Social Considerations within the
Policy
Opportunities for the Master
Plan
Potential areas of
Conflict
Land Use
Plans/County
Physical Plans
These land use plans developed for various jurisdictions
under the premise of the Physical Planning Act (Cap
286). They control land based developed within their
jurisdictions. They include both local and regional
physical development plans as defined by CAP 286.
Compliance of the NEC MP
with these plans will be
mutually beneficial to both
local authorities (County
Governments) and the
implementers of the NEC MP.
There is potential for
spatial priority
conflicts between
these plans and the
NEC MP’s
interventions at their
jurisdictions.
ENVIRONMENTAL RESOURCES MANAGEMENT JST/MOTI
3-54
3.6.3 Comparative Analysis of the Master Plan with other Programmes

ENVIRONMENTAL RESOURCES MANAGEMENT JST/MOTI
3-55
Table 3.7 Analysis of Relevant Programmes with the NEC Master Plan
Programme Environmental and Social
Considerations within the
Policy
Opportunities for the Master
Plan
Potential areas of Conflict
The Land Cover and Land Use Mapping Initiative
Vision 2030 flagship progamme that will map land cover and use in the country
Detailed information on land use and land cover in the NEC will be availed.
None
The Water Catchment Management Initiative
Vision 2030 flagship progamme that will manage water catchments in the country
Water catchments within NEC such as the Athi and Tana, South and Northern Lake Victoria Basin, will be managed
None
Securing the Wildlife Corridors and Migratory Routes Initiative
Vision 2030 flagship progamme that will provide and keep open wildlife corridors in the country
Wildlife corridors and migratory routes such as in the Tsavo West, Tsavo West, Chyulu, Nairobi National Park, Longonot, Hell’s Gate, Lake Nakuru National Parks will be secured and protected
In areas traversed by the roads and railway
The Solid Waste Management System Initiative
Vision 2030 flagship progamme that will develop solid waste management system
The system will indicate how solid waste especially in urban areas including those in the NEC will be collected and disposed or used.
None
Rehabilitation and protection of indigenous forests in the 5 water towers
This project entails full rehabilitation of the 5 water towers in the country.
Indigenous forests in the Mau Escarpment Abadares Ranges, Mt. Kenya, Cherengani Hills and Mt. Elgon will be rehabilitated and protected
None
Rehabilitation, Regeneration & Restoration of Nairobi Rivers
The aim of the programme is to fully rehabilitate the catchment basin of the Nairobi River in order to make it a recreation site.
Nairobi rivers will be rehabilitated, regenerated and restored. Other rivers like Ngong will also be covered under this programme.
None

ENVIRONMENTAL RESOURCES MANAGEMENT JST/MOTI
3-56
Programme Environmental and Social
Considerations within the
Policy
Opportunities for the Master
Plan
Potential areas of Conflict
Water harvesting and storage programme
Water from rivers that flood will be harvested and stored
The floods of Western Kenya will be managed through construction of large multi-purpose dams along Rivers Nzoia and Nyando. Water dykes will also be constructed along the lower reaches of Nzoia and Nyando rivers
None
Urban sewerage programme Managing environmental pollution in towns and in water basins
Urban sanitation and hygiene improved and pollution of shared water basins in the NEC will be controlled.
None
The Plastic Bags Initiative Vision 2030 flagship progamme that will require tightening regulations in order to limit production and usage of environmentally-detrimental plastic bags
Production and usage of environmentally detrimental bags will be regulated
None
Rural Electrification programme (REP)
Rural Electrification Programme financed to the tune of Kshs. 2.7 billion to cover various parts of the country.
The programme will facilitate connection of power to 460 trading centres and 110 secondary schools, among other public amenities, many which are within the NEC
None
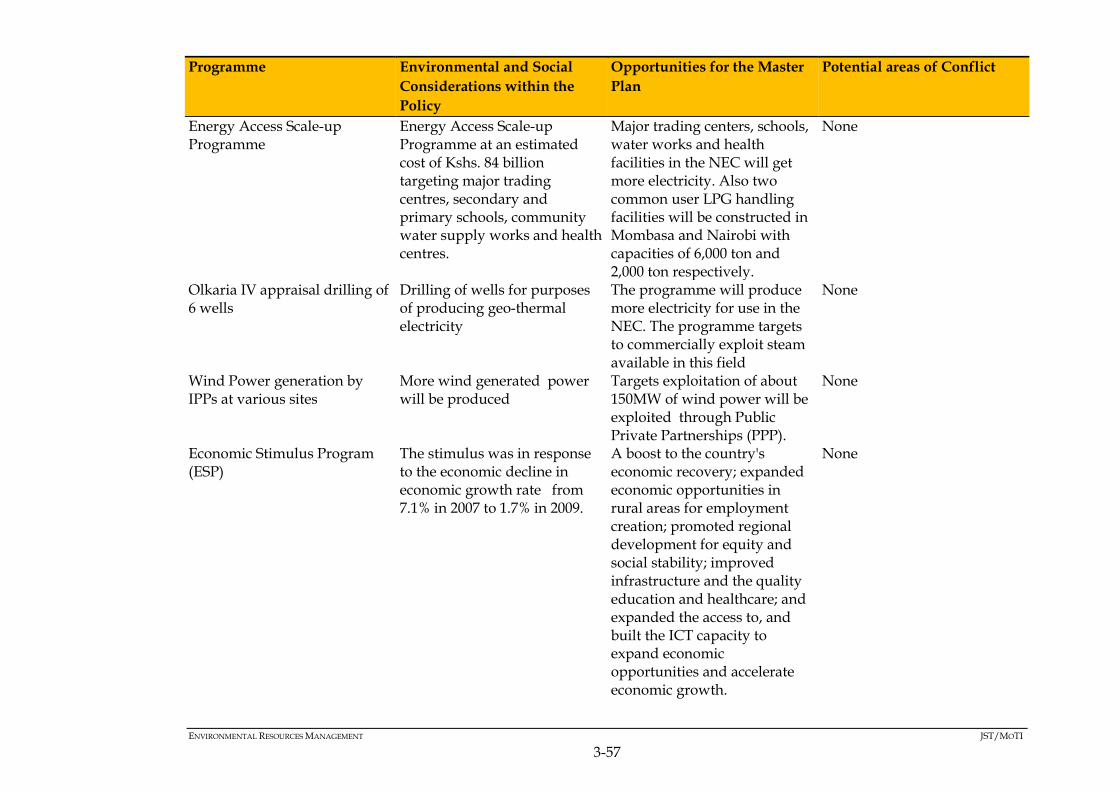
ENVIRONMENTAL RESOURCES MANAGEMENT JST/MOTI
3-57
Programme Environmental and Social
Considerations within the
Policy
Opportunities for the Master
Plan
Potential areas of Conflict
Energy Access Scale-up Programme
Energy Access Scale-up Programme at an estimated cost of Kshs. 84 billion targeting major trading centres, secondary and primary schools, community water supply works and health centres.
Major trading centers, schools, water works and health facilities in the NEC will get more electricity. Also two common user LPG handling facilities will be constructed in Mombasa and Nairobi with capacities of 6,000 ton and 2,000 ton respectively.
None
Olkaria IV appraisal drilling of 6 wells
Drilling of wells for purposes of producing geo-thermal electricity
The programme will produce more electricity for use in the NEC. The programme targets to commercially exploit steam available in this field
None
Wind Power generation by IPPs at various sites
More wind generated power will be produced
Targets exploitation of about 150MW of wind power will be exploited through Public Private Partnerships (PPP).
None
Economic Stimulus Program (ESP)
The stimulus was in response to the economic decline in economic growth rate from 7.1% in 2007 to 1.7% in 2009.
A boost to the country's economic recovery; expanded economic opportunities in rural areas for employment creation; promoted regional development for equity and social stability; improved infrastructure and the quality education and healthcare; and expanded the access to, and built the ICT capacity to expand economic opportunities and accelerate economic growth.
None

ENVIRONMENTAL RESOURCES MANAGEMENT JST/MOTI
3-58
Programme Environmental and Social
Considerations within the
Policy
Opportunities for the Master
Plan
Potential areas of Conflict
Kenya Rural Development Programme (KRDP)
To promote sustainable livelihood diversification in Arid and semi arid lands
Livelihoods in ASAL counties within the NEC are being diversified
None
Agricultural Sector Development Support Programme (ASDSP)
The overall objective is to achieve agricultural growth rate of 7% per year through commercialization and modernization of the sector
Increased agricultural cargo to be handled by the NEC
None
Kenya’s Industrial Transformation Programme
Economic Pillar of Vision 2030 which aims to transform Kenya into a newly industrializing, “middle-income country providing a high-quality life to all its citizens by the year 2030
Creates a robust, diversified and competitive manufacturing sector in the NEC in three ways: 1) boosting local production, 2) expanding to the regional market and 3) taking advantage of global market niches.
None

ENVIRONMENTAL RESOURCES MANAGEMENT JST/MOTI
3-59
Programme Environmental and Social
Considerations within the
Policy
Opportunities for the Master
Plan
Potential areas of Conflict
Kenya Extractive Industries Development Programme (KEIDP)
Supports efforts to develop a stable, transparent and sustainable extractive industry covering oil, gas and mining, which delivers inclusive benefits to Kenyan citizens. KEIDP’s objective and principal outputs are achieved through four key components: (i) Ministry of Mining; (ii) Ministry of Energy and Petroleum; (iii) Community Engagement Component; (iv) Cross Cutting Component comprising a Local Content Study and the Information Centre for the Extractives Sector( ICES)
The Programme is structured around two principal outputs: (i) Increased capacity of key national government agencies to govern the sector well; and (ii) Significantly improved participatory, equitable and sustainable collective stewardship of the extractive sectors
None
School Feeding Programme Used to incentivize the enrollment and retention of rural children and girls, as part in the realizing the country’s goal of universal primary education
Through providing daily meals, schools are able to meet immediate food needs, provide future safety nets, and offer long-term assistance and empowerment to children, families and communities within the ASAL areas of the NEC
None
National Aids and STI Control Programme (NASCOP)
Controlling the spread of HIV and sexually transmitted diseases
Increasing labor productivity and reducing public expenditure on these diseases in the NEC
None

ENVIRONMENTAL RESOURCES MANAGEMENT JST/MOTI
3-60
Programme Environmental and Social
Considerations within the
Policy
Opportunities for the Master
Plan
Potential areas of Conflict
The East African Marine Systems (TEAMS)
A submarine cable that will extend from Mombasa to Fujairah in the UAE.
Kenya will have affordable high-capacity bandwidth
None
National Terrestrial Fibre Optic Network Project
Intended to compliment the TEAMS programme.
Programme ensures maximum utilization of capacity and connectivity in all the counties
Government Common Core Network (GCCN)
Intended to function as a shared and secure interoperable government-wide ICT architecture.
The system does not only integrate work processes and information flow, but also improves inter-ministerial sharing of databases and exchange of information
None
Local and Wide Area Networks
Local Area Networks (LANS) have been installed in all government ministry headquarters.
This eases communication. It has been extended to all the counties
None
Kenya Transparency Communication Infrastructure Programme (KTCIP)
This programme aims to ensure equity in the provision of ICT services.
The programme incorporates establishment of digital villages and bandwidth subsidies in the counties.
None
Data Centre/Data Recovery Centre
The government Data Centre (GDC) will be established to provide storage for all government data bases.
The Neutral Data Centre will provide world-class services to government ministries, departments and agencies, private sector operators and businesses.
None
Digital Literacy Programme Promoting computer based learning in primary schools
More than 12,000 digital devices for the programme will be distributed to 150 primary schools for the pilot phase of the Digital Literacy Programme
None

ENVIRONMENTAL RESOURCES MANAGEMENT JST/MOTI
3-61
Programme Environmental and Social
Considerations within the
Policy
Opportunities for the Master
Plan
Potential areas of Conflict
Women Enterprise Fund The fund capacity builds women entrepreneurs through the concept volunteerism. The volunteers are based at constituency level and their roles include recruiting women, training them and monitoring their projects and loan repayments.
The fund will empower women so that they can participate in businesses in the NEC
None
Youth Enterprise Development Fund
The Fund is one of the flagship projects of Vision 2030, under the social pillar. Its strategic focus is on enterprise development as a key strategy that will increase economic opportunities for, and participation by Kenyan Youth in nation building.
The Fund creates employment opportunities for young people through entrepreneurship and encouraging them to be job creators and not job seekers. It does this by providing easy and affordable financial and business development support services to youth who are keen on starting or expanding businesses.
None
Uwezo Youth Development Programme
Flagship programme for vision 2030 which aims at empowering women, youth and persons with disabilities.
Enables women, youth and persons with disability access finances to promote businesses and enterprises at the constituency level, thereby enhancing economic growth towards the realization of the same and the Millennium Development Goals No.1
None

ENVIRONMENTAL RESOURCES MANAGEMENT JST/MOTI
3-62
Programme Environmental and Social
Considerations within the
Policy
Opportunities for the Master
Plan
Potential areas of Conflict
Gender mainstreaming This will ensure inclusion of gender related issues in all government policies, plans and programmes
The needs and interests of each gender (i.e. women and men, girls and boys) are addressed
None
Special Programmes (Famine and disaster risk reduction)
Reduction of risks associated with famine and disasters
Minimize the effects of famine and disasters on the people and the economy
None
ENVIRONMENTAL RESOURCES MANAGEMENT JST/MOTI
4-1
4 METHODOLOGY AND APPROACH
This SEA methodology Chapter is based on the:
NEMA National Guidelines for SEA in Kenya, 2012, specifically
Appendix 7 – Consolidated Checklist for the Quality Assurance, Review
and Performance Evaluation of a Comprehensive SEA, and the
Transport Analysis Guidance (TAG), Transport Appraisal Process
from the UK Department of Transport publication of January
2014.
4.1 SEA STUDY AREA
The target area of the Master Plan study covers the following routes
and surrounding areas (see below) (1):
Main route
o Mombasa – Nairobi – Tororo –Kampala – Katuna – Kigali
(Rwanda)
Sub-routes
o Eldoret – Nadapal – Juba (South Sudan)
o Tororo – Gulu – Elegu – Juba
o Kampala – Gulu – Elegu – Juba
o Mbarara – Mpondwe – Kisangani (DRC)
(1) It is important to note that an SEA is also being carried out in Uganda, under consultation with NEMA Uganda
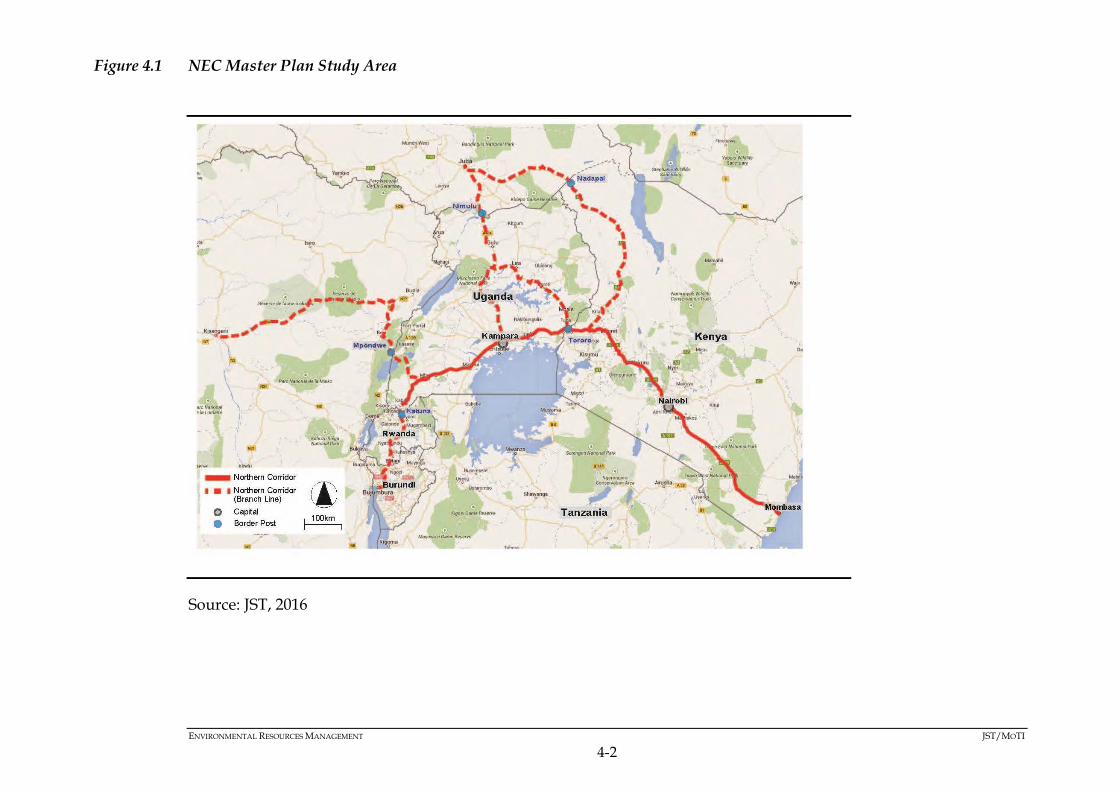
ENVIRONMENTAL RESOURCES MANAGEMENT JST/MOTI
4-2
Figure 4.1 NEC Master Plan Study Area
Source: JST, 2016
ENVIRONMENTAL RESOURCES MANAGEMENT JST/MOTI
4-3
4.2 SCREENING
Screening is carried out to establish whether an SEA is appropriate and
relevant to the development of a PPP (NEMA, 2012). It is used to
determine the potential of a PPP to result in significant impacts on the
environment and to determine if a SEA is required. The screening stage
of the SEA is when:
objectives are set, and
the process of identifying stakeholders is carried out.
As discussed in Chapter 1 of this SEA Report, a PPP Brief was submitted
to NEMA in June 2015 by the JST on behalf of MoTI. The screening
results were thereafter communicated to the Ministry, i.e., the decision
by NEMA that an SEA was necessary, and was to be carried out in
accordance with the National Guidelines for SEA in Kenya (2012).
4.3 SCOPING
The scoping stage establishes the focus and content of the SEA and the
relevant criteria for assessment. The scoping study identified the
potentially significant environmental and social impacts relating to the
PPP that needed to be addressed as part of the SEA Study. The scoping
study was carried out by ERM between October 2015 and February
2016.
As part of the Scoping Study the following activities were undertaken:
Identification of sources of secondary data on baseline conditions;
Identification of, and consultation with, stakeholders who would be
interested and/or affected by the NEC Master Plan;
Identification of cross-sectoral issues and impacts, prioritising them
on a shortlist which would need to be considered as part of the SEA;
and
Defining the environmental, social and legislative setting of the
Master Plan.
The following methods of data collection were used during the Scoping
Study:
A desk-top review of documents including the JST Master Plan
Inception Report and Progress Report Number 1, as well as other
relevant PPPs,
ENVIRONMENTAL RESOURCES MANAGEMENT JST/MOTI
4-4
Consultative meetings with Stakeholders in Nairobi, Nakuru,
Mombasa, Kisumu and Malaba (1) , and
Preparation and circulation of a questionnaire that was
administered during the Stakeholder Meetings in the 5 towns.
The Scoping Report was submitted to NEMA on the 02nd March 2016
and the Report was approved by NEMA on 06th April 2016 (Reference
number NEMA/SEA/5/2/043).
4.4 BASELINE DATA COLLECTION AND CONSTRAINTS MAPPING
In order to understand the existing baseline environmental and social
conditions in the area, a variety of data collection methods were
undertaken.
4.4.1 Baseline Data Collection
Due to the extensive coverage of the Master Plan, the level of baseline
data was collected at County and City levels from secondary data,
mainly the most recent County Integrated Development Plans (CIDPs),
Strategic Plans and the Kenya National Bureau of Statistics.
Other sources of data included:
United Nations Educational, Scientific and Cultural Organization
(UNESCO), for data on cultural and scientific significance;
Ramsar, for the identification and mapping of wetlands of
international importance;
Ministry of Planning and Devolution (Kenya), for County Profiles;
USGS and NASA – Satellite Imagery and Earthquake Data, for
seismic and satellite information;
NOAA – Tropical Storm Data, for information on natural hazards;
International Union for the Conservation of Nature (IUCN), for the
identification of conservation areas and identification of threatened
species;
UNEP-WCMC and IUCN – Protected Planet, for the identification of
protected areas and areas of conservation value;
BirdLife International and Nature Kenya, for the identification of
important bird areas (IBAs);
(1)It is important to note that since the coverage area of the Master Plan is so extensive, the places where the stakeholder
meetings were conducted was limited to major cities/towns along the Corridor. This was agreed in consultative meetings
between NEMA/JST/MoTI.

ENVIRONMENTAL RESOURCES MANAGEMENT JST/MOTI
4-5
Kenya Institute for Public Policy Research and Analysis (KIPPRA)
Economic Report 2014 Data, for the performance of the Kenyan
economy;
Kenya Wildlife Service (KWS), for the identification and mapping of
nature reserves and national parks; and
Kenya Forest Service (KFS), for the identification and mapping of
gazetted forest reserves.
Baseline data was collected as per the National Guidelines for SEA in
Kenya (NEMA, 2012), as indicated in Box 4.1
Box 4.1 Baseline Data Collected
Source: NEMA, 2012
4.4.2 Document Review
A detailed literature review was undertaken based on the findings of
the scoping process, which involved reviewing legislation, policies,
County Development Plans, and previous studies carried out in the
area to determine the baseline conditions and establish the legal,
institutional and biophysical and socio-economic environmental setting
of the proposed project.
The desk based study also included the development of Key Informant
Interview (KII) questionnaires/guided discussions, as well as the
approach to continued stakeholder engagement as outlined in the
Stakeholder Engagement Plan (SEP).
4.4.3 Stakeholder Consultation
Stakeholder consultation during baseline data collection was carried
out as follows:
Physical environment - including climate, air quality, water resources
and water quality, noise, topography, soils, geology, hydrology
including risks of natural disasters.
Biological conditions - biodiversity, ecology and nature conservation
in which issues of endangered species, protected ecosystems, habitat,
species of commercial importance, invasive species and their impacts
are assessed.
Social-economic conditions and human health – including
archaeology and cultural heritage landscape and facial aspects,
recreational, social-economic aspects, land use, transportation,
infrastructure, agricultural development, tourism, and human health.

ENVIRONMENTAL RESOURCES MANAGEMENT JST/MOTI
4-6
Key Informant Interviews (KII) with various high-level Stakeholders
in Nairobi, Nakuru, Mombasa, Kisumu and Malaba,
A second round of consultative meetings with Stakeholders in
Nairobi, Nakuru, Mombasa, Kisumu and Malaba;
Additional meetings with the Ministries relevant to the Master Plan,
as well as the County Representatives that the NEC traverses.
4.4.4 Identifying Constraints and Opportunities
This stage was concerned with identifying the physical, legal and
institutional constraints, and the opportunities affecting the Area of
Interest (AoI).
4.4.4.1 Identifying Constraints
Constraints are features which limit the potential transport options
available. Constraints identified by the SEA experts included:
areas with extensive development within urban areas through to
landscape and environmental constraints in most rural areas,
physical features which exert special constraints on the shape of the
logistics strategy, such as sensitive areas of ecological or landscape
or heritage importance, built-up areas, hilly terrain, rivers and
railways that are expensive to bridge, etc., and
Institutional or legal constraints which are important to take into
account, e.g., the provision of elements of the public transport
system by private operators who will have their own commercial
objectives. The extent to which these institutional and legal
constraints have a material bearing on the outcome of the SEA
depend on the extent to which the recommendations are developed
with the private suppliers of transport.
Early appreciation of any constraints, especially those which may be
“show-stoppers”, is essential when developing and assessing options.
However, identification of constraints, can limit the option generation
process unnecessarily. The SEA Experts therefore assessed the extent to
which each of the identified constraints can or cannot be overcome (and
how).
4.4.4.2 Identifying Opportunities
In parallel with listing constraints, any opportunities to improve the
transport and logistic system more widely or to have positive impacts

ENVIRONMENTAL RESOURCES MANAGEMENT JST/MOTI
4-7
on issues of wider concern, such as regeneration, were noted. Examples
of opportunities include:
ways of making better use of the existing infrastructure or existing
underused assets (e.g. reopening rail lines),
transport that opens up development land for regeneration or
housing, and
enhancements to the environment.
4.5 IMPACT ASSESSMENT AND MITIGATION
The SEA assessment and mitigation methodology relied heavily on the
Transport Analysis Guidance (TAG), Transport Appraisal Process from
the UK Department of Transport publication of January 2014:
https://www.gov.uk/transport-analysis-guidance-webtag
Additional useful information on the reporting of specific impacts, and
on the assessment of significance of impacts, was sourced from:
http://www.standardsforhighways.co.uk/dmrb/
4.5.1 Assessing the Significance of Impacts
The significance of the impact was formulated as a function of the
receptor or resource environmental value (or sensitivity) and the
magnitude of project impact (change). In other words, significance
criteria are used to report the effect of the impact.
Table 4.1 Environmental Value (or Sensitivity) and Typical Descriptors
Value
(sensitivity)
Typical Descriptors
Very High Very high importance and rarity, international scale and
very limited potential for substitution
High High importance and rarity, national scale and limited
potential for substitution
Medium High or medium importance and rarity, regional scale,
limited potential for substitution
Low (or Lower) Low or medium importance and rarity, local scale
Negligible Very low importance and rarity, local scale
Source: UK Department of Transport, 2014

ENVIRONMENTAL RESOURCES MANAGEMENT JST/MOTI
4-8
Table 4.2 Assessment Magnitude of Impact
Magnitude of
Impact
Typical Criteria Descriptors
Major Loss of resource and/or quality and integrity of resource,
severe damage to key characteristics, features or elements
(adverse)
Large scale or major improvement of resource quality,
extensive restoration or enhancement, major improvement of
attribute quality (beneficial)
Moderate Loss of resource but not so adversely affecting the integrity,
partial loss of damage to key characteristics, features or
elements (adverse)
Benefit to, or addition of, key characteristics, features or
elements, improvement of attribute quality (beneficial)
Minor Some measureable change in attributes, quality or
vulnerability, minor loss of, or alteration to one (maybe more)
key characteristics, features or elements (adverse)
Minor benefit to, or addition of, one (maybe more) key
characteristics, features or elements, some beneficial impact on
attribute or a reduced risk of negative impacts occurring
(beneficial)
Negligible Very minor loss or detrimental alteration to one or more
characteristic, feature or element (adverse)
Very minor benefit to or positive addition of one or more
characteristic, feature or element (beneficial)
No Change No loss or alteration of characteristic, features or elements, no
observable impact in either direction.
Source: UK Department of Transport, 2014
The approach to assigning the significance of impacts was based on
reasoned arguments, professional judgement and taking on board the
advice and views of appropriate Stakeholders. The five significance
categories are set out in Table 4.3
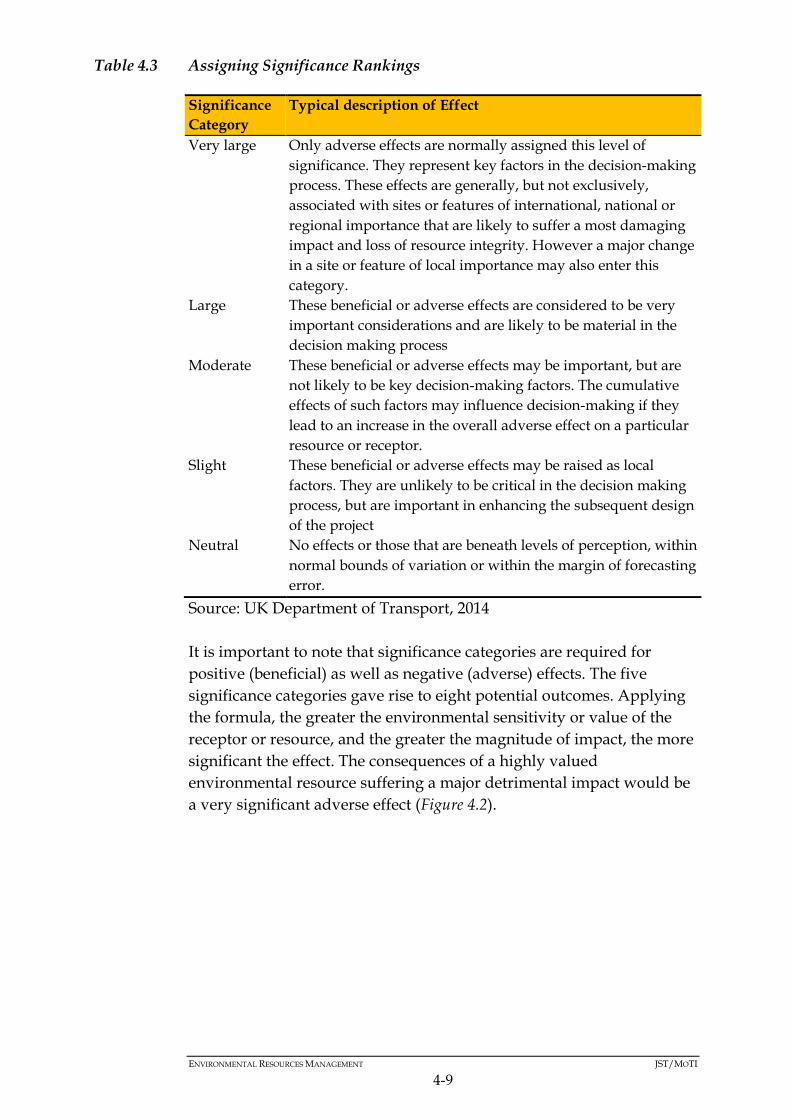
ENVIRONMENTAL RESOURCES MANAGEMENT JST/MOTI
4-9
Table 4.3 Assigning Significance Rankings
Significance
Category
Typical description of Effect
Very large Only adverse effects are normally assigned this level of
significance. They represent key factors in the decision-making
process. These effects are generally, but not exclusively,
associated with sites or features of international, national or
regional importance that are likely to suffer a most damaging
impact and loss of resource integrity. However a major change
in a site or feature of local importance may also enter this
category.
Large These beneficial or adverse effects are considered to be very
important considerations and are likely to be material in the
decision making process
Moderate These beneficial or adverse effects may be important, but are
not likely to be key decision-making factors. The cumulative
effects of such factors may influence decision-making if they
lead to an increase in the overall adverse effect on a particular
resource or receptor.
Slight These beneficial or adverse effects may be raised as local
factors. They are unlikely to be critical in the decision making
process, but are important in enhancing the subsequent design
of the project
Neutral No effects or those that are beneath levels of perception, within
normal bounds of variation or within the margin of forecasting
error.
Source: UK Department of Transport, 2014
It is important to note that significance categories are required for
positive (beneficial) as well as negative (adverse) effects. The five
significance categories gave rise to eight potential outcomes. Applying
the formula, the greater the environmental sensitivity or value of the
receptor or resource, and the greater the magnitude of impact, the more
significant the effect. The consequences of a highly valued
environmental resource suffering a major detrimental impact would be
a very significant adverse effect (Figure 4.2).

ENVIRONMENTAL RESOURCES MANAGEMENT JST/MOTI
4-10
Figure 4.2 Arriving at the Significance of Effect Categories
Source: UK Department of Transport, 2014
Change can be either beneficial or adverse, and effects can also,
therefore, be either beneficial or adverse. In some cases above the
significance was shown as being one of two alternatives. In these cases
a single description was decided upon with reasoned judgement for
that level of significance chosen.
It is important to note that at the early stages of project design, the
details of mitigation are likely to be poorly defined. The significance
assigned to impacts by the SEA Consultant should be based upon the
assumption that only standard mitigation practices should be put in
place. Where other mitigation measures may be feasible or desirable to
address the effects, then these should be noted but these should not
influence the significance score that is assigned at this early stage. The
uncertainty regarding their adoption needs to be made clear and
subsequently resolved by the PPP Owner at the later stages of the
project assessment and design.
Topics seek to ensure that the following questions, where relevant,
should be considered in evaluating the significance of potential effects:
i. Which receptors/resources would be affected and in what way?
ii. Is the receptor/resource of a local, regional, national or
international importance, sensitivity or value?

ENVIRONMENTAL RESOURCES MANAGEMENT JST/MOTI
4-11
iii. Does the effect occur over the long or short term; is it permanent
or temporary and increase or decrease with time?
iv. Is the change reversible or irreversible?
v. Are environmental and health standards (e.g., local air quality
standards) being threatened?
vi. Are feasible mitigating measures available?
4.5.2 Determining the Significance of Cumulative Effects
When considered in isolation, the environmental effects of any single
project upon any single receptor/ resource may not be significant.
However, when individual effects are considered in combination, the
resulting cumulative effect may be significant. The focus in assigning
significance to cumulative effects should be determined by the extent to
which the impacts can be accommodated by the receptor/resource.
Thresholds (limits beyond which cumulative change becomes a
concern) and indicative levels of acceptable performance of a
receptor/resource may also aid the assessment process.
The following factors should be considered in determining the
significance of cumulative effects:
• Which receptors/resources are affected?
• How will the activity or activities affect the condition of the
receptor/resource?
• What are the probabilities of such effects occurring?
• What ability does the receptor/resource have to absorb further
effects before change becomes irreversible?
It is useful to standardise significance criteria for cumulative effects.
The 5 categories below could be used as a framework for determining
significance of cumulative effects:
Table 4.4 Determining the Effects of Cumulative Impacts
Significance Effect
Severe Effects that the decision-maker must take into account as the
receptor/resource is irretrievably compromised
Major Effects that may become a key decision-making issue
Moderate Effects that are unlikely to become issues on whether the
project design should be selected, but where future work may
be needed to improve on current performances
Minor Effects that are locally significant

ENVIRONMENTAL RESOURCES MANAGEMENT JST/MOTI
4-12
Significance Effect
Not
Significant
Effects that are beyond the current forecasting ability or are
within the ability of the resource to absorb such change.
Source: UK Department of Transport, 2014
4.5.3 Impact Mitigation
The SEA sought to incorporate measures to avoid or reduce the
significant environmental and social impacts following a hierarchical
system, where avoidance was always the first mitigation measure to be
considered, as presented in Box 4.2 below.
Box 4.2 Mitigation Hierarchy
Source: NEMA, 2012
4.6 APPRAISING STRATEGIC ALTERNATIVES
The SEA should assess reasonable alternatives taking into account
current knowledge and methods of assessment. Each alternative can be
tested against the SEA objectives. Positive as well as negative effects
should be considered, and uncertainties about the nature and
significance of effects should be noted. This will often be an iterative
process, with the alternatives being revised to enhance positive effects
and reduce negative ones. It is, in any case, important to highlight that
it is not the purpose of SEA to decide which alternative should be
chosen for the plan or programme. This is the role of the decision
makers who have to make choices on the plan or programme to be
adopted. The SEA simply has to provide information on the relative
environmental impact of alternatives.
The alternatives considered at project, corridor and network level vary
from country to country, and between transport infrastructure plans. It
Avoidance – consider and incorporate measures to prevent the effect
(for example, consider alternative design options or phase the project to
avoid environmentally sensitive periods).
Reduction – where avoidance is not possible, then methods to lessen
the effect should be considered and incorporated into the project
design. Consultation with the Overseeing Organisation will determine
whether any remaining ‘residual’ effect is considered to be
environmentally acceptable.
Remediation – where it is not possible to avoid or reduce a significant
adverse effect, then measures to offset the effect should be considered.
ENVIRONMENTAL RESOURCES MANAGEMENT JST/MOTI
4-13
is possible, however, to identify indicators that may be used to compare
certain types of alternatives. The main distinction is between:
• alternative indicative routing, or siting in the case of nodal
infrastructure (normally assessed at corridor level);
• Alternative modes and measures to influence traffic flows (assessed
at corridor level or network level).
• In all cases impacts are deemed relevant if they can be influenced by
the infrastructure plan.
Table 4.5 shows indicators appropriate for comparing the above
outlined types of alternatives.
39
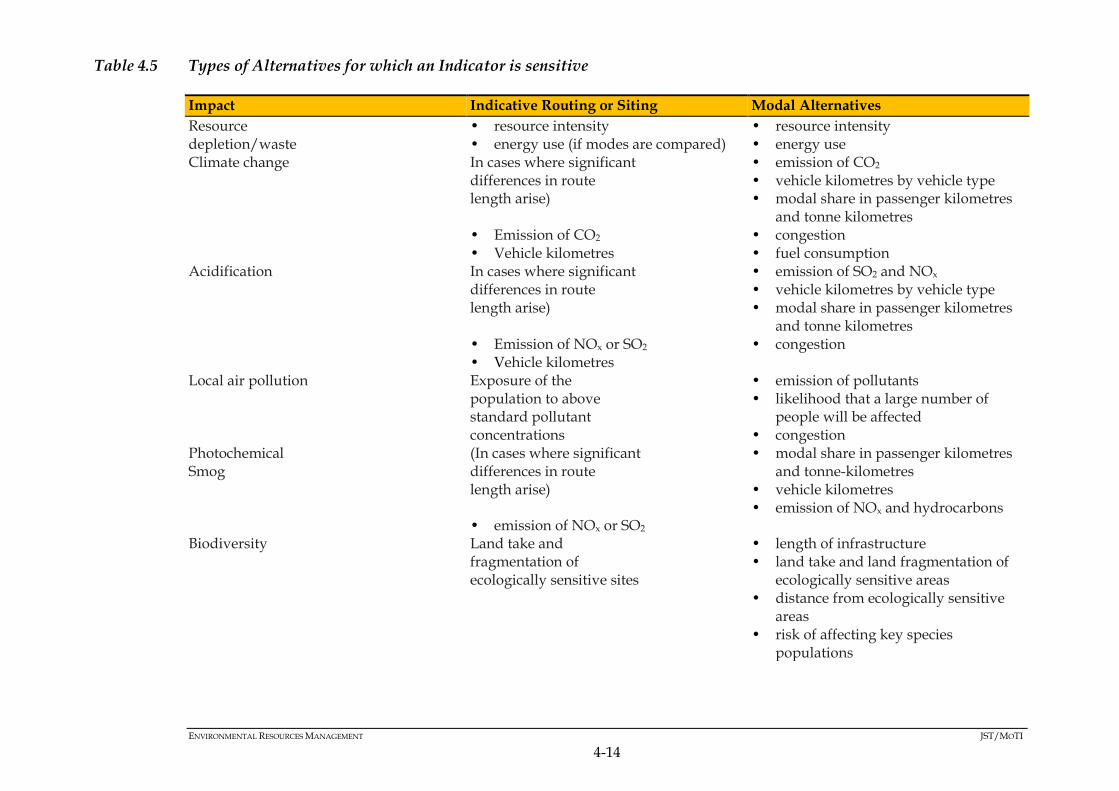
ENVIRONMENTAL RESOURCES MANAGEMENT JST/MOTI
4-14
Table 4.5 Types of Alternatives for which an Indicator is sensitive
Impact Indicative Routing or Siting Modal Alternatives
Resource depletion/waste
• resource intensity • energy use (if modes are compared)
• resource intensity • energy use
Climate change In cases where significant differences in route length arise) • Emission of CO2 • Vehicle kilometres
• emission of CO2 • vehicle kilometres by vehicle type • modal share in passenger kilometres
and tonne kilometres • congestion • fuel consumption
Acidification In cases where significant differences in route length arise) • Emission of NOx or SO2 • Vehicle kilometres
• emission of SO2 and NOx • vehicle kilometres by vehicle type • modal share in passenger kilometres
and tonne kilometres • congestion
Local air pollution Exposure of the population to above standard pollutant concentrations
• emission of pollutants • likelihood that a large number of
people will be affected • congestion
Photochemical Smog
(In cases where significant differences in route length arise) • emission of NOx or SO2
• modal share in passenger kilometres and tonne-kilometres
• vehicle kilometres • emission of NOx and hydrocarbons
Biodiversity Land take and fragmentation of ecologically sensitive sites
• length of infrastructure • land take and land fragmentation of
ecologically sensitive areas • distance from ecologically sensitive
areas • risk of affecting key species
populations
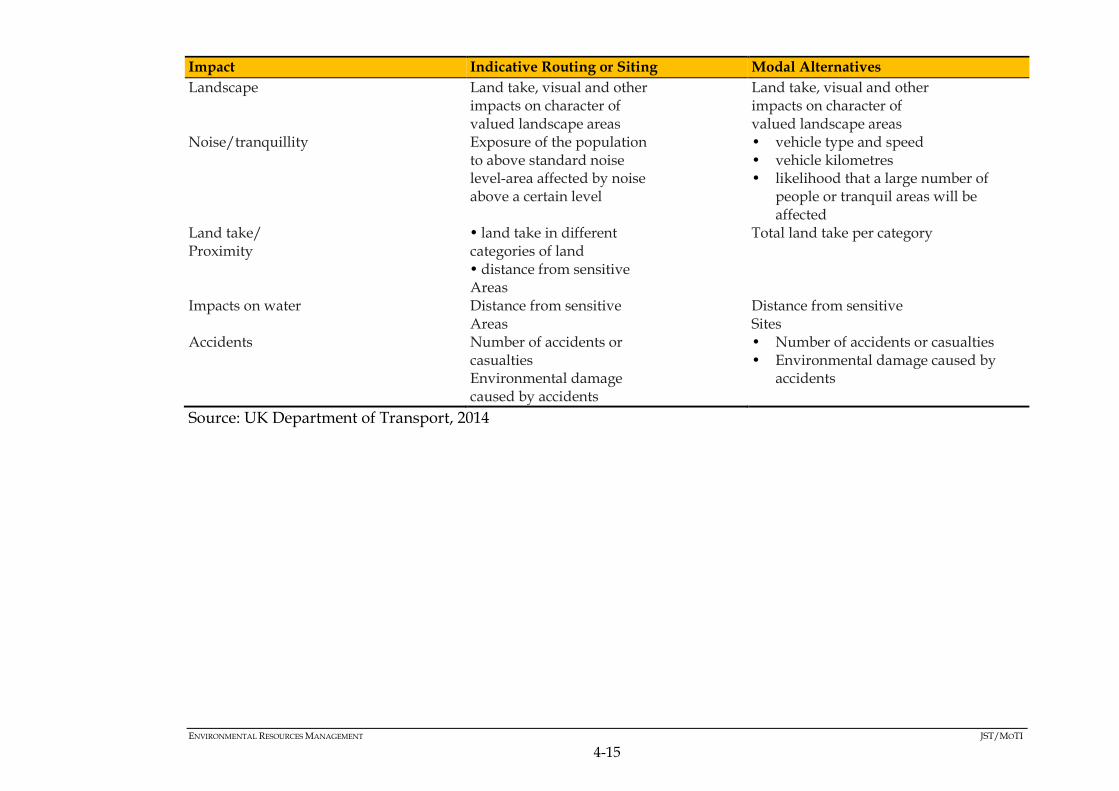
ENVIRONMENTAL RESOURCES MANAGEMENT JST/MOTI
4-15
Impact Indicative Routing or Siting Modal Alternatives
Landscape Land take, visual and other impacts on character of valued landscape areas
Land take, visual and other impacts on character of valued landscape areas
Noise/tranquillity Exposure of the population to above standard noise level-area affected by noise above a certain level
• vehicle type and speed • vehicle kilometres • likelihood that a large number of
people or tranquil areas will be affected
Land take/ Proximity
• land take in different categories of land • distance from sensitive Areas
Total land take per category
Impacts on water Distance from sensitive Areas
Distance from sensitive Sites
Accidents Number of accidents or casualties Environmental damage caused by accidents
• Number of accidents or casualties • Environmental damage caused by
accidents
Source: UK Department of Transport, 2014

ENVIRONMENTAL RESOURCES MANAGEMENT JST/MOTI
4-16
A summary of the main alternatives studied by the Overseeing
Organisation that emerge in pursuit of the project objectives, the reason
for the Overseeing Organisation’s choice of project (taking into account
potential significant environmental effects), and an indication of the
main reasons for continuing with the project taking consideration of
potential significant environmental effects, must be provided in the
SEA. The main alternatives typically relate to ‘Demand’, ‘Activity’ or
‘Location’ alternatives e.g., those considered and presented at public
consultation for a major project.
4.7 REPORTING
4.7.1 Draft SEA Report
A Draft SEA Report was developed and submitted to NEMA on 28th
October 2016, reference number NEMA/SEA/5/2/043. (See Annex A3
for the Draft Report submission acknowledgement from NEMA).
4.7.2 Validation Workshop
The validation workshop was thereafter held on Tuesday 24th January
2017, where the Draft Report was presented to Stakeholders (see Annex
E2 for the minutes of this meeting).
4.7.3 Final SEA Report
As a result of the SEA process a comprehensive SEA Report (this
document) was developed for submission to NEMA for review.
4.8 GAPS, UNCERTAINTIES AND LIMITATIONS TO THE SEA STUDY
In any SEA process it is inevitable gaps remain. This section
summarises the gaps, uncertainties and limitations which were
considered when undertaking the SEA.
4.8.1 Environmental Baseline Gaps and Uncertainties
Several data gaps and uncertainties have been identified through the
preparation of the environmental baseline. These are the following:
4.8.1.1 Air Quality Baseline:
It is observed that there is no central baseline of air quality within the
country and by connection the NEC. This study therefore depends on
past studies on air quality within several nodes of the NEC.

ENVIRONMENTAL RESOURCES MANAGEMENT JST/MOTI
4-17
4.8.1.2 Ecology and Spatial Data of Protected Areas (PAs) and Conservation
Areas (CAs)
Whilst this study was able to identify their location, there is limited
information available in literature on the ecology of PAs and CAs.
Furthermore, from the spatial data obtained, the spatial extent of many
of these areas is not discernible since they only appear as points.
4.8.1.3 Aquifer Maps
This study was only able to identify groundwater potential but not
accurately map aquifers. It is recommended that further studies on
hydrogeology be done at the project level when the NEC MP is
implemented.
4.8.1.4 Influence of Soil Characteristics:
Soils influence the development of infrastructure depending on the type
of infrastructure. This influence can thus mean mapped characteristics
of soils such as texture and pH can be constraints. However, the data
used for this study is coarse in resolution and accurate mapping can
only be done at the project level through geotechnical investigations.
4.8.2 Social Baseline Gaps and Uncertainties
4.8.2.1 Land Use Information
There was no adequate land use information and there was no up to
date land use shapefiles. Therefore the land uses maps were based on
the KWS land use shapefiles. There was also the lack of an integrated
land use framework plan.
4.8.2.2 Land Values
Land values along the NEC constantly fluctuate, therefore the SEA
study is based on the current land values.
4.8.2.3 Additional Gaps
These included information on community cultural sites, household
incomes and gender issues within the NEC. This information was either
unavailable or incomplete for the Counties that the NEC traverses.

ENVIRONMENTAL RESOURCES MANAGEMENT JST/MOTI
4-18
4.8.3 Limitations
4.8.3.1 Ongoing Projects within the NEC
The NEC comprises a variety of projects being implemented by
different agencies and some are already underway. This limits the
integration of the SEA’s recommendations and findings into these
projects.
4.8.3.2 Duplication of Government Agency Mandates
There is duplication of mandates amongst the government agencies that
are responsible for environment/natural resource management in
Kenya and a need for effective coordination among and within these
agencies
4.8.3.3 SEA Implementation
There is insufficient political buy-in to implement SEA when compared
to the prevailing environmental regulatory tools such as EIAs and
Environmental Audits.

ENVIRONMENTAL RESOURCES MANAGEMENT JST/MOTI
5-1
5 ENVIRONMENTAL BASELINE
5.1 INTRODUCTION AND OVERVIEW
This Chapter presents a description of the physical and biological
baseline environment of the NEC. It is essential that the baseline
conditions of an environment are characterised in order to accurately
predict the potential impacts the PPP may have on the environment.
The collection of baseline data also focuses on providing information to
support the assessment of any potential impacts.
Information was collected at the following levels:
National Level: Secondary information was collected at national level
to provide a high level contextual overview of Kenya, and
County Level: Secondary information was collected at the county
level aimed at providing a contextual overview the various counties
that the NEC traverses.
The baseline data was also collected to perform a situational analysis of
the receptive environment. Through this process potential constraints in
the NEC were identified and assessed.
Several regulations and Good International Industry Practice (GIIPs)
were consulted in developing this SEA’s baseline with the main ones
being:
National Guidelines for SEA in Kenya (NEMA, 2012),
JICA Guidelines for Environmental and Social Considerations
(2010), and
EIA Regulations of Kenya (2003).
5.1.1 Master Plan Components and Layout
The Kenyan Section of the NEC is the basis of this Baseline Study. Its
primary infrastructure component is the Main Arterial Road (MR)
(A109 and A104 highway) which links Mombasa and Malaba. A total of
29 counties are traversed by the corridor in the main route with an
additional 2 in the sub route as identified in Table 5.1. These counties
are together termed as the ‘NEC Counties’ in this Report.
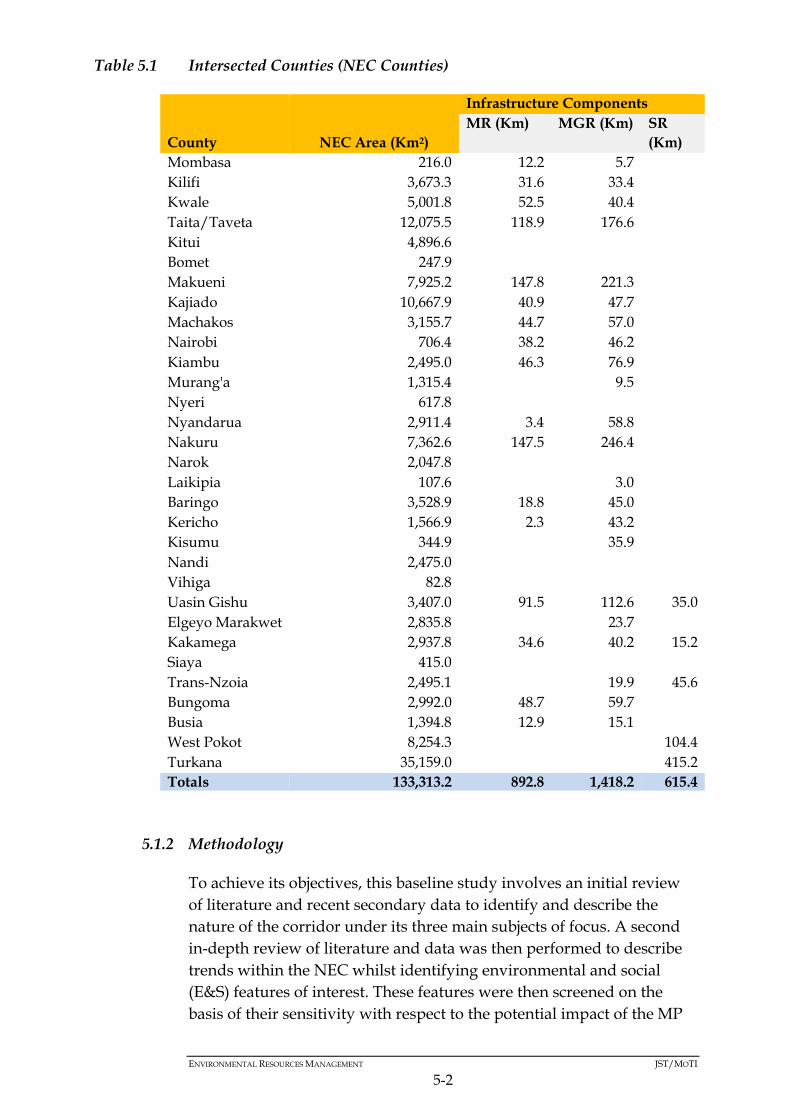
ENVIRONMENTAL RESOURCES MANAGEMENT JST/MOTI
5-2
Table 5.1 Intersected Counties (NEC Counties)
County NEC Area (Km2)
Infrastructure Components
MR (Km) MGR (Km) SR
(Km)
Mombasa 216.0 12.2 5.7
Kilifi 3,673.3 31.6 33.4
Kwale 5,001.8 52.5 40.4
Taita/Taveta 12,075.5 118.9 176.6
Kitui 4,896.6
Bomet 247.9
Makueni 7,925.2 147.8 221.3
Kajiado 10,667.9 40.9 47.7
Machakos 3,155.7 44.7 57.0
Nairobi 706.4 38.2 46.2
Kiambu 2,495.0 46.3 76.9
Murang'a 1,315.4 9.5
Nyeri 617.8
Nyandarua 2,911.4 3.4 58.8
Nakuru 7,362.6 147.5 246.4
Narok 2,047.8
Laikipia 107.6 3.0
Baringo 3,528.9 18.8 45.0
Kericho 1,566.9 2.3 43.2
Kisumu 344.9 35.9
Nandi 2,475.0
Vihiga 82.8
Uasin Gishu 3,407.0 91.5 112.6 35.0
Elgeyo Marakwet 2,835.8 23.7
Kakamega 2,937.8 34.6 40.2 15.2
Siaya 415.0
Trans-Nzoia 2,495.1 19.9 45.6
Bungoma 2,992.0 48.7 59.7
Busia 1,394.8 12.9 15.1
West Pokot 8,254.3 104.4
Turkana 35,159.0 415.2
Totals 133,313.2 892.8 1,418.2 615.4
5.1.2 Methodology
To achieve its objectives, this baseline study involves an initial review
of literature and recent secondary data to identify and describe the
nature of the corridor under its three main subjects of focus. A second
in-depth review of literature and data was then performed to describe
trends within the NEC whilst identifying environmental and social
(E&S) features of interest. These features were then screened on the
basis of their sensitivity with respect to the potential impact of the MP

ENVIRONMENTAL RESOURCES MANAGEMENT JST/MOTI
5-3
on them. The features are then classified as constraints in any of the
three categories of High, Moderate or Low explained in Table 5.2
Constructability of the MP’s subsequent projects against these features
is also considered in this classification.
The methods used by this study are informed by GIIP guidelines such
as those of the International Finance Corporation (IFC), JICA and the
World Bank in addition to similar practices used in routing risk
assessment studies.
Table 5.2 Constraint Classification Criteria
Constraint
Class
Description
Low A Low Constraint is one which is worth considering but does
not require additional mitigation measures beyond those
normally employed for infrastructure projects under normal
conditions.
Moderate A Moderate Constraint is one which definitely requires
mitigation measures to prevent impacts even under normal
conditions. It may have pre-determined mitigation measures
from characteristic practices in the infrastructure sector but
without these measures, the cost (social, legal, environmental
and financial) will be significant. The key difference between it
and High Constraints is the magnitude of the impact for a
Moderate Constraint is lower and under normal conditions
acceptable with mitigation.
High A High Constraint is one which is sensitive or pristine in
nature and should otherwise be avoided through re-routing or
refinement. They are features which impacts would result in
legal, social, environmental and financial costs on the MP that
would undercut its benefits. They are features upon which the
acceptability of impacts is low to negligible whilst the
magnitude of impact is higher than Moderate Constraints.
A table of identified constraints as well as the constraints maps are
included in Annex D.
5.1.3 Data Sources
The receptive baseline environment of the NEC is described through a
review of literature and analysis of secondary data. This description is
focussed on the southern region of Kenya and then more specifically on
the NEC and the intersected counties. This baseline study not only
focusses on describing the receptive environment but importantly it
identifies and classifies potential constraints in the NEC.

ENVIRONMENTAL RESOURCES MANAGEMENT JST/MOTI
5-4
Classification of these constraints was thus based on findings and
developments of works from: United National Environment Program
(UNEP), International Union for Conservation of Nature (IUCN), Food
and Agriculture Organization of the United Nations (FAO),
Conservation International and United Nations Educational, Scientific
and Cultural Organization (UNESCO) amongst other organisations.
Close attention is paid to good practice advocated by GIIPs and
regulations from institutions such as: JICA, World Bank, IFC, United
Nations Environment Program Finance Initiative (UNEP FI), NEMA
(Kenya) and the Equator Principles. By answering to the requirements
of these GIIPs this study provides knowledge that informs decisions of
the SEA.
5.2 GENERAL SETTING
The study area, the NEC, is Kenya’s main economic corridor that
stretches from Mombasa to Kenya’s western border in Busia County
and north-western border with South Sudan. The NEC Main Route and
Eldoret-Nadapal-Juba Sub-Route occupy an area of 136,998.56 km2,
within 31 counties, comprising of both terrestrial and marine regions.
The climate of this area is influenced by five main factors which are:
The Inter-Tropical Convergence Zone (ITCZ), monsoons, latitude,
topography and inland lakes. The NEC experiences a bi-modal system
of rainfall wherein rainfall ranges from 42 mm to 302 mm during the
long rains and 26 mm to 220 mm during the short rains. Influenced by
the aforementioned five factors, the highlands in the NEC generally
experience a cooler climate as compared to low-lying areas. On the
other hand, air quality is generally poorer in densely populated areas
and within the neighbourhoods of industries.
The geomorphology of the NEC is similar to the rest of country which
has been part of the African continent since Mesozoic times during
which the processes that occurred shaped the country’s geology. The
NEC is covered with the following rock classes: metamorphic rocks
25.8%, igneous rocks 34.6%, sedimentary rocks 13.8% and
unconsolidated rocks 25.4%. The remaining 0.3% are water bodies.
Analogous to the rest of Kenya, soils in the NEC vary due to
topography, amount of rainfall and parent material. 74.4% of the NEC
is covered by clay soils, 5.4% by sandy soils and 19.3% by loams. The
remaining 0.9% is unclassified or water.
ENVIRONMENTAL RESOURCES MANAGEMENT JST/MOTI
5-5
Hydrologically, the NEC intersects all of Kenya’s five drainage basins
as follows in terms of percentage area: 16.0% Lake Victoria Basin, 46.0%
Rift Valley Basin, 34.1% Athi River and Coast Basin, 3.4% Tana River
Basin and 0.6% Ewaso Ng’iro Basin. As a result, four of Kenya’s five
main water towers are traversed by the NEC. These are Aberdares,
Cherangani Hills, Mau Complex and Mt Elgon. Hydrogeologically, the
NEC is located in regions with high and moderate likelihood of
groundwater in its central and western sections.
In the marine environment, it is observed that Kenya has a narrow
continental shelf which drops below 200 m within less than 4 km from
the coast. Semi-diurnal tides are also experienced most of the year in
the country whereas four coastal currents feature in Kenya’s coast.
These currents are South Equatorial Current (SEC), East African Coastal
Current (EACC), Equatorial Counter Current (ECC), and Somali
Current (SC). The monsoon season also influences sea surface
temperature (SST) and salinity in Kenya’s coast.
With respect to natural hazards, The International Disaster Database (EM-DAT) shows hydro meteorological hazards to be the most common hazards in Kenya. Prevailing poverty levels predispose the country’s population to vulnerability. The Index for Risk Management (INFORM) assesses Kenya’s humanitarian and disaster risk profile to a value of 6.2, ranking the country 16 out of 191 countries.
As mentioned, the NEC includes intersects both the terrestrial and
marine eco-regions. It traverses all ecosystems therein except for the
glacial ecosystem that is only found at the summit of Mt Kenya. In this
respect, the NEC also includes all 7 humidity zones of Kenya’s Agro-
Ecological Zones.
The main land cover classes in the NEC’s terrestrial area in 2012 were
grassland, cropland/natural vegetation mosaic, woody savannas and
savannas which occupied 39.77%, 23.97%, 10.67% and 9.79% of the area
respectively. Deciduous and evergreen needleleaf forests occupied
0.0014% of the area whilst permanent wetlands, water, croplands,
evergreen broadleaf forests, and urban and built up areas occupied
0.23%, 4.08%, 3.59%, 3.4% and 0.36% of the area respectively.
Due to its extent, the NEC covers an area that supports numerous
species including several that are at risk globally according to IUCN’s
Red List. In both eco-regions, a total of 166 species, are identified to be
at risk, divided amongst the threatened assessment categories as
follows: 61 NT, 56 VU, 31 EN and 18 CR. The NEC is thus rich in
species diversity and it includes national and international designated

ENVIRONMENTAL RESOURCES MANAGEMENT JST/MOTI
5-6
and sensitive areas with the following typologies: Protected Areas
(PAs), Wetlands and Ramsar Sites, UNESCO World Heritage Sites
(WHS), UNESCO Man and Biosphere Reserves (MAB), Important Bird
Areas (IBAs) and Endemic Bird Areas (EBAs), Alliance for Zero
Extinction Sites (AZE), Eastern Afromontane Biodiversity Hotspot
(EAM), Flyways, Corals, Sandy Beaches, Sea Turtle Nesting Sites and
Transboundary Resources.
5.3 PHYSICAL BASELINE
5.3.1 Climate and Air Quality
The climate of the NEC is influenced by the five factors explained
below in a similar manner as the rest of Kenya:
5.3.1.1 Inter-Tropical Convergence Zone (ITCZ)
The movement of the ITCZ southwards between October and
December, and northwards between March and May results in a bi-
modal rainfall system. The rainfall that falls during the former period
are termed as the ‘short rains’ and during the latter the ‘long rains’1.
5.3.1.2 Monsoon Winds
The climate of the coastal belt (Kilifi, Kwale and Mombasa Counties) is
influenced by the monsoons whereby:
November - early March: The weather at the Kenyan coast is
dominated by the Northeast Monsoon (Kaskazi) which is
comparatively dry. This period is characterized by warm
temperatures (mean 28.4 ⁰C, max 31-32 ⁰C), shorter and lighter rains
(8 to 84 mm/month), calm seas and steady light winds (<0.25 m/s)2.
March - April: The wind blows in an east-to-south-easterly direction
with strong incursions of maritime air from the Indian Ocean
causing heavy rains inland2.
May - August: The Southeast Monsoon (Kusi) influence gradually
sets in and the weather becomes more stable with overcast skies and
comparatively cooler temperatures. This period is characterized by
1 McSweeney C. et al (n.d). UNDP Climate Change Country Profiles. Kenya. Retrieved February 15, 2016 from http://www.geog.ox.ac.uk/research/climate/projects/undp-cp/UNDP_reports/Kenya/Kenya.lowres.report.pdf 2 UNEP, (1998). East Africa Atlas of Coastal Resources.

ENVIRONMENTAL RESOURCES MANAGEMENT JST/MOTI
5-7
cool temperatures (mean 26.4ºC, max 30ºC), prolonged and heavier
rains (55 to 272 mm/month), rougher seas and strong winds (0.5 to
0.75 m/s)2.
September - November: The Northeast Monsoon gradually re-
establishes itself and by December the Northeast Monsoon is
dominant once again2.
5.3.1.3 Latitude
This influences the timing of rainfall minima and maxima by
determining the amount of sunlight a place receives1. Higher latitudes
receive less sunlight as compared to lower latitudes. As a result, higher
latitudes receive less rainfall compared to regions closer to the equator
or lower latitudes.
5.3.1.4 Topography
Kenya is separated into four distinct climatic zones based on
topography. These are explained as follows:
Central Highlands and Rift Valley: This region receives high annual
rainfall in the mountains (up to 3,000 mm). This rain feeds the lakes
of the Rift Valley. Average daytime temperatures in Nairobi
(altitude 1,661 m) which is in this region, are between 21-26 °C. NEC
Counties in this region include: Uasin Gishu, Kericho, Baringo,
Nakuru, Nyandarua, Nairobi and the north-western regions of
Kajiado.
Western Kenya: This region is hot and wet throughout the year,
with annual rainfall over 1,000 mm and average daytime
temperatures in areas such as Kisumu ranging between 27-29 °C.
NEC Counties located here are Kakamega, Busia and Bungoma.
Northern and Eastern Kenya: Here the land is hot and arid, with
vast ‘lake’ beds/deserts of lava, sand, salt and soda. Average
annual rainfall is less than 510 mm and daytime temperatures are
mostly between 30 and 40 °C, soaring to 39 °C in some desert areas.
NEC Counties in this region include Central and South Eastern
regions of Kajiado, Machakos, Makueni and western regions of Taita
Taveta.
1 Raphael W. (n.d). Some Aspects of the Geography of Kenya.

ENVIRONMENTAL RESOURCES MANAGEMENT JST/MOTI
5-8
Coastal Belt: Kenya’s beaches are hot and humid but tempered with
cooling sea breezes. A narrow plain of land along the coast is
suitable for crops such as fruits, nuts and cotton, before the terrain
becomes semi-desert. Annual rainfall is usually over 1,000mm and
daytime temperatures in Mombasa average 28-31°C. NEC Counties
in this region are Kwale, Kilifi, Mombasa and the eastern regions of
Taita Taveta.
5.3.1.5 Inland Lakes
These provide inland sources of moisture influencing humidity and
rainfall patterns. Inland lakes located within the NEC include Lakes
Nakuru, Elementaita and Naivasha.
Using humidity and temperature, Sombroek et al. (1982) sub-
distinguished Kenya’s land mass into Agro-Climatic Zones (ACZs).
Each ACZ is assigned a double digit numerical value achieved by
combining the index of moisture and temperature zones. Moisture
availability zones comprise of the following seven zones according to
relative humidity: (I) >80-Humid, (II) 65-80-Sub-humid, (III) 50-65-
Semi-humid, (IV) 40-50-Semi-humid to Semi-arid, (V) 25-40-Semi-arid,
(VI) 15-25-Arid and (VII) <15-Very arid. On the other hand,
temperature zones comprise the following nine zones in accordance to
their temperature ranges: (1) 24-30, (2) 22-24, (3) 20-22, (4) 18-20, (5) 16-
18, (6) 14-16, (7) 12-14, (8) 10-12 and (9) <10.
Figure 5.1 shows the ACZs zones found within the NEC.
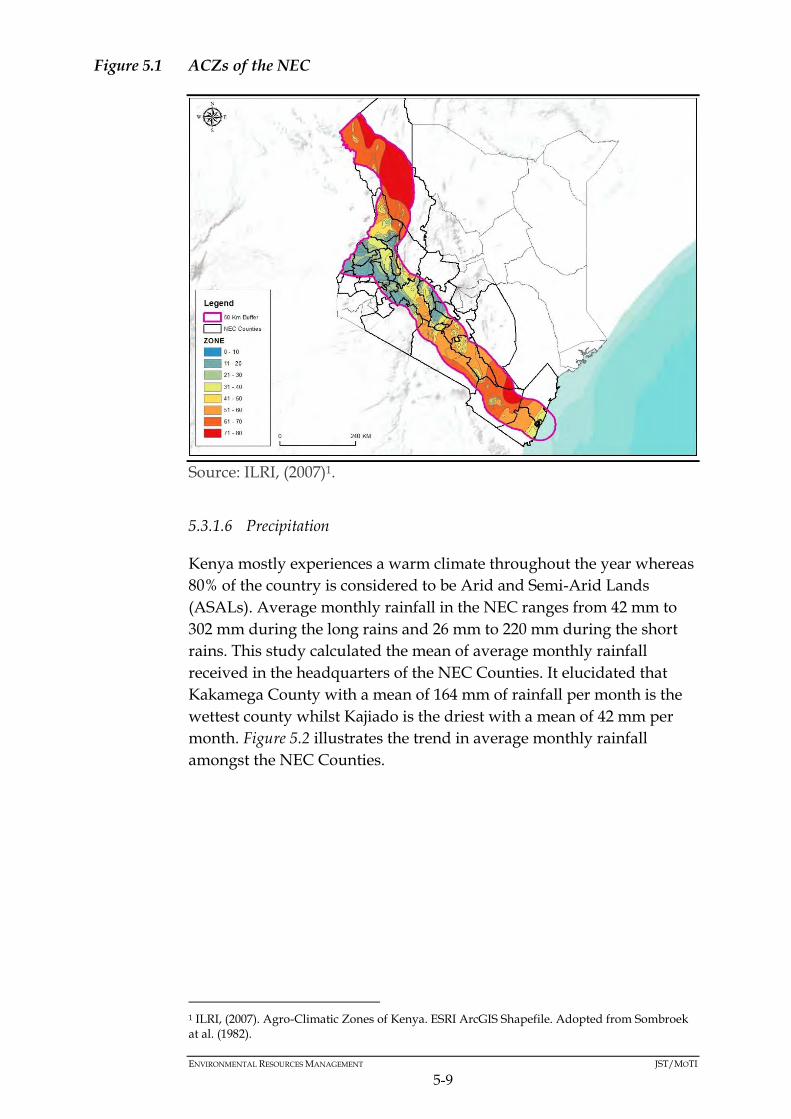
ENVIRONMENTAL RESOURCES MANAGEMENT JST/MOTI
5-9
Figure 5.1 ACZs of the NEC
Source: ILRI, (2007)1.
5.3.1.6 Precipitation
Kenya mostly experiences a warm climate throughout the year whereas
80% of the country is considered to be Arid and Semi-Arid Lands
(ASALs). Average monthly rainfall in the NEC ranges from 42 mm to
302 mm during the long rains and 26 mm to 220 mm during the short
rains. This study calculated the mean of average monthly rainfall
received in the headquarters of the NEC Counties. It elucidated that
Kakamega County with a mean of 164 mm of rainfall per month is the
wettest county whilst Kajiado is the driest with a mean of 42 mm per
month. Figure 5.2 illustrates the trend in average monthly rainfall
amongst the NEC Counties.
1 ILRI, (2007). Agro-Climatic Zones of Kenya. ESRI ArcGIS Shapefile. Adopted from Sombroek at al. (1982).

ENVIRONMENTAL RESOURCES MANAGEMENT JST/MOTI
5-10
Figure 5.2 Average Monthly Rainfall (mm) in the NEC Counties
Source: www.clima-temps.org, (2016)1.
The spatial distribution of average annual rainfall further confirms the
trends amongst the counties in Figure 5.3. It is seen that the counties in
the highlands and western region receive the most rainfall in the NEC.
1 www.clima-temps.org, (2016). Rainfall Data on Kenya Cities.
0
50
100
150
200
250
300
350
J F M A M J J A S O N D
Rai
nfa
ll (m
m)
Average Monthly Rainfall
Baringo Bungoma Busia
Kajiado Kakamega Kericho
Kwale Nakuru Nyandarua
Taita/Taveta Uasin Gishu Mombasa
Kilifi Makueni Nairobi
Machakos Kiambu TransNzoia
Nandi Kisumu Siaya
Bomet Narok Laikipia
Kirinyaga Kitui Elgeyo Marakwet
Vihiga Muranga Turkana
West Pokot
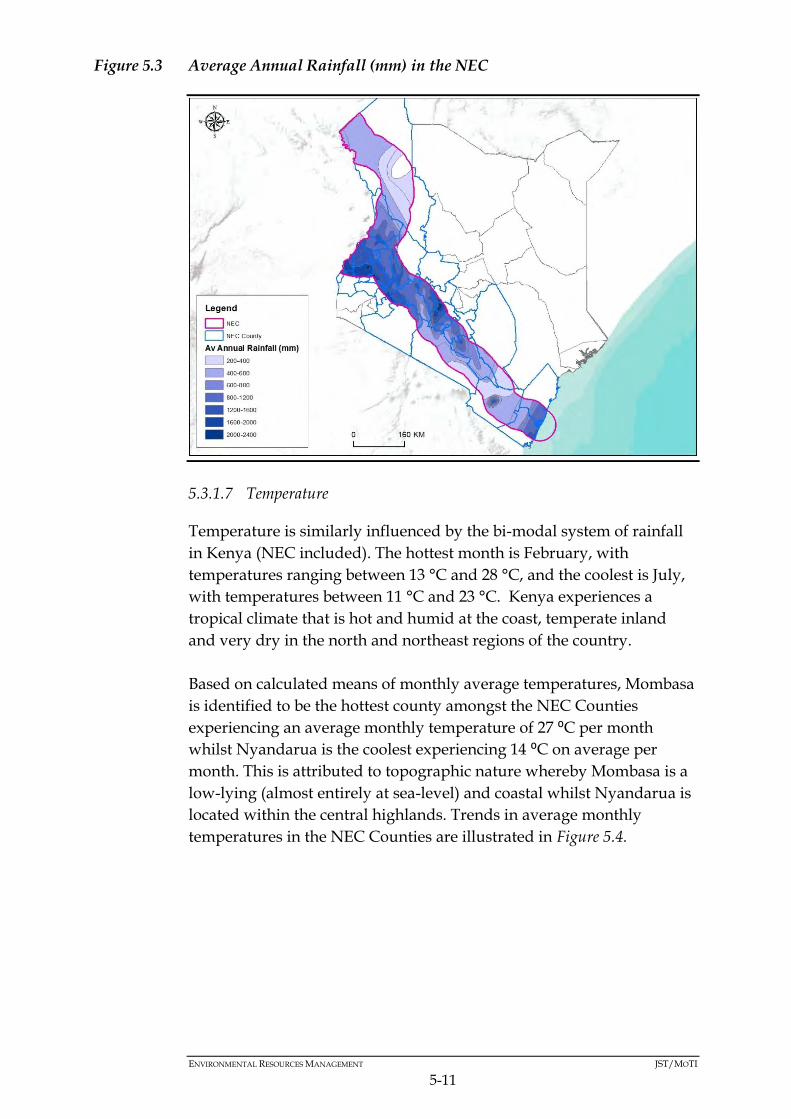
ENVIRONMENTAL RESOURCES MANAGEMENT JST/MOTI
5-11
Figure 5.3 Average Annual Rainfall (mm) in the NEC
5.3.1.7 Temperature
Temperature is similarly influenced by the bi-modal system of rainfall
in Kenya (NEC included). The hottest month is February, with
temperatures ranging between 13 °C and 28 °C, and the coolest is July,
with temperatures between 11 °C and 23 °C. Kenya experiences a
tropical climate that is hot and humid at the coast, temperate inland
and very dry in the north and northeast regions of the country.
Based on calculated means of monthly average temperatures, Mombasa
is identified to be the hottest county amongst the NEC Counties
experiencing an average monthly temperature of 27 ⁰C per month
whilst Nyandarua is the coolest experiencing 14 ⁰C on average per
month. This is attributed to topographic nature whereby Mombasa is a
low-lying (almost entirely at sea-level) and coastal whilst Nyandarua is
located within the central highlands. Trends in average monthly
temperatures in the NEC Counties are illustrated in Figure 5.4.
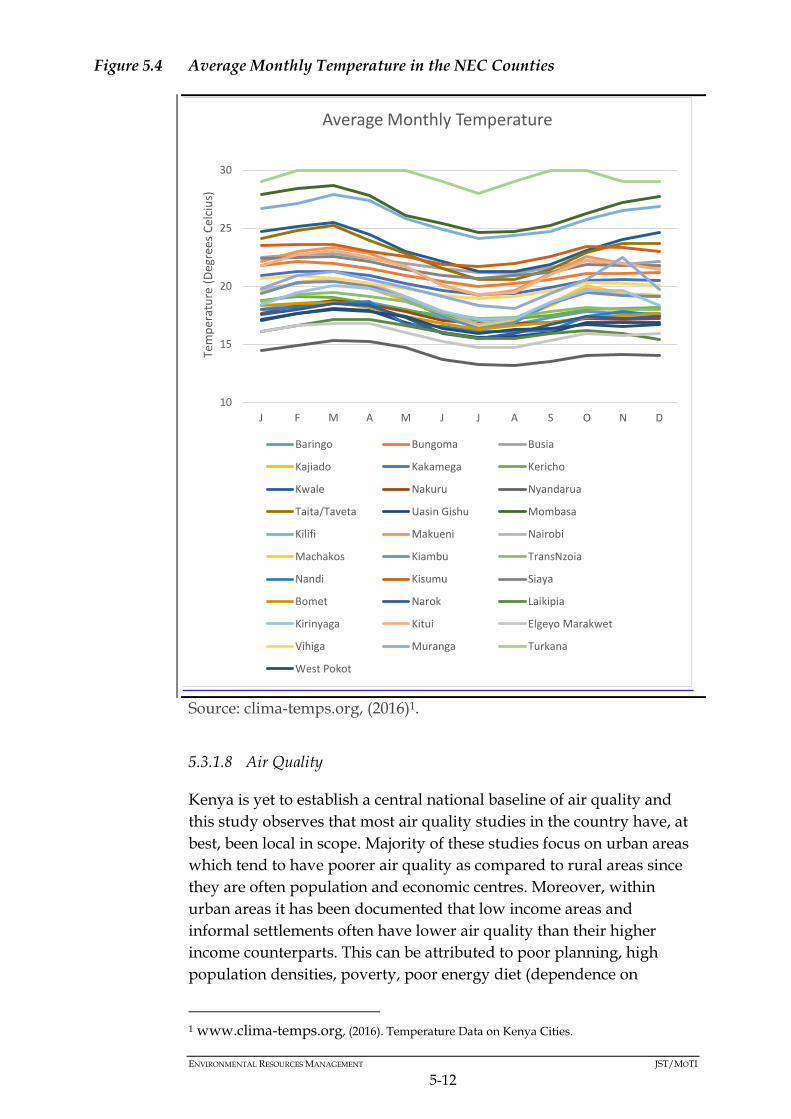
ENVIRONMENTAL RESOURCES MANAGEMENT JST/MOTI
5-12
Figure 5.4 Average Monthly Temperature in the NEC Counties
Source: clima-temps.org, (2016)1.
5.3.1.8 Air Quality
Kenya is yet to establish a central national baseline of air quality and
this study observes that most air quality studies in the country have, at
best, been local in scope. Majority of these studies focus on urban areas
which tend to have poorer air quality as compared to rural areas since
they are often population and economic centres. Moreover, within
urban areas it has been documented that low income areas and
informal settlements often have lower air quality than their higher
income counterparts. This can be attributed to poor planning, high
population densities, poverty, poor energy diet (dependence on
1 www.clima-temps.org, (2016). Temperature Data on Kenya Cities.
10
15
20
25
30
J F M A M J J A S O N D
Tem
per
atu
re (
Deg
rees
Cel
ciu
s)
Average Monthly Temperature
Baringo Bungoma Busia
Kajiado Kakamega Kericho
Kwale Nakuru Nyandarua
Taita/Taveta Uasin Gishu Mombasa
Kilifi Makueni Nairobi
Machakos Kiambu TransNzoia
Nandi Kisumu Siaya
Bomet Narok Laikipia
Kirinyaga Kitui Elgeyo Marakwet
Vihiga Muranga Turkana
West Pokot
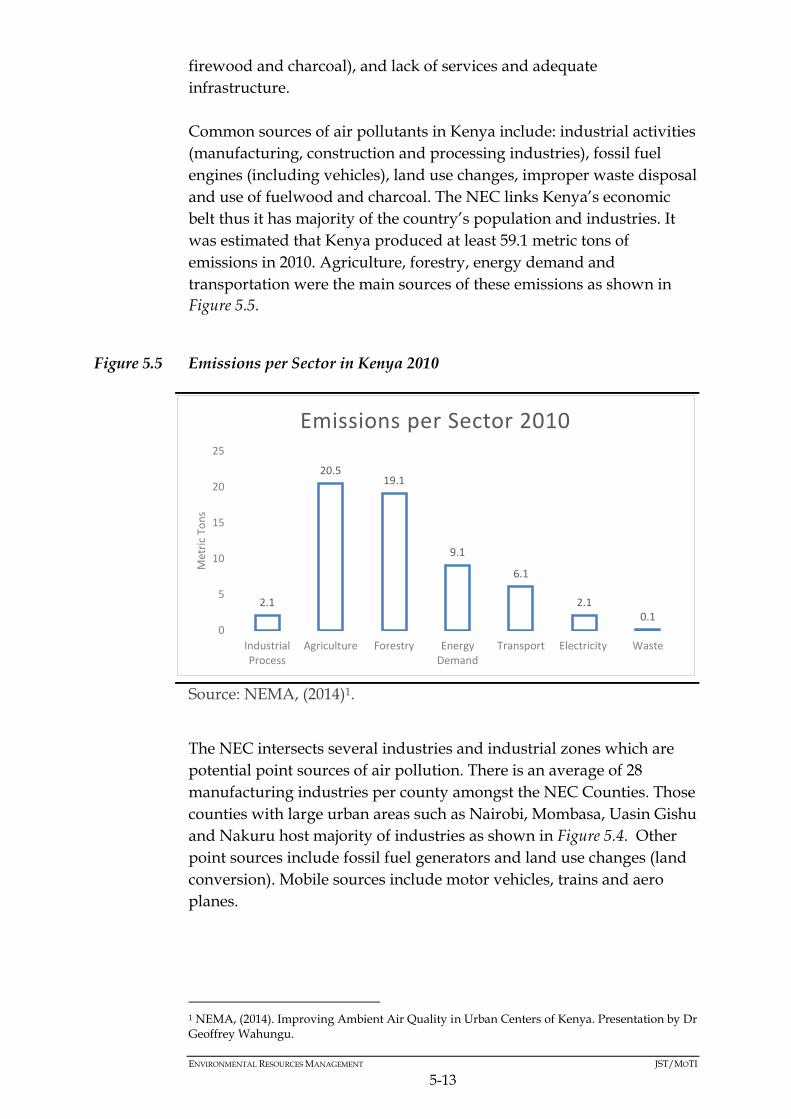
ENVIRONMENTAL RESOURCES MANAGEMENT JST/MOTI
5-13
firewood and charcoal), and lack of services and adequate
infrastructure.
Common sources of air pollutants in Kenya include: industrial activities
(manufacturing, construction and processing industries), fossil fuel
engines (including vehicles), land use changes, improper waste disposal
and use of fuelwood and charcoal. The NEC links Kenya’s economic
belt thus it has majority of the country’s population and industries. It
was estimated that Kenya produced at least 59.1 metric tons of
emissions in 2010. Agriculture, forestry, energy demand and
transportation were the main sources of these emissions as shown in
Figure 5.5.
Figure 5.5 Emissions per Sector in Kenya 2010
Source: NEMA, (2014)1.
The NEC intersects several industries and industrial zones which are
potential point sources of air pollution. There is an average of 28
manufacturing industries per county amongst the NEC Counties. Those
counties with large urban areas such as Nairobi, Mombasa, Uasin Gishu
and Nakuru host majority of industries as shown in Figure 5.4. Other
point sources include fossil fuel generators and land use changes (land
conversion). Mobile sources include motor vehicles, trains and aero
planes.
1 NEMA, (2014). Improving Ambient Air Quality in Urban Centers of Kenya. Presentation by Dr Geoffrey Wahungu.
2.1
20.5 19.1
9.1
6.1
2.1 0.1
0
5
10
15
20
25
IndustrialProcess
Agriculture Forestry EnergyDemand
Transport Electricity Waste
Met
ric
Ton
s
Emissions per Sector 2010

ENVIRONMENTAL RESOURCES MANAGEMENT JST/MOTI
5-14
Figure 5.6 Manufacturing Industries in the NEC Counties
Source: KNBS, (2013)1.
Air pollution studies in different areas in the NEC, biased on criteria
pollutants, have in some cases found prevailing levels higher than
recommended levels according to WHO standards. Studies which have
documented levels of air pollutants in some of the nodes of the NEC are
discussed below. Whilst this discussion is not extensive it seeks to give
an indication of documented levels and/or impacts of air pollution and
quality in the NEC:
Nakuru: Wangari S. et al (2014) sampled rooftops in 34 locations in
the Lake Nakuru Basin for heavy metals (Pb, Ni, Zn, Fe and Cr). The
study reveals that distribution of these pollutants is similar within
the entire basin and Fe was the most deposited heavy metal
followed by Zn, Cr and Pb. Ni concentration were lower than
detection limits. The study points that the levels detected were not
at alarming levels1.
Nairobi: Galcano C. and Kariuki L. (2001) sampled TSP in Nairobi
from 11 locations (industrial, commercial and residential areas) to
create an air quality map using Thiessen Polygons. The study
identifies that most regions in its study area have higher TSP
concentrations than WHO recommendations2.
1 Wangari S. (2014). Assessment of Heavy Metals in Rooftop dust around Lake Nakuru Basin, Kenya. Research Journal of Chemical Sciences. Vol. 4(11), 13-17, November (2014). 2 Galcano C and Kariuki L (2001). Mapping and Analysis of Air Pollution in Nairobi, Kenya. International Conference on Spatial Information for Sustainable Development Nairobi, Kenya 2–5 October 2001.
0
50
100
150
200
250
300
350
400
450
Bar
ingo
Bo
me
t
Bu
ngo
ma
Bu
sia
Elge
yo M
arak
wet
Kaj
iad
o
Kak
ameg
a
Ker
ich
o
Kia
mb
u
Kili
fi
Kis
um
u
Kit
ui
Kw
ale
Laik
ipia
Mac
hak
os
Mak
uen
i
Mo
mb
asa
Mu
ran
g'a
Nai
rob
i
Nak
uru
Nan
di
Nar
ok
Nya
nd
aru
a
Nye
ri
Siay
a
Tait
a Ta
veta
Tran
s-N
zoia
Uas
in G
ish
u
Vih
iga
Ind
ust
rie
s
NEC Counties Manufacturing Industries

ENVIRONMENTAL RESOURCES MANAGEMENT JST/MOTI
5-15
Patrick L et al., (2011) found that mean daytime concentrations of
PM2.5 from traffic in Nairobi ranged from 10.7 in the rural
background areas to 98.1 µg/m3 on the sidewalks of the central
business district (CBD)1. These values exceed the WHO
recommendation of 25 µg/m3. This can be expected at other urban
areas in the NEC.
Eldoret: Donna A et al. (2015) reported that rapid urbanization in
Eldoret town has contributed to increased air pollution. They
attribute this to increased population and economic activity which
leads to increased vehicular traffic, land use changes and expansion
of manufacturing activities. The authors indicate that the town has
also experienced increases in respiratory and cardiovascular
diseases as well as childhood asthma2. Apart from vehicular traffic
and dust during the dry season smoke (emissions) from industries
have been identified as a key source of air pollution in Eldoret3.
Webuye (Bungoma County): During Webuye Pan Paper mill’s
operational period, it was considered to be one of Kenya’s largest air
polluters. The mill emitted significant quantities of SOx creating
persistent nuisances and acid rain which damaged neighbouring
properties simultaneously affecting farming activities in its
neighbourhood. Annual losses caused by air pollution from the mill
were estimated to a value of USD 38 million by one study4.
However, the closure of the mill also had socioeconomic impacts to
the town5.
Athi River (Kajiado County): Zablon W. et al (2015) collected air
samples from three sites in Athi River Township over a one-week
period using gas samplers and analysers in a Mobile Air Laboratory.
In their findings they elucidate that the PMx concentration was
generally high in the morning and late evening. Furthermore, the
mean 24-hour concentration of PM2.5 was 30.74 µg/m3 which is
excess of WHO recommendation of 25 µg/m3. On the other hand,
they found the concentration of Black Carbon to range from
1 Patrick K. et al (2011). Traffic Impacts on PM2.5 Air Quality in Nairobi, Kenya. Elsevier. Environmental Science and Policy. 2011 June; 14(4): 369–378. 2 Donna A et al (2015). Air Quality and Health Impacts: A novel approach to an international cooperative monitoring project in Uasin Gishu County, Kenya. American Meteorological Society. 3 Job K. et al (2014). Urban Environmental Planning and Development Control of Medium Sized Towns in Kenya. A Case of Eldoret Municipality. Journal of Emerging Trends in Economics and Management Sciences (JETEMS) 5(3):351-363. 4 CPK (2000) Pollution from Panpaper factory, A research report by the Church of the Province of Kenya. 5 Eunice O. et al (2014). Industrial Air Pollution in Rural Kenya: Community Awareness, Risk Perception and Associations Between Risk Variables. BMC Public Health 2014, 14:377.

ENVIRONMENTAL RESOURCES MANAGEMENT JST/MOTI
5-16
medium to extremely high whereas the concentrations of N, S and H
were generally low. These findings are attributed to industrial
activities in the Athi River region1.
Mombasa (Mombasa County): AfDB (2014) investigated air quality
in a 40 km long corridor along the Mombasa-Mariakani A109 road.
The study noted that while PMx concentrations were below WHO
recommended limits, sections with high population densities and
economic activities registered high concentrations. A maximum
concentration of 7.3 mg/m3 was registered in the Miritini area.
Concentrations of CO2 (the dominant pollutant) followed the same
trend with a maximum value of 200 mg/l observed in Kokotoni. SO2
concentrations were low in the study area, ranging between 0.01 and
0.14 mg/l. CO, VOCs and NOx were all below detection limits2.
It is reported that residents in Changamwe suffer from dust stirred
up by container trucks and local emission sources include the
refinery, oil-fired power plant and fires at the landfill site3.
Bamburi (Kilifi County): Mining of limestone and manufacture of
cement are the major source of air pollutants (PMx, NOx, CO2 and
SOx) in this region. It has been estimated the production standards
in this area emit 650g of CO2, 1,566 g of N2 and 262g of O2 per kg of
cement produced4.
Olkaria (Nakuru County): Kenya’s geothermal power plants are
located in this region. Such power plants are known to be sources of
H2S which WHO recommends should not exceed 0.1 ppm in a 24-
hour average concentration. Cornelius J. (2015) modelled H2S
dispersion from three development scenarios/stages at Olkaria
using the CALMET/CALPUFF model. The study postulates that an
odour detectable concentration can be expected up to 10 km from
the source from a 1-hour average concentration. For the 24-hour
average concentration, the study postulates that only 0.03 ppm can
1 Zablon W. et al (2015). Ambient Air Quality Monitoring and Audit over Athi River Township, Kenya. International Journal of Scientific Research in Environmental Sciences, 3(8), pp. 0291-0301, 2015. 2 AfDB (2014). Mombasa–Mariakani Road Upgrading Project Environmental and Social Impact Assessment (ESIA) Summary. 3 JICA (n.d). Summary of the Preliminary Study for Grant Aid Project (draft). Retrieved February 22, 2016 from http://www.jica.go.jp/english/our_work/social_environmental/archive/grantaid/pdf/kenya4_01.pdf 4 LaFarge (2008). Managing Emissions from industrial and Mining Sources Dust Emissions from Cement Manufacturing Plant. Presentation by Alfred Wafua.
ENVIRONMENTAL RESOURCES MANAGEMENT JST/MOTI
5-17
be expected in the residential and commercial areas in the
neighbourhood of Olkaria1.
Currently, Kenya is still in the process of establishing regulations in air
quality management. Prevailing regulations (EMCA) propose the
adoption of WHO standards. However, this situation is deemed as a
gap in view of the presence of numerous potential sources of air
pollution in the NEC. In addition, some emissions have global warming
potentials. Key regulations which seek to limit emissions include: Waste
Management Regulations (2006), Waste Tyre Regulations (2014), OSHA,
EMCA, Climate Change Act (2014) and Vehicular Emission Standards
(KS 1515).
Box 5.1 Constraints – Climate and Air Quality
5.3.2 Topography
Volcanic activity and the Great Rift Valley system shaped Kenya’s
topography. The country’s highlands are located to the west of the Rift
Valley with their highest point being Mt Kenya’s summit at 5,199 m asl.
In the eastern region are the lowlands whose altitude decreases to sea
level at the coast1. The country has the following six distinct
physiographic regions which are traversed by the NEC:
1. Coastal belt and plains;
2. Coastal Hinterlands;
3. Foreland Plateau;
4. Highlands includes Rift Valley;
5. Nyanza Low Plateau, and
6. Northern Plain Lands1.
On an E-W profile the MR commences in Mombasa at an altitude of
approx. 21 m asl in region #1 above. It steadily rises 173 km to altitude
of 693 m asl in Taita Taveta County as it traverses the Coastal
Hinterlands. From here its next 24 km drops gently to an altitude of 466
m before rising gradually to an eventual altitude of 1,649 m over a
distance of 202 km through the counties of Makueni and Kajiado in the
1 Cornelius J. (2015). Air Quality Assessment for Development Options at Olkaria Geothermal Field in Kenya. Proceedings World Geothermal Congress 2015. Melbourne, Australia, 19-25 April 2015.
Under this topic, this study identifies constraints to include areas that
are prone to hydrometeorological hazards. These are discussed in
Section 5.3.6
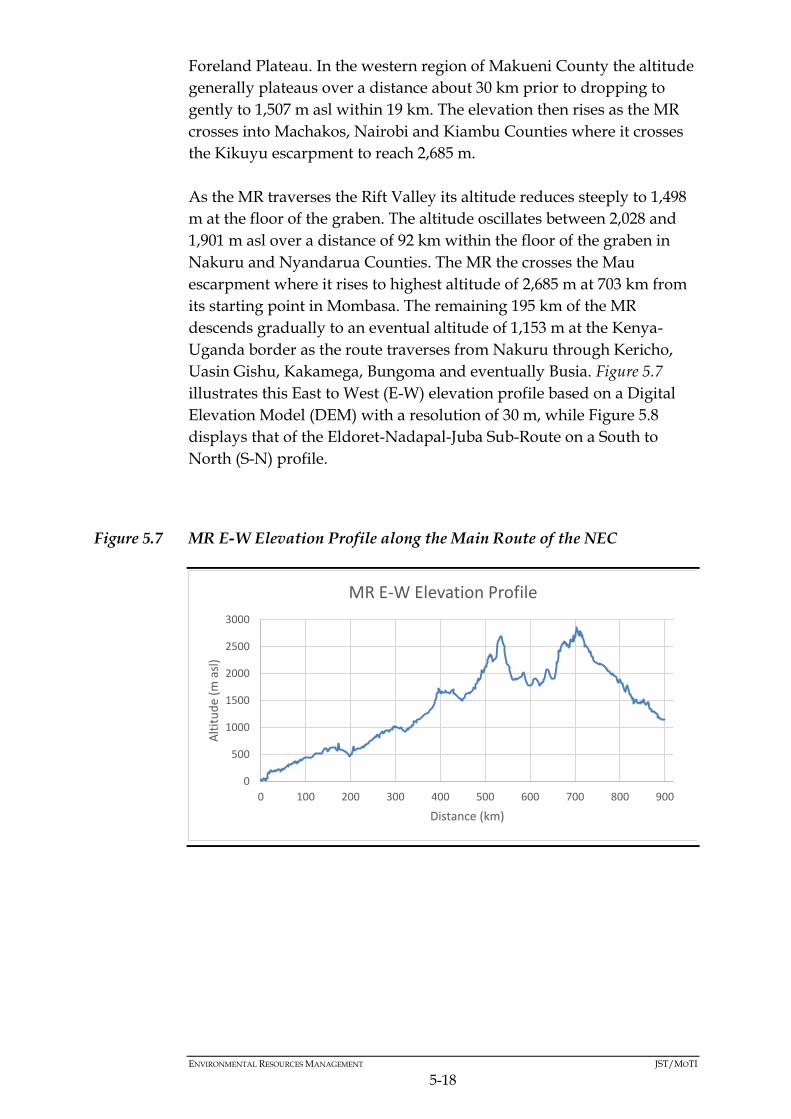
ENVIRONMENTAL RESOURCES MANAGEMENT JST/MOTI
5-18
Foreland Plateau. In the western region of Makueni County the altitude
generally plateaus over a distance about 30 km prior to dropping to
gently to 1,507 m asl within 19 km. The elevation then rises as the MR
crosses into Machakos, Nairobi and Kiambu Counties where it crosses
the Kikuyu escarpment to reach 2,685 m.
As the MR traverses the Rift Valley its altitude reduces steeply to 1,498
m at the floor of the graben. The altitude oscillates between 2,028 and
1,901 m asl over a distance of 92 km within the floor of the graben in
Nakuru and Nyandarua Counties. The MR the crosses the Mau
escarpment where it rises to highest altitude of 2,685 m at 703 km from
its starting point in Mombasa. The remaining 195 km of the MR
descends gradually to an eventual altitude of 1,153 m at the Kenya-
Uganda border as the route traverses from Nakuru through Kericho,
Uasin Gishu, Kakamega, Bungoma and eventually Busia. Figure 5.7
illustrates this East to West (E-W) elevation profile based on a Digital
Elevation Model (DEM) with a resolution of 30 m, while Figure 5.8
displays that of the Eldoret-Nadapal-Juba Sub-Route on a South to
North (S-N) profile.
Figure 5.7 MR E-W Elevation Profile along the Main Route of the NEC
0
500
1000
1500
2000
2500
3000
0 100 200 300 400 500 600 700 800 900
Alt
itu
de
(m a
sl)
Distance (km)
MR E-W Elevation Profile

ENVIRONMENTAL RESOURCES MANAGEMENT JST/MOTI
5-19
Figure 5.8 Eldoret-Nadapal-Juba Sub-Route S-N Elevation Profile
Figure 5.9 shows the elevation of the NEC through a DEM developed
with data from the SRTM satellite instrument.
Figure 5.9 NEC Elevation
Source: NASA LP DAAC, (2016)1.
1 NASA Land Processes Distributed Active Archive Center (LP DAAC), (2016). SRTM. USGS/Earth Resources Observation and Science (EROS) Center, Sioux Falls, South Dakota.
0
500
1000
1500
2000
2500
0 100 200 300 400 500 600
Alt
itu
de
(m a
sl)
Distance (Km)
SR S-N Elevation Profile

ENVIRONMENTAL RESOURCES MANAGEMENT JST/MOTI
5-20
Box 5.2 Constraints – Topography
5.3.3 Geological Characterisations
5.3.3.1 Geomorphology
The geomorphology of the NEC is similar to the rest of country which
has been part of the African continent since Mesozoic times during
which the processes that occurred shaped the country’s geology. As a
result of those processes, marine transgressions formed during the
Jurassic and Cretaceous periods can be found up to 150 km inland
(Taita Taveta County). Regional uplift of up to 600 m in Central Kenya
is associated with the Tertiary period that followed and marked the
beginning of the present Cenozoic era. Great volcanic activities then
followed and continued into the Quaternary period. This resulted in the
volcanic rocks, widely found in the country, covering one third of the
country’s surface.
Extensive areas of the Pre-Cambrian shield were overlaid by lava and
Quaternary sediments as the Rift Valley formed. In the Pleistocene
period (earlier stages of the Quaternary period) the immediate forebear
of other modern undulates were developed. Many landscapes were
borne over these millions of years. The Nyanzian system is where the
Pre-Cambrian geological formations fall. The Nyanzian shield and the
metamorphism involved are found in the early Pre-Cambrian formation
which date back about 3 trillion years ago. The associated rocks are
well-developed around Lake Victoria where they are associated with
intrusive gold-bearing granites.
Banded ironstones with quartzite, which are mainly developed east of
Lake Victoria, are from the Nyanzian system. These have undergone
slight metamorphism as a result of intense folding and granitic
batholithic intrusions. Rocks of the Karroo system noted for their fossil
beds and coal-bearing strata are the record of Paleozoic and lower
Mesozoic times in Kenya. Lake and river deposits from Pleistocene
times and more recent alluvial and swamp deposits are the Quaternary
sediments which are mostly of terrestrial origin. These are distributed
in the low lands of Eastern Kenya. Large sectors of Northern and
Central Kenya, extending into Tanzania are covered by Tertiary to
Constraints identified in topography include steep slopes and high
peaks (See Figure 5.12). These areas are construction constraints in
which the constructability of any infrastructure is low or accessibility to
those areas is poor. Volcanic peaks are identified and discussed further
in Section 5.3.3 under volcanism.
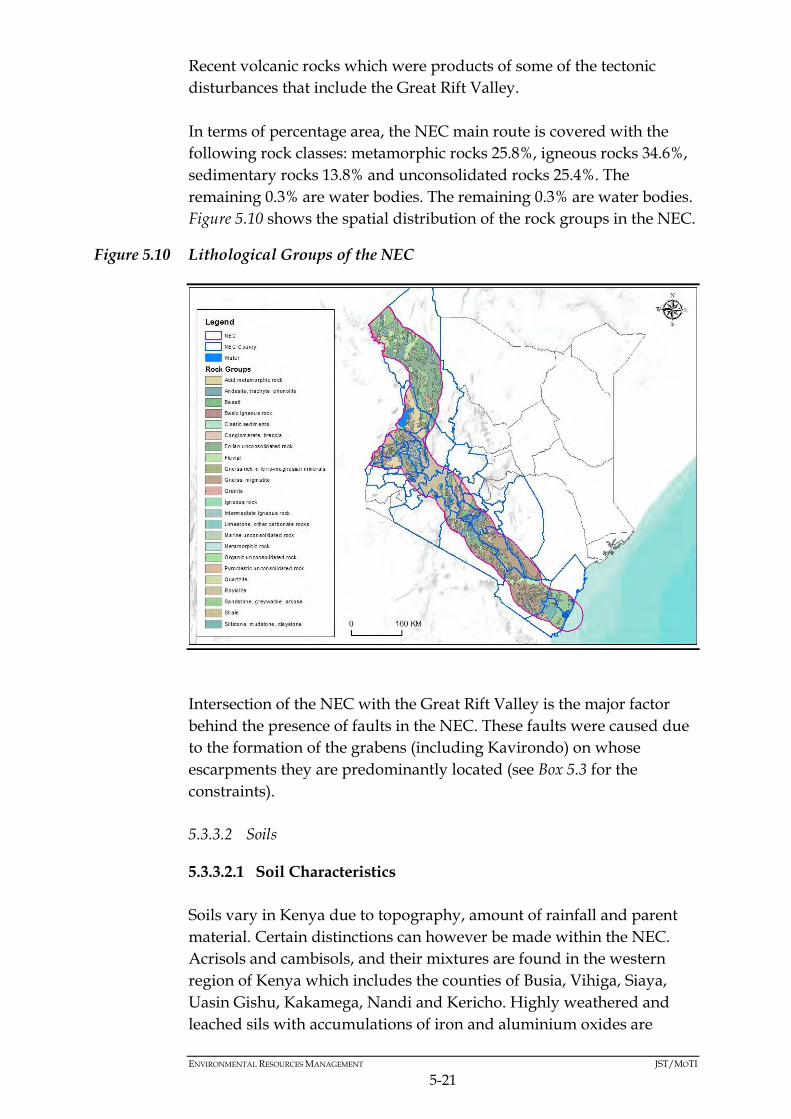
ENVIRONMENTAL RESOURCES MANAGEMENT JST/MOTI
5-21
Recent volcanic rocks which were products of some of the tectonic
disturbances that include the Great Rift Valley.
In terms of percentage area, the NEC main route is covered with the
following rock classes: metamorphic rocks 25.8%, igneous rocks 34.6%,
sedimentary rocks 13.8% and unconsolidated rocks 25.4%. The
remaining 0.3% are water bodies. The remaining 0.3% are water bodies.
Figure 5.10 shows the spatial distribution of the rock groups in the NEC.
Figure 5.10 Lithological Groups of the NEC
Intersection of the NEC with the Great Rift Valley is the major factor
behind the presence of faults in the NEC. These faults were caused due
to the formation of the grabens (including Kavirondo) on whose
escarpments they are predominantly located (see Box 5.3 for the
constraints).
5.3.3.2 Soils
5.3.3.2.1 Soil Characteristics
Soils vary in Kenya due to topography, amount of rainfall and parent
material. Certain distinctions can however be made within the NEC.
Acrisols and cambisols, and their mixtures are found in the western
region of Kenya which includes the counties of Busia, Vihiga, Siaya,
Uasin Gishu, Kakamega, Nandi and Kericho. Highly weathered and
leached sils with accumulations of iron and aluminium oxides are
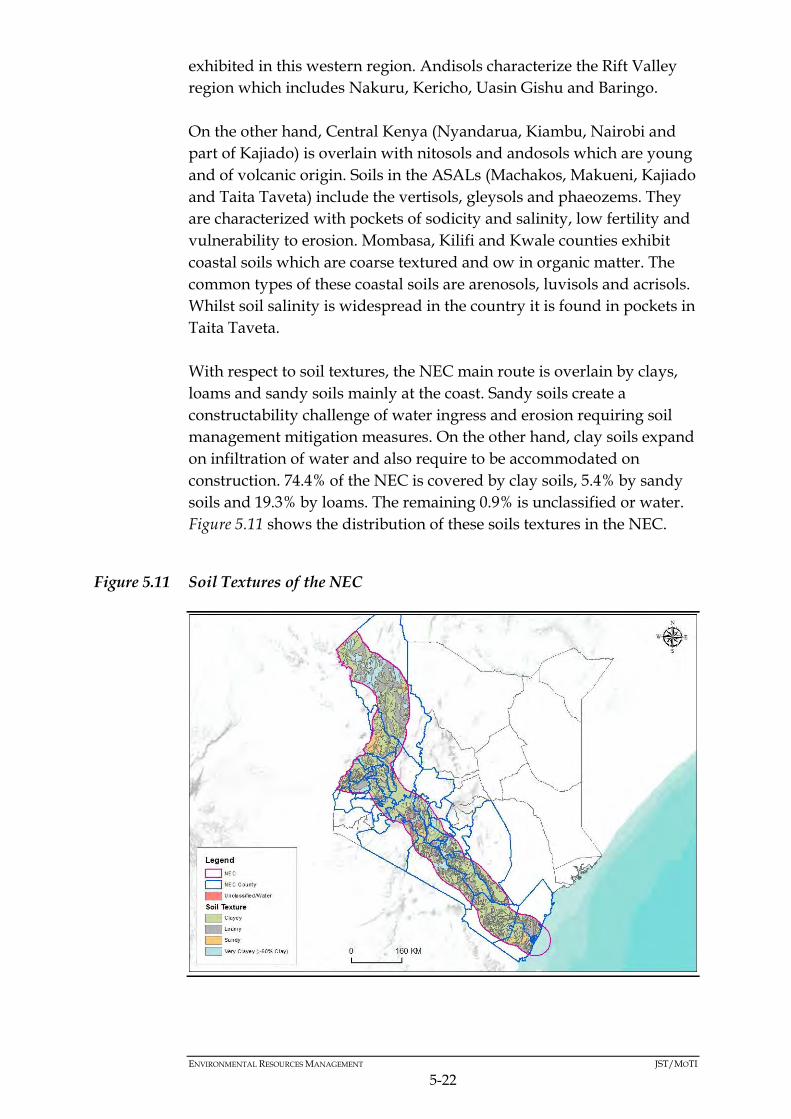
ENVIRONMENTAL RESOURCES MANAGEMENT JST/MOTI
5-22
exhibited in this western region. Andisols characterize the Rift Valley
region which includes Nakuru, Kericho, Uasin Gishu and Baringo.
On the other hand, Central Kenya (Nyandarua, Kiambu, Nairobi and
part of Kajiado) is overlain with nitosols and andosols which are young
and of volcanic origin. Soils in the ASALs (Machakos, Makueni, Kajiado
and Taita Taveta) include the vertisols, gleysols and phaeozems. They
are characterized with pockets of sodicity and salinity, low fertility and
vulnerability to erosion. Mombasa, Kilifi and Kwale counties exhibit
coastal soils which are coarse textured and ow in organic matter. The
common types of these coastal soils are arenosols, luvisols and acrisols.
Whilst soil salinity is widespread in the country it is found in pockets in
Taita Taveta.
With respect to soil textures, the NEC main route is overlain by clays,
loams and sandy soils mainly at the coast. Sandy soils create a
constructability challenge of water ingress and erosion requiring soil
management mitigation measures. On the other hand, clay soils expand
on infiltration of water and also require to be accommodated on
construction. 74.4% of the NEC is covered by clay soils, 5.4% by sandy
soils and 19.3% by loams. The remaining 0.9% is unclassified or water.
Figure 5.11 shows the distribution of these soils textures in the NEC.
Figure 5.11 Soil Textures of the NEC
ENVIRONMENTAL RESOURCES MANAGEMENT JST/MOTI
5-23
5.3.3.3 Tectonic Setting
Most of the NEC is located within the Kenya Dome which overlies the
Nubian (African) Plate covering an area of about 1,000 km wide. The
NEC traverses the Eastern Branch of the Rift Valley in the region where
the Somalia Plate is pulling away from the Nubian and Arabian plate.
This branch bisects the country north to south and splits further into
three rift arms. The main rift is formed by two of these arms whilst the
third (Kavirondo) is a subdued graben west of the dome in Nandi,
Kericho and Nakuru1. The eastern section of the plate forms a smaller
segment underlying the NEC in the South East (Mombasa, Taita Taveta,
Kwale and Kilifi Counties). This region lies in the Somalia plate.
5.3.3.4 Volcanism
Kenya’s volcanic activity is associated with the East African Rift System
(EARS) which covers an area extending up to 200 km on each of its
flanks concentrated around the Kenya Dome. Two volcanism regions
are distinguished in Kenya as follows: the northern half of the Kenya
Rift Valley which began at 30 Million years ago (Ma), and the southern
half which began at 15 Ma. Volcanic rock in the country range from
acidic to basic with the majority being alkaline (mildly alkaline, alkali
basalt-trachyte series to strongly alkaline) under saturated nephelinites
and phonolites2.
Kenya has five volcanic provinces within the two aforementioned
regions. These include: Northern Rift (Turkana), Central Rift Valley,
West of Rift Valley, Southern Rift (Kenya Dome) and east of Rift Valley.
These regions contain 24 volcanoes (volcanic peaks) and those located
within the NEC are identified in Table 5.3 This study considers these
peaks as constraints since they lower constructability of infrastructure
whilst posing access challenges due to steep and or rugged slopes. They
also have a low risk of eruption since most are extinct.
1 Alex G. and James W., (n.d). East Africa's Great Rift Valley: A Complex Rift System. 2 Kristján S., (2008). East African Rift System - An Overview. Presented at Short Course III on Exploration for Geothermal Resources, organized by UNU-GTP and KenGen, at Lake Naivasha, Kenya, October 24 - November 17, 2008.

ENVIRONMENTAL RESOURCES MANAGEMENT JST/MOTI
5-24
Table 5.3 Volcanic Peaks in the NEC
Name Altitude (m asl) Last Eruption1 County
Olkaria 2,434 1770 Nakuru, Narok
Chyulu Hills 2,188 1855 Makueni, Kajiado,
Taita Taveta
Longonot 2,776 1863 Nakuru
Menengai 2,278 6050 BC Nakuru
Elementaita Badlands 2,126 Holocene Nakuru
Ol Doinyo Eburru 2,856 Not known Nakuru
Suswa 2,356 Not known Kajiado, Narok
Mt Elgon 4,321 Not known Bungoma, Trans
Nzoia
Out of the eight volcanic peaks identified within the NEC, only Mt
Elgon and Chyulu Hills are not located along the Rift Valley. This
confirms the influence of the Rift on volcanism in the NEC. The location
of these peaks is shown in Figure 5.12 below.
Figure 5.12 Volcanic Peaks in the NEC
Source: Volcanoes Live, (2008)1.
1 Volcanoes Live, (2008). Volcanoes of Kenya. Retrieved November 18, 2014 from www.volcanoeslive.com.

ENVIRONMENTAL RESOURCES MANAGEMENT JST/MOTI
5-25
5.3.3.5 Seismicity
Whilst Kenya experiences low seismic activity, it remains vulnerable
due to the EARS which runs through the West of the country and
through the Davie fracture zone. The Great Rift Valley is considered to
be one of the most quake prone areas in the world which consequently
makes areas in Kenya such as the Nyanza basin prone to earthquakes.
Low magnitude earthquake events are common along the Kenya Rift
Valley due to the rift’s slow divergent movements and hydrothermal
processes within the geothermal fields (Olkaria – Nakuru). This implies
slow but continuous radiation of seismic energy which relieves stress in
the subsurface plates2,1.
In general, Kenya’s seismicity is characterized by high-frequency low-
magnitude events concentrated along the rift axes which intersect the
NEC. The country’s seismic character is typical for magmatically active
continental rifts, where igneous material at a shallow depth causes
extensive grid faulting and geothermal activity. The build-up of large
elastic strains is prohibited by thermal overprinting and dike intrusion,
therefore prohibiting the generation of large-magnitude earthquake.
Seismic data suggest that the EARS is a zone of shallow earthquakes
(average focal depth 20 km). The epicentres are shallowest in afar,
deepest in the southern part of the rift system. Focal mechanism
studies show dominantly normal faulting (Kebede and Kulhanek (1991)
as cited in Kristján S., (2008); Stamps et al. (2008) Kristján S., (2008)).
The Eastern Rift is less active seismically than the Western Rift where
they run parallel. In the Eastern Rift seismic activity seems to be more
concentrated in swarms.
This study considers faults and past earthquake epicentres as
constraints due to them being geologically active and their movement
can damage infrastructure. Earthquakes are discussed in Section 5.3.6 of
this Chapter under natural hazards.
1 Robert L. et al, (1993). The distribution of earthquakes and volcanoes along the East African Rift system.

ENVIRONMENTAL RESOURCES MANAGEMENT JST/MOTI
5-26
Box 5.3 Constraints - Geological Characterisations
5.3.4 Hydrology and Hydrogeology
5.3.4.1 Surface Hydrology
The Great Rift Valley bisects Kenya on a N-S axis into two regions
thereby influencing the extent of the country’s drainage basins. The
NEC intersects all of the country’s five drainage basins which are
described herein:
Lake (L) Victoria Basin: Covers ~8% of Kenya land area but
provides up to 54% of the country’s freshwater. The main outflow
from the basin is through River (R) Nile to its north in Uganda. Its
inflows from the Kenyan catchment include Rivers Sio, Nzoia, Yala,
Nyando, Sondu Miriu, North Awach, South Awach and Gucha-
Migori. Other inflows outside of Kenya’s catchment is R Akagera
whose source is in Rwanda1.
Rift Valley Basin: Covers an area of approx. 130,452 km2
comprising of a number of closed basins. It includes the basins
which discharge into L Turkana in the north through Rivers
Turkwel and Kerio as well as basins draining into L Natron in the
south through R Ewaso Ng’iro South. Almost all major lakes in
Kenya are located in this basin such as Baringo, Bogoria, Nakuru,
Elementaita, Naivasha, Ol Bolossat and Magadi1. These lakes form
individual basins and the Nakuru, Elementaita and Naivasha are
located within the NEC.
Athi River and Coast Basin: Stretches over an area of about 67,000
km2 and comprises the southern part of Kenya east of the Rift
1 NEMA (2011). State of the Environment and Outlook Report.
Constraints identified in this topic include the following features:
Fault movement can damage infrastructure such as roads, railways,
water conveyance infrastructure and pipelines. Engineering
mitigation measures will be required where they can’t be avoided.
Volcanic peaks lower infrastructure constructability and provide
access challenges where they are located. Although most are extinct,
their presence creates a low risk of eruption.
Areas prone to soil erosion will require soil management measures
during construction and operation of infrastructure to prevent soil
erosion. These areas are identified in Section 5.3.65.3.6.

ENVIRONMENTAL RESOURCES MANAGEMENT JST/MOTI
5-27
Valley. It includes the rivers which drain into the Indian Ocean
through R Athi from the southern slopes of the Aberdares Range,
flanks of the Rift Valley and north eastern slopes of Mt Kilimanjaro.
This basin provides water for some of the highly populated urban
areas of the country including Mombasa and Nairobi1.
Tana River Basin: Measures about 127,000 km2 and drains into the
Indian Ocean from the eastern slopes of the Aberdares range, the
southern slopes of Mt Kenya and the Nyambene hills. This basin
also provides water for populated regions of the country in Central
Kenya and despite 80% of it being located within ASALs it is a
major source of hydropower1.
Ewaso Ng’iro Basin: Expands over an area of approx. 209,000 km2 in
the northern region of Kenya. It drains the northern slopes of the
Aberdares and Mt Kenya. Rivers in this basin drain into the Lorian
Swamp but on occasion they flow into Somalia1.
Figure 5.13 displays the extent of each of these basins. This study
identifies that the area of the NEC is comprised 16.0% Lake Victoria
Basin, 46.0% Rift Valley Basin, 34.1% Athi River and Coast Basin, 3.4%
Tana River Basin and 0.6% Ewaso Ng’iro Basin.
Figure 5.13 Hydrological Features in the NEC
Table 5.4 further provides summary characteristics of these drainage
basins whilst also identifying the NEC Counties overlapped by each of
them.

ENVIRONMENTAL RESOURCES MANAGEMENT JST/MOTI
5-28
Table 5.4 Summary Characteristics of Kenya's Drainage Basins
Basin
Area
(Km2)
Annual
Rainfal
l
Surfac
e
Water
(106
m3)
Surface
Water
Abstraction
Groundwate
r (106 m3)
Total
water
(106
m3)
% of
total
water
resource
s
potential
NEC
Counties
NEC
Area
(Km2)
Major
Rivers
Lakes within the
NEC 106 m3 %
L
Victori
a
46, 229 1,368 11,672 254.3 2.2 116 11,78
8
54.1 Trans
Nzoia,
Bungoma,
Busia,
Kakamega,
Siaya,
Kisumu,
Vihiga,
Kericho,
Bomet,
Narok,
Nakuru,
Nandi,
Uasin
Gishu and
Elgeyo
Marakwet
21,287 Sio, Nzoia,
Yala,
Nyando,
Sondu-
Miriu,
North
Awach,
South
Awach and
Gucha-
Migori
Victoria
Rift
Valley
130,45
2
562 2,784 46.8 1.7 126 2,910 3.4 Elgeyo
Marakwet,
Baringo,
West
Pokot,
Turkana,
Nakuru,
61,245 Kerio,
Turkwell
Nakuru,
Elementaita,
Naivasha,
Ol Bolossat

ENVIRONMENTAL RESOURCES MANAGEMENT JST/MOTI
5-29
Basin
Area
(Km2)
Annual
Rainfal
l
Surfac
e
Water
(106
m3)
Surface
Water
Abstraction
Groundwate
r (106 m3)
Total
water
(106
m3)
% of
total
water
resource
s
potential
NEC
Counties
NEC
Area
(Km2)
Major
Rivers
Lakes within the
NEC 106 m3 %
Kajiado,
Narok,
Laikipia,
Nyandarua
, Kiambu
and Nyeri
Athi
River
66,837 739 1,152 133.1 11.
6
87 1,239 4.3 Murang’a,
Nyandarua
, Kiambu,
Nairobi,
Kajiado,
Machakos,
Makueni,
Taita
Taveta,
Kitui, Kilifi,
Mombasa
and Kwale
45,367 Athi None
Tana
River
126,02
6
697 3,744 595.4 15.
9
147 3,891 32.3 Nyeri,
Murang’a
and
Nyandarua
4,571 Tana None
Ewaso
Ng’iro
North
210,22
6
411 339 42.1 12.
4
142 481 5.8 Laikipia,
Nyandarua
and Nyeri
755 Ewaso
Ng’iro
North
-
Total 579,77 621 19,691 1,071. 5.4 618 20,30 99.9

ENVIRONMENTAL RESOURCES MANAGEMENT JST/MOTI
5-30
Basin
Area
(Km2)
Annual
Rainfal
l
Surfac
e
Water
(106
m3)
Surface
Water
Abstraction
Groundwate
r (106 m3)
Total
water
(106
m3)
% of
total
water
resource
s
potential
NEC
Counties
NEC
Area
(Km2)
Major
Rivers
Lakes within the
NEC 106 m3 %
0 7 4 9
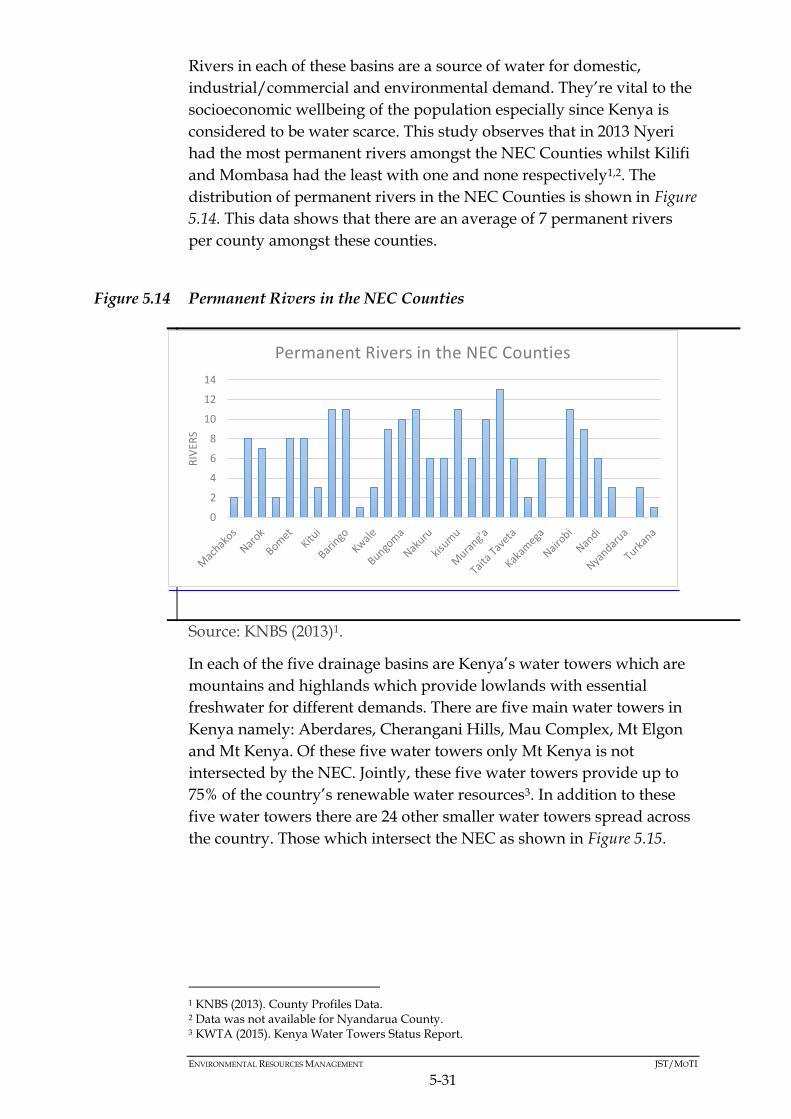
ENVIRONMENTAL RESOURCES MANAGEMENT JST/MOTI
5-31
Rivers in each of these basins are a source of water for domestic,
industrial/commercial and environmental demand. They’re vital to the
socioeconomic wellbeing of the population especially since Kenya is
considered to be water scarce. This study observes that in 2013 Nyeri
had the most permanent rivers amongst the NEC Counties whilst Kilifi
and Mombasa had the least with one and none respectively1,2. The
distribution of permanent rivers in the NEC Counties is shown in Figure
5.14. This data shows that there are an average of 7 permanent rivers
per county amongst these counties.
Figure 5.14 Permanent Rivers in the NEC Counties
Source: KNBS (2013)1.
In each of the five drainage basins are Kenya’s water towers which are
mountains and highlands which provide lowlands with essential
freshwater for different demands. There are five main water towers in
Kenya namely: Aberdares, Cherangani Hills, Mau Complex, Mt Elgon
and Mt Kenya. Of these five water towers only Mt Kenya is not
intersected by the NEC. Jointly, these five water towers provide up to
75% of the country’s renewable water resources3. In addition to these
five water towers there are 24 other smaller water towers spread across
the country. Those which intersect the NEC as shown in Figure 5.15.
1 KNBS (2013). County Profiles Data. 2 Data was not available for Nyandarua County. 3 KWTA (2015). Kenya Water Towers Status Report.
0
2
4
6
8
10
12
14
RIV
ERS
Permanent Rivers in the NEC Counties

ENVIRONMENTAL RESOURCES MANAGEMENT JST/MOTI
5-32
Figure 5.15 Water Towers in the NEC
Table 5.5 identifies the water towers which intersected by the NEC, and
the drainage basins and counties in which they’re located.
Table 5.5 Water Towers in the NEC
Water
Towers
Drainage Basin County
Aberdares Athi, Tana River, Ewaso
Ng’iro North and Rift
Valley
Nyeri, Kiambu, Murang’a and
Nyandarua
Shimba Hills Athi River Kwale
Chyulu Athi River Taita Taveta, Kajiado and Makueni
Kikuyu
Escarpment
Athi River and Rift
Valley
Kiambu, Nyandarua and Nakuru
Enoosupukia Rift Valley Narok, Nakuru
Kipipiri Rift Valley Nyandarua
Nandi Lake Victoria Nandi and Kakamega
Cherangani Lake Victoria and Rift
Valley
Uasin Gishu and Elgeyo Marakwet
Mt Elgon Lake Victoria Bungoma and Trans Nzoia
Marmanet Rift Valley and Ewaso
Ng’iro North
Laikipia, Nakuru and Nyandarua
Mau Forest
Complex
Rift Valley and Lake
Victoria
Uasin Gishu, Nandi, Baringo,
Nakuru, Kericho, Bomet and
Narok
Loima Rift Valley Turkana

ENVIRONMENTAL RESOURCES MANAGEMENT JST/MOTI
5-33
Source: KWTA, (2015) 3.
Being forests in nature these water towers are threatened by a
combination of anthropogenic factors including encroachment, climate
change, degradation, unplanned dams and irrigation projects. These
threats pose a threat to the country’s water security, stability and
surfeit3. They are therefore considered constraints by this study.
5.3.4.2 Hydrogeology
Aquifers in Kenya are linked with the three major rock formations: the
basement metamorphic, intrusive igneous and the quaternary
sedimentary rocks. Volcanic and quaternary formations are particularly
rich in groundwater. However, groundwater potential in the country is
extremely variable, spatially and temporally, in terms of quality and
quantity and in the level of the water table and depth. Recharge rates
vary from as high as 30% of annual rainfall in areas of deep sandy soils,
coral limestone and unconsolidated rock where evapotranspiration
losses are low, to 5% in the ASALs where evapotranspiration losses are
high. Moreover, humid and semi-humid regions exhibit higher
recharge rates1.
The NEC crosses through regions with high and moderate likelihood of
groundwater in its central and western sections as deduced from Figure
5.16. The northern and eastern sections of the corridor interest regions
with less production potential which have fewer areas of moderate or
high likelihood of groundwater production.

ENVIRONMENTAL RESOURCES MANAGEMENT JST/MOTI
5-34
Figure 5.16 Groundwater Production Areas of Kenya
Source: ILRI (n.d).1
The NEC traverses the following groundwater basins or regions:
Nairobi Aquifer Suite (NAS): NAS is a series of multi-layered
aquifers in the volcanic flows rising from the southern Aberdares,
the Kikuyu Escarpment and Ngong Hills and dipping gently
eastward into the pre-Tertiary Athi Lake Basin, terminating at the
Mozambican Basement System. The groundwater basin extends
from the zone of north-south rift faulting west of the city (with an
elevation of about 2,400 m asl) towards the Athi river floodplain
(with an elevation of 1,500 m asl) east of the city centre2,3,4. NAS
intersects and provides water for Nairobi, Kiambu, Machakos and
1ILRI, (n.d). Workshop Paper presented at the ILRI Workshop: Groundwater Management: Sharing Responsibility for an Open Access Resource. 2 Gulf Power Ltd., (2010). Geology and Hydrogeology Report. 3 Stephen F. and Albert T., (2005). The Role of Groundwater in the Water-Supply of Greater Nairobi, Kenya. 4 WRMA, (2010). Nairobi Water Allocation Plan.

ENVIRONMENTAL RESOURCES MANAGEMENT JST/MOTI
5-35
Kajiado. NAS features the only Groundwater Conservation Area
(GCA) in Kenya, which was established as part of the strategies
aimed at protecting its sustainability. However, this GCA is poorly
enforced as NAS is the most abstracted aquifer with the most
boreholes amongst all aquifers in the country.
Mount Elgon Aquifer: This transboundary aquifer between Uganda
and Kenya is a volcanic formation. In this aquifer volcanic rocks are
found in high relief areas and groundwater often occurs in the form
of springs1.
Kilimanjaro Aquifer: Kilimanjaro Aquifer is the general name
given to various volcanic aquifers, which have Mount Kilimanjaro at
their centre and extend over an area of approx. 15,000 km2 [2]. The
aquifer encompasses Chyulu Hills which is located within the NEC.
Coastal Sedimentary Basin: This spans the coastal area between
Tanzania and Kenya. It is a transboundary aquifer spanning an area
of 16,800 km2 and composed of quaternary and consolidated
sedimentary rocks3.
Baricho Aquifer: This is a strategic alluvial aquifer because of its
importance in public water supply to the Coastal Strip. Baricho
aquifer extends over approx. 2 km2 from Malindi to the north of
Mombasa mainland. The aquifer does not face risks of depletion due
to abstraction levels being within sustainable levels, however it
remains vulnerable to pollution4.
Tiwi Aquifer: This aquifer is strategic to the water supply of the
southern coast of Kenya. The aquifer spans 147 km2 between the
Mwachema River to the south and a point between Matuga and
Ngombeni in the north; its eastern boundary is the contact with the
Pleistocene coral limestone, and its western boundary is
approximately 2,000 m west of the Likoni-Ukunda road4.
In 2009, 43% of the urban population and 23% of the rural population
accessed water mainly through groundwater underpinning its
importance in water supply4. Amongst the NEC Counties, an average
1 Appelgren B. (2004). Managing Shared Aquifer Resources in Africa. UNESCO. IHP-VI, Series on Groundwater No. 8. 2 Malte G. (2008). The Kilimanjaro Aquifer A case study for the research project “Transboundary groundwater management in Africa”. German Development Institute. 3 International Water Management Institute (2014). Transboundary Aquifer Mapping and Management in Africa. CGIAR. 4 Mumma A., Lane M., Kairu E., Tuinhof A., and Hirji R., (2011). Kenya Groundwater Governance Case Study.

ENVIRONMENTAL RESOURCES MANAGEMENT JST/MOTI
5-36
of 26% of the households per county access water through groundwater
sources (boreholes and wells) 1. Figure 5.17 illustrates the distribution of
boreholes amongst the NEC Counties. It is observed that Nairobi has
the most boreholes whilst Bomet has the least. Based on this data there
are at least 327 boreholes per county amongst the NEC Counties.
Figure 5.17 Boreholes in the NEC Counties
Sources: KNBS, (2013)1 and WRMA (2011)1.
Groundwater remains important to environmental water demands in
Kenya. This is underpinned by the existence of several specific
Groundwater Dependent Ecosystems (GDEs) in the country including,
Mzima Springs, Njoro Kubwa, Lari Swamp in Limuru, the Kibwezi
“groundwater forest” and Ondiri Swamp, and Kikuyu Springs2.
1 WRMA (2011). Nairobi Metropolitan Borehole Inventory Study. 2 MoWI (2013). The National Policy Groundwater Resources Development and Management. June 2013 Draft. Department of Water and Irrigation.
- 250 500 750
1 000 1 250 1 500 1 750 2 000 2 250
Nye
ri
Ba
rin
go
Bo
me
t B
un
gom
a
Bu
sia
E
lge
yo M
ara
kwe
t K
aji
ad
o
Ka
kam
ega
ke
rich
o
Kia
mb
u
Kil
ifi
kisu
mu
K
itu
i K
wa
le
laik
ipia
M
ach
ako
s M
aku
en
i M
om
ba
sa
Mu
ran
g'a
N
air
ob
i N
aku
ru
Na
nd
i N
aro
k Si
aya
T
ait
a T
ave
ta
Tra
ns-
Nzo
ia
Ua
sin
Gis
hu
V
ihig
a
BO
REH
OLE
S
Boreholes in the NEC Counties
ENVIRONMENTAL RESOURCES MANAGEMENT JST/MOTI
5-37
Box 5.4 Constraints - Hydrology and Hydrogeology
5.3.5 Oceanography
The NEC extends up to approx. 47 km off the coast of Mombasa, Kilifi
and Kwale creating an offshore area measuring 3,684 km2. This area
stretches from Gazi to Kilifi town along the coast as shown in Figure
5.18 and this subsection describes the oceanographic conditions
associated with it.
Hydrological constraints identified include:
Rivers, lakes and other water bodies intersected by the NEC. These
features provide water for human and ecological needs in a water
scarce country. National regulations also protect these water bodies
from pollution or unsustainable consumption. Moreover, some of
them are designated as Ramsar Wetlands and or their linked
ecosystems are national PAs.
Water towers which are the source of the rivers mentioned above in
addition to being ecosystems that support a variety of species some
of which are at risk. They also provide other ecosystem goods and
services that are important to human wellbeing. These water towers
are protected by national regulations and some of them are also
national PAs.
The GCA in the NAS since the abstraction of water from within it
will contribute to the challenge of over-abstraction in the NAS. Any
water demands of NEC in the NAS will have to be supplied in
accordance to the management strategies implemented by
regulatory authorities such as WRMA.

ENVIRONMENTAL RESOURCES MANAGEMENT JST/MOTI
5-38
Figure 5.18 NEC Offshore Area
5.3.5.1 Bathymetry
Kenya has a narrow continental shelf with depths dropping below 200
m within less than 4 km of the coastline in most regions. In front of the
mouths of rivers Tana and Sabaki, the shelf however widens
significantly exceeding 15 km off the northern end of Ungwana Bay.
Fringing reefs protect the shoreline by running along the coast with
gaps at the areas adjacent to the mouths of the main rivers. Slope of
gentle gradients of about 1:20 to the shelf edge generally characterize
the continental slope and dissected appearance occurs probably due to
previous fluvial action.
The development of this shelf is connected with glacio-eustatic event
and tectonic episodes since Permo-triassic times. The shelf has been
classified as an Afro-trailing edge type by Hove A.R.T (1980)1. The shelf
is markedly absent along certain straight segments of the coast
suggesting a fault origin. The sudden drop of the sea-floor topography
which is attributed to the postulated Ruvu-Mombasa fault supports this
occurrence2. This fault apparently maintains a north-northeast to south-
southwest orientation throughout. Examination of bathymetric charts
for the Kenyan coast indicate that indentations along the coast such as
1 Hove A.R.T, (1980). Some Aspects of Current Sedimentation, Depositional Environments and Submarine Geomorphology of Kenya’s Submerged Continental Margins. University of Nairobi, IDS/OP 28, pp. 127–144. 2 Abuodha J.O.Z, (1989). Morphodynamics and sedimentology of the Malindi-Fundisa coastal area associated with the heavy mineral deposition. Unpubl. M.Sc. thesis, Univ. Nairobi, 258p.

ENVIRONMENTAL RESOURCES MANAGEMENT JST/MOTI
5-39
around the Ungwana Bay area are related to widening of the shelf,
whereas narrow zones are generally associated with headlands and
islands, for example in the vicinity of Mombasa Island.
5.3.5.2 Tides
The Kenyan coast is characterized by semi-diurnal tides which except
for limited periods in the year, the levels of high and low water of each
successive tide differ from the corresponding tide before and after. The
tides are therefore designated as mixed semi-diurnal tides.
According to tidal observations at the Kilindini and Lamu port,
Kilindini has a maximum tidal range which usually does not exceed 3.8
m but on occasion it may go beyond this2. On the other hand, Lamu
port has a maximum tidal range of 4.0 m at spring tide and 2.5 m at
neap tides1. Malindi has a tidal range of 2 m for neap tie and 2.9 m for
spring tide. A lag in the tidal state exists along the Kenyan coast and it
increases with distance northwards. Malindi is typically 5 minutes after
Kilindini while Lamu is about 40 minutes behind2.
The semi-diurnal tidal regime varies from 1.5 m to 4 m amplitude from
neap to spring tides, creating extensive inter-tidal platforms and rocky-
shore communities exposed twice-daily during low tides. Fringing reef
crests dominate the whole southern coast and parts of the northern
coast towards Somalia, forming a natural barrier to the wave energy
from the ocean.
5.3.5.3 Currents
There are four oceanic currents experienced in the Kenyan coast,
namely:
South Equatorial Current (SEC),
East African Coastal Current (EACC),
Equatorial Counter Current (ECC), and
Somali Current (SC).
The SEC moves westward dividing into two branches as it reaches
Cape Delgado on the Eastern coast of Africa. It produces both the
1 KPA, (2013). Kenya Tidal Observations. 2 A form number, F, has been defined as the ratio of the sum of amplitudes of diurnal tidal species over semi diurnal species. According to Defant (1958), a simplified definition for F, F = (k1+O1)/ (M2+S2), can be used to characterize tidal types. If F is less than 0.25, the tide is referred to as semi-diurnal, and if F is greater than 3.0, the tide is diurnal. Value of F between 0.25 and 3.0 are considered as mixed tides.
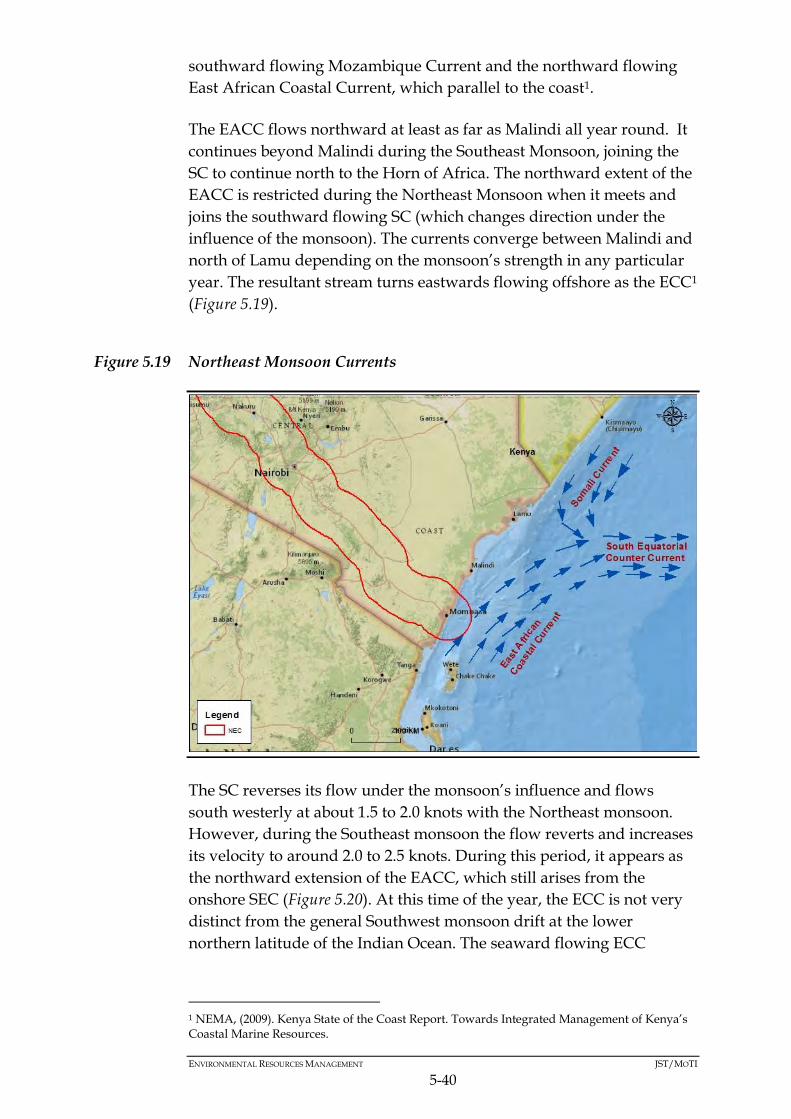
ENVIRONMENTAL RESOURCES MANAGEMENT JST/MOTI
5-40
southward flowing Mozambique Current and the northward flowing
East African Coastal Current, which parallel to the coast1.
The EACC flows northward at least as far as Malindi all year round. It
continues beyond Malindi during the Southeast Monsoon, joining the
SC to continue north to the Horn of Africa. The northward extent of the
EACC is restricted during the Northeast Monsoon when it meets and
joins the southward flowing SC (which changes direction under the
influence of the monsoon). The currents converge between Malindi and
north of Lamu depending on the monsoon’s strength in any particular
year. The resultant stream turns eastwards flowing offshore as the ECC1
(Figure 5.19).
Figure 5.19 Northeast Monsoon Currents
The SC reverses its flow under the monsoon’s influence and flows
south westerly at about 1.5 to 2.0 knots with the Northeast monsoon.
However, during the Southeast monsoon the flow reverts and increases
its velocity to around 2.0 to 2.5 knots. During this period, it appears as
the northward extension of the EACC, which still arises from the
onshore SEC (Figure 5.20). At this time of the year, the ECC is not very
distinct from the general Southwest monsoon drift at the lower
northern latitude of the Indian Ocean. The seaward flowing ECC
1 NEMA, (2009). Kenya State of the Coast Report. Towards Integrated Management of Kenya’s Coastal Marine Resources.
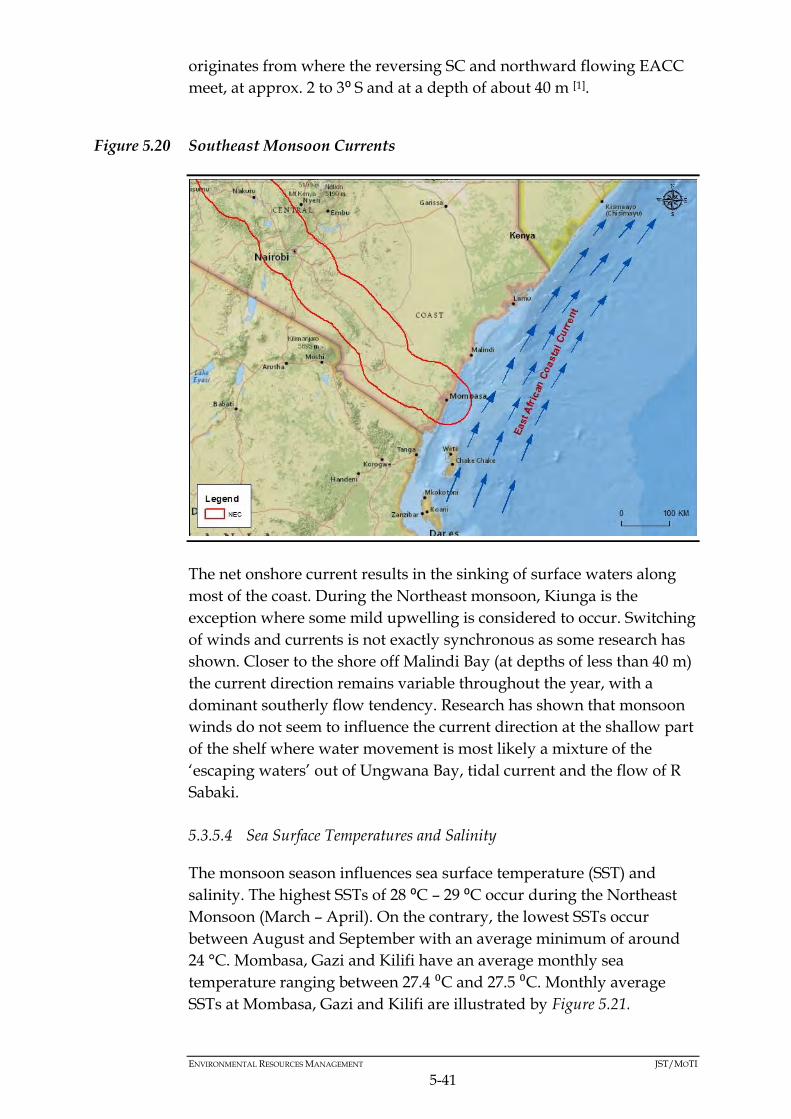
ENVIRONMENTAL RESOURCES MANAGEMENT JST/MOTI
5-41
originates from where the reversing SC and northward flowing EACC
meet, at approx. 2 to 3⁰ S and at a depth of about 40 m [1].
Figure 5.20 Southeast Monsoon Currents
The net onshore current results in the sinking of surface waters along
most of the coast. During the Northeast monsoon, Kiunga is the
exception where some mild upwelling is considered to occur. Switching
of winds and currents is not exactly synchronous as some research has
shown. Closer to the shore off Malindi Bay (at depths of less than 40 m)
the current direction remains variable throughout the year, with a
dominant southerly flow tendency. Research has shown that monsoon
winds do not seem to influence the current direction at the shallow part
of the shelf where water movement is most likely a mixture of the
‘escaping waters’ out of Ungwana Bay, tidal current and the flow of R
Sabaki.
5.3.5.4 Sea Surface Temperatures and Salinity
The monsoon season influences sea surface temperature (SST) and
salinity. The highest SSTs of 28 ⁰C – 29 ⁰C occur during the Northeast
Monsoon (March – April). On the contrary, the lowest SSTs occur
between August and September with an average minimum of around
24 °C. Mombasa, Gazi and Kilifi have an average monthly sea
temperature ranging between 27.4 ⁰C and 27.5 ⁰C. Monthly average
SSTs at Mombasa, Gazi and Kilifi are illustrated by Figure 5.21.
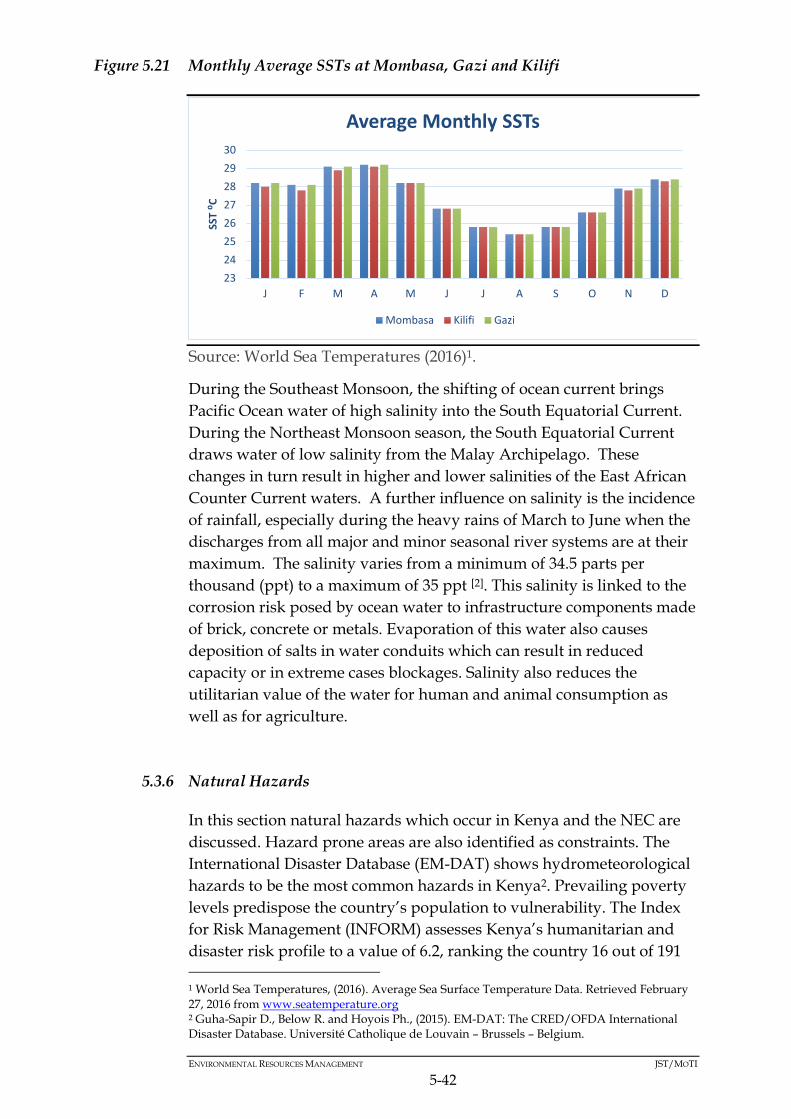
ENVIRONMENTAL RESOURCES MANAGEMENT JST/MOTI
5-42
Figure 5.21 Monthly Average SSTs at Mombasa, Gazi and Kilifi
Source: World Sea Temperatures (2016)1.
During the Southeast Monsoon, the shifting of ocean current brings
Pacific Ocean water of high salinity into the South Equatorial Current.
During the Northeast Monsoon season, the South Equatorial Current
draws water of low salinity from the Malay Archipelago. These
changes in turn result in higher and lower salinities of the East African
Counter Current waters. A further influence on salinity is the incidence
of rainfall, especially during the heavy rains of March to June when the
discharges from all major and minor seasonal river systems are at their
maximum. The salinity varies from a minimum of 34.5 parts per
thousand (ppt) to a maximum of 35 ppt [2]. This salinity is linked to the
corrosion risk posed by ocean water to infrastructure components made
of brick, concrete or metals. Evaporation of this water also causes
deposition of salts in water conduits which can result in reduced
capacity or in extreme cases blockages. Salinity also reduces the
utilitarian value of the water for human and animal consumption as
well as for agriculture.
5.3.6 Natural Hazards
In this section natural hazards which occur in Kenya and the NEC are
discussed. Hazard prone areas are also identified as constraints. The
International Disaster Database (EM-DAT) shows hydrometeorological
hazards to be the most common hazards in Kenya2. Prevailing poverty
levels predispose the country’s population to vulnerability. The Index
for Risk Management (INFORM) assesses Kenya’s humanitarian and
disaster risk profile to a value of 6.2, ranking the country 16 out of 191
1 World Sea Temperatures, (2016). Average Sea Surface Temperature Data. Retrieved February 27, 2016 from www.seatemperature.org 2 Guha-Sapir D., Below R. and Hoyois Ph., (2015). EM-DAT: The CRED/OFDA International Disaster Database. Université Catholique de Louvain – Brussels – Belgium.
23
24
25
26
27
28
29
30
J F M A M J J A S O N D
SST ⁰C
Average Monthly SSTs
Mombasa Kilifi Gazi
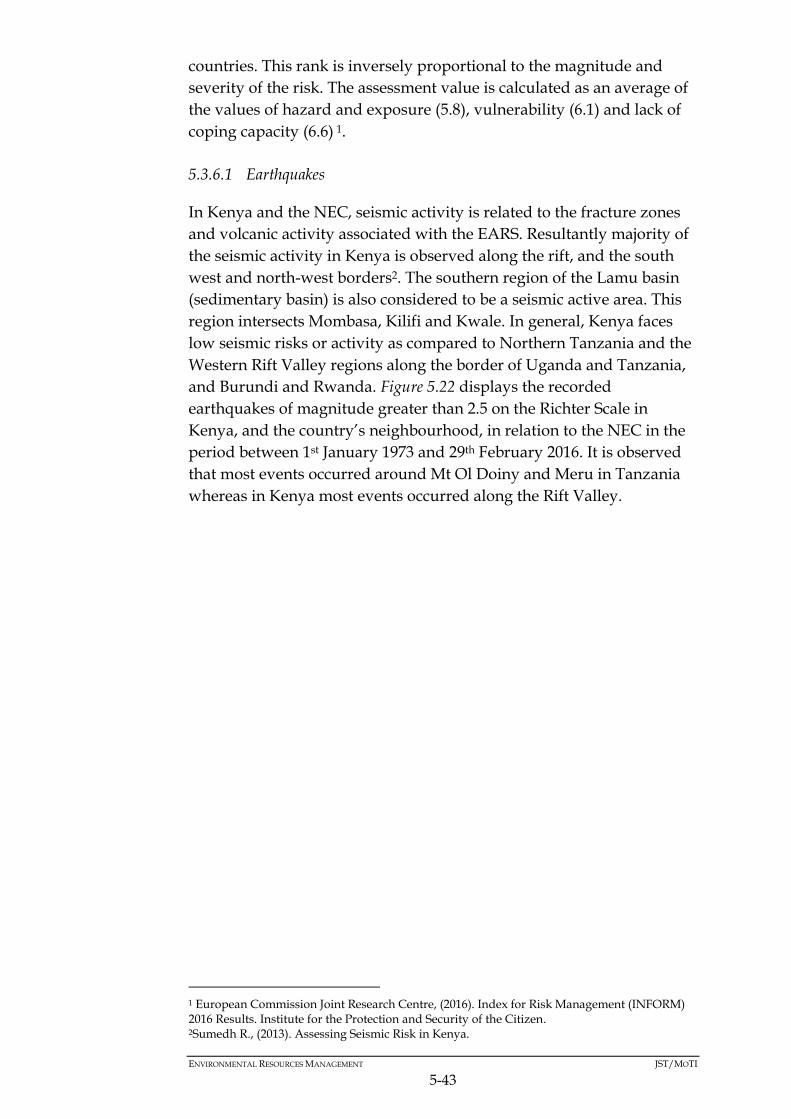
ENVIRONMENTAL RESOURCES MANAGEMENT JST/MOTI
5-43
countries. This rank is inversely proportional to the magnitude and
severity of the risk. The assessment value is calculated as an average of
the values of hazard and exposure (5.8), vulnerability (6.1) and lack of
coping capacity (6.6) 1.
5.3.6.1 Earthquakes
In Kenya and the NEC, seismic activity is related to the fracture zones
and volcanic activity associated with the EARS. Resultantly majority of
the seismic activity in Kenya is observed along the rift, and the south
west and north-west borders2. The southern region of the Lamu basin
(sedimentary basin) is also considered to be a seismic active area. This
region intersects Mombasa, Kilifi and Kwale. In general, Kenya faces
low seismic risks or activity as compared to Northern Tanzania and the
Western Rift Valley regions along the border of Uganda and Tanzania,
and Burundi and Rwanda. Figure 5.22 displays the recorded
earthquakes of magnitude greater than 2.5 on the Richter Scale in
Kenya, and the country’s neighbourhood, in relation to the NEC in the
period between 1st January 1973 and 29th February 2016. It is observed
that most events occurred around Mt Ol Doiny and Meru in Tanzania
whereas in Kenya most events occurred along the Rift Valley.
1 European Commission Joint Research Centre, (2016). Index for Risk Management (INFORM) 2016 Results. Institute for the Protection and Security of the Citizen. 2Sumedh R., (2013). Assessing Seismic Risk in Kenya.
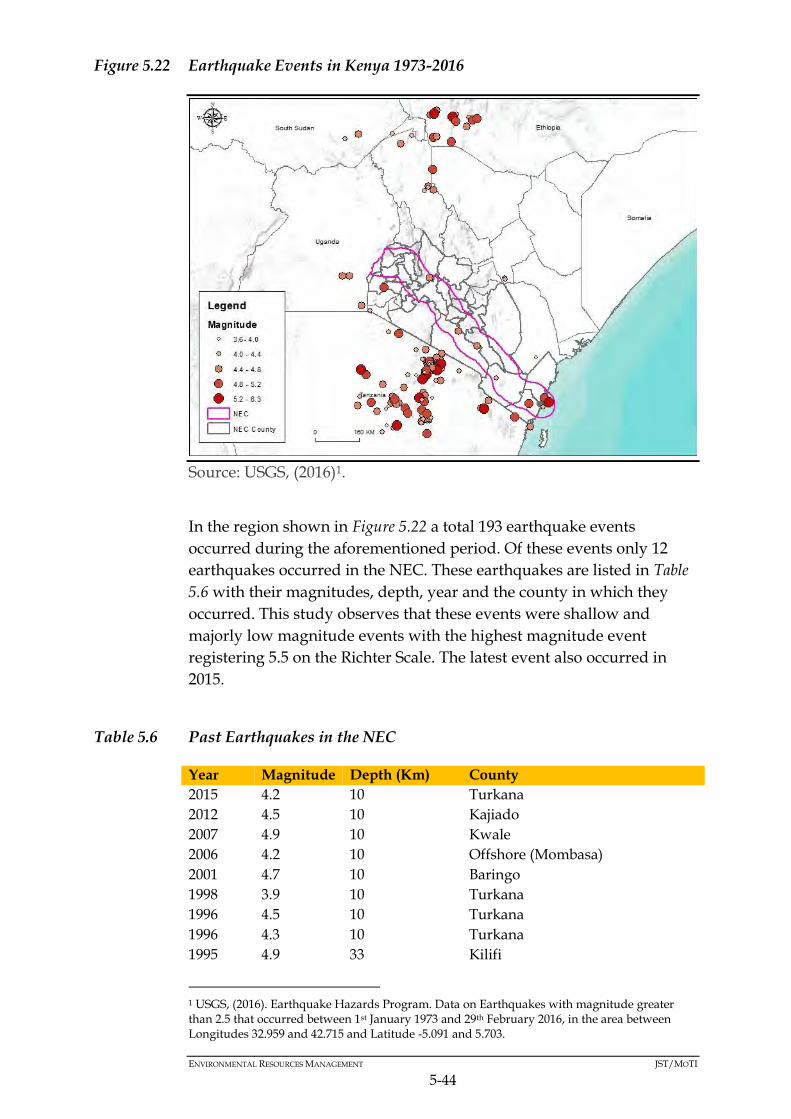
ENVIRONMENTAL RESOURCES MANAGEMENT JST/MOTI
5-44
Figure 5.22 Earthquake Events in Kenya 1973-2016
Source: USGS, (2016)1.
In the region shown in Figure 5.22 a total 193 earthquake events
occurred during the aforementioned period. Of these events only 12
earthquakes occurred in the NEC. These earthquakes are listed in Table
5.6 with their magnitudes, depth, year and the county in which they
occurred. This study observes that these events were shallow and
majorly low magnitude events with the highest magnitude event
registering 5.5 on the Richter Scale. The latest event also occurred in
2015.
Table 5.6 Past Earthquakes in the NEC
Year Magnitude Depth (Km) County
2015 4.2 10 Turkana
2012 4.5 10 Kajiado
2007 4.9 10 Kwale
2006 4.2 10 Offshore (Mombasa)
2001 4.7 10 Baringo
1998 3.9 10 Turkana
1996 4.5 10 Turkana
1996 4.3 10 Turkana
1995 4.9 33 Kilifi
1 USGS, (2016). Earthquake Hazards Program. Data on Earthquakes with magnitude greater than 2.5 that occurred between 1st January 1973 and 29th February 2016, in the area between Longitudes 32.959 and 42.715 and Latitude -5.091 and 5.703.
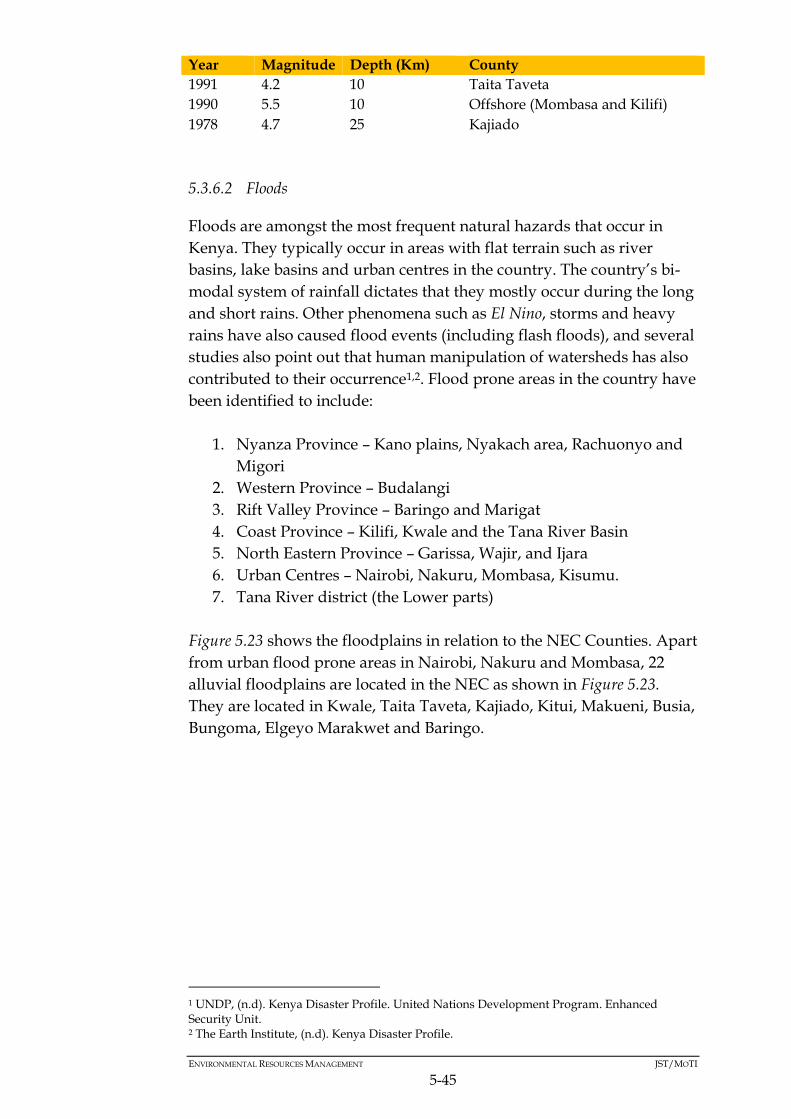
ENVIRONMENTAL RESOURCES MANAGEMENT JST/MOTI
5-45
Year Magnitude Depth (Km) County
1991 4.2 10 Taita Taveta
1990 5.5 10 Offshore (Mombasa and Kilifi)
1978 4.7 25 Kajiado
5.3.6.2 Floods
Floods are amongst the most frequent natural hazards that occur in
Kenya. They typically occur in areas with flat terrain such as river
basins, lake basins and urban centres in the country. The country’s bi-
modal system of rainfall dictates that they mostly occur during the long
and short rains. Other phenomena such as El Nino, storms and heavy
rains have also caused flood events (including flash floods), and several
studies also point out that human manipulation of watersheds has also
contributed to their occurrence1,2. Flood prone areas in the country have
been identified to include:
1. Nyanza Province – Kano plains, Nyakach area, Rachuonyo and
Migori
2. Western Province – Budalangi
3. Rift Valley Province – Baringo and Marigat
4. Coast Province – Kilifi, Kwale and the Tana River Basin
5. North Eastern Province – Garissa, Wajir, and Ijara
6. Urban Centres – Nairobi, Nakuru, Mombasa, Kisumu.
7. Tana River district (the Lower parts)
Figure 5.23 shows the floodplains in relation to the NEC Counties. Apart
from urban flood prone areas in Nairobi, Nakuru and Mombasa, 22
alluvial floodplains are located in the NEC as shown in Figure 5.23.
They are located in Kwale, Taita Taveta, Kajiado, Kitui, Makueni, Busia,
Bungoma, Elgeyo Marakwet and Baringo.
1 UNDP, (n.d). Kenya Disaster Profile. United Nations Development Program. Enhanced Security Unit. 2 The Earth Institute, (n.d). Kenya Disaster Profile.

ENVIRONMENTAL RESOURCES MANAGEMENT JST/MOTI
5-46
Figure 5.23 Floodplains in the NEC
5.3.6.3 Drought
Drought is common in Kenya due to the fact that 80% of the country’s
land mass is ASALs. In these areas annual rainfall ranges between 200
and 500 mm [1]. Moreover, these areas have the highest levels of poverty
creating vulnerable populations predisposed to drought disaster on
exposure. The impact of drought is experienced in the whole country in
all economic sectors since it causes:
Reduced water supply in both rural and urban areas,
Reduced hydropower generation leading to power rationing,
Crop failures and reduced food security,
Deaths of humans, livestock and wildlife,
Loss of employment when industries shut down as resources get
depleted,
Deterioration of human health due to malnutrition and poor
access to quality water, and
Conflicts between communities and wildlife2.
Drought is also a co-factor amongst the causes of environmental
degradation and desertification. Areas prone to drought are the ASALs
which coincide with ACZs with a value greater than 40 (See Section
1 Kandji T. (2006). Drought in Kenya: Climatic, Economic and Socio-Political Factors. New Standpoints November-December 2006. 2 Mbogo E., Inganga F. and Maina J., (n.d). Drought conditions and management strategies in Kenya.

ENVIRONMENTAL RESOURCES MANAGEMENT JST/MOTI
5-47
5.3.1). The NEC Counties intersected by these regions are Kilifi, Kwale,
Kitui, Makueni, Kajiado, Narok, Machakos, Nakuru, Kiambu, Nyeri,
Baringo, Bomet, Elgeyo Marakwet and Laikipia1.
Figure 5.23 identifies past drought events in the country between 1883
and 2011. A total of 26 events are identified in this time period.
Table 5.7 Historical Drought Events in Kenya
Period or
Year
Areas Affected
1883 Coast
1889-1890 Coast
1894-1895 Coast
1896-1900 Countrywide
1907-1911 Lake Victoria, Machakos, Kitui and Coastal areas
1913-1919 Eastern and coastal provinces
1921 Rift valley Central and Coast
1925 Northern Rift Valley and central provinces
1938-1939 Countrywide
1942-1944 Central and Coast Provinces
1947-1950 Eastern, central, Coast, Nyanza, western and rift valley provinces
1952-1955 Eastern, south/north rift Valley
1960-1961 Widespread
1972 Most of Kenya
1973-1974 Eastern Central, northern provinces
1974-1976 Central, Eastern, Western, coast
1980 Eastern province
1981 Countrywide
1983 Countrywide
1984 Central, Rift Valley, Eastern and North Eastern
1987 Eastern and Central
1992-1994 Northern, Central, Eastern Provinces
1999-2000 Countrywide except west and coastal belt
2003-2004 Countrywide
2005-2006 Countrywide
2008-2011 Countrywide
Sources: NDMA, (2012)2 and UNDP, (n.d) 1.
5.3.6.4 Landslides
Landslides and other forms of mass wasting generally occur on
hillsides and slopes. They are often caused by a combination of one or
1 Republic of Kenya (2015). National Policy for the Sustainable Development of Northern Kenya and other Arid Lands. The Presidency. Ministry of Devolution and Planning. July 2015 Draft. 2 NDMA, (2012). Kenya Post-Disaster Needs Assessment (PDNA) 2008-2011 Drought.

ENVIRONMENTAL RESOURCES MANAGEMENT JST/MOTI
5-48
more of geological, morphological and anthropogenic factors listed in
Table 5.8.
Table 5.8 Landslide Causes
Geologic Causes Morphological Causes Human Causes
Weak or sensitive
materials
Weathered materials
Sheared, jointed, or
fissured materials
Adversely oriented
discontinuity (bedding,
schistosity, fault,
unconformity, and
contact)
Contrast in permeability
and/or stiffness of
materials
Tectonic or volcanic
uplift
Glacial rebound
Fluvial, wave, or
glacial erosion of
slope toe or lateral
margins
Subterranean erosion
(solution and piping)
Deposition loading
slope or its crest
Vegetation removal
(by fire and drought)
Thawing
Freeze-and-thaw
weathering
Shrink-and-swell
weathering
Excavation of
slope or its
toe
Loading of
slope or its
crest
Drawdown
(of reservoirs)
Deforestation
Irrigation
Mining
Artificial
vibration
Water
leakage from
utilities
Source: Gichaba M. et al, (2013)1.
Excessive rainfall, earth movements and human manipulation of
landscapes are the most common triggers of landslides. On the other
hand, floods accelerate the occurrence of mass wasting, particularly
mudslides since the resulting inundation increases the water content in
soil1.
Mass wasting often occurs in areas which receive high rainfall (over
1,200 mm annual rainfall) and have steep (over 80⁰) or exposed slopes.
Such areas where landslides have occurred in the past have included,
Mombasa, Rift Valley, Nairobi, Central Kenya and Western. The former
Central Province is particularly susceptible since it has permeable soils
and receives high rainfall and has steep slopes (highlands). The NEC
Counties with a risk of landslides, based on past events between 1974
and 2009, are Kiambu, Murang’a, Nyandarua, Nairobi, Busia, Narok,
Bungoma, Taita Taveta, Nyeri and Nandi1,2.
1 Gichaba M., Kipseba K. and Masibo M., (2013). Overview of Landslide Occurrences in Kenya, Causes, Mitigation, and Challenges Developments in Earth Surface Processes, Vol. 16. Elsevier. 2 Ministry of Special Programmes, (2009). National Policy for Disaster Management in Kenya. Office of the President. Government of Kenya.

ENVIRONMENTAL RESOURCES MANAGEMENT JST/MOTI
5-49
5.3.6.5 Storms
5.3.6.5.1 Tropical Storms
In the NEC, and Kenya in general, tropical cyclones are rare and almost
unknown since the country intersects the equator. They are however
more common between November and April in the Mozambique
Channel, south of the NEC. They are associated with a fresh westerly
wind in southern Tanzania when they occur. Tropical cyclones
predominantly occur in the south Indian Ocean and pass farther south
of the NEC but may, however, at times affect winds along the Kenyan
coast.
Kenya’s coast is located in the southwest Indian Ocean basin in which
cyclones affect Kenya, Tanzania, Comoros, Réunion, Madagascar,
Mozambique and Mauritius. In this basin an average of about ten
tropical cyclones form per year1.
5.3.6.6 El Niño
El Niño refers to the periodic build-up of a large pool of unusually
warm water in large parts of the eastern and central equatorial Pacific
Ocean. Conversely, the opposite condition, known as La Niña, describes
the periodic build-up of unusually cold waters in large parts of the
same ocean basin. During both periods extreme weather events occur
worldwide such as droughts, floods, cold/hot spells, tropical cyclones.
Kenya experienced El Niño in 1997/98, 2002/03, 2006/07, 2009/10 and
2014/15[2]. Effects of these events included floods, storms and
deposition of excessive sediments along the coast due to exceptional
run-off from the storms. The excessive sedimentation of the 1997/98
event caused coral bleaching of up to 90% of corals along the coast. This
event has been recognized as the most severe since it triggered
landslides, damaged property and led to loss of human lives. The
floods resulting from the 1997/98 El Niño were considered to be most
intense since the 1961/62 floods3.
5.3.6.7 Tsunami
Kenya is amongst the western Indian Ocean states that were affected by
the Boxing Day Tsunami (December 26, 2004) albeit with low
1 World Meteorological Organization, (2006). Tropical Cyclones in the Western Indian Ocean. 2 Ministry of Environment and Natural Resources, (2015). El Niño. Retrieved March 01, 2016 from http://www.environment.go.ke/?p=1337 3Ngecu M. and Mathu E., (1999). The El Nino Triggered Landslides and Their Socioeconomic Impacts on Kenya. Episodes, Vol. 22, No. 4.

ENVIRONMENTAL RESOURCES MANAGEMENT JST/MOTI
5-50
magnitude effects. Not much damage was caused by the Tsunami
because extensive reaches of the coast are protected by fringing reefs.
It took nine hours for the Boxing Day Tsunami to impact the northern
part of the Kenyan coast. In contrast to the southern coast, the northern
coast registered higher tsunami heights. Higher magnitude damage
was observed in Lamu and Malindi towns compared to Kilifi and
Mombasa towns. A simulation of the Tsunami with Padang (Sumatra)
as the epicentre postulated wave heights as high as 1.5 m in areas such
as Ungwana Bay and Lamu, and 0.5 m around Mombasa’s coastline1
(Figure 5.24).
Figure 5.24 Tsunami Wave Heights along the Kenyan Coast
Source: Ngunjiru M., (2006)2.
Tsunamis triggered by earthquakes of different magnitudes resulting
from the fracture of the Davie Ridge3 have been simulated in one study.
The study used near-field earthquake source models for earthquakes
with Moment Magnitude (Mw) 7.2, 8.0 and 9.0. For Mw 7.2 earthquake,
the study estimated a seafloor deformation of about 0.5 m resulting
wave heights of 1 m along the Kenyan coast. The Mw 8.0 and 9.0
resulted in deformations of 3 m and 10 m respectively with wave
heights of less than 1 m and 10.5 m respectively. Thus, a Mw 9.0
earthquake along the Davie Ridge will have the most devastating
effects4.
2 Ngunjiri M., (2006). Tsunami and Seismic Activities in Kenya 3 The Davie Ridge is located off the Eastern Africa Coast in the Western Indian Ocean. 4 Josphat K., Fumiaki K. and Nguyen A., (2013). Seismic Hazards. Developments in Earth Surface Processes, Vol. 16. Elsevier.

ENVIRONMENTAL RESOURCES MANAGEMENT JST/MOTI
5-51
5.3.6.8 Soil Erosion
Soil erosion is a globally recognized problem, which leads to losses of
up to 5 Mg/Ha of fertile top soil in Africa annually1. In Kenya, it
presents a challenge to agriculture which contributed 30.3% of the
country’s GDP in 2014 [2]. The main agents of soil erosion in Kenya and
the NEC are wind and water. Erosion is influenced by a combination of
factors including, soil structure and texture, amount of vegetative
cover, land management practices (land use changes), slope of land,
amount of rainfall and wind intensity. The impacts of soil erosion vary
amongst others:
Loss of nutrients,
Loss of land fertility and productivity,
Increased sedimentation in water bodies,
Loss of biodiversity,
Increase of greenhouse emission from soil carbon losses,
Reduced livestock carrying capacity,
Reduced water quantity and quality, and
Reduced wood availability.
Soil erosion is amongst the co-factors that drive land degradation whilst
posing a threat to sustainable agriculture. Moreover, land and
environmental degradation, and soil erosion are reinforcing in an
interlinked network of factors and drivers as shown by Figure 5.25 on
their relationship with soil and land productivity in Kenya.
1 Angima S., Stott D., O’Neill M., Ong C. and Weesies G., (2002). Soil Erosion Prediction Using RUSLE for Central Kenyan Highland Conditions. Agriculture, Ecosystems and Environment 97 (2003) 295–308. Elsevier. 2 World Bank, (2016). Agriculture, value added (% of GDP). Retrieved March 03, 2016 from http://data.worldbank.org/indicator/NV.AGR.TOTL.ZS

ENVIRONMENTAL RESOURCES MANAGEMENT JST/MOTI
5-52
Figure 5.25 Factors Affecting Soil Productivity in Kenya
Source: Ovuka M., (2000)1.
This study identifies only one study, Lieven C. et al, (2008)2, that has
calculated soil erosion potential in a study area that includes the whole
of Kenya’s land mass using the Revised Universal Soil Loss Equation
(RUSLE) model. On the other hand, other studies have focus on
regional subsets such as the Kenyan Highlands (Angima S.D. et al
(2003)3), Ewaso Ngiro Basin (Mati M., (2000)4) and Embu (Sara R.,
(2009)5) to mention a few. This study therefore estimates the erosion
potential of the NEC using an index calculated using the parameters of
rainfall, land uses, slope, soil texture, bedrock depth and landforms. All
these parameters were assigned representative values which are as
added and multiplied by the land use value. The resulting values,
ranging between 0 (waterbodies) and 92, are divided into 5 equal
interval classes namely, Very Low, Low, Moderate, High and Very
1 Ovuka M., (2000). Effects of Soil Erosion on Nutrient Status and Soil Productivity in The Central Highlands of Kenya. Göteborg University, Department of Earth Sciences. 2 Lieven C., Paulo V.B., Notenbaert A., Mario H., Jeanette V.D.S, (2008). Mapping potential soil erosion in East Africa using the Universal Soil Loss Equation and secondary data. Sediment Dynamics in Changing Environments (Proceedings of a symposium held in Christchurch, New Zealand, December 2008). IAHS Publ. 325, 2008. 3 Angima S.D., Stott D.E., O’Neill M.K., Ong C.K. and Weesies G.A, (2003). Soil erosion prediction using RUSLE for central Kenyan highland conditions. Agriculture, Ecosystems and Environment 97 (2003) 295–308. Elsevier. 4 Mati M., (2000). Assessment of erosion hazard with USLE and GIS—a case study of the upper Ewaso Ngiro basin of Kenya. Int. J. Appl. Earth Observ. Geoinform. 2, 78–86. 5 Sara R., (2008). Soil physical properties and erosion risks at smallholder farms in Embu, Kenya. Swedish University of Agricultural sciences. Department of Soil and Environment.
GeologySoil typeDrainageTopographyRainfallTemperatureVegetation
Biophysical Factors
LabourCapitalInputsTenure Security
Economic Factors
History of peopleCultureKnowledgeDemographyGovernment policies
Socio-political Factors
Land use and management
Soil productivity
Soil erosion
Soil nutrients

ENVIRONMENTAL RESOURCES MANAGEMENT JST/MOTI
5-53
High. This is done through GIS using overlays and the results are
shown in Figure 5.26 (1).
Figure 5.26 Soil Erosion Potential along the Main Route of the NEC
This erosion potential analysis identified high potential areas along the
coastal area, the central highlands, rift valley and western region. The
high potential in the coastal region is largely attributed to the high
annual rainfall received. The central highlands, rift valley and western
regions have high potential due high annual rainfall, steep slopes and
predominance of agricultural practices. The location of these high
potential areas coincides with the findings of Lieven C. et al, (2008).
(1) Data for the sub-route was unavailable

ENVIRONMENTAL RESOURCES MANAGEMENT JST/MOTI
5-54
Box 5.5 Constraints - Natural Hazards
5.4 BIOLOGICAL BASELINE
Kenya’s biodiversity richness comprises over 35,000 species of flora and
fauna1. This richness is attributed to a long evolutionary history,
variable climatic conditions, and diverse habitat types and ecosystems1.
Several of these biological resources face risks of extinction (species)
and degradation (habitats). This study pays particular interest and
1 UNEP, (2009). Kenya: Atlas of Our Changing Environment. Division of Early Warning and Assessment (DEWA). United Nations Environment Programme (UNEP)
All hazard prone areas in the NEC are classed to be constraints
particularly due to the vulnerability of Kenya’s population to disasters.
These constraints are the following:
Earthquake Epicentres (Seismic Zones): These areas are geological
active and any infrastructure located in their neighbourhood will
require mitigation measures to make them earthquake proof.
Earthquakes present a risk on the infrastructure, human life and
livelihood assets.
Flood Prone Areas: Floods can damage infrastructure and affect
human life negatively by: increasing the risk of water-borne
diseases, leading to loss of life through drowning, damaging
livelihood assets and leading to displacement.
Soil erosion prone areas: In these areas the development of
infrastructure can lead to or increase the risk of erosion. Soil
management measures will thus have to be implemented to manage
this risk.
Landslide Prone Areas: Landslides can lead to loss of human life
and damage infrastructure. The development of infrastructure or
extension of agriculture in areas prone to landslides in the NEC can
increase their associated risk.
Tsunami: Coastal areas and infrastructure of the NEC will be
vulnerable to tsunamis which can damage infrastructure on landfall,
cause flooding and subsequently loss of life.
Drought: The NEC’s ASALs are the most susceptible to drought.
The occurrence of drought in these regions will create a challenge of
acquiring resources such as water which will be required in
developing any infrastructure. Additionally, these areas remain
impoverished as compared to the wetter regions of the country
whereas due to their prevailing conditions the interventions of the
NEC will be limited.

ENVIRONMENTAL RESOURCES MANAGEMENT JST/MOTI
5-55
focus on the anthropogenic drivers of these risks. This is because the
NEC MP has the potential of contributing to these risks since it
intersects regions with valuable biological diversity.
This subsection describes the biological resources of the NEC, similarly
with a purpose of identifying potential constraints to the MP.
Assessment methods employed in this section for species borrow from
IUCN’s Red List assessment method and those used nationally for
prioritization1. The following IUCN Red List assessment categories are
considered:
Critically Endangered (CR): The species is in imminent risk of
extinction in the wild.
Endangered (EN): The species is facing an extremely high risk of
extinction in the wild.
Vulnerable (VU): The species is facing a high risk of extinction in
the wild.
Near Threatened (NT): The species does not meet any of the criteria
that would categorise it as risking extinction but it is likely to do so
in the future.
These classes are used in assessing the sensitivity of species or
ecosystems and habitats of such species in this sub-section.
5.4.1 Ecosystems and Agro-ecological Zones
The NEC intersects ecosystems in both the marine and terrestrial eco-
regions. Topography plays a determinant role in the ecosystems found
in a particular location in the country. The NEC intersects all the
ecosystems shown in Figure 5.27 except for Mt Kenya, and the Glacial
and Alpine ecosystems.
Figure 5.27 Ecosystems in Kenya
1 National prioritization of species and ecosystems are according to the 2nd Schedule of the Wildlife Management and Coordination Act (2013).

ENVIRONMENTAL RESOURCES MANAGEMENT JST/MOTI
5-56
Source: Westview Press, (1993)1.
5.4.1.1 Terrestrial Eco-Region
Ecosystems in Kenya’s terrestrial eco-region include forests, forest
ranges, savannahs, grasslands, lake ecosystems, riverine ecosystems
and highlands/mountainous ecosystems. KWS has identified
priority/endangered ecosystems and areas of environmental
significance in the country. Those priority ecosystems and areas of
environmental significance which intersect the NEC are identified in
Table 5.9.
Table 5.9 Priority Ecosystems and Areas of Environmental Significance in the
NEC
Endangered or Priority
Ecosystems
Areas of Environmental Significance
Athi-Kitengela and Kaputei
Plains (Kajiado)
Eburru Forest (Narok)
Kerio valley (Baringo)
Kimana Group Ranch
(Kajiado)
Kuku A and B Group
Ranches (Kajiado)
Lake Elementaita and its
catchment and its basin
(Naivasha)
Lake Nakuru N.P and its
catchment (Nakuru)
Lolorashi Group Ranch
(Kajiado)
Machakos ranches
(Machakos)
Marula Ranch (Naivasha)
Marula ranch (Nakuru)
Mashuru (Kajiado)
Mau Forest Complex
(Nakuru, Bomet, Narok,
Kericho)
Mbirikani Group Ranch
(Kajiado)
Nairobi National park
(Nairobi)
Ol Gulului (Kajiado)
Ol Gulului Trust Land
Aberdare Ecosystem Ranges
(Nyandarua/Nyeri)
Baringo Ecosystem (Baringo)
Lake Naivasha Ecosystem (Nakuru)
Mt. Elgon Ecosystem (Bungoma/Trans
Nzoia)
Mt. Kenya Ecosystem
(Meru/Tharaka/Kirinyaga/Nyeri/Laiki
pia)
Shimba Hills Ecosystem (Kwale)
Tsavo Ecosystem (Tana River/Taita
Taveta/ Kitui)
1 Westview Press, (1993). Ecological Zones in Kenya.
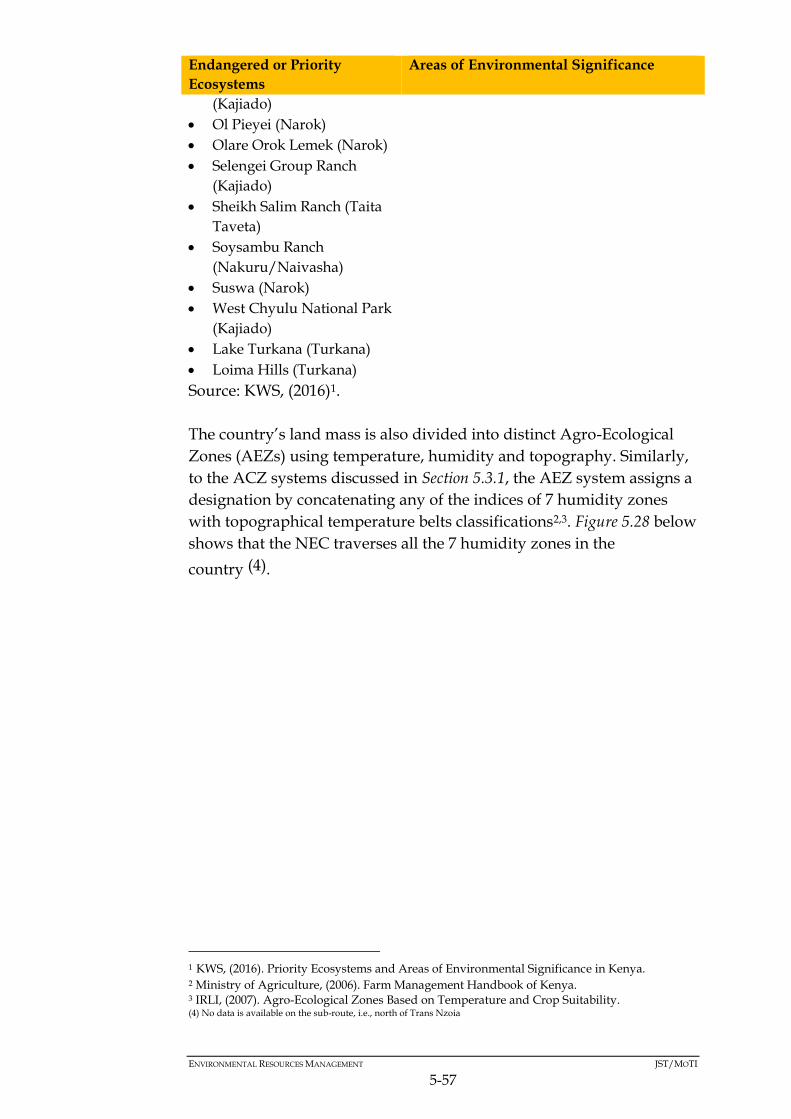
ENVIRONMENTAL RESOURCES MANAGEMENT JST/MOTI
5-57
Endangered or Priority
Ecosystems
Areas of Environmental Significance
(Kajiado)
Ol Pieyei (Narok)
Olare Orok Lemek (Narok)
Selengei Group Ranch
(Kajiado)
Sheikh Salim Ranch (Taita
Taveta)
Soysambu Ranch
(Nakuru/Naivasha)
Suswa (Narok)
West Chyulu National Park
(Kajiado)
Lake Turkana (Turkana)
Loima Hills (Turkana)
Source: KWS, (2016)1.
The country’s land mass is also divided into distinct Agro-Ecological
Zones (AEZs) using temperature, humidity and topography. Similarly,
to the ACZ systems discussed in Section 5.3.1, the AEZ system assigns a
designation by concatenating any of the indices of 7 humidity zones
with topographical temperature belts classifications2,3. Figure 5.28 below
shows that the NEC traverses all the 7 humidity zones in the
country (4).
1 KWS, (2016). Priority Ecosystems and Areas of Environmental Significance in Kenya. 2 Ministry of Agriculture, (2006). Farm Management Handbook of Kenya. 3 IRLI, (2007). Agro-Ecological Zones Based on Temperature and Crop Suitability. (4) No data is available on the sub-route, i.e., north of Trans Nzoia

ENVIRONMENTAL RESOURCES MANAGEMENT JST/MOTI
5-58
Figure 5.28 AEZs in the NEC Main Route
Source: ILRI, (2007)3.
From the map above, the topographical temperature belts intersected
by the NEC are:
Coastal Lowlands (CL),
Inner Lowlands (IL),
Lower Highlands (LH),
Upper Midlands (UM),
Lower Midlands (LM),
Tropical Alpine (TA), and
Upper Highlands (UH).
5.4.1.2 Marine Eco-Region
In the marine eco-region ecosystems range from mangroves and coastal
wetlands to lagoons to fringing coral reefs and the open ocean. The
discrete ecosystems found in the areas of this eco-region intersected by
the NEC are explained in Table 5.10
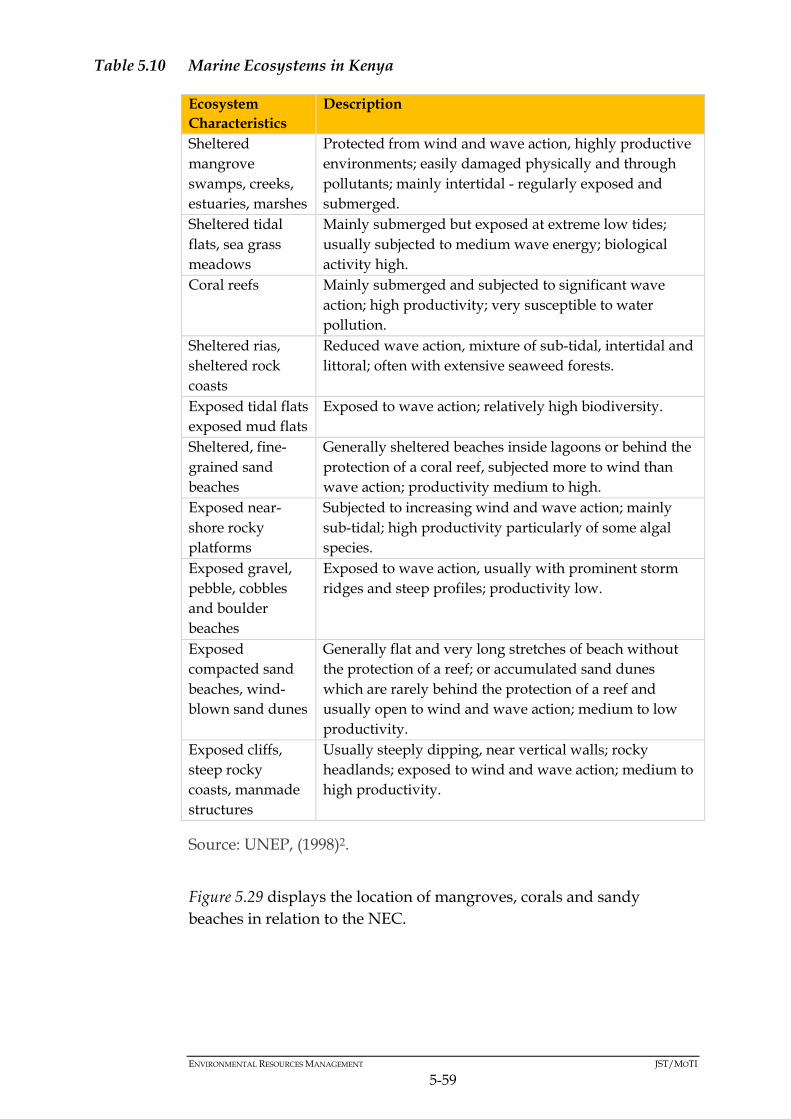
ENVIRONMENTAL RESOURCES MANAGEMENT JST/MOTI
5-59
Table 5.10 Marine Ecosystems in Kenya
Ecosystem
Characteristics
Description
Sheltered
mangrove
swamps, creeks,
estuaries, marshes
Protected from wind and wave action, highly productive
environments; easily damaged physically and through
pollutants; mainly intertidal - regularly exposed and
submerged.
Sheltered tidal
flats, sea grass
meadows
Mainly submerged but exposed at extreme low tides;
usually subjected to medium wave energy; biological
activity high.
Coral reefs Mainly submerged and subjected to significant wave
action; high productivity; very susceptible to water
pollution.
Sheltered rias,
sheltered rock
coasts
Reduced wave action, mixture of sub-tidal, intertidal and
littoral; often with extensive seaweed forests.
Exposed tidal flats
exposed mud flats
Exposed to wave action; relatively high biodiversity.
Sheltered, fine-
grained sand
beaches
Generally sheltered beaches inside lagoons or behind the
protection of a coral reef, subjected more to wind than
wave action; productivity medium to high.
Exposed near-
shore rocky
platforms
Subjected to increasing wind and wave action; mainly
sub-tidal; high productivity particularly of some algal
species.
Exposed gravel,
pebble, cobbles
and boulder
beaches
Exposed to wave action, usually with prominent storm
ridges and steep profiles; productivity low.
Exposed
compacted sand
beaches, wind-
blown sand dunes
Generally flat and very long stretches of beach without
the protection of a reef; or accumulated sand dunes
which are rarely behind the protection of a reef and
usually open to wind and wave action; medium to low
productivity.
Exposed cliffs,
steep rocky
coasts, manmade
structures
Usually steeply dipping, near vertical walls; rocky
headlands; exposed to wind and wave action; medium to
high productivity.
Source: UNEP, (1998)2.
Figure 5.29 displays the location of mangroves, corals and sandy
beaches in relation to the NEC.

ENVIRONMENTAL RESOURCES MANAGEMENT JST/MOTI
5-60
Figure 5.29 Mangroves, Corals and Sandy Beaches
This study finds corals, sandy beaches, mangroves and seagrass beds to
be sensitive ecosystems. This is because they provide valuable
ecosystem services but are threatened by human activities. They are
discussed in more detail in Section 5.4.4
Box 5.6 Constraints - Endangered Ecosystems and Areas of Environmental
Significance
5.4.2 Biodiversity
The diversity of flora and fauna in Kenya has led to several areas to be
designated as Ramsar sites, Man and Biosphere (MAB) Reserves or
World Heritage Sites. Through tourism and other environmental
services this diversity contributes to the country’s economy. It is
however noted that 70% of the national diversity exists outside of
The endangered ecosystems and areas of environmental significance are
recognized as constraints by this study. This is because:
They are protected by national regulations
They are priority areas of conservation efforts in the country.
This study deems that these ecosystems and areas are at risk of
degradation from anthropogenic pressures, and
The NEC MP has the potential of increasing these pressures and
risks.

ENVIRONMENTAL RESOURCES MANAGEMENT JST/MOTI
5-61
protected areas1. This situation threatens the longevity and wellbeing of
this diversity.
5.4.2.1 Fauna
5.4.2.1.1 Terrestrial Fauna
Kenya has over 25,000 species of fauna of which several are considered
at risk by IUCN Red List assessment method and national regulations.
This study focusses on species likely to be found in the NEC which are
considered to be at risk by these two regimes of assessment. Species are
identified through GIS from species ranges obtained from IUCN’s Red
List1. In the subsections herein briefs on the findings are provided:
1. Mammals
A total of 310 mammals listed in IUCN’s Red List are identified
to be likely to found within the NEC. Figure 5.30 displays the
distribution of these mammals according the assessment
categories. Whilst most of the identified mammals are assessed
to be under LC (260), 3 are EN and 3 are CE. Those under these
two categories are the following:
Endangered
o Equus grevyi (Grevy’s Zebra)
o Lycaon pictus (African Wild Dog)
o Rhynchocyon chrysopygus (Golden-rumped Elephant
Shrew)
Critically Endangered
o Beatragus hunter (Hunter’s Antelope)
o Diceros bicornis (Black Rhinocerous)
o Suncus aequatorius (Taita Shrew)
o
1 IUCN Red List, (2014). The IUCN Red List of Threatened Species.
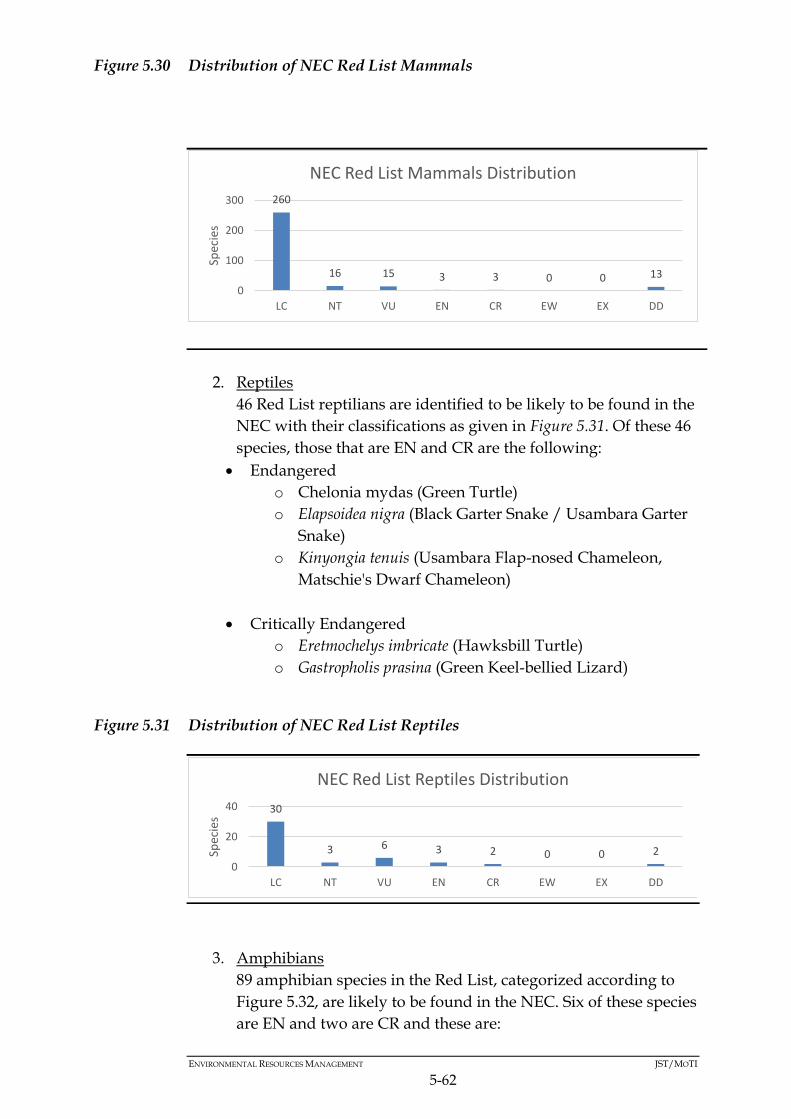
ENVIRONMENTAL RESOURCES MANAGEMENT JST/MOTI
5-62
Figure 5.30 Distribution of NEC Red List Mammals
2. Reptiles
46 Red List reptilians are identified to be likely to be found in the
NEC with their classifications as given in Figure 5.31. Of these 46
species, those that are EN and CR are the following:
Endangered
o Chelonia mydas (Green Turtle)
o Elapsoidea nigra (Black Garter Snake / Usambara Garter
Snake)
o Kinyongia tenuis (Usambara Flap-nosed Chameleon,
Matschie's Dwarf Chameleon)
Critically Endangered
o Eretmochelys imbricate (Hawksbill Turtle)
o Gastropholis prasina (Green Keel-bellied Lizard)
Figure 5.31 Distribution of NEC Red List Reptiles
3. Amphibians
89 amphibian species in the Red List, categorized according to
Figure 5.32, are likely to be found in the NEC. Six of these species
are EN and two are CR and these are:
260
16 15 3 3 0 0 13
0
100
200
300
LC NT VU EN CR EW EX DD
Spec
ies
NEC Red List Mammals Distribution
30
3 6 3 2 0 0 2
0
20
40
LC NT VU EN CR EW EX DD
Spec
ies
NEC Red List Reptiles Distribution

ENVIRONMENTAL RESOURCES MANAGEMENT JST/MOTI
5-63
Endangered
o Afrixalus sylvaticus (Forest Banana Frog / Forest Spiny
Reed Frog)
o Boulengerula changamwensis (Changamwensis African
Caecilian / Changamwe Lowland Caecilian /
Changamwe Caecilian)
o Boulengerula niedeni (Sagalla Caecilian)
o Boulengerula taitana (Taita African Caecilian)
o Hyperolius rubrovermiculatus (Reed Frog)
o Phrynobatrachus irangi (Irangi Puddle Frog)
Critically Endangered
o Arthroleptides dutoiti (Du Toit's Torrent Frog)
o Callulina dawida (Taita Hills Warty Frog)
Figure 5.32 Distribution of NEC Red List Amphibians
4. Birds
There are 971 species of birds that are likely to be found in the
NEC which are in the Red List. Figure 5.33 illustrates the
distribution of the assessment categories of these birds. Those
which are EN and CR are:
Endangered
o Acrocephalus griseldis (Basra Reed-warbler)
o Anthus sokokensis (Sokoke Pipit)
o Aquila nipalensis (Steppe eagle)
o Ardeola idae (Madagascar Pond-heron)
o Balearica regulorum (Grey crowned crane)
o Cisticola Aberdare (Aberdare Cisticola)
o Eremomela turneri (Turner's Eremomela)
o Falco cherrug (Saker Falcon)
o Macronyx sharpei (Sharpe's Longclaw)
o Neophron percnopterus (Egyptian vulture)
o Ploceus golandi (Clarke's Weaver)
76
1 1 6 2 0 0 3 0
50
100
LC NT VU EN CR EW EX DD
Spec
ies
NEC Red List Amphibians

ENVIRONMENTAL RESOURCES MANAGEMENT JST/MOTI
5-64
o Torgos tracheliotos (Lappet-faced Vulture)
o Zoothera guttata (Spotted Ground-thrush)
Critically Endangered
o Apalis fuscigularis (Taita Apalis)
o Gyps africanus (White backed vulture)
o Gyps rueppelli (Rüppell's vulture)
o Necrosyrtes monachus (Hooded Vulture)
o Trigonoceps occipitalis (White-headed Vulture)
o Turdus helleri (Taita Thrush)
Figure 5.33 Distribution of NEC Red List Birds
5. Aquatic (Freshwater) Species
138 aquatic fish species in the Red List are likely to be found in
the rivers, wetlands and lakes in the NEC. The distribution of
their assessment categories is shown in Figure 5.34. The
freshwater fish which are EN and CR are:
Endangered
o Alcolapia alcalicus (Soda Cichlid / Magadi Tilapia)
o Barbus quadralineatus (Nelitriip-pardkala1)
o Brycinus jacksonii (Victoria Robber)
o Marcusenius victoriae (Victoria Stonebasher)
Critically Endangered
o Aplocheilichthys sp. nov. 'Baringo'
1 Estonian common name Source: Fishbase.org (2008). Common names of Barbus quadrilineatus. Retrieved March 03, 2016 from http://www.fishbase.org/comnames/CommonNamesList.php?ID=62907&GenusName=Barbus&SpeciesName=quadrilineatus&StockCode=52976
906
29 16 13 6 0 0 1
LC NT VU EN CR EW EX DD
NEC Red List Birds Distribution

ENVIRONMENTAL RESOURCES MANAGEMENT JST/MOTI
5-65
o Haplochromis sp. nov. 'Amboseli'
o Oreochromis esculentus (Singidia Tilapia)
o Oreochromis jipe (Jipe Tilapia)
o Oreochromis variabilis (Victoria Tilapia)
Figure 5.34 Distribution of NEC Red List Freshwater Fish
5.4.2.1.2 Marine Fauna
The marine zone of the NEC forms a habitat for a diverse set of species
some of which are under risk from human activities. These species
include cetaceans, wrasse, sea turtles and parrotfish amongst others.
1. Cetaceans
There are 23 cetaceans in the Red List likely to be found in the
NEC. The distribution of their assessment categories are given in
Figure 5.35. None of the species are CR, however those that are
EN are:
Balaenoptera musculus (Blue Whale), and
Balaenoptera borealis (Sei Whale).
90
2
13 4 5
0 1
23
0
10
20
30
40
50
60
70
80
90
100
LC NT VU EN CR EW EX DD
Spec
ies
NEC Red List Freshwater Fish

ENVIRONMENTAL RESOURCES MANAGEMENT JST/MOTI
5-66
Figure 5.35 Distribution of NEC Red List Cetaceans
2. Sea Turtles
Kenya’s five sea turtle species are likely to be found in the NEC.
These are Chelonia mydas (Green turtle), Eretmochelys imbricate
(Hawksbill turtle), Caretta caretta (Loggerhead turtle),
Lepidochelys olivacea (Olive Ridley), and Dermochelys coriacea
(Leatherback Turtle). The Green turtle and Hawksbill turtle are
EN and CR respectively.
3. Angelfish
In the NEC there are 12 Angelfish species in the Red List that are
likely to be found. All these species are categorized as LC.
4. Groupers
There are 46 Red List Grouper species likely to found in the
NEC. Their assessment categories are distributed as shown by
Figure 5.36
It is observed that none of the species are CR or EN, however
those that are NT and VU are the following:
o Near Threatened
Epinephelus malabaricus (Malabar Grouper)
Plectropomus pessuliferus (Roving Coralgrouper)
Epinephelus fuscoguttatus (Brown-marbled Grouper)
Epinephelus coioides (Orange-spotted Grouper)
Epinephelus polyphekadion (Camouflage Grouper)
o Vulnerable
Plectropomus laevis (Blacksaddled Coral Grouper)
10
1 2 2
0 0 0
8
0
2
4
6
8
10
12
LC NT VU EN CR EW EX DD
SPEC
IES
NEC Red List Cetaceans
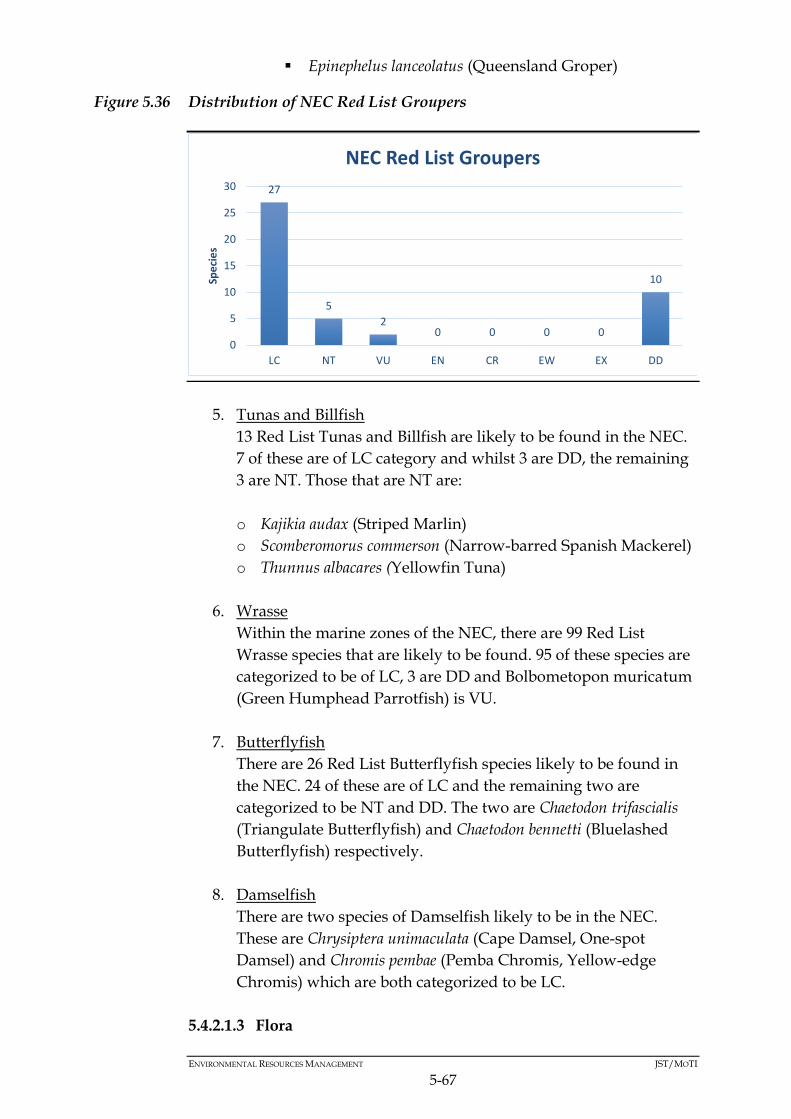
ENVIRONMENTAL RESOURCES MANAGEMENT JST/MOTI
5-67
Epinephelus lanceolatus (Queensland Groper)
Figure 5.36 Distribution of NEC Red List Groupers
5. Tunas and Billfish
13 Red List Tunas and Billfish are likely to be found in the NEC.
7 of these are of LC category and whilst 3 are DD, the remaining
3 are NT. Those that are NT are:
o Kajikia audax (Striped Marlin)
o Scomberomorus commerson (Narrow-barred Spanish Mackerel)
o Thunnus albacares (Yellowfin Tuna)
6. Wrasse
Within the marine zones of the NEC, there are 99 Red List
Wrasse species that are likely to be found. 95 of these species are
categorized to be of LC, 3 are DD and Bolbometopon muricatum
(Green Humphead Parrotfish) is VU.
7. Butterflyfish
There are 26 Red List Butterflyfish species likely to be found in
the NEC. 24 of these are of LC and the remaining two are
categorized to be NT and DD. The two are Chaetodon trifascialis
(Triangulate Butterflyfish) and Chaetodon bennetti (Bluelashed
Butterflyfish) respectively.
8. Damselfish
There are two species of Damselfish likely to be in the NEC.
These are Chrysiptera unimaculata (Cape Damsel, One-spot
Damsel) and Chromis pembae (Pemba Chromis, Yellow-edge
Chromis) which are both categorized to be LC.
5.4.2.1.3 Flora
27
5
2 0 0 0 0
10
0
5
10
15
20
25
30
LC NT VU EN CR EW EX DD
Spe
cie
s
NEC Red List Groupers
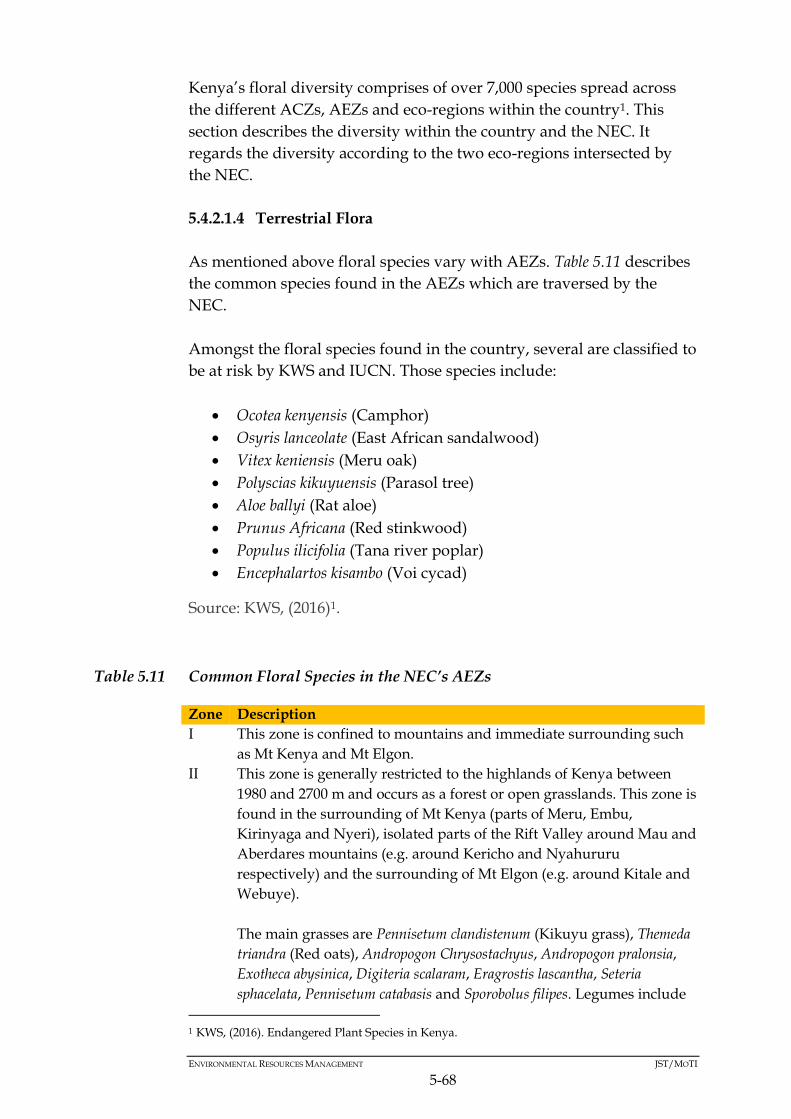
ENVIRONMENTAL RESOURCES MANAGEMENT JST/MOTI
5-68
Kenya’s floral diversity comprises of over 7,000 species spread across
the different ACZs, AEZs and eco-regions within the country1. This
section describes the diversity within the country and the NEC. It
regards the diversity according to the two eco-regions intersected by
the NEC.
5.4.2.1.4 Terrestrial Flora
As mentioned above floral species vary with AEZs. Table 5.11 describes
the common species found in the AEZs which are traversed by the
NEC.
Amongst the floral species found in the country, several are classified to
be at risk by KWS and IUCN. Those species include:
Ocotea kenyensis (Camphor)
Osyris lanceolate (East African sandalwood)
Vitex keniensis (Meru oak)
Polyscias kikuyuensis (Parasol tree)
Aloe ballyi (Rat aloe)
Prunus Africana (Red stinkwood)
Populus ilicifolia (Tana river poplar)
Encephalartos kisambo (Voi cycad)
Source: KWS, (2016)1.
Table 5.11 Common Floral Species in the NEC’s AEZs
Zone Description
I This zone is confined to mountains and immediate surrounding such
as Mt Kenya and Mt Elgon.
II This zone is generally restricted to the highlands of Kenya between
1980 and 2700 m and occurs as a forest or open grasslands. This zone is
found in the surrounding of Mt Kenya (parts of Meru, Embu,
Kirinyaga and Nyeri), isolated parts of the Rift Valley around Mau and
Aberdares mountains (e.g. around Kericho and Nyahururu
respectively) and the surrounding of Mt Elgon (e.g. around Kitale and
Webuye).
The main grasses are Pennisetum clandistenum (Kikuyu grass), Themeda
triandra (Red oats), Andropogon Chrysostachyus, Andropogon pralonsia,
Exotheca abysinica, Digiteria scalaram, Eragrostis lascantha, Seteria
sphacelata, Pennisetum catabasis and Sporobolus filipes. Legumes include
1 KWS, (2016). Endangered Plant Species in Kenya.

ENVIRONMENTAL RESOURCES MANAGEMENT JST/MOTI
5-69
Zone Description
Trifolium johnstoni, Medicago sativa (Alfalfa or Lucerne), Sesbania sesban
and Leuceana leucusephala.
III Trees are numerous here and somewhat of shorter stature than in Zone
II. This zone is the most significant for agricultural cultivation and
several legume fodders are found here in crop-livestock systems. It
occurs in the vast parts of Nyanza, Western and Central provinces,
good proportion of Central Rift-Valley (Nandi, Nakuru, Bomet,
Eldoret and Kitale) and a small strip at the Coast province. The major
grasses are Hyperenia and Cymbopogon, Themeeda triandra, Panicum
maximum, Seteria Sphacelata, Sporobolus pyramidalis, Bracharia brizantha
(Congo signal), Bricharia siluta, Chloris gayana (Rhodes grass) and
Cynodon dactylon (Star grass).
IV This zone occupies more or less the same elevation (900-1800 m) as the
previous or may be at times lower. It is typically represented in
surroundings of Naivasha, vast parts of Laikipia and Machakos, vast
parts of the former Central Province and vast part of the southern
region of the former Coast Province. It is the home of most Acacia trees
and shrubs including Acacia seyal, Acasia Senegal, Acacia brevispica,
Acacia drepanolobium and Acacia gerrardii. Euphobia trees occur in some
drier parts of this zone. Combretum and Terchonanthus spp. are also
common here.
Grasses found in this zone include Themeda triandra, Pennisetum
mezianum, Pennisetum straminium, Pennisetum massaiense, Eragrostis spp.,
Hyperenia spp., Seteria spp., Digiteria spp., Bothriochloa insculpta and
Cenchrus ciliaris. Rare grasses include Chloris spp. and Cynodon spp.
Besides Acacia, other important legumes include Indigoferra and
Crotolaria.
V This zone is much drier than Zone IV and occurs at lower elevations.
This Zone is prevalent in northern Baringo, Turkana, lower Makueni
and vast parts of the former North Eastern Province.
Low trees and shrubs found here include Acacia mellifera, Acacia tortilis,
Acacia horrida, Acacia reficiens, Acacia nubica, Acaia paslii, Acacia
Zanzibarica, Adansonia digitata, Terminalia prunioides, Dobea spp.,
Dioppspyros spp. and Commiphora spp.
Common grasses in this zone are Eragrostis superba, Cenchrus ciliaris,
Cymbopogon spp., Bothriochloa spp. and Heteropogon contortus.
VI This zone is considered as semi desert and is the driest part of Kenya.
Dominant in this zone are Acacia and Commiphora shrubs with
scattered taller trees of Delonix elata, Acacia tortilis and Adansonia
digitata. Balanites eagyptica, Boscia coriacea, Salvadora persica, Acacia
mellifera and Acacia reficiens are important shrubs or low tree species.
Common dwarf shrubs here are Indigofera spinosa and Sansevieria spp.
Other important shrubs are Sericocomopsis, Barberia and Duosperma
eromophylum. Important grasses include Aristida adoensis, Stipagrostis
hirtigluma, which are very characteristic and may occur as annuals or

ENVIRONMENTAL RESOURCES MANAGEMENT JST/MOTI
5-70
Zone Description
perennials. Other grasses also found here are Aristida mutabilis,
Chrysopogon aucheri, Tetrapogon spp., Enneapogon cenchroides and Chloris
roxburghiana.
VII This zone is desert dominated by sparse salt bushes.
Source: Infonet-Biovision, (2016)1.
5.4.2.1.5 Forestry
Kenya is classified as a country with low forest cover since less than
10% of its area covered by forests. Recent estimates calculated the
country’s gazetted forest cover to a value less than 3.5%. This has
driven efforts of increasing the country’s forest cover since forest
provide diverse and valuable environmental services and goods.
Kenya’s Vision 2030 sets 10% as the national goal of forest cover.
Climate change, encroachment, pollution, land use changes and
unsustainable harvesting of forest products are amongst the pressures
which prevent the attainment of this goal. Nationally, only 18 counties
had a forest cover above 10% in 2015[3].
Amongst the NEC Counties, the counties which meet the 10% goal are
Elgeyo Marakwet, Baringo, Bungoma, Trans Nzoia, Nandi, Kericho,
Bomet, Narok, Kiambu, Nyandarua, Nyeri, Kirinyaga, Kiambu and
Makueni. Figure 5.37 illustrates the distribution of percentage forest
cover amongst the NEC Counties. This study calculates that 8.93% of
land area of the NEC Counties is covered by forests. This translates to
24,467.20 km2 wherein an average of 789 km2 of forest cover per county
is observed amongst these counties.
.
1 Infonet-Biovision, (2016). AEZs: The Kenya System. Retrieved March 04, 2016 from http://www.infonet-biovision.org/EnvironmentalHealth/AEZs-Kenya-System
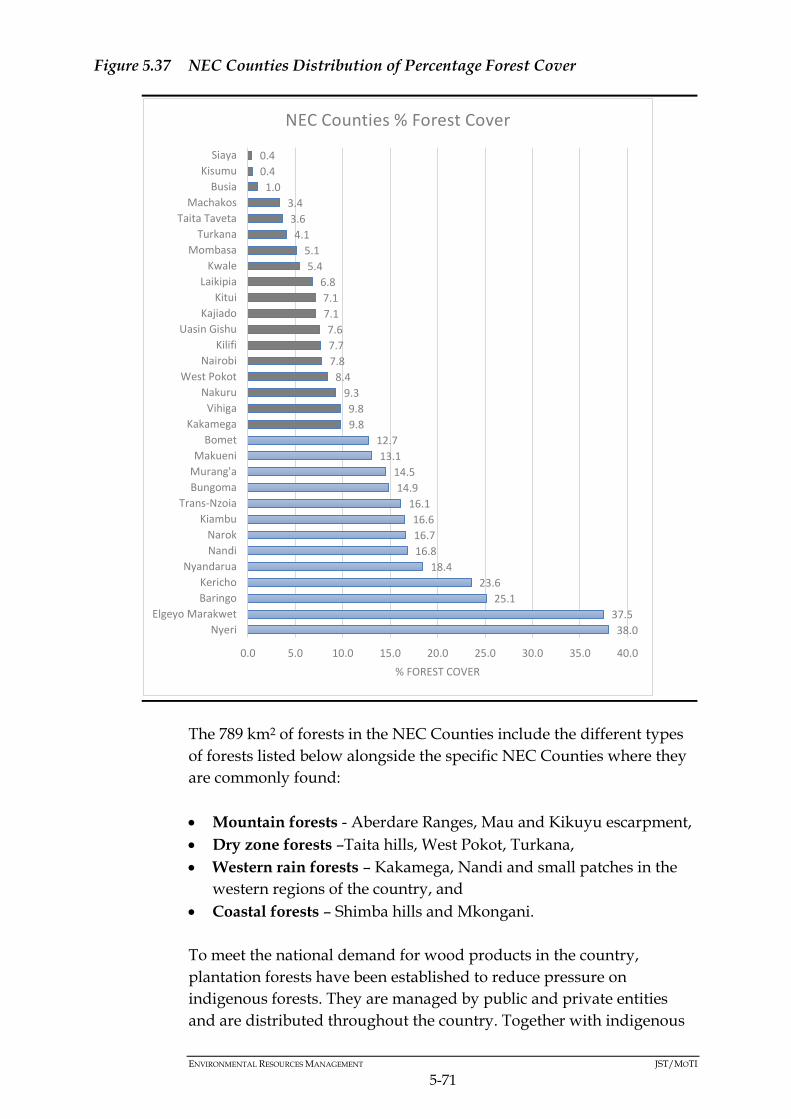
ENVIRONMENTAL RESOURCES MANAGEMENT JST/MOTI
5-71
Figure 5.37 NEC Counties Distribution of Percentage Forest Cover
The 789 km2 of forests in the NEC Counties include the different types
of forests listed below alongside the specific NEC Counties where they
are commonly found:
Mountain forests - Aberdare Ranges, Mau and Kikuyu escarpment,
Dry zone forests –Taita hills, West Pokot, Turkana,
Western rain forests – Kakamega, Nandi and small patches in the
western regions of the country, and
Coastal forests – Shimba hills and Mkongani.
To meet the national demand for wood products in the country,
plantation forests have been established to reduce pressure on
indigenous forests. They are managed by public and private entities
and are distributed throughout the country. Together with indigenous
38.0
37.5
25.1
23.6
18.4
16.8
16.7
16.6
16.1
14.9
14.5
13.1
12.7
9.8
9.8
9.3
8.4
7.8
7.7
7.6
7.1
7.1
6.8
5.4
5.1
4.1
3.6
3.4
1.0
0.4
0.4
0.0 5.0 10.0 15.0 20.0 25.0 30.0 35.0 40.0
Nyeri
Elgeyo Marakwet
Baringo
Kericho
Nyandarua
Nandi
Narok
Kiambu
Trans-Nzoia
Bungoma
Murang'a
Makueni
Bomet
Kakamega
Vihiga
Nakuru
West Pokot
Nairobi
Kilifi
Uasin Gishu
Kajiado
Kitui
Laikipia
Kwale
Mombasa
Turkana
Taita Taveta
Machakos
Busia
Kisumu
Siaya
% FOREST COVER
NEC Counties % Forest Cover
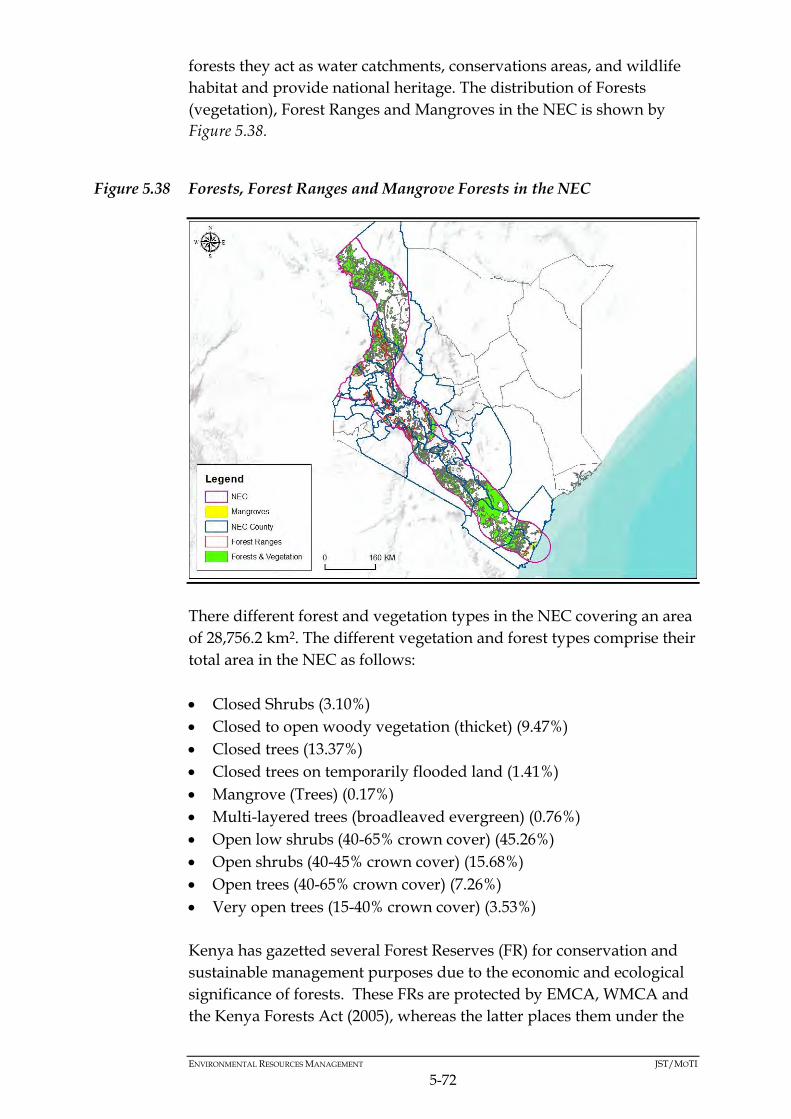
ENVIRONMENTAL RESOURCES MANAGEMENT JST/MOTI
5-72
forests they act as water catchments, conservations areas, and wildlife
habitat and provide national heritage. The distribution of Forests
(vegetation), Forest Ranges and Mangroves in the NEC is shown by
Figure 5.38.
Figure 5.38 Forests, Forest Ranges and Mangrove Forests in the NEC
There different forest and vegetation types in the NEC covering an area
of 28,756.2 km2. The different vegetation and forest types comprise their
total area in the NEC as follows:
Closed Shrubs (3.10%)
Closed to open woody vegetation (thicket) (9.47%)
Closed trees (13.37%)
Closed trees on temporarily flooded land (1.41%)
Mangrove (Trees) (0.17%)
Multi-layered trees (broadleaved evergreen) (0.76%)
Open low shrubs (40-65% crown cover) (45.26%)
Open shrubs (40-45% crown cover) (15.68%)
Open trees (40-65% crown cover) (7.26%)
Very open trees (15-40% crown cover) (3.53%)
Kenya has gazetted several Forest Reserves (FR) for conservation and
sustainable management purposes due to the economic and ecological
significance of forests. These FRs are protected by EMCA, WMCA and
the Kenya Forests Act (2005), whereas the latter places them under the

ENVIRONMENTAL RESOURCES MANAGEMENT JST/MOTI
5-73
management of KFS. The FRs traversed by the NEC are identified and
discussed in Section 5.4.4.
5.4.2.1.6 Marine Flora
In the marine eco-region mangrove forests and seagrass beds are
amongst the important floral species and ecosystems. These are
discussed in the subsections herein.
1. Mangroves
Mangroves are distinctive coastal ecosystems that are highly
productive areas making them important economically and socially.
They are estuarine and occur in protected habitats where the
seawater and freshwater mix. They provide fish habitat and are
source of materials such as locally used wood. They are important
nurseries and breeding sites for a variety of marine species of
economic importance and other that contribute to the food chain.
UNEP, (2011) calculated the value of mangroves in Gazi Bay based
on the following goods and services:
Direct Use Values (DUV): fishery, timber, eco-tourism, research
and education, aquaculture and apiculture;
Indirect Use Values (IUV): shoreline protection, carbon
sequestration and biodiversity, and
Existence Values (EV): which signifies the value of mangroves
in an undamaged state
The study calculated a Total Economic Value (TEV) of USD
1,092/Ha. This was divided as follows: DUV = 20%; IUV = 25%;
and EV = 55%. The Kenya coast has an estimated area of 530 km2 of
mangrove forests and those within the NEC are displayed in Figure
5.29 and Figure 5.38 . The dominant mangrove species in Kenya
include among others:
Rhizophora mucronata (Red mangrove),
Avicennia marina (Grey or white mangrove),
Ceriopstagal (Tagal mangrove), and
Bruguiera gymnorrhiza (Large leafed mangrove or oriental
mangrove).
2. Seagrass Beds
Seagrass beds occur along the entire coastline of Kenya, usually
adjacent to or associated with coral reefs from the inter-tidal zone
down to a depth of 20 m or more. They serve as an important
ENVIRONMENTAL RESOURCES MANAGEMENT JST/MOTI
5-74
habitat for many species and as a sediment trap thus keeping coastal
beaches pristine. Seagrass beds provide a habitat for many species of
fish, octopi and holothurians. Many of these species are of
commercial importance. Seagrass beds are also the feeding grounds
for endangered species such as the green turtle, the hawksbill turtle
and the dugong. Artisanal fishing and commercial trawling
activities often concentrate on seagrass beds.
Thirteen species of seagrass have been recorded in Kenya, none of
which are endemic. These species are in the IUCN Red List wherein
only Zostera capensis is categorized as VU and the other as LC.
However, the most abundant species in Kenya are Cymodocea ciliata
and Thalassia hemprichii which are found mostly on hard substrate
covered to some degree by sand. They root firmly in the substrate
and can withstand high wave action. C. ciliata does not do well in
sheltered creeks away from the open sea. It reaches its maximum
development in locations where it is never exposed by low tides. T.
hemprichii does sometimes occur in sheltered places where it
assumes luxuriant growth and may root to considerable depth. It
becomes stunted in areas where it is uncovered by low tides.
In the reef and the lagoon environment Thalassodendron ciliatum
(Cymodocea ciliata) is the predominant species, forming dense
undersea meadows. Another abundant species is Thalassia
hemprichii. The extensive growth of the above seagrasses constitutes
a substantial part of the biomass found in lagoons, and provides
food and shelter for a variety of organisms. Without the sand
binding effect of these and similar plants the lagoon environment
would not have been habitable for many of the organisms which
now can be found there. It is possible that juveniles of spiny lobsters
are among the animals benefiting from the particular habitats
shaped by these plants.
Seagrass distribution along the Kenyan coast has not been mapped.
UNEP, (1998)2 shows that seagrass beds occur throughout the 600
km-long Kenyan coastline in sheltered tidal flats, lagoons and
creeks, with the exception of the coastal stretch adjoining the Tana
Delta.
3. Invasive Species
According to the Global Invasive Species Database (GISD), Kenya
has documented at least 61 invasive species to present day (2016).
These comprise the 26 animals, 2 bacteria, 2 fungi, 30 plants and 1

ENVIRONMENTAL RESOURCES MANAGEMENT JST/MOTI
5-75
virus listed in Table 5.121. The emergence of invasive species is
considered to be caused by climate change, pollution, poor
agricultural practices or intentional and unintentional introduction1.
These invasive species have caused negative impacts on
biodiversity, agriculture and human development which have
included amongst others:
Loss of capital and income including increasing agricultural
costs,
Loss and reduction of agricultural yields,
Loss of native biodiversity,
Creation of hazards such as birds at airports, and
Loss of pasture.
Table 5.12 Documented Invasive Species in Kenya
Fauna
Mammals Arthropods Coral
Myocastor
coypus (Swamp
Beaver, Coypu
Rat, Coypu Rat,
Nutria, Nutria
Rat)
Cactoblastis cactorum
(Cactus Moth, Prickly
Pear Moth)
Ceratitis capitate
(Meditarranean Fruit
Fly, Medifly)
Gonipterus scutellatus
(Eucalyptus Snout
Beetle, Eucalyptus,
Eucalyptus Weevil)
Orthezia insignis (Croton
Bug, Kew Bug,
Jacaranda Bug, Latana
Blight)
Paratrechina longicornis
(Crazy Ant)
Pheidole megacephala (Big
Headed Ant, Coastal
Brown Ant, Lion Ant,
Brown House Ant)
Procambarus clarkia (Red
Swamp Cray Fish,
Louisiana Cray Fish)
Scyphophorus
acupunctatus (Acapiche
Del Nardo, Agave
Billbug, Agave Snout
Weevil Agave Snout-
Tubastraea coccinea (Colonial
Cup- Coral, Orange–Cup
Coral, Orange-Tube Coral)
Molluscs
Achatina fulica (Giant African
Snail, Giant African Land
Snail, Kalutara Snail)
1 GISD, (2016). Retrieved March 08, 2016 from http://www.iucngisd.org
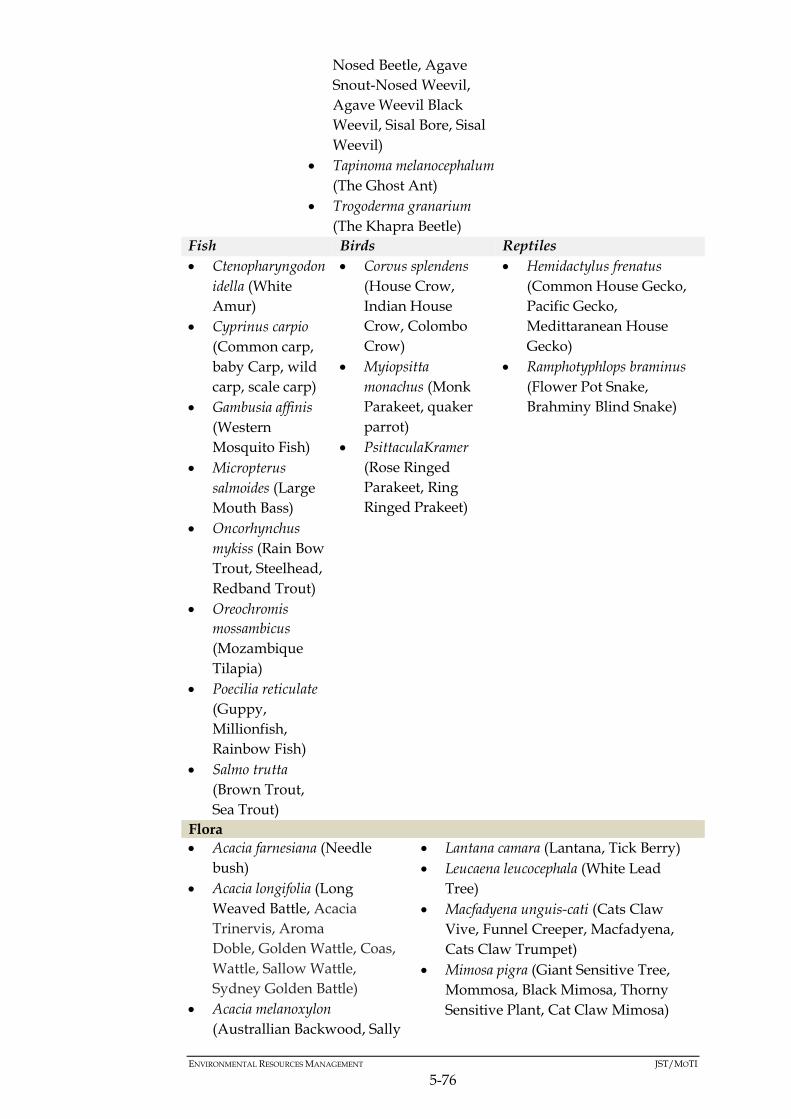
ENVIRONMENTAL RESOURCES MANAGEMENT JST/MOTI
5-76
Nosed Beetle, Agave
Snout-Nosed Weevil,
Agave Weevil Black
Weevil, Sisal Bore, Sisal
Weevil)
Tapinoma melanocephalum
(The Ghost Ant)
Trogoderma granarium
(The Khapra Beetle)
Fish Birds Reptiles
Ctenopharyngodon
idella (White
Amur)
Cyprinus carpio
(Common carp,
baby Carp, wild
carp, scale carp)
Gambusia affinis
(Western
Mosquito Fish)
Micropterus
salmoides (Large
Mouth Bass)
Oncorhynchus
mykiss (Rain Bow
Trout, Steelhead,
Redband Trout)
Oreochromis
mossambicus
(Mozambique
Tilapia)
Poecilia reticulate
(Guppy,
Millionfish,
Rainbow Fish)
Salmo trutta
(Brown Trout,
Sea Trout)
Corvus splendens
(House Crow,
Indian House
Crow, Colombo
Crow)
Myiopsitta
monachus (Monk
Parakeet, quaker
parrot)
PsittaculaKramer
(Rose Ringed
Parakeet, Ring
Ringed Prakeet)
Hemidactylus frenatus
(Common House Gecko,
Pacific Gecko,
Medittaranean House
Gecko)
Ramphotyphlops braminus
(Flower Pot Snake,
Brahminy Blind Snake)
Flora
Acacia farnesiana (Needle
bush)
Acacia longifolia (Long
Weaved Battle, Acacia
Trinervis, Aroma
Doble, Golden Wattle, Coas,
Wattle, Sallow Wattle,
Sydney Golden Battle)
Acacia melanoxylon
(Australlian Backwood, Sally
Lantana camara (Lantana, Tick Berry)
Leucaena leucocephala (White Lead
Tree)
Macfadyena unguis-cati (Cats Claw
Vive, Funnel Creeper, Macfadyena,
Cats Claw Trumpet)
Mimosa pigra (Giant Sensitive Tree,
Mommosa, Black Mimosa, Thorny
Sensitive Plant, Cat Claw Mimosa)

ENVIRONMENTAL RESOURCES MANAGEMENT JST/MOTI
5-77
Wattlr, Light Wood, Hickory)
Acanthophora spicifera (Red
Alga, Boeloeng)
Agave Americana (Century
plant, Maguey, American
Aloe)
Bidens pilosa (Begger Ticks,
Spanish Needle, Black Jack)
Caesalpinia decapetala (Shoofly,
Mauritius, Mysore thorn)
Cenchrus clandestinus (Kikuyu
Grass, West African
Pennisettum)
Cryptostegia madagascariensis
(Madagascar Rubber Vine,
Indian Rubber Vine, Palay
Rubber Vine, Purple
Allamanda)
Cyperus rotundus (Java grass,
nut grass, purple nut sedge,
red nut sedge)
Dalbergia sissoo (Northern
Indian Rose Wood)
Eichhornia crassipes (Water
Hyacinth)
Gracilaria Salicornia (Red
Algae)
Halophila stipulacea
(Halopholla seagrass)
Imperata cylindrical (Blady
grass, Cogon grass)
Physalis peruviana (Cape Goose Berry,
African Ground Cherry)
Prosopis (Honey Mesquite)
Psidium guajava (Guava, Guiaba,
Djamboe)
Rubus niveus (Mysore Raspberry, Hill
Rasp Berry, Caylon Rasp Berry)
Salvelinus fontinalis (Trout, Brook
trout)
Salvinia molesta (Kabira Weed, Giant
Salivinia)
Scaevola sericea (Beach Naupaka, Half
Flowers, Fun Flowers)
Setaria verticillata (Bur Grass, Brstly
Foxtail, Bristle Hooked Grass, Rough
Bristle Grass)
Tradescantia fluminensis (Small Leaf
Spider Wort, Creeping Christian,
Spider Wort, Inch Plant, Wandering
Williwe, Wandering Trad, Water
Spider Wort)
Tradescantia spathacea (Moses in a
Basket, Moses in A Boat, Boastlilly,
Oyster Plant, Three Men in a Boast)
Verbena brasiliensis (Bzazillian
Verbena, Gin Case, Brazillian Vervain)
Bacteria Fungi
Vibrio cholera (Asiatic
Cholera)
Yersinia pestis (Bubonic
Plague)
Batrachochytrium dendrobatidis (Chytrid
Frog Fungi, Chytridiomycosis, Frog
Chytrid Fungus)
Phellinus noxius (Brown Root Rot)
Virus
West Nile Virus
Source: GISD, (2016)1.
5.4.2.1.7 Species of Commercial Value
1. Terrestrial Species
There several species of fauna and flora that are either traded,
produce goods or are part of services that are traded in the NEC,
country and export markets. These are the species of commercial
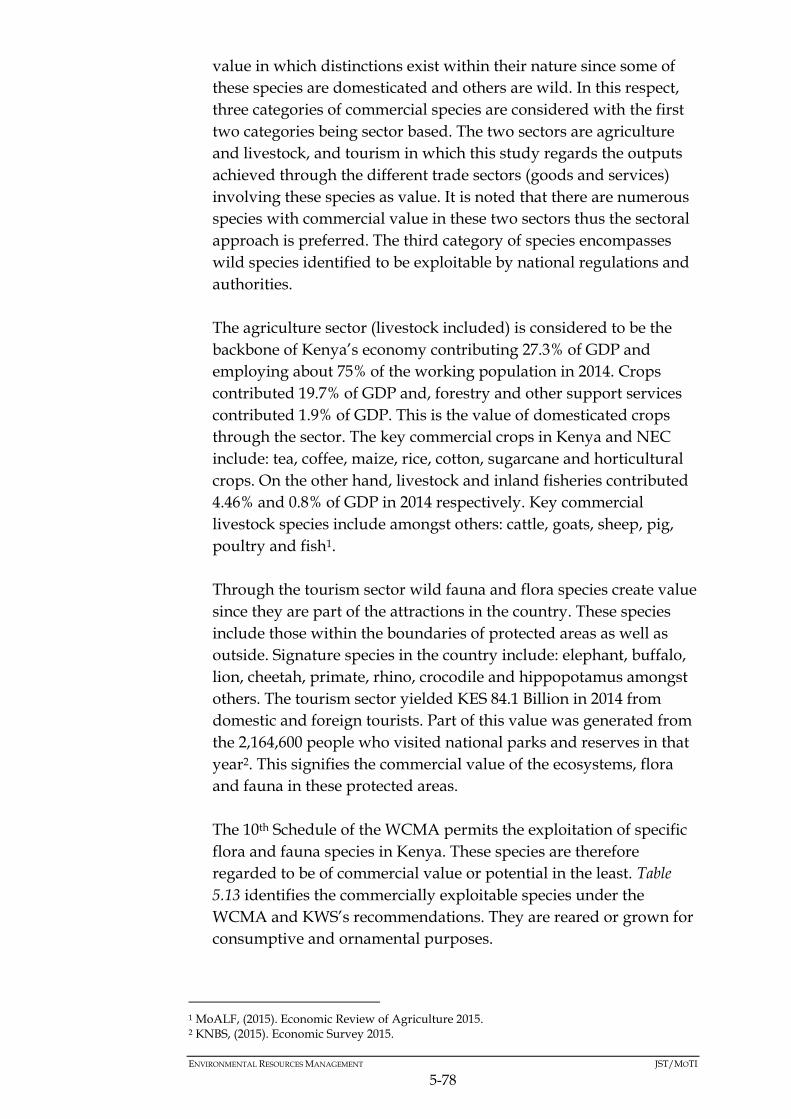
ENVIRONMENTAL RESOURCES MANAGEMENT JST/MOTI
5-78
value in which distinctions exist within their nature since some of
these species are domesticated and others are wild. In this respect,
three categories of commercial species are considered with the first
two categories being sector based. The two sectors are agriculture
and livestock, and tourism in which this study regards the outputs
achieved through the different trade sectors (goods and services)
involving these species as value. It is noted that there are numerous
species with commercial value in these two sectors thus the sectoral
approach is preferred. The third category of species encompasses
wild species identified to be exploitable by national regulations and
authorities.
The agriculture sector (livestock included) is considered to be the
backbone of Kenya’s economy contributing 27.3% of GDP and
employing about 75% of the working population in 2014. Crops
contributed 19.7% of GDP and, forestry and other support services
contributed 1.9% of GDP. This is the value of domesticated crops
through the sector. The key commercial crops in Kenya and NEC
include: tea, coffee, maize, rice, cotton, sugarcane and horticultural
crops. On the other hand, livestock and inland fisheries contributed
4.46% and 0.8% of GDP in 2014 respectively. Key commercial
livestock species include amongst others: cattle, goats, sheep, pig,
poultry and fish1.
Through the tourism sector wild fauna and flora species create value
since they are part of the attractions in the country. These species
include those within the boundaries of protected areas as well as
outside. Signature species in the country include: elephant, buffalo,
lion, cheetah, primate, rhino, crocodile and hippopotamus amongst
others. The tourism sector yielded KES 84.1 Billion in 2014 from
domestic and foreign tourists. Part of this value was generated from
the 2,164,600 people who visited national parks and reserves in that
year2. This signifies the commercial value of the ecosystems, flora
and fauna in these protected areas.
The 10th Schedule of the WCMA permits the exploitation of specific
flora and fauna species in Kenya. These species are therefore
regarded to be of commercial value or potential in the least. Table
5.13 identifies the commercially exploitable species under the
WCMA and KWS’s recommendations. They are reared or grown for
consumptive and ornamental purposes.
1 MoALF, (2015). Economic Review of Agriculture 2015. 2 KNBS, (2015). Economic Survey 2015.
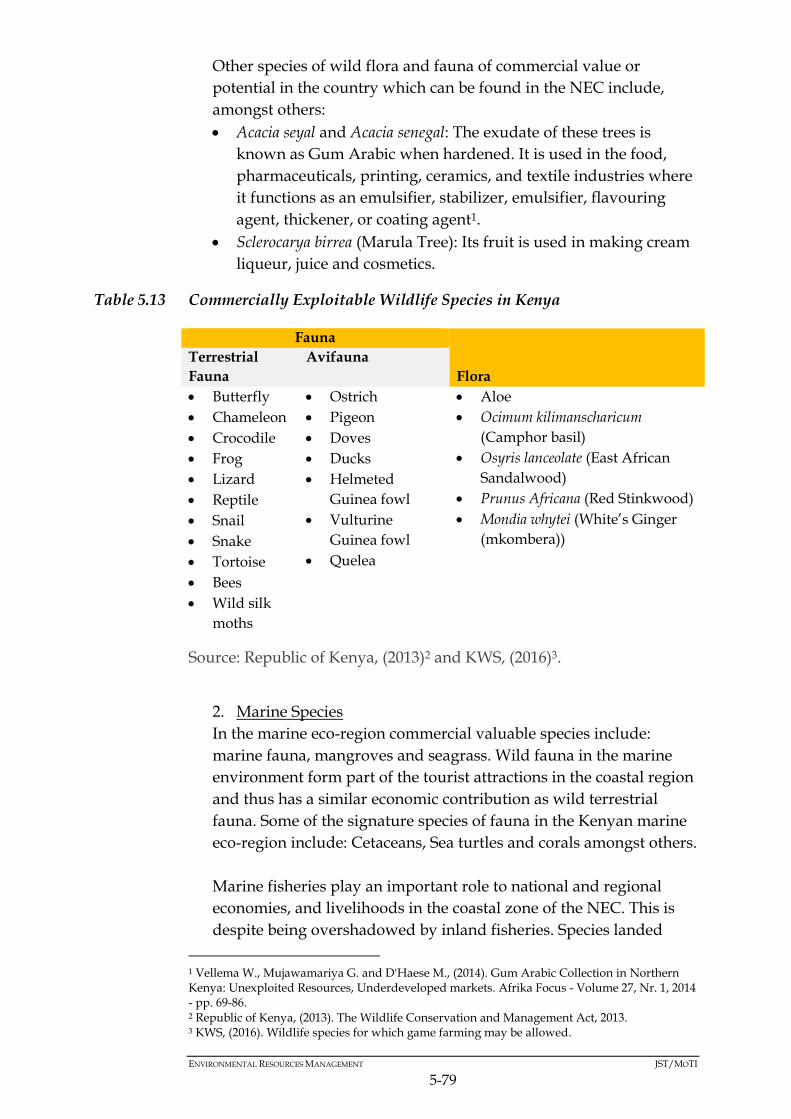
ENVIRONMENTAL RESOURCES MANAGEMENT JST/MOTI
5-79
Other species of wild flora and fauna of commercial value or
potential in the country which can be found in the NEC include,
amongst others:
Acacia seyal and Acacia senegal: The exudate of these trees is
known as Gum Arabic when hardened. It is used in the food,
pharmaceuticals, printing, ceramics, and textile industries where
it functions as an emulsifier, stabilizer, emulsifier, flavouring
agent, thickener, or coating agent1.
Sclerocarya birrea (Marula Tree): Its fruit is used in making cream
liqueur, juice and cosmetics.
Table 5.13 Commercially Exploitable Wildlife Species in Kenya
Fauna
Flora
Terrestrial
Fauna
Avifauna
Butterfly
Chameleon
Crocodile
Frog
Lizard
Reptile
Snail
Snake
Tortoise
Bees
Wild silk
moths
Ostrich
Pigeon
Doves
Ducks
Helmeted
Guinea fowl
Vulturine
Guinea fowl
Quelea
Aloe
Ocimum kilimanscharicum
(Camphor basil)
Osyris lanceolate (East African
Sandalwood)
Prunus Africana (Red Stinkwood)
Mondia whytei (White’s Ginger
(mkombera))
Source: Republic of Kenya, (2013)2 and KWS, (2016)3.
2. Marine Species
In the marine eco-region commercial valuable species include:
marine fauna, mangroves and seagrass. Wild fauna in the marine
environment form part of the tourist attractions in the coastal region
and thus has a similar economic contribution as wild terrestrial
fauna. Some of the signature species of fauna in the Kenyan marine
eco-region include: Cetaceans, Sea turtles and corals amongst others.
Marine fisheries play an important role to national and regional
economies, and livelihoods in the coastal zone of the NEC. This is
despite being overshadowed by inland fisheries. Species landed
1 Vellema W., Mujawamariya G. and D'Haese M., (2014). Gum Arabic Collection in Northern Kenya: Unexploited Resources, Underdeveloped markets. Afrika Focus - Volume 27, Nr. 1, 2014 - pp. 69-86. 2 Republic of Kenya, (2013). The Wildlife Conservation and Management Act, 2013. 3 KWS, (2016). Wildlife species for which game farming may be allowed.

ENVIRONMENTAL RESOURCES MANAGEMENT JST/MOTI
5-80
include: demersals, pelagics, crustaceans, molluscs, and sharks and
rays. It is estimated that marine fisheries contributed 0.44% of
Kenya’s GDP in 2014 [1].
Figure 5.39 displays the trend in value earned from marine fisheries
in Kenya between 2010 and 2014. In addition, ornamental or
aquarium fishing is practised along the coast of Kenya. In 2009, an
estimated 250,000 fish were exported through the trade, primarily
from Kilifi, Shimoni, Shelly beach, Kanamai, Nyali, Diani and
Kikambala. Species involved in this trade include Angelfish,
Anemonefishes, Butterflyfish, Damselfish, Anthiases and Corals1.
Mangroves and seaweed are exploited commercially in the coastal
zone of the NEC. Mangroves trees provide timber used for
construction as part of their DUVs. Seaweed is grown primarily in
the South Coast (Kwale) targeting local and foreign markets. Dried
seaweed extract, carrageenan, is used in the food, cosmetic and
pharmaceutical industries2.
Figure 5.39 Value of Marine Fish Landings 2010-2014
1 Okemwa G., Kimani E., Zamu M., Waiyaki E., Muthama C., Ogutu B., Muturi J., (2011). The Marine Ornamental and Curio trades in the Western Indian Ocean – benefit or threat? KMFRI. 2 Magangi N., Kiema A., Kimanthi A. and Nzioka A., (2011). Development of a Seaweed Nursery for Kappaphycus alvarezi (cottonii) and Eucheuma denticulatum (spinosum) in the South Coast of Kenya. KMFRI.
-
200
400
600
800
1 000
1 200
2010 2011 2012 2013 2014
KES
(1
0⁶)
Value of Marine Species Landed in Kenya 2010-2014
Marine Fish Crustaceans Molluscs

ENVIRONMENTAL RESOURCES MANAGEMENT JST/MOTI
5-81
Box 5.7 Constraints - Biodiversity and Ecosystems
5.4.3 Land Cover
The NEC traverses diverse regions in the country including rural, peri-
urban and urban areas. It intersects Kenya’s primary economic belt
linked by the MR and SGR through the cities and towns of Mombasa,
Nairobi, Nakuru, and Kisumu amongst others. In addition, as noted in
Section 5.4.1 the corridor transects most classes of ecosystems in the
country. Consequently, land cover classes/types in the corridor vary
with the social, environmental and economic characteristics of the
underlying regions.
This study calculates the percentage area occupied in the NEC by the
typical land cover classes used for the MODIS satellite instrument. This
is based on 2012 MODIS data through which it is observed that
grassland, cropland/natural vegetation mosaic, woody savannas and
savannas occupied 39.77%, 23.97%, 10.67% and 9.79% of the NEC
respectively. These land covers occupied the most area, together
comprising 84.2% of the NEC’s area. The least area was occupied by
deciduous and evergreen needleleaf forests (0.0014%). Permanent
wetlands, water, croplands, evergreen broadleaf forests, and urban and
built up areas occupied 0.23%, 4.08%, 3.59%, 3.4% and 0.36% of the
NEC’s area. Figure 5.40 compares the percentage of the total area of
these land cover classes.
Constraints under this topic include the following:
Mangrove forests and gazetted forests including forest reserves.
These provide valuable ecosystem goods and services and are
protected by national regulations.
Ecosystems classified endangered by KWS. Their designation is
evidence of their sensitive nature and part of conservation
strategies. Some are PAs and the implementation of the NEC can
increase the threats and pressures they face.
Protected areas which create a habitat for endangered or threatened
species. These are discussed in Section 5.4.4.
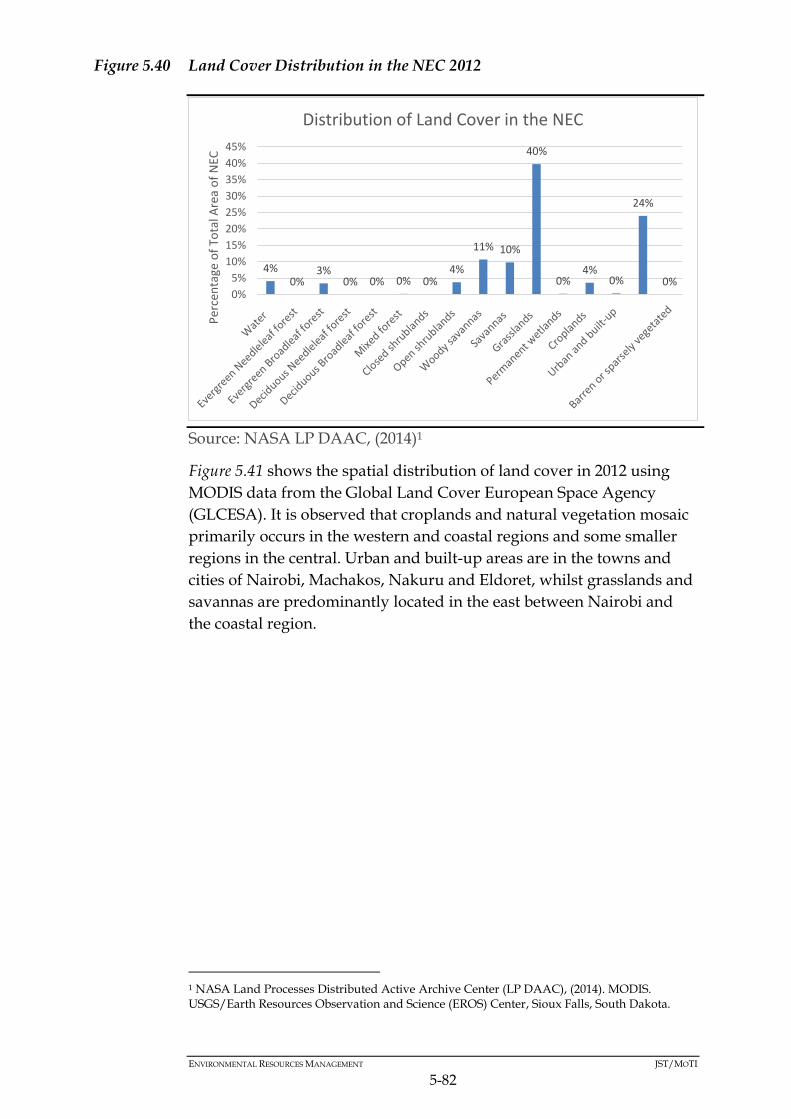
ENVIRONMENTAL RESOURCES MANAGEMENT JST/MOTI
5-82
Figure 5.40 Land Cover Distribution in the NEC 2012
Source: NASA LP DAAC, (2014)1
Figure 5.41 shows the spatial distribution of land cover in 2012 using
MODIS data from the Global Land Cover European Space Agency
(GLCESA). It is observed that croplands and natural vegetation mosaic
primarily occurs in the western and coastal regions and some smaller
regions in the central. Urban and built-up areas are in the towns and
cities of Nairobi, Machakos, Nakuru and Eldoret, whilst grasslands and
savannas are predominantly located in the east between Nairobi and
the coastal region.
1 NASA Land Processes Distributed Active Archive Center (LP DAAC), (2014). MODIS. USGS/Earth Resources Observation and Science (EROS) Center, Sioux Falls, South Dakota.
4% 0%
3% 0% 0% 0% 0%
4%
11% 10%
40%
0% 4%
0%
24%
0% 0%
5%
10%
15%
20%
25%
30%
35%
40%
45%
Per
cen
tage
of
Tota
l Are
a o
f N
EC
Distribution of Land Cover in the NEC

ENVIRONMENTAL RESOURCES MANAGEMENT JST/MOTI
5-83
Figure 5.41 NEC Land Cover 2012
5.4.3.1 Land Suitability/Potential
Land suitability is determined by both environmental and social factors.
The former category of factors limits the type of land uses that can
occur at any land unit whilst the latter which includes tenure systems
often influence the choice of land use. Such choices are largely based on
the value that can be obtained from land with respect to the capacity of
users. Agriculture remains an important land use in the country since it
employs up to 75% of the population. On the contrary, land tenure
systems and demand driven by population growth contributes to
commoditization of land. Often competing interests exist on land units
particularly in urban and high populated areas. This is observed in that
80% of Kenya’s population is supported by the available arable land
and the ASALs support 20% of the population, 50% of livestock and 80-
90% of wildlife1.
Figure 5.42 shows the land potential/suitability of the NEC Counties
generalized from NEMA, (2011)23 into three classes of potentiality. The
original potentiality classes are informed by, rainfall (water
availability), soil, ACZs and AEZs. According to this system, it is
observed that 39% of the land area has high potential, 58% has
moderate potential and 3% is low potential.
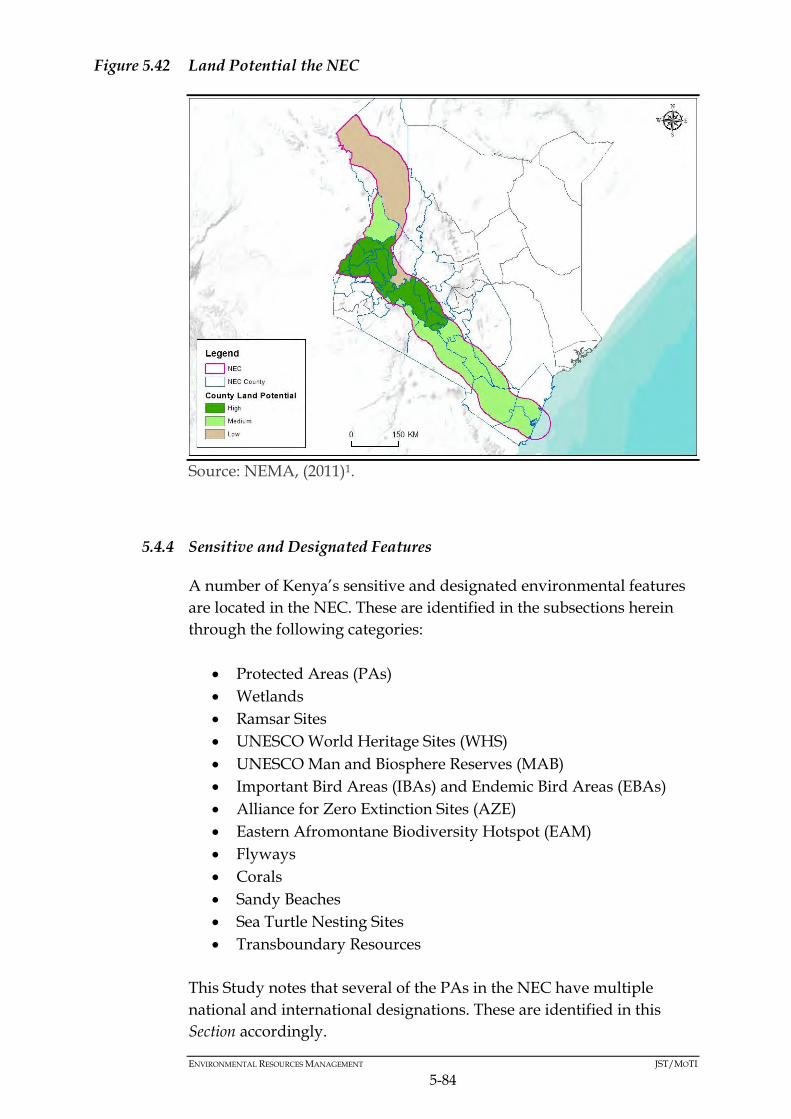
ENVIRONMENTAL RESOURCES MANAGEMENT JST/MOTI
5-84
Figure 5.42 Land Potential the NEC
Source: NEMA, (2011)1.
5.4.4 Sensitive and Designated Features
A number of Kenya’s sensitive and designated environmental features
are located in the NEC. These are identified in the subsections herein
through the following categories:
Protected Areas (PAs)
Wetlands
Ramsar Sites
UNESCO World Heritage Sites (WHS)
UNESCO Man and Biosphere Reserves (MAB)
Important Bird Areas (IBAs) and Endemic Bird Areas (EBAs)
Alliance for Zero Extinction Sites (AZE)
Eastern Afromontane Biodiversity Hotspot (EAM)
Flyways
Corals
Sandy Beaches
Sea Turtle Nesting Sites
Transboundary Resources
This Study notes that several of the PAs in the NEC have multiple
national and international designations. These are identified in this
Section accordingly.

ENVIRONMENTAL RESOURCES MANAGEMENT JST/MOTI
5-85
5.4.4.1 Nationally Protected Areas
Protected Areas cover 14% of Kenya’s surface area and are grouped into
8 conservation areas (CAs) by KWS. The NEC intersects the 7 out of the
8 (CAs) in Kenya namely, Western, Mountain, Tsavo, Southern, Coast,
Central Rift and Eastern conversation areas. These CAs include
Protected Areas (PAs) of economic and ecological significance. This is
because they provide a habitat to some of the species at risk in the
country whilst being fundamental to the tourism sector. The ecological
significance of some of these PAs is evidenced by their international
recognition whereby some are classified as Ramsar Sites, World
Heritage Sites, UNESCO Biosphere Reserves or form part of the EAM.
Economically, these PAs contributed to revenues earned from tourism
even in spite of reduced activity in the sector between 2010 and 2014
(The specific nationally gazetted PAs in the NEC are identified using
data from WDPA (2016) and KWS, (2016)1. A total of 163 PAs are
intersected by the NEC with their typology including:
National Park (NP),
National Reserve (NR),
Marine Protected Area (MPA) (Marine National Park and Marine
National Reserve),
Wildlife Sanctuary (WS),
Forest Reserve (FR), and
Private Conservation Area (PCA) and Community Conservation
Area (CCA) – These include Community Conservancy,
Community Wildlife Sanctuary (CWS), Private Reserve (PR) and
Locally Managed Marine Area.
These PAs are protected by national regulations such as EMCA, WMCA
and the Forest Act. The distribution of their typologies is given in Figure
5.44, in which FRs are the most abundant (128) followed by NPs (10)
and Private Reserves (10).
ENVIRONMENTAL RESOURCES MANAGEMENT JST/MOTI
5-86
Figure 5.43). A total of 1,626,300 tourists visited the PAs in the NEC in
2014.
The specific nationally gazetted PAs in the NEC are identified using
data from WDPA (2016)1 and KWS, (2016)1. A total of 163 PAs are
intersected by the NEC with their typology including:
National Park (NP),
National Reserve (NR),
Marine Protected Area (MPA) (Marine National Park and Marine
National Reserve),
Wildlife Sanctuary (WS),
Forest Reserve (FR), and
Private Conservation Area (PCA) and Community Conservation
Area (CCA) – These include Community Conservancy,
Community Wildlife Sanctuary (CWS), Private Reserve (PR) and
Locally Managed Marine Area.
These PAs are protected by national regulations such as EMCA, WMCA
and the Forest Act. The distribution of their typologies is given in Figure
5.44, in which FRs are the most abundant (128) followed by NPs (10)
and Private Reserves (10).
1 UNEP-WCMC and IUCN, (2016). Protected Areas of Kenya. February 2016.

ENVIRONMENTAL RESOURCES MANAGEMENT JST/MOTI
5-87
Figure 5.43 Visitors to PAs in the NEC 2010-2014 (1)
1 Others include: Arabuko Sokoke, Ol-Donyo Sabuk, Marsabit, Saiwa swamp, Sibiloi, Bamburi,
Chyulu, Ruma National Park, Mwea National Reserve, Central lsland National Park, Kiunga,
Mt. Elgon, Nasolot, Ndere and Kakamega.
0
50
100
150
200
250
300
350
400
450
500
2010 2011 2012 2013 2014
VIS
ITO
RS
('0
00
S)
NEC PAs Visitors 2010-2014
Nairobi Nairobi Safari Walk Nairobi Mini Orphanage
Amboseli Tsavo (West) Tsavo (East)
Aberdare Lake Nakuru Haller's Park
Lake Bogoria Shimba Hills Mombasa Marine
Hell's Gate Mt. Longonot Others
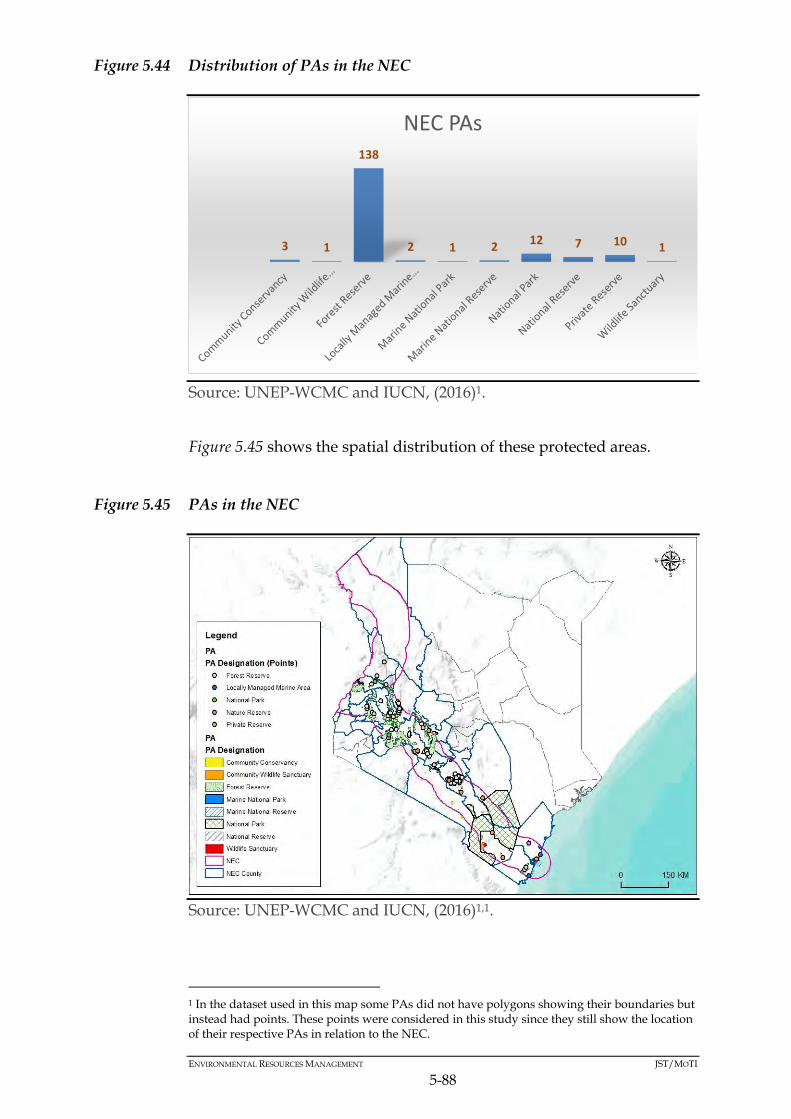
ENVIRONMENTAL RESOURCES MANAGEMENT JST/MOTI
5-88
Figure 5.44 Distribution of PAs in the NEC
Source: UNEP-WCMC and IUCN, (2016)1.
Figure 5.45 shows the spatial distribution of these protected areas.
Figure 5.45 PAs in the NEC
Source: UNEP-WCMC and IUCN, (2016)1,1.
1 In the dataset used in this map some PAs did not have polygons showing their boundaries but instead had points. These points were considered in this study since they still show the location of their respective PAs in relation to the NEC.
3 1
138
2 1 2 12 7 10 1
NEC PAs

ENVIRONMENTAL RESOURCES MANAGEMENT JST/MOTI
5-89
This study is guided by IUCN’s Protected Area Category System in
assessing the sensitivity or significance of the PAs in the NEC. This
system defines the following types to PAs:
Category Ia Strict Nature Reserve: These are strictly PAs set aside
to protect biodiversity and also possibly geological/geomorphic
features, where human visitation, use and impacts are strictly
controlled and limited to ensure protection of the conservation
values. Such PAs can serve as indispensable reference areas for
scientific research and monitoring1.
Category Ib Wilderness Area: These PAs are usually large
unmodified or slightly modified areas, retaining their natural
character and influence without permanent or significant human
habitation, which are protected and managed so as to preserve their
natural condition.
Category II National Park: These PAs are large natural or near
natural areas set aside to protect large-scale ecological processes,
along with the complement of species and ecosystems characteristic
of the area, which also provide a foundation for environmentally
and culturally compatible, spiritual, scientific, educational,
recreational, and visitor opportunities.
Category III Natural Monument or Feature: These are PAs set aside
to protect a specific natural monument, which can be a landform,
sea mount, sub-marine cavern, geological feature such as a cave or
even a living feature such as an ancient grove. They are generally
quite small PAs and often have high visitor value.
Category IV Habitat/Species Management Area: These PAs aim to
protect particular species or habitats and management reflects this
priority. Many Category IV PAs will need regular, active
interventions to address the requirements of particular species or to
maintain habitats, but this is not a requirement of the category.
Category V Protected Landscape / Seascape: This is a PA where the
interaction of people and nature over time has produced an area of
distinct character with significant, ecological, biological, cultural and
scenic value; and where safeguarding the integrity of this interaction
is vital to protecting and sustaining the area and its associated
nature conservation and other values.
1 IUCN, (2014). IUCN Protected Areas Categories System. Retrieved March 09, 2016 from http://www.iucn.org/about/work/programmes/gpap_home/gpap_quality/gpap_pacategories/

ENVIRONMENTAL RESOURCES MANAGEMENT JST/MOTI
5-90
Category VI Protected area with sustainable use of natural
resources: These PAs conserve ecosystems and habitats together
with associated cultural values and traditional natural resource
management systems. Most of these PAs are expansive and natural
condition. A proportion of these PAs are under sustainable natural
resource management, where low-level non-industrial use of natural
resources compatible with nature conservation is seen as one of the
main aims of these areas.
5.4.4.2 National Parks
Ten national parks (NPs) are intersected by NEC. Details of these NPs,
including characteristics and number of species at risk supported, are
provided in Table 5.14 as well as Figure 5.46.
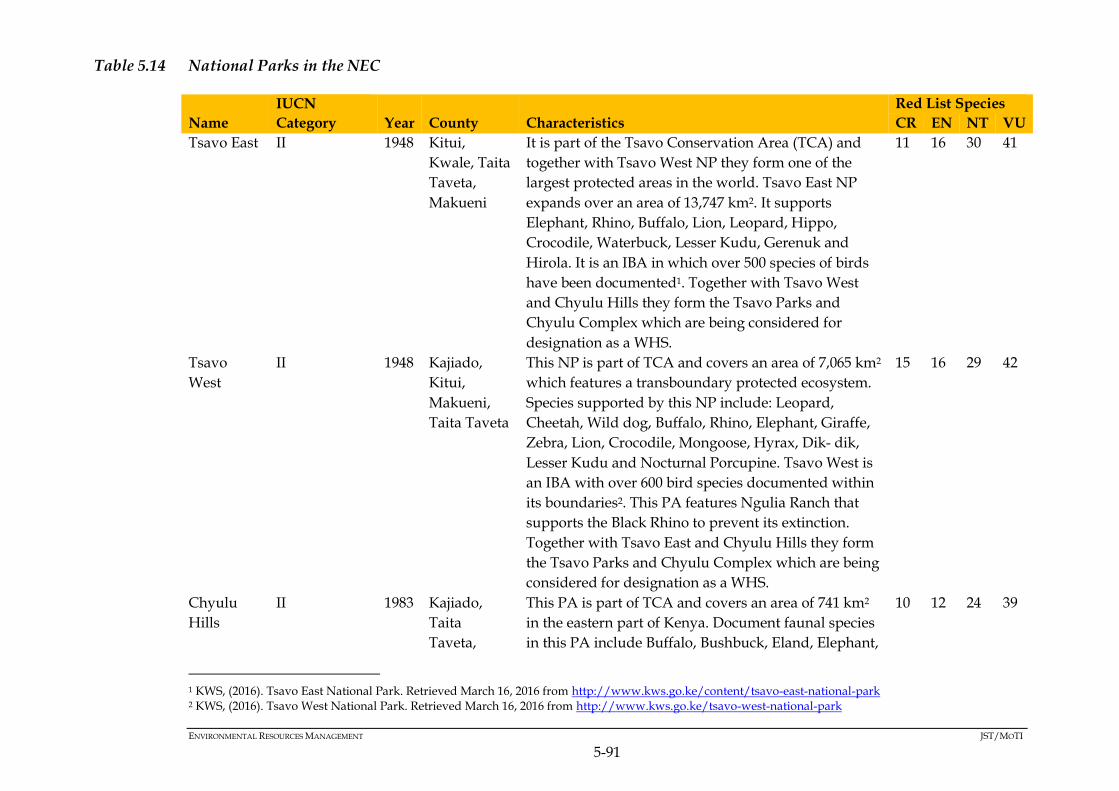
ENVIRONMENTAL RESOURCES MANAGEMENT JST/MOTI
5-91
Table 5.14 National Parks in the NEC
Name
IUCN
Category Year County Characteristics
Red List Species
CR EN NT VU
Tsavo East II 1948 Kitui,
Kwale, Taita
Taveta,
Makueni
It is part of the Tsavo Conservation Area (TCA) and
together with Tsavo West NP they form one of the
largest protected areas in the world. Tsavo East NP
expands over an area of 13,747 km2. It supports
Elephant, Rhino, Buffalo, Lion, Leopard, Hippo,
Crocodile, Waterbuck, Lesser Kudu, Gerenuk and
Hirola. It is an IBA in which over 500 species of birds
have been documented1. Together with Tsavo West
and Chyulu Hills they form the Tsavo Parks and
Chyulu Complex which are being considered for
designation as a WHS.
11 16 30 41
Tsavo
West
II 1948 Kajiado,
Kitui,
Makueni,
Taita Taveta
This NP is part of TCA and covers an area of 7,065 km2
which features a transboundary protected ecosystem.
Species supported by this NP include: Leopard,
Cheetah, Wild dog, Buffalo, Rhino, Elephant, Giraffe,
Zebra, Lion, Crocodile, Mongoose, Hyrax, Dik- dik,
Lesser Kudu and Nocturnal Porcupine. Tsavo West is
an IBA with over 600 bird species documented within
its boundaries2. This PA features Ngulia Ranch that
supports the Black Rhino to prevent its extinction.
Together with Tsavo East and Chyulu Hills they form
the Tsavo Parks and Chyulu Complex which are being
considered for designation as a WHS.
15 16 29 42
Chyulu
Hills
II 1983 Kajiado,
Taita
Taveta,
This PA is part of TCA and covers an area of 741 km2
in the eastern part of Kenya. Document faunal species
in this PA include Buffalo, Bushbuck, Eland, Elephant,
10 12 24 39
1 KWS, (2016). Tsavo East National Park. Retrieved March 16, 2016 from http://www.kws.go.ke/content/tsavo-east-national-park 2 KWS, (2016). Tsavo West National Park. Retrieved March 16, 2016 from http://www.kws.go.ke/tsavo-west-national-park

ENVIRONMENTAL RESOURCES MANAGEMENT JST/MOTI
5-92
Name
IUCN
Category Year County Characteristics
Red List Species
CR EN NT VU
Makueni Leopard, Giant Forest Hogs, Bush Pig, Reedbuck,
Giraffe, Black Mamba, Puff Adder, Rock Python,
Gecko, Tortoise and Lizard1.
Chyulu Hills is also an IBA and a gazetted water
tower which is a Key Biodiversity Area (KBA) of the
EAM. Together with the Tsavo NPs they form the
Tsavo Parks and Chyulu Complex which are being
considered for designation as a WHS.
Nairobi II 1946 Nairobi This PA occupies an area of 117 km2 within Kenya’s
capital city. An estimate 100 mammalian species have
been documented in this PA including African
Buffalo, Baboon, Eastern Black Rhinoceros, Bushnell
Zebra, Cheetah, Coke's Hartebeest, Grant's Gazelle,
Hippopotamus, African Leopard, African Lion,
Thomson's Gazelle, Eland, Impala, Masai Giraffe,
Ostrich, Vulture and Waterbuck among others. It is an
IBA which features at least 400 bird species of which
at least 20 are identified to be European migrants2,3.
Nairobi NP supports the second largest annual
migration of large herbivores (wildebeest and zebra).
The PA features a Rhino sanctuary which breeds the
species to restock other PAs4. Adjacent to the PA is
Nairobi’s animal orphanage and safari walk.
9 16 19 43
Aberdare II 1950 Murang’a, Aberdare NP occupies 765.7 km2 as part of the greater 10 21 29 50
1 KWS, (2016). Chyulu Hills National Park. Retrieved March 16, 2016 http://www.kws.go.ke/content/chyulu-hills-national-park 2 Prins H.; Grootenhuis J.G; Thomas T., (2000). Wildlife Conservation by Sustainable Use. Springer. 3 Trzyna, T., (2014). Urban Protected Areas: Profiles and Best Practice Guidelines. Best Practice Protected Area Guidelines Series No. 22, Gland, Switzerland: IUCN. xiv + 110pp. 4 KWS, (2016). Nairobi National Park. Retrieved March 16, 2016 from http://www.kws.go.ke/parks/nairobi-national-park
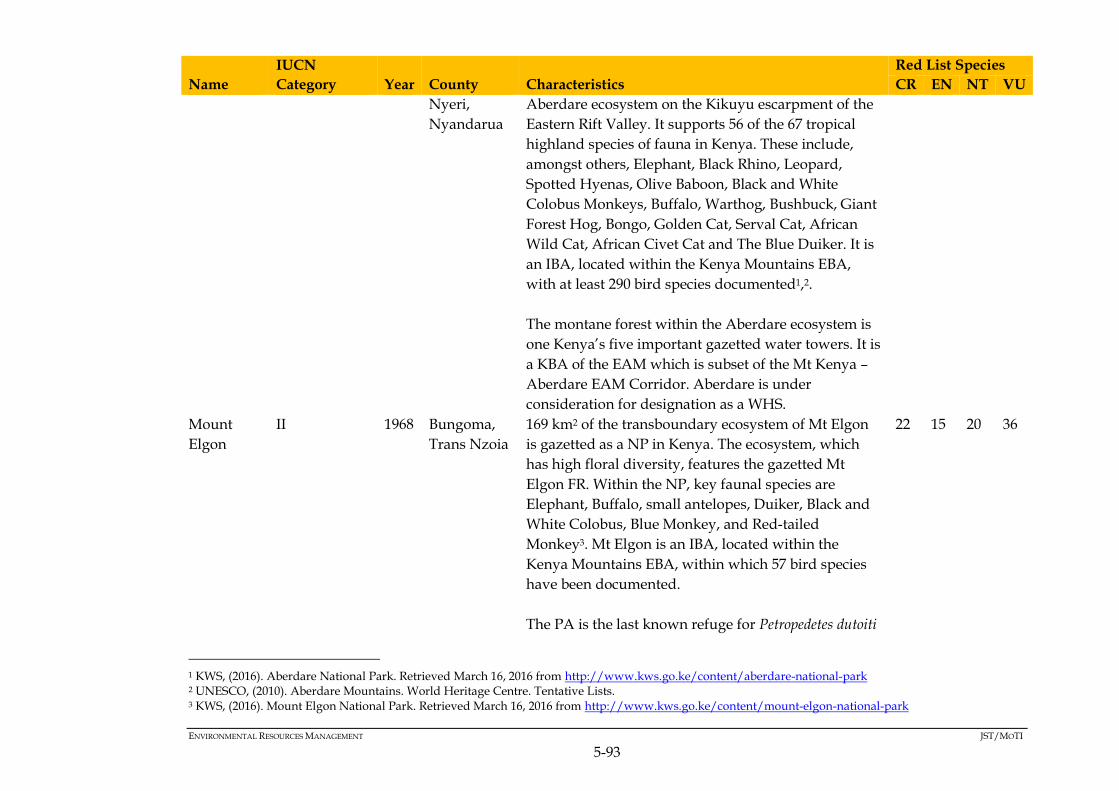
ENVIRONMENTAL RESOURCES MANAGEMENT JST/MOTI
5-93
Name
IUCN
Category Year County Characteristics
Red List Species
CR EN NT VU
Nyeri,
Nyandarua
Aberdare ecosystem on the Kikuyu escarpment of the
Eastern Rift Valley. It supports 56 of the 67 tropical
highland species of fauna in Kenya. These include,
amongst others, Elephant, Black Rhino, Leopard,
Spotted Hyenas, Olive Baboon, Black and White
Colobus Monkeys, Buffalo, Warthog, Bushbuck, Giant
Forest Hog, Bongo, Golden Cat, Serval Cat, African
Wild Cat, African Civet Cat and The Blue Duiker. It is
an IBA, located within the Kenya Mountains EBA,
with at least 290 bird species documented1,2.
The montane forest within the Aberdare ecosystem is
one Kenya’s five important gazetted water towers. It is
a KBA of the EAM which is subset of the Mt Kenya –
Aberdare EAM Corridor. Aberdare is under
consideration for designation as a WHS.
Mount
Elgon
II 1968 Bungoma,
Trans Nzoia
169 km2 of the transboundary ecosystem of Mt Elgon
is gazetted as a NP in Kenya. The ecosystem, which
has high floral diversity, features the gazetted Mt
Elgon FR. Within the NP, key faunal species are
Elephant, Buffalo, small antelopes, Duiker, Black and
White Colobus, Blue Monkey, and Red-tailed
Monkey3. Mt Elgon is an IBA, located within the
Kenya Mountains EBA, within which 57 bird species
have been documented.
The PA is the last known refuge for Petropedetes dutoiti
22 15 20 36
1 KWS, (2016). Aberdare National Park. Retrieved March 16, 2016 from http://www.kws.go.ke/content/aberdare-national-park 2 UNESCO, (2010). Aberdare Mountains. World Heritage Centre. Tentative Lists. 3 KWS, (2016). Mount Elgon National Park. Retrieved March 16, 2016 from http://www.kws.go.ke/content/mount-elgon-national-park

ENVIRONMENTAL RESOURCES MANAGEMENT JST/MOTI
5-94
Name
IUCN
Category Year County Characteristics
Red List Species
CR EN NT VU
(Du Toit's Torrent Frog) (CR) and Otomys barbouri
(Barbours Vlei Rat) (EN), therefore it is a designated
AZE. Moreover, the ecosystem is one of Kenya’s 5
major gazetted water towers. In connection, the
catchment within the ecosystem is a Freshwater KBA
(FWKBA) of the EAM, whilst the montanous
ecosystem is a composite KBA of the EAM. Due to its
uniqueness as a water the ecosystem is also designated
as a UNESCO MAB.
Lake
Nakuru
II 1967 Nakuru This NP measures 118 km2 and provides a habitat for
about 450 species of Greater and Lesser Flamingos. At
least 56 species of mammals have also been
documented in the NP including White Rhino and
Waterbuck. 550 species of flora are known to exist
with the NP including the largest Euphorbia forest in
Africa1.
Due to its support for bird species the NP is an IBA
within the Kenyan Mountains EBA. The lake supports
several endangered species and for this reason it is
designated as a Ramsar Site, in addition to a WHS as
part of the Kenya Lake System in the Rift Valley. It is
also a FWKBA of the EAM.
9 14 16 44
Ol Donyo
Sabuk
II 1967 Machakos Ol Donyo Sabuk NP covers an area of 20.7 km2 which
supports Buffalo, Leopard, Mongoose, Bushbuck,
Olive Baboon, Colobus Monkey, Vervet Monkey,
Sykes' Monkey, Kirk's Dik-Dik, Bush Pig, Common
Duiker, Reedbuck, Rock Hyrax, Bush Baby, Tree and
Ground Squirrel, Aardvark, Porcupine, Python and
9 16 4 30
1 KWS, (2016). Lake Nakuru National Park. Retrieved March 16, 2016 from http://www.kws.go.ke/lake-nakuru-national-park

ENVIRONMENTAL RESOURCES MANAGEMENT JST/MOTI
5-95
Name
IUCN
Category Year County Characteristics
Red List Species
CR EN NT VU
Monitor Lizard. Additionally, over 45 avifaunal
species have been recorded in the NP1.
Hell's Gate II 1984 Nakuru,
Narok
This NP measures 68 km2 in an area beset with
geothermal activity within the Rift Valley. It supports
a range of species including: Giraffe, Eland,
Hartebeest, Buffalo, Gazelles, Antelope, Lion,
Leopard, Cheetah, Klipspringer, Rock Hyrax and
Chanler's Mountain Reedbuck. Avifaunal diversity in
the NP encompasses 103 enumerated species with
notable ones including Vulture, Ragles and Augur
Buzzard. Rare bird species documented in the PA are
the Verreaux's Eagle and the Lammergeyer, Ruppel's
Griffon and Hooded Vultures. The NP is under
consideration for designation as a WHS2.
9 16 21 34
Longonot II 1983 Nakuru Mt Longonot NP occupies 52 km2 in the Rift Valley,
featuring the extinct monolith of Mt Longonot.
Common species observed in the NP are Buffalo,
Eland, Lion, Leopard, Bushbuck, Common Zebra,
Giraffe and Grant’s Gazelles3.
9 14 16 43
1 KWS, (2016). Ol Donyo Sabuk National Park. Retrieved March 16, 2016 from http://www.kws.go.ke/content/ol-donyo-sabuk-national-park 2 UNESCO, (2010). The African Great Rift Valley - Hell’s Gate National Park. World Heritage Centre. Tentative Lists. 3 KWS, (2016). Mount Longonot National Park. Retrieved March 16, 2016 from http://www.kws.go.ke/content/mount-longonot-national-park

ENVIRONMENTAL RESOURCES MANAGEMENT JST/MOTI
5-96
Figure 5.46 National Parks in the NEC
5.4.4.3 National Reserves
Five National Reserves, whose details are provided in Table 5.15
and Figure 5.47, are traversed by the NEC.
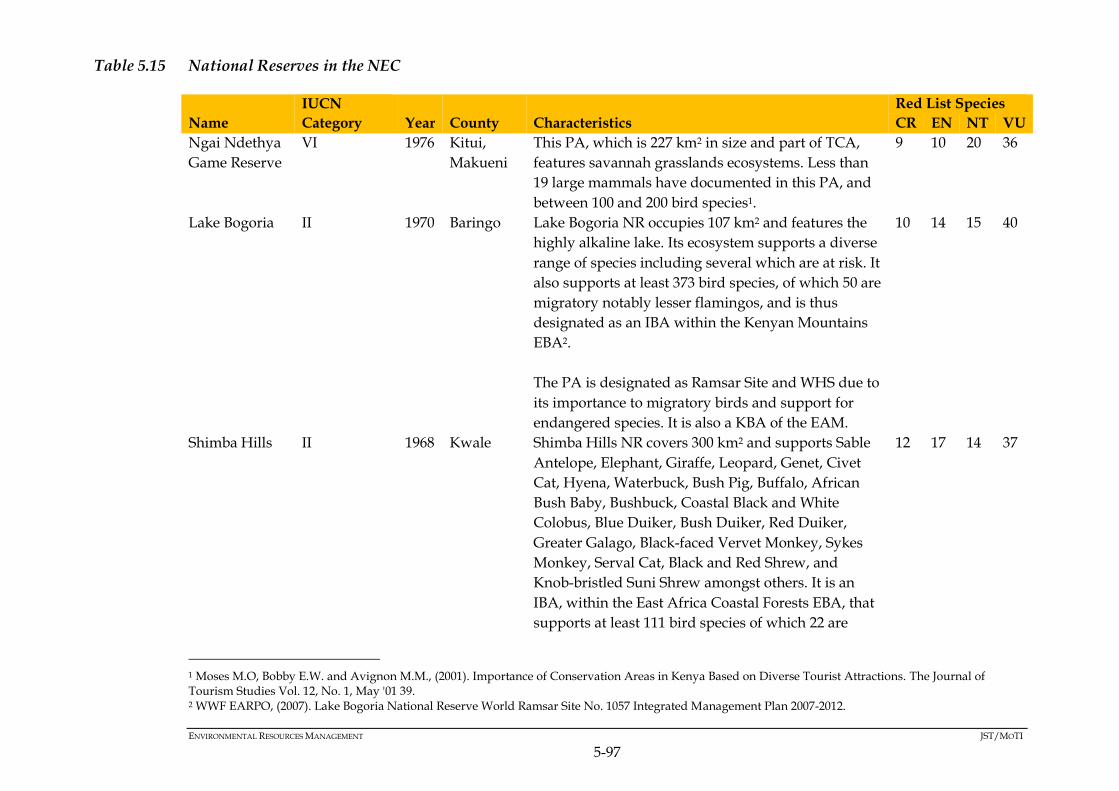
ENVIRONMENTAL RESOURCES MANAGEMENT JST/MOTI
5-97
Table 5.15 National Reserves in the NEC
Name
IUCN
Category Year County Characteristics
Red List Species
CR EN NT VU
Ngai Ndethya
Game Reserve
VI 1976 Kitui,
Makueni
This PA, which is 227 km2 in size and part of TCA,
features savannah grasslands ecosystems. Less than
19 large mammals have documented in this PA, and
between 100 and 200 bird species1.
9 10 20 36
Lake Bogoria II 1970 Baringo Lake Bogoria NR occupies 107 km2 and features the
highly alkaline lake. Its ecosystem supports a diverse
range of species including several which are at risk. It
also supports at least 373 bird species, of which 50 are
migratory notably lesser flamingos, and is thus
designated as an IBA within the Kenyan Mountains
EBA2.
The PA is designated as Ramsar Site and WHS due to
its importance to migratory birds and support for
endangered species. It is also a KBA of the EAM.
10 14 15 40
Shimba Hills II 1968 Kwale Shimba Hills NR covers 300 km2 and supports Sable
Antelope, Elephant, Giraffe, Leopard, Genet, Civet
Cat, Hyena, Waterbuck, Bush Pig, Buffalo, African
Bush Baby, Bushbuck, Coastal Black and White
Colobus, Blue Duiker, Bush Duiker, Red Duiker,
Greater Galago, Black-faced Vervet Monkey, Sykes
Monkey, Serval Cat, Black and Red Shrew, and
Knob-bristled Suni Shrew amongst others. It is an
IBA, within the East Africa Coastal Forests EBA, that
supports at least 111 bird species of which 22 are
12 17 14 37
1 Moses M.O, Bobby E.W. and Avignon M.M., (2001). Importance of Conservation Areas in Kenya Based on Diverse Tourist Attractions. The Journal of Tourism Studies Vol. 12, No. 1, May '01 39. 2 WWF EARPO, (2007). Lake Bogoria National Reserve World Ramsar Site No. 1057 Integrated Management Plan 2007-2012.
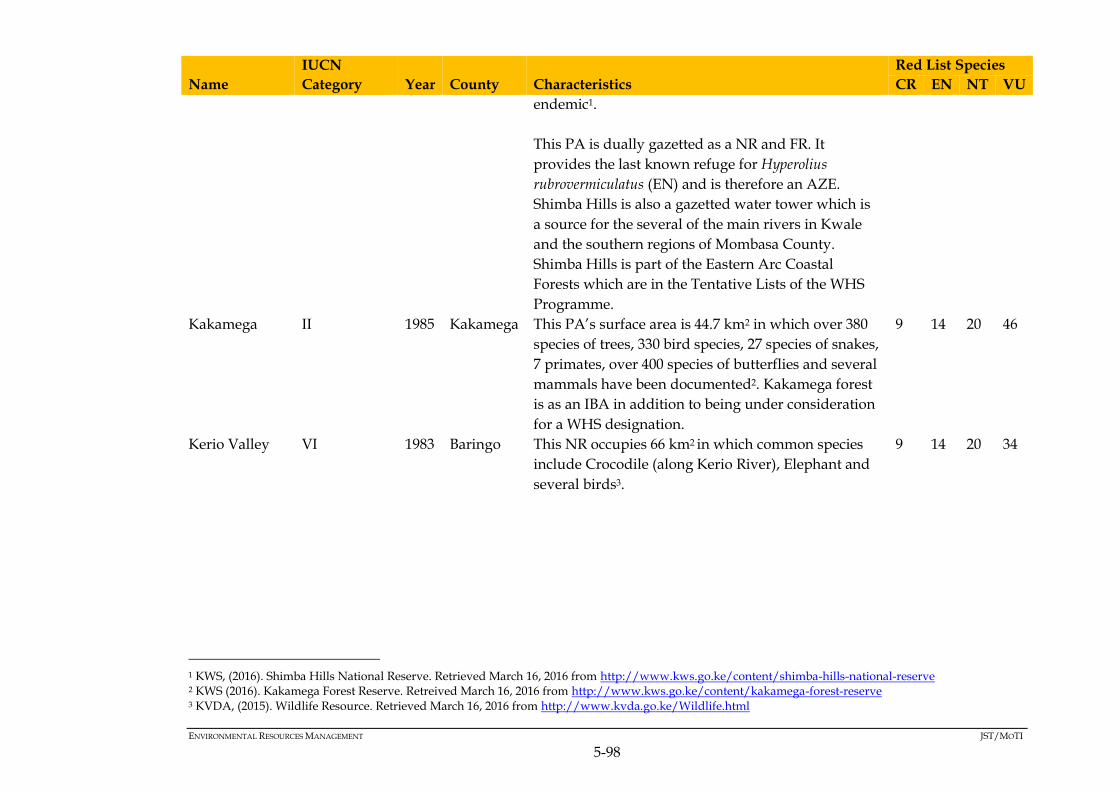
ENVIRONMENTAL RESOURCES MANAGEMENT JST/MOTI
5-98
Name
IUCN
Category Year County Characteristics
Red List Species
CR EN NT VU
endemic1.
This PA is dually gazetted as a NR and FR. It
provides the last known refuge for Hyperolius
rubrovermiculatus (EN) and is therefore an AZE.
Shimba Hills is also a gazetted water tower which is
a source for the several of the main rivers in Kwale
and the southern regions of Mombasa County.
Shimba Hills is part of the Eastern Arc Coastal
Forests which are in the Tentative Lists of the WHS
Programme.
Kakamega II 1985 Kakamega This PA’s surface area is 44.7 km2 in which over 380
species of trees, 330 bird species, 27 species of snakes,
7 primates, over 400 species of butterflies and several
mammals have been documented2. Kakamega forest
is as an IBA in addition to being under consideration
for a WHS designation.
9 14 20 46
Kerio Valley VI 1983 Baringo This NR occupies 66 km2 in which common species
include Crocodile (along Kerio River), Elephant and
several birds3.
9 14 20 34
1 KWS, (2016). Shimba Hills National Reserve. Retrieved March 16, 2016 from http://www.kws.go.ke/content/shimba-hills-national-reserve 2 KWS (2016). Kakamega Forest Reserve. Retreived March 16, 2016 from http://www.kws.go.ke/content/kakamega-forest-reserve 3 KVDA, (2015). Wildlife Resource. Retrieved March 16, 2016 from http://www.kvda.go.ke/Wildlife.html
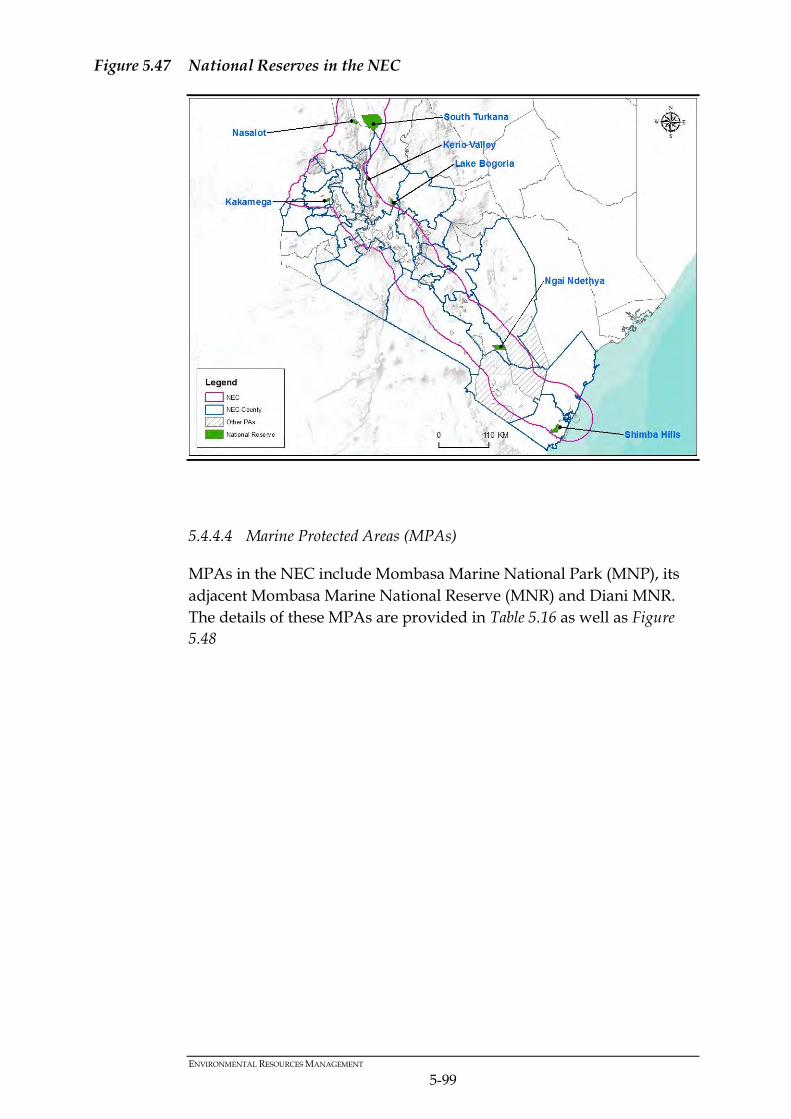
ENVIRONMENTAL RESOURCES MANAGEMENT
5-99
Figure 5.47 National Reserves in the NEC
5.4.4.4 Marine Protected Areas (MPAs)
MPAs in the NEC include Mombasa Marine National Park (MNP), its
adjacent Mombasa Marine National Reserve (MNR) and Diani MNR.
The details of these MPAs are provided in Table 5.16 as well as Figure
5.48

Table 5.16 MPAs in the NEC
Name
IUCN
Category Year County Characteristics
Red List Species
CR EN NT VU
Mombasa
MNP
II 1986 Mombasa This MNP occupies an area of approx. 10 km2, located off
the coast of Mombasa County. It features sea grasses and
marine algae in terms of vegetation. Marine life includes
crabs, corals, sea urchins, jellyfish, sea stars, sea
cucumbers and different varieties of coral species
comprising of Acropora, Turbinaria and Porites. Seabirds
are also present in large nesting colonies and
internationally significant number of crab plover and
roseate tern1.
9 9 46 85
Mombasa
MNR
VI 1986 Mombasa This reserve surrounds Mombasa MNP and stretches
over an area of about 194 km2. It shares similar
characteristic vegetation, marine life and birds as
Mombasa MNP described above1.
3 4 44 66
Diani-Chale
MNR
VI 1995 Kwale Diani-Chale MNR covers approx. 107 km2 off the coast
Kwale County. It was designated as a MNR to protect its
coral reef, coral gardens and fish species2. The diversity
of the fish species comprises at least 350 species3.
13 11 56 105
1 KWS, (2016). Mombasa Marine National Park and Reserve. Retrieved March 16, 2016 from http://www.kws.go.ke/content/mombasa-marine-national-park-reserve 2 Kenya County Guide, (2015). Diani/Chale Marine National Park and Reserve. Retrieved March 16, 2016 from http://kenyacountyguide.com/home/dianichale-marine-national-park-and-reserve/ 3 Muthiga N.A., Kawaka J., (2010). Progress Towards Conservation Science for Marine Protected Areas in Kenya: An Annotated Bibliography. WIOMSA Book Series No. 4, v + 171.
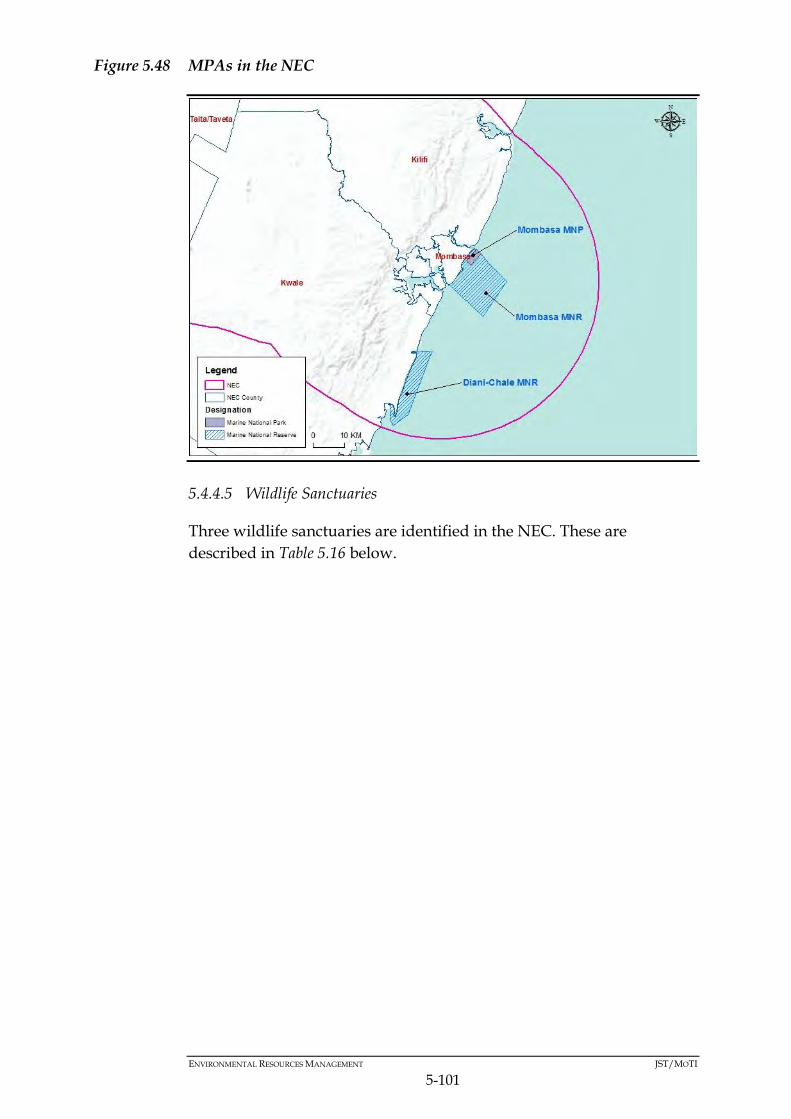
ENVIRONMENTAL RESOURCES MANAGEMENT JST/MOTI
5-101
Figure 5.48 MPAs in the NEC
5.4.4.5 Wildlife Sanctuaries
Three wildlife sanctuaries are identified in the NEC. These are
described in Table 5.16 below.
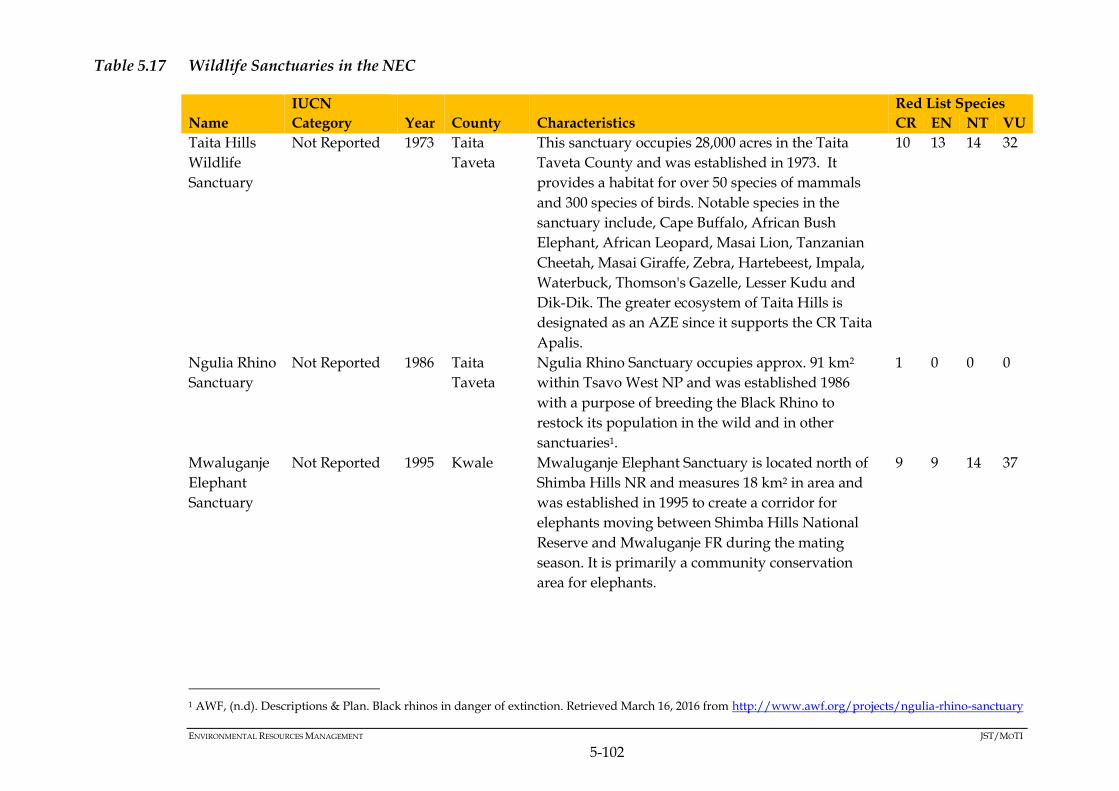
ENVIRONMENTAL RESOURCES MANAGEMENT JST/MOTI
5-102
Table 5.17 Wildlife Sanctuaries in the NEC
Name
IUCN
Category Year County Characteristics
Red List Species
CR EN NT VU
Taita Hills
Wildlife
Sanctuary
Not Reported 1973 Taita
Taveta
This sanctuary occupies 28,000 acres in the Taita
Taveta County and was established in 1973. It
provides a habitat for over 50 species of mammals
and 300 species of birds. Notable species in the
sanctuary include, Cape Buffalo, African Bush
Elephant, African Leopard, Masai Lion, Tanzanian
Cheetah, Masai Giraffe, Zebra, Hartebeest, Impala,
Waterbuck, Thomson's Gazelle, Lesser Kudu and
Dik-Dik. The greater ecosystem of Taita Hills is
designated as an AZE since it supports the CR Taita
Apalis.
10 13 14 32
Ngulia Rhino
Sanctuary
Not Reported 1986 Taita
Taveta
Ngulia Rhino Sanctuary occupies approx. 91 km2
within Tsavo West NP and was established 1986
with a purpose of breeding the Black Rhino to
restock its population in the wild and in other
sanctuaries1.
1 0 0 0
Mwaluganje
Elephant
Sanctuary
Not Reported 1995 Kwale Mwaluganje Elephant Sanctuary is located north of
Shimba Hills NR and measures 18 km2 in area and
was established in 1995 to create a corridor for
elephants moving between Shimba Hills National
Reserve and Mwaluganje FR during the mating
season. It is primarily a community conservation
area for elephants.
9 9 14 37
1 AWF, (n.d). Descriptions & Plan. Black rhinos in danger of extinction. Retrieved March 16, 2016 from http://www.awf.org/projects/ngulia-rhino-sanctuary
ENVIRONMENTAL RESOURCES MANAGEMENT JST/MOTI
5-103
5.4.4.6 Forest Reserves (FRs)
There are 138 FRs intersected by the NEC Table 5.17 and Figure 5.49 identify them according to the regions or wider ecosystems in which they belong. They are important ecosystems which are protected by national regulations and some these FRs have globally recognized designations. The forests within their boundaries provide important ecosystem goods and services including, carbon sequestration, flood mitigation, soil erosion prevention, provision of goods (food, wood fuel, water - some of the FRs are water towers (see Section 5.3.4)), provision of habitat for wild fauna and avifauna and climate modulation.

ENVIRONMENTAL RESOURCES MANAGEMENT JST/MOTI
5-104
Table 5.18 Forest Reserves in the NEC
Region/Ecosystem Forest Reserves Counties Characteristics
Red List Species
CR EN VU NT
Coastal Zone
(East African
Coastal Forests)
Shimba Hills, Mkongani North,
Mkongani West, Gogoni, Buda
and Mwachi and Mwaluganje.
Kwale These FRs are part of the Eastern
Africa Coastal Forests. Shimba
Hills, Mkongani North, Mkongani
West and Mwaluganje are part of
the Shimba Hills water tower. The
wider ecosystem of the coastal
forests is part of the habitat of:
Diceros bicornis (Black Rhino) (CR),
Loxodonta africana (Savanna
Elephant) (EN), Lycaon pictus
(Wild dog) (EN) and Hyperolius
rubrovermiculatus (EN)1.
The Shimba Hills forests,
including Mkongani forests, have
a heterogeneous mosaic of
vegetation, including grassland,
scrub and exotic plantations as
well as forest. Six major forest
types have been documented,
including tall Milicia forest on the
deep soils on the plateau top (in
Longomagandi and Makadara
forests, and near Kwale town),
and on the western escarpment;
Afzelia–Erythrophloeum forest,
covering much of the eastern and
12 14 14 37
1 TFCG, (2006). Coastal Forests of Kenya and Tanzania. Retrieved March 10, 2016 from http://coastalforests.tfcg.org/index.html
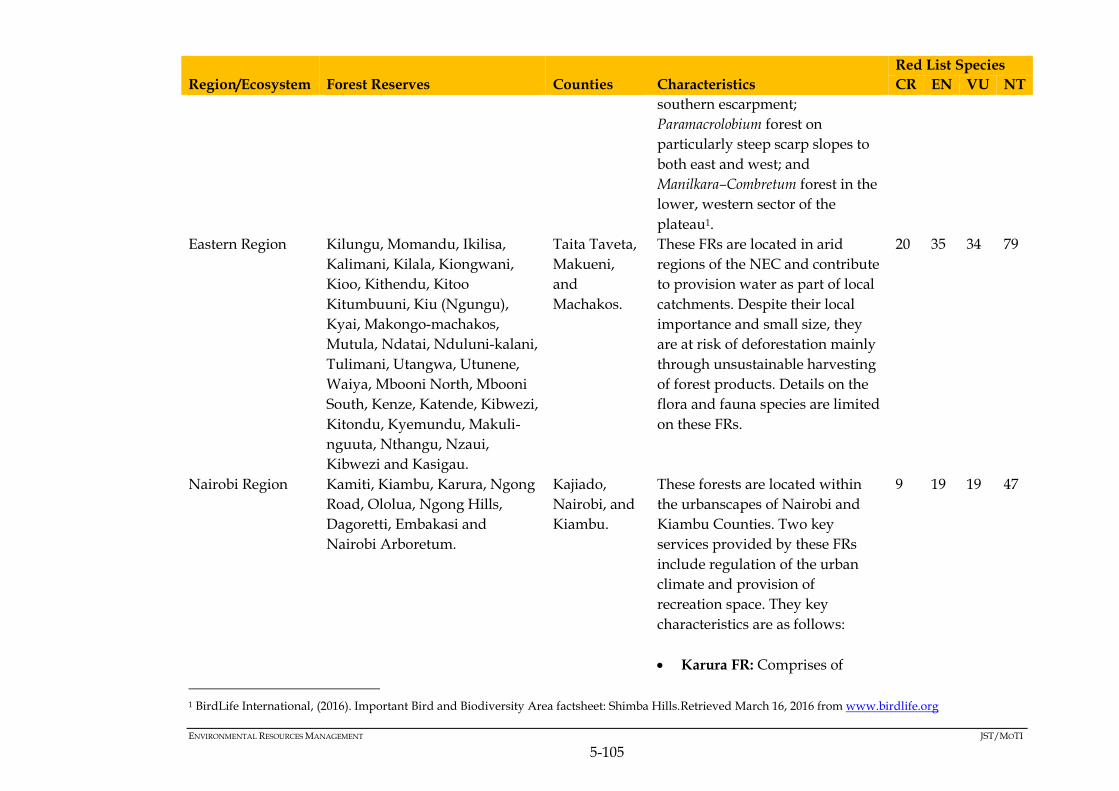
ENVIRONMENTAL RESOURCES MANAGEMENT JST/MOTI
5-105
Region/Ecosystem Forest Reserves Counties Characteristics
Red List Species
CR EN VU NT
southern escarpment;
Paramacrolobium forest on
particularly steep scarp slopes to
both east and west; and
Manilkara–Combretum forest in the
lower, western sector of the
plateau1.
Eastern Region Kilungu, Momandu, Ikilisa,
Kalimani, Kilala, Kiongwani,
Kioo, Kithendu, Kitoo
Kitumbuuni, Kiu (Ngungu),
Kyai, Makongo-machakos,
Mutula, Ndatai, Nduluni-kalani,
Tulimani, Utangwa, Utunene,
Waiya, Mbooni North, Mbooni
South, Kenze, Katende, Kibwezi,
Kitondu, Kyemundu, Makuli-
nguuta, Nthangu, Nzaui,
Kibwezi and Kasigau.
Taita Taveta,
Makueni,
and
Machakos.
These FRs are located in arid
regions of the NEC and contribute
to provision water as part of local
catchments. Despite their local
importance and small size, they
are at risk of deforestation mainly
through unsustainable harvesting
of forest products. Details on the
flora and fauna species are limited
on these FRs.
20 35 34 79
Nairobi Region Kamiti, Kiambu, Karura, Ngong
Road, Ololua, Ngong Hills,
Dagoretti, Embakasi and
Nairobi Arboretum.
Kajiado,
Nairobi, and
Kiambu.
These forests are located within
the urbanscapes of Nairobi and
Kiambu Counties. Two key
services provided by these FRs
include regulation of the urban
climate and provision of
recreation space. They key
characteristics are as follows:
Karura FR: Comprises of
9 19 19 47
1 BirdLife International, (2016). Important Bird and Biodiversity Area factsheet: Shimba Hills.Retrieved March 16, 2016 from www.birdlife.org
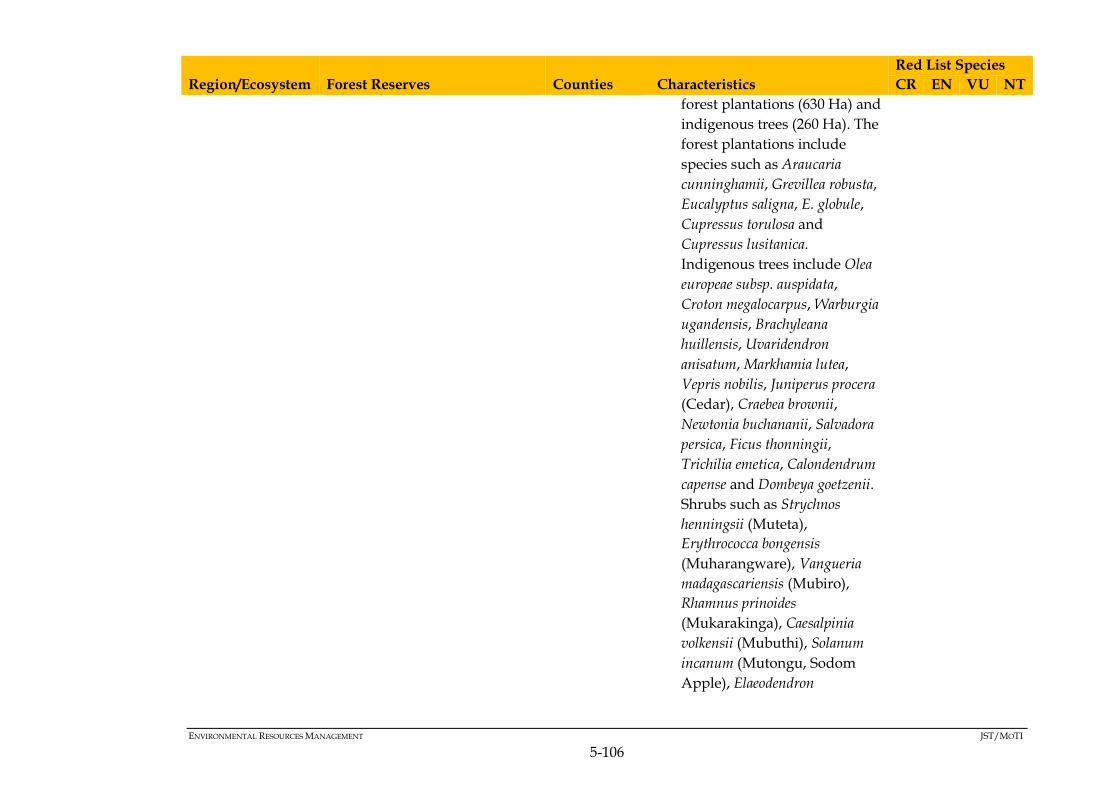
ENVIRONMENTAL RESOURCES MANAGEMENT JST/MOTI
5-106
Region/Ecosystem Forest Reserves Counties Characteristics
Red List Species
CR EN VU NT
forest plantations (630 Ha) and
indigenous trees (260 Ha). The
forest plantations include
species such as Araucaria
cunninghamii, Grevillea robusta,
Eucalyptus saligna, E. globule,
Cupressus torulosa and
Cupressus lusitanica.
Indigenous trees include Olea
europeae subsp. auspidata,
Croton megalocarpus, Warburgia
ugandensis, Brachyleana
huillensis, Uvaridendron
anisatum, Markhamia lutea,
Vepris nobilis, Juniperus procera
(Cedar), Craebea brownii,
Newtonia buchananii, Salvadora
persica, Ficus thonningii,
Trichilia emetica, Calondendrum
capense and Dombeya goetzenii.
Shrubs such as Strychnos
henningsii (Muteta),
Erythrococca bongensis
(Muharangware), Vangueria
madagascariensis (Mubiro),
Rhamnus prinoides
(Mukarakinga), Caesalpinia
volkensii (Mubuthi), Solanum
incanum (Mutongu, Sodom
Apple), Elaeodendron
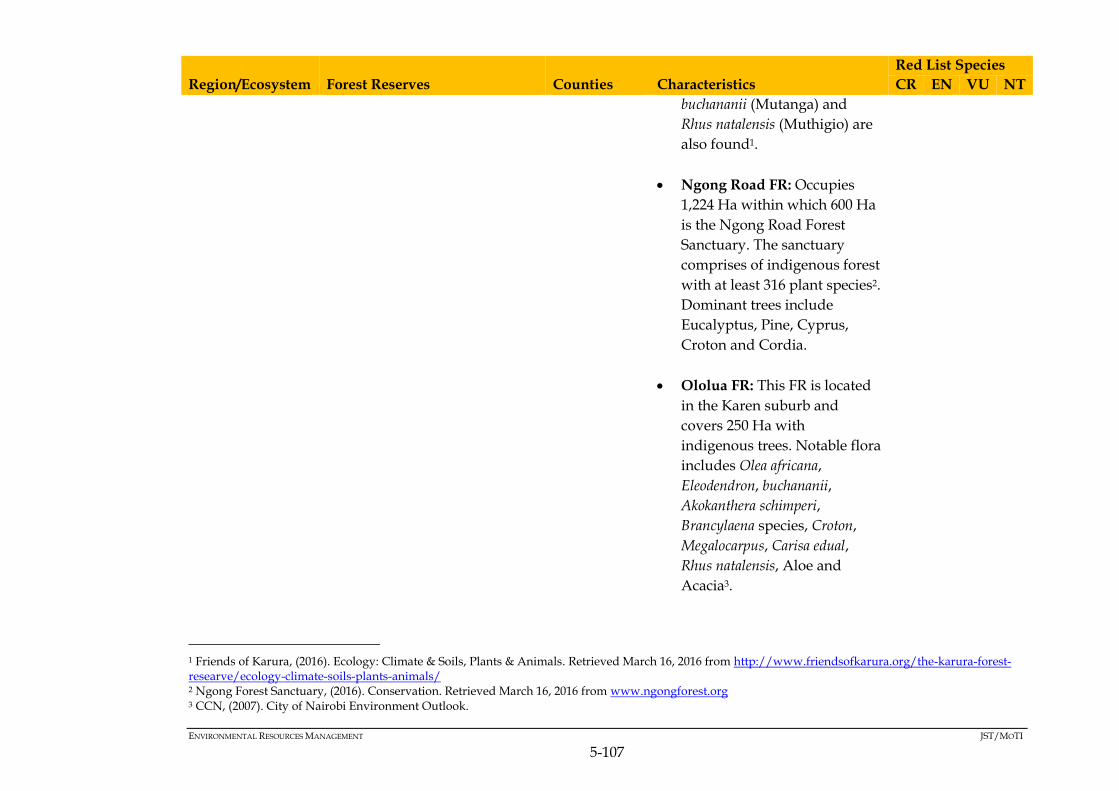
ENVIRONMENTAL RESOURCES MANAGEMENT JST/MOTI
5-107
Region/Ecosystem Forest Reserves Counties Characteristics
Red List Species
CR EN VU NT
buchananii (Mutanga) and
Rhus natalensis (Muthigio) are
also found1.
Ngong Road FR: Occupies
1,224 Ha within which 600 Ha
is the Ngong Road Forest
Sanctuary. The sanctuary
comprises of indigenous forest
with at least 316 plant species2.
Dominant trees include
Eucalyptus, Pine, Cyprus,
Croton and Cordia.
Ololua FR: This FR is located
in the Karen suburb and
covers 250 Ha with
indigenous trees. Notable flora
includes Olea africana,
Eleodendron, buchananii,
Akokanthera schimperi,
Brancylaena species, Croton,
Megalocarpus, Carisa edual,
Rhus natalensis, Aloe and
Acacia3.
1 Friends of Karura, (2016). Ecology: Climate & Soils, Plants & Animals. Retrieved March 16, 2016 from http://www.friendsofkarura.org/the-karura-forest-researve/ecology-climate-soils-plants-animals/ 2 Ngong Forest Sanctuary, (2016). Conservation. Retrieved March 16, 2016 from www.ngongforest.org 3 CCN, (2007). City of Nairobi Environment Outlook.

ENVIRONMENTAL RESOURCES MANAGEMENT JST/MOTI
5-108
Region/Ecosystem Forest Reserves Counties Characteristics
Red List Species
CR EN VU NT
Nairobi Arboretum: Extends
over 30 Ha and holds over 350
tree species. It was established
in 1907 to reduce pressure on
indigenous tree species during
the construction of the East
Africa Railway and was later
gazetted in 19371. Nairobi
Arboretum provides a habitat
to over 100 species of resident
and migrant birds. Notable
mammals in the Arboretum
are Vervet and Sykes
monkeys.
Kikuyu
Escarpment and
Aberdares
Ecosystem
Nyamweru, Kingatua, Muguga,
Aberdare, Kikuyu Escarpment,
Magumo North, Magumo
South, Kirima, Muruai, Kipipiri
and Ol-bolossat.
Kiambu,
Nyandarua,
Murang’a,
Laikipia and
Nyeri.
These FRs are located within the
Central Highlands along the
Kikuyu Escarpment of the Eastern
Rift Valley. The key characteristics
of the main FRs in this region are
provided below.
Aberdare FR: This FR largely
surrounds Aberadare NP and
is adjacent to Kikuyu
Escarpment FR (south) and
Kipipiri FR (west). It measures
approx. 947 km2. Within the
forest a total of 778 species,
sub-species and varieties of
21 39 51 94
1 Nature Kenya, (n.d). Nairobi Arboretum. Retrieved March 16, 2016 from http://www.naturekenya.org/content/nairobi-arboretum

ENVIRONMENTAL RESOURCES MANAGEMENT JST/MOTI
5-109
Region/Ecosystem Forest Reserves Counties Characteristics
Red List Species
CR EN VU NT
vascular plants belonging to
421 genera and 128 families,
have been documented. It has
four key vegetative zones
whose distribution
determined by climatic
conditions and altitude. These
are: Sub alpine vegetation,
Montane humid forest,
Xeromorphic evergreen forest,
and Sub-montane forest1.
Kikuyu Escarpment FR: This
FR occupies an area of 413
km2, south of Aberdare FR.
The forest comprises of mixed
montane forest with its major
block having a closed canopy
whilst other habitats in the FR
include forest and agro-
industrial plantations, and
savanna bamboo montane
vegetation2.
Ol-bolossat FR: It is located to
the north east of Aberdare FR
and covers an area of about 32
km2. Its vegetation types rage
amongst natural forest,
1 KFS, (2010). Aberdare Forest Reserve Management Plan. 2 BirdLife International, (2016). Important Bird and Biodiversity Area factsheet: Kikuyu Escarpment Forest. Retrieved March 16, 2016 from www.birdlife.org.
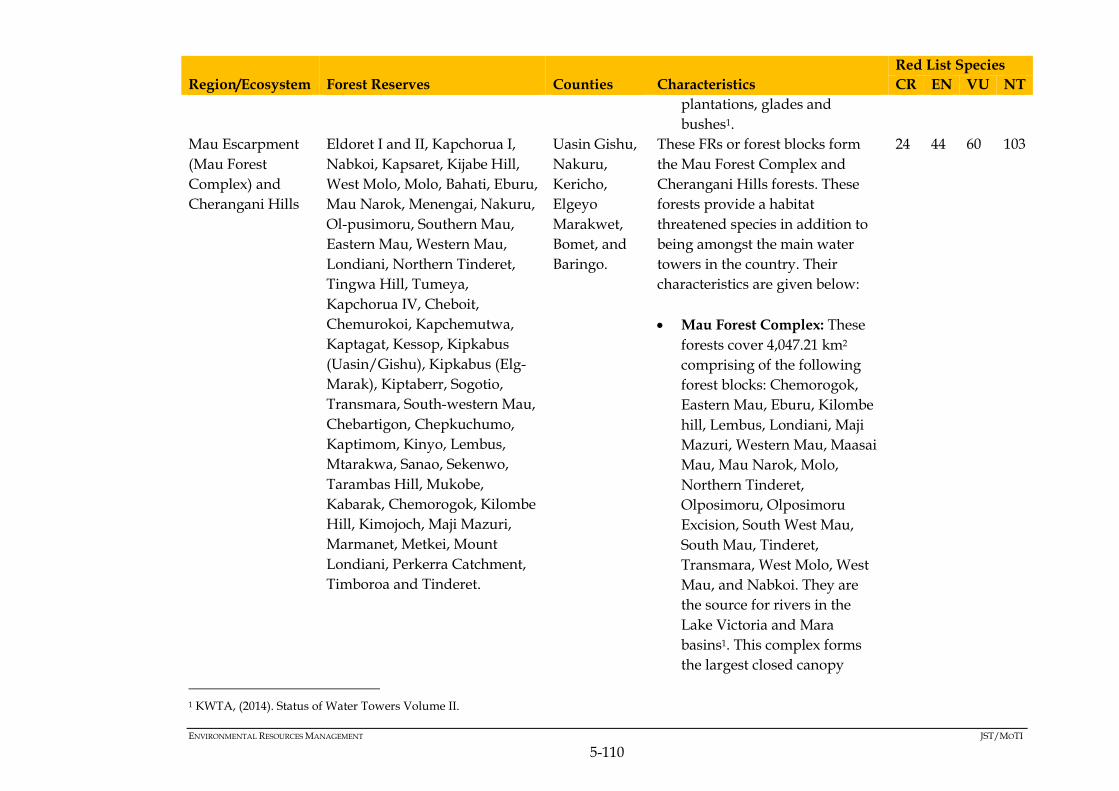
ENVIRONMENTAL RESOURCES MANAGEMENT JST/MOTI
5-110
Region/Ecosystem Forest Reserves Counties Characteristics
Red List Species
CR EN VU NT
plantations, glades and
bushes1.
Mau Escarpment
(Mau Forest
Complex) and
Cherangani Hills
Eldoret I and II, Kapchorua I,
Nabkoi, Kapsaret, Kijabe Hill,
West Molo, Molo, Bahati, Eburu,
Mau Narok, Menengai, Nakuru,
Ol-pusimoru, Southern Mau,
Eastern Mau, Western Mau,
Londiani, Northern Tinderet,
Tingwa Hill, Tumeya,
Kapchorua IV, Cheboit,
Chemurokoi, Kapchemutwa,
Kaptagat, Kessop, Kipkabus
(Uasin/Gishu), Kipkabus (Elg-
Marak), Kiptaberr, Sogotio,
Transmara, South-western Mau,
Chebartigon, Chepkuchumo,
Kaptimom, Kinyo, Lembus,
Mtarakwa, Sanao, Sekenwo,
Tarambas Hill, Mukobe,
Kabarak, Chemorogok, Kilombe
Hill, Kimojoch, Maji Mazuri,
Marmanet, Metkei, Mount
Londiani, Perkerra Catchment,
Timboroa and Tinderet.
Uasin Gishu,
Nakuru,
Kericho,
Elgeyo
Marakwet,
Bomet, and
Baringo.
These FRs or forest blocks form
the Mau Forest Complex and
Cherangani Hills forests. These
forests provide a habitat
threatened species in addition to
being amongst the main water
towers in the country. Their
characteristics are given below:
Mau Forest Complex: These
forests cover 4,047.21 km2
comprising of the following
forest blocks: Chemorogok,
Eastern Mau, Eburu, Kilombe
hill, Lembus, Londiani, Maji
Mazuri, Western Mau, Maasai
Mau, Mau Narok, Molo,
Northern Tinderet,
Olposimoru, Olposimoru
Excision, South West Mau,
South Mau, Tinderet,
Transmara, West Molo, West
Mau, and Nabkoi. They are
the source for rivers in the
Lake Victoria and Mara
basins1. This complex forms
the largest closed canopy
24 44 60 103
1 KWTA, (2014). Status of Water Towers Volume II.
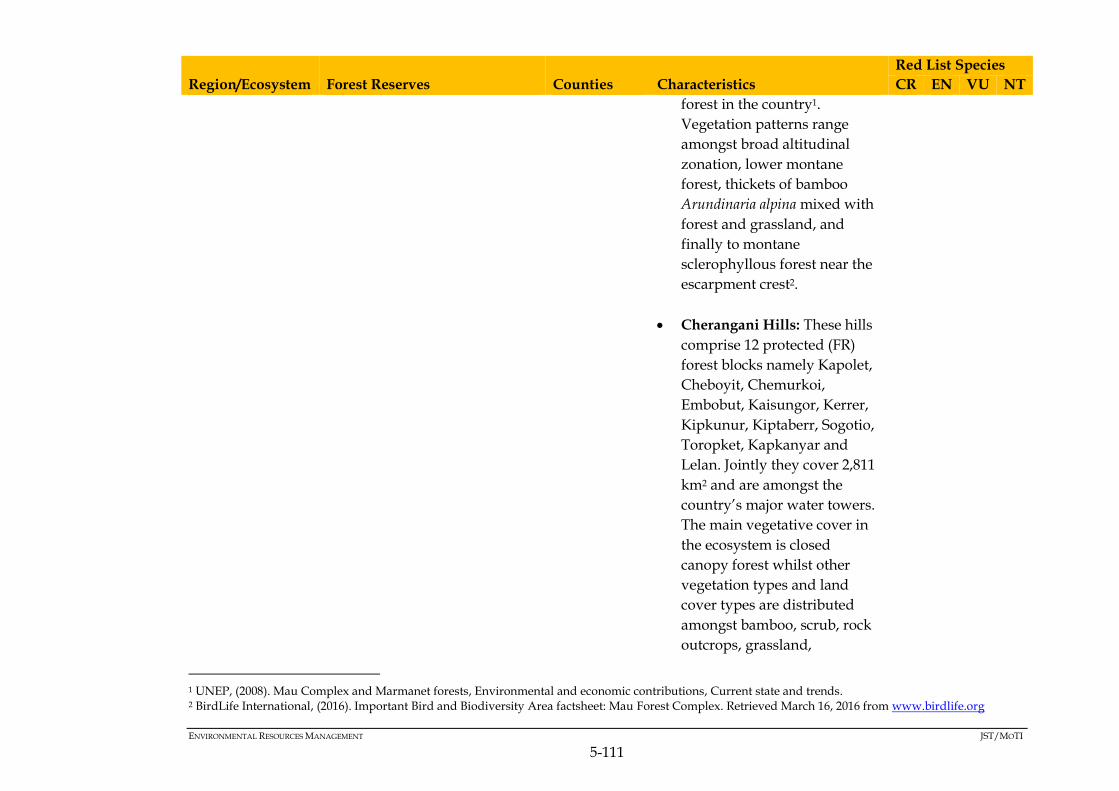
ENVIRONMENTAL RESOURCES MANAGEMENT JST/MOTI
5-111
Region/Ecosystem Forest Reserves Counties Characteristics
Red List Species
CR EN VU NT
forest in the country1.
Vegetation patterns range
amongst broad altitudinal
zonation, lower montane
forest, thickets of bamboo
Arundinaria alpina mixed with
forest and grassland, and
finally to montane
sclerophyllous forest near the
escarpment crest2.
Cherangani Hills: These hills
comprise 12 protected (FR)
forest blocks namely Kapolet,
Cheboyit, Chemurkoi,
Embobut, Kaisungor, Kerrer,
Kipkunur, Kiptaberr, Sogotio,
Toropket, Kapkanyar and
Lelan. Jointly they cover 2,811
km2 and are amongst the
country’s major water towers.
The main vegetative cover in
the ecosystem is closed
canopy forest whilst other
vegetation types and land
cover types are distributed
amongst bamboo, scrub, rock
outcrops, grassland,
1 UNEP, (2008). Mau Complex and Marmanet forests, Environmental and economic contributions, Current state and trends. 2 BirdLife International, (2016). Important Bird and Biodiversity Area factsheet: Mau Forest Complex. Retrieved March 16, 2016 from www.birdlife.org

ENVIRONMENTAL RESOURCES MANAGEMENT JST/MOTI
5-112
Region/Ecosystem Forest Reserves Counties Characteristics
Red List Species
CR EN VU NT
moorland, cultivated areas
and plantations of exotic
species. The ecosystem
contains an IBA within the
Kenyan Mountains EBA, and
is also part of the EAM1,2.
North Rift Valley
and Western
Regions
Kitale Township, Kitale,
Kaptaroi, Ururu, North Nandi,
South Nandi, Taressia, Buyanga,
Kisere, Malaba, Bunyala, Lugari,
Turbo, Kakamega, Mount Elgon
and Sekhendu.
Trans-Nzoia,
Nandi,
Kakamega
and
Bungoma.
These FRs contain the rainforests
in Western Kenya and North Rift
Valley. The characteristics of the
major FRs are as follows:
Kakamega FR: This FR covers
an area of about 181 km2 and
is considered to be the
easternmost outlier of the
Guinea-Congolian forest and
the only remaining tropical
rainforest in Kenya3.
Vegetation within the FR
includes closed canopy
indigenous forest, grassy and
bushed glades (some natural,
some maintained by fire or
grazing), tea, cultivation and
plantations of softwoods and
commercially valuable
23 28 40 75
1 BirdLife International, (2016). Important Bird and Biodiversity Area factsheet: Cherangani Hills. Retrieved March 16, 2016 from www.birdlife.org 2 KFS, (2015). Cherangani Hills Forest Strategic Ecosystem Management Plan 2015 -2040. 3 Piritta P., (2004). Forest Types of Kenya. In: Pellikka, P., J. Ylhäisi & B. Clark (eds.) Taita Hills and Kenya, 2004 – seminar, reports and journal of a field excursion to Kenya. Expedition reports of the Department of Geography, University of Helsinki 40, 8-13. Helsinki 2004, ISBN 952-10-2077-6, 148 pp.
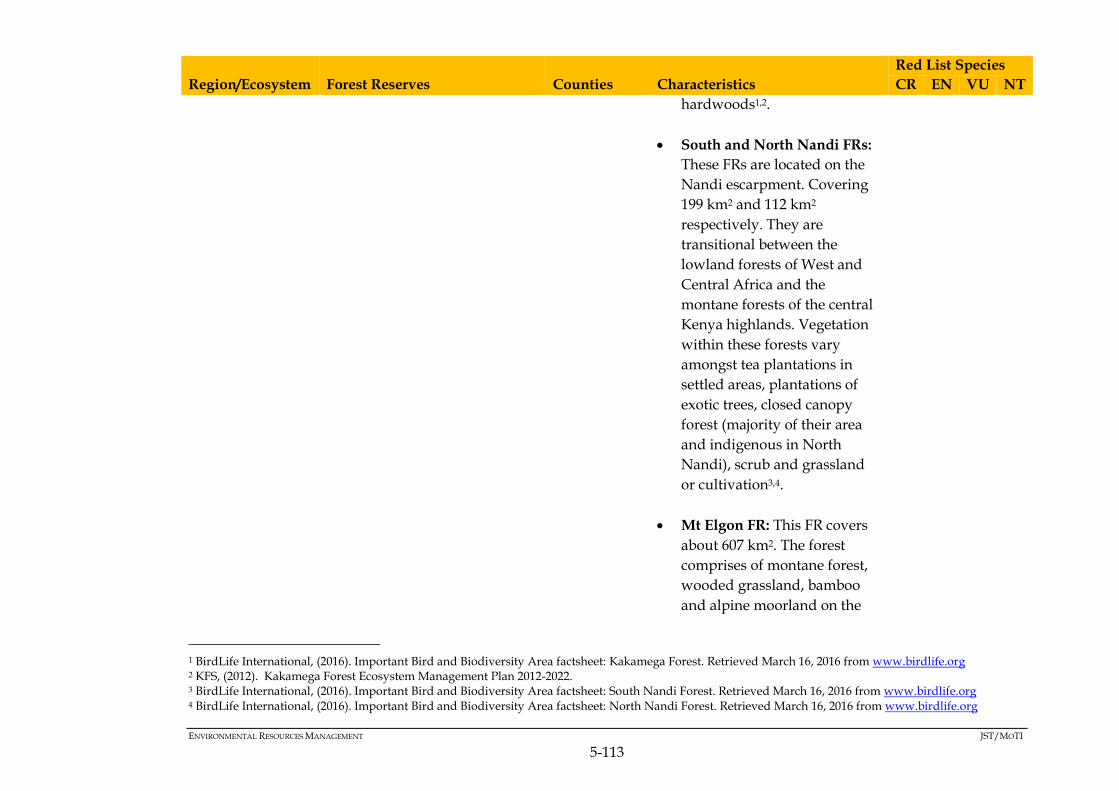
ENVIRONMENTAL RESOURCES MANAGEMENT JST/MOTI
5-113
Region/Ecosystem Forest Reserves Counties Characteristics
Red List Species
CR EN VU NT
hardwoods1,2.
South and North Nandi FRs:
These FRs are located on the
Nandi escarpment. Covering
199 km2 and 112 km2
respectively. They are
transitional between the
lowland forests of West and
Central Africa and the
montane forests of the central
Kenya highlands. Vegetation
within these forests vary
amongst tea plantations in
settled areas, plantations of
exotic trees, closed canopy
forest (majority of their area
and indigenous in North
Nandi), scrub and grassland
or cultivation3,4.
Mt Elgon FR: This FR covers
about 607 km2. The forest
comprises of montane forest,
wooded grassland, bamboo
and alpine moorland on the
1 BirdLife International, (2016). Important Bird and Biodiversity Area factsheet: Kakamega Forest. Retrieved March 16, 2016 from www.birdlife.org 2 KFS, (2012). Kakamega Forest Ecosystem Management Plan 2012-2022. 3 BirdLife International, (2016). Important Bird and Biodiversity Area factsheet: South Nandi Forest. Retrieved March 16, 2016 from www.birdlife.org 4 BirdLife International, (2016). Important Bird and Biodiversity Area factsheet: North Nandi Forest. Retrieved March 16, 2016 from www.birdlife.org

ENVIRONMENTAL RESOURCES MANAGEMENT JST/MOTI
5-114
Region/Ecosystem Forest Reserves Counties Characteristics
Red List Species
CR EN VU NT
eastern slopes of the
mountain. Vegetation within
the wider Mt Elgon ecosystem
is determined by altitude. The
wet montane forest is
dominated by Olea capensis
and Aningeria adolfi-friedericii
grading into Olea–Podocarpus
falcatus forest, a zone of mixed
Podocarpus and bamboo
Arundinaria alpina, and the
Hagenia abyssinica zone with
giant heath Erica arborea and E.
trimera elgonensis. Afro-alpine
moorlands occupy the highest
parts of the mountain, with
tussock grasses. Open wooded
grasslands cover part of the
lower, drier north-eastern
slopes. The remaining regions
are forest and moorland and
are part of the FR. In the
north-eastern region is
wooded grassland which is
unprotected1.
1 BirdLife International, (2016). Important Bird and Biodiversity Area factsheet: Mount Elgon (Kenya). Retrieved March 16, 2016 from www.birdlife.org

ENVIRONMENTAL RESOURCES MANAGEMENT JST/MOTI
5-115
Figure 5.49 Forest Reserves in the NEC
5.4.4.7 Private Conservation Areas (PCAs) and Community Conservation
Areas (CCAs)
PCAs and CCAs in the NEC are listed below and their locations are shown in Figure 5.50. This study notes there is limited information available from secondary sources on the sensitivities and other characteristics of these areas.
Imbirikani Community Conservancy (Kajiado)
Esenlenkei Community Conservancy (1983) (Kajiado)
Motikanju Community Conservancy (2010) (Kajiado)
Lumo Community Wildlife Sanctuary (2001) (Taita/Taveta)
South-Western Mau Nature Reserve (1961) (Bomet)
Boabab Farm Private Reserve (Kilifi)
Lisa Ranch Private Reserve (Machakos)
Konza Ranching and farming Co-operative Private Reserve
(Makueni)
Chololo Ranch Private Reserve (Nakuru)
Enganani Ranch Private Reserve (Nakuru)
Galana Ranch Private Reserve (Kitui)
Mbulia Group Ranch Private Reserve (1993) (Taita Taveta)
Kisima Farm Rumuruti Private Reserve (Nyeri)
Dawida Ranch Private Reserve (1987) (Taita Taveta)
Tarda Emali Ranch Private Reserve (Makueni)

ENVIRONMENTAL RESOURCES MANAGEMENT JST/MOTI
5-116
There are two Locally Manage Marine Areas (LMMA) in the NEC. They
are:
Kuruwitu (2003) (Kilifi)
Majoreni (2011) (Kwale)
Figure 5.50 PCAs and CCAs in the NEC
5.4.4.8 Wetlands
Wetlands are areas of marsh, fen, peatland or water, whether natural or
artificial, permanent or temporary, with water that is static or flowing,
fresh, brackish or salt, including areas of marine water the depth of
which at low tide does not exceed six metres1. They include riparian
areas adjacent to the wetlands as shown by Figure 5.51 which gives a
representation of wetland vegetation types across a gradient of
decreasing wetness.
Kenya has six classes of wetlands including, marine, estuarine,
lacustrine, palustrine, riverine and human made wetlands. These
wetlands occupy approx. 14,000 km2 of the country’s land area and
each of the classes of wetlands exist within the NEC.
Figure 5.52 shows those mapped within the NEC. Of these wetlands,
Lakes Nakuru, Elementaita and Naivasha are considered to be
1 Ramsar Convention Secretariat (2013). The Ramsar Convention Manual: a guide to the Convention on Wetlands (Ramsar, Iran, 1971), 6th ed. Ramsar Convention Secretariat, Gland, Switzerland.

ENVIRONMENTAL RESOURCES MANAGEMENT JST/MOTI
5-117
wetlands of the international importance (“Ramsar Sites”) under the
Ramsar Convention. Ramsar sites are discussed in the next subsection
Table 5.18 identifies and describes major wetlands traversed by the
NEC. The basin and sub-basin in which they are located, key
land/wetland uses, pressures and impacts are identified in this table.
Figure 5.51 Wetland Vegetation in Relation to Wetness Gradient
Source: NEWP (2012) as cited in MEMR (2012)1.
1 MEMR, (2012). Kenya Wetlands Atlas.
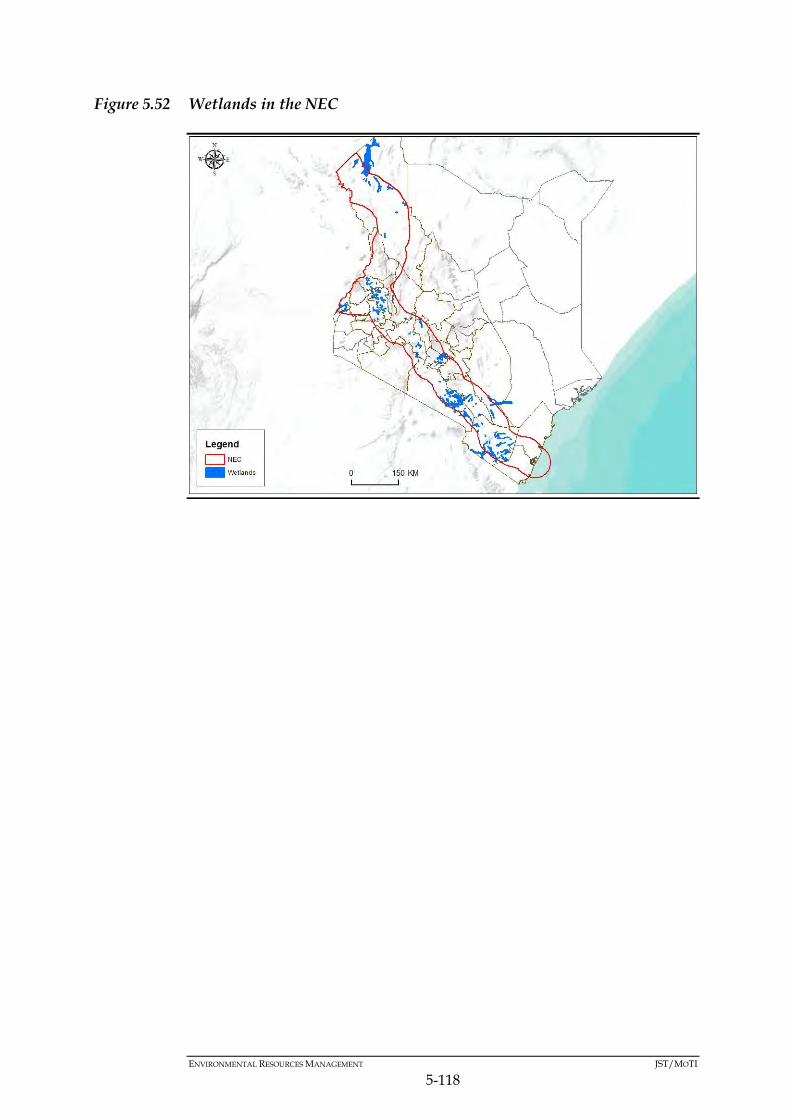
ENVIRONMENTAL RESOURCES MANAGEMENT JST/MOTI
5-118
Figure 5.52 Wetlands in the NEC

ENVIRONMENTAL RESOURCES MANAGEMENT JST/MOTI
5-119
Table 5.19 Characteristics of Wetlands in the NEC
Basin/Sub-
Basin
Major
Wetlands
Land/Wetland Uses Pressures Impacts
L Victoria
North
R Yala
R Nzoia
Sio-Siteko
Fishing
Large-scale farming
Mining
Harvesting papyrus reeds
Brick making
Forestry
Conservation (Kakamega Forest)
Tourism and recreation
Irrigation
Power production
Artisanal products
Inappropriate
land use and
overutilization
Conversion of
wetlands to
agricultural land
Unsustainable
exploitation of
resources
Land subdivision
and fragmentation
Pollution
Land cover
loss
Invasive
species
Reduced water
quantity and
quality
Biodiversity
loss
Flooding
Reduced
fisheriesL Victoria
South
R Nyando Fishing
Large-scale farming
Mining
Harvesting papyrus reeds
Brick making
Pastoralism
Forestry
Conservation (Ruma,
Ndere island)
Energy
Water supply
Recreation
Artisanal products
Rift Valley L Nakuru
L Naivasha
Conservation
Mining
Fishing
Forestry
Urbanization
Inappropriate
land use
Conversion of
Pollution
Soil
erosion/siltatio
n

ENVIRONMENTAL RESOURCES MANAGEMENT JST/MOTI
5-120
Basin/Sub-
Basin
Major
Wetlands
Land/Wetland Uses Pressures Impacts
Pastoralism
Energy - geo and hydro power
Ranching
Tourism and recreation
Irrigation
land for
agriculture
Unsustainable
exploitation of
resources
Increased demand
for resources
Land subdivision
and fragmentation
Loss of
land/forest
cover
Overgrazing
Reduced
quantity and
quality of
water
Ewaso Ng’iro
North
L Ol-Bolossat
R Amala
Large-scale commercial farms
Pastoralism
Ranching
Wildlife conservancies
Oil and gas exploration
Forestry
Grazing
Water supply
Fish farming
Tourism
Inappropriate
land use
Overutilization of
water
Conversion of
land to agriculture
Overstocking of
livestock
Settlements
Loss of catchment
forests
Increased demand
for resources
Reduced water
levels
Land subdivision
and fragmentation
Pollution
Soil erosion /
siltation
Overgrazing
Reduced water
volume
Tana - Large-scale farming
Conservation
Irrigation
Pastoralism
Inappropriate
land use
Overutilization of
water
Pollution
Soil
erosion/siltatio
n

ENVIRONMENTAL RESOURCES MANAGEMENT JST/MOTI
5-121
Basin/Sub-
Basin
Major
Wetlands
Land/Wetland Uses Pressures Impacts
Mining-sand
Fishing
Quarrying
Forestry
Hydropower generation
Recreation
Water supply
Conversion of
land to
agriculture
Overstocking of
livestock
Conversion of
land to
settlements
Loss of catchment
forests
Increased demand
for resources
Reduced water
levels
Land subdivision
and fragmentation
Overgrazing
Reduced water
volume
Loss of critical
habitats and
species
Reduced
hydrological
capacity
Athi R Athi
R Nairobi
R Ramisi
Wildlife conservation area (Nairobi
National Park, Tsavo Conservation Area,
Shimba Hills)
Industrial use
Farming (subsistence and commercial)
Pastoralism
Livestock ranching
Mining (sand, limestone)
Fishing
Forestry
Energy - wind and thermal water supply
Nature conservation and recreation
Irrigation
Salt harvesting
Over-exploitation
of surface and
groundwater
resources.
Wetlands
resources
degradation
Unregulated
diversions of river
channels
Catchment
degradation due
to overgrazing
and sand
Acute water
scarcity due to
high water
demand
Limited
ground water
recharge
Changing river
regime
Pollution of
water
resources from
industrial
effluents, and
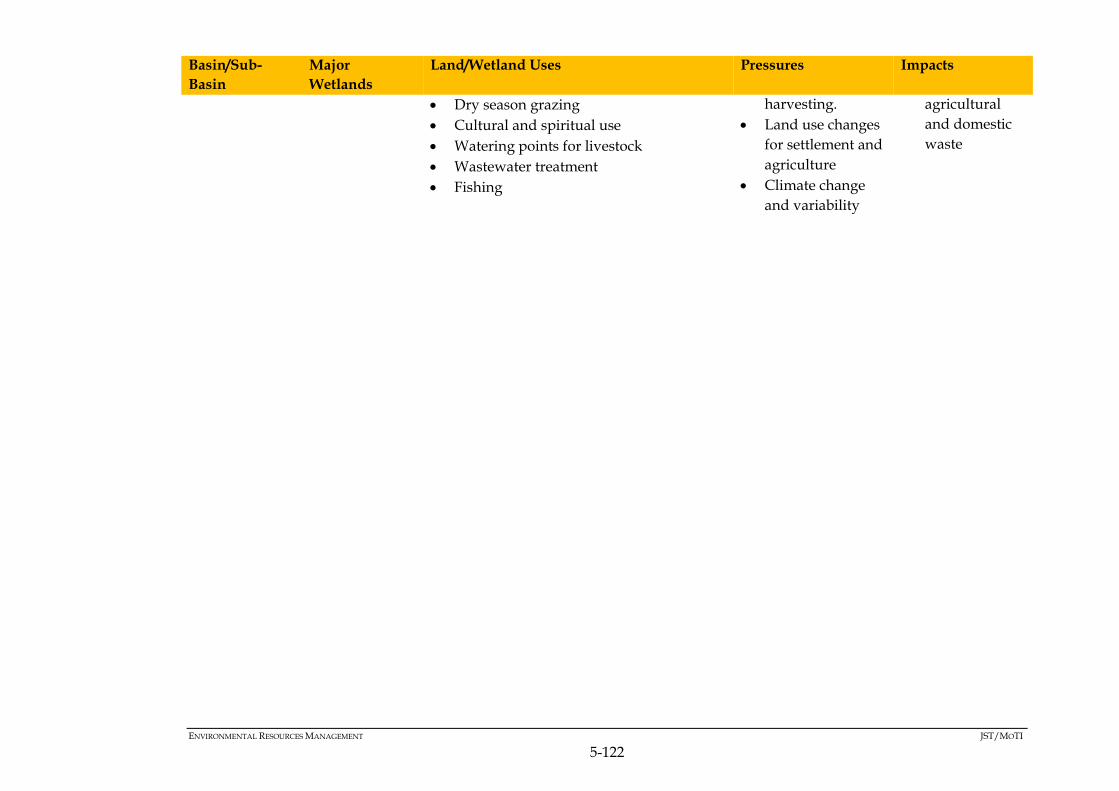
ENVIRONMENTAL RESOURCES MANAGEMENT JST/MOTI
5-122
Basin/Sub-
Basin
Major
Wetlands
Land/Wetland Uses Pressures Impacts
Dry season grazing
Cultural and spiritual use
Watering points for livestock
Wastewater treatment
Fishing
harvesting.
Land use changes
for settlement and
agriculture
Climate change
and variability
agricultural
and domestic
waste

ENVIRONMENTAL RESOURCES MANAGEMENT JST/MOTI
5-123
Figure 5.53 compares the areas occupied by water bodies in the NEC
Counties. Siaya County has the largest area occupied by water bodies
and Nairobi the least. However, given as a percentage of the total area
of the county, Bungoma County has the lowest percentage whilst Siaya
still has the highest.
In addition to being protected against degradation and pollution by
national regulations, wetlands play important social, economic and
environmental roles through the ecosystems services they provide.
They are unique ecosystems which provide all four classes of
ecosystems services namely, provisioning, regulating, supporting and
cultural services. Despite this, wetlands face threats of degradation
from anthropogenic factors including climate change1. This study
therefore considers wetlands to be constraint features in the NEC since
additional pressure from infrastructure development can potentially
lead to degradation.
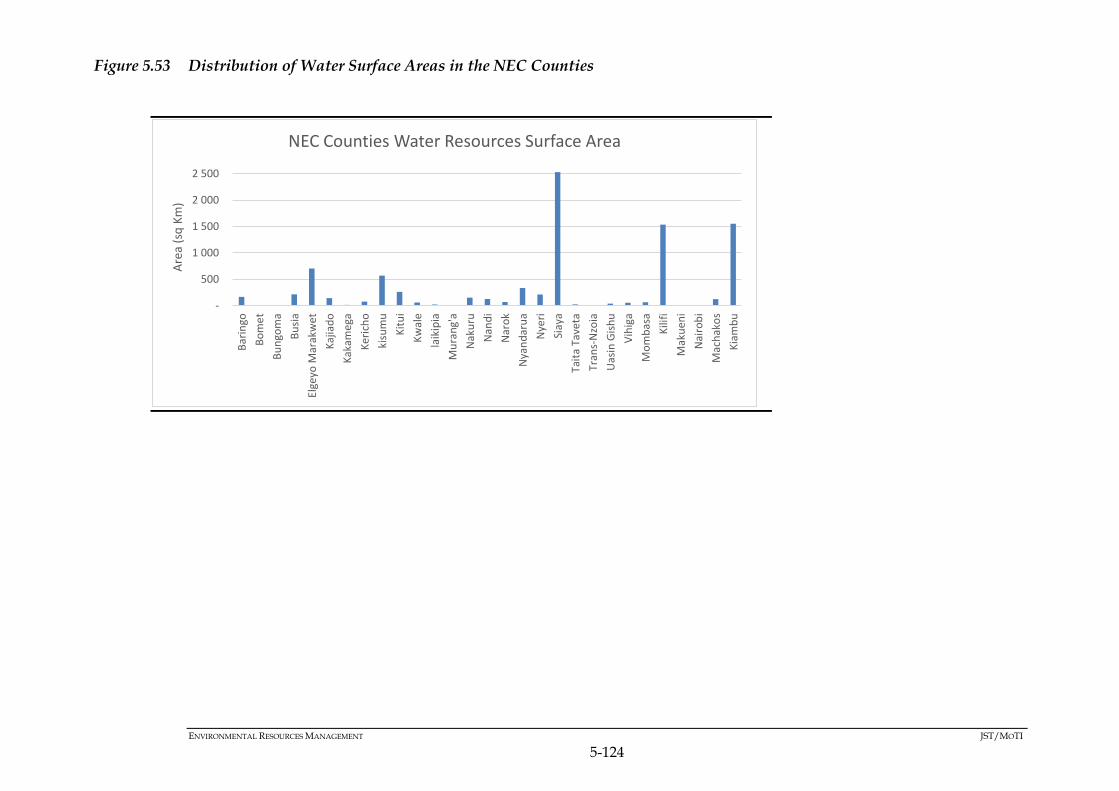
ENVIRONMENTAL RESOURCES MANAGEMENT JST/MOTI
5-124
Figure 5.53 Distribution of Water Surface Areas in the NEC Counties
-
500
1 000
1 500
2 000
2 500
Bar
ingo
Bo
me
t
Bu
ngo
ma
Bu
sia
Elge
yo M
arak
wet
Kaj
iad
o
Kak
ameg
a
Ker
ich
o
kisu
mu
Kit
ui
Kw
ale
laik
ipia
Mu
ran
g'a
Nak
uru
Nan
di
Nar
ok
Nya
nd
aru
a
Nye
ri
Siay
a
Tait
a Ta
veta
Tran
s-N
zoia
Uas
in G
ish
u
Vih
iga
Mo
mb
asa
Kili
fi
Mak
uen
i
Nai
rob
i
Mac
hak
os
Kia
mb
u
Are
a (s
q K
m)
NEC Counties Water Resources Surface Area

ENVIRONMENTAL RESOURCES MANAGEMENT JST/MOTI
5-125
5.4.4.9 Ramsar Sites
Kenya has six wetlands declared Ramsar Sites (wetlands of
international importance) under the Ramsar Convention. Four of these
sites namely Lakes Bogoria, Nakuru, Naivasha and Elementaita are
intersected by the NEC. These lakes are part of the Great Rift Lakes in
Kenya. The details behind their Ramsar designation are below (the year
of designation is elucidated in parenthesis):
Lake Bogoria (2001): The Lake provides critical refuge for the
Phoenicopterus minor (Lesser Flamingo), with a population of 1 to 1.5
million. It supports over 300 waterbird species whilst the shoreline
fringe of the lake and associated acacia woodland provide critical
habitat for the endangered Tragelaphus strepsciseros (Greater Kudu)
and other mammals1. Lake Bogoria is also a NR.
Lake Nakuru (1990): The ecosystems within the site support
globally endangered mammal species such as the black rhino and
hippo in addition to regionally endangered bird species like the
African darter, Great egret, the range-restricted Grey-crested
Helmet-shrike, the Lesser kestrel and the Madagascar pond heron. L
Nakuru supports over 450 avian species and about 70 waterbird
species, including 1 million flamingos. Archaeological caves used by
early man are also found in the area2. L Nakuru is also a NP.
Lake Naivasha (1995): This site provides a habitat for globally
threatened species including Prionops poliolophus (Grey‐crested
Helmet‐shrike), Acrocephalus griseldis (Basra Reed Warbler).
Regionally threatened species supported by L Naivasha include the
Great Crested Grebe, Maccoa Duck, African Darter, Great Egret,
Saddle‐billed Stork, White‐backed Duck, Baillon’s Crake and
African Skimmer. Populations of Hippopotamus are also found
within the lake. The lake supports a diverse waterbird community,
with more than 80 waterfowl species and over 400 total avian
species3. L Naivasha is a county managed PA.
Lake Elementaita (2005): This Lake supports several species falling
into different conservation categories as threatened, vulnerable and
endangered at local, national, regional and international levels.
These include the Lesser and Greater Flamingo. Other threatened
1 Ramsar, (2001). Information Sheet on Ramsar Wetlands (RIS) - Lake Bogoria. Ramsar Site Information Service. 2 Ramsar, (2005). Information Sheet on Ramsar Wetlands (RIS) - Lake Nakuru. Ramsar Site Information Service. 3 Ramsar, (2005). Information Sheet on Ramsar Wetlands (RIS) – Lake Naivasha. Ramsar Site Information Service.

ENVIRONMENTAL RESOURCES MANAGEMENT JST/MOTI
5-126
species are Great Crested Grebe, Great White Pelican, Great Egret
and Maccoa Duck. L Elementaita supports over 450 bird species that
include approximately 80 waterfowl species. It is considered to
support 1% of East Africa’s flamingo population estimated at 1.5
million1. L Elementaita is a county management PA.
Figure 5.54 shows the location of these sites in relation to the NEC.
Figure 5.54 Ramsar Sites in the NEC
5.4.4.10 World Heritage Sites (WHSs)
Under the Convention concerning the Protection of the World Cultural
and Natural Heritage (1972), several sites are designated to be World
Heritage Sites (WHS). These sites are considered to be of outstanding
value to humanity. Kenya has 6 WHS of which the 3 explained below
with their inscription year in parenthesis are intersected by the NEC:
Fort Jesus (2011): This site was designated due to its cultural and
historical value. The Fort was built by the Portuguese in 1593-1596
to the designs of Giovanni Battista Cairati to protect the port of
Mombasa. It is one of the well preserved examples of 16th
Portuguese military fortification and a historical landmark in its
type of construction. The property covers an area of 2.36 hectares
1 Ramsar, (2005). Information Sheet on Ramsar Wetlands (RIS) – Lake Elementaita. Ramsar Sites Information Service.

ENVIRONMENTAL RESOURCES MANAGEMENT JST/MOTI
5-127
and includes the fort's moat and immediate surroundings. It
represents an exchange of cultural values amongst people of
African, Arab, Turkish, Persian and European origin. In addition,
The Fort exemplifies a new type of fortification that resulted from
the innovations in military and weapons technology that occurred
between the 15th and 16th centuries1.
Kenya Lake System in the Great Rift Valley (2011): Comprises of
the three inter-linked relatively shallow lakes, L Nakuru, L Bogoria
and L Elementaita. The lakes were added to the list because they
present an appealing range of geological and biological processes in
the landscape of the Great Rift Valley. The lakes create a habitat of
up to 4 million Lesser Flamingos which migrate amongst them.
They provide the main nesting and breeding grounds for Great
White Pelicans whereas their terrestrial zones contain important
populations of many mammal and bird species that are globally or
regionally threatened. They are support to over 100 species of
migratory birds and support globally important populations of
Black-Necked Grebe, African Spoonbill, Pied Avocet, Little Grebe,
Yellow Billed Stork, Black Winged Stilt, Grey-Headed Gull and Gull
Billed Tern. The property makes a critical contribution to the
conservation of the natural values within the Great Rift Valley, as an
integral part of the most important route of the African-Eurasian
Flyway System2
Sacred Mijikenda Kaya Forests (2008): Consist of 11 separate
forests spread over 200 km along the coast. 4 of these forests
intersect the NEC, namely Kayas Chonyi, Ribe, Jibana and Kambe in
Kwale. Kayas are remains of fortified villages of the Mijikenda
people. They are revered as the repositories of spiritual beliefs of the
Mijikenda people and are seen as the sacred abode of their
ancestors. The kayas are designated as a WHS since they have
metonymic significance to Mijikenda and are a fundamental source
of Mijikenda's sense of being. Since they have been transferred from
the domestic to spiritual sphere, the biodiversity in the Kayas has
been sustained due to restrictions on access and use of their natural
forest resources. The Kayas are associated with beliefs of local and
1 UNESCO, (2011). Cultural Properties - Fort Jesus, Mombasa (Kenya). UNESCO World Heritage Committee Decision: 35 COM 8B.19. 2 UNESCO, (2011). Natural Properties - Kenya Lake System in the Great Rift Valley (Kenya). UNESCO World Heritage Committee Decision: 35 COM 8B.6.

ENVIRONMENTAL RESOURCES MANAGEMENT JST/MOTI
5-128
national significance, however they are under threat due to decline
in traditional knowledge and practices1.
Figure 5.55 WHSs in the NEC
5.4.4.11 UNESCO Man and the Biosphere Reserves
UNESCO Man and the Biosphere Reserves (MAB) are areas comprising
either terrestrial, marine and coastal ecosystems designated to promote
solutions reconciling the conservation of biodiversity with its
sustainable use. They are special places for testing interdisciplinary
approaches to understanding and managing changes and interactions
between social and ecological systems, including conflict prevention
and management of biodiversity.
Mt Elgon, which was designated as a MAB in 2003 due to its
importance as a water tower, is the only MAB in the NEC. It is a
volcanic massif and water tower with high plant diversity. Mt Elgon
has cultural significance to over 100,000 people, who live in its
neighbourhood, depending on subsistence and commercial cropping,
pastoralism, and ecotourism. The biosphere reverse covers about
208,821 Ha, comprising Mt Elgon National Park (16,916 ha) which
forms the core area; the Mt Elgon Forest Reserve and Chepkitale NR,
together forming a buffer zone of 90,905 Ha; and a 10 km strip of
1 UNESCO, (2009). Examination of Nominations and Minor Modifications to The Boundaries of Naturel, Mixed and Cultural Properties to The World Heritage List - Sacred Mijikenda Kaya Forests (Kenya). UNESCO World Heritage Committee Decision: 32 COM 8B.50.

ENVIRONMENTAL RESOURCES MANAGEMENT JST/MOTI
5-129
intensively used land in the foothills of the mountain range, covering
approx. 101,00 Ha [1]. Mt Elgon’s ecosystem intersects both Kenya and
Uganda and it is thus a transboundary biosphere reserve. Figure 5.56
displays the Kenyan section of the Mt Elgon MAB Reserve.
Figure 5.56 Kenyan Section of the Mt Elgon MAB Reserve
5.4.4.12 Important and Endemic Bird Areas
An Important Bird Area (IBA) is designated by BirdLife International as
a site that is known or thought regularly to hold significant numbers of
a globally threatened species, or other species of global conservation
concern. The designation applies where the species are either CR, EN or
VU according to IUCN Red List assessment method. VU species apply
when threshold numbers are existent at the site. IBAs are usually small
and often located in PAs or EBAs. LC, DD and NR species can also
trigger an IBA classification if they are biome-restricted species (Criteria
A3) or if they form threshold congregations (Criteria A4) 2. Kenya has
66 IBAs and 26 of them are located in the NEC.
An Endemic Bird Area (EBA) is a site where two or more species of
restricted range (with world distributions of less than 50,000 km2),
occur together. This is because more than 70% of such species are
1 UNESCO, (2004). Biosphere Reserve Information. Kenya. Mt Elgon. UNESCO MAB Biosphere Reserves Directory. The MAB Programme. 2 BirdLife International, (2016). Global IBA Criteria. Retrieved March 11, 2016 from www.birdlife.org
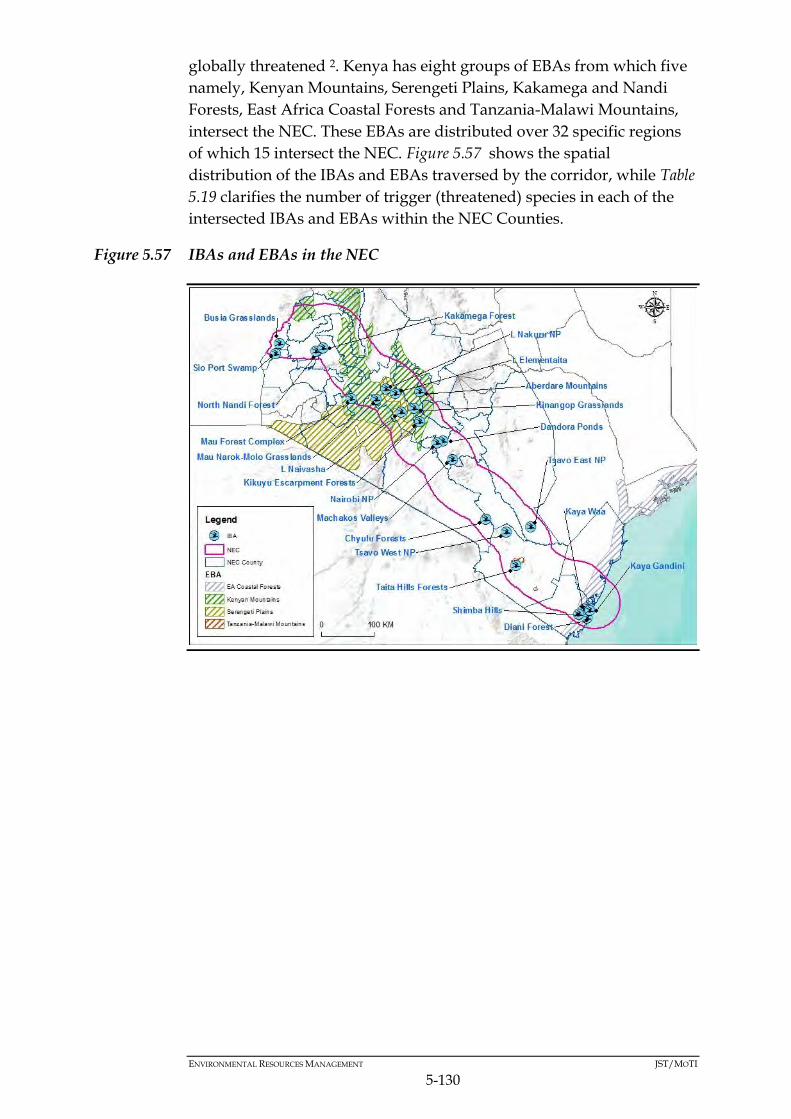
ENVIRONMENTAL RESOURCES MANAGEMENT JST/MOTI
5-130
globally threatened 2. Kenya has eight groups of EBAs from which five
namely, Kenyan Mountains, Serengeti Plains, Kakamega and Nandi
Forests, East Africa Coastal Forests and Tanzania-Malawi Mountains,
intersect the NEC. These EBAs are distributed over 32 specific regions
of which 15 intersect the NEC. Figure 5.57 shows the spatial
distribution of the IBAs and EBAs traversed by the corridor, while Table
5.19 clarifies the number of trigger (threatened) species in each of the
intersected IBAs and EBAs within the NEC Counties.
Figure 5.57 IBAs and EBAs in the NEC

ENVIRONMENTAL RESOURCES MANAGEMENT JST/MOTI
5-131
Table 5.20 Trigger Species in the Intersected IBAs and EBAs
Name County
Trigger Species
CR EN VU NT LC NR DD IBAs A41
IBAs
Aberdare Mountains Nyeri 0 2 1 1 39 10 0 N/A 0
Busia grasslands Busia 0 0 1 1 5 0 0 N/A 0
Chyulu Hills forests Kajiado 0 0 1 0 0 0 0 N/A 0
Dandora ponds Nairobi 0 0 0 0 1 0 0 N/A 0
Diani forest Kwale 0 1 0 3 0 0 0 N/A 0
Hell’s Gate NP Nakuru 0 1 0 1 0 0 0 N/A 0
Kakamega forest Kakamega 0 1 1 0 35 4 0 N/A 0
Kaya Gandini Kwale 0 2 0 2 0 0 0 N/A 0
Kaya Waa Kwale 0 1 0 1 0 0 0 N/A 0
Kikuyu Escarpment
forest
Kiambu 0 0 1 0 30 9 0 N/A 0
Kinangop grasslands Nyandarua 0 2 0 2 1 0 0 N/A 0
Lake Ol’ Bolossat Nyandarua 0 1 0 1 0 0 0 N/A 0
Lake Elmenteita (2) Nakuru 0 0 0 3 6 0 0 N/A 1
Lake Naivasha Nakuru 0 1 0 1 3 0 0 N/A 1
Lake Nakuru NP Nakuru 0 1 0 2 8 2 0 N/A 1
Machakos valleys Machakos 0 0 1 0 0 0 0 N/A 0
Mau forest complex Bomet 0 0 0 1 39 10 0 N/A 0
Mau Narok - Molo
grasslands
Narok 0 2 0 2 2 0 0 N/A 0
Mt Elgon Bungoma 0 1 0 0 46 10 0 N/A 0
Nairobi National Park Nairobi 0 1 0 1 2 0 0 N/A 0
North Nandi forest Nandi 0 0 1 0 21 2 0 N/A 0
Shimba Hills Kwale 0 2 0 4 12 0 0 N/A 0
South Nandi Forest Nandi 0 1 0 0 25 3 0 N/A 0
1 These are congregations of birds under Global IBA Criteria A4. (2) Also Elementaita
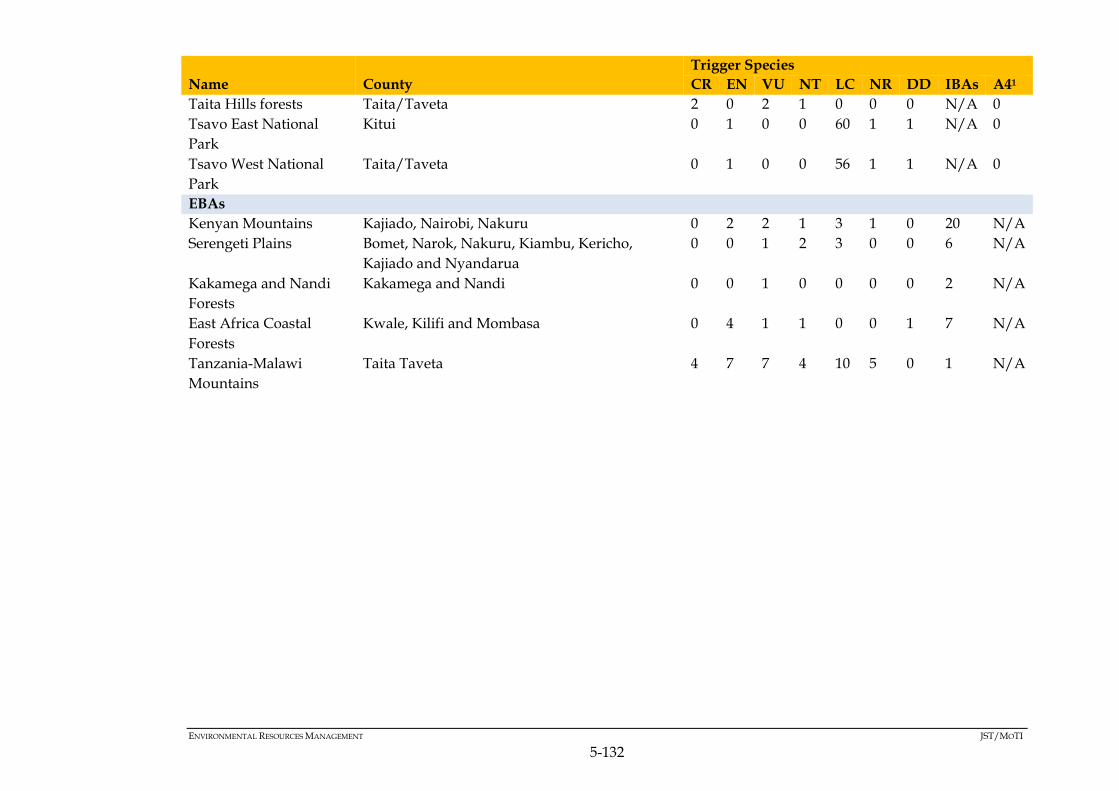
ENVIRONMENTAL RESOURCES MANAGEMENT JST/MOTI
5-132
Name County
Trigger Species
CR EN VU NT LC NR DD IBAs A41
Taita Hills forests Taita/Taveta 2 0 2 1 0 0 0 N/A 0
Tsavo East National
Park
Kitui 0 1 0 0 60 1 1 N/A 0
Tsavo West National
Park
Taita/Taveta 0 1 0 0 56 1 1 N/A 0
EBAs
Kenyan Mountains Kajiado, Nairobi, Nakuru 0 2 2 1 3 1 0 20 N/A
Serengeti Plains Bomet, Narok, Nakuru, Kiambu, Kericho,
Kajiado and Nyandarua
0 0 1 2 3 0 0 6 N/A
Kakamega and Nandi
Forests
Kakamega and Nandi 0 0 1 0 0 0 0 2 N/A
East Africa Coastal
Forests
Kwale, Kilifi and Mombasa 0 4 1 1 0 0 1 7 N/A
Tanzania-Malawi
Mountains
Taita Taveta 4 7 7 4 10 5 0 1 N/A
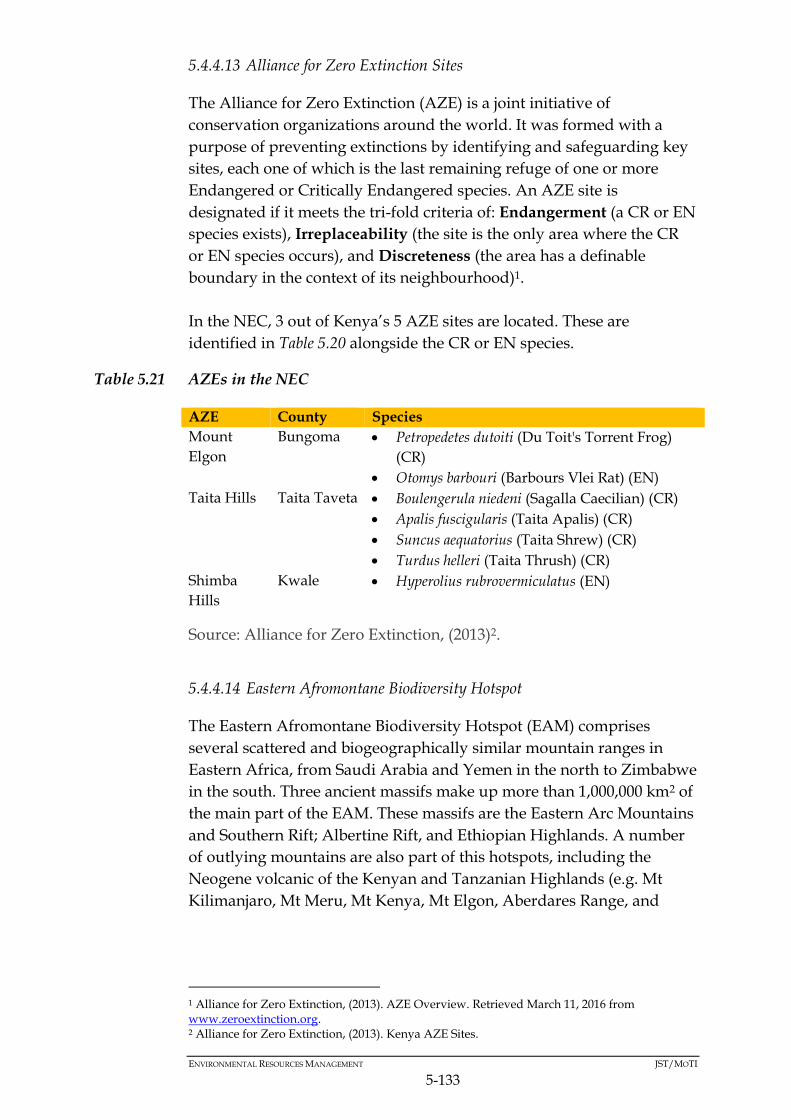
ENVIRONMENTAL RESOURCES MANAGEMENT JST/MOTI
5-133
5.4.4.13 Alliance for Zero Extinction Sites
The Alliance for Zero Extinction (AZE) is a joint initiative of
conservation organizations around the world. It was formed with a
purpose of preventing extinctions by identifying and safeguarding key
sites, each one of which is the last remaining refuge of one or more
Endangered or Critically Endangered species. An AZE site is
designated if it meets the tri-fold criteria of: Endangerment (a CR or EN
species exists), Irreplaceability (the site is the only area where the CR
or EN species occurs), and Discreteness (the area has a definable
boundary in the context of its neighbourhood)1.
In the NEC, 3 out of Kenya’s 5 AZE sites are located. These are
identified in Table 5.20 alongside the CR or EN species.
Table 5.21 AZEs in the NEC
AZE County Species
Mount
Elgon
Bungoma Petropedetes dutoiti (Du Toit's Torrent Frog)
(CR)
Otomys barbouri (Barbours Vlei Rat) (EN)
Taita Hills Taita Taveta Boulengerula niedeni (Sagalla Caecilian) (CR)
Apalis fuscigularis (Taita Apalis) (CR)
Suncus aequatorius (Taita Shrew) (CR)
Turdus helleri (Taita Thrush) (CR)
Shimba
Hills
Kwale Hyperolius rubrovermiculatus (EN)
Source: Alliance for Zero Extinction, (2013)2.
5.4.4.14 Eastern Afromontane Biodiversity Hotspot
The Eastern Afromontane Biodiversity Hotspot (EAM) comprises
several scattered and biogeographically similar mountain ranges in
Eastern Africa, from Saudi Arabia and Yemen in the north to Zimbabwe
in the south. Three ancient massifs make up more than 1,000,000 km2 of
the main part of the EAM. These massifs are the Eastern Arc Mountains
and Southern Rift; Albertine Rift, and Ethiopian Highlands. A number
of outlying mountains are also part of this hotspots, including the
Neogene volcanic of the Kenyan and Tanzanian Highlands (e.g. Mt
Kilimanjaro, Mt Meru, Mt Kenya, Mt Elgon, Aberdares Range, and
1 Alliance for Zero Extinction, (2013). AZE Overview. Retrieved March 11, 2016 from www.zeroextinction.org. 2 Alliance for Zero Extinction, (2013). Kenya AZE Sites.
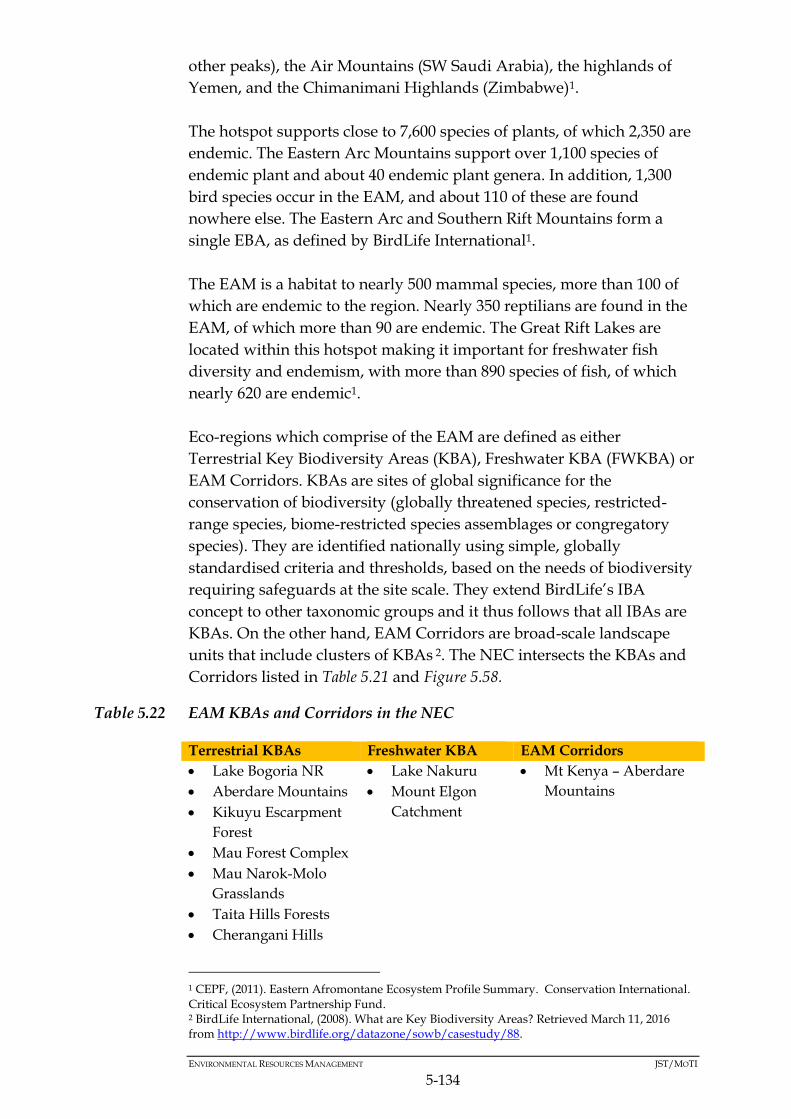
ENVIRONMENTAL RESOURCES MANAGEMENT JST/MOTI
5-134
other peaks), the Air Mountains (SW Saudi Arabia), the highlands of
Yemen, and the Chimanimani Highlands (Zimbabwe)1.
The hotspot supports close to 7,600 species of plants, of which 2,350 are
endemic. The Eastern Arc Mountains support over 1,100 species of
endemic plant and about 40 endemic plant genera. In addition, 1,300
bird species occur in the EAM, and about 110 of these are found
nowhere else. The Eastern Arc and Southern Rift Mountains form a
single EBA, as defined by BirdLife International1.
The EAM is a habitat to nearly 500 mammal species, more than 100 of
which are endemic to the region. Nearly 350 reptilians are found in the
EAM, of which more than 90 are endemic. The Great Rift Lakes are
located within this hotspot making it important for freshwater fish
diversity and endemism, with more than 890 species of fish, of which
nearly 620 are endemic1.
Eco-regions which comprise of the EAM are defined as either
Terrestrial Key Biodiversity Areas (KBA), Freshwater KBA (FWKBA) or
EAM Corridors. KBAs are sites of global significance for the
conservation of biodiversity (globally threatened species, restricted-
range species, biome-restricted species assemblages or congregatory
species). They are identified nationally using simple, globally
standardised criteria and thresholds, based on the needs of biodiversity
requiring safeguards at the site scale. They extend BirdLife’s IBA
concept to other taxonomic groups and it thus follows that all IBAs are
KBAs. On the other hand, EAM Corridors are broad-scale landscape
units that include clusters of KBAs 2. The NEC intersects the KBAs and
Corridors listed in Table 5.21 and Figure 5.58.
Table 5.22 EAM KBAs and Corridors in the NEC
Terrestrial KBAs Freshwater KBA EAM Corridors
Lake Bogoria NR
Aberdare Mountains
Kikuyu Escarpment
Forest
Mau Forest Complex
Mau Narok-Molo
Grasslands
Taita Hills Forests
Cherangani Hills
Lake Nakuru
Mount Elgon
Catchment
Mt Kenya – Aberdare
Mountains
1 CEPF, (2011). Eastern Afromontane Ecosystem Profile Summary. Conservation International. Critical Ecosystem Partnership Fund. 2 BirdLife International, (2008). What are Key Biodiversity Areas? Retrieved March 11, 2016 from http://www.birdlife.org/datazone/sowb/casestudy/88.

ENVIRONMENTAL RESOURCES MANAGEMENT JST/MOTI
5-135
Terrestrial KBAs Freshwater KBA EAM Corridors
South Nandi Forest
Kinangop Grasslands
Lake Ol' Bolossat
Mukurweini Valleys
Chyulu Hills
Mount Elgon
(Kenya)
Figure 5.58 EAM KBAs and Corridors Intersected by the NEC
Source: CEPF, (2011)1.
5.4.4.15 Flyways
The East Asia/East Africa flyway, which is used by 331 known
avifaunal species, intersects Kenya and the NEC. On this flyway typical
journey follow a predominantly north-south axis, linking breeding
grounds in the arctic and temperatre regions with non-breeding sites in
in temperate and tropical areas. Numerous birds that breed in the mid-
Palaearctic choose to embark on a much longer south-westerly
migration to Africa rather than spending the northern winter directly to
the south. Two main migration routes have been identified south
through equatorial eastern Africa. Species such as the Barn Swallow,
Willow Warbler and Red-backed Shrike (Lanius collurio) prefer a route
through Uganda and the L Victoria basin, whilst others, such as the
Marsh warbler, Trush Nightingale (Luscinia luscinia) and Basra Reed-
warbler (Acrocephalus griseldis) pass further to the east through the
Kenyan highlands. The return migration in spring is relatively rapid
ENVIRONMENTAL RESOURCES MANAGEMENT JST/MOTI
5-136
with many birds completing the entire journey from the southern
tropics to their northern breeding grounds in six weeks1.
5.4.4.16 Coral Reefs
The total area of Kenya’s coral reefs (warm water corals) is estimated at
50,000 Ha. These reefs are divided into two main areas – a fairly
continuous 200 km long fringing reef along the south coast extending
from Malindi to Shimoni and patch reefs (exposed and protected), and
fore reef slopes in north coast from Lamu to the Somali border (See
Figure 5.59). In both areas, hard substrate patches with coral growth are
interspersed between extensive seagrass and algal beds. Coral cover is
typically about 30% within these patches, and the reef’s complexity and
diversity is higher in the south decreasing northward past Lamu due to
increasing influence of the cold-water Somali current system2.
In the south, the narrow 200 km long fringing reef continues into the
Tanzanian coast. It colonized the shallow part of the continental shelf
along half of Kenya’s coastline from about mean sea level to a depth of
20-25 m and at a distance of between 500 m and 2 km offshore.
Exceptions exists where river systems create high turbidity and low
salinity conditions, which limit coral growth. As a result of these
conditions, estuaries and deltas along the coast are instead
characterized by extensive mangrove forests.
This Study identifies 198 Red List species of corals belonging to 53
genera, within the NEC’s marine region, distributed amongst the
assessment categories as shown by Figure 5.59. These coral are stony
corals whereas other important reef building organisms include soft
coral and coralline red algae (or calcareous algae). In the general, the
coral species are similar to other part of the Western Indian Ocean.
They are dominated by Porites sp. assemblages in calm water and
Acropora sp. assemblages in high energy environments. Stony coral
cover averages between 30-40% of all corals in the Kenyan Coast
1Birdlife International (n.d). East Asia/East Africa Flyway. 2 IUCN/UNEP, (1985).

ENVIRONMENTAL RESOURCES MANAGEMENT JST/MOTI
5-137
Figure 5.59 Distribution of Red List Corals
Cold water reefs are found in dark, deep waters with temperatures
between 4°-13°C. Cold-water corals are still being studied but are
potentially located in all seas and at all latitudes. There are only six
identified coral species that are able to build reefs (vs. approximately
800 warm-water species). Most cold water reefs are comprised of just 1-
2 species. These reefs provide habitat and feeding grounds for a range
of deep-water organisms. Their full ecological importance is still
unknown. These reefs are at risk from bottom fisheries, oil and gas
exploration activities, placement of pipelines and cables and pollution.
Cold-water reefs have been identified off the coast of East Africa, near
Madagascar, and are potentially present off the coast of Kenya. They
have however not been identified in the NEC’s offshore area.
5.4.4.17 Sandy Beaches
Two types of sandy shores are present along the Kenyan coast:
Gentle to steep sandy beaches without protection from reef
barriers and often backed by one or more series of wind-blown
sand dunes; and
Gently sloping, usually sheltered behind a fringing reef, and
common along the coast, south of Ungwana Bay (typical
examples are Diani Beach and Tiwi Beach).
Species diversity on sandy beaches is usually low, with few burrowing
crabs and amphipods. The density and diversity of crabs, bivalves,
polychaetes and other marine invertebrates, increases in the inter-tidal
zone, but remain low compared to most other habitats. Stranded debris
in this zone may attract a variety of foraging waders and other birds.
Sandy beaches are considered sensitive because on top of being tourist
5
106
61
26
0 0 0 0 0 0
20
40
60
80
100
120
DD LC NT VU EN CR EW EX NR
Spe
cie
s
NEC Red List Coral Distribution

ENVIRONMENTAL RESOURCES MANAGEMENT JST/MOTI
5-138
attractions they serve as nesting sites for sea turtles. This is discussed in
the next section under which Figure 5.60 displays the sandy beaches
intersected by the NEC.
5.4.4.18 Sea Turtle Nesting Sites
Three of the five species of species of sea turtles in Kenya nest on
Kenyan beaches. These are the green turtle, the hawksbill turtle and
more rarely, the olive ridley. They nest on a variety of beach types with
the basic requirements for a good nesting site are easy accessibility
to/from the sea and beach sand text that is fine enough to prevent
excessive slippage whilst the nest is being constructed. Other
considerations are the nature of the offshore approach, the slope of the
beach and the beach front vegetation. Although much progress has
been made in identifying key nesting sites, there has been inadequate
information on the status and extent of sea nesting beaches along the
Kenyan coast. This information is important in conservation decision
making.
Large numbers of migratory sea turtles - the loggerhead (Caretta caretta)
and leatherback (Demochelys coriacea) which can reach two meters in
length and weigh 500 kg - also forage in Kenyan waters, especially
around Wasini island at the south coast of Kenya. Other nesting areas
on the Kenyan Coast include Mpunguti ya chini, Funzi island,
Msambweni, Chale, Diani, English Point and Serena beach.
The predominant threats on sea turtle nesting beaches are shoreline
developments such as sea walls, soil erosion, predation (by humans,
crabs and birds), and human activity (such as fishing, tourism and
recreation). Figure 5.60 shows key sea turtle nesting sites in the NEC
although it is important to note that all sandy beaches can be
considered to be potential turtle nesting sites.

ENVIRONMENTAL RESOURCES MANAGEMENT JST/MOTI
5-139
Figure 5.60 Sandy Beaches and Turtle Nesting Sites
5.4.4.19 Transboundary Resources
Transboundary natural resources are identified and explained in the
Sections below.
5.4.4.19.1 Lake Victoria Catchment
Lake Victoria is a transboundary catchment shared amongst Uganda
(16%), Kenya (22%), Tanzania (44%), Rwanda (11%) and Burundi (7%)
(see Figure 5.61). The lake itself occupies an area of 178,710 km2 within
its catchment area of 499,870 km2. As a result of this size, L Victoria
plays a vital role in the ecology of the entire East African region. It
supports numerous fish and bird species, including the crested crane
and the Sitatunga, a globally threatened species of water antelope1.
L Victoria shapes regional weather patterns thus playing an important
ecological role. Its surface temperature is significantly correlated to the
basin-wide spatial distribution of rainfall through frictional and thermal
contrasts between lake surfaces and the adjoining land areas,
(Mukabana and Pielke 1996 as cited in Kelly L. (2009)1. Moreover, it is a
source of moisture and latent heat, both of which drive the tropical
climate in its surrounding area. As compared to other large inland
lakes, L Victoria effect on temperature and climate is more significant
1 Kelly L. (2009). Cooperation and Competition: Managing Transboundary Water Resources in
the Lake Victoria Region
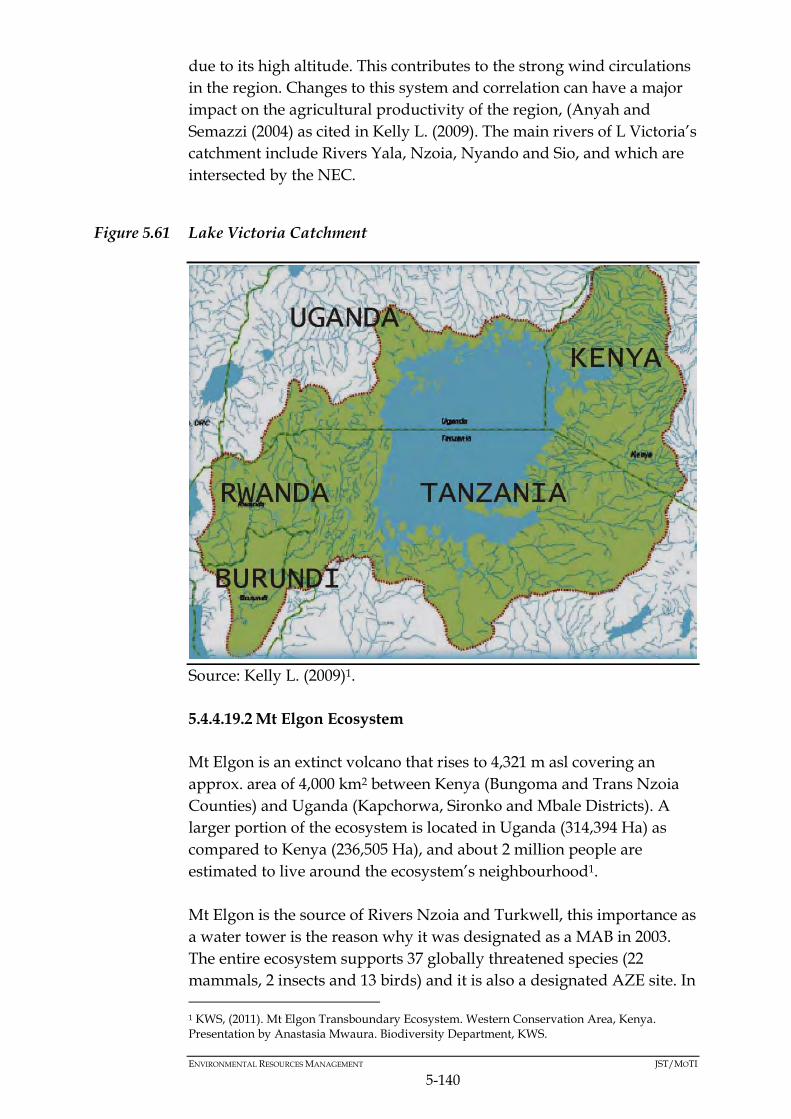
ENVIRONMENTAL RESOURCES MANAGEMENT JST/MOTI
5-140
due to its high altitude. This contributes to the strong wind circulations
in the region. Changes to this system and correlation can have a major
impact on the agricultural productivity of the region, (Anyah and
Semazzi (2004) as cited in Kelly L. (2009). The main rivers of L Victoria’s
catchment include Rivers Yala, Nzoia, Nyando and Sio, and which are
intersected by the NEC.
Figure 5.61 Lake Victoria Catchment
Source: Kelly L. (2009)1.
5.4.4.19.2 Mt Elgon Ecosystem
Mt Elgon is an extinct volcano that rises to 4,321 m asl covering an
approx. area of 4,000 km2 between Kenya (Bungoma and Trans Nzoia
Counties) and Uganda (Kapchorwa, Sironko and Mbale Districts). A
larger portion of the ecosystem is located in Uganda (314,394 Ha) as
compared to Kenya (236,505 Ha), and about 2 million people are
estimated to live around the ecosystem’s neighbourhood1.
Mt Elgon is the source of Rivers Nzoia and Turkwell, this importance as
a water tower is the reason why it was designated as a MAB in 2003.
The entire ecosystem supports 37 globally threatened species (22
mammals, 2 insects and 13 birds) and it is also a designated AZE site. In
1 KWS, (2011). Mt Elgon Transboundary Ecosystem. Western Conservation Area, Kenya. Presentation by Anastasia Mwaura. Biodiversity Department, KWS.
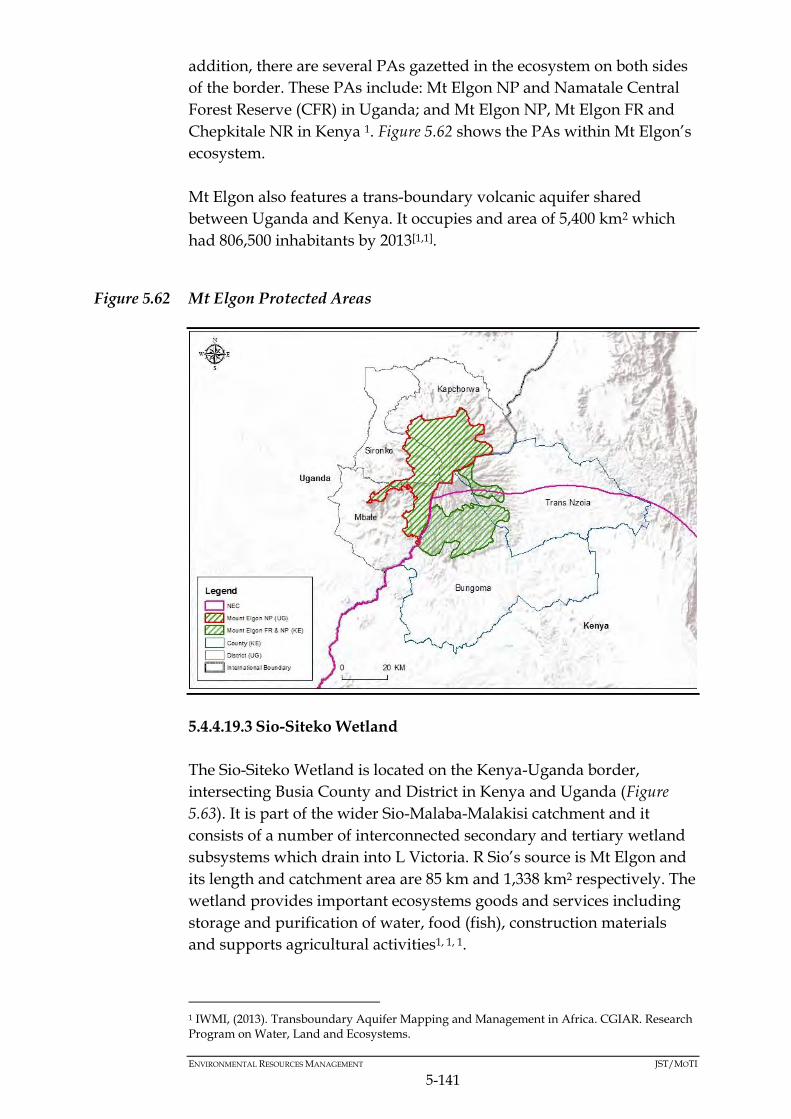
ENVIRONMENTAL RESOURCES MANAGEMENT JST/MOTI
5-141
addition, there are several PAs gazetted in the ecosystem on both sides
of the border. These PAs include: Mt Elgon NP and Namatale Central
Forest Reserve (CFR) in Uganda; and Mt Elgon NP, Mt Elgon FR and
Chepkitale NR in Kenya 1. Figure 5.62 shows the PAs within Mt Elgon’s
ecosystem.
Mt Elgon also features a trans-boundary volcanic aquifer shared
between Uganda and Kenya. It occupies and area of 5,400 km2 which
had 806,500 inhabitants by 2013[1,1].
Figure 5.62 Mt Elgon Protected Areas
5.4.4.19.3 Sio-Siteko Wetland
The Sio-Siteko Wetland is located on the Kenya-Uganda border,
intersecting Busia County and District in Kenya and Uganda (Figure
5.63). It is part of the wider Sio-Malaba-Malakisi catchment and it
consists of a number of interconnected secondary and tertiary wetland
subsystems which drain into L Victoria. R Sio’s source is Mt Elgon and
its length and catchment area are 85 km and 1,338 km2 respectively. The
wetland provides important ecosystems goods and services including
storage and purification of water, food (fish), construction materials
and supports agricultural activities1, 1, 1.
1 IWMI, (2013). Transboundary Aquifer Mapping and Management in Africa. CGIAR. Research Program on Water, Land and Ecosystems.

ENVIRONMENTAL RESOURCES MANAGEMENT JST/MOTI
5-142
The catchment and linked wetlands provide a habitat for several
species including 206 plants, 29 fish, 25 mammals, 8 reptiles and several
invertebrates. It is an IBA in which over 300 bird species have been
documented. These birds have included the globally threatened
Laniarius mufumbiri (Papyrus Gonolek) and Circus macrourus (Pallid
Harrier). Notable mammals found in the area include Vervet Monkey,
Otter, Sitatunga, Hippopotamus and Water Mongoose1, 1, 1.
Figure 5.63 Sio-Siteko Wetland
5.4.4.19.4 Western Indian Ocean
The Western Indian Ocean is shared amongst the East African states of
Kenya, Somalia and Tanzania. Its pelagic and benthic habitats support
numerous species some of which are globally threatened. Moreover, it
features numerous coastal and marine PAs in these three countries,
which are considered to be sensitivities by this study. Those PAs along
the coasts of Somalia, Kenya and Tanzania are shown in Figure 5.64.

ENVIRONMENTAL RESOURCES MANAGEMENT JST/MOTI
5-143
Figure 5.64 Indian Ocean PAs
5.4.4.19.5 Tsavo West National Park (NP)/Mkomazi NP
Tsavo West, located in southeast of Kenya and traversed by the NEC, is
adjoined to Mkomazi NP at the Kenya-Tanzania border. Although the
region of adjoinment between these two NPs is not intersected by the
NEC, this study considers the entire transboundary ecosystem to of
interest to the NEC. Tsavo West NP is discussed in Section 5.4.4 as a NP
and as an IBA. Mkomazi NP is located north-eastern Tanzania,
stretching over an area of 3,500 km2. Mkomazi NP intersects Umba
Game Reserve (GR), over a region that has a designated IBA. Thus these
two PAs support at least 405 bird species and other endangered species
of fauna such as Loxodonta africana (EN) (which are migratory between
Mkomazi NP and Tsavo West (TCA)), Panthera leo (VU), Acinonyx
jubatus (VU) and Diceros bicornis (CR) (introduced through a special
programme1. Figure 5.65 displays the location of this transboundary
PAs in context of the NEC.
1 BirdLife International, (2016). Important Bird and Biodiversity Area factsheet: Mkomazi Game Reserve. Retrieved March 17, 2016 from www.birdlife.org

ENVIRONMENTAL RESOURCES MANAGEMENT JST/MOTI
5-144
Figure 5.65 Tsavo West and Mkomazi National Parks
Box 5.8 Constraints - Sensitive and Designated Areas or Ecosystems
5.4.5 Anthropogenic Hazards
Kenya’s natural and social resources are placed at risk by a number of
anthropogenic hazards which frequently or continually occur driven by
economic and social factors. Four key hazards are discussed in this
The sensitive and designated areas or ecosystems, located within the
NEC are classed to be constraints because:
Despite their ecological and economic significance most of them are
at risk of degradation;
They are protected by national regulations in that some are
designated as PAs nationally whilst others are also designated
internationally under different classification systems;
The potential and consequences of degradation can be exacerbated
by the implementation of the NEC MP, and
Location and or development of infrastructure against the
provisions of their management plans can result in opposition from
local communities and conservation groups and subsequently
reputation losses for the NEC MP implementers.

ENVIRONMENTAL RESOURCES MANAGEMENT JST/MOTI
5-145
section namely pollution, climate change, groundwater over-abstraction and
unsustainable land use changes.
5.4.5.1 Pollution
In Kenya, air, water and soil pollution are mainly driven by a growth in
population that is not met with adequate services. This results in
pollution from the: by-products from the manufacture of the goods
demanded by this population, service industry used by this population
and the goods consumed by the same population. Other factors
contribute to the pollution such as the level of technological
advancement of the country, level of awareness, and enforcement of
and compliance with regulations. These drivers are not universal and
they would apply in any combination and interlinked manner for a
particular case of pollution.
Air pollution is primarily caused by emissions from motor vehicles,
emissions from dumpsites, industrial activities, land use changes, civil
and construction activities, combustion of fossil fuels and combustion
of green fuels (firewood, charcoal amongst others). Air pollution affects
both natural resources and humans reducing the quality of life. This
study notes that there has been an increase in cardio-respiratory
diseases in the country, that has been partly attributed to both indoor
and outdoor air pollution1. Lower outdoor air quality has been
documented in the urban and more populated regions in the NEC as
compared to rural and less populated areas. This is attributed to the
high density of people, vehicles and industries. On the contrary, rural
areas have higher preference to firewood as a fuel source and often
have lower indoor air quality. Amongst the NEC Counties firewood is
the main source of cooking fuel whilst tin lamps and lanterns (which
use paraffin) are also the most preferred mode of lighting in these
counties1.
Water and soil pollution are caused by improper disposal of solid
wastes; industrial, domestic and agricultural effluents, and accidental
spills from industries and transportation of hazardous or toxic wastes.
This study notes that Kenya does not have a single sanitary landfill,
therefore solid wastes are by and large not managed sustainably. This
has resulted in growing dumpsites in all major towns and cities such as
Dandora (Nairobi), Mwakirunge and Kibarani (Mombasa), Gioto
(Nakuru) and Mwenderi (Eldoret).
1 KNBS, (2014). Kenya Demographic and Health Survey 2014.

ENVIRONMENTAL RESOURCES MANAGEMENT JST/MOTI
5-146
Water and soil pollution have a variety of impacts on human health and
natural resources, depending of the characteristics of specific pollutants.
Low access to sanitation in the country is a precursor to these forms of
pollution and contributes to a high prevalence of water-borne diseases.
Water pollution is in addition identified as one of the threats in all the
wetlands and water resources in the NEC that places them at risk of
degradation and reducing their ecological integrity1. On the other hand,
soil pollution or land contamination is a co-factor in land degradation
which lowers land productivity in the country.
5.4.5.2 Climate Change
Climate change is considered to be amongst the most significant threats
facing Kenya. This is even though the country is amongst the low
emitters of Greenhouse Gases (GHGs) globally. The country was
estimated to emit 0.33 MTC in 2011[1], meaning that whilst the country
plays a small role toward the emission of GHGs, it is mostly vulnerable
to the associated effects of climate change. Kenya was ranked 154 out of
180 countries in the ND-GAIN2 index in 2014[3]. This is attributed to
prevailing poverty levels which manifests in low coping, resilience and
adaptive capacity in majority of the population which leaves them
predisposed to hazards. The ASAL regions of the country are
particularly most vulnerable since they have the highest poverty levels
across the country. On the broad scale, lack of a comprehensive legal
and policy framework on land management also contributes to Kenya’s
climate change vulnerability. This is because the situation results in
land fragmentation and disparities in ownership which cause conflict
and disincentivize sustainable investments on the lands or conservation
practices1.
Studies have elucidated that the effects of climate change are already
being experienced in Kenya. The country warmed by 1 °C from 1960 to
2010, with projections suggesting that it will rise to 2.5 °C by 2050.
General trends of increases in temperature and reduced rainfall over
long-term means have been observed in the country. These changes
place the country’s economic goals at risk since they have been
associated with short and long-term negative effects on agriculture,
health and tourism. Adding on to this, it is postulated that climate
change would increase the frequency of natural hazards such as floods,
1 World Bank, (2016). CO2 emissions (metric tons per capita). Data on Kenya. 2 The ND-GAIN Country Index summarizes a country's vulnerability to climate change and other global challenges in combination with its readiness to improve resilience. It measures the overall vulnerability by considering vulnerability in six life-supporting sectors – food, water, health, ecosystem service, human habitat and infrastructure. 3 ND-GAIN, (2014). Country Rankings. Retrieved March 23, 2016 from http://index.gain.org/ranking

ENVIRONMENTAL RESOURCES MANAGEMENT JST/MOTI
5-147
El Nino and drought. Climate change is in addition amongst the co-
factors of land degradation and desertification, especially since 80% of
the country comprises ASALs1.
Another potential effect of climate change is reduction in water
availability due to negative variance in the hydrometeorological
regimes brought about by rising temperatures. Models applied at the
national level predict decreases of 50-150 mm between 2000 and 2025
for most of the country with higher decreses in the ASALs. This would
increase competition for water resources since the country is already
water scarce and has a growing population. About 98% of Kenya’s crop
production is rain-fed and this reliance predisposes the sector and
majority of farmers to the risk of climate change- or climate variability-
induced crop failure. Moreover, women are most vulnerable since they
manage 40% of smallholder farms whilst providing 80% of the labour
for crop production1.
Lastly, sea-level rise along the coast has already been documented
whereas it increases the risks of coastal erosion, loss of coastal wetlands,
loss of agricultural land, infrastructure damages from storm surges and
salt intrusion. It is estimated that sea-level rise in Kenya can result in
losses of 7-58 million USD per year by 2030 and 31-313 USD million per
year by 2050[1].
In summary, the risks and impacts of climate change in Kenya have
been postulated by NEMA (2015) to be those given in the table below.
1 Netherland Commission for Environmental Assessment, (2015). Climate Change Profile Kenya. Dutch Sustainability Unit.

ENVIRONMENTAL RESOURCES MANAGEMENT JST/MOTI
5-148
Table 5.23 Summary of Climate Change Risks and Impacts in Kenya
Sector Impacts and Risks
Water Resources This is already affected by inter- and intra-annual rainfall variability, including the extremes of flooding
and drought. Climate change may further reduce the availability of water resources through altered
rainfall patterns, higher evaporation, lower lake levels, accelerated loss of glaciers and rising sea level.
Food Security The agriculture, livestock and fisheries sector is key for Kenya in terms of employment, food security,
livelihoods and economic development. Climate change has the potential to significantly affect
agriculture-based livelihoods by challenging the sustainability of current arable, pastoral and fishing
practices.
Coastal Zones Increases in sea surface temperature, sea level rise and coastal erosion are likely to put additional
pressure on coastal ecosystems, including islands, estuaries, beaches, coral reefs and marine
biodiversity. Coral reef ecosystems are particularly vulnerable to climate change impacts, with
associated consequences for the livelihoods of millions of people depending on those ecosystems for
food, income and shoreline protection. In coastal locations, ports and transport infrastructure is
particularly exposed due to flooding, together with tourism assets and settlements situated close to the
coast.
Human Health Climate change is expected to put human health at risk by exacerbating the magnitude and occurrence
of existing impacts, such as heat stress, air pollution, asthma, vector-borne diseases (such as malaria,
dengue, schistosomiasis – also referred to as swimmer’s itch or snail fever – and tick-borne diseases),
water-borne and food-borne diseases (such as diarrhoeal diseases).
Forestry and Wildlife Anticipated impacts of climate change on biodiversity include shifting of ecosystem boundaries, change
in natural habitats and sharp increases in extinction rates for some species.
Urban and Housing Climate change is likely to make rural livelihood strategies and living conditions increasingly
challenging and as a result is likely to exaggerate the current rural-to-urban migration trend. Specific
risks and challenges for communities, especially those living in urban environments and particularly the
most vulnerable, include river and flash flooding, with flood-related fatalities constituting 60 per cent of
disaster victims in Kenya. Extreme events also have indirect impacts through water scarcity and quality
issues and food insecurity.
ASALs Over the past few decades, transformations in the ASALs have impacted the livelihoods of the
pastoralists. The migration of rural communities from the congested high-potential areas and the dry
arid areas to cities has contributed to overpopulated slums and settlements that lack basic services.

ENVIRONMENTAL RESOURCES MANAGEMENT JST/MOTI
5-149
Sector Impacts and Risks
Implications for women included the additional burden of sustaining household food, water and
human security. School attendance rates for children has decreased, child labour increased land conflicts
over resources have intensified in such situations.
Tourism Climate variability and climate change, partnered with broader environmental degradation has the
potential to significantly affect the tourism sector, including wildlife tourism. With its close connections
to the environment and climate itself, tourism is considered to be a highly climate-sensitive industry.
Manufacturing,
Transport and trade
Impacts to critical supporting infrastructure, such as energy, water, communications and transport,
have the potential to reverberate into the private sector, with consequences for business continuity,
revenue, workforce and associated supply chains. Climate induced changes affecting productivity and
crop diversity, in the tea, coffee and horticulture sectors, have implications for exports and imports
Infrastructure (for
energy and transport)
Climate change has the potential to compromise infrastructure design, function and performance across
a range of settings. In coastal locations, ports and transport infrastructure is particularly exposed.
Riverine flooding and landslides have the potential to cause significant damage to physical
infrastructure such as roads, bridges, water pipelines and power lines.
Source: NEMA, (2015)1.
1 NEMA, (2015). Kenya Second National Communication to the United Nations Framework Convention on Climate Change.

ENVIRONMENTAL RESOURCES MANAGEMENT JST/MOTI
5-150
5.4.5.3 Groundwater Over-Abstraction
Groundwater plays a vital role in water supply in Kenya, a water scarce
country. It either supplements surface supplies or in other cases is the
main mode water access. It is observed that amongst the NEC Counties
an average of 27% households per county depend on it as the main
mode of supply1. In spite of its importance it has been observed that
only about 17.3% of the annual available renewable groundwater is
utilized in the country4. However, due to growing demand
groundwater is often abstracted unsustainably particularly in densely
populated areas such as urban areas. It is observed that of the 44,754
boreholes that were existent in Kenya by 2012, 49.2% and 34.6% were
located in the Athi and Rift Valley catchment areas or basins1.
Amongst the dominant drivers of over-abstraction is the country’s
weak legal framework of groundwater management. Kenya does not
have explicit limitations on spacing of boreholes but regulations rather
recommend authorities to establish these limits through evaluations on
groundwater availability. Such evaluations have not been done in the
case of most aquifers and thus abstraction permits are issued on a case
by case basis. Moreover, only one Groundwater Conservation Area
(GCA) has been established in the country and it is not enforced1. This
GCA is in Nairobi.
Potential impacts of over-abstraction include land subsidence, falling
water table, pollution and increased competition for reducing
resources. Increased competition and pollution promote malpractices
such as abstracting groundwater against the conditions of abstraction
permits. In areas such as Nairobi, competition, pollution and
availability of groundwater has led to increases in the depth of
boreholes and establishment of illegal boreholes.
5.4.5.4 Unsustainable Land Use Change
The growth of the population in Kenya post-independence has led to
increases in demand for goods and services provided through land
based resources. This has led to conversion of more land for commercial
and residential purposes in addition to increased consumption of
natural resources. These changes in land use have not been sustainable
on several occasions whilst population growth reduced the amount of
land available per capita reduced from 9.6 Ha in 1950 to 1.7 Ha in
2005[1]. Poor enforcement of regulations and a weak governance
framework on land further challenge sustainable utilization of land.
1 Ochillo D., (2012). Groundwater Governance and Policies in Kenya: Institutional Structure and Legal Settings. WRMA Presentation.

ENVIRONMENTAL RESOURCES MANAGEMENT JST/MOTI
5-151
Incompatible land uses thus occur against existing regulations and
policies.
Unsustainable land use changes place the country’s natural resource at
risk of degradation in addition to leading to precarious and illegal
settlements. Documented impacts of unstainable land use changes
include amongst others:
Loss of biodiversity including in sensitive areas such as forests,
wetlands and PAs
Habitat degradation
Increased emissions of GHGs
Increased run-off
Reduction in water quality and availability
Hotspots in which land use changes are deemed to be significant in the
NEC include:
Nairobi NP
Mlolongo Township
L Nakuru Ecosystem
L Naivasha Ecosystem
The Mau Forest Complex
Source: UNEP, (2009)1.

ENVIRONMENTAL RESOURCES MANAGEMENT JST/MOTI
6-1
6 SOCIO-ECONOMIC BASELINE
6.1 INTRODUCTION
The purpose of this Chapter is to describe the socio-economic receiving
environment within which the NEC is located. The baseline provides a
critical contextual component for identifying and assessing any
potential socio-economic impacts of the Master Plan.
The NEC traverses 29 Counties in the main route (as indicated in Box
6.1 and Figure 6.1 below) and 4 Counties in the sub-route (as shown in
Box 6.2) As the coverage area of the NEC Master Plan is so extensive,
the level of baseline information collected is at national and county
levels.
Box 6.1 NEC Counties along the Main Route of the NEC
Box 6.2 NEC Counties along the Sub-Route of the NEC
Counties that are fully transversed by the NEC main route
include Mombasa, Makueni, Nairobi, Kiambu, Muranga,
Nyandarua, Nakuru, Uasin Gishu, Kericho, Nandi, Kisumu,
Vihiga, Kakamega Siaya and Busia.
Counties that are partially transversed by the NEC main route
are Kwale, Kilifi, Kitui, Kajiado, Narok, Nyeri, Laikipia, Baringo,
Elgeyo Marakwet and Trans Nzioa.
Counties that are traversed by the NEC sub-route are Trans
Nzoia, West Pokot, Elgeyo Marakwet and Turkana
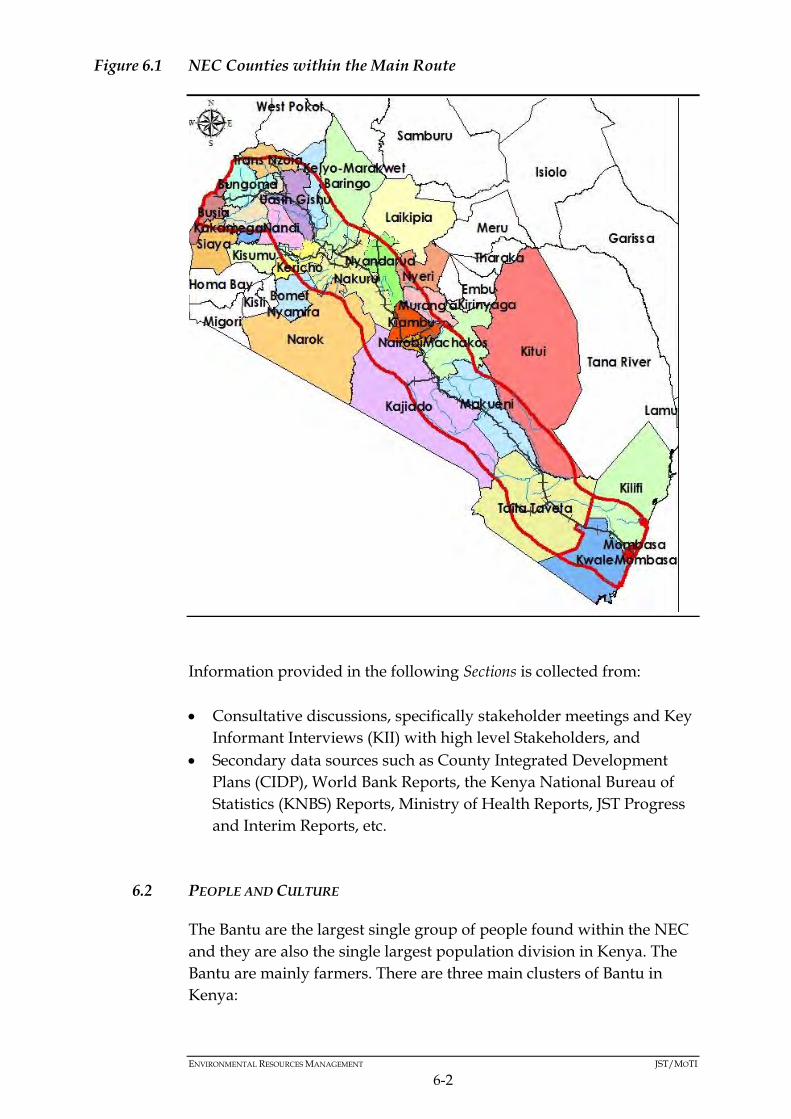
ENVIRONMENTAL RESOURCES MANAGEMENT JST/MOTI
6-2
Figure 6.1 NEC Counties within the Main Route
Information provided in the following Sections is collected from:
Consultative discussions, specifically stakeholder meetings and Key
Informant Interviews (KII) with high level Stakeholders, and
Secondary data sources such as County Integrated Development
Plans (CIDP), World Bank Reports, the Kenya National Bureau of
Statistics (KNBS) Reports, Ministry of Health Reports, JST Progress
and Interim Reports, etc.
6.2 PEOPLE AND CULTURE
The Bantu are the largest single group of people found within the NEC
and they are also the single largest population division in Kenya. The
Bantu are mainly farmers. There are three main clusters of Bantu in
Kenya:
ENVIRONMENTAL RESOURCES MANAGEMENT JST/MOTI
6-3
Those near the Coast and in the plains a short distance inland. These
are mainly the Pokomo, Taita, Makonde, Taveta tribes as well as the
'nine tribes' of the Mijikenda;
The Central Highlands Bantu, mainly found around Mount Kenya
and the Nyandarua (Aberdare) Range. These are comprised of the
Chuka, Embu and Mbeere, Kamba, Kikuyu, Meru and various
related tribes; and
Those in and to the north of the Lake Victoria Basin in the far west
of the country, specifically the Gusii (Kisii), Kuria, and the various
Luhya sections (1) .
Although each of these tribes shares Bantu as a root language, their
own languages (of which there are usually many dialects and
variations) are not necessarily mutually understandable.
The second largest group of people within the NEC are the Nilotes. The
Nilotic-speaking tribes comprise the Luo, Maasai, Pokot, Samburu,
Turkana, and many of the subgroups which constitute the Kalenjin.
They mainly occupy the western Kenya's Rift Valley. The Nilotes are
traditionally cattle-herders, although some groups, notably the Luo and
Kalenjin, have converted to agricultural ways of life.
While this classification of people is true for most rural areas and some
smaller towns, the same cannot be said of big towns such as Nairobi,
Nakuru and Mombasa. In these areas, there are diverse people
including other Africans, Arabs, Indians and Europeans who come
from different cultural backgrounds (2).
The two main groups of people in the NEC are Bantus and Nilotes and,
culturally are farmers. Therefore most of the goods expected to
originate from the areas these people occupy will be mostly agricultural
goods; food and cash crops and, live animals and animal products.
Conversely, these groups of people constitute the market for
agricultural inputs as well as a market for industrial consumer goods.
6.3 DEMOGRAPHIC PROFILE
6.3.1 Population
According to the Kenya National Bureau of Statistics (KBNS) (3),
Kenya’s population is projected to be 47.47 million by 2017, an increase
of over 1.2 million since 2016. The natural increase is expected to be
(1) http://www.bluegecko.org/kenya/contexts/bantu.htm (2) http://www.bluegecko.org/kenya/contexts/nilotes.htm
(3) KNBS, Population and Housing Census 2009

ENVIRONMENTAL RESOURCES MANAGEMENT JST/MOTI
6-4
positive, as the number of births will exceed the number of deaths by 1,
247,263.
Table 6.1 below shows the population between 1951 and 2010, while
Table 6.2 shows the Country’s projected population from 2020-2050.
Table 6.1 Kenya's Population 1951-2010
Year 1951 1960 1970 1980 1990 2000 2010
Pop. 6,158,56
7
7,982,96
0
11,060,0
92
15,964,6
60
23,057,2
34
30,683,5
30
39,799,1
51
Source: KNBS, 2009
Table 6.2 Kenya's Projected Population 2020-2050
Year 2020 2025 2030 2035 2040 2045 2050
Pop. 52,186,7
22
58,610,1
70
65,411,9
01
72,599,5
75
80,090,7
25
87,770,4
96
95,504,6
36
Source: KNBS, 2009
Box 6.3 Opportunities - Increasing Population
A growing population can generate economic growth
The labour force increases if the rise in population has resulted
from an increase in the birth rate or immigration. The expanding
economy industries can recruit new workers to the labour from
this labour force
If the population is above the optimum size, the country will be
able to make better use of its resources
A large population translates into a greater domestic market, a
stimulating investment in knowledge and attracting investors
and multinational companies in areas that previously lacked
them

ENVIRONMENTAL RESOURCES MANAGEMENT JST/MOTI
6-5
Box 6.4 Constraints - Increasing Population
6.3.2 Population Density
Within the NEC, high population densities occur in the following
Counties: Mombasa, Nairobi, Machakos, Kiambu, Muranga, Nyeri,
Nyandarua, Trans Nzoia, Bungoma, Kericho, Kakamega, Vihiga, Siaya,
Kisumu, and Bomet. Moderate population densities are found in
Makueni, Uasin Gishu, Nakuru, Tran Nzioa and Nandi Counties. Low
population densities are in Taita Taveta, Kajiado, Narok and Elgeyo
Marakwet Counties (see Figure 6.2).
Box 6.5 Constraint - High Population Density
If a country is currently overpopulated and agricultural
productivity is low, there is a risk that the country may not be
able to feed more dependants
Resources which could have been used to improve living
standards may have to be devoted to the provision of goods and
services for the extra number of dependants in the population
Increases in population may put pressure on the government to
divert resources from productive sectors to provision of social
services
More people in a country will exert pressure on natural
resources
An increase in the number of people of working-age without a
corresponding increase in appropriate skills and jobs will result
in unemployment
More dependants in the population may result into an increased
burden on the working population and the economy.
Densely populated areas within the NEC means that implementation of
some the Development Strategies would require that many people are
displaced and resettled elsewhere and their properties compensated
appropriately. High resettlement and compensation costs can in turn
make the infrastructure projects costly.

ENVIRONMENTAL RESOURCES MANAGEMENT JST/MOTI
6-6
Figure 6.2 Population Density in the NEC Main Route
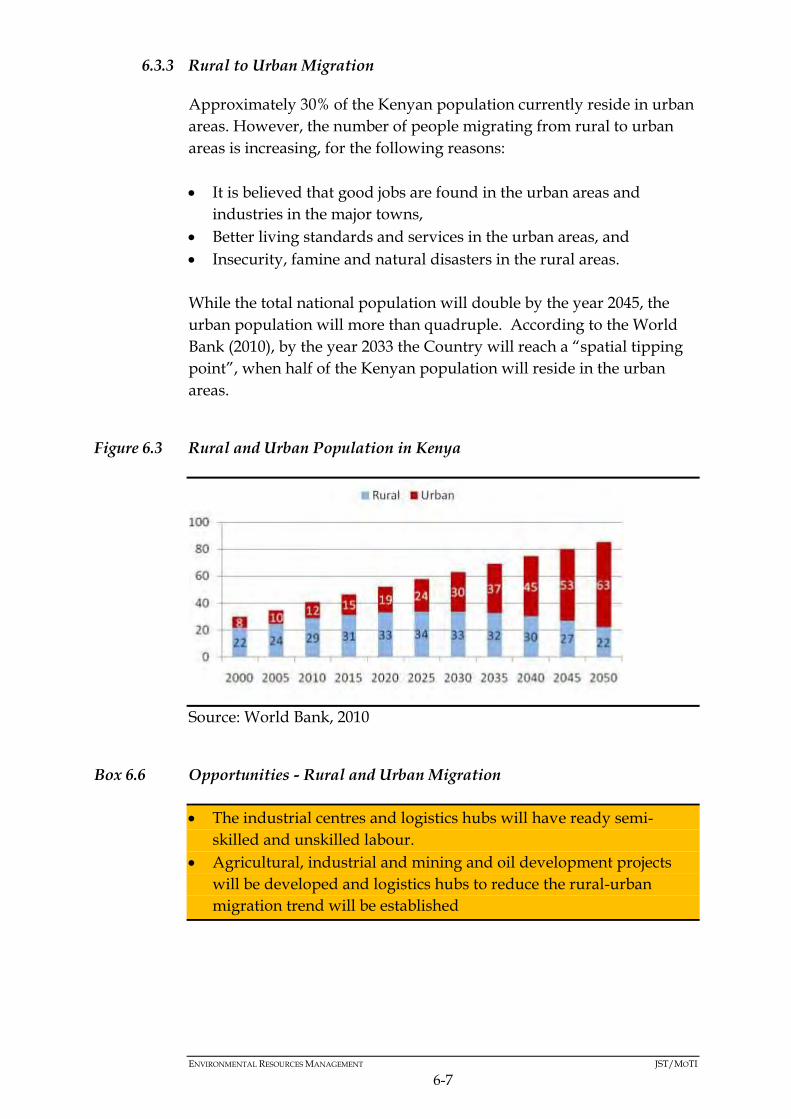
ENVIRONMENTAL RESOURCES MANAGEMENT JST/MOTI
6-7
6.3.3 Rural to Urban Migration
Approximately 30% of the Kenyan population currently reside in urban
areas. However, the number of people migrating from rural to urban
areas is increasing, for the following reasons:
It is believed that good jobs are found in the urban areas and
industries in the major towns,
Better living standards and services in the urban areas, and
Insecurity, famine and natural disasters in the rural areas.
While the total national population will double by the year 2045, the
urban population will more than quadruple. According to the World
Bank (2010), by the year 2033 the Country will reach a “spatial tipping
point”, when half of the Kenyan population will reside in the urban
areas.
Figure 6.3 Rural and Urban Population in Kenya
Source: World Bank, 2010
Box 6.6 Opportunities - Rural and Urban Migration
The industrial centres and logistics hubs will have ready semi-
skilled and unskilled labour.
Agricultural, industrial and mining and oil development projects
will be developed and logistics hubs to reduce the rural-urban
migration trend will be established
ENVIRONMENTAL RESOURCES MANAGEMENT JST/MOTI
6-8
Box 6.7 Constraint - Rural and Urban Migration
6.4 EDUCATION PROFILE
Major urban areas in Kenya have high education levels but there are
very large disparities with regards to levels of education within these
populations. Mombasa, Nairobi, Nakuru, Eldoret and Kisumu all have
gaps between highest and lowest wards in share of residents with
secondary school education or higher levels. In most rural counties,
education levels are lower but the gap, while still large, is somewhat
lower than that experienced in urban areas (1) .
The share of residents with secondary education or higher in Nairobi
(50.8%) is more than that of an average Kenyan County. Conversely,
those living in rural counties are less likely to have any secondary
education compared to an average Kenyan. The proportion of
individuals with secondary education in male headed households is
higher than that for female headed households across all Counties.
The Counties with the highest share of primary education are
concentrated in the Western part of the Country, specifically Siaya,
Vihiga and Busia. Elgeyo Marakwet. Figure 6.4 below shows the
education levels in the Country.
(1) KNBS & SIDS, 2013. Exploring Kenya's Inequality. Pulling Apart or Pooling Together?
Rural areas are deprived of labour in agricultural sector leading
to decline or slow growth of agricultural output; and families
and cultural bonds break or weaken as the population moves to
the urban areas.
As the population moves to the urban areas, unemployment
increases, crime rates rise, slums or shanties develop and social
services become inadequate.
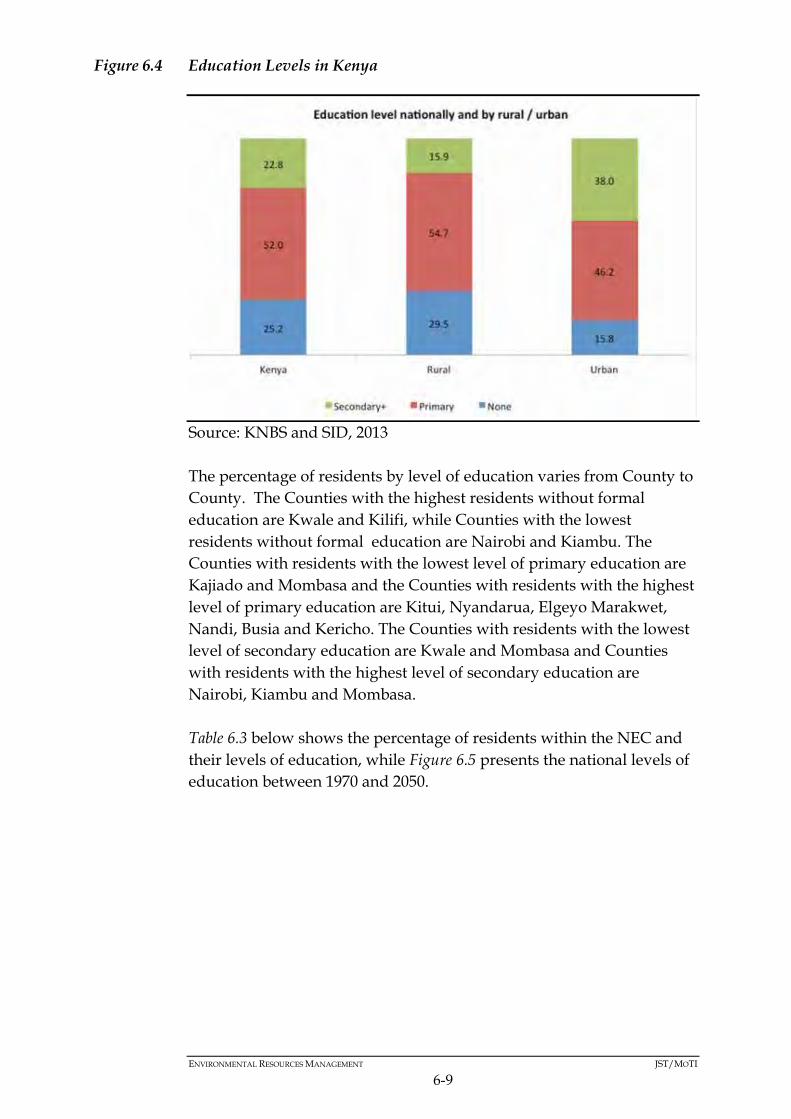
ENVIRONMENTAL RESOURCES MANAGEMENT JST/MOTI
6-9
Figure 6.4 Education Levels in Kenya
Source: KNBS and SID, 2013
The percentage of residents by level of education varies from County to
County. The Counties with the highest residents without formal
education are Kwale and Kilifi, while Counties with the lowest
residents without formal education are Nairobi and Kiambu. The
Counties with residents with the lowest level of primary education are
Kajiado and Mombasa and the Counties with residents with the highest
level of primary education are Kitui, Nyandarua, Elgeyo Marakwet,
Nandi, Busia and Kericho. The Counties with residents with the lowest
level of secondary education are Kwale and Mombasa and Counties
with residents with the highest level of secondary education are
Nairobi, Kiambu and Mombasa.
Table 6.3 below shows the percentage of residents within the NEC and
their levels of education, while Figure 6.5 presents the national levels of
education between 1970 and 2050.

ENVIRONMENTAL RESOURCES MANAGEMENT JST/MOTI
6-10
Table 6.3 Percentage of Residents by Level of Education (in %)
County No
educati
on
Primary
educati
on
Seconda
ry
educatio
n
County No
educati
on
Primary
educati
on
Seconda
ry
educatio
n
Mombas
a
17 46 37 Narok 38 51 11
Kwale 39 51 10 Nakuru 17 55 28
Kilifi 36 52 13 Baringo 36 48 16
T.Taveta 18 60 21 U.Gishu 17 54 29
Kitui 25 62 14 Nandi 19 63 19
Makueni 17 62 21 E.Marak
wet
20 62 18
Kajiado 31 42 28 T. Nzoia 20 59 21
Machako
s
15 58 27 Kakameg
a
21 61 19
Nairobi 11 39 51 Vihiga 18 63 20
Kiambu 12 48 40 Bungoma 18 61 21
Muranga 14 62 25 Busia 23 62 16
Nyandar
ua
16 62 22 Kericho 16 62 22
Nyeri 12 54 34 Kisumu 18 57 25
Laikipia 24 53 23 Siaya 16 64 20
Bomet 17 64 19 West
Pokot
55 38 06
Turkana 82 15 03
Source: KNBS & SID Report, 2013
Figure 6.5 Education Levels in Kenya, 1970-2050
Source: World Bank, 2010

ENVIRONMENTAL RESOURCES MANAGEMENT JST/MOTI
6-11
Box 6.8 Opportunities - High Education Levels
Box 6.9 Constraints - High Education Levels
6.5 HEALTH PROFILE
According to the Ministry of Health (2013), Kenya currently has a total
of 9,694 health facilities that are government, private, NGO and
religious owned. The majority of Kenya’s population within the NEC
receives healthcare services from the public sector. The range of services
includes:
preventive services, which includes routine childhood
immunizations and environmental activities to control mosquito
breeding,
promotive services that are mostly educational services
provided to the general population on healthy lifestyles and
available interventions, and
curative and rehabilitative services, which include all treatment
activities available at hospitals and other healthcare facilities.
Under the devolved government system, healthcare facilities are
organised into 6 levels as follows:
High education levels will provide a steady workforce for the
NEC Development Strategy Projects
High education levels will also result in workers with higher
incomes that ultimately contribute more through taxes over the
course of their lifetimes.
High education levels without relevant and sufficient skills for
agricultural, industrial mining and oil development and
transport infrastructure projects would result in structural and
frictional unemployment and a waste of manpower.
Lack of relevant and sufficient skilled manpower locally would
mean the County would have to depend on foreign manpower
to develop the agriculture, industrial, mining and oil and
transport infrastructure projects proposed in the NEC Master
Plan. As foreign manpower would be paid in foreign currencies,
this would result into loss of scarce foreign exchange for the
country

ENVIRONMENTAL RESOURCES MANAGEMENT JST/MOTI
6-12
Level 1: Community Health Services, which are community-
based demand services,
Level 2: Dispensaries for both public and private health services
providers,
Level 3: Health Centres, provided by county governments
Level 4: Sub County Referral Hospitals, which are managed by
the respective County Governments,
Level 5: County Referral Hospital, which are managed by the
National Government, and
Level 6: National Referral Hospitals, which comprise of
facilities that provide highly specialized services and include all
tertiary referral facilities.
In the NEC, all 29 counties have Level 1-4 healthcare facilities. Only 6
Counties have Level 5 health care facilities, namely:
Nairobi County (Kenyatta National Hospital),
Mombasa County (Coast General Hospital),
Nakuru County (Nakuru Hospital),
Kisumu County (Kisumu Hospital), and
Kakamega County (Kakamega Hospital).
Within the NEC, there are a total of 4 Level 6 healthcare facilities as
follows:
Kenyatta National Hospital, Spinal Injury Hospital and Mathere
Mental Hospital in Nairobi County, and
Moi National and Teaching Hospital in Uasin Gishu County.
In 2012, the Country had an average of 19 doctors and 173 nurses per
100,000 population, compared to WHO recommended minimum
staffing levels of 36 and 356 doctors and nurses per 100,000 people (1) .
About 52% of Kenya’s population have access to basic health services
within 5 km. Access to basic primary health care and referral services,
however, still remains a significant challenge. Significant disparities in
service availability exist between rural and urban areas and in hard to
reach areas. Mortality rates remain high and the causes of death in both
the Country and NEC Counties include:
HIV/AIDS (29.3%),
perinatal conditions (9.0%),
lower respiratory infections (8.1%),
tuberculosis (6.3%),
diarrhoea (6.0%), and
(1) Health Sector Working Group Report, 2012
ENVIRONMENTAL RESOURCES MANAGEMENT JST/MOTI
6-13
malaria (5.8%).
Other causes of death include cerebrovascular diseases, ischaemic heart
disease, road traffic accidents and violence.
Box 6.10 Opportunities - Health
Box 6.11 Constraints - Health
6.6 SOCIAL INFRASTRUCTURE
6.6.1 Water and Sanitation
Most of the residents in the NEC use improved sources of water. An
improved drinking-water source is defined as one that, by nature of its
construction or through active intervention, is protected from outside
contamination, in particular from contamination with faecal matter (1).
However, less than half of the residents in Kwale, Makueni, Kitui,
Machakos, Muranga, Baringo, Nandi, Bomet and Siaya Counties use
unimproved sources of water, as presented in Table 6.3 below.
(1) http://www.wssinfo.org/definitions-methods/watsan-categories/
Availability of adequate health facilities and health workers in
the NEC will control common diseases such as Malaria and
HIV/AIDS. This will increase the quality of labour force in the
NEC and consequently increase overall productivity in
agricultural, industrial and transport sectors.
The strategy to move cargo from the trucks to the railway and
pipeline will decrease the spread of HIV/Aids along the major
trucking routes.
Poor access to basic primary health care
High mortality rates
Low staffing levels of doctors and nurses
Prevalence of communicable disease in the country
Poor health affects the quality of labour

ENVIRONMENTAL RESOURCES MANAGEMENT JST/MOTI
6-14
Table 6.4 Percentage of Residents Using Improved and Unimproved Water
Sources by NEC County
County Improved
water source
(percentage)
Unimproved
water sources
(percentage)
County Improved
water source
(percentage)
Unimproved
water sources
(percentage)
Mombasa 76 24 Nakuru 60 40
Kwale 47 53 Baringo 24 76
Kilifi 64 36 U.Gishu 74 26
Taita Taveta 68 32 Nandi 37 63
Kitui 26 74 E.Marawet 51 49
Makueni 36 64 Trans Nzoia 65 35
Kajiado 66 34 Kakamega 61 39
Machakos 37 63 Vihiga 63 37
Nairobi 84 16 Bungoma 73 27
Kiambu 75 25 Busia 61 29
Muranga 41 59 Kericho 40 60
Nyandarua 59 41 Bomet 24 76
Nyeri 64 36 Kisumu 54 56
Laikipia 50 50 Siaya 36 64
Narok 21 79 West Pokot 25 75
Turkana 39 61 - - -
Source: Compiled from KNBS & SID Reports, 2013
Box 6.12 Opportunities - Water
Box 6.13 Constraint – Water
Inadequate water supplies in the NEC will make it possible for
relevant authorities to plan for better water use, conservation
and management of water resources.
It is essential to ensure that the NEC is planned to protect water
resources and water harvesting areas to protect water quality
Lack of access to improved water services is a cause of water
borne diseases
Women and children labour is spent more on looking for water
rather than for productive purposes
Lack of water frustrates the demand of the commodity for
domestic use, food production and industrial development
Water shortages due to drought limit the amount of hydro-
electric power produced in the country. This adversely affects
industries and businesses

ENVIRONMENTAL RESOURCES MANAGEMENT JST/MOTI
6-15
6.6.2 Energy
Majority of the residents in the NEC use firewood for cooking followed
by charcoal (see Table 6.5). LPG is the least used energy source for
cooking. Paraffin is mostly used in Mombasa, Nairobi and Kiambu
Counties. This means that if the present rate of using firewood and
charcoal is not well managed, more trees in the NEC will be harvested
in future. Loss of trees would result in deforestation, especially if the
rate of tree planting is less than the rate at which trees are harvested (as
is the case presently).
Table 6.5 Percentage Energy Use for Cooking by NEC County
County LP
G
Paraffi
n
Firewoo
d
Charcoa
l
County LP
G
Paraffi
n
Firewoo
d
Charcoa
l
Mombasa 9 39 6 41 Nakuru 5 8 46 40
Kwale 1 6 80 11 Baringo 1 1 87 11
Kilifi 2 8 67 21 U.Gishu 5 7 55 32
Taita
Taveta
2 5 69 24 Nandi 1 1 89 8
Kitui 1 2 89 8 E.Marakwe
t
1 1 90 8
Makueni 1 3 85 11 T.Nzoia 1 3 77 18
Kajiado 13 19 41 25 Kakamega 1 2 87 9
Machakos 3 11 69 16 Vihiga 1 2 91 6
Nairobi 23 54 1 17 Bungoma 1 2 85 11
Kiambu 13 23 35 26 Busia 1 2 84 13
Muranga 2 6 85 7 Kericho 1 2 84 12
Nyandaru
a
1 1 78 19 Bomet 1 2 92 5
Nyeri 5 5 73 16 Kisumu 3 7 58 29
Laikipia 3 3 65 29 Siaya 1 2 82 15
Narok 1 2 80 17 West Pokot 1 1 91 7
Turkana 1 1 87 11 - - - - -
Source: Compiled from KNBS & SID Reports, 2013
6.6.3 Housing
Majority of residents in the 29 Counties of the NEC have houses with
corrugated iron sheet roofs (see Table 6.6). Muranga and Nairobi
Counties have substantial percentages of residents that have houses
with concrete roofs.
In the event that residents along the Corridor are required to give-way
to development of some of the proposed NEC projects, they would
have to be relocated and resettled elsewhere. Compensation for loss of
housing would take into account the costs of materials used to build the
houses.
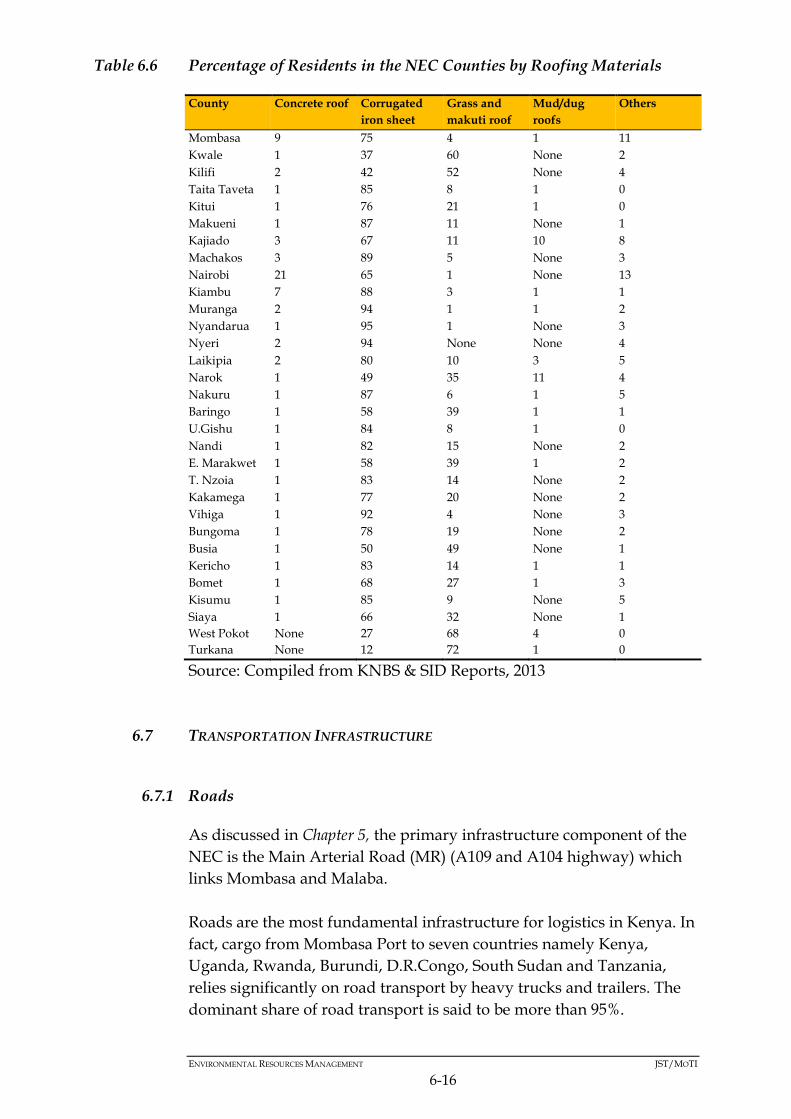
ENVIRONMENTAL RESOURCES MANAGEMENT JST/MOTI
6-16
Table 6.6 Percentage of Residents in the NEC Counties by Roofing Materials
County Concrete roof Corrugated
iron sheet
Grass and
makuti roof
Mud/dug
roofs
Others
Mombasa 9 75 4 1 11
Kwale 1 37 60 None 2
Kilifi 2 42 52 None 4
Taita Taveta 1 85 8 1 0
Kitui 1 76 21 1 0
Makueni 1 87 11 None 1
Kajiado 3 67 11 10 8
Machakos 3 89 5 None 3
Nairobi 21 65 1 None 13
Kiambu 7 88 3 1 1
Muranga 2 94 1 1 2
Nyandarua 1 95 1 None 3
Nyeri 2 94 None None 4
Laikipia 2 80 10 3 5
Narok 1 49 35 11 4
Nakuru 1 87 6 1 5
Baringo 1 58 39 1 1
U.Gishu 1 84 8 1 0
Nandi 1 82 15 None 2
E. Marakwet 1 58 39 1 2
T. Nzoia 1 83 14 None 2
Kakamega 1 77 20 None 2
Vihiga 1 92 4 None 3
Bungoma 1 78 19 None 2
Busia 1 50 49 None 1
Kericho 1 83 14 1 1
Bomet 1 68 27 1 3
Kisumu 1 85 9 None 5
Siaya 1 66 32 None 1
West Pokot None 27 68 4 0
Turkana None 12 72 1 0
Source: Compiled from KNBS & SID Reports, 2013
6.7 TRANSPORTATION INFRASTRUCTURE
6.7.1 Roads
As discussed in Chapter 5, the primary infrastructure component of the
NEC is the Main Arterial Road (MR) (A109 and A104 highway) which
links Mombasa and Malaba.
Roads are the most fundamental infrastructure for logistics in Kenya. In
fact, cargo from Mombasa Port to seven countries namely Kenya,
Uganda, Rwanda, Burundi, D.R.Congo, South Sudan and Tanzania,
relies significantly on road transport by heavy trucks and trailers. The
dominant share of road transport is said to be more than 95%.

ENVIRONMENTAL RESOURCES MANAGEMENT JST/MOTI
6-17
Along the NEC, there are increasing traffic demands and bottlenecks of
road traffic in the urban areas of Mombasa, Nairobi, Nakuru, Eldoret,
Kisumu and their surrounding areas, as well as around the borders,
Mombasa Port and railway stations. Road sections with four lanes are
limited to Mombasa, Nairobi and Nakuru and trunk roads with high
capacity are limited. The road’s surface on the main route is generally
good although there are many potholes in Mombasa County. The
section between Nairobi and Eldoret has good surface and well
balanced capacity.
Box 6.14 Constraints - Current State of the Roads along the NEC
6.7.2 Railway
The Kenyan Meter Gauge Railway (MGR) system operated by Rift
Valley Railways (RVR) comprises approximately 1,320 km of track. This
includes the mainline of about 1,185 km from Mombasa to Malaba
passing through Nairobi. Branch lines to Thika and Nanyuki complete
the system. Figure 6.6 below shows the proposed Standard Gauge
Railway (SGR) Line and existing MGR Line, while Figure 6.7 shows an
inventory of current railway line operating facilities.
Congestion in city centres of Mombasa, Nairobi, Nakuru,
Eldoret, Kisumu, as well as around the borders of Malaba and
Busia, and Mombasa Port
Long queues on Mombasa weigh bridge.
Quick deterioration of road surfaces due to overloading by
trucks
Accident black spots along Nairobi – Mombasa road
Lack of exclusive lanes for trucks along Nairobi – Mombasa road
causing traffic jams
Lack of alternative exit roads from Mombasa Island
Lack of timely road repair on degraded sections

ENVIRONMENTAL RESOURCES MANAGEMENT JST/MOTI
6-18
Figure 6.6 The SGR and MGR Lines
Source: Kenya Railways Corporation, 2016
Nairobi County has experienced serious traffic congestion that has
necessitated the opening of the following three railway stations that
commute to the Nairobi Railway Station:
Syokimau railway station,
Makadara railway station ,and
Imara Daima railway station.
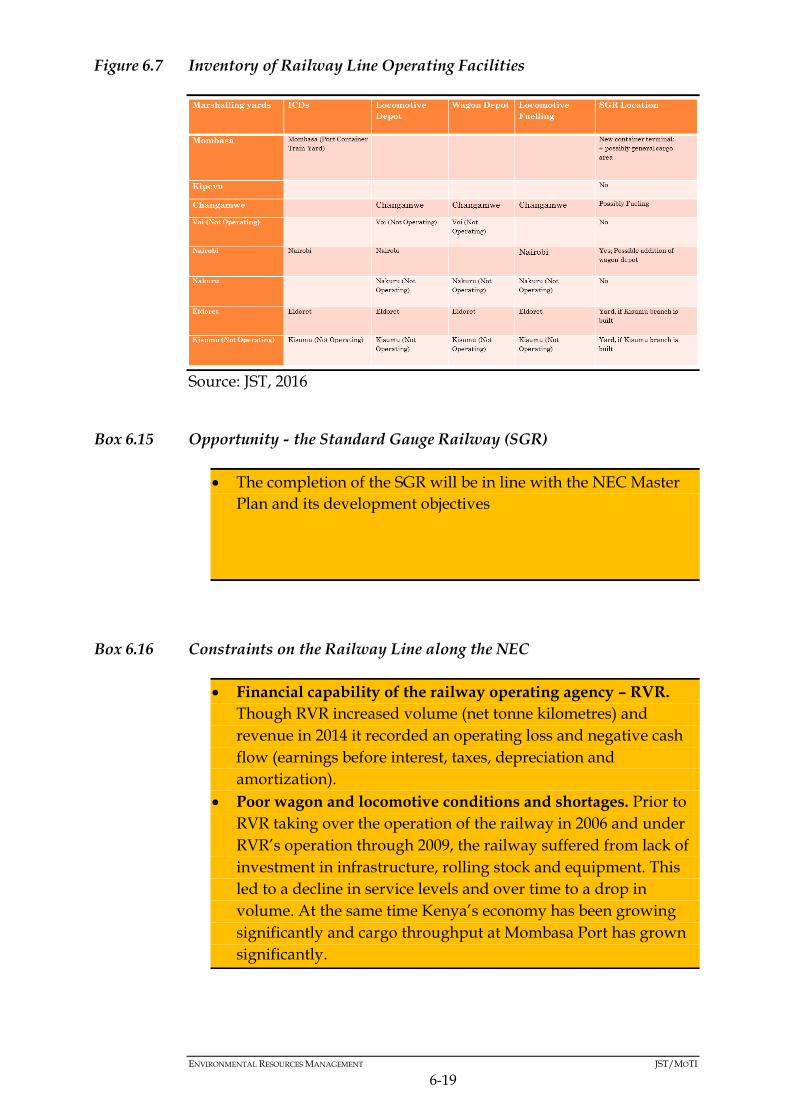
ENVIRONMENTAL RESOURCES MANAGEMENT JST/MOTI
6-19
Figure 6.7 Inventory of Railway Line Operating Facilities
Source: JST, 2016
Box 6.15 Opportunity - the Standard Gauge Railway (SGR)
Box 6.16 Constraints on the Railway Line along the NEC
The completion of the SGR will be in line with the NEC Master
Plan and its development objectives
Financial capability of the railway operating agency – RVR.
Though RVR increased volume (net tonne kilometres) and
revenue in 2014 it recorded an operating loss and negative cash
flow (earnings before interest, taxes, depreciation and
amortization).
Poor wagon and locomotive conditions and shortages. Prior to
RVR taking over the operation of the railway in 2006 and under
RVR’s operation through 2009, the railway suffered from lack of
investment in infrastructure, rolling stock and equipment. This
led to a decline in service levels and over time to a drop in
volume. At the same time Kenya’s economy has been growing
significantly and cargo throughput at Mombasa Port has grown
significantly.
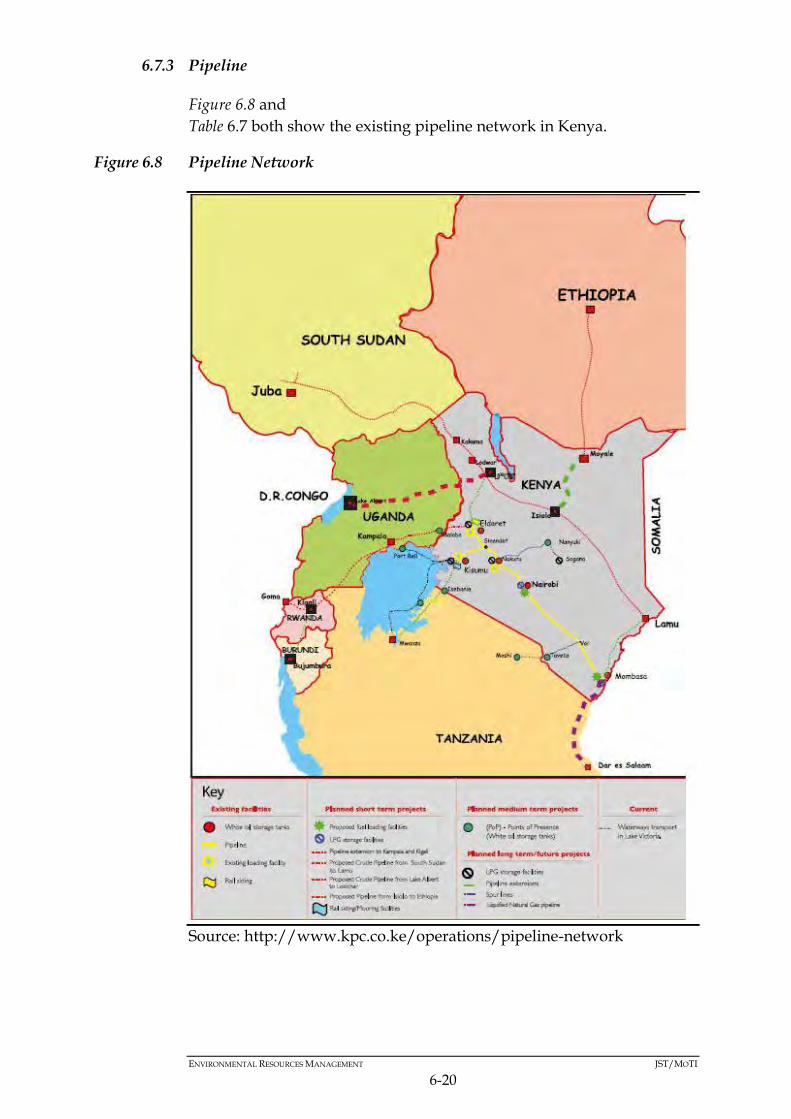
ENVIRONMENTAL RESOURCES MANAGEMENT JST/MOTI
6-20
6.7.3 Pipeline
Figure 6.8 and
Table 6.7 both show the existing pipeline network in Kenya.
Figure 6.8 Pipeline Network
Source: http://www.kpc.co.ke/operations/pipeline-network
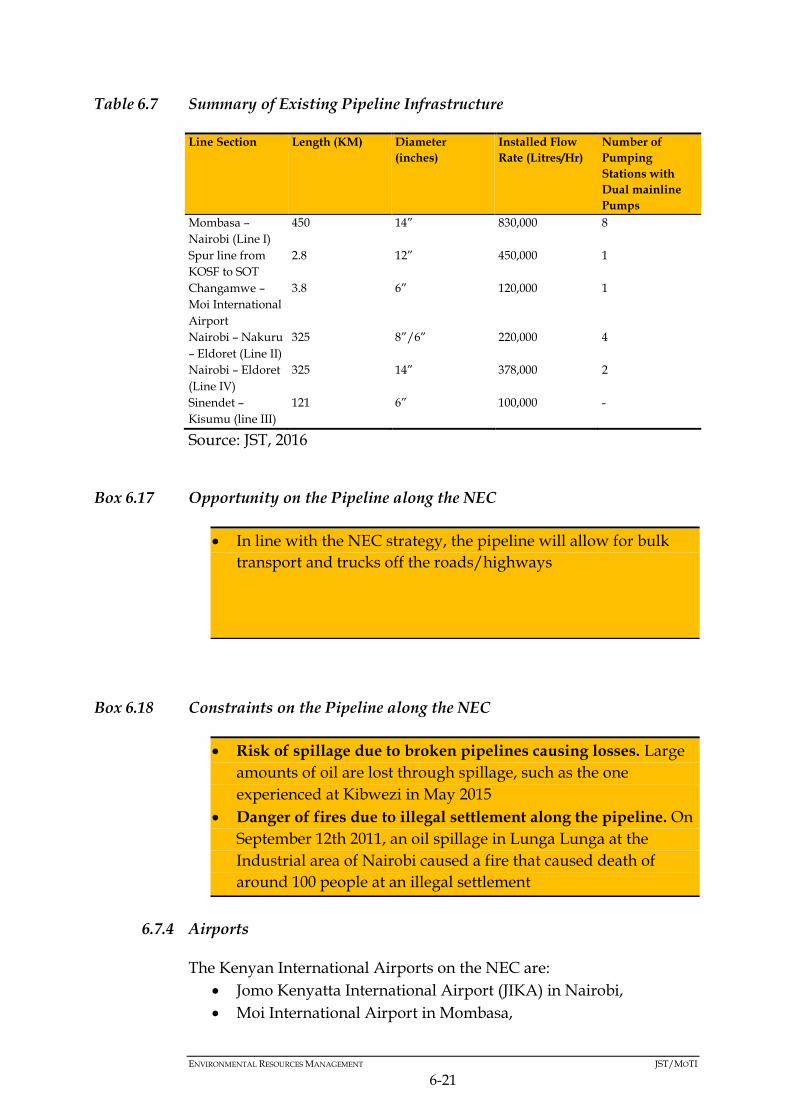
ENVIRONMENTAL RESOURCES MANAGEMENT JST/MOTI
6-21
Table 6.7 Summary of Existing Pipeline Infrastructure
Line Section Length (KM) Diameter
(inches)
Installed Flow
Rate (Litres/Hr)
Number of
Pumping
Stations with
Dual mainline
Pumps
Mombasa –
Nairobi (Line I)
450 14” 830,000 8
Spur line from
KOSF to SOT
2.8 12” 450,000 1
Changamwe –
Moi International
Airport
3.8 6” 120,000 1
Nairobi – Nakuru
– Eldoret (Line II)
325 8”/6” 220,000 4
Nairobi – Eldoret
(Line IV)
325 14” 378,000 2
Sinendet –
Kisumu (line III)
121 6” 100,000 -
Source: JST, 2016
Box 6.17 Opportunity on the Pipeline along the NEC
Box 6.18 Constraints on the Pipeline along the NEC
6.7.4 Airports
The Kenyan International Airports on the NEC are:
Jomo Kenyatta International Airport (JIKA) in Nairobi,
Moi International Airport in Mombasa,
In line with the NEC strategy, the pipeline will allow for bulk
transport and trucks off the roads/highways
Risk of spillage due to broken pipelines causing losses. Large
amounts of oil are lost through spillage, such as the one
experienced at Kibwezi in May 2015
Danger of fires due to illegal settlement along the pipeline. On
September 12th 2011, an oil spillage in Lunga Lunga at the
Industrial area of Nairobi caused a fire that caused death of
around 100 people at an illegal settlement
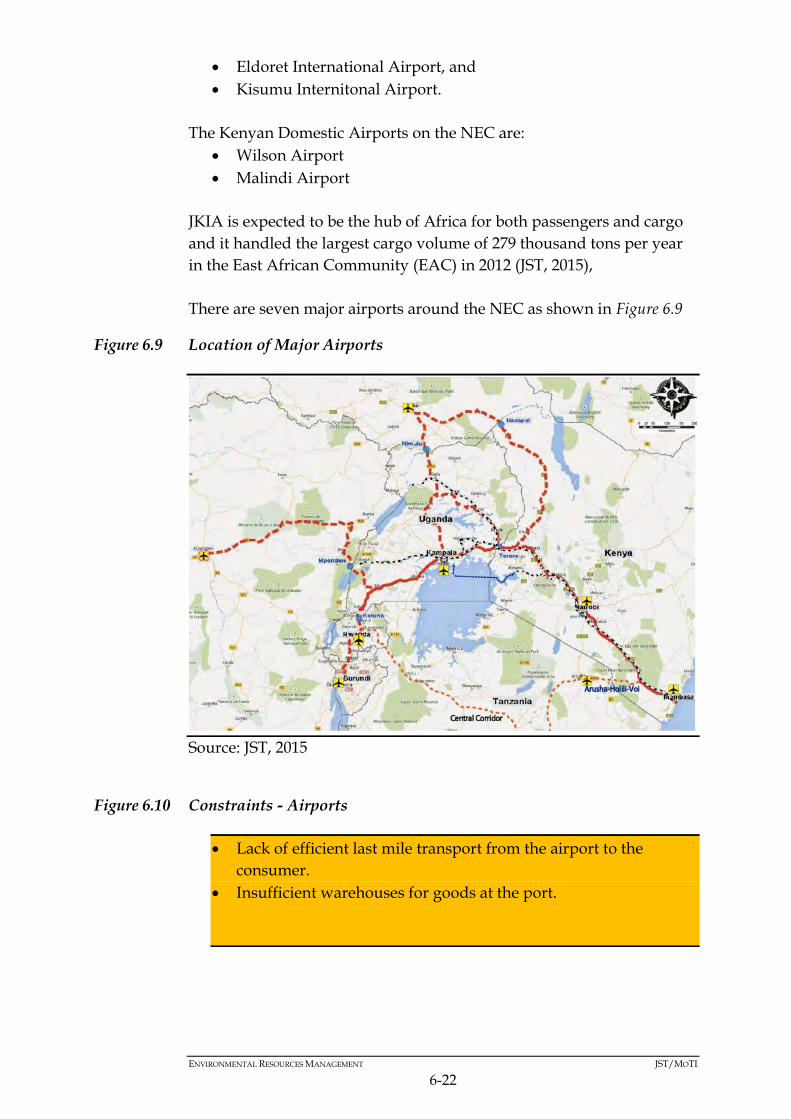
ENVIRONMENTAL RESOURCES MANAGEMENT JST/MOTI
6-22
Eldoret International Airport, and
Kisumu Internitonal Airport.
The Kenyan Domestic Airports on the NEC are:
Wilson Airport
Malindi Airport
JKIA is expected to be the hub of Africa for both passengers and cargo
and it handled the largest cargo volume of 279 thousand tons per year
in the East African Community (EAC) in 2012 (JST, 2015),
There are seven major airports around the NEC as shown in Figure 6.9
Figure 6.9 Location of Major Airports
Source: JST, 2015
Figure 6.10 Constraints - Airports
Lack of efficient last mile transport from the airport to the
consumer.
Insufficient warehouses for goods at the port.
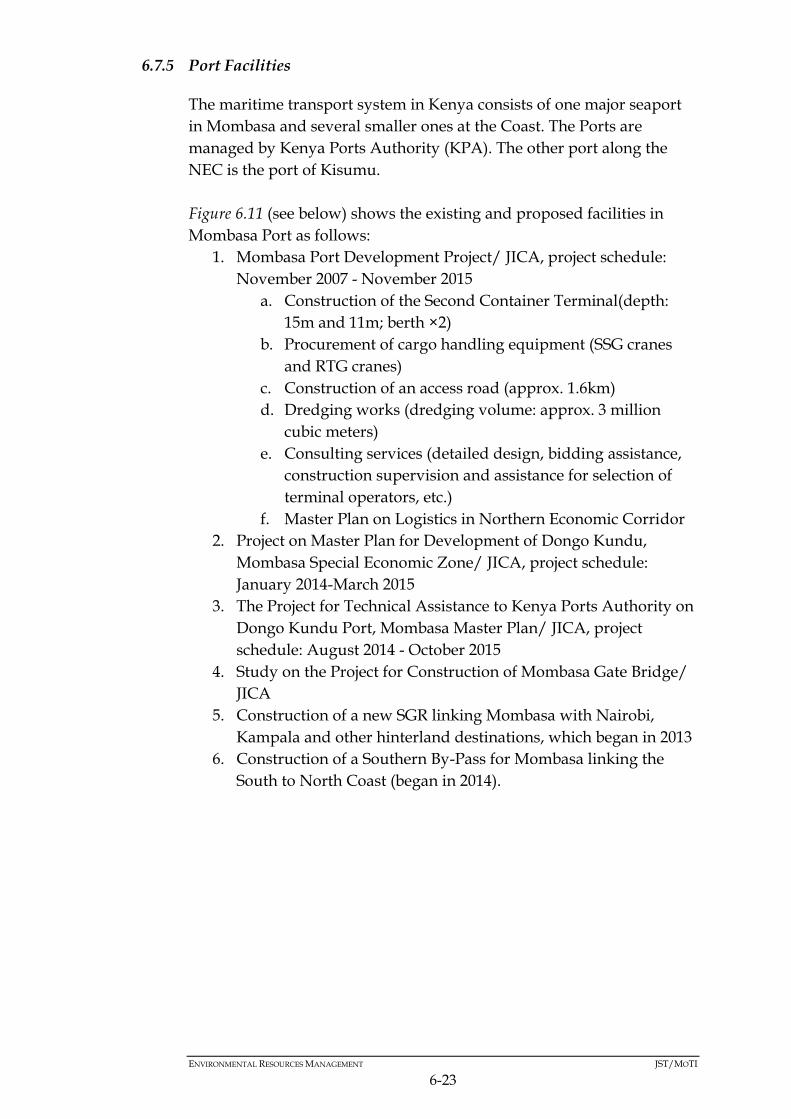
ENVIRONMENTAL RESOURCES MANAGEMENT JST/MOTI
6-23
6.7.5 Port Facilities
The maritime transport system in Kenya consists of one major seaport
in Mombasa and several smaller ones at the Coast. The Ports are
managed by Kenya Ports Authority (KPA). The other port along the
NEC is the port of Kisumu.
Figure 6.11 (see below) shows the existing and proposed facilities in
Mombasa Port as follows:
1. Mombasa Port Development Project/ JICA, project schedule:
November 2007 - November 2015
a. Construction of the Second Container Terminal(depth:
15m and 11m; berth ×2)
b. Procurement of cargo handling equipment (SSG cranes
and RTG cranes)
c. Construction of an access road (approx. 1.6km)
d. Dredging works (dredging volume: approx. 3 million
cubic meters)
e. Consulting services (detailed design, bidding assistance,
construction supervision and assistance for selection of
terminal operators, etc.)
f. Master Plan on Logistics in Northern Economic Corridor
2. Project on Master Plan for Development of Dongo Kundu,
Mombasa Special Economic Zone/ JICA, project schedule:
January 2014-March 2015
3. The Project for Technical Assistance to Kenya Ports Authority on
Dongo Kundu Port, Mombasa Master Plan/ JICA, project
schedule: August 2014 - October 2015
4. Study on the Project for Construction of Mombasa Gate Bridge/
JICA
5. Construction of a new SGR linking Mombasa with Nairobi,
Kampala and other hinterland destinations, which began in 2013
6. Construction of a Southern By-Pass for Mombasa linking the
South to North Coast (began in 2014).
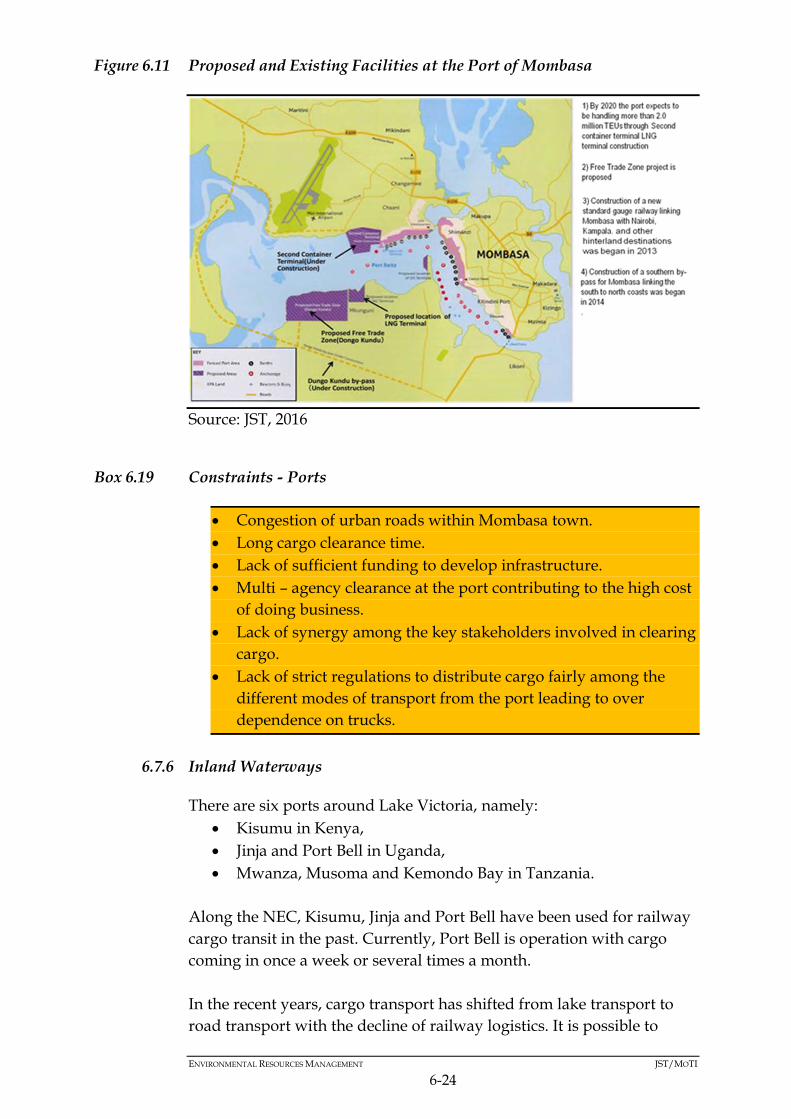
ENVIRONMENTAL RESOURCES MANAGEMENT JST/MOTI
6-24
Figure 6.11 Proposed and Existing Facilities at the Port of Mombasa
Source: JST, 2016
Box 6.19 Constraints - Ports
6.7.6 Inland Waterways
There are six ports around Lake Victoria, namely:
Kisumu in Kenya,
Jinja and Port Bell in Uganda,
Mwanza, Musoma and Kemondo Bay in Tanzania.
Along the NEC, Kisumu, Jinja and Port Bell have been used for railway
cargo transit in the past. Currently, Port Bell is operation with cargo
coming in once a week or several times a month.
In the recent years, cargo transport has shifted from lake transport to
road transport with the decline of railway logistics. It is possible to
Congestion of urban roads within Mombasa town.
Long cargo clearance time.
Lack of sufficient funding to develop infrastructure.
Multi – agency clearance at the port contributing to the high cost
of doing business.
Lack of synergy among the key stakeholders involved in clearing
cargo.
Lack of strict regulations to distribute cargo fairly among the
different modes of transport from the port leading to over
dependence on trucks.

ENVIRONMENTAL RESOURCES MANAGEMENT JST/MOTI
6-25
revive the Lake Transport after the SGR project is completed and
railway is operating and covering the region.
Box 6.20 Opportunities - Inland Waterways
6.8 URBANISATION
Urbanization refers to a process in which increasing proportion of an
entire population lives in cities and the suburbs of cities. As stated in
Section 6.3.3 over the years, urban centres in the NEC have been
experiencing population increase due to rural-urban migration. The
urban population is growing very fast, while the economic growth and
development transformations necessary to support it and enhance
quality of life are not occurring at the same rate.
The populations of major urban centres by 2012 are as indicated in Table
6.8 below, while Figure 6.12 shows the Cities, Municipalities and Towns
within the NEC. Figure 6.13 shows urban growth trends in Kenya from
1948-2009.
Table 6.8 Population within Urban Centres in the NEC
Urban Centre Population Urban Centre Population Urban Centre Population
Mombasa 1.2 million Matuu 53,144 Nairobi 3.5 million
Mariakani 89,321 Kangundo-
Tala
218,557 Ongota
Rongai
40,178
Mtwapa 48,625 Machakos 150,041 Ruiru 238,858
Ukunda 62,529 Athi River 139,380 Kikuyu 233,231
Voi 45,483 Ngong 107,188 Kiambu 88,869
Wundanyi 62,404 Kitengela 58,167 Juja 40,446
Naivasha 181,966 Gilgil 35,293 Maragua 32,315
Thika 139,853 Karuri 129,934 Makuyu 71,913
Molo 107,806 Limuru 104,282 Ol Kalou 66,015
Rumuruti 66,015 Nyahururu 51,434 Nandi Hills 73,626
Eldoret 289,380 Burnt Forest 32,993 Malava 60,831
Luanda 49,346 Malakisi 41,784 Vihiga 118,696
Mumias 116,358 Webuye 65,280 Kimilili 94,927
Kapsabet 91,030 Kakamega 91,768 Nambale 34,735
Busia 61,715 Malaba 63,324 Kisumu 409,928
Londiani 44,953 Kipkeleon 49,939 Kericho 104,282
Ukwala 57,081 Awasi 93,369 Ahero 76,828
Siaya 45,353 Muhoroni 34,457 Ugunja 33,878
Increased linkages among the ports on Lake Victoria. Kisumu
and Port Bell will be well linked with Mwanza port through the
improvement of infrastructure of wagon/car ferry port and
provision of new vessels including car ferry and passenger
vessels.
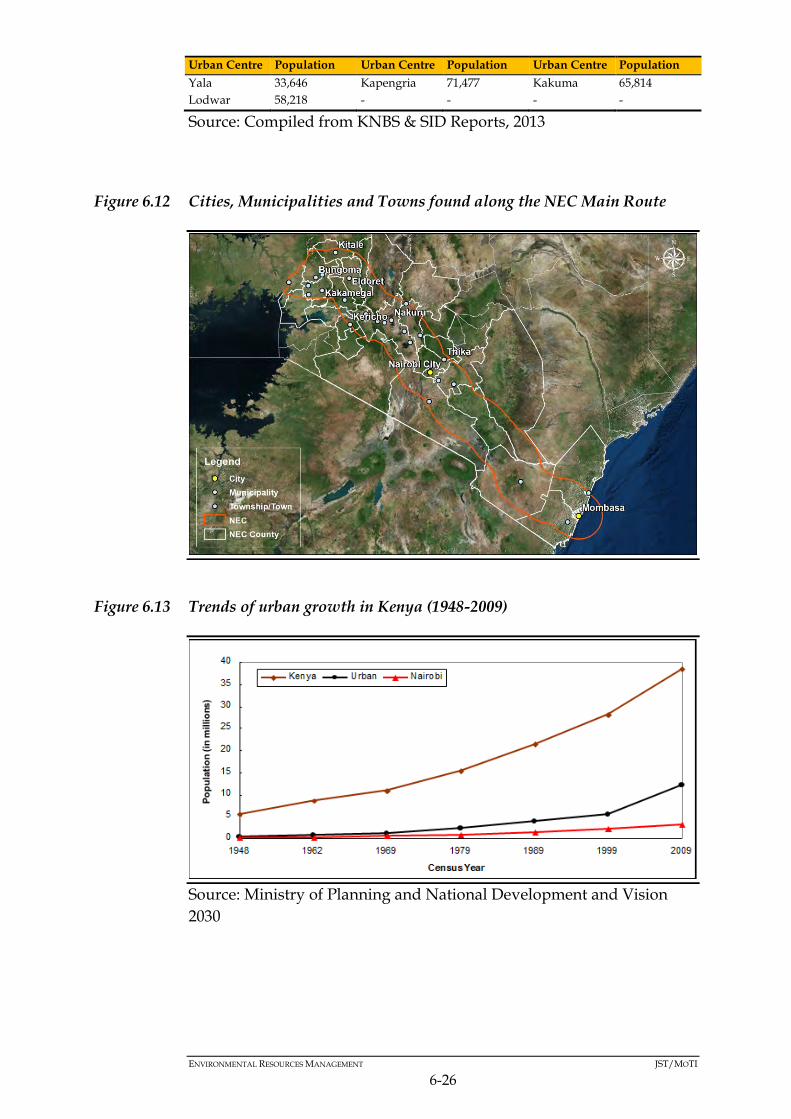
ENVIRONMENTAL RESOURCES MANAGEMENT JST/MOTI
6-26
Urban Centre Population Urban Centre Population Urban Centre Population
Yala 33,646 Kapengria 71,477 Kakuma 65,814
Lodwar 58,218 - - - -
Source: Compiled from KNBS & SID Reports, 2013
Figure 6.12 Cities, Municipalities and Towns found along the NEC Main Route
Figure 6.13 Trends of urban growth in Kenya (1948-2009)
Source: Ministry of Planning and National Development and Vision
2030
ENVIRONMENTAL RESOURCES MANAGEMENT JST/MOTI
6-27
Box 6.21 Opportunity - Urbanisation
Box 6.22 Constraints - Urbanisation
6.9 LAND ISSUES
6.9.1 Land Use
Land use types along the NEC vary significantly as it traverses
northwards through the landscape. Factors such as land value, zoning
rules that control development, technology, climate and proximity to
network infrastructure (e.g. availability of water, electricity and
telecommunication) influence the land use along the Corridor.
Residential, commercial, educational, public purpose, public utilities,
transportation and industrialization are the land uses found along the
NEC. Changes in land use are very popular along the NEC as land that
was previously meant for agricultural purposes is being changed to
residential, commercial and industrial land uses. Figure 6.14 shows the
land use classification according to the Kenya Forest Service (KFS) (1) .
(1) Data for the sub-route was not available
Urbanization will result in social, economic, environmental and
spatial development challenges that will be addressed by the
Master Plan. Implementation of regional, industrial and
transport strategies of the Master Plan are meant bring about that
desired development,
Urbanization will encourage rapid inflows of rural populations
to urban areas that give rise to housing problems and the
development of slums
An increase in urban areas will pressurise water and sanitation
facilities and potentially result in environmental pollution, as
well as increased unemployment in urban areas

ENVIRONMENTAL RESOURCES MANAGEMENT JST/MOTI
6-28
Figure 6.14 Land Use along the NEC Main Route
Source: Kenya Wildlife Services, 2015
Box 6.23 Constraint - Land Use Conflicts and Conversions
6.9.2 Land Tenure
Land tenure is the relationship, whether legally or customarily defined,
among people, as individuals or groups, with respect to land. In this
case “land” is used to include other natural resources such as water and
trees.
Rules of tenure define how property rights to land are to be allocated
within societies. They define how access is granted to rights to use,
control, and transfer land, as well as associated responsibilities and
restraints. In simple terms, land tenure systems determine who can use
what resources for how long, and under what conditions, it is an
important part of social, political and economic structures and it is
therefore very important to put it into consideration (FAO, 2009).
Implementing the Master Plan Development Strategies could result in
land use conflicts. Use of certain areas/parcels of land to implement
the Development Strategies will need trade-off with other existing and
potential uses e.g. developing transport infrastructure in certain
sections of the NEC would require converting agricultural and
conservation land for such a purpose. In sections where conversions are
resisted, land use conflicts and litigations may occur which can delay
and increase the cost of the project.
ENVIRONMENTAL RESOURCES MANAGEMENT JST/MOTI
6-29
The land tenure system along the NEC falls into the following broad
categories:
Private/ individual, where land rights are assigned to a private
party who may be an individual, a married couple, a group of
people, or a corporate body such as a commercial entity or non-
profit organization,
Community/ Customary, where land rights exist within a
community and each member has a right to independently use
the holdings of the community. For example, members of a
community may have the right to cultivate on a common piece of
land, and
Public/ State, where property rights are assigned to some
authority in the public sector. For example, open spaces fall
under the mandate of the state and all members of the state can
use them freely.
Along the NEC land is either owned on lease or freehold. In many rural
areas land is owned on freehold, this gives the holder absolute
ownership of the land for life. This means that descendants can remain
as the owner for as long as the family lineage exists. A freehold title
deed has no restrictions as to the use or occupation.
In urban areas land is mostly owned on leasehold where the interest in
land is for a specific period, subject to payment of a fee or rent to the
grantor. Payment of rates is made to the respective local authority for
services rendered. Leases are granted by:
Government for public land,
local authority for trust land, and
individuals with freeholds.
The maximum term of government leases is 999 years for agricultural
land and 99 years for urban plots. It is also common to find 33 year
leases in respect to urban trust land.
6.9.3 Land Values along the NEC
Land value in Kenya is determined by the economic principle of highest
and best use of land which produces the highest net return in any term,
over a period of time. As mentioned previously, the NEC traverses 29
Counties and the land values for the various counties are different as
they are influenced by:
physical attributes,
accessibility to economic activities,
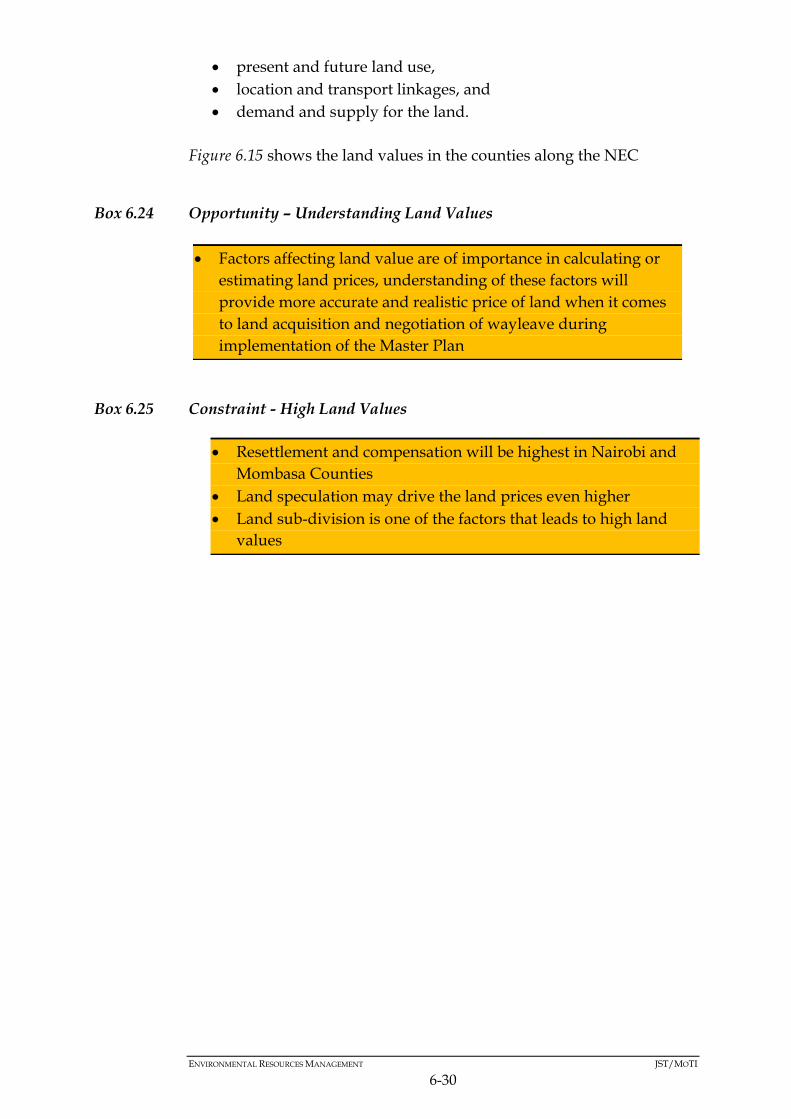
ENVIRONMENTAL RESOURCES MANAGEMENT JST/MOTI
6-30
present and future land use,
location and transport linkages, and
demand and supply for the land.
Figure 6.15 shows the land values in the counties along the NEC
Box 6.24 Opportunity – Understanding Land Values
Box 6.25 Constraint - High Land Values
Factors affecting land value are of importance in calculating or
estimating land prices, understanding of these factors will
provide more accurate and realistic price of land when it comes
to land acquisition and negotiation of wayleave during
implementation of the Master Plan
Resettlement and compensation will be highest in Nairobi and
Mombasa Counties
Land speculation may drive the land prices even higher
Land sub-division is one of the factors that leads to high land
values

ENVIRONMENTAL RESOURCES MANAGEMENT JST/MOTI
6-31
Figure 6.15 Land Values along the NEC
100
28 20 20 18 15 15
10 10 8 5 3 3 2 2 2 2 1.6 1.5 1.4 1.3 1.2 1.2 1 0.8 0.7 0.25
KES (Millions)/Acre

ENVIRONMENTAL RESOURCES MANAGEMENT JST/MOTI
6-32
6.9.4 Settlement Patterns along the NEC
Human settlements are defined as communities or groups of people
living together in a particular place to realize certain objectives. Human
settlements therefore have 3 major roles:
Residential functions, particularly for those people who derive
their livelihood from non-farming activities. It is usually
assumed that those in agricultural areas have their own
accommodation,
Service functions, the settlements have to offer some facilities
such as educational, health, administrative, social-cultural etc.
Economic functions usually offered by the settlements including
markets, goods and services, employment and income
generating opportunities and also enable people to access
manufactured goods.
As settlements grow, they form identifiable patterns depending on the
various factors which limit their growth in different areas. There is
therefore a range of settlement patterns exhibited along the NEC, as
discussed in the Sections below:
6.9.4.1 Linear Pattern
This type of settlement pattern develops when structures are built along
linear features such as roads, rail, a coastline and rivers. Many Kenyan
urban centres attribute their growth and development as a result of
infrastructure development, for example, Nairobi City grew due to the
construction of the Kenya-Uganda railway, being strategically placed
between Mombasa and Kampala. The ease of movement when located
along a transport network greatly contributes to increased settlement
growth along a corridor.
Table 6.9 Advantages and Disadvantages of Linear Settlement Patterns along
the NEC
Advantages Disadvantages
Easy access to the NEC No open spaces, which may limit
development
- This type of settlement can lead to
traffic congestion in many areas along
the NEC
- Prone to accident
ENVIRONMENTAL RESOURCES MANAGEMENT JST/MOTI
6-33
Figure 6.16 Linear settlement along the corridor in Nakuru
Source: Google Earth Pro, 2016
6.9.4.2 Clustered Pattern
Clustered settlement is observed in urban areas such as Mombasa,
Nairobi, and Kisumu. Nairobi City is an ideal example of a cluster of
human settlements within the Central Business District (CBD).
Table 6.10 Advantages and Disadvantages of Clustered Settlement Patters along
the NEC
Advantages Disadvantages
Good transport network High population density, which can
lead to diseases spreading quickly
It is easy to provide services to this
type of settlement
Urban areas with this type of
settlement pattern suffer from
shortage of housing, transport, health
and civic amenities.
There in convenience , in that access to
facilities and services is easy
This settlement pattern attracts
inadequate social infrastructure and
basic facilities due to over-population
and lack of financial resources in the
cities.
6.9.4.3 Dispersed Pattern
Dispersed settlement is evident along the NEC, especially in rural areas,
whereby homesteads or development are separated and scattered
throughout the landscape. This usually occurs in the low population

ENVIRONMENTAL RESOURCES MANAGEMENT JST/MOTI
6-34
density areas and this is as a result of limiting factors such as
unfavourable climatic and geographic conditions.
Table 6.11 Advantages and Disadvantages of Dispersed Settlement Patterns along
the NEC
Advantages Disadvantages
Clustered settlement pattern provides
open spaces which provides
community members with larger
recreation areas and create a sense of
openness that people along the
corridor desire
It is expensive to provide services to
this type of settlement
Open spaces also benefit the
environment by providing habitat for
wildlife, naturally filtering storm
water, reducing storm water runoff
from impervious surfaces, and
protecting the natural features of an
area
Methods to protect and maintain the
open space must be carefully
developed, implemented and
monitored
Linking the open space of several
conservation design subdivisions will
help to develop larger and more
effective “environmental corridor”
within and between communities
Although not necessarily a restricting
disadvantage, the management of
waste water must be carefully
designed for smaller lots. While these
disadvantages should be
acknowledged and addressed, none
should preclude the use of cluster
development
Clustered settlement pattern will
benefit the implementers of the NEC
corridor because in areas where there
is this kind of settlement the costs of
development is reduced
-
Clustered settlement pattern helps to
reinforce the policy of maintaining the
local rural character which is included
in many comprehensive land use
plans
-

ENVIRONMENTAL RESOURCES MANAGEMENT JST/MOTI
6-35
Figure 6.17 Dispersed settlements in Makueni County
Source: Google Earth Pro, 2016
6.9.4.4 Summary
The most visible settlement forms within the NEC are clustered and
linear patterns whereby people and activities are located in large
groups and along linear features, in this case being the road and
railway (see Figure 6.2).
6.10 ECONOMIC ACTIVITIES
6.10.1 Agriculture
The main crops are grown in the NEC shown in Table 6.12

ENVIRONMENTAL RESOURCES MANAGEMENT JST/MOTI
6-36
Table 6.12 Crops Grown in the NEC Counties
County Crops Grown
All Counties within
the main route
Maize, beans
Kiambu Coffee, Tea, Irish potatoes, bananas, commercial
horticulture
Muranga Coffee, Irish potatoes, bananas, commercial
horticulture
Nyeri Coffee, tea
Bungoma Coffee, bananas
Kericho Tea
Bomet Tea
Nandi Tea
Vihiga Tea
Nakuru Wheat, Irish potatoes, cut flowers, commercial
horticulture
Busia Tobacco
Kilifi Coconuts, mangoes
Mombasa Coconuts
Kwale Coconuts, mangoes
Siaya Cotton, rice
Kisumu Rice
Nyandarua Irish potatoes, commercial horticulture
Makueni Pigeon peas, sorghum, mangoes,
Machakos Pigeon peas, mangoes
West Pokot Maize, potatoes, beans, onions and millet
Turkana Maize, sorghum, millet and cow peas
Source: various CIDP
Box 6.26 Opportunities - Falling Prices of Exports
Falling exports prices will present opportunities for market forces to
reallocate resources to production of goods and services with high
demand and high prices. The invisible hand of free market forces will
determine the type of exportable goods and quantities that will be
produced in the NEC
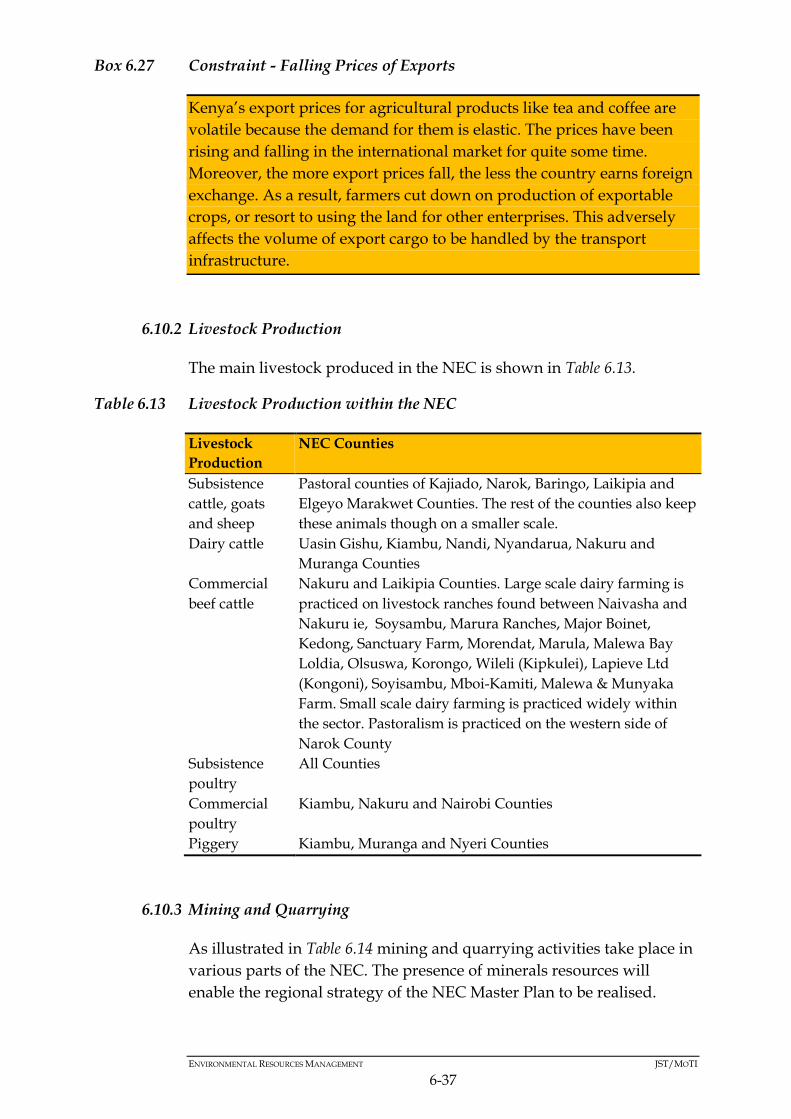
ENVIRONMENTAL RESOURCES MANAGEMENT JST/MOTI
6-37
Box 6.27 Constraint - Falling Prices of Exports
6.10.2 Livestock Production
The main livestock produced in the NEC is shown in Table 6.13.
Table 6.13 Livestock Production within the NEC
Livestock
Production
NEC Counties
Subsistence
cattle, goats
and sheep
Pastoral counties of Kajiado, Narok, Baringo, Laikipia and
Elgeyo Marakwet Counties. The rest of the counties also keep
these animals though on a smaller scale.
Dairy cattle Uasin Gishu, Kiambu, Nandi, Nyandarua, Nakuru and
Muranga Counties
Commercial
beef cattle
Nakuru and Laikipia Counties. Large scale dairy farming is
practiced on livestock ranches found between Naivasha and
Nakuru ie, Soysambu, Marura Ranches, Major Boinet,
Kedong, Sanctuary Farm, Morendat, Marula, Malewa Bay
Loldia, Olsuswa, Korongo, Wileli (Kipkulei), Lapieve Ltd
(Kongoni), Soyisambu, Mboi-Kamiti, Malewa & Munyaka
Farm. Small scale dairy farming is practiced widely within
the sector. Pastoralism is practiced on the western side of
Narok County
Subsistence
poultry
All Counties
Commercial
poultry
Kiambu, Nakuru and Nairobi Counties
Piggery Kiambu, Muranga and Nyeri Counties
6.10.3 Mining and Quarrying
As illustrated in Table 6.14 mining and quarrying activities take place in
various parts of the NEC. The presence of minerals resources will
enable the regional strategy of the NEC Master Plan to be realised.
Kenya’s export prices for agricultural products like tea and coffee are
volatile because the demand for them is elastic. The prices have been
rising and falling in the international market for quite some time.
Moreover, the more export prices fall, the less the country earns foreign
exchange. As a result, farmers cut down on production of exportable
crops, or resort to using the land for other enterprises. This adversely
affects the volume of export cargo to be handled by the transport
infrastructure.

ENVIRONMENTAL RESOURCES MANAGEMENT JST/MOTI
6-38
Mineral resource productive areas will be linked to the NEC and the
LAPSSET Corridor.
Table 6.14 Mining and Quarrying Activities in the NEC
Mineral/Quarrying Activity Area
Limestone Athi River, Bamburi and Waa
Artisanal mining of Tsavorite, red
garnets, green garnets, yellow garnets,
ruby, green tourmalines, yellow
tourmalines, change colour, blue
sapphire, pink sapphire, amethyst,
peridot, iolite, spinel, rhodolites and
kyanites
Kasigau, Kuranze. Taita Hills and
Mwatate areas
Coal Mui Basin (Kutui County) and West
Pokot
Sand, limestone and granite Machakos
Quarrying activities are centered in 15
quarries located mainly in Njiru and
Embakasi areas that produce natural
building stones, ballast, etc
Nairobi County
Sand harvesting, limestone, granite,
gypsum, and quartz
Makueni
Quarrying for construction stones,
ballast and hardcore
Isinya and Kitengela
Fluorspar Kerio Valley
Diatomite Kariandusi
Geothermal power generation Olkaria , Menengai and Ol Doinyo
Emburu
Sand harvesting Along river banks such as Nyano and
Awach, Lake Victoria beaches and
River Nzoia in Siaya County.
Gold Bondo, Siaya, Rarieda, Ugunja, Gem
(Siaya County) and West Pokot
Mining potentials for limestone Sigor (Bomet), Koru (Kisumu) and
West Pokot
Oil Nyando and Nyakach Sub-counties,
Elgeyo Marakwet and Turkana
Granite and black sand Yala Valley and Kogello, West Pokot
and Taita Taveta
Source: various CIDP
6.10.4 Fishing
Most fishing activities take place along the Indian Ocean and along
Lakes Naivasha and Victoria. The marine capture fishery is composed
of coastal and near shore artisanal, semi industrial and offshore

ENVIRONMENTAL RESOURCES MANAGEMENT JST/MOTI
6-39
industrial fisheries. Artisanal and semi-industrial fisheries are exploited
by the coastal local communities while the industrial fisheries are
exploited by foreign fishing companies. There are 51 fish landing sites
in Mombasa County alone and several sites in Kilifi and Kwale counties
that are within the NEC. The main types of fish caught are Rabbit Fish,
scavengers, Jack Fish and King Fish.
The main fish landing beaches on Lake Naivasha are Karagita, Kamere,
Kihoto, Tarembete,and central. The main fish caught include common
carp, minor carp, tilapia, black bass and catfish.
On Lake Victoria, there are several landing beaches. They include
Kaloka, Ndere Island, Kisumu Port, Dunga Beach, Sango Beach and
Kusa Beach in Kisumu County; Luanda Kotieno, Wichlum Uhanya,
Usenge, Nango Kamariga, Mahanga Mageta, Sirongo, Ndeda Island,
Misori B, Luando Kotieno, and Kopiata in Siaya District; and Osindo in
Siaya County; and Rudacho, Marenga, Nalera Beach, Bukoma,
Namabusi, Rukala, and Wayasi Island in Busia County. Additional
fishing activities take place on Lake Kanyaboli in Siaya County and, in
dams and ponds that are widespread in the four counties ie Kericho,
Bomet, Kisumu and Siaya, though on small scale. The fish caught
include; Rastrineobola argentea (Omena), Tilapia, Nile perch, among
others.
Minor fisheries exist in a variety of other inland waters, as follows: a) L.
Victoria Basin: rivers Nzoia, Sondu, and Yala; b) Rift Valley Basin:
rivers Suam-Turkwel Kerio, Lessos and Turkwell Gorge reservoirs; c)
Athi River Basin: rivers Athi-Galana-Sabaki, and Voi, lakes Chala and
Jipe; d) Tana River Basin: upper Tana River and impoundments
including Masinga, Kamburu, Gitaru, and Kindaruma reservoirs.
Fishing also takes place on both private and community owned dams.
In addition, fish farming is being encouraged by the government and a
number of fish ponds are producing fish especially in Kiambu,
Nyahururu and Muranga counties. The main fish farmed are Tilapia
and catfish. Although fish farming is being encouraged by the
government, it has not picked up in most parts of the NEC due to
shortage of water.
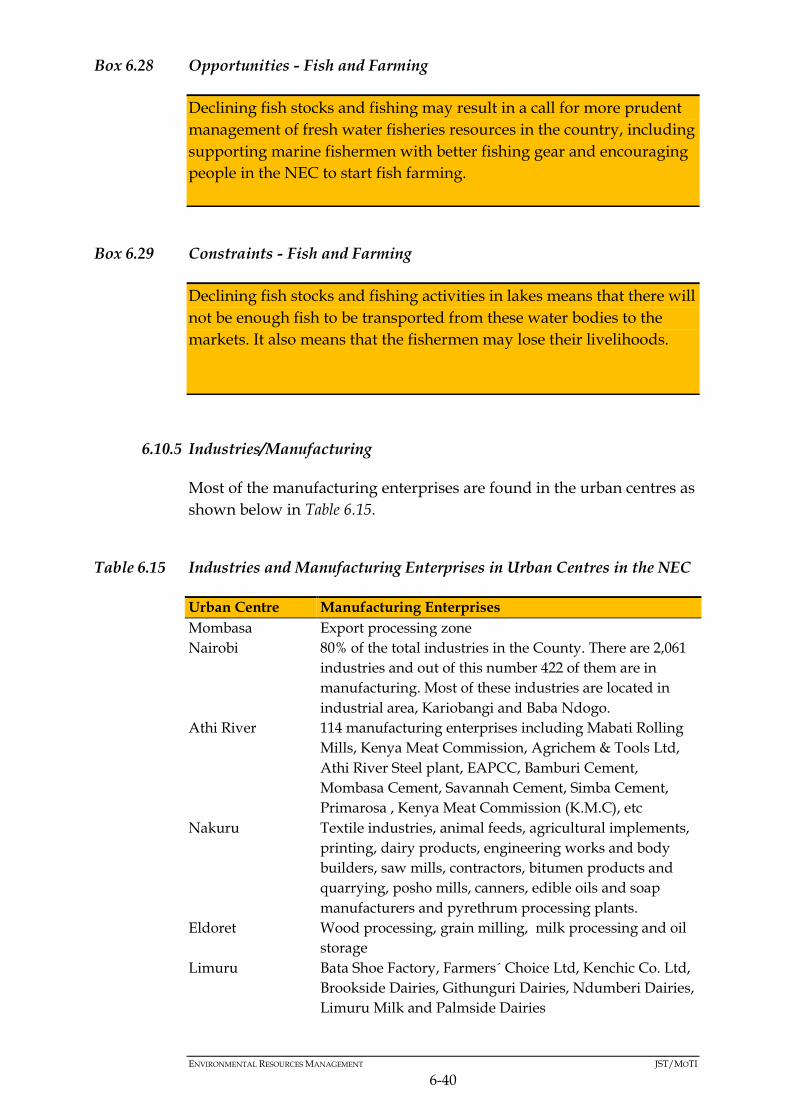
ENVIRONMENTAL RESOURCES MANAGEMENT JST/MOTI
6-40
Box 6.28 Opportunities - Fish and Farming
Box 6.29 Constraints - Fish and Farming
6.10.5 Industries/Manufacturing
Most of the manufacturing enterprises are found in the urban centres as
shown below in Table 6.15.
Table 6.15 Industries and Manufacturing Enterprises in Urban Centres in the NEC
Urban Centre Manufacturing Enterprises
Mombasa Export processing zone
Nairobi 80% of the total industries in the County. There are 2,061
industries and out of this number 422 of them are in
manufacturing. Most of these industries are located in
industrial area, Kariobangi and Baba Ndogo.
Athi River 114 manufacturing enterprises including Mabati Rolling
Mills, Kenya Meat Commission, Agrichem & Tools Ltd,
Athi River Steel plant, EAPCC, Bamburi Cement,
Mombasa Cement, Savannah Cement, Simba Cement,
Primarosa , Kenya Meat Commission (K.M.C), etc
Nakuru Textile industries, animal feeds, agricultural implements,
printing, dairy products, engineering works and body
builders, saw mills, contractors, bitumen products and
quarrying, posho mills, canners, edible oils and soap
manufacturers and pyrethrum processing plants.
Eldoret Wood processing, grain milling, milk processing and oil
storage
Limuru Bata Shoe Factory, Farmers´ Choice Ltd, Kenchic Co. Ltd,
Brookside Dairies, Githunguri Dairies, Ndumberi Dairies,
Limuru Milk and Palmside Dairies
Declining fish stocks and fishing may result in a call for more prudent
management of fresh water fisheries resources in the country, including
supporting marine fishermen with better fishing gear and encouraging
people in the NEC to start fish farming.
Declining fish stocks and fishing activities in lakes means that there will
not be enough fish to be transported from these water bodies to the
markets. It also means that the fishermen may lose their livelihoods.

ENVIRONMENTAL RESOURCES MANAGEMENT JST/MOTI
6-41
Urban Centre Manufacturing Enterprises
Thika Bidco Oil Industries, Thika Motor Vehicle dealers, Thika
Pharmaceutical Manufacturers Limited, Devki Steel Mills,
Broadway Bakeries, Kenblest Industry, Kel Chemicals,
Thika Rubber Industries Limited, Macadamia Nuts,
Campwell Industry and Kenya Tanning Extracts Limited.
Naivasha Breweries and milk processing
Ruiru Clay Works and Spinners and Spinners
Sotik Milk Processing
Kericho Nandi Hills, and Vihiga have tea processing factories
Nzoia, Mumias,
Chemill,
Muhoroni,
Nambale and
Kibos
Sugar refining factories
Ahero Mattresses manufacturing and rice processing
Kisumu 27 manufacturing industries and 16 bakeries
Voi and Mtito
Andei
Sisal fibre production
Makindu Bakery
Mariakani Iron sheet manufacturing
Malakisi Cotton ginning and tobacco curing
Kitale Flour milling
Kapenguria Flour milling
Kalakol Fish processing
Source: various VIDP
Box 6.30 Opportunities - Domestic Challenges in the Manufacturing Sector
Box 6.31 Constraint - Domestic Challenges in the Manufacturing Sector
Domestic challenges in the manufacturing sector can present
opportunities for the industrial sector to plan and address them,
specifically through the improvement of the investment
environment, increasing the market size, increasing employment
and incomes and providing raw materials from the agricultural
and mineral and oil sectors.
Domestic challenges in the manufacturing sector include
unconducive business environments especially: the high cost of
doing business; low domestic savings and investments; high cost
of finance; high cost and unavailable industrial land; limited
market access; as well as counterfeit dumping and substandard
goods.

ENVIRONMENTAL RESOURCES MANAGEMENT JST/MOTI
6-42
Box 6.32 Constraint – Limitation to Growth in the Manufacturing Sector
6.10.6 Tourism
Most of tourist attractions are found in and around Mombasa and
Nairobi Counties as well as within the protected areas discussed in
Chapter 5.
Mombasa has several tourist attractions including Fort Jesus Museum,
the gigantic elephant tusks mould, Likoni ferry, old town, the old port,
Mombasa Marine Park, Haller Park and Butterfly Pavilion. Mombases
has over 430 beach and tour operator firms that provide various tourist
related services. The county has 201 registered hotels and lodges with a
total bed capacity of 8,000 beds. Several tourist facilities and tour
operator firms also exist along the Kwale and Kilifi parts of the beach
front and along the Mombasa-Diani and Mombasa-Malindi highways.
Nairobi County is a major centre of tourism in the Country. Its
proximity to many tourist attractions both in Kenya and East Africa and
the good communication network makes it a focal point of great
importance to the tourism sector. As the capital city and commercial
centre, it attracts many businessmen and leisure tourists. Tourist
attractions include the Nairobi National Park, Nairobi National
Museum, Karen Blixen Museums and several historical sites and
monuments.
Other tourist attractions in the NEC include:
Iveti hills scenery, Kyamwilu gravitational defying area and the
wood carving in Wamunyu (Machakos),
Inability of small scale firms enjoying economies of scale
Lack of comprehensive policy;
Regulatory and incentive framework to attract investors
Small talent pool
Lack of marketing
Rigid labour laws for export services;
Lack of a formalized one stop shop to facilitate the ease of doing
business
Competition from other countries offering competitive prices
due to their comparative advantage.
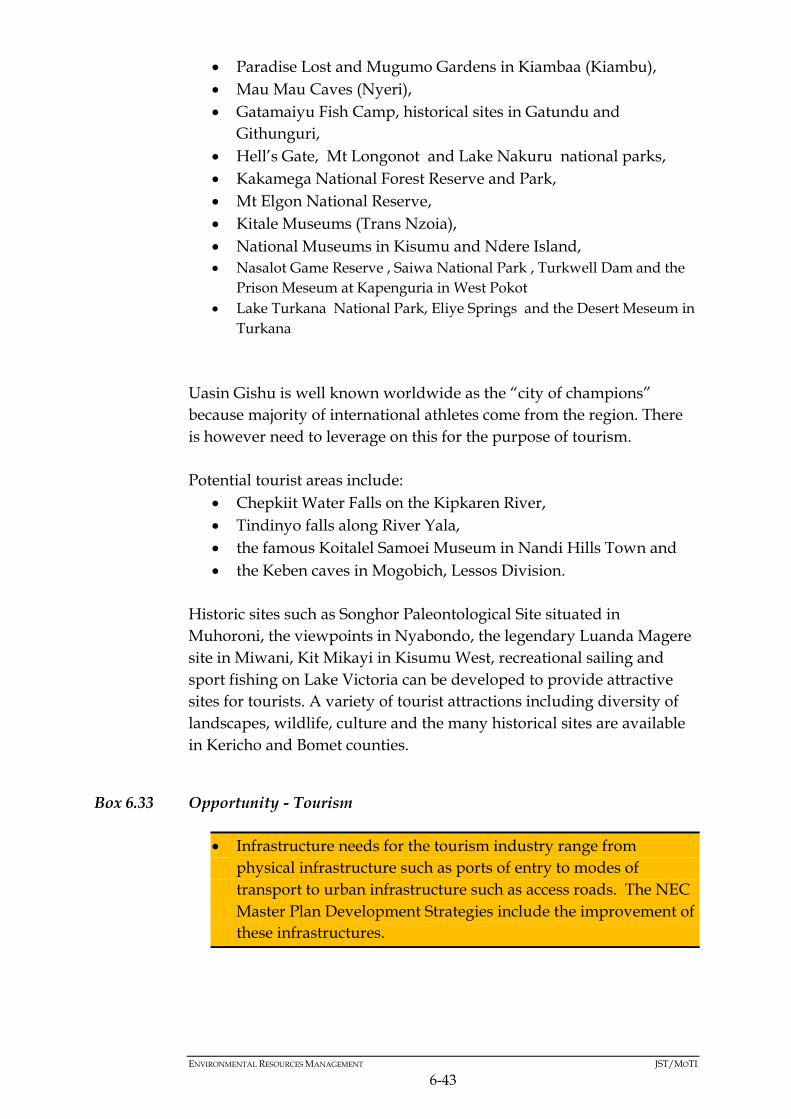
ENVIRONMENTAL RESOURCES MANAGEMENT JST/MOTI
6-43
Paradise Lost and Mugumo Gardens in Kiambaa (Kiambu),
Mau Mau Caves (Nyeri),
Gatamaiyu Fish Camp, historical sites in Gatundu and
Githunguri,
Hell’s Gate, Mt Longonot and Lake Nakuru national parks,
Kakamega National Forest Reserve and Park,
Mt Elgon National Reserve,
Kitale Museums (Trans Nzoia),
National Museums in Kisumu and Ndere Island,
Nasalot Game Reserve , Saiwa National Park , Turkwell Dam and the
Prison Meseum at Kapenguria in West Pokot
Lake Turkana National Park, Eliye Springs and the Desert Meseum in
Turkana
Uasin Gishu is well known worldwide as the “city of champions”
because majority of international athletes come from the region. There
is however need to leverage on this for the purpose of tourism.
Potential tourist areas include:
Chepkiit Water Falls on the Kipkaren River,
Tindinyo falls along River Yala,
the famous Koitalel Samoei Museum in Nandi Hills Town and
the Keben caves in Mogobich, Lessos Division.
Historic sites such as Songhor Paleontological Site situated in
Muhoroni, the viewpoints in Nyabondo, the legendary Luanda Magere
site in Miwani, Kit Mikayi in Kisumu West, recreational sailing and
sport fishing on Lake Victoria can be developed to provide attractive
sites for tourists. A variety of tourist attractions including diversity of
landscapes, wildlife, culture and the many historical sites are available
in Kericho and Bomet counties.
Box 6.33 Opportunity - Tourism
Infrastructure needs for the tourism industry range from
physical infrastructure such as ports of entry to modes of
transport to urban infrastructure such as access roads. The NEC
Master Plan Development Strategies include the improvement of
these infrastructures.

ENVIRONMENTAL RESOURCES MANAGEMENT JST/MOTI
6-44
Box 6.34 Constraints - Tourism
6.10.7 Employment
Counties with the lowest percentage of residents with no formal
education and are working for pay include Narok and Baringo and
Counties with the highest percentage of residents with no formal
education and are working for pay are Nairobi, Uasin Gishu and
Mombasa.
Counties with the lowest percentage of residents with primary level
education and are working for pay for pay are Narok, Busia and
Bungoma while the counties with highest percentage of residents with
primary level education and working for pay are Nairobi and
Mombasa.
Counties with the lowest percentage of residents with secondary level
education and are working for pay are Mombasa and Nairobi while the
Counties with the highest percentage of residents with secondary level
education and are working for pay are Mombasa Kiambu and Nairobi
Table 6.16 Percentage of Residents Working for Pay by NEC County
County No
formal
educatio
n
Primary
level of
educatio
n
Secondar
y level of
educatio
n and
above
County No
formal
educatio
n
Primary
level of
educatio
n
Secondar
y level of
educatio
n and
above
Mombasa 28 37 46 Baringo 5 14 26
Kwale 10 16 34 U. Gishu 28 23 32
Kilifi 16 23 39 Nandi 24 22 27
T.Taveta 21 22 32 E.
Marakwe
t
13 11 21
Kitui 18 20 27 T.Nzoia 25 20 26
Makueni 19 23 25 Kakameg
a
17 15 22
Projects developed within the NEC need to avoid areas of high
tourism potential such as protected areas.

ENVIRONMENTAL RESOURCES MANAGEMENT JST/MOTI
6-45
County No
formal
educatio
n
Primary
level of
educatio
n
Secondar
y level of
educatio
n and
above
County No
formal
educatio
n
Primary
level of
educatio
n
Secondar
y level of
educatio
n and
above
Kajiado 12 32 44 Vihiga 18 16 22
Machakos 23 27 33 Bungoma 14 10 19
Nairobi 34 45 49 Busia 10 10 21
Kiambu 34 38 39 Kericho 20 21 30
Muranga 17 22 24 Bomet 13 15 24
Nyandaru
a
17 16 21 Kisumu 19 20 32
Nyeri 21 25 28 Siaya 11 13 22
Laikipia 16 22 32 Nakuru 24 26 36
Narok 8 10 26 West
Pokot
55 38 06
Turkana 82 15 03 Turkana 82 15 03
West
Pokot
55 38 06 - - - -
Source: Compiled from KNBS & SID Reports, 2013
6.10.8 Unemployment
Unemployment and underemployment have both been identified as
Kenya’s difficult and persistent problems. Over 13% of the working age
population is unemployed. About 67% of Kenya’s unemployed are
youths between 15 and 34 years of age. The highest unemployment
rates are for people around 20 years old at 35%. This makes
unemployment in Kenya a youth problem. It should be noted that the
Kenyan labour market, just like other countries, is always in a state of
flux with people leaving and changing jobs while others are joining.
6.10.9 Gini Coefficient
The Gini index measures the extent to which the distribution of
consumption expenditure among individuals or households within an
economy deviates from a perfectly equal distribution. A Gini index of
‘0’ represents perfect equality, while an index of ‘1’ implies perfect
inequality. See Table 6.17 for the Gini Index by NEC County.
Counties with Gini coefficient closer to zero have more even income
distribution than those with Gini coefficient closer to one. Income
distribution reveals possible markets sizes in the NEC that will support
manufactured goods resulting from proposed industrial projects.

ENVIRONMENTAL RESOURCES MANAGEMENT JST/MOTI
6-46
Table 6.17 Gini Coefficient by County
County Gini Coefficient County Gini Coefficient
Mombasa 0.356 Baringo 0.356
Kwale 0.597 U. Gishu 0.370
Kilifi 0.565 Nandi 0.343
T.Taveta 0.437 E. Marakwet 0.358
Kitui 0.388 T.Nzoia 0.360
Makueni 0.376 Kakamega 0.394
Kajiado 0.403 Vihiga 0.399
Machakos 0.403 Bungoma 0.430
Nairobi 0.341 Busia 0.459
Kiambu 0.335 Kericho 0.378
Muranga 0.361 Bomet 0.340
Nyandarua 0.394 Kisumu 0.430
Nyeri 0.365 Siaya 0.405
Laikipia 0.369 Nakuru 0.376
Narok 0.376 West Pokot 0.318
Turkana 0.283 - -
Source: Compiled from KNBS & SID Reports, 2013
6.10.10 Regional Integration and Preferential Trade Arrangements
Kenya’s total exports to East African Community (EAC) increased by
60% between 2008 and 2012 (KNBS, 2013). Uganda was Kenya’s leading
export destination (absorbing 13% of the country’s total exports) while
Tanzania was second at 9%. Exports to the EAC are diversified and
include chemicals, fuels and lubricants, machinery and transport
services.
In 2012, Kenya’s exports the EAC accounted for 54% of the total exports
to Africa and 26.1% of its exports. The exports to the Common Market
for Eastern and Southern Africa (COMESA) increased by 58% and
accounted for 34& of the total exports in 2012. On the other hand, the
total exports imports from COMESA increased by 117%. (KNBS, 2013)
Box 6.35 Opportunities- Regional integration and preferential trade agreements
Admission of Rwanda, Burundi and South Sudan in the EAC has
expanded the market for products and services produced in this
region. As a result, Kenya’s industries are bound to produce and
sell more in the region.
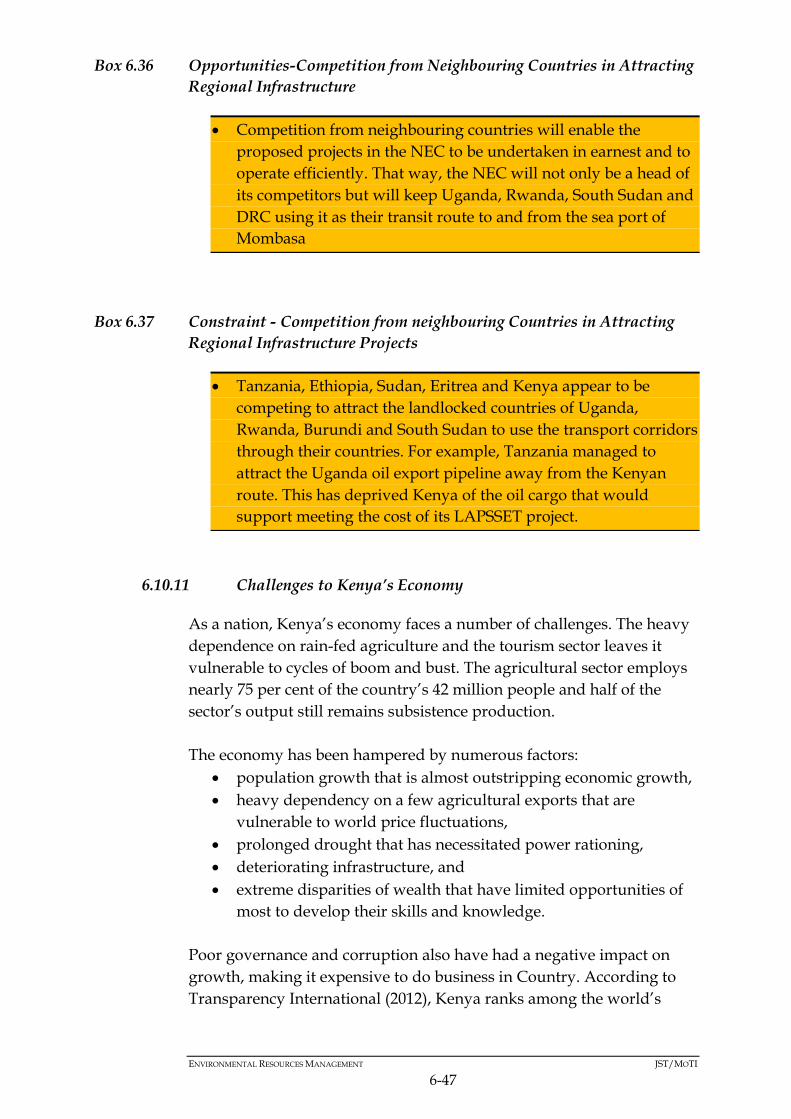
ENVIRONMENTAL RESOURCES MANAGEMENT JST/MOTI
6-47
Box 6.36 Opportunities-Competition from Neighbouring Countries in Attracting
Regional Infrastructure
Box 6.37 Constraint - Competition from neighbouring Countries in Attracting
Regional Infrastructure Projects
6.10.11 Challenges to Kenya’s Economy
As a nation, Kenya’s economy faces a number of challenges. The heavy
dependence on rain-fed agriculture and the tourism sector leaves it
vulnerable to cycles of boom and bust. The agricultural sector employs
nearly 75 per cent of the country’s 42 million people and half of the
sector’s output still remains subsistence production.
The economy has been hampered by numerous factors:
population growth that is almost outstripping economic growth,
heavy dependency on a few agricultural exports that are
vulnerable to world price fluctuations,
prolonged drought that has necessitated power rationing,
deteriorating infrastructure, and
extreme disparities of wealth that have limited opportunities of
most to develop their skills and knowledge.
Poor governance and corruption also have had a negative impact on
growth, making it expensive to do business in Country. According to
Transparency International (2012), Kenya ranks among the world’s
Competition from neighbouring countries will enable the
proposed projects in the NEC to be undertaken in earnest and to
operate efficiently. That way, the NEC will not only be a head of
its competitors but will keep Uganda, Rwanda, South Sudan and
DRC using it as their transit route to and from the sea port of
Mombasa
Tanzania, Ethiopia, Sudan, Eritrea and Kenya appear to be
competing to attract the landlocked countries of Uganda,
Rwanda, Burundi and South Sudan to use the transport corridors
through their countries. For example, Tanzania managed to
attract the Uganda oil export pipeline away from the Kenyan
route. This has deprived Kenya of the oil cargo that would
support meeting the cost of its LAPSSET project.

ENVIRONMENTAL RESOURCES MANAGEMENT JST/MOTI
6-48
half-dozen most corrupt countries. Bribery and fraud cost the country
as much as US$ 1 billion a year.
Other areas that have an impact on the Country’s economy are youth
unemployment, HIV/Aids burden, increasing debt and terrorism
threats.
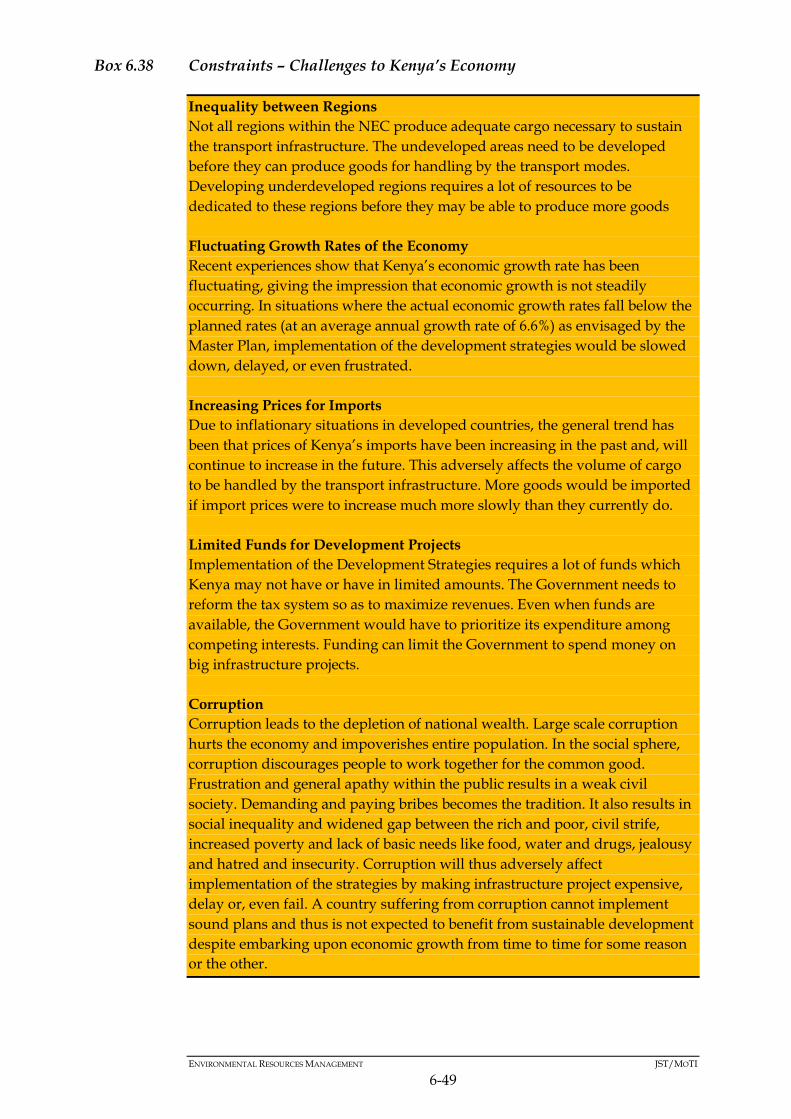
ENVIRONMENTAL RESOURCES MANAGEMENT JST/MOTI
6-49
Box 6.38 Constraints – Challenges to Kenya’s Economy
Inequality between Regions
Not all regions within the NEC produce adequate cargo necessary to sustain
the transport infrastructure. The undeveloped areas need to be developed
before they can produce goods for handling by the transport modes.
Developing underdeveloped regions requires a lot of resources to be
dedicated to these regions before they may be able to produce more goods
Fluctuating Growth Rates of the Economy
Recent experiences show that Kenya’s economic growth rate has been
fluctuating, giving the impression that economic growth is not steadily
occurring. In situations where the actual economic growth rates fall below the
planned rates (at an average annual growth rate of 6.6%) as envisaged by the
Master Plan, implementation of the development strategies would be slowed
down, delayed, or even frustrated.
Increasing Prices for Imports
Due to inflationary situations in developed countries, the general trend has
been that prices of Kenya’s imports have been increasing in the past and, will
continue to increase in the future. This adversely affects the volume of cargo
to be handled by the transport infrastructure. More goods would be imported
if import prices were to increase much more slowly than they currently do.
Limited Funds for Development Projects
Implementation of the Development Strategies requires a lot of funds which
Kenya may not have or have in limited amounts. The Government needs to
reform the tax system so as to maximize revenues. Even when funds are
available, the Government would have to prioritize its expenditure among
competing interests. Funding can limit the Government to spend money on
big infrastructure projects.
Corruption
Corruption leads to the depletion of national wealth. Large scale corruption
hurts the economy and impoverishes entire population. In the social sphere,
corruption discourages people to work together for the common good.
Frustration and general apathy within the public results in a weak civil
society. Demanding and paying bribes becomes the tradition. It also results in
social inequality and widened gap between the rich and poor, civil strife,
increased poverty and lack of basic needs like food, water and drugs, jealousy
and hatred and insecurity. Corruption will thus adversely affect
implementation of the strategies by making infrastructure project expensive,
delay or, even fail. A country suffering from corruption cannot implement
sound plans and thus is not expected to benefit from sustainable development
despite embarking upon economic growth from time to time for some reason
or the other.
ENVIRONMENTAL RESOURCES MANAGEMENT JST/MOTI
6-50
6.11 POLITICAL ENVIRONMENT
Kenya has made considerable progress in recent years towards a
politically stable, democratic Country with the enactment of a new
Constitution in August 2010, the conclusion of a peaceful political
transition following the March 2013 elections, and the launch of a
devolved system of Governance in the same month.
However, Kenya exhibits some fragile characteristics, most importantly
the high level of poverty and regional disparities as well as high youth
unemployment, which, if not effectively addressed, might pose threats
to the country’s overall stability. There is, therefore, a strong need to
create economic opportunities for the disadvantaged groups of society,
in particular the youth, to avoid conflict and violence in the future.
Other factors of fragility include terrorist activities and ethnic tensions
compounded with a post-colonial land allocation that left certain
communities feeling dispossessed and created long-standing sources of
unrest.
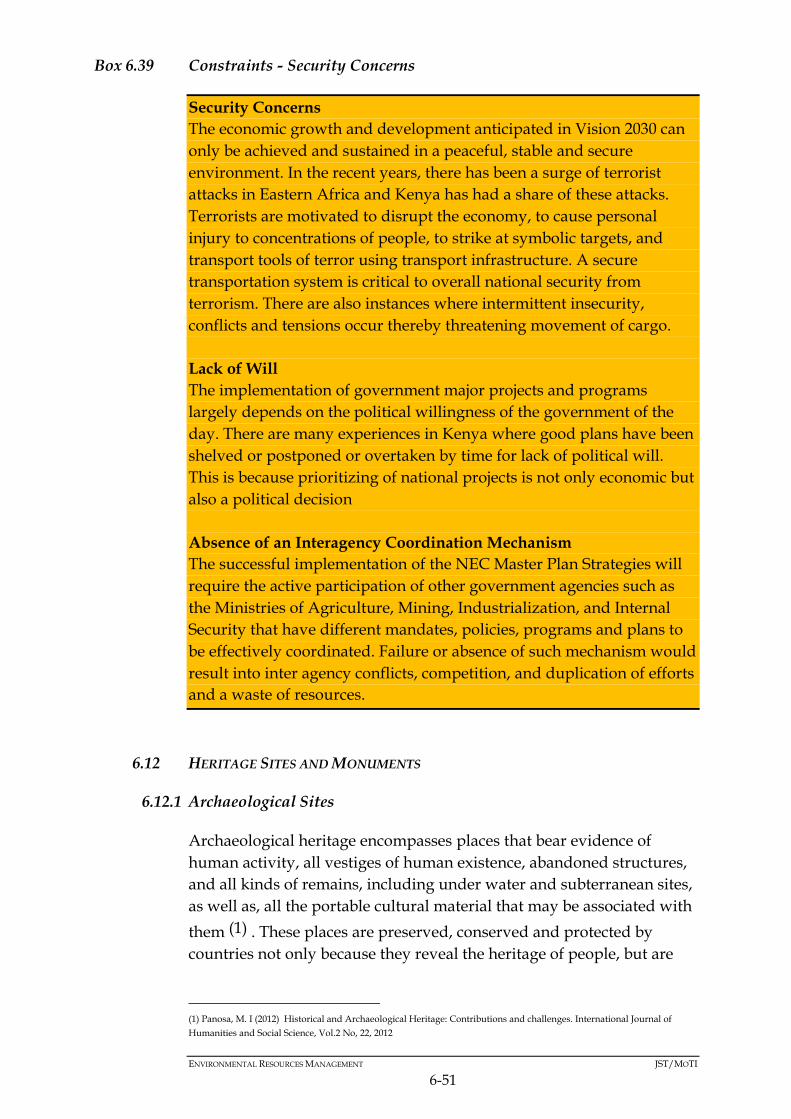
ENVIRONMENTAL RESOURCES MANAGEMENT JST/MOTI
6-51
Box 6.39 Constraints - Security Concerns
6.12 HERITAGE SITES AND MONUMENTS
6.12.1 Archaeological Sites
Archaeological heritage encompasses places that bear evidence of
human activity, all vestiges of human existence, abandoned structures,
and all kinds of remains, including under water and subterranean sites,
as well as, all the portable cultural material that may be associated with
them (1) . These places are preserved, conserved and protected by
countries not only because they reveal the heritage of people, but are
(1) Panosa, M. I (2012) Historical and Archaeological Heritage: Contributions and challenges. International Journal of
Humanities and Social Science, Vol.2 No, 22, 2012
Security Concerns
The economic growth and development anticipated in Vision 2030 can
only be achieved and sustained in a peaceful, stable and secure
environment. In the recent years, there has been a surge of terrorist
attacks in Eastern Africa and Kenya has had a share of these attacks.
Terrorists are motivated to disrupt the economy, to cause personal
injury to concentrations of people, to strike at symbolic targets, and
transport tools of terror using transport infrastructure. A secure
transportation system is critical to overall national security from
terrorism. There are also instances where intermittent insecurity,
conflicts and tensions occur thereby threatening movement of cargo.
Lack of Will
The implementation of government major projects and programs
largely depends on the political willingness of the government of the
day. There are many experiences in Kenya where good plans have been
shelved or postponed or overtaken by time for lack of political will.
This is because prioritizing of national projects is not only economic but
also a political decision
Absence of an Interagency Coordination Mechanism
The successful implementation of the NEC Master Plan Strategies will
require the active participation of other government agencies such as
the Ministries of Agriculture, Mining, Industrialization, and Internal
Security that have different mandates, policies, programs and plans to
be effectively coordinated. Failure or absence of such mechanism would
result into inter agency conflicts, competition, and duplication of efforts
and a waste of resources.

ENVIRONMENTAL RESOURCES MANAGEMENT JST/MOTI
6-52
also tourist attractions. Table 6.18 below lists the important
archaeological sites within the NEC.
Table 6.18 Important Archaeological Sites within the NEC
Archaeological Sites Brief Description Location
Jumba la Mtwana Fifteenth century site
and slave trade port
Mtwapa, Kilifi County
Olorgesailie Lower Paleolithic
archaeological site
64 km southwest of
Nairobi along the road to
Lake Magadi, Kajiado
County
Kiandurusi Pre-historic site Kariandusi, Nakuru
County
Enkapune Ya Muto, also
known as Twilight Cave
Late Stone age site Mau Escarpment
Enkorika Iron Age smelting site Narok
Njoro River Cave Dated to roughly 1000
BC
Njoro, Nakuru County
Sirikwa holes Sirikwa people
settlement site
Kerio Valley and Uasin
Gishu
Ngenyn Late Stone Age and/or a
Savanna Pastoral
Neolithic
Kapthurin River Basin,
Baringo
Kaputhurin Acheulean stone tools
and animal bones left
behind here
Near Lake Bogoria and
Lake Baringo
Gogo Falls Earliest appearances of
artifacts and domestic
animals are in the area
Kanyamkago Hillside
near the modern dam on
the West bank of Kuja
River, L.Victoria Basin
Hyrax Hill Prehistoric site Near Narok
Koobi For Palaeontological locality Eastern shores of Lake
Turkana
Lomekwi Kenyanthropus site North western shores of
Lake Turkana
Namaratunga Archaeostronomical site West of Lake Turkana
Naturuk Pre-historic site South-West of Lake
Turkana
Lake Turkana Basin Australopicthecus fossils Lake Turkana Basin
Source: National Museums of Kenya, 2016
ENVIRONMENTAL RESOURCES MANAGEMENT JST/MOTI
6-53
Box 6.40 Constraint – Presence of Archaeological Sites
6.12.2 Historical Sites and Monuments
Historical sites and monuments represent great achievements in art and
architecture of a country. It is therefore important they are preserved so
that present and future generations can continue to enjoy and learn
from them as well. Important historical sites and monuments found
within the NEC are presented in Table 6.19 as well as Annex F.
Along the NEC there are a number of archaeological sites that have to
be preserved. . Development of the NEC transport infrastructure is
likely to disturb or disrupt these sites.

ENVIRONMENTAL RESOURCES MANAGEMENT JST/MOTI
6-54
Table 6.19 Historical Sites and Monuments in the NEC
County Historical Site/Monument
Mombasa Fort Jesus, Kisauni Bell Tower, Mbaraki Pillar, Old Law Courts,
Mnarani Ruins, Mombasa Old Town, Portuguese Ship Wreck,
Redoubt, Mama Ngina Drive, Mombasa Old Club, Babu Motors,
Kilindini House, Ivory House, Issa Thawar House, Mombasa
Hospital Dispensary, Central Police Station, District Officer’s
Office, Anglican Cathedral, Macknon Market, Alidina Visram
School, Grindlays Bank, National Bank of Kenya, Valentine High
School, Kaya Kiteje, Kaya Pungu, Similani Cave, Uhuru Gardens,
Jomo Kenyatta Public Beach, KPA Maritine Museum Building,
KPA, St Emmanuel Church, Frere Town, Leven house, Sheikh
Mwinyime Shrine, Holy Ghost Cathederal, and Castle Hotel.
Kilifi Mtwapa Ruins, Takaungu North and Tangaungu South, Kaya
Mudzimiru,
Mnarani, Old Ronald Ngala Tombstone, Bedida Sacred Grove,
Kaya Mzizima, Kaya Bomu/Fimboni, Kaya Lunguma, Kaya
Mudzi Muvya, Kaya Kavuma, and Kaya Kauma
Kwale Kaya Bombo, Kaya Waa, Kaya Sega, Kaya Gonja, Kaya Jego, Kaya
Tiwi, Kaya Chitsanze, Kaya Chonyi, Kaya Mstwakara, Tiwi, and
Diani Ruins
Taita
Taveta
Old St. Marks ACK Church, Sagala
Machakos Paul Ngei Mausoleum, Ol Donyo Sabuk House, the first District
Commissioner’s (DC’s) Office
Nairobi Old Provincial Commissioner’s (PC’s) Office, Nairobi, Uhuru Park
National Monument, Uhuru Gardens national Monument, Kenya
National Archives, Mc Millian Library, High Court Building,
Kipande House, City Park, Former Parkland Railway Staff
Quarters, Jeevanje Gardens, the Calton Fenzi Memorial Stone, the
War Memorial Statute, Institute of African Studies-Chiromo,
Nairobi School, Khoja Mosque, Pensions Building, Old Mutual
Building, Standard Chartered Building, Pan Africa House,
Royality House, Imperial Chambers, Imperial British East Africa,
Bull Gate, Prembro House, Surat District Association House,
Rahimutulla Trust Library, Bohra Mosque, Makhan Sigh House,
Dedan Kimani Statue, War Memorial Pillar, Nairobi Club, City
Park, Railway House, Lower Hill Road, Land’s Offices, Moi
Avenue, Siri Gurdwara Ramgharia, Peponi Road House No 21,
Westmister House, Shaffi Mosque, City Market, Nairobi South
Cementry, Desai House, 2nd Parklands Avenue, Pumwani
Community Memorial Hall, Tom Mboya Statue, YWCA
International House and Cameo Cinema Building.

ENVIRONMENTAL RESOURCES MANAGEMENT JST/MOTI
6-55
County Historical Site/Monument
Kiambu Kijabe Church , AIC Church Ruins , Fort Smith near Muguga ,
Manse Kikuyu, St Paul Church ACK , Watson Scot Memorial,
PCEA Church at Thogoto, Githunguri Gallows, Jomo Kenyatta
College’s Residence, Mbiyu Koinanges’ College Residence,
Githunguri Girls Dormitory (Kiriri), Italian Prisoners of War
Pillar, Italian Prisoners of War Brick Manufacturing
Muranga Fort Hall, Mukurwe wa Nyagathanga, Bildad Kaggia Moseleum
and Ichagaki Prison Church
Nyeri Mau Mau Caves, Burgret Mau Mau Shelter and Mau Mau Trench;
Nakuru Lanet Prehistoric site, Fort Terman Paleo Site, Blixen House
(Naivasha) and Lord Egerton Castle
Nakuru Mt. Suswa Caves
Uasin
Gishu
Former Italian Barracks, Old Asian School, St. Peters’ Catholic
Church at Tuluap-Sigis
Bungoma Muhanda and Chetambes Forts
Kakamega Muliro Gardens and Ikhonga Murwi (weeping stone)
Vihiga Abatondo Sacred Forest, King George’s Tower and Asubwe
Sacred Groove
Busia Kakapeli Rock Shelter and Oluchiri Sacred Grove
Siaya Jaromogi Oginga Odinga Mausoleum, Got Ramogi Hill, Kit
Mikayi Shrine and East Alego Nyangoma Kogelo, Kanam-Kanjera
Kisumu Old PC’s Office, DC’s Office, Police Headquarters
West
Pokot
Kapenguria Prison Meseum
Turkana Kenyatta House
Source: National Museums of Kenya, 2016
Box 6.41 Opportunity - Presence of Historical Site and Monuments
Along the NEC there are a number of historical sites and monuments
that have to be avoided. The NEC Master Plan could plan for these sites
and boost tourism by making these sites more accessible.
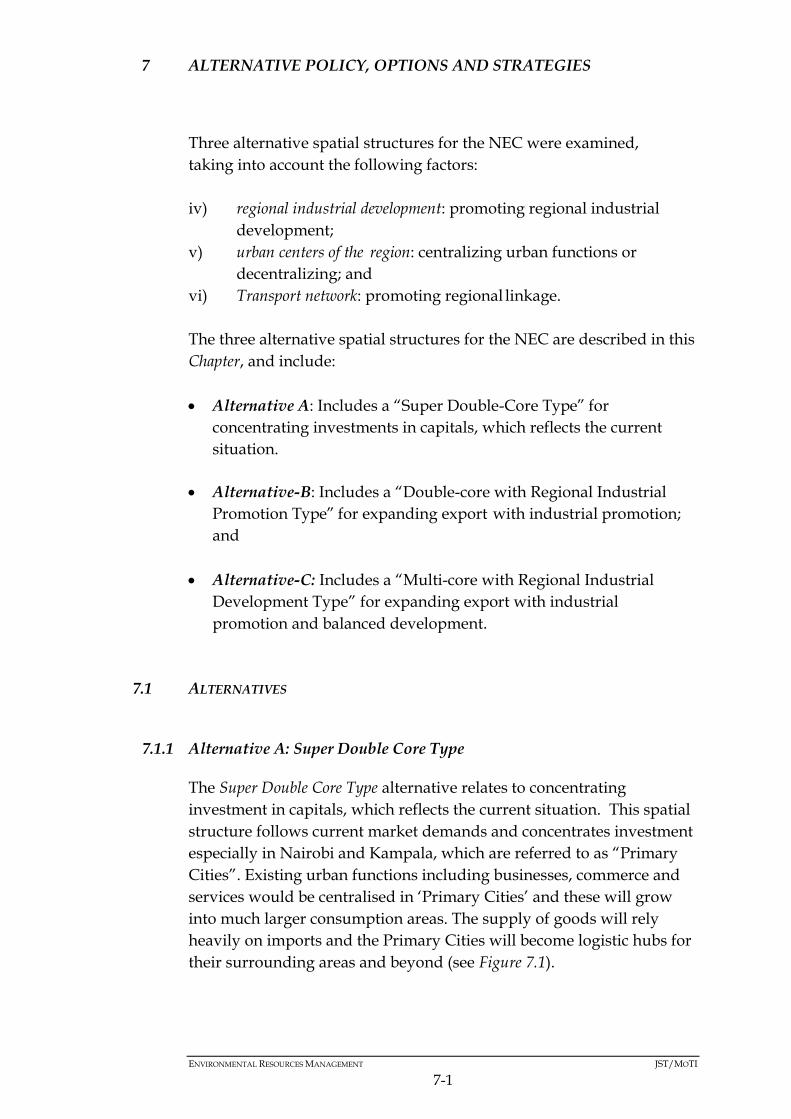
ENVIRONMENTAL RESOURCES MANAGEMENT JST/MOTI
7-1
7 ALTERNATIVE POLICY, OPTIONS AND STRATEGIES
Three alternative spatial structures for the NEC were examined,
taking into account the following factors:
iv) regional industrial development: promoting regional industrial
development;
v) urban centers of the region: centralizing urban functions or
decentralizing; and
vi) Transport network: promoting regional linkage.
The three alternative spatial structures for the NEC are described in this
Chapter, and include:
Alternative A: Includes a “Super Double-Core Type” for
concentrating investments in capitals, which reflects the current
situation.
Alternative-B: Includes a “Double-core with Regional Industrial
Promotion Type” for expanding export with industrial promotion;
and
Alternative-C: Includes a “Multi-core with Regional Industrial
Development Type” for expanding export with industrial
promotion and balanced development.
7.1 ALTERNATIVES
7.1.1 Alternative A: Super Double Core Type
The Super Double Core Type alternative relates to concentrating
investment in capitals, which reflects the current situation. This spatial
structure follows current market demands and concentrates investment
especially in Nairobi and Kampala, which are referred to as “Primary
Cities”. Existing urban functions including businesses, commerce and
services would be centralised in ‘Primary Cities’ and these will grow
into much larger consumption areas. The supply of goods will rely
heavily on imports and the Primary Cities will become logistic hubs for
their surrounding areas and beyond (see Figure 7.1).
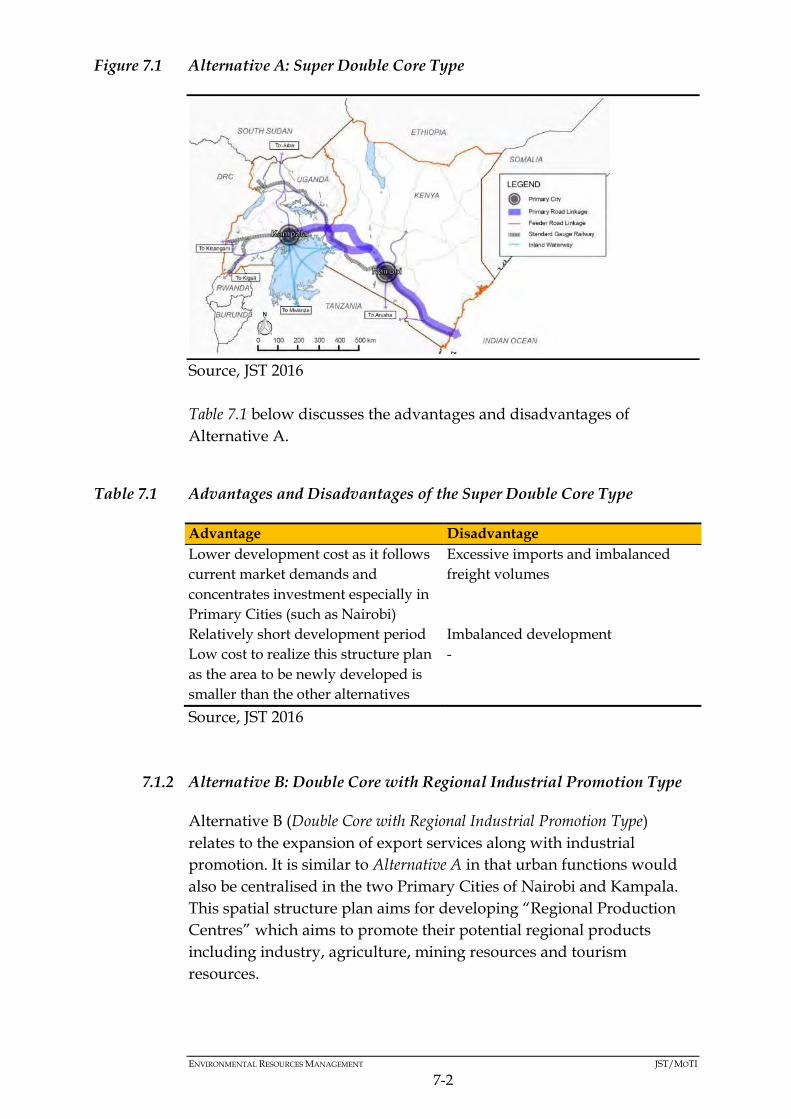
ENVIRONMENTAL RESOURCES MANAGEMENT JST/MOTI
7-2
Figure 7.1 Alternative A: Super Double Core Type
Source, JST 2016
Table 7.1 below discusses the advantages and disadvantages of
Alternative A.
Table 7.1 Advantages and Disadvantages of the Super Double Core Type
Advantage Disadvantage
Lower development cost as it follows
current market demands and
concentrates investment especially in
Primary Cities (such as Nairobi)
Excessive imports and imbalanced
freight volumes
Relatively short development period Imbalanced development
Low cost to realize this structure plan
as the area to be newly developed is
smaller than the other alternatives
-
Source, JST 2016
7.1.2 Alternative B: Double Core with Regional Industrial Promotion Type
Alternative B (Double Core with Regional Industrial Promotion Type)
relates to the expansion of export services along with industrial
promotion. It is similar to Alternative A in that urban functions would
also be centralised in the two Primary Cities of Nairobi and Kampala.
This spatial structure plan aims for developing “Regional Production
Centres” which aims to promote their potential regional products
including industry, agriculture, mining resources and tourism
resources.

ENVIRONMENTAL RESOURCES MANAGEMENT JST/MOTI
7-3
Key industries in “Regional Production Centres” will be promoted to
produce goods for export through utilising resources as the regional
advantage. These products will be transported to Primary Cities and
out of the NEC region (see Figure 7.2). In this alternative, the
involvement of local Government will be required so as to improve the
production of products and goods from the regional production
centres. Export of the regional products will be expected to make
transportation cost to Mombasa port decrease with improving the
problem of empty return cargo.
Figure 7.2 Alternative B: Double Core with Regional Industrial Promotion Type
Source, JST 2016
Table 7.2 below discusses the advantages and disadvantages of
Alternative B.
Table 7.2 Advantages and Disadvantages of Alternative B
Advantages Disadvantages
Expansion of exports Imbalanced development
Replacement of imports by domestic
products
High development cost
- Longer development period
Source, JST 2016
7.1.3 Alternative C: Multi-Core with Regional Industrial Development Type
The Multi-Core with Regional Industrial Development Type alternative
aims at balanced growth and efficient logistics in the NEC region by
promoting urban functions of 18 Secondary Cites, including 6
Secondary cum Regional Production Centres (see Figure 0.3).

ENVIRONMENTAL RESOURCES MANAGEMENT JST/MOTI
7-4
This alternative promotes decentralizing urban functions to Secondary
Cities, urbanization of them and concentration of population on them
from surrounding region. Similar to Alternative B, it aims to promote
Regional Production Centres, because demand for commercial and
services in urban area (which results from surrounding regional area)
will promote the demand of Secondary Cities.
These Secondary Cities will serve as regional urban centres supplying
urban services and logistics hub connecting Regional Production
Centres and Primary Cities as consumption areas. In this alternative,
the involvement of local Government is also essential. The initial cost to
realize this structure plan will be higher than the other alternatives
because the area to be newly developed is larger. This structure plan
needs more public engagement and management capacity for urban
management and development control to avoid unnecessary
development in a planned manner.
Figure 7.3 Alternative C: Multi-Core with Regional Industrial Development Type
Source, JST 2016
Table 7.3 below discusses the advantages and disadvantages of
Alternative C.
Table 7.3 Advantages and Disadvantages of Alternative C
Advantages Disadvantages
Expansion of export and replacement
of imports by domestic products
Highest development costs
Balanced development Longest development period
Source, JST 2016

ENVIRONMENTAL RESOURCES MANAGEMENT JST/MOTI
7-5
This is the preferred alternative because it is consistent with Vision 2030, the
MoTI Strategic Plan and the goals of the NEC Master Plan, which are to
improve logistics for the NEC as well as provide an integrated regional
development strategy consistent with sub-regional development plans and
national development plans. This alternative is therefore the basis of this
SEA.
7.1.4 Alternative D: No Go Alternative
The no-go alternative means that the proposed Master Plan is not
implemented in its entirety, leading to the following disadvantages:
Continuous Road Congestion mainly around Mombasa, Nairobi,
Nakuru, Eldoret, Kisumu and Malaba in Kenya. The congestion
around these points is caused by cargo and passenger traffic,
delays and high cost of running logistics.
Stretched Mombasa Port Operations Capacity, as Mombasa Port is
the only international seaport on the NEC and while the Port has
implemented projects with capacity expansion and efficiency
improvement, these developments have not matched the 10%
average annual growth rate in demand for import cargo
registered in the past five years.
Cross Border Delays, for example in Malaba Town which is
located between Kenya and Uganda, where queues of more than
3 km are commonly witnessed during the daytime. In addition,
custom clearance procedures are still inefficient due to lack of
human capacity, electricity, internet communication, inadequate
parking lots and access road among others.
As such, this No-Go option alternative is not considered reasonable and will
not be considered any further in this SEA.
7.2 ALTERNATIVE SCENARIO ANALYSIS
7.2.1 Overview
Scenario analysis was used to present alternative futures of the Multi-
Core with Regional Industrial Development Type, i.e., the preferred
alternative and the focus of the SEA Study. Scenario building focused
on:
Identifying the strategic issues associated with the Master Plan
(i.e., identification of the critical success factors and key

ENVIRONMENTAL RESOURCES MANAGEMENT JST/MOTI
7-6
concerns). These are spurring production and regional
development;
Representing the current state of the environment (e.g., levels of
biophysical, social and economic environments);
Describing the key driving forces and what was inevitably
giving the driving forces. These are agricultural, industrial
mineral, tourism sectors;
Identifying key uncertainties that could determine a different
evolution of the future. These would be economic growth rates;
and
Outlining possible futures (given the key driving forces and
uncertainties).
7.2.2 Economic Framework for the NEC and East Africa Community
The Kenyan economy is projected to experience a solid growth of 6-7%
in the medium term, based on the following assumptions (1):
crude oil export would start from the year 2020,
import of refined oil products from the Middle East or Uganda
due to the current outlook of low oil prices and economic
reasons,
the impact of crude oil production may be more significant at the
beginning of oil production and is projected to help attain a
growth of 9% in the year 2020, but diminish gradually as the size
of the economy grows
(1) JST, 2016, Master Plan on the Logistics in the NEC – Draft Final Report

ENVIRONMENTAL RESOURCES MANAGEMENT JST/MOTI
7-7
Table 7.4 Future Gross Domestic Product (GDP) Projection in Kenya 2015-2020
GDP/Sector 2015 2020 2025 2030
GDP growth
(% base case)
5.6% 8,6% 7.9% 5.7%
Agriculture
(% of total)
24.0% 22.5% 20.9% 20%
Industry (% of
total)
21% 24.2% 25.9% 25.4%
Service (% of
total)
55% 53.3% 53.3% 47.4%
Source: JST, 2016
7.2.3 Scenario Analysis
Scenario analysis presents several alternative future developments in
order to determine a scope of possible future outcomes. Therefore,
when analysing scenarios, it is useful to generate an optimistic, a
pessimistic, and a most likely scenario, as discussed in the Sections
below, where the possible outcomes of the NEC Master Plan depend on
how the economy performs in the future.
7.2.3.1 Scenario 1: Status quo
For the purpose of this analysis, this scenario is defined by the Kenyan
Growth Domestic Product (GDP) growing at the current rate of 6.5%
based on the assumptions discussed in Section 7.2.2.
7.2.3.2 Scenario 2: Optimistic
This analysis of the outcomes of Master Plan is based on the national
economy growing at higher rate than 6.5%
7.2.3.3 Scenario 3: Pessimistic
This scenario is based on an annual growth rate of less than 6.5%.
7.2.3.4 Scenario Analysis
Table 7.5 therefore shows the analysis of the Multi-Core with Regional
Industrial Development Type in relation to the various scenarios expected
within the 20-year implementation period of the NEC Masterplan, for
the chosen alternative:
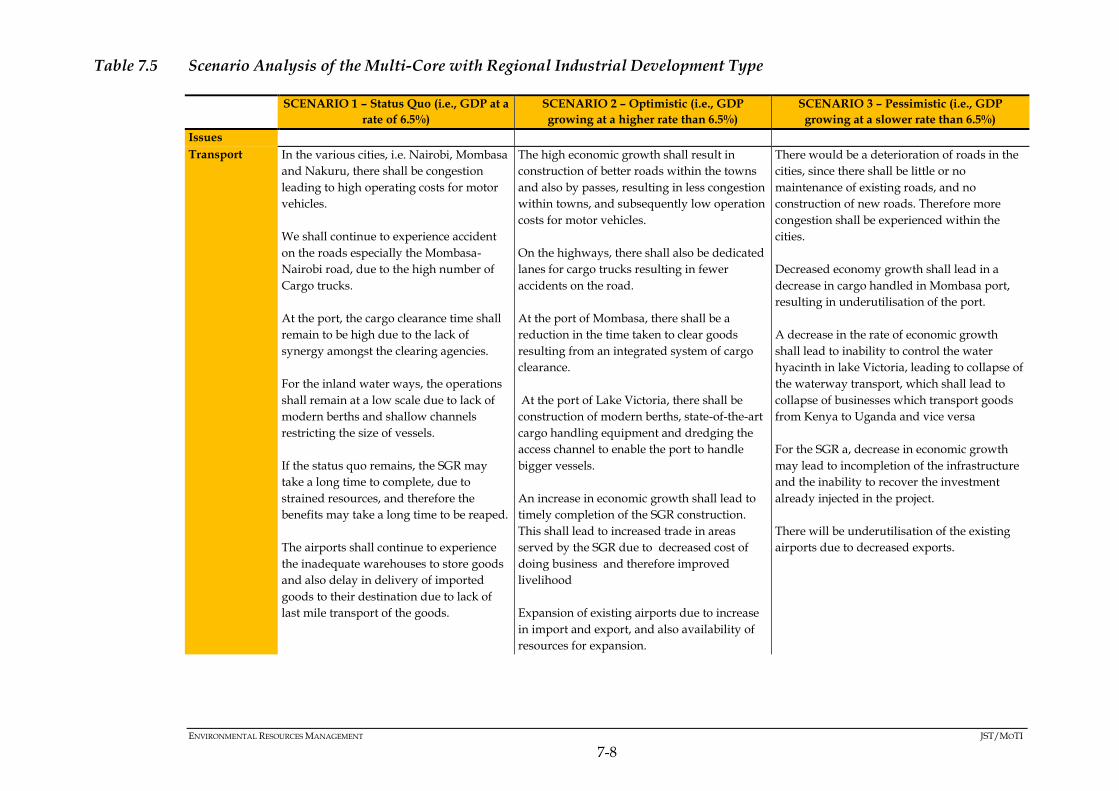
ENVIRONMENTAL RESOURCES MANAGEMENT JST/MOTI
7-8
Table 7.5 Scenario Analysis of the Multi-Core with Regional Industrial Development Type
SCENARIO 1 – Status Quo (i.e., GDP at a
rate of 6.5%)
SCENARIO 2 – Optimistic (i.e., GDP
growing at a higher rate than 6.5%)
SCENARIO 3 – Pessimistic (i.e., GDP
growing at a slower rate than 6.5%)
Issues
Transport In the various cities, i.e. Nairobi, Mombasa
and Nakuru, there shall be congestion
leading to high operating costs for motor
vehicles.
We shall continue to experience accident
on the roads especially the Mombasa-
Nairobi road, due to the high number of
Cargo trucks.
At the port, the cargo clearance time shall
remain to be high due to the lack of
synergy amongst the clearing agencies.
For the inland water ways, the operations
shall remain at a low scale due to lack of
modern berths and shallow channels
restricting the size of vessels.
If the status quo remains, the SGR may
take a long time to complete, due to
strained resources, and therefore the
benefits may take a long time to be reaped.
The airports shall continue to experience
the inadequate warehouses to store goods
and also delay in delivery of imported
goods to their destination due to lack of
last mile transport of the goods.
The high economic growth shall result in
construction of better roads within the towns
and also by passes, resulting in less congestion
within towns, and subsequently low operation
costs for motor vehicles.
On the highways, there shall also be dedicated
lanes for cargo trucks resulting in fewer
accidents on the road.
At the port of Mombasa, there shall be a
reduction in the time taken to clear goods
resulting from an integrated system of cargo
clearance.
At the port of Lake Victoria, there shall be
construction of modern berths, state-of-the-art
cargo handling equipment and dredging the
access channel to enable the port to handle
bigger vessels.
An increase in economic growth shall lead to
timely completion of the SGR construction.
This shall lead to increased trade in areas
served by the SGR due to decreased cost of
doing business and therefore improved
livelihood
Expansion of existing airports due to increase
in import and export, and also availability of
resources for expansion.
There would be a deterioration of roads in the
cities, since there shall be little or no
maintenance of existing roads, and no
construction of new roads. Therefore more
congestion shall be experienced within the
cities.
Decreased economy growth shall lead in a
decrease in cargo handled in Mombasa port,
resulting in underutilisation of the port.
A decrease in the rate of economic growth
shall lead to inability to control the water
hyacinth in lake Victoria, leading to collapse of
the waterway transport, which shall lead to
collapse of businesses which transport goods
from Kenya to Uganda and vice versa
For the SGR a, decrease in economic growth
may lead to incompletion of the infrastructure
and the inability to recover the investment
already injected in the project.
There will be underutilisation of the existing
airports due to decreased exports.

ENVIRONMENTAL RESOURCES MANAGEMENT JST/MOTI
7-9
SCENARIO 1 – Status Quo (i.e., GDP at a
rate of 6.5%)
SCENARIO 2 – Optimistic (i.e., GDP
growing at a higher rate than 6.5%)
SCENARIO 3 – Pessimistic (i.e., GDP
growing at a slower rate than 6.5%)
Issues
Bio-physical The magnitude and scope of impacts
under this scenario will be as predicted in
this Report. This scenario is the basis of
this SEA’s impact prediction and analysis.
The significant potential negative impacts
are found to include:
Habitat Alteration and Biodiversity
Impacts;
Air Emissions;
Soil Alteration;
Hydrological Modifications;
Pollution Risk;
Natural Resources Demand, and
Health and Safety Risks.
These impacts are fairly distributed in the
target areas of the NEC MP. In general,
this scenario has a mostly moderate
outcome as compared to the other two
scenarios.
In this scenario, there will be more growth in
the target economic sectors of the NEC MP
and others, promoting infrastructure
development.
Compared to other scenarios, this will create
the most demand on the natural resources
required for the development of the NEC MP’s
projects. In addition, landscape modifications
would be more significant in contrast to the
other scenarios.
The pressure placed on sensitive ecosystems
by the infrastructure projects and spurred
human settlements linked to the NEC MP will
be the highest in this scenario. This is because
it is anticipated that the population will grow
the most in industrial or economic centres
targeted by the NEC MP.
The magnitude and scope of impacts is
therefore the highest in this scenario. In
particular, the geographical scope of these
impacts will be spread out more than the other
scenarios due to a higher intensification of
economic activities.
On the other hand, financial and social
capacities to manage environmental risks will
be the highest in this scenario. Therefore,
mitigation, monitoring and management
measures will be easier to implement whereas
there will be more potential for innovation.
Under this scenario there will be less growth in
the sectors targeted by the NEC MP as well as
others.
There will be less infrastructure growth than
Scenario 1 and thus less demand for natural
resources. As such the scope of impacts is at
most similar to Scenario 1.
Compared to Scenario 2, there will be less
pressure on sensitive ecosystems by the
infrastructure projects and spurred human
settlements linked to the NEC MP.
Financial and social capacities to manage the
risks of the NEC MP will be the least and
therefore their magnitude will be higher on
their receptors when compared to the other
scenarios. Due to these lower capacities, there
will be more pressure for innovation in
environmental risk management.
Social
Archaeological and historical heritage sites would be threatened
Archaeological and historical heritage sites would be highly threatened
Archaeological and historical heritage sites may not be threatened
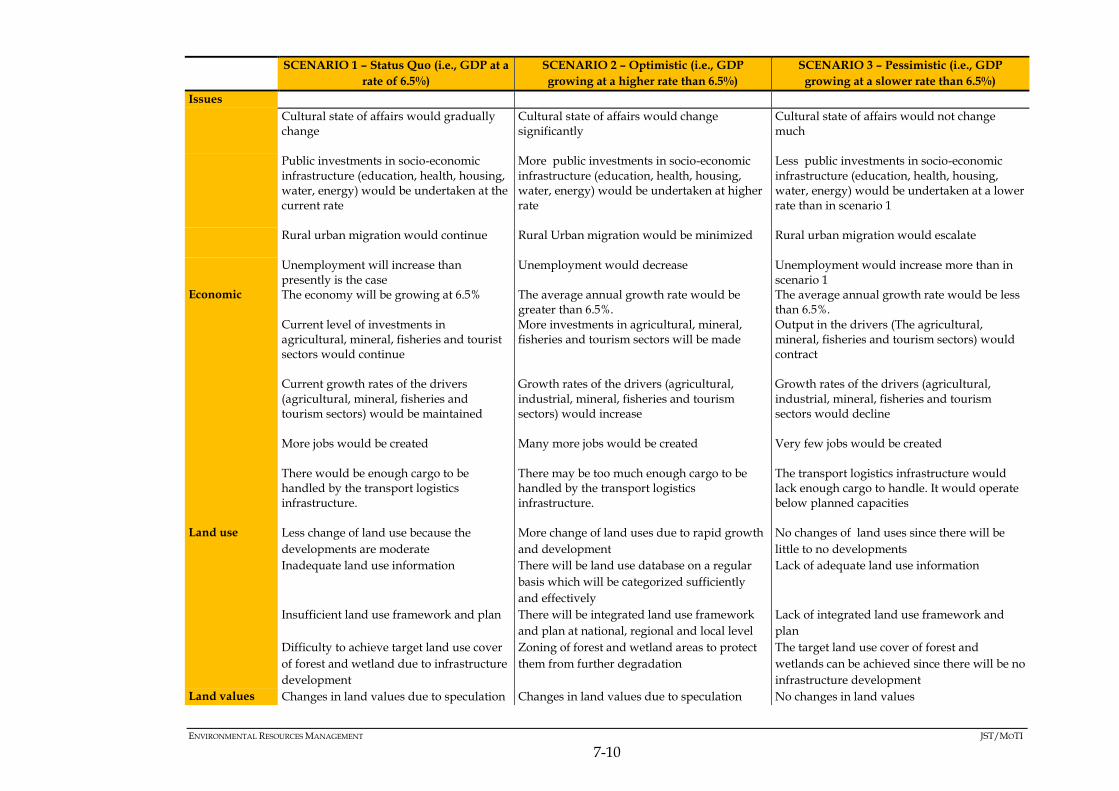
ENVIRONMENTAL RESOURCES MANAGEMENT JST/MOTI
7-10
SCENARIO 1 – Status Quo (i.e., GDP at a
rate of 6.5%)
SCENARIO 2 – Optimistic (i.e., GDP
growing at a higher rate than 6.5%)
SCENARIO 3 – Pessimistic (i.e., GDP
growing at a slower rate than 6.5%)
Issues
Cultural state of affairs would gradually change
Cultural state of affairs would change significantly
Cultural state of affairs would not change much
Public investments in socio-economic infrastructure (education, health, housing, water, energy) would be undertaken at the current rate
More public investments in socio-economic infrastructure (education, health, housing, water, energy) would be undertaken at higher rate
Less public investments in socio-economic infrastructure (education, health, housing, water, energy) would be undertaken at a lower rate than in scenario 1
Rural urban migration would continue
Rural Urban migration would be minimized
Rural urban migration would escalate
Unemployment will increase than presently is the case
Unemployment would decrease Unemployment would increase more than in scenario 1
Economic The economy will be growing at 6.5% The average annual growth rate would be greater than 6.5%.
The average annual growth rate would be less than 6.5%.
Current level of investments in agricultural, mineral, fisheries and tourist sectors would continue
More investments in agricultural, mineral, fisheries and tourism sectors will be made
Output in the drivers (The agricultural, mineral, fisheries and tourism sectors) would contract
Current growth rates of the drivers (agricultural, mineral, fisheries and tourism sectors) would be maintained
Growth rates of the drivers (agricultural, industrial, mineral, fisheries and tourism sectors) would increase
Growth rates of the drivers (agricultural, industrial, mineral, fisheries and tourism sectors would decline
More jobs would be created
Many more jobs would be created
Very few jobs would be created
There would be enough cargo to be handled by the transport logistics infrastructure.
There may be too much enough cargo to be handled by the transport logistics infrastructure.
The transport logistics infrastructure would lack enough cargo to handle. It would operate below planned capacities
Land use Less change of land use because the
developments are moderate
More change of land uses due to rapid growth
and development
No changes of land uses since there will be
little to no developments
Inadequate land use information There will be land use database on a regular
basis which will be categorized sufficiently
and effectively
Lack of adequate land use information
Insufficient land use framework and plan There will be integrated land use framework
and plan at national, regional and local level
Lack of integrated land use framework and
plan
Difficulty to achieve target land use cover
of forest and wetland due to infrastructure
development
Zoning of forest and wetland areas to protect
them from further degradation
The target land use cover of forest and
wetlands can be achieved since there will be no
infrastructure development
Land values Changes in land values due to speculation Changes in land values due to speculation No changes in land values

ENVIRONMENTAL RESOURCES MANAGEMENT JST/MOTI
7-11
SCENARIO 1 – Status Quo (i.e., GDP at a
rate of 6.5%)
SCENARIO 2 – Optimistic (i.e., GDP
growing at a higher rate than 6.5%)
SCENARIO 3 – Pessimistic (i.e., GDP
growing at a slower rate than 6.5%)
Issues
Land Tenure
System
Secure land tenure system.
Efficient system of land delivery with
preparation and maintenance of cadastral
information indicating not merely who
owns what interest in land, but other
details such as land capability, uses, size,
distribution and topographical
characteristics.
Secure land tenure system.
Efficient system of land delivery with
preparation and maintenance of cadastral
information indicating not merely who owns
what interest in land, but other details such as
land capability, uses, size, distribution and
topographical characteristics.
Insecure Land tenure systems
Land
Acquisition
and
Resettlement
No clear regulations of land acquisition
and resettlement e.g. croplands protection
Increase interests to safeguard issues like food
security land which hold multi crop potential
can be acquired and the owner be resettled in
another area or compensated e.g. case of and
irrigation scheme
Increased uncontrolled land acquisition and
resettlement systems Increased uncontrolled
compensation methods.
Settlement
Patters
Insufficient frameworks to fully control
settlement structure.
Poor implementation of set guidelines
governing or controlling settlements
Settlement patterns will be controlled through
the implementation of plans and through
zoning and building coding systems.
Increased uncontrolled settlements and
developments
Eruption of informal settlements
Urbanisation No clear guidelines to control urbanization
e.g. integrated plans.
Growth of urban centres and other growth
drivers
Lack of integrated plans to control
urbanization, Urban Sprawl

ENVIRONMENTAL RESOURCES MANAGEMENT JST/MOTI
8-1
8 STAKEHOLDER ENGAGEMENT
8.1 OVERVIEW
This Chapter presents a summary of the stakeholder engagement
undertaken as part of the SEA. It also serves as a summary of a more
detailed Stakeholder Engagement Plan (SEP), which presents the
engagement approach and identifies stakeholders and the mechanisms
through which stakeholders have been engaged. The complete SEP is
included in Annex E.
The engagement process has been designed to meet both Kenyan legal
requirements for public participation in relation to a SEA and
international requirements for engagement as outlined in the JICA
Guidelines for Environmental and Social Considerations, 2010.
8.2 OBJECTIVES OF STAKEHOLDER ENGAGEMENT
The objectives of engaging stakeholders and the general public during
the SEA process and beyond include:
Ensuring understanding: An open, inclusive and transparent
process of engagement and communication was undertaken to
ensure that stakeholders were well informed about the Master Plan
as it developed. Information was disclosed as early and as
comprehensively as possible and appropriate.
Involving stakeholders in the assessment: Stakeholders were
included in the scoping of issues as well as the SEA Study. They also
played an important role in providing local knowledge and
information for the baseline to inform the impact assessment.
Building relationships: Through supporting open dialogue,
engagement helped establish and maintain a productive
relationship between the Master Plan and stakeholders. This
supports not only an effective SEA, but also strengthens the existing
relationships and builds new relationships between MoTI and
stakeholders.
Ensuring compliance: The process was designed to ensure
compliance with both national regulatory requirements and
international best practice.
ENVIRONMENTAL RESOURCES MANAGEMENT JST/MOTI
8-2
One of the key outcomes of engagement should be free, prior and
informed consultation of stakeholders, where this can be understood to
be:
Free: engagement free of external manipulation or coercion and
intimidation;
Prior: engagement undertaken in a timely way, for example the
timely disclosure of information; and
Informed: engagement enabled by relevant, understandable and
accessible information.
8.3 STAKEHOLDER IDENTIFICATION AND MAPPING
8.3.1 Stakeholder Identification
Stakeholder identification was undertaken through a brainstorming
process and to guide the exercise, the following questions were asked:
Which people/groups/institutions would be interested in the
Master Plan development and implementation? What is/would be
their role?
Who are the potential beneficiaries of the NEC?
Who might be adversely impacted? Who has constraints about the
initiative?
Who may impact the Master Plan? Who has the power to influence?
Thereafter, a list of stakeholder’s organizations was developed and
grouped as government, civil society, NGOs and private sector, as
presented in Table 8.1 below and the detailed Stakeholder Database is
provided in Annex E.
The next step was to analyse the list of stakeholders to better
understand their relevance and the perspective they offer, to
understand their relationship to the issues and each other and, to
prioritize based on their the relative usefulness for the SEA
engagement. A list of criteria used to analyse each stakeholder is as
follows:
Contribution (value): does the stakeholder have information
counsel or expertise on the issue that could be helpful to the SEA
process?
ENVIRONMENTAL RESOURCES MANAGEMENT JST/MOTI
8-3
Legitimacy: how legitimate is the stakeholders claim for
engagement?
Willingness to engage: how willing is the stakeholder to engage?
Influence: how much influence does the stakeholder have?
Necessity of involvement: can the stakeholder derail or
delegitimize the SEA process if they were not included in the
engagement?

ENVIRONMENTAL RESOURCES MANAGEMENT JST/MOTI
8-4
Table 8.1 List of Identified Stakeholders
Stakeholder Category Stakeholder Group Connection to the Master Plan
Government Government agencies
National regulatory bodies
National Government are of primary
importance in terms of establishing PPPs
Key County Authorities County government are also of primary
importance as they are responsible for
implementation of legislation, and
development plans and policies at the County
level. The NEC traverses 29 Counties.
Civil Society Community Based Organisations
Community of Other Associations
Research and Academic
Institutions
Organisations with direct interest in the NEC
and Master Plan, and its social and
environmental aspects and that are able to
influence the Master Plan directly or through
public opinion. Such organisations may also
have useful data and insight and may be able
to become partners to the Master Plan in areas
of common interest.
Non-Governmental Organisations
(NGOs)
National
Local
NGOs with direct interest in the NEC and
Master Plan, and its social and environmental
aspects and that are able to influence the
Master Plan directly or through public
opinion.
Private Sector Private Sector Private Sector with direct interest in the NEC,
and the impact it will have on their businesses.

ENVIRONMENTAL RESOURCES MANAGEMENT JST/MOTI
8-5
8.3.2 Stakeholder Mapping
8.3.2.1 Stakeholder Mapping
Mapping stakeholders is a visual exercise and analysis tool used to
establish which stakeholders are most useful to engage with. Mapping
allows one to see where stakeholders stand when valuated by the same
key criteria and compared to each other and helps to visualize the often
complex interplay of issues and relationships created in then criteria
chart above.
When developing stakeholder map, the SEA team considered the
following questions:
1. What is the stakeholder’s level of influence? Level of influence
refers to the stakeholder’s breadth of authority and influence (direct
or indirect) to the success of the SEA, including positional authority,
financial power, or persuasive power over decision-makers.
2. What is the extent of the stakeholder’s potential contributions?
For example, does the stakeholder have information, expertise, or
resources (current or potential) that will facilitate the development
and execution of the Master Plan? What perspectives or experiences
does the stakeholder bring to the conversation that is unique to his
or her community?
3. What is the stakeholder’s commitment level? What would be the
organization’s role in executing the Master Plan? How committed is
the organization’s leadership to executing the Master Plan? How
will the change associated with the Master Plan affect the
organization?
8.3.2.2 Creating a Stakeholder Map
After detailed information was gathered about the stakeholders, the
next task was to create a Stakeholder Map. This is a visual exercise and
analysis tool to help determine the extent to which different
stakeholders could be engaged in the SEA process, based on their level
of influence and potential contributions.
In order to create the stakeholder map, the SEA team classified each
stakeholder as either high influence or low influence, and as either high
contribution or low contribution. The stakeholders were then placed
into the appropriate quadrant (group) on the stakeholder map: A, B, C,
or D (see Figure 8.1 below). Those that fell into groups B, C, and D were
considered key stakeholders because they had substantial influence,
could make substantial contributions to the SEA process, or both.

ENVIRONMENTAL RESOURCES MANAGEMENT JST/MOTI
8-6
Figure 8.1 Stakeholder Mapping
High
B.
High influence/Low
contribution
A.
High influence/High
contribution
D.
Low
influence/Low
contribution
C.
Low influence/High
contribution
Low High
Contribution
8.3.2.3 Stakeholder Groups
Group A (high influence, high contribution): These stakeholders
appear to have a high degree of influence on the Master Plan and are of
high importance to its success. Therefore, the SEA Team created good
working relationships with these stakeholders, to ensure an effective
coalition of support for the SEA.
Group B (high influence, low contribution): These are stakeholders
with high influence, who can affect the outcomes of the SEA, but whose
interests were not necessarily aligned with the overall goals of the
Master Plan.
Group C (low influence, high contribution): These stakeholders are of
high importance to the success of the Master Plan, but have low
influence. This implies that they require special initiatives if their
interests are to be protected. Because of their substantial contributions,
they can help shape the implementation of the SEA and therefore, in
some circumstances, be valued more highly than stakeholders in Group
C.
Group D (low influence, low contribution): The stakeholders in this
group have low influence and low importance to the Master Plan
objectives. Therefore they are of low priority and require limited
engagement.
Lev
el o
f In
flu
ence

ENVIRONMENTAL RESOURCES MANAGEMENT JST/MOTI
8-7
8.3.2.4 Approaches and Methods for Engaging Stakeholders
Table 8.2 Approaches and Methods for Engaging Stakeholders
Stakeholder/Organisatio
n
Approach Methodology
Group A (High
Influence, High
Contribution)
Engage and consult
regularly
Involve in decision-
making of:
strategic priorities,
intervention
selection, and
cost estimate
Inclusion in strategy
advisory group or
SEA team
consultations
Inclusion in thematic
consultations
Key informant
interviews,
Consensus-building
and decision-making
forums
Group B (High
Influence, Low
Contribution)
Consult on specific areas
of
expertise/Contribution
Proactively engage
Same as Group A, plus:
One-on-one
consultations
Group C (Low Influence,
High
Contribution
Same as Group A, plus:
Work with stakeholders
to ensure that expressed
needs and concerns are
directly reflected in the
SEA
Same as Group A, plus:
Dedicated
stakeholder
consultation during
situation analysis to
gather stakeholder
input
Solicitation of
recommendations for
interventions
Review of planned
intervention
This list of stakeholders mapped according to their levels of influence
and contribution is presented in the SEP in Annex E.
8.4 STAKEHOLDER ENGAGEMENT
8.4.1 Stakeholder Meetings
Various stakeholder meetings were then held as shown in Table 8.3 and
Table 8.4 below. The minutes and the list of participants in the meetings
are attached in Annex F. It is important to note that since the coverage
area of the Master Plan is so extensive:
the target participants was limited to high level officials, and
ENVIRONMENTAL RESOURCES MANAGEMENT JST/MOTI
8-8
the places where the stakeholder meetings were conducted was
limited to major cities/towns along the Corridor, namely
Nairobi, Mombasa, Nakuru, Kisumu and Malaba (1) .
(1) This was agreed in consultative meetings between NEMA/JST/MoTI.

ENVIRONMENTAL RESOURCES MANAGEMENT JST/MOTI
8-9
Table 8.3 Stakeholder Meetings at the Scoping Stage
Date Location Venue Attendees
02nd November 2015 Nairobi Silver Springs Hotel JICA, various Government Ministries,
PIEA, LAPSSET Authority, KURA, Traffic
Police, NEMA, KPC, SP Advisory, Toyota
Tsusho East Africa Ltd, KIFWA, KURA,
KeNHA, KeRRA
04th November 2015 Mombasa Best Western Creekside Hotel Ministry of Lands, KIFWA, KPRL,
NCTTCA, KPA
06th November 2015 Nakuru Merica Hotel Ministry of Industrialisation, NEMA, KAM,
Ministry of Labour, Social Security and
Services, County Government of Nakuru
09th November 2015 Kisumu Imperial Hotel Ministry of Energy, NEMA, KeNHA and
Lake Victoria Basin Development Authority
09th November 2015 Kisumu Kisumu County Government Offices Kisumu County Government CEC-
Information Communication and
Technology
10th November 2015 Kisumu Kenya Association of Manufacturers
(KAM) Offices in Kisumu
KAM Western and Nyanza Region and the
Kenya National Chambers of Commerce
and Industry (KNCCI)-Western and
Nyanza Region
10th November 2015 Kisumu County Government Offices, City Hall,
Kisumu
Kisumu County
Government City Planner
10th November 2015 Kisumu Kisumu County Government Offices Kisumu County
Government CEC- Industrialisation
10th November 2015 Kisumu Tom Mboya Labour College, Kisumu
City
Government Officials from Busia County
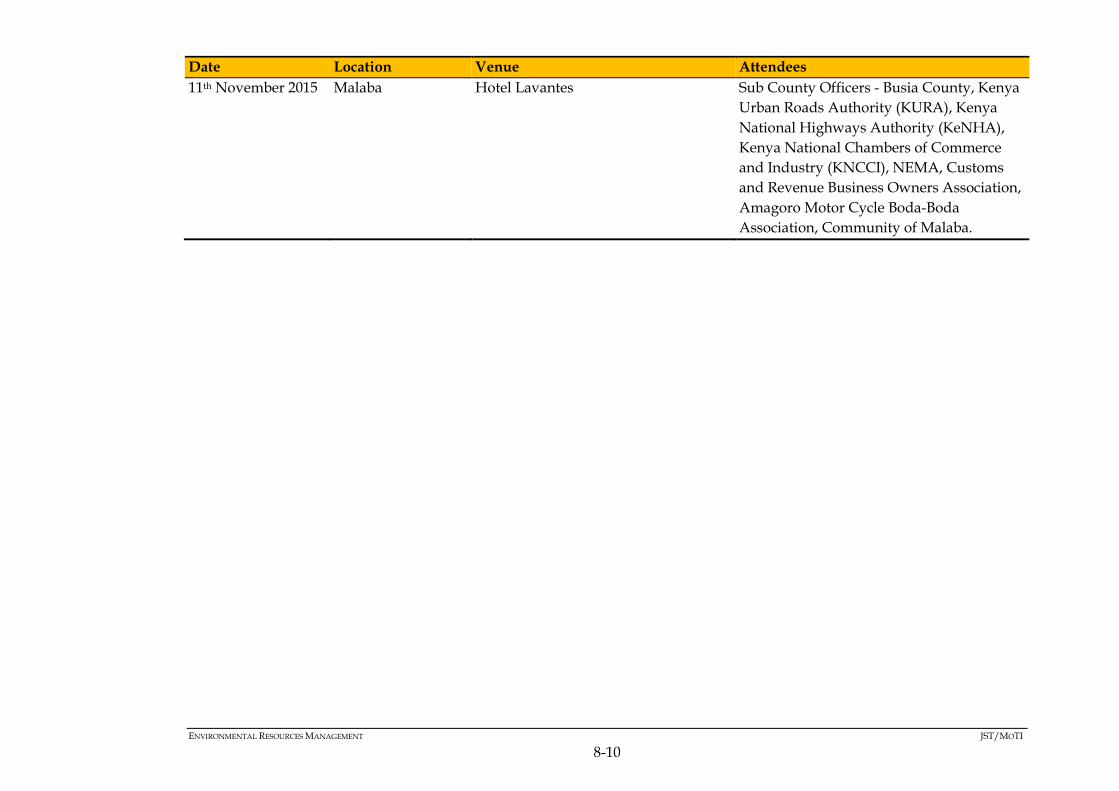
ENVIRONMENTAL RESOURCES MANAGEMENT JST/MOTI
8-10
Date Location Venue Attendees
11th November 2015 Malaba Hotel Lavantes Sub County Officers - Busia County, Kenya
Urban Roads Authority (KURA), Kenya
National Highways Authority (KeNHA),
Kenya National Chambers of Commerce
and Industry (KNCCI), NEMA, Customs
and Revenue Business Owners Association,
Amagoro Motor Cycle Boda-Boda
Association, Community of Malaba.
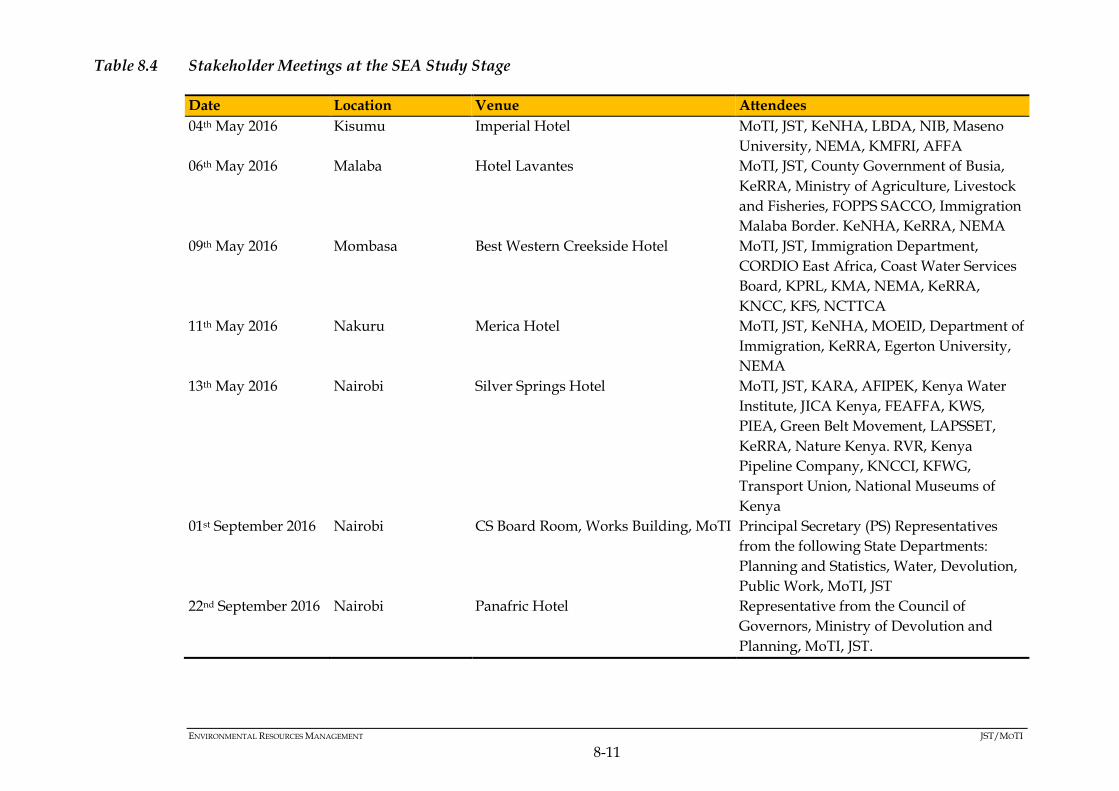
ENVIRONMENTAL RESOURCES MANAGEMENT JST/MOTI
8-11
Table 8.4 Stakeholder Meetings at the SEA Study Stage
Date Location Venue Attendees
04th May 2016 Kisumu Imperial Hotel MoTI, JST, KeNHA, LBDA, NIB, Maseno
University, NEMA, KMFRI, AFFA
06th May 2016 Malaba Hotel Lavantes MoTI, JST, County Government of Busia,
KeRRA, Ministry of Agriculture, Livestock
and Fisheries, FOPPS SACCO, Immigration
Malaba Border. KeNHA, KeRRA, NEMA
09th May 2016 Mombasa Best Western Creekside Hotel MoTI, JST, Immigration Department,
CORDIO East Africa, Coast Water Services
Board, KPRL, KMA, NEMA, KeRRA,
KNCC, KFS, NCTTCA
11th May 2016 Nakuru Merica Hotel MoTI, JST, KeNHA, MOEID, Department of
Immigration, KeRRA, Egerton University,
NEMA
13th May 2016 Nairobi Silver Springs Hotel MoTI, JST, KARA, AFIPEK, Kenya Water
Institute, JICA Kenya, FEAFFA, KWS,
PIEA, Green Belt Movement, LAPSSET,
KeRRA, Nature Kenya. RVR, Kenya
Pipeline Company, KNCCI, KFWG,
Transport Union, National Museums of
Kenya
01st September 2016 Nairobi CS Board Room, Works Building, MoTI Principal Secretary (PS) Representatives
from the following State Departments:
Planning and Statistics, Water, Devolution,
Public Work, MoTI, JST
22nd September 2016 Nairobi Panafric Hotel Representative from the Council of
Governors, Ministry of Devolution and
Planning, MoTI, JST.

ENVIRONMENTAL RESOURCES MANAGEMENT JST/MOTI
8-12
8.4.2 Baseline Phase Engagement
8.4.2.1 Opinion Surveys
Two sets of opinion surveys/questionnaires were administered during
the stakeholder meetings. The results were used to inform the baseline
data.
8.4.2.2 Key Informant Interviews
Key Informant Interviews (KIIs) were held with stakeholders in April
and May 2016, where the interviewees were taken through a guided
discussion. See Table 8.5 for the discussion topics and Table 8.6 for the
interview schedule. The interviews were held one on one between
Stakeholders and individual SEA team members.

ENVIRONMENTAL RESOURCES MANAGEMENT JST/MOTI
8-13
Table 8.5 KII Discussion Topics
Subject Question/Discussion Topic Target Respondent/
Stakeholder
Environment
Designated and Sensitive Areas Industrial corridors Are there any gazetted or at least recognized industrial corridors in the PAs according to their management plans?
KWS, KFS
PCAs and CCAs What are the sensitivities of the PCAs and CCAs intersected by the NEC? Do the authorities maintain any data or records on them?
KWS, KFS
Unprotected Sensitive Areas Besides the priority ecosystems identified in KWS’s website are there any other ecosystems in the NEC that are not protected?
KFS, KWS
Threats Which threats face the protected areas intersected?
KWS, KFS
Species of Commercial Value The species (flora and Fauna) of commercial value found in the NEC and their markets.
KWS, KFS, County Governments
Pollution and Air Quality Pollution and Air Quality The main forms of pollution that occur in their respective counties, their causes, impacts and actions being taken in response.
County Governments, KPA
Regulatory Framework Adequacy of Current Framework Any regulatory gaps in their jurisdictions or mandates with respect to management of natural resources.
All stakeholders
Hydrology Are there any recently documented articles on the hydrological and hydrogeological conditions of all the counties? If yes where?
WRMA Kenya Metrological Department.
Geology and Soils Do the authorities have recent soil surveys done along the corridor? How have the recent changes in land use affected the structures and composition of the soil along the corridor?
KARLO
Socio-Economic

ENVIRONMENTAL RESOURCES MANAGEMENT JST/MOTI
8-14
Subject Question/Discussion Topic Target Respondent/
Stakeholder
Effects/impact of implementing the
NEC Master Plan on other
organizations
How will implementation of the NEC Master Plan affect/impact on
implementation of your policy, programs and plans and, vice versa?
All stakeholders
Socio-economic compatibility of
NEC Master Plan and other
intuitional policies, programmes
and plans
What are the compatible socio-economic areas (actual and potential)
between NEC Master Plan and your policy, programs and plans?
All stakeholders
Socio-economic conflicts between
the NEC Master Plan and other
institutional policies, programmes
and plans
What are the socio-economic areas of conflict (actual and potential)
between the NEC Master Plan and your policy, programs and
plans?
All stakeholders
Strategic actions and
recommendations
Propose specific strategic actions that the NEC Master plan should
have to:
a) enhance compatibility; and
b) mitigate the conflicts.
All stakeholders
Archaeological sites Are archaeological and historical sites documented in their
respective counties?
Do the authorities maintain any records on them?
National Museums of
Kenya
Additional sources of information Is there useful documentation that you know of, that the SEA Team
should note, refer to, or guide them while assessing the NEC Master
Plan?
Do the authorities maintain any records on them
All stakeholders
Urban/Physical Planning Urban areas How will the urban areas found along the corridor likely to be
affected economically by the NEC? Ministry of Lands, Housing and Urban Development
Transport
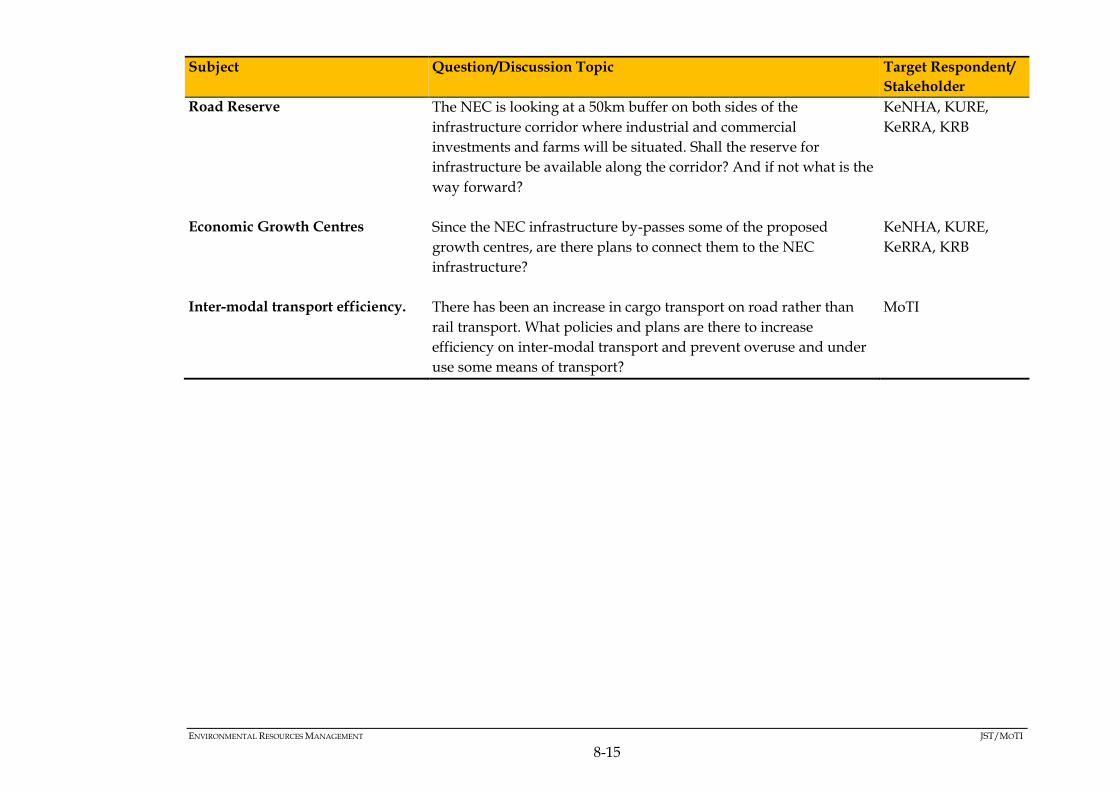
ENVIRONMENTAL RESOURCES MANAGEMENT JST/MOTI
8-15
Subject Question/Discussion Topic Target Respondent/
Stakeholder
Road Reserve The NEC is looking at a 50km buffer on both sides of the
infrastructure corridor where industrial and commercial
investments and farms will be situated. Shall the reserve for
infrastructure be available along the corridor? And if not what is the
way forward?
KeNHA, KURE,
KeRRA, KRB
Economic Growth Centres Since the NEC infrastructure by-passes some of the proposed
growth centres, are there plans to connect them to the NEC
infrastructure?
KeNHA, KURE,
KeRRA, KRB
Inter-modal transport efficiency. There has been an increase in cargo transport on road rather than
rail transport. What policies and plans are there to increase
efficiency on inter-modal transport and prevent overuse and under
use some means of transport?
MoTI

ENVIRONMENTAL RESOURCES MANAGEMENT JST/MOTI
8-16
Table 8.6 Key Informant Interviews Schedule
Date Location Venue Stakeholder/Representative
19th April 2016 Nairobi KWS Headquarters Nairobi KWS Warden in Charge of Nairobi National
Park
Kisumu Kenya Railways Offices Port Manager
Mombasa Kenya Maritime Authority (KMA)
Headquarters
KMA Marine Safety Engineer
Kisumu County Government Officers Chief Officer Communication, Planning and
Development
20th April 2016 Nakuru County Environment Offices County Director Environment (NEMA,
Nakuru)
Mombasa KWS Headquarters Mombasa Assistant Director KWS Coast
Kisumu KPC Offices KPC Assistant Director
Nairobi KNCCI Offices KNCCI Manager in the Department of
Trade
Nakuru KeRRA Regional Offices KeRRA Regional Manager
Nairobi KeRRA Headquarters Director General and Senior Engineer
Nakuru County Government Offices CEC Lands, Housing and Physical Planning
Nakuru County Government Offices CEC in charge of Agriculture, Livestock and
Fisheries
21st April 2016 Malaba PALWECO Offices Sub County Coordinator Malaba,
Mombasa KNCCI Offices Executive Officer KNCCI Mombasa
Busia Busia County Offices County Government Busia- Chief Officer
Public Works and Energy
Busia Assistant County Commissioner
Malaba Office
Assistant County Commissioner
22nd April 2016 Mombasa KFS Headquarters Assistant Director KFS Coast Region
Mombasa Kenya Ports Authority (KPA) Environmental Officer
Kisumu KPA Inland Container Depot (ICD) Port Manager
Kisumu Kisumu City County Offices Director City Planning, Kisumu City
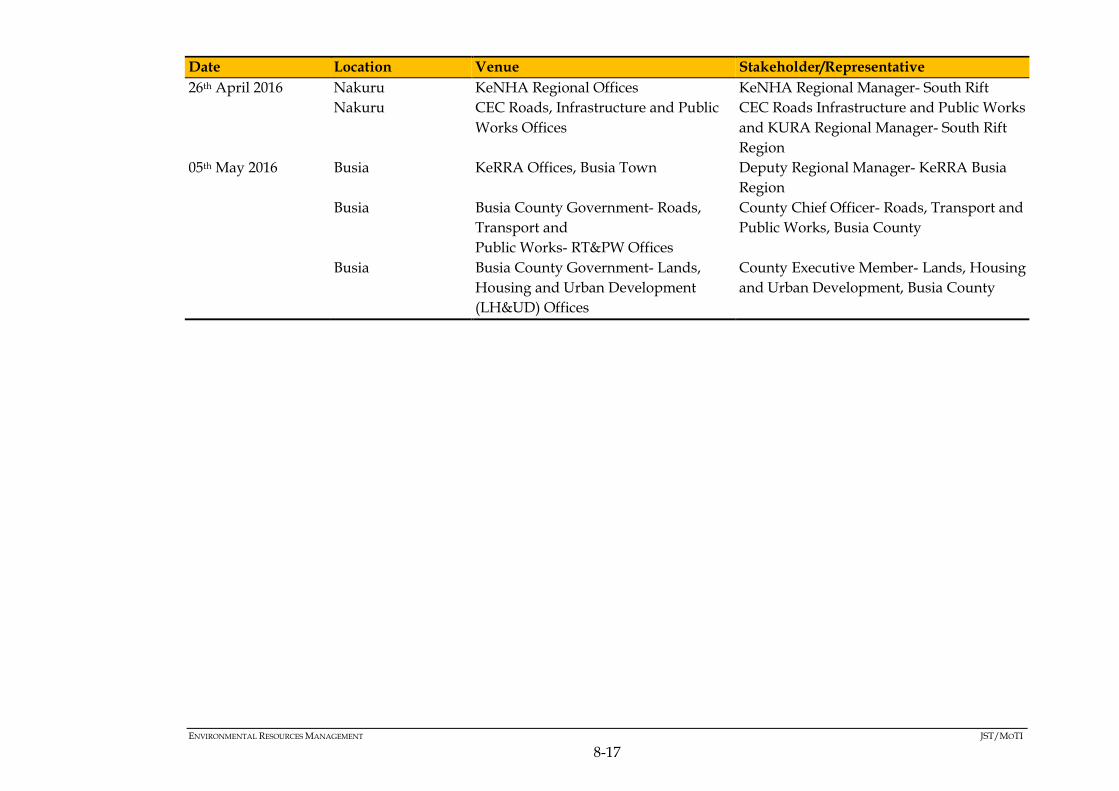
ENVIRONMENTAL RESOURCES MANAGEMENT JST/MOTI
8-17
Date Location Venue Stakeholder/Representative
26th April 2016 Nakuru KeNHA Regional Offices KeNHA Regional Manager- South Rift
Nakuru CEC Roads, Infrastructure and Public
Works Offices
CEC Roads Infrastructure and Public Works
and KURA Regional Manager- South Rift
Region
05th May 2016 Busia KeRRA Offices, Busia Town Deputy Regional Manager- KeRRA Busia
Region
Busia Busia County Government- Roads,
Transport and
Public Works- RT&PW Offices
County Chief Officer- Roads, Transport and
Public Works, Busia County
Busia Busia County Government- Lands,
Housing and Urban Development
(LH&UD) Offices
County Executive Member- Lands, Housing
and Urban Development, Busia County
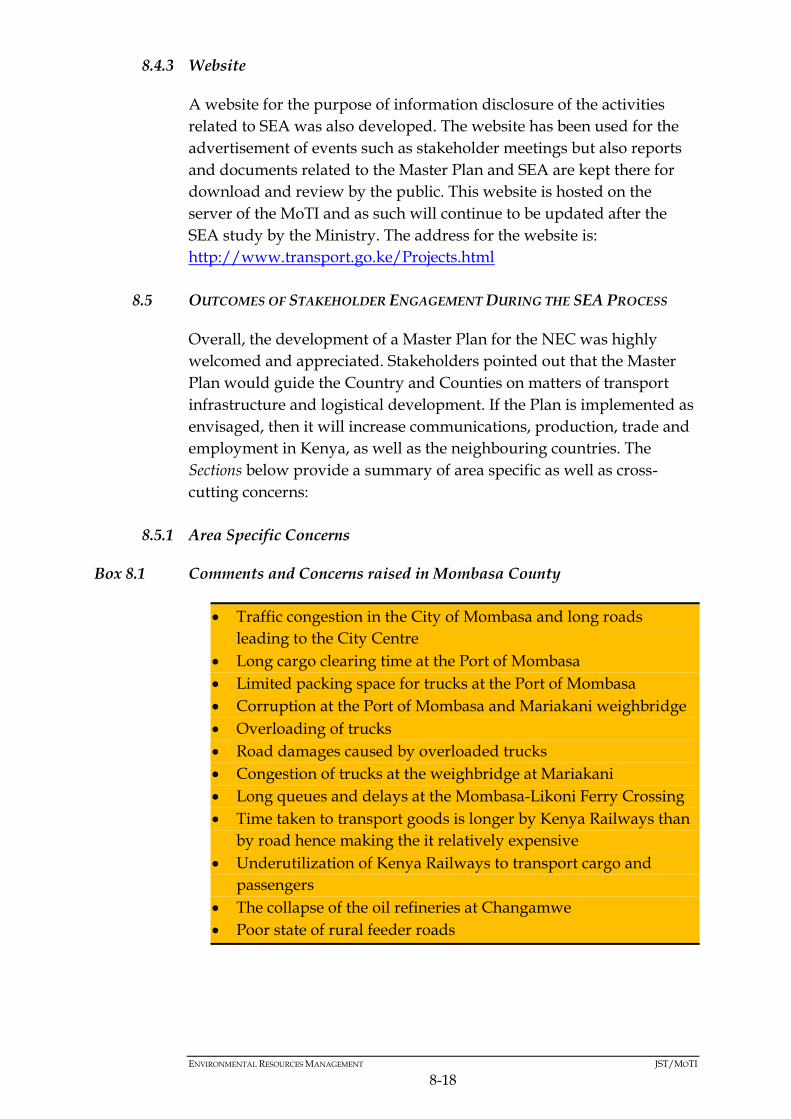
ENVIRONMENTAL RESOURCES MANAGEMENT JST/MOTI
8-18
8.4.3 Website
A website for the purpose of information disclosure of the activities
related to SEA was also developed. The website has been used for the
advertisement of events such as stakeholder meetings but also reports
and documents related to the Master Plan and SEA are kept there for
download and review by the public. This website is hosted on the
server of the MoTI and as such will continue to be updated after the
SEA study by the Ministry. The address for the website is:
http://www.transport.go.ke/Projects.html
8.5 OUTCOMES OF STAKEHOLDER ENGAGEMENT DURING THE SEA PROCESS
Overall, the development of a Master Plan for the NEC was highly
welcomed and appreciated. Stakeholders pointed out that the Master
Plan would guide the Country and Counties on matters of transport
infrastructure and logistical development. If the Plan is implemented as
envisaged, then it will increase communications, production, trade and
employment in Kenya, as well as the neighbouring countries. The
Sections below provide a summary of area specific as well as cross-
cutting concerns:
8.5.1 Area Specific Concerns
Box 8.1 Comments and Concerns raised in Mombasa County
Traffic congestion in the City of Mombasa and long roads
leading to the City Centre
Long cargo clearing time at the Port of Mombasa
Limited packing space for trucks at the Port of Mombasa
Corruption at the Port of Mombasa and Mariakani weighbridge
Overloading of trucks
Road damages caused by overloaded trucks
Congestion of trucks at the weighbridge at Mariakani
Long queues and delays at the Mombasa-Likoni Ferry Crossing
Time taken to transport goods is longer by Kenya Railways than
by road hence making the it relatively expensive
Underutilization of Kenya Railways to transport cargo and
passengers
The collapse of the oil refineries at Changamwe
Poor state of rural feeder roads

ENVIRONMENTAL RESOURCES MANAGEMENT JST/MOTI
8-19
Box 8.2 Comments and Concerns raised in Nairobi County
Box 8.3 Comments and Concerns raised in Nakuru County
Traffic congestion within the City of Nairobi which is increasing
the time and cost of travelling
Unsatisfactory traffic flow control by the traffic police and traffic
lights
Public service vehicles (matatu) disregard for traffic laws
Traffic accidents
Road damages caused by overloaded trucks
High road maintenance costs
Time taken to transport goods is longer by Kenya Railways than
by road, making it comparatively expensive
Underutilisation of the Kenya Railways to transport cargo and
passengers
Interference of the SGR with Nairobi National Park
Lack of lanes for use by cyclists and hand carts on city roads
Lack of road signage in some areas within Nairobi
Congestion of trucks at the weighbridge at Mlolongo
Corruption at the weighbridge at Mlolongo
Overloading by trucks
Failure by some trucks to use the Northern and Southern by-
passes
Traffic congestion within the CBD
Time taken to transport goods is longer by Kenya Railways than
by road, making it comparatively expensive
Congestion caused by trucks at the vehicle inspection near Gilgil
Congestion caused by trucks at Salaga town
Increase in number of traffic accidents
Poor state of rural feeder roads

ENVIRONMENTAL RESOURCES MANAGEMENT JST/MOTI
8-20
Box 8.4 Comments and Concerns raised in Kisumu County
Box 8.5 Comments and Concerns raised in Busia County
8.5.2 Cross-Cutting Issues
The following is a summary of issues and comments raised throughout
the engagement process:
Underutilisation of the port of Kisumu and other smaller ports
along Lake Victoria
Traffic congestion within the CBD
Time taken to transport goods is longer by Kenya Railways than
by road hence making the railway transport more expensive
Underutilisation of Kenya Railway to transport cargo and
passengers. The Butere line is currently out of use
Poor state of rural feeder roads
Underutilisation of Mombasa International Airport in handling
cargo
Traffic congestion at Malaba and Busia border points
Most of Malaba Town sits on privately owned land
Long clearing time of trucks crossing in and out of Kenya
Poor state of rural feeder roads
Loss of revenue to the County government if the cargo handled
by the trucks is moved to the railway and pipeline
Decline of businesses that directly and indirectly depend on
trucks
Increase of unemployment in the towns if the shift of cargo from
trucks to the railways and pipeline is actualised

ENVIRONMENTAL RESOURCES MANAGEMENT JST/MOTI
8-21
Table 8.7 Summary of Cross Cutting Engagement Raised During the SEA
Main Issue Specific Concern
Road Furniture Speed bumps which are meant to reduce road accidents but end up reducing travelling
time and causing traffic congestion along the roads
Vandalism of road furniture and road signage along the highways
Absence of climbing lanes in certain deserving parts of the roads
Health and Safety Road safety awareness creation should be incorporated into the Master Plan
The SEA should consider issues along the corridor such as communicable diseases,
health, crime, social interests that will come about due to developments from the NEC
Alignment with other PPPs Whether PPPs developed by different government institutions in the country, would
conflict or contradict with NEC Master Plan.
Need for the harmonization of the Master Plan with existing other national and county
government PPP
Land Acquisition and
Resettlement
High cost of acquiring land for infrastructure development
Tendency for land speculation, especially when government plans to undertake major
infrastructural developments are known. This makes project costs unnecessarily high.
Whether the Plan would develop a Land Bank
Economic Issues The cost of transporting goods and people is generally high for ordinary Kenyans
Stakeholders were concerned that the development of transport logistics infrastructure
would increase the cost of doing business in Kenya.
An increase in the volume of internal cargo to be handled by the transport infrastructure
depends largely on how the economy performs (especially within the agricultural,
industrial and mining sectors). Stakeholders expressed reservations on how MoTI will
ensure that the Master Plan implementation is not frustrated by slow/no growth in these
vital sectors of the economy.
How the Master Plan would deal with the problem of insufficient cargo to sustain the
infrastructure in order to avoid the situation Kenya Railways, Kisumu International
Airport and Kisumu Port are currently experiencing.
The cost to Kenyans of implementing the Master Plan
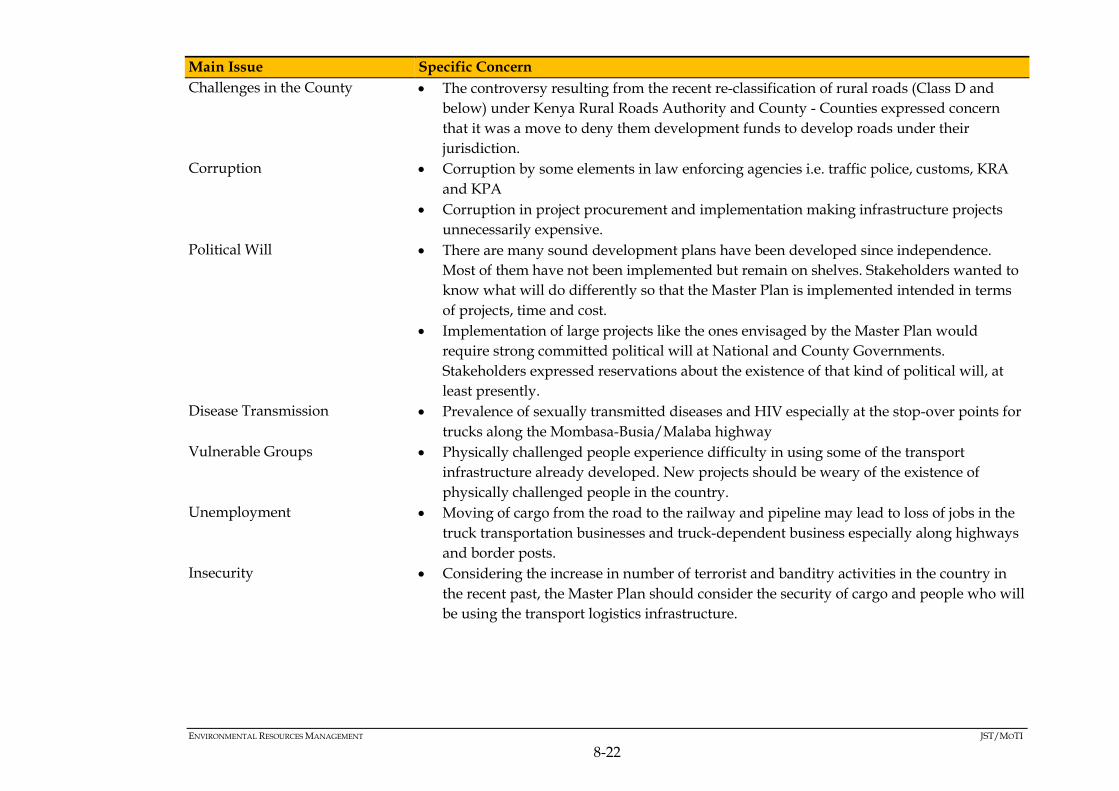
ENVIRONMENTAL RESOURCES MANAGEMENT JST/MOTI
8-22
Main Issue Specific Concern
Challenges in the County The controversy resulting from the recent re-classification of rural roads (Class D and
below) under Kenya Rural Roads Authority and County - Counties expressed concern
that it was a move to deny them development funds to develop roads under their
jurisdiction.
Corruption Corruption by some elements in law enforcing agencies i.e. traffic police, customs, KRA
and KPA
Corruption in project procurement and implementation making infrastructure projects
unnecessarily expensive.
Political Will There are many sound development plans have been developed since independence.
Most of them have not been implemented but remain on shelves. Stakeholders wanted to
know what will do differently so that the Master Plan is implemented intended in terms
of projects, time and cost.
Implementation of large projects like the ones envisaged by the Master Plan would
require strong committed political will at National and County Governments.
Stakeholders expressed reservations about the existence of that kind of political will, at
least presently.
Disease Transmission Prevalence of sexually transmitted diseases and HIV especially at the stop-over points for
trucks along the Mombasa-Busia/Malaba highway
Vulnerable Groups Physically challenged people experience difficulty in using some of the transport
infrastructure already developed. New projects should be weary of the existence of
physically challenged people in the country.
Unemployment Moving of cargo from the road to the railway and pipeline may lead to loss of jobs in the
truck transportation businesses and truck-dependent business especially along highways
and border posts.
Insecurity Considering the increase in number of terrorist and banditry activities in the country in
the recent past, the Master Plan should consider the security of cargo and people who will
be using the transport logistics infrastructure.

ENVIRONMENTAL RESOURCES MANAGEMENT JST/MOTI
8-23
Main Issue Specific Concern
Legal Framework It was observed that although Kenya Railways has the mandate for managing inland
water ways and ports, it does not have the capacity to do and to develop new ports. Many
previous piers on Lake Victoria are vandalized and the only existing Kisumu port is
underutilized. Since Kenya Ports Authority has the capacity and experience to manage
marine ports, the law should be amended to give it additional mandate of manage and
develop inland water ways and ports.
Feasibility Studies Stakeholders raised the concern of developing huge infrastructure projects without
undertaking comprehensive feasibility studies. If that had been done, Uganda would
have not chosen the southern against the northern route to develop a petroleum pipeline
from Hoima to sea or Rwanda preferring to develop a railway link with Tanzania
Railway rather than the Kenya-Uganda Standard Gauge Railway.
Litigation Development projects having a tendency of delaying implementation through long and
winding litigations. This does delays project implementation and increases the project
cost.
Gender That gender issues should be integrated into the Master Plan
ENVIRONMENTAL RESOURCES MANAGEMENT JST/MOTI
8-24
8.6 SEA VALIDATION
8.6.1 Submission of Draft SEA Report and Advertisements in the Media
The Draft Report was submitted to NEMA on 28th October 2016 (See
Annex A3 for the submission acknowledgement). Thereafter,
advertisements were placed in the media (see Annex E6 for copies of the
Daily Nation and the Kenya Gazette adverts) calling for the public to
submit their comments (see Annex E7 for the comments received on the
Draft NEC SEA Report from Stakeholders).
The Draft SEA Report was made available for inspection at the Ministry
of Environmental and Natural Resources and NEMA offices. The
Report was also made available for download at:
The NEMA website www.nema.go.ke (SEA/043), and
The MoTI website: http://www.transport.go.ke/Projects.html .
8.6.2 Validation Workshop
The validation workshop was thereafter held on Tuesday 24th January
2017, where the Draft Report was presented to Stakeholders (see Annex
E2 and Annex E3 for the minutes and photos of the validation meeting).
Table 8.8 provides a summary of the comments received on the Draft
SEA Report..
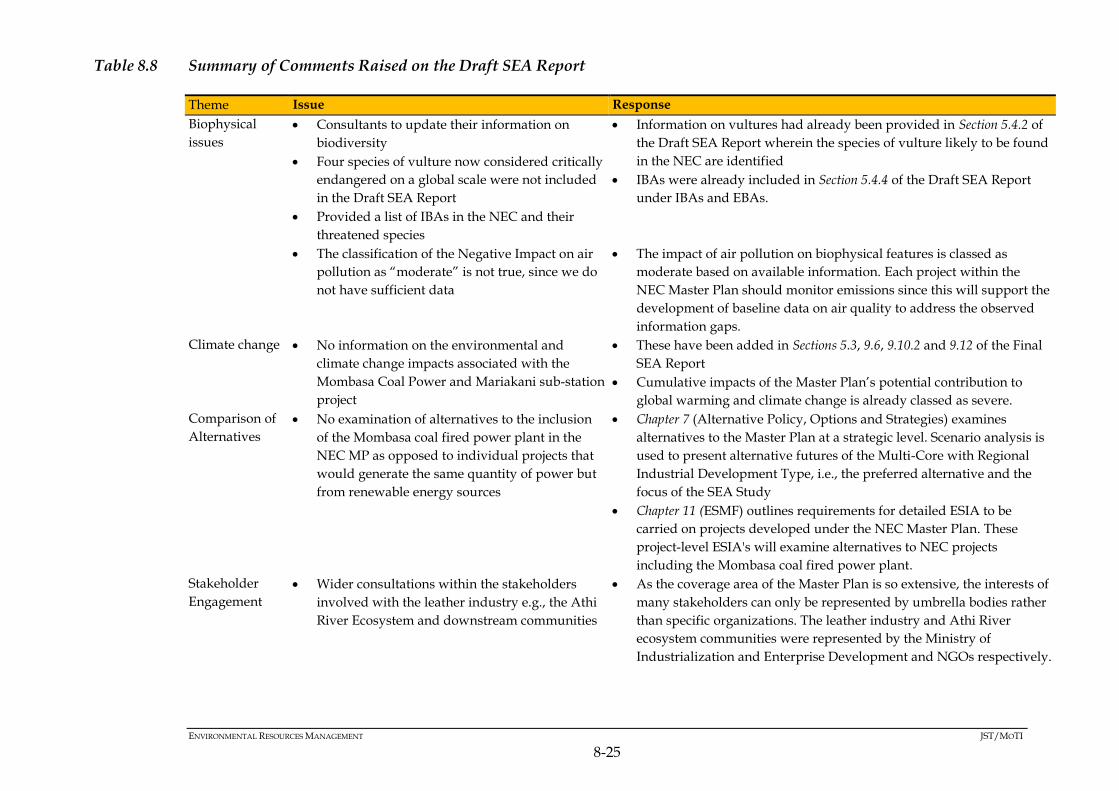
ENVIRONMENTAL RESOURCES MANAGEMENT JST/MOTI
8-25
Table 8.8 Summary of Comments Raised on the Draft SEA Report
Theme Issue Response
Biophysical
issues
Consultants to update their information on
biodiversity
Four species of vulture now considered critically
endangered on a global scale were not included
in the Draft SEA Report
Provided a list of IBAs in the NEC and their
threatened species
Information on vultures had already been provided in Section 5.4.2 of
the Draft SEA Report wherein the species of vulture likely to be found
in the NEC are identified
IBAs were already included in Section 5.4.4 of the Draft SEA Report
under IBAs and EBAs.
The classification of the Negative Impact on air
pollution as “moderate” is not true, since we do
not have sufficient data
The impact of air pollution on biophysical features is classed as
moderate based on available information. Each project within the
NEC Master Plan should monitor emissions since this will support the
development of baseline data on air quality to address the observed
information gaps.
Climate change No information on the environmental and
climate change impacts associated with the
Mombasa Coal Power and Mariakani sub-station
project
These have been added in Sections 5.3, 9.6, 9.10.2 and 9.12 of the Final
SEA Report
Cumulative impacts of the Master Plan’s potential contribution to
global warming and climate change is already classed as severe.
Comparison of
Alternatives
No examination of alternatives to the inclusion
of the Mombasa coal fired power plant in the
NEC MP as opposed to individual projects that
would generate the same quantity of power but
from renewable energy sources
Chapter 7 (Alternative Policy, Options and Strategies) examines
alternatives to the Master Plan at a strategic level. Scenario analysis is
used to present alternative futures of the Multi-Core with Regional
Industrial Development Type, i.e., the preferred alternative and the
focus of the SEA Study
Chapter 11 (ESMF) outlines requirements for detailed ESIA to be
carried on projects developed under the NEC Master Plan. These
project-level ESIA's will examine alternatives to NEC projects
including the Mombasa coal fired power plant.
Stakeholder
Engagement
Wider consultations within the stakeholders
involved with the leather industry e.g., the Athi
River Ecosystem and downstream communities
As the coverage area of the Master Plan is so extensive, the interests of
many stakeholders can only be represented by umbrella bodies rather
than specific organizations. The leather industry and Athi River
ecosystem communities were represented by the Ministry of
Industrialization and Enterprise Development and NGOs respectively.

ENVIRONMENTAL RESOURCES MANAGEMENT JST/MOTI
8-26
Theme Issue Response
The National Land Commission (NLC) should
be included as a key institution to implement the
SEA
NLC was identified as important stakeholder (see Annex E1,
Stakeholder Database) as well as an Institution involved in the
implementation of the ESMF (Chapter 11).
Was Kenya National Human Rights
Commission (KNHCR) mapped in considering
socio economic factors
KNHCR was identified as important stakeholder (see Annex E1,
Stakeholder Database) as well as an Institution involved in the
implementation of the ESMF (Chapter 11).
How are all the communities supposed to
benefit from the NEC MP?
The SEA engaged in high level consultations, which were meant to be
cascaded downwards. The process was a top-bottom engagement as
opposed to bottom –top engagement
Communities will benefit at the project-level
Contents of the
SEA Report
Concerned that this is not really a SEA but more
a ‘big’ EIA but done at such a general level that
the information used is very non-specific, and
none of the recommendations indicated are tied
to any of the specific elements of the Master Plan
While (the SEA) does recommend that each of
the 119 component projects has an EIA done for
it, it does not provide anything of a strategic
framework that links or limits these projects or
the EIAs related to them
Would have thought more strategic and
integrative issues would have been indicated,
such as the issue of the key alternatives for a
major controversial feature
These concerns have already been addressed in the Draft SEA Report
with are tied to any of the specific elements of the Master Plan
(Chapters 9, 10 and 11).
The ESMF (Chapter 11) provides a strategic framework that links or
limits these projects or the EIAs related to them
The SEA team will have a workshop with JST/MoTI on how the
ESMF will work going forward
Impact
Assessment and
Mitigation
For the soil protected areas, mitigation is given
as “Limiting excavation in necessary areas”
Define the term “Necessary
The term necessary is based on the engineering specifications of each
infrastructure project. This is because land/excavation requirements
and construction methods vary by project type and through
optimizations in the latter the former can be limited. Thus, it is the
principle of limiting excavation based on those engineering
specifications that is being suggested.
How are the unseen loses of the social cultural
loses captured in the SEA
This was addressed in Section 10.6.1 (Loss of Cultural Heritage) of the
Draft SEA Report
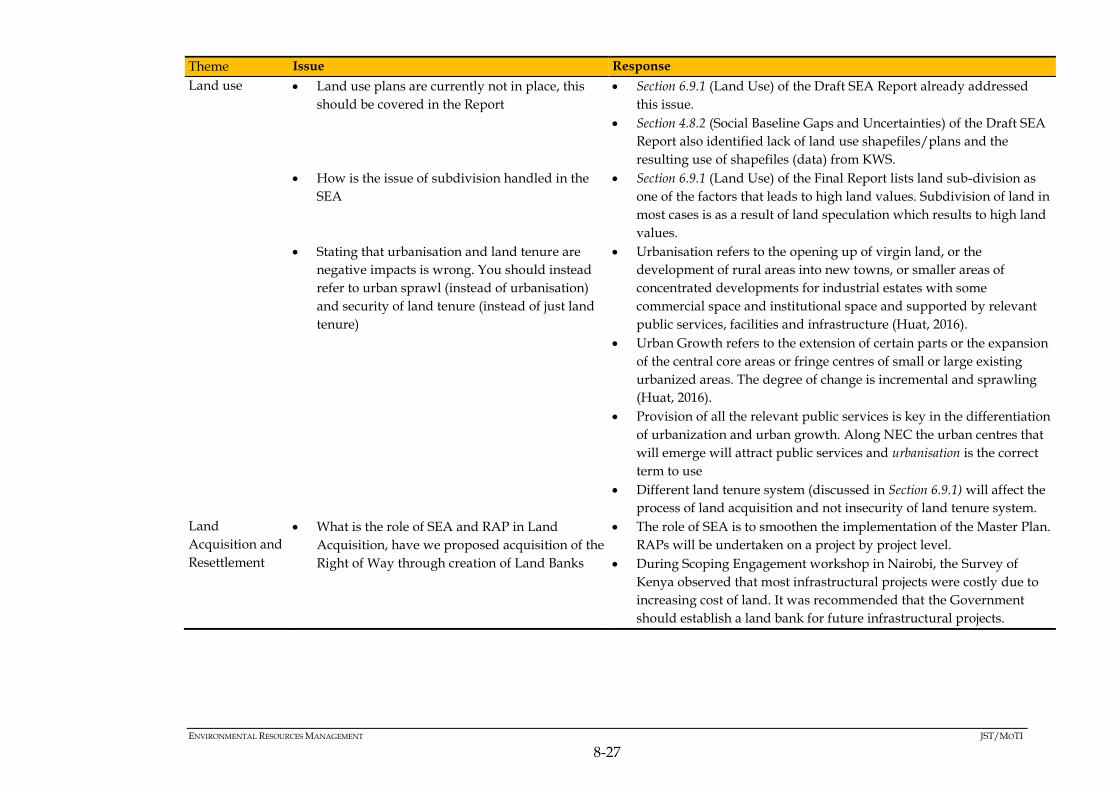
ENVIRONMENTAL RESOURCES MANAGEMENT JST/MOTI
8-27
Theme Issue Response
Land use Land use plans are currently not in place, this
should be covered in the Report
Section 6.9.1 (Land Use) of the Draft SEA Report already addressed
this issue.
Section 4.8.2 (Social Baseline Gaps and Uncertainties) of the Draft SEA
Report also identified lack of land use shapefiles/plans and the
resulting use of shapefiles (data) from KWS.
How is the issue of subdivision handled in the
SEA
Section 6.9.1 (Land Use) of the Final Report lists land sub-division as
one of the factors that leads to high land values. Subdivision of land in
most cases is as a result of land speculation which results to high land
values.
Stating that urbanisation and land tenure are
negative impacts is wrong. You should instead
refer to urban sprawl (instead of urbanisation)
and security of land tenure (instead of just land
tenure)
Urbanisation refers to the opening up of virgin land, or the
development of rural areas into new towns, or smaller areas of
concentrated developments for industrial estates with some
commercial space and institutional space and supported by relevant
public services, facilities and infrastructure (Huat, 2016).
Urban Growth refers to the extension of certain parts or the expansion
of the central core areas or fringe centres of small or large existing
urbanized areas. The degree of change is incremental and sprawling
(Huat, 2016).
Provision of all the relevant public services is key in the differentiation
of urbanization and urban growth. Along NEC the urban centres that
will emerge will attract public services and urbanisation is the correct
term to use
Different land tenure system (discussed in Section 6.9.1) will affect the
process of land acquisition and not insecurity of land tenure system.
Land
Acquisition and
Resettlement
What is the role of SEA and RAP in Land
Acquisition, have we proposed acquisition of the
Right of Way through creation of Land Banks
The role of SEA is to smoothen the implementation of the Master Plan.
RAPs will be undertaken on a project by project level.
During Scoping Engagement workshop in Nairobi, the Survey of
Kenya observed that most infrastructural projects were costly due to
increasing cost of land. It was recommended that the Government
should establish a land bank for future infrastructural projects.
ENVIRONMENTAL RESOURCES MANAGEMENT JST/MOTI
9-1
9 KEY ENVIRONMENTAL IMPACTS AND MITIGATION STRATEGIES
9.1 INTRODUCTION
In this Chapter the potential environmental impacts of the NEC Master
Plan are predicted and assessed, and mitigation strategies are proposed.
This prediction and assessment is focused on the Multi-Core with
Regional Industrial Development Type Master Plan Alternative. Insights
and feedback received from stakeholders during the preparation of this
Study also inform this impact assessment process.
This chapter addresses two items, namely:
Environmental Impacts, and
Cumulative Environmental Impacts.
9.2 NEC MASTER PLAN
As discussed in Chapter 2 of this Report, the development vision for the
NEC is to be the leading economic corridor with integrated transport
and logistics systems in Africa. The Master Plan therefore aims at
balanced growth and efficient logistics in the NEC region by promoting
urban functions of 18 Secondary Cites, including 6 Secondary cum
Regional Production Centres (see Figure 9.1 and Table 9.1 below), which
also cascade into specific sectoral infrastructure projects (Table 9.2).

ENVIRONMENTAL RESOURCES MANAGEMENT JST/MOTI
9-2
Figure 9.1 The NEC Master Plan
Source: JICA, 2016
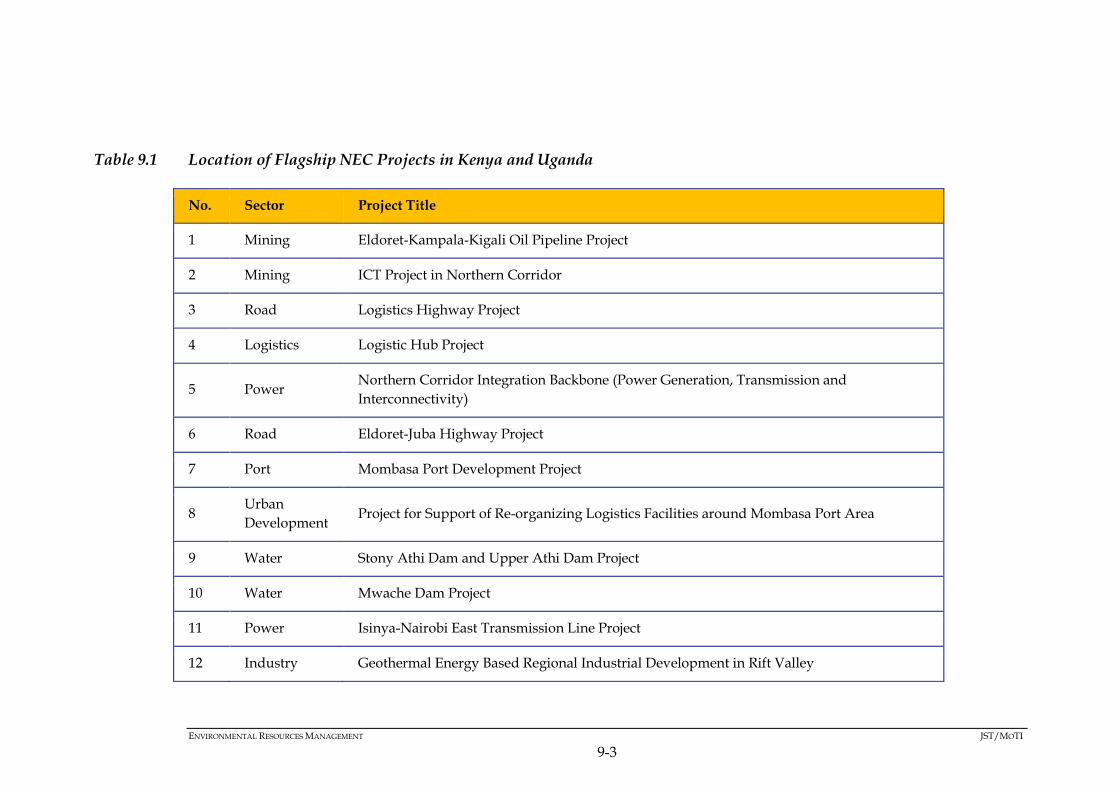
ENVIRONMENTAL RESOURCES MANAGEMENT JST/MOTI
9-3
Table 9.1 Location of Flagship NEC Projects in Kenya and Uganda
No. Sector Project Title
1 Mining Eldoret-Kampala-Kigali Oil Pipeline Project
2 Mining ICT Project in Northern Corridor
3 Road Logistics Highway Project
4 Logistics Logistic Hub Project
5 Power Northern Corridor Integration Backbone (Power Generation, Transmission and
Interconnectivity)
6 Road Eldoret-Juba Highway Project
7 Port Mombasa Port Development Project
8 Urban
Development Project for Support of Re-organizing Logistics Facilities around Mombasa Port Area
9 Water Stony Athi Dam and Upper Athi Dam Project
10 Water Mwache Dam Project
11 Power Isinya-Nairobi East Transmission Line Project
12 Industry Geothermal Energy Based Regional Industrial Development in Rift Valley

ENVIRONMENTAL RESOURCES MANAGEMENT JST/MOTI
9-4
13 Power Geothermal Project in Rift Valley
14 Power Mombasa Coal Power and Mariakani Substation Project
15 Power Dongo Kundu-Mariakani Transmission Project
16 Industry Mombasa Special Economic Zone Project
17 Industry Project for Building Up Competitiveness of Construction Materials and Machinery Industry
in Kenya
18 Agriculture Agricultural Financing Improvement Project in Nairobi
19 Agriculture Value Chain of Agriculture Development Pilot Project in Kenya
20 Urban
Development Logistics Based Kisumu-Kakamega Metropolitan Area Development Project
21 Mining Study on Mining Master Plan in Uganda
22 Industry Project for Building Up Competitiveness of Construction Materials and Machinery Industry
in Uganda
23 Agriculture Value Chain of Agriculture Development Pilot Project in Uganda
24 Power Kampala-North-Namungona-Mutundwe 132 kV Transmission Line Refurbishment
25 Urban
Development Great Kampala (including Jinja) Logistic Based Urban Development Project
26 Urban
Development Study on master Plan for Urban Transport Development for Regional cities
27 Industry SEZ Development Project in Kampala
Source: JST, 2016

ENVIRONMENTAL RESOURCES MANAGEMENT JST/MOTI
9-5
Table 9.2 NEC MP Sectoral Distribution of Infrastructure Projects
Sector Number of Projects
Road 12
Railway 10
Border Post 7
Marine Port 5
Airport 1
Inland Waterway/Port 1
Logistics Hub 3
Oil and Mining 3
Agriculture and Fishery 9
Manufacture 3
Power 3
Water 9
Source: JST, 2016
The NEC Master Plan will ultimately result in the development of a
multitude of projects. The potential impacts of these projects are
predicted and assessed at a strategic level on the receptive baseline and
its constraints discussed in Chapter 5 (Environmental Baseline) and
Chapter 6 (Socio-Economic Baseline).
9.3 IMPACT PREDICTION
The impact prediction process entails grouping issues associated with
the different sectoral projects being developed. These issues are
identified through an iterative process. In order to achieve this,
prediction matrices have been used. This process is also informed by:
Good International Industry Practice Guidelines (GIIPs),
research,
environmental and social risks of similar projects and plans, and
Stakeholder engagement.
9.4 SUMMARY OF ENVIRONMENTAL IMPACTS
Table 9.3 below provides a summary of the environmental impacts that may occur as a result of the Master Plan.

ENVIRONMENTAL RESOURCES MANAGEMENT JST/MOTI
9-6
Table 9.3 Environmental Impact Identification Matrix
Sector
Impacts and Risks1
Habitat
Alteration
(Biodiversit
y Impacts)
Air
Emission
s
Landscape
Modification
s
Soil
Alteratio
n
Hydrological
Modification
s
Pollution Risk Natural
Resource
s
Demand
H&S
Risk
s
Solid
Wast
e
Liqui
d
Waste
Hazardou
s
Materials
Road X X X X X X X X X X
Railway X X X X X X X X X X
Border Post X X X X X X X X X X
Port X X X X X X X X X
Airport X X X X X X X X X X
Inland
Waterway/Por
t
X X X X X X X X X
Logistic Hub X X X X X X X X X X
Oil and Mining X X X X X X X X X X
Agriculture
and Fisheries
X X X X X X X X X X
Manufacture X X X X X X X X X
Power X X X X X X X X X
Water X X X X X X X X X
1 ‘X’ denotes impact.

ENVIRONMENTAL RESOURCES MANAGEMENT JST/MOTI
9-7
9.5 HABITAT ALTERATION AND BIODIVERSITY IMPACTS
9.5.1 Summary of Applicable Constraints
Applicable constraints to Habitat Alteration and Biodiversity impacts
include:
• Protected Areas,
• Internationally Designated Areas,
• Wetlands,
• Rivers and lakes, and
• Sensitive ecosystems (Water Towers, Forests, Corals, Sandy
beaches, Mangrove forests, and Sea Turtle Nesting Beaches).
Protected areas are particularly susceptible to impacts of habitat
alteration and on biodiversity. Their location in the NEC is shown by
the map below.
Figure 9.2 Protected Areas in the NEC
9.5.2 Impact on Habitats
The implementation of physical infrastructure within the NEC will
involve:
Conversion of land uses via the establishment, rehabilitation and
expansion of rights of way (RoW) and
Development of projects on Greenfield sites.
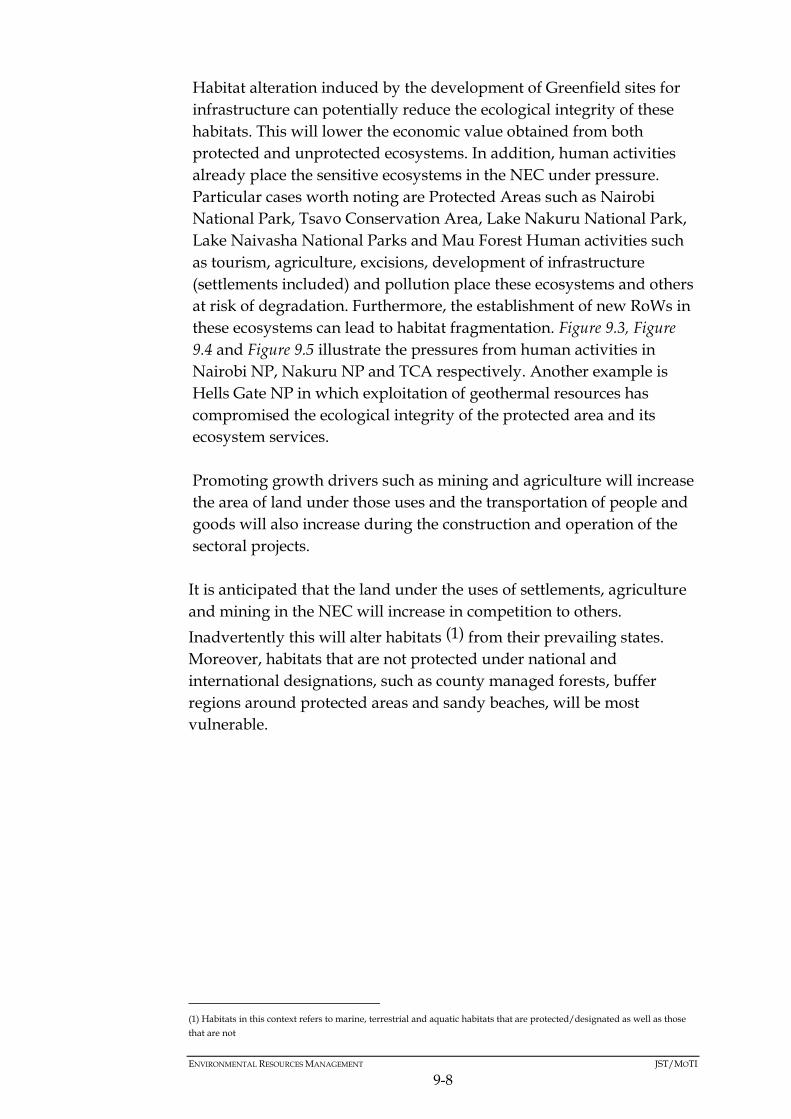
ENVIRONMENTAL RESOURCES MANAGEMENT JST/MOTI
9-8
Habitat alteration induced by the development of Greenfield sites for
infrastructure can potentially reduce the ecological integrity of these
habitats. This will lower the economic value obtained from both
protected and unprotected ecosystems. In addition, human activities
already place the sensitive ecosystems in the NEC under pressure.
Particular cases worth noting are Protected Areas such as Nairobi
National Park, Tsavo Conservation Area, Lake Nakuru National Park,
Lake Naivasha National Parks and Mau Forest Human activities such
as tourism, agriculture, excisions, development of infrastructure
(settlements included) and pollution place these ecosystems and others
at risk of degradation. Furthermore, the establishment of new RoWs in
these ecosystems can lead to habitat fragmentation. Figure 9.3, Figure
9.4 and Figure 9.5 illustrate the pressures from human activities in
Nairobi NP, Nakuru NP and TCA respectively. Another example is
Hells Gate NP in which exploitation of geothermal resources has
compromised the ecological integrity of the protected area and its
ecosystem services.
Promoting growth drivers such as mining and agriculture will increase
the area of land under those uses and the transportation of people and
goods will also increase during the construction and operation of the
sectoral projects.
It is anticipated that the land under the uses of settlements, agriculture
and mining in the NEC will increase in competition to others.
Inadvertently this will alter habitats (1) from their prevailing states.
Moreover, habitats that are not protected under national and
international designations, such as county managed forests, buffer
regions around protected areas and sandy beaches, will be most
vulnerable.
(1) Habitats in this context refers to marine, terrestrial and aquatic habitats that are protected/designated as well as those
that are not
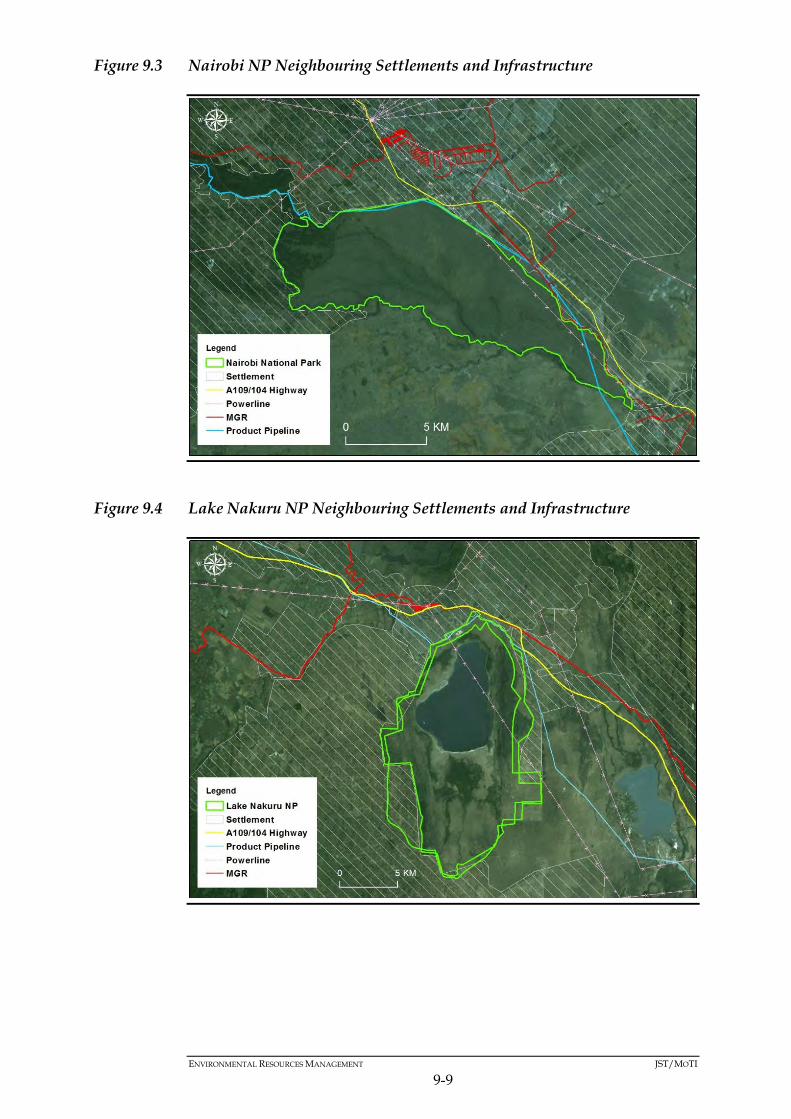
ENVIRONMENTAL RESOURCES MANAGEMENT JST/MOTI
9-9
Figure 9.3 Nairobi NP Neighbouring Settlements and Infrastructure
Figure 9.4 Lake Nakuru NP Neighbouring Settlements and Infrastructure
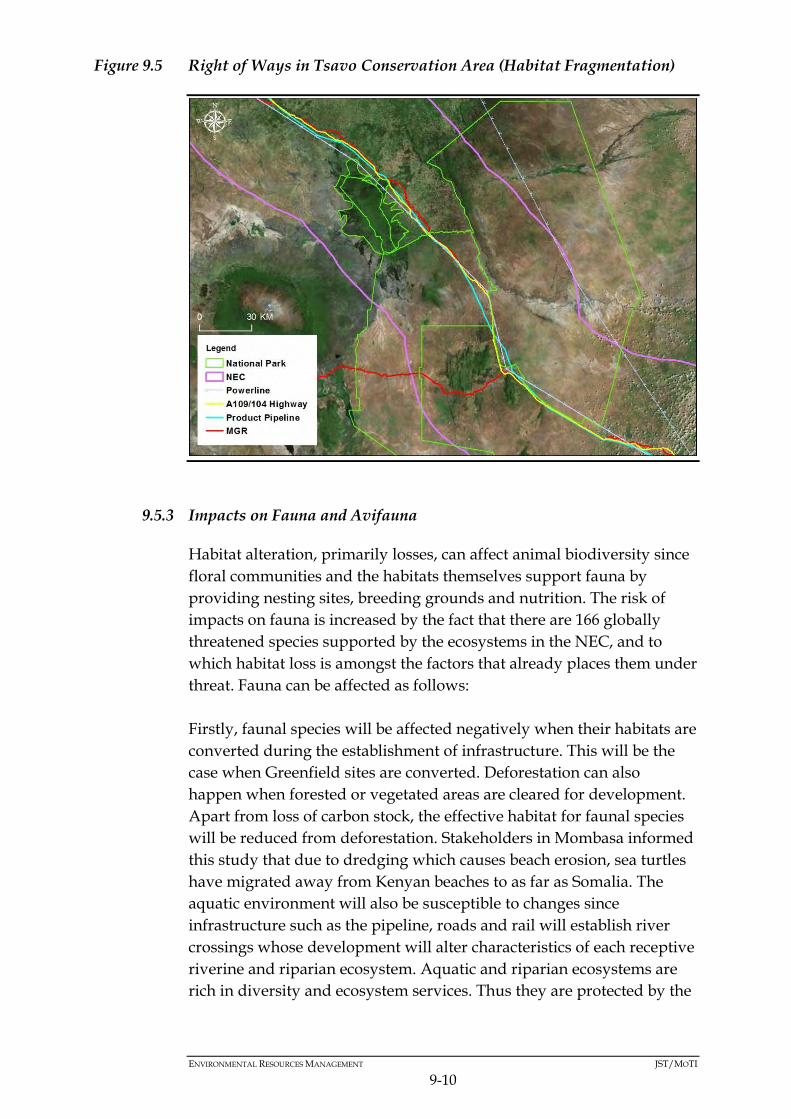
ENVIRONMENTAL RESOURCES MANAGEMENT JST/MOTI
9-10
Figure 9.5 Right of Ways in Tsavo Conservation Area (Habitat Fragmentation)
9.5.3 Impacts on Fauna and Avifauna
Habitat alteration, primarily losses, can affect animal biodiversity since
floral communities and the habitats themselves support fauna by
providing nesting sites, breeding grounds and nutrition. The risk of
impacts on fauna is increased by the fact that there are 166 globally
threatened species supported by the ecosystems in the NEC, and to
which habitat loss is amongst the factors that already places them under
threat. Fauna can be affected as follows:
Firstly, faunal species will be affected negatively when their habitats are
converted during the establishment of infrastructure. This will be the
case when Greenfield sites are converted. Deforestation can also
happen when forested or vegetated areas are cleared for development.
Apart from loss of carbon stock, the effective habitat for faunal species
will be reduced from deforestation. Stakeholders in Mombasa informed
this study that due to dredging which causes beach erosion, sea turtles
have migrated away from Kenyan beaches to as far as Somalia. The
aquatic environment will also be susceptible to changes since
infrastructure such as the pipeline, roads and rail will establish river
crossings whose development will alter characteristics of each receptive
riverine and riparian ecosystem. Aquatic and riparian ecosystems are
rich in diversity and ecosystem services. Thus they are protected by the
ENVIRONMENTAL RESOURCES MANAGEMENT JST/MOTI
9-11
Water Act, WCMA and EMCA. It is for this reason that this SEA study
has classified them as constraints.
Secondly, the increase in transportation (rail, road, water and air) can
disrupt migration and breeding of faunal species (behaviour). This
increase in movement can lead to mortality when collisions with
animals occur. Additionally, transmission lines can also lead to
avifauna fatalities through electrocution. In totality, these accidents and
establishment of infrastructure components in proximity or within the
natural habitats (species ranges) of wild fauna can increase human-
wildlife conflict. Introduced noise generated by vehicles, crafts,
machinery, equipment and civil processes can also become a
disturbance to fauna and affect their behaviour (1).
9.5.4 Summary of Impact on Habitats, Fauna and Avifauna
The impact of the NEC MP on habitats and biodiversity is amongst the
concerns of stakeholders. Kenya’s economy greatly depends on natural
resources (tourism, agriculture and mining amongst others) which in
some cases are not managed sustainably. Thus, without adequate
management plans the NEC MP has the potential of increasing the
pressures and threats on the sensitive ecosystems and biodiversity in
the NEC. These potential impacts will be against the conservation
strategies and objectives proposed by Vision 2030, EMCA, WCMA,
KWS’s species conservation strategies and ecosystem management
plans.
9.5.5 Transboundary Resources, Activities and Invasive Species
The entire NEC is a transboundary area which intersects several
resources of a similar nature such as: Tsavo-Mkomazi ecosystem, Mt
Elgon ecosystem, Sio-Siteko wetland, the Indian Ocean, Lake Victoria
catchment and the Indian Ocean. Impacts on biodiversity and habitats
have a transboundary context wherein the linked resources are
managed under different regimes in the countries involved. Particular
transboundary resources of concern are identified as constraints in
Chapter 5 of this Report.
As the implementation of the NEC Master Plan increases trade in East
Africa, and therein movement of goods and people across borders, this
creates a risk of more invasive species being imported into, or exported
from Kenya intentionally or unintentionally. Apart from self-
proliferation, some commonly known modes through which invasive
(1) Radle A., (2007). The Effect of Noise on Wildlife: A Literature Review.
ENVIRONMENTAL RESOURCES MANAGEMENT JST/MOTI
9-12
species can enter the country via the NEC MP include the transport of
bulk agricultural produce and other goods; vehicles, crafts and vessels;
and ballast water.
Cumulatively, with the impacts of other projects and without proper
natural resource management, the potential direct negative impacts of
the NEC MP have the potential of contributing to land and habitat
degradation and climate change. These two cumulative impacts are
known to have the potential of leading to the proliferation of invasive
species. This is since they can create harsh conditions only which
invasive species can thrive in, since they are usually more resilient than
indigenous species. This study finds that there are already 61 invasive
species in Kenya which have negative economic effects and thus
proliferation preceptors already exist. Invasive species are amongst the
concerns raised by stakeholders from the consultation process.
9.5.6 Mitigation Strategies
The following mitigation strategies can be implemented against the
potential risks on habitats and biodiversity:
• Avoiding PAs,
• Aligning new infrastructure with existing RoWs or defined
corridors,
• Limiting the size of construction RoWs where possible, and
• Complying with existing land use and PA management plans
and supporting their development and implementation where
none have been gazetted.
9.6 AIR EMISSIONS
9.6.1 Summary of Applicable Constraints
Applicable constraints to air emissions include:
• Protected Areas
• Internationally Designated Areas,
• Sensitive ecosystems,
• Biodiversity (flora and fauna),
• Rivers, lakes and wetlands,
• Agricultural areas,
• Settlements, and
• Existing infrastructure.
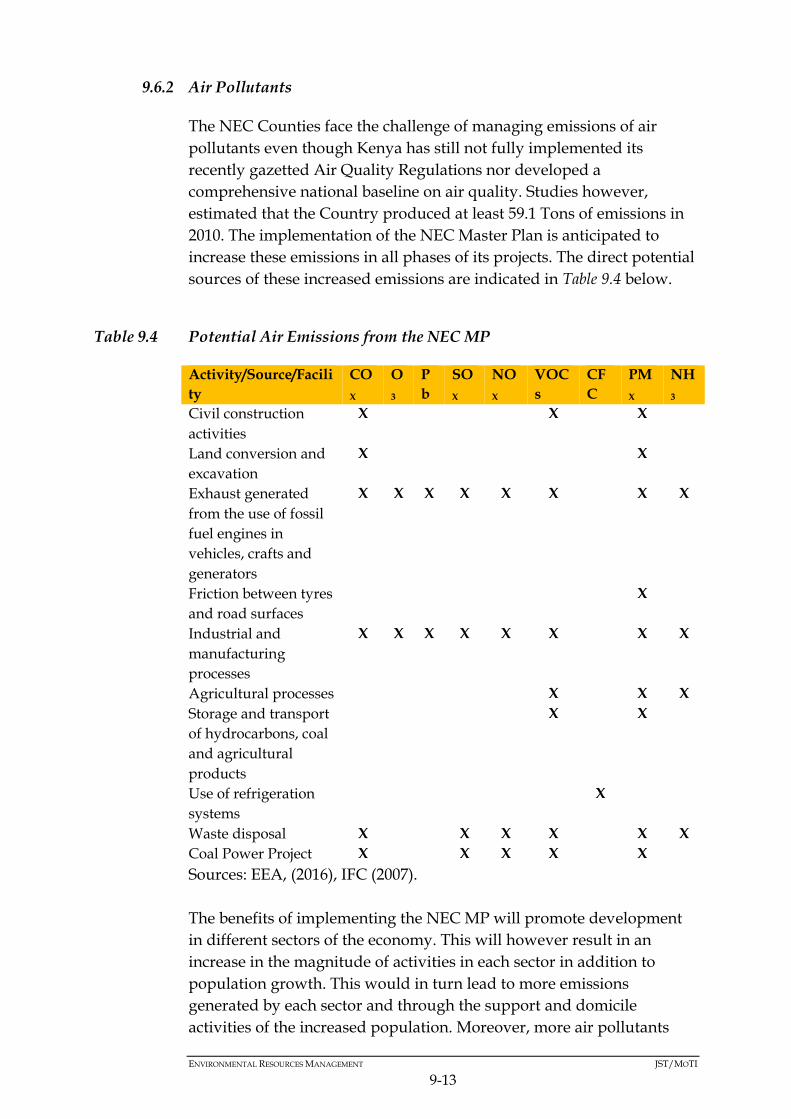
ENVIRONMENTAL RESOURCES MANAGEMENT JST/MOTI
9-13
9.6.2 Air Pollutants
The NEC Counties face the challenge of managing emissions of air
pollutants even though Kenya has still not fully implemented its
recently gazetted Air Quality Regulations nor developed a
comprehensive national baseline on air quality. Studies however,
estimated that the Country produced at least 59.1 Tons of emissions in
2010. The implementation of the NEC Master Plan is anticipated to
increase these emissions in all phases of its projects. The direct potential
sources of these increased emissions are indicated in Table 9.4 below.
Table 9.4 Potential Air Emissions from the NEC MP
Activity/Source/Facili
ty
CO
X
O
3
P
b
SO
X
NO
X
VOC
s
CF
C
PM
X
NH
3
Civil construction
activities
X X X
Land conversion and
excavation
X X
Exhaust generated
from the use of fossil
fuel engines in
vehicles, crafts and
generators
X X X X X X X X
Friction between tyres
and road surfaces
X
Industrial and
manufacturing
processes
X X X X X X X X
Agricultural processes X X X
Storage and transport
of hydrocarbons, coal
and agricultural
products
X X
Use of refrigeration
systems
X
Waste disposal X X X X X X
Coal Power Project X X X X X
Sources: EEA, (2016), IFC (2007).
The benefits of implementing the NEC MP will promote development
in different sectors of the economy. This will however result in an
increase in the magnitude of activities in each sector in addition to
population growth. This would in turn lead to more emissions
generated by each sector and through the support and domicile
activities of the increased population. Moreover, more air pollutants
ENVIRONMENTAL RESOURCES MANAGEMENT JST/MOTI
9-14
will be emitted since this population will require energy, of which in
Kenya 68% is sourced from biomass and 21% from petroleum (1).
Exacerbation of microclimate modifications such as urban heat islands
and lowering of air quality can then occur particularly in the economic
centres and industrial zones.
Air pollutants have different impacts on humans and the environment
depending on their concentrations and exposure. Each pollutant has its
own lethal dose and dose response limits. On humans, low doses albeit
pollutant dependent, exposure to air pollutants can cause irritation of
the eyes, nose, and throat, and wheezing, coughing, chest tightness, and
breathing difficulties. Moderate effects include worsening of existing
lung and heart problems, such as asthma, and increased risk of heart
attack. Long-term exposure and high doses can cause cancer and
damage to the immune, neurological, reproductive, respiratory systems
and death (2).
This SEA Study predicts that without adequate mitigation, at the
project level and cumulatively, there is potential of air pollutants such
as O3, NO2, PMX and SO2 being released beyond WHO’s guidelines (3).
National studies have pointed out that industrial and urban centres
generally have poorer air quality against the WHO guidelines as
compared to rural and some background areas. Air pollution is
attributed to be a contributing factor to the prevalence of respiratory
infections and complications in Kenya as a cause of morbidity and
mortality.
Environmentally, the transport and disposition of air pollutants can
have the following effects:
Acid Rain: This is caused by the chemical reactions of NOX and
SOX with water during precipitation or in the atmosphere. It
either falls as wet or dry precipitation with a pH of about 4.3. It
damages flora, and acidifies soils and water bodies in turn
affecting fauna. Acid rain also corrodes infrastructure shortening
their lifespan or increasing maintenance costs. This is evident in
Webuye in the NEC whereas acid rain can also damage cultural
heritage sites (4),
(1) Institute of Economic Affairs, (2015). Situational Analysis of Energy Industry, Policy and Strategy for Kenya (2) Department of Environmental Protection, (n.d). Health and Environmental Effects of Air Pollution (3) WHO, (2005). WHO Air quality guidelines for particulate matter, ozone, nitrogen dioxide and sulfur dioxide. Global
update 2005. (4) EPA, (2016). Effects of Acid Rain

ENVIRONMENTAL RESOURCES MANAGEMENT JST/MOTI
9-15
Haze and Smog: Haze is formed when small particles in the air
(PMX and smoke) are exposed to sunlight. It can also be caused
when NOX and SOX form particles that are transported by wind.
Smog is a yellowish fog consisting of fine particles and ozone.
These fine particles are often produced from the chemical
reactions that produce SO2 and NOX. Ozone in the lower
atmosphere is typically a product of the reaction of NOX and
VOCs. Smog and haze are observable indicators of poor air
quality or presence of pollutants. In addition to lowering
visibility, the ozone in smog is linked to health effects ranging
from minor aches to deadly pulmonary diseases (1). They mostly
occur in urban areas such as Nairobi, Nakuru and Mombasa due
to the higher concentrations of industries and motor vehicles (2),
Eutrophication: Whilst this naturally occurs with the aging of
lakes and estuaries, NOX emissions can accelerate the rate at
which it occurs. This is because they increase the effective
amount of nutrients in the water bodies including oceans.
Eutrophication stimulates blooms of algae which can kill fish
and lead to losses of aquatic biodiversity, (3)
Impacts on Fauna and Flora: Air pollutants are similarly as toxic
to fauna when exposed as they are to humans, when the
pollutants are deposited on land, flora or water. Studies have
shown that air pollution can cause death, debilitating industrial-
related injury and disease, stress related physiological changes
and population declines (4). Persistent pollutants in the aquatic
environment can bio-accumulate up the food chain. On flora,
pollutants such as ozone affect membrane function, leading to
reduction in photosynthesis, slower growth, and in severe cases
death (5). Acid rain can also damage flora through corrosion as
mentioned above. Effects on flora would not only directly affect
fauna but also livelihoods through agriculture and forestry.
Ozone depletion: This is caused by CFCs and halons which,
among others, are generally known as ozone depleting
(1) EPA, (1999). Smog—Who Does It Hurt? (2) Gouvernement du Québec, (2007). Formation and Origin of Smog. Info-Smog (3) Huijbregts M., (1999). Life Cycle Impact Assessment of Acidifying and Eutrophying Air Pollutants, Barret K. and Eerens
H., (2008). Air Pollution and the Eutrophication and Acidification of European Seas. Discussion Paper. ETC/ACC Technical
Paper 2008/17 (4) Newman, J., (1980). Effects of Air Emissions on Wildlife Resources. US Fish and Wildlife Service, Biological Services
Program, National Power Plant Team: FWSJOBS-80/40.1. (5) Lovett M. et al., (2009). Effects of Air Pollution on Ecosystems and Biological Diversity in the
Eastern United States. The Year in Ecology and Conservation Biology, 2009: Ann. N.Y. Acad. Sci. 1162: 99–135 (2009).
ENVIRONMENTAL RESOURCES MANAGEMENT JST/MOTI
9-16
substances. The depletion of ozone results in more UV radiation
reaching the earth’s surface. This in turn can increase skin
cancers, cause cataracts and lower human immunity to diseases.
9.6.3 Greenhouse Gases
Amongst the potential emissions anticipated from the implementation
of the NEC Master Plan are greenhouse gases (GHG), specifically CO2,
N2O, CH4 and Fluorinated Hydrocarbons (HFs). GHG will be primarily
emitted from:
land conversion processes,
wastes,
combustion of fossil fuels, and
bio-agricultural processes.
Land conversion and increase of industrial activity in water bodies can
reduce the effective carbon sinks in the NEC. This will be a negative
reinforcement which can compromise commitments on reducing
Kenya’s emissions proposed by, and agreed in the National Climate
Change Response Strategy (NCCRS), United Nations Framework
Convention on Climate Change (UNFCCC) and Conference of the
Parties (COP) 21 (2015); and enshrined in Article 42 of the Kenyan
Constitution. The anticipated population growth associated with the
NEC Master Plan will also contribute to this. This is because this
population will require more land, materials, energy and services,
which are currently mostly not provided through low carbon modes.
According to Kenya’s 2nd National Communication to the UNFCCC, the
Country’s total emissions in 2000 were 55 MTCO2eq. These were shared
amongst economic sectors as follows:
energy (17.8%),
industries (1.5%),
agriculture (41.0%),
land use,
land use change and forestry (37.6%), and
waste (2.2%)1.
This SEA Study anticipates that, even though Kenya is a low emitter of
GHGs, total emissions will increase on implementation of the NEC
Master Plan. In a ‘business as usual (BAU)’ scenario and without
adequate mitigation, this increase of emissions will drive the Country
closer towards its projected emissions of 143 MTCO2eq by 2030. This 1 NEMA, (2015). Kenya Second National Communication to the United Nations Framework Convention on Climate Change.

ENVIRONMENTAL RESOURCES MANAGEMENT JST/MOTI
9-17
will be in conjunction with other projects and activities that are outside
the scope of the NEC MP but can compromise the realization of the
country’s commitments on emission reduction. These commitments
were set in 2015 to capping CO2 emissions by 100 MTCO2eq per year by
2030 to the baseline emission level in 2010 of 73 MTCO2eq (1).
9.6.4 Mitigation Strategies
Mitigation strategies that can be employed to manage the risks of air
emissions include:
• Selecting clean energy options,
• Promoting the use of clean energy sources,
• Complying with the Air Quality Regulations (2014) and emission
standards as provided in KS 1515,
• Implementing energy efficiency measures across the different
projects,
• Using Combined Heat and Power systems for the coal power
plant and high energy conversion technology in line with
industry standards and guidelines2,
• Supporting the implementation of the National Climate Change
Action Plan and integrating its recommendations in the NEC
MP,
• Using cleaner energy sources and promoting their use,
• Limiting land conversion to only necessary areas (3) , and
• Managing wastes according to regulations in addition to
employing the 3Rs to ensure they are managed sustainably.
9.7 LANDSCAPE MODIFICATIONS
9.7.1 Summary of Applicable Constraints
The following are the constraints which will be susceptible to landscape
modifications:
• Nationally Protected Areas,
• Internationally Designated Areas,
• Settlements,
• Recreational areas, and
• Cultural heritage sites. (1) Ministry of Environment and Natural Resources, (2015). Kenya’s Intended Nationally Determined
Contribution (INDC). 2 Such standards and guidelines include the IFC EHS Guidelines for the Thermal Power Plants (2007). (3) The term ‘necessary’ is based on the engineering specifications of each infrastructure project. Each type
of infrastructure project has unique land/excavation requirements and construction methods. Through
optimization of the construction methods the land/excavation requirements can be limited to minimize this
potential impact.

ENVIRONMENTAL RESOURCES MANAGEMENT JST/MOTI
9-18
9.7.2 Landscape Modification
Greenfield projects of the NEC Master Plan will cause direct
modifications of terrestrial landscapes. As discussed in Section 9.5, these
projects will involve the development of new facilities and settlements,
establishment of RoWs and land conversion.
There will also be changes in brownfield sites, for example the
expansion and development of new facilities such as: Dualling of the
Mariakani-Mombasa Road; Nairobi-Nakuru Logistics Highway Project;
Mariakani-Voi Logistics Highway Project; Standard Gauge Railway and
OSBPs amongst others, as well as to the maritime environment
including: container berths No.20, 21, 22 (Reitz), No.4 (Lighter Area)
and Bulk Cargo (Mbaraki) and Container berth No.19 all at Mombasa,
and Rehabilitation of 3 to 6 ports at Lake Victoria.
These changes in landscape (visual impacts) will also entail changes in
activities (character) presently carried out in the target areas of these
projects. This includes generation of noise. Such changes include
expansion or intensification of agriculture, generation of wastes during
construction, increased transportation through vehicles, vessels and
crafts ferrying people, materials and equipment, as well as general
increases in human activities. Apart from the direct infrastructure
projects, the secondary cities are amongst the primary areas where this
impact is anticipated.
Landscape modifications are also expected in areas where construction
materials will be sourced, such as quarries and forests. Combined with
changes at project target areas, these modifications and activities will
distinctively alter the social character of the affected areas.
Landscape modifications have varying interconnected social and
environmental effects which are not always benign. Potential impacts
on ecosystems are covered in Section 9.5.
Lastly, changes in landscape can lead to loss of serene ecosystems or the
serenity of ecosystems. Such ecosystems are those identified to be
Category A constraints by this study (See Figure 9.2). A reduction in the
option and or existence value of such ecosystems would then result.
Industries such as tourism and recreation activities can be
compromised by these changes since they hedge on natural
environments as attractions. Some of these attractions in the NEC
include amongst others: Kakamega Forest Reserve (FR) which is
Kenya’s only tropical rainforest; Mt Elgon ecosystem which is

ENVIRONMENTAL RESOURCES MANAGEMENT JST/MOTI
9-19
transboundary, a UNESCO Man and Biosphere Reserve and an Alliance
for Zero Extinction site; Nairobi National Park (NP) which is an IBA
and Kenya’s most visited NP; and the Great Rift Valley Lakes which
feature Ramsar Site, IBAs and World Heritage Sites (WHS).
9.7.3 Mitigation Strategies
Mitigation strategies that can lower the magnitude or avoid this impact
include:
• Locating infrastructure with existing land use plans,
• Complying with ecosystem management plans of protected
areas,
• Implementing noise control and minimization measures for each
project,
• Implementing noise control and minimization measures for each
project,
• Limiting the size of construction RoWs, and
• Avoiding protected areas and settlements.
9.8 IMPACTS ON SOILS
9.8.1 Summary of Applicable Constraints
The constraints which are vulnerable to impacts on soils include:
• Settlements,
• Protected Areas,
• Internationally Designated Areas,
• River, lakes and wetlands,
• Agricultural areas, and
• Areas with a high Soil Erosion Potential (SEP).
There are two methods through which the implementation of the NEC
Master Plan can alter soil characteristics, as presented in the Sections
below:
9.8.2 Soil Erosion
Soil erosion has a high potential of occurring in the 42% of the land
mass comprising the NEC which has a high Soil Erosion Potential
(SEP). Developing infrastructure, increasing crop agriculture or mining
activities has the potential to result in soil erosion, as follows:
Land clearing and excavation for the development of physical
infrastructure such as roads, railways, dams and buildings. This
ENVIRONMENTAL RESOURCES MANAGEMENT JST/MOTI
9-20
construction will also involve increased movement of vehicles
and people resulting in the loss of topsoil;
Increasing crop agriculture will involve disturbances to topsoil
layers during tilling, planting and harvesting leading to erosion
and loss of soil carbon. The use of irrigation to promote
agricultural production without adequate soil conservation
measures can also result in erosion;
Sourcing of construction materials through extractive and
destructive means can result in increased SEP in the source areas.
This commonly occurs in Kenya due to the demand for building
materials and the Master Plan projects are anticipated to increase
this demand; and
Land conversion for Greenfield projects will increase the total
area in the NEC under infrastructure and settlements. This will
result in increased run-off from those areas since less water will
be able to percolate underground. The excess run-off will in turn
erode more soil.
9.8.3 Altering Soil Physical, Chemical and Biological Characteristics
This can occur due to the following:
Contamination by solid and liquid wastes;
Acid rain from air pollution;
Civil processes such as compaction;
Extraction of groundwater; and
Use of fertilizer and inundation by water (dams and irrigation).
Amongst the potential effects of altering soil and land characteristics
will be increasing the SEP of affected areas. Primarily, this will be by
the removal of vegetation and increasing susceptibility by the creation
of pilings during construction as well as increased run-off. Increased
erosion can also affect other infrastructure systems such as drains in
urban areas which can become clogged with the eroded/transported
material. Sedimentation and turbidity can also be increased with this
material when transported into water bodies.

ENVIRONMENTAL RESOURCES MANAGEMENT JST/MOTI
9-21
Soil alteration can lead to loss of soil nutrients. These nutrients can be
lost through eroded topsoil thereby reducing the eventual land
potential for agriculture, which is Kenya’s main economic activity, and
lowering the ecological productivity of affected ecosystems.
Furthermore, inundation and deposition of pollutants can contribute to
nutrient loss via replacement through ion exchange reactions.
Deposition of pollutants can also lead to land contamination.
9.8.4 Summary
Ultimately, without mitigation both methods of soil alteration have the
potential of reducing land productivity or economic potential in the
regions that can be affected. This is already recognized as a national
problem and it was estimated by 2004 that at least USD 390 million or
3.8% of GDP is lost to erosion1.
9.8.5 Mitigation Strategies
The following mitigation strategies can be employed against soil
impacts:
• Limiting excavations to only necessary areas,
• Implementing soil conservation strategies in areas with high Soil
Erosion Potential,
• Complying with waste management regulations,
• Complying with regulations and guidelines on soil conservation
such as those provided by land use plan, ecosystem management
plans and those gazetted by the Agriculture and Food Authority,
and
• Implementing run-off and water management measures.
9.9 IMPACTS ON HYDROLOGY AND HYDROGEOLOGY
9.9.1 Summary of Applicable Constraints
Applicable constraints to the potential impact on hydrology and
hydrogeology include:
• Protected Areas,
• Internationally Designated Areas,
• Sensitive ecosystems,
1 Cohen J., Brown T. and Shepherd D., (2004). Estimating the Environmental Costs of Soil Erosion at Multiple Scales in Kenya Using Emergy Synthesis. Agriculture, Ecosystems and Environment 114 (2006) 249–269. Elsevier.
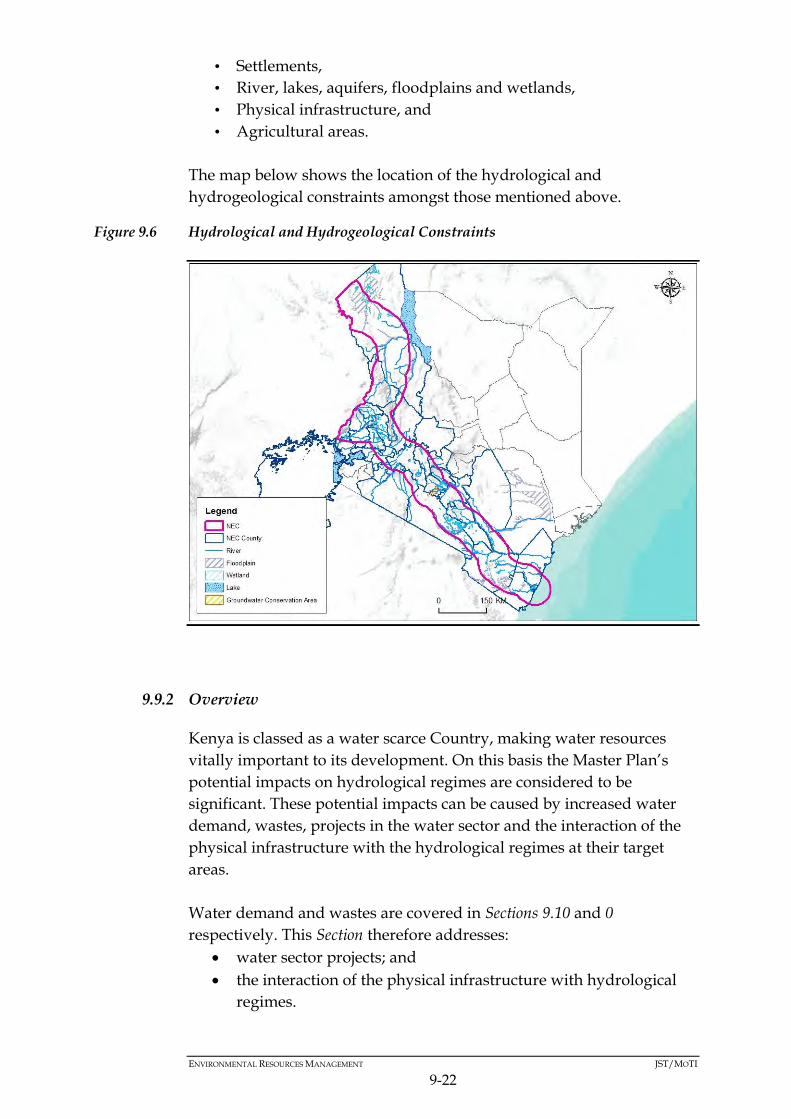
ENVIRONMENTAL RESOURCES MANAGEMENT JST/MOTI
9-22
• Settlements,
• River, lakes, aquifers, floodplains and wetlands,
• Physical infrastructure, and
• Agricultural areas.
The map below shows the location of the hydrological and
hydrogeological constraints amongst those mentioned above.
Figure 9.6 Hydrological and Hydrogeological Constraints
9.9.2 Overview
Kenya is classed as a water scarce Country, making water resources
vitally important to its development. On this basis the Master Plan’s
potential impacts on hydrological regimes are considered to be
significant. These potential impacts can be caused by increased water
demand, wastes, projects in the water sector and the interaction of the
physical infrastructure with the hydrological regimes at their target
areas.
Water demand and wastes are covered in Sections 9.10 and 0
respectively. This Section therefore addresses:
water sector projects; and
the interaction of the physical infrastructure with hydrological
regimes.

ENVIRONMENTAL RESOURCES MANAGEMENT JST/MOTI
9-23
9.9.3 NEC Water Sector Projects
The NEC Master Plan’s water sector infrastructure projects are mainly
multi-purpose dams aimed at providing water to support livelihoods
and other industries. The environmental impacts of dams are
summarised in Box 9.1.
Box 9.1 Environmental Impacts of Dams
9.9.4 Interaction of Physical Infrastructure with Hydrological Regimes
The NEC Master Plan infrastructure projects will involve land clearing
or deforestation for construction which will reduce the amount of
evapotranspiration. Consequently, this would mean less rainfall
potentially contributing to microclimatic modifications. This currently
occurs and is one of the challenges faced by Kenya’s water towers
Dams hold back sediment by increasing the retention through
their reservoirs. This prevents sediment feeding downstream in
addition to decreasing sediment loads downstream. This results
in: corrosion/erosion causing deepening of river beds
downstream, and degradation of floodplains in deltas ( ) ,
Dams restrict the egg laying zone and migration of fish by
creating a barrier. Reproduction of migrating fish is hindered by
floods that harm egg beds while egg gravel beds can be damaged
by the excavation and coating works on stream beds
Storage of water in reservoirs alters its physical, chemical and
biological characteristics. The discharged water consequently has
different quality as compared to inflows
Water quality is also affected by farm run-off or effluents which
often drains back to the reservoir when they provide water for
irrigation
Dams may increase of prevalence of water sourced illnesses
typhus, malaria, fever, malaria and cholera amongst others
Dams results in inundation of upstream ecosystems and low
flows downstream. They also alter the thermal regimes of rivers
thereby affecting growth of freshwater organisms
Increase in water surface area at the reservoir leads to increased
evaporation. This contributes to microclimatic modifications due
to changes in air moisture percentage, air temperature, air
movements in big scale and the changes in the region
topography caused by the stagnant, large scaled mass of water

ENVIRONMENTAL RESOURCES MANAGEMENT JST/MOTI
9-24
including those in the NEC. Other factors such as air emissions would
add to the microclimatic modifications.
Other potential modifiers of hydrological regimes are the impermeable
surfaces of the physical infrastructure that will be established by the
NEC Master Plan. These surfaces will cause less water to percolate
underground. Groundwater recharge will thus be reduced thereby
affecting groundwater availability. On the other hand, the impermeable
surfaces will increase surface run-off potentially increasing soil erosion
and flood risk. The development of these impermeable surfaces in, and
other physical alterations to, wetlands can compromise the ecosystems
services they provide such as flood retention and water purification.
Another potential modification is in the coastal region where the
establishment of foundations such as berths can increase saltwater
intrusion. One modelling study showed that this can occur because
after foundations are added, the overall seawater and fresh
groundwater interface moves landward1. In the agriculture sector,
irrigation and agricultural extension can result in:
Degradation of irrigated lands through salinization, alkalization,
waterlogging and soil acidification2.
Poor water quality of the irrigation water and for downstream
users in the case of rivers. Biodiversity at the project area and
downstream will be affected by this
Groundwater depletion when wells are the water source. It can
also lead to saline intrusion in coastal areas and reduced base
flow
Other changes to the low flow and flood regime as well as
changes to the level of the water table
The effects of these potential changes to hydrological regimes will
include negative reinforcement of soil erosion. Water availability can
also be reduced or segregated within river basins. Such changes can
become contributing factors to resource conflicts since they would affect
agricultural and ecological productivity.
9.9.5 Mitigation Strategies
Mitigation strategies that the NEC MP can implement include:
1 Ding G., Jiao J. and Zhang D., (2007). Modelling Study on the Impact of Deep Building Foundations on the Groundwater System. Hydrol. Process. (2007). Wiley InterScience. 2 Dougherty T. and Hall W., (1995). Environmental Impact Assessment of Irrigation and Drainage Projects. FAO. Natural Resource Management and Environment Department.
ENVIRONMENTAL RESOURCES MANAGEMENT JST/MOTI
9-25
• Avoiding wetlands, water towers, groundwater conservation
areas and flood plains,
• Implementing water ingress management measures as
appropriate, and
• Controlling run-off from infrastructure and implementing
sustainable drainage systems (SUDS) which mimic or allow
natural percolation of water.
9.10 RISK OF POLLUTION
9.10.1 Summary of Applicable Constraints
The following are the applicable constraints to this risk:
• Settlements,
• Protected Areas,
• Internationally Designated Areas,
• Sensitive ecosystems,
• Rivers, lakes, aquifers and wetlands, and
• Agricultural and high productivity areas.
9.10.2 Pollution
The implementation of the NEC Master Plan will introduce and or
generate materials, such as waste, hazardous materials and chemicals.
These materials will require to be properly managed as required by the
Waste Management Regulations (2006) or they would otherwise cause
pollution. Table 9.5 below identifies the nature of these materials as risk
agents while linking them to their potential sources.
Emissions to air and emergencies such as spills are covered in Section
9.4.10.

ENVIRONMENTAL RESOURCES MANAGEMENT JST/MOTI
9-26
Table 9.5 NEC MP Pollution Risk Factors
Source
Risk Agents
Solid Wastes Liquid Wastes Hazardous Materials
1. Construction, rehabilitation operation (use) and maintenance of transport infrastructure and related activities
1.1. Roads Construction waste
Road surfacing waste
Road litter
Domestic and office
waste
Waste tyres
Wastewater (black
and grey water)
Construction
effluents
Stormwater
(including sediments
and sludge)
Petrochemicals (asphalt, tar and
bitumen)
Paint (may contain lead and heavy
metals)
1.2. Railways Construction waste
General solid waste
(domestic and office
waste (MSW)) from
passengers and
terminals
Stormwater
Wastewater
(including
construction
effluents, black and
grey water)
Black water from
passenger cars and
terminal lavatories
Petrochemicals and petroleum
Cargo may include hazardous materials
Solvents, acids, coolants and alkalis
(rolling stock maintenance)
PCBs may be found in old electrical
equipment
1.3. Power
Transmission
Infrastructure
Construction waste Construction
effluent
Petrochemicals and petroleum
(including mineral oils used as coolants)
PCBs and SF6
Wood preservation chemicals (Creosote,
PCP and CCA)
1.4. Logistic Hubs Construction waste
Domestic and office
waste
Construction
effluents
Wastewater (black
and grey)
Stormwater
Cargo can include hazardous materials
1.5. OSBPs -
1.6. Inland Ports Construction waste Wastewater (black Petroleum and petrochemicals

ENVIRONMENTAL RESOURCES MANAGEMENT JST/MOTI
9-27
Source
Risk Agents
Solid Wastes Liquid Wastes Hazardous Materials
1.7. Marine Ports
(Container
berths)
Dredged materials
Domestic and office
waste including those
from vessels
and grey including
those from vessels)
Stormwater
Ballast and bilge
water
Sludge
Liquid wastes with noxious properties
Degreasing solvents
Cargo can include hazardous materials
1.8. ICDs Construction waste Wastewater (black
and grey)
Stormwater
Cargo can include hazardous materials
1.9. Airport
Expansion
Construction waste
Domestic and office
waste including those
from aircraft
Construction
effluents
Stormwater
Wastewater (black
and grey including
those from aircrafts)
Petroleum and petrochemicals
Cargo can include hazardous materials
Paints (may contain heavy metals) and
solvents
1.10. Pipeline
(including
telecommunicati
on and SCADA
system)
Construction waste
Domestic and office
waste
Construction
effluents
Stormwater
Wastewater (black
and grey including
water containing oil)
Tank sludge
Petroleum and petrochemicals
1.11. Shipping Domestic and office
wastes including those
from vessels (MSW)
Wastewater (black
and grey including
those from vessels)
Ballast water
Bilge water and tank
wash water
Sludge
Stormwater
Petroleum and petrochemicals
Cargo can include hazardous materials
PCBs, CFCs, asbestos and lead
containing batteries and paint, from ship
decommissioning and maintenance
activities (these may be present in old
vessels)
Antifouling paint

ENVIRONMENTAL RESOURCES MANAGEMENT JST/MOTI
9-28
Source
Risk Agents
Solid Wastes Liquid Wastes Hazardous Materials
Solvents
Incinerator ash (presence depends on
vessel type)
2. Coal Transportation Coal debris (solid
waste)
Wastewater
(including cleaning
water containing
coal)
-
3. Sourcing of
construction materials
and mining
Mining wastes (spoils,
soil and rocks)
Domestic and office
waste (MSW)
Wastewater (black
and grey)
Mining effluents
(including acid rock
drainage, metals
leaching and
tailings)
Stormwater
Hazardous materials vary with mining
methods
Petroleum and petrochemicals
Explosive wastes
4. Agriculture and fisheries sector activities
4.1. Promotion of
crop and
livestock
agriculture
Farm wastes Farm run-off (High
BOD) and irrigation
effluent
Pesticides
Herbicides
Fertilizers
4.2. Food processing
hub
Food/crop waste
Construction waste
Office and domestic
waste (MSW)
Stormwater
Construction
effluent
Facility effluent
(High BOD)
Wastewater (black
and grey)
Petroleum and petrochemicals
4.3. Commercial
crop distribution
facility
4.4. Irrigation Construction waste
Farm waste
Irrigation effluent
Wastewater (black
and grey)
Petroleum and petrochemicals
Pesticides
Herbicides
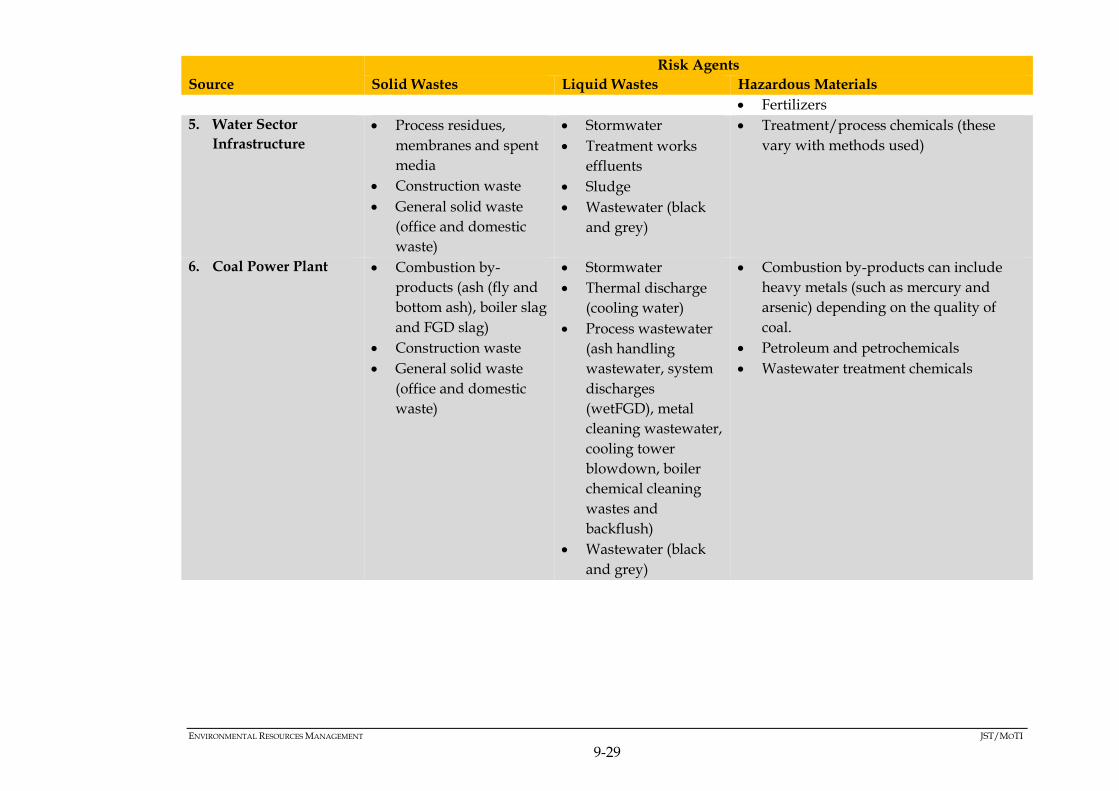
ENVIRONMENTAL RESOURCES MANAGEMENT JST/MOTI
9-29
Source
Risk Agents
Solid Wastes Liquid Wastes Hazardous Materials
Fertilizers
5. Water Sector
Infrastructure
Process residues,
membranes and spent
media
Construction waste
General solid waste
(office and domestic
waste)
Stormwater
Treatment works
effluents
Sludge
Wastewater (black
and grey)
Treatment/process chemicals (these
vary with methods used)
6. Coal Power Plant Combustion by-
products (ash (fly and
bottom ash), boiler slag
and FGD slag)
Construction waste
General solid waste
(office and domestic
waste)
Stormwater
Thermal discharge
(cooling water)
Process wastewater
(ash handling
wastewater, system
discharges
(wetFGD), metal
cleaning wastewater,
cooling tower
blowdown, boiler
chemical cleaning
wastes and
backflush)
Wastewater (black
and grey)
Combustion by-products can include
heavy metals (such as mercury and
arsenic) depending on the quality of
coal.
Petroleum and petrochemicals
Wastewater treatment chemicals

ENVIRONMENTAL RESOURCES MANAGEMENT JST/MOTI
9-30
Kenya faces challenges in managing wastes due to (1):
Lack of awareness and knowledge,
Political influence and lack of good will to particularly
implement long-term waste management solutions,
Limited availability of disposal facilities,
Limited availability of funding,
High poverty levels,
Limited technical competencies, and
Low level of technological advancement and adoption.
These factors are compounded by a growing population which seeks to
develop through consumptive modes. Perennial increases in the
amount of waste generated have been observed, contributing to the
problem of pollution. This is because wastes generated, in most cases
Municipal Solid Waste (MSW), are often not always managed as
required by law or standard good practice1.
It is observed in Kenya that hazardous wastes are at times disposed
through MSW and the management of the liquid waste stream is
limited by access to the sewer reticulation networks and the capacities
of existing treatment works. Practices such as sorting and separation,
and the 3Rs (Reducing, Reusing and Recycling) are deployed selectively
as influenced by waste generators’ capacities.
On this background, the implementation of the NEC projects will
contribute to the challenges faced in managing waste by generating
additional waste. Kenya lacks a single sanitary landfill (2) and most
waste is disposed through dumpsites in towns and cities.
Therefore, without proper management the waste generated by the
NEC Master Plan will cause pollution and the effects are discussed in
Box 9.2:
(1) Source: NEMA, (2015). The National Solid Waste Management Strategy. (2) A sanitary landfill in this case refers to one that is compliant with international standards on landfill design and
operation

ENVIRONMENTAL RESOURCES MANAGEMENT JST/MOTI
9-31
Box 9.2 Effects of Pollution in Kenya:
9.10.3 Mitigation Strategies
The following mitigation strategies can be implemented against the risk
of pollution:
• Developing complementary waste management facilities
including a sanitary landfill and a hazardous waste disposal
facility,
• Integrating Life Cycle Assessments into the project level
environmental risk management,
• Managing wastes (collection, transport and disposal) in
accordance to the provisions of the Waste Management
Regulations (2006), international standards such as those of the
IFC industry specific EHS Guidelines and providing adequate
equipment and facilities to do so, and
• Integrating the 3Rs (Reduce, Reuse, Recycle) of waste
management in NEC MP and at the project level.
9.11 NATURAL RESOURCE DEMAND
9.11.1 Summary of Applicable Constraints
The features listed below are the applicable constraints to natural
resource demand:
• Protected Areas,
Lowering the quality of life through morbidity and increasing
mortality rates. This results in lost time due to the former and
lost years due to the latter.
Contributing to land degradation in combination with poor
natural resource management. Land degradation will in turn
lower land productivity affecting economic activities such as
agriculture.
Limiting access to resources such as water and land.
Reducing the ecological integrity of ecosystems. This involves
compromising the economic value gained from these
ecosystems.
Creating an opportunity cost due to remediation costs. These
resources can be used to address other development needs
instead.
Creating service disruptions on infrastructure networks such as
drains and roads.

ENVIRONMENTAL RESOURCES MANAGEMENT JST/MOTI
9-32
• Internationally Designated Areas,
• Sensitive ecosystems,
• Resource extraction areas (forests, sand harvesting sites and
mines),
• Agricultural and high productivity areas, and
• Rivers, lakes, wetlands and aquifers.
9.11.2 Overview
The NEC Master Plan projects will require natural resources to be
exploited or utilised. These resources include energy, water and
materials which will be used in the construction and operation of
infrastructure and the population anticipated to grow as a result of the
projects (1). Therefore, additional demand on these resources will be
created and there is potential that the increased demand is negative as
explained in the Sections below:
9.11.3 Energy
Energy will be required to operate construction equipment, offices,
camps, homes and even in the use/operation of the infrastructure
components. For construction, the most common source of energy is
diesel, a fossil fuel whose use releases GHGs and other emissions (see
Section 9.6). Transportation on the constructed infrastructure through
crafts, vessels and vehicles will also rely on other fossil fuels. This is
demonstrated by the fact that electric cars constitute less than 1% of
vehicles in Kenya; and the rail, aviation and maritime sectors use diesel
and jet fuel primarily. Further, to sustain the population a combination
of energy sources will be used including fossil fuels and biomass.
Biomass, the most commonly used energy source in Kenya, leads to
deforestation (which result in habitat and carbon stock losses), and air
emissions (on thermal conversion) which include GHGs and PMX.
These emissions are associated with global climate change and
respiratory diseases.
The NEC Master Plan will establish fixed facilities such as at the port,
airport, food processing, distribution, logistics hubs and OSBPs. These
facilities will require electrical energy to operate and where feasible the
national grid will be used. However, it may be beyond the facility
owners’ or occupiers’ discretion to select which source of electricity
generation is used to supply the national grid. Therefore, fossil fuel
sources which are known to have negative environmental impacts will
(1) It is anticipated that the NEC Master Plan will lead to population growth through influx and promoting the economic
drivers of population growth through its positive impacts
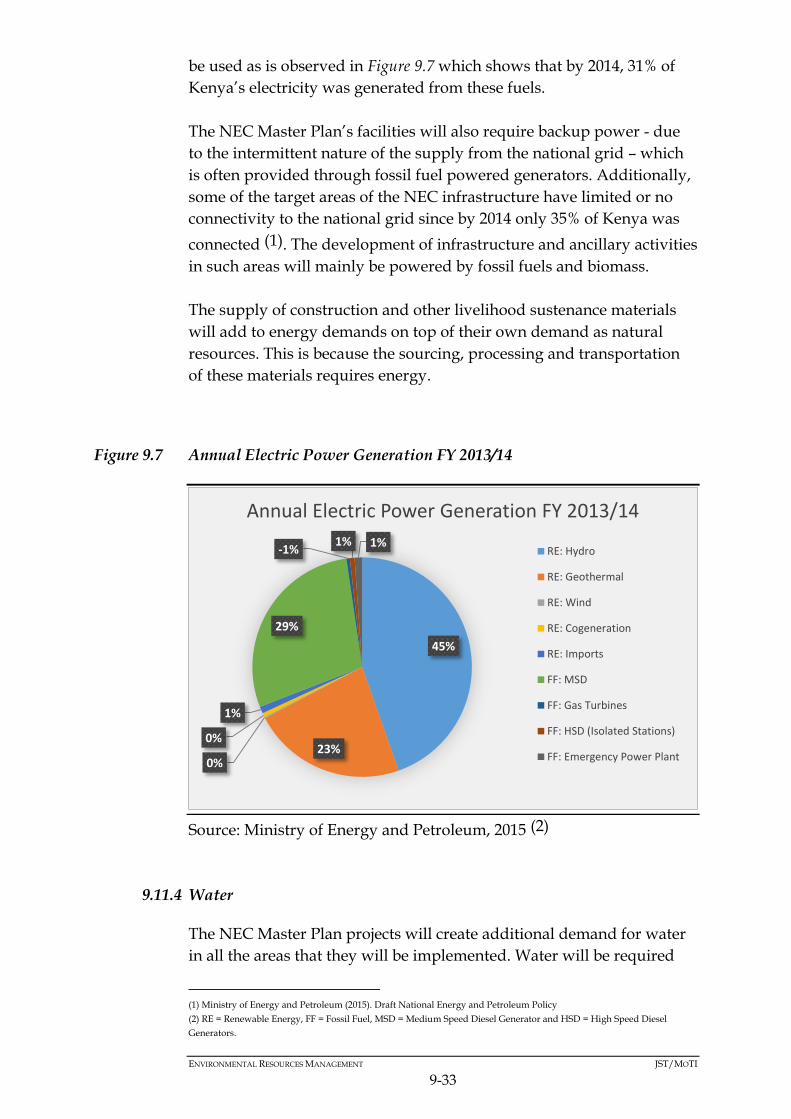
ENVIRONMENTAL RESOURCES MANAGEMENT JST/MOTI
9-33
be used as is observed in Figure 9.7 which shows that by 2014, 31% of
Kenya’s electricity was generated from these fuels.
The NEC Master Plan’s facilities will also require backup power - due
to the intermittent nature of the supply from the national grid – which
is often provided through fossil fuel powered generators. Additionally,
some of the target areas of the NEC infrastructure have limited or no
connectivity to the national grid since by 2014 only 35% of Kenya was
connected (1). The development of infrastructure and ancillary activities
in such areas will mainly be powered by fossil fuels and biomass.
The supply of construction and other livelihood sustenance materials
will add to energy demands on top of their own demand as natural
resources. This is because the sourcing, processing and transportation
of these materials requires energy.
Figure 9.7 Annual Electric Power Generation FY 2013/14
Source: Ministry of Energy and Petroleum, 2015 (2)
9.11.4 Water
The NEC Master Plan projects will create additional demand for water
in all the areas that they will be implemented. Water will be required
(1) Ministry of Energy and Petroleum (2015). Draft National Energy and Petroleum Policy (2) RE = Renewable Energy, FF = Fossil Fuel, MSD = Medium Speed Diesel Generator and HSD = High Speed Diesel
Generators.
45%
23% 0%
0%
1%
29%
-1% 1% 1%
Annual Electric Power Generation FY 2013/14
RE: Hydro
RE: Geothermal
RE: Wind
RE: Cogeneration
RE: Imports
FF: MSD
FF: Gas Turbines
FF: HSD (Isolated Stations)
FF: Emergency Power Plant

ENVIRONMENTAL RESOURCES MANAGEMENT JST/MOTI
9-34
for construction of infrastructure projects, ancillary services/activities,
as well as facility maintenance and operation. Water sector
infrastructure projects, multi-purpose dams, will also create shifts water
availability by adding additional water rights in their respective sheds.
Furthermore, the NEC MP has the potential of increasing the risks on
water quality and subsequently reducing water availability by altering
ecosystems such as wetlands and water towers, and causing pollution
of water resources.
Whilst the additional demand on water resources will be typical except
in the case of storage dams and those dams with an irrigation
component, the demand is both a potential opportunity and negative
impact. The latter is significant since Kenya is a water scarce country
whose land is classified as over 80% Arid and Semi-Arid Lands.
Distribution and access of water resources is uneven, and is a potential
preceptor of conflict. Conflict in this context is includes social, economic
and human-wildlife conflict.
The NEC traverses both urban and rural areas whose water sources
range from groundwater, piped water, rainwater and rivers amongst
others surface sources (See Figure 9.6) The Master Plan projects will
create an opportunity for service providers to capitalize on its
additional demand. But, without adequate investments into
infrastructure and Integrated Water Resource Management (IWRM), it
can contribute to intermittent service on piped supply and/or increase
competition on both surface and groundwater sources. This SEA study
deems the water sector projects are mainstream strategies aimed at
solving sectoral challenges in the country.
9.11.5 Materials and Goods
The infrastructure projects proposed by the NEC MP will create a
demand for construction materials and goods. This will not only create
an economic opportunity for supplying those materials but also a threat
on natural resources that can be sourced or converted to goods through
unsustainable means. These means of sourcing and converting these
materials/goods are usually either extractive, destructive or generate
the most emissions. The NEC MP projects can thus contribute to the
development challenges associated with unsustainable resource
consumption in Kenya and beyond. This risk compounds the potential
pressure that the NEC MP can add to PAs and other sensitive
ecosystems. Stakeholders of the NEC MP raised this amongst their
concerns and some common examples include extraction of building
materials, notably sand, concrete and bricks.
ENVIRONMENTAL RESOURCES MANAGEMENT JST/MOTI
9-35
9.11.6 Mitigation Strategies
Mitigation strategies that can be implemented against natural resource
demand include:
• Integrating Life Cycle Assessment into the project level
environmental risk management,
• Complying with regulations governing resource extraction such
as Forests Act (2005), EMCA (2014), Sand Harvesting Guidelines
(2009), Water Resource Management Rules (2006) and Water Act
(2014) amongst others,
• Adopting sustainability standards at the project level such as
those pertaining to green building and energy efficiency (LEED),
• Ensuring building materials are sourced from sustainable
sources, and
• Implementing demand management and resource efficiency
measures for water, electricity and materials.
9.12 HEALTH AND SAFETY (H&S) RISKS
A risk is defined as the probability of hazard occurrence and its
potential consequences on exposure to a receptor1. This study
distinguishes potential H&S risks as follows:
9.12.1.1 Construction and Decommissioning Hazards
These hazards are associated with the processes, equipment and
materials of the construction and decommissioning phase of projects
(see Table 9.6). Dependent on the spatial nature of the hazard, potential
receptors will include project staff and neighbouring communities.
1 The World Bank (1997). Environmental Hazard and Risk Assessment. Environment Department. Number 21.

ENVIRONMENTAL RESOURCES MANAGEMENT JST/MOTI
9-36
Table 9.6 Construction and Decommissioning H&S Hazards
Hazard
Category
Potential Hazards
Physical
Rotating and moving equipment
Noise and vibration
Electricity
Vehicular transport
Material conveyance or carousels
Working with heat and hot equipment
Ergonomic hazards (repetitive motion and handling)
Working in lowly lit areas
Working at height
Working over water
Working in confined spaces
Slippery surfaces
Stuck by objects
Falling objects
Elevated and stacked loads
Tunnels and excavations
Emissions and ejected materials
Chemical Gaseous and particulate emissions
Fires and explosions
Flammable materials and chemicals
Explosive materials and chemicals
Oxidizing and corrosive chemicals
Biological Wastes (solid and liquid) and other agents of disease
ecology including social ones
Hazardous and toxic chemicals
Radiological Electromagnetic Fields and Interference (non-ionizing
radiation).
Source: IFC, 2007 Environmental, Health and Safety General
Guidelines; ILO 1992, Safety and Health in Construction: An ILO Code
of Practice.

ENVIRONMENTAL RESOURCES MANAGEMENT JST/MOTI
9-37
9.12.1.2 Industry Specific Hazards
Industry specific hazards are those that are associated with the specific
activities of either the industry associated with the Master Plan projects
or the type of project itself. Table 9.7 identifies them according to their
respective sectors or projects, and they can be further identified and
assessed at the project level when project details are more defined.

ENVIRONMENTAL RESOURCES MANAGEMENT JST/MOTI
9-38
Table 9.7 Industry Specific H&S Hazards
Sector/Project/Activities
Hazards
Physical Chemical Biological Radiological
Roads Moving equipment
Vehicular collisions
(accidents), elevated work
and loads
Working over water
Noise and vibration
Slips and falls.
Hazardous chemicals
(bitumen, asphalt,
solvents and other
chemicals)
Air emissions (exhaust
and dust)
Transportation of
hazardous/dangerous
cargo.
Solid and
liquid wastes
(pathogens)
-
Railway Train/worker collisions
(accidents - derailment
and at level crossings)
Noise and vibration
Electricity
Worker fatigue
Moving equipment
Working in confined
spaces.
Diesel exhaust
Hazardous chemicals and
substances (VOCs, PCBs,
asbestos, paints, solvents
and heavy metals)
Fires and explosions
Transportation and
handling of
hazardous/dangerous
cargo.
Solid and
liquid wastes
(pathogens)
Cargo can
include
biologically
hazardous
materials.
Cargo
may
include
radioacti
ve
materials.
Power Transmission
Infrastructure
Electricity (live power
lines)
Working at height
Air traffic obstacles
Noise (HV lines and
transformers).
PCBs in transformers
Ozone (produced from
corona).
Solid and
liquid wastes
(pathogens)
EMFs
and EMI.
Logistic Hubs Vehicular collisions
(accidents)
Elevated and stacked
Transportation and
handling of
hazardous/dangerous
Solid and
liquid wastes
(pathogens)
Cargo
may
include
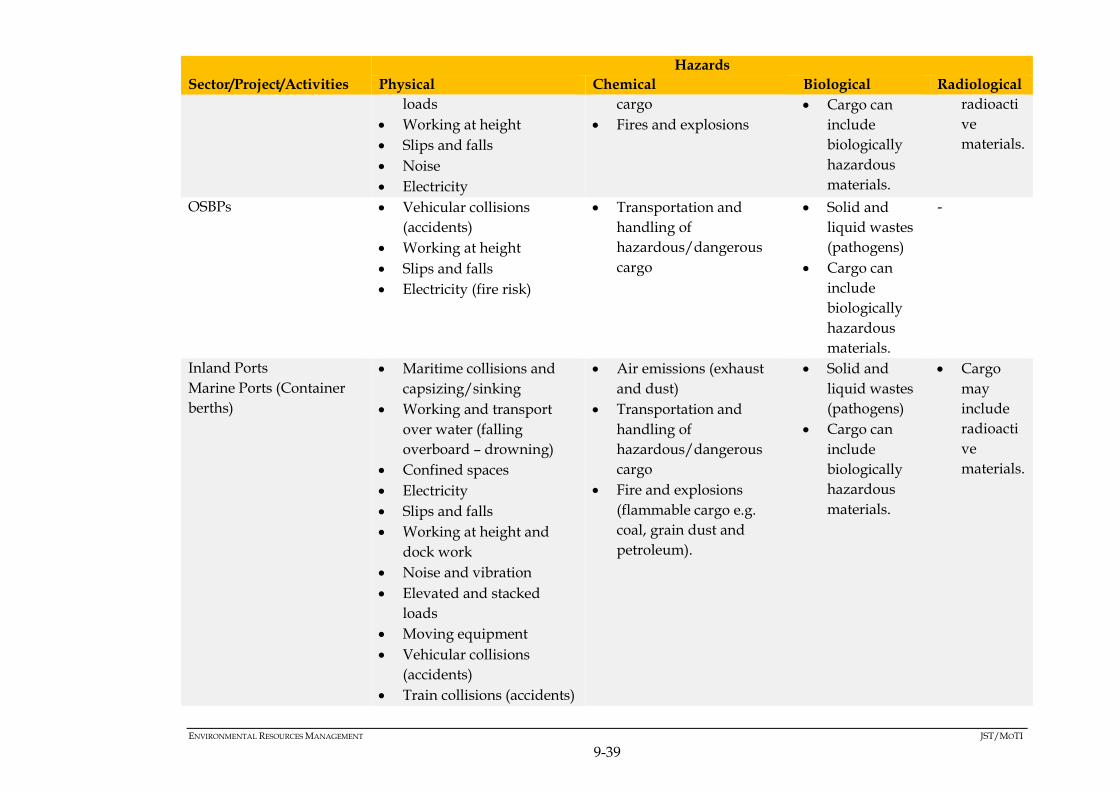
ENVIRONMENTAL RESOURCES MANAGEMENT JST/MOTI
9-39
Sector/Project/Activities
Hazards
Physical Chemical Biological Radiological
loads
Working at height
Slips and falls
Noise
Electricity
cargo
Fires and explosions
Cargo can
include
biologically
hazardous
materials.
radioacti
ve
materials.
OSBPs Vehicular collisions
(accidents)
Working at height
Slips and falls
Electricity (fire risk)
Transportation and
handling of
hazardous/dangerous
cargo
Solid and
liquid wastes
(pathogens)
Cargo can
include
biologically
hazardous
materials.
-
Inland Ports Maritime collisions and
capsizing/sinking
Working and transport
over water (falling
overboard – drowning)
Confined spaces
Electricity
Slips and falls
Working at height and
dock work
Noise and vibration
Elevated and stacked
loads
Moving equipment
Vehicular collisions
(accidents)
Train collisions (accidents)
Air emissions (exhaust
and dust)
Transportation and
handling of
hazardous/dangerous
cargo
Fire and explosions
(flammable cargo e.g.
coal, grain dust and
petroleum).
Solid and
liquid wastes
(pathogens)
Cargo can
include
biologically
hazardous
materials.
Cargo
may
include
radioacti
ve
materials.
Marine Ports (Container
berths)

ENVIRONMENTAL RESOURCES MANAGEMENT JST/MOTI
9-40
Sector/Project/Activities
Hazards
Physical Chemical Biological Radiological
Visual intrusion
(permanent illumination at
night).
ICDs Elevated and stacked
loads
Moving machinery
Electricity
Slips and falls
Noise and vibration
Traffic collisions
(accidents)
Confined spaces
Working at height
Air emissions (exhaust
and dust)
Transportation and
handling of
hazardous/dangerous
cargo
Fire and explosions
(flammable cargo).
Solid and
liquid wastes
(pathogens)
Cargo can
include
biologically
hazardous
materials.
Cargo
may
include
radioacti
ve
materials.
Airport Expansion Vehicular collisions
(accidents)
Air crashes and aircraft
collisions (including
ground accidents and
Foreign Object Damage
(FOD))
Wake vortices
Elevated loads
Working at height
Confined spaces
Moving equipment
Slips and falls
Visual intrusion
(permanent illumination at
night)
Noise and vibration
Air emissions (exhaust,
VOCs and dust)
Transportation and
handling of
hazardous/dangerous
cargo
Fire and explosions
(flammable cargo,
electricity, heating and
cooking equipment)
Petroleum and
petrochemicals (handling
and storage of fuel)
Solid and
liquid wastes
(pathogens)
Cargo can
include
biologically
hazardous
materials
Food
contamination
potential.
Cargo
may
include
radioacti
ve
materials
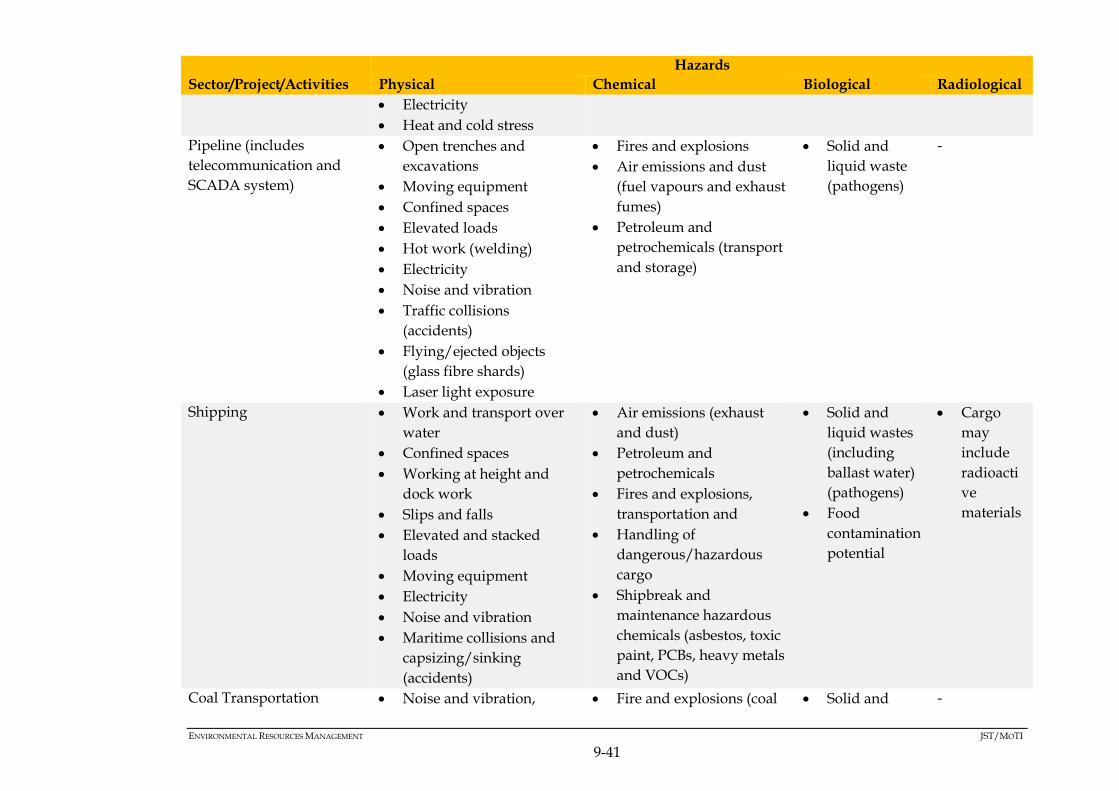
ENVIRONMENTAL RESOURCES MANAGEMENT JST/MOTI
9-41
Sector/Project/Activities
Hazards
Physical Chemical Biological Radiological
Electricity
Heat and cold stress
Pipeline (includes
telecommunication and
SCADA system)
Open trenches and
excavations
Moving equipment
Confined spaces
Elevated loads
Hot work (welding)
Electricity
Noise and vibration
Traffic collisions
(accidents)
Flying/ejected objects
(glass fibre shards)
Laser light exposure
Fires and explosions
Air emissions and dust
(fuel vapours and exhaust
fumes)
Petroleum and
petrochemicals (transport
and storage)
Solid and
liquid waste
(pathogens)
-
Shipping Work and transport over
water
Confined spaces
Working at height and
dock work
Slips and falls
Elevated and stacked
loads
Moving equipment
Electricity
Noise and vibration
Maritime collisions and
capsizing/sinking
(accidents)
Air emissions (exhaust
and dust)
Petroleum and
petrochemicals
Fires and explosions,
transportation and
Handling of
dangerous/hazardous
cargo
Shipbreak and
maintenance hazardous
chemicals (asbestos, toxic
paint, PCBs, heavy metals
and VOCs)
Solid and
liquid wastes
(including
ballast water)
(pathogens)
Food
contamination
potential
Cargo
may
include
radioacti
ve
materials
Coal Transportation Noise and vibration, Fire and explosions (coal Solid and -
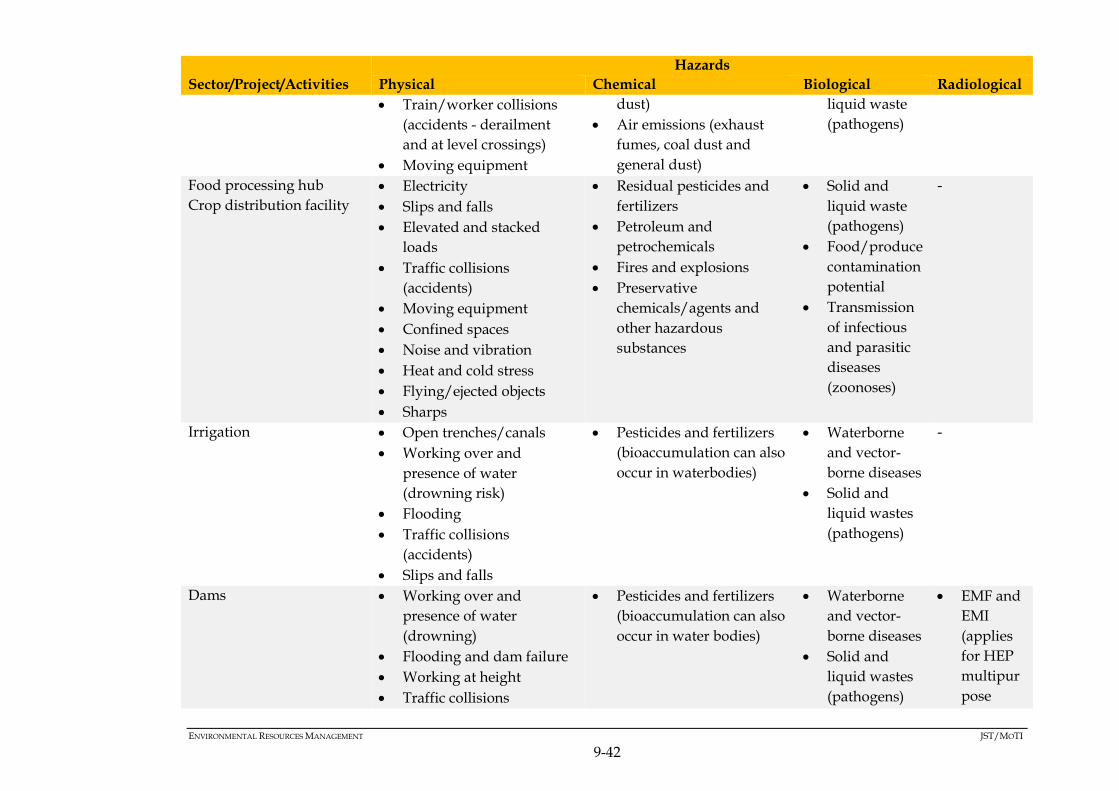
ENVIRONMENTAL RESOURCES MANAGEMENT JST/MOTI
9-42
Sector/Project/Activities
Hazards
Physical Chemical Biological Radiological
Train/worker collisions
(accidents - derailment
and at level crossings)
Moving equipment
dust)
Air emissions (exhaust
fumes, coal dust and
general dust)
liquid waste
(pathogens)
Food processing hub Electricity
Slips and falls
Elevated and stacked
loads
Traffic collisions
(accidents)
Moving equipment
Confined spaces
Noise and vibration
Heat and cold stress
Flying/ejected objects
Sharps
Residual pesticides and
fertilizers
Petroleum and
petrochemicals
Fires and explosions
Preservative
chemicals/agents and
other hazardous
substances
Solid and
liquid waste
(pathogens)
Food/produce
contamination
potential
Transmission
of infectious
and parasitic
diseases
(zoonoses)
-
Crop distribution facility
Irrigation Open trenches/canals
Working over and
presence of water
(drowning risk)
Flooding
Traffic collisions
(accidents)
Slips and falls
Pesticides and fertilizers
(bioaccumulation can also
occur in waterbodies)
Waterborne
and vector-
borne diseases
Solid and
liquid wastes
(pathogens)
-
Dams Working over and
presence of water
(drowning)
Flooding and dam failure
Working at height
Traffic collisions
Pesticides and fertilizers
(bioaccumulation can also
occur in water bodies)
Waterborne
and vector-
borne diseases
Solid and
liquid wastes
(pathogens)
EMF and
EMI
(applies
for HEP
multipur
pose

ENVIRONMENTAL RESOURCES MANAGEMENT JST/MOTI
9-43
Sector/Project/Activities
Hazards
Physical Chemical Biological Radiological
(accidents)
Electricity (HEP
multipurpose dams)
dams)
Water Treatment and
Supply
Electricity
Confined spaces
Traffic collisions
(accidents)
Moving machinery
Open water
Slips and falls
Working at height
Water treatment
chemicals (can include
strong acids and bases e.g.
Cl, Na, NaOCl and NH3)
Heavy metals
Air emissions (exhaust
and dust)
Chemical water
contamination
Solid and
liquid wastes
(pathogens
and treatment
waste)
Biological
water
contamination
Water may
contain
radioactive
substances
Coal Power Plant Electricity
Confined spaces
Traffic collisions
(accidents)
Moving machinery
Heat stress and heated
equipment
Moving machinery
Water and process
chemicals
Fires and explosions (coal
dust)
Solid and
liquid wastes
(pathogens
and treatment
waste)
EMF and
EMI (non-
ionizing
radiation)

ENVIRONMENTAL RESOURCES MANAGEMENT JST/MOTI
9-44
9.13 UNPLANNED EVENTS
The following Section presents the assessment of impacts resulting from
unplanned or non-routine events and those which are as a result of
accidents. These are different to impacts from effects that would
reasonably be predicted to occur in the normal course of activities.
9.13.1 Accidents
The risk of transportation accidents will be increased as a result of the
implementation of the Master Plan projects. In the roads sector, which
is most commonly used transportation mode in the NEC, there were
3,093 fatal accidents per year in Kenya between 2005 and 2015. In 2015,
there were 6.4 deaths or road fatalities per 100,000 people in the
country. In the same year, 18% of road fatalities in Kenya occurred
within the NEC – which is Kenya’s most important transport corridor.
The NEC also has 72 documented accident hotspots (blackspots) which
is significantly more than the rest of the country1. The number of Road
and Traffic Accidents (RTAs) has also in recent times been influenced
by an increase in the number of motor cycles in the country.
In the aviation sector, there have been 198 accidents/crashes in Kenya
between 1926 and 2016. Of these, 66 have been fatal causing 235
fatalities2. Maritime and rail accidents are more common than aviation
accidents but less common than RTAs.
The following mitigation strategies can be implemented to prevent
accidents:
• Complying with industry guidelines and regulations in the
design of infrastructure,
• Implementing and supporting programs to ensure vehicles and
crafts are maintained to regulatory approved standards,
• Implementing and supporting programs that ensure drivers and
pilots are adequately trained to operate their respective vehicles
and crafts,
• Implementing and supporting programs aimed at raising public
awareness in the pertinent industries, and
• Developing project level emergency/disaster preparedness and
response plans.
1 Kenya Police Service, (2014). Accident Blackspots in Kenya. 2 Aviation Safety Network, (2016). Statistics on Air Crashes in Kenya 1926 – 2016.

ENVIRONMENTAL RESOURCES MANAGEMENT JST/MOTI
9-45
9.13.2 Spills
Spills or accidental release of hazardous materials can occur from their
storage, use and transportation. Whilst their nature will be largely
industry specific, there will be a higher risk of spills from road
transportation as compared to other potential causes. This is because
road transportation has the most human factors (interaction with other
users and accidents). Maritime transportation of liquids including
petroleum and oil will also present a risk of spills. This form of
transportation is the most common cause of oil spills globally when
compared to all other potential causes.
With respect to pipelines, poor maintenance and the age of the current
product pipeline has resulted in spills some of which have been fatal. It
is deemed that the Master Plan interventions in the oil and gas section
aim to solve challenges in this sector.
Lastly, risks of spills from storage and use of hazardous materials is
specific to projects and the facilities concerned. These facilities will
include: logistic hubs, ports and local storages at the project level.
The mitigation strategies below can be implemented against the risk of
spills:
• Developing project level emergency/disaster preparedness and
response plans as well as spill contingency plans and providing
resources to respond to spills,
• Complying with the National Oil Spill Response Plan by
integrating its provisions to any project level contingency plans,
• Implementing and supporting monitoring programs at the
project level,
• Providing training to project staff on spill prevention and
management, and
• Adhering to industry guidelines on the design and maintenance
of any fluid storage, loading and conveyance equipment and
infrastructure.
9.13.3 Fire
Fires can occur on implementation of the Master Plan projects due to:
the introduction, generation, storage and use of flammable
materials (including wastes),
emergencies such as accidents and spills,
use of heating and burning equipment, and

ENVIRONMENTAL RESOURCES MANAGEMENT JST/MOTI
9-46
electric faults.
Microclimatic modifications can also increase the preceptors of wild
fires. This will be through increasing local dry periods and temperature
maxima particularly in the ASAL and grassland regions. These regions
are predominant in the low-lying regions in the eastern section of the
NEC (ASALs), and the southern and central regions of the Rift Valley in
Nakuru, Laikipia, Kiambu, Baringo, Kajiado and Narok counties.
9.13.4 Electrocution
The use of electricity in the different Master Plan projects and its
transmission through powerlines can cause electrocution. This can
occur when people and animals are exposed to uninsulated conductors
or if electric faults occur. Avifauna and other large animals such as
primates which can scale power infrastructure will be particularly at
risk of electrocution from powerlines. Induced faults, including those
from animals, can result in loss of service affecting related economic
activities in service areas.
9.13.5 Product Safety Risk
The Master Plan projects include 8No. Water Supply Projects (WSPs) as
part of the multi-purpose dams, a food processing hub and agricultural
produce distribution centre. These will produce or handle consumable
goods and will thus have to adhere with health and safety standards.
This is because risks of contamination and transmission of zoonoses (1)
will be present at these facilities. Contamination and transmission of
zoonoses can have negative health impacts on the receptors and
compromise the economic and social objectives of these
facilities/projects.
9.13.6 Human Wildlife Conflict
Human-wildlife conflict can occur via any of the following modes:
Increasing the interactions between humans and wildlife
through the development of infrastructure in Greenfield areas or
increase of human activity.
Increasing the risk agents of accidents which include collisions
with wildlife.
Reducing access to natural resources such as water due to
development of dams.
(1) a disease that can be transmitted to humans from animals.

ENVIRONMENTAL RESOURCES MANAGEMENT JST/MOTI
9-47
Increasing or concentrating wildlife attractions in settled areas.
These attractions include agricultural produce, crops and organic
wastes amongst others.
Increasing other hazards to wildlife such as wastes and
electricity from power transmission infrastructure.
9.14 NATURAL HAZARDS
9.14.1 Summary of Applicable Constraints
Pertinent constraints to natural disasters include:
• Faults and seismic zones,
• Flood plains,
• Arid and Semi-Arid Lands, and
• Areas susceptible to landslides.
9.14.2 Floods
Hydro meteorological hazards, including floods, are the most prevalent
type of hazard in Kenya as discussed in Chapter 5 of this report. Flood
risk can be exacerbated by the NEC through the predicted changes in
hydrological regimes and land use changes. Amongst the modes
through which this can occur is by increasing run-off in watersheds,
dam burst and irrigation. On the other hand, particularly in urban
areas, improper management of the anticipated solid wastes can lead to
clogging or blockage of drainage systems resulting floods during
deluge and or rainy seasons. This has been observed in urban centres
such as Nairobi recently in 2015 and 2016. Other factors contributing to
these urban floods include land use changes, construction in riparian
areas and diversion of watercourses.
9.14.3 Dam Burst
Under abnormal circumstances, dam bursts or breakage (failures) can
occur on the dams which are intended to be developed by the Master
Plan. Dam bursts pose a risk on downstream communities because of
the destructive force of the resulting flood wave and sudden inundation
of large areas. The flood wave and inundation can cause loss of life
through drowning as well as destruction of property and displacement
of communities.

ENVIRONMENTAL RESOURCES MANAGEMENT JST/MOTI
9-48
9.14.4 Landslides
The risk of landslides can increase in the highland areas of the NEC as a
result of road and rail cut, hillside farming and land use changes. Road
and rail cut change slope angles thereby reducing their stability and
increasing susceptibility to mass wasting. Hillside farming and land use
change in hillsides contribute to this risk through a variety of way
which include: increasing run-off on slopes, altering slope angles and
stability and increasing the weight of overburden on the slopes.
9.14.5 Mitigation Strategies
The following are the mitigation strategies that can be implemented
against natural hazards:
• Avoiding construction in flood plains in line with industry
guidelines,
• Integrating considerations for seismicity in the engineering
design of infrastructure in seismically active areas,
• Complying with industry guidelines for the design and
maintenance of dams such as those published by the
International Commission for Large Dams (ICOLD),
• Avoidance of fault zones,
• Incorporating landslide prevention measures for any
construction in landslide prone areas,
• Implementing and supporting disaster/emergency preparedness
and response plans and programs at the project level,
• Implementing and supporting programs aimed at raising
personnel and public awareness on potential hazards, and
• Integrating the provisions of the National Disaster Response
Plan into project level disaster/emergency preparedness and
response plans, and coordinating with the pertinent authorities.
9.15 CLIMATE CHANGE
As discussed in Chapter 5, climate change poses a threat to each
economic sector of Kenya. These threats can challenge the achievement
of Master Plan strategic objectives. Whilst GHGs are considered to be
the cause of global anthropogenic climate change, the NEC MP can only
mitigate emissions within its projects. Climate change can still occur as
a result of emissions from other activities. Notably these include: other
sectors in Kenya not in the NEC MP, other projects in the NEC not
under the management or influence of the NEC Master Plan
Implementers, and activities of other countries. This study notes that
Kenya remains vulnerable to the impacts of climate change despite

ENVIRONMENTAL RESOURCES MANAGEMENT JST/MOTI
9-49
being amongst the lower quantiles of GHG emitters. In connection, the
NEC MP will be vulnerable as well.
9.16 ASSESSMENT OF ENVIRONMENTAL IMPACTS
Table 9.8 presents the findings of the assessment exercise on the
identified impact using the methodology described in Chapter 4
(Section 4.5).
Table 9.8 Impact Significance Assessment
Impact Sensitivity Magnitude Significance
Habitat Alteration and
Biodiversity Impacts
High Moderate Large
Air Emissions Medium Moderate Moderate
Landscape Modifications Low Moderate Slight
Soil Alteration Medium Moderate Moderate
Hydrological Modifications High Minor Moderate
Pollution Risk High Moderate Large
Natural Resources Demand High Moderate Large
Health and Safety Risks High Large Large
9.17 CUMULATIVE ENVIRONMENTAL IMPACTS
9.17.1 Overview
This Cumulative Impact Assessment (CIA) has been prepared as per
the ERM Impact Assessment Standard which addresses the evaluation
of cumulative impacts and is based on current international practice
and guidance, specifically:
European Union (EU), 1999, Guidelines for the Assessment of
Indirect and Cumulative Impacts as well as Impact Interactions,
Canadian Environmental Assessment Agency, 2012, Assessing
Cumulative Environmental Effects under the Canadian
Environmental Assessment Act,
International Finance Corporation (IFC), 2013, Good Practice
Handbook Cumulative Impact Assessment and Management:
Guidance for the Private Sector in Emerging Markets, and

ENVIRONMENTAL RESOURCES MANAGEMENT JST/MOTI
9-50
National Environmental Policy Act (NEPA) Council on
Environmental Quality (CEQ), 1997, Considering Cumulative
Effects under the National Environmental Policy Act.
Cumulative impacts are those that result from the successive,
incremental, and/or combined effects of an action, project, or activity
when added to other existing, planned, and/or reasonably anticipated
future ones
This cumulative assessment uses five classes to define the resulting
significance of these cumulative impacts. These are described in Table
9.9.
Table 9.9 Determining the Effects of Cumulative Impacts
Significance Effect
Severe Effects that the decision-maker must take into account as the
receptor/resource is irretrievably compromised
Major Effects that may become a key decision-making issue
Moderate Effects that are unlikely to become issues on whether the
project design should be selected, but where future work may
be needed to improve on current performances
Minor Effects that are locally significant
Not
Significant
Effects that are beyond the current forecasting ability or are
within the ability of the resource to absorb such change.
9.17.2 Cumulative Environmental Impacts
Table 9.10 presents the findings of the identification and assessment of
the cumulative environmental effects/impacts of the NEC MP.
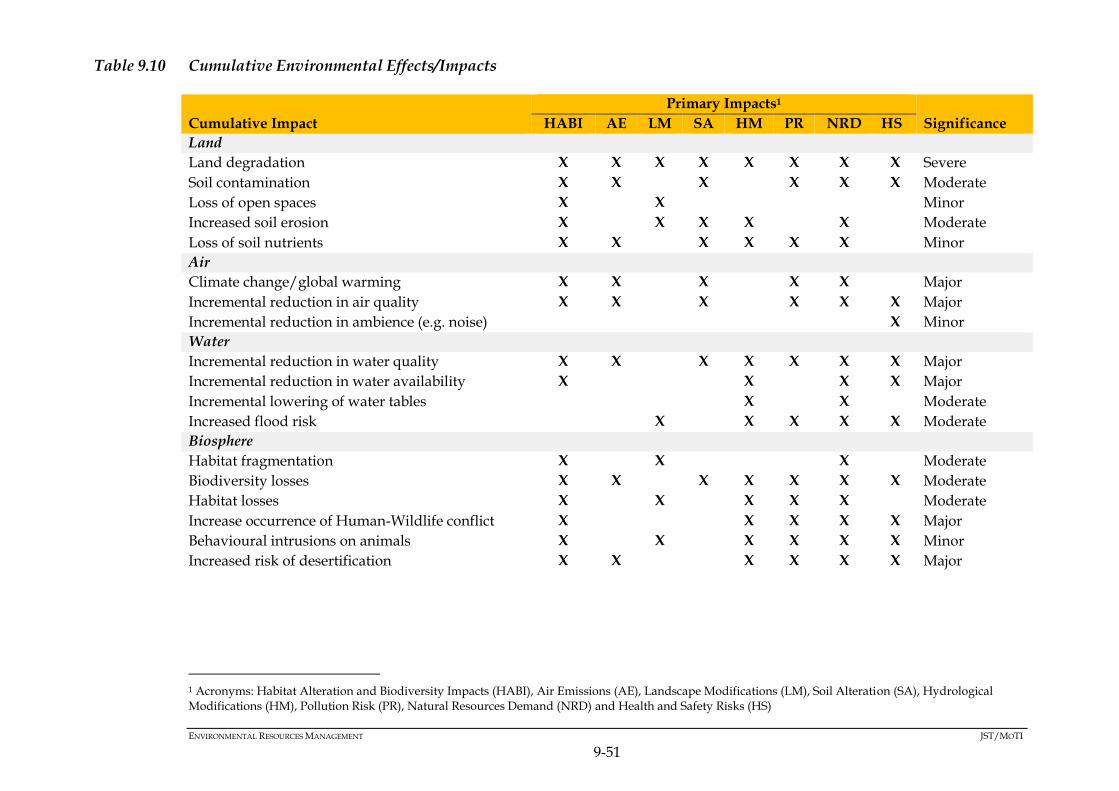
ENVIRONMENTAL RESOURCES MANAGEMENT JST/MOTI
9-51
Table 9.10 Cumulative Environmental Effects/Impacts
Cumulative Impact
Primary Impacts1
Significance HABI AE LM SA HM PR NRD HS
Land
Land degradation X X X X X X X X Severe
Soil contamination X X X X X X Moderate
Loss of open spaces X X Minor
Increased soil erosion X X X X X Moderate
Loss of soil nutrients X X X X X X Minor
Air
Climate change/global warming X X X X X Major
Incremental reduction in air quality X X X X X X Major
Incremental reduction in ambience (e.g. noise) X Minor
Water
Incremental reduction in water quality X X X X X X X Major
Incremental reduction in water availability X X X X Major
Incremental lowering of water tables X X Moderate
Increased flood risk X X X X X Moderate
Biosphere
Habitat fragmentation X X X Moderate
Biodiversity losses X X X X X X X Moderate
Habitat losses X X X X X Moderate
Increase occurrence of Human-Wildlife conflict X X X X X Major
Behavioural intrusions on animals X X X X X X Minor
Increased risk of desertification X X X X X X Major
1 Acronyms: Habitat Alteration and Biodiversity Impacts (HABI), Air Emissions (AE), Landscape Modifications (LM), Soil Alteration (SA), Hydrological Modifications (HM), Pollution Risk (PR), Natural Resources Demand (NRD) and Health and Safety Risks (HS)

ENVIRONMENTAL RESOURCES MANAGEMENT JST/MOTI
10-1
10 KEY SOCIO-ECONOMIC IMPACTS AND MITIGATION MEASURES
10.1 INTRODUCTION
In this Chapter the potential social, cultural, economic and human health
impacts of the NEC Master Plan are predicted and assessed, and
mitigation strategies are proposed. Similar to Chapter 9, the prediction
and assessment is focused on the Multi-Core with Regional Industrial
Development Type Master Plan Alternative. Insights and feedback
received from stakeholders during the preparation of this Study also
inform this impact assessment process.
This Chapter addresses two items, namely:
Socio-economic impacts, and
Cumulative socio-economic impacts.
10.2 NEC MASTER PLAN
As discussed in Chapter 2 of this Report, the development vision for the
NEC is to be the leading economic corridor with integrated transport
and logistics systems in Africa. The Master Plan therefore aims at
balanced growth and efficient logistics in the NEC region by promoting
urban functions of 18 Secondary Cites, including 6 Secondary cum
Regional Production Centres (see Figure 10.1 and Table 0.1 below),
which also cascade into specific sectoral infrastructure projects (Table
10.2).

ENVIRONMENTAL RESOURCES MANAGEMENT JST/MOTI
10-2
Figure 10.1 The NEC Master Plan
Source: JICA, 2016

ENVIRONMENTAL RESOURCES MANAGEMENT JST/MOTI
10-3
Table 10.1 Location of Flagship NEC Projects in Kenya and Uganda
No. Sector Project Title
1 Mining Eldoret-Kampala-Kigali Oil Pipeline Project
2 Mining ICT Project in Northern Corridor
3 Road Logistics Highway Project
4 Logistics Logistic Hub Project
5 Power Northern Corridor Integration Backbone (Power Generation, Transmission and
Interconnectivity)
6 Road Eldoret-Juba Highway Project
7 Port Mombasa Port Development Project
8 Urban Dev’t Project for Support of Re-organizing Logistics Facilities around Mombasa Port Area
9 Water Stony Athi Dam and Upper Athi Dam Project
10 Water Mwache Dam Project
11 Power Isinya-Nairobi East Transmission Line Project
12 Industry Geothermal Energy Based Regional Industrial Development in Rift Valley
13 Power Geothermal Project in Rift Valley
14 Power Mombasa Coal Power and Mariakani Substation Project
15 Power Dongo Kundu-Mariakani Transmission Project

ENVIRONMENTAL RESOURCES MANAGEMENT JST/MOTI
10-4
16 Industry Mombasa Special Economic Zone Project
17 Industry Project for Building Up Competitiveness of Construction Materials and Machinery
Industry in Kenya
18 Agriculture Agricultural Financing Improvement Project in Nairobi
19 Agriculture Value Chain of Agriculture Development Pilot Project in Kenya
20 Urban Dev’t Logistics Based Kisumu-Kakamega Metropolitan Area Development Project
21 Mining Study on Mining Master Plan in Uganda
22 Industry Project for Building Up Competitiveness of Construction Materials and Machinery
Industry in Uganda
23 Agriculture Value Chain of Agriculture Development Pilot Project in Uganda
24 Power Kampala-North-Namungona-Mutundwe 132 kV Transmission Line Refurbishment
25 Urban Dev’t Great Kampala (including Jinja) Logistic Based Urban Development Project
26 Urban Dev’t Study on master Plan for Urban Transport Development for Regional cities
27 Industry SEZ Development Project in Kampala
Source: JST, 2016

ENVIRONMENTAL RESOURCES MANAGEMENT JST/MOTI
10-5
Table 10.2 NEC MP Sectoral Distribution of Infrastructure Projects
Sector Number of Projects
Road 12
Railway 10
Border Post 7
Marine Port 5
Airport 1
Inland Waterway/Port 1
Logistics Hub 3
Oil and Mining 3
Agriculture and Fishery 9
Manufacture 3
Power 3
Water 9
Source: JST, 2016
The NEC Master Plan will ultimately result in the development of a
multitude of projects. The potential impacts of these projects are
predicted and assessed at a strategic level on the receptive baseline and
its constraints discussed in Chapter 6 (Socio-Economic Baseline).
10.3 IMPACT PREDICTION
The impact prediction process entails grouping issues associated with
the different sectoral projects being developed. These issues are
identified through an iterative process. In order to achieve this,
prediction matrices have been used. This process is also informed by:
Good International Industry Practice Guidelines (GIIPs),
research,
environmental and social risks of similar projects and plans, and
Stakeholder engagement.
10.4 SUMMARY OF SOCIO-ECONOMIC IMPACTS
Table 10.3 below provides a summary of the socio-economic impacts that may occur as a result of the Master Plan.

ENVIRONMENTAL RESOURCES MANAGEMENT JST/MOTI
10-6
Table 10.3 Socio-Economic Identification Matrix
Impro
ved
Logisti
cs
Regional
develop
ment
Grow
th
drive
rs
Capacity
Develop
ment
Employ
ment
Procure
ment
Econo
my
Cultu
ral
Herita
ge
Liveliho
ods
Rural –
urban
migrati
on
Publ
ic
Heal
th
Insecur
ity
Land
acquisit
ion
Lan
d
use
Urbanisa
tion
Land
Tenu
re
Sector
Road X X X X X X X X X X X X X X X
Railway X X X X
Border
Post
X X X X X X X X X X X X X X X X
Port X X X X X X X X X X X X X
Airport X X X X X X X X X X X X X X X
Inland
Waterwa
y/
Port
X X X X X X X X X X X X X X
Logistic
Hub
X X X X X X X
Oil and
Mining
X X X X X X X X X X X X X X X X
Agricultu
re and
Fisheries
X X X X X X X X X X X X X X X
Manufact
ure
X X X X X X X X X X X X X X X
Power X X X X X X X X X X X X X X X X
Water X X X X X X X X X X X X X X X X

ENVIRONMENTAL RESOURCES MANAGEMENT JST/MOTI
10-7
10.5 POSITIVE SOCIO-ECONOMIC IMPACTS
The overall objective of the Master Plan is to improve logistics for the
NEC as well as to provide an integrated regional development strategy
consistent with sub-regional and national development plans. As per
Chapter 2 of this Report, it is hoped that this will:
spur regional economic development within Kenya, as well as
Uganda,
improve the development of the industrial, agricultural, mining,
petroleum, manufacturing and tourism sectors,
lead to transport and logistics infrastructure development,
result in an efficient and integrated multi-modal transportation
system,
result in the diversification of financial sources for infrastructure
through PPP arrangements and infrastructure bonds, and
reduce the bottlenecks to efficient cargo transportation, such as road
and port congestion, as well as cross border delays.
The following Sections detail the positive socio-economic impacts of the
NEC Master Plan.
10.5.1 Logistics Improvements
10.5.1.1 Summary of Bottlenecks:
Current bottlenecks result in:
high transport costs, and
Long delays of cargo at customs, at the port and at border posts.
10.5.1.2 Logistics Improvements
Cost reducing factors of inland transport as a result of the Master Plan
have been identified as:
reduction of truck charges,
reduction of costs of various procedures and formalities,
reduction in the cost due to the use of the SGR for returning empty
containers, and
Reduction in the time it takes for imports to clear customs, the
Mombasa Port, and at Border posts.
As a result, JST (2016) estimate that approximately 15% of the total
inland transport cost will be reduced in the case of transport from

ENVIRONMENTAL RESOURCES MANAGEMENT JST/MOTI
10-8
Mombasa to Nairobi and to Kampala as shown below in Table 10.4 and
Table 10.5.
Table 10.4 Summary of Estimated Reduction of Inland Transport Cost (per
container)
From
Mombasa Item Current
cost
Reduction
of
truck
charge
s
Reduction
of cost for
procedures
Returning
empty
containers
by rail
To Nairobi Reduction rate(USD)
0 45 200 180
Amount(USD) 1,915 1,870 1,670 1,490
Degree of Reduction (%)
100% 98% 87% 78%
To
Kampala
Reduction rate(USD)
0 50 400 450
Amount(USD) 3,600 3,550 3,150 2,700
Degree of Reduction (%)
100% 98% 87% 75%
Source: JST 2016
Table 10.5 Projection of Reduction of Inland Transport Cost and Production Cost
Cost of inland transportation
per container (USD)
Total cost of production using one container of raw materials (USD)
Percentage
of reduced
cost in
total cost Before After Before After
To Nairobi 1,000 780 25,000 24,780 0.9%
To Kampala 4,250 3,188 28,333 27,271 3.8%
Source: JST 2016 (1)
The current transport and logistics situation for the NEC is that the
movement of cargo is heavily influenced by road traffic congestion, the
operation of the Mombasa Port, and cross border operations. In Kenya,
approximately 1% cost reduction of the total production can be realized
through the NEC Master Plan. It should be noted that the impact of
transportation and procedural streamlining will also improve the
logistics between the factories to customers, and sometimes across
borders. Therefore, the impact should not be limited to the above-
mentioned volume.
(1) The inland transportation cost per container is calculated using the lowest price per ton per container obtained through
interview. One container is assumed to be 25t of raw materials
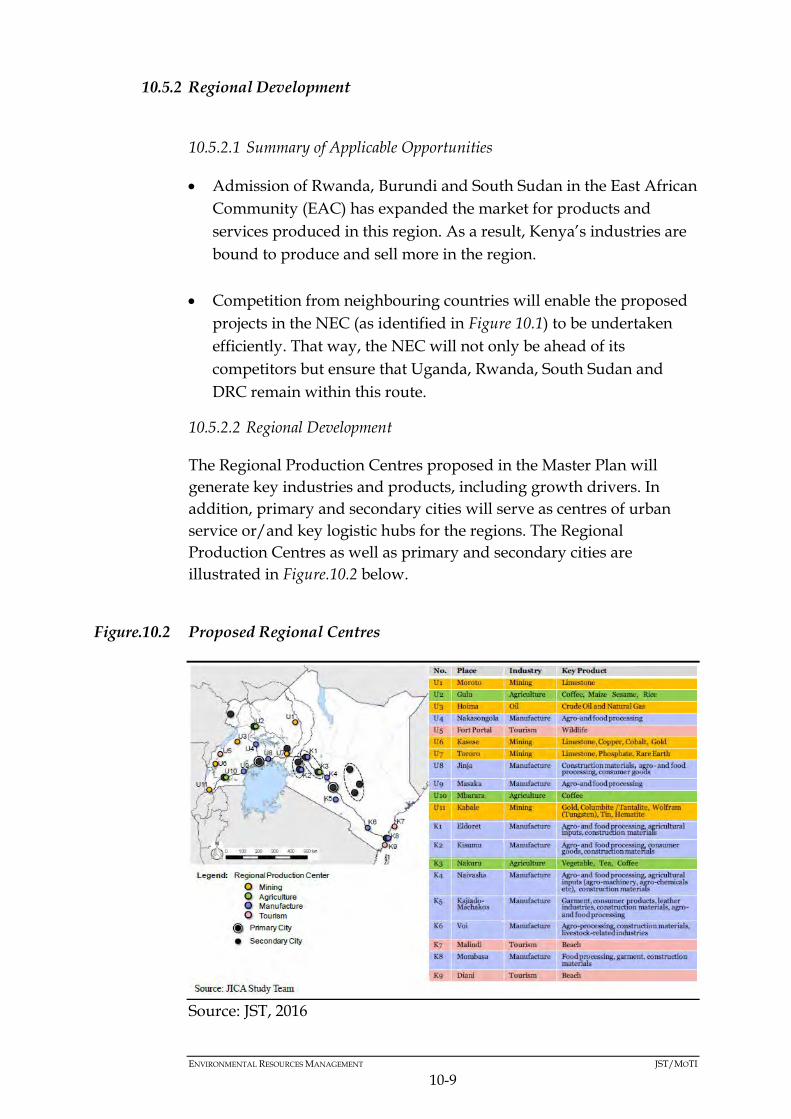
ENVIRONMENTAL RESOURCES MANAGEMENT JST/MOTI
10-9
10.5.2 Regional Development
10.5.2.1 Summary of Applicable Opportunities
Admission of Rwanda, Burundi and South Sudan in the East African
Community (EAC) has expanded the market for products and
services produced in this region. As a result, Kenya’s industries are
bound to produce and sell more in the region.
Competition from neighbouring countries will enable the proposed
projects in the NEC (as identified in Figure 10.1) to be undertaken
efficiently. That way, the NEC will not only be ahead of its
competitors but ensure that Uganda, Rwanda, South Sudan and
DRC remain within this route.
10.5.2.2 Regional Development
The Regional Production Centres proposed in the Master Plan will
generate key industries and products, including growth drivers. In
addition, primary and secondary cities will serve as centres of urban
service or/and key logistic hubs for the regions. The Regional
Production Centres as well as primary and secondary cities are
illustrated in Figure.10.2 below.
Figure.10.2 Proposed Regional Centres
Source: JST, 2016
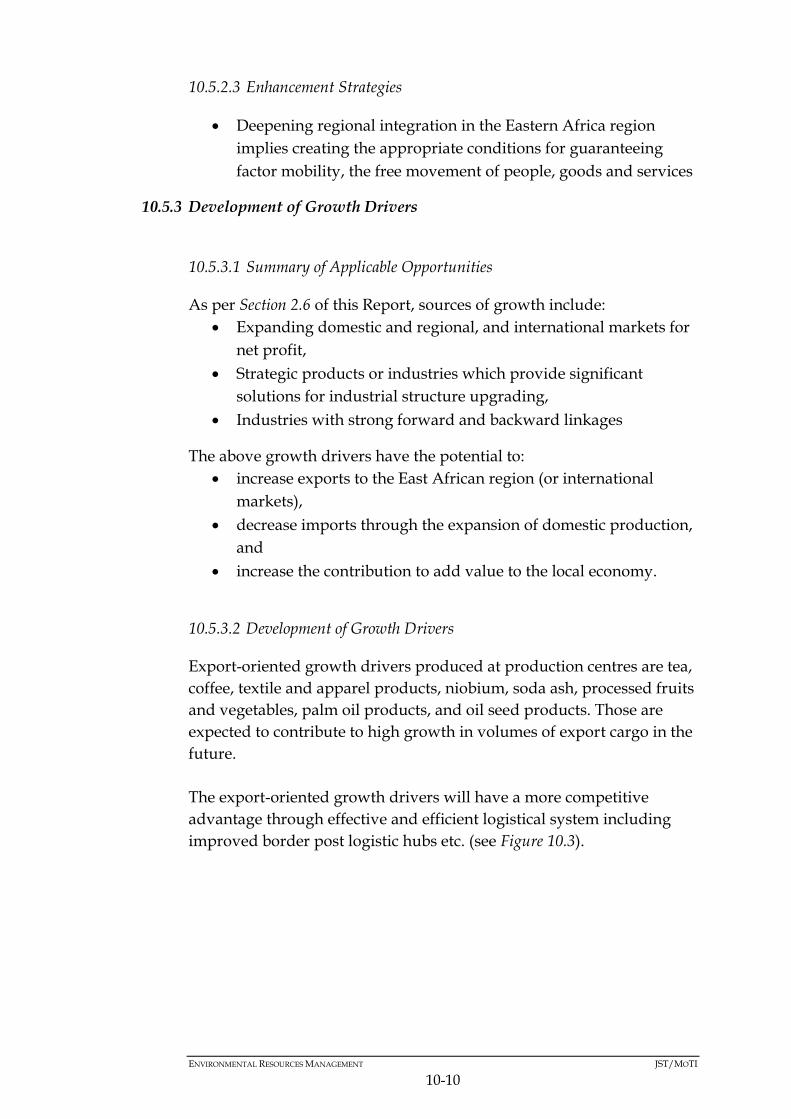
ENVIRONMENTAL RESOURCES MANAGEMENT JST/MOTI
10-10
10.5.2.3 Enhancement Strategies
Deepening regional integration in the Eastern Africa region
implies creating the appropriate conditions for guaranteeing
factor mobility, the free movement of people, goods and services
10.5.3 Development of Growth Drivers
10.5.3.1 Summary of Applicable Opportunities
As per Section 2.6 of this Report, sources of growth include:
Expanding domestic and regional, and international markets for
net profit,
Strategic products or industries which provide significant
solutions for industrial structure upgrading,
Industries with strong forward and backward linkages
The above growth drivers have the potential to:
increase exports to the East African region (or international
markets),
decrease imports through the expansion of domestic production,
and
increase the contribution to add value to the local economy.
10.5.3.2 Development of Growth Drivers
Export-oriented growth drivers produced at production centres are tea,
coffee, textile and apparel products, niobium, soda ash, processed fruits
and vegetables, palm oil products, and oil seed products. Those are
expected to contribute to high growth in volumes of export cargo in the
future.
The export-oriented growth drivers will have a more competitive
advantage through effective and efficient logistical system including
improved border post logistic hubs etc. (see Figure 10.3).
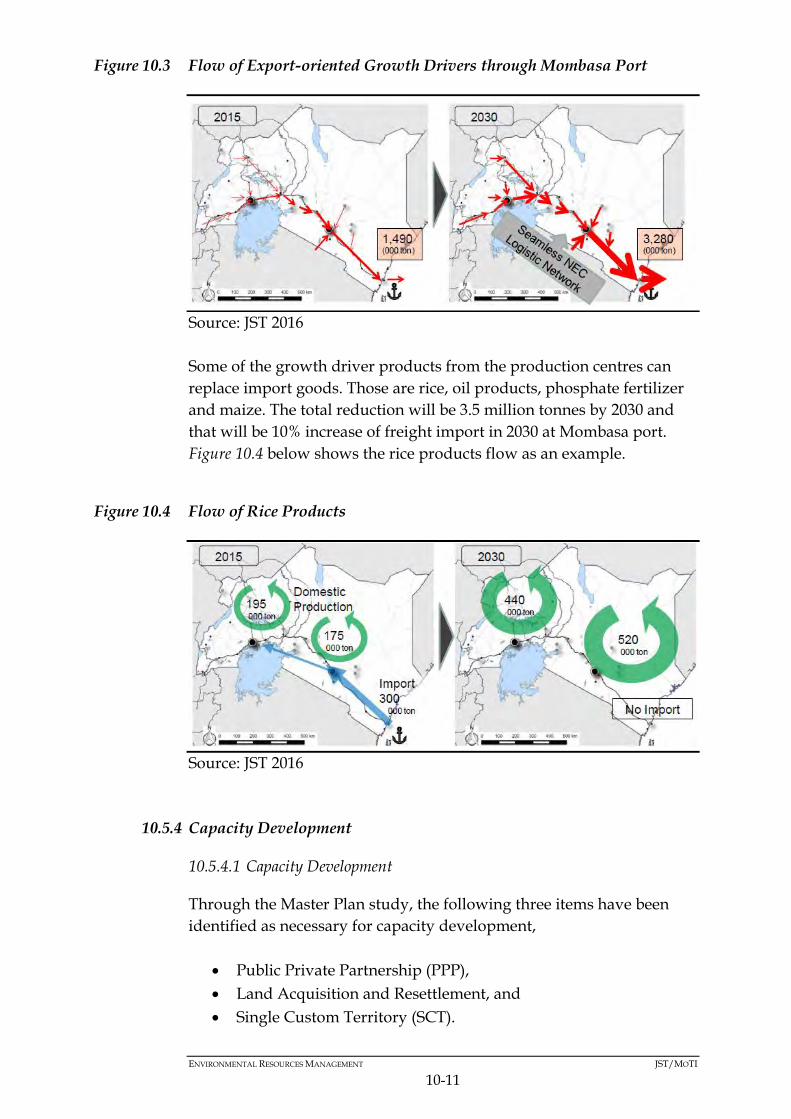
ENVIRONMENTAL RESOURCES MANAGEMENT JST/MOTI
10-11
Figure 10.3 Flow of Export-oriented Growth Drivers through Mombasa Port
Source: JST 2016
Some of the growth driver products from the production centres can
replace import goods. Those are rice, oil products, phosphate fertilizer
and maize. The total reduction will be 3.5 million tonnes by 2030 and
that will be 10% increase of freight import in 2030 at Mombasa port.
Figure 10.4 below shows the rice products flow as an example.
Figure 10.4 Flow of Rice Products
Source: JST 2016
10.5.4 Capacity Development
10.5.4.1 Capacity Development
Through the Master Plan study, the following three items have been
identified as necessary for capacity development,
Public Private Partnership (PPP),
Land Acquisition and Resettlement, and
Single Custom Territory (SCT).
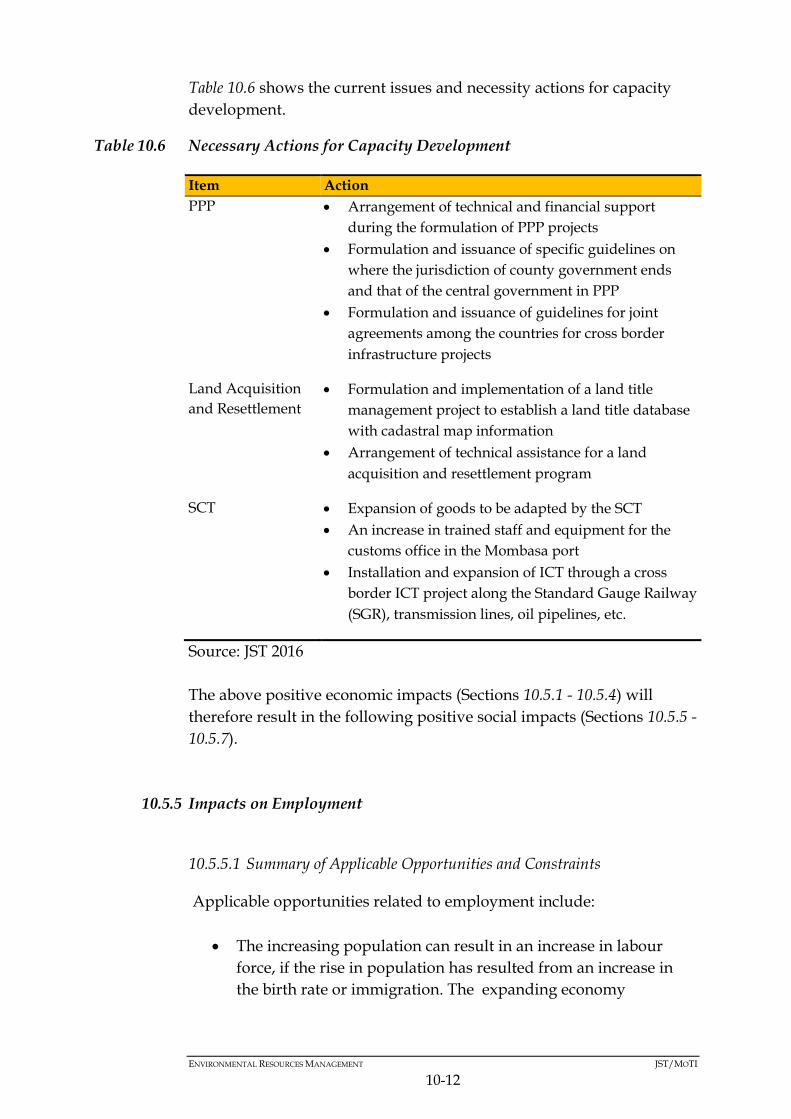
ENVIRONMENTAL RESOURCES MANAGEMENT JST/MOTI
10-12
Table 10.6 shows the current issues and necessity actions for capacity
development.
Table 10.6 Necessary Actions for Capacity Development
Item Action
PPP Arrangement of technical and financial support
during the formulation of PPP projects
Formulation and issuance of specific guidelines on
where the jurisdiction of county government ends
and that of the central government in PPP
Formulation and issuance of guidelines for joint
agreements among the countries for cross border
infrastructure projects
Land Acquisition
and Resettlement
Formulation and implementation of a land title
management project to establish a land title database
with cadastral map information
Arrangement of technical assistance for a land
acquisition and resettlement program
SCT Expansion of goods to be adapted by the SCT
An increase in trained staff and equipment for the
customs office in the Mombasa port
Installation and expansion of ICT through a cross
border ICT project along the Standard Gauge Railway
(SGR), transmission lines, oil pipelines, etc.
Source: JST 2016
The above positive economic impacts (Sections 10.5.1 - 10.5.4) will
therefore result in the following positive social impacts (Sections 10.5.5 -
10.5.7).
10.5.5 Impacts on Employment
10.5.5.1 Summary of Applicable Opportunities and Constraints
Applicable opportunities related to employment include:
The increasing population can result in an increase in labour
force, if the rise in population has resulted from an increase in
the birth rate or immigration. The expanding economy
ENVIRONMENTAL RESOURCES MANAGEMENT JST/MOTI
10-13
industries can therefore recruit new workers from this labour
force,
Domestic challenges in the manufacturing sector can present
opportunities for the industrial sector to plan and address them,
specifically through the improvement of the investment
environment, increasing the market size, increasing employment
and incomes and providing raw materials from the agricultural
and mineral and oil sectors.
However, potential constraints also include:
An increase in the number of people of working-age without a
corresponding increase in appropriate skills and jobs will result
in unemployment
As the population moves to the urban areas, unemployment can
increase, resulting in an increase in crime rates as well as the
development of slums or shanties.
Unemployment and underemployment have both been
identified as Kenya’s difficult and persistent problems. Over 13%
of the working age population is unemployed. About 67% of
Kenya’s unemployed are youths between 15 and 34 years of age.
The highest unemployment rates are for people around 20 years
old at 35%. This makes unemployment in Kenya a youth
problem.
10.5.5.2 Impacts on Employment
The growth of secondary cities will attract new investments and
businesses. As these cities will also be governance and economic
centres, their growth will create new jobs and reduce rural-urban
migrations to the major cities.
The growth of agricultural and mineral sectors will create employment
opportunities in the rural areas. This will increase the incomes,
investments, growth of the rural sector and reduce rural poverty.
Jobs will also be created by freight rail, related logistics industries, and
the manufacturing businesses served by freight rail. The sub-sectors
will offer good entry level jobs with career potential for more skilled
workers.
Employment opportunities will be created from logistic activities which
range from low to high skilled jobs to support the logistic operations. A

ENVIRONMENTAL RESOURCES MANAGEMENT JST/MOTI
10-14
diversified logistics service market will strengthen local expertise and
improve the performance of freight distribution.
The existing infrastructure facilities will employ more people once there
is improvement in their utilization. More people will be employed as
result of increasing operations at inland water ports and Mombasa port.
Reducing imports and reliance on home-grown food and processing
thereof will also serve as a massive boost to employment
10.5.5.3 Enhancement Strategies
The objective of enhancement measures is to optimise the opportunity
for direct employment and training for the work force at a local,
provincial or national level. Proposed strategies include:
Skills development and adult education programs will be required
to maximise the benefits associated with formal employment
opportunities.
Representatives from the various County Governments should be
informed of the specific jobs and the skills required for the NEC
projects, prior to the commencement of construction of these
projects. This will give the local populations time prior to the
commencement of construction to enable them to attain the relevant
skills to be employable on these projects. This is applicable to un-
skilled and semi-skilled workers.
NEC projects should prioritise the employment of unskilled labour
from local communities in the first instance.
NEC projects developing a fair and transparent employment policy
and process that manages out any potential nepotism. The policy
should be shared with nearby communities.
10.5.6 Impact on Procurement
10.5.6.1 Impact on Procurement
The risk of losing money on investments in developing transport and
logistics infrastructure will be reduced. This is because the Country will
depend on many sectors i.e. agriculture, industry, mining, tourism etc.
to pay, in the long run, for the investment
ENVIRONMENTAL RESOURCES MANAGEMENT JST/MOTI
10-15
10.5.6.2 Enhancement Strategies
Due to the viability, some of the proposed projects should be
undertaken by the private sector or public-private partnerships
(PPP). Such projects include establishment of industries, production
centres and transport hubs, mining, etc.
10.5.7 Impact on the Economy
10.5.7.1 Summary of Applicable Constraints
Potential constraints include:
In recent years, there has been a surge of terrorist attacks in Eastern
Africa and Kenya has had a share of these attacks. Terrorists are
motivated to disrupt the economy, to cause personal injury to
concentrations of people, to strike at symbolic targets, and transport
tools of terror using transport infrastructure,
Not all regions within the NEC produce adequate cargo necessary to
sustain the transport infrastructure. The undeveloped areas need to
be developed before they can produce goods for handling by the
transport modes. Developing underdeveloped regions requires a lot
of resources to be dedicated to these regions before they may be able
to produce more goods,
Recent experiences show that Kenya’s economic growth rate has
been fluctuating, giving the impression that economic growth is not
steadily occurring. In situations where the actual economic growth
rates fall below the planned rates (at an average annual growth rate
of 6.6%) as envisaged by the Master Plan, implementation of the
development strategies would be slowed down, delayed, or even
frustrated,
Implementation of the Development Strategies requires a lot of
funds which Kenya may not have or have in limited amounts. The
Government needs to reform the tax system so as to maximize
revenues. Even when funds are available, the Government would
have to prioritize its expenditure among competing interests.
Funding can limit the Government to spend money on big
infrastructure projects, and
Corruption can adversely affect implementation of the development
strategies by making infrastructure project expensive, delay or, even
fail. A country suffering from corruption cannot implement sound
plans and thus is not expected to benefit from sustainable
development despite embarking upon economic growth from time
to time for some reason or the other.
ENVIRONMENTAL RESOURCES MANAGEMENT JST/MOTI
10-16
10.5.7.2 Impact on the Economy
Local production of goods will be stimulated. This would result in more
goods and cargo being produced to support the transport logistics
infrastructure investments.
Industrial business sectors will be anchored in the COD. It will attract
and retain logistics and manufacturing operations that depend on
proximity to the railway lines, trans-load facilities, or intermodal
terminal to minimize transportation costs while gaining ready access to
urban markets.
Regional competitiveness will be improved. A strong multimodal
freight transportation system is a prerequisite for development of
industrial clusters in a region and a key to energy-efficient
transportation. COD will enable regions to create more efficient
national freight transportation networks, with the benefits of COD in
multiple regions flowing up to strengthen the national economy.
There will be improved system condition and performance in terms of
modal connectivity and safety. There will be benefit-cost and cost
effectiveness in terms of time and cost, system accessibility, short-term
jobs and operational costs.
Work practices will be integrated: the integration of labour force work
practices required to move cargo most efficiently through a supply
chain, including at ports and intermodal/ trans-load facilities. It will
require sound organizational (managing labour as a group) and
management skills (managing individual workers) competencies.
Information will be integrated: the inter-connectedness of information
systems to allow for improved management of supply chains. Systems
that provide electronic data interchange will be included.
There will be planning and funding integration: the planning and
funding of infrastructure from an integrated multimodal, total logistics
chain perspective. Freight transportation bottlenecks are a potentially
significant hindrance to economic growth and the integration of
transport chains. It will also recognize the concerns in government and
industry that established institutional and financial arrangements have
not adequately responded in recent decades to the demands imposed
by growing volumes of freight and passenger traffic and to
fundamental shifts in regional and global patterns of trade.

ENVIRONMENTAL RESOURCES MANAGEMENT JST/MOTI
10-17
There will be customs integration which will aim at moving goods
more efficiently across Kenya’s borders, including pre-screening and
inspections.
Security will be integrated which will emphasize the
interconnectedness or harmonization of security procedures that
protect cargo from theft or damage and protect the public from risks
posed by dangerous cargo or threats posed by illicit cargo.
The infrastructure would be optimally utilized. Presently some of it is
underutilized or redundant. For example, Kisumu Port and other
smaller ports on Lake Victoria currently handle lower volume of cargo
than they used in 1960s and 1970s. If they are fully utilized, they will
improve trade within the lake region and, between Kenya, Uganda and
Tanzania.
All components of logistics will be efficiently coordinated to promote
value addition under the least cost principle.
Well-coordinated logistics will benefit both producers and consumers.
The net effect will be reduction of costs of doing business for producers
and lower prices for consumers in Kenya.
Infrastructure will be integrated: the physical connectedness and
interoperability of hard infrastructure, such as the ability to move
containers efficiently from ship to truck to rail. The transport terminal–
port, rail, or airport – is the key infrastructure where physical flows of
goods will be reconciled with the requirements of supply-chain
management.
Commerce will be integrated: the development of commercial
arrangements to promote a better integrated logistics system, including
service-level agreements and performance targets and penalties as well
as management processes, for example, between main-line railways and
short lines, or between railways and ports (or terminal operators). This
will include the elements of cost, time, and reliability as commercial
goals that are benchmarked and included in commercial supply-chain
decisions.
There will be regulatory integration: the structuring of regulations to
promote a better-integrated freight distribution system. Regulations
will promote efficient modal choice, avoid subsidized modal
preferences, and favour the harmonization of regulation across
jurisdictions. Since supply-chain management will involve modes and
processes across several nations, regulatory integration will become
ENVIRONMENTAL RESOURCES MANAGEMENT JST/MOTI
10-18
increasingly important because it will transcend modes and
jurisdictions.
Agricultural and mineral cargo will easily reach the markets. Farmers
will produce and earn more from agricultural produce and minerals
like coal in Makueni will be exploited. Conversely, manufactured cargo
from the industries will easily reach the rural areas which will stimulate
consumption. The combined impact would result in increased
employment, incomes, improved well-being of the people and
development of the rural areas.
More agricultural and mineral raw materials will be produced for local
consumption, industrial use and exports. Consequently, the county’s
GDP, revenues and foreign exchange will increase. In addition, there
will be industrial growth when raw materials are turned into
manufactured goods.
Increased trade will enhance regional cooperation and integration
between the five countries and other African countries. The people and
governments in these countries will have increased need to work
together for their own benefit.
A wide range of goods for exports would be produced than presently is
the case. This would reduce the country’s over-reliance on a few crops
for exports and produce new different products and increase the
volume of the export cargo.
Import-substitution industries will be developed which will reduce the
volume of some of the current imports and the foreign earnings spent
for importing them. This would create jobs in the country and save the
country substantial foreign exchange.
Tax bases for the logistical hubs will grow and raise government
revenue. More business created in the hubs and beyond will be taxed to
raise government revenue.
Trade between Kenya, Uganda, South Sudan, Ethiopia and Djibouti will
be enhanced. This will encourage production and consumption of
goods and services in these countries because of expanded market
ENVIRONMENTAL RESOURCES MANAGEMENT JST/MOTI
10-19
10.6 NEGATIVE SOCIO-ECONOMIC IMPACTS
10.6.1 Loss of Cultural Heritage
The term cultural heritage encompasses several main categories of
heritage (1):
Cultural heritage, which includes tangible cultural heritage such as
movable cultural heritage (paintings, sculptures, coins,
manuscripts), immovable cultural heritage (monuments,
archaeological sites), underwater cultural heritage (shipwrecks,
underwater ruins and cities), as well as intangible cultural heritage (
oral traditions, performing arts, rituals); and
Natural heritage: natural sites with cultural aspects such as cultural
landscapes, physical, biological or geological formations
10.6.1.1 Summary of Applicable Constraints and Opportunities
Along the NEC there are a number of archaeological sites that have
to be preserved. Development of the NEC transport infrastructure is
likely to disturb or disrupt these sites (see Annex F), and
However, the NEC Master could also plan for these sites and boost
tourism by making these sites more accessible.
10.6.1.2 Loss of Cultural Heritage
The development of projects within the NEC may interfere with the
existing archaeological and historical heritage sites (see Section 6.12.2
and Annex F). These sites are therefore susceptible to degradation and
at the worst case, permanent destruction. Loss of cultural assets can
impact on community networks, structures and traditional practices
and can negatively affect the ability of a project to achieve a social
licence to operate and establish good relationships with neighbouring
communities.
10.6.1.3 Mitigation Strategies
To avoid and reduce the significance of the above mentioned impacts,
the following mitigation and management measures should be
implemented by the projects developed within the NEC.
The presence of cultural heritage assets would need to be confirmed
in detailed studies associated with each potential project; this could (1) http://www.unesco.org/new/en/culture/themes/illicit-trafficking-of-cultural-property/unesco-database-of-national-
cultural-heritage-laws/frequently-asked-questions/definition-of-the-cultural-heritage/

ENVIRONMENTAL RESOURCES MANAGEMENT JST/MOTI
10-20
influence the design and location of infrastructure, commercial
enterprises and industrial facilities.
Incorporation of heritage sites into tourism master plans as a way of
preserving such sites
Projects associated with the construction and operation of
infrastructure should be subject to Environmental and Social Impact
Assessment (ESIA) commensurate with the scale of the project and
impacts which includes consideration of cultural heritage and the
development of appropriate mitigation and management plans.
In terms of locally important cultural heritage sites, any loss or
alteration to such sites should be consulted on, and agreed, with the
National Museums of Kenya (NMK) as well as the local
communities and the custodians of the site. If necessary, appropriate
rituals should be undertaken to move the cultural asset, or to
otherwise expiate disturbance or loss of the site.
A framework “chance finds procedure” should be developed to
support the Master Plan which involves and references all relevant
ministries, other agencies and major cultural heritage stakeholders
in the country. The framework procedure should be deployed
within the construction and management planning for all
developments implemented under the auspices of the Plan.
10.6.2 Impact on Livelihoods
10.6.2.1 Impact on Livelihoods
There will be unemployment for those previously transporting cargo by
trucks. Businesses and livelihoods that also depend on trucks will be
adversely affected by the modal shift from truck to rail. Stakeholders
consulted in the border towns of Malaba and Busia raised this concern,
as they wanted to know what would be the alternative livelihoods for
those that depend on truck cargo transportation. JST responded that the
demand for human capacity would increase due to the modal shift and
as the economy grows, and gave examples from Japan.
10.6.2.2 Mitigation Strategies
Institutional strengthening and capacity building for agencies across
the NEC who are responsible for promoting and coordinating
ENVIRONMENTAL RESOURCES MANAGEMENT JST/MOTI
10-21
commercial developments to ensure that social risks are adequately
understood and addressed through mitigation.
10.6.3 Rural-Urban Migration
10.6.3.1 Summary of Applicable Constraints
Rural areas are deprived of labour in the agricultural sector leading
to a decline or slow growth of agricultural output; and families and
cultural bonds break or weaken as the population moves to the
urban areas, and
As the population moves to the urban areas, unemployment
increases, crime rates rise, slums or shanties develop and social
services become inadequate.
10.6.3.2 Rural – Urban Migration
The growth of secondary cities will encourage rural-urban migration.
Workers will compare the expected incomes, job opportunities and
standard of living in the urban sector with the rural areas and migrate if
the former exceeds the latter. Rural-urban migration would also
exacerbate urban unemployment in the secondary cities, resulting in an
increase in anti-social behaviour (e.g., crime).
An increase in urban immigration would result in pressure on the social
amenities and infrastructure in the cities. City and county governments
would have to spend more funds to develop and maintain the schools,
health, housing, and recreational facilities.
Finally, rural-urban migration will deprive the rural areas of the young
and able-bodied people necessary to provide labour and skills for
increased agricultural productivity. This may then hamper the growth
of the agricultural/rural sector.
10.6.3.3 Mitigation Strategies
Specific measures include:
Infrastructure projects should be subject to Environmental and
Social Impact Assessment (ESIA) undertaken in line with
international standards such as those of the World Bank or the
International Finance Corporation (IFC). The scope of the ESIA
should always include consideration of rural – urban migration.
Urban development plans / CIDP should also cater for rural-urban
migration.
ENVIRONMENTAL RESOURCES MANAGEMENT JST/MOTI
10-22
10.6.4 Public Health
10.6.4.1 Summary of Applicable Constraints
Applicable constraints within the Country as a whole include:
Poor access to basic primary health care;
High mortality rates;
Low staffing levels of doctors and nurses;
Prevalence of communicable disease in the country; and
Poor health affects the quality of labour.
10.6.4.2 Impact on Public Health
The link between transportation and the spread of sexually transmitted
diseases (STI) as well as HIV/AIDS is well documented. Incidences of
STI/HIV/AIDS may increase as a result of setting up construction
camps, and resultant social interaction with local communities. It is
important to note, however, that the modal shift from truck to railway
and pipeline may reduce the cases of STI/HIV/AIDS.
Construction activities have also been associated with increased
transmission of malaria, if NEC project sites are not appropriately
managed, breeding grounds can be created leading to increased
prevalence of mosquitos and therefore potential for transmission. The
presence of external workforces can also contribute to the transmission
of other communicable diseases including TB and respiratory tract
infections.
Those with pre-existing health conditions, the elderly and children are
usually worse affected by any changes in the disease profile in an area
or in changes in access to health care facilities.
ENVIRONMENTAL RESOURCES MANAGEMENT JST/MOTI
10-23
10.6.4.3 Mitigation Strategies
Specific measures include:
Infrastructure projects should be subject to Environmental and
Social Impact Assessment (ESIA) undertaken in line with
international standards such as those of the World Bank or the
International Finance Corporation (IFC). The scope of the ESIA
should always include consideration of health related impacts. For
large Projects this may require that appropriately qualified
international experts are appointed to address impacts on health.
The development and implementation of HIV/AIDS/malaria
policies and information documents for all workers directly related
to NEC projects. The information document will address factual
health issues as well as behaviour change issues around the
transmission and infection of HIV/AIDS as well as malaria.
All projects should have a Worker Code of Conduct for all project
personnel that include guidelines on worker-worker interactions,
worker-community interactions and development of personal
relationships with members of the local communities. As part of the
Worker Code of Conduct, all project personnel should be prohibited
from engaging in illegal activities including the use of commercial
sex workers and transactional sex. Anyone caught engaging in
illegal activities will be subject to disciplinary proceedings. If
workers are found to be in contravention of the Code of Conduct,
which they will be required to sign at the commencement of their
contract, they will face disciplinary procedures that could result in
dismissal.
Working in conjunction with relevant partners (eg health
authorities, NGOs, development agencies), information, education
and communication campaigns around diseases and health practices
should be developed as part of the Master Plan implementation
10.6.5 Insecurity
10.6.5.1 Summary of Applicable Constraints
The economic growth and development anticipated in Vision 2030
can only be achieved and sustained in a peaceful, stable and secure
environment. In the recent years, there has been a surge of terrorist
attacks in Eastern Africa and Kenya has had a share of these attacks.
Terrorists are motivated to disrupt the economy, to cause personal
injury to concentrations of people, to strike at symbolic targets, and
ENVIRONMENTAL RESOURCES MANAGEMENT JST/MOTI
10-24
transport tools of terror using transport infrastructure. A secure
transportation system is critical to overall national security from
terrorism. There are also instances where intermittent insecurity,
conflicts and tensions occur thereby threatening movement of cargo,
and
10.6.5.2 Insecurity
Security concerns in some sections of the corridor could jeopardize
linking of NEC with the LAPSSET, central corridor and Kampala-Juba-
Addis -Djibouti.
10.6.5.3 Mitigation Strategies
The successful implementation of the NEC Master Plan Strategies
will require the active participation of the Ministry of Interior and
Coordination of National Government.
10.6.6 Land Acquisition and Resentment
10.6.6.1 Summary of Applicable Constraints
Resettlement and compensation will be highest especially in Nairobi
and Mombasa Counties, as well as all proposed secondary growth
nodes and identified projects; and
Speculation may drive the land prices even higher.
10.6.6.2 Land Acquisition and Resettlement
The development of the NEC projects will require changes in existing
land uses which can result in physical and economic resettlement and
changes in social structures of communities. This could be due to either
temporary or permanent land take, where land is required for
infrastructure purposes (for example construction camps, expansion of
railway yards), or where people are required to move out of rights of
way (ROWs) in order to allow infrastructure to be built, or where
additional land is required for a widened ROW. The risk of relocation
and involuntary resettlement is therefore high.
The consequences of acquisition and/or involuntary resettlement are
severe, as they cause major upheavals to livelihoods, loss of income,
loss of property and assets, and social defragmentation.
ENVIRONMENTAL RESOURCES MANAGEMENT JST/MOTI
10-25
10.6.6.3 Mitigation Strategies
As part of capacity development, JST have already identified the
following with regards to resettlement and land acquisition:
Formulation and implementation of a land title management
project to establish a land title database with cadastral map
information, and
Arrangement of technical assistance for a land acquisition and
resettlement program
In addition:
Any physical and/or economic resettlement of communities should
be subject to the development of Resettlement Action Plans/
Livelihood Restoration Plans which should be prepared in line with
Kenyan regulations and international best practice as defined by the
World Bank or International Finance Corporation.
Institutional strengthening and capacity building for agencies across
the NEC who are responsible for promoting and coordinating
commercial developments to ensure that social risks are adequately
understood and addressed through mitigation
The budgeting process for any of the NEC initiatives must also
include a budget for resettlement and compensation, as these costs
can be quite significant.
10.6.7 Land Use and Settlement Patterns
10.6.7.1 Summary of Applicable Constraints
Implementing the Master Plan Development Strategies could result in
land use conflicts. Use of certain areas/parcels of land such as national
parks, wetlands, protected areas etc., to implement the Development
Strategies will need trade-off with other existing and potential uses (e.g.
developing transport infrastructure in certain sections of the NEC
would require converting agricultural and conservation land for such a
purpose). In sections where conversions of landuse are resisted, land
use conflicts and litigations may occur which can delay and increase the
cost of a project.
ENVIRONMENTAL RESOURCES MANAGEMENT JST/MOTI
10-26
10.6.7.2 Land Use and Settlement Patterns
Land uses will be affected by providing or increasing accessibility to
and from activity centres through the opening up of formerly
inaccessible areas. The NEC Master Plan will also lead to redistribution
of metropolitan growth to highway corridors and decentralization of
population and employment.
Settlement patterns have always been affected by the technology
available to the dwellers and especially by methods of transportation.
Along the corridor and around the growth drivers, settlement patterns
will change. The introduction of new roads will attract linear settlement
while primary and secondary cities will lead to clustered settlement
patterns.
10.6.7.3 Mitigation Strategies
Institutions responsible for land use plans should ensure that they
contain measures relating to infrastructure provision that are robust
and fit for purpose, with a focus on the poorest and most vulnerable
communities
Avoidance of conservation areas, national parks, wetlands,
protected areas
10.6.8 Urbanisation
10.6.8.1 Summary of Applicable Constraints
Urbanization will encourage rapid inflows of rural populations to
urban areas that give rise to housing problems and the development of
slums. An increase in urban areas will therefore put pressure on
existing water and sanitation facilities and potentially result in
environmental pollution, as well as increased unemployment in urban
areas
10.6.8.2 Mitigation Strategies
Any physical and/or economic resettlement of communities should
be subject to the development of Resettlement Action Plans/
Livelihood Restoration Plans which should be prepared in line with
Kenyan regulations and international best practice as defined by the
World Bank or International Finance Corporation.

ENVIRONMENTAL RESOURCES MANAGEMENT JST/MOTI
10-27
Institutional strengthening and capacity building for agencies across
the NEC who are responsible for promoting and coordinating
commercial developments to ensure that social risks are adequately
understood and addressed through mitigation.
Regional and/or County Integrated Development Plans (CIDP) to
plan for such urbanisation
10.7 CUMULATIVE SOCIO-ECONOMIC IMPACTS
10.7.1 Overview
This Cumulative Impact Assessment (CIA) has been prepared as per
the ERM Impact Assessment Standard which addresses the evaluation
of cumulative impacts and is based on current international practice
and guidance, specifically:
European Union (EU), 1999, Guidelines for the Assessment of
Indirect and Cumulative Impacts as well as Impact Interactions,
Canadian Environmental Assessment Agency, 2012, Assessing
Cumulative Environmental Effects under the Canadian
Environmental Assessment Act,
International Finance Corporation (IFC), 2013, Good Practice
Handbook Cumulative Impact Assessment and Management:
Guidance for the Private Sector in Emerging Markets, and
National Environmental Policy Act (NEPA) Council on
Environmental Quality (CEQ), 1997, Considering Cumulative
Effects under the National Environmental Policy Act.
Cumulative impacts are those that result from the successive,
incremental, and/or combined effects of an action, project, or activity
when added to other existing, planned, and/or reasonably anticipated
future ones
This cumulative assessment uses five classes to define the resulting
significance of these cumulative impacts. These are described in Table
9.9.

ENVIRONMENTAL RESOURCES MANAGEMENT JST/MOTI
10-28
Table 10.7 Determining the Effects of Cumulative Impacts
Significance Effect
Severe Effects that the decision-maker must take into account as the
receptor/resource is irretrievably compromised
Major Effects that may become a key decision-making issue
Moderate Effects that are unlikely to become issues on whether the
project design should be selected, but where future work may
be needed to improve on current performances
Minor Effects that are locally significant
Not
Significant
Effects that are beyond the current forecasting ability or are
within the ability of the resource to absorb such change.
10.7.2 Cumulative Socio-Economic Impacts
Table 10.8 presents the findings of the identification and assessment of
the cumulative environmental effects/impacts of the NEC Master Plan.
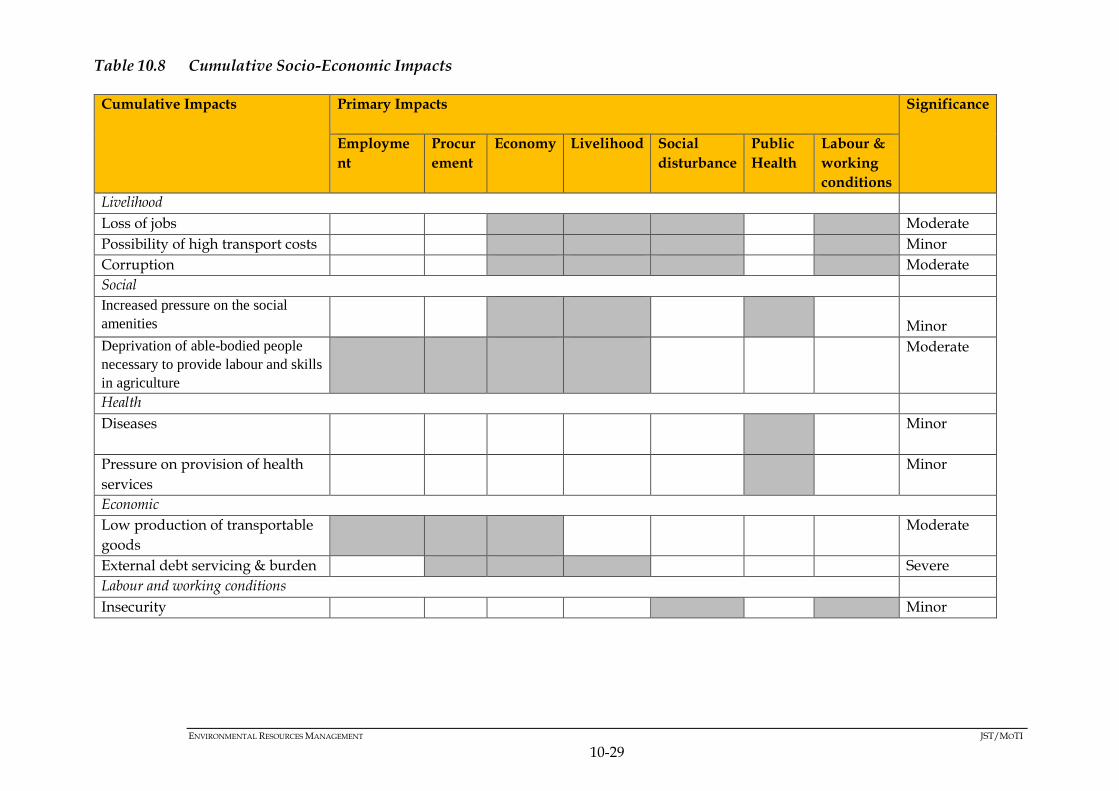
ENVIRONMENTAL RESOURCES MANAGEMENT JST/MOTI
10-29
Table 10.8 Cumulative Socio-Economic Impacts
Cumulative Impacts Primary Impacts
Significance
Employme
nt
Procur
ement
Economy Livelihood Social
disturbance
Public
Health
Labour &
working
conditions
Livelihood
Loss of jobs Moderate
Possibility of high transport costs Minor
Corruption Moderate
Social
Increased pressure on the social
amenities
Minor
Deprivation of able-bodied people
necessary to provide labour and skills
in agriculture
Moderate
Health
Diseases
Minor
Pressure on provision of health
services
Minor
Economic
Low production of transportable
goods
Moderate
External debt servicing & burden Severe
Labour and working conditions
Insecurity Minor

ENVIRONMENTAL RESOURCES MANAGEMENT JST/MOTI
11-1
11 ENVIRONMENTAL AND SOCIAL MANAGEMENT FRAMEWORK
11.1 INTRODUCTION
As discussed in Chapter 2, the overall objective of the Master Plan is to
improve logistics for the NEC as well as to provide an integrated
regional development strategy consistent with sub-regional and
national development plans. Although the proposed NEC development
will certainly result in positive socio-economic impacts, the SEA
assessment has also identified some unforeseen and potentially
significant negative impacts that will need to be addressed, as identified
and discussed in Chapters 9 and 10.
The following Chapter presents the recommended measures to mitigate
these negative environmental and social consequences of implementing
the Master Plan, and also to enhance its positive benefits wherever
possible. It also includes recommendations for strengthening the
institutional and measures and arrangements within the Plan with a
view to enhancing its environmental and social performance overall.
11.2 ENVIRONMENTAL AND SOCIAL MANAGEMENT FRAMEWORK
Table 11.1 presents the recommended Environmental and Social
Management Framework (ESMF) for the NEC Master Plan that contains
the strategic level mitigation and enhancement measures for addressing
the biophysical and socio-economic negative impacts that have been
identified in respect to the Plan in Chapters 9 and 10. Table 11.1 also
provides the recommended indicators for monitoring the effectiveness
of these measures and the overall sustainability of the Master Plan.
The measures themselves are not costed, since the vast majority have
already been identified and costed in detail within the Master Plan
itself. Likewise the Master Plan already contains detailed timelines for
their implementation, which are not reproduced here. However, the
ESMF does provide approximate timeframes for the various additional
measures that have been identified. The incremental cost of these SEA
measures is considered to be negligible in comparison to the cost of the
Plan measures themselves.

ENVIRONMENTAL RESOURCES MANAGEMENT JST/MOTI
11-2
Table 11.1 Environmental and Social Management Framework
Impact Impact
Significance
SEA Mitigation Measure Key Indicator Institutions
Involved
Approximate
timeframe (short,
medium, long
term)
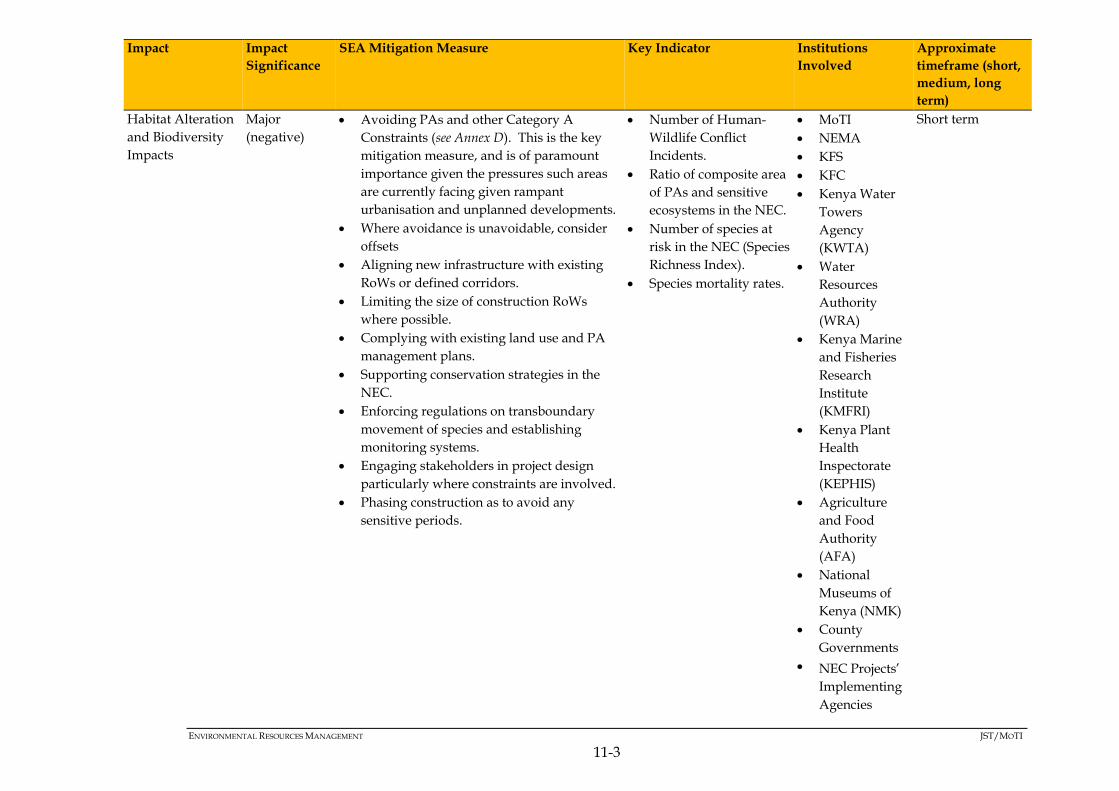
ENVIRONMENTAL RESOURCES MANAGEMENT JST/MOTI
11-3
Impact Impact
Significance
SEA Mitigation Measure Key Indicator Institutions
Involved
Approximate
timeframe (short,
medium, long
term)
Habitat Alteration
and Biodiversity
Impacts
Major
(negative)
Avoiding PAs and other Category A
Constraints (see Annex D). This is the key
mitigation measure, and is of paramount
importance given the pressures such areas
are currently facing given rampant
urbanisation and unplanned developments.
Where avoidance is unavoidable, consider
offsets
Aligning new infrastructure with existing
RoWs or defined corridors.
Limiting the size of construction RoWs
where possible.
Complying with existing land use and PA
management plans.
Supporting conservation strategies in the
NEC.
Enforcing regulations on transboundary
movement of species and establishing
monitoring systems.
Engaging stakeholders in project design
particularly where constraints are involved.
Phasing construction as to avoid any
sensitive periods.
Number of Human-
Wildlife Conflict
Incidents.
Ratio of composite area
of PAs and sensitive
ecosystems in the NEC.
Number of species at
risk in the NEC (Species
Richness Index).
Species mortality rates.
MoTI
NEMA
KFS
KFC
Kenya Water
Towers
Agency
(KWTA)
Water
Resources
Authority
(WRA)
Kenya Marine
and Fisheries
Research
Institute
(KMFRI)
Kenya Plant
Health
Inspectorate
(KEPHIS)
Agriculture
and Food
Authority
(AFA)
National
Museums of
Kenya (NMK)
County
Governments
NEC Projects’
Implementing
Agencies
Short term

ENVIRONMENTAL RESOURCES MANAGEMENT JST/MOTI
11-4
Impact Impact
Significance
SEA Mitigation Measure Key Indicator Institutions
Involved
Approximate
timeframe (short,
medium, long
term)
Air Emissions Moderate
(negative)
Complying with the Air Quality
Regulations (2014) and emission standards
as provided in KS 1515.
Using cleaner energy sources and
promoting their use.
Limiting land conversion to only necessary
areas.
Managing wastes according to regulations
in addition to employing the 3Rs to ensure
they are managed sustainably.
Supporting the development of an air
quality baseline through monitoring.
Supporting climate change response and
adaptation strategies as guided by national
strategies.
Promoting resource efficiency programs.
Avoiding the use of toxic or hazardous
materials through engineering design
measures where feasible.
Monitoring air quality in the target areas of
the NEC Projects.
Air emissions per
capita.
GHG emissions per
capita.
Prevalence rates of
morbidity causes linked
to air pollution.
Concentration of
criteria pollutants in the
NEC.
MoTI
NEMA
National
Climate
Change
Council
(NCCC)
Department of
Occupational
Safety and
Health (DOSH)
(MoLSS&S)
County
Governments
NEC Projects’
Implementing
Agencies
Short
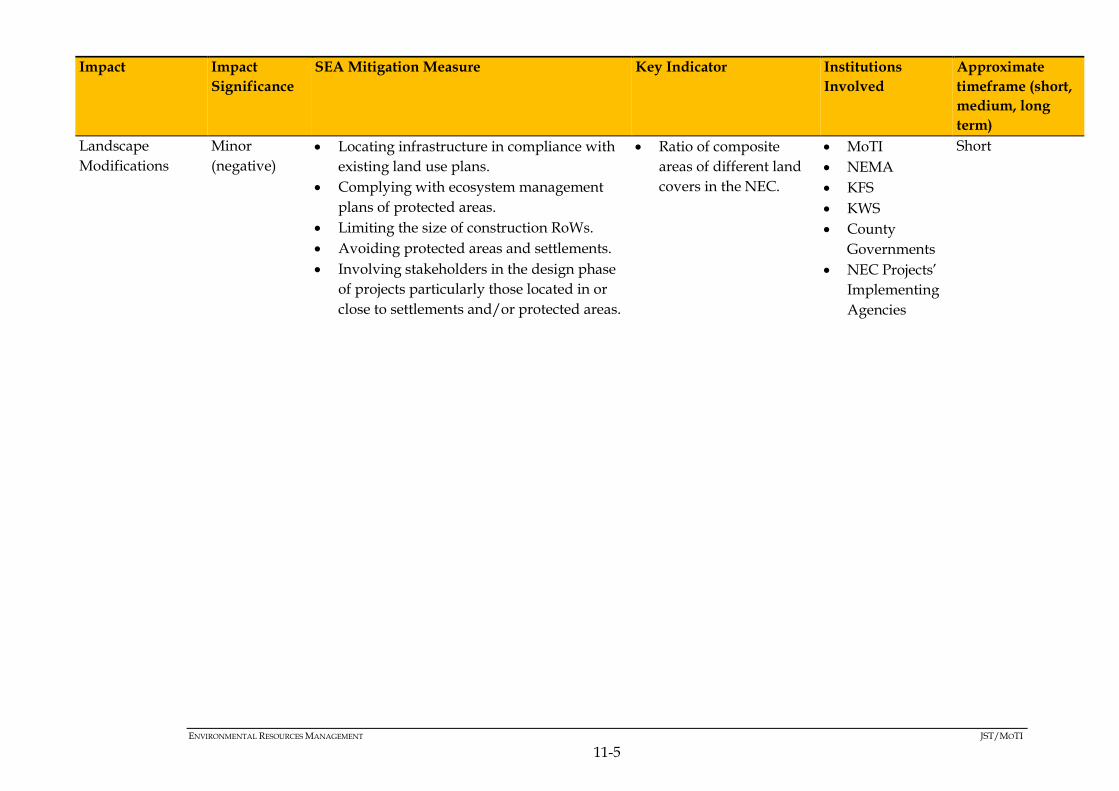
ENVIRONMENTAL RESOURCES MANAGEMENT JST/MOTI
11-5
Impact Impact
Significance
SEA Mitigation Measure Key Indicator Institutions
Involved
Approximate
timeframe (short,
medium, long
term)
Landscape
Modifications
Minor
(negative)
Locating infrastructure in compliance with
existing land use plans.
Complying with ecosystem management
plans of protected areas.
Limiting the size of construction RoWs.
Avoiding protected areas and settlements.
Involving stakeholders in the design phase
of projects particularly those located in or
close to settlements and/or protected areas.
Ratio of composite
areas of different land
covers in the NEC.
MoTI
NEMA
KFS
KWS
County
Governments
NEC Projects’
Implementing
Agencies
Short

ENVIRONMENTAL RESOURCES MANAGEMENT JST/MOTI
11-6
Impact Impact
Significance
SEA Mitigation Measure Key Indicator Institutions
Involved
Approximate
timeframe (short,
medium, long
term)
Impacts on Soils Moderate
(negative)
Avoidance of areas listed as constraints (see
Chapter 5 and Annex D)
Implementing run-off and water
management measures.
Limiting excavations to only necessary
areas.
Implementing soil conservation strategies in
areas with high Soil Erosion Potential.
Complying with waste management
regulations.
Complying with regulations and guidelines
on soil conservation such as those provided
by land use plan, ecosystem management
plans and those gazetted by the Agriculture
and Food Authority.
Supporting other soil conservation and
management strategies in the NEC.
Completing erosion modelling studies at the
project level and taking necessary action
according to those studies.
Monitoring soil quality in the target areas of
the NEC Projects.
Amount of soil erosion
loss per year.
Concentration of
pollutants in the soil in
the project target areas
(Soil quality).
MoTI
NEMA
AFA
County
Governments
NEC Projects’
Implementing
Agencies
Short

ENVIRONMENTAL RESOURCES MANAGEMENT JST/MOTI
11-7
Impact Impact
Significance
SEA Mitigation Measure Key Indicator Institutions
Involved
Approximate
timeframe (short,
medium, long
term)
Impacts on
Hydrology and
Hydrogeology
Moderate
(negative)
Avoiding wetlands, water towers,
groundwater conservation areas and flood
plains (see Chapter 5 and Annex D).
Implementing water ingress management
measures as appropriate at the project level.
Controlling run-off from infrastructure and
using sustainable drainage systems (SUDS)
which mimic or allow natural percolation of
water.
Supporting Integrated Water Resource
Management Strategies.
Monitoring water quality in water bodies
that could be affected by the NEC.
Concentration of
pollutants in water
resources (water
quality).
Ratio of composite area
of water bodies in the
NEC.
Prevalence rates of
morbidity causes linked
to water pollution.
MoTI
NEMA
WRA
KFS
KWTA
County
Governments
NEC Projects’
Implementing
Agencies
Short
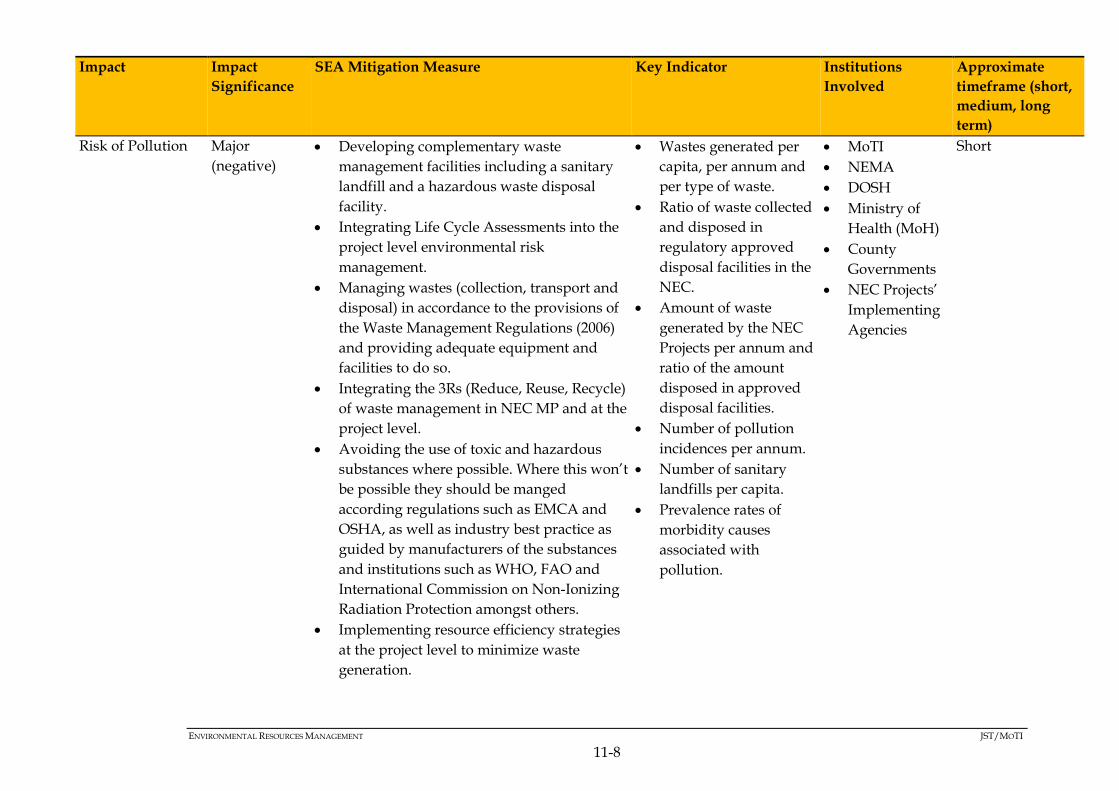
ENVIRONMENTAL RESOURCES MANAGEMENT JST/MOTI
11-8
Impact Impact
Significance
SEA Mitigation Measure Key Indicator Institutions
Involved
Approximate
timeframe (short,
medium, long
term)
Risk of Pollution Major
(negative)
Developing complementary waste
management facilities including a sanitary
landfill and a hazardous waste disposal
facility.
Integrating Life Cycle Assessments into the
project level environmental risk
management.
Managing wastes (collection, transport and
disposal) in accordance to the provisions of
the Waste Management Regulations (2006)
and providing adequate equipment and
facilities to do so.
Integrating the 3Rs (Reduce, Reuse, Recycle)
of waste management in NEC MP and at the
project level.
Avoiding the use of toxic and hazardous
substances where possible. Where this won’t
be possible they should be manged
according regulations such as EMCA and
OSHA, as well as industry best practice as
guided by manufacturers of the substances
and institutions such as WHO, FAO and
International Commission on Non-Ionizing
Radiation Protection amongst others.
Implementing resource efficiency strategies
at the project level to minimize waste
generation.
Wastes generated per
capita, per annum and
per type of waste.
Ratio of waste collected
and disposed in
regulatory approved
disposal facilities in the
NEC.
Amount of waste
generated by the NEC
Projects per annum and
ratio of the amount
disposed in approved
disposal facilities.
Number of pollution
incidences per annum.
Number of sanitary
landfills per capita.
Prevalence rates of
morbidity causes
associated with
pollution.
MoTI
NEMA
DOSH
Ministry of
Health (MoH)
County
Governments
NEC Projects’
Implementing
Agencies
Short

ENVIRONMENTAL RESOURCES MANAGEMENT JST/MOTI
11-9
Impact Impact
Significance
SEA Mitigation Measure Key Indicator Institutions
Involved
Approximate
timeframe (short,
medium, long
term)
Natural Resource
Demand
Major
(negative)
Integrating Life Cycle Assessment into the
project level environmental risk
management.
Complying with regulations governing
resource extraction such as Forests Act
(2005), EMCA (2014), Sand Harvesting
Guidelines (2009), Water Resource
Management Rules (2006) and Water Act
(2014) amongst others.
Adopting sustainability standards at the
project level such as those pertaining to
green building and energy efficiency
(LEED).
Ensuring building materials are sourced
from sustainable sources.
Implementing demand management and
resource efficiency measures for water,
electricity and materials.
Total energy demand of
the NEC Projects per
annum.
Ratio of energy
obtained from
sustainable sources.
Number of
transgressions related
to resource extraction
regulations.
MoTI
NEMA
NEC Projects’
Implementing
Agencies
County
Governments
Ministry of
Energy and
Petroleum
WRA
Ministry of
Mining
Short

ENVIRONMENTAL RESOURCES MANAGEMENT JST/MOTI
11-10
Impact Impact
Significance
SEA Mitigation Measure Key Indicator Institutions
Involved
Approximate
timeframe (short,
medium, long
term)
Loss of Cultural
Heritage
Major
(negative)
The presence of cultural heritage should be
considered as part of the site selection
process for all potential developments in the
NEC and a framework for the site selection
process should be included in the Plan as
part of a Cultural Heritage Management
Plan.
Incorporation of heritage sites into tourism
master plans as a way of preserving such
sites
Confirm presence of heritage assets through
detailed studies
ESIAs to include consideration of cultural
heritage and the development of
appropriate mitigation and management
plans.
In terms of locally important cultural
heritage sites, any loss or alteration to such
sites should be consulted on, and agreed,
with the local communities and the
custodians of the site. If necessary,
appropriate rituals should be undertaken to
move the cultural asset, or to otherwise
expiate disturbance or loss of the site
Development of a
cultural heritage
management plan
including a chance
finds procedure
ESIAs (developed to
World Bank/IFC
environmental and
social standards)
including consideration
of cultural heritage.
Reports detailing
approach to managing
locally important
cultural heritage and
agreements with the
owners of these sites
over change in use.
NMK
MoTI
NEMA
Project
Developers
County
Government
Long term
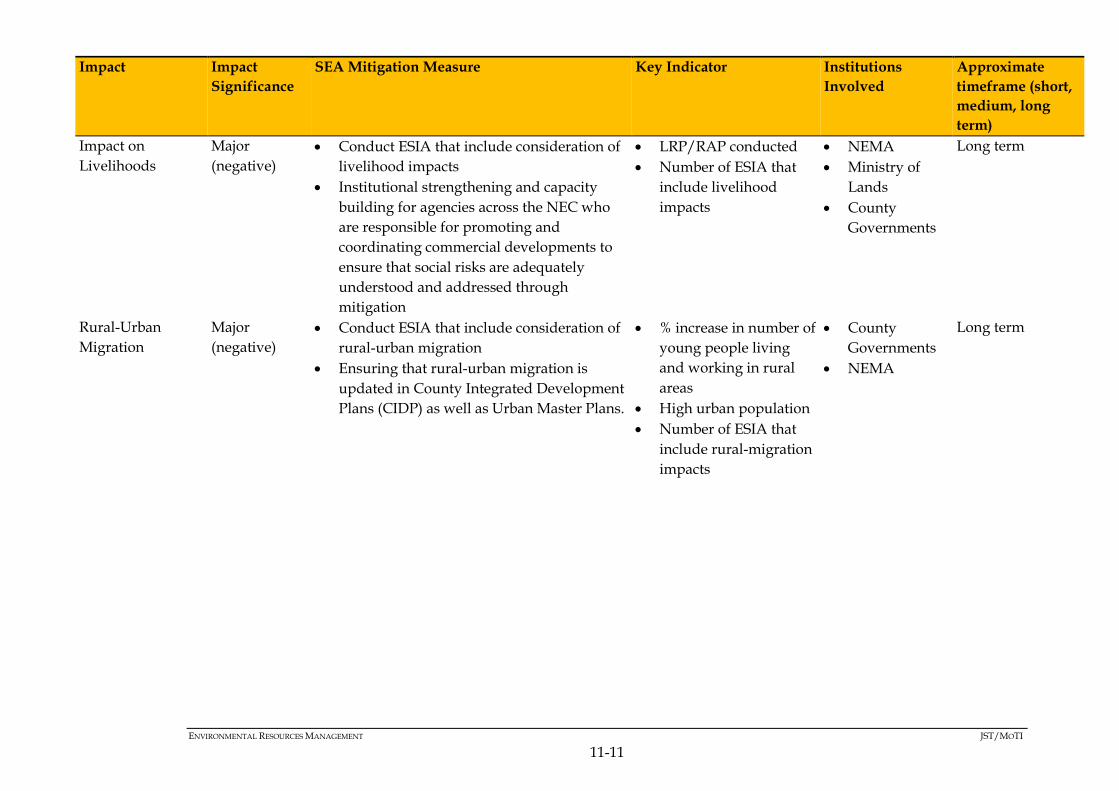
ENVIRONMENTAL RESOURCES MANAGEMENT JST/MOTI
11-11
Impact Impact
Significance
SEA Mitigation Measure Key Indicator Institutions
Involved
Approximate
timeframe (short,
medium, long
term)
Impact on
Livelihoods
Major
(negative)
Conduct ESIA that include consideration of
livelihood impacts
Institutional strengthening and capacity
building for agencies across the NEC who
are responsible for promoting and
coordinating commercial developments to
ensure that social risks are adequately
understood and addressed through
mitigation
LRP/RAP conducted
Number of ESIA that
include livelihood
impacts
NEMA
Ministry of
Lands
County
Governments
Long term
Rural-Urban
Migration
Major
(negative)
Conduct ESIA that include consideration of
rural-urban migration
Ensuring that rural-urban migration is
updated in County Integrated Development
Plans (CIDP) as well as Urban Master Plans.
% increase in number of
young people living
and working in rural
areas
High urban population
Number of ESIA that
include rural-migration
impacts
County
Governments
NEMA
Long term

ENVIRONMENTAL RESOURCES MANAGEMENT JST/MOTI
11-12
Impact Impact
Significance
SEA Mitigation Measure Key Indicator Institutions
Involved
Approximate
timeframe (short,
medium, long
term)
Public Health Minor
(negative)
Conduct ESIA that include consideration of
health impacts
Develop and implementation of
HIV/AIDS/malaria policies and
information documents for all workers
directly related NEC projects
Working in conjunction with relevant
partners (eg health authorities, NGOs,
development agencies), information,
education and communication campaigns
around diseases and health practices should
be developed as part of Plan,
implementation.
Number of ESIA that
include health impacts
Number of NEC
projects that have
HIV/AIDS/malaria
policies
Number of NEC
projects that have
worker code of conduct
Ministry of
Health
NEMA
County
Government
Local NGOs
and
development
agencies
Long term
Insecurity Minor
(negative)
Capacity building for security agencies Number of security
workers trained and
number equipment
Ministry of
Interior and
Coordination
of National
Government.
Long term
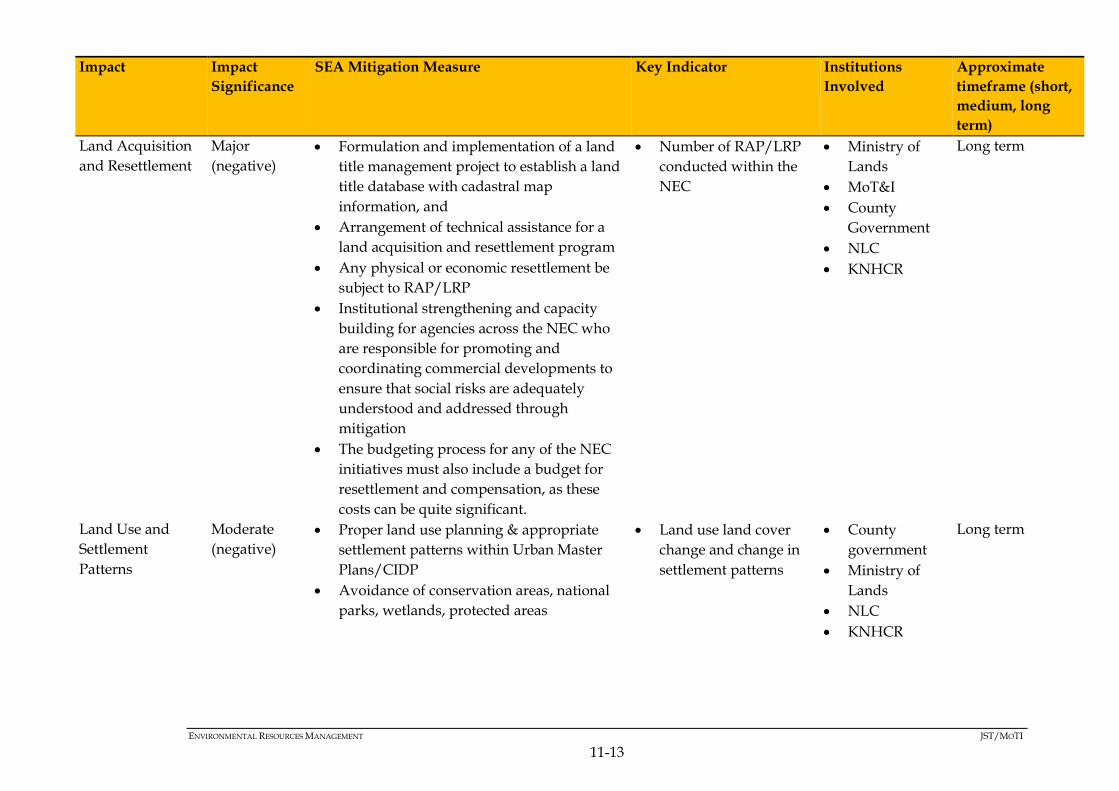
ENVIRONMENTAL RESOURCES MANAGEMENT JST/MOTI
11-13
Impact Impact
Significance
SEA Mitigation Measure Key Indicator Institutions
Involved
Approximate
timeframe (short,
medium, long
term)
Land Acquisition
and Resettlement
Major
(negative)
Formulation and implementation of a land
title management project to establish a land
title database with cadastral map
information, and
Arrangement of technical assistance for a
land acquisition and resettlement program
Any physical or economic resettlement be
subject to RAP/LRP
Institutional strengthening and capacity
building for agencies across the NEC who
are responsible for promoting and
coordinating commercial developments to
ensure that social risks are adequately
understood and addressed through
mitigation
The budgeting process for any of the NEC
initiatives must also include a budget for
resettlement and compensation, as these
costs can be quite significant.
Number of RAP/LRP
conducted within the
NEC
Ministry of
Lands
MoT&I
County
Government
NLC
KNHCR
Long term
Land Use and
Settlement
Patterns
Moderate
(negative)
Proper land use planning & appropriate
settlement patterns within Urban Master
Plans/CIDP
Avoidance of conservation areas, national
parks, wetlands, protected areas
Land use land cover
change and change in
settlement patterns
County
government
Ministry of
Lands
NLC
KNHCR
Long term
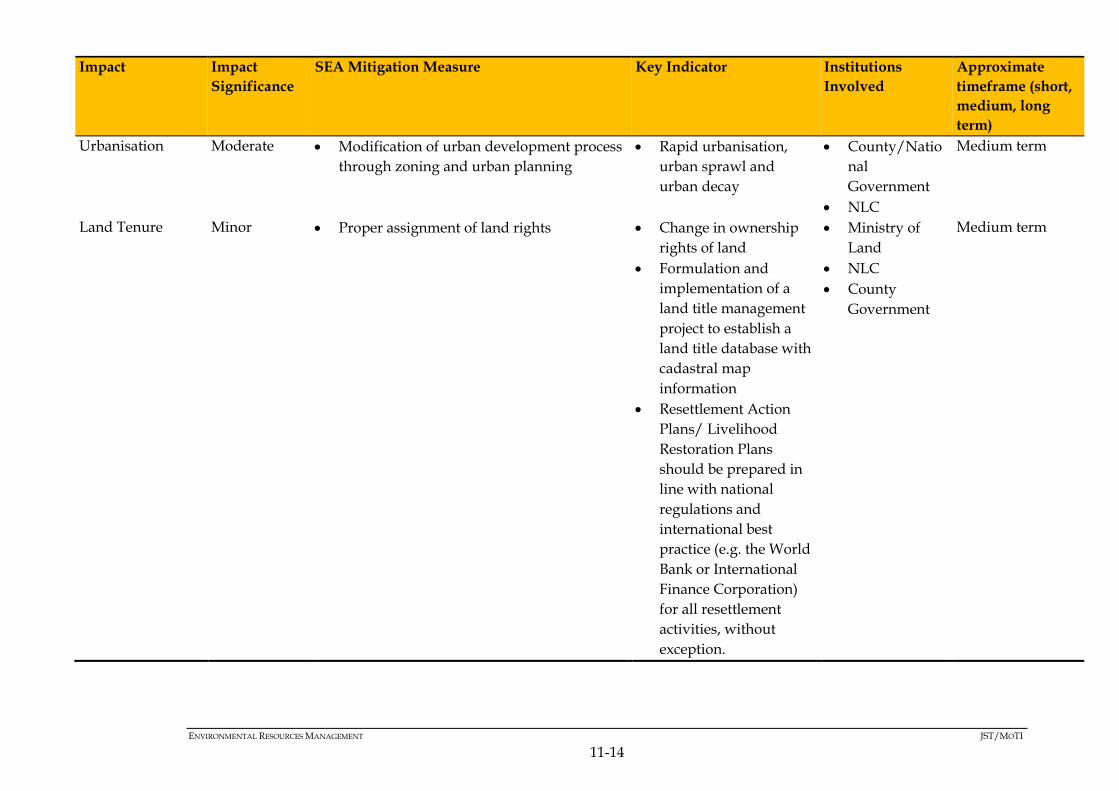
ENVIRONMENTAL RESOURCES MANAGEMENT JST/MOTI
11-14
Impact Impact
Significance
SEA Mitigation Measure Key Indicator Institutions
Involved
Approximate
timeframe (short,
medium, long
term)
Urbanisation Moderate Modification of urban development process
through zoning and urban planning
Rapid urbanisation,
urban sprawl and
urban decay
County/Natio
nal
Government
NLC
Medium term
Land Tenure Minor Proper assignment of land rights
Change in ownership
rights of land
Formulation and
implementation of a
land title management
project to establish a
land title database with
cadastral map
information
Resettlement Action
Plans/ Livelihood
Restoration Plans
should be prepared in
line with national
regulations and
international best
practice (e.g. the World
Bank or International
Finance Corporation)
for all resettlement
activities, without
exception.
Ministry of
Land
NLC
County
Government
Medium term

ENVIRONMENTAL RESOURCES MANAGEMENT JST/MOTI
11-15
11.3 ORGANISATIONAL AND POLICY STRATEGY
11.3.1 Regional Coordination for Logistics Improvement
As per JST’s (2016) recommendation, the organisational and regulatory framework for logistics and multi-modal transportation needs to be established at the regional level. So far, regional coordination for planning and monitoring of the NEC in
both Kenya and Uganda has been carried out by the Northern Corridor
Transit and Transport Coordination Authority (NCTTCA), while
regional coordination mechanisms and private sector involvement has
been developed through the Northern Corridor Integration Projects
(NCIP).
Figure 11.1 below illustrates a potential national and regional
institutional framework for both logistics promotion and multimodal
transport.
Figure 11.1 Proposed Institutional Framework for Logistics Promotion and
Multimodal Transport
Source: JST 2016
11.3.2 Proposed Organisational Framework
If the Master Plan is approves and implementation commences, there
must be a monitoring and evaluation mechanism. JST (2016)
recommend that under the initiative of MoTI, a taskforce be established
to cover the various ministries and agencies in charge of transport,
finance, trade, industry, agriculture, mining, energy, water as well as
the private sector and NCTTCA. It is recommended that the taskforce
be maintained after the JICA study as a further monitoring and
implementation mechanism (see Figure 11.2).
It is however recommended, that for this taskforce to be effective, it
would have to be bestowed with an appropriate mandate, be
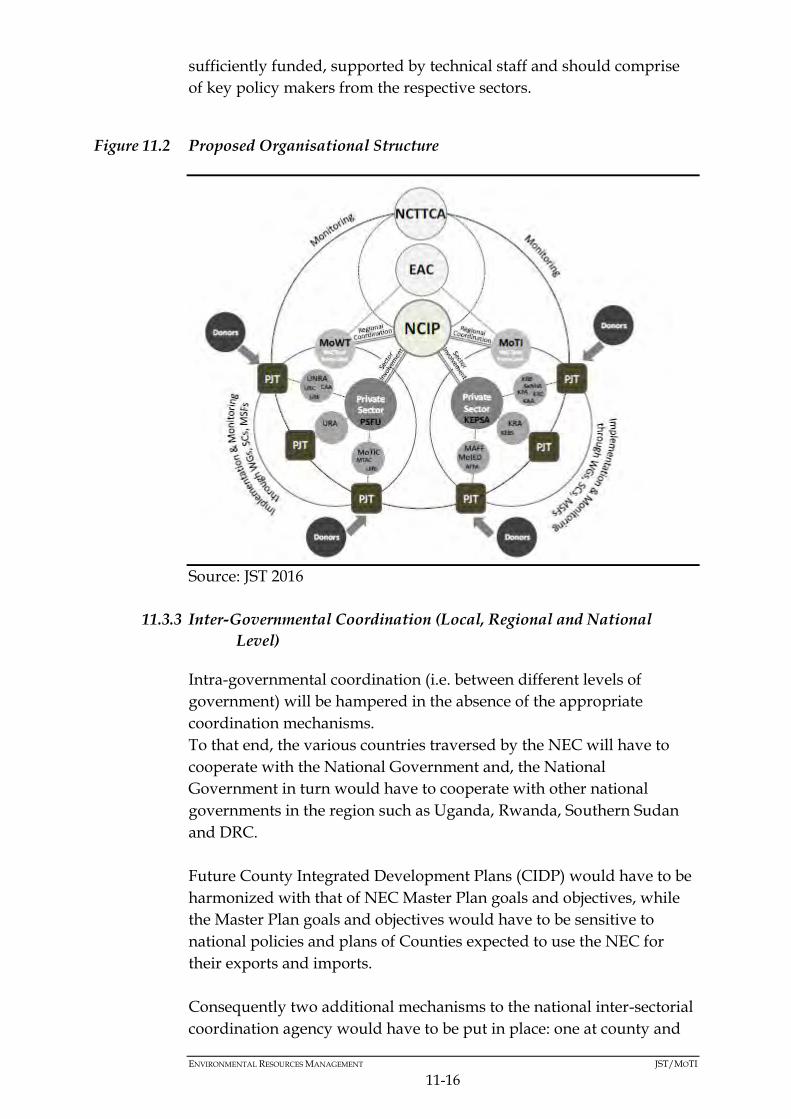
ENVIRONMENTAL RESOURCES MANAGEMENT JST/MOTI
11-16
sufficiently funded, supported by technical staff and should comprise
of key policy makers from the respective sectors.
Figure 11.2 Proposed Organisational Structure
Source: JST 2016
11.3.3 Inter-Governmental Coordination (Local, Regional and National
Level)
Intra-governmental coordination (i.e. between different levels of
government) will be hampered in the absence of the appropriate
coordination mechanisms.
To that end, the various countries traversed by the NEC will have to
cooperate with the National Government and, the National
Government in turn would have to cooperate with other national
governments in the region such as Uganda, Rwanda, Southern Sudan
and DRC.
Future County Integrated Development Plans (CIDP) would have to be
harmonized with that of NEC Master Plan goals and objectives, while
the Master Plan goals and objectives would have to be sensitive to
national policies and plans of Counties expected to use the NEC for
their exports and imports.
Consequently two additional mechanisms to the national inter-sectorial
coordination agency would have to be put in place: one at county and

ENVIRONMENTAL RESOURCES MANAGEMENT JST/MOTI
11-17
the other at regional levels to coordinate implementation of Master
Plan.

ENVIRONMENTAL RESOURCES MANAGEMENT JST/MOTI
12-1
12 CONCLUSION AND RECOMMENDATIONS
12.1 INTRODUCTION
This SEA Report is an independent assessment submitted to the
National Environment Management Authority (NEMA), to enable the
Authority to make an informed decision in accordance with the
Environmental Management and Coordination Act, 1999 (EMCA) as
well as the National Guidelines for SEA in Kenya (2012).
Through the SEA process, which included various stakeholder input,
ERM has identified and assessed a number of potential impacts relating
to the NEC Master Plan. This Chapter therefore provides an overview of
the SEA findings and makes recommendations regarding key
mitigation measures.
The potential impacts associated with the Master Plan are summarised
below and should be considered both in the context of the Master Plan
rationale as well as in the discussion of cumulative impacts.
12.2 CONCLUSION
12.2.1 Environmental and Social Sensitive Features
This SEA study identifies environmental and social sensitive features as
constraints and classed them into three categories, representative of
their sensitivity or mitigation requirement. These are low, moderate
and high constraints in order of increasing sensitivity.
Table 12.1 and Table 12.2 provide a summary listing of the specific
features comprising each environmental and socio-economic constraint
category respectively.

ENVIRONMENTAL RESOURCES MANAGEMENT JST/MOTI
12-2
Table 12.1 Summary of Environmental Constraints
Subject Low Moderate High
Physical Faults
Mountains and
Extinct/Inactive Volcanoes
Seismic Zones/Epicentres of
Past Earthquakes
Active Volcanoes
Lakes
Flood Prone Areas
(Flood plains)
Soil Erosion Prone
Areas
Rift Valley Crossings
Water production areas
Rivers
Groundwater Conservation Areas
Biological Private Reserves and Ranches
Community Conservancies
Endemic Bird Areas
Eastern Afromontane
Biodiversity Hotspots
Terrestrial Key Biodiversity
Areas (Mau Narok-Molo
Grasslands and Kinangop
Grasslands)
Transboundary Resources
(Lake Victoria Catchment and
The Western Indian Ocean)
Wetlands
National Parks
(Chyulu Hills,
Longonot, Ol Doinyo
Sabuk and Tsavo East)
National Reserves
(Ngai Ndethya Game
Reserve, Kakamega
and Kerio Valley)
Marine National
Reserves
Wildlife Sanctuary
(Mwaluganje Elephant
Sanctuary)
Forest Reserves
(Coastal Zone (East
African Coastal
Forests), Eastern
Region, North Rift
Valley and Western
Region Forests)
Nature Reserves
Locally Managed
Ramsar Sites
UNESCO World Heritage Sites
UNESCO Man and Biosphere Reserves
National Parks (Aberdares, Hell's Gate, Lake
Nakuru, Mount Elgon, Nairobi and Tsavo
West)
National Reserves (Shimba Hills and Lake
Bogoria)
Marine National Parks
Wildlife Sanctuaries (Taita Hills Wildlife
Sanctuary and Ngulia Rhino Sanctuary)
Forest Reserves (Nairobi Region, Kikuyu
Escarpment, Aberdares Ecosystem, Mau
Escarpment (Mau Forest Complex) and
Cherangani Hills Forests)
Important Bird Areas
Alliance for Zero Extinction Sites
Eastern Afromontane Biodiversity Hotspot
Terrestrial Key Biodiversity Areas (Lake
Bogoria NR, Aberdare Mountains, Kikuyu
Escarpment Forest, Mau Forest Complex, Taita
Hills Forests, Cherangani Hills, South Nandi
Forest, Lake Ol' Bolossat, Chyulu Hills and

ENVIRONMENTAL RESOURCES MANAGEMENT JST/MOTI
12-3
Subject Low Moderate High
Marine Areas
Eastern Afromontane
Biodiversity Hotspot
Terrestrial Key
Biodiversity Areas
(Mukurweini Valleys)
Eastern Afromontane
Biodiversity Hotspot
Biodiversity Corridors
Sandy Beaches
Mount Elgon (Kenya))
Eastern Afromontane Biodiversity Hotspots
Freshwater Key Biodiversity Areas
Mangrove Forests
Coral Reef
Sea Turtle Nesting Sites
Transboundary Resources (Mt Elgon
Ecosystem, Sio-Siteko Wetland and Tsavo
West-Mkomazi Ecosystem)
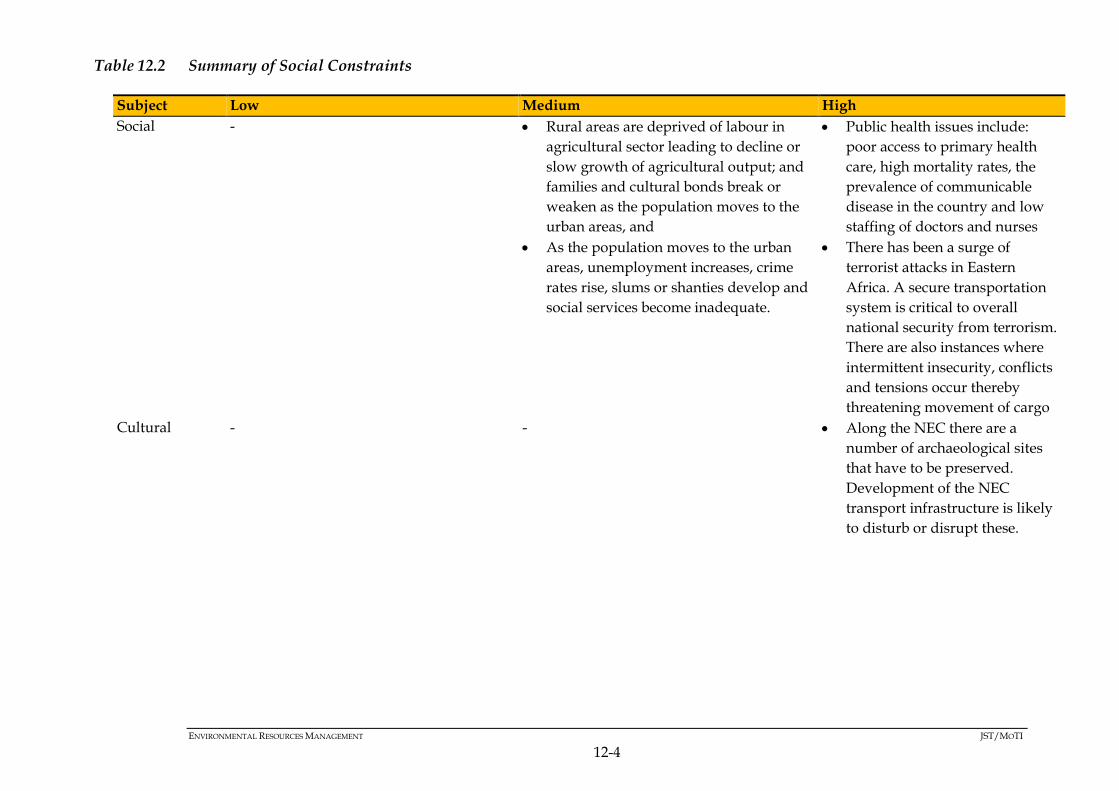
ENVIRONMENTAL RESOURCES MANAGEMENT JST/MOTI
12-4
Table 12.2 Summary of Social Constraints
Subject Low Medium High
Social - Rural areas are deprived of labour in
agricultural sector leading to decline or
slow growth of agricultural output; and
families and cultural bonds break or
weaken as the population moves to the
urban areas, and
As the population moves to the urban
areas, unemployment increases, crime
rates rise, slums or shanties develop and
social services become inadequate.
Public health issues include:
poor access to primary health
care, high mortality rates, the
prevalence of communicable
disease in the country and low
staffing of doctors and nurses
There has been a surge of
terrorist attacks in Eastern
Africa. A secure transportation
system is critical to overall
national security from terrorism.
There are also instances where
intermittent insecurity, conflicts
and tensions occur thereby
threatening movement of cargo
Cultural - - Along the NEC there are a
number of archaeological sites
that have to be preserved.
Development of the NEC
transport infrastructure is likely
to disturb or disrupt these.
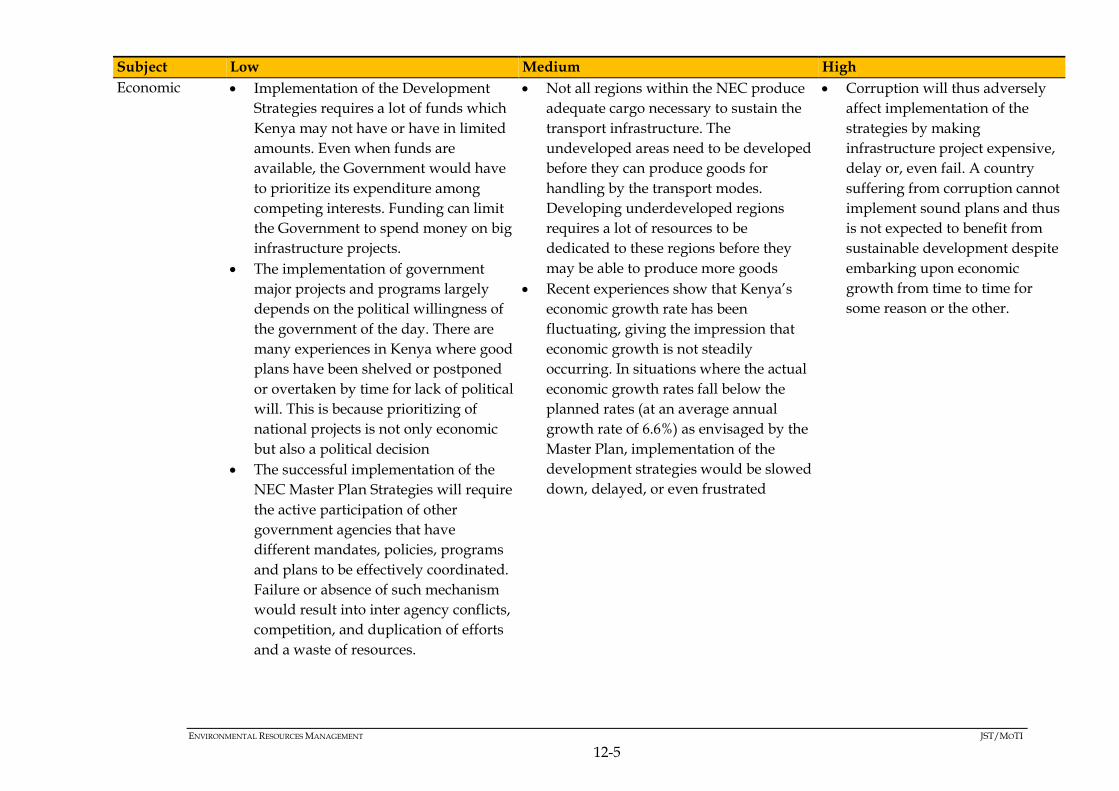
ENVIRONMENTAL RESOURCES MANAGEMENT JST/MOTI
12-5
Subject Low Medium High
Economic Implementation of the Development
Strategies requires a lot of funds which
Kenya may not have or have in limited
amounts. Even when funds are
available, the Government would have
to prioritize its expenditure among
competing interests. Funding can limit
the Government to spend money on big
infrastructure projects.
The implementation of government
major projects and programs largely
depends on the political willingness of
the government of the day. There are
many experiences in Kenya where good
plans have been shelved or postponed
or overtaken by time for lack of political
will. This is because prioritizing of
national projects is not only economic
but also a political decision
The successful implementation of the
NEC Master Plan Strategies will require
the active participation of other
government agencies that have
different mandates, policies, programs
and plans to be effectively coordinated.
Failure or absence of such mechanism
would result into inter agency conflicts,
competition, and duplication of efforts
and a waste of resources.
Not all regions within the NEC produce
adequate cargo necessary to sustain the
transport infrastructure. The
undeveloped areas need to be developed
before they can produce goods for
handling by the transport modes.
Developing underdeveloped regions
requires a lot of resources to be
dedicated to these regions before they
may be able to produce more goods
Recent experiences show that Kenya’s
economic growth rate has been
fluctuating, giving the impression that
economic growth is not steadily
occurring. In situations where the actual
economic growth rates fall below the
planned rates (at an average annual
growth rate of 6.6%) as envisaged by the
Master Plan, implementation of the
development strategies would be slowed
down, delayed, or even frustrated
Corruption will thus adversely
affect implementation of the
strategies by making
infrastructure project expensive,
delay or, even fail. A country
suffering from corruption cannot
implement sound plans and thus
is not expected to benefit from
sustainable development despite
embarking upon economic
growth from time to time for
some reason or the other.

ENVIRONMENTAL RESOURCES MANAGEMENT JST/MOTI
12-6
Subject Low Medium High
Urban/Physical
Planning
- Urbanization will encourage rapid
inflows of rural populations to urban
areas that give rise to housing problems
and the development of slums. An
increase in urban areas will therefore put
pressure on existing water and sanitation
facilities and potentially result in
environmental pollution, as well as
increased unemployment in urban areas
Implementing the Master Plan
Development Strategies could result in
land use conflicts.
Use of certain areas/parcels of land to
implement the Development Strategies
will need trade-off with other existing
and potential uses e.g. developing
transport infrastructure in certain
sections of the NEC would require
converting agricultural and conservation
land for such a purpose.
In sections where conversions are
resisted, land use conflicts and litigations
may occur which can delay and increase
the cost of a project
Resettlement and compensation
will be highest in Nairobi and
Mombasa Counties and
speculation may drive the land
prices even higher
ENVIRONMENTAL RESOURCES MANAGEMENT JST/MOTI
12-7
12.2.2 Key Impacts and Mitigation Measures
Table 12.3 below provides a summary of the key environmental and
social impacts as well as mitigation measures identified during the SEA
Study.

ENVIRONMENTAL RESOURCES MANAGEMENT JST/MOTI
12-8
Table 12.3 Key Environmental and Social Impacts and Mitigation Measures
Impacts Mitigation Measure
Environmental
Habitat Alteration and
Biodiversity Impacts
Avoiding Protected Areas,
Aligning new infrastructure with existing RoWs or defined corridors,
Limiting the size of construction RoWs where possible, and
Complying with existing land use and PA management plans
Air Emissions Complying with the Air Quality Regulations (2014) and emission standards as provided in
KS 1515,
Using cleaner energy sources and promoting their use,
Limiting land conversion to only necessary areas, and
Managing wastes according to regulations in addition to employing the 3Rs to ensure they
are managed sustainably.
Landscape Modification Locating infrastructure with existing land use plans,
Complying with ecosystem management plans of protected areas,
Limiting the size of construction RoWs, and
Avoiding protected areas and settlements
Soil Limiting excavations to only necessary areas,
Implementing soil conservation strategies in areas with high Soil Erosion Potential,
Complying with waste management regulations,
Complying with regulations and guidelines on soil conservation such as those provided by
land use plan, ecosystem management plans and those gazetted by the Agriculture and
Food Authority, and
Implementing run-off and water management measures
Hydrology and Hydrogeology Avoiding wetlands, water towers, groundwater conservation areas and flood plains,
Implementing water ingress management measures as appropriate, and
Controlling run-off from infrastructure and implementing sustainable drainage systems
(SUDS) which mimic or allow natural percolation of water.
Pollution Developing complementary waste management facilities including a sanitary landfill and a
hazardous waste disposal facility,

ENVIRONMENTAL RESOURCES MANAGEMENT JST/MOTI
12-9
Impacts Mitigation Measure
Integrating Life Cycle Assessments into the project level environmental risk management,
Managing wastes (collection, transport and disposal) in accordance to the provisions of the
Waste Management Regulations (2006) and providing adequate equipment and facilities to
do so, and
Integrating the 3Rs (Reduce, Reuse, Recycle) of waste management in NEC MP and at the
project level.
Natural Resource Demand Integrating Life Cycle Assessment into the project level environmental risk management,
Complying with regulations governing resource extraction such as Forests Act (2005),
EMCA (2014), Sand Harvesting Guidelines (2009), Water Resource Management Rules
(2006) and Water Act (2014) amongst others,
Adopting sustainability standards at the project level such as those pertaining to green
building and energy efficiency (LEED),
Ensuring building materials are sourced from sustainable sources, and
Implementing demand management and resource efficiency measures for water, electricity
and materials.
Accidents Complying with industry guidelines and regulations in the design of infrastructure,
Implementing and supporting programs to ensure vehicles and crafts are maintained to
regulatory approved standards,
Implementing and supporting programs that ensure drivers and pilots are adequately
trained to operate their respective vehicles and crafts,
Implementing and supporting programs aimed at raising public awareness in the pertinent
industries, and
Developing project level emergency/disaster preparedness and response plans.
Spills Developing project level emergency/disaster preparedness and response plans as well as
spill contingency plans and providing resources to respond to spills,
Complying with the National Oil Spill Response Plan by integrating its provisions to any
project level contingency plans,
Implementing and supporting monitoring programs at the project level,
Providing training to project staff on spill prevention and management, and
Adhering to industry guidelines on the design and maintenance of any fluid storage,
loading and conveyance equipment and infrastructure.

ENVIRONMENTAL RESOURCES MANAGEMENT JST/MOTI
12-10
Impacts Mitigation Measure
Natural Hazard Avoiding construction in flood plains in line with industry guidelines,
Integrating considerations for seismicity in the engineering design of infrastructure in
seismically active areas,
Complying with industry guidelines for the design and maintenance of dams such as those
published by the International Commission for Large Dams (ICOLD),
Avoidance of fault zones,
Incorporating landslide prevention measures for any construction in landslide prone areas,
Implementing and supporting disaster/emergency preparedness and response plans and
programs at the project level,
Implementing and supporting programs aimed at raising personnel and public awareness
on potential hazards, and
Integrating the provisions of the National Disaster Response Plan into project level
disaster/emergency preparedness and response plans, and coordinating with the pertinent
authorities.
Socio-Economic
Loss of Cultural Heritage The presence of cultural heritage assets would need to be confirmed in detailed studies
associated with each potential project; this could influence the design and location of
infrastructure, commercial enterprises and industrial facilities.
Incorporation of heritage sites into tourism master plans as a way of preserving such sites
Projects associated with the construction and operation of infrastructure should be subject
to Environmental and Social Impact Assessment (ESIA) commensurate with the scale of the
project and impacts which includes consideration of cultural heritage and the development
of appropriate mitigation and management plans.
In terms of locally important cultural heritage sites, any loss or alteration to such sites
should be consulted on, and agreed, with the local communities and the custodians of the
site. If necessary, appropriate rituals should be undertaken to move the cultural asset, or to
otherwise expiate disturbance or loss of the site.
A framework “chance finds procedure” should be developed to support the Master Plan
which involves and references all relevant ministries, other agencies and major cultural
heritage stakeholders in the country. The framework procedure should be deployed within
the construction and management planning for all developments implemented under the

ENVIRONMENTAL RESOURCES MANAGEMENT JST/MOTI
12-11
Impacts Mitigation Measure
auspices of the Plan.
Livelihood Institutional strengthening and capacity building for agencies across the NEC who are
responsible for promoting and coordinating commercial developments to ensure that social
risks are adequately understood and addressed through mitigation
Rural Urban Migration Infrastructure projects should be subject to Environmental and Social Impact Assessment
(ESIA) undertaken in line with international standards such as those of the World Bank or
the International Finance Corporation (IFC). The scope of the ESIA should always include
consideration of rural – urban migration.
Urban development plans / CIDP should also cater for rural-urban migration.
Public Health Infrastructure projects should be subject to Environmental and Social Impact Assessment
(ESIA) undertaken in line with international standards such as those of the World Bank or
the International Finance Corporation (IFC). The scope of the ESIA should always include
consideration of health related impacts. For large Projects this may require that
appropriately qualified international experts are appointed to address impacts on health.
The development and implementation of HIV/AIDS/malaria policies and information
documents for all workers directly related NEC projects. The information document will
address factual health issues as well as behaviour change issues around the transmission
and infection of HIV/AIDS as well as malaria.
All projects should have a Worker Code of Conduct for all project personnel that include
guidelines on worker-worker interactions, worker-community interactions and
development of personal relationships with members of the local communities. As part of
the Worker Code of Conduct, all project personnel should be prohibited from engaging in
illegal activities including the use of commercial sex workers and transactional sex.
Anyone caught engaging in illegal activities will be subject to disciplinary proceedings. If
workers are found to be in contravention of the Code of Conduct, which they will be
required to sign at the commencement of their contract, they will face disciplinary
procedures that could result in dismissal.
Working in conjunction with relevant partners (eg health authorities, NGOs, development
agencies), information, education and communication campaigns around diseases and
health practices should be developed as part of the Master Plan implementation
Insecurity The successful implementation of the NEC Master Plan Strategies will require the active

ENVIRONMENTAL RESOURCES MANAGEMENT JST/MOTI
12-12
Impacts Mitigation Measure
participation of the Ministry of Interior and Coordination of National Government.
Land Acquisition and
resettlement
Formulation and implementation of a land title management project to establish a land title
database with cadastral map information, and
Arrangement of technical assistance for a land acquisition and resettlement program
Any physical and/or economic resettlement of communities should be subject to the
development of Resettlement Action Plans/ Livelihood Restoration Plans which should be
prepared in line with Kenyan regulations and international best practice as defined by the
World Bank or International Finance Corporation.
Institutional strengthening and capacity building for agencies across the NEC who are
responsible for promoting and coordinating commercial developments to ensure that social
risks are adequately understood and addressed through mitigation
The budgeting process for any of the NEC initiatives must also include a budget for
resettlement and compensation, as these costs can be quite significant.
Land use and settlement
pattern
Institutions responsible for land use plans should ensure that they contain measures
relating to infrastructure provision that are robust and fit for purpose, with a focus on the
poorest and most vulnerable communities
Avoidance of conservation areas, national parks, wetlands, protected areas
Urbanisation Any physical and/or economic resettlement of communities should be subject to the
development of Resettlement Action Plans/ Livelihood Restoration Plans which should be
prepared in line with Kenyan regulations and international best practice as defined by the
World Bank or International Finance Corporation.
Institutional strengthening and capacity building for agencies across the NEC who are
responsible for promoting and coordinating commercial developments to ensure that social
risks are adequately understood and addressed through mitigation
Regional and/or County Integrated Development Plans (CIDP) to plan for such
urbanisation
Land tenure Formulation and implementation of a land title management project to establish a land title
database with cadastral map information.

ENVIRONMENTAL RESOURCES MANAGEMENT JST/MOTI
12-13
12.3 RECOMMENDATIONS
12.3.1 Recommended PPP Changes
Intra-governmental coordination for the implementation of the NEC
(i.e. between different levels of government) will be hampered in the
absence of the appropriate coordination mechanisms.
To that end, the various countries traversed by the NEC will have to
cooperate with the National Government and, the National
Government in turn would have to cooperate with other national
governments in the region such as Uganda, Rwanda, Southern Sudan
and DRC.
Future County Integrated Development Plans (CIDP) would have to be
harmonized with that of NEC Master Plan goals and objectives, while
the Master Plan goals and objectives would have to be sensitive to
national policies and plans of Counties expected to use the NEC for
their exports and imports.
Consequently two additional mechanisms to the national inter-sectorial
coordination agency would have to be put in place: one at county and
the other at regional levels to coordinate implementation of Master
Plan.
12.3.2 Recommended Alternatives(s)
As discussed in Chapter 7, the Multi-Core with Regional Industrial
Development Type alternative aims at balanced growth and efficient
logistics in the NEC region by promoting urban functions of 18
Secondary Cites, including 6 Secondary cum Regional Production
Centres (see Figure 0.3).
This alternative promotes:
decentralizing urban functions to Secondary Cities,
the urbanization of Secondary Cities and the concentration of
population on them from surrounding regions,
regional production centres, as demand for commercial and
services in urban area (which results from surrounding regional
area) will promote the demand of Secondary Cities.
These Secondary Cities will serve as regional urban centres supplying
urban services and logistics hub connecting Regional Production

ENVIRONMENTAL RESOURCES MANAGEMENT JST/MOTI
12-14
Centres and Primary Cities as consumption areas. In this alternative,
the involvement of local Government is also essential.
It is important to note however, this structure plan requires more public
engagement and management capacity for urban management and
development control to avoid unnecessary development.
This is the preferred alternative because it is consistent with Vision
2030, the MoTI Strategic Plan and the goals of the Master Plan, which
are to improve logistics for the NEC as well as provide an integrated
regional development strategy consistent with sub-regional
development plans and national development plans.
Figure 12.1 Alternative C: Multi-Core with Regional Industrial Development Type
Source: JST, 2016
12.3.3 Subsequent Environmental and Social Impact Assessment for NEC
Projects
JST has proposed 119 projects for the development of the NEC (see
Annex C) in both Kenya and Uganda. The potential impacts of these
projects have been discussed in Chapters 9 and 10 of this Report, and
are within the following sectors:
road
railway
border posts
port, airport, and inland way
logistic hub
oil and mining
ENVIRONMENTAL RESOURCES MANAGEMENT JST/MOTI
12-15
agriculture and fishery
manufacturing
power
water
It is therefore recommended that these projects be subjected to
Environmental and Social Impact Assessments (ESIA) in order to:
identify all potentially project-specific significant adverse
environmental and social impacts of the project and recommend
measures for mitigation;
gather baseline data to inform the assessment of impacts and to
monitor changes to the environment as a result of each of the
projects as well as evaluate the success of the mitigation measures
implemented; and
recommend measures to be used to avoid or reduce the anticipated
negative impacts and enhance the positive impacts.
For each project the ESIA should be carried out in line with Kenyan
regulations as well as international best practice as defined by the
World Bank or International Finance Corporation (IFC).
The ESIA reports should also consider environmental impacts and also
include the following socio-economic impacts, where possible:
cultural heritage,
loss of livelihoods,
health, and
rural – urban migration
It is also recommended that any physical and/or economic resettlement
of communities should be subject to the development of Resettlement
Action Plans/ Livelihood Restoration Plans which should be prepared
in line with Kenyan regulations and international best practice as
defined by the World Bank or International Finance Corporation

ERM consulting services worldwide www.erm.com
ERM has 140 offices across the following
Countries worldwide
Argentina
Australia
Belgium
Brazil
Canada
China
Colombia
France
Germany
Hong Kong
Hungary
India
Indonesia
Ireland
Italy
Japan
Kazakhstan
Kenya
Malaysia
Mexico
Mozambique
ERM’s Nairobi Office 4th Floor, Landmark Office Suites
Laiboni Centre, Lenana Road, Kilimani
PO Box 100798-00101
Nairobi, Kenya
T: +254 20 493 8113/4
M: +254 71 265 0516
ERM’s Cape Town Office 2nd Floor Great Westerford
240 Main Road,
Rondebosch, 7700
Cape Town, South Africa
T:+27 (0) 21 681 5400
F:+27 (0) 21 686 0736
ERM’s Durban Office Unit 6, St Helier Office Park,
Cnr St Helier & Forbes Drive
Gillitts, 3610
Durban, South Africa
T:+27 (0) 31 767 2080
F:+27 (0) 31 764 3643
ERM’s Johannesburg Office Building 32, The Woodlands Office Park,
Woodlands Drive,
Woodmead, 2148
Johannesburg, South Africa
T:+27 (0) 11 798 4300
F:+27 (0) 11 804 2289
www.erm.com
The Netherlands
New Zealand
Panama
Peru
Poland
Portugal
Puerto Rico
Romania
Russia
Singapore
South Africa
South Korea
Spain
Sweden
Taiiwan
Thailand
United Arab
Emirates
United Kingdom
United States of
America
Vietnam