
Protection in Practice: Food Assistance with Safety and Dignity
Upload
truongkhuongCategory
view
214download
0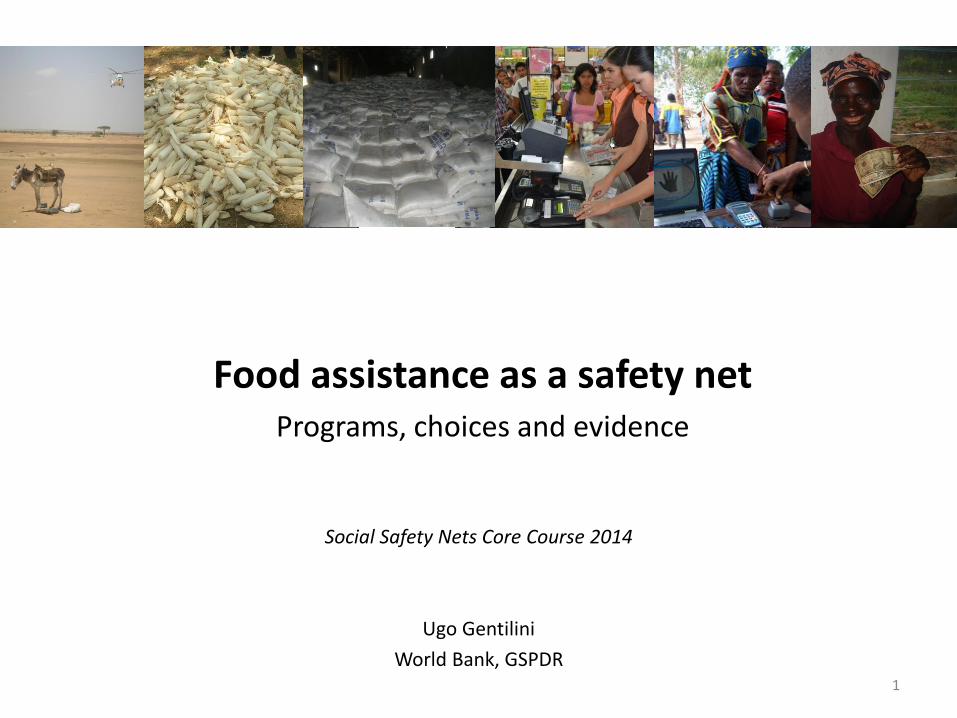
Food assistance as a safety net Programs, choices and evidence
Social Safety Nets Core Course 2014
Ugo Gentilini
World Bank, GSPDR 1

• Concepts and definitions (what is ‘food assistance’)
• Food assistance programs (what forms does it take)
• Making choices (comparing impacts and costs; issues to consider)
• Wrap-up
2

• Concepts and definitions
• Food assistance programs
• Making choices
• Wrap-up
Concepts and definitions
3
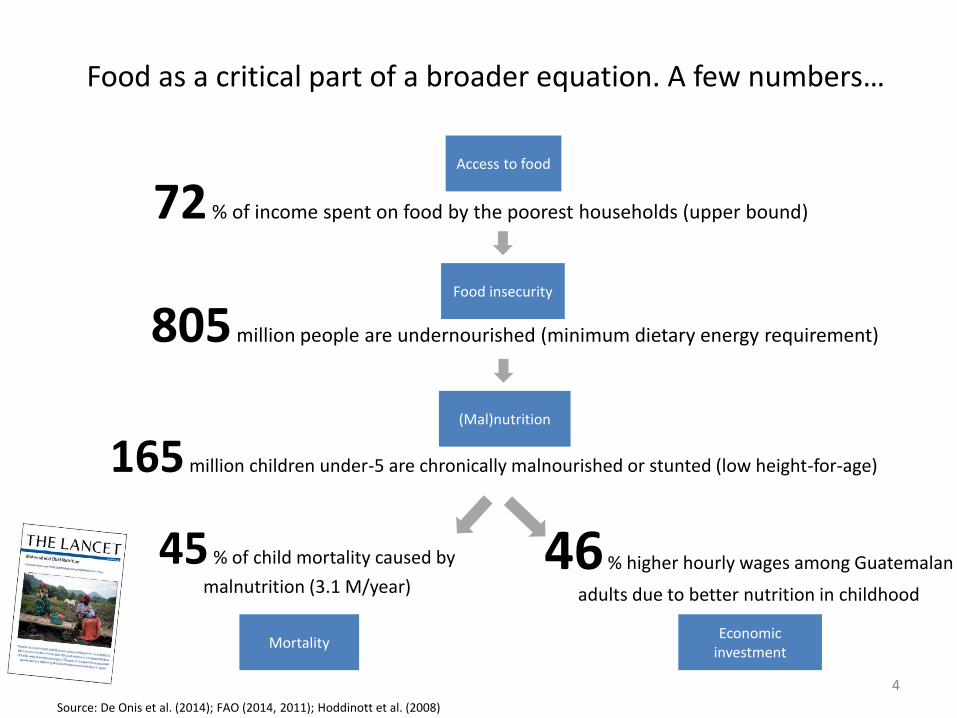
Food as a critical part of a broader equation. A few numbers…
72 % of income spent on food by the poorest households (upper bound)
Source: De Onis et al. (2014); FAO (2014, 2011); Hoddinott et al. (2008)
Access to food
Food insecurity
(Mal)nutrition
Mortality Economic
investment
46 % higher hourly wages among Guatemalan
adults due to better nutrition in childhood
45 % of child mortality caused by
malnutrition (3.1 M/year)
165 million children under-5 are chronically malnourished or stunted (low height-for-age)
805 million people are undernourished (minimum dietary energy requirement)
4
• What it includes
– Measures that “… improve access to, and consumption of, adequate, safe and nutritious food”
– Cash transfers, vouchers, food transfers (if with external assistance = ‘food aid’)
– Design devised accordingly (e.g., transfer size, M&E) • (Hint: we do not here consider large cash lump grants or similar, but transfers for an amount to
access a basic food basket + little top-up)
• Programs
– Unconditional, conditional, public works
– Formally provided by governments
– Fully or partially subsidized
Unbundling ‘food assistance’
5

Food
Procurement
Storage, handling
Distribution
Beneficiary
Provision of vouchers
Beneficiaries
Provision of cash
Beneficiaries
Vouchers Cash
Contract with shops
Transport
6
• Concepts and definitions
• Food assistance programs
• Making choices
• Wrap-up
Food assistance programs
7
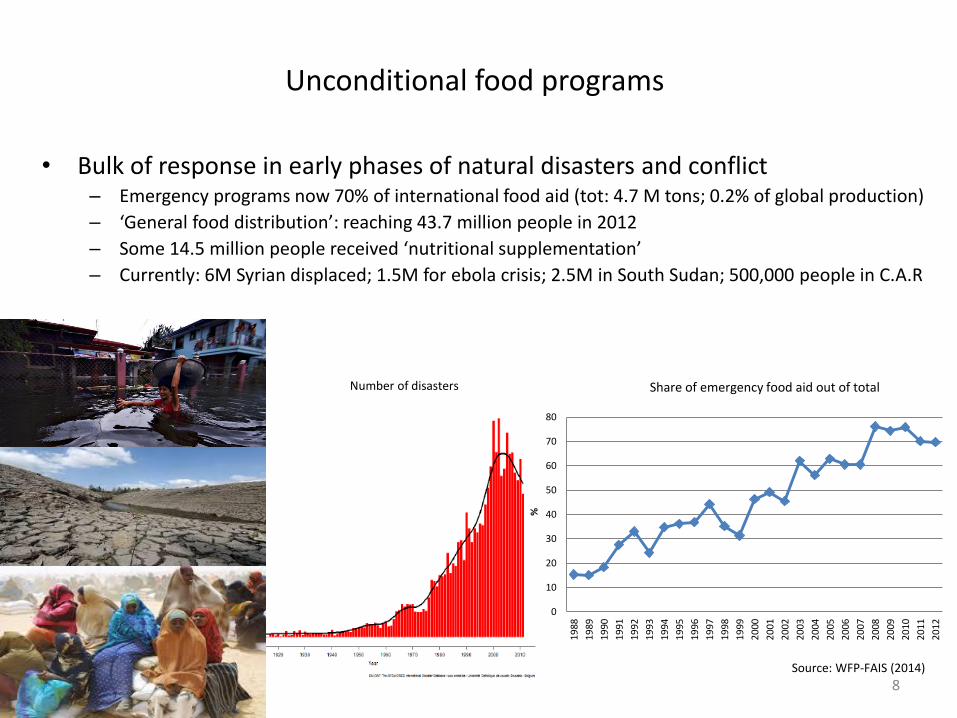
• Bulk of response in early phases of natural disasters and conflict – Emergency programs now 70% of international food aid (tot: 4.7 M tons; 0.2% of global production)
– ‘General food distribution’: reaching 43.7 million people in 2012
– Some 14.5 million people received ‘nutritional supplementation’
– Currently: 6M Syrian displaced; 1.5M for ebola crisis; 2.5M in South Sudan; 500,000 people in C.A.R
Unconditional food programs
Source: WFP-FAIS (2014)
0
10
20
30
40
50
60
70
80
19
88
19
89
19
90
19
91
19
92
19
93
19
94
19
95
19
96
19
97
19
98
19
99
20
00
20
01
20
02
20
03
20
04
20
05
20
06
20
07
20
08
20
09
20
10
20
11
20
12
%
Share of emergency food aid out of total
Number of disasters
8

• A food transfer consist of commodities of various quantity and quality – Traditional cereals, pulses and oil
– ‘Ready to Use Therapeutic Foods’, lipid-based products for treatment of severe acute malnutrition
– Costs higher for high-quality products (R&D, imported, shelf life, etc.)
Source: WFP (2014)
9

• Domestic, institutionalized programs – Specific risks in lifecycle, e.g. Chile’s PNAC (2kgs of powdered milk per month from birth
to two years of age, i.e. 8.9 M children) and PACAM (4.7 M senior, +60-70)
• Various models of ‘public distribution systems’ – Evolved from price stabilization functions to safety net programs
– Often as partially subsidized commodities
– Substantial scale: at least 850 million individuals; ~$18 billion
Country Program Beneficiaries (M) Cost ($ Bill)
India TDPS 180* 7
Iraq PDS 32 5
Mexico Diconsa 0.67* 0.37
Egypt Baladi 70 3.64
Indonesia Raskin 18.5* 1.4
*households. Source: internal work in progress, LAC SP database , ASPIRE
10
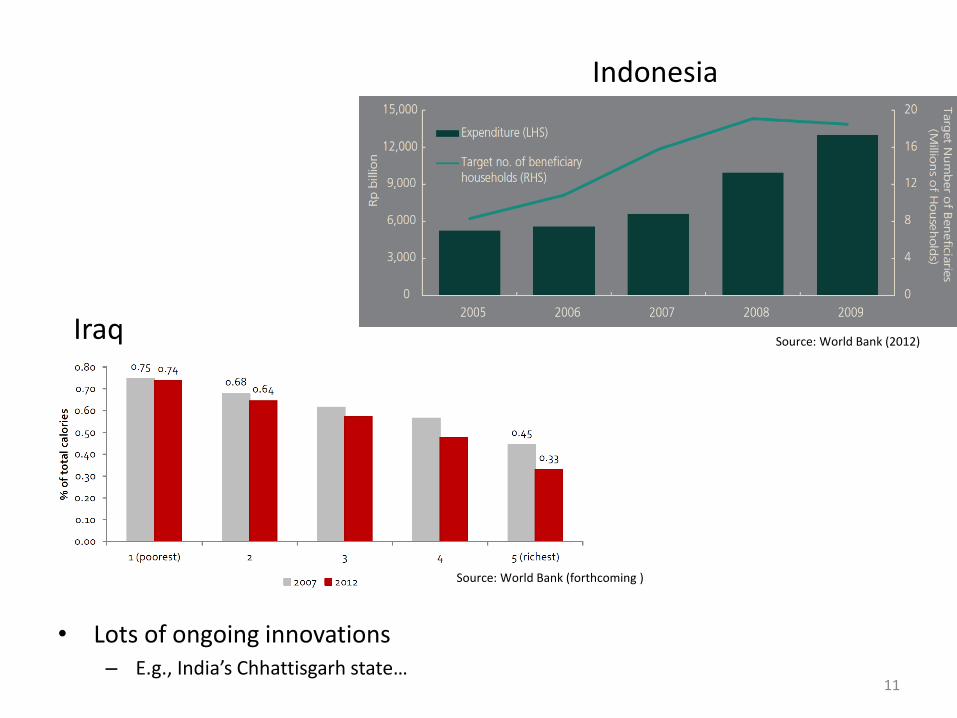
• Lots of ongoing innovations – E.g., India’s Chhattisgarh state…
Source: World Bank (2012)
Source: World Bank (forthcoming )
Indonesia
Iraq
11
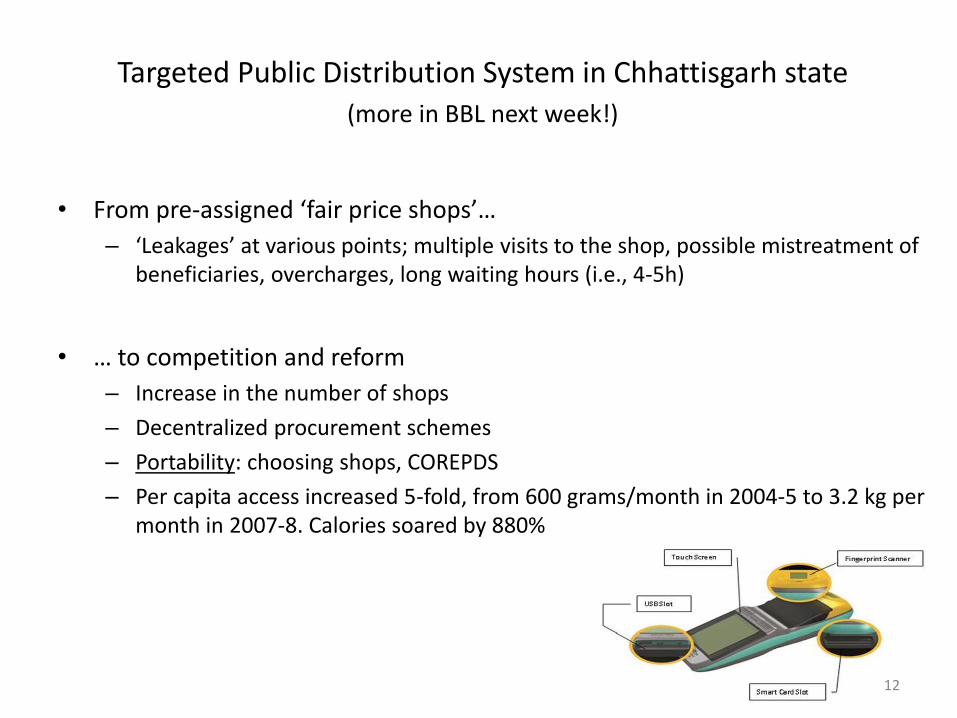
• From pre-assigned ‘fair price shops’…
– ‘Leakages’ at various points; multiple visits to the shop, possible mistreatment of beneficiaries, overcharges, long waiting hours (i.e., 4-5h)
• … to competition and reform
– Increase in the number of shops
– Decentralized procurement schemes
– Portability: choosing shops, COREPDS
– Per capita access increased 5-fold, from 600 grams/month in 2004-5 to 3.2 kg per month in 2007-8. Calories soared by 880%
Targeted Public Distribution System in Chhattisgarh state (more in BBL next week!)
12
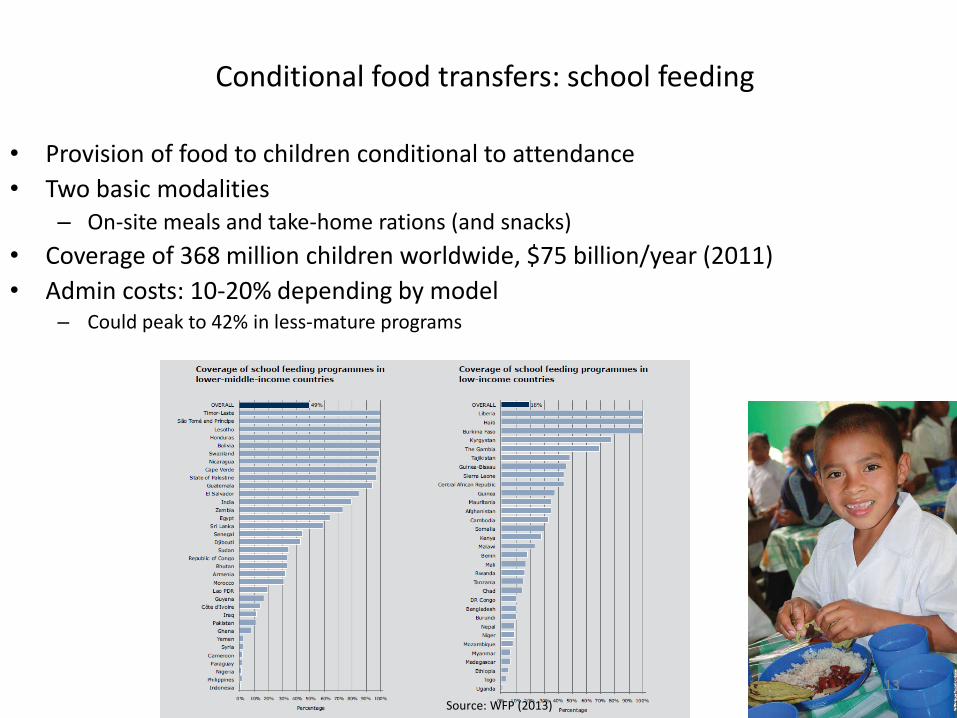
• Provision of food to children conditional to attendance
• Two basic modalities – On-site meals and take-home rations (and snacks)
• Coverage of 368 million children worldwide, $75 billion/year (2011)
• Admin costs: 10-20% depending by model – Could peak to 42% in less-mature programs
Conditional food transfers: school feeding
Source: WFP (2013)
13

Source: Gelli et al. (2012)
School feeding models
14
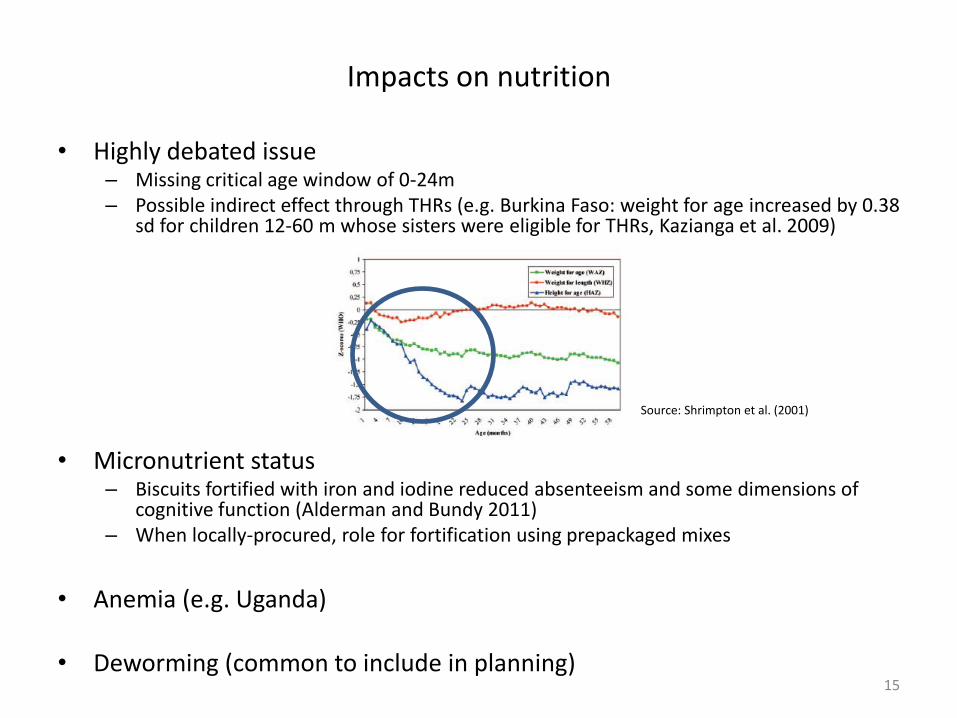
Impacts on nutrition
• Highly debated issue – Missing critical age window of 0-24m – Possible indirect effect through THRs (e.g. Burkina Faso: weight for age increased by 0.38
sd for children 12-60 m whose sisters were eligible for THRs, Kazianga et al. 2009)
• Micronutrient status – Biscuits fortified with iron and iodine reduced absenteeism and some dimensions of
cognitive function (Alderman and Bundy 2011) – When locally-procured, role for fortification using prepackaged mixes
• Anemia (e.g. Uganda)
• Deworming (common to include in planning)
Source: Shrimpton et al. (2001)
15
Impacts on education and income
• Considerably effective in enrolment – Uganda: 9% increase in children aged 6–13 who started school (Alderman et al 2010)
– Bangladesh: 14% difference (in communities with and without SF (Ahmed 2004)
– Burkina Faso: new enrollment of girls by about 5-6% (Kazianga et al. 2009)
– Kenya: 30% increase (pre-school) (Vermeersch and Kremer 2005)
• Cognitive skills – Mixed evidence on learning (supply-side, quality of education as key, e.g. Pritchett 2013…)
– E.g. Uganda impact on math test scores (children aged 11-14), but not test of literacy
• Targeting – School-targeted as generally progressive (Lindert et al. 2010)
– THRs as gender-targeted (double in transfer size, e.g. Gelli et al. 2009)
– Expanded in crises, but where existed (e.g., Burundi, CAR, Ghana, Liberia, Togo, and Philippines)
16
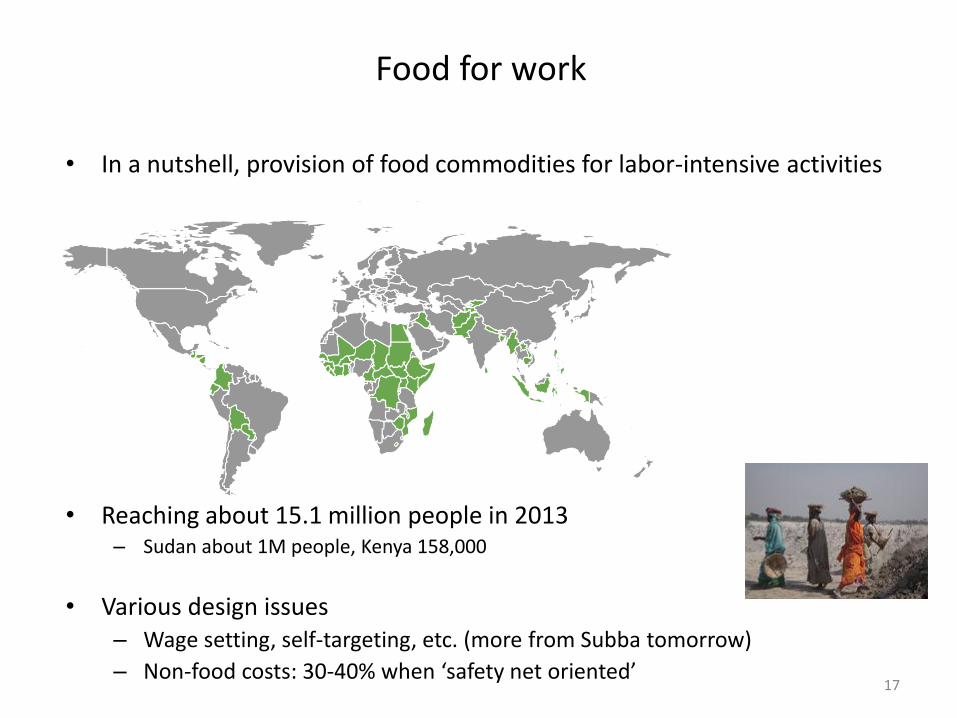
Food for work
• In a nutshell, provision of food commodities for labor-intensive activities
• Reaching about 15.1 million people in 2013 – Sudan about 1M people, Kenya 158,000
• Various design issues – Wage setting, self-targeting, etc. (more from Subba tomorrow)
– Non-food costs: 30-40% when ‘safety net oriented’
17

Food for work
• Different models, e.g. Ethiopia – Long history for FFW before PSNP (EGS)
– PSNP and MERET
• Changing composition in early-recovery – E.g. Sudan
Source: WFP, based on Zeleke (2013)
18

Paper-based
Phone-based
Swipe-cards
Semi-paper
Vouchers
• Usually unconditional; can be quantity or value-based
• Different ways of provision/payment…
Pakistan (1990s) Burkina Faso
Zambia Zimbabwe
Syria
Palestine Lebanon
19

Integration and multipliers
• Gaza – Crisis in 2014, voucher platform used to channel humanitarian assistance (300,000 people)
• Cards uploaded to serve 84,000 people with water and sanitation items, and 14,000 children received school uniforms
• Lebanon – Coverage 882,850 people in October 2014 alone (75% of refugees)
– US$30 per person, US$345M in 2014 (expected to generate US$517 M in the economy)
– 416 shops; +1,300 jobs and US$3M in capital investments (space and storage)
– Vouchers delivered with Mastercard®; online monitoring; payment of merchants within 48h
– Informing the Emergency National Poverty Targeting Programme (E-NPTP) in Lebanon
20

Ms Mabel McFiggin of Rochester, New York
21

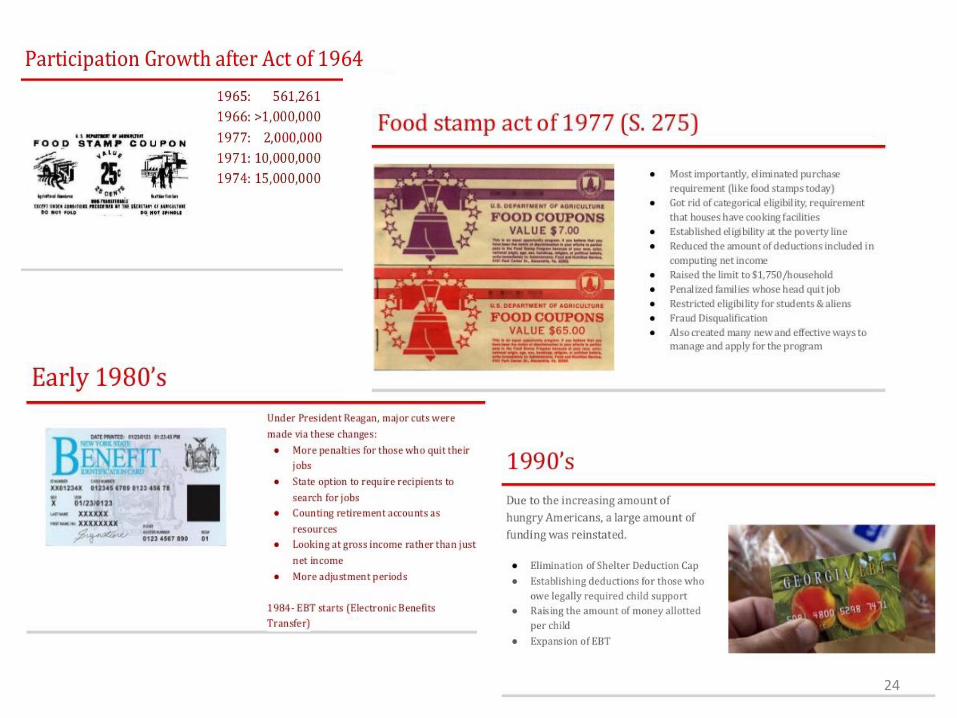
First printing of SNAP (food stamps), Washington D.C., April 20, 1939
22

… then stopped. No program between 1943-61…
Pilot 1939-43…
… then pilot again (1961) and eventually enshrined into law (1964)
+
Introduced in waves …
23
24
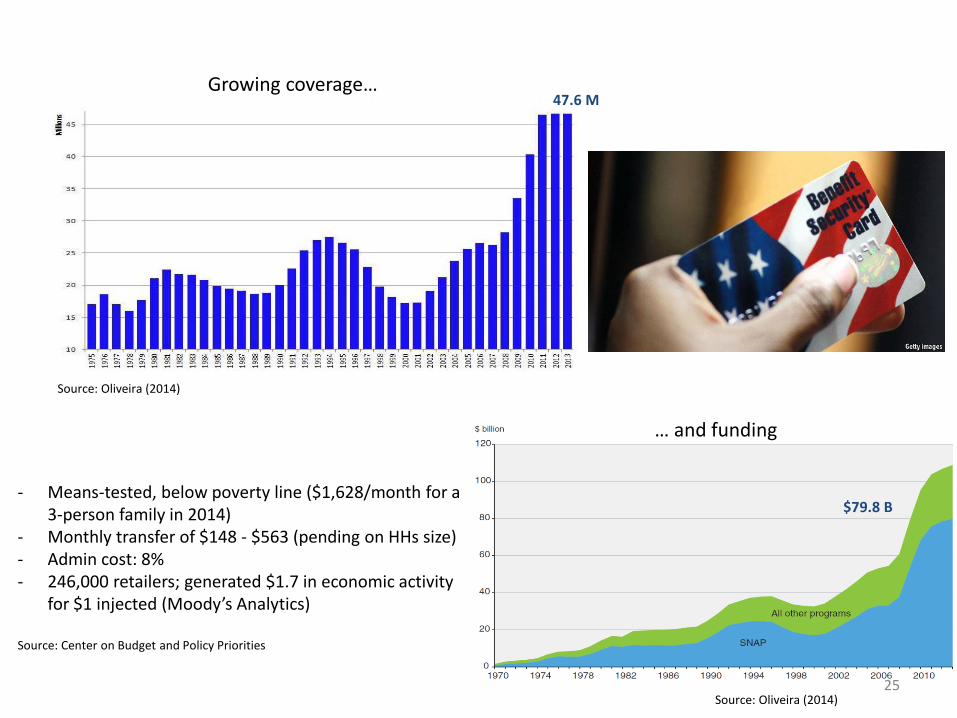
Growing coverage…
… and funding
Source: Oliveira (2014)
Source: Oliveira (2014)
47.6 M
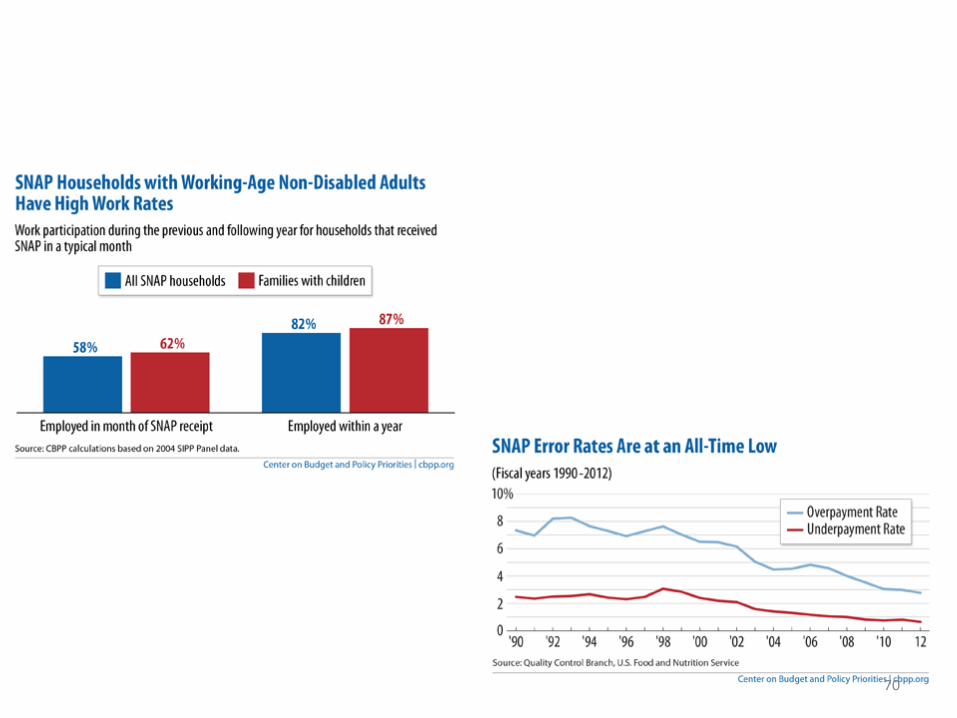
$79.8 B - Means-tested, below poverty line ($1,628/month for a
3-person family in 2014) - Monthly transfer of $148 - $563 (pending on HHs size) - Admin cost: 8% - 246,000 retailers; generated $1.7 in economic activity
for $1 injected (Moody’s Analytics) Source: Center on Budget and Policy Priorities
25

Quasi-formal food assistance: food banks
Source: Gentilini (2013)
26
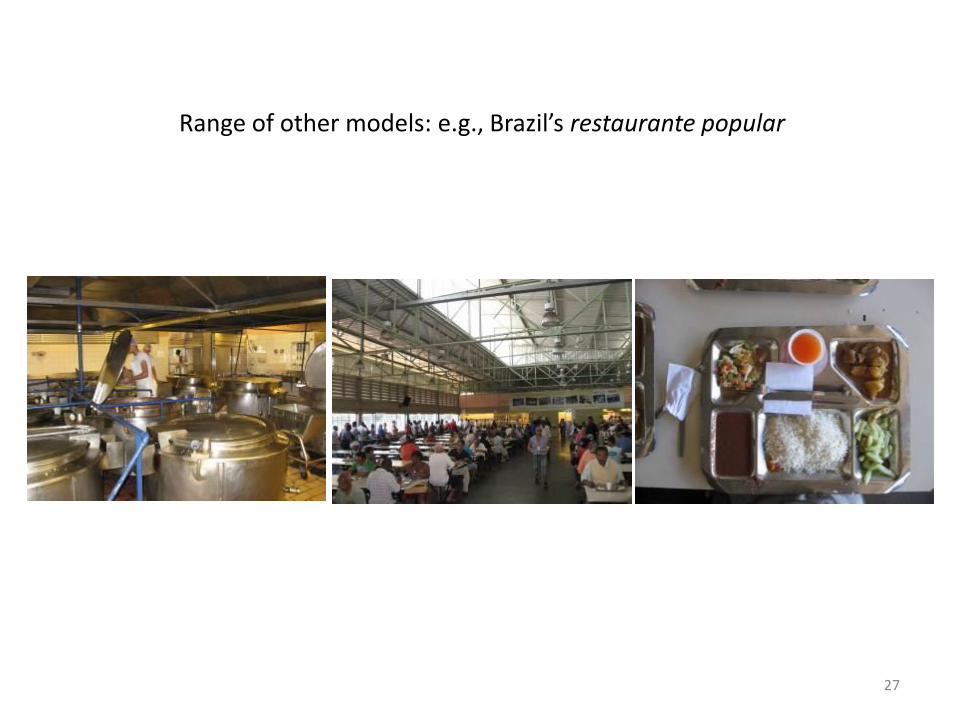
Range of other models: e.g., Brazil’s restaurante popular
27

• Concepts and definitions
• Food assistance programs
• When to
• Wrap-up
Making choices
28

• Can be ideological and polarizing…
“[T]he big reason poor people are poor is because they don’t have enough money. (…) So let’s abandon [vouchers and in-kind transfers] and just give money to those we
should help out.” (C. Kenny, CGD)
“The economist’s traditional, normative dictum on benefits in-kind may be analytically elegant (…) but practically dead wrong.” (U. Reinhardt, Princeton University)
• Political economy can play an important role – Constituencies
– Perceptions
– Paternalism vs fungibility
What do we know about cash versus food?
29

• Lots of evidence on individual cash, food and voucher programs
– Comparisons somewhat ‘by inference’
• But little about about relative performance? In other words, deliberate comparisons…
– Same context
– Equal objectives
– Consistent design (transfer size, frequency)
– … and using RCTs/quasi-experiments
What do we know about cash versus food?
30

SNAP evidence
• “… virtually every study finds food stamps increase household nutrient availability at 2 to 10 times the rate of a like value of cash income” (Barrett 2002)
• Explaining the “cash out puzzle”
– ‘Labeling’ effect inducing a sense of moral obligation to use in-kind transfers for their intended food consumption purpose (Senauer and Young 1986)
– Gender and decision-making behaviors in multi-adult households (Breunig and Dasgupta 2005)
– Alterations in household budgeting and planning of monthly purchases (Wilde and Ranney 1996)
– Others…
31
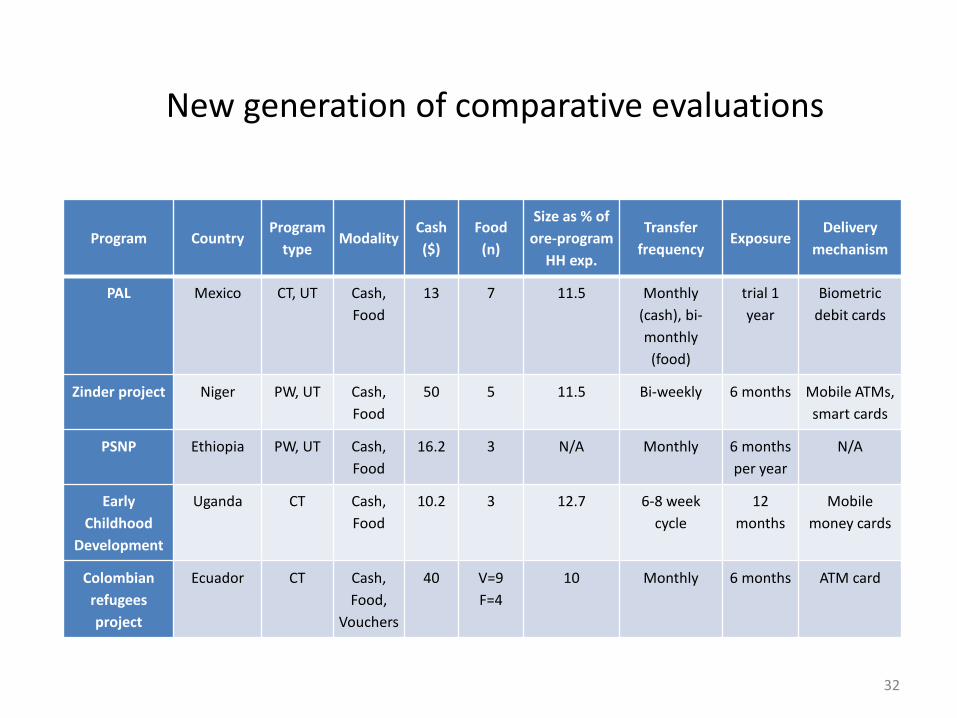
Program Country Program
type Modality
Cash
($)
Food
(n)
Size as % of
ore-program
HH exp.
Transfer
frequency Exposure
Delivery
mechanism
PAL Mexico CT, UT Cash,
Food
13 7 11.5 Monthly
(cash), bi-
monthly
(food)
trial 1
year
Biometric
debit cards
Zinder project Niger PW, UT Cash,
Food
50 5 11.5 Bi-weekly 6 months Mobile ATMs,
smart cards
PSNP Ethiopia PW, UT Cash,
Food
16.2 3 N/A Monthly 6 months
per year
N/A
Early
Childhood
Development
Uganda CT Cash,
Food
10.2 3 12.7 6-8 week
cycle
12
months
Mobile
money cards
Colombian
refugees
project
Ecuador CT Cash,
Food,
Vouchers
40 V=9
F=4
10 Monthly 6 months ATM card
New generation of comparative evaluations
32

Program Country Program
type Modality
Cash
($)
Food
(n)
Size as % of
ore-program
HH exp.
Transfer
frequency Exposure
Delivery
mechanism
IDPs project Democratic
Republic of
Congo
UT Cash,
Vouchers
18.5 V=10 18.96 Bi-monthly 7 months Bank accounts
Unconditional
safety net
Yemen UT Cash,
Food
49 2 N/A Bi-monthly 6 months ID card via
Postal Savings
Corporation
Scholarship
pilot program
Cambodia CT Cash,
Food
5 1 2.5 Monthly 10
months
On-site
manual
distribution
CTPP Sri Lanka UT Cash,
Food
9.8 6 26.3 Bi-weekly
(cash),
bi-monthly
(food)
3 months Samurdhi
Bank
IGVGD, RMP Bangladesh UT, PW Cash,
Food
19.7 1 30 (cash)
15.5 (food)
Bi-monthly
(cash),
monthly
(food)
2-4 years Public banks
• What do they tell us? – Impacts
– Other related findings
– Costs
33
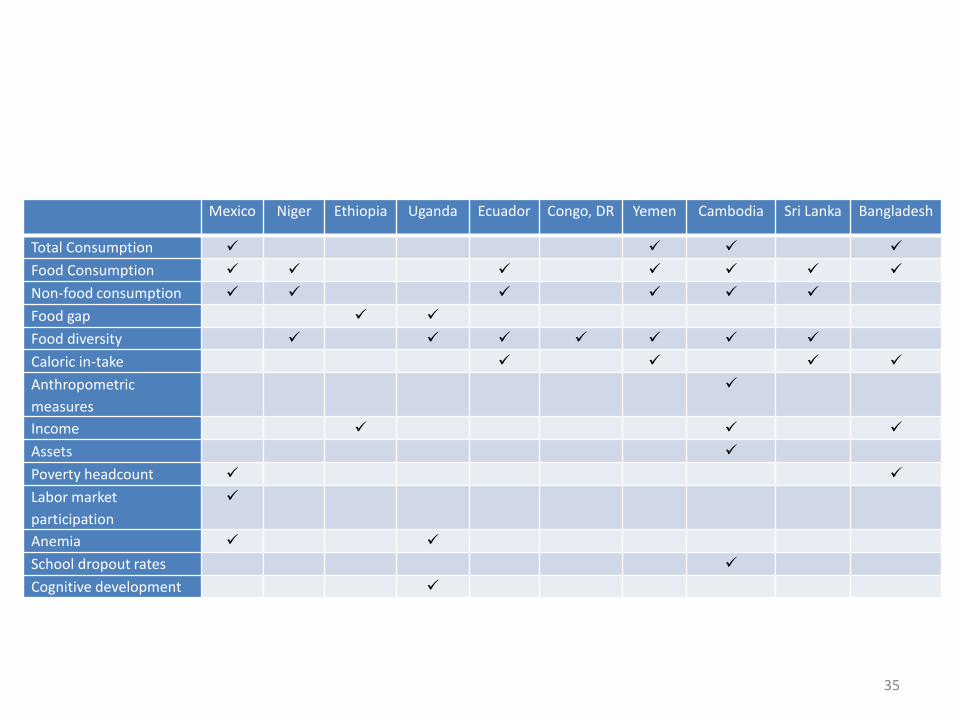
Mexico Niger Ethiopia Uganda Ecuador Congo, DR Yemen Cambodia Sri Lanka Bangladesh
Total Consumption
Food Consumption
Non-food consumption
Food gap
Food diversity
Caloric in-take
Anthropometric
measures
Income
Assets
Poverty headcount
Labor market
participation
Anemia
School dropout rates
Cognitive development
35
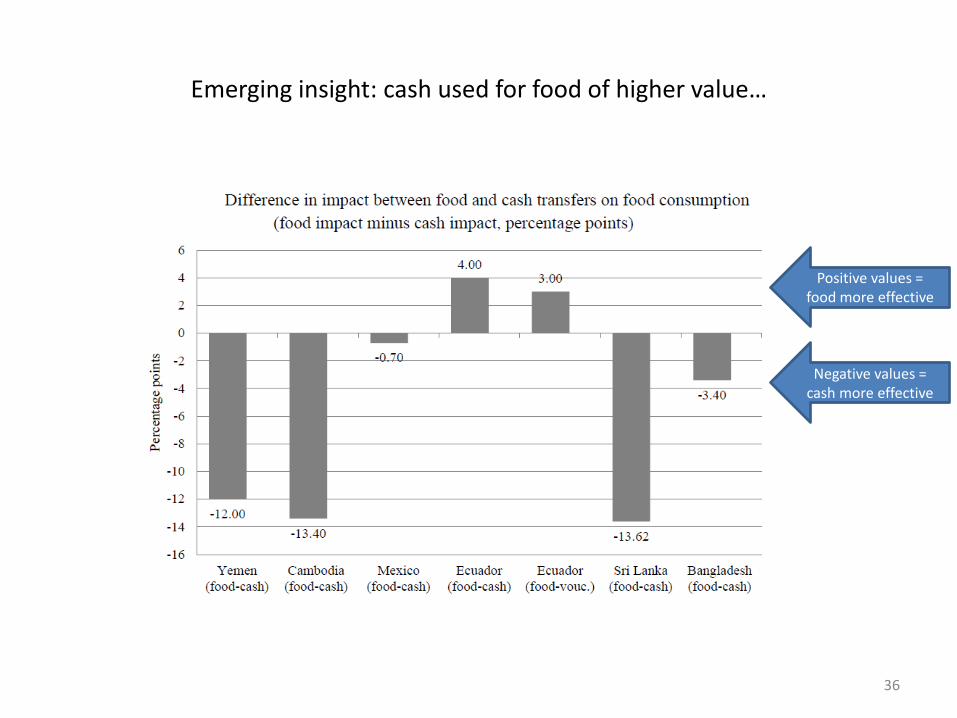
Emerging insight: cash used for food of higher value…
Positive values = food more effective
Negative values = cash more effective
36
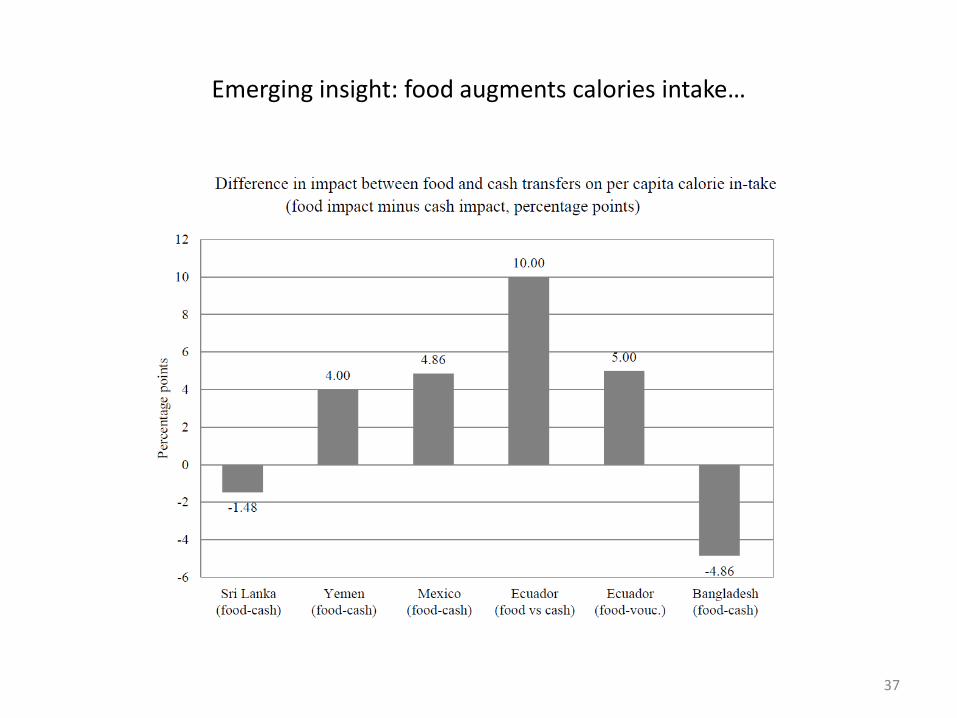
Emerging insight: food augments calories intake…
37
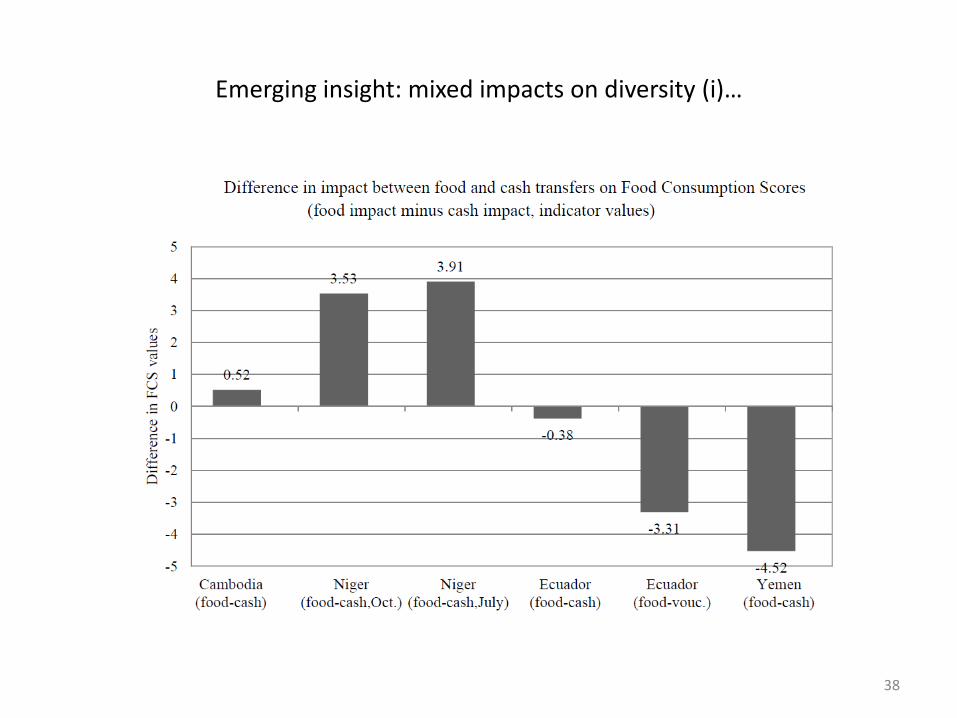
Emerging insight: mixed impacts on diversity (i)…
38

Emerging insight: mixed impacts on diversity (ii)…
39
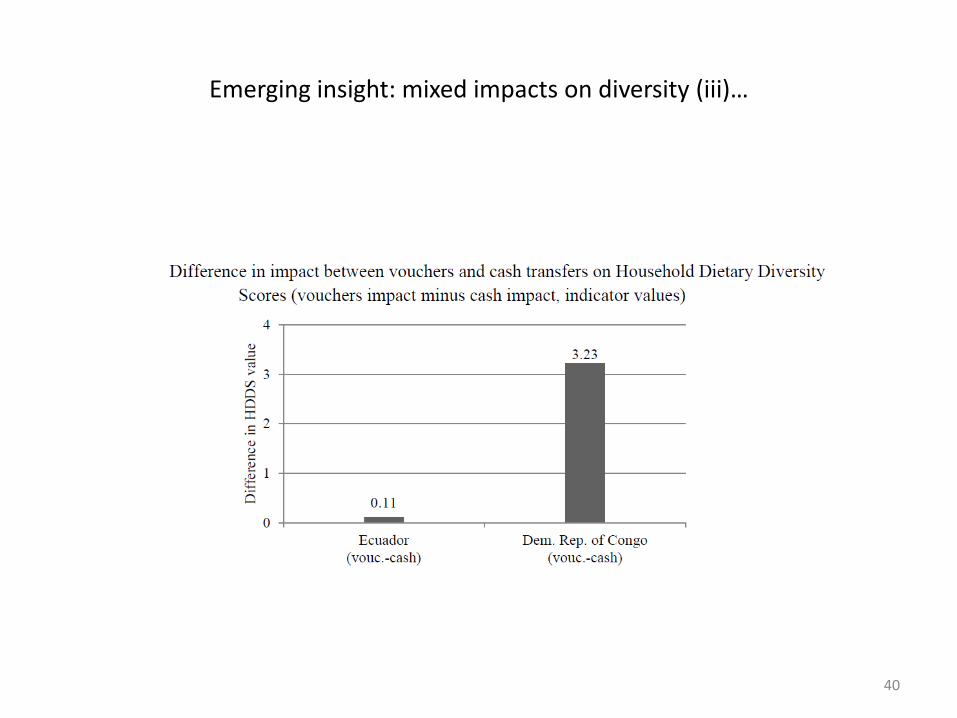
Emerging insight: mixed impacts on diversity (iii)…
40

Some other findings and implications
41
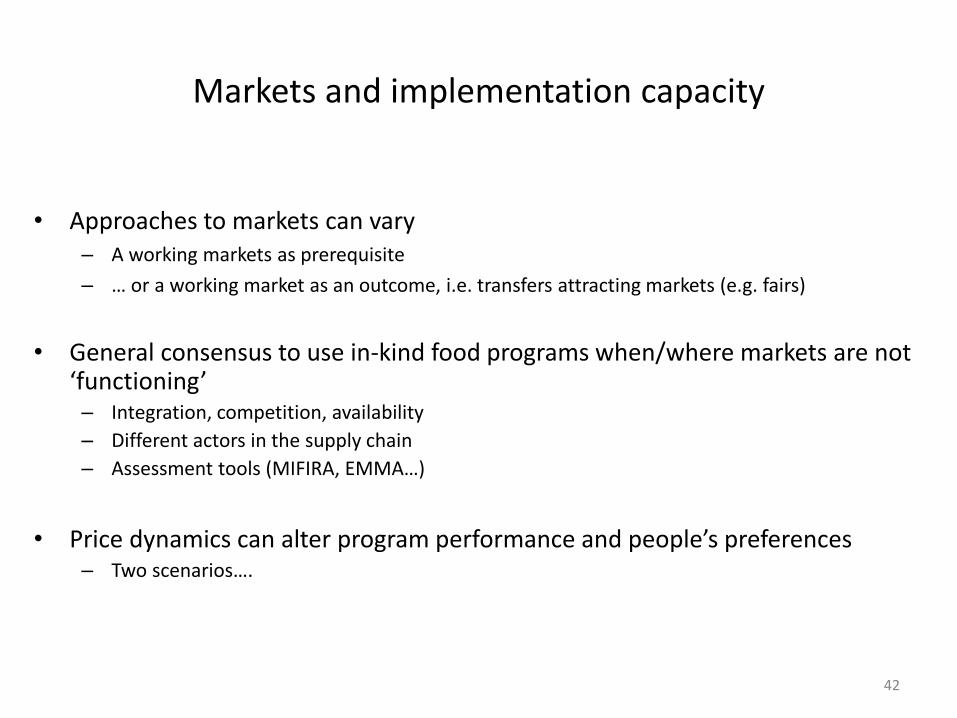
Markets and implementation capacity
• Approaches to markets can vary – A working markets as prerequisite
– … or a working market as an outcome, i.e. transfers attracting markets (e.g. fairs)
• General consensus to use in-kind food programs when/where markets are not ‘functioning’ – Integration, competition, availability
– Different actors in the supply chain
– Assessment tools (MIFIRA, EMMA…)
• Price dynamics can alter program performance and people’s preferences
– Two scenarios….
42

• Ebola in West Africa – Monrovia: in 2 weeks (August), cassava prices increased by 30%
– Sierra Leone: in 6 months prices for local rice ranged from -20% to +42%
• PSNP in Ethiopia – High food prices in 2008 increased market value of food transfers was between 1.4 - 3
times the value of cash transfers
Source: Sabates-Wheeler and Devereux (2010)
Price dynamics (unpredictable shocks)
43

Price dynamics (seasonal/predictable)
The PSNP payment rate was set at 6 Birr per day in 2005-06 to purchase 3 kg of cereals
- 2.5 kg (in Tigray) to as much as 5.9 kg (in SNNPR)
Mean seasonal price change in the Malawi maize market, 1989-2009
Source: Ellis and Manda (2012)
Source: Sabates-Wheeler and Devereux (2010) 44
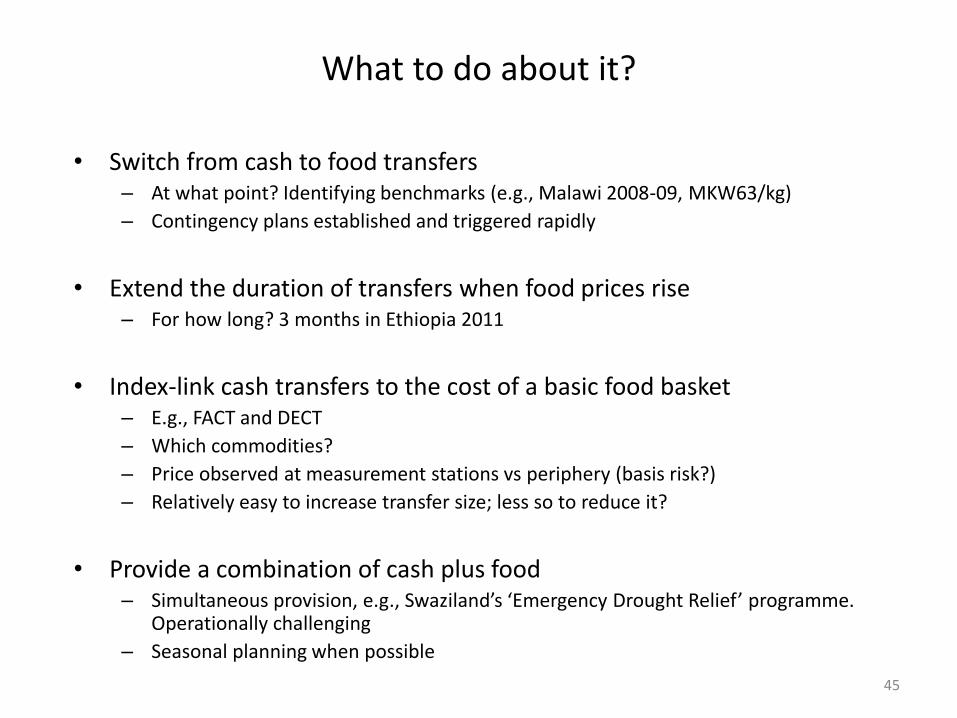
What to do about it?
• Switch from cash to food transfers – At what point? Identifying benchmarks (e.g., Malawi 2008-09, MKW63/kg)
– Contingency plans established and triggered rapidly
• Extend the duration of transfers when food prices rise – For how long? 3 months in Ethiopia 2011
• Index-link cash transfers to the cost of a basic food basket – E.g., FACT and DECT
– Which commodities?
– Price observed at measurement stations vs periphery (basis risk?)
– Relatively easy to increase transfer size; less so to reduce it?
• Provide a combination of cash plus food – Simultaneous provision, e.g., Swaziland’s ‘Emergency Drought Relief’ programme.
Operationally challenging
– Seasonal planning when possible
45

Snapshot of cash-food seasonal planning in Mozambique
46

What to do about it?
• Provide transfers in the form of commodity-denominated vouchers – Transfer risk to retailers; their interest to participate may vary
• Each options suggests that… operational capacity is key – Availability of pre-existing systems
– Logistics, partnerships, coordination, delivery building blocks
– And takes time to build and enhance…
Source: Wiseman et al. (2010)
Improving timeliness of PSNP transfers
47
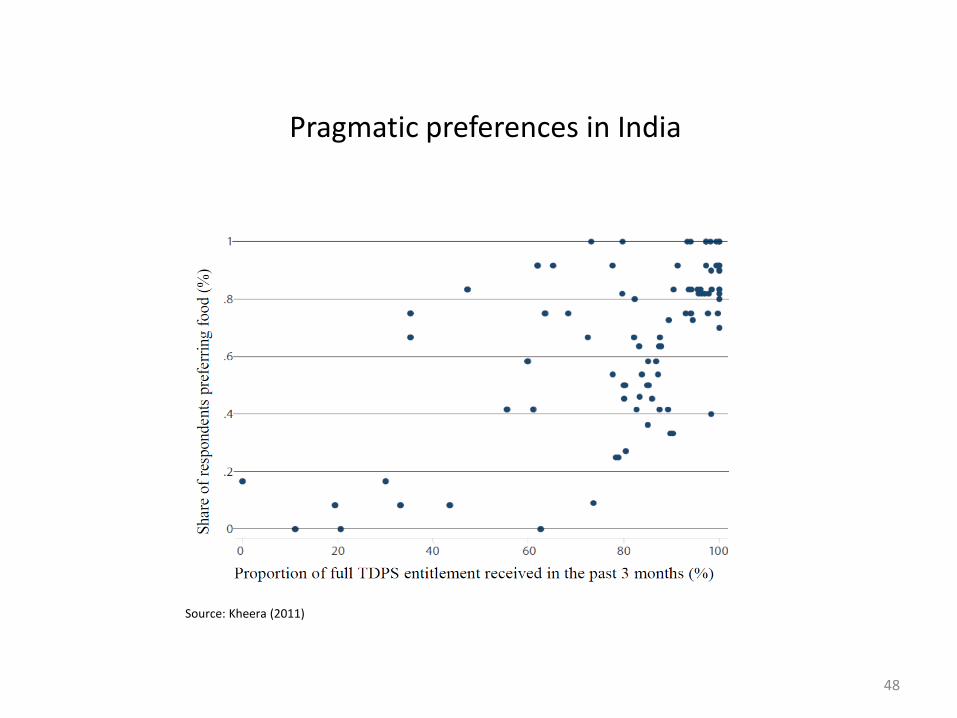
Source: Kheera (2011)
Pragmatic preferences in India
48
Costs
49

• In general, costs lower for cash (and vouchers) than food
- At least about 2 times lower
- Less logistics (transport, storage, etc.)
• BUT….
50
• Diverse analyses methods, breadth and depth
• Often they may not disaggregate by…
– Set-up (fixed) vs. running (variable) costs
– Planned (design) vs. actual implementation costs (e.g., Zambia)
– Emerging of more nuanced tools (VFM, Ryckembusch et al., Gelli et al., etc.)
• Consider beneficiary transaction costs (time and money)
• Beyond delivery cost: account for cost of food basket
– Cost of food often assumed to be = local market value of food, not procurement cost
– Procurement cost can be higher/equal/lower than local market value, altering results
… let’s look at some of these, with an application to Yemen
51
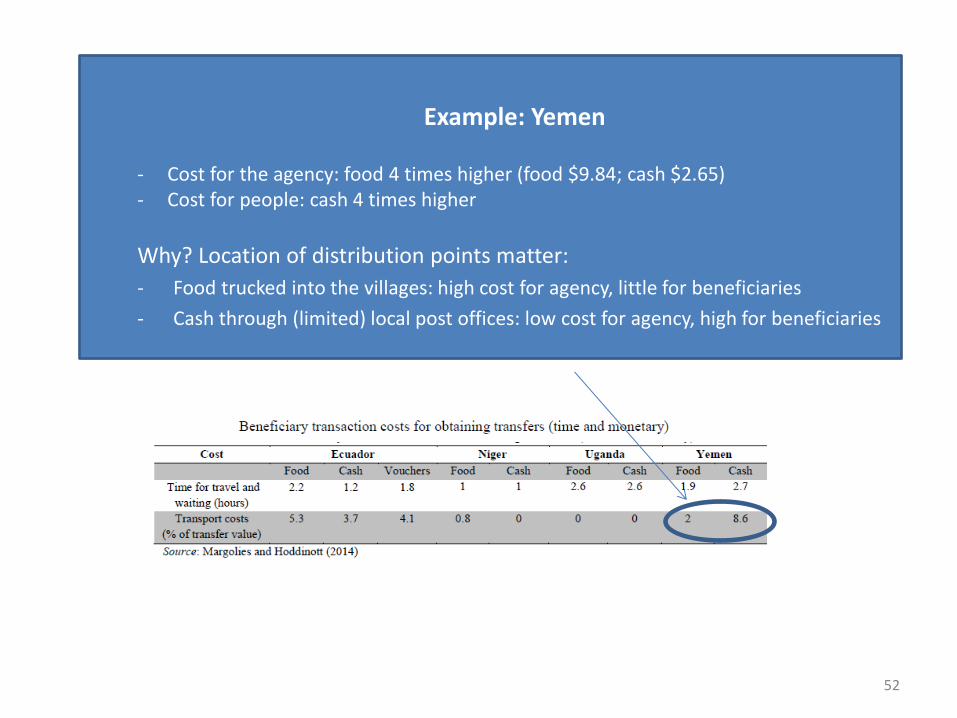
Example: Yemen
- Cost for the agency: food 4 times higher (food $9.84; cash $2.65) - Cost for people: cash 4 times higher
Why? Location of distribution points matter:
- Food trucked into the villages: high cost for agency, little for beneficiaries
- Cash through (limited) local post offices: low cost for agency, high for beneficiaries
52
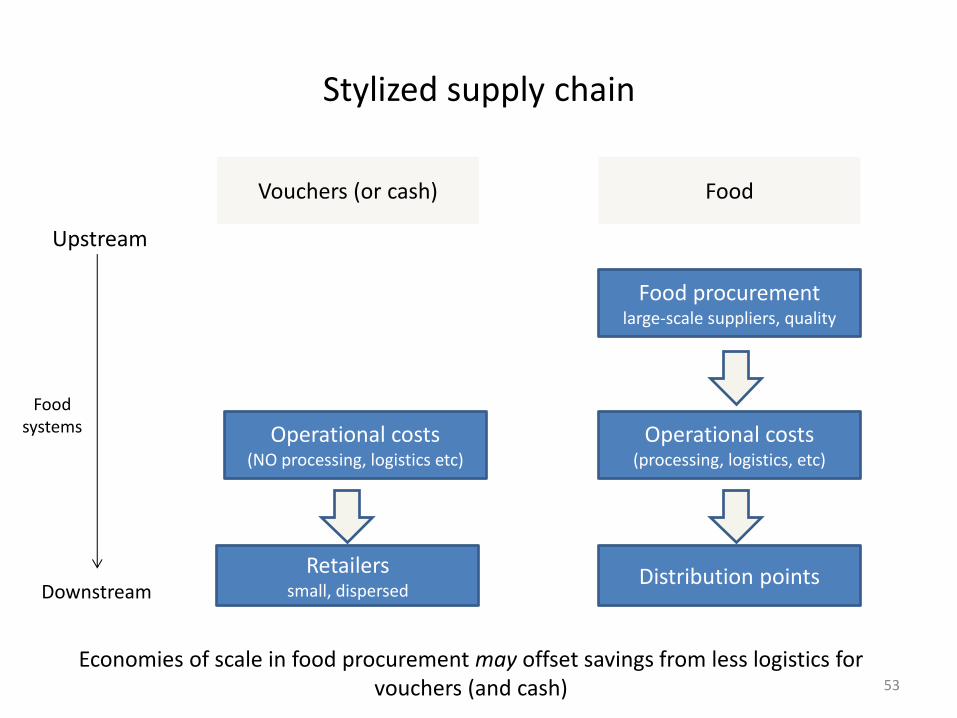
Operational costs (NO processing, logistics etc)
Retailers small, dispersed
Operational costs (processing, logistics, etc)
Distribution points
Food procurement large-scale suppliers, quality
Vouchers (or cash) Food
Upstream
Downstream
Food systems
Stylized supply chain
Economies of scale in food procurement may offset savings from less logistics for vouchers (and cash) 53
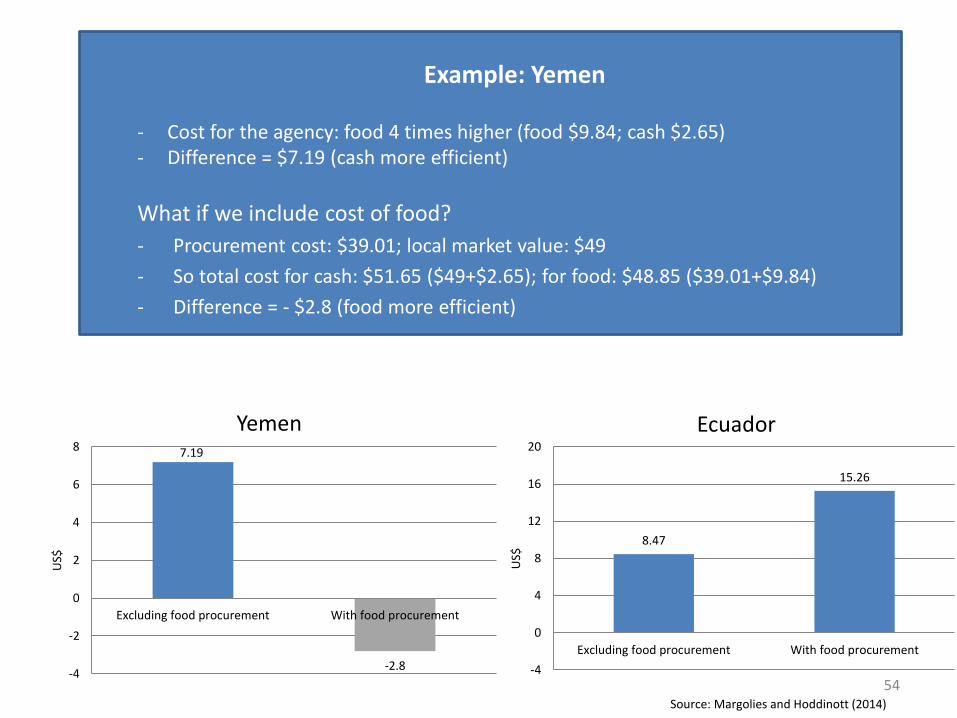
Source: Margolies and Hoddinott (2014)
Example: Yemen
- Cost for the agency: food 4 times higher (food $9.84; cash $2.65) - Difference = $7.19 (cash more efficient)
What if we include cost of food?
- Procurement cost: $39.01; local market value: $49
- So total cost for cash: $51.65 ($49+$2.65); for food: $48.85 ($39.01+$9.84)
- Difference = - $2.8 (food more efficient)
8.47
15.26
-4
0
4
8
12
16
20
Excluding food procurement With food procurement
US$
Ecuador 7.19
-2.8 -4
-2
0
2
4
6
8
Excluding food procurement With food procurement
US$
Yemen
54

• Averting (dis)economies of scale: large procurement and logistics space demands investment in adequate accountability and transparency – Avoiding ‘leakages’, or diversion and losses of food at various points in supply chains, hence
not reaching intended beneficiaries
– E.g., TPDS in India: around 58% of grains ‘leaked’ in early 2000s (Planning Commission)
– May need to consider possible leakages in efficiency analysis
Source: World Bank (2011)
55

• Concepts and definitions
• Food assistance programs
• Making choices
• Wrap-up Wrap-up
56
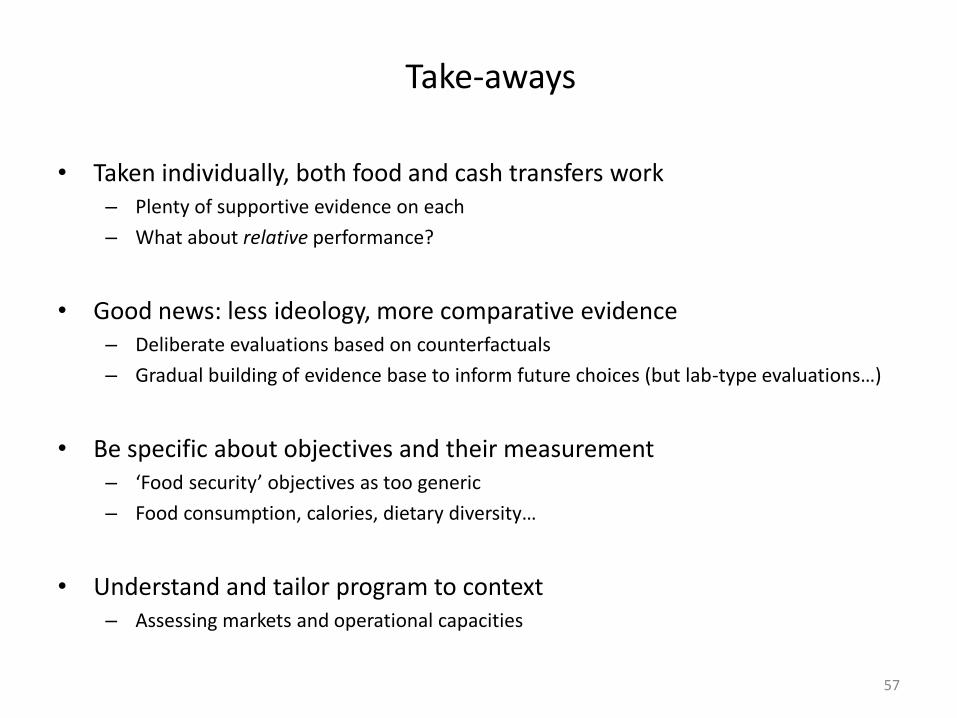
• Taken individually, both food and cash transfers work – Plenty of supportive evidence on each
– What about relative performance?
• Good news: less ideology, more comparative evidence – Deliberate evaluations based on counterfactuals
– Gradual building of evidence base to inform future choices (but lab-type evaluations…)
• Be specific about objectives and their measurement – ‘Food security’ objectives as too generic
– Food consumption, calories, dietary diversity…
• Understand and tailor program to context – Assessing markets and operational capacities
Take-aways
57
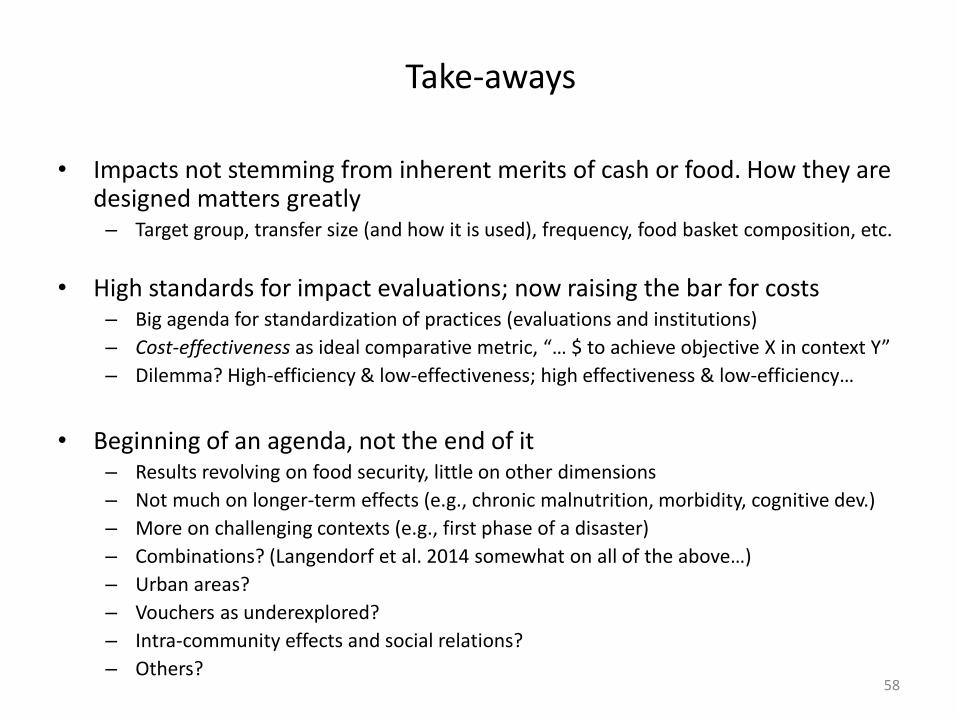
• Impacts not stemming from inherent merits of cash or food. How they are designed matters greatly – Target group, transfer size (and how it is used), frequency, food basket composition, etc.
• High standards for impact evaluations; now raising the bar for costs – Big agenda for standardization of practices (evaluations and institutions)
– Cost-effectiveness as ideal comparative metric, “… $ to achieve objective X in context Y”
– Dilemma? High-efficiency & low-effectiveness; high effectiveness & low-efficiency…
• Beginning of an agenda, not the end of it – Results revolving on food security, little on other dimensions
– Not much on longer-term effects (e.g., chronic malnutrition, morbidity, cognitive dev.)
– More on challenging contexts (e.g., first phase of a disaster)
– Combinations? (Langendorf et al. 2014 somewhat on all of the above…)
– Urban areas?
– Vouchers as underexplored?
– Intra-community effects and social relations?
– Others?
Take-aways
58
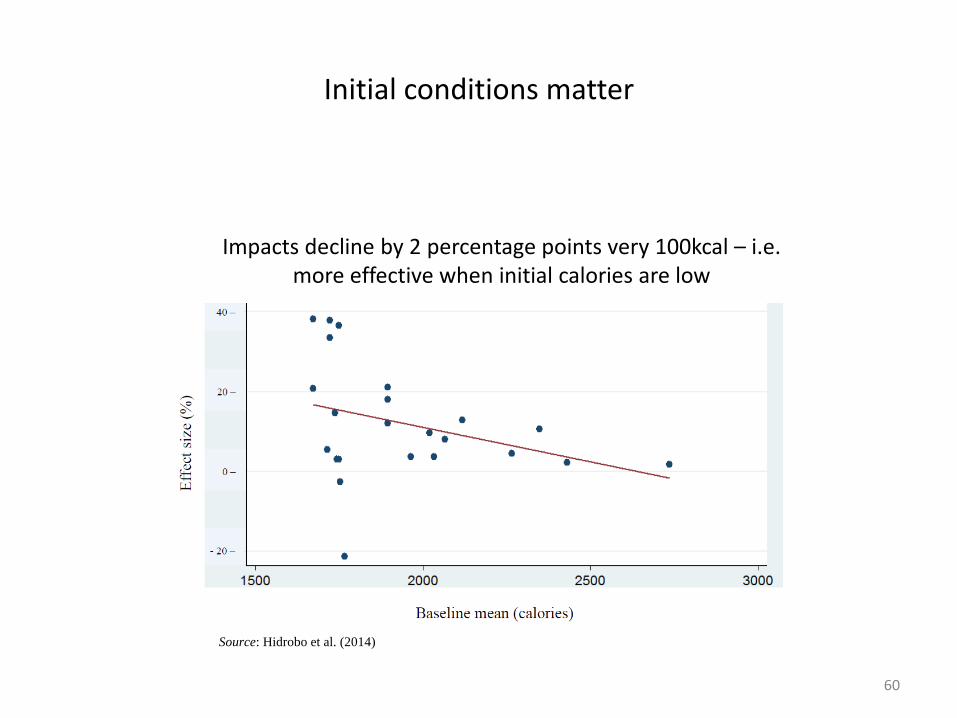
Source: Hidrobo et al. (2014)
Initial conditions matter
Impacts decline by 2 percentage points very 100kcal – i.e. more effective when initial calories are low
60
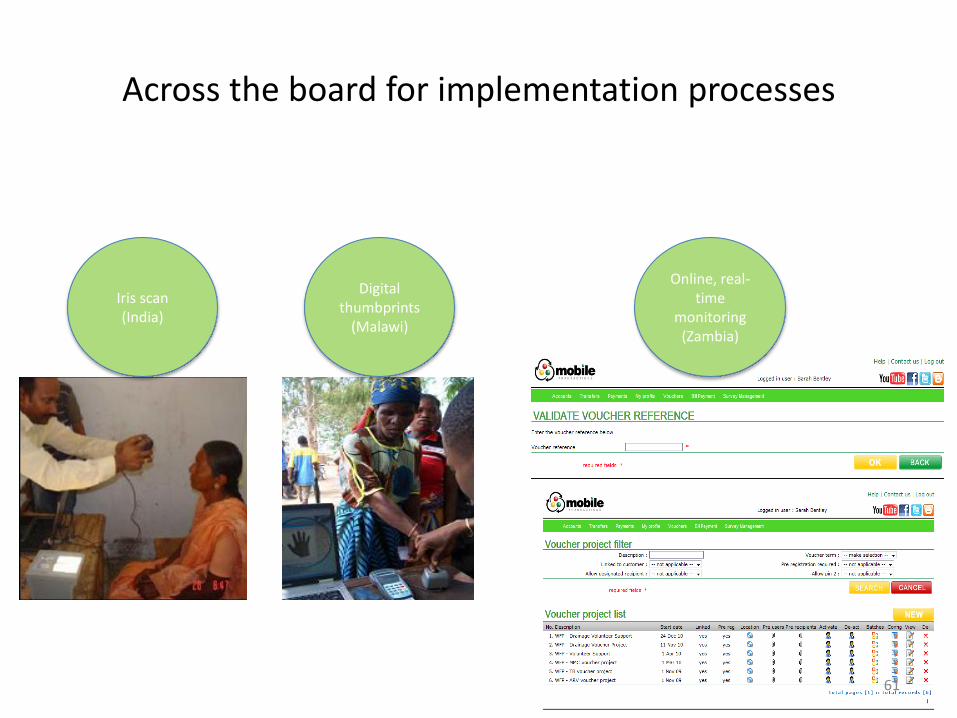
Across the board for implementation processes
Iris scan (India)
Digital thumbprints
(Malawi)
Online, real-time
monitoring (Zambia)
61
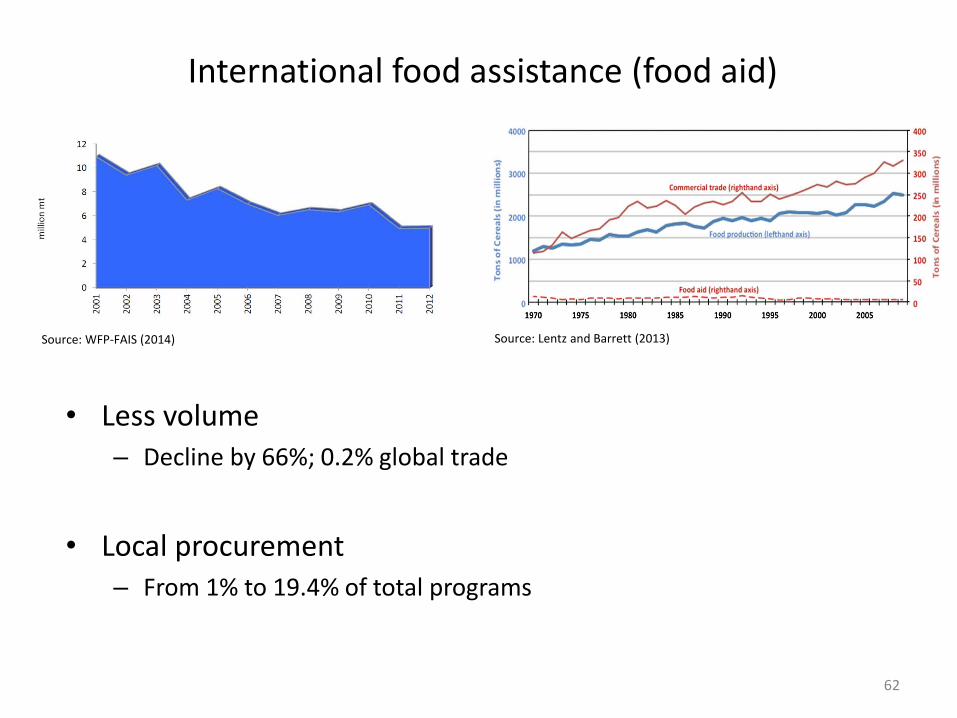
• Less volume – Decline by 66%; 0.2% global trade
• Local procurement – From 1% to 19.4% of total programs
International food assistance (food aid)
Source: WFP-FAIS (2014) Source: Lentz and Barrett (2013)
62
63

Source: Bundy et al. (2009)
Stages in program practice
64
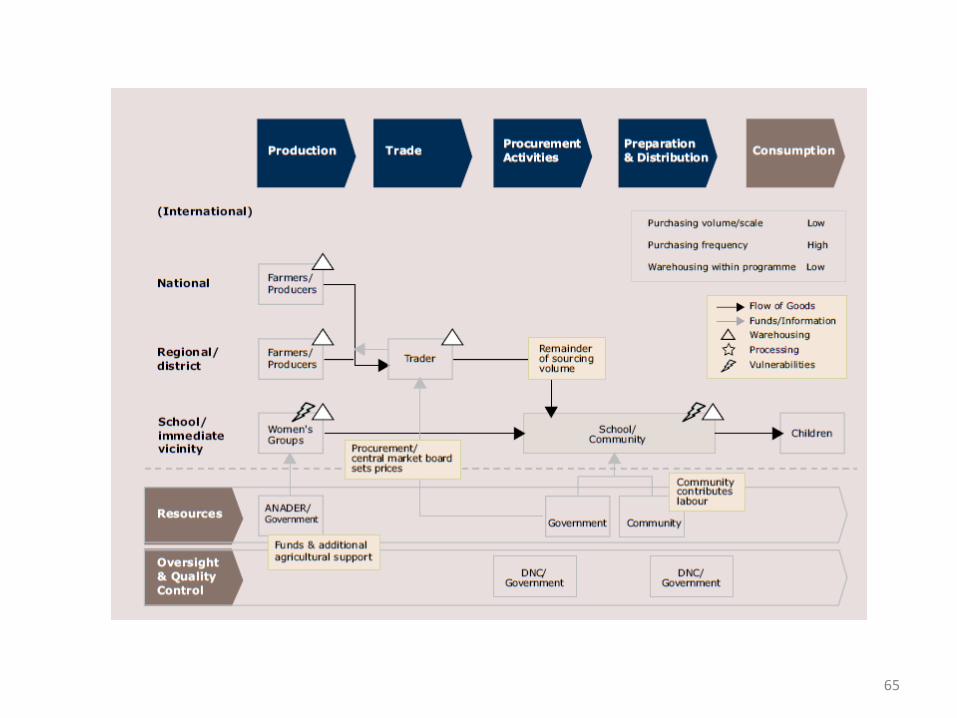
65

• SF models and cost structures
Source: PCD (work in progress)
66
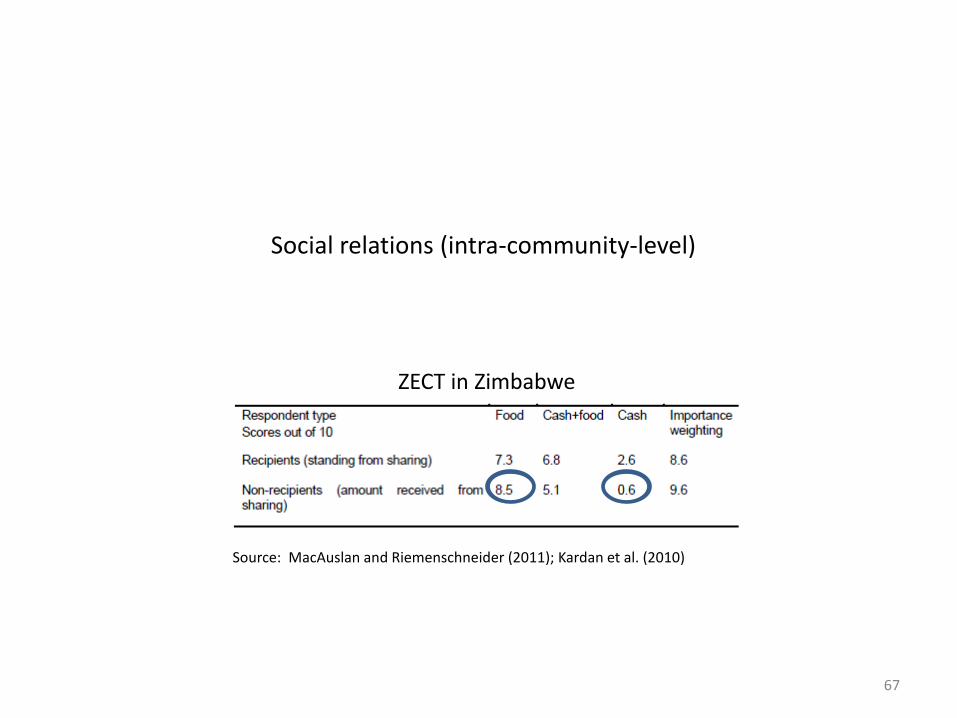
Source: MacAuslan and Riemenschneider (2011); Kardan et al. (2010)
ZECT in Zimbabwe
Social relations (intra-community-level)
67
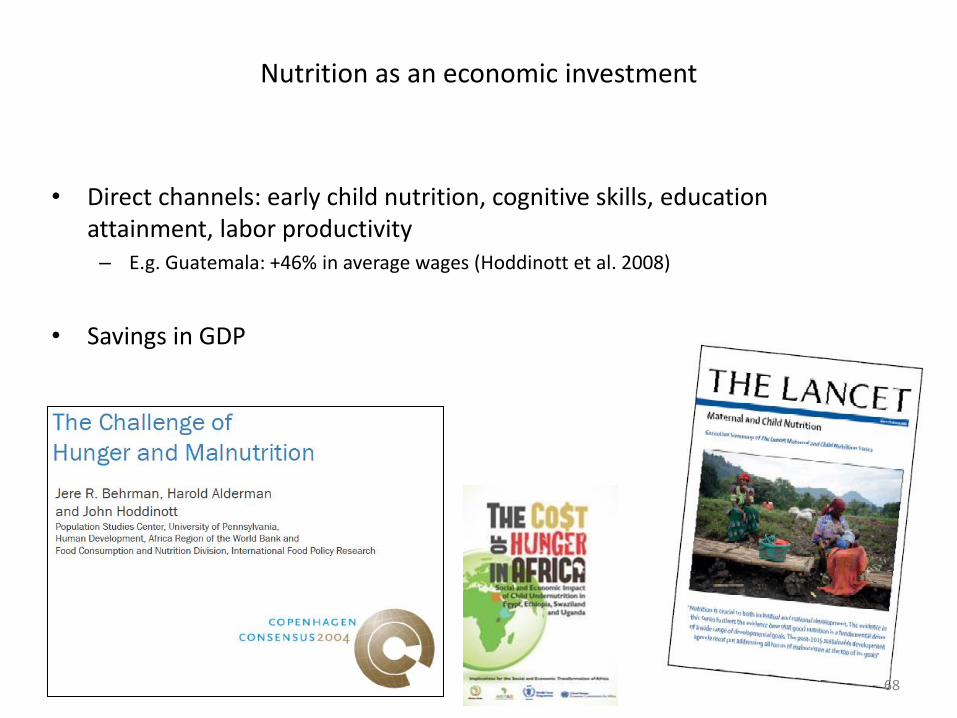
Nutrition as an economic investment
• Direct channels: early child nutrition, cognitive skills, education attainment, labor productivity – E.g. Guatemala: +46% in average wages (Hoddinott et al. 2008)
• Savings in GDP
68

Measuring food security
69
70
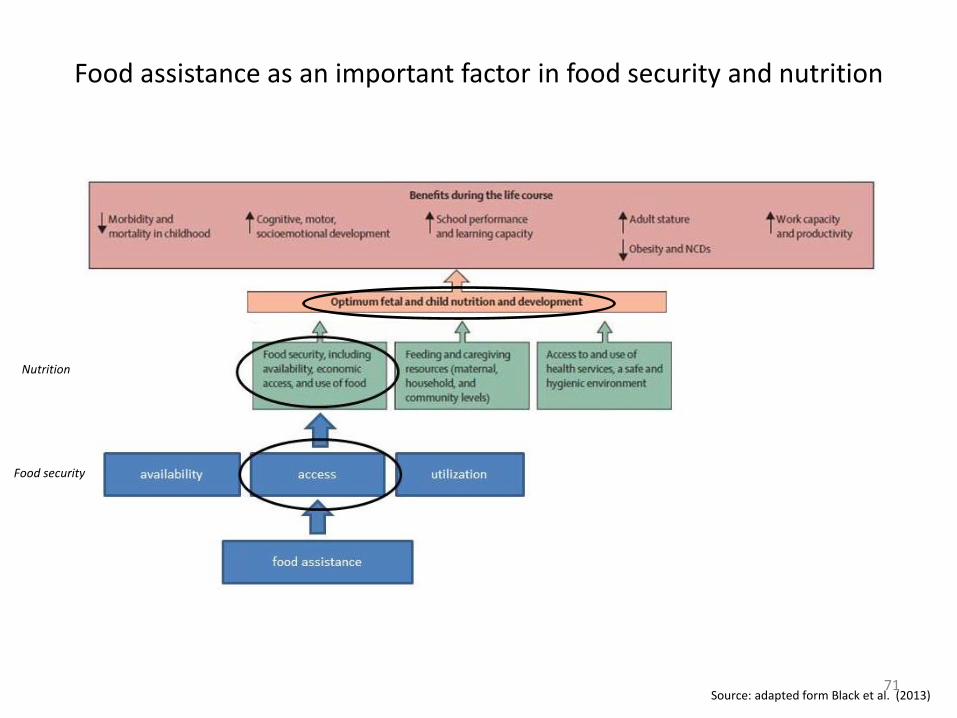
Food assistance as an important factor in food security and nutrition
Source: adapted form Black et al. (2013)
Food security
Nutrition
71


