Profile Report - State - ACT · Tables for these new scores and indicators (Writing scores from ......
32
Profile Report - State Graduating Class 2016 Mississippi ACT, INC. -- CONFIDENTIAL *070059110*
Transcript of Profile Report - State - ACT · Tables for these new scores and indicators (Writing scores from ......

Profile Report - State
Graduating Class 2016
Mississippi
ACT, INC. -- CONFIDENTIAL*070059110*

ACT PROFILE REPORT- State
Graduating Class 2016 Code 259999
Mississippi
Total Students in Report: 35,678
New to your 2016 Profile Report
●
●
●
●
●
In Fall 2015, ACT introduced additional test scores and indicators to provide students and educators with more insight into critical aspects of college and career readiness. Tables for these new scores and indicators (Writing scores from enhanced design, ELA score, STEM score, Understanding Complex Texts Indicator, and Progress Toward Career Readiness Indicator) are included in this report to describe available data. To determine where the new scores are summarized in this report, please consult the Table of Contents.
Writing scores: Writing scores describe core writing competencies valued by high school and college educators. These competencies are summarized by the writing scores. Writing scores from test events before September 2015 will be reported on the 2-12 scale. Writing scores from test events on or after September 2015 will be reported on the 1-36 scale.
ELA: The English Language Arts (ELA) score is based upon student scores in ACT English, Reading, and Writing, and is intended to represent a measure of students’ overall literacy skills. This score utilizes ACT’s customary 1-36 scale.
STEM: In response to the national focus on student performance in Science, Technology, Engineering, and Mathematics (STEM), a STEM score was developed to gauge students’ overall performance in mathematics and science. This score, driven by ACT Matehmatics and Science scores, ranges from 1 to 36. Test scores from previous years have been calculated.
Understanding Complex Texts Indicator: The Understanding Complex Texts indicator represents students' progress toward understanding the complex written material encountered in college and careers. The indicator is reported in three proficiency levels: Below Proficient, Proficient, and Above Proficient.
Progress Toward Career Readiness Indicator: Progress toward career readiness indicator is based upon the ACT Composite score, representing the level at which students perform relative to the National Career Readiness Certificate (NCRC). Symbolizing attainment of workplace employability skills critical to job success, this indicator is reported in four levels: Progress Needs Improvement, Progress Toward Bronze NCRC, Progress Toward Silver NCRC, and Progress Toward Gold NCRC.

ACT PROFILE REPORT - State PAGE 1
Graduating Class 2016 Code 259999
Mississippi
Total Students in Report: 35,678
Table of Contents
Section I: Executive Summary Page 5Percent of Your Students Ready for College-Level Coursework
Five Year Trends—Percent of Students Who Met College Readiness Benchmarks
Five Year Trends—Average ACT Scores
Five Year Trends—Average ACT Scores by Level of Preparation
Five Year Trends—Percent and Average Composite Score by Race/Ethnicity
Five Year Trends—Achievement in STEM
Proficiency Toward Understanding Complex Text
Average ACT College Reportable Scores by Test Session Duration
Percent of Students Who Met College Readiness Benchmark Scores by Test Session Duration
Section II: Academic Achievement Page 11ACT Score Distributions, Cumulative Percentages, Averages, and Quartile Values
Average ACT Composite Scores for Race/Ethnicity by Level of Preparation
Average ACT Scores by Race/Ethnicity
Average ACT Composite Scores for Gender by Level of Preparation
Average ACT Scores by Gender
Section III: College Readiness & Impact of Course Rigor Page 17Percent of Students in College and Career Readiness Standards (CCRS) Score Ranges
Percent of Students Who Met ACT College Readiness Benchmark Scores by Gender and Race/Ethnicity
Progress Toward National Career Readiness Certificates
College Readiness Benchmark Percent and Average ACT Scores by Overall High School Curriculum
College Readiness Benchmark Percent and Average ACT Scores by Content-Specific Curriculum
College Readiness Benchmark Percent and Average ACT Scores by Common Course Patterns
Section IV: Career and Educational Aspirations Page 23Distribution of Planned Educational Majors for All Students by College Plans
Average ACT Composite Scores for Racial/Ethnic Groups by Post-Secondary Educational Aspirations
Students' Score Report Preferences at Time of Testing
Section V: Optional Writing Test Results Page 27Average ACT Total Writing and English/Language Arts Scores by Race/Ethnicity and Gender

ACT PROFILE REPORT - State PAGE 2
Graduating Class 2016 Code 259999
Mississippi
Total Students in Report: 35,678
This report focuses on:
Performance - student test performance in the context of college readiness
Access - number of your graduates exposed to college entrance testing and the percent of race/ethnicity participation
Course Selection - percent of students pursuing a core curriculum
Course Rigor - impact of rigorous coursework on achievement
College Readiness - percent of students meeting ACT College Readiness Benchmark Scores in each content area
Awareness - extent to which student aspirations match performance
Articulation - colleges and universities to which your students send test results
This report provides information about the performance of your 2016 graduating seniors who took the ACT as
sophomores, juniors, or seniors; and self-reported at the time of testing that they were scheduled to graduate in 2016.
Beginning with the Graduating Class of 2013, all students whose scores are college reportable, both standard and
extended time tests, are now included in the report.
Each year, test data for a school, district, and the state represents a different cohort of students. ACT encourages
educators to focus on trends (3, 5, 10 years), not year-to-year changes. Such changes can represent normal – even
expected – fluctuations. On the other hand, trend lines offer more insight into what is happening in a school, district, or
the state.
Furthermore, ACT encourages educators to measure student performance in the context of college readiness measures.
The focus should be on the number and percentage of students who met or exceeded ACT’s College Readiness
Benchmark Scores, a measure that is much more meaningful and understandable than an average composite score for a
group of students.

ACT PROFILE REPORT - State PAGE 3
Graduating Class 2016 Code 259999
Mississippi
Total Students in Report: 35,678
The ACT is a curriculum-based measure of college readiness. ACT components include:
Tests of academic achievement in English, math, reading, science, and writing (optional)
High school grade and course information
Student Profile Section
Career Interest Inventory
The ACT:
College Course/Course Area ACT Score Benchmark Score
English Composition English 18
Algebra Mathematics 22
Social Sciences Reading 22
Biology Science 23
STEM STEM 26
For more information, go to www.act.org
Every few years, ACT conducts the ACT National Curriculum Survey to ensure its curriculum-based assessment tools accurately
measure the skills high school teachers teach and instructors of entry-level college courses expect. The ACT is the only college
readiness test designed to reflect the results of such a survey.
Only the ACT reports College Readiness Benchmark Scores – A benchmark score is the minimum score needed on an ACT
subject-area test to indicate a 50% chance of obtaining a B or higher or about a 75% chance of obtaining a C or higher in the
corresponding credit-bearing college courses, which include English Composition, Algebra, Social Science, Biology and STEM.
These scores were empirically derived based on the actual performance of students in college.
ACT’s College Readiness Standards are sets of statements intended to help students, parents and educators understand the
meaning of test scores. The standards relate test scores to the types of skills needed for success in high school and beyond. They
serve as a direct link between what students have learned and what they are ready to do next. The ACT is the only college readiness
test for which scores can be tied directly to standards. Connecting College Readiness Standards to the Classroom interpretive guides
can be found at www.act.org/content/act/en/education-and-career-planning/college-and-career-readiness-standards.html.

ACT PROFILE REPORT - State PAGE 4
Graduating Class 2016 Code 259999
Mississippi
Total Students in Report: 35,678
How to Improve Scores and Increase College Readiness
#1422
For more information on interpreting data in this report, or to learn how ACT can help your students improve their readiness for college and the
workplace, contact ACT Customer Service at 319-337-1365 or [email protected].
PLAN GUIDANCE ACTIVITIES BASED ON STUDENTS' CAREER AND COLLEGE ASPIRATIONS: Data in Tables 4.1 and 4.2 enable the reader to
determine if aspirations are consistent with academic performance and whether, among students with similar aspirations, academic performance is
consistent across racial/ethnic groups.
EVALUATING RIGOR OF COURSES: Table 3.1 reports the percentage of students falling in each of the ACT College Readiness Standards score
ranges. For example, approximately 75% of the cohort fall into the lowest three Mathematics score ranges. To increase these students'
achievement, identify the standards they should focus on next by accessing ACT's College Readiness Standards at www.act.org/standard.
11% of your students met all four ACT College Readiness Benchmark Scores (Table 1.1). To improve students' scores and increase the percentage
of students identified as college ready, ACT suggests:
PROVIDING ACCESS FOR ALL STUDENTS TO TAKE THE ACT: 35,678 of your students are included in this report (the 'cohort'). Increasing
access insures that more students have the opportunity to consider college and allows the reader to use this report to evaluate how well courses and
instructional programs are preparing students for college and work.
MAKING CORE CURRICULUM A PRIORITY: Emphasize the need for all students to develop college and work ready skills, regardless of
postsecondary aspirations. 60% of the students in the cohort reported taking courses that would be considered 'Core or More' (Table 1.4).
MAKING SURE STUDENTS ARE TAKING THE RIGHT KINDS OF COURSES: Table 3.8 reports 7% of the cohort took less than three years of
math courses. Of these students, 2% were college ready. 23% of the cohort reported taking a course sequence of Algebra I, Algebra II, and
Geometry. 4% of these students were college ready. In comparison, 27% of the students who took 3 or more years of math beyond Algebra I,
Algebra II, and Geometry were college ready. Getting more students ready for Algebra prior to 9th grade will increase the chances that students will
be prepared for and take advanced-level math courses.
Similarly, Table 3.8 reports 29% of the cohort took less than three years of natural science courses. 11% of these students were college ready. In
comparison, 23% of students who took at least three years of science coursework were college ready.

ACT PROFILE REPORT - State: SECTION I, EXECUTIVE SUMMARY PAGE 5
Graduating Class 2016 Code 259999
Mississippi
Total Students in Report: 35,678
Section I
Executive Summary
To find the results of only standard time or extended time test takers, refer to Tables 1.7 and 1.8 on page 9.
Beginning in August of 2013, all students whose scores are college reportable, both standard and extended time tests, are now included.
Also beginning in August 2013 Graduating Class data, College Readiness Benchmarks for Reading and Science were updated to reflect the most recent
college coursework research.

ACT PROFILE REPORT - State: SECTION I, EXECUTIVE SUMMARY PAGE 6
Graduating Class 2016 Code 259999
Mississippi
Total Students in Report: 35,678
Figure 1.1. Percent of Your Students Ready for College-Level Coursework
46
20
27
19
11
61
4144
36
26
0
10
20
30
40
50
60
70
80
90
100
College English Composition College Algebra College Social Science College Biology Students Who Met All 4 ACTBenchmark Scores
A benchmark score is the minimum score needed on an ACT subject-area test to indicate a 50% chance of obtaining a B or higher or about a 75% chance of obtaining a C or higher in the corresponding credit-bearing college course.
State
National
ACT EnglishBenchmark Score=18
ACT MathBenchmark Score=22
ACT ReadingBenchmark Score=22
ACT ScienceBenchmark Score=23
ACT PROFILE REPORT - State: SECTION I, EXECUTIVE SUMMARY PAGE 7
Graduating Class 2016 Code 259999
Mississippi
Total Students in Report: 35,678
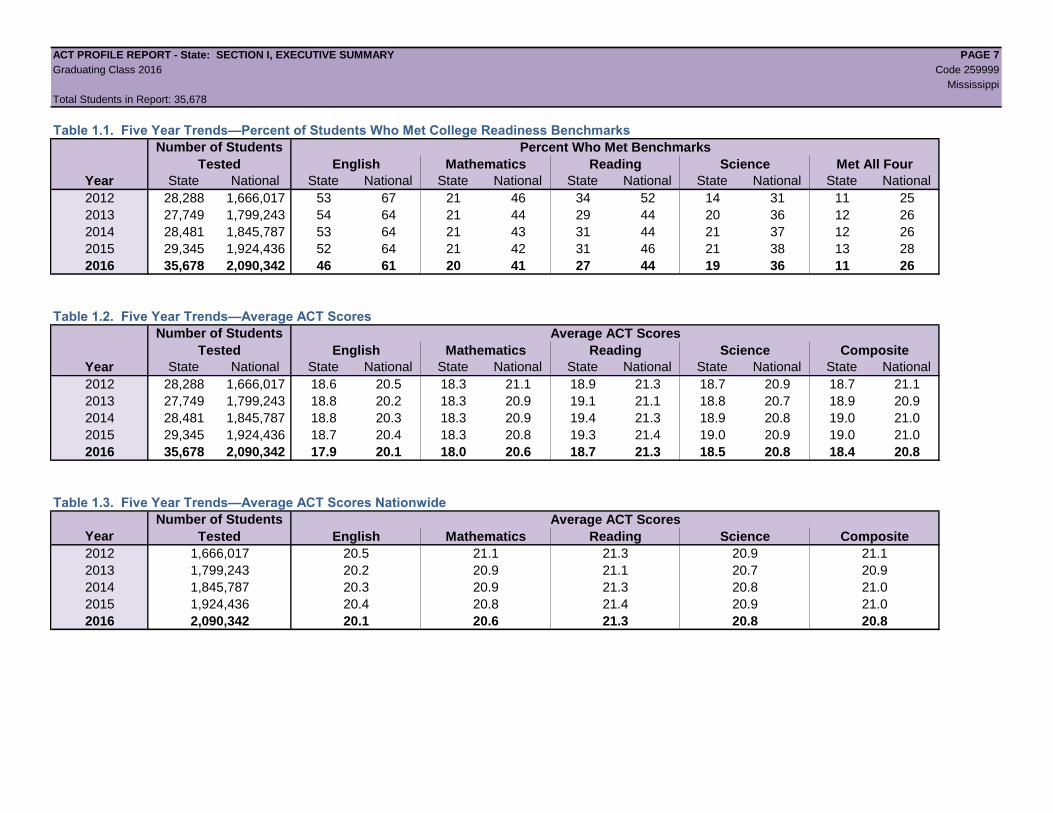
Table 1.1. Five Year Trends—Percent of Students Who Met College Readiness Benchmarks
Percent Who Met Benchmarks
English Mathematics Reading Science Met All Four
Year State National State National State National State National State National State National
2012 28,288 1,666,017 53 67 21 46 34 52 14 31 11 25
2013 27,749 1,799,243 54 64 21 44 29 44 20 36 12 26
2014 28,481 1,845,787 53 64 21 43 31 44 21 37 12 26
2015 29,345 1,924,436 52 64 21 42 31 46 21 38 13 28
2016 35,678 2,090,342 46 61 20 41 27 44 19 36 11 26
Table 1.2. Five Year Trends—Average ACT Scores
Average ACT Scores
English Mathematics Reading Science Composite
Year State National State National State National State National State National State National
2012 28,288 1,666,017 18.6 20.5 18.3 21.1 18.9 21.3 18.7 20.9 18.7 21.1
2013 27,749 1,799,243 18.8 20.2 18.3 20.9 19.1 21.1 18.8 20.7 18.9 20.9
2014 28,481 1,845,787 18.8 20.3 18.3 20.9 19.4 21.3 18.9 20.8 19.0 21.0
2015 29,345 1,924,436 18.7 20.4 18.3 20.8 19.3 21.4 19.0 20.9 19.0 21.0
2016 35,678 2,090,342 17.9 20.1 18.0 20.6 18.7 21.3 18.5 20.8 18.4 20.8
Table 1.3. Five Year Trends—Average ACT Scores Nationwide
Average ACT Scores
Year English Mathematics Reading Science Composite
2012 1,666,017 20.5 21.1 21.3 20.9 21.1
2013 1,799,243 20.2 20.9 21.1 20.7 20.9
2014 1,845,787 20.3 20.9 21.3 20.8 21.0
2015 1,924,436 20.4 20.8 21.4 20.9 21.0
2016 2,090,342 20.1 20.6 21.3 20.8 20.8
Number of Students
Tested
Number of Students
Tested
Number of Students
Tested

ACT PROFILE REPORT - State: SECTION I, EXECUTIVE SUMMARY PAGE 8
Graduating Class 2016 Code 259999
Mississippi
Total Students in Report: 35,678
Table 1.4. Five Year Trends—Average ACT Scores by Level of Preparation
Average ACT Scores
Number of
Students Tested Percent2
English Mathematics Reading Science Composite
Year
Core or
More1
Less than
Core
Core
or
More
Less
than
Core
Core or
More
Less than
Core
Core or
More
Less than
Core
Core or
More
Less than
Core
Core or
More
Less than
Core
Core or
More
Less than
Core
2012 21,238 6,794 75 24 19.4 16.2 18.8 16.8 19.5 17.1 19.2 17.1 19.4 16.9
2013 20,963 6,370 76 23 19.6 16.6 18.8 16.8 19.7 17.4 19.3 17.4 19.5 17.2
2014 20,825 7,227 73 25 19.7 16.6 18.9 16.8 20.1 17.7 19.5 17.3 19.6 17.2
2015 20,719 7,764 71 26 19.6 16.6 18.9 17.0 20.0 17.6 19.7 17.7 19.7 17.4
2016 21,332 12,627 60 35 19.4 15.9 18.9 16.8 19.9 17.2 19.5 17.1 19.5 16.91"Core or More" results correspond to students taking four or more years of English AND three or more years each of math, social studies, and natural science.
2Percent of all students tested. Numbers will not add up to 100% due to student non-response.
Table 1.5. Five Year Trends—Percent and Average Composite Score by Race/Ethnicity
2012 2013 2014 2015 2016
N % Avg N % Avg N % Avg N % Avg N % Avg
All Students 28,288 100 18.7 27,749 100 18.9 28,481 100 19.0 29,345 100 19.0 35,678 100 18.4
Black/African American 11,549 41 16.3 11,183 40 16.5 11,355 40 16.5 11,658 40 16.6 14,405 40 16.1
American Indian/Alaska Native 132 0 17.0 124 0 17.5 134 0 17.2 160 1 17.6 227 1 16.6
White 14,143 50 20.6 13,834 50 20.7 14,149 50 20.8 14,091 48 20.8 16,135 45 20.4
Hispanic/Latino 680 2 19.0 664 2 19.1 829 3 19.1 863 3 18.8 1,150 3 18.5
Asian 304 1 22.2 309 1 22.8 309 1 22.8 338 1 22.7 365 1 22.6
Native Hawaiian/Other Pacific Islander 17 0 18.6 17 0 19.1 16 0 18.6 20 0 16.4 33 0 17.8
Two or more races 562 2 19.2 595 2 19.8 633 2 20.0 744 3 19.8 922 3 19.5
Prefer not to respond/No response 901 3 19.3 1,023 4 19.3 1,056 4 19.2 1,471 5 19.2 2,441 7 17.7

ACT PROFILE REPORT - State: SECTION I, EXECUTIVE SUMMARY PAGE 9
Graduating Class 2016 Code 259999
Mississippi
Total Students in Report: 35,678
Table 1.6. Five Year Trends—Achievement in STEM1
All Tested Students Students Meeting STEM Benchmarks
Number of
Students Tested Avg. STEM Score Percent Meeting STEM Benchmark Avg. Mathematics Score Avg. Science Score
Year State National State National State National State National State National
2012 28,288 1,666,017 18.7 21.3 7 20 27.7 28.7 28.0 27.9
2013 27,749 1,799,243 18.8 21.1 7 19 27.6 28.7 27.9 28.0
2014 28,481 1,845,787 18.9 21.1 8 20 27.7 28.7 28.3 28.3
2015 29,345 1,924,436 18.9 21.1 8 20 27.7 28.7 28.4 28.4
2016 35,678 2,090,342 18.5 20.9 7 20 27.7 28.7 28.2 28.61The STEM score describes students' overall proficiency in mathematics and science.
Table 1.7. Proficiency In Understanding Complex Texts1
Text Complexity Proficiency Level
Below Proficient Proficient Above Proficient
N Percent Avg. Reading N Percent Avg. Reading N Percent Avg. Reading
Year State National State National State National State National State National State National State National State National State National
2012 0 0 0 0 . . 0 0 0 0 . . 0 0 0 0 . .
2013 0 0 0 0 . . 0 0 0 0 . . 0 0 0 0 . .
2014 0 0 0 0 . . 0 0 0 0 . . 0 0 0 0 . .
2015 0 0 0 0 . . 0 0 0 0 . . 0 0 0 0 . .
2016 13,216 485,762 37 23 16.4 17.0 5,275 322,548 15 15 23.3 23.6 2,706 235,380 8 11 30.0 30.31The text complexity indicator, beginning in Fall 2015, represents students' progress toward understanding complex written material often encountered in college and careers.

ACT PROFILE REPORT - State: SECTION I, EXECUTIVE SUMMARY PAGE 10
Graduating Class 2016 Code 259999
Mississippi
Total Students in Report: 35,678
Table 1.8. Average ACT College Reportable Scores by Test Session Duration
Average ACT Scores
N Percent English Mathematics Reading Science Composite
Standard Time 34,214 96 18.1 18.1 18.8 18.6 18.5
Extended Time 1,464 4 13.7 16.0 15.9 15.8 15.5
Total 35,678 100 17.9 18.0 18.7 18.5 18.4
Standard Time 1,985,389 95 20.3 20.7 21.4 20.9 21.0
Extended Time 104,953 5 16.6 18.0 18.9 18.2 18.0
Total 2,090,342 100 20.1 20.6 21.3 20.8 20.8
Table 1.9. Percent of Students Who Met College Readiness Benchmark Scores by Test Session Duration
Percent of Students Met
English Mathematics Reading Science All Four
Standard Time 47 20 27 19 12
Extended Time 23 9 15 9 6
Total 46 20 27 19 11
Standard Time 63 42 45 37 27
Extended Time 39 22 31 23 16
Total 61 41 44 36 26
State
National
Student GroupTest Session
Duration
State
National
Student GroupTest Session
Duration

ACT PROFILE REPORT- State: SECTION II, ACADEMIC ACHIEVEMENT PAGE 11
Graduating Class 2016 Code 259999
Mississippi
Total Students in Report: 35,678
Section II
Academic Achievement
Beginning with the Graduating Class of 2013, all students whose scores are college reportable, both standard and extended time tests, are now included.
Also beginning with the 2013 Graduating Class data, College Readiness Benchmarks for Reading and Science were updated to reflect the most recent
college coursework research.

ACT PROFILE REPORT- State: SECTION II, ACADEMIC ACHIEVEMENT PAGE 12
Graduating Class 2016 Code 259999
Mississippi
Total Students in Report: 35,678
Table 2.1. ACT Score Distributions, Cumulative Percentages (CP1), and Score Averages
English Mathematics Reading Science Composite STEM
N CP N CP N CP N CP N CP N CP
36 90 100 25 100 86 100 62 100 15 100 25 100 36
35 368 99 46 99 179 99 70 99 33 99 23 99 35
34 365 99 44 99 312 99 103 99 96 99 65 99 34
33 321 98 61 99 268 98 111 99 140 99 87 99 33
32 264 97 80 99 467 98 115 99 164 99 104 99 32
31 387 96 123 99 392 96 183 99 239 99 146 99 31
30 427 95 143 99 604 95 145 98 414 98 185 99 30
29 430 94 250 99 479 94 226 98 418 97 266 98 29
28 541 93 449 98 539 92 335 97 489 96 377 97 28
27 510 91 619 97 622 91 468 96 626 94 525 96 27
26 778 90 764 95 693 89 586 95 727 93 745 95 26
25 958 87 741 93 752 87 1,196 93 897 91 961 93 25
24 1,362 85 1,333 91 1,061 85 1,675 90 1,191 88 1,197 90 24
23 1,209 81 1,141 87 1,658 82 1,463 85 1,238 85 1,319 87 23
22 1,526 78 1,145 84 1,442 77 2,449 81 1,558 81 1,469 83 22
21 1,951 73 1,087 80 2,499 73 1,898 74 1,982 77 1,891 79 21
20 1,978 68 1,158 77 1,696 66 3,368 69 2,202 71 2,400 74 20
19 1,542 62 1,633 74 2,541 61 2,630 59 2,519 65 3,054 67 19
18 1,568 58 2,992 70 2,692 54 3,424 52 2,958 58 3,779 58 18
17 1,601 54 4,320 61 2,333 47 2,408 43 3,153 50 4,183 48 17
16 2,378 49 6,982 49 2,482 40 2,813 36 3,379 41 3,898 36 16
15 2,850 42 5,835 30 2,299 33 2,256 28 3,299 32 3,655 25 15
14 2,727 34 2,884 13 2,983 27 2,611 22 3,099 22 2,672 15 14
13 1,960 27 1,246 5 2,250 18 1,571 14 2,555 14 1,578 7 13
12 1,789 21 387 2 2,441 12 1,379 10 1,476 6 740 3 12
11 1,964 16 123 1 817 5 828 6 568 2 241 1 11
10 1,767 11 39 1 549 3 617 4 173 1 67 1 10
9 877 6 19 1 282 2 370 2 45 1 18 1 9
8 701 3 0 1 134 1 244 1 14 1 2 1 8
7 273 1 5 1 72 1 44 1 7 1 2 1 7
6 133 1 2 1 8 1 5 1 3 1 2 1 6
5 50 1 0 1 25 1 17 1 1 1 1 1 5
4 19 1 2 1 15 1 5 1 0 1 0 1 4
3 5 1 0 1 1 1 0 1 0 1 1 1 3
2 8 1 0 1 2 1 2 1 0 1 0 1 2
1 1 1 0 1 3 1 1 1 0 1 0 1 1
Avg (SD) 17.9 (6.4) 18.0 (4.1) 18.7 (5.7) 18.5 (4.8) 18.4 (4.8) 18.5 (4.2) Avg (SD)1CP is the cumulative percent of students at or below a score point.
Note: Shaded portions of columns identify the students who met/exceeded the ACT College Readiness Benchmark Scores.
ACT Scale
Score
ACT Scale
Score

ACT PROFILE REPORT- State: SECTION II, ACADEMIC ACHIEVEMENT PAGE 13
Graduating Class 2016 Code 259999
Mississippi
Total Students in Report: 35,678
Table 2.2. ACT Subscore Distributions, Cumulative Percentages (CP1), and Subscore Averages
English Reading Mathematics
Usage/ Mechanics Rhetorical Skills
Social Studies/
Sciences Arts/ Literature
Pre/Elementary
Algebra
Algebra/ Coordinate
Geometry
Plane Geometry/
Trigonometry
N CP N CP N CP N CP N CP N CP N CP
18 867 100 228 100 346 100 569 100 272 100 109 100 68 100 18
17 1,114 98 517 99 784 99 842 98 413 99 40 99 19 99 17
16 730 94 858 98 1,129 97 1,252 96 564 98 235 99 274 99 16
15 1,028 92 1,478 96 846 94 1,282 93 865 96 698 99 637 99 15
14 962 90 1,357 91 2,075 91 1,347 89 1,104 94 1,063 97 937 97 14
13 1,662 87 1,524 88 1,623 85 1,793 85 1,870 91 1,673 94 1,427 95 13
12 1,899 82 2,530 83 2,743 81 2,053 80 2,183 86 3,119 89 1,606 91 12
11 2,411 77 2,776 76 2,755 73 2,508 74 2,397 80 3,699 81 3,071 86 11
10 3,358 70 2,936 68 3,621 66 3,150 67 2,217 73 5,080 70 4,441 77 10
9 3,225 61 4,277 60 4,697 55 3,118 59 3,042 67 6,140 56 6,328 65 9
8 3,292 52 4,512 48 5,065 42 3,500 50 5,199 58 6,840 39 7,277 47 8
7 3,503 42 3,479 36 3,974 28 4,197 40 7,386 44 2,365 20 2,621 27 7
6 3,587 33 3,402 26 3,120 17 3,722 28 4,226 23 2,337 13 2,305 20 6
5 3,384 23 3,113 16 1,604 8 3,730 18 2,278 11 640 6 2,914 13 5
4 2,420 13 1,787 8 781 4 1,606 7 1,018 5 962 5 68 5 4
3 1,411 6 712 3 348 1 676 3 554 2 432 2 1,262 5 3
2 731 2 169 1 90 1 322 1 78 1 129 1 28 1 2
1 94 1 23 1 77 1 11 1 12 1 117 1 395 1 1
Avg (SD) 8.8 (3.9) 9.0 (3.4) 9.6 (3.3) 9.1 (3.7) 8.7 (3.1) 9.3 (2.6) 8.7 (2.8) Avg (SD)1CP is the cumulative percent of students at or below a score point.
Table 2.3. ACT Score Quartile ValuesQuartile English Mathematics Reading Science Composite
Q3 (75th Percentile) 22 20 22 22 21
Q2 (50th Percentile) 17 17 18 18 18
Q1 (25th Percentile) 13 15 14 15 15
ACT Scale
Score
ACT Scale
Score

ACT PROFILE REPORT- State: SECTION II, ACADEMIC ACHIEVEMENT PAGE 14
Graduating Class 2016 Code 259999
Mississippi
Total Students in Report: 35,678
Table 2.4. Average ACT Composite Scores for Race/Ethnicity by Level of Preparation
Student Number of Percent Taking Average ACT Composite Score
Group Race/Ethnicity Students Tested Core or More1
Core or More Less Than CoreAll Students 35,678 60 19.5 16.9
Black/African American 14,405 58 16.8 15.3
American Indian/Alaska Native 227 52 18.3 15.1
White 16,135 63 21.6 18.4
Hispanic/Latino 1,150 57 19.6 17.4
Asian 365 73 23.7 20.8
Native Hawaiian/Other Pac. Isl. 33 55 18.4 18.0
Two or More Races 922 66 20.4 17.8
Prefer not/No Response 2,441 46 19.4 16.1
All Students 2,090,342 69 21.9 18.7
Black/African American 272,363 64 17.8 15.7
American Indian/Alaska Native 16,183 57 18.9 16.3
White 1,119,398 73 23.2 20.0
Hispanic/Latino 337,280 69 19.5 17.3
Asian 93,493 78 24.7 22.1
Native Hawaiian/Other Pac. Isl. 6,797 61 20.1 16.6
Two or More Races 85,494 70 21.9 19.0
Prefer not/No Response 159,334 48 22.3 18.21"Core or More" results correspond to students taking four or more years of English AND three or more years each of math, social studies, and natural science.
Table 2.5. Average ACT Scores by Race/Ethnicity
Student
Group Race/Ethnicity N Percent English Mathematics Reading Science Composite STEMAll Students 35,678 100 17.9 18.0 18.7 18.5 18.4 18.5
Black/African American 14,405 40 14.9 16.2 16.3 16.5 16.1 16.6
American Indian/Alaska Native 227 1 15.3 16.9 16.7 17.3 16.6 17.3
White 16,135 45 20.6 19.5 20.8 20.3 20.4 20.1
Hispanic/Latino 1,150 3 17.9 18.3 18.8 18.6 18.5 18.7
Asian 365 1 22.4 23.2 22.1 22.3 22.6 23.0
Native Hawaiian/Other Pac. Isl. 33 0 17.1 17.5 18.1 18.0 17.8 18.1
Two or More Races 922 3 19.3 18.7 20.0 19.5 19.5 19.4
Prefer not/No Response 2,441 7 16.8 17.5 18.0 17.7 17.7 17.9
All Students 2,090,342 100 20.1 20.6 21.3 20.8 20.8 20.9
Black/African American 272,363 13 15.8 17.0 17.4 17.2 17.0 17.3
American Indian/Alaska Native 16,183 1 16.3 17.7 18.2 18.1 17.7 18.2
White 1,119,398 54 21.9 21.7 22.8 22.1 22.2 22.1
Hispanic/Latino 337,280 16 17.6 18.8 19.2 18.9 18.7 19.1
Asian 93,493 4 23.3 25.0 23.7 23.6 24.0 24.6
Native Hawaiian/Other Pac. Isl. 6,797 0 17.4 18.9 18.9 18.6 18.6 19.0
Two or More Races 85,494 4 20.4 20.5 21.6 20.9 21.0 21.0
Prefer not/No Response 159,334 8 19.3 20.0 20.6 20.0 20.1 20.3
National
State
National
State

ACT PROFILE REPORT- State: SECTION II, ACADEMIC ACHIEVEMENT PAGE 15
Graduating Class 2016 Code 259999
Mississippi
Total Students in Report: 35,678
Table 2.6. Average ACT Composite Scores for Gender by Level of Preparation
Number of Percent Taking Average ACT Composite Score
Students Tested Core or More1
Core or More Less Than Core
Males 16,962 58 19.5 16.4
Females 17,720 63 19.6 17.4
No Response 996 40 18.6 15.9
Males 971,383 68 22.1 18.5
Females 1,074,049 72 21.7 19.1
No Response 44,910 28 19.3 16.5
Table 2.7. Average ACT Scores by Gender
Student Group Gender N Percent English Mathematics Reading Science Composite STEM
Males 16,962 48 17.3 18.1 18.2 18.5 18.1 18.5
Females 17,720 50 18.6 17.9 19.3 18.6 18.8 18.5
No Response 996 3 15.8 17.1 17.3 17.0 16.9 17.3
Males 971,383 46 19.8 21.0 21.0 21.1 20.9 21.3
Females 1,074,049 51 20.6 20.3 21.6 20.6 20.9 20.7
No Response 44,910 2 16.5 17.9 18.0 17.9 17.7 18.2
National
Student Group
State
National
Gender
State

ACT PROFILE REPORT- State: SECTION II, ACADEMIC ACHIEVEMENT PAGE 16
Graduating Class 2016 Code 259999
Mississippi
Total Students in Report: 35,678
This page intentionally left blank.

ACT PROFILE REPORT - State: SECTION III, COLLEGE AND CAREER READINESS & THE IMPACT OF COURSE RIGOR PAGE 17
Graduating Class 2016 Code 259999
Mississippi
Total Students in Report: 35,678
Section III
College and Career Readiness
and the Impact of Course Rigor
Beginning with the Graduating Class of 2013, all students whose scores are college reportable, both standard and extended time tests, are now included.
Also beginning with the 2013 Graduating Class data, College Readiness Benchmarks for Reading and Science were updated to reflect the most recent
college coursework research.

ACT PROFILE REPORT - State: SECTION III, COLLEGE AND CAREER READINESS & THE IMPACT OF COURSE RIGOR PAGE 18
Graduating Class 2016 Code 259999
Mississippi
Total Students in Report: 35,678
Table 3.1. Percent of Students in College and Career Readiness Standards (CCRS) Score Ranges
Student English Mathematics Reading Science
Group N % N % N % N %
33 to 36 1,144 3 176 0 845 2 346 1
28 to 32 2,049 6 1,045 3 2,481 7 1,004 3
24 to 27 3,608 10 3,457 10 3,128 9 3,925 11
20 to 23 6,664 19 4,531 13 7,295 20 9,178 26
16 to 19 7,089 20 15,927 45 10,048 28 11,275 32
13 to 15 7,537 21 9,965 28 7,532 21 6,438 18
01 to 12 7,587 21 577 2 4,349 12 3,512 10
33 to 36 116,080 6 59,483 3 130,942 6 72,515 3
28 to 32 200,641 10 192,181 9 275,075 13 157,797 8
24 to 27 315,883 15 404,868 19 295,645 14 407,121 19
20 to 23 472,860 23 351,510 17 483,472 23 578,034 28
16 to 19 378,663 18 701,208 34 451,883 22 502,407 24
13 to 15 317,275 15 353,660 17 297,137 14 234,398 11
01 to 12 288,940 14 27,432 1 156,188 7 138,070 7
Table 3.2. Percent of Students Who Met College Readiness Benchmark Scores by Gender
Percent of Students Met
English Mathematics Reading Science All Four
Males 42 21 25 20 12
Females 51 19 29 18 11
No Response 35 15 19 14 8
Males 59 44 43 39 28
Females 64 39 47 34 25
No Response 39 21 24 18 11
National
Student Group
CRS
Range
State
National
Gender
State
ACT PROFILE REPORT - State: SECTION III, COLLEGE AND CAREER READINESS & THE IMPACT OF COURSE RIGOR PAGE 19
Graduating Class 2016 Code 259999
Mississippi
Total Students in Report: 35,678
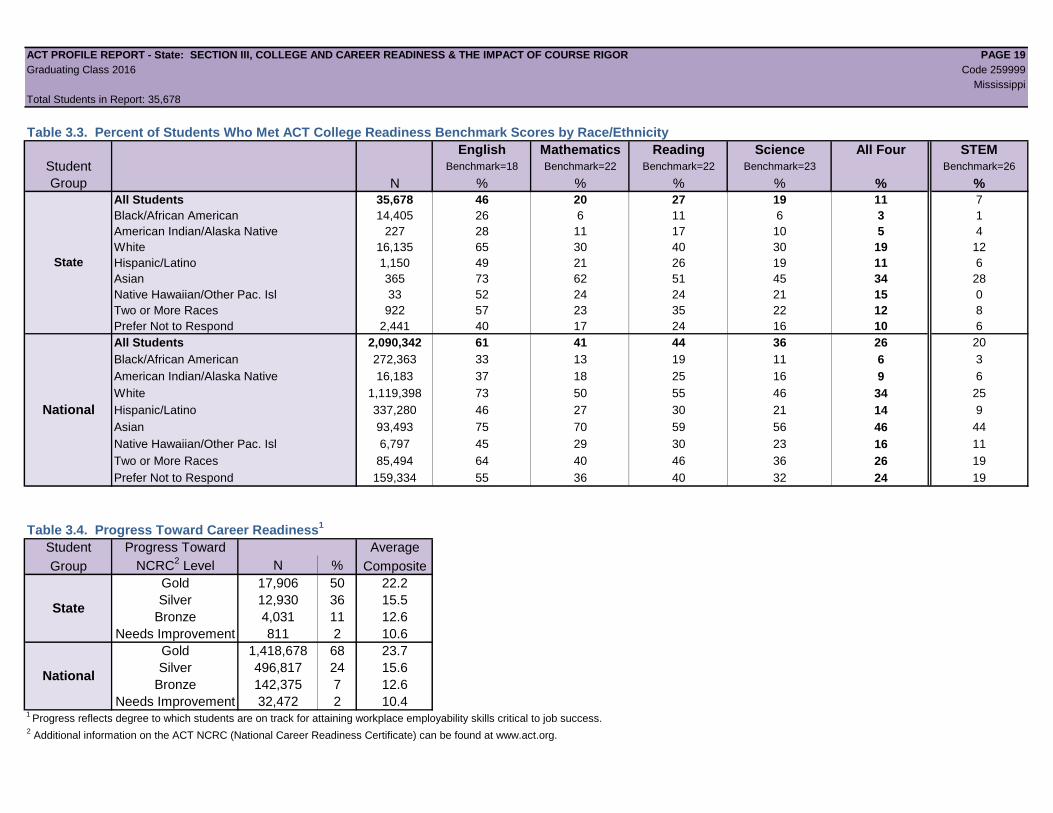
Table 3.3. Percent of Students Who Met ACT College Readiness Benchmark Scores by Race/Ethnicity
English Mathematics Reading Science All Four STEM
Student Benchmark=18 Benchmark=22 Benchmark=22 Benchmark=23 Benchmark=26
Group N % % % % % %
All Students 35,678 46 20 27 19 11 7
Black/African American 14,405 26 6 11 6 3 1
American Indian/Alaska Native 227 28 11 17 10 5 4
White 16,135 65 30 40 30 19 12
Hispanic/Latino 1,150 49 21 26 19 11 6
Asian 365 73 62 51 45 34 28
Native Hawaiian/Other Pac. Isl 33 52 24 24 21 15 0
Two or More Races 922 57 23 35 22 12 8
Prefer Not to Respond 2,441 40 17 24 16 10 6
All Students 2,090,342 61 41 44 36 26 20
Black/African American 272,363 33 13 19 11 6 3
American Indian/Alaska Native 16,183 37 18 25 16 9 6
White 1,119,398 73 50 55 46 34 25
Hispanic/Latino 337,280 46 27 30 21 14 9
Asian 93,493 75 70 59 56 46 44
Native Hawaiian/Other Pac. Isl 6,797 45 29 30 23 16 11
Two or More Races 85,494 64 40 46 36 26 19
Prefer Not to Respond 159,334 55 36 40 32 24 19
Table 3.4. Progress Toward Career Readiness1
Student Progress Toward Average
Group NCRC2 Level N % Composite
Gold 17,906 50 22.2
Silver 12,930 36 15.5
Bronze 4,031 11 12.6
Needs Improvement 811 2 10.6
Gold 1,418,678 68 23.7
Silver 496,817 24 15.6
Bronze 142,375 7 12.6
Needs Improvement 32,472 2 10.41
Progress reflects degree to which students are on track for attaining workplace employability skills critical to job success.2 Additional information on the ACT NCRC (National Career Readiness Certificate) can be found at www.act.org.
State
National
State
National

ACT PROFILE REPORT - State: SECTION III, COLLEGE AND CAREER READINESS & THE IMPACT OF COURSE RIGOR PAGE 20
Graduating Class 2016 Code 259999
Mississippi
Total Students in Report: 35,678
Table 3.5. College Readiness Benchmark Percent and Average ACT Scores by Overall High School Curriculum
Student Curriculum English Mathematics Reading Science Composite4
STEM
Group Taken1 % Avg % Avg % Avg % Avg % Avg % Avg
Core or More2
21,332 56 19.4 26 18.9 34 19.9 25 19.5 16 19.5 10 19.5
Less than Core 12,627 33 15.9 10 16.8 17 17.2 10 17.1 5 16.9 2 17.2
Missing3
1,719 24 14.0 7 16.0 14 15.9 8 15.7 4 15.5 2 16.1
Core or More 1,441,538 69 21.3 48 21.5 51 22.3 43 21.7 32 21.9 24 21.9
Less than Core 483,335 46 17.8 26 18.7 31 19.2 23 18.8 15 18.7 11 19.0
Missing 165,469 38 16.4 20 17.7 24 18.0 18 17.8 11 17.6 8 18.01 "Curriculum Taken" reflects overall high school curriculum in this table.
2 "Core or More" results correspond to students taking four or more years of English AND three or more years each of math, social studies, and natural science.
3 Zero years or no coursework information reported in one or more content areas.
4 Composite College Readiness Benchmark % results reflect students who met all four subject-area benchmarks.
Table 3.6. College Readiness Benchmark Percent and Average ACT Scores by Content-Specific Curriculum
Student Curriculum English Mathematics Reading Science
Group Taken1 N % Avg N % Avg N % Avg N % Avg
Core or More2
31,524 49 18.4 31,680 21 18.3 30,745 30 19.2 23,658 23 19.2
Less than Core 2,806 22 14.0 2,538 2 15.4 3,435 8 15.4 10,471 11 17.2
Missing3
1,348 26 14.4 1,460 8 16.1 1,498 14 16.1 1,549 8 15.9
Core or More 1,821,855 65 20.7 1,834,921 44 21.0 1,707,404 48 21.8 1,679,561 41 21.4
Less than Core 121,175 34 15.8 101,097 8 16.1 229,685 32 19.2 255,155 17 18.0
Missing 147,312 40 16.6 154,324 20 17.8 153,253 25 18.2 155,626 19 18.01
"Curriculum Taken" reflects content-specific curriculum in this table.2 "Core or More" results correspond to students taking four or more years of English or three or more years of math, social studies, or natural science, respectively.
For instance, Reading "Core or More" results correspond to students taking three or more years of social studies, regardless of courses taken in other content areas.3 Zero years or no coursework information reported in the specified content area.
National
N
State
National
State

ACT PROFILE REPORT - State: SECTION III, COLLEGE AND CAREER READINESS & THE IMPACT OF COURSE RIGOR PAGE 21
Graduating Class 2016 Code 259999
Mississippi
Total Students in Report: 35,678
Table 3.7. College Readiness Benchmark (CRB) Percent and Average ACT Scores by Common Course PatternsCourse Pattern State National
ENGLISH COURSE PATTERN N
Percent Taking
Pattern
Avg ACT
English
Percent Who Met
Benchmark N
Percent Taking
Pattern
Avg ACT
English
Percent Who Met
Benchmark
Eng 9, Eng 10, Eng 11, Eng 12, & Other English 6,781 19 20.0 60 385,251 18 21.7 71
Eng 9, Eng 10, Eng 11, Eng 12 24,743 69 18.0 47 1,436,604 69 20.4 63
Less than 4 years of English 2,806 8 14.0 22 121,175 6 15.8 34
Zero years / no English courses reported 1,348 4 14.4 26 147,312 7 16.6 40
MATHEMATICS COURSE PATTERN N
Percent Taking
Pattern
Avg ACT
Math
Percent Who Met
Benchmark N
Percent Taking
Pattern
Avg ACT
Math
Percent Who Met
Benchmark
Alg 1, Alg 2, Geom, Trig, & Calc 1,881 5 18.6 24 125,390 6 23.2 63
Alg 1, Alg 2, Geom, Trig, & Other Adv Math 2,510 7 20.3 39 163,212 8 21.6 52
Alg 1, Alg 2, Geom, & Trig 2,662 7 17.2 13 126,596 6 18.9 27
Alg 1, Alg 2, Geom, & Other Adv Math 3,314 9 18.1 18 379,347 18 19.3 30
Other comb of 4 or more years of Math 10,906 31 20.0 36 689,169 33 23.6 64
Alg 1, Alg 2, & Geom 8,243 23 16.2 4 243,569 12 16.8 10
Other comb of 3 or 3.5 years of Math 2,164 6 16.8 8 107,638 5 19.5 32
Less than 3 years of Math 2,538 7 15.4 2 101,097 5 16.1 8
Zero years / no Math courses reported 1,460 4 16.1 8 154,324 7 17.8 20
SOCIAL SCIENCE COURSE PATTERN N
Percent Taking
Pattern
Avg ACT
Reading
Percent Who Met
Benchmark N
Percent Taking
Pattern
Avg ACT
Reading
Percent Who Met
Benchmark
US Hist, World Hist, Am Gov, & Other Hist 285 1 17.7 23 51,783 2 22.1 50
Other comb of 4 or more years Social Science 24,935 70 19.7 33 979,530 47 22.3 51
US Hist, World Hist, & Am Gov 402 1 16.0 10 120,501 6 19.6 33
Other comb of 3 or 3.5 years of Social Science 5,123 14 17.2 16 555,590 27 21.4 45
Less than 3 years of Social Science 3,435 10 15.4 8 229,685 11 19.2 32
Zero years / no Social Science courses reported 1,498 4 16.1 14 153,253 7 18.2 25
NATURAL SCIENCE COURSE PATTERN N
Percent Taking
Pattern
Avg ACT
Science
Percent Who Met
Benchmark N
Percent Taking
Pattern
Avg ACT
Science
Percent Who Met
Benchmark
Gen Sci1, Bio, Chem, & Phys 10,464 29 19.3 25 844,557 40 22.1 46
Bio, Chem, Phys 2,031 6 22.1 46 233,024 11 23.0 52
Gen Sci1, Bio, Chem 10,105 28 18.8 18 542,380 26 20.0 29
Other comb of 3 years of Natural Science 1,058 3 16.9 9 59,600 3 19.0 23
Less than 3 years of Natural Science 10,471 29 17.2 11 255,155 12 18.0 17
Zero years / no Natural Science courses reported 1,549 4 15.9 8 155,626 7 18.0 191Includes General, Physical and Earth Sciences.

ACT PROFILE REPORT - State: SECTION III, COLLEGE AND CAREER READINESS & THE IMPACT OF COURSE RIGOR PAGE 22
Graduating Class 2016 Code 259999
Mississippi
Total Students in Report: 35,678
Table 3.8. College Readiness Benchmark (CRB) Percent and Average ACT Scores for Gender by Common Course PatternsCourse Pattern All Students Males Females
ENGLISH COURSE PATTERN N Percent
ACT
English
% Who Met
Benchmark N Percent
ACT
English
% Who Met
Benchmark N Percent
ACT
English
% Who Met
Benchmark
Eng 9, Eng 10, Eng 11, Eng 12, & Other English 6,781 19 20.0 60 2,868 17 19.4 56 3,840 22 20.5 64
Eng 9, Eng 10, Eng 11, Eng 12 24,743 69 18.0 47 11,744 69 17.5 43 12,348 70 18.5 50
Less than 4 years of English 2,806 8 14.0 22 1,599 9 13.5 18 1,063 6 14.9 28
Zero years / no English courses reported 1,348 4 14.4 26 751 4 14.0 25 469 3 15.2 31
MATHEMATICS COURSE PATTERN N Percent
ACT
Math
% Who Met
Benchmark N Percent
ACT
Math
% Who Met
Benchmark N Percent
ACT
Math
% Who Met
Benchmark
Alg 1, Alg 2, Geom, Trig, & Calc 1,881 5 18.6 24 802 5 19.1 28 1,035 6 18.2 20
Alg 1, Alg 2, Geom, Trig, & Other Adv Math 2,510 7 20.3 39 1,010 6 20.7 43 1,463 8 20.0 36
Alg 1, Alg 2, Geom, & Trig 2,662 7 17.2 13 1,235 7 17.5 15 1,337 8 17.1 11
Alg 1, Alg 2, Geom, & Other Adv Math 3,314 9 18.1 18 1,405 8 18.2 21 1,833 10 18.0 17
Other comb of 4 or more years of Math 10,906 31 20.0 36 5,017 30 20.4 39 5,678 32 19.7 33
Alg 1, Alg 2, & Geom 8,243 23 16.2 4 4,098 24 16.3 5 3,930 22 16.1 3
Other comb of 3 or 3.5 years of Math 2,164 6 16.8 8 1,077 6 17.0 10 1,024 6 16.5 6
Less than 3 years of Math 2,538 7 15.4 2 1,488 9 15.4 2 923 5 15.4 2
Zero years / no Math courses reported 1,460 4 16.1 8 830 5 16.0 8 497 3 16.2 7
SOCIAL SCIENCE COURSE PATTERN N Percent
ACT
Reading
% Who Met
Benchmark N Percent
ACT
Reading
% Who Met
Benchmark N Percent
ACT
Reading
% Who Met
Benchmark
US Hist, World Hist, Am Gov, & Other Hist 285 1 17.7 23 164 1 17.3 22 111 1 18.3 24
Other comb of 4 or more years Social Science 24,935 70 19.7 33 11,125 66 19.3 31 13,340 75 20.0 34
US Hist, World Hist, & Am Gov 402 1 16.0 10 206 1 15.6 7 175 1 16.6 15
Other comb of 3 or 3.5 years of Social Science 5,123 14 17.2 16 2,549 15 16.9 15 2,382 13 17.7 18
Less than 3 years of Social Science 3,435 10 15.4 8 2,052 12 15.1 7 1,204 7 15.9 8
Zero years / no Social Science courses reported 1,498 4 16.1 14 866 5 15.6 13 508 3 17.0 17
NATURAL SCIENCE COURSE PATTERN N Percent
ACT
Science
% Who Met
Benchmark N Percent
ACT
Science
% Who Met
Benchmark N Percent
ACT
Science
% Who Met
Benchmark
Gen Sci1, Bio, Chem, & Phys 10,464 29 19.3 25 5,087 30 19.7 28 5,190 29 19.1 23
Bio, Chem, Phys 2,031 6 22.1 46 953 6 23.0 52 1,023 6 21.5 41
Gen Sci2, Bio, Chem 10,105 28 18.8 18 4,374 26 18.6 18 5,501 31 19.0 18
Other comb of 3 years of Natural Science 1,058 3 16.9 9 564 3 17.1 12 465 3 16.8 6
Less than 3 years of Natural Science 10,471 29 17.2 11 5,117 30 16.9 10 4,996 28 17.6 11
Zero years / no Natural Science courses reported 1,549 4 15.9 8 867 5 15.9 9 545 3 16.0 81Includes General, Physical and Earth Sciences.

ACT PROFILE REPORT - State: SECTION IV, CAREER AND EDUCATIONAL ASPIRATIONS PAGE 23
Graduating Class 2016 Code 259999
Mississippi
Total Students in Report: 35,678
Section IV
Career and Educational Aspirations
Beginning with the Graduating Class of 2013, all students whose scores are college reportable, both standard and extended time tests, are now included.
Also beginning with the 2013 Graduating Class data, College Readiness Benchmarks for Reading and Science were updated to reflect the most recent
college coursework research.

ACT PROFILE REPORT - State: SECTION IV, CAREER AND EDUCATIONAL ASPIRATIONS PAGE 24
Graduating Class 2016 Code 259999
Mississippi
Total Students in Report: 35,678
Table 4.1. Distribution of Planned Educational Majors for All Students by College Plans
All Students Plan on 2 Years or Less of College Plan on 4 Years or More of College
Planned Educational Major N1
Percent2
Avg ACT
Comp N Percent
Avg ACT
Comp N Percent
Avg ACT
Comp
Agriculture & Natural Resources Conservation 790 2 17.0 193 4 15.0 547 2 17.9
Architecture 388 1 18.5 51 1 15.4 319 1 19.1
Area, Ethnic, & Multidisciplinary Studies 35 0 18.0 6 0 11.7 27 0 19.5
Arts: Visual & Performing 2,188 6 18.2 358 7 15.6 1,693 7 18.9
Business 2,386 7 18.1 402 8 15.2 1,881 7 18.9
Communications 421 1 19.0 39 1 15.5 365 1 19.5
Community, Family, & Personal Services 1,460 4 16.5 388 7 15.1 992 4 17.1
Computer Science & Mathematics 711 2 19.8 94 2 16.1 582 2 20.5
Education 1,729 5 18.2 199 4 15.4 1,467 6 18.6
Engineering 2,819 8 19.9 438 8 15.3 2,258 9 20.9
Engineering Technology & Drafting 711 2 17.3 200 4 14.9 476 2 18.5
English & Foreign Languages 220 1 22.4 10 0 18.8 204 1 22.7
Health Administration & Assisting 1,279 4 16.9 234 4 15.7 987 4 17.2
Health Sciences & Technologies 8,082 23 19.3 698 13 16.2 7,169 28 19.6
Philosophy, Religion, & Theology 131 0 19.5 7 0 15.6 120 0 19.7
Repair, Production, & Construction 1,122 3 15.8 668 13 15.6 390 2 16.4
Sciences: Biological & Physical 1,382 4 21.4 71 1 16.1 1,253 5 21.9
Social Sciences & Law 1,990 6 19.4 117 2 15.6 1,804 7 19.8
Undecided 3,900 11 18.9 631 12 15.6 2,777 11 19.9
No Response 3,694 10 15.9 308 6 13.5 468 2 15.212-Year and 4-Year "N" counts do not reflect "Missing" and "Other" college plans, therefore they may not add up to the N count for All Students.
2Percent of students tested within College Plan groups (All Students, 2-Year, 4-Year).
ACT PROFILE REPORT - State: SECTION IV, CAREER AND EDUCATIONAL ASPIRATIONS PAGE 25
Graduating Class 2016 Code 259999
Mississippi
Total Students in Report: 35,678
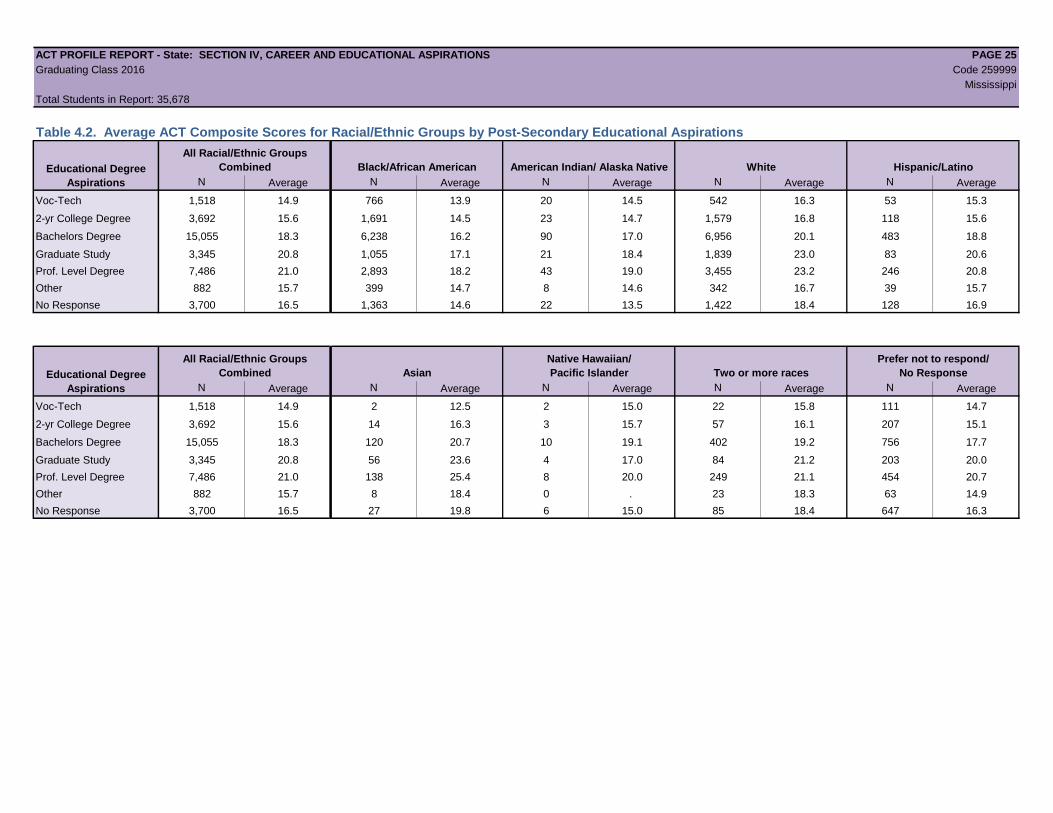
Table 4.2. Average ACT Composite Scores for Racial/Ethnic Groups by Post-Secondary Educational Aspirations
All Racial/Ethnic Groups
Combined Black/African American American Indian/ Alaska Native White Hispanic/Latino
N Average N Average N Average N Average N Average
Voc-Tech 1,518 14.9 766 13.9 20 14.5 542 16.3 53 15.3
2-yr College Degree 3,692 15.6 1,691 14.5 23 14.7 1,579 16.8 118 15.6
Bachelors Degree 15,055 18.3 6,238 16.2 90 17.0 6,956 20.1 483 18.8
Graduate Study 3,345 20.8 1,055 17.1 21 18.4 1,839 23.0 83 20.6
Prof. Level Degree 7,486 21.0 2,893 18.2 43 19.0 3,455 23.2 246 20.8
Other 882 15.7 399 14.7 8 14.6 342 16.7 39 15.7
No Response 3,700 16.5 1,363 14.6 22 13.5 1,422 18.4 128 16.9
All Racial/Ethnic Groups
Combined Asian
Native Hawaiian/
Pacific Islander Two or more races
Prefer not to respond/
No Response
N Average N Average N Average N Average N Average
Voc-Tech 1,518 14.9 2 12.5 2 15.0 22 15.8 111 14.7
2-yr College Degree 3,692 15.6 14 16.3 3 15.7 57 16.1 207 15.1
Bachelors Degree 15,055 18.3 120 20.7 10 19.1 402 19.2 756 17.7
Graduate Study 3,345 20.8 56 23.6 4 17.0 84 21.2 203 20.0
Prof. Level Degree 7,486 21.0 138 25.4 8 20.0 249 21.1 454 20.7
Other 882 15.7 8 18.4 0 . 23 18.3 63 14.9
No Response 3,700 16.5 27 19.8 6 15.0 85 18.4 647 16.3
Educational Degree
Aspirations
Educational Degree
Aspirations

ACT PROFILE REPORT - State: SECTION IV, CAREER AND EDUCATIONAL ASPIRATIONS PAGE 26
Graduating Class 2016 Code 259999
Mississippi
Total Students in Report: 35,678
Table 4.3. Students' Score Report Preferences at Time of Testing
Percent of Students in
Number of Students College Readiness Standards Ranges
Name State Total 1st Choice
2nd-6th
Choice 01-12 13-15 16-19 20-23 24-27 28-32 33-36
MISSISSIPPI STATE UNIVERSITY Mississippi 12,731 4,636 8,095 3 18 34 24 13 6 1
UNIVERSITY OF MISSISSIPPI Mississippi 8,932 2,865 6,067 2 13 31 27 17 9 1
UNIVERSITY SOUTHERN MISSISSIPPI Mississippi 6,680 1,563 5,117 3 18 36 25 13 5 0
JACKSON STATE UNIVERSITY Mississippi 3,342 841 2,501 9 37 39 12 3 0 0
JONES COUNTY JUNIOR COLLEGE Mississippi 2,727 1,135 1,592 6 27 38 20 8 2 0
ALCORN STATE UNIVERSITY Mississippi 2,655 957 1,698 10 40 38 10 2 0 0
NORTHWEST MISSISSIPPI COMMUNITY COLLEGE Mississippi 2,637 1,026 1,611 6 29 39 18 6 1 0
ITAWAMBA COMMUNITY COLLEGE Mississippi 2,582 1,134 1,448 6 25 41 19 7 2 0
DELTA STATE UNIVERSITY Mississippi 2,247 571 1,676 5 24 37 22 9 3 0
NORTHEAST MISSISSIPPI COMM COLL Mississippi 2,066 853 1,213 6 25 40 20 8 1 0
PEARL RIVER COMMUNITY COLLEGE Mississippi 2,059 679 1,380 6 27 39 20 7 1 0
HINDS COMM COLLEGE-RAYMOND CAMPUS Mississippi 1,888 667 1,221 6 33 38 16 5 1 0
HOLMES COMMUNITY COLLEGE Mississippi 1,872 574 1,298 8 29 36 20 6 1 0
EAST MISSISSIPPI COMM COLL Mississippi 1,719 547 1,172 8 36 36 15 4 1 0
MISSISSIPPI GULF COAST COMM COLLEGE Mississippi 1,666 636 1,030 3 20 38 25 13 3 0
MISSISSIPPI COLLEGE Mississippi 1,663 407 1,256 1 10 26 28 21 14 1
WILLIAM CAREY UNIVERSITY Mississippi 1,525 243 1,282 4 20 36 23 12 5 0
EAST CENTRAL COMMUNITY COLLEGE Mississippi 1,229 562 667 7 30 35 20 6 2 0
UNIVERSITY OF MEMPHIS Tennessee 1,142 257 885 4 19 37 25 11 4 0
LOUISIANA ST UNIV/A&M-BATON ROUGE Louisiana 1,060 264 796 4 20 30 22 15 9 1
MISSISSIPPI UNIV FOR WOMEN Mississippi 1,055 193 862 2 18 40 25 10 4 0
UNIVERSITY OF ALABAMA Alabama 1,051 275 776 3 9 26 23 20 16 2
COPIAH-LINCOLN COMMUNITY COLLEGE Mississippi 1,041 452 589 6 29 37 20 7 1 0
MERIDIAN COMMUNITY COLLEGE Mississippi 1,010 329 681 5 31 37 19 6 2 0
MISSISSIPPI VALLEY STATE UNIV Mississippi 979 189 790 13 46 31 9 1 0 0
UNIVERSITY OF SOUTH ALABAMA Alabama 895 276 619 1 8 27 29 22 11 1
MISSISSIPPI DELTA COMM COLL Mississippi 889 211 678 9 38 38 12 3 0 0
HINDS COMM COLLEGE-JACKSON CAMPUS Mississippi 880 214 666 12 42 34 10 2 0 0
SOUTHWEST MISSISSIPPI COMMUNITY COLL Mississippi 878 294 584 7 28 40 18 5 1 0
UNIVERSITY OF MISSISSIPPI MEDICAL CTR Mississippi 788 77 711 3 19 36 27 13 3 0
All Other Institutions 28,465 7,569 20,896 7 25 30 19 10 7 2
Total 100,353 30,496 69,857 6 24 34 21 10 5 1

ACT PROFILE REPORT - State: SECTION V, OPTIONAL WRITING TEST RESULTS PAGE 27
Graduating Class 2016 Code 259999
Mississippi
Total Students in Report: 35,678
Section V
Optional Writing Test Results
Beginning with the Graduating Class of 2013, all students whose scores are college reportable, both standard and extended time tests, are now included.
Also beginning with the 2013 Graduating Class data, College Readiness Benchmarks for Reading and Science were updated to reflect the most recent
college coursework research.
ACT PROFILE REPORT - State: SECTION V, OPTIONAL WRITING TEST RESULTS PAGE 28
Graduating Class 2016 Code 259999
Mississippi
Total Students in Report: 35,678
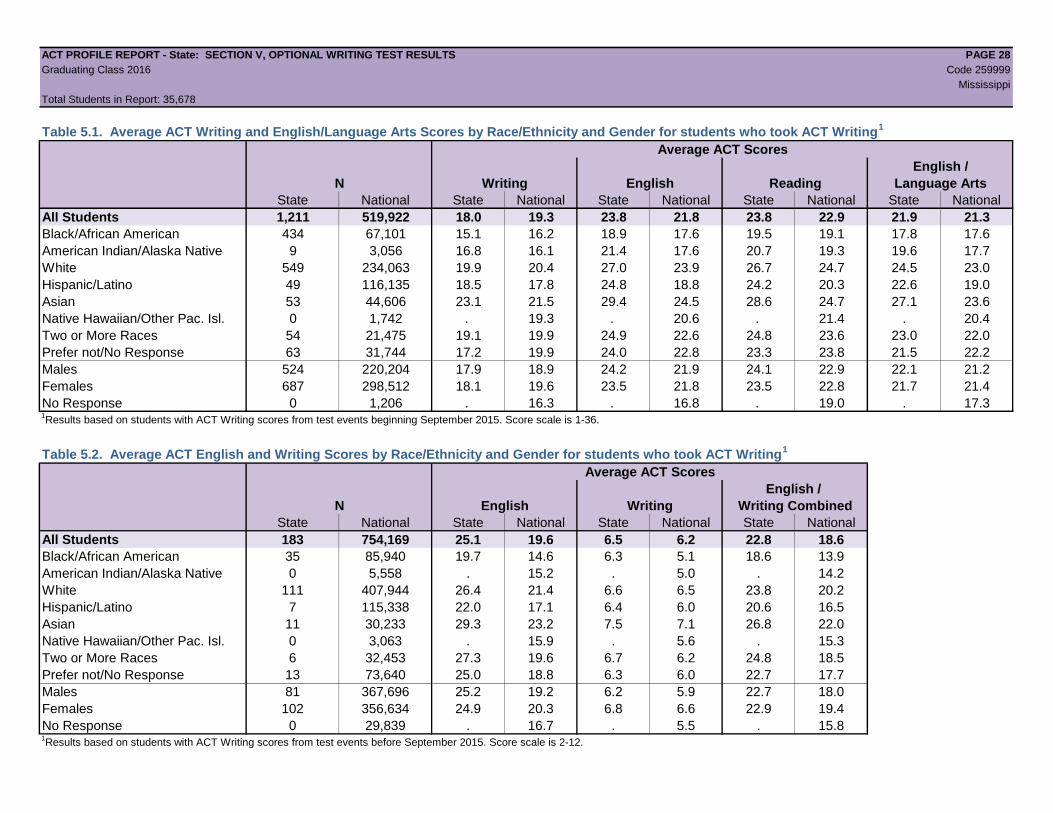
Table 5.1. Average ACT Writing and English/Language Arts Scores by Race/Ethnicity and Gender for students who took ACT Writing1
Average ACT Scores
English /
N Writing English Reading Language Arts
State National State National State National State National State National
All Students 1,211 519,922 18.0 19.3 23.8 21.8 23.8 22.9 21.9 21.3
Black/African American 434 67,101 15.1 16.2 18.9 17.6 19.5 19.1 17.8 17.6
American Indian/Alaska Native 9 3,056 16.8 16.1 21.4 17.6 20.7 19.3 19.6 17.7
White 549 234,063 19.9 20.4 27.0 23.9 26.7 24.7 24.5 23.0
Hispanic/Latino 49 116,135 18.5 17.8 24.8 18.8 24.2 20.3 22.6 19.0
Asian 53 44,606 23.1 21.5 29.4 24.5 28.6 24.7 27.1 23.6
Native Hawaiian/Other Pac. Isl. 0 1,742 . 19.3 . 20.6 . 21.4 . 20.4
Two or More Races 54 21,475 19.1 19.9 24.9 22.6 24.8 23.6 23.0 22.0
Prefer not/No Response 63 31,744 17.2 19.9 24.0 22.8 23.3 23.8 21.5 22.2
Males 524 220,204 17.9 18.9 24.2 21.9 24.1 22.9 22.1 21.2
Females 687 298,512 18.1 19.6 23.5 21.8 23.5 22.8 21.7 21.4
No Response 0 1,206 . 16.3 . 16.8 . 19.0 . 17.31Results based on students with ACT Writing scores from test events beginning September 2015. Score scale is 1-36.
Table 5.2. Average ACT English and Writing Scores by Race/Ethnicity and Gender for students who took ACT Writing1
Average ACT Scores
English /
N English Writing Writing Combined
State National State National State National State National
All Students 183 754,169 25.1 19.6 6.5 6.2 22.8 18.6
Black/African American 35 85,940 19.7 14.6 6.3 5.1 18.6 13.9
American Indian/Alaska Native 0 5,558 . 15.2 . 5.0 . 14.2
White 111 407,944 26.4 21.4 6.6 6.5 23.8 20.2
Hispanic/Latino 7 115,338 22.0 17.1 6.4 6.0 20.6 16.5
Asian 11 30,233 29.3 23.2 7.5 7.1 26.8 22.0
Native Hawaiian/Other Pac. Isl. 0 3,063 . 15.9 . 5.6 . 15.3
Two or More Races 6 32,453 27.3 19.6 6.7 6.2 24.8 18.5
Prefer not/No Response 13 73,640 25.0 18.8 6.3 6.0 22.7 17.7
Males 81 367,696 25.2 19.2 6.2 5.9 22.7 18.0
Females 102 356,634 24.9 20.3 6.8 6.6 22.9 19.4
No Response 0 29,839 . 16.7 . 5.5 . 15.81Results based on students with ACT Writing scores from test events before September 2015. Score scale is 2-12.