Profile of Mutual Fund Shareholders,
48
ICI RESEARCH REPORT Profile of Mutual Fund Shareholders, 2020 JANUARY 2021 WASHINGTON, DC // LONDON // BRUSSELS // HONG KONG // WWW.ICI.ORG
Transcript of Profile of Mutual Fund Shareholders,

ICI RESEARCH REPORT
Profile of Mutual Fund Shareholders, 2020
JANUARY 2021
W A S H I N G T O N , D C // L O N D O N // B R U S S E L S // H O N G K O N G // W W W . I C I . O R G

Copyright © 2021 by the Investment Company Institute. All rights reserved.
The Investment Company Institute (ICI) is the leading association representing regulated funds globally, including mutual funds, exchange-traded funds (ETFs), closed-end funds, and unit investment trusts (UITs) in the United States, and similar funds offered to investors in jurisdictions worldwide. ICI seeks to encourage adherence to high ethical standards, promote public understanding, and otherwise advance the interests of funds, their shareholders, directors, and advisers.
Suggested citation: Schrass, Daniel, and Michael Bogdan. 2021. “Profile of Mutual Fund Shareholders, 2020.” ICI Research Report (January). Washington, DC: Investment Company Institute. Available at www.ici.org/pdf/20_rpt_profiles.pdf.
Contents
1 Introduction 1 Annual Survey
2 The “Typical” Mutual Fund–Owning Household
2 Variations in Characteristics of Households That Own Mutual Funds
5 Chapter 1: Mutual Fund–Owning Households 5 Demographic Characteristics
6 Employment Status and Household Income
6 Financial Characteristics
7 Mutual Fund Ownership
8 Goals and Mutual Fund Investing
8 Views on Investment Risk
17 Chapter 2: Mutual Fund–Owning Households by Fund Ownership Inside and Outside Employer-Sponsored Retirement Plans
19 Chapter 3: Mutual Fund–Owning Households by Channels Used to Purchase Mutual Funds Outside Employer-Sponsored Retirement Plans
21 Chapter 4: Mutual Fund–Owning Households by Primary Source for Purchasing Funds
23 Chapter 5: Mutual Fund–Owning Households by Generation
25 Chapter 6: Mutual Fund–Owning Households by Age
27 Chapter 7: Mutual Fund–Owning Households by Household Income
29 Chapter 8: Mutual Fund–Owning Households by Household Financial Assets
31 Chapter 9: Mutual Fund–Owning Households by Investment Risk Tolerance
33 Chapter 10: Mutual Fund–Owning Households by Year of Initial Mutual Fund Purchase
35 Appendix: Research Methodology 35 Research Design
35 Interviewing
35 Revisions to ICI’s Annual Mutual Fund Shareholder Tracking Survey
36 Survey Weights
36 Sampling Error
37 Notes
38 References

FiguresAll figures are available in a Microsoft Excel file located at www.ici.org/info/20_rpt_profiles_data20.xls. Those with page numbers indicated are available in this report.
Chapter 1: Mutual Fund–Owning Households
5 Figure 1.1 58.7 Million US Households Owned Mutual Funds
9 Figure 1.2 Mutual Fund Shareholder Head of Household Characteristics
10 Figure 1.3 Employment Status and Income of Households Owning Mutual Funds
11 Figure 1.4 Mutual Fund–Owning Households’ Financial Assets
12 Figure 1.5 Mutual Fund Investing Among Households Owning Mutual Funds
13 Figure 1.6 Households Own Many Funds Through Multiple Purchase Sources
14 Figure 1.7 Sources Used to Purchase Mutual Funds
15 Figure 1.8 Financial Goals of Households Owning Mutual Funds
16 Figure 1.9 Views on Investment Risk
Chapter 2: Mutual Fund–Owning Households by Fund Ownership Inside and Outside Employer-Sponsored Retirement Plans
17 Figure 2.1 Mutual Fund Owning–Households by Fund Ownership Inside and Outside Employer-Sponsored Retirement Plans
Figure 2.2 Head of Household Characteristics by Fund Ownership Inside and Outside Employer-Sponsored Retirement Plans
Figure 2.3 Employment Status and Income by Fund Ownership Inside and Outside Employer-Sponsored Retirement Plans
Figure 2.4 Mutual Fund–Owning Households’ Financial Assets by Fund Ownership Inside and Outside Employer-Sponsored Retirement Plans
Figure 2.5 Mutual Fund Investing by Fund Ownership Inside and Outside Employer-Sponsored Retirement Plans

Figure 2.6 Number of Funds Owned and Purchase Sources Used by Fund Ownership Inside and Outside Employer-Sponsored Retirement Plans
Figure 2.7 Sources Used to Purchase Mutual Funds by Fund Ownership Inside and Outside Employer-Sponsored Retirement Plans
Figure 2.8 Financial Goals by Fund Ownership Inside and Outside Employer-Sponsored Retirement Plans
Figure 2.9 Views on Investment Risk by Fund Ownership Inside and Outside Employer-Sponsored Retirement Plans
Chapter 3: Mutual Fund–Owning Households by Channels Used to Purchase Mutual Funds Outside Employer-Sponsored Retirement Plans
19 Figure 3.1 Sources Used by Mutual Fund–Owning Households to Purchase Mutual Funds
Figure 3.2 Head of Household Characteristics by Fund Ownership Outside Employer-Sponsored Retirement Plans
Figure 3.3 Employment Status and Income by Fund Ownership Outside Employer-Sponsored Retirement Plans
Figure 3.4 Mutual Fund–Owning Households’ Financial Assets by Fund Ownership Outside Employer-Sponsored Retirement Plans
Figure 3.5 Mutual Fund Investing by Fund Ownership Outside Employer-Sponsored Retirement Plans
Figure 3.6 Number of Funds Owned and Purchase Sources Used by Fund Ownership Outside Employer-Sponsored Retirement Plans
Figure 3.7 Sources Used to Purchase Mutual Funds by Fund Ownership Outside Employer-Sponsored Retirement Plans
Figure 3.8 Financial Goals by Fund Ownership Outside Employer-Sponsored Retirement Plans
Figure 3.9 Views on Investment Risk by Fund Ownership Outside Employer-Sponsored Retirement Plans
Chapter 4: Mutual Fund–Owning Households by Primary Source for Purchasing Funds
21 Figure 4.1 Mutual Fund–Owning Households by Primary Source for Purchasing Funds
Figure 4.2 Head of Household Characteristics by Primary Purchase Source
Figure 4.3 Employment Status and Income by Primary Purchase Source
Figure 4.4 Mutual Fund–Owning Households’ Financial Assets by Primary Purchase Source
Figure 4.5 Mutual Fund Investing by Primary Purchase Source

Figure 4.6 Number of Funds Owned and Purchase Sources Used by Primary Purchase Source
Figure 4.7 Sources Used to Purchase Mutual Funds by Primary Purchase Source
Figure 4.8 Financial Goals by Primary Purchase Source
Figure 4.9 Views on Investment Risk by Primary Purchase Source
Chapter 5: Mutual Fund–Owning Households by Generation
23 Figure 5.1 Mutual Fund–Owning Households and Assets by Generation
Figure 5.2 Head of Household Characteristics by Generation
Figure 5.3 Employment Status and Income by Generation
Figure 5.4 Mutual Fund–Owning Households’ Financial Assets by Generation
Figure 5.5 Mutual Fund Investing by Generation
Figure 5.6 Number of Funds Owned and Purchase Sources Used by Generation
Figure 5.7 Sources Used to Purchase Mutual Funds by Generation
Figure 5.8 Financial Goals by Generation
Figure 5.9 Views on Investment Risk by Generation
Chapter 6: Mutual Fund–Owning Households by Age
25 Figure 6.1 Mutual Fund–Owning Households and Assets by Age
Figure 6.2 Head of Household Characteristics by Age
Figure 6.3 Employment Status and Income by Age
Figure 6.4 Mutual Fund–Owning Households’ Financial Assets by Age
Figure 6.5 Mutual Fund Investing by Age
Figure 6.6 Number of Funds Owned and Purchase Sources Used by Age
Figure 6.7 Sources Used to Purchase Mutual Funds by Age
Figure 6.8 Financial Goals by Age
Figure 6.9 Views on Investment Risk by Age
Chapter 7: Mutual Fund–Owning Households by Household Income
27 Figure 7.1 Mutual Fund–Owning Households by Household Income
Figure 7.2 Head of Household Characteristics by Household Income
Figure 7.3 Employment Status and Income by Household Income
Figure 7.4 Mutual Fund–Owning Households’ Financial Assets by Household Income
Figure 7.5 Mutual Fund Investing by Household Income
Figure 7.6 Number of Funds Owned and Purchase Sources Used by Household Income
Figure 7.7 Sources Used to Purchase Mutual Funds by Household Income
Figure 7.8 Financial Goals by Household Income
Figure 7.9 Views on Investment Risk by Household Income
Chapter 8: Mutual Fund–Owning Households by Household Financial Assets
29 Figure 8.1 Mutual Fund–Owning Households by Household Financial Assets
Figure 8.2 Head of Household Characteristics by Household Financial Assets
Figure 8.3 Employment Status and Income by Household Financial Assets
Figure 8.4 Mutual Fund–Owning Households’ Financial Assets by Household Financial Assets
Figure 8.5 Mutual Fund Investing by Household Financial Assets
Figure 8.6 Number of Funds Owned and Purchase Sources Used by Household Financial Assets
Figure 8.7 Sources Used to Purchase Mutual Funds by Household Financial Assets
Figure 8.8 Financial Goals by Household Financial Assets
Figure 8.9 Views on Investment Risk by Household Financial Assets

Chapter 9: Mutual Fund–Owning Households by Investment Risk Tolerance
31 Figure 9.1 Mutual Fund–Owning Households by Investment Risk Tolerance
Figure 9.2 Head of Household Characteristics by Investment Risk Tolerance
Figure 9.3 Employment Status and Income by Investment Risk Tolerance
Figure 9.4 Mutual Fund–Owning Households’ Financial Assets by Investment Risk Tolerance
Figure 9.5 Mutual Fund Investing by Investment Risk Tolerance
Figure 9.6 Number of Funds Owned and Purchase Sources Used by Investment Risk Tolerance
Figure 9.7 Sources Used to Purchase Mutual Funds by Investment Risk Tolerance
Figure 9.8 Financial Goals by Investment Risk Tolerance
Figure 9.9 Views on Investment Risk by Investment Risk Tolerance
Chapter 10: Mutual Fund–Owning Households by Year of Initial Mutual Fund Purchase
33 Figure 10.1 Mutual Fund–Owning Households by Year of Initial Mutual Fund Purchase
Figure 10.2 Head of Household Characteristics by Year of Initial Mutual Fund Purchase
Figure 10.3 Employment Status and Income by Year of Initial Mutual Fund Purchase
Figure 10.4 Mutual Fund–Owning Households’ Financial Assets by Year of Initial Mutual Fund Purchase
Figure 10.5 Mutual Fund Investing by Year of Initial Mutual Fund Purchase
Figure 10.6 Number of Funds Owned and Purchase Sources Used by Year of Initial Mutual Fund Purchase
Figure 10.7 Sources Used to Purchase Mutual Funds by Year of Initial Mutual Fund Purchase
Figure 10.8 Financial Goals by Year of Initial Mutual Fund Purchase
Figure 10.9 Views on Investment Risk by Year of Initial Mutual Fund Purchase

ICI RESEARCH REPORT: PROFILE OF MUTUAL FUND SHAREHOLDERS, 2020 // 1
Profile of Mutual Fund Shareholders, 2020Daniel Schrass, economist, and Michael Bogdan, associate economist, prepared this report.
IntroductionOwnership of mutual funds by US households grew significantly in the 1980s and 1990s and has remained steady over the past two decades. On average since 1999, household ownership of mutual funds has been about 45 percent each year; this is down a bit from 49 percent in 2001 but higher than the 41 percent rate in 1998. Between mid-2000 and mid-2020, assets held in mutual funds increased from $7.1 trillion to $21.4 trillion.1 In 2020, 45.7 percent of US households owned mutual funds, representing 102.5 million individual mutual fund shareholders.2 Mutual fund holdings represent a significant component of the savings and investments of many US households, with mutual fund assets now accounting for about one-fifth of households’ financial assets.3
Annual SurveyThe Investment Company Institute (ICI) conducts an annual survey to track US households’ ownership of mutual funds and to gather information on their demographic and financial characteristics. The most recent survey was conducted from May to June 2020 and was based on a dual-frame telephone sample of 3,001 randomly selected US households. Of these, 1,350 households were from a landline random digit dial (RDD) frame, and 1,651 households were from a cell phone RDD frame. Of the households contacted, 1,372 (45.7 percent) owned mutual funds. Eligible households were those owning mutual funds inside or outside employer-sponsored retirement plans, including funds purchased through investment professionals or directly from mutual fund companies or discount brokers. All interviews were conducted with the investment decisionmaker, the person most knowledgeable about the household’s savings and investments.4

2 // ICI RESEARCH REPORT: PROFILE OF MUTUAL FUND SHAREHOLDERS, 2020
The “Typical” Mutual Fund–Owning HouseholdThis report summarizes the findings of the 2020 survey.5 As described in the first chapter, in 2020 the “typical” mutual fund–owning head of household
» was middle-aged, employed, educated, married or living with a partner;
» shared investment decisionmaking with his or her spouse or partner;
» had $105,000 in household income and $300,000 in household financial assets;
» owned investments other than mutual funds, including individual stocks, and had more than half of the household’s financial assets (excluding the primary residence) invested in mutual funds;
» had $126,700 invested in four mutual funds, including at least one equity fund;
» owned mutual funds inside an employer-sponsored retirement plan, such as a 401(k) plan, 403(b) plan, 457 plan, SEP IRA, SAR-SEP IRA, or SIMPLE IRA;
» owned mutual funds outside employer-sponsored retirement plans, primarily purchased through investment professionals (e.g., registered investment advisers, full-service brokers, independent financial planners, bank or savings institution representatives, insurance agents, or accountants);
» owned a traditional or Roth IRA; and
» was confident that mutual funds could help him or her reach financial goals.
Chapter 1 discusses a full set of figures highlighting demographic and financial characteristics of mutual fund–owning households, the variety of mutual funds they own, and the different ways they purchase mutual funds, as well as their financial assets, financial goals, and willingness to take investment risk. The remaining chapters present similar information for subgroups of mutual fund–owning households. Figures for all of the chapters are available in a Microsoft Excel file located at www.ici.org/info/20_rpt_profiles_data20.xls.
Variations in Characteristics of Households That Own Mutual FundsChapters 2, 3, and 4 focus on the principal channels used by mutual fund–owning households to purchase fund shares. With the growth of 401(k) plans since 1990, employer-sponsored retirement plans have become a common channel through which households own mutual funds. In 2020, 83 percent of mutual fund–owning households held funds through these plans. Sixty-three percent of mutual fund–owning households held mutual funds purchased outside employer-sponsored retirement plans. Nearly half of mutual fund–owning households held mutual funds purchased from the sales force channel, that is, through investment professionals, which include registered

ICI RESEARCH REPORT: PROFILE OF MUTUAL FUND SHAREHOLDERS, 2020 // 3
investment advisers, full-service brokers, independent financial planners, bank or savings institution representatives, insurance agents, and accountants. Thirty-one percent owned fund shares purchased from the direct market channel, which consists of purchases made directly from fund companies and through discount brokers. More than half of mutual fund–owning households held mutual funds through multiple sources.6 In identifying their primary source for purchasing funds, 59 percent of mutual fund–owning households pointed to employer-sponsored retirement plans, 29 percent reported the sales force channel, and 12 percent cited the direct market channel.
Chapter 5 presents mutual fund–owning households by generation. Thirty percent were members of Generation Z and the Millennial Generation (born between 1981 and 2012), and 31 percent were members of Generation X (born between 1965 and 1980).7 The Baby Boom Generation (those born between 1946 and 1964) represented a 31 percent share of mutual fund–owning households. Eight percent were members of the Silent and GI Generations (born between 1904 and 1945).8 Figures in this chapter highlight how demographic characteristics, mutual fund ownership, financial assets, and savings goals vary among mutual fund–owning households by generation.
Chapter 6 describes mutual fund–owning households by age. Twenty percent of individuals heading households owning mutual funds were younger than 35. The largest age group consisted of individuals between the ages of 35 and 54, who made up 39 percent of mutual fund–owning household heads. Household heads aged 55 to 64 accounted for 21 percent of mutual fund–owning households. The remaining 20 percent of individuals heading mutual fund–owning households were 65 or older. Figures in this chapter reveal how demographic characteristics, mutual fund ownership, financial assets, and savings goals vary among mutual fund–owning households by age group.
Chapter 7 describes mutual fund–owning households by their level of household income. Twelve percent of mutual fund–owning households had incomes below $50,000, 31 percent had incomes between $50,000 and $99,999, 24 percent had incomes between $100,000 and $149,999, and 33 percent had incomes of $150,000 or more. Figures in this chapter focus on how demographic characteristics, mutual fund ownership, financial assets, and savings goals vary among mutual fund–owning households by household income.

4 // ICI RESEARCH REPORT: PROFILE OF MUTUAL FUND SHAREHOLDERS, 2020
Chapter 8 examines mutual fund–owning households by household financial assets. Fourteen percent of mutual fund–owning households had financial assets of less than $50,000, 10 percent had assets between $50,000 and $99,999, 20 percent had assets between $100,000 and $249,999, and 56 percent had assets of $250,000 or more. Figures in this chapter show how demographic characteristics, mutual fund ownership, financial assets, and savings goals vary among mutual fund–owning households by household financial assets.
Chapter 9 examines mutual fund–owning households by the level of investment risk respondents are willing to take. Forty percent of mutual fund–owning households were willing to take above-average or substantial investment risk for similar levels of financial gain, 42 percent were willing to take average investment risk for average financial gain, and 18 percent were willing to take below-average investment risk for below-average financial gain or were unwilling to take investment risk. Figures in this chapter illustrate how demographic characteristics, mutual fund ownership, financial assets, and savings goals vary among mutual fund–owning households by level of investment risk.
Chapter 10 describes mutual fund–owning households by the year of their initial mutual fund purchase. Twenty-two percent of mutual fund–owning households purchased their first mutual fund before 1990, and 29 percent purchased their first mutual fund between 1990 and 1999. Twenty-five percent purchased their first mutual fund between 2000 and 2009, and 24 percent did so in 2010 or later. Figures in this chapter highlight how demographic characteristics, mutual fund ownership, financial assets, and savings goals vary among mutual fund–owning households by year of initial mutual fund purchase.
Taken together, these chapters present an overview of the millions of US households that invest in mutual funds, the ways in which they purchase fund shares, and the ways in which they use funds to meet their current and long-term financial needs.

ICI RESEARCH REPORT: PROFILE OF MUTUAL FUND SHAREHOLDERS, 2020 // 5
CHAPTER 1
Mutual Fund–Owning HouseholdsDemographic CharacteristicsIn 2020, 58.7 million, or 45.7 percent of, US households owned mutual funds (Figure 1.1). The median age of individuals heading households that owned mutual funds was 50 (Figure 1.2).9 More than half of these individuals had college or postgraduate degrees. Sixty-nine percent of US households that owned mutual funds consisted of couples who were married or living with a partner, and investment decisionmaking was a shared responsibility in 53 percent of mutual fund–owning households.
FIGURE 1.158.7 Million US Households Owned Mutual FundsPercentage of all US households, 2020
45.7%Owned mutual funds
54.3%Did not own mutual funds
Total number of US households: 128.5 million
Sources: Investment Company Institute and US Census Bureau

6 // ICI RESEARCH REPORT: PROFILE OF MUTUAL FUND SHAREHOLDERS, 2020
Employment Status and Household IncomeThe majority of the heads of mutual fund–owning households were employed and earned moderate, although above-average, household incomes. In 2020, 75 percent of individuals heading households that owned mutual funds were employed full- or part-time (Figure 1.3). Four percent of individuals heading households that owned mutual funds indicated that they were retired from their lifetime occupations but were employed either full- or part-time. Twenty-five percent of individuals heading households that owned mutual funds were not employed, but 76 percent of these household heads were retired. All told, 23 percent of individuals heading households that owned mutual funds were retired from their lifetime occupations. The median income of mutual fund–owning households was $105,000. Twelve percent had household incomes of less than $50,000, 15 percent had household incomes between $50,000 and $74,999, 16 percent had household incomes between $75,000 and $99,999, and 57 percent had household incomes of $100,000 or more.
Financial CharacteristicsThe majority of mutual fund–owning households have accumulated a variety of financial assets and retirement accounts. Among households that owned mutual funds, median household financial assets were $300,000 (Figure 1.4). Mutual fund–owning households typically had other types of savings and investments. Twenty-four percent owned certificates of deposit, 48 percent owned individual stocks, and 12 percent owned individual bonds (excluding US savings bonds). In addition, 32 percent held investment real estate, and 24 percent held fixed or variable annuities. A significant number of mutual fund–owning households made use of tax-advantaged savings vehicles. Eighty-eight percent had assets in employer-sponsored retirement plan accounts, usually 401(k) plans, and 65 percent owned individual retirement accounts (IRAs).10 Twenty percent of US households owning mutual funds had education-targeted savings program accounts—7 percent had Coverdell education savings accounts (ESAs), and 17 percent had 529 plan accounts.

ICI RESEARCH REPORT: PROFILE OF MUTUAL FUND SHAREHOLDERS, 2020 // 7
Mutual Fund OwnershipEquity mutual funds were the most commonly held mutual funds. Among households that owned mutual funds, median mutual fund holdings were $126,700 (Figure 1.5). The largest percentage of mutual fund–owning households, 90 percent, owned equity funds. Thirty-five percent had invested in balanced funds,11 43 percent in bond funds, and 53 percent in money market funds. In addition, 36 percent of mutual fund–owning households held global or international equity funds. Mutual fund holdings represented more than half of household financial assets for 56 percent of households that owned mutual funds.
The majority of mutual fund–owning households were longtime mutual fund investors (Figure 1.5). Twenty-two percent reported that the household bought its first mutual fund before 1990, 29 percent between 1990 and 1999, and 25 percent between 2000 and 2009. Twenty-four percent reported that the household bought its first fund in 2010 or later.
Mutual fund–owning households owned many funds through multiple purchase sources (Figure 1.6). In 2020, these households owned a median of four mutual funds. Forty-eight percent owned three or fewer funds, and 52 percent owned four or more. Among households that owned funds outside employer-sponsored retirement plans, 31 percent owned funds purchased from one source, 36 percent owned funds purchased from two sources, and 33 percent owned funds purchased from three or more sources.
Thirty-seven percent of mutual fund–owning households held mutual funds solely inside employer-sponsored retirement plans, which include defined contribution (DC) plans (such as 401(k), 403(b), or 457 plans) and employer-sponsored IRAs (SEP IRAs, SAR-SEP IRAs, and SIMPLE IRAs); 17 percent owned funds solely outside these plans; and 46 percent had funds both inside and outside employer-sponsored retirement plans (Figure 1.7). Altogether, 83 percent of mutual fund–owning households owned funds through employer-sponsored retirement plans, and 63 percent owned funds outside these plans through either the sales force or direct market channels. Nearly half of mutual fund–owning households owned funds through the sales force channel, that is, through investment professionals, which include registered investment advisers, full-service brokers, independent financial planners, bank or savings institution representatives, insurance agents, and accountants. Thirty-one percent owned funds through the direct market channel, which includes mutual fund companies directly and discount brokers.
Fifty-nine percent of all US households that owned mutual funds reported that employer-sponsored retirement plans were their primary source for purchasing mutual funds, 29 percent regarded the sales force channel as their primary source, and 12 percent considered the direct market channel to be their primary source (Figure 1.7). Sixty-three percent of mutual fund–owning households in 2020 reported that the household bought its first fund through an employer-sponsored retirement plan.

8 // ICI RESEARCH REPORT: PROFILE OF MUTUAL FUND SHAREHOLDERS, 2020
Goals and Mutual Fund InvestingIn 2020, the vast majority of mutual fund–owning households were using mutual funds to save for retirement (Figure 1.8). Ninety-four percent of mutual fund–owning households indicated that saving for retirement was one of their household’s financial goals, and 75 percent indicated that retirement saving was their primary financial goal. Eighty-three percent of households owning mutual funds held funds in employer-sponsored retirement plans, and 46 percent owned funds inside IRAs. Eighty-eight percent were confident that mutual funds were an investment that could help them meet their household’s financial goals.
Views on Investment RiskWillingness to take investment risk is higher among mutual fund–owning households than among non-owning households.12 Almost all mutual fund–owning households were willing to take some investment risk for financial gain (Figure 1.9). Forty percent of mutual fund–owning households said they were willing to take substantial or above-average investment risk for similar levels of financial gain. Forty-two percent of mutual fund–owning households were willing to take average risk for average gain. Only 18 percent of mutual fund–owning households were willing to take below-average risk for below-average gain or were unwilling to take any investment risk.

ICI RESEARCH REPORT: PROFILE OF MUTUAL FUND SHAREHOLDERS, 2020 // 9
FIGURE 1.2Mutual Fund Shareholder Head of Household CharacteristicsPercentage of US households owning mutual funds, 2020
Age of household sole or co-decisionmaker for saving and investing
Younger than 35 20
35 to 44 19
45 to 54 20
55 to 64 21
65 or older 20
Median 50 years
Mean 50 years
Education level
High school diploma or less 16
Some college or associate’s degree 28
Completed four years of college 24
Some graduate school 5
Completed graduate school 27
Marital status
Married or living with a partner 69
Single 18
Divorced or separated 7
Widowed 6
Household investment decisionmaker
Male is sole decisionmaker 32
Female is sole decisionmaker 15
Co-decisionmakers 53
Ethnic background*
Caucasian 73
African American 8
Hispanic 8
Asian 5
Other 3
*Multiple responses are included.

10 // ICI RESEARCH REPORT: PROFILE OF MUTUAL FUND SHAREHOLDERS, 2020
FIGURE 1.3Employment Status and Income of Households Owning Mutual FundsPercentage of US households owning mutual funds, 2020
Employment status1
Employed full-time 70
Not retired 68
Retired from lifetime occupation 2
Employed part-time 5
Not retired 3
Retired from lifetime occupation 2
Not employed 25
Not retired 6
Retired from lifetime occupation 19
Total household income2
Less than $25,000 2
$25,000 to $34,999 4
$35,000 to $49,999 6
$50,000 to $74,999 15
$75,000 to $99,999 16
$100,000 to $149,999 24
$150,000 to $249,999 23
$250,000 or more 10
Median $105,000
Mean $145,000
1 Figure reports employment status of the head of household (sole or co-decisionmaker for saving and investing).2 Total reported is household income before taxes in 2019.

ICI RESEARCH REPORT: PROFILE OF MUTUAL FUND SHAREHOLDERS, 2020 // 11
FIGURE 1.4Mutual Fund–Owning Households’ Financial AssetsPercentage of US households owning mutual funds, 2020
Total household financial assets1
Less than $25,000 9
$25,000 to $49,999 5
$50,000 to $74,999 6
$75,000 to $99,999 4
$100,000 to $249,999 20
$250,000 to $499,999 16
$500,000 to $999,999 20
$1 million or more 20
Median $300,000
Mean $707,700
Household ownership of non–mutual fund investments2
Certificates of deposit 24
Individual stocks, individual bonds, or annuities (total) 59
Individual stocks 48
Individual bonds (excluding US savings bonds) 12
Fixed or variable annuities 24
Investment real estate 32
Closed-end funds 5
Exchange-traded funds 17
Household ownership of employer-sponsored retirement plan accounts2
Household owned employer-sponsored retirement plan accounts (total) 88
DC retirement plan accounts (total) 87
401(k) plan account 75
403(b); state, local, or federal government plan account 37
Employer-sponsored IRA3 12
Household ownership of IRAs2
Household owned IRA (total) 65
Traditional IRA or Roth IRA 62
Employer-sponsored IRA3 12
Household ownership of education-targeted savings accounts2
Household owned education-targeted savings program account (total) 20
Coverdell education savings account 7
529 prepaid tuition or college savings plan account (total) 17
1 Household financial assets include assets in employer-sponsored retirement plans but exclude the household’s primary residence.2 Multiple responses are included.3 Employer-sponsored IRAs include SEP IRAs, SAR-SEP IRAs, and SIMPLE IRAs.

12 // ICI RESEARCH REPORT: PROFILE OF MUTUAL FUND SHAREHOLDERS, 2020
FIGURE 1.5Mutual Fund Investing Among Households Owning Mutual FundsPercentage of US households owning mutual funds, 2020
Total household mutual fund assets
Less than $5,000 6
$5,000 to $9,999 4
$10,000 to $19,999 5
$20,000 to $29,999 5
$30,000 to $49,999 6
$50,000 to $74,999 8
$75,000 to $99,999 4
$100,000 to $249,999 23
$250,000 or more 39
Median $126,700
Mean $343,800
Percent allocation of household financial assets to mutual funds
25% or less 23
Between 26% and 50% 21
Between 51% and 75% 18
More than 75% 38
Types of mutual funds owned*
Equity funds 90
Balanced funds 35
Bond funds 43
Money market funds 53
Other fund type specified 3
Year of initial mutual fund purchase
Before 1990 22
Between 1990 and 1999 29
Between 2000 and 2009 25
2010 or later 24
Median 1999
Mean 1999
*Multiple responses are included.

ICI RESEARCH REPORT: PROFILE OF MUTUAL FUND SHAREHOLDERS, 2020 // 13
FIGURE 1.6Households Own Many Funds Through Multiple Purchase Sources
Total number of mutual funds ownedPercentage of US households owning mutual funds, 2020
One 18
Two 17
Three 13
Four 11
Five to six 15
Seven to ten 11
Eleven or more 15
Median 4 funds
Mean 7 funds
Number of mutual fund purchase sources used outside employer-sponsored retirement plans*Percentage of US households owning mutual funds outside employer-sponsored retirement plans, 2020
One 31
Two 36
Three 18
Four or more 15
Median 2 sources
Mean 2 sources
*Purchase sources outside employer-sponsored retirement plans include full-service brokers, independent financial planners, bank and savings institution representatives, insurance agents, accountants, fund companies directly, and discount brokers.

14 // ICI RESEARCH REPORT: PROFILE OF MUTUAL FUND SHAREHOLDERS, 2020
FIGURE 1.7Sources Used to Purchase Mutual Funds Percentage of US households owning mutual funds, 2020
Source of mutual fund ownership
Only inside employer-sponsored retirement plan 37
Only outside employer-sponsored retirement plan 17
Both inside and outside employer-sponsored retirement plan 46
Purchase sources through which funds are currently owned1
Inside employer-sponsored retirement plans (total) 83
Inside DC retirement plans (total) 81
401(k) plan 70
403(b); state, local, or federal government plan 24
Inside employer-sponsored IRA2 8
Outside employer-sponsored retirement plans (total) 63
Sales force (total) 47
Full-service broker 26
Independent financial planner 22
Bank or savings institution representative 17
Insurance agent 9
Accountant 7
Direct market (total) 31
Mutual fund company directly 16
Discount broker 21
Primary mutual fund purchase source
Inside employer-sponsored retirement plans 59
Outside employer-sponsored retirement plans 41
Sales force 29
Full-service broker 12
Independent financial planner 8
Bank or savings institution representative 6
Insurance agent 2
Accountant 1
Direct market 12
Mutual fund company directly 5
Discount broker 7
Source of first mutual fund purchase
Inside employer-sponsored retirement plan 63
Outside employer-sponsored retirement plan 37
1 Multiple responses are included.2 Employer-sponsored IRAs include SEP IRAs, SAR-SEP IRAs, and SIMPLE IRAs.

ICI RESEARCH REPORT: PROFILE OF MUTUAL FUND SHAREHOLDERS, 2020 // 15
FIGURE 1.8Financial Goals of Households Owning Mutual FundsPercentage of US households owning mutual funds, 2020
Financial goals for mutual fund investments1
Retirement 94
Reduce taxable income 47
Emergency 47
Education 26
Current income 26
House or other large item 16
Other 6
Primary financial goal for mutual fund investments
Retirement 75
Reduce taxable income 3
Emergency 6
Education 4
Current income 5
House or other large item 5
Other 2
Level of confidence that mutual funds are an investment that can help the household meet financial goals
Very confident 29
Somewhat confident 59
Not very confident 7
Not at all confident 5
Ownership of mutual funds in employer-sponsored retirement plans1
Inside employer-sponsored retirement plans (total) 83
Inside DC retirement plans (total) 81
401(k) plan 70
403(b); state, local, or federal government plan 24
Inside employer-sponsored IRA2 8
Ownership of mutual funds in IRAs1
Had IRA invested in mutual funds (total) 46
Traditional IRA or Roth IRA 43
Employer-sponsored IRA2 8
1 Multiple responses are included.2 Employer-sponsored IRAs include SEP IRAs, SAR-SEP IRAs, and SIMPLE IRAs.

16 // ICI RESEARCH REPORT: PROFILE OF MUTUAL FUND SHAREHOLDERS, 2020
FIGURE 1.9Views on Investment RiskPercentage of US households owning mutual funds, 2020
Level of risk willing to take with financial investments
Substantial risk for substantial gain 7
Above-average risk for above-average gain 33
Average risk for average gain 42
Below-average risk for below-average gain 8
Unwilling to take any risk 10

ICI RESEARCH REPORT: PROFILE OF MUTUAL FUND SHAREHOLDERS, 2020 // 17
CHAPTER 2
Mutual Fund–Owning Households by Fund Ownership Inside and Outside Employer‑Sponsored Retirement PlansIn 2020, 83 percent of mutual fund–owning households in the United States held mutual funds inside employer-sponsored retirement plan accounts (Figure 2.1), which include DC plans (such as 401(k), 403(b), or 457 plans) and employer-sponsored IRAs (SEP IRAs, SAR-SEP IRAs, and SIMPLE IRAs). Sixty-three percent of mutual fund–owning households owned mutual funds outside employer-sponsored retirement plan accounts, purchased either through the sales force channel (investment professionals) or through the direct market channel. Forty-six percent of mutual fund–owning households owned funds both inside and outside employer-sponsored retirement plans.
The remaining figures for this chapter show how mutual fund–owning households’ demographic and financial characteristics, pattern of mutual fund ownership, financial assets, financial goals, and willingness to take risk vary by whether the mutual fund–owning households held mutual funds inside or outside employer-sponsored retirement plans (see Figures 2.2 to 2.9, available in a Microsoft Excel file located at www.ici.org/info/20_rpt_profiles_data20.xls).
FIGURE 2.1Mutual Fund Owning–Households by Fund Ownership Inside and Outside Employer‑Sponsored Retirement PlansPercentage of US households owning mutual funds, 2020
46
17
37
Only outside employer-sponsored retirement plansInside and outside employer-sponsored retirement plansOnly inside employer-sponsored retirement plans
63%Owned mutual funds outside
employer-sponsored retirement plans83%
Owned mutual funds inside employer-sponsored retirement plans
Note: Employer-sponsored retirement plans include DC plans (such as 401(k), 403(b), or 457 plans) and employer-sponsored IRAs (SEP IRAs, SAR-SEP IRAs, and SIMPLE IRAs).


ICI RESEARCH REPORT: PROFILE OF MUTUAL FUND SHAREHOLDERS, 2020 // 19
CHAPTER 3
Mutual Fund–Owning Households by Channels Used to Purchase Mutual Funds Outside Employer‑Sponsored Retirement PlansMutual fund–owning households gain access to mutual funds through a variety of channels. In 2020, 83 percent of mutual fund–owning households held mutual funds through employer-sponsored retirement plans, and 63 percent owned mutual funds outside such plans (Figure 3.1). This latter group purchased funds through two sources: the sales force channel (investment professionals) and the direct market channel. The sales force channel includes registered investment advisers, full-service brokers, independent financial planners, bank or savings institution representatives, insurance agents, and accountants. The direct market channel includes fund companies and discount brokers. In 2020, nearly half of households owning mutual funds held funds purchased through the sales force channel, and 31 percent owned funds purchased through the direct market channel.
The remaining figures for this chapter illustrate how mutual fund–owning households’ demographic and financial characteristics, pattern of mutual fund ownership, financial assets, financial goals, and willingness to take risk vary by purchase channel (see Figures 3.2 to 3.9, available in a Microsoft Excel file located at www.ici.org/info/20_rpt_profiles_data20.xls).
FIGURE 3.1Sources Used by Mutual Fund–Owning Households to Purchase Mutual FundsPercentage of US households owning mutual funds, 2020
47%Sales force/Investment professionals
31%Direct market
63%Owned mutual funds outside employer-sponsored retirement plans*
Discountbroker
Mutual fundcompanydirectly
AccountantInsuranceagent
Bank orsavings institution
representative
Independentfinancialplanner
Full-servicebroker
Inside employer-sponsored
retirement plans*
1679172226
83
21
* Employer-sponsored retirement plans include DC plans (such as 401(k), 403(b), or 457 plans) and employer-sponsored IRAs (SEP IRAs, SAR-SEP IRAs, and SIMPLE IRAs). Note: Multiple responses are included.

ICI RESEARCH REPORT: PROFILE OF MUTUAL FUND SHAREHOLDERS, 2020 // 21
CHAPTER 4
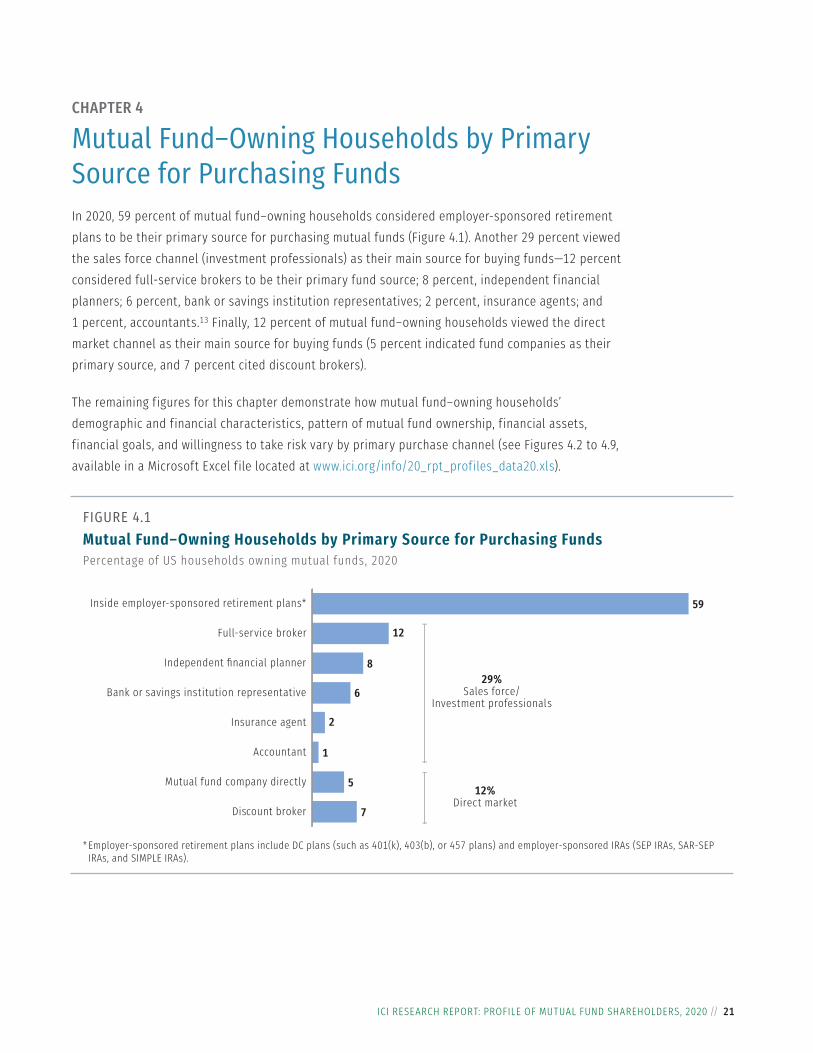
Mutual Fund–Owning Households by Primary Source for Purchasing FundsIn 2020, 59 percent of mutual fund–owning households considered employer-sponsored retirement plans to be their primary source for purchasing mutual funds (Figure 4.1). Another 29 percent viewed the sales force channel (investment professionals) as their main source for buying funds—12 percent considered full-service brokers to be their primary fund source; 8 percent, independent financial planners; 6 percent, bank or savings institution representatives; 2 percent, insurance agents; and 1 percent, accountants.13 Finally, 12 percent of mutual fund–owning households viewed the direct market channel as their main source for buying funds (5 percent indicated fund companies as their primary source, and 7 percent cited discount brokers).
The remaining figures for this chapter demonstrate how mutual fund–owning households’ demographic and financial characteristics, pattern of mutual fund ownership, financial assets, financial goals, and willingness to take risk vary by primary purchase channel (see Figures 4.2 to 4.9, available in a Microsoft Excel file located at www.ici.org/info/20_rpt_profiles_data20.xls).
FIGURE 4.1Mutual Fund–Owning Households by Primary Source for Purchasing FundsPercentage of US households owning mutual funds, 2020
29%Sales force/
Investment professionals
12%Direct market
Discount broker
Mutual fund company directly
Accountant
Insurance agent
Bank or savings institution representative
Independent financial planner
Full-service broker
Inside employer-sponsored retirement plans*
7
5
1
2
6
8
12
59
* Employer-sponsored retirement plans include DC plans (such as 401(k), 403(b), or 457 plans) and employer-sponsored IRAs (SEP IRAs, SAR-SEP IRAs, and SIMPLE IRAs).


ICI RESEARCH REPORT: PROFILE OF MUTUAL FUND SHAREHOLDERS, 2020 // 23
CHAPTER 5
Mutual Fund–Owning Households by GenerationAmericans across all generations own mutual funds. In 2020, 30 percent of individuals heading households that owned mutual funds were members of Generation Z and the Millennial Generation, who were born between 1981 and 2012 and were 39 or younger at the time of the survey (Figure 5.1).14 Thirty-one percent were members of Generation X, those born between 1965 and 1980 and aged 40 to 55 at the time of the survey. The Baby Boom Generation—who were born between 1946 and 1964 and were between 56 and 74 at the time of the survey—were an additional 31 percent of individuals heading mutual fund–owning households. The remaining 8 percent of individuals heading mutual fund–owning households were members of the Silent and GI Generations, born between 1904 and 1945, who were 75 or older at the time of the survey.15
Older generations held the majority of household mutual fund assets (Figure 5.1). In 2020, the Baby Boom Generation held 43 percent of total household mutual fund assets, and the Silent and GI Generations held an additional 10 percent. Generation X held 31 percent of total household mutual fund assets, and Generation Z and Millennials held the remaining 16 percent.
FIGURE 5.1Mutual Fund–Owning Households and Assets by GenerationPercentage of the total, 2020
Silent and GI Generations (born between 1904 and 1945)Baby Boom Generation (born between 1946 and 1964)Generation X (born between 1965 and 1980)Generation Z and Millennials (born between 1981 and 2012)*
Households owning mutual funds
8
31
Households’ mutual fund assets
10
43
31
30
31
16
* Generation Z (born 1997 to 2012) and the Millennial Generation (born 1981 to 1996) are aged 8 to 39 in 2020; however, survey respondents must be 18 or older.Note: Generation is based on the age of the household sole or co-decisionmaker for saving and investing.

24 // ICI RESEARCH REPORT: PROFILE OF MUTUAL FUND SHAREHOLDERS, 2020
The remaining figures for this chapter explain how mutual fund–owning households’ demographic and financial characteristics, pattern of mutual fund ownership, financial assets, financial goals, and willingness to take risk vary by generation (see Figures 5.2 to 5.9, available in a Microsoft Excel file located at www.ici.org/info/20_rpt_profiles_data20.xls).
ICI RESEARCH REPORT: PROFILE OF MUTUAL FUND SHAREHOLDERS, 2020 // 25
CHAPTER 6
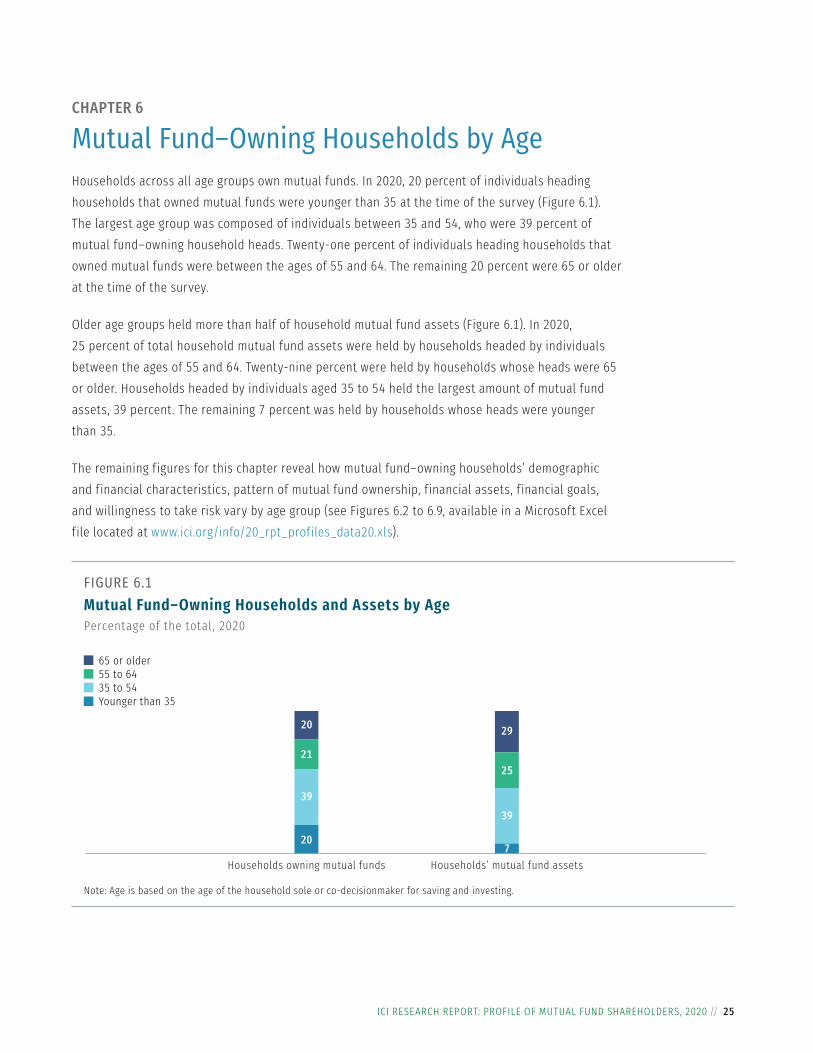
Mutual Fund–Owning Households by AgeHouseholds across all age groups own mutual funds. In 2020, 20 percent of individuals heading households that owned mutual funds were younger than 35 at the time of the survey (Figure 6.1). The largest age group was composed of individuals between 35 and 54, who were 39 percent of mutual fund–owning household heads. Twenty-one percent of individuals heading households that owned mutual funds were between the ages of 55 and 64. The remaining 20 percent were 65 or older at the time of the survey.
Older age groups held more than half of household mutual fund assets (Figure 6.1). In 2020, 25 percent of total household mutual fund assets were held by households headed by individuals between the ages of 55 and 64. Twenty-nine percent were held by households whose heads were 65 or older. Households headed by individuals aged 35 to 54 held the largest amount of mutual fund assets, 39 percent. The remaining 7 percent was held by households whose heads were younger than 35.
The remaining figures for this chapter reveal how mutual fund–owning households’ demographic and financial characteristics, pattern of mutual fund ownership, financial assets, financial goals, and willingness to take risk vary by age group (see Figures 6.2 to 6.9, available in a Microsoft Excel file located at www.ici.org/info/20_rpt_profiles_data20.xls).
FIGURE 6.1Mutual Fund–Owning Households and Assets by AgePercentage of the total, 2020
65 or older55 to 6435 to 54Younger than 35
Households owning mutual funds
20
21
Households’ mutual fund assets
29
25
39
20
39
7
Note: Age is based on the age of the household sole or co-decisionmaker for saving and investing.


ICI RESEARCH REPORT: PROFILE OF MUTUAL FUND SHAREHOLDERS, 2020 // 27
CHAPTER 7
Mutual Fund–Owning Households by Household IncomeHouseholds in all income categories own mutual funds. In 2020, 12 percent of mutual fund–owning households had incomes of less than $50,000, 31 percent had household incomes between $50,000 and $99,999, 24 percent had household incomes between $100,000 and $149,999, and 33 percent had household incomes of $150,000 or more (Figure 7.1).16 The median household income of mutual fund–owning households ($105,000) was more than the median household income nationwide ($68,703),17 reflecting their older age, higher education, and higher likelihood of full-time employment, on average.
The remaining figures for this chapter establish how mutual fund–owning households’ demographic and financial characteristics, pattern of mutual fund ownership, financial assets, financial goals, and willingness to take risk vary by household income (see Figures 7.2 to 7.9, available in a Microsoft Excel file located at www.ici.org/info/20_rpt_profiles_data20.xls).
FIGURE 7.1Mutual Fund–Owning Households by Household IncomePercentage of US households owning mutual funds, 2020
12%Less than $50,000
31%$50,000 to $99,999
24%$100,000 to $149,999
33%$150,000 or more
Note: Total reported is household income before taxes in 2019.


ICI RESEARCH REPORT: PROFILE OF MUTUAL FUND SHAREHOLDERS, 2020 // 29
CHAPTER 8
Mutual Fund–Owning Households by Household Financial AssetsMutual fund–owning households represent a range of levels of household financial assets. In 2020, 14 percent of mutual fund–owning households in the United States had household financial assets of less than $50,000, and 10 percent had household financial assets between $50,000 and $99,999 (Figure 8.1). Another 20 percent had household financial assets between $100,000 and $249,999, and 56 percent had household financial assets of $250,000 or more. Household financial assets include assets in employer-sponsored retirement plans but exclude the household’s primary residence.
The remaining figures for this chapter demonstrate how mutual fund–owning households’ demographic and financial characteristics, pattern of mutual fund ownership, financial assets, financial goals, and willingness to take risk vary by household financial assets (see Figures 8.2 to 8.9, available in a Microsoft Excel file located at www.ici.org/info/20_rpt_profiles_data20.xls).
FIGURE 8.1Mutual Fund–Owning Households by Household Financial AssetsPercentage of US households owning mutual funds, 2020
20%$100,000 to $249,999
56%$250,000 or more
14%Less than $50,000
10%$50,000 to $99,999
Note: Household financial assets include assets in employer-sponsored retirement plans but exclude the household’s primary residence.


ICI RESEARCH REPORT: PROFILE OF MUTUAL FUND SHAREHOLDERS, 2020 // 31
FIGURE 9.1Mutual Fund–Owning Households by Investment Risk TolerancePercentage of US households owning mutual funds, 2020
33
7
42
810
Substantial risk for substantial gainAbove-average risk for above-average gainAverage investment risk for average gainBelow-average risk for below-average gainUnwilling to take any risk
40%Substantial or above-average investment risk
42%Average investment risk
18%Below-average or no investment risk
Level of risk willing to take with financial investments
CHAPTER 9
Mutual Fund–Owning Households by Investment Risk ToleranceMutual fund–owning households generally indicate willingness to take financial risk. In 2020, 40 percent of mutual fund–owning households in the United States were willing to take substantial or above-average risk for similar levels of financial gain (Figure 9.1). Those willing to take average risk for average financial gain—the largest group—accounted for 42 percent of all mutual fund–owning households. Eighteen percent of mutual fund–owning households described themselves as willing to take below-average risk for below-average financial gain or unwilling to take any investment risk.
The remaining figures for this chapter show how mutual fund–owning households’ demographic and financial characteristics, pattern of mutual fund ownership, financial assets, and financial goals vary by investment risk tolerance (see Figures 9.2 to 9.9, available in a Microsoft Excel file located at www.ici.org/info/20_rpt_profiles_data20.xls).


ICI RESEARCH REPORT: PROFILE OF MUTUAL FUND SHAREHOLDERS, 2020 // 33
CHAPTER 10
Mutual Fund–Owning Households by Year of Initial Mutual Fund PurchaseMost mutual fund–owning households have invested in mutual funds for many years. In 2020, 22 percent of mutual fund–owning households reported that the household purchased their first mutual fund before 1990; 29 percent purchased their first mutual fund between 1990 and 1999; and 25 percent purchased their first mutual fund between 2000 and 2009 (Figure 10.1). Twenty-four percent of mutual fund–owning households purchased their first mutual fund in 2010 or later.
The remaining figures for this chapter illustrate how mutual fund–owning households’ demographic and financial characteristics, pattern of mutual fund ownership, financial assets, financial goals, and willingness to take risk vary by year of initial mutual fund purchase (see Figures 10.2 to 10.9, available in a Microsoft Excel file located at www.ici.org/info/20_rpt_profiles_data20.xls).
FIGURE 10.1Mutual Fund–Owning Households by Year of Initial Mutual Fund PurchasePercentage of US households owning mutual funds, 2020
29%Between 1990 and 1999
22%Before 1990
25%Between 2000 and 2009
24%2010 or later
34 // ICI RESEARCH REPORT: PROFILE OF MUTUAL FUND SHAREHOLDERS, 2020
Additional Reading
» Ownership of Mutual Funds, Shareholder Sentiment, and Use of the Internet, 2020 www.ici.org/pdf/per26‑08.pdf
» Characteristics of Mutual Fund Investors, 2020 www.ici.org/pdf/per26‑09.pdf
» 2020 Investment Company Fact Book: A Review of Trends and Activities in the Investment Company Industry www.icifactbook.org
» ICI Research on Mutual Fund Ownership www.ici.org/research/investors/ownership
» ICI Research on Mutual Fund Shareholders’ Use of Information www.ici.org/research/investors/information

ICI RESEARCH REPORT: PROFILE OF MUTUAL FUND SHAREHOLDERS, 2020 // 35
APPENDIX
Research MethodologyResearch DesignKantar TNS, a nationwide opinion research firm, conducted the survey of mutual fund–owning households under the direction of the Investment Company Institute’s Research Department. The survey gathered demographic, financial, and fund ownership characteristics of mutual fund–owning households nationwide. The survey collected information on fund ownership inside and outside employer-sponsored retirement plans, including the number and types of funds owned and total mutual fund assets. The survey also gathered data about aspects of fund investing, including financial goals and willingness to take investment risk. Finally, the survey collected information on household income and demographic data such as the age, education, and marital status of the head of household.
InterviewingICI conducts the Annual Mutual Fund Shareholder Tracking Survey each year to gather information on the demographic and financial characteristics of mutual fund–owning households in the United States. The most recent survey was conducted from May to June 2020 and was based on a dual-frame telephone sample of 3,001 US households. Of these, 1,350 households were from a landline random digit dial (RDD) frame, and 1,651 households were from a cell phone RDD frame. Of the households contacted, 1,372 (45.7 percent) owned mutual funds. All interviews were conducted over the telephone with the member of the household who was either the sole or the co-decisionmaker most knowledgeable about the household’s savings and investments.
Revisions to ICI’s Annual Mutual Fund Shareholder Tracking SurveyIn the usual course of household survey work, researchers periodically reexamine sampling and weighting methods to ensure that the results published are representative of the underlying population of interest. ICI reexamined its Annual Mutual Fund Shareholder Tracking Survey in 2014, and the figures presented in this paper for the 2020 survey reflect a revised sampling and weighting methodology that was adopted in 2014. To achieve a representative sample of US households, the 2014, 2015, 2016, 2017, and 2018 Annual Mutual Fund Shareholder Tracking Surveys were based on a dual-frame sample of landline (about half) and cell phone numbers (about half). The combined sample for 2019 and 2020 includes about 45 percent of households reached on a landline and about 55 percent of households reached on a cell phone. Before 2014, the Annual Mutual Fund Shareholder Tracking Survey was based on a sample of landline phone numbers. The change to a combined sample of cell and landline phone numbers improves the representativeness of the sample. For
36 // ICI RESEARCH REPORT: PROFILE OF MUTUAL FUND SHAREHOLDERS, 2020
a detailed description of the survey methodology, see “Ownership of Mutual Funds, Shareholder Sentiment, and Use of the Internet, 2020,” ICI Research Perspective 26, no. 8 (November), available at www.ici.org/pdf/per26-08.pdf.
Survey WeightsWhen a survey sample is drawn from a population, the proportions of segments within the sample (by age, income, or other key variables) may not match the distribution of those segments within the population. The sample’s distribution may be different due to sampling techniques, varying degrees of nonresponse from segments of the population, or a survey design that was not able to cover the entire population. It is possible to improve the relation between the sample and the population from which it was drawn by applying weights to the sample that match the proportions present in the population. This process is known as sample-balancing, or raking.18 Because the sample methodology for the Annual Mutual Fund Shareholder Tracking Survey is a dual-frame RDD survey including cell phones, it was necessary to adjust the weighting methodology for the survey. In order to combine the landline and cell phone samples, an initial base weight was created to adjust for households that could have been in both the landline and cell phone sample frames. A second stage of weighting included the standard raking to control totals based on census region, householder age, household income, and educational attainment of the head of household from the most recent version of the Annual Social and Economic Supplement (ASEC) to the Current Population Survey (CPS).19 In the 2014, 2015, 2016, 2017, 2018, 2019, and 2020 survey, the second stage of weighting also included raking to control totals based on household telephone status from the most recent version of the National Health Interview Survey (NHIS).20 The weighting adjusts for differences among the households sampled in the ICI survey and the population of US households.
Sampling ErrorThe use of sample surveys is standard practice for constructing estimates about a total population. Estimates derived through survey sampling are subject to sampling error. As sample size increases, the level of potential sampling error generally becomes smaller. The overall margin of sampling error for the 2020 sample of households owning mutual funds is ± 2.6 percentage points at the 95 percent confidence level. Components may not add to 100 percent because of rounding; where respondents were allowed to provide multiple responses, percentages may add to more than 100 percent.

ICI RESEARCH REPORT: PROFILE OF MUTUAL FUND SHAREHOLDERS, 2020 // 37
Notes1 Tabulations of Investment Company Institute data indicate that total net assets in mutual funds for June
2000 were $7,113 billion. More specifically, in June 2000, equity mutual funds held $4,292 billion; hybrid mutual funds held $362 billion; bond mutual funds held $801 billion; and money market mutual funds held $1,658 billion. Total net assets in mutual funds for June 2020 were $21,411 billion—equity mutual funds held $10,609 billion; hybrid mutual funds held $1,450 billion; bond mutual funds held $4,718 billion; and money market funds held $4,635 billion. See Investment Company Institute 2020a.
2 For the full series of mutual fund incidence, see Holden, Schrass, and Bogdan 2020a.3 See Holden, Schrass, and Bogdan 2020a.4 See “Appendix: Research Methodology” on page 35 for details on the survey’s design, interviewing
procedures, revisions to survey sampling, weighting, and margin of sampling error.5 For prior years’ reports, see Schrass and Holden 2008; Schrass and Bass 2009 and 2010; Schrass and
Bogdan 2011 and 2012; Bogdan and Schrass 2013, 2014, 2015, and 2016; and Schrass and Bogdan 2017a, 2017b, 2018, and 2019.
6 See Figure 10 in Holden, Schrass, and Bogdan 2020b.7 Survey participants must be 18 or older and be the most knowledgeable about the household’s savings and
investments; so, although people born between 1981 and 2012 are members of the Millennial Generation (1981 to 1996) and Generation Z (1997 to 2012), only those born between 1981 and 2002 are included in this survey. The majority of this grouping is the Millennial Generation; Generation Z represents 3 percent of individuals heading mutual fund–owning households in 2020.
8 The majority of this grouping is the Silent Generation. The GI Generation, which includes individuals born between 1904 and 1927, represented less than 0.5 percent of individuals heading mutual fund–owning households in 2020.
9 Throughout this report, head of household refers to the survey respondent who identified themselves as the sole or co-decisionmaker for household saving and investing.
10 IRAs include traditional IRAs, Roth IRAs, and employer-sponsored IRAs (SEP IRAs, SAR-SEP IRAs, and SIMPLE IRAs). For additional information on IRA-owning households, see Holden and Schrass 2021a. For detailed analysis of IRA investors’ account balances; asset allocation; and contribution, rollover, conversion, and withdrawal activities, see Holden and Bass 2018 and Holden and Schrass 2018.
11 Balanced funds, also called hybrid funds, invest in a mix of equities and fixed-income securities. Most target date and lifestyle mutual funds are counted in this category.
12 See Figure 11 in Holden, Schrass, and Bogdan 2020a. In 2020, 40 percent of mutual fund–owning households were willing to take above-average or substantial investment risk, compared with 12 percent of households not owning mutual funds.
13 The sample sizes for mutual fund–owning households that consider either insurance agents or accountants to be their primary source for purchasing mutual funds were too small to analyze. Thus, Figures 4.2 to 4.9 do not report separate data for those households.
14 Survey participants must be 18 or older and be the most knowledgeable about the household’s savings and investments; so, although people born between 1981 and 2012 are members of the Millennial Generation (1981 to 1996) and Generation Z (1997 to 2012), only those born between 1981 and 2002 are included in this survey. The majority of this grouping is the Millennial Generation; Generation Z represents 3 percent of individuals heading mutual fund–owning households in 2020.
15 The majority of this grouping is the Silent Generation. The GI Generation, which includes individuals born between 1904 and 1927, represented less than 0.5 percent of individuals heading mutual fund–owning households in 2020.
16 Total reported is household income before taxes in 2019.17 The median household income nationwide was $68,703 in 2019. See US Census Bureau 2020.18 See Izrael, Hoaglin, and Battaglia 2004.19 See US Census Bureau 2020.20 Responses were weighted to five telephone status categories: cell phone–only; both, cell phone–mostly;
both, equally; both, landline–mostly; and landline–only. See Blumberg and Luke 2020.

38 // ICI RESEARCH REPORT: PROFILE OF MUTUAL FUND SHAREHOLDERS, 2020
ReferencesBlumberg, Stephen J., and Julian V. Luke. 2020. “Wireless Substitution: Early Release of Estimates from the National Health Interview Survey, July–December 2019.” National Health Interview Survey Early Release Program. Hyattsville, MD: Centers for Disease Control and Prevention, National Center for Health Statistics. Available at www.cdc.gov/nchs/data/nhis/earlyrelease/wireless202009-508.pdf.
Bogdan, Michael, and Daniel Schrass. 2013. “Profile of Mutual Fund Shareholders, 2012.” ICI Research Report (February). Available at www.ici.org/pdf/rpt_13_profiles.pdf.
Bogdan, Michael, and Daniel Schrass. 2014. “Profile of Mutual Fund Shareholders, 2013.” ICI Research Report (February). Available at www.ici.org/pdf/rpt_14_profiles.pdf.
Bogdan, Michael, and Daniel Schrass. 2015. “Profile of Mutual Fund Shareholders, 2014.” ICI Research Report (February). Available at www.ici.org/pdf/rpt_15_profiles.pdf.
Bogdan, Michael, and Daniel Schrass. 2016. “Profile of Mutual Fund Shareholders, 2015.” ICI Research Report (March). Available at www.ici.org/pdf/rpt_16_profiles.pdf.
Holden, Sarah, and Steven Bass. 2018. “The IRA Investor Profile: Traditional IRA Investors’ Activity, 2007–2016.” ICI Research Report (September). Available at www.ici.org/pdf/rpt_18_ira_traditional.pdf.
Holden, Sarah, and Daniel Schrass. 2018. “The IRA Investor Profile: Roth IRA Investors’ Activity, 2007–2016.” ICI Research Report (September). Available at www.ici.org/pdf/rpt_18_ira_roth_investors.pdf.
Holden, Sarah, and Daniel Schrass. 2021a. “The Role of IRAs in US Households’ Saving for Retirement, 2020.” ICI Research Perspective 27, no. 1 (January). Available at www.ici.org/pdf/per27-01.pdf.
Holden, Sarah, and Daniel Schrass. 2021b. “Supplemental Tables: The Role of IRAs in US Households’ Saving for Retirement, 2020.” ICI Research Perspective 27, no. 1 (January). Available at www.ici.org/pdf/per27-01_data.xls.
Holden, Sarah, Daniel Schrass, and Michael Bogdan. 2020a. “Ownership of Mutual Funds, Shareholder Sentiment, and Use of the Internet, 2020.” ICI Research Perspective 26, no. 8 (November). Available at www.ici.org/pdf/per26-08.pdf.
Holden, Sarah, Daniel Schrass, and Michael Bogdan. 2020b. “Characteristics of Mutual Fund Investors, 2020.” ICI Research Perspective 26, no. 9 (November). Available at www.ici.org/pdf/per26-09.pdf.
Investment Company Institute. 2020a. “Trends in Mutual Fund Investing.” Available at www.ici.org/research/stats/trends.

ICI RESEARCH REPORT: PROFILE OF MUTUAL FUND SHAREHOLDERS, 2020 // 39
Investment Company Institute. 2020b. 2020 Investment Company Fact Book: A Review of Trends and Activities in the Investment Company Industry. Washington, DC: Investment Company Institute. Available at www.icifactbook.org.
Izrael, David, David C. Hoaglin, and Michael P. Battaglia. 2004. “To Rake or Not to Rake Is Not the Question Anymore with the Enhanced Raking Macro.” May 2004 SUGI Conference, Montreal, Canada. Available at www2.sas.com/proceedings/sugi29/207-29.pdf.
Schrass, Daniel, and Steven Bass. 2009. “Profile of Mutual Fund Shareholders, 2008.” ICI Research Report (Winter). Available at www.ici.org/pdf/rpt_profile09.pdf.
Schrass, Daniel, and Steven Bass. 2010. “Profile of Mutual Fund Shareholders, 2009.” ICI Research Report (Winter). Available at www.ici.org/pdf/rpt_profile10.pdf.
Schrass, Daniel, and Michael Bogdan. 2011. “Profile of Mutual Fund Shareholders, 2010.” ICI Research Report (February). Available at www.ici.org/pdf/rpt_11_profiles.pdf.
Schrass, Daniel, and Michael Bogdan. 2012. “Profile of Mutual Fund Shareholders, 2011.” ICI Research Report (February). Available at www.ici.org/pdf/rpt_12_profiles.pdf.
Schrass, Daniel, and Michael Bogdan. 2017a. “Profile of Mutual Fund Shareholders, 2016.” ICI Research Report (February). Available at www.ici.org/pdf/rpt_17_profiles16.pdf.
Schrass, Daniel, and Michael Bogdan. 2017b. “Profile of Mutual Fund Shareholders, 2017.” ICI Research Report (October). Available at www.ici.org/pdf/rpt_17_profiles17.pdf.
Schrass, Daniel, and Michael Bogdan. 2018. “Profile of Mutual Fund Shareholders, 2018.” ICI Research Report (December). Available at www.ici.org/pdf/rpt_18_profiles18.pdf.
Schrass, Daniel, and Michael Bogdan. 2019. “Profile of Mutual Fund Shareholders, 2019.” ICI Research Report (December). Available at www.ici.org/pdf/rpt_19_profiles19.pdf.
Schrass, Daniel, and Sarah Holden. 2008. “Profile of Mutual Fund Shareholders.” ICI Research Report (February). Available at www.ici.org/pdf/rpt_profile08.pdf.
US Census Bureau. 2020. “Income and Poverty in the United States: 2019.” Current Population Reports, P60-270 (September). Washington, DC: US Government Printing Office. Available at www.census.gov/content/dam/Census/library/publications/2020/demo/p60-270.pdf.

WASHINGTON, DC • LONDON • BRUSSELS • HONG KONG • WWW.ICI.ORG
Daniel SchrassDaniel Schrass is an economist in the retirement and investor research division at ICI. He focuses on investor demographics and behavior, as well as trends in household retirement saving activity. His detailed research includes analysis of IRA-owning households and individual IRA investors in the IRA Investor DatabaseTM, which includes data on more than 17 million IRA investors. He also conducts research with government surveys such as the Survey of Consumer Finances, the Current Population Survey, and the Survey of Household Economics and Decisionmaking. Before joining ICI in October 2007, he served as an economist at the US Bureau of Labor Statistics. He has an MA in applied economics from the Johns Hopkins University and a BS in economics from the Pennsylvania State University.
Michael BogdanMichael Bogdan is an associate economist in the retirement and investor research division at ICI. Bogdan conducts research concerning the Institute’s household surveys. His areas of expertise include households’ ownership of mutual funds and other investments, retirement plans, and individual retirement accounts. Bogdan also conducts research with government surveys such as the Survey of Consumer Finances and the Current Population Survey. Before joining ICI in 1997, Bogdan worked for the chemical engineering department at Michigan State University as a technology transfer specialist for the Composite Materials and Structures Center. He has an MA and a BS in economics from Miami University in Oxford, Ohio.