Productsalesforecastingusingonlinereviewsandhistoricalsale...
11
Product sales forecasting using online reviews and historical sales data: A method combining the Bass model and sentiment analysis Zhi-Ping Fan, Yu-Jie Che, Zhen-Yu Chen ⁎ Department of Information Management and Decision Sciences, School of Business Administration, Northeastern University, Shenyang 110167, China abstract article info Article history: Received 14 May 2016 Received in revised form 19 January 2017 Accepted 21 January 2017 Available online xxxx Online reviews provide consumers with rich information that may reduce their uncertainty regarding purchases. As such, these reviews have a significant influence on product sales. In this paper, a novel method that combines the Bass/Norton model and sentiment analysis while using historical sales data and online review data is devel- oped for product sales forecasting. A sentiment analysis method, the Naive Bayes algorithm, is used to extract the sentiment index from the content of each online review and integrate it into the imitation coefficient of the Bass/ Norton model to improve the forecasting accuracy. We collected real-world automotive industry data and related online reviews. The computational results indicate that the combination of the Bass/Norton model and sentiment analysis has higher forecasting accuracy than the standard Bass/Norton model and some other sales forecasting models. © 2017 Elsevier Inc. All rights reserved. Keywords: Product sales forecasting Online reviews Sentiment analysis Bass model Norton model 1. Introduction Firms use product sales forecasting as a foundation to estimate sales revenue and make decisions regarding production, operation and mar- keting strategies (Marshall, Dockendorff, & Ibáñez, 2013; Shi, Bigdeli, & Li, 2015). Through product sales forecasting, firms can create a plan for marketing, sales management, production, procurement, logistics and so on to improve their economic benefits and reduce losses caused by weaknesses in the production plan (Mentzer & Bienstock, 1998). Ac- cording to the extant research, two primary factors influence con- sumers' purchasing decisions. One is the influence of other consumers who have bought the product and recommended it through verbal com- munication. The other is the influence of advertisements and the mass media, among other factors. A number of researchers have studied product sales forecasting and developed effective forecasting models that take relevant factors into account. Among them, the Bass model (Bass, 1969) simultaneously considers these factors as external and in- ternal coefficients. Thus, the Bass model along with its extensions, such as the Norton model (Norton & Bass, 1987) and the contingent diffusion model (Peterson & Mahajan, 1978) is commonly used for new products, technology diffusion and product sales forecasting (Hyman & Michael, 1988), and it has been successfully applied in many fields, particularly in the durable consumer goods (Bass, 2004; Wang, Chang, & Hsiao, 2013), equipment and IT technology (Speece & Maclachlan, 1995; Barnes, Southwell, Bruce, et al., 2014; Wu & Chu, 2010), telecommuni- cation services and retail (Seol, Park, Lee, & Yoon, 2012; Song, Lee, Zo, & Lee, 2015; Guo, 2014; Turk & Trkman, 2012) industries. Word of mouth (WOM) is considered one of the most important fac- tors influencing the purchasing decisions of consumers, especially with regard to imitators (Herr, Kardes, & Kim, 1991; Taylor, 2003). Online WOM, such as online reviews and microblogs, have become popular with the development of Internet technologies. A number of e-com- merce websites such as Amazon and Taobao have established online re- view systems to encourage consumers to post product reviews and, as a result, have gradually changed consumer behavior patterns and affected consumer purchasing decisions. For example, consumers are paying in- creasingly more attention to online opinions when deciding which movies to watch, in which stocks they should invest, etc. (Wysocki, 2000; Ryu & Han, 2010). In addition, many online communities, such as Facebook and Douban, provide platforms for consumer discussions. These reviews often reveal personal emotions, such as happiness, anger, sorrow, criticism and praise, and potential consumers can browse the public opinions on a product to inform their purchase decisions. Ac- cordingly, in the last decade, sentiment analysis techniques have been used to measure the sentiments conveyed through the content of online reviews (Pang & Lee, 2005; Prabowo & Thelwall, 2009). As indicated by Yu, Liu, Huang, and An (2012), the sentiment index extracted from the content of online reviews by sentiment analysis techniques can be used to forecast many social economic phenomena, including product market shares, box office attendance, transmissions of information or diseases (Culotta, 2010) and the results of political elections (Lee, 2009). The sentiment index can also be used to analyze macroeconomic Journal of Business Research 74 (2017) 90–100 ⁎ Corresponding author. E-mail addresses: [email protected] (Z.-P. Fan), [email protected] (Y.-J. Che), [email protected] (Z.-Y. Chen). http://dx.doi.org/10.1016/j.jbusres.2017.01.010 0148-2963/© 2017 Elsevier Inc. All rights reserved. Contents lists available at ScienceDirect Journal of Business Research
Transcript of Productsalesforecastingusingonlinereviewsandhistoricalsale...
Journal of Business Research 74 (2017) 90–100
Contents lists available at ScienceDirect
Journal of Business Research
Product sales forecasting using online reviews and historical sales data: Amethod combining the Bass model and sentiment analysis
Zhi-Ping Fan, Yu-Jie Che, Zhen-Yu Chen ⁎Department of Information Management and Decision Sciences, School of Business Administration, Northeastern University, Shenyang 110167, China
⁎ Corresponding author.E-mail addresses: [email protected] (Z.-P. Fan), 3
[email protected] (Z.-Y. Chen).
http://dx.doi.org/10.1016/j.jbusres.2017.01.0100148-2963/© 2017 Elsevier Inc. All rights reserved.
a b s t r a c t
a r t i c l e i n f oArticle history:Received 14 May 2016Received in revised form 19 January 2017Accepted 21 January 2017Available online xxxx
Online reviews provide consumerswith rich information thatmay reduce their uncertainty regarding purchases.As such, these reviews have a significant influence on product sales. In this paper, a novel method that combinesthe Bass/Norton model and sentiment analysis while using historical sales data and online review data is devel-oped for product sales forecasting. A sentiment analysismethod, the Naive Bayes algorithm, is used to extract thesentiment index from the content of each online review and integrate it into the imitation coefficient of the Bass/Nortonmodel to improve the forecasting accuracy.We collected real-world automotive industry data and relatedonline reviews. The computational results indicate that the combination of the Bass/Nortonmodel and sentimentanalysis has higher forecasting accuracy than the standard Bass/Norton model and some other sales forecastingmodels.
© 2017 Elsevier Inc. All rights reserved.
Keywords:Product sales forecastingOnline reviewsSentiment analysisBass modelNorton model
1. Introduction
Firms use product sales forecasting as a foundation to estimate salesrevenue and make decisions regarding production, operation and mar-keting strategies (Marshall, Dockendorff, & Ibáñez, 2013; Shi, Bigdeli, &Li, 2015). Through product sales forecasting, firms can create a plan formarketing, sales management, production, procurement, logistics andso on to improve their economic benefits and reduce losses caused byweaknesses in the production plan (Mentzer & Bienstock, 1998). Ac-cording to the extant research, two primary factors influence con-sumers' purchasing decisions. One is the influence of other consumerswhohave bought theproduct and recommended it through verbal com-munication. The other is the influence of advertisements and the massmedia, among other factors. A number of researchers have studiedproduct sales forecasting and developed effective forecasting modelsthat take relevant factors into account. Among them, the Bass model(Bass, 1969) simultaneously considers these factors as external and in-ternal coefficients. Thus, the Bass model along with its extensions, suchas theNortonmodel (Norton & Bass, 1987) and the contingent diffusionmodel (Peterson &Mahajan, 1978) is commonly used for newproducts,technology diffusion and product sales forecasting (Hyman & Michael,1988), and it has been successfully applied in many fields, particularlyin the durable consumer goods (Bass, 2004; Wang, Chang, & Hsiao,2013), equipment and IT technology (Speece & Maclachlan, 1995;
[email protected] (Y.-J. Che),
Barnes, Southwell, Bruce, et al., 2014; Wu & Chu, 2010), telecommuni-cation services and retail (Seol, Park, Lee, & Yoon, 2012; Song, Lee, Zo,& Lee, 2015; Guo, 2014; Turk & Trkman, 2012) industries.
Word ofmouth (WOM) is considered one of themost important fac-tors influencing the purchasing decisions of consumers, especially withregard to imitators (Herr, Kardes, & Kim, 1991; Taylor, 2003). OnlineWOM, such as online reviews and microblogs, have become popularwith the development of Internet technologies. A number of e-com-mercewebsites such as Amazon and Taobao have established online re-view systems to encourage consumers to post product reviews and, as aresult, have gradually changed consumer behavior patterns and affectedconsumer purchasing decisions. For example, consumers are paying in-creasingly more attention to online opinions when deciding whichmovies to watch, in which stocks they should invest, etc. (Wysocki,2000; Ryu & Han, 2010). In addition, many online communities, suchas Facebook and Douban, provide platforms for consumer discussions.These reviews often reveal personal emotions, such as happiness,anger, sorrow, criticismandpraise, and potential consumers can browsethe public opinions on a product to inform their purchase decisions. Ac-cordingly, in the last decade, sentiment analysis techniques have beenused tomeasure the sentiments conveyed through the content of onlinereviews (Pang & Lee, 2005; Prabowo & Thelwall, 2009). As indicated byYu, Liu, Huang, and An (2012), the sentiment index extracted from thecontent of online reviews by sentiment analysis techniques can beused to forecast many social economic phenomena, including productmarket shares, box office attendance, transmissions of information ordiseases (Culotta, 2010) and the results of political elections (Lee,2009). The sentiment index can also be used to analyzemacroeconomic

91Z.-P. Fan et al. / Journal of Business Research 74 (2017) 90–100
conditions (Bollen,Mao, & Zeng, 2011) andwarn the public of emergen-cies (Yu & Kak, 2012).
Many studies indicate that onlineWOM influences consumer behav-ior and product sales (Liu, 2006; Godes & Mayzlin, 2004; Chevalier &Mayzlin, 2006). They find that the attributes of online reviews, such asthe number of online reviews (Duan, Gu, & Whinston, 2008; Ye, Law,& Gu, 2009; Liu, 2006), ratings (Chevalier & Mayzlin, 2006; Segal et al.,2012), and sentiments shared in the reviews (Ye et al., 2009), have ef-fect on product sales. Several researchers have explored the relationshipbetween online reviews and product sales (Chevalier & Mayzlin, 2006;Dellarocas, Awad, & Zhang, 2007) and have developed forecastingmethods that combine the Bass model and the ratings from onlineWOM (Wu, Wang, & Li, 2015; Dellarocas et al., 2007). However, thesemodels have used only the historical sales and rating data to forecastproduct sales. Few studies have developed improved versions of theBass models to consider the sentiments expressed in the content of on-line reviews. As discussed by Dellarocas et al. (2007), combining theBass model and sentiment analysis has the potential to improve theforecasting performance of the standard Bass model.
In this study, a method that combines the Bass/Norton model andsentiment analysis is proposed to forecast product sales using productreview data. This method incorporates the Naive Bayes (NB) algorithmto compute the sentiment index of online reviews and then employs thesentiment index to extend the imitation coefficient in the Bass/Nortonmodel. To the best of our knowledge, few studies have taken into ac-count the content of online reviews when extending the Bass/Nortonmodel to improve product sales. Moreover, in this study, real-world au-tomotive industry data are used to evaluate the forecasting perfor-mance of the proposed method.
The remainder of this paper is structured as follows. Section 2 pro-vides a comprehensive literature review, whereas Section 3 describesthe research framework, including data collection, online review dataprocessing, forecasting models and performance criteria. Section 4then provides the forecasting results and comparisons with the stan-dard Bass/Norton model and some other sales forecasting models, andSection 5 discusses the conclusions and limitations of this study andsuggests future research directions.
2. Literature review
The extant literature regarding product sales forecasting using on-line review data and using the Bass model are discussed herein.
2.1. Product sales forecasting based on online review data
A number of scholars have developed sentiment analysis techniquesfor predicting sales performance using online product review and blogdata mining (Asur & Humberman, 2010). In the existing literature,three types of information are extracted fromonline reviews in the fore-casting models. The first type of information is volume, which refers tothe number of online reviews. As the number of reviews a product hasincreases, consumers' knowledge about the product increases (Liu,2006). The second type is valence, which refers to the degree of con-sumer satisfaction with the product, e.g., the number of positive andnegative reviews (Liu, 2006; Godes & Mayzlin, 2004). The third typeof information is dispersion. As the distribution of product review infor-mation becomesmore dispersive, consumers' knowledge about the cor-responding product increases (Godes & Mayzlin, 2004).
Yu et al. (2012) trained a sentiment-based probabilistic latent se-mantic analysis model to obtain sentiment information from online re-views and then proposed an auto-regressive sentiment-aware modelfor sales forecasting. Using movie reviews and box office data, theyfound that sentiment information and the quality of online reviewshave a substantial effect on box office forecasting. Asur andHumberman (2010) adopted the chatter from Twitter.com to forecastbox office sales. They used the LingPipe linguistic analysis package to
construct a sentiment analysis classifier andmeasured the ratio of positivetonegative tweets to quantify the sentiments about amovie, and then con-structed a linear regression model of the rate of positive and negative on-line film reviews. They found that the sentiments extracted from Twitterimprove forecasting power. Liu, Huang, An, and Yu (2007) collectedblogs using Google's blog search engine and the box office revenue datafrom the IMDB website to explore the forecasting power of blogs. Theyforecasted product sales utilizing an auto-regressive sentiment-awaremodel and the sentiment information obtained from a sentiment-basedprobabilistic latent semantic analysis. Archak, Ghose, and Ipeirotis (2011)used the programming interface providedbyAmazonWeb Services to col-lect daily product prices and product ratings from consumer reviews onAmazon and combined natural language processing and crowdsourcingon Amazon Mechanical Turk to extract opinions from online reviews andto model a linear equation with product reviews. They demonstratedthat textual data in product reviews could be used to determine con-sumers' relative preferences for different product features and therebyforecast future changes in sales. Different from most existing researchwhich uses online reviews to forecast box office sales and sales of digitalproducts, our research focuses on the automotive industry and uses thesentiment index to extend the Bass model to forecast product sales.
2.2. Product sales forecasting using the Bass model
Recently, many researchers have modified the Bass model to im-prove the forecasting accuracy and have provided explicit guidance(Wang et al., 2013; Speece & Maclachlan, 1995; Barnes et al., 2014;Seol et al., 2012; Song et al., 2015; Guo, 2014; Turk & Trkman, 2012).Speece and Maclachlan (1995) extended the Bass and Norton modelsby adding pricing andmarket growth factors to forecast the use of pack-aging technology. Wang et al. (2013) used a modified Bass model toforecast the notebook shipments from Taiwanese firms and used a hy-brid evolutionary algorithm for the parameter estimates to improveforecasting accuracy. Barnes et al. (2014) used the Bass model to ex-plore the effects of incentive schemes on carbon-reducing technologiesand provided a general quantitative measure of the effect of an incen-tive scheme on technology adoption. Seol et al. (2012) proposed a com-petitive Bass model to forecast the demand for new services whileconsidering competitive relationships with existing services. Song etal. (2015) used an improved Bass model, the hybrid Bass-Markovmodel, to forecast the competitive service diffusion process. Turk andTrkman (2012) forecasted broadband diffusion in European countriesusing the Bass model and analyzed the future of broadband services.Lee, Kim, Park, and Kang (2014) used a statistical and machine learn-ing-based approach based on the Bass model for the pre-launch fore-casting of new product demand. Fernández-Durán (2014) defined aseasonal Bass model that took into account the seasonal effects of prod-ucts and used a family of distributions for circular random variables toestimate seasonal effects. For the automobile industry, historical prod-uct sales data are incorporated into Bass model to forecast the sales ofAlternative Fuel Vehicle (Shoemaker, 2012) and future automobileproducts (Zhu, Jiang, & Chen, 2008) and to explore the maturity of hy-brid power technology (Gao, Chai, & Tang, 2013).
In a different view, few studies have emphasized combining the Bassmodel with online review data for forecasting models. Dellarocas et al.(2007) developed a Bass model based on the revenue forecastingmodel. To test the innovation and imitation coefficients of the Bassmodel, they used online ratings, the number of posted reviews and infor-mation about the reviewers obtained from Yahoo movies. They foundthat the arithmeticmean of ratings is a useful proxy forWOMwhen fore-casting box office sales. In the extant literature related to the Bass model,only Dellarocas et al. (2007) investigated the relationship between onlinereviews andproduct sales andusedonline reviewdata to forecast productsales. This paper differs from this previous research in that we extract thesentiment index from the content of online reviews, rather than ratings,and use it to extend the Bass and Norton model.

92 Z.-P. Fan et al. / Journal of Business Research 74 (2017) 90–100
3. Methodology
3.1. Research framework
The research framework is illustrated in Fig. 1, which shows thatproduct sales forecasting using online review data includes the follow-ing three steps:
(1) Data collection and preprocessing. In this step, products withmul-tiple technological generations are selected and sales, along withonline review data, are collected. Word segmentation methodsandword frequency statistics are thenused for data preprocessing.
Fig. 1. Research framework.
(2) Sentiment index extraction and forecastingmodel building. In thisstep, a sentiment analysismethod, i.e., theNBmethod (Yu, Duan, &Cao, 2013), is used to analyze the review data and to calculate thesentiment index based on the time point. A new forecastingmodelthat combines the Bass and Norton model with the extracted sen-timent index is developed to improve the forecasting accuracy.
(3) Performance validation. In this step,wefit the proposedmodel andevaluate the forecasting performance using specific measures. Atthe same time, the results of the proposed method are comparedwith those for the standard Bass and Norton model.
3.2. Data collection and preprocessing
In this study, two types of data, i.e., historical sales and online re-views data, were collected. We extracted the following attributes foreach online review: reviewer ID, title, rating and time, the number oftimes other users have browsed the review, the number of users whoagree with (oppose) the review, and content. These attributes are pre-sented in Table 1.
As discussed in Section 2.2, information extracted from online re-views can be classified in terms of volume, valence and dispersion, aspresented in Table 1. The number of reviews made during a particulartime period is regarded as volume. The ratings and content of the re-views denote the degree of consumer satisfaction with the product,which is represented by valence. The number of views is regarded asdispersion, which means that as more users see the reviews, the effecton others increases.
Selecting useful attributes when adopting a forecasting model is acritical task. Some scholars have focused on the influence of online re-views on different types of products. For the prediction of productsales, different kinds of products can be classified as experiential andsearch products (Nelson, 1974). For experiential products such asmovies and books, the number of online reviews and the contents ofsuch reviews have a higher impact on this type of product (Chevalier& Mayzlin, 2006; Dellarocas et al., 2007; Duan et al., 2008; Liu, 2006;Ye et al., 2009; Segal et al., 2012). For search products such as digitalcamera, video camera and notebook computer, the content of online re-views has a higher impact on this kind of product (Li, 2012; Cabral &Hortacsu, 2003; Archak et al., 2011). Regardless of whether it is an expe-riential products or a search product, the content of online reviews actsas an important part of sales forecasting.
In this study, the second type of information, i.e., valence, explainsthe imitation coefficient in the Bass and Norton model. Dellarocas etal. (2007) regard the rating of online reviews as the valence of online re-views tomeasure the product customer satisfaction. Comparedwith thework of Dellarocas et al. (2007), the sentiment index extracted from thecontent of online reviews, rather than ratings, is used to reveal individ-ual preferences reflected in the imitation coefficient of the Bass model.Thus, consumer preferences can be measured more accurately by ourmodel because consumers who share equal degrees of satisfactionwith a product may assign different ratings to that product.
Table 1Attributes extracted from online reviews.
Attribute Description
ID Reviewer IDTitle Main content of the reviewRating Product rating by reviewerTime Time reviewer conducted the reviewBrowse Number of times users browsed the reviewAgree Number of users who agreed with the reviewOppose Number of users who opposed to the reviewContent Content of the review
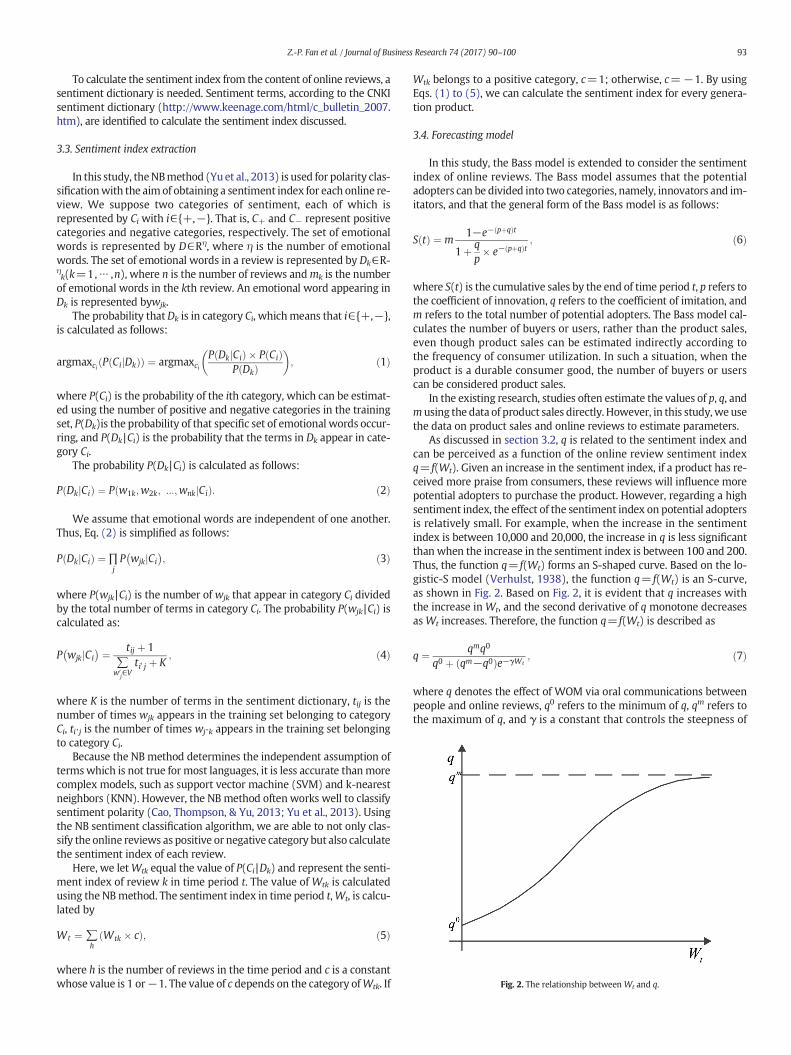
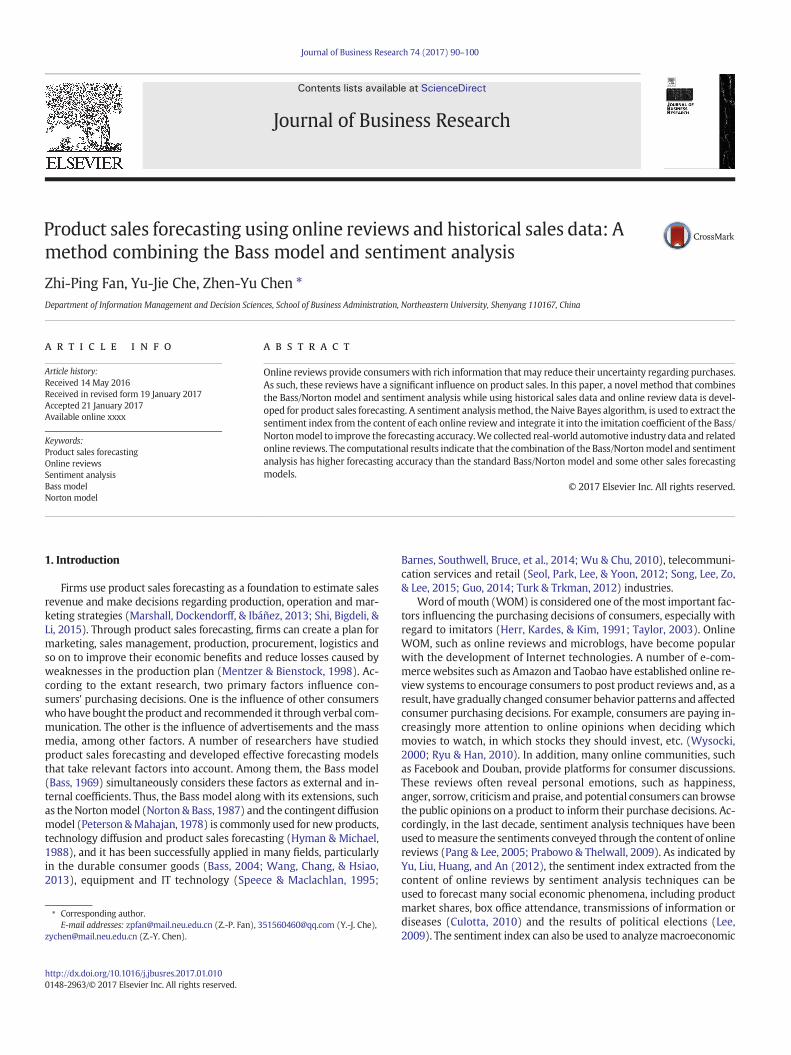
Fig. 2. The relationship between Wt and q.
93Z.-P. Fan et al. / Journal of Business Research 74 (2017) 90–100
To calculate the sentiment index from the content of online reviews, asentiment dictionary is needed. Sentiment terms, according to the CNKIsentiment dictionary (http://www.keenage.com/html/c_bulletin_2007.htm), are identified to calculate the sentiment index discussed.
3.3. Sentiment index extraction
In this study, theNBmethod (Yu et al., 2013) is used for polarity clas-sificationwith the aimof obtaining a sentiment index for each online re-view. We suppose two categories of sentiment, each of which isrepresented by Ci with i∈{+,−}. That is, C+ and C− represent positivecategories and negative categories, respectively. The set of emotionalwords is represented by D∈Rη, where η is the number of emotionalwords. The set of emotional words in a review is represented by Dk∈R-ηk(k=1,⋯ ,n), where n is the number of reviews andmk is the numberof emotional words in the kth review. An emotional word appearing inDk is represented bywjk.
The probability thatDk is in category Ci, whichmeans that i∈{+,−},is calculated as follows:
argmaxci P CijDkð Þð Þ ¼ argmaxciP DkjCið Þ � P Cið Þ
P Dkð Þ� �
; ð1Þ
where P(Ci) is the probability of the ith category, which can be estimat-ed using the number of positive and negative categories in the trainingset, P(Dk)is the probability of that specific set of emotional words occur-ring, and P(Dk |Ci) is the probability that the terms in Dk appear in cate-gory Ci.
The probability P(Dk |Ci) is calculated as follows:
P DkjCið Þ ¼ P w1k;w2k; :::;wnkjCið Þ: ð2Þ
We assume that emotional words are independent of one another.Thus, Eq. (2) is simplified as follows:
P DkjCið Þ ¼ ∏jP wjkjCi� �
; ð3Þ
where P(wjk|Ci) is the number of wjk that appear in category Ci dividedby the total number of terms in category Ci. The probability P(wjk|Ci) iscalculated as:
P wjkjCi� � ¼ tij þ 1
∑w0
j∈Vti0 j þ K
; ð4Þ
where K is the number of terms in the sentiment dictionary, tij is thenumber of times wjk appears in the training set belonging to categoryCi, ti ' j is the number of times wj 'k appears in the training set belongingto category Ci.
Because the NB method determines the independent assumption oftermswhich is not true for most languages, it is less accurate thanmorecomplex models, such as support vector machine (SVM) and k-nearestneighbors (KNN). However, the NB method often works well to classifysentiment polarity (Cao, Thompson, & Yu, 2013; Yu et al., 2013). Usingthe NB sentiment classification algorithm, we are able to not only clas-sify the online reviews as positive or negative category but also calculatethe sentiment index of each review.
Here, we letWtk equal the value of P(Ci |Dk) and represent the senti-ment index of review k in time period t. The value of Wtk is calculatedusing the NBmethod. The sentiment index in time period t,Wt, is calcu-lated by
Wt ¼ ∑h
Wtk � cð Þ; ð5Þ
where h is the number of reviews in the time period and c is a constantwhose value is 1 or−1. The value of c depends on the category ofWtk. If
Wtk belongs to a positive category, c=1; otherwise, c=−1. By usingEqs. (1) to (5), we can calculate the sentiment index for every genera-tion product.
3.4. Forecasting model
In this study, the Bass model is extended to consider the sentimentindex of online reviews. The Bass model assumes that the potentialadopters can be divided into two categories, namely, innovators and im-itators, and that the general form of the Bass model is as follows:
S tð Þ ¼ m1−e− pþqð Þt
1þ qp� e− pþqð Þt
; ð6Þ
where S(t) is the cumulative sales by the end of time period t, p refers tothe coefficient of innovation, q refers to the coefficient of imitation, andm refers to the total number of potential adopters. The Bass model cal-culates the number of buyers or users, rather than the product sales,even though product sales can be estimated indirectly according tothe frequency of consumer utilization. In such a situation, when theproduct is a durable consumer good, the number of buyers or userscan be considered product sales.
In the existing research, studies often estimate the values of p, q, andmusing the data of product sales directly. However, in this study,we usethe data on product sales and online reviews to estimate parameters.
As discussed in section 3.2, q is related to the sentiment index andcan be perceived as a function of the online review sentiment indexq= f(Wt). Given an increase in the sentiment index, if a product has re-ceived more praise from consumers, these reviews will influence morepotential adopters to purchase the product. However, regarding a highsentiment index, the effect of the sentiment index on potential adoptersis relatively small. For example, when the increase in the sentimentindex is between 10,000 and 20,000, the increase in q is less significantthan when the increase in the sentiment index is between 100 and 200.Thus, the function q= f(Wt) forms an S-shaped curve. Based on the lo-gistic-S model (Verhulst, 1938), the function q= f(Wt) is an S-curve,as shown in Fig. 2. Based on Fig. 2, it is evident that q increases withthe increase in Wt, and the second derivative of q monotone decreasesasWt increases. Therefore, the function q= f(Wt) is described as
q ¼ qmq0
q0 þ qm−q0ð Þe−γWt; ð7Þ
where q denotes the effect of WOM via oral communications betweenpeople and online reviews, q0 refers to the minimum of q, qm refers tothe maximum of q, and γ is a constant that controls the steepness of
1 R2 ¼ ∑ni¼1 ðyi−yi Þ
2
∑ni¼1 ðyi−yi Þ
2 . where yi refers to the fit value in the ith time period, yi refers to the
actual value in the ith time period,yi refers to the average value in the ith time period, andn refers to the number of time periods.
2 RMSE ¼ffiffiffiffiffiffiffiffiffiffiffiffiffiffiffiffiffiffiffiffiffiffiffiffiffiffiffiffiffiffiffiffiffiffi1n∑
ni¼1 ðyi− _yiÞ2
q. Where _yi refers to the forecasting value in the ith time
periods.
Table 2Cumulative sales of three generations of cars.
Time period Elantra Elantra-l Elantra-y
2007-Q3 1 208,487 0 02007-Q4 2 245,239 0 02008-Q1 3 288,619 0 02008-Q2 4 316,105 37,248 02008-Q3 5 334,164 58,649 02008-Q4 6 362,999 85,974 02009-Q1 7 400,655 132,620 02009-Q2 8 449,096 200,698 02009-Q3 9 492,761 266,406 02009-Q4 10 534,604 325,423 02010-Q1 11 580,675 383,975 02010-Q2 12 616,982 443,234 02010-Q3 13 653,678 498,503 02010-Q4 14 687,345 558,777 02011-Q1 15 722,173 612,881 02011-Q2 16 750,802 659,367 02011-Q3 17 777,631 710,580 02011-Q4 18 800,713 749,772 02012-Q1 19 827,039 794,515 02012-Q2 20 845,582 847,288 02012-Q3 21 855,965 910,312 26,8562012-Q4 22 865,076 963,746 80,4602013-Q1 23 871,629 1,016,473 132,3412013-Q2 24 882,711 1,060,359 183,7002013-Q3 25 891,458 1,097,173 239,6312013-Q4 26 899,530 1,135,293 286,8082014-Q1 27 907,671 1,176,867 342,1902014-Q2 28 919,771 1,212,260 400,8932014-Q3 29 927,477 1,239,208 465,9472014-Q4 30 931,766 1,267,657 539,146
94 Z.-P. Fan et al. / Journal of Business Research 74 (2017) 90–100
the S-curve. This study refers to the extended Bass model as the Bass-emotion model.
There are many ways to extend the Bass model, such as consideringprice factors (Robinson & Lakhani, 1975), the Norton model (Norton &Bass, 1987), combining with the marketing variable (Bass, Krishnan, &Jain, 1994), and the contingent diffusion model (Peterson & Mahajan,1978). The Norton model is a typical model for multiple-generationproducts. The samemethod used for the Bass-emotionmodel can createthe Norton-emotion model. When three-generation products are con-sidered, the standard Norton model is
S1 tð Þ ¼ F1 tð Þm1 1−F2 t−τ2ð Þ½ � for tNτ2; ð8aÞ
S2 tð Þ ¼ F2 t−τ2ð Þ m2 þ F1 tð Þm1½ � 1−F3 t−τ3ð Þ½ � for tNτ2; ð8bÞ
S3 tð Þ ¼ F3 t−τ3ð Þ m3 þ F2 t−τ2ð Þ m2 þ F1 tð Þm1½ �½ � for tNτ3; ð8cÞ
where Si(t) refers to the cumulative sales of the ith generation by theend of timeperiod t,mi refers to potential adopters to the ith generation,τi refers to the timewhen the ith generation is introduced, Fi(t−τi)=0if tbτi, and Fi(t) refers to the ith generation's cumulative fraction ofadopters in time period t. Fi(t) is calculated as follows:
Fi tð Þ ¼ 1−e− piþqið Þt
1þ qipie− piþqið Þt
; ð9Þ
where pi refers to the ith generation's coefficient of innovation and qi isthe imitation coefficient for the ith generation.
In the Norton model, qi is also a function of the online review senti-ment index. The sentiment index in time period t for the ith-generationproduct is computed as follows:
Wit ¼ ∑h
Witk � cð Þ; ð10Þ
whereWitk represents the sentiment index of reviews k for the ith-gen-eration product in time period t, and h is the number of reviews.
The coefficient qi can be calculated as.
qi ¼ f Witð Þ ¼ qmi q0i
q0i þ qmi −q0i� �
e−γiWit; ð11Þ
where qi0 refers to theminimum of qi for the ith generation, qim refers tothemaximumof qi, andγi is a constant that controls the steepness of thecurve to the ith generation.
3.5. Validation method and performance measure
To verify the fit between the forecasting model and the actual data,specific criteria are used to evaluate performance (Marshall et al.,2013; Dellarocas et al., 2007). R21 and the root mean squared error(RMSE)2 are used to measure the fit precision. To verify the effective-ness of the forecasting model, we use the mean absolute percentageerror (MAPE) and percentage error (PE) to evaluate the performanceof the model:
MAPE ¼ 1n∑n
i¼1
yi− _yiyi
��������; ð12aÞ
PE ¼ _yi−yiyi
: ð12bÞ
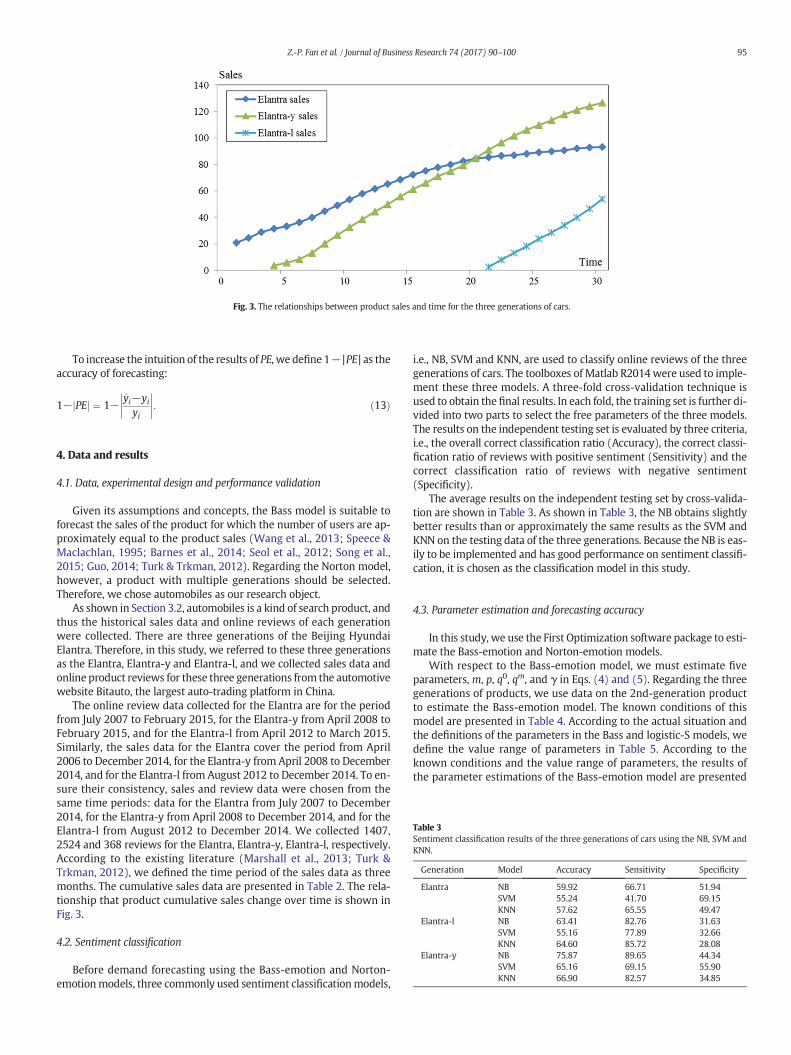
Fig. 3. The relationships between product sales and time for the three generations of cars.
Table 3Sentiment classification results of the three generations of cars using the NB, SVM andKNN.
Generation Model Accuracy Sensitivity Specificity
Elantra NB 59.92 66.71 51.94SVM 55.24 41.70 69.15KNN 57.62 65.55 49.47
Elantra-l NB 63.41 82.76 31.63SVM 55.16 77.89 32.66KNN 64.60 85.72 28.08
Elantra-y NB 75.87 89.65 44.34SVM 65.16 69.15 55.90KNN 66.90 82.57 34.85
95Z.-P. Fan et al. / Journal of Business Research 74 (2017) 90–100
To increase the intuition of the results of PE, we define 1− |PE| as theaccuracy of forecasting:
1− PEj j ¼ 1−_yi−yiyi
��������: ð13Þ
4. Data and results
4.1. Data, experimental design and performance validation
Given its assumptions and concepts, the Bass model is suitable toforecast the sales of the product for which the number of users are ap-proximately equal to the product sales (Wang et al., 2013; Speece &Maclachlan, 1995; Barnes et al., 2014; Seol et al., 2012; Song et al.,2015; Guo, 2014; Turk & Trkman, 2012). Regarding the Norton model,however, a product with multiple generations should be selected.Therefore, we chose automobiles as our research object.
As shown in Section 3.2, automobiles is a kind of search product, andthus the historical sales data and online reviews of each generationwere collected. There are three generations of the Beijing HyundaiElantra. Therefore, in this study, we referred to these three generationsas the Elantra, Elantra-y and Elantra-l, and we collected sales data andonline product reviews for these three generations from the automotivewebsite Bitauto, the largest auto-trading platform in China.
The online review data collected for the Elantra are for the periodfrom July 2007 to February 2015, for the Elantra-y from April 2008 toFebruary 2015, and for the Elantra-l from April 2012 to March 2015.Similarly, the sales data for the Elantra cover the period from April2006 to December 2014, for the Elantra-y from April 2008 to December2014, and for the Elantra-l from August 2012 to December 2014. To en-sure their consistency, sales and review data were chosen from thesame time periods: data for the Elantra from July 2007 to December2014, for the Elantra-y from April 2008 to December 2014, and for theElantra-l from August 2012 to December 2014. We collected 1407,2524 and 368 reviews for the Elantra, Elantra-y, Elantra-l, respectively.According to the existing literature (Marshall et al., 2013; Turk &Trkman, 2012), we defined the time period of the sales data as threemonths. The cumulative sales data are presented in Table 2. The rela-tionship that product cumulative sales change over time is shown inFig. 3.
4.2. Sentiment classification
Before demand forecasting using the Bass-emotion and Norton-emotionmodels, three commonly used sentiment classificationmodels,
i.e., NB, SVM and KNN, are used to classify online reviews of the threegenerations of cars. The toolboxes of Matlab R2014 were used to imple-ment these three models. A three-fold cross-validation technique isused to obtain the final results. In each fold, the training set is further di-vided into two parts to select the free parameters of the three models.The results on the independent testing set is evaluated by three criteria,i.e., the overall correct classification ratio (Accuracy), the correct classi-fication ratio of reviews with positive sentiment (Sensitivity) and thecorrect classification ratio of reviews with negative sentiment(Specificity).
The average results on the independent testing set by cross-valida-tion are shown in Table 3. As shown in Table 3, the NB obtains slightlybetter results than or approximately the same results as the SVM andKNN on the testing data of the three generations. Because the NB is eas-ily to be implemented and has good performance on sentiment classifi-cation, it is chosen as the classification model in this study.
4.3. Parameter estimation and forecasting accuracy
In this study, we use the First Optimization software package to esti-mate the Bass-emotion and Norton-emotion models.
With respect to the Bass-emotion model, we must estimate fiveparameters, m, p, q0, qm, and γ in Eqs. (4) and (5). Regarding the threegenerations of products, we use data on the 2nd-generation productto estimate the Bass-emotion model. The known conditions of thismodel are presented in Table 4. According to the actual situation andthe definitions of the parameters in the Bass and logistic-S models, wedefine the value range of parameters in Table 5. According to theknown conditions and the value range of parameters, the results ofthe parameter estimations of the Bass-emotion model are presented
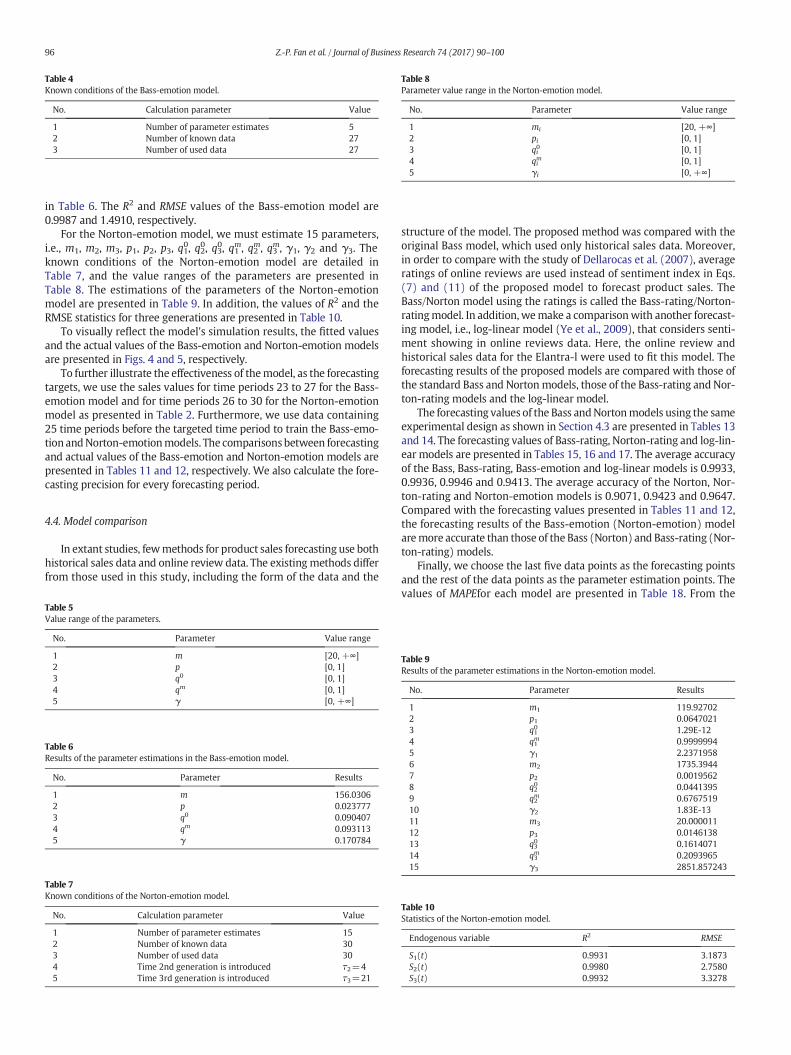
Table 8Parameter value range in the Norton-emotion model.
No. Parameter Value range
1 mi [20, +∞]2 pi [0, 1]3 qi
0 [0, 1]4 qi
m [0, 1]5 γi [0, +∞]
Table 4Known conditions of the Bass-emotion model.
No. Calculation parameter Value
1 Number of parameter estimates 52 Number of known data 273 Number of used data 27
96 Z.-P. Fan et al. / Journal of Business Research 74 (2017) 90–100
in Table 6. The R2 and RMSE values of the Bass-emotion model are0.9987 and 1.4910, respectively.
For the Norton-emotion model, we must estimate 15 parameters,i.e., m1, m2, m3, p1, p2, p3, q10, q20, q30, q1m, q2m, q3m, γ1, γ2 and γ3. Theknown conditions of the Norton-emotion model are detailed inTable 7, and the value ranges of the parameters are presented inTable 8. The estimations of the parameters of the Norton-emotionmodel are presented in Table 9. In addition, the values of R2 and theRMSE statistics for three generations are presented in Table 10.
To visually reflect the model's simulation results, the fitted valuesand the actual values of the Bass-emotion and Norton-emotion modelsare presented in Figs. 4 and 5, respectively.
To further illustrate the effectiveness of themodel, as the forecastingtargets, we use the sales values for time periods 23 to 27 for the Bass-emotion model and for time periods 26 to 30 for the Norton-emotionmodel as presented in Table 2. Furthermore, we use data containing25 time periods before the targeted time period to train the Bass-emo-tion andNorton-emotionmodels. The comparisons between forecastingand actual values of the Bass-emotion and Norton-emotion models arepresented in Tables 11 and 12, respectively. We also calculate the fore-casting precision for every forecasting period.
4.4. Model comparison
In extant studies, fewmethods for product sales forecasting use bothhistorical sales data and online review data. The existing methods differfrom those used in this study, including the form of the data and the
Table 5Value range of the parameters.
No. Parameter Value range
1 m [20, +∞]2 p [0, 1]3 q0 [0, 1]4 qm [0, 1]5 γ [0, +∞]
Table 6Results of the parameter estimations in the Bass-emotion model.
No. Parameter Results
1 m 156.03062 p 0.0237773 q0 0.0904074 qm 0.0931135 γ 0.170784
Table 7Known conditions of the Norton-emotion model.
No. Calculation parameter Value
1 Number of parameter estimates 152 Number of known data 303 Number of used data 304 Time 2nd generation is introduced τ2=45 Time 3rd generation is introduced τ3=21
structure of the model. The proposed method was compared with theoriginal Bass model, which used only historical sales data. Moreover,in order to compare with the study of Dellarocas et al. (2007), averageratings of online reviews are used instead of sentiment index in Eqs.(7) and (11) of the proposed model to forecast product sales. TheBass/Norton model using the ratings is called the Bass-rating/Norton-ratingmodel. In addition,wemake a comparisonwith another forecast-ing model, i.e., log-linear model (Ye et al., 2009), that considers senti-ment showing in online reviews data. Here, the online review andhistorical sales data for the Elantra-l were used to fit this model. Theforecasting results of the proposed models are compared with those ofthe standard Bass and Norton models, those of the Bass-rating and Nor-ton-rating models and the log-linear model.
The forecasting values of the Bass andNortonmodels using the sameexperimental design as shown in Section 4.3 are presented in Tables 13and 14. The forecasting values of Bass-rating, Norton-rating and log-lin-ear models are presented in Tables 15, 16 and 17. The average accuracyof the Bass, Bass-rating, Bass-emotion and log-linear models is 0.9933,0.9936, 0.9946 and 0.9413. The average accuracy of the Norton, Nor-ton-rating and Norton-emotion models is 0.9071, 0.9423 and 0.9647.Compared with the forecasting values presented in Tables 11 and 12,the forecasting results of the Bass-emotion (Norton-emotion) modelaremore accurate than those of the Bass (Norton) and Bass-rating (Nor-ton-rating) models.
Finally, we choose the last five data points as the forecasting pointsand the rest of the data points as the parameter estimation points. Thevalues of MAPEfor each model are presented in Table 18. From the
Table 9Results of the parameter estimations in the Norton-emotion model.
No. Parameter Results
1 m1 119.927022 p1 0.06470213 q1
0 1.29E-124 q1
m 0.99999945 γ1 2.23719586 m2 1735.39447 p2 0.00195628 q2
0 0.04413959 q2
m 0.676751910 γ2 1.83E-1311 m3 20.00001112 p3 0.014613813 q3
0 0.161407114 q3
m 0.209396515 γ3 2851.857243
Table 10Statistics of the Norton-emotion model.
Endogenous variable R2 RMSE
S1(t) 0.9931 3.1873S2(t) 0.9980 2.7580S3(t) 0.9932 3.3278
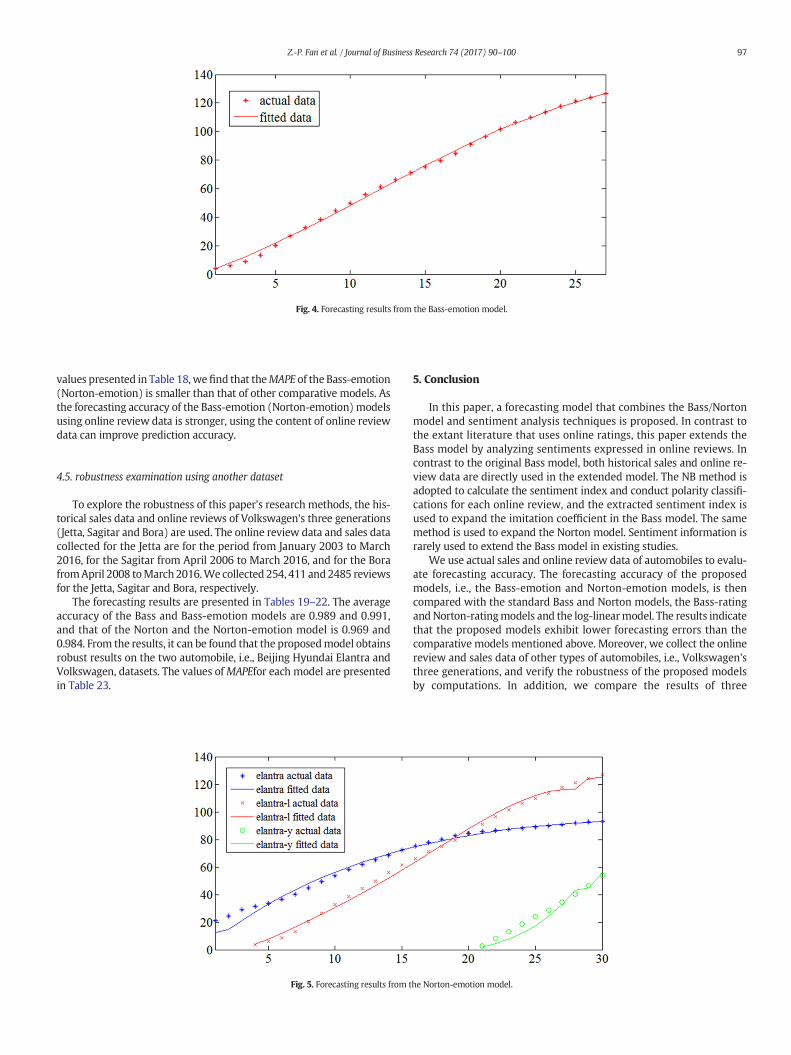
Fig. 4. Forecasting results from the Bass-emotion model.
97Z.-P. Fan et al. / Journal of Business Research 74 (2017) 90–100
values presented in Table 18, we find that theMAPE of the Bass-emotion(Norton-emotion) is smaller than that of other comparative models. Asthe forecasting accuracy of the Bass-emotion (Norton-emotion) modelsusing online review data is stronger, using the content of online reviewdata can improve prediction accuracy.
4.5. robustness examination using another dataset
To explore the robustness of this paper's research methods, the his-torical sales data and online reviews of Volkswagen's three generations(Jetta, Sagitar and Bora) are used. The online review data and sales datacollected for the Jetta are for the period from January 2003 to March2016, for the Sagitar from April 2006 to March 2016, and for the BorafromApril 2008 toMarch2016.We collected 254, 411 and2485 reviewsfor the Jetta, Sagitar and Bora, respectively.
The forecasting results are presented in Tables 19–22. The averageaccuracy of the Bass and Bass-emotion models are 0.989 and 0.991,and that of the Norton and the Norton-emotion model is 0.969 and0.984. From the results, it can be found that the proposedmodel obtainsrobust results on the two automobile, i.e., Beijing Hyundai Elantra andVolkswagen, datasets. The values ofMAPEfor each model are presentedin Table 23.
Fig. 5. Forecasting results from t
5. Conclusion
In this paper, a forecasting model that combines the Bass/Nortonmodel and sentiment analysis techniques is proposed. In contrast tothe extant literature that uses online ratings, this paper extends theBass model by analyzing sentiments expressed in online reviews. Incontrast to the original Bass model, both historical sales and online re-view data are directly used in the extended model. The NB method isadopted to calculate the sentiment index and conduct polarity classifi-cations for each online review, and the extracted sentiment index isused to expand the imitation coefficient in the Bass model. The samemethod is used to expand the Norton model. Sentiment information israrely used to extend the Bass model in existing studies.
We use actual sales and online review data of automobiles to evalu-ate forecasting accuracy. The forecasting accuracy of the proposedmodels, i.e., the Bass-emotion and Norton-emotion models, is thencompared with the standard Bass and Norton models, the Bass-ratingandNorton-ratingmodels and the log-linearmodel. The results indicatethat the proposed models exhibit lower forecasting errors than thecomparative models mentioned above. Moreover, we collect the onlinereview and sales data of other types of automobiles, i.e., Volkswagen'sthree generations, and verify the robustness of the proposed modelsby computations. In addition, we compare the results of three
he Norton-emotion model.
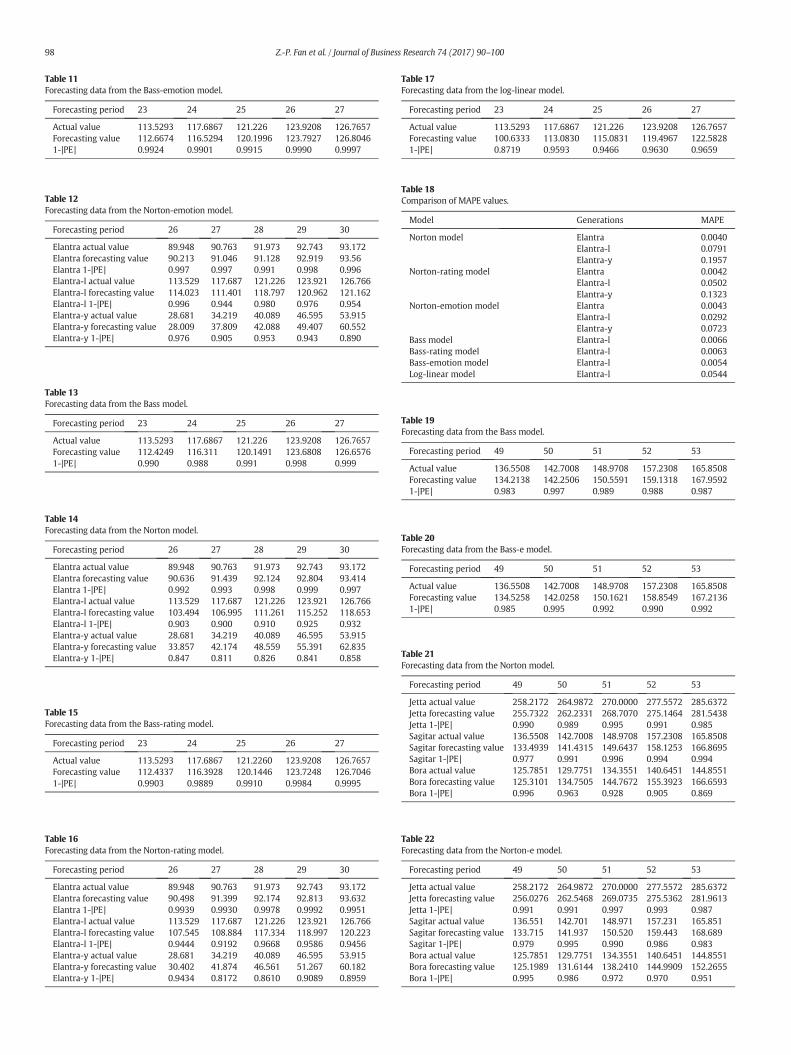
Table 12Forecasting data from the Norton-emotion model.
Forecasting period 26 27 28 29 30
Elantra actual value 89.948 90.763 91.973 92.743 93.172Elantra forecasting value 90.213 91.046 91.128 92.919 93.56Elantra 1-|PE| 0.997 0.997 0.991 0.998 0.996Elantra-l actual value 113.529 117.687 121.226 123.921 126.766Elantra-l forecasting value 114.023 111.401 118.797 120.962 121.162Elantra-l 1-|PE| 0.996 0.944 0.980 0.976 0.954Elantra-y actual value 28.681 34.219 40.089 46.595 53.915Elantra-y forecasting value 28.009 37.809 42.088 49.407 60.552Elantra-y 1-|PE| 0.976 0.905 0.953 0.943 0.890
Table 13Forecasting data from the Bass model.
Forecasting period 23 24 25 26 27
Actual value 113.5293 117.6867 121.226 123.9208 126.7657Forecasting value 112.4249 116.311 120.1491 123.6808 126.65761-|PE| 0.990 0.988 0.991 0.998 0.999
Table 14Forecasting data from the Norton model.
Forecasting period 26 27 28 29 30
Elantra actual value 89.948 90.763 91.973 92.743 93.172Elantra forecasting value 90.636 91.439 92.124 92.804 93.414Elantra 1-|PE| 0.992 0.993 0.998 0.999 0.997Elantra-l actual value 113.529 117.687 121.226 123.921 126.766Elantra-l forecasting value 103.494 106.995 111.261 115.252 118.653Elantra-l 1-|PE| 0.903 0.900 0.910 0.925 0.932Elantra-y actual value 28.681 34.219 40.089 46.595 53.915Elantra-y forecasting value 33.857 42.174 48.559 55.391 62.835Elantra-y 1-|PE| 0.847 0.811 0.826 0.841 0.858
Table 15Forecasting data from the Bass-rating model.
Forecasting period 23 24 25 26 27
Actual value 113.5293 117.6867 121.2260 123.9208 126.7657Forecasting value 112.4337 116.3928 120.1446 123.7248 126.70461-|PE| 0.9903 0.9889 0.9910 0.9984 0.9995
Table 16Forecasting data from the Norton-rating model.
Forecasting period 26 27 28 29 30
Elantra actual value 89.948 90.763 91.973 92.743 93.172Elantra forecasting value 90.498 91.399 92.174 92.813 93.632Elantra 1-|PE| 0.9939 0.9930 0.9978 0.9992 0.9951Elantra-l actual value 113.529 117.687 121.226 123.921 126.766Elantra-l forecasting value 107.545 108.884 117.334 118.997 120.223Elantra-l 1-|PE| 0.9444 0.9192 0.9668 0.9586 0.9456Elantra-y actual value 28.681 34.219 40.089 46.595 53.915Elantra-y forecasting value 30.402 41.874 46.561 51.267 60.182Elantra-y 1-|PE| 0.9434 0.8172 0.8610 0.9089 0.8959
Table 17Forecasting data from the log-linear model.
Forecasting period 23 24 25 26 27
Actual value 113.5293 117.6867 121.226 123.9208 126.7657Forecasting value 100.6333 113.0830 115.0831 119.4967 122.58281-|PE| 0.8719 0.9593 0.9466 0.9630 0.9659
Table 18Comparison of MAPE values.
Model Generations MAPE
Norton model Elantra 0.0040Elantra-l 0.0791Elantra-y 0.1957
Norton-rating model Elantra 0.0042Elantra-l 0.0502Elantra-y 0.1323
Norton-emotion model Elantra 0.0043Elantra-l 0.0292Elantra-y 0.0723
Bass model Elantra-l 0.0066Bass-rating model Elantra-l 0.0063Bass-emotion model Elantra-l 0.0054Log-linear model Elantra-l 0.0544
Table 19Forecasting data from the Bass model.
Forecasting period 49 50 51 52 53
Actual value 136.5508 142.7008 148.9708 157.2308 165.8508Forecasting value 134.2138 142.2506 150.5591 159.1318 167.95921-|PE| 0.983 0.997 0.989 0.988 0.987
Table 20Forecasting data from the Bass-e model.
Forecasting period 49 50 51 52 53
Actual value 136.5508 142.7008 148.9708 157.2308 165.8508Forecasting value 134.5258 142.0258 150.1621 158.8549 167.21361-|PE| 0.985 0.995 0.992 0.990 0.992
Table 21Forecasting data from the Norton model.
Forecasting period 49 50 51 52 53
Jetta actual value 258.2172 264.9872 270.0000 277.5572 285.6372Jetta forecasting value 255.7322 262.2331 268.7070 275.1464 281.5438Jetta 1-|PE| 0.990 0.989 0.995 0.991 0.985Sagitar actual value 136.5508 142.7008 148.9708 157.2308 165.8508Sagitar forecasting value 133.4939 141.4315 149.6437 158.1253 166.8695Sagitar 1-|PE| 0.977 0.991 0.996 0.994 0.994Bora actual value 125.7851 129.7751 134.3551 140.6451 144.8551Bora forecasting value 125.3101 134.7505 144.7672 155.3923 166.6593Bora 1-|PE| 0.996 0.963 0.928 0.905 0.869
Table 22Forecasting data from the Norton-e model.
Forecasting period 49 50 51 52 53
Jetta actual value 258.2172 264.9872 270.0000 277.5572 285.6372Jetta forecasting value 256.0276 262.5468 269.0735 275.5362 281.9613Jetta 1-|PE| 0.991 0.991 0.997 0.993 0.987Sagitar actual value 136.551 142.701 148.971 157.231 165.851Sagitar forecasting value 133.715 141.937 150.520 159.443 168.689Sagitar 1-|PE| 0.979 0.995 0.990 0.986 0.983Bora actual value 125.7851 129.7751 134.3551 140.6451 144.8551Bora forecasting value 125.1989 131.6144 138.2410 144.9909 152.2655Bora 1-|PE| 0.995 0.986 0.972 0.970 0.951
Table 11Forecasting data from the Bass-emotion model.
Forecasting period 23 24 25 26 27
Actual value 113.5293 117.6867 121.226 123.9208 126.7657Forecasting value 112.6674 116.5294 120.1996 123.7927 126.80461-|PE| 0.9924 0.9901 0.9915 0.9990 0.9997
98 Z.-P. Fan et al. / Journal of Business Research 74 (2017) 90–100
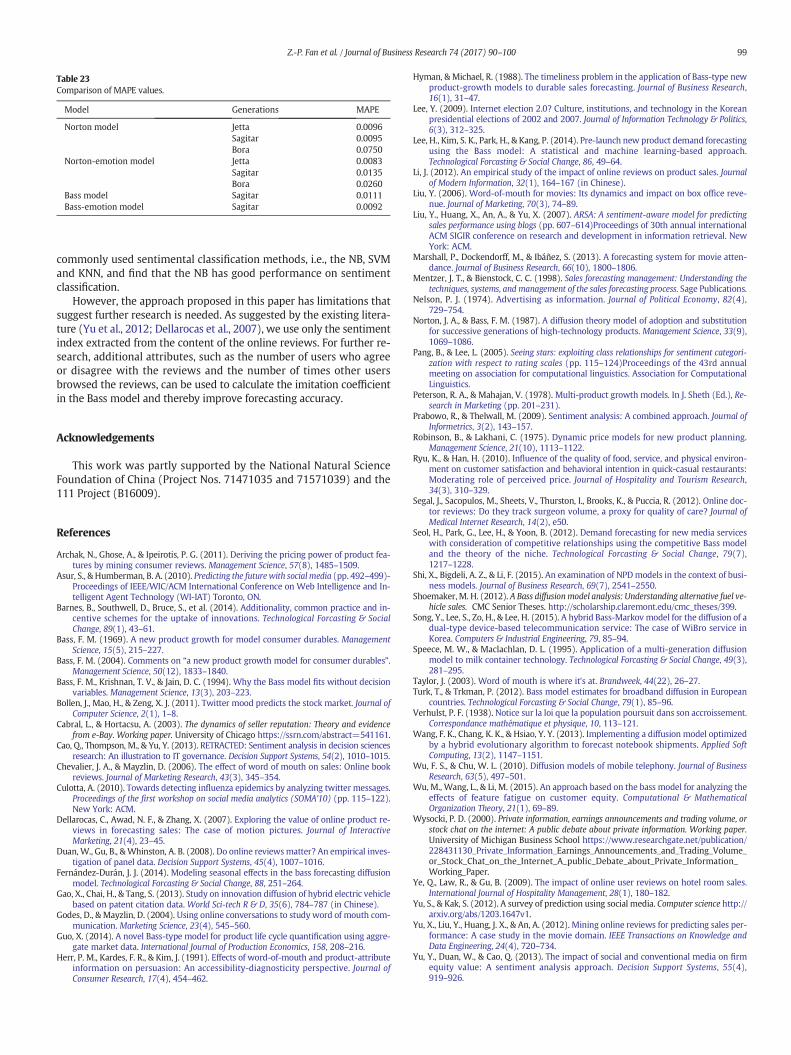
Table 23Comparison of MAPE values.
Model Generations MAPE
Norton model Jetta 0.0096Sagitar 0.0095Bora 0.0750
Norton-emotion model Jetta 0.0083Sagitar 0.0135Bora 0.0260
Bass model Sagitar 0.0111Bass-emotion model Sagitar 0.0092
99Z.-P. Fan et al. / Journal of Business Research 74 (2017) 90–100
commonly used sentimental classification methods, i.e., the NB, SVMand KNN, and find that the NB has good performance on sentimentclassification.
However, the approach proposed in this paper has limitations thatsuggest further research is needed. As suggested by the existing litera-ture (Yu et al., 2012; Dellarocas et al., 2007), we use only the sentimentindex extracted from the content of the online reviews. For further re-search, additional attributes, such as the number of users who agreeor disagree with the reviews and the number of times other usersbrowsed the reviews, can be used to calculate the imitation coefficientin the Bass model and thereby improve forecasting accuracy.
Acknowledgements
This work was partly supported by the National Natural ScienceFoundation of China (Project Nos. 71471035 and 71571039) and the111 Project (B16009).
References
Archak, N., Ghose, A., & Ipeirotis, P. G. (2011). Deriving the pricing power of product fea-tures by mining consumer reviews. Management Science, 57(8), 1485–1509.
Asur, S., & Humberman, B. A. (2010). Predicting the future with social media (pp. 492–499)-Proceedings of IEEE/WIC/ACM International Conference on Web Intelligence and In-telligent Agent Technology (WI-IAT) Toronto, ON.
Barnes, B., Southwell, D., Bruce, S., et al. (2014). Additionality, common practice and in-centive schemes for the uptake of innovations. Technological Forcasting & SocialChange, 89(1), 43–61.
Bass, F. M. (1969). A new product growth for model consumer durables. ManagementScience, 15(5), 215–227.
Bass, F. M. (2004). Comments on “a new product growth model for consumer durables”.Management Science, 50(12), 1833–1840.
Bass, F. M., Krishnan, T. V., & Jain, D. C. (1994). Why the Bass model fits without decisionvariables. Management Science, 13(3), 203–223.
Bollen, J., Mao, H., & Zeng, X. J. (2011). Twitter mood predicts the stock market. Journal ofComputer Science, 2(1), 1–8.
Cabral, L., & Hortacsu, A. (2003). The dynamics of seller reputation: Theory and evidencefrom e-Bay. Working paper. University of Chicago https://ssrn.com/abstract=541161.
Cao, Q., Thompson, M., & Yu, Y. (2013). RETRACTED: Sentiment analysis in decision sciencesresearch: An illustration to IT governance. Decision Support Systems, 54(2), 1010–1015.
Chevalier, J. A., & Mayzlin, D. (2006). The effect of word of mouth on sales: Online bookreviews. Journal of Marketing Research, 43(3), 345–354.
Culotta, A. (2010). Towards detecting influenza epidemics by analyzing twitter messages.Proceedings of the first workshop on social media analytics (SOMA'10) (pp. 115–122).New York: ACM.
Dellarocas, C., Awad, N. F., & Zhang, X. (2007). Exploring the value of online product re-views in forecasting sales: The case of motion pictures. Journal of InteractiveMarketing, 21(4), 23–45.
Duan, W., Gu, B., &Whinston, A. B. (2008). Do online reviewsmatter? An empirical inves-tigation of panel data. Decision Support Systems, 45(4), 1007–1016.
Fernández-Durán, J. J. (2014). Modeling seasonal effects in the bass forecasting diffusionmodel. Technological Forcasting & Social Change, 88, 251–264.
Gao, X., Chai, H., & Tang, S. (2013). Study on innovation diffusion of hybrid electric vehiclebased on patent citation data. World Sci-tech R & D, 35(6), 784–787 (in Chinese).
Godes, D., & Mayzlin, D. (2004). Using online conversations to studyword of mouth com-munication. Marketing Science, 23(4), 545–560.
Guo, X. (2014). A novel Bass-type model for product life cycle quantification using aggre-gate market data. International Journal of Production Economics, 158, 208–216.
Herr, P. M., Kardes, F. R., & Kim, J. (1991). Effects of word-of-mouth and product-attributeinformation on persuasion: An accessibility-diagnosticity perspective. Journal ofConsumer Research, 17(4), 454–462.
Hyman, & Michael, R. (1988). The timeliness problem in the application of Bass-type newproduct-growth models to durable sales forecasting. Journal of Business Research,16(1), 31–47.
Lee, Y. (2009). Internet election 2.0? Culture, institutions, and technology in the Koreanpresidential elections of 2002 and 2007. Journal of Information Technology & Politics,6(3), 312–325.
Lee, H., Kim, S. K., Park, H., & Kang, P. (2014). Pre-launch new product demand forecastingusing the Bass model: A statistical and machine learning-based approach.Technological Forcasting & Social Change, 86, 49–64.
Li, J. (2012). An empirical study of the impact of online reviews on product sales. Journalof Modern Information, 32(1), 164–167 (in Chinese).
Liu, Y. (2006). Word-of-mouth for movies: Its dynamics and impact on box office reve-nue. Journal of Marketing, 70(3), 74–89.
Liu, Y., Huang, X., An, A., & Yu, X. (2007). ARSA: A sentiment-aware model for predictingsales performance using blogs (pp. 607–614)Proceedings of 30th annual internationalACM SIGIR conference on research and development in information retrieval. NewYork: ACM.
Marshall, P., Dockendorff, M., & Ibáñez, S. (2013). A forecasting system for movie atten-dance. Journal of Business Research, 66(10), 1800–1806.
Mentzer, J. T., & Bienstock, C. C. (1998). Sales forecasting management: Understanding thetechniques, systems, and management of the sales forecasting process. Sage Publications.
Nelson, P. J. (1974). Advertising as information. Journal of Political Economy, 82(4),729–754.
Norton, J. A., & Bass, F. M. (1987). A diffusion theory model of adoption and substitutionfor successive generations of high-technology products. Management Science, 33(9),1069–1086.
Pang, B., & Lee, L. (2005). Seeing stars: exploiting class relationships for sentiment categori-zation with respect to rating scales (pp. 115–124)Proceedings of the 43rd annualmeeting on association for computational linguistics. Association for ComputationalLinguistics.
Peterson, R. A., & Mahajan, V. (1978). Multi-product growth models. In J. Sheth (Ed.), Re-search in Marketing (pp. 201–231).
Prabowo, R., & Thelwall, M. (2009). Sentiment analysis: A combined approach. Journal ofInformetrics, 3(2), 143–157.
Robinson, B., & Lakhani, C. (1975). Dynamic price models for new product planning.Management Science, 21(10), 1113–1122.
Ryu, K., & Han, H. (2010). Influence of the quality of food, service, and physical environ-ment on customer satisfaction and behavioral intention in quick-casual restaurants:Moderating role of perceived price. Journal of Hospitality and Tourism Research,34(3), 310–329.
Segal, J., Sacopulos, M., Sheets, V., Thurston, I., Brooks, K., & Puccia, R. (2012). Online doc-tor reviews: Do they track surgeon volume, a proxy for quality of care? Journal ofMedical Internet Research, 14(2), e50.
Seol, H., Park, G., Lee, H., & Yoon, B. (2012). Demand forecasting for new media serviceswith consideration of competitive relationships using the competitive Bass modeland the theory of the niche. Technological Forcasting & Social Change, 79(7),1217–1228.
Shi, X., Bigdeli, A. Z., & Li, F. (2015). An examination of NPDmodels in the context of busi-ness models. Journal of Business Research, 69(7), 2541–2550.
Shoemaker,M. H. (2012). A Bass diffusionmodel analysis: Understanding alternative fuel ve-hicle sales. CMC Senior Theses. http://scholarship.claremont.edu/cmc_theses/399.
Song, Y., Lee, S., Zo, H., & Lee, H. (2015). A hybrid Bass-Markov model for the diffusion of adual-type device-based telecommunication service: The case of WiBro service inKorea. Computers & Industrial Engineering, 79, 85–94.
Speece, M. W., & Maclachlan, D. L. (1995). Application of a multi-generation diffusionmodel to milk container technology. Technological Forcasting & Social Change, 49(3),281–295.
Taylor, J. (2003). Word of mouth is where it's at. Brandweek, 44(22), 26–27.Turk, T., & Trkman, P. (2012). Bass model estimates for broadband diffusion in European
countries. Technological Forcasting & Social Change, 79(1), 85–96.Verhulst, P. F. (1938). Notice sur la loi que la population poursuit dans son accroissement.
Correspondance mathématique et physique, 10, 113–121.Wang, F. K., Chang, K. K., & Hsiao, Y. Y. (2013). Implementing a diffusion model optimized
by a hybrid evolutionary algorithm to forecast notebook shipments. Applied SoftComputing, 13(2), 1147–1151.
Wu, F. S., & Chu, W. L. (2010). Diffusion models of mobile telephony. Journal of BusinessResearch, 63(5), 497–501.
Wu, M., Wang, L., & Li, M. (2015). An approach based on the bass model for analyzing theeffects of feature fatigue on customer equity. Computational & MathematicalOrganization Theory, 21(1), 69–89.
Wysocki, P. D. (2000). Private information, earnings announcements and trading volume, orstock chat on the internet: A public debate about private information. Working paper.University of Michigan Business School https://www.researchgate.net/publication/228431130_Private_Information_Earnings_Announcements_and_Trading_Volume_or_Stock_Chat_on_the_Internet_A_public_Debate_about_Private_Information_Working_Paper.
Ye, Q., Law, R., & Gu, B. (2009). The impact of online user reviews on hotel room sales.International Journal of Hospitality Management, 28(1), 180–182.
Yu, S., & Kak, S. (2012). A survey of prediction using social media. Computer science http://arxiv.org/abs/1203.1647v1.
Yu, X., Liu, Y., Huang, J. X., & An, A. (2012). Mining online reviews for predicting sales per-formance: A case study in the movie domain. IEEE Transactions on Knowledge andData Engineering, 24(4), 720–734.
Yu, Y., Duan, W., & Cao, Q. (2013). The impact of social and conventional media on firmequity value: A sentiment analysis approach. Decision Support Systems, 55(4),919–926.

100 Z.-P. Fan et al. / Journal of Business
Zhu, Y., Jiang, Z. B., & Chen, L. (2008). Analysis on 3M new product diffusion and regres-sion based on Bass model. Logistics Technology, 27(11), 77–79.
Zhi-Ping Fan received the Ph.D. degree in control theory and applications fromNortheastern University (NEU), Shenyang, China, in 1996. He is currently a Professor inthe Department of Information Management and Decision Sciences, School of BusinessAdministration, NEU. He was Research Fellow at City University of Hong Kong, Kowloon,Hong Kong, in 2001, 2003, 2004 and 2005, respectively. He is the author or coauthor ofover 80 refereed articles published in international journals including the IEEE Transac-tions on Systems, Men and Cybernetics, the IEEE Transactions on Engineering Manage-ment, the Information Sciences, and the European Journal of Operational Research. Hiscurrent research interests include decision analysis and operations research.
Yu-Jie Che is a M.Sc. candidate from the Northeastern University, China. His researchinterests include text mining, demand and technological forecasting.
Zhen-Yu Chen received the Ph.D. degree from the University of Chinese Academy ofSciences in 2008. He is an associate professor in the Department of Information Manage-ment and Decision Sciences, School of Business Administration, Northeastern University,Shenyang, China. His research interests include data mining, electronic commerce andcustomer relationship management. He has coauthored some journal publicationsincluding the European Journal of Operational Research, the Knowledge and InformationSystems, the Knowledge-based Systems, the Expert Systems with Applications, the Infor-mation Sciences, etc.
Research 74 (2017) 90–100