C.R. Kitchin-Astrophysical Tecnhniques-Istitute of Physics Pub (2003)

Procedia Economics and Finance 36 ( 2016 ) 189 – 200
Available online at www.sciencedirect.com
2212-5671 © 2016 The Authors. Published by Elsevier B.V. This is an open access article under the CC BY-NC-ND license (http://creativecommons.org/licenses/by-nc-nd/4.0/).Peer-review under responsibility of SCIJOUR-Scientific Journals Publisherdoi: 10.1016/S2212-5671(16)30030-2
ScienceDirect
1st International Conference on Applied Economics and Business, ICAEB 2015
An Examination of the Impact of Cultural Values on Brand Preferences in Tehran’s Fashion Market
Fahimeh Cheginia,*, Saeed Baghayi Molanb, Somaye Sanei Kashanifarc aDepartment of Management,Faculty of administrative & Economics,University of Isfahan,Isfahan,Iran
bDepartment of Management,Sience & Technology,Amirkabir University of Technology,Tahran,Iran cDepartment of Management,Khatam Istitute,Tehran,Iran
Abstract
Consumers’ brand preferences and loyalty is what has obsessed minds of consumer behavior analysts for many years. There are, definitely, many factors influencing this process but undoubtedly, culture is the most effective factor on a consumer’s behavior which is presented in the values and norms a society emphasizes. Culture affects consumer’s buying behavior due to its emergence in the values they focus. Since values are long lasting, efforts to change them are useless. So, marketers almost always try to swim along the waves of culture rather than against them. Every culture consists of a series of values which are transferred to its members. One of the most common views in brand preferences studies is the self-congruity theory, according to which a consumer’s behavior is to a great extent defined by comparing one’s self image with the brand personality of a product. This theory plays an important role in marketing as it is mentioned that consumers are mainly influenced by their self-image, especially when making fashion buying decisions. This paper focuses on how much brand preferences are identified by cultural values of consumers and to what extent each construct of values can explain brand preferences in Iranian context. Brand preference in this research is measured using a brand personality scale. Values are also measured using list of values (LOV). Hence, a sample of 313 consumers of Adidas, Nike and Holiday sports clothes was selected in Tehran. Structural equation modeling technique and one-way ANOVA were utilized for data analysis. © 2015 The Authors. Published by Elsevier B.V. Peer-review under responsibility of SCIJOUR-Scientific Journals Publisher.
Keywords: consumer behavior; cultural values; brand preferences; self-congruity theory; brand personality
* Corresponding author. Tel.: +98 912 580 2006
E-mail address: [email protected]
© 2016 The Authors. Published by Elsevier B.V. This is an open access article under the CC BY-NC-ND license (http://creativecommons.org/licenses/by-nc-nd/4.0/).Peer-review under responsibility of SCIJOUR-Scientific Journals Publisher

190 Fahimeh Chegini et al. / Procedia Economics and Finance 36 ( 2016 ) 189 – 200
1. Introduction
With international marketing growing, firms should decide whether to opt a global marketing strategy or a local one? Global strategy is based on a belief that needs of consumption and ways to respond to them remain the same in different markets around the globe, therefore, it is not necessary to change the marketing mix for and with regard to every country’s specifications. Local strategy is, on the other hand, based on a fact that there should be different marketing plans according to each country’s needs, values, habits and buying power (Roosta,2007). With the emergence of global market segments, marketing and branding managers in firms with markets of multiple cultures and countries have to face the challenge of common consumption-related behavior with logos and brands of special meanings to them, if they seek to serve these markets effectively (Gammoh et al.,2011).
To guide managers who seek an effective way to improve their brand equity in the competitive global market, Alden et al.(1999) has depicted a new brand positioning strategy called “global consumer culture positioning” (GCCP), versus two other strategies: foreign consumer culture positioning (FCCP) and local consumer culture positioning ( LCCP) (Gammoh et al.,2011). In his paper, Gammoh et al.(2011) proposes GCCP strategy as the one with the most acceptance and appeal for consumers. Hence, the effect of culture on brand positioning in global markets scale is one of the most important issues for marketing managers. Commercial firms use standardized brand image strategies rather than local brand image strategies with no strong evidence; especially, when implementing a series of international advertising activities, they ignore cultural values in local markets. Brand images in international markets should reflect the differences in cultural values which represents different needs of consumers among various nations. Rajagopal in his paper (2009) reports some factors to be of most importance for powerful brand strategic positioning, one of which is cultural values. He also states that brand personality traits can contribute to consumers’ brand preferences and can be longer lasting than functional attributes due to the symbolic meaning and the emotional tie they create. Many scholars have also tested the influence of cultural values on brand awareness and come to a conclusion that values have significant effect (Foscht et al., 2008; Buil et al.,2009; Mulyanegara and Tsarenko, 2009; Park and Rabolt, 2009; Rajagopal, 2009; Gammoh et al.,2011; Sung et al.,2011; Paasovaara et al.,2012).
2. Literature Review
2.1. Brand preferences
Research into brand preferences has gained the interest of many marketing scholars since 1970s when they began to examine attributes of brand preferences over a range of products. One of the most popular concepts in brand preferences is the theory of self-congruity. According to this theory a consumer’s behavior is partially identified by a comparison of an individual’s self image with a product’s brand image (Mulyanegara and Tsarenko, 2009).
Whether marketers like it or not, brands gain a personality and reputation among consumers which will influence their buying decisions. This is why marketing and brand managers should plan for their brands’ personality (Hawkins et al., 2004). Brand personality is defined as “the set of human characteristics associated with a brand.” Researchers, in consumer behavior studies, have done some research into how a brand personality enables consumers to express their own self, ideal self or specific dimensions of self through a brand (Aaker, 1997).
Foscht et al.(2008) in a six-nation research of brand perception of the same brand concludes that the same brand is perceived differently in various cultures. He then questions this and states that if a firm chooses to be more market-oriented, in order to make the brand more relevant to that market’s self-concept, should emphasize the brand characteristic that is desirable in that market, though may not desirable in other countries.
2.2. Brand Personality
Brand personality, in marketing literature, was first mentioned in the early 1950s, when Gardner and Levy (1955) proposed that brands own traits which are conceived by consumers in complex ways. This continued to interest others (Levy, 1959; Landon, 1974; Crask and Lasky, 1990) who concluded that brand personality can (Mulyanegara and Tsarenko, 2009):
191 Fahimeh Chegini et al. / Procedia Economics and Finance 36 ( 2016 ) 189 – 200
Improve the attraction of a consumer to a specific brand through personality investment. Help marketers to establish those characteristics which are perceived emotionally. Assist marketers to develop exclusive positioning strategies through brand differentiation.
Sheena and G. Naresh in their research named “Do brand personalities make a difference to consumers?” used a brand personality scale to conclude that marketers should focus on strengthening their strategies by emphasizing on the significant personality traits of their brands(2012).
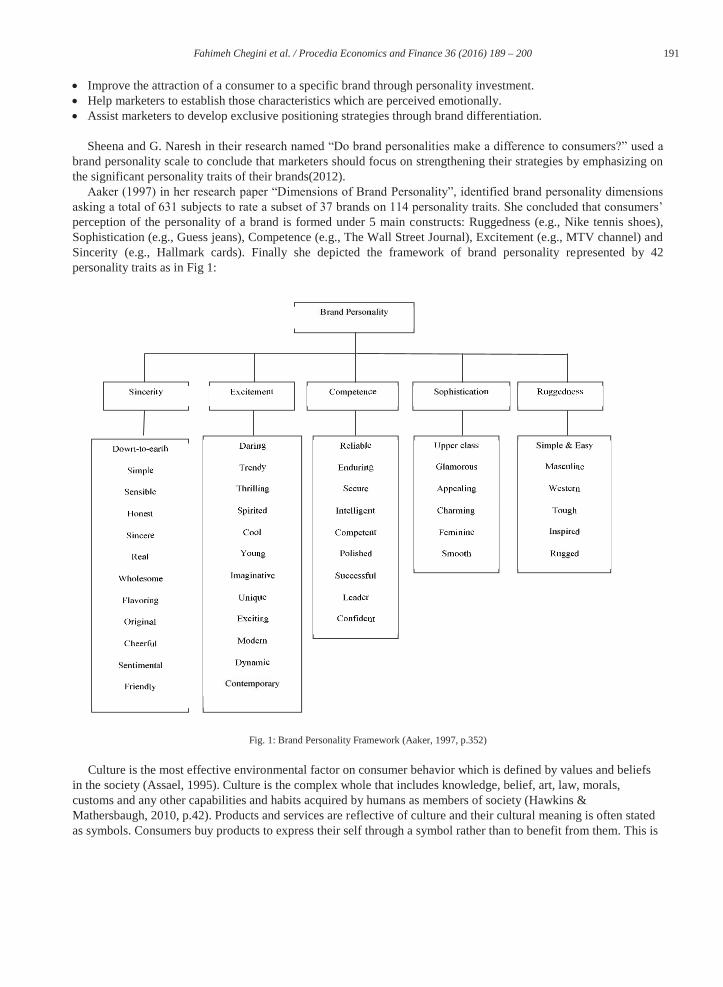
Aaker (1997) in her research paper “Dimensions of Brand Personality”, identified brand personality dimensions asking a total of 631 subjects to rate a subset of 37 brands on 114 personality traits. She concluded that consumers’ perception of the personality of a brand is formed under 5 main constructs: Ruggedness (e.g., Nike tennis shoes), Sophistication (e.g., Guess jeans), Competence (e.g., The Wall Street Journal), Excitement (e.g., MTV channel) and Sincerity (e.g., Hallmark cards). Finally she depicted the framework of brand personality represented by 42 personality traits as in Fig 1:
Fig. 1: Brand Personality Framework (Aaker, 1997, p.352)
Culture is the most effective environmental factor on consumer behavior which is defined by values and beliefs in the society (Assael, 1995). Culture is the complex whole that includes knowledge, belief, art, law, morals, customs and any other capabilities and habits acquired by humans as members of society (Hawkins & Mathersbaugh, 2010, p.42). Products and services are reflective of culture and their cultural meaning is often stated as symbols. Consumers buy products to express their self through a symbol rather than to benefit from them. This is

192 Fahimeh Chegini et al. / Procedia Economics and Finance 36 ( 2016 ) 189 – 200
why marketers attempt to establish symbols which introduce products with positive cultural values (Assael, 1995). Culture influences buying behavior as consumers show it in the values they learn from the society. Values such as individuality, independence, success and self fulfillment (Assael, 1995), so marketers always try to swim along the cultural waves rather than against them (Assael, 1995, p.452). Cultural values are “enduring beliefs that a specific mode of conduct or end-state of existence is personally or socially preferable to an opposite or converse mode of conduct or endstate” (Rokeach, 1973, p. 5). Assael (1995) mentions the characteristics of cultural values as below: 1) Cultural values of other societies are learned by three ways: formal learning, informal learning and technical learning. 2) Cultural values direct an individual’s behavior through establishing cultural norms. 3) Cultural values are permanent as well as being dynamic. 4) Cultural values are mainstream, common values which distinguish one culture from the other.
Values are beyond objects and situations. They are related to behavioral states (instrumental values) and end-state existence (Terminal values). Each group of values influences consumers’ choice criteria in some ways (product choice and brand choice). Choice criteria also influence formation of a consumer’s attitudes toward the product and the brand (Loudon and Della bita, 1993). Based on a model of Loudon et al., the criteria of choosing a product model are the prominent attributes of a product whereas the brand choice criteria are the prominent attributes of a brand. These findings are helpful for brand positioning so that advertisements can transfer a brand’s superiority to potential buyers. Gutman (1982), Rokeach(1968) and Rosenberg(1956), in their theories, also consider product attributes, which provide consumption goals, a connector between culture and consumer behavior and supplier of terminal values, or in other words cultural values(Assael,1995).
Various approaches have been used to measure consumers’ values in marketing research one of which is the approach introduced by Kahle(1983) with the aim of removing shortcomings of Rokeach’s list of values which turned out to be a more common tool to evaluate values in nonphsycologic studies as it is easier to reply and manage(Mehmetoglu et al.,2010). It includes 9 terminal values which have been proposed using 18 terminal values in Rokeach’s list and Maslow’s hierarchy of needs and many other researches ,e.g., Feather(1975) (Mehmetoglu et al.,2010). Kahle’s list of values (LOV) includes the following 9 values: Warm relationship with others, Self-respect, Sense of achievement, Fun and enjoyment in life, Self-fulfillment, Being well respected, Security, Sense of belonging and finally Excitement.
Kahle (1983) has suggested three main domains regarding LOV items: internal (self-respect, sense of achievement, self-fulfillment), interpersonal or hedonic (fun and enjoyment, excitement), and external (warm relationships with others, being well respected, sense of belonging, security). Internally oriented individuals (those who rate fun and enjoyment, self-fulfillment, excitement, a sense of accomplishment and self-respect highly) want more control over all aspects of their lives. In contrast, those people who rate the external values (sense of belonging, being well respected and security) highly are more inclined to let fate control their lives. Chan and Rossiter(1997) also agreed that the LOV items could be divided into internal and external orientations. They believed consumers with an internal locus of control are much more individualistic, while those with an external locus of control are more concerned with their social group and its approval (Watkins and G noth, 2005, 227).
3. Hypotheses and Conceptual Research Model
Based on the literature above, the self-congruity theory plays an important role in fashion marketing since consumers and, in particular, youngsters are mainly influenced by their self-image while making fashion based buying decisions.(Mulyanegara and Tsarenko, 2009). Based on this and the values-brand congruence concept which states that brand preference is due to a compatibility between the human values which are demonstrated in a brand as symbols and the values that one endorses. Thus, The research are hypothesized as follow:
H0)There is a significant relationship between cultural values and brand preferences H1)There is a positive relationship between each item of values and brand preferences The model in this paper (Fig.2) uses Aaker’s brand personality constructs and Kahle’s list of values. This
examines the impact of cultural values as a whole as well as each item of LOV on brand preferences which is evaluated by brand personality scale.

193 Fahimeh Chegini et al. / Procedia Economics and Finance 36 ( 2016 ) 189 – 200
Fig 2.Model of Research
4. Methodology
4.1. Sample and Data Collection
Both primary and secondary data collection methods were employed. Primary data were obtained through questionnaires given to respondents while the secondary data were gathered through books, journals, articles, internet and other published materials. The population study was chosen to be customers of two foreign brands in sports clothes, Adidas and Nike, and one well-known local brand, Holiday. 350 questionnaires were distributed among customers of all branches of these brands in Tehran. After removing altered ones, 313 questionnaires were analyzed.
The questionnaire consisted of three sections. One section for the demographic data, the second to evaluate the respondents ’cultural values and the last section for brand personality identification.
4.2. Measure for cultural values
A list of values (LOV)( Kahle and Kennedy,1989)was applied to measure the values construct. The respondents were asked to rate the 9 items on the list ranging from 1=important to 6=very important .At the end they were asked to define one item as the most important value to them.

194 Fahimeh Chegini et al. / Procedia Economics and Finance 36 ( 2016 ) 189 – 200
4.3. Measure for Brand personality
The Brand Personality Scale was adopted from the “Dimensions of Brand Personality” (Aaker,1997). Subjects were asked to choose one brand they preferred to the other two and to answer the 45 questions regarding the personality they assumed for the brand of their choice as if it was a human.
5. Data Analysis
About 54% of the people surveyed were aged between 20 and 30,59% of the respondents were female and 61% were single. Most of them had a master’s or a higher degree. Adidas with 47.3% was the most preferred brand for sports clothes.
5.1. Reliability and validity of measures
The validity of the primary data was ascertained by using validated questionnaires. According to Euro journal (2012) a validated questionnaire is one which has undergone a validation procedure to show that it accurately measures what it aims to do, regardless of who responds, when they respond, and to whom they respond or when self-administered(Al Azzawi and Nzube Ezeh,2012). Both the LOV and Aaker’s BPS are widely known and used. For the evaluation of instrument validity, thanks to the use of CFA technology, the first step of evaluation assesses whether the overall model fit satisfies the criteria of CFI (comparative fit index) >0.90, RMSEA< 0.08, and AGFI >0.85. The results indicate that the measurement model for Brand Personality has acceptable model fitting (X2/df = 2.05, AGFI = 0.86, CFI = 0.92, RMSEA = 0.024). Principle Component Factor analysis was used to analyze on 42 variables of brand personality and 9 items of LOV. Dimensions with factor loadings that are equal to or greater than 0.40 were retained. Based on Table 1, only 35 out of 42 variables of brand BPS were loaded. Seven personality traits (Down-to-earth, simple, cool, feminine, simple and easy, smooth, and western) were below 0.40 factor loading.
Table 1: Validity of Brand Personality Scale
T-Value Factor Loading Facets T-Value Factor Loading Facets
Sincerity Competence 7.73 0.44 Sensible 12.68 0.65 Reliability 11.32 0.61 Honest 7.55 0.43 Enduring 8.39 0.47 Sincere 13.75 0.7 Secure 10.4 0.57 Real 14/62 0.73 Intelligent 13.72 0.71 Wholesome 17.36 0.82 Polished
9.35 0.52 Flavoring 14/03 0.72 Competent 12.66 0.67 Original 18.4 0.85 Successful 12.8 0.67 Cheerful 14.33 0.72 Leader
6.59 0.38 Sentimental 15.79 0.77 Confident 10.01 0.55 Friendly
Excitement Sophistication
16.12
0.74
Daring
16.42
0.8
Upper Class 13.03 0.67 Trendy 17.2 0.82 Glamorous 10.42 0.56 Thrilling 18.17 0.85 Appealing
11.02 0.58 Spirited 15.85 0.78 Charming 7.82 0.43 Young Ruggedness 14.58 0.73 Imaginative 8.65 0.49 Masculine
195 Fahimeh Chegini et al. / Procedia Economics and Finance 36 ( 2016 ) 189 – 200
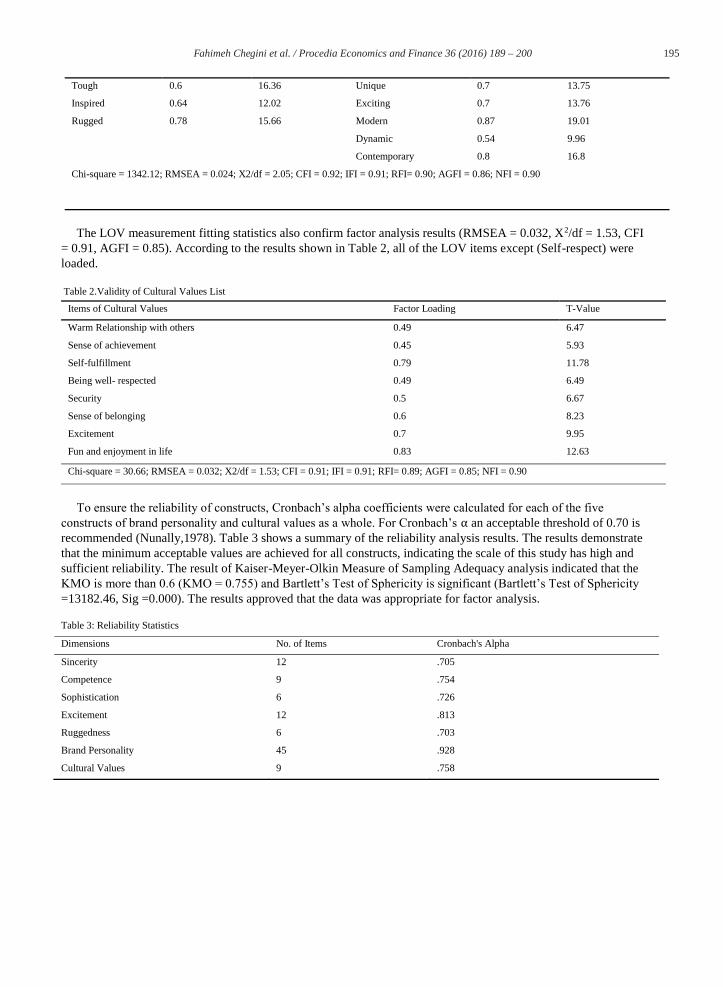
The LOV measurement fitting statistics also confirm factor analysis results (RMSEA = 0.032, X2/df = 1.53, CFI
= 0.91, AGFI = 0.85). According to the results shown in Table 2, all of the LOV items except (Self-respect) were loaded.
Table 2.Validity of Cultural Values List
To ensure the reliability of constructs, Cronbach’s alpha coefficients were calculated for each of the five
constructs of brand personality and cultural values as a whole. For Cronbach’s an acceptable threshold of 0.70 is recommended (Nunally,1978). Table 3 shows a summary of the reliability analysis results. The results demonstrate that the minimum acceptable values are achieved for all constructs, indicating the scale of this study has high and sufficient reliability. The result of Kaiser-Meyer-Olkin Measure of Sampling Adequacy analysis indicated that the KMO is more than 0.6 (KMO = 0.755) and Bartlett’s Test of Sphericity is significant (Bartlett’s Test of Sphericity =13182.46, Sig =0.000). The results approved that the data was appropriate for factor analysis.
Table 3: Reliability Statistics
Dimensions No. of Items Cronbach's Alpha
Sincerity 12 .705
Competence 9 .754
Sophistication 6 .726
Excitement 12 .813
Ruggedness 6 .703
Brand Personality 45 .928
Cultural Values 9 .758
13.75 0.7 Unique 16.36 0.6 Tough 13.76 0.7 Exciting 12.02 0.64 Inspired 19.01 0.87 Modern 15.66 0.78 Rugged 9.96 0.54 Dynamic 16.8 0.8 Contemporary
Chi-square = 1342.12; RMSEA = 0.024; X2/df = 2.05; CFI = 0.92; IFI = 0.91; RFI= 0.90; AGFI = 0.86; NFI = 0.90
T-Value Factor Loading Items of Cultural Values
6.47 0.49 Warm Relationship with others 5.93 0.45 Sense of achievement 11.78 0.79 Self-fulfillment 6.49 0.49 Being well- respected 6.67 0.5 Security 8.23 0.6 Sense of belonging 9.95 0.7 Excitement 12.63 0.83 Fun and enjoyment in life
Chi-square = 30.66; RMSEA = 0.032; X2/df = 1.53; CFI = 0.91; IFI = 0.91; RFI= 0.89; AGFI = 0.85; NFI = 0.90

196 Fahimeh Chegini et al. / Procedia Economics and Finance 36 ( 2016 ) 189 – 200
5.2. Test of Hypotheses
Table 4 presents several goodness of fit indices of the structure model. Among these fit measures, X2/df = 2.95 is below the suggested value of 3; goodness of fit (GFI) = 0.89 is approximately near the threshold value of 0.9, and the value of RMSEA is 0.000, which is below the acceptable value of 0.08. These numbers indicate that a strong goodness of fit between the theoretical model and actual data is verified to exist. Moreover, CFI and incremental fit index (IFI) meet the suggested value of 0.9, suggesting a good degree of fit and parsimony for the overall model. In sum, all of these fit measures for the structure model are acceptable, indicating that the structure model of the theoretical framework provides a good fit with the data.
Table 4.Model Statistics for Goodness of Fit
Accepted Range Value Measured Fit Indices
X2/df 3 2.95 X2/df
RMSEA<0.09 0.000 RMSEA
GFI>0.9 0.89 GFI
AGFI>0.85 0.85 AGFI
CFI>0.90 0.90 CFI
IFI>0.90 0.90 IFI
After proving the fitness of model the results of structural equation modeling(Fig.3,Table 5), performed by
LISREL 8.5, reveals the coefficient of 0.63 and a T value of 9.81 at P<0.01, supporting the existence of a meaningful relationship between cultural values and brand preferences.
Fig.3: Structural Equation Modeling
Sincerity
Excitement
Competence
Sophistication
Ruggedness
Brand Preferences
Cultural Values
P1
P3
P4
P5
P6
P7
P8
P9
0.77
0.79
0.35
0.78
0.77
0.68
0.56
0.20
0.44
0.25
0.21
0.48
0.49
0.48
0.46
0.81
0.47
0.48
0.56
0.67
0.89
0.63
0.71
0.48
0.89
0.86
0.75
Chi-Square=188.79, df=64, P-value=0.00000, RMSEA=0.078
197 Fahimeh Chegini et al. / Procedia Economics and Finance 36 ( 2016 ) 189 – 200
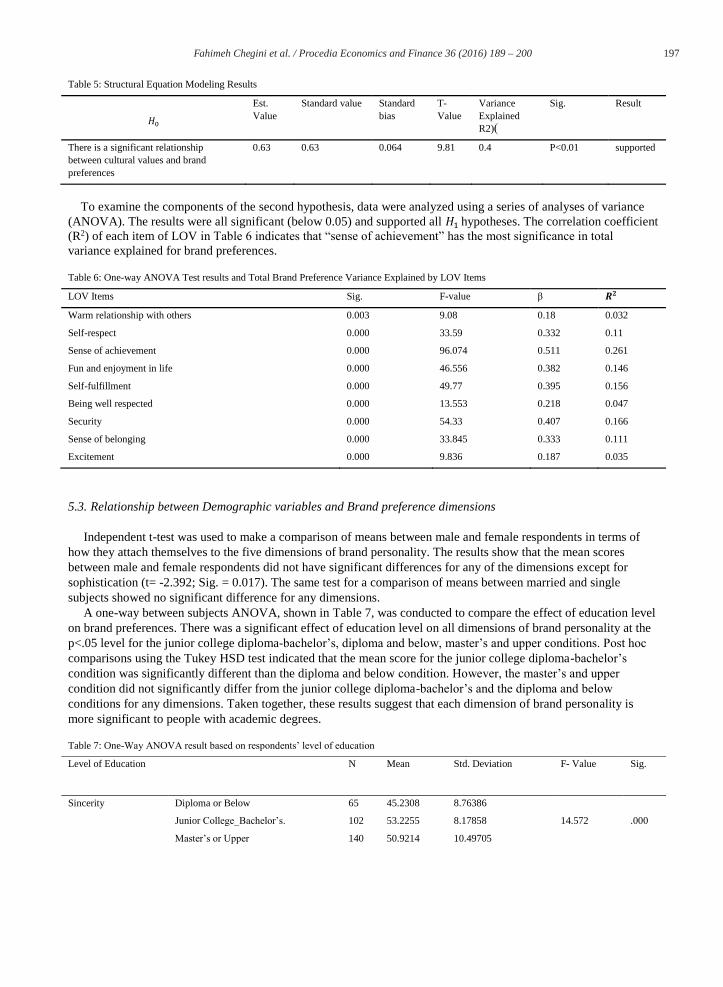
Table 5: Structural Equation Modeling Results
Est. Value
Standard value Standard bias
T-Value
Variance Explained R2)(
Sig. Result
There is a significant relationship between cultural values and brand preferences
0.63 0.63 0.064 9.81 0.4 P<0.01 supported
To examine the components of the second hypothesis, data were analyzed using a series of analyses of variance (ANOVA). The results were all significant (below 0.05) and supported all hypotheses. The correlation coefficient (R2) of each item of LOV in Table 6 indicates that “sense of achievement” has the most significance in total variance explained for brand preferences.
Table 6: One-way ANOVA Test results and Total Brand Preference Variance Explained by LOV Items
LOV Items Sig. F-value β
Warm relationship with others 0.003 9.08 0.18 0.032
Self-respect 0.000 33.59 0.332 0.11
Sense of achievement 0.000 96.074 0.511 0.261
Fun and enjoyment in life 0.000 46.556 0.382 0.146
Self-fulfillment 0.000 49.77 0.395 0.156
Being well respected 0.000 13.553 0.218 0.047
Security 0.000 54.33 0.407 0.166
Sense of belonging 0.000 33.845 0.333 0.111
Excitement 0.000 9.836 0.187 0.035
5.3. Relationship between Demographic variables and Brand preference dimensions
Independent t-test was used to make a comparison of means between male and female respondents in terms of how they attach themselves to the five dimensions of brand personality. The results show that the mean scores between male and female respondents did not have significant differences for any of the dimensions except for sophistication (t= -2.392; Sig. = 0.017). The same test for a comparison of means between married and single subjects showed no significant difference for any dimensions.
A one-way between subjects ANOVA, shown in Table 7, was conducted to compare the effect of education level on brand preferences. There was a significant effect of education level on all dimensions of brand personality at the p<.05 level for the junior college diploma-bachelor’s, diploma and below, master’s and upper conditions. Post hoc comparisons using the Tukey HSD test indicated that the mean score for the junior college diploma-bachelor’s condition was significantly different than the diploma and below condition. However, the master’s and upper condition did not significantly differ from the junior college diploma-bachelor’s and the diploma and below conditions for any dimensions. Taken together, these results suggest that each dimension of brand personality is more significant to people with academic degrees.
Table 7: One-Way ANOVA result based on respondents’ level of education
Level of Education N Mean Std. Deviation F- Value Sig.
Sincerity
Diploma or Below 65 45.2308 8.76386
Junior College_Bachelor’s. 102 53.2255 8.17858 14.572 .000
Master’s or Upper 140 50.9214 10.49705

198 Fahimeh Chegini et al. / Procedia Economics and Finance 36 ( 2016 ) 189 – 200
Total 307 50.4821 9.83103
Excitement Diploma or Below 47 49.9787 10.63319
Junior College_Bachelor’s. 96 56.9688 10.56653 7.216 .001
Master’s or Upper 137 53.4380 10.78661
Total 280 54.0679 10.92164
Competence
Diploma or Below 59 37.6610 7.68252
Junior College_Bachelor’s. 102 43.0980 8.27918 7.121 .001
Master’s or Upper 137 41.6350 9.76554
Total 298 41.3490 9.07168
Sophistication Diploma or Below 59 22.2034 6.90772
Junior College_Bachelor’s. 102 26.3235 6.18552 7.564 .001
Master’s or Upper 143 24.1958 6.80126
Total 304 24.5230 6.76426
Ruggedness Diploma or Below 65 22.6615 5.72079
Junior College_Bachelor’s. 102 26.4412 5.07483 18.041 .000
Master’s or Upper 143 22.4056 5.59204
Total 310 23.7871 5.74821
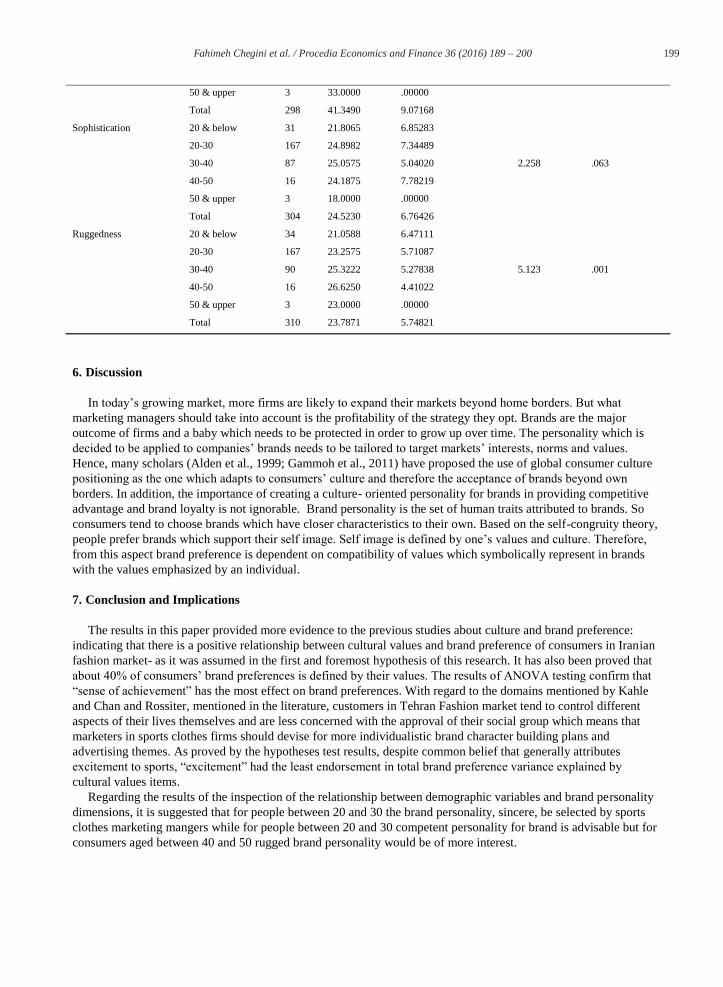
In table 8, ANOVA between group results for the effect of age range on each dimension didn’t show any
significant differences in terms of excitement (Sig.= 0.29)and sophistication(Sig.=0.06). However, significant means differences were observed in the aspect of sincerity (F = 5.302. Sig.= 0.000), ruggedness (F = 5.123; Sig. = 0.001) and Competence (F = 4.327; Sig. = 0.002) of the brand personality. While sincerity was most significantly important to the group age 20-30 and 30-40, competence and ruggedness were important to the group age 30-40 and the group age 40-50 respectively.
Table 8: One-Way ANOVA result based on respondents’ age group
Age Group N Mean Std. Deviation F-Value Sig.
Sincerity 20 & below 34 45.0000 6.43381
20-30 164 51.7439 9.59782
30-40
40-50
90 51.3889 9.86959 5.302 .000
16 45.6875 13.12361
50 & upper 3 42.0000 .00000
Total 307 50.4821 9.83103
Excitement 20 & below 25 50.3600 10.69611
20-30 158 54.7468 10.09442
30-40 81 54.1728 12.28189 1.263 .287
40-50 16 52.6250 11.59813
50 & upper 0 . .
Total 280 54.0679 10.92164
Competence 20 & below 31 35.9032 8.66162
20-30 164 41.7378 8.36650
30-40 84 42.9286 10.12665 4.327 .002
40-50 16 41.1875 7.77362
199 Fahimeh Chegini et al. / Procedia Economics and Finance 36 ( 2016 ) 189 – 200
50 & upper 3 33.0000 .00000
Total 298 41.3490 9.07168
Sophistication 20 & below 31 21.8065 6.85283
20-30 167 24.8982 7.34489
30-40 87 25.0575 5.04020 2.258 .063
40-50 16 24.1875 7.78219
50 & upper 3 18.0000 .00000
Total 304 24.5230 6.76426
Ruggedness 20 & below 34 21.0588 6.47111
20-30 167 23.2575 5.71087
30-40 90 25.3222 5.27838 5.123 .001
40-50 16 26.6250 4.41022
50 & upper 3 23.0000 .00000
Total 310 23.7871 5.74821
6. Discussion
In today’s growing market, more firms are likely to expand their markets beyond home borders. But what marketing managers should take into account is the profitability of the strategy they opt. Brands are the major outcome of firms and a baby which needs to be protected in order to grow up over time. The personality which is decided to be applied to companies’ brands needs to be tailored to target markets’ interests, norms and values. Hence, many scholars (Alden et al., 1999; Gammoh et al., 2011) have proposed the use of global consumer culture positioning as the one which adapts to consumers’ culture and therefore the acceptance of brands beyond own borders. In addition, the importance of creating a culture- oriented personality for brands in providing competitive advantage and brand loyalty is not ignorable. Brand personality is the set of human traits attributed to brands. So consumers tend to choose brands which have closer characteristics to their own. Based on the self-congruity theory, people prefer brands which support their self image. Self image is defined by one’s values and culture. Therefore, from this aspect brand preference is dependent on compatibility of values which symbolically represent in brands with the values emphasized by an individual.
7. Conclusion and Implications
The results in this paper provided more evidence to the previous studies about culture and brand preference: indicating that there is a positive relationship between cultural values and brand preference of consumers in Iranian fashion market- as it was assumed in the first and foremost hypothesis of this research. It has also been proved that about 40% of consumers’ brand preferences is defined by their values. The results of ANOVA testing confirm that “sense of achievement” has the most effect on brand preferences. With regard to the domains mentioned by Kahle and Chan and Rossiter, mentioned in the literature, customers in Tehran Fashion market tend to control different aspects of their lives themselves and are less concerned with the approval of their social group which means that marketers in sports clothes firms should devise for more individualistic brand character building plans and advertising themes. As proved by the hypotheses test results, despite common belief that generally attributes excitement to sports, “excitement” had the least endorsement in total brand preference variance explained by cultural values items.
Regarding the results of the inspection of the relationship between demographic variables and brand personality dimensions, it is suggested that for people between 20 and 30 the brand personality, sincere, be selected by sports clothes marketing mangers while for people between 20 and 30 competent personality for brand is advisable but for consumers aged between 40 and 50 rugged brand personality would be of more interest.
200 Fahimeh Chegini et al. / Procedia Economics and Finance 36 ( 2016 ) 189 – 200
7.1. Future Research Scope
Like other studies this research had also some limitations which can open path for future investigation. As it was the first time one of many common value surveys was used to measure the relation between cultural values and brand preference of consumers, it is recommended that further research will be done with various value surveys to find the best fitting one for Iranian culture. Besides, other indicators of brand preference could be applied (e.g. brand image). More investigation is needed to find out whether the LOV items suffice Iranian value system. Future research could be expanded to cross national or cross cultural value survey of Iranian products as well.
References
Aaker J. 1997. Dimensions of brand personality. Journal of Marketing Research. 34(3): 347-356. Al Azzawi M., Ezeh,M.A.N 2012. Students Brand Preferences Between Apple and Samsung. Master Thesis, School of Sustainable Development of Society and Technology, Malardalen University Eskilstuna-Vasteras. Alden D.L., Steenkamp J.B., and Batra, R. 1999. Brand positioning through advertising in Asia, North America and Europe: the role of global consumer culture. Journal of Marketing. 63(1): 75-87. Assael H. 1995. Consumer Behavior and Marketing Action. Fifth ed. South Western College Publishing . Buil I., Chernatony L.D., and Hem L.E. 2009. Brand extension strategies: perceived fit, brand type, and culture influences. European Journal of Marketing. 43(11): 1300 - 1324 Gammoh B.S, Koh A.C, and Okoroafo S.C. 2011. Consumer culture brand positioning strategies: an Experimental investigation . Journal of Product & Brand Management. 20(1) pp. 48 – 57. Foscht T., Maloles III,C., Swoboda B., Morschett D., and Sinha I. 2008. The impact of culture on brand perceptions: a six-nation study. Journal of Product & Brand Management. 17(3):131 – 142 Hawkins D.I., Best R., and Coney K. 2004.Consumer behavior: building marketing strategy. (9th ed.). McGraw-Hill/Irwin. Hawkins D.I., Mothersbaugh D.L., 2010.Consumer behavior: building marketing strategy. (11th ed.) McGraw-Hill/Irwin. Mehmetoglu M., Hines K., Graumann C., and Greibrokk, J. 2010. The relationship between personal values and tourism behaviour: a segmentation approach. Journal of Vacation Marketing. 16(1):17–27 Mulyanegara R.C., Tsarenko Y. 2009. Predicting brand preferences: An examination of the predictive power of consumer personality and values in the Australian fashion market. Journal of Fashion Marketing and Management.13(3): 358 – 371. Paasovaara R., Luomala H., Pohjanheimo T., and Sandell M. 2012. Understanding consumers’ brand induced food taste perception: A comparison of ‘brand familiarity’ – and ‘consumer value – brand symbolism (in)congruity’ – accounts. Journal of Consumer Behaviour 11:11-20 Park H.J., Rabolt N.J. 2010. Cultural Value, Consumption Value, and Global Brand Image: A Cross-National Study. Psychology & Marketing. 26(8):714–735. Rajagopal 2009. Conational Drivers Influencing Brand Preference Among Consumers. Working Paper. Rokeach M. 1973. The Nature of Human Values. New York: The Free Press. Roosta A., Venus D., and Ebrahimi A. 2007. Marketing management. Tehran: Samt Press, Sixth edition. Sheena and G. Naresh / Procedia - Social and Behavioral Sciences 37 ( 2012 ) 31 – 37 Sung Y.,Choi S.M., and Lin J.S. 2011. The interplay of culture and situational cues in consumers’ brand evaluation. International Journal of Consumer Studies. 36(6): 696-701. Watkins L., Gnoth J. 2005). Methodological issues in using Kahle’s list of values scale for Japanese tourism behavior. Journal of Vacation Marketing. 11(3) : 225–233