PRODUCTIVITY TRENDS IN THE US PASSENGER...
26
PRODUCTIVITY TRENDS IN THE US PASSENGER AIRLINE INDUSTRY 1978-2010 Peter Belobaba, Kari Hernandez, Joe Jenkins, Robert Powell, William Swelbar
Transcript of PRODUCTIVITY TRENDS IN THE US PASSENGER...

PRODUCTIVITY TRENDS IN THE US PASSENGER AIRLINE INDUSTRY 1978-2010
Peter Belobaba, Kari Hernandez, Joe Jenkins, Robert Powell, William Swelbar

1
Executive Summary The Airline Deregulation Act of 1978 started a process of transformation for the US passenger
airline industry that has accelerated in recent years. Over the past 30 years, air travelers have
seen dramatically lower airfares as well as changes to route networks and service quality. At the
same time, airlines experienced greater profit volatility and, in some cases, bankruptcy and
liquidation. The airlines that survived this transition have also become significantly more cost
efficient and productive. The focus of this study is on the changes in operating efficiency and
overall productivity of the US passenger airlines over the past three decades.
This report summarizes the findings of several studies of cost and productivity trends in the US
passenger airline industry, undertaken at MIT. Productivity improvements during the first 50
years of airline industry development were driven primarily by innovations in aircraft
technology. Until 1978, the ability of US airlines to achieve greater levels of productivity was
constrained by economic regulation. It has only been in the period since deregulation that
airlines have focused on cost efficiency and productivity improvement in the face of increasing
competition.
In the US airline industry, approximately 100 certificated passenger airlines operate close to 10
million flight departures per year, and carry about one-third of the world’s total air passengers.
US airlines enplaned 720 million passengers in 2010, 630 million of whom flew domestically.
In 2010, US airlines (both cargo and passenger) generated $1.225 trillion in total US economic
activity, contributing $731 billion – or 5.2% – of the US GDP, and provided 10.9 million jobs
(ATA, 2011).

2
The US airline industry contributes significantly to both the US and global economies. Its
economic impacts include direct effects like airline employment and many indirect effects on
related activities that include aircraft manufacturers, airports, business travel and tourism. The
economic importance of the airline industry and its impacts on so many other major industries
makes the volatility of airline profits and the financial sustainability of airlines a national
concern.
1 Evolution of the US Airline Industry
Productivity improvements during the first 50 years of the US passenger airline industry were
driven primarily by innovations in aircraft technology related to speed and capacity – the
introduction of jet airplanes in the 1960s, followed by wide-body “jumbo jets” in the 1970s. Yet,
until 1978, the ability of US airlines to achieve greater levels of productivity was constrained by
economic regulations – management decisions as to which routes to serve, how often and at what
prices were subject to government controls. It has only been since deregulation that airlines
have been able to focus on cost efficiency and productivity improvement in the face of
increasing competition.
Airline deregulation has benefited the vast majority of air travelers in the United States.
Domestic air travel in the past 30 years has grown at rates significantly greater than prior to
deregulation, while average real fares have dropped dramatically and in 2010 are still about one-
half of 1978 levels. New entry by innovative Low Cost Carriers (LCCs) contributed to increased
fare competition, forcing the more established Network Legacy Carriers (NLCs) to reduce costs
and improve productivity, and changing the traveling public’s expectations with respect to low-
priced air travel.

3
On the other hand, deregulation of US airlines also had some negative impacts. Cost cutting,
increased profit volatility, mergers and bankruptcies of several large airlines led to job losses and
reduced wages for many airline employees. Residents of some small cities saw changes to their
air services, as deregulated airlines were no longer obligated to serve less profitable routes with
as much capacity or frequency. And, the development of large connecting hub networks by the
NLCs also raised concerns about the pricing power of dominant airlines at hub airports (GAO,
1993).
Deregulation removed barriers to entry into the US airline industry, spawning new entrant
airlines with lower cost structures that allowed them to offer consumers new options for air
travel at lower fares. Their pricing strategies, combined with the additional capacity offered in
affected markets, reduced average fares for consumers and, in turn, the revenues of NLCs as they
matched the lower prices to protect market share. The significantly lower cost structures of the
LCCs allowed them to generate operating profits even at low fares, while the NLCs had little
choice but to re-structure their operating models in the hopes of maintaining profitability.
The significantly lower cost structures of the LCCs can be attributed primarily to higher levels of
productivity of both aircraft and employees. LCCs initially operated “point-to-point” networks
with simplified passenger processing and lower aircraft ground times, in contrast to the hub-and-
spoke networks of the NLCs. Shorter ground times enabled LCCs to achieve higher aircraft
utilization rates than NLCs, contributing to lower unit aircraft operating costs. LCCs were also
able to achieve significantly higher labor productivity than NLCs, due to more flexible work
rules that allow cross-utilization of employees, which also contributed to lower unit labor costs
(Belobaba et al, 2009).

4
Although deregulation legislation was passed in 1978, it has taken several decades for its full
impacts to be felt in the industry. In the years immediately following deregulation, a fuel crisis
and economic recession clouded any assessment of its initial effects. While some new entrant
LCCs began to emerge in the mid-1980s, existing NLCs were able to fend off the competitive
attacks through aggressive price matching. Barriers to entry had been removed, but there
remained a variety of barriers to exit that allowed some inefficient legacy airlines to survive.
The early 1990s brought the first Gulf War, a fuel crisis and economic recession that plunged the
US airlines into another period of operating losses. Iconic names like Braniff, Eastern and Pan
Am disappeared from the industry. By the mid 1990s, the remaining legacy airlines were able to
return to profitability by reinforcing their hub and spoke networks, protecting their market share
and keeping LCCs at bay. The “Big 6” NLCs were able to co-exist and generate record profits
during the late 1990s, the last period of extended profitability for US airlines as a group.
The financial problems of the US airlines that began with the economic downturn at the
beginning of 2001 reached crisis levels between 2001 and 2005. The combination of the terror
attacks of September 11, 2001, the subsequent economic downturn, several military actions,
along with international health concerns drove the US airline industry into uncharted financial
territory. Four out of the six US NLCs (US Airways, United, Delta and Northwest) filed Chapter
11 bankruptcy between 2001 and 2005. Under bankruptcy protection, these carriers focused on
down-sizing, cutting operating costs and improving productivity as part of their re-structuring
efforts. NLC airline employment dropped by 30% in just five years, representing over 100,000
jobs lost, while average wage rates were also cut by 7% (US DOT, 2011). Despite these re-
structuring efforts, US airlines posted cumulative net losses of over $60 billion from 2001 to
2010.

5
In response to the challenges since 2000, the US airline industry achieved productivity
improvements that exceed the gains made during the first two decades of deregulation. Recent
productivity gains have come from the introduction of new technologies (e.g., internet ticket
distribution, web check-in) and by re-allocating capacity (e.g., moving aircraft from domestic to
international routes in an effort to improve both aircraft and employee utilization). The NLCs
also attempted to replicate some of the cost efficiencies of the LCCs, for example, by eliminating
free meals and pillows on domestic flights to reduce costs and by reducing aircraft turn-around
times to improve aircraft productivity.
The strategy adopted by nearly every US airline following the schedule reductions made in
response to the economic downturn of 2008 is one of maintaining capacity discipline and
focusing on profits instead of incremental revenue and/or market share. With this capacity
discipline comes the capability to increase yields and revenues. Without it, airlines would not be
able to pass through increasing proportions of the rising cost of jet fuel to the consumer. The
increasing cost of oil has also encouraged industry consolidation as another approach to capacity
discipline, and this recent consolidation has not been limited to only the NLCs but has affected
the LCCs and regional sector as well.
2 Traffic, Output, Fares, Revenues
US domestic passenger air traffic, measured in revenue passenger miles (RPMs), has almost
tripled since deregulation, as shown in Figure 11. The output of US passenger airlines, measured
in available seat miles (ASMs), increased by 186% between 1978 and its peak output level of
1 Unless otherwise noted, data compiled for the metrics, analyses and graphs displayed in figures throughout this report were collected from the United States Department of Transportation Form 41 reports, which include financial and operating information for US airlines.

6
2007. The mix of international versus domestic capacity has also changed – in 1978, only 19%
of US passenger airline output was flown on international routes, whereas this proportion has
increased to almost 30%.
Figure 2 shows the growth in total system RPMs and ASMs for US passenger airlines, along
with the resulting average load factors. With RPMs increasing at a faster rate than ASMs, the
average system load factor (percentage of available seats sold) has increased steadily since 1980.
By 2009, average load factors for US airlines surpassed 80%, more than 20 percentage points
higher than in the early 80s, with a large portion of the increase realized in the last decade.
Higher load factors reflect improvements in productivity attributable to improved scheduling and
fleet assignment practices and the development of differential pricing and revenue management
techniques.
100
200
300
400
500
600
700
1978
1979
1980
1981
1982
1983
1984
1985
1986
1987
1988
1989
1990
1991
1992
1993
1994
1995
1996
1997
1998
1999
2000
2001
2002
2003
2004
2005
2006
2007
2008
2009
2010
Revenu
e Passenger M
iles (Billion
s)
Figure 1: Annual US Domestic Revenue Passenger Miles

7
While US domestic air traffic has almost tripled since deregulation, average real fares have
declined significantly and in 2009 remained at less than 50% of 1978 levels. Figure 3 shows the
dramatic decreases in yield (average fare paid per passenger-mile), inflation adjusted to 2010
dollars, for both domestic and international travel on US carriers. The decrease in real fares has
been greater in the US domestic market: international average fares dropped 49% between 1977
and 2009, and domestic average fares decreased at an even higher rate of 56% during the same
time period. Despite this significant decline in real fares since deregulation, Total industry
passenger revenues have risen over much of the period as a result of increased output, traffic,
and load factors, but have stagnated in the last decade. Total 2009 passenger revenues were in
real terms equal to 1988 levels, effectively eliminating 20 years of revenue growth.
-‐
200
400
600
800
1,000
1,200
50%
55%
60%
65%
70%
75%
80%
85%
1978
1980
1982
1984
1986
1988
1990
1992
1994
1996
1998
2000
2002
2004
2006
2008
2010
RPMs/AS
Ms (Billion
s)
Load Fa
ctor
Figure 2: Traffic (RPMs), Output (ASMs), and Average Load Factor
Load Factor ASMs RPMs

8
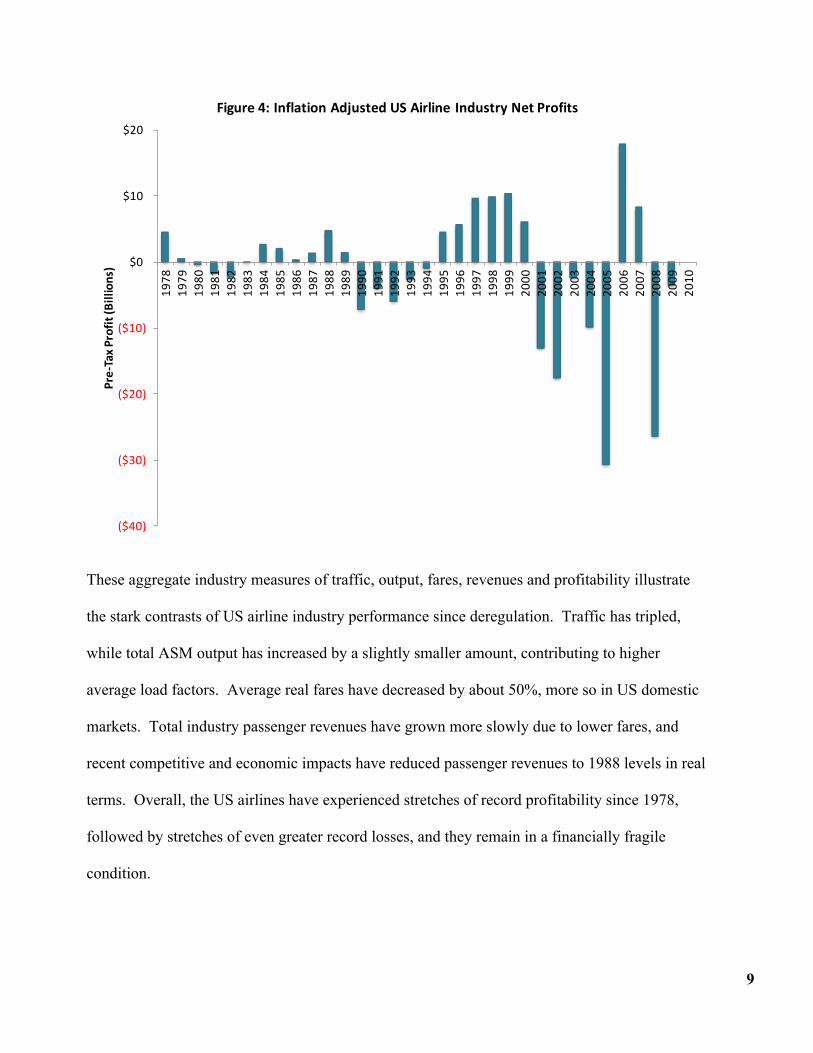
Increased competition also contributed to an increase in the volatility of US airline profitability.
As shown in Figure 4, the total net profits of US airlines have been both cyclical and increasingly
variable over the past 30 years. After the industry posted five consecutive years of losses
totaling more than $13 billion from 1990 to 1994, it returned to record profitability in the late
1990s. Since then, the industry has continued to experience dramatic swings from financial
crisis to profitability, and these swings have become even more volatile in recent years.
$0.00
$0.05
$0.10
$0.15
$0.20
$0.25
$0.30
$0.35
1978
1979
1980
1981
1982
1983
1984
1985
1986
1987
1988
1989
1990
1991
1992
1993
1994
1995
1996
1997
1998
1999
2000
2001
2002
2003
2004
2005
2006
2007
2008
2009
2010
Passen
ger Fare pe
r RPM
Figure 3: US Airline Inflation Adjusted Average Yield
Domestic System International
9
These aggregate industry measures of traffic, output, fares, revenues and profitability illustrate
the stark contrasts of US airline industry performance since deregulation. Traffic has tripled,
while total ASM output has increased by a slightly smaller amount, contributing to higher
average load factors. Average real fares have decreased by about 50%, more so in US domestic
markets. Total industry passenger revenues have grown more slowly due to lower fares, and
recent competitive and economic impacts have reduced passenger revenues to 1988 levels in real
terms. Overall, the US airlines have experienced stretches of record profitability since 1978,
followed by stretches of even greater record losses, and they remain in a financially fragile
condition.
($40)
($30)
($20)
($10)
$0
$10
$20
1978
1979
1980
1981
1982
1983
1984
1985
1986
1987
1988
1989
1990
1991
1992
1993
1994
1995
1996
1997
1998
1999
2000
2001
2002
2003
2004
2005
2006
2007
2008
2009
2010
Pre-‐Tax P
rofit (B
illions)
Figure 4: Inflation Adjusted US Airline Industry Net Profits

10
3 Operating Costs
The competition made possible by deregulation focused the attention of airlines on cost
containment, particularly given competition from new entrant Low Cost Carriers (LCCs). Total
operating expenses in real terms (2010 dollars) increased from $67 billion in 1978 to $108
billion in 2010, or by 61%. Compared to the 186% overall growth in ASM capacity over the
same period, this relatively modest increase in real operating expenses suggests that significant
improvements in cost efficiency have been achieved.
While the industry has made tremendous progress in terms of unit cost efficiencies in both their
labor and non-labor expenses, the instability of fuel costs has proven to be a driver of the
profitability cycles discussed above. Figure 5 shows the evolution of total airline operating
expenses broken down into these cost components on an inflation-adjusted basis since 1978.
Historically, fuel has accounted for a smaller portion of total operating expenses than in the most
recent decade, peaking at over 36% of total airline operating expenses in 2008. Labor costs, on
the other hand, have decreased substantially, especially since the re-structuring by Network
Legacy Carriers (NLCs) in the early 2000s. The share of total operating expenses related to
labor decreased from 42% in 1978 to 29% in 2010.

11
Unit cost is the ratio of airline total operating expenses to ASMs produced, also known as CASM
(cost per ASM). The average unit cost of US passenger airlines in real terms has declined almost
40% since deregulation. Figure 6 shows the inflation adjusted unit costs for the fuel, labor, and
non-labor categories. The largest portion of this decrease in unit operating costs has occurred in
the labor cost category. Labor unit costs fell quickly in the early 1980s and then remained
relatively stable until the early 2000s, when NLC re-structuring led to a more dramatic drop in
labor costs. In real terms, labor unit costs have decreased by 55% since deregulation. The most
volatile component of airline unit costs is fuel. Very high fuel costs in the early 1980s exceeded
the recent peak in 2008, but much of the period from the late 1980s through the early 2000s was
$0
$20
$40
$60
$80
$100
$120
$140
1978
1979
1980
1981
1982
1983
1984
1985
1986
1987
1988
1989
1990
1991
1992
1993
1994
1995
1996
1997
1998
1999
2000
2001
2002
2003
2004
2005
2006
2007
2008
2009
2010
Total Expen
se (B
illions)
Figure 5: Inflation Adjusted Total US Airline Operating Expenses
Fuel Labor Non-‐Labor

12
characterized by fairly low and stable real fuel unit costs.
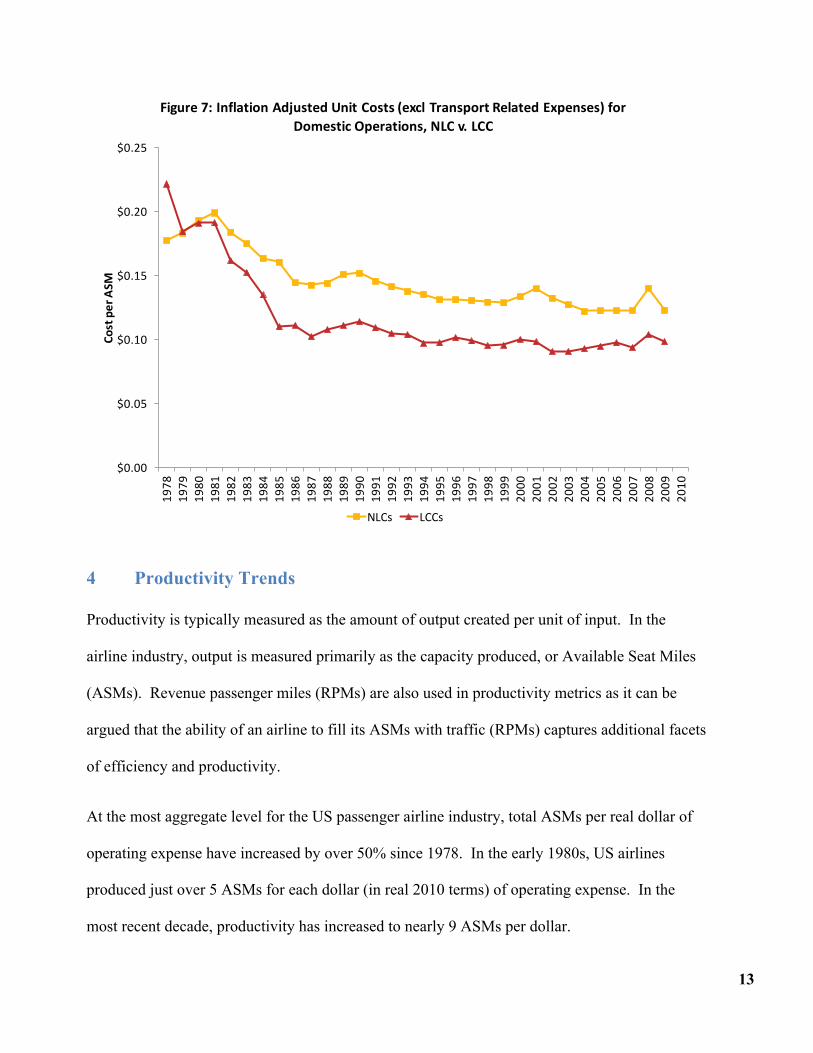
Low Cost Carriers (LCCs) have driven significant change in the US airline industry, with lower
cost structures and higher productivity levels that allow them to offer lower fares and operate
profitably. Although LCCs have historically reported unit costs about 2¢ per ASM lower than
NLCs, unit costs have been converging for the two groups, particularly in recent years. LCC unit
costs relative to NLCs were about 20% lower in 2009 compared to 30% lower in 2001, with this
convergence explained largely by decreased labor unit costs of the NLC group. Figure 7
compares inflation adjusted NLC and LCC airline unit costs since 1978.
$0.00
$0.01
$0.02
$0.03
$0.04
$0.05
$0.06
$0.07
$0.08
$0.0919
7819
7919
8019
8119
8219
8319
8419
8519
8619
8719
8819
8919
9019
9119
9219
9319
9419
9519
9619
9719
9819
9920
0020
0120
0220
0320
0420
0520
0620
0720
0820
0920
10
Infla
tion Ad
justed
Unit C
osts by C
ategory
Figure 6: Inflation Adjusted Unit Costs by Category
Fuel Labor Non-‐Labor
13
4 Productivity Trends
Productivity is typically measured as the amount of output created per unit of input. In the
airline industry, output is measured primarily as the capacity produced, or Available Seat Miles
(ASMs). Revenue passenger miles (RPMs) are also used in productivity metrics as it can be
argued that the ability of an airline to fill its ASMs with traffic (RPMs) captures additional facets
of efficiency and productivity.
At the most aggregate level for the US passenger airline industry, total ASMs per real dollar of
operating expense have increased by over 50% since 1978. In the early 1980s, US airlines
produced just over 5 ASMs for each dollar (in real 2010 terms) of operating expense. In the
most recent decade, productivity has increased to nearly 9 ASMs per dollar.
$0.00
$0.05
$0.10
$0.15
$0.20
$0.2519
7819
7919
8019
8119
8219
8319
8419
8519
8619
8719
8819
8919
9019
9119
9219
9319
9419
9519
9619
9719
9819
9920
0020
0120
0220
0320
0420
0520
0620
0720
0820
0920
10
Cost per ASM
Figure 7: Inflation Adjusted Unit Costs (excl Transport Related Expenses) for Domestic Operations, NLC v. LCC
NLCs LCCs

14
Airline productivity can then be broken down according to key inputs: capital (aircraft), fuel, and
labor. Aircraft utilization has increased substantially since deregulation, peaking in 2007. LCCs
have historically posted utilization about 1.5 block hours per day higher than NLCs. NLC
aircraft utilization increased by about 10%, while LCC aircraft utilization increased by over 30%
through 2007 (see Figure 8).
Fuel productivity has increased dramatically since 1978: by 73% for produced output (ASMs)
per gallon of fuel and by 128% for consumed output (RPMs) per gallon of fuel. By 2010, US
airlines delivered 64 ASMs per gallon of fuel (and 52 RPMs), meaning the industry’s fuel
efficiency exceeds that of the average automobile. Figure 9 shows the inflation-adjusted fuel
expense productivity, with both produced (ASMs) and consumed (RPMs) measures overlaid on
-‐
2
4
6
8
10
12
14
1978
1979
1980
1981
1982
1983
1984
1985
1986
1987
1988
1989
1990
1991
1992
1993
1994
1995
1996
1997
1998
1999
2000
2001
2002
2003
2004
2005
2006
2007
2008
2009
2010
Block H
ours per Airc
raft Day
Figure 8: Aircraft Utilization, NLC v. LCC
NLCs LCCs

15
the total fuel expense. After adjusting for inflation, fuel expenditures were much higher in the
early 1980s than many would expect, but they did decline in real terms for the greater part of the
following two decades. In recent years, real fuel costs have soared relative to historic levels,
peaking in 2008.
Historically, labor-‐related expenses have accounted for as much as 40% of the total
operating expenses for US passenger airlines. More recently, this proportion has been
reduced, both by airline efforts to reduce labor costs and by the growth of other expense
categories such as fuel. The total number of employees in the US airline industry grew along
with increasing capacity and traffic through the 1980s and 1990s, with temporary declines during
$0
$10
$20
$30
$40
$50
$60
-‐
10
20
30
40
50
60
70
80
1978
1980
1982
1984
1986
1988
1990
1992
1994
1996
1998
2000
2002
2004
2006
2008
2010
Total Fue
l Expen
se (B
illions)
ASMs/RP
Ms p
er Fu
el Dollar
Figure 9: Fuel Expense Productivity and Total Fuel Expense
Total Fuel Cost ASMs per Fuel Dollar RPMs per Fuel Dollar

16
economic downturns. After peaking at almost 550,000 in 2000, total US airline employment
plummeted by over 30%, due largely to the NLC labor force cuts in the early to mid-2000s.
Overall, labor productivity has grown in waves since deregulation, and has reached historically
high levels. ASMs per employee have more than doubled, increasing 108% since 1978, with
more than half of that gain achieved since 2001. The evolution of labor force productivity,
expressed as ASMs per FTE (full time equivalent employee), is presented in Figure 10.
A more detailed assessment of changes in US airline industry productivity was based on a Multi-
Factor Productivity (MFP) model, which has been used in many studies of the airline industry.
MFP combines various inputs used in the production process and thus provides as a more
comprehensive measure than the single-factor productivity measures described above.
-‐
100
200
300
400
500
600
-‐
0.5
1.0
1.5
2.0
2.5
3.0
1978
1980
1982
1984
1986
1988
1990
1992
1994
1996
1998
2000
2002
2004
2006
2008
2010
Full Time Equivalent Em
ployee
s (Thou
sand
FTEs)
ASMs/RP
Ms p
er FT
E (Millions)
Figure 10: Labor Force Productivity and Total Labor Force
FTEs ASMs per FTE RPMs per FTE

17
In this study, three measures of output were considered: revenue passenger-miles (RPMs),
available seat-miles (ASMs) and revenue ton-miles (RTMs). The inputs required to produce
these outputs were categorized as fuel, capital, labor, and intermediate goods/services, all
quantified in terms of constant dollars expenditures.
Preliminary estimates of the overall increase in multi-factor productivity (MFP) for the US
passenger airline industry also show tremendous productivity improvement over the past 30
years. Use of the growth accounting methodology for the period since deregulation indicates
that, on the basis of ASMs as output, aggregate airline MFP has increased by about 80%. Use of
the RPM measure as output increases the estimate of MFP growth since 1980 to 160%, that is,
the aggregate MFP of the US passenger airlines has grown by over 2.5 times when increases in
average load factor are included. The cumulative increases in airline MFP productivity derived
from this growth accounting methodology for the period since deregulation are summarized in
Figure 11.

18
5 Airport Connectivity and Recent Network Evolution
Over the past three decades, the route freedoms of deregulation allowed the networks of US
airlines to expand significantly. Network Legacy Carriers (NLCs) focused their network
development on hub-and-spoke operations. New entrant Low Cost Carriers (LCCs) relied more
on point-to-point services that can provide them certain productivity advantages. Yet, the LCC
and NLC business models are converging in terms of network structures as well.
Hub-and-spoke networks (like the hypothetical example shown in Figure 12) allow airlines to
provide joint supply of seats to multiple origin-destination (O-D) markets with fewer flight
departures and fewer aircraft, with lower total operating costs than in a point-to-point route
network. Despite repeated forecasts of more point-to-point operations, the trend toward
development of bigger and stronger hubs has continued. The economic advantages of hub
-‐20%
0%
20%
40%
60%
80%
100%
120%
140%
160%
180%
200%
1980
1981
1982
1983
1984
1985
1986
1987
1988
1989
1990
1991
1992
1993
1994
1995
1996
1997
1998
1999
2000
2001
2002
2003
2004
2005
2006
2007
2008
2009
Percen
t Change
Figure 11: Cumulative Growth of MFP since 1980
RPMs
ASMs
RTMs

19
network operations – increased revenues from more frequent (connecting) flight departures
combined with the clear unit operating cost savings from operating fewer (and larger) aircraft
than in a complete point-to-point network – far exceed their disadvantages.
Figure 12: Example of Hub Network (Source: Belobaba et al, 2009)
The US airline industry’s dependence on the hub-and-spoke model has continued to increase
following a wave of recent mergers between major US carriers driven by fare competition,
bankruptcies and fuel crises. The mergers had a significant impact on flight volumes, and all
NLCs reached unprecedented levels of hub flights – well over 90% of their total operations
originate from and/or terminate at a major connecting hub airport. Even most LCCs, incorrectly
thought to be point-to-point carriers, utilize a designated hub for over 90% of all flight segments.
Only Southwest shows relatively low levels of hub dependence, but even its use of hubbing has
grown significantly, with over 50% of its flights arriving or departing a designated hub.
The effect of these changes in network structure on passengers has been lower average path

20
quality and slightly higher circuity – both suggesting increased inconvenience of travel for nearly
all airport categories studied. However, the apparent declines in these aggregate measures are
due in part to the fact that far more passengers are choosing to select a connecting itinerary based
on the availability of a lower fare (see Figure 13). Improved airline efficiency from hubbing has
lowered unit operating costs, and increased competition has forced the airlines to pass some of
that cost savings to consumers in the form of lower fares.
Figure 13: Inflation Adjusted Average Passenger Fares

21
6 Looking ahead: US Airline Industry Challenges
Since deregulation, the US passenger airline industry has undergone tremendous changes in
business practices, leading to substantial improvements in cost efficiency and productivity.
LCCs have become a permanent fixture in the industry, and will co-exist with NLCs as their
operating models continue to converge. But while consumers have benefited from increased
competition, lower fares, new entry and innovative service options, airlines have not been able to
retain the financial benefits from the many cost and productivity efficiencies they achieved.
Despite all of the efforts of US carriers to restructure themselves in recent years, the industry
remains in a vulnerable financial position. Airlines continue to look for a business model that
can ensure sustained profitability.
US airlines today confront a number of growing dangers. For one, the entire industry is highly
leveraged, although airlines are attempting to repair their balance sheets. Many airline
companies have now decided that investments must at least earn the cost of capital, requiring
financial discipline that the industry has not previously exhibited. Fuel costs – both higher oil
prices and their increasing volatility – pose another major challenge to US airlines. Over the first
25 years of deregulation, the industry paid the equivalent of $30 per barrel for jet fuel (cost of
crude oil plus the refining margin or “crack spread”). Today airlines are paying nearly $100
more per barrel for jet fuel and most of the airline companies are reporting profits, albeit modest
profits. Without the restructuring that took place during the early 2000s, it is doubtful that many
of the largest legacy airlines would have survived as standalone companies after the most recent
financial crisis in 2008.

22
At the same time, airport and airspace infrastructure capacity constraints, along with the costs of
expanding this infrastructure, pose critical problems for the future of the US airline industry.
Although the FAA has been working toward increasing the capacity of the en route airspace,
persistent congestion and delays indicate that the US air traffic infrastructure has not kept pace
with air travel demand. Without major investments in new technologies and even additional
airport infrastructure, it will be extremely difficult to accommodate the expected growth in air
traffic.
Concerns about the environmental impacts of aviation are growing, and will need to be
addressed. Continued movement by governments toward more stringent environmental
regulations will encourage the development of new aircraft technologies and force airlines to
adopt them more quickly. However, without a return to sustained profitability, it will be difficult
for many carriers to fund the investment required to renew their fleets.
Although the US airline industry was deregulated more than 30 years ago, it remains subject to
substantial government intervention and regulation. Airline labor relations are governed by the
Railway Labor Act, much of which has remained unchanged since 1934. Infrastructure
limitations pose an impediment to operational efficiency, in many cases due to regulatory
requirements and the inability of major stakeholders to resolve policy differences. Despite all of
the efforts of US carriers to restructure themselves in recent years, the remnants of 60 years of
regulation continue to affect airline business practices and operations.
And, despite being critical to the nation’s economic activity, the US airline industry remains a
target of regulation and taxation. Today, the US airline industry, its passengers and cargo are
subject to 17 different federal taxes totaling nearly $17 billion per year (Calio, 2011), compared

23
to an inflation-adjusted total of $6.2 billion twenty years ago. Continued taxation and emerging
regulations being promoted in the name of consumer protection are imposing costs on the
industry that could lead to unintended consequences – a smaller industry contributing less in
economic activity than it does today.
Looking ahead for US airlines, global rather than domestic competition will determine the shape
of future networks and industry structure. The US airline industry has historically been the
largest in the world and a leader in terms of technology, competition and innovative business
practices. But this leadership position has been eroded, particularly during the past decade.
While it focused on the restructuring of costs and productivity, the US industry stagnated as
airlines in other regions of the world continued to grow and remain profitable.
Such mounting challenges suggest airlines will remain vulnerable to the cyclical swings between
record profits and astonishing losses that have historically plagued the industry. As US airlines
having to compete in an increasingly global marketplace, geopolitical events will have as great
an impact on the industry as economic conditions, contributing further to this volatility. Yet if
US airlines are to succeed in an increasingly harsh and competitive environment, perhaps the
biggest challenge for the industry is to find a path to sustained profitability and greater stability.

24
REFERENCES
Air Transport Association of America (2010), Economic Report 2010, www.airlines.org.
Apostolides, A. (2008), "A Primer on Multifactor Productivity: Description, Benefits, and Uses”. US Department of Transportation, Research and Innovative Technology Administration, Bureau of Transportation Statistics, Office of Advanced Studies, Washington, DC.
Baltagi, B., Griffin. J., and Daniel, R. (1995), "Airline Deregulation:The Cost Pieces of the Puzzle," International Economic Review 36.1, 245-258.
Belobaba, P., Odoni, A., and Barnhart, C. (editors) (2009), The Global Airline Industry, John Wiley and Sons.
Calio, N.E. (2011), “Proposed Airline Taxes Would Harm Economy, Jobs”, www.rollcall.com, July 28, 2011.
Caves D., Christensen, L., and Tretheway, M. "Productivity Performance of US Trunk and Local Service Airlines in the Era of Deregulation," Economic Inquiry 21, 312-324.
General Accounting Office (1993), “Airline Competition: Higher Fares and Less Competition Continue at Concentrated Airports”, Report to Committee on Commerce, Science and Transportation, US Senate, Report GAO/RCED-93-171, Washington, DC, July.
Gittell, J.H. (2003), The Southwest Airlines Way, McGraw-Hill, New York.
Hernandez, K., Swelbar, W., and Belobaba, P. (2011), “US Airline Domestic Network Evolution 2000-2010”, Working Paper, International Center for Air Transportation, Department of Aeronautics and Astronautics, MIT.
Homsombat, W., Xiaowen, F., and Sumalee, A. (2010), "Policy Implications of Airline Performance Indicators: Analysis of Major North American Airlines," Journal of the Transportation Research Board 2177, 41-48.
Jenkins, J. (2011), “The Evolution of Passenger Accessibility in the US Airline Industry 1980-2010.” MST thesis, Massachusetts Institute of Technology, Cambridge, MA.
Karlsson, J. (2010), “Airline Ticket Tax Project”, MIT Global Airline Industry Program, http://web.mit.edu/TicketTax/
Oum, T. H. and Yu, C. (1995), "A Productivity Comparison of the World's Major Airlines", Journal of Air Transport Management 2.3-4, 181-195.
Powell, R. (forthcoming, 2012), “Measuring Productivity of US Airlines”, MST Thesis, Massachusetts Institute of Technology, Cambridge, MA.
Tsoukalas, G., Belobaba, P. and Swelbar, W. (2008), “Cost Convergence in the US Airline Industry: An Analysis of Unit Costs 1995-2006”, Journal of Air Transport Management 14, 179-187.
United States Department of Transportation (2011), “Air Carrier Financial Reports (Form 41 Financial Data)”, Bureau of Transportation Statistics, Washington, DC. http://www.transtats.bts.gov/
transportation.mit.edu/productivity.php