NURail Project ID: Intercity Passenger Rail Productivity ... · 10/1/2015 · Andrés Felipe...
178
NURail Project ID: NURail2012-MIT-R02 High-Speed Rail and Productivity Intercity Passenger Rail Productivity in the Northeast Corridor: Implications for the Future of High-Speed Rail By Andrés Felipe Archila Téllez Supervised by Professor Joseph M. Sussman 10/1/2015 Grant Number: DTRT12-G-UTC18
Transcript of NURail Project ID: Intercity Passenger Rail Productivity ... · 10/1/2015 · Andrés Felipe...

NURail Project ID: NURail2012-MIT-R02 High-Speed Rail and Productivity
Intercity Passenger Rail Productivity in the Northeast Corridor:
Implications for the Future of High-Speed Rail
By
Andrés Felipe Archila Téllez
Supervised by Professor Joseph M. Sussman
10/1/2015 Grant Number: DTRT12-G-UTC18

2

3
DISCLAIMER The contents of this report reflect the views of the authors, who are responsible for the facts and the accuracy of the information presented herein. This document is disseminated under the sponsorship of the U.S. Department of Transportation’s University Transportation Centers Program, in the interest of information exchange. The U.S. Government assumes no liability for the contents or use thereof.
4
TECHNICAL SUMMARY
Title Intercity Passenger Rail Productivity in the Northeast Corridor: Implications for the Future of High-Speed Rail
Author: Andrés Felipe Archila Téllez
Introduction The ongoing discussion about the future implementation of high-speed rail (HSR) in the Northeast Corridor (NEC) is full of questions on the feasibility of HSR and the ability of Amtrak to implement it. Indeed, the introduction of the Acela Express in the past decade was not free from operating problems, but even with trains running below their full potential, the Amtrak NEC had substantial market growth. Thus, it is not clear if a true HSR service is feasible in the NEC, and if the current prospects are potentially effective.
This report uses classical productivity analysis to consider the future potential of HSR in the NEC as further discussed below.
Approach and Methodology To evaluate the performance of the NEC and its main services in FY 2002-2012, and make inferences about HSR in the NEC for the next 30 years, we use productivity analysis. We employ a non-parametric single factor productivity (SFP) Törnqvist trans-log index approach with several metrics. We set ridership, revenue, revenue passenger-miles (RPM), and available seat-miles (ASM) as outputs, and operating costs as input. In this way, we provided guidelines and a robust structure of analysis that can be useful for subsequent passenger rail productivity studies.
Findings The findings of this research are described below:
• Productivity analyses are useful for assessing performance and determining the drivers of
performance in intercity passenger rail transportation, but the literature is sparse.

5
Productivity analyses allow managers and decision-makers to understand the behavior and the
drivers of productivity change in the NEC, and to better prepare or respond to potential
realizations of the future. In general, productivity improvements explain long-term
improvements in intercity passenger transportation. In the past, they have translated into benefits
to operators and users. For the future, they can reveal if a strategy is realistic or not, and even if a
strategy is preferred over another. However, the literature on passenger rail transportation
productivity is not extensive, is sparse, and the myriad of approaches to productivity analyses,
selected by various researchers, make it hard not only to comprehend, but also to compare results
across studies.
• Not only is the productivity literature sparse, but also has guidelines that are confusing,
sometimes contradictory, and rarely specific for transportation studies. Thus the following
(not exhaustive) guidelines for analyzing productivity and communicating results in intercity
passenger transportation may be useful for subsequent studies.
Reference explicitly and (where possible) jointly the output and input data categories, the
productivity metrics, and the method of a productivity analysis, in order to prevent confusion and
to understand if results are comparable across studies.
Select the output and input data categories, then the productivity metric(s), and finally the
method of productivity analysis.
DATA: Keep in mind that it is unclear exactly which are the outputs and inputs of a
transportation process (unlike in economic studies, where at least there is a consensus on GDP,
labor, and capital). For intercity passenger transportation, different outputs (not to be mistaken
for multiple outputs) coexist and have different meanings: Available Seat-Miles are a proxy for
transportation capacity, Revenue Passenger-Miles measure the ability to use the available
capacity, and Revenue measures the ability to economically exploit the capacity.
The inputs are even more ambiguous than the outputs. There are many possible input (or cost)
breakdowns, which, as with outputs, will give different meanings to the productivity metrics
derived. Previous analyses have used the economic approach to inputs (labor, capital) with an
additional category for fuel. The input breakdown is relevant when working with MFP and TFP,
but not when using SFP.
6
We encourage developing alternative outputs and/or inputs in order to measure the quality of the
service provided (LOS) and to account for the quality of the inputs. However, we recognize that
the data might not be readily available, as they do not correspond to incumbent managerial
reporting schemes.
Select physical outputs and inputs over monetary quantities where possible, but keep in mind
that they are harder to get. Deflate monetary quantities as detailed as possible.
METRICS: Do not use partial productivity interchangeably with SFP, and MFP with TFP.
Partial productivity is an arbitrary metric in multi-output multi-input or multi-output single-input
processes that necessarily excludes some outputs or inputs. SFP, instead, is a metric of a single-
output single-input process; MFP is used in single-output multi-input processes; and TFP is used
in multi-output multi-input processes. SFP, MFP, and TFP do not exclude (at least intentionally)
factors of production. Partial productivity does.
SFP is the preferred choice in single-output single-input processes and in multi-output multi-
input processes that can be unmistakably reduced to a single output single-input process. MFP
and TFP are definitively preferred over the (inappropriate) partial measures of productivity in
multi-output multi-input processes that cannot be unmistakably reduced to a single output single-
input process.
METHOD: Select the method to analyze productivity depending on the question of interest, the
type of data, the data availability, the computational resources, and additional context-specific
constraints. Robustness and computational easiness are desired attributes of a method of analysis.
Parametric methods are very powerful; they can provide detailed information on the drivers of
productivity change, but are data-intensive and computationally complex. Non-parametric
methods may sacrifice the amount of information they return, but are less data-intensive and
computationally friendlier than parametric methods.
Use complementary analysis, like reviewing historical events or using various productivity
metrics, to compensate for the disadvantages of a particular method.
Obtain the cumulative SFP by compounding year-to-year SFP instead of by directly computing
an inter-year SFP.

7
• In FY 2000-2012, there was substantial but not uniformly distributed ridership and revenue
growth for Amtrak. Currently, system-wide unprofitability and capacity constraints in the
NEC remain as two of the most pressing challenges that Amtrak faces.
Amtrak’s system-wide ridership and real ticket revenue grew 55% and 38%, respectively, in FY
2000-2012. Short and special routes became more profitable and utilized than longer routes. The
NEC contributed nearly half of Amtrak’s ridership. Even with HSR trains running below their
full potential, the NEC showed increasing revenue, ridership, operating profits, and air/rail
market shares. Similarly, the incremental ridership of the Acela Express proved to be highly
profitable, much more than that of the Northeast Regional and other services.
However, Amtrak still requires about $1.2 billion annually in governmental subsidies (to which
they respond that other modes are heavily subsidized as well). The NEC, the most heavily
utilized railway corridor of the U.S., is still facing capacity constraints, aging infrastructure, and
maintenance backlogs. Frequently, the political issues of the entire Amtrak system transfer to the
NEC and make it difficult for the NEC to be discussed independently.
• Route changes, technical problems with train sets, targeted capital investments, and
economic recession and recovery in the NEC translated into volatile, but considerable
productivity growth in FY 2002-2012.
The analysis of four distinct SFP metrics (i.e., ridership, revenue, revenue passenger-miles, and
available seat-miles SFP with respect to operating costs) through a non-parametric Törnqvist
trans-log index showed that the NEC had very volatile, but upward productivity growth in FY
2002-2012. Overall, the NEC was less productive by FY 2010 than in FY 2005, had substantial
productivity dips in FY 2006 and FY 2009 (-10% to -20%), but boosted its productivity in the
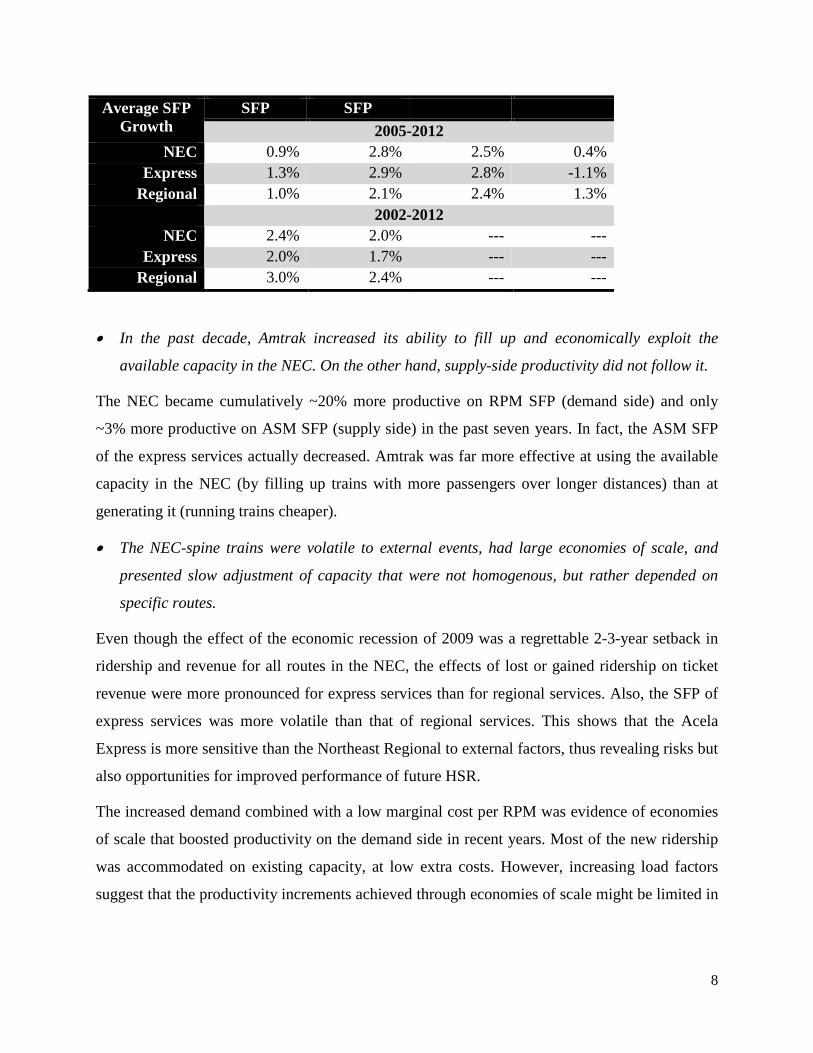
last three years (as high as 20% in one year). As shown in Table 5.1, the yearly average SFP
growth of the NEC was in the range of ~1-3%. Although results are not directly comparable with
previous studies of rail transportation in the U.S., the NEC experienced higher average
productivity improvements in FY 2002-2012 than the U.S. railroads (combined freight and
passenger outputs) in 1951-1974 (2.5% RPM SFP v. 1.5% [RPM & RTM] TFP) (Caves et al.
1980).
Table 5.1- Summary of NEC SFP Growth in FY 2002-2012
Yearly Ridership Revenue RPM SFP ASM SFP
8
Average SFP Growth
SFP SFP 2005-2012
NEC 0.9% 2.8% 2.5% 0.4% Express 1.3% 2.9% 2.8% -1.1%
Regional 1.0% 2.1% 2.4% 1.3% 2002-2012
NEC 2.4% 2.0% --- --- Express 2.0% 1.7% --- ---
Regional 3.0% 2.4% --- ---
• In the past decade, Amtrak increased its ability to fill up and economically exploit the
available capacity in the NEC. On the other hand, supply-side productivity did not follow it.
The NEC became cumulatively ~20% more productive on RPM SFP (demand side) and only
~3% more productive on ASM SFP (supply side) in the past seven years. In fact, the ASM SFP
of the express services actually decreased. Amtrak was far more effective at using the available
capacity in the NEC (by filling up trains with more passengers over longer distances) than at
generating it (running trains cheaper).
• The NEC-spine trains were volatile to external events, had large economies of scale, and
presented slow adjustment of capacity that were not homogenous, but rather depended on
specific routes.
Even though the effect of the economic recession of 2009 was a regrettable 2-3-year setback in
ridership and revenue for all routes in the NEC, the effects of lost or gained ridership on ticket
revenue were more pronounced for express services than for regional services. Also, the SFP of
express services was more volatile than that of regional services. This shows that the Acela
Express is more sensitive than the Northeast Regional to external factors, thus revealing risks but
also opportunities for improved performance of future HSR.
The increased demand combined with a low marginal cost per RPM was evidence of economies
of scale that boosted productivity on the demand side in recent years. Most of the new ridership
was accommodated on existing capacity, at low extra costs. However, increasing load factors
suggest that the productivity increments achieved through economies of scale might be limited in
9
the future unless the capacity of the corridor is enhanced. Such capacity enhancements remain an
unmet challenge for the NEC.
• NEC users are traveling longer distances by rail, and trains are becoming more competitive
in traditional short-haul air markets.
This is evidenced by the fact that cumulative RPM SFP exceeded ridership SFP over the last
decade, and also by the increased air/rail market share of Amtrak in the New York-Washington
and New York-Boston routes. In the Boston-Washington market, Amtrak is still not too
competitive with air travel.
• The ability to implement and operate HSR in the NEC is similar as the state of the regional
economy so far as productivity concerns go; however, the demand side productivity of the
NEC was more volatile with respect to external factors than the supply side.
The reestablishment of the Acela Express in FY 2006 reduced productivity more than the
economic recession of 2009, and ASM SFP only recovered after infrastructure investments in
recent years.
The economic dip of 2009 greatly affected the demand side of the NEC (RPM, ridership, and
revenue SFP) but had little influence on the productivity of the supply side (ASM SFP).
Ridership, revenue, and RPM SFP also increased at higher rates than ASM SFP in favorable
years.
Although the introduction of 40 additional Acela-Express coach cars to lengthen the train sets in
FY 2014 is promising (Amtrak 2011c), it might not increase ASM productivity if not
coordinated with infrastructure enhancements and modifications to maintenance facilities.
• The characteristics of the NEC reveal a potential for the successful introduction of a true
HSR service; however, determining a consensual implementation strategy is challenging but
mandatory to move forward effectively.
The extrapolation of the past productivity determined a ballpark estimate of what the
productivity in the future could be, and suggested drivers of productivity change that could help
sustain such productivity growth rates. Thus, productivity changes in the past suggested future
improvements in the NEC, potentially driven by well-known internal and external factors.

10
Now, although the geographic and socioeconomic characteristics of the NEC make it an ideal
candidate for HSR, it is a multi-stakeholder, multi-state, multi-purpose corridor under a funding-
constrained scenario and a polarized debate. So, current initiatives and studies attempt to find a
way to enhance the NEC, e.g., the NECMP (2010), the Amtrak Vision for HSR in the NEC
(2010, 2012), the multi-stakeholder effort NEC FUTURE (2012-present), and Sussman et al.
(2012a, 2012b).
However, most of the planning efforts are at the early stages of development. Alternatives are
still to be scoped, consensus to be reached, and significant choices made. For some critics,
substantial trip time reductions are scheduled to be realized too far in the future. Current
estimates of investments are highly variable. Alignments, services, and institutional
arrangements have not yet been determined. So, there is uncertainty in this long-term planning
and implementing process, but a common strategy among stakeholders is still needed to advance
HSR in the NEC effectively.
• Amtrak’s prospects for HSR in the NEC are realistic but perhaps not too ambitious. The NEC
VISION may be risky.
Our analysis of the NECMP of 2010 revealed that higher productivity levels could be expected,
and that the prospects for bringing the corridor to a state of good repair and accommodate some
capacity growth were feasible. However, such interventions will prevent the NEC from truly
deploying an international-quality HSR service, and there might be a greater potential for
increased productivity and services, which the NECMP did not consider.
Our analysis of the NEC VISION of 2012 showed that the performance on the NEC is still
sensitive to many factors, and the projected productivity levels are volatile and especially low at
the beginning of the proposed interventions. Thus, productivity benefits may take years to
realize. If the financial leverage is not there to temporarily support adverse events, or if the
market and managers take too much time to adapt to changing conditions, there might be reasons
to doubt on a successful implementation of HSR.
Also the NEC VISION is in some ways a bit unambitious, since the projected cumulative
productivity growth is low in comparison to the growth in the past decade (20--40% in the next
30 years v. 20% in the past 10 years). In addition, international comparisons of HSR in corridors

11
similar to the NEC suggest that Amtrak’s projections of ridership and revenue are reasonable,
but might be on the low side.
Conclusions After a process of data rationalization and scoping of the analysis at the route levels, we
demonstrated that a non-parametric SFP Törnqvist trans-log index with varying metrics was
useful to assess the productivity of the NEC-spine trains from FY 2002 to 2012. This structure of
analysis is first of its kind for intercity passenger rail transportation productivity in the U.S.,
which has never been studied in isolation before, or for the selected time period (to the best of
the author’s knowledge). Despite data constraints and inconsistencies, the analysis provided
robust results that could be associated to notable episodes of the past decade. It went on to
evaluate specific sets of routes and it overcame various limitations of parametric methods
through the use of multiple SFP metrics and year-to-year calculations. Within the limited
productivity literature for rail transportation in general, the analysis has provided a robust
platform for future productivity studies of passenger services. An immediate extension of this
method could be the analysis of other routes or sub-networks of Amtrak in the same time period.
The productivity analysis was useful to understand the system’s behavior. In general, the NEC
experienced volatile productivity changes in FY 2002-2012; by FY 2010 it was less productive
than in FY 2005, but in the last three years its productivity boosted. Several events provided
reasons for that varying productivity: route changes, technical problems with train sets, capital
investments in the NEC, and economic recession and recovery. The results suggested critical
characteristics of the NEC: volatility to external events, large economies of scale, and slow
adjustment of capacity. Such characteristics, however, were not homogenous and rather
depended on specific routes. For instance, the productivity of express services was more volatile
than that of regional services, thus showing a greater range of performance. In addition,
increasing ALF suggest that the productivity increments achieved through economies of scale
might be limited in the future unless the capacity of the corridor is enhanced. This is a worrisome
situation for a corridor that exhibits slow capacity adjustments and that not until 2015 will define
a clear capital investment strategy.
These results are useful in thinking about if and how to move forward with HSR in the NEC.
Express services proved to have a wide range of performance, thus revealing risks and
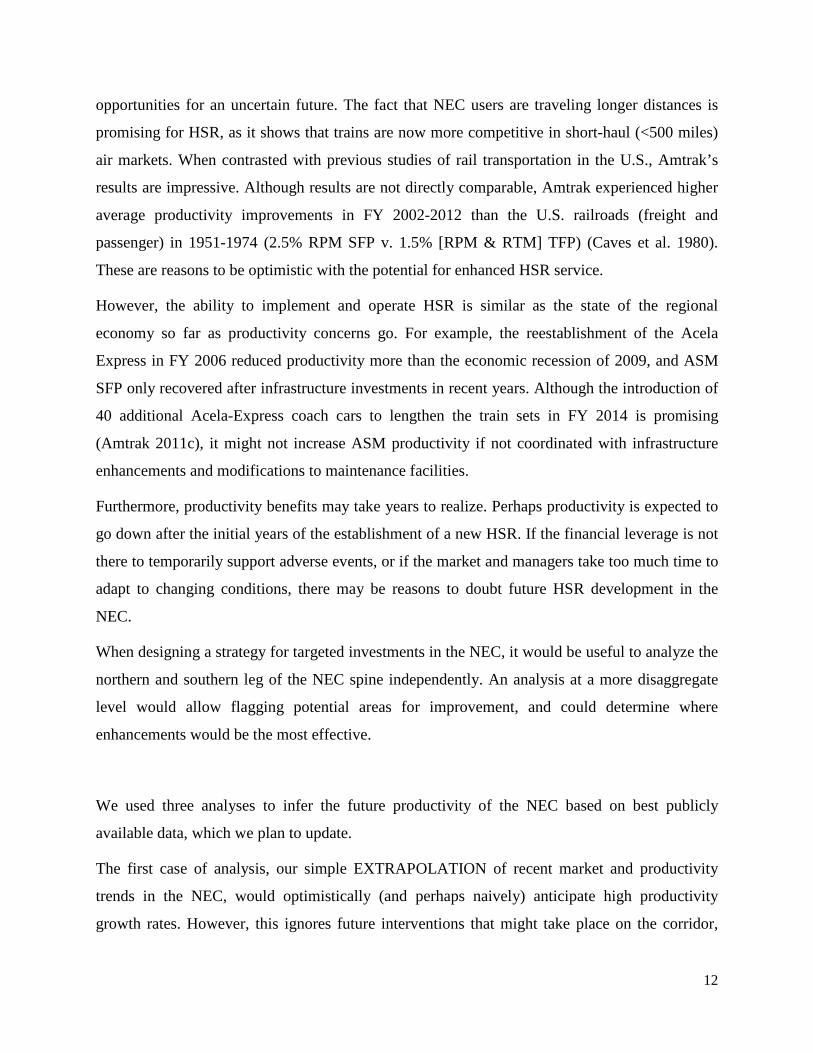
12
opportunities for an uncertain future. The fact that NEC users are traveling longer distances is
promising for HSR, as it shows that trains are now more competitive in short-haul (<500 miles)
air markets. When contrasted with previous studies of rail transportation in the U.S., Amtrak’s
results are impressive. Although results are not directly comparable, Amtrak experienced higher
average productivity improvements in FY 2002-2012 than the U.S. railroads (freight and
passenger) in 1951-1974 (2.5% RPM SFP v. 1.5% [RPM & RTM] TFP) (Caves et al. 1980).
These are reasons to be optimistic with the potential for enhanced HSR service.
However, the ability to implement and operate HSR is similar as the state of the regional
economy so far as productivity concerns go. For example, the reestablishment of the Acela
Express in FY 2006 reduced productivity more than the economic recession of 2009, and ASM
SFP only recovered after infrastructure investments in recent years. Although the introduction of
40 additional Acela-Express coach cars to lengthen the train sets in FY 2014 is promising
(Amtrak 2011c), it might not increase ASM productivity if not coordinated with infrastructure
enhancements and modifications to maintenance facilities.
Furthermore, productivity benefits may take years to realize. Perhaps productivity is expected to
go down after the initial years of the establishment of a new HSR. If the financial leverage is not
there to temporarily support adverse events, or if the market and managers take too much time to
adapt to changing conditions, there may be reasons to doubt future HSR development in the
NEC.
When designing a strategy for targeted investments in the NEC, it would be useful to analyze the
northern and southern leg of the NEC spine independently. An analysis at a more disaggregate
level would allow flagging potential areas for improvement, and could determine where
enhancements would be the most effective.
We used three analyses to infer the future productivity of the NEC based on best publicly
available data, which we plan to update.
The first case of analysis, our simple EXTRAPOLATION of recent market and productivity
trends in the NEC, would optimistically (and perhaps naively) anticipate high productivity
growth rates. However, this ignores future interventions that might take place on the corridor,

13
and neither Amtrak nor the author claims that these performance rates are to be obtained. So, the value
of the EXTRAPOLATION was in determining a ballpark estimate of what the productivity of in
the future could be, and in suggesting drivers of productivity change that could help sustain such
growth rates.
The second case of analysis, the qualitative analysis of the NECMP of 2010, revealed that while
higher productivity levels could be expected, they are limited by the conservative interventions
presented by the NECMP. Although the author is optimistic about the potential achievement of
the prospects described in the NECMP, such interventions will also prevent the NEC from truly
deploying an international-quality HSR service. As implied by the analysis, there might be a
greater potential for increased productivity and services in the NEC that the NECMP is not
exploiting.
Greater expectations for the corridor were in fact considered in the quantitative analysis of the
NEC VISION of 2012. The analysis showed that the performance on the NEC is still sensitive to
many factors, and that perhaps Amtrak’s vision is both risky and in some ways a bit unambitious.
On one hand, the projected productivity levels are volatile and especially low at the beginning of
the interventions. On the other hand, the projected cumulative productivity growth is low in
comparison to the growth in the past decade.
This reveals the need for an improved vision that both reduces risk and takes advantage of the
opportunities of the NEC. In fact, international comparisons of HSR in corridors similar to the
NEC suggest that Amtrak’s projections of ridership and revenue are reasonable, but might be on
the low side. An improved level of service in the NEC could attract more riders and bring
additional revenue. Air/rail cooperation and competition could be key in shaping a more
comprehensive vision for HSR in the NEC.
The results of the analysis in this chapter raised our confidence in the structure of analysis
developed earlier. On one hand, the expected SFP growth was within the ranges of what the NEC
has shown in the past, both in the cumulative and year-to-year values. The sensitivity analysis
also revealed that results are robust to changes in key assumptions regarding data generation and
uncertainty of forecasts. On the other hand, the interventions and market effects embedded in
Amtrak’s forecasts could reasonably explain future productivity growth. However, we think they
ignored external factors, managerial changes, and unplanned interventions that might affect

14
productivity in the future. Finally, comparisons of results across the cases of analyses were
difficult, and there were tradeoffs between qualitative and quantitative analyses: The qualitative
analysis allowed us to infer the behavior of several SFP metrics, but did not provide specific
values. In contrast, the quantitative analysis gave specific results, but restricted the analysis due
to lack of data to just two SFP metrics on the demand side of rail transportation: revenue SFP
and ridership SFP, both with respect to operating cost.
Naturally, there is room for major improvements in the analysis. The introduction of available
seat-miles SFP or any other metric on the supply side will allow us not only to understand the
supply side of the services, but also to understand the implications for profitability and further
growth when compared to the demand side. Additional cases of analysis could be included, e.g.,
cases with substantial ridership changes, or cases based upon the preliminary alternatives report
of the NEC FUTURE. Another improvement would be the development of a way to allocate
operating costs at the route level, which would permit a comparison of performance between
regional and express services, and perhaps the refinement of a strategy to mix those services.
Finally, more disaggregate data at the specific route-level or O-D-level, or additional information
on the way in which Amtrak made the forecasts (which might be available in the “NEC Business
and Financial Plan”), would allow a direct comparison between future and past productivity, and
expand the analysis of the future productivity of the NEC.
Recommendations
Recommendations for the Prospects of HSR in the NEC
Amtrak set forth a myriad of short-, medium-, and long-term goals and objectives to advance its
vision for HSR in the NEC. In addition, the ongoing NEC FUTURE planning process frequently
receives public input. Thus, there are some ways in which the current prospects for HSR in the
NEC could be enriched by the findings of this thesis, in order to reduce risk and to take
advantage of the opportunities of the corridor:
• The projections of ridership and revenue should be revised, given that they might be
underestimated. This is in line with Amtrak’s short-term (6-12 months) goal to “Further
refine and develop program alternatives as part of the capital expenditure re-profiling
efforts…” (Amtrak 2012).

15
• Air/rail cooperation and competition should be explicitly considered in shaping a more
comprehensive vision for HSR in the NEC. The FAA should be involved in the planning
process. This builds on Amtrak’s short-term goal to “Devise future market strategies and
coordinate with rail industry experts…” (Amtrak 2012).
• The effect of improved management practices within Amtrak and other stakeholders of
the NEC should be considered in the projections (in case it has not been considered
already). This is aligned with the medium-term (1-3 years) goal to: “Develop appropriate
program management capabilities and undertake staffing and resource assessments”
(Amtrak 2012).
• From a productivity perspective, priority should be given to stages of the implementation
that promise the highest productivity improvements. More concretely, efforts to
accelerate the Gateway Program or to develop an alternative project that achieves such
benefits should be included. This is in line with Amtrak’s medium-term goal to: “Define
and advance “pathway” projects to gain early support and momentum” (Amtrak 2012).
• The productivity of the NEC is quite sensitive to multiple factors, including large,
unexpected regional events that were not explicitly considered in Amtrak’s forecasts.
Also, there is uncertainty related to political support, external events, or funding for HSR.
These are strong arguments for a scenario-planning approach (see Schwartz 1996) and
the design of flexibility in the proposed investment alternatives, which might be useful to
be better prepared to unexpected (good or bad) circumstances (see Sussman et al. 2012a).
For example, new policies could favor governmental funding of HSR over air
infrastructure funding. Under appropriate economic conditions, express services should
be expanded much more than regional services. This is in line with Amtrak’s long-term
(3-10 years) goal to “Review ongoing changes that may be needed in the structure of
Amtrak and the current phased implementation strategy to effectively deliver the
program” (Amtrak 2012).

16
Publications
Additional publications:
Amtrak’s Productivity in the Northeast Corridor: Past and Future (attached) Andres F. Archila and Joseph M. Sussman
Productivity Of Passenger Rail Transportation Services In The Northeast Corridor (TRB, 2014) Andres-Felipe Archila, Ryusuke Sakamoto, Rebecca Cassler Fearing, and Joseph M. Sussman

17
Primary Contact Professor Joseph M. Sussman [email protected] (617) 253-4430 Principal Investigators Names: Andrés Felipe Archila Téllez, Joseph M. Sussman
Title: Intercity Passenger Rail Productivity in the Northeast Corridor: Implications for the Future of High-Speed Rail Department: Civil and Environmental Engineering
University: Massachusetts Institute of Technology
Andrés Felipe Archila Téllez [email protected] (617) 690-9570 Joseph M. Sussman [email protected] (617) 253-4430 Other Faculty and Students Involved
Name: Professor Joseph M. Sussman Title: JR East Professor of Civil and Environmental Engineering and Engineering Systems
Department: Civil and Environmental Engineering
University: Massachusetts Institute of Technology [email protected] (617) 253-4430 NURail Center 217-244-4999 [email protected] http://www.nurailcenter.org/

18
Intercity Passenger Rail Productivity in the Northeast Corridor:
Implications for the Future of High-Speed Rail
by
Andrés Felipe Archila Téllez
B. S. Mechanical Engineering, Universidad de los Andes, Colombia (2009)
Submitted to the Department of Civil and Environmental Engineering in partial fulfillment of the requirements for the degree of
MASTER OF SCIENCE IN TRANSPORTATION
at the
MASSACHUSETTS INSTITUTE OF TECHNOLOGY
June 2013
© Massachusetts Institute of Technology 2013. All rights reserved.
Signature of Author .………………………………………………………………………………..
Department of Civil and Environmental Engineering
February 10, 2016
Certified by ……………………………...…………………………………………………………
Joseph M. Sussman
JR East Professor of Civil and Environmental Engineering and Engineering Systems
Thesis Supervisor
Accepted by ………………………………………………………………………………………..
Heidi M. Nepf
Chair, Departmental Committee for Graduate Students

19


21
Intercity Passenger Rail Productivity in the Northeast Corridor:
Implications for the Future of High-Speed Rail
by
Andrés Felipe Archila Téllez
Submitted to the Department of Civil and Environmental Engineering on February 10, 2016, in
partial fulfillment of the requirements for the degree of Master of Science in Transportation
Abstract
The ongoing discussion about the future implementation of high-speed rail (HSR) in the Northeast Corridor (NEC) is full of questions on the feasibility of HSR and the ability of Amtrak to implement it. Indeed, the introduction of the Acela Express in the past decade was not free from operating problems, but even with trains running below their full potential, the Amtrak NEC had substantial market growth. Thus, it is not clear if a true HSR service is feasible in the NEC, and if the current prospects are potentially effective.
To evaluate the performance of the NEC and its main services in FY 2002-2012, and make inferences about HSR in the NEC for the next 30 years, we use productivity analysis. We employ a non-parametric single factor productivity (SFP) Törnqvist trans-log index approach with several metrics. We set ridership, revenue, revenue passenger-miles (RPM), and available seat-miles (ASM) as outputs, and operating costs as input. In this way, we provided guidelines and a robust structure of analysis that can be useful for subsequent passenger rail productivity studies.
We find that the NEC experienced highly volatile, but considerable productivity growth in FY 2002-2012 (in the range of ~1-3% per year). Amtrak increased its ability to fill up and economically exploit the available capacity, but did not perform equally well on the supply side. Service changes, technical problems with train sets, targeted capital investments, and economic recession and recovery were the main drivers of productivity change. The Acela Express and Northeast Regional were very sensitive to external events, had large economies of scale, and implemented slow adjustment of capacity via rolling stock and infrastructure improvements, which varied depending on the service.
The characteristics of the NEC reveal a potential for a successful introduction of HSR, but although Amtrak’s Vision for HSR in the NEC is realistic (in terms of productivity), it is risky and perhaps the time scale is not ambitious enough. We recommend revising the current projections, incorporate additional planning approaches, accelerate key stages of the Vision and include the FAA in the planning process.
Thesis Supervisor: Joseph M. Sussman
Title: JR East Professor of Civil and Environmental Engineering and Engineering Systems


23
Acknowledgments
I would like to thank as briefly as I can those who made this thesis possible and also those who made my stay at MIT for the past two years a life-changing experience. I hope I didn’t miss anyone, and if I did, I hope you forgive me. I’m sure I will thank you personally when the opportunity comes.
Thank you, above all, Joe Sussman!
I like happy stories. On August 31, 2011, the day before Orientation Day, I got my first email from Professor Sussman with the subject “Possible position” and the message “There is a possibility for research support in my group. When can you come to see me to discuss this?” Suffice to say that we scheduled a meeting on very short notice, and I came running down the hall of Building 1 just a minute before the scheduled meeting time. His assistant pointed at him behind me, and the first thing he told me was “I saw somebody running down the hall just now and I thought ‘Gee, that must be him!’… I admire your speed.” After writing a statement from our meeting notes on that evening, Professor Sussman wrote to me next morning: "Nice paper with some good ideas. I invite you to join my HSR/ Regions group as a research assistant and hope you will accept". These words will be engraved in my mind forever.
Professor Sussman, you not only gave me the chance of a lifetime with my RA and TA appointments –for which I am immensely and eternally grateful—but, most importantly, your generosity, kindness, humility, intelligence, guidance, open-minded vision, and, yes, patience made this a life-changing experience for me in many dimensions.
I learned so much from Joe as an academic as well as from Joe as a person. He showed me many times the importance of values, which I never expected to learn when I daydreamt of coming to MIT. I am profoundly happy and honored to consider myself his friend and to have him as a mentor. Joe, you are a role model for me and one of my personal heroes. Gracias.
In addition, thank you, Becky Fearing, for your guidance in the productivity project; the sponsors of our research, the Speedwell Foundation and Shelter Hill Foundation; Amtrak officials Petra Todorovich Messick and Stephen Gardner for providing data for this research; and MIT freshman Zhengli Wang for his research support.
Thank you, members of our research group, especially our “darling”, Naomi Stein; my “twin”, Joel Carlson; and our tireless Maite Peña-Alcaraz, with whom I had the honor of sharing most of the past 21 months. Thank you as well, Ryan Westrom (another mentor), Ryusuke Sakamoto, Regina Clewlow, Soshi Kawakami, Iori Mori, Guineng Chen, Heather Jones, Luis Caetano, Taede Tillema, and José Linares.
Special thanks to my favorite lecturers, George Kocur, Richard de Neufville, Fred Salvucci, and again Joe Sussman, for inspiring talks that made my eyes shine, my brain work, and my creativity exploit.
Thank you, Carl Martland, Rebecca Heywood, and my 16 brilliant students of 1.011, spring 2012.

24
Thank you, 1-151, a communicative, entertaining, and multicultural office on MIT campus: Carlos Herrera, Serdar Colak, Jameson Toole, Kanchana Nanduri, Laura Viña, Carter Wang, and other guests I have mentioned before or accidentally forgot to mention now. (Figure 0.1 shows what I mean).
Figure 0.1 – The Community of 1-151 in Academic Year 2012-2013
Thank you, CEE staff, for the wonderful work you do: Kris Kipp, Nancy Cook, Christine Blackett, Jeanette Marchocki, Mira Parsons, Denise Brehm, Patricia Glidden, Kiley Clapper, Ginny Siggia, and many more. The department could not be run without you.
Thank you, members of the Colombian Association of MIT, for allowing me to be your President. To some extent you are a micro cosmos of Colombia.
Thank you, Carolina Osorio and Édgar Blanco, superb Colombian ambassadors to MIT, and Ralph Gakenheimer, honorary colombianista.
Thank you, TSG, T-club, other classmates, and friends, in particular, Diego Vargas, old high-school classmate who became my roommate, best friend, and confident in Cambridge. You are a role model.
Thank you, MIT.
Last, but certainly not least, thank you to my dear loving family and close friends. To my parents, César and Clemencia, for always allowing me to be what I wanted to be; and to my siblings, Francisco, Mónica and Santiago, for always believing in me with open criticism. You are my cornerstone.
This work is in memory of Alejandro Llano and Andrés Corredor, two beloved high-school friends who passed away in Bogotá, Colombia, during my time here at MIT.

25
Table of Contents Abstract ...................................................................................................................................................... 21
Acknowledgments ..................................................................................................................................... 23
List of Figures ............................................................................................................................................ 29
List of Tables, Equations, and Boxes....................................................................................................... 31
List of Acronyms and Abbreviations ...................................................................................................... 33
Introduction ............................................................................................................................................... 35
Chapter 1. Productivity Review ............................................................................................................... 37
1.1. Introduction ..................................................................................................................................... 37
1.2. Basic Concept ................................................................................................................................. 37
1.3. Productivity Metrics ........................................................................................................................ 38
1.3.1. Single Factor Productivity (SFP) ............................................................................................ 38
1.3.2. Multi Factor Productivity (MFP) and Total Factor Productivity (TFP) .................................. 39
1.3.3. Partial Productivity ................................................................................................................. 40
1.4. Methods for MFP/TFP .................................................................................................................... 40
1.4.1. Non-parametric Approaches ................................................................................................... 41
1.4.2. Parametric Approaches ........................................................................................................... 43
1.5. Data Requirements .......................................................................................................................... 43
1.6. Productivity in Passenger Rail Transportation ................................................................................ 44
1.6.1. Review of Studies of Productivity in Passenger Rail Transportation ..................................... 45
1.6.2. Outputs .................................................................................................................................... 46
1.6.3. Inputs ....................................................................................................................................... 46
1.6.4. Partial Productivity in Rail Transportation ............................................................................. 46
1.6.5. Factors that Influence Productivity in Passenger Rail Transportation .................................... 47
1.6.6. Limitations of Past Studies on Rail Transportation ................................................................ 47
1.6.7. Implications for the Study of HSR .......................................................................................... 48

26
1.7. Chapter Conclusion ......................................................................................................................... 49
1.8. Chapter References ......................................................................................................................... 51
Chapter 2. The Amtrak NEC Review ..................................................................................................... 53
2.1. Introduction ..................................................................................................................................... 53
2.2. The Northeast Megaregion.............................................................................................................. 53
2.3. Amtrak ............................................................................................................................................ 53
2.3.1. Outputs: Ridership, Revenue, Profit ....................................................................................... 54
2.3.1.1. Ridership ......................................................................................................................... 55
2.3.1.2. Revenue ........................................................................................................................... 56
2.3.1.3. Profit ............................................................................................................................... 57
2.4. The Amtrak Northeast Corridor (NEC) .......................................................................................... 59
2.4.1. NEC Infrastructure and Ownership ......................................................................................... 59
2.4.2. NEC Operations and Services ................................................................................................. 60
2.4.3. NEC Performance ................................................................................................................... 62
2.5. High-Speed Rail Experience in the NEC ........................................................................................ 64
2.5.1. A Note on the Definition of HSR ............................................................................................ 64
2.5.2. Prospects for HSR in the NEC ................................................................................................ 66
2.5.2.1. The NEC Master Plan ..................................................................................................... 66
2.5.2.2. Amtrak’s Vision for HSR in the Northeast Corridor ...................................................... 67
2.5.2.3. NEC FUTURE ................................................................................................................ 69
2.5.2.4. Alternative Approach to HSR in the US ......................................................................... 70
2.6. Chapter Conclusion ......................................................................................................................... 71
2.7. Chapter References ......................................................................................................................... 73
Chapter 3. Past Productivity in the NEC ................................................................................................ 75
3.1. Introduction ..................................................................................................................................... 75
3.2. Data, Scope, and Method of Analysis ............................................................................................. 75
3.2.1. Sources of Data ....................................................................................................................... 75

27
3.2.2. Output and Input Data ............................................................................................................. 76
3.2.3. Route Definitions .................................................................................................................... 77
3.2.4. Method of Analysis ................................................................................................................. 79
3.3. Past Productivity in the NEC .......................................................................................................... 82
3.3.1. Context of the Past Decade in the NEC 2002-2012 ................................................................ 82
3.3.2. SFP Analysis ........................................................................................................................... 84
3.3.2.1. Usage and Capacity ......................................................................................................... 84
3.3.2.2. Route Comparisons ......................................................................................................... 87
3.3.3. Sensitivity Analysis................................................................................................................. 88
3.4. Chapter Conclusion ......................................................................................................................... 88
3.5. Chapter References ......................................................................................................................... 91
Chapter 4. Future Productivity in the NEC ........................................................................................... 93
4.1. Introduction ..................................................................................................................................... 93
4.2. Cases of Analyses ........................................................................................................................... 93
4.3. First Case: EXTRAPOLATION 2012-2030 ................................................................................... 94
4.4. Second Case: NECMP 2010-2030 .................................................................................................. 97
4.5. Third Case: NEC VISION 2013-2040 ............................................................................................ 99
4.5.1. Data for the NEC VISION 2013-2040 .................................................................................... 99
4.5.1.1. Output and Input Data ..................................................................................................... 99
4.5.1.2. Scope and Limitations ................................................................................................... 100
4.5.1.3. Characterization of the NEC VISION........................................................................... 101
4.5.2. SFP Analysis of the NEC VISION ....................................................................................... 103
4.5.2.1. Projected SFP ................................................................................................................ 103
4.5.2.2. Drivers of Future Productivity ...................................................................................... 105
4.5.3. Comments on Amtrak’s Projections ..................................................................................... 106
4.5.3.1. Competition ................................................................................................................... 106
4.5.3.2. Underestimation of Projections ..................................................................................... 107

28
4.5.3.3. HSR International Comparisons ................................................................................... 107
4.5.3.4. Risks and Opportunities ................................................................................................ 109
4.5.4. Sensitivity Analyses of the NEC VISION ............................................................................ 110
4.5.4.1. Sensitivity to Assumptions Regarding Data Generation ............................................... 110
4.5.4.2. Sensitivity to Uncertainty of Forecasts ......................................................................... 114
4.6. Chapter Conclusion ....................................................................................................................... 117
4.7. Chapter References ....................................................................................................................... 119
Chapter 5. Summary and Conclusion ................................................................................................... 121
5.1. Summary ....................................................................................................................................... 121
5.2. Findings......................................................................................................................................... 122
5.3. Recommendations for the Prospects of HSR in the NEC ............................................................. 128
5.4. Contributions ................................................................................................................................. 130
5.5. Future Research ............................................................................................................................ 131
5.6. Chapter References ....................................................................................................................... 133
Appendix A: NEC Data FY 2002-2012 ................................................................................................. 135
Appendix B: Additional NEC SFP Figures and Tables FY 2002-2012 .............................................. 161
Appendix C: Future Data NEC VISION 2013-2040 ............................................................................ 165
Appendix D: Baseline Figures NEC VISION ....................................................................................... 167

29
List of Figures Figure 1.1 - Categories of Productivity Metrics.......................................................................................... 39
Figure 2.1- Ridership FY 2000- 2012 (Adapted from Amtrak 2011a, 2011b, 2009-2012) ........................ 55
Figure 2.2- Ticket Revenue FY 2000- 2012 (2012 USD) (Adapted from Amtrak 2011a, 2011b, 2009-
2012) ........................................................................................................................................................... 56
Figure 2.3- NEC Ownership and Operations (NEC MPWG 2010) ............................................................ 60
Figure 2.4- Projected Ridership NECMP and Vision 2010 (Amtrak 2010) ............................................... 67
Figure 2.5- NEC Capital Investment Program (Amtrak 2012) ................................................................... 68
Figure 2.6- Initial Alternatives Networks for NEC Spine and Connecting Corridors (NEC FUTURE
2013b) ......................................................................................................................................................... 70
Figure 3.1- NEC Ridership Breakdown FY 2002-2012 (Adapted from Amtrak 2003-2012) .................... 82
Figure 3.2- NEC Ticket Revenue Breakdown FY 2002-2012 (Adapted from Amtrak 2003-2012) ........... 83
Figure 3.3- NEC, Cumulative SFP Growth FY 2002-2012 ........................................................................ 86
Figure 3.4- a) Express and b) Cumulative SFP Growth FY 2002-2012 .................................................... 87
Figure 4.1- EXTRAPOLATION, Year-to-Year SFP Growth FY 2005-2012 and 2013-2030 ................... 95
Figure 4.2- EXTRAPOLATION, Cumulative SFP Growth FY 2005-2012 and 2013-2030 ...................... 96
Figure 4.3- Characterization of the NEC VISION 2013-2040 ................................................................. 102
Figure 4.4- NEC VISION, Year-to-Year SFP Growth FY 2002-2012 and 2013-2040 ............................ 103
Figure 4.5- NEC VISION, Cumulative SFP Growth FY 2002-2012 and 2013-2040 .............................. 104
Figure 4.6- a) Alternative Characterization of the NEC VISION 2013-2040 b) Base Case Characterization
.................................................................................................................................................................. 112
Figure 4.7- a) Alternative NEC VISION, Year-to-Year SFP Growth FY 2002-2012 and 2013-2040 b)
Base Case .................................................................................................................................................. 113
Figure 4.8- Alternative NEC VISION, Cumulative SFP Growth FY 2002-2012 and 2013-2040............ 114

31
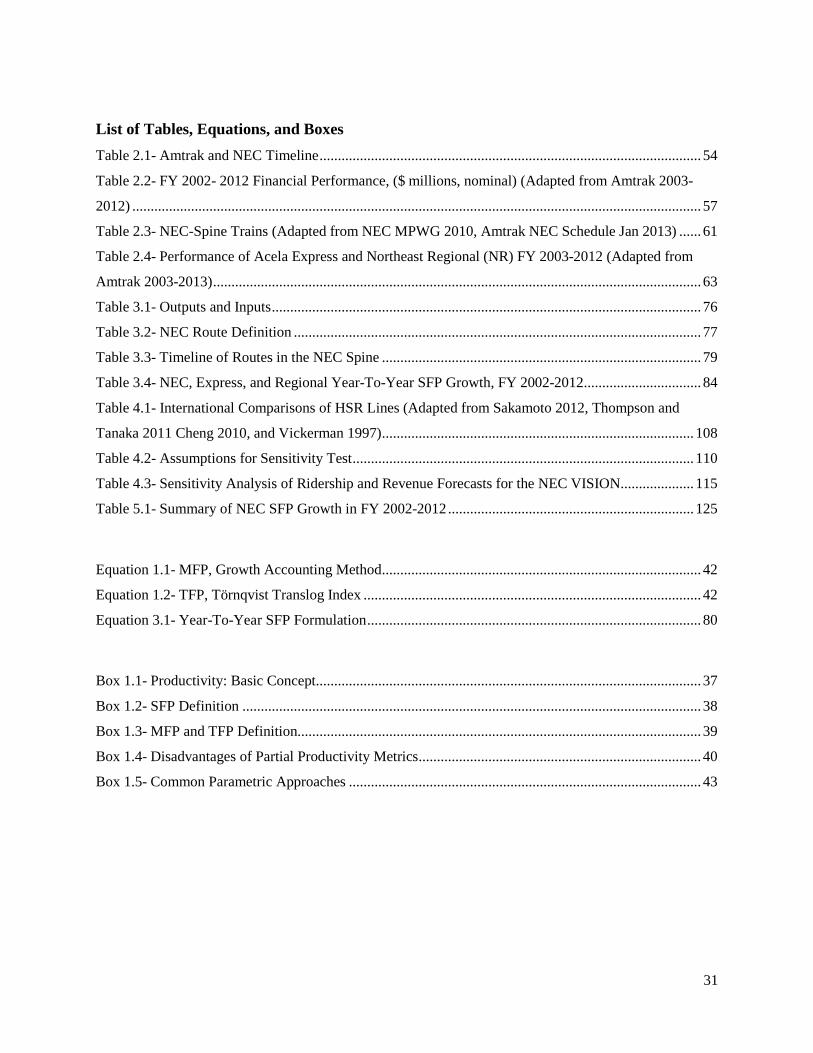
List of Tables, Equations, and Boxes Table 2.1- Amtrak and NEC Timeline ........................................................................................................ 54
Table 2.2- FY 2002- 2012 Financial Performance, ($ millions, nominal) (Adapted from Amtrak 2003-
2012) ........................................................................................................................................................... 57
Table 2.3- NEC-Spine Trains (Adapted from NEC MPWG 2010, Amtrak NEC Schedule Jan 2013) ...... 61
Table 2.4- Performance of Acela Express and Northeast Regional (NR) FY 2003-2012 (Adapted from
Amtrak 2003-2013) ..................................................................................................................................... 63
Table 3.1- Outputs and Inputs ..................................................................................................................... 76
Table 3.2- NEC Route Definition ............................................................................................................... 77
Table 3.3- Timeline of Routes in the NEC Spine ....................................................................................... 79
Table 3.4- NEC, Express, and Regional Year-To-Year SFP Growth, FY 2002-2012 ................................ 84
Table 4.1- International Comparisons of HSR Lines (Adapted from Sakamoto 2012, Thompson and
Tanaka 2011 Cheng 2010, and Vickerman 1997) ..................................................................................... 108
Table 4.2- Assumptions for Sensitivity Test ............................................................................................. 110
Table 4.3- Sensitivity Analysis of Ridership and Revenue Forecasts for the NEC VISION.................... 115
Table 5.1- Summary of NEC SFP Growth in FY 2002-2012 ................................................................... 125
Equation 1.1- MFP, Growth Accounting Method ....................................................................................... 42
Equation 1.2- TFP, Törnqvist Translog Index ............................................................................................ 42
Equation 3.1- Year-To-Year SFP Formulation ........................................................................................... 80
Box 1.1- Productivity: Basic Concept ......................................................................................................... 37
Box 1.2- SFP Definition ............................................................................................................................. 38
Box 1.3- MFP and TFP Definition.............................................................................................................. 39
Box 1.4- Disadvantages of Partial Productivity Metrics ............................................................................. 40
Box 1.5- Common Parametric Approaches ................................................................................................ 43

33
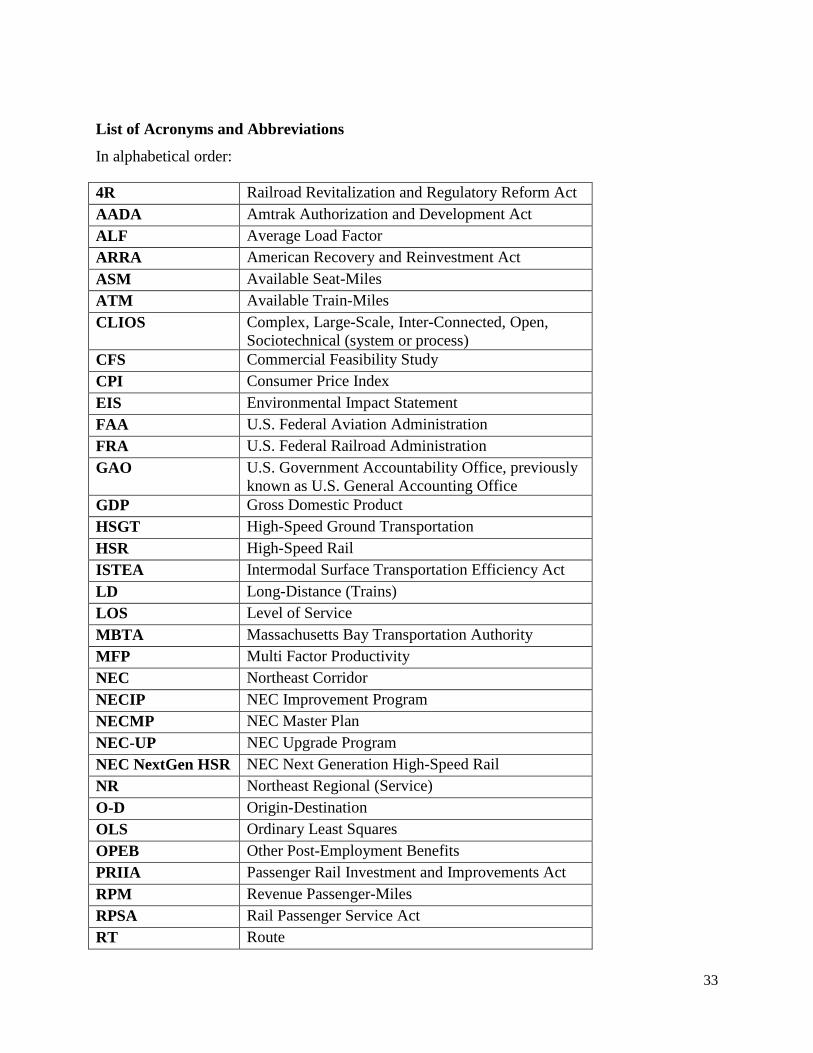
List of Acronyms and Abbreviations
In alphabetical order:
4R Railroad Revitalization and Regulatory Reform Act AADA Amtrak Authorization and Development Act ALF Average Load Factor ARRA American Recovery and Reinvestment Act ASM Available Seat-Miles ATM Available Train-Miles CLIOS Complex, Large-Scale, Inter-Connected, Open,
Sociotechnical (system or process) CFS Commercial Feasibility Study CPI Consumer Price Index EIS Environmental Impact Statement FAA U.S. Federal Aviation Administration FRA U.S. Federal Railroad Administration GAO U.S. Government Accountability Office, previously
known as U.S. General Accounting Office GDP Gross Domestic Product HSGT High-Speed Ground Transportation HSR High-Speed Rail ISTEA Intermodal Surface Transportation Efficiency Act LD Long-Distance (Trains) LOS Level of Service MBTA Massachusetts Bay Transportation Authority MFP Multi Factor Productivity NEC Northeast Corridor NECIP NEC Improvement Program NECMP NEC Master Plan NEC-UP NEC Upgrade Program NEC NextGen HSR NEC Next Generation High-Speed Rail NR Northeast Regional (Service) O-D Origin-Destination OLS Ordinary Least Squares OPEB Other Post-Employment Benefits PRIIA Passenger Rail Investment and Improvements Act RPM Revenue Passenger-Miles RPSA Rail Passenger Service Act RT Route

34
RTM Revenue Train-Miles SD Short-Distance (Trains) SDP Service Development Plan SFP Single Factor Productivity TFP Total Factor Productivity

35
Introduction
The Northeast Corridor (NEC) of the United States is the most densely settled region and the
economic engine of the country. It has been plagued for decades with congestion on its intercity
transportation system, and the expected population growth will most likely make worse this
situation. Within this context, enhanced high-speed rail (HSR) service seems like a promising
solution for improving mobility in the future, since it is suitable for the physical and economic
characteristic of the NEC. Thus, the Obama administration’s effort to prioritize HSR nationally
was recently echoed by new plans and studies that look for ways to implement HSR in the NEC.
But, multiple stakeholders and uses, aging infrastructure, the need for substantial capital
expenditures, and the lack of trust in Amtrak’s ability to manage the corridor pose complex
upgrading challenges.
In informing if and how HSR could be implemented in the NEC, it is key to review the recent
performance of the corridor and the implications for the future. This thesis uses productivity, a
concept widely used in economic studies but not so much in passenger rail transportation, to
assess the past performance of the NEC and make inferences on future HSR developments. The
goal is to highlight characteristics of the corridor, identify drivers of productivity growth, and
make recommendations for the ongoing planning processes.
This thesis is organized as follows:
• Chapter 1 discusses the concept, the metrics, and the methods of productivity
measurement, followed by a review of previous productivity studies in rail transportation,
and a discussion of the implications for the research on productivity of intercity
passenger rail transportation.
• Chapter 2 reviews the history and performance of Amtrak, the passenger rail
transportation system of the Northeast Corridor (NEC) of the U.S., and its high-speed rail
(HSR) prospects for the next decades.
• Chapter 3 lays out a structure to study productivity of passenger rail in the NEC,
followed by an analysis of the productivity of the NEC-spine trains from FY 2002 to
2012

36
• Chapter 4 uses the structure of analysis and findings of Chapter 3 to make inferences on
the productivity of future HSR developments in the NEC as described in Chapter 2.
• Chapter 5 summarizes key research findings and contributions, reflects on the
recommended ways to move forward for HSR implementation in the NEC, and suggests
potential areas of future research.

37
1. Productivity Review
1.1. Introduction
This chapter discusses the concept, metrics, and methods of productivity measurement drawing
on the extensive subject literature. Then it reviews previous productivity studies in rail
transportation. Finally it discusses the implications for the research on productivity of intercity
passenger rail transportation.
1.2. Basic Concept
Productivity is a way of evaluating the performance of a country, industry, firm, system or
process. At the most fundamental level, it is simply the relationship between outputs and inputs
(Coelli et al 2005, Solow 1957).
Box 1.1- Productivity: Basic Concept
𝑃𝑃𝑃𝑃𝑃𝑃𝑃𝑃𝑃𝑃𝑃𝑃 =𝑂𝑃𝑃𝑂𝑃𝑃𝑂𝐼𝐼𝑂𝑃𝑃𝑂
Because productivity is a derived metric instead of a direct measured quantity, there are three
basic ways of improving productivity:
- By producing the same outputs with fewer inputs
- By producing more outputs with the same inputs
- A combination of the two approaches
Increments in productivity are caused by drivers of productivity growth, which may be multiple
and seldom self-evident. On one hand, there might be ‘true’ shifts of the production function
caused by technological change (new technology), organizational change (changes in the process
or managerial skills), or externalities (economic conditions, industry conditions). But on the
other hand there might be effects due to non-technological progress like adjustment costs,
economies of scale, cyclical effects, or pure changes in efficiency and measurement errors
(OECD 2001, Coelli et al 2005, Oum et al 1992, Solow 1957).

38
Productivity is used to compare performance of processes, systems, firms, industries, regions or
countries with respect to each other and over time. Applications include, for example, the
comparison of the productivity of two railroads in one year, or the assessment of the productivity
of the US railroad industry over time.
Productivity improvements are of importance to the economy. Economic growth, interpreted as
the output of the economy, can be increased by either increasing input quantities or by improving
productivity. Given that input quantities have well-known physical limits but innovation does
not, long-term economic growth is achieved by productivity improvements rather than by surges
in input quantities. Thus, productivity may be used to trace technological change or to assess the
standard of living (OECD 2001, Solow 1957).
1.3. Productivity Metrics
Depending on the number of inputs and outputs, productivity metrics can be categorized as
Single Factor Productivity (SFP), Partial Productivity, Multi Factor Productivity (MFP) and
Total Factor Productivity (TFP). As will be shown later in Section 1.4 (Methods for MFP/TFP),
the conceptual differences between these metrics are clear, but their empirical application is
heavily dependent on the method of analysis.
1.3.1. Single Factor Productivity (SFP)
The concept of single Factor Productivity (SFP) is intuitive for a single-input single-output
process:
Box 1.2- SFP Definition
- Single Factor Productivity (SFP): A one-to-one relationship defined as the ratio of the
single output to the single input of a process.
The treatment of this metric is mostly unrestricted. It ranges from plots and tables of SFP,
adjusted for inflation, that analyze the evolution of a process over time, to comparisons of
different firms with the same kinds of output and input at one point in time.
39
The normalization of SFP with respect to the productivity on a base year, or the calculation of
the changes in productivity from year to year, allows the comparison of productivity gains of
single-input single-output firms producing a different output.
The general methods to be described in section 1.4: Methods for MFP/TFP can be simplified and
extended to SFP in the case of single-output single-input processes.
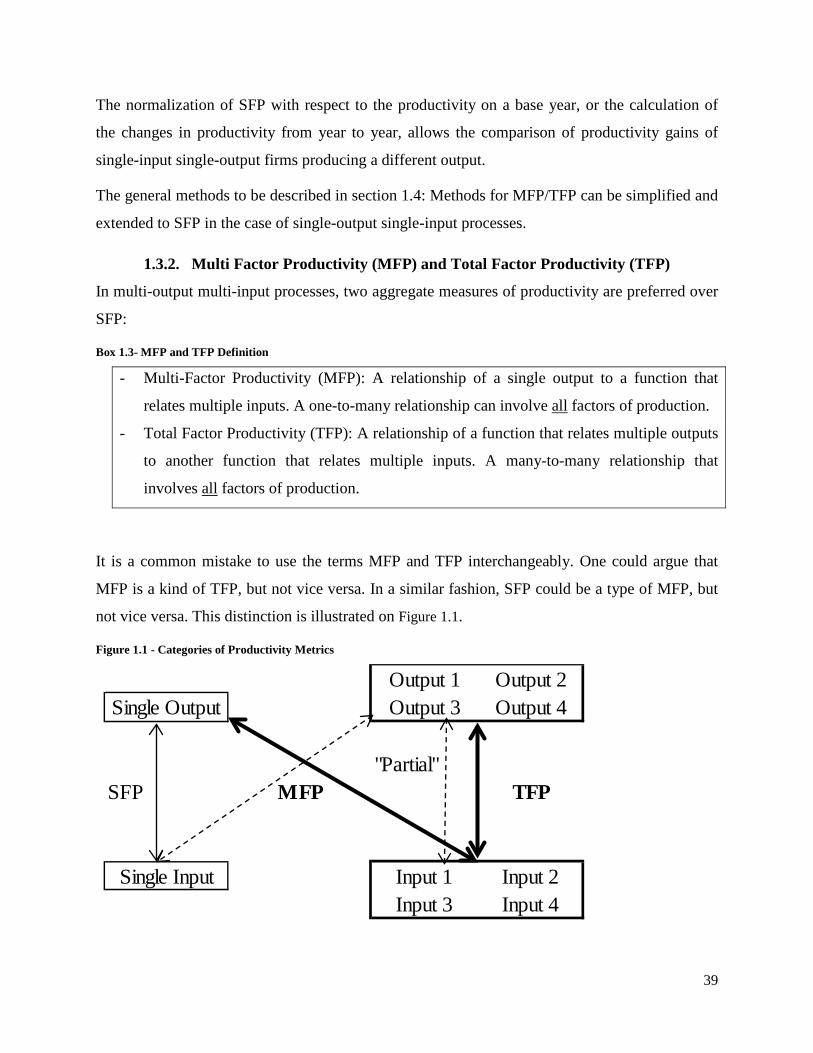
1.3.2. Multi Factor Productivity (MFP) and Total Factor Productivity (TFP)
In multi-output multi-input processes, two aggregate measures of productivity are preferred over
SFP:
Box 1.3- MFP and TFP Definition
- Multi-Factor Productivity (MFP): A relationship of a single output to a function that
relates multiple inputs. A one-to-many relationship can involve all factors of production.
- Total Factor Productivity (TFP): A relationship of a function that relates multiple outputs
to another function that relates multiple inputs. A many-to-many relationship that
involves all factors of production.
It is a common mistake to use the terms MFP and TFP interchangeably. One could argue that
MFP is a kind of TFP, but not vice versa. In a similar fashion, SFP could be a type of MFP, but
not vice versa. This distinction is illustrated on Figure 1.1.
Figure 1.1 - Categories of Productivity Metrics
Output 1 Output 2Single Output Output 3 Output 4
"Partial"SFP MFP TFP
Single Input Input 1 Input 2Input 3 Input 4
40
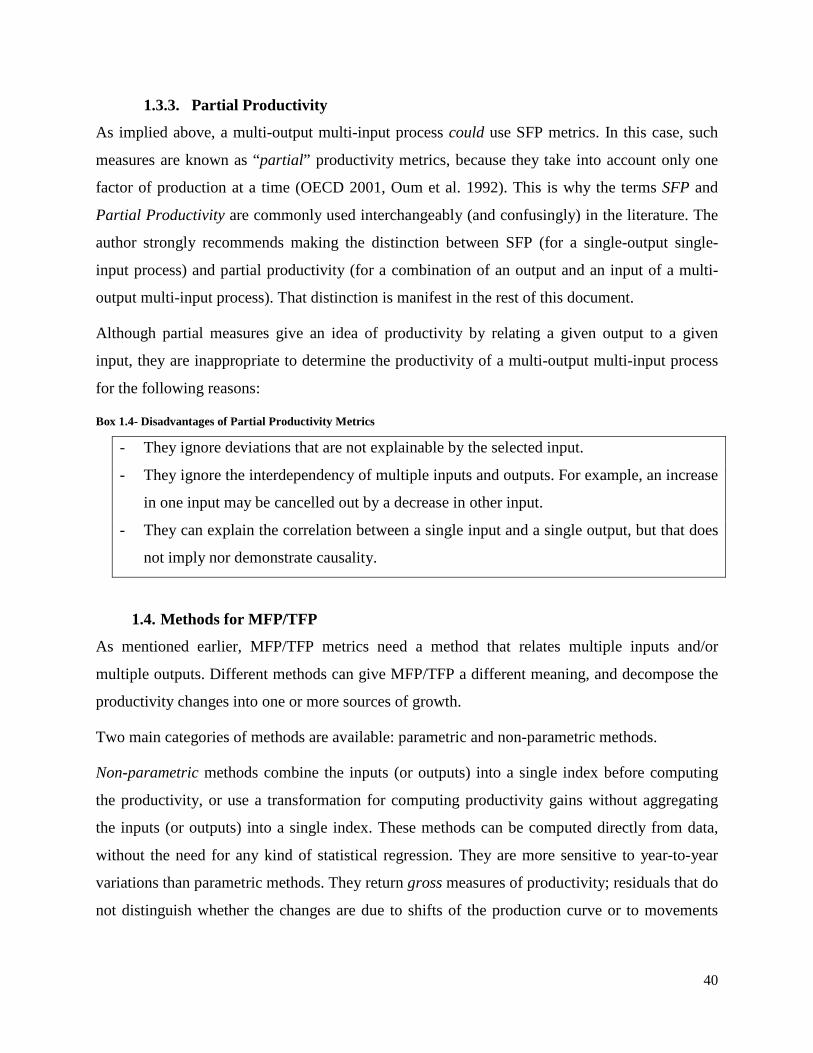
1.3.3. Partial Productivity
As implied above, a multi-output multi-input process could use SFP metrics. In this case, such
measures are known as “partial” productivity metrics, because they take into account only one
factor of production at a time (OECD 2001, Oum et al. 1992). This is why the terms SFP and
Partial Productivity are commonly used interchangeably (and confusingly) in the literature. The
author strongly recommends making the distinction between SFP (for a single-output single-
input process) and partial productivity (for a combination of an output and an input of a multi-
output multi-input process). That distinction is manifest in the rest of this document.
Although partial measures give an idea of productivity by relating a given output to a given
input, they are inappropriate to determine the productivity of a multi-output multi-input process
for the following reasons:
Box 1.4- Disadvantages of Partial Productivity Metrics
- They ignore deviations that are not explainable by the selected input.
- They ignore the interdependency of multiple inputs and outputs. For example, an increase
in one input may be cancelled out by a decrease in other input.
- They can explain the correlation between a single input and a single output, but that does
not imply nor demonstrate causality.
1.4. Methods for MFP/TFP
As mentioned earlier, MFP/TFP metrics need a method that relates multiple inputs and/or
multiple outputs. Different methods can give MFP/TFP a different meaning, and decompose the
productivity changes into one or more sources of growth.
Two main categories of methods are available: parametric and non-parametric methods.
Non-parametric methods combine the inputs (or outputs) into a single index before computing
the productivity, or use a transformation for computing productivity gains without aggregating
the inputs (or outputs) into a single index. These methods can be computed directly from data,
without the need for any kind of statistical regression. They are more sensitive to year-to-year
variations than parametric methods. They return gross measures of productivity; residuals that do
not distinguish whether the changes are due to shifts of the production curve or to movements

41
along the existing production curve. Furthermore, they cannot determine the specific sources or
drivers of productivity growth. (Oum et al. 1992, Coelli et al. 2005).
Parametric methods estimate a production or cost function through regression analyses (least-
squares econometric production models, stochastic frontiers). They are less sensitive to year-to-
year variations than non-parametric methods. These methods can distinguish between true
“technical” shifts in productivity and economies of scale or other phenomena related to the
production process (i.e. movements along the production curve) (Oum et al 1992, Coelli et al.
2005).
Careful consideration must be given to the selection of the method. Methodological differences
can cause substantially different results for MFP/TFP metrics1 (Oum et al 1992). Analyses
performed with different methods, outputs, or inputs may not be comparable, even if they study
the same entity.
Before continuing, it is important to note that sometimes productivity is analyzed by
manipulating incremental gains of inputs (or outputs) rather than their absolute value. An
incremental gain is defined as the relative growth of an output (or input) during a given time
period. It is a dimensionless unit.
1.4.1. Non-parametric Approaches
The growth-accounting approach, inspired by Solow (1957), is the most relevant non-parametric
approach. It computes MFP/TFP productivity growth as the sum of incremental gains in output
(or the sum of a linear combination of incremental gains of outputs) less a linear combination of
incremental gains in inputs. The residual, i.e., MFP/TFP growth, represents the rate of change in
output that cannot be explained by the rate of change in inputs. This is the combined effect of
technological and non-technological progress, labeled as a gross productivity measure that
cannot distinguish between those two categories of drivers of productivity change (Oum et al.
1992). For this reason, the index approach should be complemented by a review of historical
events in order to conjecture about the causes of productivity change (OECD 2001).
A linear combination of incremental gains requires weights for the relative importance of input
(or output) variables. The input weights are calculated as the share of each input on total input, 1 Much confusion would be spared if researchers stop reporting SFP, MFP or TFP alone without specification, and rather report the metric put together with the method of application

42
and the output weights are calculated as the share of each output on total output, and both can be
either fixed (constant weights) or variable (moving weights).
The various ways of defining incremental gains and determining the weighting coefficients
required by the growth accounting method define the different available methods within this
approach:
- In the basic growth accounting method, an incremental gain is simply expressed as the
percentage growth of input in a time period. Input weights are calculated as the share of
each input on operational expenses at a given year. Output weights depend on the share
of operational revenues. For the case of MFP, this is written as:
Equation 1.1- MFP, Growth Accounting Method
∆𝑇𝑇
=∆𝑄𝑄− �𝛼1
∆𝑃𝐼𝑂𝑃𝑃1𝑃𝐼𝑂𝑃𝑃1
+ 𝛼2∆𝑃𝐼𝑂𝑃𝑃2𝑃𝐼𝑂𝑃𝑃2
+ 𝛼3∆𝑃𝐼𝑂𝑃𝑃3𝑃𝐼𝑂𝑃𝑃3
�
𝑊ℎ𝑒𝑃𝑒: ∆𝑇𝑇
= 𝑔𝑃𝑃𝑔𝑃ℎ 𝑃𝑜 𝑀𝑀𝑃,
∆𝑄𝑄
= 𝑔𝑃𝑃𝑔𝑃ℎ 𝑃𝑜 𝑃𝑃𝑃𝑂𝑃𝑃,
∆𝑃𝐼𝑂𝑃𝑃𝑖𝑃𝐼𝑂𝑃𝑃𝑖
= 𝑔𝑃𝑃𝑔𝑃ℎ 𝑃𝑜 𝑃𝐼𝑂𝑃𝑃 𝑃
𝛼𝑖 = 𝑆ℎ𝑎𝑃𝑒 𝑃𝑜 𝑃𝑃𝑂𝑃 𝑃𝑜 𝑃𝐼𝑂𝑃𝑃 𝑃 𝑃𝐼 𝑃𝑃𝑃𝑎𝑡 𝑃𝑃𝑂𝑃 𝑃𝑜 𝑃𝐼𝑂𝑃𝑃𝑂
- The Törnqvist or translog index formula is similar to the previous method, but it uses the
natural logarithms of inputs and outputs to calculate the incremental gains. It uses
average shares over the period of comparison as input/output weights. In this TFP
example, taken from Cowie (2010), M = outputs, N = inputs, Ri (or Si) = average revenue
(cost) share of output (input) i between years k and l.
Equation 1.2- TFP, Törnqvist Translog Index
ln �𝑇𝑀𝑃𝑘𝑇𝑀𝑃𝑙
� = �𝑅�𝑖 ln �𝑃𝑖𝑘𝑃𝑖𝑙�
𝑀
𝑖=𝑙
−�𝑆�̅� ln�𝑥𝑗𝑘𝑥𝑗𝑙�
𝑁
𝑗=𝑙
43
- Other index number methods include variations of these two methods, but with similar
concepts.
As implied by the above equations, the growth accounting method can be applied for different
periods of time, for example, on a year-to-year basis (with respect to the prior year) or on a
cumulative basis (with respect to the initial year).
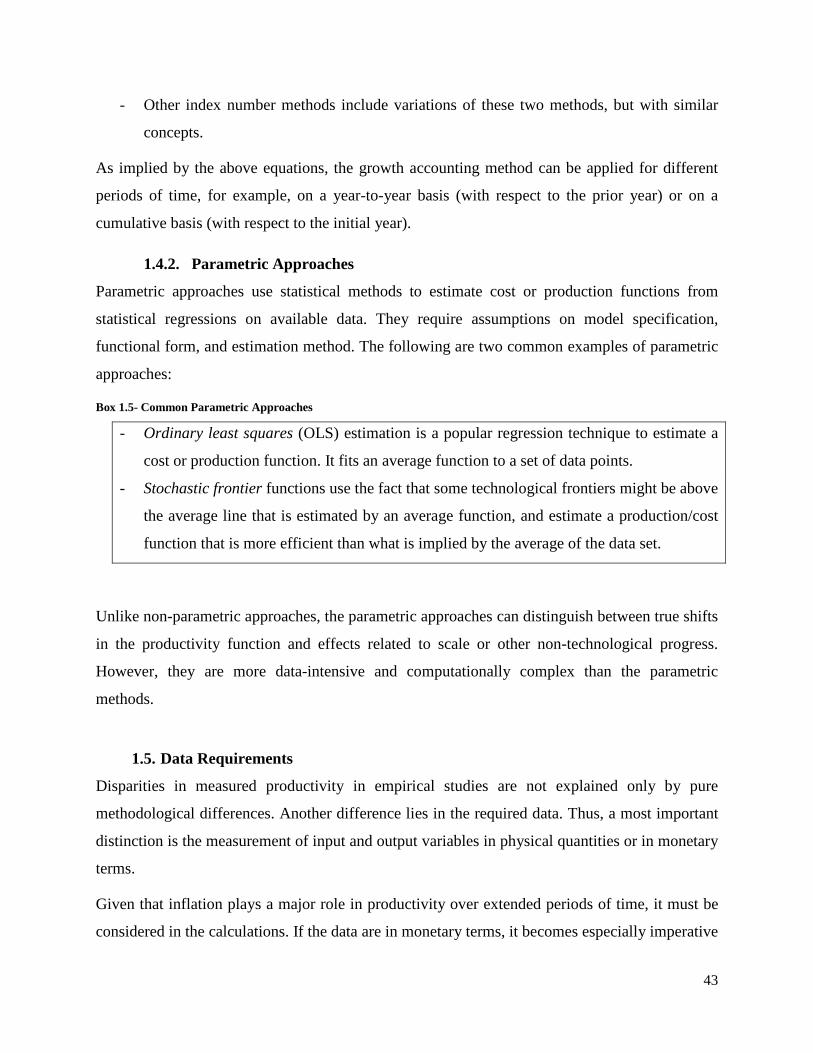
1.4.2. Parametric Approaches
Parametric approaches use statistical methods to estimate cost or production functions from
statistical regressions on available data. They require assumptions on model specification,
functional form, and estimation method. The following are two common examples of parametric
approaches:
Box 1.5- Common Parametric Approaches
- Ordinary least squares (OLS) estimation is a popular regression technique to estimate a
cost or production function. It fits an average function to a set of data points.
- Stochastic frontier functions use the fact that some technological frontiers might be above
the average line that is estimated by an average function, and estimate a production/cost
function that is more efficient than what is implied by the average of the data set.
Unlike non-parametric approaches, the parametric approaches can distinguish between true shifts
in the productivity function and effects related to scale or other non-technological progress.
However, they are more data-intensive and computationally complex than the parametric
methods.
1.5. Data Requirements
Disparities in measured productivity in empirical studies are not explained only by pure
methodological differences. Another difference lies in the required data. Thus, a most important
distinction is the measurement of input and output variables in physical quantities or in monetary
terms.
Given that inflation plays a major role in productivity over extended periods of time, it must be
considered in the calculations. If the data are in monetary terms, it becomes especially imperative

44
to deflate the quantities accordingly. This calculation is also critical to non-parametric
approaches that do not estimate a function, but rather make calculations directly from the
available data (Coelli et al. 2005).
All in all, while physical quantities are preferred over monetary quantities, the ultimate choice
depends on the confidence and availability of price and quantity data (Oum et. al. 1992).
1.6. Productivity in Passenger Rail Transportation
Economic studies of productivity outside the domain of transportation usually focus on partial
productivity (labeled in most of those studies as SFP) and MFP metrics with monetary outputs
and inputs. Economic studies at a firm or industry level usually use operational revenue as output
and multiple inputs in the categories of labor, capital, and other intermediate inputs (e.g. energy,
materials, or services). Parametric approaches are more common than non-parametric
approaches.
Transportation productivity studies also use partial productivity (labeled in most of these as
SFP), and MFP/TFP. MFP/TFP include additional outputs that account for the capacity produced
and utilized, and additional inputs that are more specific to the particular transportation context.
Both parametric and non-parametric approaches are used, and due to the several different
methods available, a comparison of findings between studies is a difficult, if not unfeasible, task.
The studies usually use partial productivity measures to specify particular factors of interest to
operators and analysts, but not to economists.
The specific rail transportation productivity literature leans towards freight (MFP), or combined
freight-passenger transportation (TFP). Few studies address the rail passenger transportation
problem in isolation. Lamentably, there are few published studies of productivity for the U.S.
passenger railroads.
Past productivity analyses in transportation can and have been used for many purposes: to
evaluate the performance of a firm/industry over time, to compare firms within an industry, to
compare firms/industries in different countries, or to compare different policy regimes.

45
1.6.1. Review of Studies of Productivity in Passenger Rail Transportation
In the most relevant study of US railroads, Caves et al. (1980) compared the TFP, for passenger
and freight rail transportation, computed with different parametric and non-parametric methods.
When using the growth accounting approach, they highlighted the importance of using adequate
moving input and output weights from operational data, and not taken from national income data
that understated the use of capital and overstated the use of labor in railroads. They concluded
that the U.S. railroads TFP productivity increased 1.5% per year on average for the period 1951-
1974.
Caves et al. (1981) further compared the US and Canadian railroads with a parametric TFP in the
period 1955-1974. They concluded that the less regulated Canadian railroads achieved higher
productivity gains than the more regulated US railroads. This research gave birth to a myriad of
studies that used MFP/TFP with a non-parametric approach to analyze (rail) transportation
performance.
Tretheway et al. (1997) used partial productivity measures (labeled by them as SFP), a revenue-
weighted (non-parametric) index of TFP, and a parametric TFP to analyze the productivity of
two Canadian railways, CN and CP, from 1956 to 1991. Their analysis includes a comparison of
various factors like ownership, technological changes, deregulation, and is benchmarked with US
railroads.
Cantos el al. (1999) used a non-parametric TFP Malmquist index to analyze the productivity of
European railways from 1970 to 1995. The analysis distinguished between changes in efficiency
and technical change. They concluded reforms that provided greater degrees of autonomy and
financial independence in the sub-period 1985-1985 contributed greatly to increases in
productivity.
Unlike previous studies, Cowie (2010) used a non-parametric MFP translog index approach to
analyze the effect of privatization in the British passenger railway industry. He found that
ownership structure and not ownership per se was relevant as a determinant of productivity
gains. The nationalized British Rail experienced productivity gains comparable to those of
railways in early stages of privatization, after the former adopted a more market-oriented
structure. Labor reductions increased productivity for privatized railroads in the short-term, but
infrastructure and rolling stock investment improved productivity for British Rail in the long run.

46
Most recently, Sakamoto (2012) used partial productivity measures (labeled by him as SFP) and
the same approach as Cowie (2010) to determine the MFP productivity of the Tokaido
Shinkansen line in Japan in the period 1964-2010. He concluded that MFP increased
significantly after the privatization process of JR Central in 1987.
The existence of a study of Amtrak’s productivity under any approach (SFP, partial, MFP or
TFP) is unknown to the author to this date.
1.6.2. Outputs
In most transportation productivity analyses, the outputs are revenue and volume. The specific
output metrics vary depending on the mode.
For rail transportation, available seat-miles (ASM) or available train-miles (ATM) are a proxy
for transportation capacity, whereas revenue passenger-miles (RPM) or revenue train-miles
(RTM) measure the ability to use the available capacity. Several authors use additional outputs,
including average length of passenger trip (Caves et al. 1980), operating revenue, net income,
gross ton-miles, locomotive miles, car-miles, train-hours, locomotive hours, or trailers loaded
(Kriem 2011). These multiple outputs are interesting from an operational point of view, but
impede comparisons among studies.
1.6.3. Inputs
In most transportation productivity analyses, the inputs are generally labor and capital. The
specific input metrics also vary depending on the transportation mode.
In rail transportation, the inputs are generally labor, capital and fuel. Some studies include more
detailed inputs such as infrastructure, equipment, cars, or stations (Kriem 2011, Martland 2011,
Caves et al. 1981). Other studies discriminate inputs in a different way, for example, in
personnel, non-personnel and capital expenditures (Sakamoto 2012). The data availability
determines to some extent the breakdown of inputs.
1.6.4. Partial Productivity in Rail Transportation
As mentioned earlier (see section 1.6.1 Review of Studies), several studies used partial
productivity metrics to identify firm/industry trends, or to get a sense of operational details that
may be of interest to analysts. Such partial measures enable multiple permutations of outputs and
inputs. For example, Martland (2011) and Kriem (2011) used several partial productivity

47
metrics: labor, fuel, infrastructure, equipment, operations, capital or safety, with various
combinations for each one.
A failing of productivity studies is that they often omit level of service (LOS). There are only
tangential approaches to measuring LOS as an output of transportation. This is mostly done on
partial productivity analyses that use performance indicators as productivity measures, (e.g.
operational safety defined as injuries divided by number of employees).
As noted earlier (section 1.3.3 Partial Productivity), partial productivity is inappropriate for
analyzing multi-output multi-input processes.
1.6.5. Factors that Influence Productivity in Passenger Rail Transportation
There are many factors that can change productivity in passenger rail transportation. Some of
them can be related to technology change (use of improved equipment, improved maintenance
techniques, use of IT to monitor and control trains, use of online ticket sales), others are related
to organizational change (improved manager practices, mergers/acquisitions, changing
legislation), and others are due to external events (industry and market behavior, single events).
Previous studies have shown the effects of some of this factor on productivity (see section 1.6.1
Review of Studies)
1.6.6. Limitations of Past Studies on Rail Transportation
The scope of analysis in past productivity studies on rail transportation was limited by the
inherent tradeoff between parametric and non-parametric approaches. The former are harder to
calculate and more data-intensive, but can distinguish between sources of productivity growth.
The latter are easier to compute and less data-intensive, but cannot separate the causes of
productivity gains (see section 1.4: Methods for MFP/TFP). Given that non-parametric
approaches are more popular, the literature still relies on historical reviews that make inferences
on the specific sources of productivity change.
Previous studies also failed to make conclusions on performance of railroads due to lack of
reliable data. Sometimes researchers had problems obtaining disaggregate data from carriers,
which they viewed as competitive information.
The great range of available methods and their incompatibility prevented researchers from
building on previous studies. This resulted in a lack of continuity in the literature.

48
Finally, the selected inputs of previous studies in transportation did not account for the LOS, an
important concept in transportation and one of the strongest arguments in favor of newer
transportation technologies. In addition, the metrics generally measured the quantity but not the
quality of inputs. However, the theory on productivity does allow the free selection of input and
output variables, which may have the potential for evaluating the productivity from a level-of-
service perspective.
1.6.7. Implications for the Study of HSR
Higher productivity could translate into more utilization of HSR assets, lower fares to customers,
higher employee compensation, potentially more profits for HSR owners, and perhaps even
lower need for public funding.
Even though productivity is a poor proxy for profitability – given that financial performance
depends on other factors, such as fares or competition— good productivity is in fact a
precondition for profitability. Thus, a mode’s productivity could give a boundary for profitability
and perhaps even explain long-term profitability.
Calculations of productivity in the NEC could be done at the route (sub-firm) level (e.g. the
Acela Express). However, the same data categories, metrics, and methods should be used to
accurately compare distinct studies, regardless of whether the analysis is done for different
routes, in different locations, or in different periods of time.

49
1.7. Chapter Conclusion
Productivity analyses are useful to study intercity passenger rail transportation because they can
assess performance and provide insights into the sources of performance change, i.e., into the so-
called drivers of productivity change. In intercity passenger transportation, productivity
improvements may explain long-term improvements and translate into many benefits to users
and producers of those services. Several studies have revealed that various factors related to
technological change, organizational change, and external events affected productivity in
intercity passenger rail transportation, mostly outside of the U.S. Thus, a successful productivity
analysis of the Northeast Corridor may allow managers and decision-makers to understand the
system’s behavior, and to better prepare or respond to potential realizations of the future.
The basic definition of productivity and clarification of the intricate metrics and methods of
productivity measurement presented in this chapter have provided an understanding of the
concept of productivity and of the somewhat disorganized productivity literature, where no
widely dominant approach is to be found, and only scarce, discontinuous, and incompatible
studies of rail transportation are available. As a recommendation to prevent major future
confusion, the data categories, the productivity metrics, and the method of analysis should be
explicitly and jointly referenced in a productivity study.
The advantages, disadvantages, and tradeoffs of the wide range of available methods for
productivity analysis make this a non-straightforward decision. Parametric methods can provide
detailed information on the drivers of productivity change, but are data-intensive and
computationally complex. Non-parametric methods may sacrifice the amount of information
they return, but are less data-intensive and computationally friendlier than parametric methods.
Complementary analysis, like reviewing historical events or using alternative metrics, may
compensate for the disadvantages of a particular method. Ultimately, the selection of a method
depends on the question of interest, the type of data, the data availability, the computational
resources, and other context-specific constraints. Robustness, however, is a desired attribute of
any method, given that distinct approaches may return great discrepancies in the estimation of
productivity, even when applied to the same dataset.
The selection of productivity metrics is more direct than and usually precedes the selection of the
method of analysis. SFP, partial productivity, MFP, and TFP metrics are used for a variety of

50
analysis, ranging from single-output single-input to multi-output multi-input processes. In single-
output single-input processes, or in processes where multiple inputs can unmistakably be
combined into a single input, SFP is the preferred choice. In multi-output multi-input processes,
MFP and TFP are definitively preferred over the (inappropriate) partial measures of productivity.
Although the selection of outputs and inputs in transportation productivity analyses is mostly
constrained by data availability and reliability, this does not necessarily mean that alternative
outputs and inputs cannot be selected or derived. Given that operators usually report financial
data, several transportation productivity studies used monetary terms instead of physical input
quantities. Moreover, physical outputs that can measure capacity and usage (ASM and RPM) are
commonly reported by firms. However, these data respond to incumbent managerial reporting
schemes that rarely account for LOS. In addition, the metrics generally measure the quantity but
not the quality of inputs. Thus, there is a need for developing alternative outputs and/or inputs in
productivity analysis in order to measure the quality of the service provided and to account for
the quality of the inputs.
The next chapter discusses the passenger rail transportation system of the Northeast Corridor and
the high-speed rail prospects for the next few decades.
51
1.8. Chapter References
Cantos, P., Pastor, J. M., & Serrano, L. (1999). Productivity, Efficiency and Technical Change in the European Railways: A Non-Parametric Approach. Transportation, 26(4), 337-357.
Caves, D. W., Christensen, L. R., & Swanson, J. A. (1980). Productivity in US Railroads, 1951-1974. The Bell Journal of Economics, 166-181.
Caves, D. W., Christensen, L. R., & Swanson, J. A. (1981). Economic Performance in Regulated and Unregulated Environments: A Comparison of US and Canadian Railroads. The Quarterly Journal of Economics, 96(4), 559-581.
Coelli, T. J., Rao, D. S. P., O'Donnell, C. J., & Battese, G. E. (2005). An Introduction to Efficiency and Productivity Analysis. Springer.
Cowie, J. (2010). Subsidy and Productivity in the Privatised British Passenger Railway.
Kriem, Y., & Massachusetts Institute of Technology. Dept. of Civil and Environmental Engineering. (2011). Productivity of the U.S. Freight Rail Industry: A Review of the Past and Prospects for the Future. (M. Eng., Massachusetts Institute of Technology, Dept. of Civil and Environmental Engineering).
Martland, C. D. (2011). Productivity Improvements in the US Rail Freight Industry, 1980-2010. MIT paper October 2011
Measuring Productivity, OECD (2001). Manual: Measurement of Aggregate and Industry-Level Productivity Growth.
Oum, T. H., Tretheway, M. W., & Waters, W. (1992). Concepts, Methods and Purposes of Productivity Measurement in Transportation. Transportation Research Part A: Policy and Practice, 26(6), 493-505.
Sakamoto, R., & Massachusetts Institute of Technology. Dept. of Civil and Environmental Engineering. (2012). High Speed Railway Productivity: How Does Organizational Restructuring Contribute to HSR Productivity Growth? (S.M. in Transportation, Massachusetts Institute of Technology, Dept. of Civil and Environmental Engineering).
Solow, R. M. (1957). Technical Change and the Aggregate Production Function. The Review of Economics and Statistics, 39(3), 312-320.
Tretheway, M. W., Waters, W., & Fok, A. K. (1997). The Total Factor Productivity of the Canadian Railways, 1956-91. Journal of Transport Economics and Policy, 93-113.


53
2. The Amtrak NEC Review
2.1. Introduction
This chapter reviews the passenger rail transportation system of the Northeast Corridor (NEC) in
the U.S. and its high-speed rail (HSR) prospects for the next decades, providing the context for
an assessment of its productivity in later chapters.
2.2. The Northeast Megaregion
The Northeast Corridor of the United States, by convention, stretches from Washington, D.C., to
Boston, MA, lying in an essentially contiguous megaregion, which is the United States’ largest.
With over 55 million people and a $2.6 trillion economy one-fifth of the U.S. GDP, it is the most
densely settled region and the economic engine of the country. However, it has been plagued for
decades with congestion on its intercity transportation system, especially at airports and on
highways, a condition that might worsen due to expected population growth, travel frequency
increases, constraints on investment, and likely increasingly frequent large weather events
(hurricanes, snowstorms). This poses challenges in upgrading a multi-state, multi-use and multi-
operator corridor that is vital to the economy of the U.S. and even the world.
2.3. Amtrak
Amtrak, a portmanteau of “American” and “Track”, is the accepted name of the National
Railroad Passenger Corporation; a publicly-owned company operated and managed as a for-
profit, private corporation, and currently the only intercity rail passenger operator in the NEC.
The Rail Passenger Service Act (RPSA) of 1970 gave birth to Amtrak, which began operations
on May 1, 1971, after the consolidation of several private passenger railroads of the time.
Amtrak currently operates a 22,000-mile passenger rail nationwide system.
Table 2.1 displays a timeline with major events regarding the evolution of Amtrak and the NEC.

54
Table 2.1- Amtrak and NEC Timeline YEAR EVENT
1830-1917 NEC is built 1965 High Speed Ground Transportation (HSGT) Act 1968 Establishment of Penn Central Transportation Co. 1969 Introduction of Metroliner and Turbotrain services 1970 Rail Passenger Service Act (RPSA) 1971 Amtrak starts operations 1976 Railroad Revitalization and Regulatory Reform Act (4R)
1976-1982 NEC Improvement Program (NECIP) 1991 Intermodal Surface Transportation Efficiency Act (ISTEA) 1992 Amtrak Authorization and Development Act (AADA) 1995 Northeast Regional starts operations 1997 HSGT Commercial Feasibility Study (CFS) Report 2000 Acela Express stars operations 2001 Terrorist attacks of 9/11 2008 PRIIA, economic recession 2009 ARRA, “Vision for HSR in America” 2010 NEC MP, Amtrak's “Vision for HSR in the NEC”
2012 - Present NEC FUTURE, NEC Capital Investment Program 2015-2025 NEC-UP (proposed) 2030-2040 NEC NextGen HSR (proposed)
2.3.1. Outputs: Ridership, Revenue, Profit
Even though Amtrak’s ridership was relatively flat for about twenty years, the last decade has
brought an upsurge in riders. In 1972, after the first year of operations, Amtrak’s carried 16.6
million passengers system-wide; that doubled by 2012, forty years later. In the first decade of
operations, a period known as the Rainbow Era, system-wide ridership reached 21 million
annual passengers, a figure that stagnated for nearly twenty years, until 2000. In the past ten
years, however, Amtrak has broken its ridership records nine times, the only significant
downturn coming during the economic recession in fiscal year (FY) 2009, October 2008-
September 2009.
In the new millennium, Amtrak’s ridership, revenue, and profitability has exhibited mixed and
contrasting experiences in different routes and regions. Short and special routes became more
profitable and utilized than longer routes, while the latter continued to be heavily subsidized.
Two thirds of Amtrak’s ridership in FY 2012 originated in the ten largest metropolitan areas

55
(Puentes et al. 2013). The Northeast Megaregion contributed nearly half of Amtrak’s ridership
and represented the most important passenger rail transportation sub-network in the nation.
2.3.1.1. Ridership
The breakdown of Amtrak’s ridership for FY 2000-2012 is shown in Figure 2.1 and includes
NEC-spine trains (to be defined and discussed in Section 2.4.2: NEC Operations and Services),
state-supported and other short-distance corridor trains (SD) (~<400 mi), and long-distance trains
(LD) (~>400 mi).
Figure 2.1- Ridership FY 2000- 2012 (Adapted from Amtrak 2011a, 2011b, 2009-2012)
Amtrak’s system-wide ridership grew 55%, from 21 million riders in FY 2000 to an all-time high
of 31.2 million in FY 2012. This percentage increase was higher than that of other major travel
modes in the U.S. (Puentes et al. 2013), and greatly exceeds the 11% increase in U.S. population
since the beginning of the millennium (U.S. Census Bureau). The greatest ridership growth
occurred in SD trains, from 8.6 to 15.1 million annual riders (+76%). NEC-spine ridership
notably grew from 8.4 to 11.4 million riders (+36%), while LD ridership slightly increased from
4.0 to 4.7 million (+18%).
There are a number of reasons that explain this growth, including but not limited to the
availability of government funding for capital improvements; the introduction of the Acela
Express in FY 2001; external factors and events like 9/11, climate change awareness, airport
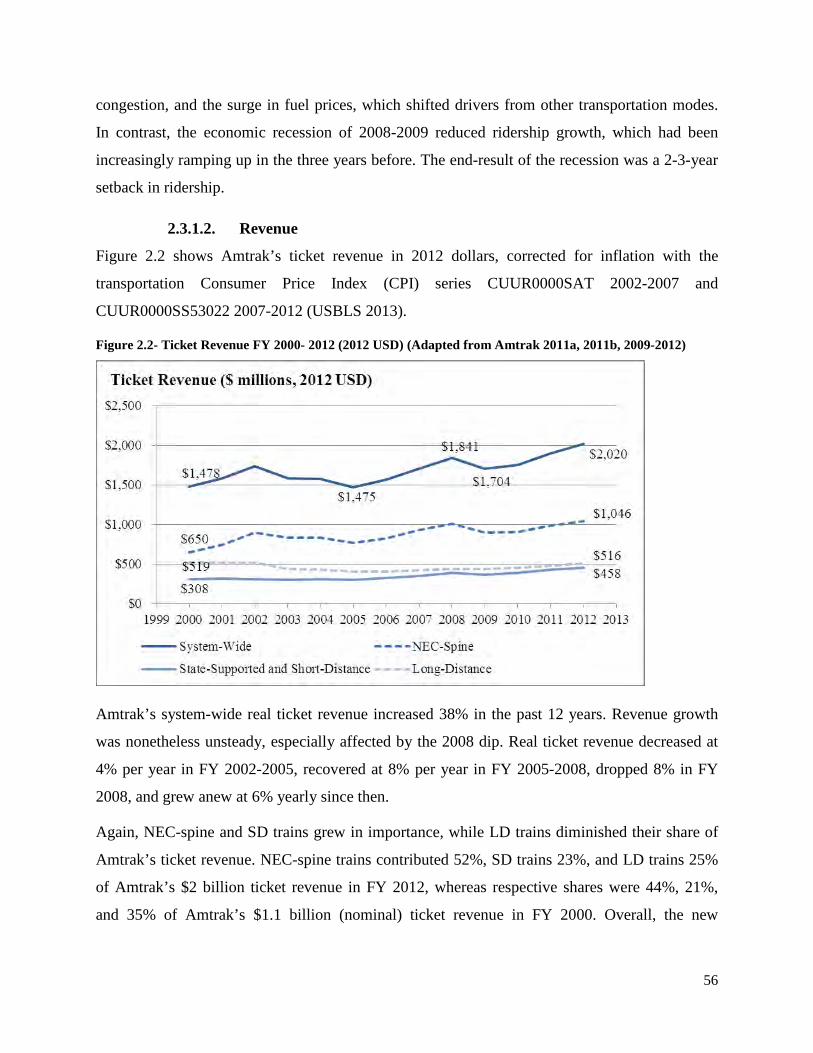
56
congestion, and the surge in fuel prices, which shifted drivers from other transportation modes.
In contrast, the economic recession of 2008-2009 reduced ridership growth, which had been
increasingly ramping up in the three years before. The end-result of the recession was a 2-3-year
setback in ridership.
2.3.1.2. Revenue
Figure 2.2 shows Amtrak’s ticket revenue in 2012 dollars, corrected for inflation with the
transportation Consumer Price Index (CPI) series CUUR0000SAT 2002-2007 and
CUUR0000SS53022 2007-2012 (USBLS 2013).
Figure 2.2- Ticket Revenue FY 2000- 2012 (2012 USD) (Adapted from Amtrak 2011a, 2011b, 2009-2012)
Amtrak’s system-wide real ticket revenue increased 38% in the past 12 years. Revenue growth
was nonetheless unsteady, especially affected by the 2008 dip. Real ticket revenue decreased at
4% per year in FY 2002-2005, recovered at 8% per year in FY 2005-2008, dropped 8% in FY
2008, and grew anew at 6% yearly since then.
Again, NEC-spine and SD trains grew in importance, while LD trains diminished their share of
Amtrak’s ticket revenue. NEC-spine trains contributed 52%, SD trains 23%, and LD trains 25%
of Amtrak’s $2 billion ticket revenue in FY 2012, whereas respective shares were 44%, 21%,
and 35% of Amtrak’s $1.1 billion (nominal) ticket revenue in FY 2000. Overall, the new

57
millennium brought 63% more real revenue in the NEC-spine, 51% in SD, and a 1% in LD. The
LD revenue remained essentially flat.
The NEC-spine showed large returns to scale. While the NEC-spine trains’ incremental ridership
was less than half of the SD trains’ (3 v. 6.5 million riders), the associated incremental revenue
was 2.5 times that of SD trains ($565 v. $230 million (nominal USD)).
2.3.1.3. Profit
Table 2.2 shows the financial performance of Amtrak in nominal dollars.
Table 2.2- FY 2002- 2012 Financial Performance, ($ millions, nominal) (Adapted from Amtrak 2003- 2012)
Year-End Total
Revenues
Total
Expenses
Net Loss from
Operations
Net Loss Adjustment
2002 $2,212 $3,224 ($1,012) ($1,148) ($631)
2003 $2,057 $3,178 ($1,121) ($1,264) ($678)
2004 $1,631 $2,917 ($1,286) ($1,286) ($635)
2005 $1,855 $2,962 ($1,107) ($1,107) ($606)
2006 $2,502 $2,450 $52 ($1,127) ---
2007 $2,151 $2,581 ($429) ($1,052) ---
2008 $2,454 $3,389 ($934) ($1,024) ---
2009 $2,353 $3,507 ($1,155) ($1,264) ($788)
2010 $2,513 $3,747 ($1,233) ($1,335) ($898)
2011 $2,714 $3,966 ($1,251) ($1,345) ($887)
2012 $2,876 $4,063 ($1,186) ($1,267) ($878)
Amtrak has shown persistent unprofitability. The net losses were $1.27 billion from $2.88 billion
total revenue in FY 2012 (44%). Certainly, the boost in ridership and revenue stabilized and even
reduced net losses in recent years, both in absolute and percentage terms. This trend was also to
be seen in the years before the 2008 economic recession. Nevertheless, subsidies are familiar to
Amtrak, which continuously received governmental support for operations since its inception
back in 1971. For this reason, Amtrak’s operational capabilities have been a matter of harsh
criticism and public debate throughout decades. Amtrak counters that other modes have been

58
more heavily subsidized; in forty years Amtrak received $36 billion from federal funding,
whereas aviation received $421 billion and highways received at least a trillion (Amtrak 2011c).
Operational losses were, nonetheless, not ubiquitous. The NEC-spine trains were operationally
profitable in FY 2012, with $289 million surplus (excluding capital charge, depreciation and
interest), as well as a few short-distance routes, with $10 million surplus. This contrasted
severely with the $760 million combined loss of the remaining routes (excluding capital charge,
depreciation and interest) (Amtrak Monthly Performance Report, September 2012). The
corresponding figures in FY 2010 showed a $61 million contribution for NEC-spine trains and
$795 million loss for the rest of the system, and a year before, in the midst of the most serious
economic recession since the Great Depression of the 1930s, a $25 million contribution and $766
million loss, respectively.
A factor that accentuated such contrasts is that most infrastructure costs were included in the
performance of the LD and SD trains—as Amtrak paid usage fees to the infrastructure owners–
but not in the almost entirely Amtrak-owned NEC–where Amtrak did not pay internal usage fees
(i.e. there is vertical integration). In the first case, most infrastructure owners are freight
railways. In the past, railroads had mixed traffic of freight and passengers. The latter were
transferred to Amtrak upon its establishment in 1971, but not the infrastructure. This condition
has made cooperative relationships difficult between Amtrak and the freight railways, which
now have no incentives to carry passenger traffic on their tracks.
Hence, the NEC revealed a different story than the rest of Amtrak. NEC-spine outputs greatly
improved in the past three years: 24% in ticket revenue, 14% in ridership, and tenfold in
operational surplus (excluding capital charge, depreciation and interest). Outside of the NEC,
Amtrak showed fluctuating losses, despite noticeable increases in ridership and revenue. It is
important to note, though, that financial performance of routes is reported before capital charges,
depreciation and interest, which would lower the above-reported figures once taken into account.
The allocation of those costs, however, is problematic and sensitive to the selected method of
charging users of shared infrastructure and services.

59
2.4. The Amtrak Northeast Corridor (NEC)
The Amtrak Northeast Corridor, hereon referred to as the NEC, is the railroad artery that spans
the Northeast Megaregion. The NEC is a multi-state corridor that runs through twelve States and
the District of Columbia. It is a multi-owner asset comprising 870 route miles and 2,340 track
miles, a multi-operator network involving eight commuter operators with one intercity-travel
operator (Amtrak), and a multi-use track alignment on which both freight and passenger trains
run every day. The Federal Railroad Administration (FRA) oversees this orchestration.
All these reasons make the NEC an intricate system that carries over 750,000 commuters and
daily intercity travelers, with 2,272 daily train movements (154 from Amtrak), and increasing
congestion and infrastructure maintenance requirements.
2.4.1. NEC Infrastructure and Ownership
The NEC rail infrastructure includes multi-track rail lines, bridges, stations, and signaling
systems between Washington, D.C., and Boston, MA, with branches to Springfield, MA,
Albany, NY, Harrisburg, PA, and Richmond, VA. Originally built between 1830 and 1917, and
upgraded by the Northeast Corridor Improvement Program (NECIP) from 1976 to 1982, the
NEC faces today aging infrastructure and maintenance backlogs.
Figure 2.3 shows the NEC infrastructure ownership and operations. Although the Railroad
Revitalization and Regulatory Reform Act (4R) of 1976 allowed Amtrak to acquire much of the
NEC infrastructure from Conrail, it remains a shared asset with multiple owners. Amtrak owns
and maintains 363 of the 457 route miles of what is termed the “NEC spine”, the track alignment
linking Washington’s Union Station to Boston’s South Station, roughly parallel to Interstate 95.
This includes 17 tunnels, 1,186 bridges, and the entire track from Washington to New York. The
Massachusetts Bay Transportation Authority (MBTA) owns the 38-mile segment in
Massachusetts, and the States of New York and Connecticut own the segment linking New
Rochelle, NY, and New Haven, CT, comprising 46 route miles (NEC MPWG 2010, Amtrak
2011a).
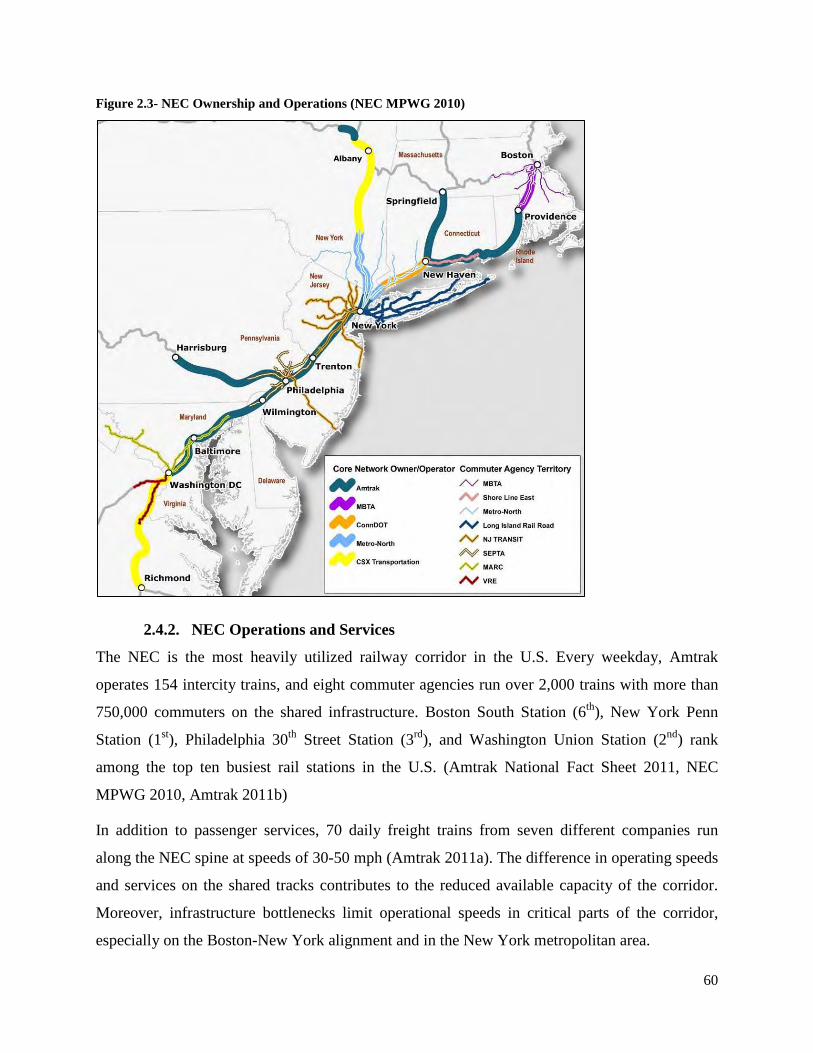
60
Figure 2.3- NEC Ownership and Operations (NEC MPWG 2010)
2.4.2. NEC Operations and Services
The NEC is the most heavily utilized railway corridor in the U.S. Every weekday, Amtrak
operates 154 intercity trains, and eight commuter agencies run over 2,000 trains with more than
750,000 commuters on the shared infrastructure. Boston South Station (6th), New York Penn
Station (1st), Philadelphia 30th Street Station (3rd), and Washington Union Station (2nd) rank
among the top ten busiest rail stations in the U.S. (Amtrak National Fact Sheet 2011, NEC
MPWG 2010, Amtrak 2011b)
In addition to passenger services, 70 daily freight trains from seven different companies run
along the NEC spine at speeds of 30-50 mph (Amtrak 2011a). The difference in operating speeds
and services on the shared tracks contributes to the reduced available capacity of the corridor.
Moreover, infrastructure bottlenecks limit operational speeds in critical parts of the corridor,
especially on the Boston-New York alignment and in the New York metropolitan area.

61
Amtrak offers multiple services along the NEC, two of which are of main importance:
The Acela Express runs from Boston to Washington via New York, Philadelphia, and Baltimore.
It is the fastest rail service in the U.S., capable of achieving top speeds of 150 mph in short
sections of the trip. Its average speed, though, is only on the order of 70-80 mph, which results in
a scheduled travel time of approximately 6:30 h from Boston to Washington. The Acela Express,
introduced in December 2000, currently offers various amenities such as first class (business
class is the lowest option), on-board Wi-Fi access, and food services.
The Northeast Regional runs from Boston/Springfield to Washington and then to other cities in
the State of Virginia (Richmond, Lynchburg, Newport News or Norfolk), via New York,
Philadelphia, and Baltimore. While the top speed is 125 mph, the average speed remains at 60-65
mph. This results in a scheduled travel time of approximately 8 h from Boston to Washington.
The Northeast Regional was introduced in 1995, and offers coach class and business class.
Table 2.3 shows certain trip characteristics of the Acela and Northeast Regional services.
Table 2.3- NEC-Spine Trains (Adapted from NEC MPWG 2010, Amtrak NEC Schedule Jan 2013)
Service Route Distance
(miles)
Weekday
Round Trips
Scheduled Travel
Time (hr:min)
Acela
Express
Boston – New York 232 10 From 3:25 to 3:35
New York – Washington 225 15 2:44 to 2:50
Boston – Washington 457 10 6:30 to 6:40
Northeast
Regional
Boston – New York 232 9 4:00 to 4:20
New York – Washington 225 14 3:12 to 3:39
Boston – Washington 457 9 7:40 to 8:05
Service on the southern leg of the NEC (New York-Washington) is 50% more frequent and 25%
faster than service in the northern leg (New York-Boston). Infrastructure constraints (old bridges,
short radii of curvature, etc.), along the northern leg of the NEC in particular, limit the capacity
of the rolling stock for achieving and maintaining high speeds. For this reason, the Acela Express
is just 18% faster than the Northeast Regional, saving, for instance, just 28 minutes in the 2-
hour-45-minute-long New York-Washington trip.
62
In addition to the Acela Express and the Northeast Regional, there are a number of Amtrak
services that operate partly on the NEC spine. The Keystone travels from New York to
Philadelphia, and then branches out to Harrisburg. The Pennsylvanian travels the route New
York—Harrisburg—Pittsburg. Amtrak also operates some NEC special trains for exceptional
occasions. Other services originate in cities on the NEC, but do not travel along the NEC spine
(e.g. the Empire service which covers the route New York—Albany—Toronto).
The Acela Express, Northeast Regional and NEC Special Trains, hereon referred to as the NEC-
spine trains, will be the focus of the subsequent review.
2.4.3. NEC Performance
In FY 2011, Amtrak’s services captured 77% of the air/rail market from Washington to New
York, and 54% of the New York – Boston market (Amtrak 2012). The NEC-spine trains carried
11.4 million passengers in FY 2012, a 36% growth since FY 2003, representing 36% of
Amtrak’s overall riders. NEC-spine trains generated $1.05 billion (52%) of Amtrak’s $2 billion
ticket revenue in FY 2012, a cumulative farebox increment of 45% in a decade. In contrast, the
level of service has only marginally improved. Amtrak and the FRA have made incremental
HSR improvements to the NEC, like electrification and procurement of HSR trains, but the 3-
hour travel-time goal between Boston and New York required by the Amtrak Authorization and
Development Act of 1992 is yet to be achieved (USGAO 2004). Surprisingly, Amtrak has
achieved such impressive market share in the NEC without having a true HSR service by many
definitions (see Section 2.5.1: A Note on the Definition of HSR)
Table 2.4 shows some performance metrics for the Acela Express and Northeast Regional in
2003-2012, a full decade. Despite a drawback in FY 2009, there were 1.0 (+44%) and 2.1 million
(+37%) additional riders on the Acela and Northeast Regional, which increased ticket revenue by
47% and 36%, respectively. In FY 2011, for the first time, ticket revenue from the Acela Express
was greater than the Northeast Regional’s, despite having less than half the ridership.
The congestion in the corridor contrasts with the still low, relative to air travel, though increasing
average load factor (ALF) of the trains: 63% on the Acela, up from 55% in 2009 and back to
2008 levels, and 48% on the Northeast Regional, up from 44% in 2009. With capacity
constraints on the corridor, partly evidenced by the modest growth of ASM, most of the new
riders are accommodated on the available capacity.

63
Table 2.4- Performance of Acela Express and Northeast Regional (NR) FY 2003-2012 (Adapted from Amtrak
2003-2013)
Year
Ridership
(millions)
Ticket Revenue
(2012 $ millions)
RPM
(millions)
ASM
(millions) ALF
Acela NR Acela NR Acela NR Acela NR Acela NR
2003 2.4 5.9 $346 $393 --- --- --- --- --- ---
2004 2.6 6.4 $351 $407 --- --- --- --- --- ---
2005 1.8 7.1 $244 $439 --- 1,041 --- 2,410 --- 43%
2006 2.7 6.8 $376 $454 473 961 923 2,307 51% 42%
2007 3.2 6.8 $453 $476 577 974 980 2,272 59% 43%
2008 3.4 7.5 $497 $511 631 1,100 1,006 2,200 63% 50%
2009 3.0 6.9 $436 $460 570 1,047 1,033 2,393 55% 44%
2010 3.2 7.1 $443 $461 611 1,105 1,015 2,394 60% 46%
2011 3.4 7.5 $494 $494 650 1,167 1,028 2,545 63% 46%
2012 3.4 8.0 $508 $536 647 1,234 1,034 2,550 63% 48%
Contrary to the overall financial performance of Amtrak, the NEC reported a $289 million
operational contribution (excluding depreciation, capital charge and interest) in FY 2012: $209
million (72%) from the Acela Express, and $72 million (25%) from the Northeast Regional.
While the Acela Express has been proven increasingly profitable since its inception, the
Northeast Regional recovered from two years of losses after the economic recession, with a $28-
million operational surplus (excluding depreciation, capital charge and interest) in FY 2011, a
comeback from a $43-million loss the year immediately before (nominal USD).
Increased transportation demand, airport congestion, targeted investments from Amtrak, and
availability of funding for capital investments have driven the recent boost in performance in the
NEC. However, an infrastructure maintenance backlog of $8 billion is yet to be addressed. In
2010 Amtrak estimated the required investment to bring the Amtrak-owned NEC infrastructure
to a state of good repair and to cope with the expected growth between 2010-2030, at $52 billion,
including the replacement of several bridges over a century old (NEC MPWG 2010).
64
2.5. High-Speed Rail Experience in the NEC
Although the conversation about HSR in the U.S. is hardly new, it was recently reinvigorated by
the Obama administration via launching of the “Vision for HSR in America”, a HSR strategic
plan, as part of the American Recovery and Reinvestment Act (ARRA) of 2009 (see Table 2.1).
This was the first U.S. presidential administration to make HSR a nationwide initiative. ARRA
authorized $8 billion to develop a national HSR system, and the NEC was selected as a strategic
corridor for targeted HSR funding (FRA 2009).
Before ARRA, the Passenger Rail Investment and Improvements Act of 2008 (PRIIA)
established the framework for development of HSR corridors, allocating $1.5 billion for capital
improvements in the NEC for FY 2009-2013 (FRA 2013). Years before, the Intermodal Surface
Transportation Efficiency Act of 1991 (ISTEA) authorized the NEC as a HSR corridor.
Governmental appropriations in the past two decades allowed track improvements and
procurement of HSR train sets, which resulted in the inauguration of the Acela Express in
December 2000.
2.5.1. A Note on the Definition of HSR
Before discussing the HSR experience in the NEC, it is important to review some definitions of
HSR and understand differences in the meaning of the terms.
There is not an absolute, consensus definition, but multiple differing denotations of HSR. For
example:
- The Council of the European Union Directive 96/48 provides a range of capital-oriented
definitions of HSR. In terms of infrastructure, HSR means "specially built high-speed
lines equipped for speeds generally equal to or greater than 250 km/h [156 mph],
specially upgraded high-speed lines equipped for speeds of the order of 200 km/h [125
mph], and specially upgraded high-speed lines which have special features as a result of
topographical, relief or town-planning constraints, on which the speed must be adapted to
each case." The directive also has a complementary definition of the required rolling
stock and some compatibility requirements. (UIC 2013)

65
- FRA’s 2009 “Vision for HSR in America” provides an infrastructure- and service-
oriented definition of HSR, accompanied by an aspiration to relieve other transportation
modes. The definition included multiple categories:
“HSR – Express. Frequent, express service between major population centers
200–600 miles apart, with few intermediate stops. Top speeds of at least 150 mph
on completely grade-separated, dedicated rights-of-way (with the possible
exception of some shared track in terminal areas). Intended to relieve air and
highway capacity constraints.”
“HSR – Regional. Relatively frequent service between major and moderate
population centers 100–500 miles apart, with some intermediate stops. Top speeds
of 110–150 mph, grade-separated, with some dedicated and some shared track
(using positive train control technology). Intended to relieve highway and, to
some extent, air capacity constraints.”
“Emerging HSR. Developing corridors of 100–500 miles, with strong potential
for future HSR Regional and/or Express service. Top speeds of up to 90–110 mph
on primarily shared track (eventually using positive train control technology),
with advanced grade crossing protection or separation. Intended to develop the
passenger rail market, and provide some relief to other modes.”
- The previous definition contrasts with FRA’s 1997 technology-based, competition-driven
definition of high-speed ground transportation (HSGT): “HSGT is self-guided intercity
passenger ground transportation—by steel-wheel railroad or magnetic levitation
(Maglev)—that is time-competitive with air and/or auto for travel markets in the
approximate range of 100 to 500 miles.”
- Sakamoto (2012) identified an informal, operational, but popular definition of HSR,
widely spread in the media and among rail advocacy groups, as: trains with maximum
speed of at least 150 mph and running almost always at more than 120 mph. One could
expand on this definition, noting that true international-quality high-speed rail is often
meant to include trains with a maximum speed of at least 220 mph. This brings strong
competitiveness in the range up to 500 miles.
66
What most definitions have in common is a mix of distances, infrastructure, rolling stock, and
operational speeds. Some of them exhibit a range of HSR categories with terms that are not
mutually agreed upon. Different agents may use the term HSR indiscriminately. This leads to
confusion and debate. For example, someone might deem the Acela Express as HSR-Regional,
according to FRA’s 2009 definition, because it reaches top speeds of 110-150 mph.
Nevertheless, these speeds are achieved only in short segments of the track between Boston and
New York, and travel time is much longer than that in countries with full-fledged HSR lines and
similar network structure. This diminishes the time-competitiveness with air travel of the Acela
Express, particularly in the Boston-Washington market, and it fails the necessary condition be
considered HSGT, according to FRA’s 1997 definition. The Acela Express would most certainly
fail Sakamoto’s definition of HSR.
2.5.2. Prospects for HSR in the NEC
The NEC network structure–a main line with some branches–with high population density,
intercity distances on the 100-500 mile range, economic power, and transit connections make it a
natural fit for world-class HSR. For this reasons, there are a number of recent and ongoing
efforts and studies for improving HSR service in the NEC.
Amtrak and the FRA launched the most relevant initiatives for HSR development in the NEC for
the next 30 years: The NEC Master Plan, the Vision for High-Speed Rail in the Northeast
Corridor, and the NEC FUTURE – Passenger Rail Corridor Investment Plan.
2.5.2.1. The NEC Master Plan
The “NEC Master Plan” (NECMP) of 2010 was an Amtrak-led initiative coordinated with
representatives from the FRA, 12 states, and the District of Columbia, commuter and freight
operators, and other stakeholders in the Northeast Corridor. As a joint effort for a shared
corridor, this plan estimated $52 billion expenditures from 2010 to 2030 to first bring existing
infrastructure to a state of good repair, subsequently increase current capacity to accommodate
expected growth of commuters, intercity travelers, and freight trains, and finally improve trip
time between city pairs (NEC MPWG 2010).
The NECMP anticipated 23 million annual intercity riders by 2030, a 76% cumulative increase
(2.9% per year), and $1.84 billion revenue. However, this master plan did not consider an
international-quality HSR deployment such as that developed in Japan or Europe. Projected trip-

67
time reductions would not be significant. The Boston-New York trip would have been merely
reduced from 3:31 to 3:08 h (23 min), and the New York-Washington from 2:45 to 2:15 h (30
min) (NEC MPWG 2010).
2.5.2.2. Amtrak’s Vision for HSR in the Northeast Corridor
After the 2010 NECMP was released, Amtrak thought more ambitiously and on a longer
timeframe about an international-quality HSR system. Its “Vision for High-Speed Rail in the
Northeast Corridor” depicted a Next-Generation HSR system (NextGen) on a new, fully
dedicated track alignment from Boston to Washington, to be completed by 2040. The $117-
billion estimated investment was to provide a range of frequent HSR services, reducing trip
times down to 1:23 h from Boston to New York, and 1:36 h from Washington to New York.
Traveling at top speeds of 220 mph with the NextGen HSR, the Washington-Boston trip would
take 3:23 h, cutting current travel time in half. Annual ridership would be as high as 17.7 million
on the NextGen HSR, and 16.1 million on regional services, five and two times the current
ridership levels on the Acela and Northeast Regional, respectively. NEC revenue would rise
threefold, yielding an annual operating surplus of $900 million (Amtrak 2010).
Figure 2.4 shows a comparison of the projected ridership under both plans.
Figure 2.4- Projected Ridership NECMP and Vision 2010 (Amtrak 2010)
Two years later, in 2012, Amtrak updated the Vision with the development of the “NEC Capital
Investment Program”, reexamining capital investments and possible track alignments on the
NEC. The result was a $150 billion stair-step phasing investment strategy, consisting of two
sequenced programs: the NEC Upgrade Program (NEC-UP) and a revised NEC Next Generation
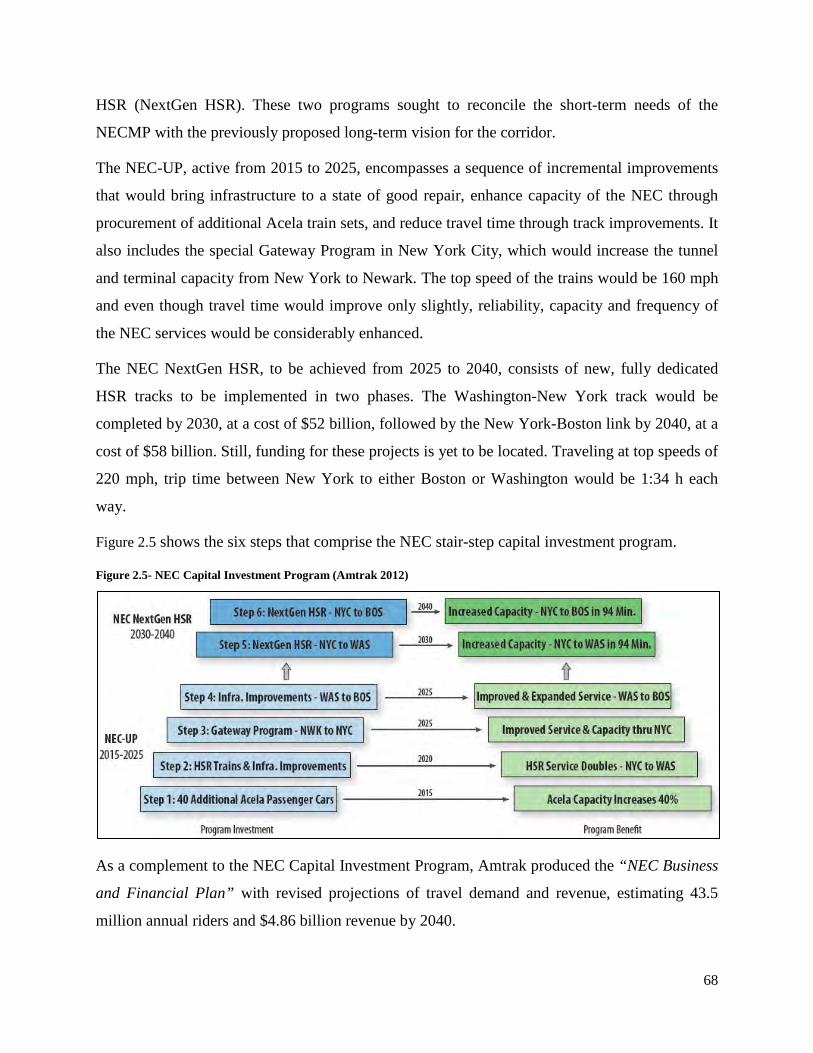
68
HSR (NextGen HSR). These two programs sought to reconcile the short-term needs of the
NECMP with the previously proposed long-term vision for the corridor.
The NEC-UP, active from 2015 to 2025, encompasses a sequence of incremental improvements
that would bring infrastructure to a state of good repair, enhance capacity of the NEC through
procurement of additional Acela train sets, and reduce travel time through track improvements. It
also includes the special Gateway Program in New York City, which would increase the tunnel
and terminal capacity from New York to Newark. The top speed of the trains would be 160 mph
and even though travel time would improve only slightly, reliability, capacity and frequency of
the NEC services would be considerably enhanced.
The NEC NextGen HSR, to be achieved from 2025 to 2040, consists of new, fully dedicated
HSR tracks to be implemented in two phases. The Washington-New York track would be
completed by 2030, at a cost of $52 billion, followed by the New York-Boston link by 2040, at a
cost of $58 billion. Still, funding for these projects is yet to be located. Traveling at top speeds of
220 mph, trip time between New York to either Boston or Washington would be 1:34 h each
way.
Figure 2.5 shows the six steps that comprise the NEC stair-step capital investment program.
Figure 2.5- NEC Capital Investment Program (Amtrak 2012)
As a complement to the NEC Capital Investment Program, Amtrak produced the “NEC Business
and Financial Plan” with revised projections of travel demand and revenue, estimating 43.5
million annual riders and $4.86 billion revenue by 2040.

69
2.5.2.3. NEC FUTURE
The “NEC FUTURE – Passenger Rail Corridor Investment Plan” is an ongoing planning effort
launched by the FRA to determine, assess and prioritize future investments on the NEC. The
overarching goal is to develop a rail network as part of an integrated, multi-modal transportation
solution in the NEC through 2040 (NEC FUTURE 2013a). The NEC FUTURE is a three-phase
planning process to be completed by 2015.
As a formal decision making process of a full range of service and alignment alternatives, the
NEC FUTURE encompasses a service development plan (SDP) and a programmatic
environmental impact statement (EIS), engaging multiple stakeholders, and developing a
passenger rail corridor investment plan. Interestingly, the NEC FUTURE is an overall rail
transportation planning process and not an exclusive HSR planning process, unlike Amtrak’s
current vision.
After an initial scoping process with several public meetings and comments, a preliminary report
with fifteen possible alternatives was issued in April 2012. Notably, the alternatives do not
consider institutional changes, focusing solely on different levels of investment, alignments, and
services. The term “institutional-neutral” is used widely in this planning process as an
opportunity to provide new services that are not provided today, for example: a new direct
service between two cities, but not in the sense of not favoring an institutional structure over
another (or a given stakeholder over another), if considering new institutional arrangements.
Although some alternatives are suitable for top speeds of 220 mph, alternatives that limit top
speeds to 160 mph, including the do-nothing alternative, are also under consideration (NEC
FUTURE 2013b). The study’s end result could incorporate for prioritization many of Amtrak’s
prior recommendations or go another direction.
Figure 2.6 shows a summary of the networks of preliminary alternatives for the NEC in this
study. The northern leg of the corridor is visibly more open to alternative alignments, including
the developing of connecting corridor linkages. The southern part of the corridor has far fewer
variations, thus resembling what Amtrak presented in its vision for the NEC.

70
Figure 2.6- Initial Alternatives Networks for NEC Spine and Connecting Corridors (NEC FUTURE 2013b)
2.5.2.4. Alternative Approach to HSR in the US
In addition to these three planning efforts, there have been studies that looked at the NEC with
innovative methods and provided alternative ways to develop.
Sussman et al. (2012a, 2012b) use the CLIOS Process–an engineering systems framework for
analyzing Complex, Large-Scale, Inter-Connected, Open, Sociotechnical systems—, scenario
planning, and flexibility analysis to study the implementation of HSR in the NEC. The analysis
recognizes interactions between institutions and physical entities. In contrast with the NEC
FUTURE, four strategic decisions comprise the bundles of strategic alternatives in HSR
development, which, in fact, consider institutional decisions in the NEC: technology, ownership,
vertical structuring, and competition.

71
The analysis notes a great deal of uncertainty in such a long-term planning process. To account
for the tremendous political and economic uncertainty, the alternatives are analyzed under
different scenarios (i.e. stories about the way the world might turn out but not predictions of the
future or extrapolations of the past) that provide a wider range of possible futures. The result was
a clear prevalence of uncertainty and a broad range of performance of the alternatives.
That motivates the incorporation of institutional and technological flexibility into the
alternatives. Flexibility is the right but not the obligation to change a decision in order to respond
dynamically to different realizations of the future (i.e. an option). In this sense, institutional
flexibility was the option to change the institutional structure of Amtrak, and the technological
flexibility was the option to change from implementing a fully dedicated HSR to making
incremental upgrades on the existing network. The end-result of this qualitative analysis was that
flexibilities, like insurance, may have a cost, but they improve the expected outcome of the
system when uncertainty dominates. Furthermore, the flexibility may facilitate the
implementation of HSR by enabling adaptation of the alternatives to uncertain futures.
2.6. Chapter Conclusion
Amtrak, the National Railroad Passenger Corporation established in 1971, has been harshly
criticized over forty years of operations for its level of service, managerial practices, and
continuous unprofitability, to the extent that critics call for an end of subsidies or alternative
institutional arrangements. Amtrak responds that it has recently improved performance and that
the stream of subsidies is much lower than that of other transportation modes. Indeed, in 2000-
2012, there was substantial ridership and revenue growth at all levels, but the performance of the
22,000-mile nationwide system greatly contrasted with the performance of the 450-mile NEC
sub-network. Today, nationwide unprofitability and capacity constraints in the NEC remain as
two of the most pressing challenges that Amtrak faces. A productivity analysis could help settle
the dispute between Amtrak and its critics by determining if productivity changes in the past may
inform further improvements in the future. Furthermore, it could help identify routes or sub-
networks of Amtrak with great potential for improvement that could be prioritized under a
funding-constrained scenario.

72
The NEC, an intricate corridor stretching from Boston to Washington, and the preeminent face of
Amtrak, is at a potential renaissance point. Thus far, the introduction of the Acela Express in
2000–perhaps not a true HSR service but an improved service—benefited Amtrak and mobility
within the megaregion. Even with HSR trains running below their full potential, Amtrak showed
increasing operating profits, ridership, and air/rail market shares in the NEC. Furthermore, the
incremental ridership of the Acela Express was very profitable. These two reasons lead one to
believe in the potential of future HSR developments.
However, the implementation of future HSR in the NEC is nonexempt from complex upgrading
challenges. The characteristics of the corridor and the political support from the Obama
administration to HSR across the country motivated enhancements to the NEC. However, a main
challenge in upgrading this multi-stakeholder, multi-state, multi-purpose corridor under a
funding-constrained scenario and a polarized debate is in managing the pressing issues and
determining a consensual strategy for moving forward effectively. Some initiatives and studies
attempt to do so: the NECMP (2010), the Amtrak vision for HSR in the NEC (2010, 2012), the
multi-stakeholder effort NEC FUTURE (2012-present), and Sussman et al. (2012a, 2012b).
There are still alternatives to be scoped and significant choices to be made: investment levels,
alignments, services, perhaps even institutional arrangements. Uncertainty dominates in such a
long-term planning and implementing process. For some critics, substantial trip time reductions
are scheduled to be realized too far in the future. To make things more complicated, but perhaps
even more comprehensive, the NEC FUTURE seeks an integrated, multi-modal transportation
solution in the NEC through 2040, potentially not even considering further HSR development.
This planning process will not be completed until 2015. Again, a productivity analysis could help
evaluate and shape such implementation strategy by determining if productivity changes in the
past suggest future improvements in the NEC, or by prioritizing areas with great potential for
improvement.
Finally, while recently improved performance may be attributed to a number of factors, at this
moment it is difficult to point to specific drivers of performance and assess their impacts.
The next chapter lays out a structure to study productivity of passenger rail in the NEC and
addresses the productivity of the NEC-spine trains from FY 2002 to 2012.

73
2.7. Chapter References
Amtrak (2003-2012). Amtrak Year-End Monthly Performance Reports. Amtrak (2010). A Vision for High-Speed Rail in the Northeast Corridor. Amtrak (2011a). Amtrak’s Northeast Corridor: FY 2011. Amtrak (2011b). News Release ATK 133, October 13, 2011.
Amtrak (2011c). News Release ATK 11-020, February 14, 2011.
Amtrak (2012). The Amtrak Vision for the Northeast Corridor: 2012 Update Report. UIC (2013). Council of the European Union Directive 96/48. Accessed on March 2013
www.uic.org/spip.php?article971
Gardner, S. (2013). Creating Capacity for Growth–New Approaches for Managing the Future of the NEC. TRB 2013 Annual Meeting: Socioeconomic and Financial Aspects of Intercity Passenger Rail Subcommittee.
NEC Future (2013a). NEC FUTURE – Passenger Rail Corridor Investment Plan. Accessed on March 2013. www.necfuture.com
NEC Future (2013b). NEC FUTURE – Passenger Rail Corridor Investment Plan. Preliminary Alternatives Report.
Puentes, R., Tomer A., Kane, J. (2013). A New Alignment: Strengthening America’s Commitment to Passenger Rail. Metropolitan Policy Program at Brookings.
Sakamoto, R., & Massachusetts Institute of Technology. Dept. of Civil and Environmental Engineering. (2012). High Speed Railway Productivity: How Does Organizational Restructuring Contribute to HSR Productivity Growth? (S.M. in Transportation, Massachusetts Institute of Technology, Dept. of Civil and Environmental Engineering).
Sussman, J., Archila, A.F., Carlson S.J., Peña-Alcaraz, M., Stein N. (2012a). Transportation in the Northeast Corridor of the U.S.: A Multimodal and Intermodal Conceptual Framework. web.mit.edu/hsr-group/documents/jiti.pdf
Sussman, J., Pena-Alcaraz, M., Carlson, S. J., Archila, A. F., Stein, N. (2012b) Analysis of High-Speed Rail Implementation Alternatives in the Northeast Corridor: the Role of Institutional and Technological Flexibility.
The NEC Master Plan Working Group (MPWG) (2010). The Northeast Corridor Infrastructure Master Plan.
U.S. Bureau of Labor Statistics (USBLS) (2013). Consumer Price Index. http://www.bls.gov/cpi/data.htm
U.S. Government Accountability Office (USGAO) (2004). Intercity Passenger Rail: Amtrak’s Management of Northeast Corridor Improvements Demonstrates Need for Applying Best Practices. GAO--‐04--‐94, U.S. Government Accountability Office, Washington, D.C.
U.S. Census Bureau (2013). Census Data. Accessed on March 2013. www.uscensus.gov
74
U.S. Department of Transportation Federal Railroad Administration (FRA). (1997). High- Speed Ground Transportation for America. U.S. Department of Transportation: Washington, D.C.
U.S. Department of Transportation Federal Railroad Administration (FRA). (2009). Vision for High-Speed Rail in America. High-Speed Rail Strategic Plan. U.S. Department of Transportation, Washington, D.C.
U.S. Department of Transportation Federal Railroad Administration (FRA). (2013) HSR overview. Accessed on February 2013. www.fra.dot.gov/Page/P0140

75
3. Past Productivity in the NEC
3.1. Introduction
This chapter lays out a structure to study the productivity of passenger rail in the NEC. Then it
addresses the productivity of the NEC-spine trains (as defined in Chapter 2) from FY 2002-2012.
3.2. Data, Scope, and Method of Analysis
The data and method of analysis are critical in a productivity study, and therefore must be
carefully chosen (see Chapter 1). This analysis focuses on the evolution of four Single Factor
Productivity (SFP) metrics, on the Express, Regional, and Combined NEC-level services. While
three SFP metrics give insights into the productivity on the demand side (ridership, revenue, and
RPM SFP with respect to operating costs), only one (ASM SFP with respect to operating costs)
refers to the productivity on the supply side.
3.2.1. Sources of Data
Data were compiled for FY 2002-2012 from Amtrak’s year-end monthly performance reports.
The Route Performance section (section C) of those reports included operational data at the
individual route level, while the Financial Results section (section A) included data on ridership
and revenue (see Appendix A: NEC Data FY 2002-2012). Most data were monetized (revenue,
cost breakdown, and contribution/profit) except for ridership data. Auxiliary metrics such as
Revenue Passenger-Miles (RPM), Available Seat-Miles (ASM) and Average Load Factor (ALF)
were derived from reported, monetized data, where possible.
Amtrak changed the format of the monthly performance reports four times during the period of
study: in FY 2005, 2006, 2009, and 2010. These format changes comprised different, sometimes
incompatible cost breakdowns, allocation methods, or route definitions. Fortunately, data were
reported for the current and past fiscal year in each document. This enabled valid year-to-year
comparisons and calculations. In years with a format change, this also allowed us to check that
data under different formats were comparable. In the face of conflicted data for a given fiscal
year, after consideration of format changes, priority was given to audited over preliminary
reports and to newer over older reports.

76
Accordingly, the analysis was divided into different time periods depending on the route
definition and the productivity metric, as will be shown in Section 3.3.2: SFP Analysis.
3.2.2. Output and Input Data
Table 3.1 displays the output and input data categories retrieved from Amtrak’s reports since FY
2002. White cells indicate data that were directly retrieved from Amtrak’s reports; light-blue
cells show indirectly calculated data; and gray cells point to data that were either not reported or
that could not be computed at all.
Table 3.1- Outputs and Inputs
Reports 2003, 2004 2005 2006, 2007, 2008
2009 2010, 2011, 2012
FY 2002-2004 2004-2005 2005-2008 2008-2009 2009-2012
Outputs
Ridership Revenue Total Revenue
Ticket Revenue --- Revenue Passenger-Miles (RPM) --- Available Seat-Miles (ASM)
Inputs
Cost Cost Total Attributed Costs
Total Costs (Excl. Dep &
Int) Total Costs
--- FRA Defined Costs Direct Labor FRA Defined
Costs
Total Costs excl. OPEB's,
Capital Charge and Other Costs
--- Remaining Direct Costs
Other Direct Costs
Total Remaining
Direct Costs
OPEB's – Other Post-
Employment Benefits
---
Total Non-Direct Costs
(Exclude Dep, Int & Discont
Ops)
Total Shared Costs
Total Non-Direct Costs Capital Charge*
Categories of data varied according to the reporting format, and, in some fortunate cases, were
comparable despite such format changes. As shown by the thick borders in Table 3.1, outputs
were consistently reported with only minor name changes, while inputs were rarely so.
“Revenue” and “Total Revenue” referred to the same output data.

77
On the inputs side, total costs were reported before depreciation, interest, capital charges, and
discontinuous operations, despite showing different labels. However, the cost breakdown did
present incompatible categories after each format change. For this reason, total costs were
considered when calculating productivity metrics instead of the specific cost categories.
No input “quantity” data were reported; rather, all inputs were “monetized”, a condition that
allowed their aggregation into a single-input metric: costs. Thus, the production process of
Amtrak could be considered as single-output single-input, with varying output categories but
with costs as single input. Hence, the productivity metrics used are labeled single factor
productivity (SFP) instead of partial productivity (see Figure 1.1).
3.2.3. Route Definitions
In addition to data categories, Amtrak also modified the route definitions of the NEC in the
monthly performance reports, even within different sections of a single document. Furthermore,
various Amtrak services ended operations in the past decade. This translated into data that were
sometimes reported for combined routes, or that were untraceable to the present day due to
discontinuity in the service offered.
For these reasons, the analyzed routes were scoped down to Express, Regional, and an overall
NEC level. Table 3.2 shows the distinct route definitions in the NEC for FY 2002-2012, and a
description of the routes follows.
Table 3.2- NEC Route Definition
Reports 2003, 2004 2005 2006, 2007, 2008 2009 2010, 2011, 2012
FY 2002-2004 2004-2005 2005-2008 2008-2009 2009-2012
Express 01-Acela Express 01-Acela and
01/02-Acela/Metroliner
01-Acela
02-Metroliner ---
Regional 05-Regional 05A-Regional/Federal 05-Regional(s) 05-Northeast Regional 06-Federal ---
Clocker 13-Clocker Service --- Crew Labor --- 91-NEC Unknown
(Crew Labor) ---
Special Trains --- 99 and
06/98/99-NEC Special Trains 99-(NEC)
Special Trains Bus
Route --- 70-NEC Bus Route ---

78
EXPRESS: Express is comprised of two routes: the Acela Express and the Metroliner. The
Acela (Route 01 – RT01) was described in Section 2.4.2: NEC Operations and Services. The
Metroliner (RT02) was an express service that ran between New York and Washington, in the
southern leg of the NEC, from January 1969 to October 2006, and is regarded as an important
precursor of HSR (Goldberg 2006). Originally, the Metroliner was scheduled to be retired in the
early 2000’s, but extended its lifetime due to recurrent technical problems of the Acela train sets.
Upon the Metroliner’s retirement, the Acela remained the only express service in the NEC, and
its data were reported individually. While these two services were accounted separately in the
FY 2003-2005 reports, they were jointly reported in the FY 2006 report, partly because the
Metroliner replaced most of the Acela services in that year, due to technical problems of the
latter.
REGIONAL: Regional is comprised of the (Northeast) Regional and the Federal. The
(Northeast) Regional (RT05) was described in Section 2.4.2: NEC Operations and Services. The
Federal (RT06) was a service that replaced a dedicated sleeper train on the NEC, and gradually
merged operations with regional services until its retirement in 2006. The Federal was of little
relative importance; for instance, it carried 3.7% of the passengers and collected 4.5% of the
ticket revenue of RT05 in FY 2002.
In the FY 2003-2004 monthly performance reports, data for the (Northeast) Regional and Federal
were reported separately. In FY 2005, both services were jointly reported as Regional/Federal
(RT05A). By FY 2006, the Federal was completely out of service, a point from which the
Northeast Regional (RT05) performance data were reported individually.
CLOCKER: The Clocker Service (RT13) ran between Philadelphia and New York, mostly
serving commuters and day-travelers, from May 1971 until October 2005. In its last years of
service, the Clocker carried close to 2 million passengers per year. Upon termination of the
service those riders shifted mainly to regular commuter services not offered by Amtrak. Not until
FY 2012 did Amtrak break the NEC ridership record that had been previously established in
times of the Clocker (11.3 million annual passengers in FY 2004). Because the Clocker service is
no longer available, it was removed from the scope of analysis but considered when assessing the
overall NEC productivity.

79
MISCELLANEOUS ROUTES: In addition to the abovementioned services, there were
miscellaneous routes running on the NEC: the NEC Crew Labor, NEC Special Trains, and NEC
Bus Route. Some did not transport revenue passengers, and their incidence on costs and revenues
was insignificant or non-existent at all. For this reason they were not analyzed individually.
However, they were in fact considered in the calculations at the overall NEC level.
Table 3.3 shows a timeline of the main route changes in the NEC-Spine, which were just
discussed.
Table 3.3- Timeline of Routes in the NEC Spine YEAR EVENT 1969 January, Metroliner (RT02) starts operations
1971 May, Clocker Service (RT13) starts operations
1995 Northeast Regional (RT05) starts operations
2000 December, Acela Express (RT01) starts operations
2002 August, Acela Express braking system problems
2005 April-September Acela Express stoppage
2005 October, Clocker Service (RT13) ends operations
2006 October, Metroliner (RT02) ends operations
2006 Federal (RT06) ends operations
Appendix A: NEC Data FY 2002-2012 includes tables with data for the NEC and exhibits of
original data.
3.2.4. Method of Analysis
The choice of a method for calculating productivity depends on factors like purpose of analysis,
type of data, data availability, computational resources and context-specific constraints.
Robustness is a most desired attribute that a productivity analysis should have (see Section 1.7:
Chapter Conclusion).
Price effects were removed by inflating monetized quantities by an appropriate consumer price
index (CPI) to 2012 USD. This guaranteed that productivity changes could be attributed to
changes in technical/managerial change, economies of scale, or external factors, and not to price
effects plus some of these factors (see Section 1.5: Data Requirements).

80
Costs were inflated by the general CPI (series CUUR0000SA0), while revenues were inflated by
the transportation CPI (series CUUR0000SAT 2002-2007 and CUUR0000SS53022 2007-2012)
(USBLS 2013). Using the transportation CPI for expenditures would have ignored that Amtrak
paid for goods and services that are not exclusively related to transportation, e.g., utilities. On the
other hand, it was preferable to manipulate revenues with the transportation CPI over the general
CPI, as Amtrak’s output was indeed a transportation service. A specific CPI series for intercity
train fare was available since 2007 (CUUR0000SS53022). For preceding years, the
transportation CPI was used instead. This returns more reliable results for recent years, and, as a
side note, results are robust enough relative to the use of one series or the other.
This productivity analysis selected a popular non-parametric (index number) approach (see
Section 1.4: Methods for MFP/TFP). Although a non-parametric of approach cannot distinguish
between the specific sources of productivity change, thus sacrificing the amount of information it
returns, the alternative, a parametric approach, is more data-intensive and computationally
complex. Moreover, it would have required the estimation of production functions that cannot be
estimated with currently available data.
In order to strengthen the selected non-parametric approach, four distinct SFP metrics were
analyzed: ridership, revenue, RPM, and ASM productivity with respect to operating costs. Each
SFP metric had a different meaning that gave different insights into what the specific
productivity changes were. Thus, using several metrics allowed making an inference on the
drivers of productivity change without the need for a parametric approach.
Next, the year-to-year SFP was calculated by considering the total costs as the single input, and a
varying output category as the single output. As mentioned earlier (see Section 3.2.2: Output and
Input Data), the Amtrak’s routes could be reduced to a single-output single-input process, thus
labeling productivity metrics as SFP instead of partial productivity. This general formulation is
shown in Equation 3.1.
Equation 3.1- Year-To-Year SFP Formulation
ln �𝑆𝑀𝑃1𝑆𝑀𝑃0
� = ln �𝑃1𝑃0� − ln �
𝑥1𝑥0� ;
𝑊ℎ𝑒𝑃𝑒 𝑃 = 𝑃𝑃𝑃𝑂𝑃𝑃, 𝑥 = 𝑃𝐼𝑂𝑃𝑃, 1 = 𝑃𝑃𝑃𝑃𝑒𝐼𝑃 𝑃𝑒𝑎𝑃, 0 = 𝑂𝑃𝑒𝑃𝑃𝑃𝑃𝑂 𝑃𝑒𝑎𝑃

81
This particular type of transformation is a non-parametric Törnqvist trans-log index. Several
authors have praised it as a robust and convenient to compute method, preferable over other main
index number methods like Laspeyres, Paasche or Fisher (OECD 2001, Coelli et al. 2005, Caves
et al. 1981). Apostolides (2008) also stated that there was very little empirical difference between
the Törnqvist trans-log index and the growth accounting method, the two most robust methods
widely used in the literature. The Törnqvist formula is easier to compute.
As per recommendation of OECD (2001), the cumulative SFP was obtained by compounding the
year-to-year variations instead of by directly computing an inter-year SFP. This has two
advantages. First, year-to-year measures guarantee comparability of data, since these were
retrieved from the same report. As mentioned earlier, there were changes in the cost-allocation
method in some reports, which complicated valid multi-year comparisons. Second, for the (not-
analyzed) case of multiple inputs, i.e., MFP or TFP, the year-to-year changes would handle
changes in input/output weights more gradually than cumulative calculations with respect to a
fixed base year (see Section 1.4: Methods for MFP/TFP).
Finally, FY 2005 was selected as the base year for compounding the cumulative SFP for two
reasons. First, there was certainty of the route definitions from that year on. Second, it was the
earliest that all productivity metrics were defined.

82
3.3. Past Productivity in the NEC
3.3.1. Context of the Past Decade in the NEC 2002-2012
Four notable episodes marked the past decade in Amtrak’s NEC. First, two important route
changes took place: the removal of the Clocker Service in October 2005 (beginning of FY 2006)
and the last run of the Metroliner in October 2006 (beginning of FY 2007) (see Table 3.3).
Second, the Acela train sets experienced recurrent technical problems with its braking system in
2002 and 2005. The latter removed the entire fleet from April to July 2005, and reestablished full
Acela service by September 2005. Third, a salient, external event occurred: the economic
recession of 2008-2009, the most serious economic recession since the Great Depression of
1930. And fourth, the Obama administration allocated funding for targeted capital investments
on the NEC starting in 2009.
Figure 3.1 shows the ridership breakdown of the NEC. Ridership on express services has been flat
since FY 2002, at 3.0—3.4 million annual passengers, with a downturn in FY 2005 due to
technical problems of the Acela train sets, and another in FY 2009 due to the economic
recession. The former, a problem on Amtrak’s side, coincided with a temporary surge in
ridership on regional services, as those trains accommodated some of the spilled demand from
express services.
Figure 3.1- NEC Ridership Breakdown FY 2002-2012 (Adapted from Amtrak 2003-2012)

83
On the other hand, ridership on regional services has gone up almost steadily at about 200,000
riders per year, with some fluctuations along the way: the aforementioned surge in FY 2005, for
better, and the economic downturn of FY 2009, for worse. Without considering the Clocker
Service, ridership on the NEC has also increased at 200,000 riders per year, with some
fluctuations, and most recently at 500,000 riders per year. While traffic growth is gratifying, it is
a worrisome situation for an already constrained corridor.
Figure 3.2 shows the revenue breakdown of the NEC. Technical problems with the Acela Express
resulted in lost revenue for the NEC, particularly in FY 2005. After that, express services
repositioned in the market and continuously increased its revenue, with the exception of the FY
2009 setback.
Regional services, in contrast, grew steadily and were less sensitive to economic conditions than
express services. Thus, the volatility of the NEC ticket revenue was explained mostly by the
sensitiveness of express services, while the majority of the net revenue growth was explained by
growth in regional services.
Figure 3.2- NEC Ticket Revenue Breakdown FY 2002-2012 (Adapted from Amtrak 2003-2012)
As implied by Figure 3.1 and Figure 3.2, the effect of the economic recession of 2009 was a
regrettable 2-3-year setback in ridership and revenue, for all routes in the NEC. Overall, the
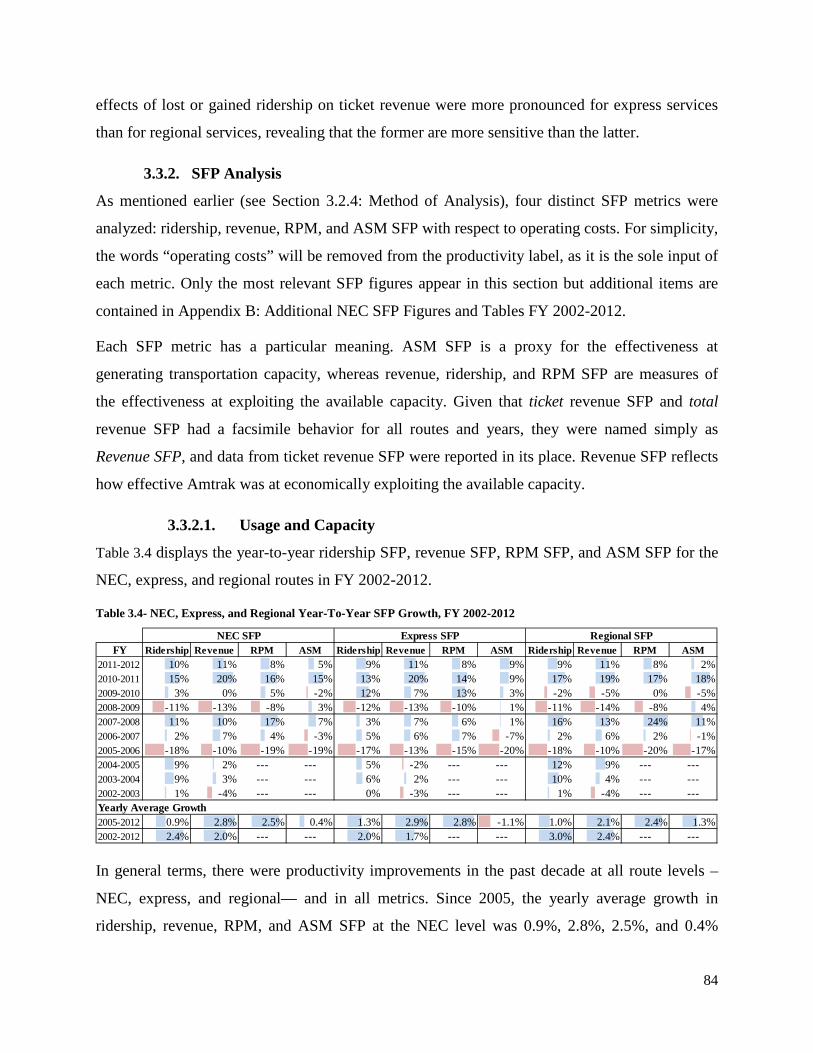
84
effects of lost or gained ridership on ticket revenue were more pronounced for express services
than for regional services, revealing that the former are more sensitive than the latter.
3.3.2. SFP Analysis
As mentioned earlier (see Section 3.2.4: Method of Analysis), four distinct SFP metrics were
analyzed: ridership, revenue, RPM, and ASM SFP with respect to operating costs. For simplicity,
the words “operating costs” will be removed from the productivity label, as it is the sole input of
each metric. Only the most relevant SFP figures appear in this section but additional items are
contained in Appendix B: Additional NEC SFP Figures and Tables FY 2002-2012.
Each SFP metric has a particular meaning. ASM SFP is a proxy for the effectiveness at
generating transportation capacity, whereas revenue, ridership, and RPM SFP are measures of
the effectiveness at exploiting the available capacity. Given that ticket revenue SFP and total
revenue SFP had a facsimile behavior for all routes and years, they were named simply as
Revenue SFP, and data from ticket revenue SFP were reported in its place. Revenue SFP reflects
how effective Amtrak was at economically exploiting the available capacity.
3.3.2.1. Usage and Capacity
Table 3.4 displays the year-to-year ridership SFP, revenue SFP, RPM SFP, and ASM SFP for the
NEC, express, and regional routes in FY 2002-2012.
Table 3.4- NEC, Express, and Regional Year-To-Year SFP Growth, FY 2002-2012
In general terms, there were productivity improvements in the past decade at all route levels –
NEC, express, and regional— and in all metrics. Since 2005, the yearly average growth in
ridership, revenue, RPM, and ASM SFP at the NEC level was 0.9%, 2.8%, 2.5%, and 0.4%
FY Ridership Revenue RPM ASM Ridership Revenue RPM ASM Ridership Revenue RPM ASM2011-2012 10% 11% 8% 5% 9% 11% 8% 9% 9% 11% 8% 2%2010-2011 15% 20% 16% 15% 13% 20% 14% 9% 17% 19% 17% 18%2009-2010 3% 0% 5% -2% 12% 7% 13% 3% -2% -5% 0% -5%2008-2009 -11% -13% -8% 3% -12% -13% -10% 1% -11% -14% -8% 4%2007-2008 11% 10% 17% 7% 3% 7% 6% 1% 16% 13% 24% 11%2006-2007 2% 7% 4% -3% 5% 6% 7% -7% 2% 6% 2% -1%2005-2006 -18% -10% -19% -19% -17% -13% -15% -20% -18% -10% -20% -17%2004-2005 9% 2% --- --- 5% -2% --- --- 12% 9% --- ---2003-2004 9% 3% --- --- 6% 2% --- --- 10% 4% --- ---2002-2003 1% -4% --- --- 0% -3% --- --- 1% -4% --- ---Yearly Average Growth2005-2012 0.9% 2.8% 2.5% 0.4% 1.3% 2.9% 2.8% -1.1% 1.0% 2.1% 2.4% 1.3%2002-2012 2.4% 2.0% --- --- 2.0% 1.7% --- --- 3.0% 2.4% --- ---
Express SFP Regional SFPNEC SFP
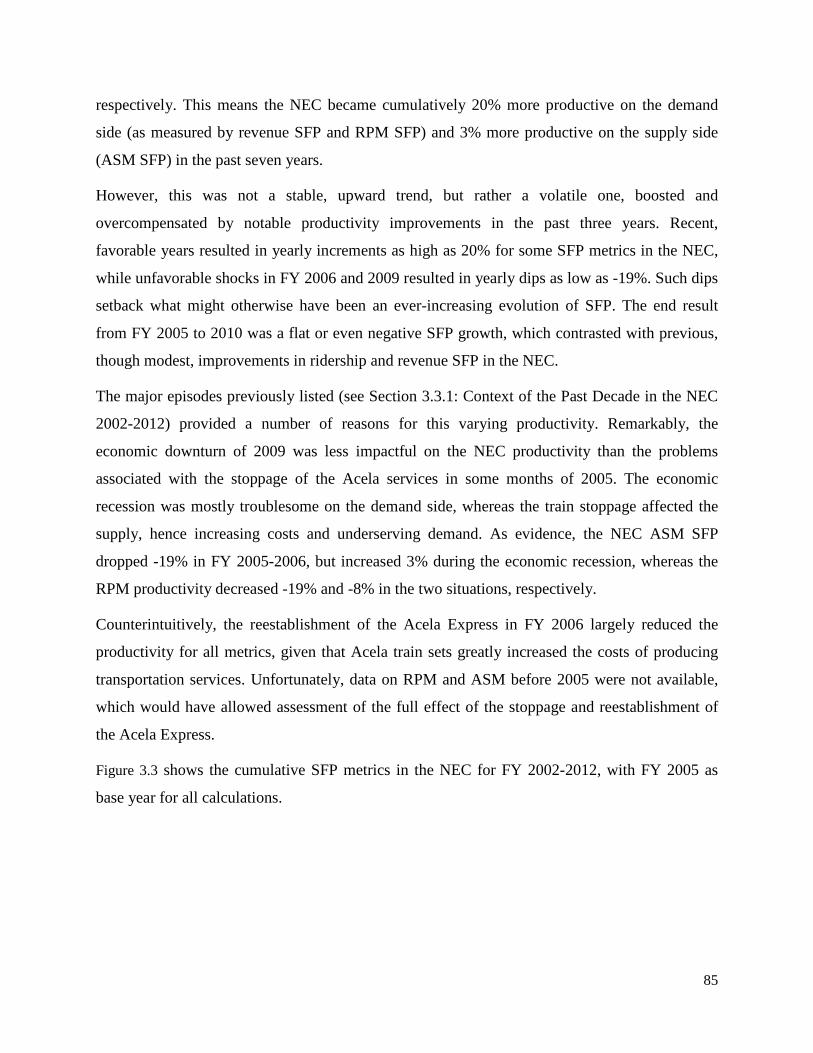
85
respectively. This means the NEC became cumulatively 20% more productive on the demand
side (as measured by revenue SFP and RPM SFP) and 3% more productive on the supply side
(ASM SFP) in the past seven years.
However, this was not a stable, upward trend, but rather a volatile one, boosted and
overcompensated by notable productivity improvements in the past three years. Recent,
favorable years resulted in yearly increments as high as 20% for some SFP metrics in the NEC,
while unfavorable shocks in FY 2006 and 2009 resulted in yearly dips as low as -19%. Such dips
setback what might otherwise have been an ever-increasing evolution of SFP. The end result
from FY 2005 to 2010 was a flat or even negative SFP growth, which contrasted with previous,
though modest, improvements in ridership and revenue SFP in the NEC.
The major episodes previously listed (see Section 3.3.1: Context of the Past Decade in the NEC
2002-2012) provided a number of reasons for this varying productivity. Remarkably, the
economic downturn of 2009 was less impactful on the NEC productivity than the problems
associated with the stoppage of the Acela services in some months of 2005. The economic
recession was mostly troublesome on the demand side, whereas the train stoppage affected the
supply, hence increasing costs and underserving demand. As evidence, the NEC ASM SFP
dropped -19% in FY 2005-2006, but increased 3% during the economic recession, whereas the
RPM productivity decreased -19% and -8% in the two situations, respectively.
Counterintuitively, the reestablishment of the Acela Express in FY 2006 largely reduced the
productivity for all metrics, given that Acela train sets greatly increased the costs of producing
transportation services. Unfortunately, data on RPM and ASM before 2005 were not available,
which would have allowed assessment of the full effect of the stoppage and reestablishment of
the Acela Express.
Figure 3.3 shows the cumulative SFP metrics in the NEC for FY 2002-2012, with FY 2005 as
base year for all calculations.

86
Figure 3.3- NEC, Cumulative SFP Growth FY 2002-2012
The NEC was less productive in FY 2010 than in FY 2005 for all SFP metrics. However, by FY
2012, Amtrak was far more effective at using the available capacity in the NEC (by filling up
trains with more passengers over longer distances) than at generating it (running trains cheaper)
with respect to FY 2005. As evidence, cumulative ASM SFP has been lower than cumulative
RPM SFP since FY 2006.
The increased demand combined with a low marginal cost per RPM evidences economies of
scale that boosted productivity on the demand side in recent years. Most of the new ridership was
accommodated on existing capacity, at low extra costs.
Naturally, these economies of scale have had little effect on the supply side. ASM productivity
was improved, instead, by recent appropriations of funding that addressed critical infrastructure
bottlenecks on the NEC. This allowed the NEC to become in FY 2012 just as ASM productive as
it was in FY 2005. The difference now is that the increased costs of running HSR rolling stock
are compensated for by a more efficient use of infrastructure.
Also, cumulative RPM SFP exceeded ridership SFP, implying that people were traveling longer
distances on the NEC. This was also evidenced by the increased market share between the three
major cities of the NEC over the last decade, with essentially the same number of passengers.

87
Finally, the usage of the capacity was more volatile with respect to external factors than the
generation of capacity in the NEC. For instance, the economic dip of 2009 greatly affected the
demand side of the NEC (RPM, ridership and revenue SFP) but had little influence on the
productivity of the supply side (ASM SFP). Ridership, revenue, and RPM SFP also increased at
higher rates than ASM SFP in favorable years.
Thus, such sensitive behaviors suggest a few critical characteristics of the NEC: volatility to
external events, large economies of scale, and slow capacity adjustments, which varied
depending on the route.
3.3.2.2. Route Comparisons
Figure 3.4 shows the cumulative SFP metrics of the express and regional services for FY 2002-
2012, with FY 2005 as base year for all calculations.
Figure 3.4- a) Express and b) Cumulative SFP Growth FY 2002-2012
There are two important observations. First, after FY 2006, the ASM productivity of express
services kept going down while the regional recovered more rapidly. The introduction of more
Acela services (newer rolling stock) and the removal of older trains (Metroliner) increased
operating cost per train-mile. Such costs remained high for the express routes, i.e., low ASM
productivity, until the recent capital investments on the NEC.
Second, the productivity of express services was more volatile than that of regional services,
providing thus a greater range of performance, for better or worse.

88
3.3.3. Sensitivity Analysis
At this point, it is important to note that the results presented so far are robust to changes in key
assumptions.
The route selection has little influence on productivity metrics. See Appendix B: Additional NEC
SFP Figures and Tables FY 2002-2012 for tables that show that year-to-year productivity before
2005 was fundamentally similar, even after inclusion or exclusion of some routes.
Different calculations with alternative CPI for transportation return similar results. For instance,
using the entire series CUUR0000SAT to deflate revenues for FY 2002-2012 would return
comparable results to the calculations shown in this analysis.
3.4. Chapter Conclusion
After a process of data rationalization and scoping of the analysis at the route levels, this chapter
demonstrated that a non-parametric SFP Törnqvist trans-log index with varying metrics was
useful to assess the productivity of the NEC-spine trains from FY 2002 to 2012. This structure of
analysis is first of its kind for intercity passenger rail transportation productivity in the U.S.,
which has never been studied in isolation before, or for the selected time period (to the best of
the author’s knowledge). Despite data constraints and inconsistencies, the analysis provided
robust results that could be associated to notable episodes of the past decade. It went on to
evaluate specific sets of routes and it overcame various limitations of parametric methods
through the use of multiple SFP metrics and year-to-year calculations. Within the limited
productivity literature for rail transportation in general, the analysis has provided a robust
platform for future productivity studies of passenger services. An immediate extension of this
method could be the analysis of other routes or sub-networks of Amtrak in the same time period.
The productivity analysis was useful to understand the system’s behavior. In general, the NEC
experienced volatile productivity changes in FY 2002-2012; by FY 2010 it was less productive
than in FY 2005, but in the last three years its productivity boosted. Several events provided
reasons for that varying productivity: route changes, technical problems with train sets, capital
investments in the NEC, and economic recession and recovery. The results suggested critical
characteristics of the NEC: volatility to external events, large economies of scale, and slow
adjustment of capacity. Such characteristics, however, were not homogenous and rather

89
depended on specific routes. For instance, the productivity of express services was more volatile
than that of regional services, thus showing a greater range of performance. In addition,
increasing ALF suggest that the productivity increments achieved through economies of scale
might be limited in the future unless the capacity of the corridor is enhanced. This is a worrisome
situation for a corridor that exhibits slow capacity adjustments and that not until 2015 will define
a clear capital investment strategy.
These results are useful in thinking about if and how to move forward with HSR in the NEC.
Express services proved to have a wide range of performance, thus revealing risks and
opportunities for an uncertain future. The fact that NEC users are traveling longer distances is
promising for HSR, as it shows that trains are now more competitive in short-haul (<500 miles)
air markets. When contrasted with previous studies of rail transportation in the U.S., Amtrak’s
results are impressive. Although results are not directly comparable, Amtrak experienced higher
average productivity improvements in FY 2002-2012 than the U.S. railroads (freight and
passenger) in 1951-1974 (2.5% RPM SFP v. 1.5% [RPM & RTM] TFP) (Caves et al. 1980).
These are reasons to be optimistic with the potential for enhanced HSR service.
However, the ability to implement and operate HSR is similar as the state of the regional
economy so far as productivity concerns go. For example, the reestablishment of the Acela
Express in FY 2006 reduced productivity more than the economic recession of 2009, and ASM
SFP only recovered after infrastructure investments in recent years. Although the introduction of
40 additional Acela-Express coach cars to lengthen the train sets in FY 2014 is promising
(Amtrak 2011c), it might not increase ASM productivity if not coordinated with infrastructure
enhancements and modifications to maintenance facilities.
Furthermore, productivity benefits may take years to realize. Perhaps productivity is expected to
go down after the initial years of the establishment of a new HSR. If the financial leverage is not
there to temporarily support adverse events, or if the market and managers take too much time to
adapt to changing conditions, there may be reasons to doubt future HSR development in the
NEC.
When designing a strategy for targeted investments in the NEC, it would be useful to analyze the
northern and southern leg of the NEC spine independently. An analysis at a more disaggregate

90
level would allow flagging potential areas for improvement, and could determine where
enhancements would be the most effective.
The next chapter will use the structure developed in this chapter to analyze the prospects of
future HSR in the NEC.

91
3.5. Chapter References
Amtrak (2003-2012). Amtrak Year-End Monthly Performance Reports. Amtrak (2011c). News Release ATK 11-020. February 14, 2011.
Apostolides, A. (2008). A Primer on Multifactor Productivity: Description, Benefits, and Uses. US Department of Transportation, Research and Innovative Technology Administration, Bureau of Transportation Statistics, Office of Advanced Studies, Washington, DC.
Caves, D. W., Christensen, L. R., & Swanson, J. A. (1980). Productivity in US Railroads, 1951-1974. The Bell Journal of Economics, 166-181.
Caves, D. W., Christensen, L. R., & Swanson, J. A. (1981). Economic Performance in Regulated and Unregulated Environments: A Comparison of US and Canadian Railroads. The Quarterly Journal of Economics, 96(4), 559-581.
Coelli, T. J., Rao, D. S. P., O'Donnell, C. J., & Battese, G. E. (2005). An Introduction to Efficiency and Productivity Analysis. Springer.
Goldberg B. (2006). Metroliner’s Amazing Career. TRAINS Magazine, June 2006. Retrieved on April 2013, from: http://trn.trains.com/en/sitecore/content/Home/Railroad%20Reference/Passenger%20Trains/2006/06/Metroliners%20amazing%20career.aspx
Measuring Productivity, OECD (2001). Manual: Measurement of Aggregate and Industry-Level Productivity Growth.
The New York Times (2005). Amtrak Suspends Acela Trains After Finding Brake Problems. Retrieved on April 20, 2013 from http://www.nytimes.com/2005/04/15/national/15cnd-amtr.html?_r=0
U. S. Bureau of Labor Statistics (USBLS) 2013. Consumer Price Index. Retrieved from http://www.bls.gov/cpi/data.htm


93
4. Future Productivity in the NEC
4.1. Introduction
This chapter uses the structure of analysis and findings of Chapter 3 to make inferences on the
productivity of future HSR developments in the NEC.
4.2. Cases of Analyses
Three cases of analyses for the future productivity of the NEC were developed.
The first case of analysis is obtained by extrapolating the recent trends identified in Chapter 3.
This case is referred to as EXTRAPOLATION.
The additional cases of analyses are based on Amtrak’s and FRA’s perspectives on HSR
development in the NEC for the next 30 years, which represent the most well-documented
initiatives for development of the corridor: the NEC Master Plan (NECMP) in 2010, the Vision
for HSR in the Northeast Corridor in 2010 and updated in 2012, and the NEC FUTURE –
Passenger Rail Corridor Investment Plan in 2012-2015 (see Section 2.5.2: Prospects for HSR in
the NEC). The first two of those initiatives represent the two additional cases of analyses for this
chapter: NECMP, and NEC VISION. The third initiative, the NEC FUTURE, was not
considered as a case for analysis because it is at the early stages of development, where only
preliminary alternatives without detailed information are available (see Section 2.5.2.3: NEC
FUTURE).
The following is a brief description of the three cases of analyses to be discussed in this chapter.
1. EXTRAPOLATION: our 20-year projection of the trends for the four distinct SFP metrics
analyzed in Chapter 3, i.e., ridership SFP, revenue SFP, revenue passenger-miles SFP, and
available seat-miles SFP. This is a hypothetical example created by the author. Neither
Amtrak nor the FRA claim to sustain such productivity growth rates. In addition, the
EXTRAPOLATION does not specify what would be the interventions on the NEC that
would allow it to sustain such productivity growth rates, but speculates on possible factors
that might do so.

94
2. NECMP: The NECMP is an Amtrak-led multi-stakeholder initiative, a $52-billion
expenditure plan from 2010 to 2030 to bring existing infrastructure to a state of good repair,
increase capacity to accommodate expected growth of commuters, intercity travelers, and
freight trains, and modestly improve trip time between cities along the corridor (see Section
2.5.2.1: The NEC Master Plan). Our analysis of the NECMP is predominantly qualitative due
to lack of operating cost, ridership, and revenue data.
3. NEC VISION: The NEC VISION is Amtrak’s Vision for HSR in the NEC, a $150-billion
stair-step phasing investment strategy with two sequenced programs: the NEC Upgrade
Program (NEC-UP) and the NEC Next Generation HSR (NextGen HSR) (See Section
2.5.2.2: Amtrak’s Vision for HSR in the Northeast Corridor). Our analysis of the NEC
VISION is quantitative.
It is worth noting that the NEC VISION is not only more ambitious than the NECMP in terms of
the time frame (extending beyond 2030 to 2040) and total investments, but also different in its
path towards 2030. The central difference is that the NECMP mainly focuses on bringing the
NEC to a state of good repair, while the NEC VISION does seek to significantly improve HSR
services.
4.3. First Case: EXTRAPOLATION 2012-2030
The first case of analysis is our 20-year projection of the trends for the four distinct SFP metrics
analyzed in Chapter 3: ridership SFP, revenue SFP, revenue passenger-miles SFP, and available
seat-miles SFP—as explained earlier (see Section 3.2: Data, Scope, and Method of Analysis),
productivity on the demand side is measured by the first three metrics, whereas productivity on
the supply side is only measured by available seat-miles SFP.
Chapter 3 concluded that after some oscillating productivity changes in FY 2002-2010, the
productivity of the NEC was boosted in the last three years (FY 2010-2012). A simple
extrapolation of these findings combined with the recent market success of the NEC would imply
that productivity, and perhaps profitability, could keep growing in the next two decades.
Just to illustrate, ridership SFP, revenue SFP, revenue passenger-miles (RPM) SFP, and available
seat-miles (ASM) SFP grew at 12%, 15%, 12% and 10% per year, respectively, in the past three
years; and at a yearly average of 0.9%, 2.8%, 2.5%, and 0.4%, respectively, in the past seven

95
years (see Section 3.3.2.1: Usage and Capacity). Taking the latter values as a reasonable estimate
of long-term productivity growth—given that the former values would be very hard to sustain for
long periods of time and would ignore possible oscillations in productivity growth— then,
projected demand-side productivity would increase ~50% by 2030 (as measured by revenue SFP
and revenue passenger-miles SFP) and supply-side productivity would increase 10% by 2030 (as
measured by available seat-miles SFP). Ridership SFP, another metric of demand-side
productivity, would not greatly increase (~20% by 2030), implying that the NEC would not
simply accommodate new riders but also many new riders on longer-distance trips.
Figure 4.1 shows the extrapolated year-to-year productivity growth for 2013-2030, and Figure 4.2
shows the corresponding cumulative SFP growth (taking 2013 as the base year). The past
(actual) values of productivity growth (FY 2005-2012) are shown for reference in both figures.
Figure 4.1- EXTRAPOLATION, Year-to-Year SFP Growth FY 2005-2012 and 2013-2030
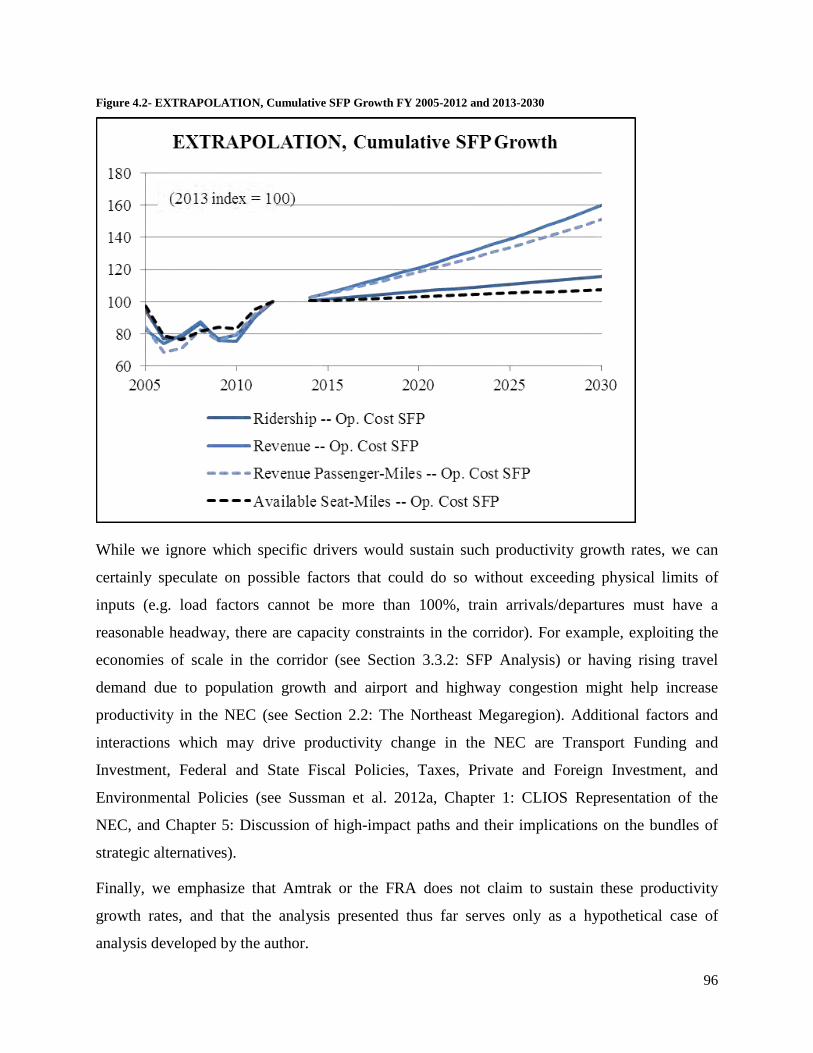
96
Figure 4.2- EXTRAPOLATION, Cumulative SFP Growth FY 2005-2012 and 2013-2030
While we ignore which specific drivers would sustain such productivity growth rates, we can
certainly speculate on possible factors that could do so without exceeding physical limits of
inputs (e.g. load factors cannot be more than 100%, train arrivals/departures must have a
reasonable headway, there are capacity constraints in the corridor). For example, exploiting the
economies of scale in the corridor (see Section 3.3.2: SFP Analysis) or having rising travel
demand due to population growth and airport and highway congestion might help increase
productivity in the NEC (see Section 2.2: The Northeast Megaregion). Additional factors and
interactions which may drive productivity change in the NEC are Transport Funding and
Investment, Federal and State Fiscal Policies, Taxes, Private and Foreign Investment, and
Environmental Policies (see Sussman et al. 2012a, Chapter 1: CLIOS Representation of the
NEC, and Chapter 5: Discussion of high-impact paths and their implications on the bundles of
strategic alternatives).
Finally, we emphasize that Amtrak or the FRA does not claim to sustain these productivity
growth rates, and that the analysis presented thus far serves only as a hypothetical case of
analysis developed by the author.

97
4.4. Second Case: NECMP 2010-2030
The second case of analysis corresponds to an examination of the prospects described in the
NECMP of 2010. This case of analysis is more valuable than the previous one
(EXTRAPOLATION), since it analyzes the prospective plans for the future rather than simply an
extrapolation of the past. However, the analysis is restricted to a qualitative assessment of
productivity, due to lack of operating cost, ridership, and revenue data that would have permitted
the calculation of productivity metrics.
If the recent trends found in Chapter 3 continue and the NECMP (as described by Amtrak in
2010) is indeed implemented, then the following is plausible:
On the supply side, available seat-miles productivity is likely to increase for two reasons.
First, the introduction of additional Acela coach cars to lengthen the existing train sets by
FY 2014 will exploit the large economies of scale of the corridor. Second, the NECMP
contemplates a number of capital expenditures to increase railroad capacity (i.e., the
numerator of the productivity metric) and reduce operating costs (i.e., the denominator of
the productivity metric): upgrades to tunnels, bridges, tracks, terminals, signals,
catenaries, and other facilities.
On the demand side, we speculate that revenue passenger-miles productivity would
increase if the current trend of more riders on longer and longer train trips on the NEC
persists (see Section 3.3.2: SFP Analysis).
The NECMP assumed 76% growth in NEC ridership and revenue (to 23 million annual
riders and $1.84 billion revenue) and 36% growth in daily trains (to 210 trains) by 2030.
This might increase the gap between revenue productivity and available seat-miles
productivity—as utilization increases much more than capacity—, potentially leading to
higher profitability given the profitable incremental ridership of the NEC (see Section
2.3.1.2: Revenue).
In the past, express services (Acela and Metroliner before 2006, Acela alone after 2006)
showed productivity growth that was volatile. Thus, the anticipated good economic
conditions and population growth in the NECMP would be promising for realization of
corridor opportunities for HSR. However, the NECMP does not expand express services
as much as regional services, which have less volatile productivity growth (see Section
98
3.3.2: SFP Analysis). This might be so because an expansion of express services would
require large capital investments that the NECMP did not contemplate, although the
market potential could be there. This investment decision would limit the potential for
profitability in the NEC.
The recent reorganization of Amtrak’s business lines and the additional improvements in
management practices might increase the ability to effectively implement and operate
enhanced HSR services. For example, the new six business lines are focused around key
market segments, giving special attention to two critical aspects of the NEC, operations
and infrastructure (Gardner 2013):
1) NEC Operations
2) NEC Infrastructure and Investment Development
3) Long-Distance Services
4) State-Supported Services
5) Commuter Services
6) Commercial Asset Development
Given that the ability to operate HSR is as important to productivity growth as the state of
the regional economy (see Section 3.4: Chapter Conclusion), a successful management
reorganization within Amtrak and other stakeholders of the NEC might lead to improved
productivity, reduced risk, and, possibly, profitability.
All this is ceteris paribus, i.e., no major interventions beyond the incremental upgrades that
would bring the NEC to a state of good repair and accommodate some capacity growth (as
planned by the NECMP). The few anticipated targeted capital investments of the NECMP would
not achieve substantial trip time reductions or an international-quality HSR service.
The NECMP is, in brief, a conservative case, not overly ambitious, but one that suggests future
productivity increments that unfortunately could not be quantified due to lack of data. Those
increments, however, ignore the uncertainty related to political support, external events,
additional investments or management changes that might affect the NEC performance over the
next two decades.
99
4.5. Third Case: NEC VISION 2013-2040
The third case of analysis corresponds to an examination of the NEC VISION developed by
Amtrak in 2010 and 2012, with the structure of productivity analysis developed by the author in
Chapter 3. This structure is applicable to many routes or sub-networks of Amtrak, and even to
the future performance of the NEC. However, the (by definition) absence of real future data
obliges us instead to study a projection of a possible future of the NEC, which requires credible
data that will enable a quantitative analysis of productivity.
So, in short, this section uses the structure of analysis developed in Chapter 3 to analyze
projected future data generated through examination of the vision for HSR in the NEC laid out
by Amtrak. Then, it uses international comparisons and a sensitivity analysis to gain more
confidence on the results.
4.5.1. Data for the NEC VISION 2013-2040
The foundation for data generation for the prospective future is “The Amtrak Vision for the
Northeast Corridor: 2012 Update Report” (Amtrak 2012). Unfortunately, this documentation
has only partial data presented in graphs and figures, not in tables, and the process by which
Amtrak made its forecasts is not public. Instead, the data and assumptions of the forecasts are
contained in the “NEC Business and Financial Plan”, a confidential document that has not been
disclosed at this time, but which we hope to have access to in the future; it can then be used to
improve this analysis.
4.5.1.1. Output and Input Data
Ideally, the same outputs and inputs used in Chapter 3—which were taken from historical
disaggregate data—should be used in this analysis. However, data constraints only permitted the
treatment of a reduced number of projected outputs and inputs. Still, the fact that similar outputs
and inputs are used throughout this document permits a comparison of future productivity levels
with those of the past.
OUTPUTS: The two outputs are revenue and ridership. Here, revenue passenger-miles and
available seat-miles were excluded, so there are only outputs related to the demand side, and not
to the supply side, in this analysis.

100
INPUTS: Exactly as in Chapter 3, the sole input is total operating costs (operation and
maintenance), excluding capital expenditures, depreciation, and interest.
The output and input data were digitized from figures presented in Amtrak (2012). In the case of
operating cost data, values for Total Net Operating Revenue were directly digitized from the
graphs and used in the calculation of Total Operating Costs as:
[Total Operating Costs] = [Total Revenue] – [Total Net Operating Revenue]2
Our analysis also required ridership and revenue data on 1-year intervals, which were not
directly available from Amtrak and had to be reconstructed. The 1-year-interval estimates were
linearly interpolated from the forecasted values given at each of the milestone years of the NEC
VISION: 2015, 2020, 2025, 2030, and 2040 (see Appendix D: Baseline Figures NEC VISION).
4.5.1.2. Scope and Limitations
Beyond the data constraints that limited the number of inputs and outputs, there are other aspects
that influence the analysis and are worth pointing out explicitly.
Data constraints require scoping the analysis to an overall NEC level. The NEC VISION
includes substantial route changes for which disaggregate data are not available. For example,
under the NEC VISION, the Acela Express is to expire and to be replaced by a range of HSR
services by 2030. Fortunately, the only routes considered in the NEC VISION are future regional
and HSR services, which would correspond to the evolution of the regional and express routes
analyzed earlier (see Section 3.2.3: Route Definitions). In addition, the operating and
maintenance costs are available at the NEC level, not at the route level, and at this point there is
not a way to reasonably allocate them. This does allows contrasting past productivity with future
productivity, but only at the NEC level.
Revenue, ridership, and operating cost forecasts from Amtrak (2012) are assumed to be accurate
(while, of course, recognizing that “the forecast is always wrong”, be it by Amtrak or by anyone
else). Also, the stair-step milestones are assumed to be implemented at the specified times. Thus,
the uncertainty of the forecasts is ignored. Given the inherent inaccuracy of travel demand
2 Amtrak did not report its projected operating costs directly. Instead, total revenue and total net operating revenue were reported. Total net operating revenue equals total revenue less operating costs. Thus, the author rearranged the equation to calculate the total operating costs.
101
projections and that large infrastructure projects usually have cost and schedule overruns,
ignoring uncertainty is unrealistic, but unavoidable.
To the best of the author’s knowledge, current forecasts omit technological or managerial
improvements that might change productivity (see Section 1.6.5: Factors that Influence
Productivity in Passenger Rail Transportation). It is possible, though, that such improvements
were considered in Amtrak’s forecasts, but, since their assumptions are not public, it is
impossible to tell one way or the other.
Large, unexpected regional events that might change productivity are not explicitly considered in
Amtrak’s forecasts. As shown in the past, performance on the NEC is quite sensitive to external
events, so these are important (see Section 3.3.2: SFP Analysis). The only major single events
included in Amtrak’s projections are the capacity enhancements currently planned.
Thus, eventual access to the confidential information contained in Amtrak’s NEC Business and
Financial Plan would allow us to retrieve the projected data directly, instead of having to digitize
it, and even to include projected outputs that at this point are excluded: available seat-miles and
revenue passenger-miles. In addition, disaggregate data at the specific route- or O-D-level, or
further information on the way in which Amtrak made the forecasts, would allow us to expand
the analysis of the future productivity of the NEC, and to compare more directly future and past
productivity. We hope to do this work in the future, once data become available to us.
4.5.1.3. Characterization of the NEC VISION
Figure 4.3 shows the characterization of the outputs and inputs of the NEC VISION for the period
2013-2040, after following the procedure just described. The evolution of the outputs (ridership
and revenue) and the input (operating cost) is overlapped with the two programs and six
milestone stages of the NEC VISION. The figure has two vertical axes: the left axis shows
revenue and operating costs in $ billions and the right axis shows ridership (dashed line) in
million passengers. Appendix C: Future Data NEC VISION 2013-2040 includes the data tables
that correspond to this case of analysis. Appendix D: Baseline Figures NEC VISION shows the
original figures from which these data were retrieved and reconstructed.

102
Figure 4.3- Characterization of the NEC VISION 2013-2040
As described earlier (see Section 2.5.2.2: Amtrak’s Vision for HSR in the Northeast Corridor),
the two programs and six milestone stages of the NEC VISION encompass:
NEC Upgrade Program (NEC-UP), 2015-2025:
Stage 1) 40% additional capacity of the Acela Express achieved through additional
passenger cars on existing train sets by 2015
Stage 2) Doubling of the HSR frequencies from New York to Washington by 2020
Stages 3) & 4) Improved and expanded service on the entire alignment, thanks to the
Gateway program, track improvements, and additional HSR trains by 2025
NEC Next Generation HSR (NextGen), 2030-2040:
Stage 5) Completion of the New York-Washington NextGen HSR segment by 2030
Stage 6) Full establishment of the Boston-Washington NextGen HSR service by 2040
At this final stage, the trip time from New York to either Boston or Washington will be reduced
to 94 min (Amtrak 2012). (Perhaps this was designed this way for marketing purposes, or just
because the length of the alignments and the average operating speeds are projected to be the
same.)
Stage 1 S. 2 S. 3 & 4 S. 5 S. 6NEC-UP NEC NextGen HSR
0
10
20
30
40
50
60
0.0
1.0
2.0
3.0
4.0
5.0
6.0
2010 2015 2020 2025 2030 2035 2040 2045
NEC VISION
Revenue Operating Cost Ridership
(Revenue and Op. Cost in 2012 $ Billions) (Million Riders)

103
4.5.2. SFP Analysis of the NEC VISION
The previous section carefully scanned the data that allow an original productivity analysis of the
prospects described by Amtrak. Similarly as before (see Section 3.2.4: Method of Analysis), a
SFP Törnqvist trans-log index formula for a single-output single-input process is used in this
analysis. Again, year-to-year variations are compounded to obtain cumulative results, in this
case, though, taking 2013 as the base year. Here, however, there is no need to deflate monetized
outputs and inputs, since forecasts are in 2012 dollars.
Two distinct SFP metrics are analyzed: ridership SFP and revenue SFP, both with respect to
operating costs. These relate to the demand side of rail transportation, not to the supply side, thus
constraining the analysis. For simplicity, the words “operating costs” are removed from the
productivity label, as those are the sole input of every productivity metric. Again, revenue
passenger-miles SFP and available seat-miles SFP, a supply-side metric, could not be computed
due to lack of data.
4.5.2.1. Projected SFP
Figure 4.4 shows the predicted year-to-year ridership SFP and revenue SFP growth for the NEC
in 2013-2040, and Figure 4.5 shows the corresponding cumulative productivity growth. For the
sake of comparison, both figures are shown overlapped with the actual evolution of productivity
in FY 2002-2012 (see Chapter 3) and the programs and milestones stages of the NEC VISION.
Figure 4.4- NEC VISION, Year-to-Year SFP Growth FY 2002-2012 and 2013-2040
S. 1 S. 2 S. 3 & 4 S. 5 S. 6NEC-UP NEC NextGen HSR
-20%-15%-10%
-5%0%5%
10%15%20%25%30%
NEC VISION, Year-to-Year SFP Growth
Ridership-Op. Cost SFP Revenue-Op. Cost SFP
Historical Data

104
Figure 4.5- NEC VISION, Cumulative SFP Growth FY 2002-2012 and 2013-2040
In general terms, the NEC would become 20–40% more productive (on the demand side) by
2040 with respect to 2013. The expected yearly average growth in ridership and revenue SFP
(0.7% and 1.3%, respectively) would be within the ranges of what the NEC achieved in the past
(~0.5%–3.0%), though perhaps on the low side (see Section 3.3.2: SFP Analysis). But, again, the
productivity increments would be highly variable and most likely occur in stages.
Perhaps counterintuitively, not every stage of the NEC VISION would increase ridership and
revenue SFP. Productivity would go down after stage 1, with the additional capacity of the
Acela, slightly increase after stage 2, with the higher frequency of HSR service between New
York and Washington, boost after stages 3 and 4, with completion of the Gateway project and
several capital upgrades, and will improve anew in the final stages, with the introduction of the
NEC Next Generation (NextGen) HSR in the entire alignment.
The most significant productivity changes are the drop after 2015 and a substantial leap after
2024 (with a slight recovery from 2020-2024), which would cancel out to a zero net SFP growth
in that decade. These peak changes, however, are within the ranges of productivity gains or
losses that the NEC showed in the past: +/- 13–18% on peak years (compares with Table 3.4).
S. 1 S. 2 S. 3 & 4 S. 5 S. 6NEC-UP NEC NextGen HSR
60
80
100
120
140
160
180
2000 2005 2010 2015 2020 2025 2030 2035 2040
NEC VISION, Cumulative SFP Growth
Ridership-Op. Cost SFP Revenue-Op. Cost SFP
(2013 index = 100)
Historical Data

105
4.5.2.2. Drivers of Future Productivity
We suggest the reasons for the fluctuations in productivity growth are pure operational and
market effects, excluding major (unknown) external events or managerial changes.
For example, the increased HSR capacity in 2015–2020 would decrease ridership SFP and
revenue SFP, as the new trains are immediately more expensive to operate per rider, while the
market would take some time to respond to the stimulus of new services (we assume that Amtrak
accounted for this in the forecasts).
The ever-increasing gap between revenue SFP and ridership SFP with respect to operating costs
after 2020 may imply that Amtrak assumed that travelers pay higher fares, possibly due to a
combination of effects. On one hand, we speculate that new HSR services are accompanied by a
new fare structure and mix of business and leisure travelers embedded in Amtrak’s projections.
Again, it is currently unknown by the author if Amtrak used a selective or an across-the-board
fare increase for the services in the revenue forecasts, or a fare increase at all. On the other hand,
the trend of people traveling longer distances on the NEC could continue, thus increasing the
average revenue per rider (see Section 3.3.2: SFP Analysis). At this point, the author cannot
think of an alternative explanation of why this could have happened, but as pointed earlier (see
Section 4.5.1.2: Scope and Limitations), more disaggregate data (O-D level or fare structure)
could help explain these forecasted results.
A key stage in productivity growth is the Gateway Program to be completed in 2025, which
would make it much easier for travelers to go through New York (see Section 2.5.2.2: Amtrak’s
Vision for HSR in the Northeast Corridor). Efforts to accelerate this project should be included
in any reasonable strategy. We note that this stage would bring similar productivity increments
as the surge in ridership of the past three years. So, from a productivity perspective, market
behavior must be considered in addition to capital investments.

106
4.5.3. Comments on Amtrak’s Projections
4.5.3.1. Competition
Naturally, it is unknown what the competition (mainly the airline industry) will do, or if Amtrak
anticipated the reaction of the competition in making its forecasts.
For example, there could be (fierce) competition. Air lobbyists could push Congress to block rail
investments or lobby for airport expansions. Airlines could also improve their services or lower
their fares in the NEC. On the other hand, the large air/rail market share of Amtrak in the NEC
may have reduced the leverage the airline industry can exert on the NEC (see Section 2.4.3: NEC
Performance). Governmental funding of HSR could be favored over air infrastructure funding, as
energy and CO2 emission savings of HSR could increase substantially if combined with more
stringent environmental dictates or cleaner energy policies (Clewlow 2012).
There is also the possibility of cooperation between airlines and HSR, but the success of such an
alliance depends on unique challenges to be addressed on the NEC, e.g., complex network
economics and financing/funding for air/rail intermodal connections (Clewlow 2012).
Whether competition or cooperation would dominate the relationship between airlines and HSR
is unknown. At this point, the NEC VISION opens the possibility for air/HSR intermodal
connections, but do not provide details on how these will be developed (if at all). For example,
the NEC VISION does consider intermodal stops at the Baltimore, Philadelphia, and Newark
airports, but not on JFK, LaGuardia, Logan, Reagan or Dulles airports (Amtrak 2012). Likewise,
the NEC FUTURE (which was not a case of analysis in this chapter) states that “these elements
[airport access solutions] will be analyzed as overlays on the alternatives [of rail investment in
the NEC]”, but no specific information is currently provided (NEC FUTURE 2013b).
From the author’s perspective, the relationship between air and rail is vital, not only to the
success of HSR but to the mobility within the NEC as a whole. However, the current planning
process of the NEC VISION and the NEC FUTURE lacks involvement of the FAA and other
stakeholders of the airline industry.

107
4.5.3.2. Underestimation of Projections
Once the NextGen HSR is introduced in 2030 (and thus the substantial trip time reductions begin
to be realized) productivity of the NEC would not go up by a significant amount. When
contrasted with the recent market success of the NEC (see Section 2.4.3: NEC Performance) and
the fact that the introduction of HSR in some nations has “resulted in substantial decline in air
traffic on short-haul routes” (Clewlow 2012), there is a possibility that current projections of
ridership and revenue are underestimated. For instance, HSR amenities and add-ons (e.g., food
services, baggage fees, Wi-Fi charges, or preferred seat assignments) could further increase
revenue. Also, an improved level of service might be accompanied by a substantial increase in
travel demand. Thus, given the characteristics of the NEC and the introductory effect of HSR,
travel demand and revenue could be even higher than anticipated.
4.5.3.3. HSR International Comparisons
Thus far, we have counted on Amtrak’s projections to make our productivity estimates in the
NEC. But, often, projections of ridership are overestimated while projections of costs are
underestimated when compared with reality (Flyvbjerg et al. 2002). Thus, a benchmark of
international experiences may suggest what could actually happen in the first years of operation
of a new HSR in the NEC.
Table 4.1 summarizes the introduction of new HSR in corridors with similar physical
characteristics to the NEC in Japan, France, South Korea, and Taiwan, and compares them with
the projected introduction of the NextGen HSR in the Washington-New York segment by 2030.
The international experiences are the first HSR implementation in such corridors, which have
now been followed by (in some cases, substantial) extensions of the lines. For this reason as
well, the comparison of the NEC is done in the Washington-New York alignment, which is the
first segment planned to operate from 2030-2040, until the New York-Boston NextGen HSR
alignment is finally introduced in 2040.
In all four international cases, the entrance of HSR significantly affected air traffic and other
transportation modes. In three out of four cases, HSR presented considerable ridership
increments above the forecasts made before the services were implemented. In fact, HSR
services usually enjoy spectacular growth in the initial years, which later declines as the market
becomes more mature (De Rus and Campos 2009). For example, revenue passenger-miles
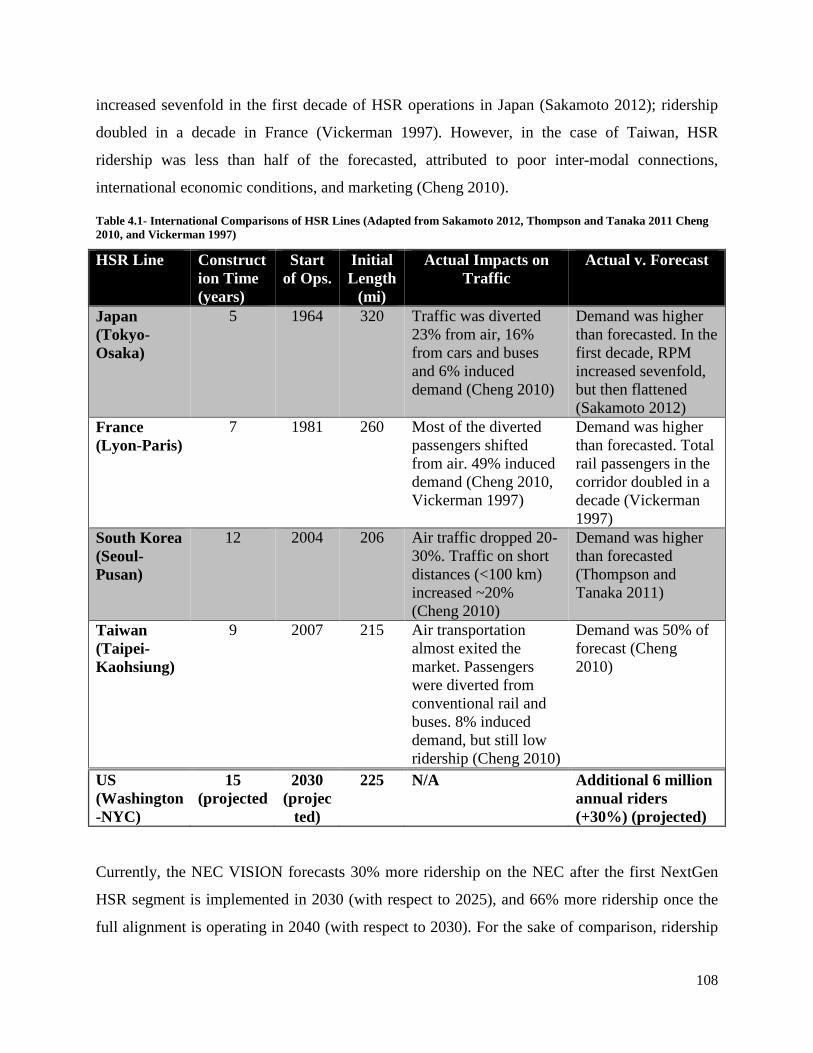
108
increased sevenfold in the first decade of HSR operations in Japan (Sakamoto 2012); ridership
doubled in a decade in France (Vickerman 1997). However, in the case of Taiwan, HSR
ridership was less than half of the forecasted, attributed to poor inter-modal connections,
international economic conditions, and marketing (Cheng 2010).
Table 4.1- International Comparisons of HSR Lines (Adapted from Sakamoto 2012, Thompson and Tanaka 2011 Cheng 2010, and Vickerman 1997)
HSR Line Construction Time (years)
Start of Ops.
Initial Length
(mi)
Actual Impacts on Traffic
Actual v. Forecast
Japan (Tokyo-Osaka)
5 1964 320 Traffic was diverted 23% from air, 16% from cars and buses and 6% induced demand (Cheng 2010)
Demand was higher than forecasted. In the first decade, RPM increased sevenfold, but then flattened (Sakamoto 2012)
France (Lyon-Paris)
7 1981 260 Most of the diverted passengers shifted from air. 49% induced demand (Cheng 2010, Vickerman 1997)
Demand was higher than forecasted. Total rail passengers in the corridor doubled in a decade (Vickerman 1997)
South Korea (Seoul-Pusan)
12 2004 206 Air traffic dropped 20-30%. Traffic on short distances (<100 km) increased ~20% (Cheng 2010)
Demand was higher than forecasted (Thompson and Tanaka 2011)
Taiwan (Taipei-Kaohsiung)
9 2007 215 Air transportation almost exited the market. Passengers were diverted from conventional rail and buses. 8% induced demand, but still low ridership (Cheng 2010)
Demand was 50% of forecast (Cheng 2010)
US (Washington-NYC)
15 (projected
2030 (projec
ted)
225 N/A Additional 6 million annual riders (+30%) (projected)
Currently, the NEC VISION forecasts 30% more ridership on the NEC after the first NextGen
HSR segment is implemented in 2030 (with respect to 2025), and 66% more ridership once the
full alignment is operating in 2040 (with respect to 2030). For the sake of comparison, ridership

109
on the NEC-Spine trains grew 36% from FY 2003-2012, with only limited capacity
enhancements (see Section 2.4.3: NEC Performance).
Thus, the international comparisons make two points. First, Amtrak’s projections are within the
range of what the international benchmark of actual performance suggests (and within what
Amtrak has achieved in the past decade). Second, Amtrak’s projections may be a bit low because
the actual HSR ridership was higher than forecasted in three out of four international cases; and,
in the case where it did poorly, it was largely due to poor planning and management. Therefore,
even though the SFP analysis of the future of the NEC is done with projections, those are
consistent with what international railroads experienced in the past, a fact that raises our
confidence that Amtrak’s projections are realistic. Moreover, our confidence is bolstered further
because not only do the projections seem to be on the low side, but also the fact that in three out
of four cases the projections were low with respect to reality suggests that the ridership in the
NEC might be higher than forecasted. This international benchmark also reveals that HSR
construction times were faster than those proposed in the NEC VISION. This could possibly
motivate Amtrak to revise current projections of ridership and revenue, and perhaps even to
accelerate or modify the vision, or, on the other hand, to warn them that a careful implementation
of HSR infrastructure and service is necessary to secure ridership.
4.5.3.4. Risks and Opportunities
In short, the lumpy productivity changes that we estimated from the NEC VISION would be due
to stages of the implementation strategy and to market response, just as expected. However, the
international benchmark and the past decade of the NEC suggest the possibility that Amtrak’s
projections of ridership and revenue are underestimated.
From a productivity perspective, we think there are some risks with going forward in this way
with the NEC VISION. As the analysis revealed, productivity would go down initially. Since the
NEC is volatile with respect to external events, an unexpected adverse major event could
endanger the future development of HSR. Amtrak’s critics might use this fact to question its
ability to implement the strategy. The current optimism might fade out and jeopardize the long-
term plans.
Also, productivity, especially on the supply side, is sensitive to management practices.
(Naturally, availability of data on available seat-miles would permit the calculation of a supply-

110
side productivity metric –available seat-miles SFP— which, lacking the data, we excluded from
our analysis). The plan to improve management is not explicitly mentioned in the NEC VISION.
Improved management practices within Amtrak and coordination with other major travel modes
may reveal a greater potential for productivity improvements.
4.5.4. Sensitivity Analyses of the NEC VISION
The previous productivity analysis of the NEC VISION assumed, on one hand, that Amtrak’s
forecasts were accurate and, on the other hand, that we had a reasonable process for
reconstructing missing data. Thus, the following sensitivity analyses test these two aspects: data
generation and uncertainty of forecasts.
4.5.4.1. Sensitivity to Assumptions Regarding Data Generation
The missing data for the base case of analysis (NEC VISION) were generated based on some key
assumptions. A sensitivity analysis is now performed to test if the results (or at least the general
behavior) persist after a change of assumptions.
Table 4.2 lists the assumptions regarding the generation of missing data points in both the base
case and an alternative case of analysis of the NEC VISION.
Table 4.2- Assumptions for Sensitivity Test
Category Base Case (NEC VISION) Alternative Case Ridership forecast on 1-year intervals
Linear interpolation from ridership estimates given at each milestone year of the NEC VISION (2015, 2020, 2025, 2030 and 2040)
Linear growth of ridership as that experienced in the past five years in the NEC (about 500,000 passengers/year)
Revenue forecast on 1-year intervals
Linear interpolation from revenue estimates given at each milestone year of the NEC VISION (2015, 2020, 2025, 2030 and 2040)
Linear correlation with ridership, as determined by a regression of past ridership and revenue data on the NEC
Operating costs [Total Operating Costs] = [Total Revenue] – [Total Net Operating Revenue]
To generate missing ridership and revenue data in 1-year intervals (as required by the analysis),
estimates were now not linearly interpolated by joining the data points of the milestone years of
the NEC VISION as before (see Section 4.5.1: Data for the NEC VISION 2013-2040). Instead,
given the lumpy upgrades of the six stair-stage milestones, we assume sudden jumps in ridership,

111
corresponding to the increase in train capacity in years 2015, 2020, 2025, 2030, and 2040,
followed by a linear growth of ridership, similar to that observed in the past five years in the
NEC (about half a million passengers per year in FY 2008-2012, in the absence of major external
events).
To estimate revenue at 1-year intervals, a correlation with ridership is assumed. This was
reasonable, as the author’s analysis of the base case projections from Amtrak discovered a good
linear correlation between the two variables.
Finally, Total Operating Costs are calculated exactly as before, as:
[Total Operating Costs] = [Total Revenue] – [Total Net Operating Revenue].
Accordingly, Figure 4.6 shows an alternative characterization of the NEC VISION. Again,
revenue and operating cost are plotted against the left vertical axis, and ridership is plotted
against the right vertical axis. In contrast to Figure 4.3, the alternative representation displays
surges in ridership and revenue after the completion of a new stage of the NEC VISION.

112
Figure 4.6- a) Alternative Characterization of the NEC VISION 2013-2040 b) Base Case Characterization
Stage 1 S. 2 S. 3 & 4 S. 5 S. 6NEC-UP NEC NextGen HSR
0
10
20
30
40
50
60
0.0
1.0
2.0
3.0
4.0
5.0
6.0
2010 2015 2020 2025 2030 2035 2040 2045
Alternative Characterization of the NEC VISION
Revenue Operating Cost Ridership
(Revenue and Op. Cost in 2012 $ Billions) (Million riders)
Stage 1 S. 2 S. 3 & 4 S. 5 S. 6NEC-UP NEC NextGen HSR
0
10
20
30
40
50
60
0.0
1.0
2.0
3.0
4.0
5.0
6.0
2010 2015 2020 2025 2030 2035 2040 2045
NEC VISION (Base Case)
Revenue Operating Cost Ridership
(Revenue and Op. Cost in 2012 $ Billions) (Million Riders)

113
Similarly, Figure 4.7 shows a) the predicted year-to-year SFP growth for the alternative
characterization of the NEC VISION in 2013-2040, and b) the results from the base case
characterization (Figure 4.4). Again, the (identical) productivity changes calculated for FY 2002-
2012 are shown for reference in both graphs (see Chapter 3: Past Productivity in the NEC).
Figure 4.7- a) Alternative NEC VISION, Year-to-Year SFP Growth FY 2002-2012 and 2013-2040 b) Base Case
b)
S. 1 S. 2 S. 3 & 4 S. 5 S. 6NEC-UP NEC NextGen HSR
-20%-15%-10%
-5%0%5%
10%15%20%25%30%
Alternative NEC VISION, Year-to-Year SFP Growth
Ridership-Op. Cost SFP Revenue-Op. Cost SFP
Historical Data
S. 1 S. 2 S. 3 & 4 S. 5 S. 6NEC-UP NEC NextGen HSR
-20%-15%-10%
-5%0%5%
10%15%20%25%30%
NEC VISION (Base Case), Year-to-Year SFP Growth
Ridership-Op. Cost SFP Revenue-Op. Cost SFP
Historical Data
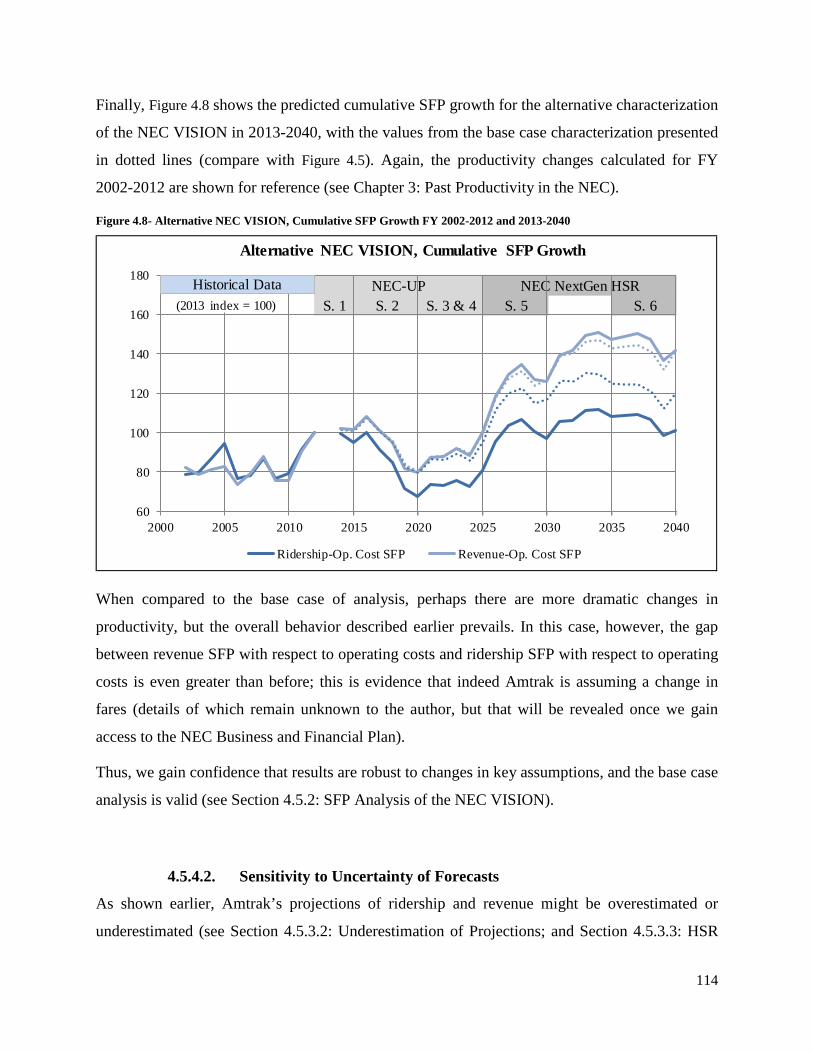
114
Finally, Figure 4.8 shows the predicted cumulative SFP growth for the alternative characterization
of the NEC VISION in 2013-2040, with the values from the base case characterization presented
in dotted lines (compare with Figure 4.5). Again, the productivity changes calculated for FY
2002-2012 are shown for reference (see Chapter 3: Past Productivity in the NEC).
Figure 4.8- Alternative NEC VISION, Cumulative SFP Growth FY 2002-2012 and 2013-2040
When compared to the base case of analysis, perhaps there are more dramatic changes in
productivity, but the overall behavior described earlier prevails. In this case, however, the gap
between revenue SFP with respect to operating costs and ridership SFP with respect to operating
costs is even greater than before; this is evidence that indeed Amtrak is assuming a change in
fares (details of which remain unknown to the author, but that will be revealed once we gain
access to the NEC Business and Financial Plan).
Thus, we gain confidence that results are robust to changes in key assumptions, and the base case
analysis is valid (see Section 4.5.2: SFP Analysis of the NEC VISION).
4.5.4.2. Sensitivity to Uncertainty of Forecasts
As shown earlier, Amtrak’s projections of ridership and revenue might be overestimated or
underestimated (see Section 4.5.3.2: Underestimation of Projections; and Section 4.5.3.3: HSR
S. 1 S. 2 S. 3 & 4 S. 5 S. 6NEC-UP NEC NextGen HSR
60
80
100
120
140
160
180
2000 2005 2010 2015 2020 2025 2030 2035 2040
Alternative NEC VISION, Cumulative SFP Growth
Ridership-Op. Cost SFP Revenue-Op. Cost SFP
(2013 index = 100)(2013 index = 100)Historical Data
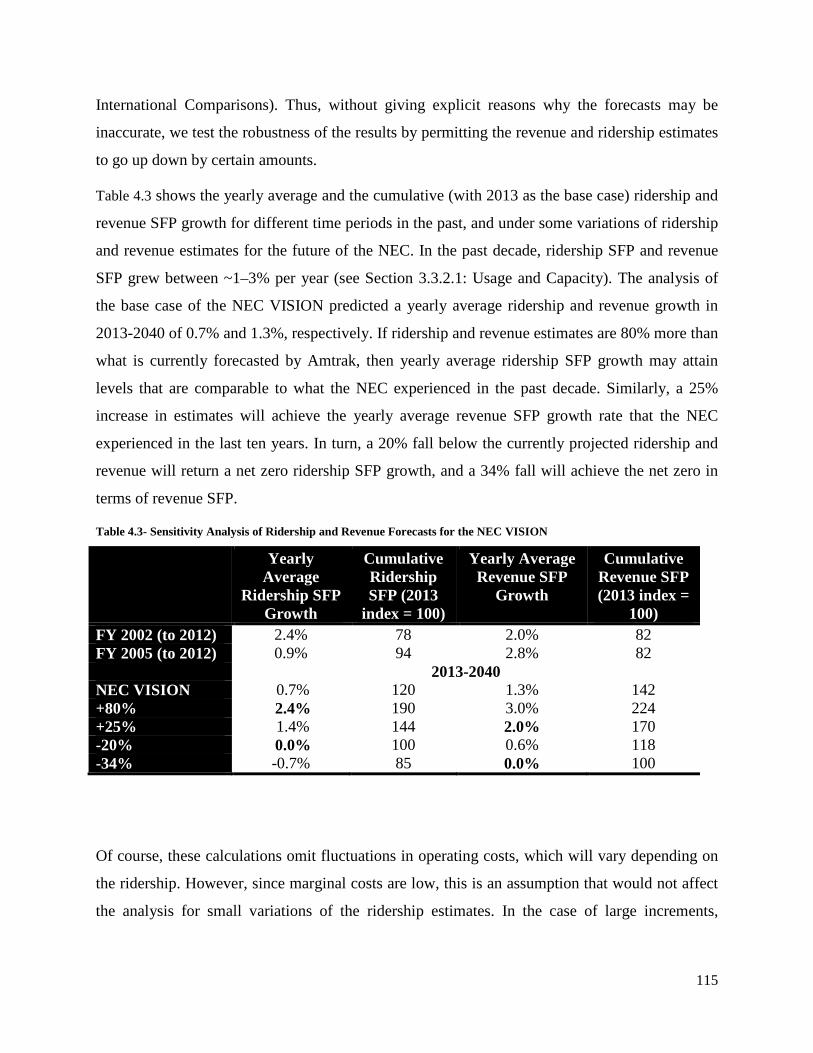
115
International Comparisons). Thus, without giving explicit reasons why the forecasts may be
inaccurate, we test the robustness of the results by permitting the revenue and ridership estimates
to go up down by certain amounts.
Table 4.3 shows the yearly average and the cumulative (with 2013 as the base case) ridership and
revenue SFP growth for different time periods in the past, and under some variations of ridership
and revenue estimates for the future of the NEC. In the past decade, ridership SFP and revenue
SFP grew between ~1–3% per year (see Section 3.3.2.1: Usage and Capacity). The analysis of
the base case of the NEC VISION predicted a yearly average ridership and revenue growth in
2013-2040 of 0.7% and 1.3%, respectively. If ridership and revenue estimates are 80% more than
what is currently forecasted by Amtrak, then yearly average ridership SFP growth may attain
levels that are comparable to what the NEC experienced in the past decade. Similarly, a 25%
increase in estimates will achieve the yearly average revenue SFP growth rate that the NEC
experienced in the last ten years. In turn, a 20% fall below the currently projected ridership and
revenue will return a net zero ridership SFP growth, and a 34% fall will achieve the net zero in
terms of revenue SFP.
Table 4.3- Sensitivity Analysis of Ridership and Revenue Forecasts for the NEC VISION
Yearly Average
Ridership SFP Growth
Cumulative Ridership SFP (2013
index = 100)
Yearly Average Revenue SFP
Growth
Cumulative Revenue SFP (2013 index =
100) FY 2002 (to 2012) 2.4% 78 2.0% 82 FY 2005 (to 2012) 0.9% 94 2.8% 82 2013-2040 NEC VISION 0.7% 120 1.3% 142 +80% 2.4% 190 3.0% 224 +25% 1.4% 144 2.0% 170 -20% 0.0% 100 0.6% 118 -34% -0.7% 85 0.0% 100
Of course, these calculations omit fluctuations in operating costs, which will vary depending on
the ridership. However, since marginal costs are low, this is an assumption that would not affect
the analysis for small variations of the ridership estimates. In the case of large increments,

116
however, operating costs would go up significantly, which might in turn decrease the
productivity estimates, bringing them back to levels previously attained.
Thus, the productivity results are somewhat robust to variations of the forecasts. Significant
variations would not bring the SFP estimates out of the range of what the NEC has achieved in
the past. If Amtrak’s projections of ridership and revenue are indeed on the low side, then
productivity rates could surge to high levels, which are still credible. In turn, lower demand, even
by 20%, would bring the productivity of the corridor to levels that are not likely (and desirable).
This raises our confidence in the analysis of the projections and also supports our belief that
Amtrak’s projections are on the low side.

117
4.6. Chapter Conclusion
This chapter used three cases of analyses to infer the future productivity of the NEC based on
best publicly available data, which we plan to update.
The first case of analysis, our simple EXTRAPOLATION of recent market and productivity
trends in the NEC, would optimistically (and perhaps naively) anticipate high productivity
growth rates. However, this ignores future interventions that might take place on the corridor,
and neither Amtrak nor the author claims that these performance rates are to be obtained. So, the value
of the EXTRAPOLATION was in determining a ballpark estimate of what the productivity of in
the future could be, and in suggesting drivers of productivity change that could help sustain such
growth rates.
The second case of analysis, the qualitative analysis of the NECMP of 2010, revealed that while
higher productivity levels could be expected, they are limited by the conservative interventions
presented by the NECMP. Although the author is optimistic about the potential achievement of
the prospects described in the NECMP, such interventions will also prevent the NEC from truly
deploying an international-quality HSR service. As implied by the analysis, there might be a
greater potential for increased productivity and services in the NEC that the NECMP is not
exploiting.
Greater expectations for the corridor were in fact considered in the quantitative analysis of the
NEC VISION of 2012. The analysis showed that the performance on the NEC is still sensitive to
many factors, and that perhaps Amtrak’s vision is both risky and in some ways a bit unambitious.
On one hand, the projected productivity levels are volatile and especially low at the beginning of
the interventions. On the other hand, the projected cumulative productivity growth is low in
comparison to the growth in the past decade.
This reveals the need for an improved vision that both reduces risk and takes advantage of the
opportunities of the NEC. In fact, international comparisons of HSR in corridors similar to the
NEC suggest that Amtrak’s projections of ridership and revenue are reasonable, but might be on
the low side. An improved level of service in the NEC could attract more riders and bring
additional revenue. Air/rail cooperation and competition could be key in shaping a more
comprehensive vision for HSR in the NEC.

118
The results of the analysis in this chapter raised our confidence in the structure of analysis
developed in Chapter 3. On one hand, the expected SFP growth was within the ranges of what
the NEC has shown in the past, both in the cumulative and year-to-year values. The sensitivity
analysis also revealed that results are robust to changes in key assumptions regarding data
generation and uncertainty of forecasts. On the other hand, the interventions and market effects
embedded in Amtrak’s forecasts could reasonably explain future productivity growth. However,
we think they ignored external factors, managerial changes, and unplanned interventions that
might affect productivity in the future. Finally, comparisons of results across the cases of
analyses were difficult, and there were tradeoffs between qualitative and quantitative analyses:
The qualitative analysis allowed us to infer the behavior of several SFP metrics, but did not
provide specific values. In contrast, the quantitative analysis gave specific results, but restricted
the analysis due to lack of data to just two SFP metrics on the demand side of rail transportation:
revenue SFP and ridership SFP, both with respect to operating cost.
Naturally, there is room for major improvements in the analysis. The introduction of available
seat-miles SFP or any other metric on the supply side will allow us not only to understand the
supply side of the services, but also to understand the implications for profitability and further
growth when compared to the demand side. Additional cases of analysis could be included, e.g.,
cases with substantial ridership changes, or cases based upon the preliminary alternatives report
of the NEC FUTURE. Another improvement would be the development of a way to allocate
operating costs at the route level, which would permit a comparison of performance between
regional and express services, and perhaps the refinement of a strategy to mix those services.
Finally, more disaggregate data at the specific route-level or O-D-level, or additional information
on the way in which Amtrak made the forecasts (which might be available in the “NEC Business
and Financial Plan”), would allow a direct comparison between future and past productivity, and
expand the analysis of the future productivity of the NEC.
The next chapter summarizes key research findings and contributions, and reflects on the
recommended ways to move forward for HSR implementation on the NEC.

119
4.7. Chapter References
Amtrak (2010). A Vision for High-Speed Rail in the Northeast Corridor. Amtrak (2012). The Amtrak Vision for the Northeast Corridor: 2012 Update Report. Cheng, Y. (2010). High-Speed Rail in Taiwan: New Experience and Issues for Future
Development. Transport Policy, Vol. 17, No. 2, pp. 51-63.
Clewlow, R. R. L. (2012). The Climate Impacts of High-Speed Rail and Air Transportation: A Global Comparative Analysis (Ph.D., Massachusetts Institute of Technology, Engineering Systems Division).
De Rus, G., Campos, J. (2009). Some Stylized Facts about High-Speed Rail: A Review of HSR Experiences around the World. Transport Policy 16, 2009
Flyvbjerg, B., Holm, M. S., & Buhl, S. (2002). Underestimating Costs in Public Works Projects: Error or Lie? Journal of the American Planning Association, 68(3), 279-295.
Gardner, S. (2013). Creating Capacity for Growth–New Approaches for Managing the Future of the NEC. TRB 2013 Annual Meeting: Socioeconomic and Financial Aspects of Intercity Passenger Rail Subcommittee.
NEC Future (2013a). NEC FUTURE – Passenger Rail Corridor Investment Plan. Accessed on March 2013 www.necfuture.com
NEC Future (2013b). NEC FUTURE – Passenger Rail Corridor Investment Plan. Preliminary Alternatives Report.
Sakamoto, R., & Massachusetts Institute of Technology. Dept. of Civil and Environmental Engineering. (2012). High Speed Railway Productivity: How Does Organizational Restructuring Contribute to HSR Productivity Growth? (S.M. in Transportation, Massachusetts Institute of Technology, Dept. of Civil and Environmental Engineering).
Sussman, J., Archila, A.F., Carlson S.J., Peña-Alcaraz, M., Stein N. (2012a). Transportation in the Northeast Corridor of the U.S.: A Multimodal and Intermodal Conceptual Framework. web.mit.edu/hsr-group/documents/jiti.pdf
The NEC Master Plan Working Group (MPWG) (2010). The Northeast Corridor Infrastructure Master Plan.
Thompson, L., Tanaka, Y. (2011). High Speed Rail Passenger Service: World Experience and U.S. Applications. TGA Transportation Concepts
Vickerman, R. (1997). High-Speed Rail in Europe: Experience and Issues for Future Development. The Annals of Regional Science No. 2, 1997


121
5. Summary and Conclusion
This chapter summarizes key research findings and contributions, reflects on the recommended
ways to move forward for HSR implementation on the NEC, and suggests potential areas of
future research.
5.1. Summary
This thesis used productivity analysis to evaluate the past performance of the NEC in FY 2002-
2012 with historical disaggregate data. Then, it made inferences about the future performance of
the prospects of HSR in the NEC by 2040. Since the NEC network structure and socioeconomic
characteristics make it a natural fit for world-class HSR, our goal was to know if the prospective
HSR implementation would be potentially effective given the behavior of the past decade and
current plans.
Now, this allows us now to make some recommendations for the future of HSR in the NEC, but
first we will review the work done so far.
First, we discussed the concept, the metrics, and the methods of productivity measurement,
reviewed previous productivity studies in rail transportation, and discussed the implications for
the research on productivity of intercity passenger rail transportation in Chapter 1.
Then, we reviewed the history and performance of Amtrak at the national level, contrasted it
with the passenger rail transportation system of the NEC, and explored the HSR prospects in the
NEC for the next decades in Chapter 2.
In Chapter 3, we laid out a specific structure to study the productivity of passenger rail in the
NEC. We used a non-parametric SFP Törnqvist trans-log index approach, with several SFP
metrics, to analyze the performance and understand the behavior of the NEC in FY 2002-2012,
with data from Amtrak’s year-end monthly performance reports.
Finally, in Chapter 4, we used the structure of analysis and findings of Chapter 3 to make
inferences on the productivity of future HSR developments in the NEC, as described in Chapter
2. Most importantly for the goals of this research, we estimated the productivity trends of the
Amtrak’s vision for HSR in the NEC for 2013-2040.

122
5.2. Findings
In this process, we have grouped the following overarching findings:
• Productivity analyses are useful for assessing performance and determining the drivers of
performance in intercity passenger rail transportation, but the literature is sparse.
Productivity analyses allow managers and decision-makers to understand the behavior and the
drivers of productivity change in the NEC, and to better prepare or respond to potential
realizations of the future. In general, productivity improvements explain long-term
improvements in intercity passenger transportation. In the past, they have translated into benefits
to operators and users. For the future, they can reveal if a strategy is realistic or not, and even if a
strategy is preferred over another. However, the literature on passenger rail transportation
productivity is not extensive, is sparse, and the myriad of approaches to productivity analyses,
selected by various researchers, make it hard not only to comprehend, but also to compare results
across studies.
• Not only is the productivity literature sparse, but also has guidelines that are confusing,
sometimes contradictory, and rarely specific for transportation studies. Thus the following
(not exhaustive) guidelines for analyzing productivity and communicating results in intercity
passenger transportation may be useful for subsequent studies.
Reference explicitly and (where possible) jointly the output and input data categories, the
productivity metrics, and the method of a productivity analysis, in order to prevent confusion and
to understand if results are comparable across studies.
Select the output and input data categories, then the productivity metric(s), and finally the
method of productivity analysis.
DATA: Keep in mind that it is unclear exactly which are the outputs and inputs of a
transportation process (unlike in economic studies, where at least there is a consensus on GDP,
labor, and capital). For intercity passenger transportation, different outputs (not to be mistaken
for multiple outputs) coexist and have different meanings: Available Seat-Miles are a proxy for
transportation capacity, Revenue Passenger-Miles measure the ability to use the available
capacity, and Revenue measures the ability to economically exploit the capacity.

123
The inputs are even more ambiguous than the outputs. There are many possible input (or cost)
breakdowns, which, as with outputs, will give different meanings to the productivity metrics
derived. Previous analyses have used the economic approach to inputs (labor, capital) with an
additional category for fuel. The input breakdown is relevant when working with MFP and TFP,
but not when using SFP.
We encourage developing alternative outputs and/or inputs in order to measure the quality of the
service provided (LOS) and to account for the quality of the inputs. However, we recognize that
the data might not be readily available, as they do not correspond to incumbent managerial
reporting schemes.
Select physical outputs and inputs over monetary quantities where possible, but keep in mind
that they are harder to get. Deflate monetary quantities as detailed as possible.
METRICS: Do not use partial productivity interchangeably with SFP, and MFP with TFP.
Partial productivity is an arbitrary metric in multi-output multi-input or multi-output single-input
processes that necessarily excludes some outputs or inputs. SFP, instead, is a metric of a single-
output single-input process; MFP is used in single-output multi-input processes; and TFP is used
in multi-output multi-input processes. SFP, MFP, and TFP do not exclude (at least intentionally)
factors of production. Partial productivity does.
SFP is the preferred choice in single-output single-input processes and in multi-output multi-
input processes that can be unmistakably reduced to a single output single-input process. MFP
and TFP are definitively preferred over the (inappropriate) partial measures of productivity in
multi-output multi-input processes that cannot be unmistakably reduced to a single output single-
input process.
METHOD: Select the method to analyze productivity depending on the question of interest, the
type of data, the data availability, the computational resources, and additional context-specific
constraints. Robustness and computational easiness are desired attributes of a method of analysis.
Parametric methods are very powerful; they can provide detailed information on the drivers of
productivity change, but are data-intensive and computationally complex. Non-parametric
methods may sacrifice the amount of information they return, but are less data-intensive and
computationally friendlier than parametric methods.

124
Use complementary analysis, like reviewing historical events or using various productivity
metrics, to compensate for the disadvantages of a particular method.
Obtain the cumulative SFP by compounding year-to-year SFP instead of by directly computing
an inter-year SFP.
• In FY 2000-2012, there was substantial but not uniformly distributed ridership and revenue
growth for Amtrak. Currently, system-wide unprofitability and capacity constraints in the
NEC remain as two of the most pressing challenges that Amtrak faces.
Amtrak’s system-wide ridership and real ticket revenue grew 55% and 38%, respectively, in FY
2000-2012. Short and special routes became more profitable and utilized than longer routes. The
NEC contributed nearly half of Amtrak’s ridership. Even with HSR trains running below their
full potential, the NEC showed increasing revenue, ridership, operating profits, and air/rail
market shares. Similarly, the incremental ridership of the Acela Express proved to be highly
profitable, much more than that of the Northeast Regional and other services.
However, Amtrak still requires about $1.2 billion annually in governmental subsidies (to which
they respond that other modes are heavily subsidized as well). The NEC, the most heavily
utilized railway corridor of the U.S., is still facing capacity constraints, aging infrastructure, and
maintenance backlogs. Frequently, the political issues of the entire Amtrak system transfer to the
NEC and make it difficult for the NEC to be discussed independently.
• Route changes, technical problems with train sets, targeted capital investments, and
economic recession and recovery in the NEC translated into volatile, but considerable
productivity growth in FY 2002-2012.
The analysis of four distinct SFP metrics (i.e., ridership, revenue, revenue passenger-miles, and
available seat-miles SFP with respect to operating costs) through a non-parametric Törnqvist
trans-log index showed that the NEC had very volatile, but upward productivity growth in FY
2002-2012. Overall, the NEC was less productive by FY 2010 than in FY 2005, had substantial
productivity dips in FY 2006 and FY 2009 (-10% to -20%), but boosted its productivity in the
last three years (as high as 20% in one year). As shown in Table 5.1, the yearly average SFP
growth of the NEC was in the range of ~1-3%. Although results are not directly comparable with
previous studies of rail transportation in the U.S., the NEC experienced higher average

125
productivity improvements in FY 2002-2012 than the U.S. railroads (combined freight and
passenger outputs) in 1951-1974 (2.5% RPM SFP v. 1.5% [RPM & RTM] TFP) (Caves et al.
1980).
Table 5.1- Summary of NEC SFP Growth in FY 2002-2012
Yearly Average SFP
Growth
Ridership SFP
Revenue SFP
RPM SFP ASM SFP
2005-2012 NEC 0.9% 2.8% 2.5% 0.4%
Express 1.3% 2.9% 2.8% -1.1% Regional 1.0% 2.1% 2.4% 1.3%
2002-2012 NEC 2.4% 2.0% --- ---
Express 2.0% 1.7% --- --- Regional 3.0% 2.4% --- ---
• In the past decade, Amtrak increased its ability to fill up and economically exploit the
available capacity in the NEC. On the other hand, supply-side productivity did not follow it.
The NEC became cumulatively ~20% more productive on RPM SFP (demand side) and only
~3% more productive on ASM SFP (supply side) in the past seven years. In fact, the ASM SFP
of the express services actually decreased. Amtrak was far more effective at using the available
capacity in the NEC (by filling up trains with more passengers over longer distances) than at
generating it (running trains cheaper).
• The NEC-spine trains were volatile to external events, had large economies of scale, and
presented slow adjustment of capacity that were not homogenous, but rather depended on
specific routes.
Even though the effect of the economic recession of 2009 was a regrettable 2-3-year setback in
ridership and revenue for all routes in the NEC, the effects of lost or gained ridership on ticket
revenue were more pronounced for express services than for regional services. Also, the SFP of
express services was more volatile than that of regional services. This shows that the Acela
Express is more sensitive than the Northeast Regional to external factors, thus revealing risks but
also opportunities for improved performance of future HSR.

126
The increased demand combined with a low marginal cost per RPM was evidence of economies
of scale that boosted productivity on the demand side in recent years. Most of the new ridership
was accommodated on existing capacity, at low extra costs. However, increasing load factors
suggest that the productivity increments achieved through economies of scale might be limited in
the future unless the capacity of the corridor is enhanced. Such capacity enhancements remain an
unmet challenge for the NEC.
• NEC users are traveling longer distances by rail, and trains are becoming more competitive
in traditional short-haul air markets.
This is evidenced by the fact that cumulative RPM SFP exceeded ridership SFP over the last
decade, and also by the increased air/rail market share of Amtrak in the New York-Washington
and New York-Boston routes. In the Boston-Washington market, Amtrak is still not too
competitive with air travel.
• The ability to implement and operate HSR in the NEC is similar as the state of the regional
economy so far as productivity concerns go; however, the demand side productivity of the
NEC was more volatile with respect to external factors than the supply side.
The reestablishment of the Acela Express in FY 2006 reduced productivity more than the
economic recession of 2009, and ASM SFP only recovered after infrastructure investments in
recent years.
The economic dip of 2009 greatly affected the demand side of the NEC (RPM, ridership, and
revenue SFP) but had little influence on the productivity of the supply side (ASM SFP).
Ridership, revenue, and RPM SFP also increased at higher rates than ASM SFP in favorable
years.
Although the introduction of 40 additional Acela-Express coach cars to lengthen the train sets in
FY 2014 is promising (Amtrak 2011c), it might not increase ASM productivity if not
coordinated with infrastructure enhancements and modifications to maintenance facilities.
• The characteristics of the NEC reveal a potential for the successful introduction of a true
HSR service; however, determining a consensual implementation strategy is challenging but
mandatory to move forward effectively.

127
The extrapolation of the past productivity determined a ballpark estimate of what the
productivity in the future could be, and suggested drivers of productivity change that could help
sustain such productivity growth rates. Thus, productivity changes in the past suggested future
improvements in the NEC, potentially driven by well-known internal and external factors.
Now, although the geographic and socioeconomic characteristics of the NEC make it an ideal
candidate for HSR, it is a multi-stakeholder, multi-state, multi-purpose corridor under a funding-
constrained scenario and a polarized debate. So, current initiatives and studies attempt to find a
way to enhance the NEC, e.g., the NECMP (2010), the Amtrak Vision for HSR in the NEC
(2010, 2012), the multi-stakeholder effort NEC FUTURE (2012-present), and Sussman et al.
(2012a, 2012b).
However, most of the planning efforts are at the early stages of development. Alternatives are
still to be scoped, consensus to be reached, and significant choices made. For some critics,
substantial trip time reductions are scheduled to be realized too far in the future. Current
estimates of investments are highly variable. Alignments, services, and institutional
arrangements have not yet been determined. So, there is uncertainty in this long-term planning
and implementing process, but a common strategy among stakeholders is still needed to advance
HSR in the NEC effectively.
• Amtrak’s prospects for HSR in the NEC are realistic but perhaps not too ambitious. The NEC
VISION may be risky.
Our analysis of the NECMP of 2010 revealed that higher productivity levels could be expected,
and that the prospects for bringing the corridor to a state of good repair and accommodate some
capacity growth were feasible. However, such interventions will prevent the NEC from truly
deploying an international-quality HSR service, and there might be a greater potential for
increased productivity and services, which the NECMP did not consider.
Our analysis of the NEC VISION of 2012 showed that the performance on the NEC is still
sensitive to many factors, and the projected productivity levels are volatile and especially low at
the beginning of the proposed interventions. Thus, productivity benefits may take years to
realize. If the financial leverage is not there to temporarily support adverse events, or if the
market and managers take too much time to adapt to changing conditions, there might be reasons
to doubt on a successful implementation of HSR.

128
Also the NEC VISION is in some ways a bit unambitious, since the projected cumulative
productivity growth is low in comparison to the growth in the past decade (20--40% in the next
30 years v. 20% in the past 10 years). In addition, international comparisons of HSR in corridors
similar to the NEC suggest that Amtrak’s projections of ridership and revenue are reasonable,
but might be on the low side.
5.3. Recommendations for the Prospects of HSR in the NEC
Amtrak set forth a myriad of short-, medium-, and long-term goals and objectives to advance its
vision for HSR in the NEC. In addition, the ongoing NEC FUTURE planning process frequently
receives public input. Thus, there are some ways in which the current prospects for HSR in the
NEC could be enriched by the findings of this thesis, in order to reduce risk and to take
advantage of the opportunities of the corridor:
• The projections of ridership and revenue should be revised, given that they might be
underestimated. This is in line with Amtrak’s short-term (6-12 months) goal to “Further
refine and develop program alternatives as part of the capital expenditure re-profiling
efforts…” (Amtrak 2012).
• Air/rail cooperation and competition should be explicitly considered in shaping a more
comprehensive vision for HSR in the NEC. The FAA should be involved in the planning
process. This builds on Amtrak’s short-term goal to “Devise future market strategies and
coordinate with rail industry experts…” (Amtrak 2012).
• The effect of improved management practices within Amtrak and other stakeholders of
the NEC should be considered in the projections (in case it has not been considered
already). This is aligned with the medium-term (1-3 years) goal to: “Develop appropriate
program management capabilities and undertake staffing and resource assessments”
(Amtrak 2012).
• From a productivity perspective, priority should be given to stages of the implementation
that promise the highest productivity improvements. More concretely, efforts to
accelerate the Gateway Program or to develop an alternative project that achieves such
benefits should be included. This is in line with Amtrak’s medium-term goal to: “Define
and advance “pathway” projects to gain early support and momentum” (Amtrak 2012).

129
• The productivity of the NEC is quite sensitive to multiple factors, including large,
unexpected regional events that were not explicitly considered in Amtrak’s forecasts.
Also, there is uncertainty related to political support, external events, or funding for HSR.
These are strong arguments for a scenario-planning approach (see Schwartz 1996) and
the design of flexibility in the proposed investment alternatives, which might be useful to
be better prepared to unexpected (good or bad) circumstances (see Sussman et al. 2012a).
For example, new policies could favor governmental funding of HSR over air
infrastructure funding. Under appropriate economic conditions, express services should
be expanded much more than regional services. This is in line with Amtrak’s long-term
(3-10 years) goal to “Review ongoing changes that may be needed in the structure of
Amtrak and the current phased implementation strategy to effectively deliver the
program” (Amtrak 2012).

130
5.4. Contributions
The main contributions of this thesis can be summarized as follows:
• Results: To the best of the author’s knowledge, these are the first results of a productivity
analysis (as defined here) of intercity passenger rail transportation in the U.S., which has
never been studied in isolation before, for the selected time period, or in the specific NEC
context. Moreover, it contributed to general rail transportation productivity literature, by
analyzing not just the NEC as a whole, but also specific services on the corridor: Acela
Express and Northeast Regional.
• Guidelines: The thesis did a thorough literature review and provided practical guidelines
in this chapter for future transportation productivity research, which hopefully will clarify
the intricate productivity literature and spare some efforts for future researchers.
• Structure of Analysis: The thesis laid out a robust structure of analysis that can be
subsequently (and perhaps easily) applied to other routes or sub-networks of Amtrak for
the given time period, and to the future performance of the NEC and its routes. This
structure overcame some limitations of parametric methods through the use of multiple
SFP metrics. The sensitivity analyses also revealed that results were robust to changes in
key assumptions regarding deflation of monetized data, route scoping, data
reconstruction, and uncertainty of forecasts.
• Inferences on Future Productivity: To the best of the author’s knowledge, this is the
first time a productivity analysis of rail passenger transportation is performed for a future
implementation. However, data limitations made difficult comparisons of results across
the cases of analyses, and there were tradeoffs between qualitative and quantitative
analyses: The qualitative analysis had a broader scope, but did not provide specific
values. In contrast, the quantitative analysis gave specific results, but restricted the
analysis to outputs and inputs for which data were available.

131
5.5. Future Research
Past Productivity: The most immediate extension of this structure of analysis is to other
services or sub-networks of Amtrak (perhaps even outside of the NEC) in the same time period
(FY 2002-2012), for which data are already available.
The analysis can also be updated with data from Amtrak’s FY 2013 year-end monthly
performance report, expected by September-October 2013.
More disaggregate past data at the NEC level would allow us to flag potential areas for
improvement, and could determine where enhancements would be the most effective. For
example, it would be useful to analyze the past performance of the northern and southern leg of
the NEC spine separately when designing a strategy for future targeted investments. However,
getting these data might not be easy.
Future Productivity: Without relying on Amtrak data, additional cases of analyses could be
generated, for example, cases based upon subsequent reports of the NEC FUTURE, which
should be increasingly detailed in the next two years.
Another improvement would be the development of a way to allocate operating costs at the route
level, which would permit a comparison of performance between regional and express services,
and perhaps the refinement of a strategy to mix those services.
The sensitivity analysis of Chapter 4 was a previous step to full-fledged scenario analysis. In the
former, we did not suggested causes for the change in the estimates of ridership, revenue, and
operating costs, and we were limited to outputs and inputs for which we had available data. In
scenario analysis, we will develop one or more narratives of the future and assess their impacts
on productivity. Then, we will suggest potential courses of action for the decision-makers, given
the events and risks described in the narrative.
Once we get access to the “NEC Business and Financial Plan”, we could update the analysis with
the specific projected data from Amtrak. Hopefully, this document includes disaggregate data at
the specific route-level or O-D-level, which would expand the analysis of the future productivity
of the NEC. The introduction of available seat-miles or any other output on the supply side will
allow us not only to understand the supply side of the services, but also to understand the
implications for profitability and further growth when compared to the demand side. Additional

132
information on the assumptions embedded in Amtrak’s forecasts would allow us to analyze the
projections and retrofit the strategy of investment in a less speculative fashion.
We thank the reader for taking interest in this thesis, and hope that it is of value for researchers in
the railway industry and for the future development of HSR in the NEC. ¡Mil gracias!

133
5.6. Chapter References
Amtrak (2010). A Vision for High-Speed Rail in the Northeast Corridor. Amtrak (2012). The Amtrak Vision for the Northeast Corridor: 2012 Update Report. Caves, D. W., Christensen, L. R., & Swanson, J. A. (1980). Productivity in US Railroads,
1951-1974. The Bell Journal of Economics, 166-181.
NEC Future (2013a). NEC FUTURE – Passenger Rail Corridor Investment Plan. Accessed on March 2013 www.necfuture.com
NEC Future (2013b). NEC FUTURE – Passenger Rail Corridor Investment Plan. Preliminary Alternatives Report.
Schwartz, P. (1996). The Art of the Long View: Planning for the Future in an Uncertain World. Doubleday: New York, NY.
Sussman, J., Archila, A.F., Carlson S.J., Peña-Alcaraz, M., Stein N. (2012a). Transportation in the Northeast Corridor of the U.S.: A Multimodal and Intermodal Conceptual Framework. web.mit.edu/hsr-group/documents/jiti.pdf
Sussman, J., Pena-Alcaraz, M., Carlson, S. J., Archila, A. F., Stein, N. (2012b) Analysis of High-Speed Rail Implementation Alternatives in the Northeast Corridor: the Role of Institutional and Technological Flexibility.
The NEC Master Plan Working Group (MPWG) (2010). The Northeast Corridor Infrastructure Master Plan.


135
Appendix A: NEC Data FY 2002-2012
This appendix displays data retrieved from Amtrak’s reports. White cells indicate data that were
directly retrieved from the reports, and light-blue cells show indirectly calculated data.
NEC Data 2009-2012
NEC Data 2008-2009
NEC Data 2005-2008
YearRoute
NumberTrain Name
Ridership (passengers)
Total Revenue ($ millions)
Ticket Revenue ($)
RPM (millions)
ASM (millions)
ALF
Total Costs excl. OPEB's, Capital
Charge and Other Costs
OPEB'sCapital
Charge*Total Costs
Fully Allocated
Contribution / (Loss)
Fully Allocated Contribution / (Loss) per Pass
Mile (cents)
Fully Allocated Contribution / (Loss) per Seat
Mile (cents)2012 RT01 Acela 3,395,354 $521.1 $508,080,295 646.7 1,034.2 63% $305.3 $6.9 n/a $312.2 $208.9 32.3 20.22012 RT05 Northeast Regional 8,014,175 $552.8 $535,700,003 1,233.9 2,550.0 48% $467.6 $8.8 n/a $476.4 $76.5 6.2 3.02012 RT99 Special Trains 13,372 $5.3 $2,131,944 1.8 12.4 15% $2.1 $0.0 n/a $2.1 $3.1 177.7 25.82012 TOTAL NEC 11,422,901 $1,079.2 $1,045,912,242 1,882.4 3,596.2 52% $775.1 $15.7 n/a $790.8 $288.5 15.3 8.02011 RT01 Acela 3,379,126 $510.3 $491,654,117 650.2 1,027.6 63% $323.4 $8.2 n/a $331.6 $178.8 27.5 17.42011 RT05 Northeast Regional 7,514,741 $505.3 $490,857,865 1,166.7 2,545.5 46% $467.2 $10.1 n/a $477.3 $28.0 2.4 1.12011 RT99 Special Trains 6,022 $0.9 $940,573 1.0 5.8 18% $2.2 $0.0 n/a $2.2 ($1.4) -135.6 -24.02011 TOTAL NEC 10,899,889 $1,016.4 $983,452,555 1,817.9 3,578.9 51% $792.8 $18.3 n/a $811.1 $205.4 11.3 5.82010 RT01 Acela 3,218,718 $449.8 $440,119,294 611.1 1,014.6 60% $316.4 $28.9 n/a $345.3 $104.5 17.1 10.32010 RT05 Northeast Regional 7,148,998 $469.7 $458,105,798 1,105.1 2,394.4 46% $466.3 $46.6 n/a $512.9 ($43.1) -3.9 -1.82010 RT99 Special Trains 7,493 $0.9 $908,307 1.2 6.0 19% $1.0 $0.2 n/a $1.2 ($0.3) -25.9 -5.02010 TOTAL NEC 10,375,209 $920.4 $899,133,399 1,717.4 3,415.0 50% $783.6 $75.7 n/a $859.3 $61.1 3.6 1.82009 RT01 Acela 3,019,627 $416.8 $409,251,483 570.5 1,032.8 55% $334.3 $22.6 n/a $356.9 $59.9 10.5 5.82009 RT05 Northeast Regional 6,920,610 $443.4 $431,430,679 1,046.9 2,392.9 44% $451.1 $25.8 n/a $476.9 ($33.5) -3.2 -1.42009 RT99 Special Trains 5,790 $1.3 $1,000,499 2.2 6.0 38% $2.6 $0.3 n/a $2.9 ($1.5) -67.2 -25.22009 TOTAL NEC 9,946,027 $861.6 $841,682,662 1,619.6 3,431.6 47% $788.0 $48.7 n/a $836.7 $24.8 1.5 0.7
YearRoute
NumberTrain Name
Ridership (passengers)
Total Revenue ($ millions)
Ticket Revenue ($)
RPM (millions)
ASM (millions)
ALFFRA
Defined Costs
Total Remaining
Direct Costs
Total Non-Direct Costs
Total Costs (Excl. Dep &
Int)
Contribution / (Loss) (Exclude
Dep & Int)
Contribution / (Loss) per Pass
Mile (cents)
Contribution / (Loss) per Seat
Mile (cents)2009 RT01 Acela 3,019,627 $414.5 $409,251,483 571.2 1,021.2 56% $135.9 $116.3 $94.9 $347.1 $67.4 11.8 6.62009 RT05 Northeast Regional 6,920,610 $440.1 $431,430,679 1,057.1 2,378.6 44% $186.5 $163.0 $157.2 $506.7 ($66.6) -6.3 -2.82009 RT91 NEC Unknown (Crew Labor) $0.0 $0.1 $0.0 $0.0 $0.1 ($0.1) --- ---2009 RT06/98/99 NEC Special Trains 5,790 $1.3 $1,000,499 2.1 3.0 70% $0.9 $0.2 $1.0 $2.1 ($0.8) -37.5 -26.42009 RT70 NEC Bus Route $0.0 $0.0 $0.0 $0.0 $0.0 $0.0 --- ---2009 TOTAL NEC 9,946,027 $855.9 $841,682,662 1,630.5 3,402.8 48% $323.5 $279.6 $253.1 $856.1 ($0.2) 0.0 0.02008 RT01 Acela 3,398,759 $474.1 $467,782,708 631.4 1,006.3 63% $145.1 $113.4 $86.8 $345.3 $128.8 20.4 12.82008 RT05 Northeast Regional 7,489,426 $490.5 $481,606,621 1,100.0 2,200.0 50% $185.4 $165.4 $137.5 $488.3 $2.2 0.2 0.12008 RT91 NEC Unknown (Crew Labor) $0.0 $1.3 $0.0 $0.0 $1.3 ($1.3) --- ---2008 RT06/98/99 NEC Special Trains 9,667 $1.6 $1,249,590 $1.1 $0.3 $0.1 $1.4 $0.2 --- ---2008 RT70 NEC Bus Route $0.0 $0.0 $0.0 $0.0 $0.0 $0.0 --- ---2008 TOTAL NEC 10,897,852 $966.2 $950,638,920 1,731.4 3,206.3 54% $332.9 $279.0 $224.3 $836.2 $129.9 7.3 3.8
YearRoute
NumberTrain Name
Ridership (passengers)
Total Revenue ($ millions)
Ticket Revenue ($)
RPM (millions)
ASM (millions)
ALFDirect Labor
Other Direct Costs
Total Shared Costs
Total Attributed
Costs
Contribution / (Loss)
(Exclude Dep & Int)
Contribution / (Loss) per Pass Mile
(cents)
Contribution / (Loss) per Seat Mile
(cents)2008 RT01 Acela 3,398,759 $486.3 $467,782,708 630.9 1,019.4 62% $27.2 $110.5 $128.4 $266.1 $220.2 34.9 21.62008 RT05 Northeast Regional 7,489,426 $518.4 $481,606,621 1,144.5 2,401.6 48% $53.7 $129.3 $188.9 $371.9 $146.5 12.8 6.12008 RT91 NEC Unknown (Crew Labor) $0.0 $1.1 $0.2 $0.0 $1.3 ($1.3) --- ---2008 RT06/98/99 Special Trains 9,667 $4.6 $1,249,590 $0.3 $0.5 $0.2 $1.1 $3.6 --- ---2008 RT70 NEC Bus Route $0.0 $0.0 $0.0 $0.0 $0.0 $0.0 --- ---2008 TOTAL NEC 10,897,852 $1,009.4 $950,638,920 1,775.5 3,421.1 52% $82.2 $240.6 $317.6 $640.4 $369.0 20.7 10.72007 RT01 Acela 3,191,321 $421.4 $403,571,410 576.9 980.1 59% $23.7 $105.5 $119.6 $248.8 $172.5 29.9 17.62007 RT05 Northeast Regional 6,836,646 $459.5 $424,721,134 973.8 2,272.2 43% $46.7 $129.5 $201.4 $377.7 $81.8 8.4 3.62007 RT91 NEC Unknown (Crew Labor) $0.0 $0.7 $0.0 $0.0 $0.7 ($0.7) --- ---2007 RT06/98/99 Special Trains 7,045 $4.3 $1,011,903 $0.2 $0.3 $0.1 $0.6 $3.7 --- ---2007 RT70 NEC Bus Route $0.0 $0.0 $0.0 $0.0 $0.0 $0.0 --- ---2007 TOTAL NEC 10,035,012 $885.2 $829,304,447 1,550.7 3,252.3 48% $71.3 $235.3 $321.2 $627.8 $257.4 16.6 8.02006 RT01 Acela/Metroliner 2,668,174 $347.5 $328,215,839 472.6 922.6 51% $23.2 $90.3 $99.4 $212.8 $134.7 28.5 14.62006 RT05 Regionals* 6,755,085 $439.9 $396,149,944 961.1 2,306.7 42% $49.8 $135.6 $185.4 $370.7 $69.2 7.2 3.02006 RT91 NEC Unknown (Crew Labor) $0.0 $0.2 $0.0 $0.0 $0.2 ($0.2) --- ---2006 RT06/98/99 Special Trains 8,020 $7.3 $1,067,843 $0.3 $0.6 $0.2 $1.1 $6.1 --- ---2006 RT70 NEC Bus Route $0.0 $0.0 $0.0 $0.0 $0.0 $0.0 --- ---2006 TOTAL NEC 9,431,279 $794.7 $725,433,626 1,433.7 3,229.3 44% $73.4 $226.5 $284.9 $584.9 $209.8 14.7 6.62005 RT01 Acela/Metroliner 2,452,902 $290.2 $276,211,184 421.5 882.1 48% $23.5 $56.1 $77.4 $157.0 $133.2 31.6 15.12005 RT05 Regionals* 7,115,698 $403.4 $368,675,501 1,040.9 2,410.5 43% $50.1 $100.7 $161.1 $311.8 $91.6 8.8 3.82005 RT91 NEC Unknown (Crew Labor) ($0.1) $0.4 $0.0 $0.0 $0.4 ($0.5) --- ---2005 RT06/98/99 Special Trains 17,580 $3.3 $1,219,518 $0.2 $0.5 $0.1 $0.9 $2.4 --- ---2005 RT70 NEC Bus Route $0.4 $0.0 $0.0 $0.0 $0.0 $0.4 --- ---2005 TOTAL NEC 9,586,180 $697.2 $646,106,203 1,462.4 3,292.6 44% $74.3 $157.2 $238.6 $470.1 $227.1 15.5 6.9
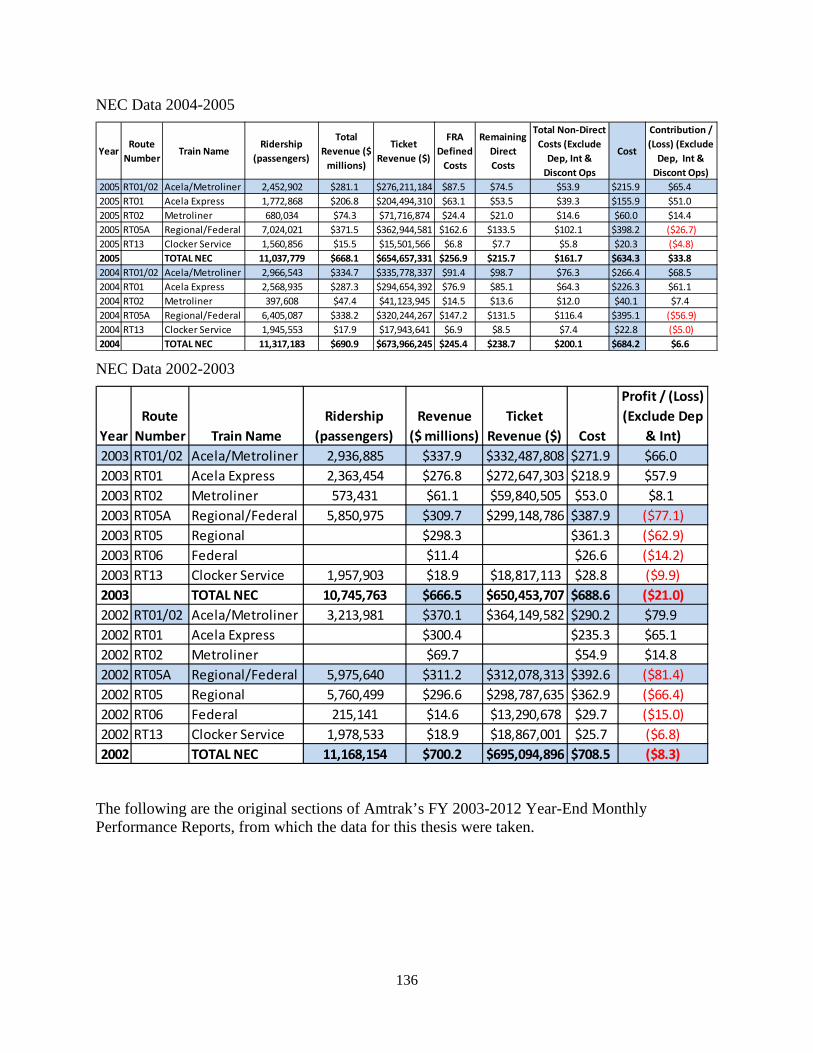
136
NEC Data 2004-2005
NEC Data 2002-2003
The following are the original sections of Amtrak’s FY 2003-2012 Year-End Monthly Performance Reports, from which the data for this thesis were taken.
YearRoute
NumberTrain Name
Ridership (passengers)
Total Revenue ($
millions)
Ticket Revenue ($)
FRA Defined
Costs
Remaining Direct Costs
Total Non-Direct Costs (Exclude
Dep, Int & Discont Ops
Cost
Contribution / (Loss) (Exclude
Dep, Int & Discont Ops)
2005 RT01/02 Acela/Metroliner 2,452,902 $281.1 $276,211,184 $87.5 $74.5 $53.9 $215.9 $65.42005 RT01 Acela Express 1,772,868 $206.8 $204,494,310 $63.1 $53.5 $39.3 $155.9 $51.02005 RT02 Metroliner 680,034 $74.3 $71,716,874 $24.4 $21.0 $14.6 $60.0 $14.42005 RT05A Regional/Federal 7,024,021 $371.5 $362,944,581 $162.6 $133.5 $102.1 $398.2 ($26.7)2005 RT13 Clocker Service 1,560,856 $15.5 $15,501,566 $6.8 $7.7 $5.8 $20.3 ($4.8)2005 TOTAL NEC 11,037,779 $668.1 $654,657,331 $256.9 $215.7 $161.7 $634.3 $33.82004 RT01/02 Acela/Metroliner 2,966,543 $334.7 $335,778,337 $91.4 $98.7 $76.3 $266.4 $68.52004 RT01 Acela Express 2,568,935 $287.3 $294,654,392 $76.9 $85.1 $64.3 $226.3 $61.12004 RT02 Metroliner 397,608 $47.4 $41,123,945 $14.5 $13.6 $12.0 $40.1 $7.42004 RT05A Regional/Federal 6,405,087 $338.2 $320,244,267 $147.2 $131.5 $116.4 $395.1 ($56.9)2004 RT13 Clocker Service 1,945,553 $17.9 $17,943,641 $6.9 $8.5 $7.4 $22.8 ($5.0)2004 TOTAL NEC 11,317,183 $690.9 $673,966,245 $245.4 $238.7 $200.1 $684.2 $6.6
YearRoute
Number Train NameRidership
(passengers)Revenue
($ millions)Ticket
Revenue ($) Cost
Profit / (Loss) (Exclude Dep
& Int)2003 RT01/02 Acela/Metroliner 2,936,885 $337.9 $332,487,808 $271.9 $66.02003 RT01 Acela Express 2,363,454 $276.8 $272,647,303 $218.9 $57.92003 RT02 Metroliner 573,431 $61.1 $59,840,505 $53.0 $8.12003 RT05A Regional/Federal 5,850,975 $309.7 $299,148,786 $387.9 ($77.1)2003 RT05 Regional $298.3 $361.3 ($62.9)2003 RT06 Federal $11.4 $26.6 ($14.2)2003 RT13 Clocker Service 1,957,903 $18.9 $18,817,113 $28.8 ($9.9)2003 TOTAL NEC 10,745,763 $666.5 $650,453,707 $688.6 ($21.0)2002 RT01/02 Acela/Metroliner 3,213,981 $370.1 $364,149,582 $290.2 $79.92002 RT01 Acela Express $300.4 $235.3 $65.12002 RT02 Metroliner $69.7 $54.9 $14.82002 RT05A Regional/Federal 5,975,640 $311.2 $312,078,313 $392.6 ($81.4)2002 RT05 Regional 5,760,499 $296.6 $298,787,635 $362.9 ($66.4)2002 RT06 Federal 215,141 $14.6 $13,290,678 $29.7 ($15.0)2002 RT13 Clocker Service 1,978,533 $18.9 $18,867,001 $25.7 ($6.8)2002 TOTAL NEC 11,168,154 $700.2 $695,094,896 $708.5 ($8.3)
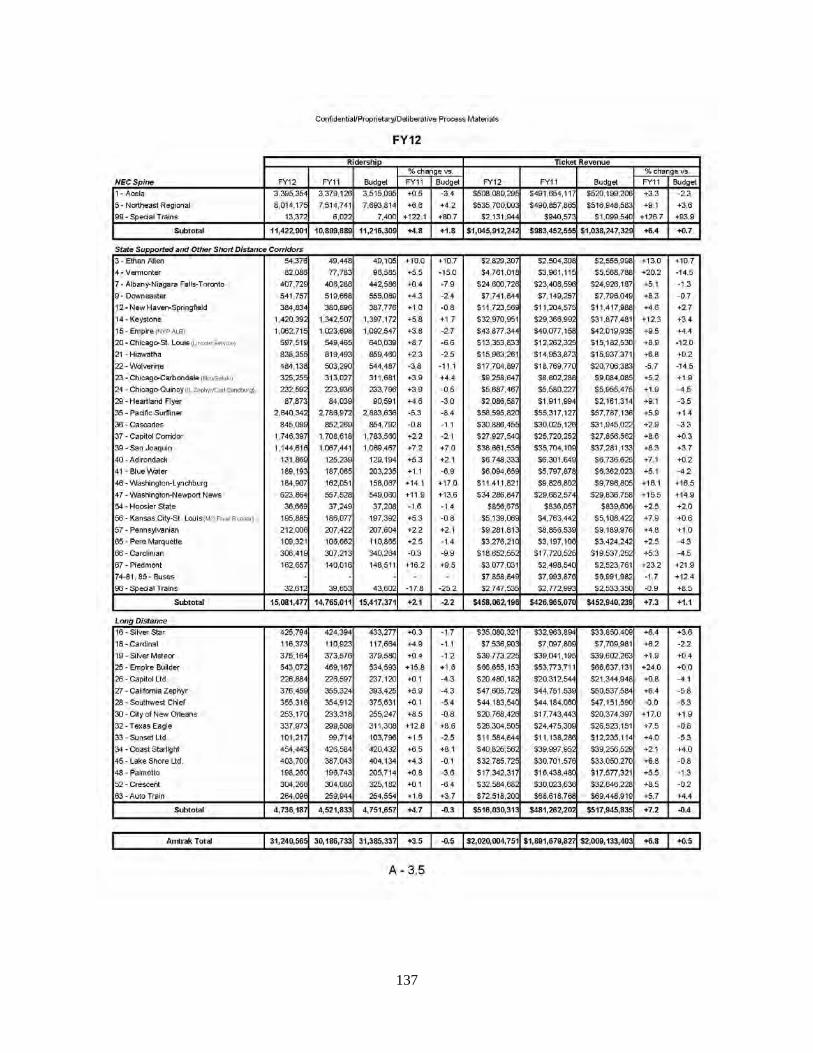
137

138

139

140
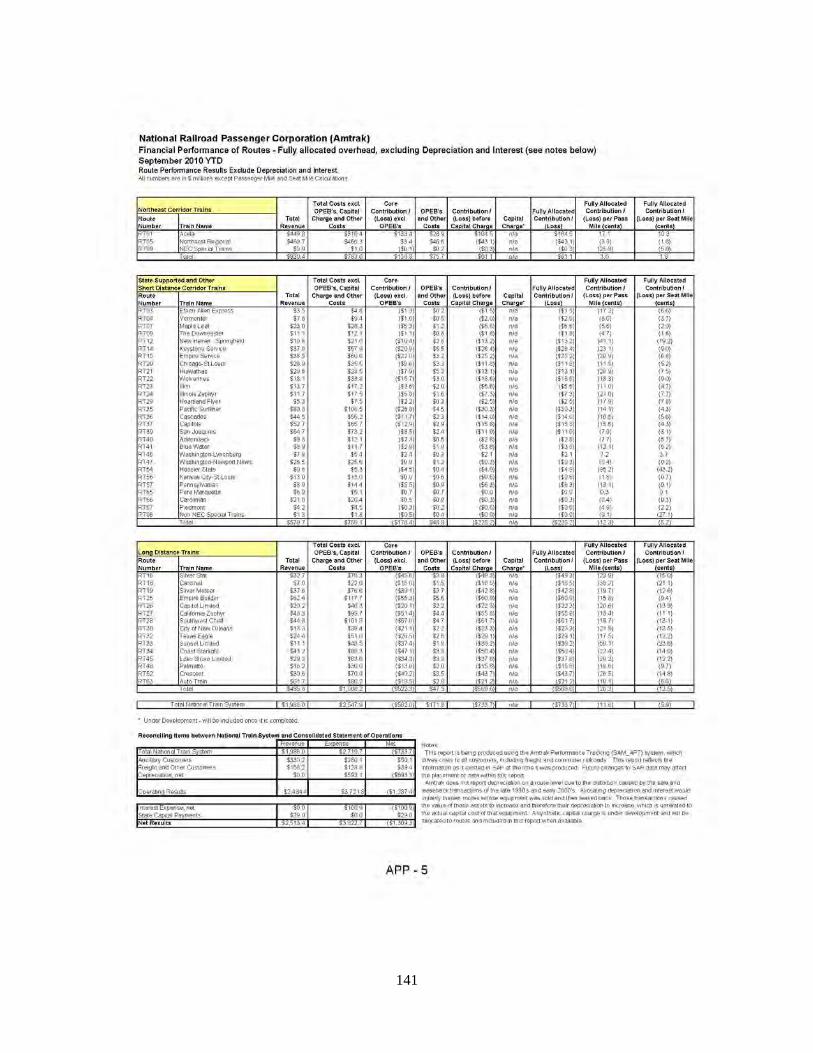
141

142
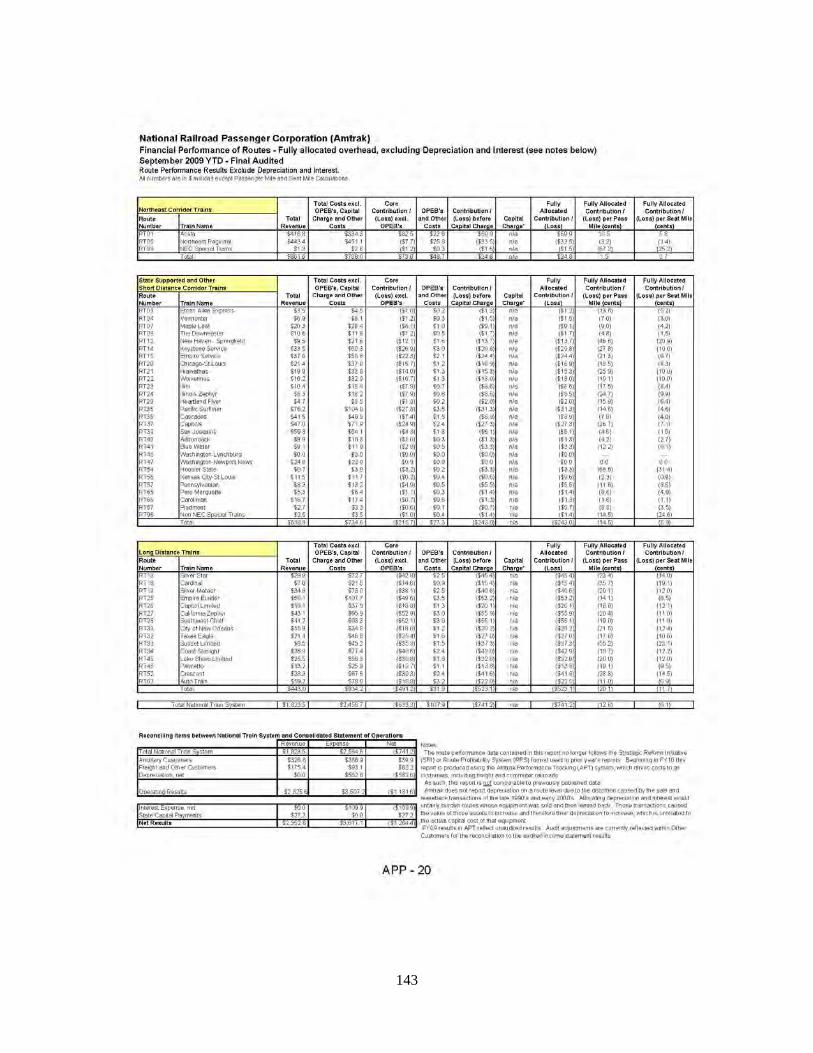
143

144

145

146
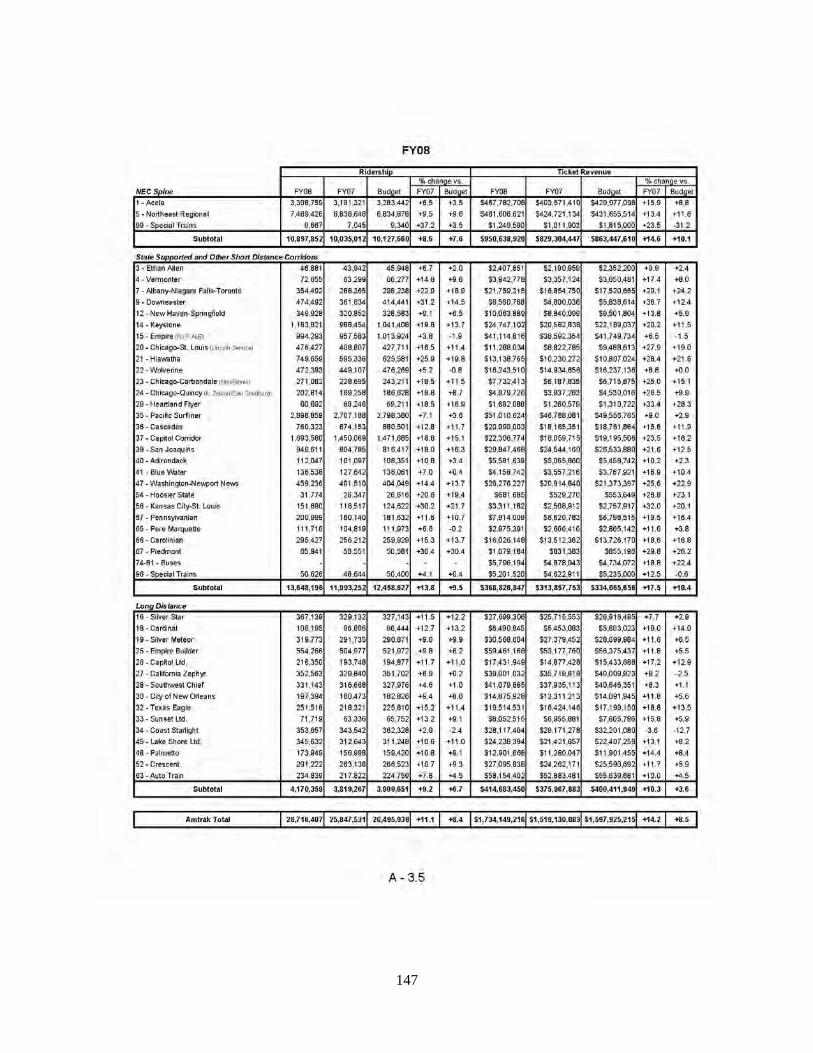
147

148

149

150

151

152

153
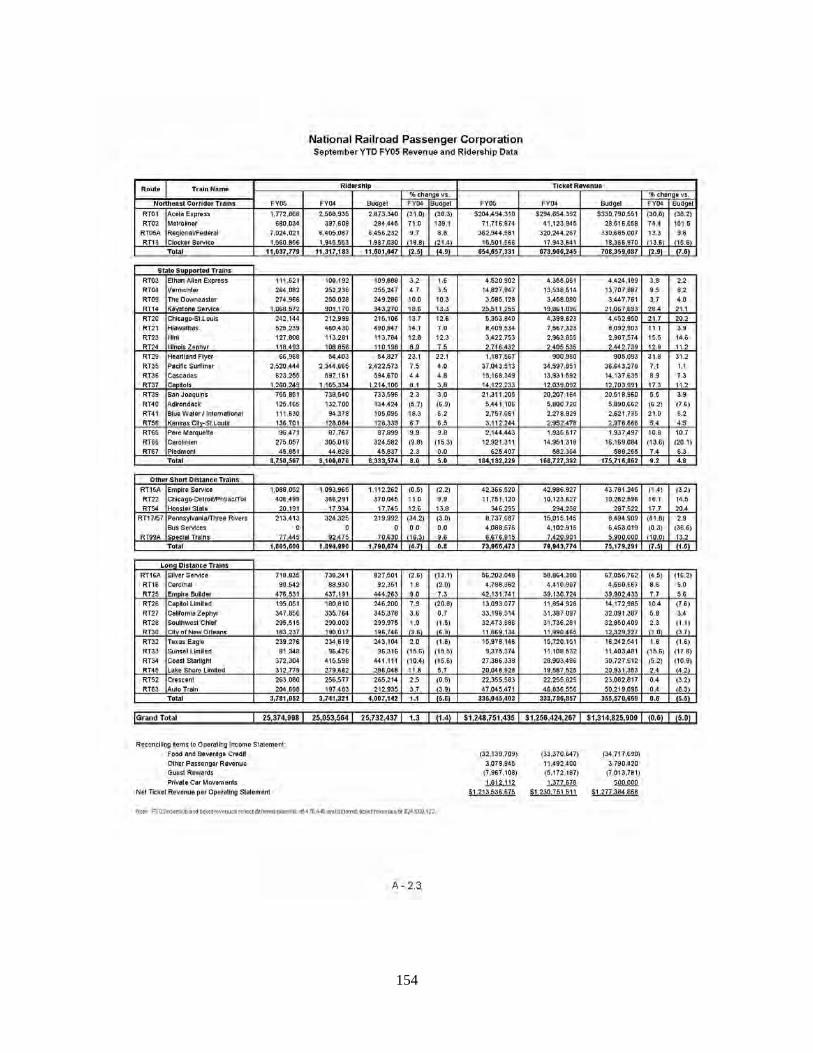
154

155
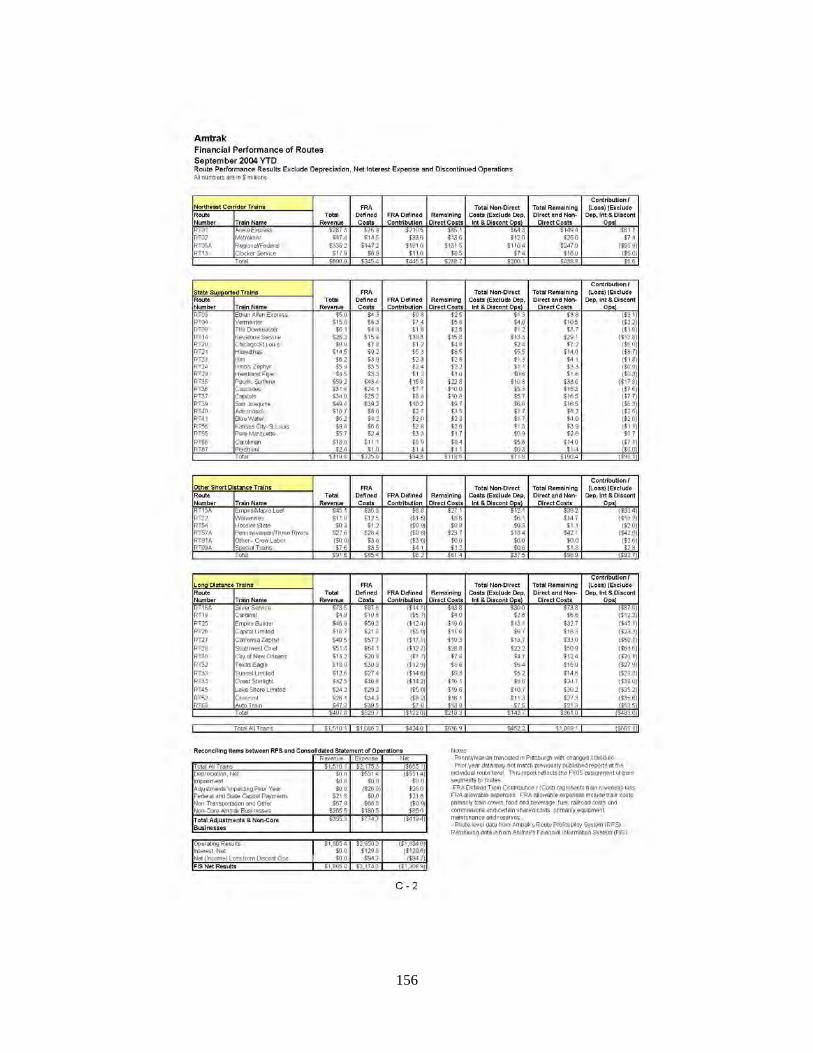
156

157

158

159

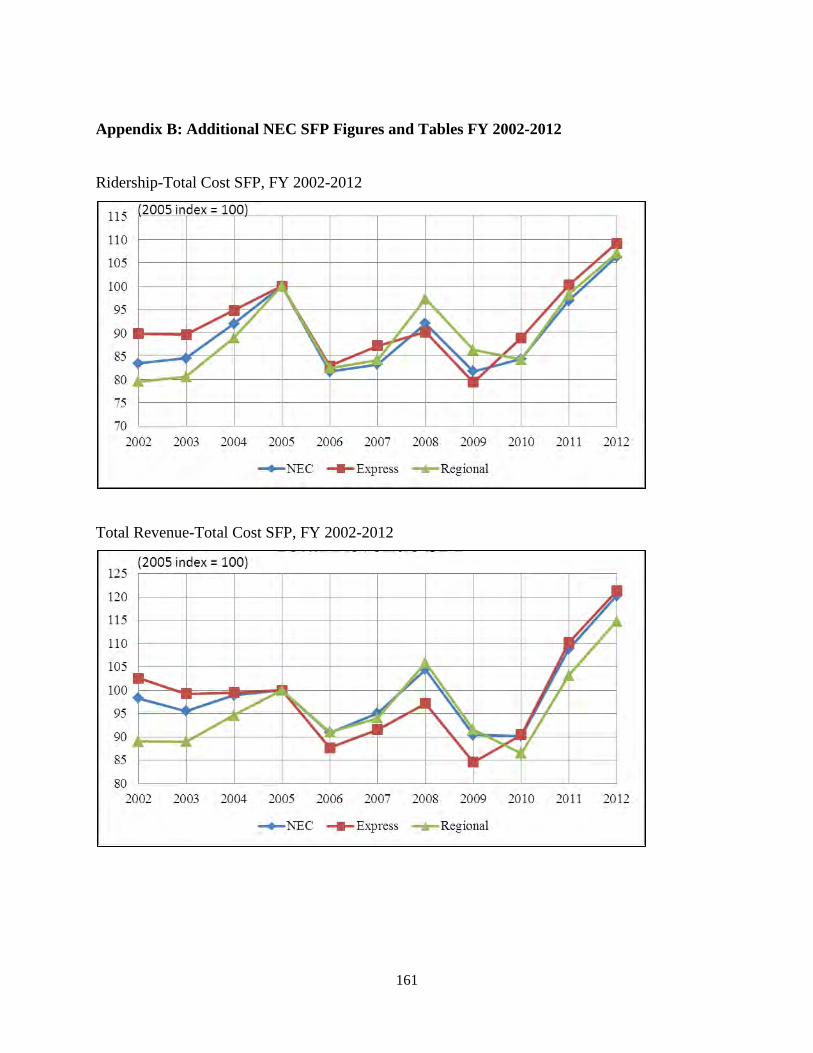
161
Appendix B: Additional NEC SFP Figures and Tables FY 2002-2012
Ridership-Total Cost SFP, FY 2002-2012
Total Revenue-Total Cost SFP, FY 2002-2012

162
Ticket Revenue-Total Cost SFP, FY 2002-2012
RPM-Total Cost SFP, FY 2005-2012

163
ASM-Total Cost SFP, FY 2005-2012
NEC, Year-To-Year SFP Growth, FY 2002-2005
NEC (excl. Clocker)
Ridership SFP
Total Revenue SFP
Ticket Revenue SFP
2004-2005 13% 1% 2% 2003-2004 9% 3% 3% 2002-2003 1% -2% -4%
Acela Express, Year-To-Year SFP Growth, FY 2002-2005
Acela Ridership SFP
Total Revenue SFP
Ticket Revenue SFP
2004-2005 4% 8% 4% 2003-2004 8% -3% 1% 2002-2003 --- -2%
Metroliner, Year-To-Year SFP Growth, FY 2002-2005
Metroliner Ridership SFP
Total Revenue SFP
Ticket Revenue SFP
2004-2005 18% 8% 21% 2003-2004 -6% -1% -13% 2002-2003 --- -10% ---

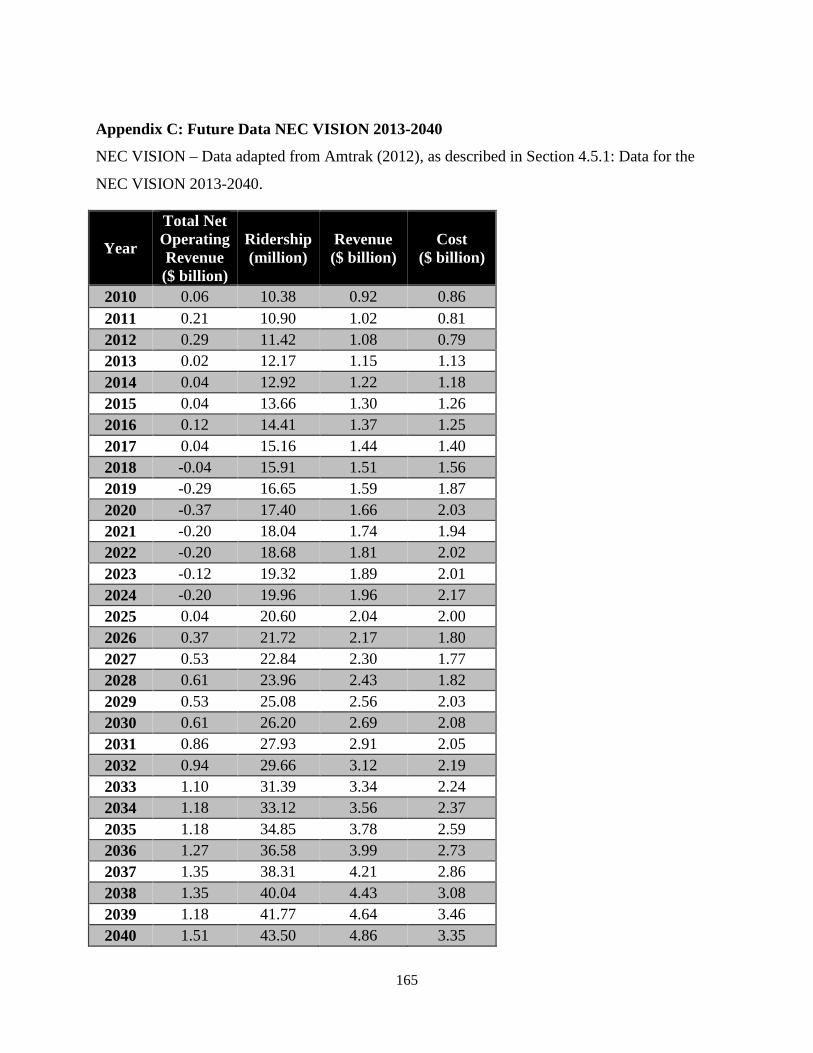
165
Appendix C: Future Data NEC VISION 2013-2040
NEC VISION – Data adapted from Amtrak (2012), as described in Section 4.5.1: Data for the
NEC VISION 2013-2040.
Year
Total Net Operating Revenue ($ billion)
Ridership (million)
Revenue ($ billion)
Cost ($ billion)
2010 0.06 10.38 0.92 0.86 2011 0.21 10.90 1.02 0.81 2012 0.29 11.42 1.08 0.79 2013 0.02 12.17 1.15 1.13 2014 0.04 12.92 1.22 1.18 2015 0.04 13.66 1.30 1.26 2016 0.12 14.41 1.37 1.25 2017 0.04 15.16 1.44 1.40 2018 -0.04 15.91 1.51 1.56 2019 -0.29 16.65 1.59 1.87 2020 -0.37 17.40 1.66 2.03 2021 -0.20 18.04 1.74 1.94 2022 -0.20 18.68 1.81 2.02 2023 -0.12 19.32 1.89 2.01 2024 -0.20 19.96 1.96 2.17 2025 0.04 20.60 2.04 2.00 2026 0.37 21.72 2.17 1.80 2027 0.53 22.84 2.30 1.77 2028 0.61 23.96 2.43 1.82 2029 0.53 25.08 2.56 2.03 2030 0.61 26.20 2.69 2.08 2031 0.86 27.93 2.91 2.05 2032 0.94 29.66 3.12 2.19 2033 1.10 31.39 3.34 2.24 2034 1.18 33.12 3.56 2.37 2035 1.18 34.85 3.78 2.59 2036 1.27 36.58 3.99 2.73 2037 1.35 38.31 4.21 2.86 2038 1.35 40.04 4.43 3.08 2039 1.18 41.77 4.64 3.46 2040 1.51 43.50 4.86 3.35


Appendix D: Baseline Figures NEC VISION
Re-Profiled Base Case – Total Net Operating Revenue (in $ Billions) (Source: Amtrak (2012))
Ridership Forecasts (in Millions) and Revenue Forecasts (in $ Billions) (Source: Amtrak (2012))

Key Projects Assumed by Milestone Year (Source: Amtrak (2012))


Additional Publications
Amtrak’s Productivity in the Northeast Corridor: Past and Future (attached) Andres F. Archila and Joseph M. Sussman

Amtrak’s Productivity in the Northeast Corridor: Past and Future
Andrés F. Archila & Joseph Sussman
Department of Civil and Environmental Engineering, Massachusetts Institute of Technology,
Cambridge, MA
Productivity analysis, the relationship between outputs and inputs in any given process, is
used to evaluate the performance of the main passenger rail services in the Northeast
Corridor (NEC) during FY 2002-2012 and to make inferences about high-speed rail (HSR)
for the next 30 years.
A non-parametric single factor productivity (SFP) Törnqvist trans-log index sets ridership,
revenue, revenue passenger-miles (RPM) and available seat-miles (ASM) as outputs, and
operating costs as inputs. According to the analysis, the NEC experienced considerable yet
highly volatile productivity growth during FY 2002-2012 (in the range of 1-3% per year).
Amtrak, the National Railroad Passenger Corporation, increased its ability to fill up trains
and economically exploit the available capacity, but did not perform equally well on the
supply side. Service changes, technical problems with train sets, targeted capital
investments, and economic recession and recovery were the main drivers of productivity
change. Amtrak’s two primary services, the Acela Express and Northeast Regional were
very sensitive to external events, had large economies of scale, and implemented slow
adjustment of capacity via rolling stock and infrastructure improvements, which varied
depending on the service.
Inferences about future productivity were based on Amtrak projections for the post-2012
period. The geographic and socioeconomic characteristics of the NEC reveal a potential for
a successful introduction of HSR. But while Amtrak’s vision for HSR in the NEC is
realistic in terms of productivity gains, it is risky and possibly inadequately ambitious in
terms of speed of implementation. Revising the current projections to make them more
aggressive, incorporating additional planning approaches, accelerating key stages of

Amtrak’s vision, and coordinating with the FAA in the planning process may improve the
implementation of HSR in the NEC.
The NEC from 2000 to 2012
The Northeast Corridor (NEC), stretching from Washington, D.C., to Boston, MA, is the most
densely settled region and one of the economic engines of the country. The NEC is a complex
multi-state, multi-operator, multi-use, and multi-owner railway corridor. It runs through several
major metropolitan areas, 12 states and the District of Columbia, and involves eight commuter
operators and one intercity travel operator (Amtrak).
Figure 1. NEC Ownership and Operations [1]
Besides the NEC as a whole, two Amtrak services are the subject of study: the Acela Express
and the Northeast Regional (NR). Average operating speeds are 70-80 mph for the Acela and 60-
65 mph for the NR, and total travel time is 6 ½ and 8 hours, respectively, from Boston to
Washington.
The period from 2000 to 2012 was characterized by regional congestion, increased rail
transportation demand, route changes in 2005-06, technical problems with Acela trains in 2002
and 2005, economic recession in 2008-09, and allocation of federal funding for capital
investments since 2009. In this period, the capacity-constrained NEC gained significant air/rail

market share and operational surplus, with a particularly profitable Acela and increasingly
utilized NR, but maintenance backlogs and infrastructure constraints remained.
Figure 2. NEC Ridership (million passengers) [2]
Productivity Methodology
Productivity is, at the most fundamental level, a relationship between outputs and inputs used to
evaluate the performance of an entity such as a country, industry, firm, system or process. Its
popularity among researchers is due to the possibility of explaining the long-term growth of an
entity, as well as the sources of growth. Of interest are the factors behind such a change in
productivity, the drivers of productivity, which can be classified as technological change,
organizational change, and externalities.
This research uses Single-Factor Productivity (SFP), which simplifies the analysis to a single-
output single-input process.
Output and input data were reported by Amtrak. The available outputs were ridership, (ticket)
revenue, revenue passenger-miles (RPM), and available seat-miles (ASM). The available inputs
were operating costs. Monetary quantities were inflated by the corresponding CPI to 2012
dollars.

As there is only a single input but four distinct outputs, four SFP metrics were used to strengthen
and validate the analysis, each providing different insights: On the supply side, ASM SFP with
respect to operating costs is a proxy for the effectiveness at generating transportation capacity;
on the demand side, ridership, revenue, and RPM SFP with respect to operating costs are
measures of the effectiveness at exploiting the available capacity. Revenue SFP with respect to
operating costs, in particular, reflects how effective Amtrak was at economically exploiting the
available capacity.
Each year-to-year SFP metric was calculated via a non-parametric Törnqvist trans-log index, and
then compounded to obtain the cumulative SFP, with 2005 as the base year for all calculations.
Finally, a sensitivity analysis with respect to the route definitions and the inflation parameters
showed that results were robust to changes in key assumptions.
NEC Productivity 2002-2012
As shown in Figure 3, from FY 2002-2012, the NEC experienced highly volatile but overall
considerable SFP growth (in the range of 1-3% per year), which was boosted by the notable SFP
improvements of the past three years.
Figure 3. NEC Cumulative SFP Growth FY 2002-2012 [2]
The differences in demand-side (RPM SFP) and supply-side (ASM SFP) productivity metrics
show that Amtrak increased its ability to fill up and economically exploit the available capacity,
but did not perform equally well on the supply side. Service changes, technical problems with
trains, targeted capital investments, and economic recession and recovery were the main drivers
of productivity change. For example, the technical problems of 2005-06 and the economic

recession of 2008 resulted in yearly productivity dips as low as -19%, while the recent surge in
ridership and allocation of funding produced increments as high as 20%.
Acela and NR services were very sensitive to external events, had large economies of scale, and
implemented slow adjustment of capacity, but their performance was not uniform. Acela was
more sensitive than NR to changing conditions.
As far as productivity concerns go, the ability to implement and operate HSR in the NEC was
more tied to the state of the regional economy, and less to managerial and operational practices.
Inferred NEC Productivity 2012-2040
For studying future productivity, a scenario of analysis for 2012-2040 was based on Amtrak’s
Vision for HSR in the NEC [3]. This is a proposed $150-billion stair-step phasing investment
strategy with two sequenced programs: the NEC Upgrade Program (NEC-UP), which would
reach top speeds of 160 mph, and the NEC Next Generation HSR (NextGen HSR), which would
reach top speeds of 220 mph and reduced travel time to 3 hours from Boston to Washington.
The six stages of the program are:
(1) 40% additional capacity of the Acela Express achieved through additional passenger cars by
2015.
(2) Doubling of the HSR frequencies from New York to Washington by 2020.
(3 - 4) Improved and expanded service on the entire alignment, thanks to the Gateway program,
track improvements, and additional HSR trains by 2025.
(5) Completion of the New York-Washington NextGen HSR segment by 2030.
(6) Full establishment of the Boston-Washington NextGen HSR service by 2040.
In this scenario, the available (projected) outputs are ridership and revenue, while the inputs are
operating costs.
By 2040, the NEC could become 20–40% more productive (on the demand side) with respect to
2013. The expected yearly average growth in ridership (0.7%) and revenue SFP (1.3%) would be
within the ranges of what the NEC achieved in the past (~0.5%–3.0%), though perhaps on the
low side. Productivity increments would be highly variable and most likely occur in later stages.

Peak changes, however, are within the ranges of productivity gains or losses that the NEC
showed in the past: +/- 13–18% on peak years.
Figure 4. NEC Cumulative SFP Growth 2002-12, 2013-40 [2]
However, there are some risks. Since productivity benefits may take years to realize, and if
financial leverage and political support are lacking during adverse times, or if the market and
managers are slow in adapting to changing conditions, the successful implementation of HSR is
uncertain.
Moreover, the NEC VISION lacks ambition in some ways, since projected cumulative
productivity growth is low in comparison to the growth of the past decade (20-40% in the next
30 years vs. 20% in the past 10). Also, the plan to improve management is not explicitly
mentioned, but improved management within Amtrak and coordination with other major travel
modes may reveal a greater potential for productivity improvements.
Thus, we offer the following recommendations to decision-makers: revise projections of
ridership and revenue; involve the FAA in the planning process and consider air/rail cooperation
explicitly; consider the possibility of improved management practices within Amtrak and other
stakeholders of the NEC; prioritize stages of the implementation that promise the highest
productivity improvements, e.g., the Gateway Program; and use scenario planning and design
flexibility in the investment alternatives.
References
[1] The NEC Master Plan Working Group (MPWG) (2010). The Northeast Corridor
Infrastructure Master Plan.
S. 1 S. 2 S. 3 & 4 S. 5 S. 6NEC-UP NEC NextGen HSR
60
80
100
120
140
160
180
2000 2005 2010 2015 2020 2025 2030 2035 2040
Ridership-Op. Cost SFP Revenue-Op. Cost SFP
(2013 index = 100)
Historical Data

[2] Archila, A. F. (2013). Intercity Passenger Rail Productivity in the Northeast Corridor:
Implications for the Future of High-Speed Rail (S.M. in Transportation, MIT)
[3] Amtrak (2012). The Amtrak Vision for the Northeast Corridor: 2012 Update Report.
The authors would like to thank NURail, the Speedwell Foundation and Shelter Hill Foundation
for sponsoring this research.