Productivity in Australia's broadacre and dairy...
18
Productivity in Australia's broadacre and dairy industries Department of Agriculture and Water Resources Research by the Australian Bureau of Agricultural and Resource Economics and Sciences MARCH QUARTER 2017 2017 Charley Xia, Shiji Zhao, Haydn Valle Agricultural Commodities Report
Transcript of Productivity in Australia's broadacre and dairy...
Productivity in Australia's broadacre and dairy industries
Department of Agricultureand Water Resources
Research by the Australian Bureau of Agricultural and Resource Economics and Sciences
MARCH QUARTER 2017
2017
Charley Xia, Shiji Zhao, Haydn Valle
Agricultural Commodities Report

© Commonwealth of Australia 2017
Ownership of intellectual property rights Unless otherwise noted, copyright (and any other intellectual property rights, if any) in this publication is owned by the Commonwealth of Australia (referred to as the Commonwealth).
Creative Commons licence All material in this publication is licensed under a Creative Commons Attribution 3.0 Australia Licence, save for content supplied by third parties, logos and the Commonwealth Coat of Arms.
Creative Commons Attribution 3.0 Australia Licence is a standard form licence agreement that allows you to copy, distribute, transmit and adapt this publication provided you attribute the work. A summary of the licence terms is available from creativecommons.org/licenses/by/3.0/au/deed.en. The full licence terms are available from creativecommons.org/licenses/by/3.0/au/legalcode.
Cataloguing data This publication (and any material sourced from it) should be attributed as ABARES 2017, Agricultural commodities: March quarter 2017. CC BY 3.0.
ISBN: 978-1-74323-330-6 (online) ISSN: 1839-5627 (online) ISBN: 978-1-74323-331-3 (printed) ISSN: 1839-5619 (printed) ABARES project 43506
Internet Agricultural commodities: March quarter 2017 is available at agriculture.gov.au/abares/publications.
Contact Australian Bureau of Agricultural and Resource Economics and Sciences (ABARES)
Postal address GPO Box 858 Canberra ACT 2601 Switchboard +61 2 6272 3933 Email [email protected] Web agriculture.gov.au/abares
Inquiries about the licence and any use of this document should be sent to [email protected].
The Australian Government acting through the Department of Agriculture and Water Resources, represented by the Australian Bureau of Agricultural and Resource Economics and Sciences, has exercised due care and skill in preparing and compiling the information and data in this publication. Notwithstanding, the Department of Agriculture and Water Resources, ABARES, its employees and advisers disclaim all liability, including liability for negligence, for any loss, damage, injury, expense or cost incurred by any person as a result of accessing, using or relying on any of the information or data in this publication to the maximum extent permitted by law.
This article was first published as part of Agricultural Commodities: March, 2017 on 7 March, 2015.
For the full report, visit:agriculture.gov.au/abares/publications/publications andselect the Agricultural Commodities Series
187ABARESAgricultural commodities – March quarter 2017
Productivity in Australia’s broadacre and dairy industriesCharley Xia, Shiji Zhao and Haydn Valle
Summary• From 1977–78 to 2014–15, productivity in the broadacre industries grew by
1.1 per cent per year on average as a result of declining input use (–1 per cent a year) and modest output growth (0.1 per cent a year).
• From 1977–78 to 2014–15 average annual productivity growth in the cropping industry was 1.5 per cent a year, compared with beef (1.3 per cent), sheep(0.3 per cent) and mixed livestock–crops (0.9 per cent).
• Since 2001–02 the sheep industry has exhibited strong annual productivity growth (2.7 per cent a year) compared with the cropping (2.1 per cent), beef (0.5 per cent)and mixed livestock–crops (1.2 per cent) industries.
• Climate conditions have significantly affected the productivity of cropping farms. However, adjusting for the effects of climate, the productivity of cropping farmsgrew strongly from 1977–78 to 1993–94 (2.5 per cent a year), slowed between1994–95 and 2006–07 (0.2 per cent) and increased between 2006–07 and2014–15 (1.7 per cent).
• In the dairy industry, productivity growth averaged 1.5 per cent a year between1978–79 and 2014–15. This was a result of a 1.3 per cent a year increase in output and a 0.2 per cent a year decline in input use.
IntroductionProductivity growth is an important measure of performance for Australian agriculture because in the long term it reflects changes in the efficiency with which farmers use land, labour, capital and intermediate inputs (for example, chemicals, fodder and purchased services) to produce outputs such as crops, meat, wool and milk.
Productivity growth is the key mechanism by which farmers maintain profits. Profitability improves farmers’ livelihoods and attracts investment and resources into agriculture. It also helps farmers:• finance ongoing expenditure on farm inputs• meet debt-servicing obligations• fund investments in new technologies• earn a return on their entrepreneurial ability and capital investments.
Productivity in Australia’s broadacre and dairy industries
188 ABARESAgricultural commodities – March quarter 2017
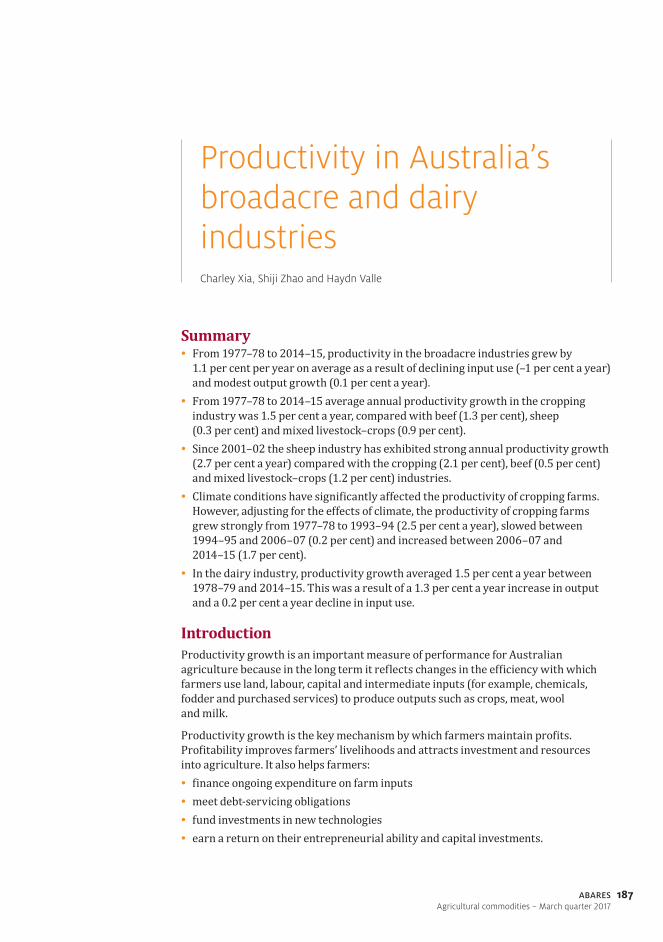
Productivity growth helps farmers offset the impact on profitability of a declining trend in farmer terms of trade (output prices relative to input prices) (Figure 1). Improving productivity is the main way farmers can meet the challenges of uncertain seasonal conditions and other factors beyond their control.
FIGURE 1 Agricultural total factor productivity and farmer terms of trade, Australia, 1948–49 to 2013–14
index1977–78
=100
Terms of tradeTotal factor productivity
Sources: ABARES; Sheng & Jackson 2015
50
100
150
200
250
300
350
400
2013–14
2006–07
1999–2000
1992–93
1985–86
1978–79
1971–72
1964–65
1957–58
1950–51
Productivity growth is the increase in output beyond associated increased input use (or a decrease in the quantity of inputs needed to produce a unit of that output). ABARES preferred measure of productivity is total factor productivity (TFP), the ratio of gross output to total inputs. TFP takes into account a wide range of inputs used and outputs produced (Zhao et al. 2012). Long-term TFP growth is a key indicator of the underlying efficiency of farm businesses. However, short-term variations in TFP can reflect changes in seasonal conditions, so readers should be cautious when interpreting year-to-year movements of TFP numbers.
ABARES produces productivity measures for the Australian broadacre and dairy industries (Box 1). This article updates ABARES productivity statistics to include data for 2014–15 and summarises some of the previous research on the drivers of agricultural productivity.
Drivers of agricultural productivity growthIn the long term, technological progress is the main driver of productivity growth. Public and private investment in research and development (R&D) has contributed significantly to agricultural productivity growth in Australia (Sheng et al. 2011a). Farmers have captured developments in technology and knowledge by investing in higher-yielding, pest and disease-resistant crop varieties, superior planting and harvesting techniques, and better livestock genetics.

Productivity in Australia’s broadacre and dairy industries
189ABARESAgricultural commodities – March quarter 2017
Box 1 ABARES productivity estimatesABARES estimates total factor productivity (TFP) as the ratio of a quantity index of gross output relative to a quantity index of total input. Outputs cover crops and livestock products. Inputs include land, labour, capital, materials and services. The Fisher index is used to aggregate across different outputs and inputs into quantity indexes. Calculating average TFP growth rates is based on fitting an exponential trend line to the annual productivity indexes.
TFP estimates for the broadacre and dairy industries are based on data collected through ABARES farm surveys. ABARES surveys approximately 1,600 broadacre farms and 300 dairy farms each year. Farm data are collected through face-to-face interviews with farmers about farm business operations during the preceding financial year. Interview questions cover farm management, production of crops and livestock products, labour use, expenditure, assets and debt positions, government assistances and off-farm activities.
ABARES classifies broadacre and dairy farms in accordance with the Australian and New Zealand Standard Industrial Classification (ANZSIC) (ABS 2013):
Crops industry (ANZSIC06 class 0146 and 0149)—farms engaged mainly in growing cereal grains, coarse grains, oilseeds, rice and/or pulses.
Mixed livestock–crops industry (ANZSIC06 class 0145)—farms engaged mainly in running sheep or beef cattle (or both) and growing cereal grains, coarse grains, oilseeds and/or pulses.
Beef industry (ANZSIC06 class 0142)—farms engaged mainly in running beef cattle.
Sheep industry (ANZSIC06 class 0141)—farms engaged mainly in running sheep.
Sheep–beef industry (ANZSIC06 class 0144)—farms engaged mainly in running both sheep and beef cattle. In this article, TFP estimates are not reported separately for these farms. However, they are included within the aggregate broadacre estimates.
Dairy industry (ANZSIC06 class 0160)—farms engaged mainly in farming dairy cattle.
A farm is classified into an industry if more than 50 per cent of its receipts are generated by that particular enterprise. Farms that do not meet this criterion for any single enterprise are considered mixed livestock–crops farms. The broadacre industries accounted for about 60 per cent of the total gross value of Australian agricultural production in 2014–15.
Productivity in Australia’s broadacre and dairy industries
190 ABARESAgricultural commodities – March quarter 2017
In the short term, measures of productivity growth for agricultural industries are sensitive to climate variability (Hughes et al. 2011; Sheng et al. 2011b). Much of the productivity growth between the late 1970s and mid 1990s was the result of generally above average rainfall, which increased cropping yields and contributed to strong pasture growth. A slowdown in productivity growth since the mid 1990s is partly a result of adverse seasonal conditions, particularly during the 2000s (Sheng et al. 2011b).
Reforms in Australian agricultural industries have also affected productivity. For example, the removal of marketing and price support mechanisms has contributed directly and indirectly to productivity growth of the broadacre industries (Gray et al. 2014a). These reforms led to structural change through the amalgamation of farms, better risk management and changes in the mix of agricultural commodities produced. These changes altered the allocation of resources between farms, with more efficient producers tending to gain a greater market share over time (Sheng & Jackson 2016; Sheng et al. 2016b).
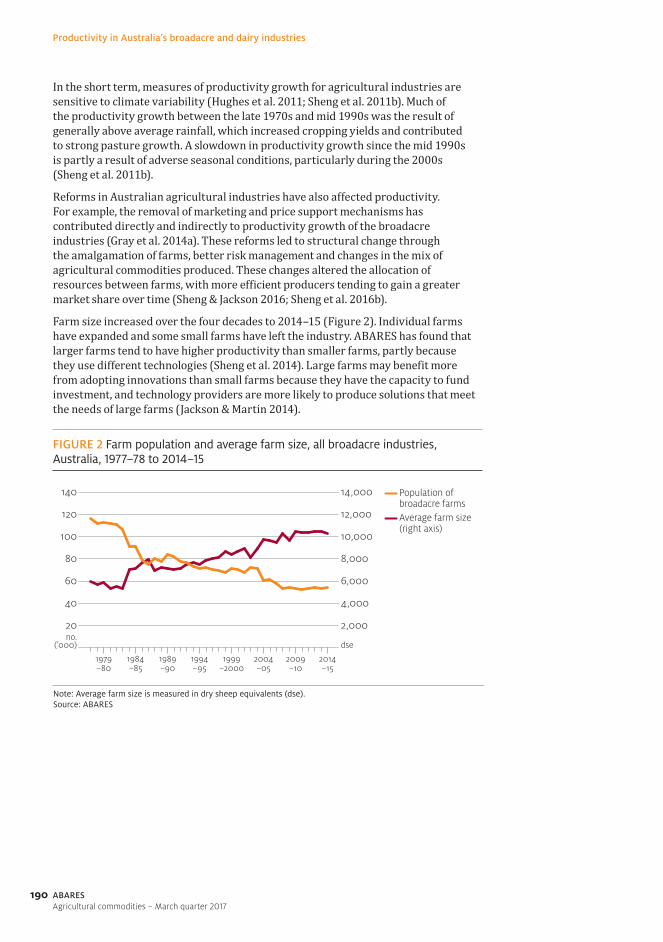
Farm size increased over the four decades to 2014–15 (Figure 2). Individual farms have expanded and some small farms have left the industry. ABARES has found that larger farms tend to have higher productivity than smaller farms, partly because they use different technologies (Sheng et al. 2014). Large farms may benefit more from adopting innovations than small farms because they have the capacity to fund investment, and technology providers are more likely to produce solutions that meet the needs of large farms (Jackson & Martin 2014).
FIGURE 2 Farm population and average farm size, all broadacre industries, Australia, 1977–78 to 2014–15
no.(’000) dse
Population ofbroadacre farmsAverage farm size(right axis)
2,000
4,000
6,000
8,000
10,000
12,000
14,000
Note: Average farm size is measured in dry sheep equivalents (dse).Source: ABARES
20
40
60
80
100
120
140
2014–15
2009–10
2004–05
1999–2000
1994–95
1989–90
1984–85
1979–80
Productivity in Australia’s broadacre and dairy industries
191ABARESAgricultural commodities – March quarter 2017
Farm managers also have a significant bearing on the productivity of farms. Farming is a complex production process. Managers require knowledge and a broad range of skills to maximise profits given uncertainty about seasonal conditions and future prices. Good managers are more likely to make use of information and change technology when it is advantageous to do so. This allows them to produce maximum output from a given set of inputs, leading to higher productivity (Nossal & Lim 2011).
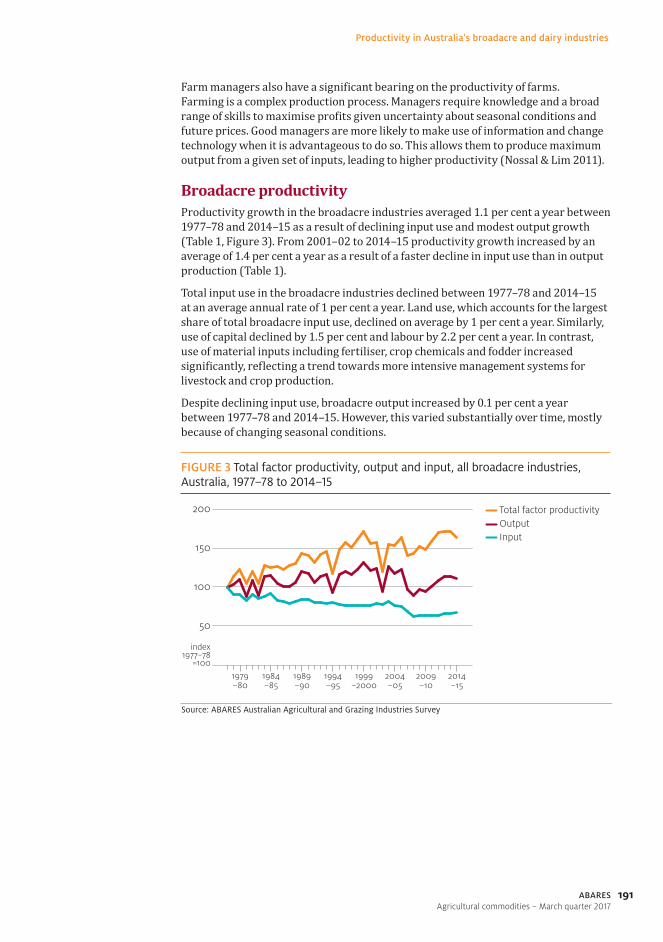
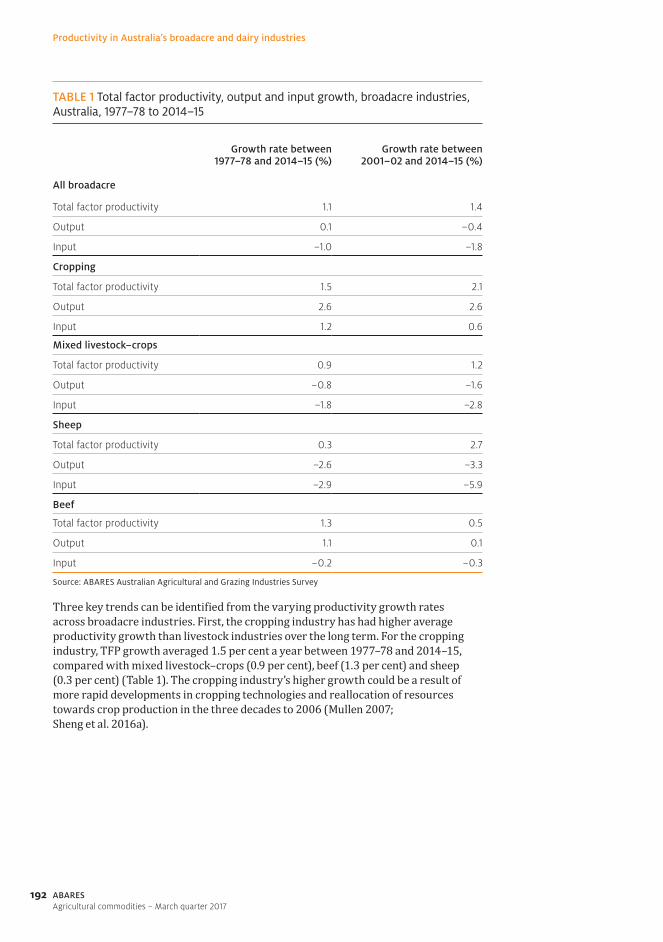
Broadacre productivityProductivity growth in the broadacre industries averaged 1.1 per cent a year between 1977–78 and 2014–15 as a result of declining input use and modest output growth (Table 1, Figure 3). From 2001–02 to 2014–15 productivity growth increased by an average of 1.4 per cent a year as a result of a faster decline in input use than in output production (Table 1).
Total input use in the broadacre industries declined between 1977–78 and 2014–15 at an average annual rate of 1 per cent a year. Land use, which accounts for the largest share of total broadacre input use, declined on average by 1 per cent a year. Similarly, use of capital declined by 1.5 per cent and labour by 2.2 per cent a year. In contrast, use of material inputs including fertiliser, crop chemicals and fodder increased significantly, reflecting a trend towards more intensive management systems for livestock and crop production.
Despite declining input use, broadacre output increased by 0.1 per cent a year between 1977–78 and 2014–15. However, this varied substantially over time, mostly because of changing seasonal conditions.
FIGURE 3 Total factor productivity, output and input, all broadacre industries, Australia, 1977–78 to 2014–15
index1977–78
=100
Total factor productivityOutputInput
50
100
150
200
Source: ABARES Australian Agricultural and Grazing Industries Survey
2014–15
2009–10
2004–05
1999–2000
1994–95
1989–90
1984–85
1979–80
Productivity in Australia’s broadacre and dairy industries
192 ABARESAgricultural commodities – March quarter 2017
Three key trends can be identified from the varying productivity growth rates across broadacre industries. First, the cropping industry has had higher average productivity growth than livestock industries over the long term. For the cropping industry, TFP growth averaged 1.5 per cent a year between 1977–78 and 2014–15, compared with mixed livestock–crops (0.9 per cent), beef (1.3 per cent) and sheep (0.3 per cent) (Table 1). The cropping industry’s higher growth could be a result of more rapid developments in cropping technologies and reallocation of resources towards crop production in the three decades to 2006 (Mullen 2007; Sheng et al. 2016a).
TABLE 1 Total factor productivity, output and input growth, broadacre industries, Australia, 1977–78 to 2014–15
Growth rate between 1977–78 and 2014–15 (%)
Growth rate between 2001–02 and 2014–15 (%)
All broadacre
Total factor productivity 1.1 1.4
Output 0.1 –0.4
Input –1.0 –1.8
Cropping
Total factor productivity 1.5 2.1
Output 2.6 2.6
Input 1.2 0.6
Mixed livestock–crops
Total factor productivity 0.9 1.2
Output –0.8 –1.6
Input –1.8 –2.8
Sheep
Total factor productivity 0.3 2.7
Output –2.6 –3.3
Input –2.9 –5.9
Beef
Total factor productivity 1.3 0.5
Output 1.1 0.1
Input –0.2 –0.3
Source: ABARES Australian Agricultural and Grazing Industries Survey
Productivity in Australia’s broadacre and dairy industries
193ABARESAgricultural commodities – March quarter 2017
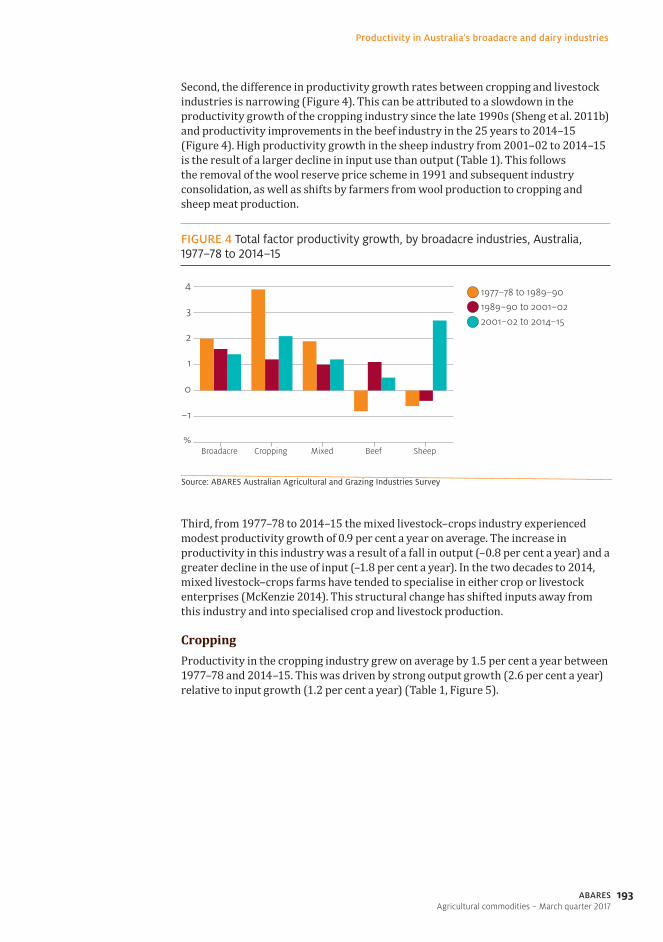
Second, the difference in productivity growth rates between cropping and livestock industries is narrowing (Figure 4). This can be attributed to a slowdown in the productivity growth of the cropping industry since the late 1990s (Sheng et al. 2011b) and productivity improvements in the beef industry in the 25 years to 2014–15 (Figure 4). High productivity growth in the sheep industry from 2001–02 to 2014–15 is the result of a larger decline in input use than output (Table 1). This follows the removal of the wool reserve price scheme in 1991 and subsequent industry consolidation, as well as shifts by farmers from wool production to cropping and sheep meat production.
FIGURE 4 Total factor productivity growth, by broadacre industries, Australia, 1977–78 to 2014–15
2001–02 to 2014–15 1989–90 to 2001–02 1977–78 to 1989–90
%
–1
0
1
2
3
4
Source: ABARES Australian Agricultural and Grazing Industries Survey
SheepBeefMixedCroppingBroadacre
Third, from 1977–78 to 2014–15 the mixed livestock–crops industry experienced modest productivity growth of 0.9 per cent a year on average. The increase in productivity in this industry was a result of a fall in output (–0.8 per cent a year) and a greater decline in the use of input (–1.8 per cent a year). In the two decades to 2014, mixed livestock–crops farms have tended to specialise in either crop or livestock enterprises (McKenzie 2014). This structural change has shifted inputs away from this industry and into specialised crop and livestock production.
CroppingProductivity in the cropping industry grew on average by 1.5 per cent a year between 1977–78 and 2014–15. This was driven by strong output growth (2.6 per cent a year) relative to input growth (1.2 per cent a year) (Table 1, Figure 5).

Productivity in Australia’s broadacre and dairy industries
194 ABARESAgricultural commodities – March quarter 2017
FIGURE 5 Total factor productivity, output and input, cropping industry, Australia, 1977–78 to 2014–15
index1977–78
=100
Total factor productivityOutputInput
50
100
150
200
250
300
350
Source: ABARES Australian Agricultural and Grazing Industries Survey
2014–15
2009–10
2004–05
1999–2000
1994–95
1989–90
1984–85
1979–80
Jackson (2010) and Knopke et al. (2000) attributed strong productivity growth in the cropping industry in the 1980s and 1990s to developments in technology such as larger machinery, new plant varieties, improved water management and a better understanding of harvesting and planning strategies. Productivity growth in the cropping industry has slowed since the late 1990s (Sheng et al. 2011b). This has been attributed to drought, the slower spread of new technology, a slowdown in the development of breakthrough technologies, the effects of knowledge constraints, loss of a profitable break crop and a shift in research priorities away from productivity-related factors (Jackson 2010).
Output has grown strongly in the cropping industry, but input use has also increased. This is largely due to increased land and material input use. From 1977–78 to 2014–15 cropping farms have operated larger farms, with average farm sowing areas increasing nearly threefold. Material inputs including fertiliser, fuel, crop chemicals and seed have increased by an average of 4 per cent a year. Improved understanding of cropping systems, including plant physiology and determinants of soil fertility, has expanded the use of fertiliser and crop chemicals (especially nitrogen and soil ameliorants such as lime and gypsum).
Cropping farms continue to face climate risks. A 2017 ABARES study (Hughes et al. forthcoming) quantifies the impact of climate conditions on cropping farm productivity (Box 2).
The Grains Research and Development Corporation (GRDC 2015) identifies three broad cropping regions across Australia: northern, southern and western. The three regions all experienced productivity growth between 1977–78 and 2014–15 but vary in their output and input growth (Table 2). Variations in climate conditions, soil fertility and operating environment across the regions contribute to differences in crop varieties and production systems. For example, climate and soil conditions in the northern region enable farmers to diversify crop production (GRDC 2015). In contrast, farmers in the western region have practised no-tillage extensively over the longest period (Llewellyn et al. 2012).

Productivity in Australia’s broadacre and dairy industries
195ABARESAgricultural commodities – March quarter 2017
Box 2 Effect of climate on cropping farm productivityABARES productivity estimates are subject to significant climate effects, including large decreases in drought years. This can make it difficult to discern underlying trends in farm performance, both in the short term due to annual climate variability and in the longer term due to climate change.
Over the 20 years to 2013, the CSIRO and Australian Bureau of Meteorology have observed marked changes in Australia’s climate, including reductions in average winter rainfall in southern Australia and general increases in temperature (CSIRO & BoM 2014). Evidence suggests these trends are partly due to climate change (CSIRO 2012; CSIRO & BoM 2016). A 2017 ABARES study (Hughes et al. forthcoming) quantifies the effects of climate on the productivity of Australian cropping farms from 1977–78 to 2014–15. The research further presents climate-adjusted productivity estimates, which measure the performance of cropping farms after climate effects have been removed.
The climate-adjusted figures suggest that productivity grew strongly during the 1980s and early 1990s but slowed considerably from around 1993–94 (Figure 6). However, evidence suggests that productivity growth of cropping farms has been rising since 2006–07 at 1.7 per cent a year. Around 85 per cent of total productivity gains since 1977–78 occurred from 1987–88 to 1993–94 and from 2007–08 to 2013–14.
FIGURE 6 Average climate-adjusted productivity, cropping farms, Australia, 1977–78 to 2014–15
index
Climate-adjusted total factor productivityTotal factorproductivityClimate e�ect
50
100
150
200
Note: The method used by Hughes et al. (forthcoming) for calculating productivity di�ersslightly from that used in this article. Estimates therefore vary.Source: Hughes et al. forthcoming
2014–15
2009–10
2004–05
1999–2000
1994–95
1989–90
1984–85
1979–80
continued ...
Productivity in Australia’s broadacre and dairy industries
196 ABARESAgricultural commodities – March quarter 2017
Box 2 Effect of climate on cropping farm productivity continued
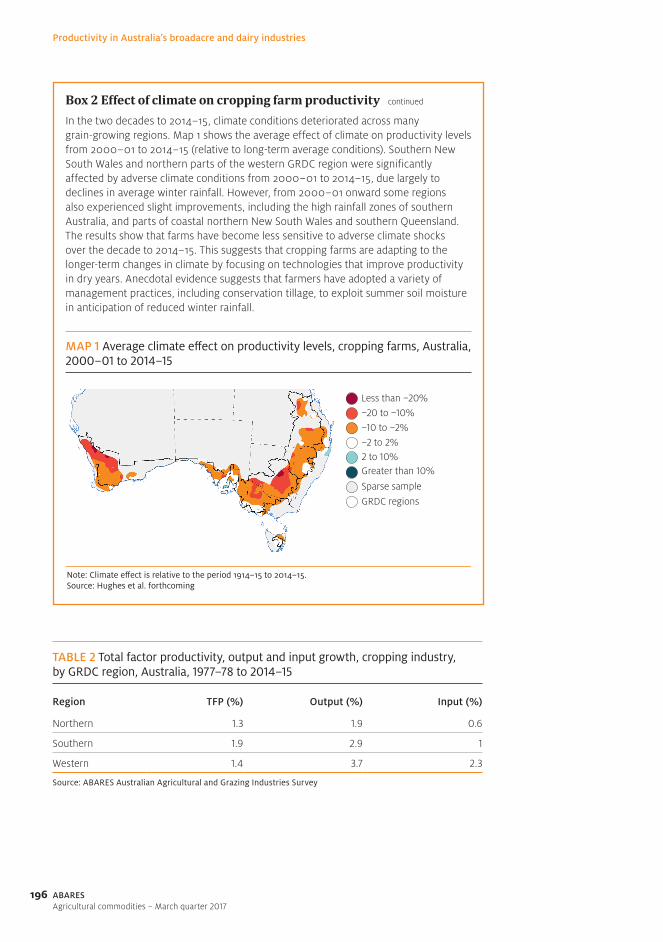
In the two decades to 2014–15, climate conditions deteriorated across many grain-growing regions. Map 1 shows the average effect of climate on productivity levels from 2000–01 to 2014–15 (relative to long-term average conditions). Southern New South Wales and northern parts of the western GRDC region were significantly affected by adverse climate conditions from 2000–01 to 2014–15, due largely to declines in average winter rainfall. However, from 2000–01 onward some regions also experienced slight improvements, including the high rainfall zones of southern Australia, and parts of coastal northern New South Wales and southern Queensland. The results show that farms have become less sensitive to adverse climate shocks over the decade to 2014–15. This suggests that cropping farms are adapting to the longer-term changes in climate by focusing on technologies that improve productivity in dry years. Anecdotal evidence suggests that farmers have adopted a variety of management practices, including conservation tillage, to exploit summer soil moisture in anticipation of reduced winter rainfall.
MAP 1 Average climate effect on productivity levels, cropping farms, Australia, 2000–01 to 2014–15
GRDC regions
Greater than 10%
Sparse sample
2 to 10%
–10 to –2%–2 to 2%
–20 to –10%Less than –20%
Note: Climate e�ect is relative to the period 1914–15 to 2014–15.Source: Hughes et al. forthcoming
TABLE 2 Total factor productivity, output and input growth, cropping industry, by GRDC region, Australia, 1977–78 to 2014–15
Region TFP (%) Output (%) Input (%)
Northern 1.3 1.9 0.6
Southern 1.9 2.9 1
Western 1.4 3.7 2.3
Source: ABARES Australian Agricultural and Grazing Industries Survey
Productivity in Australia’s broadacre and dairy industries
197ABARESAgricultural commodities – March quarter 2017
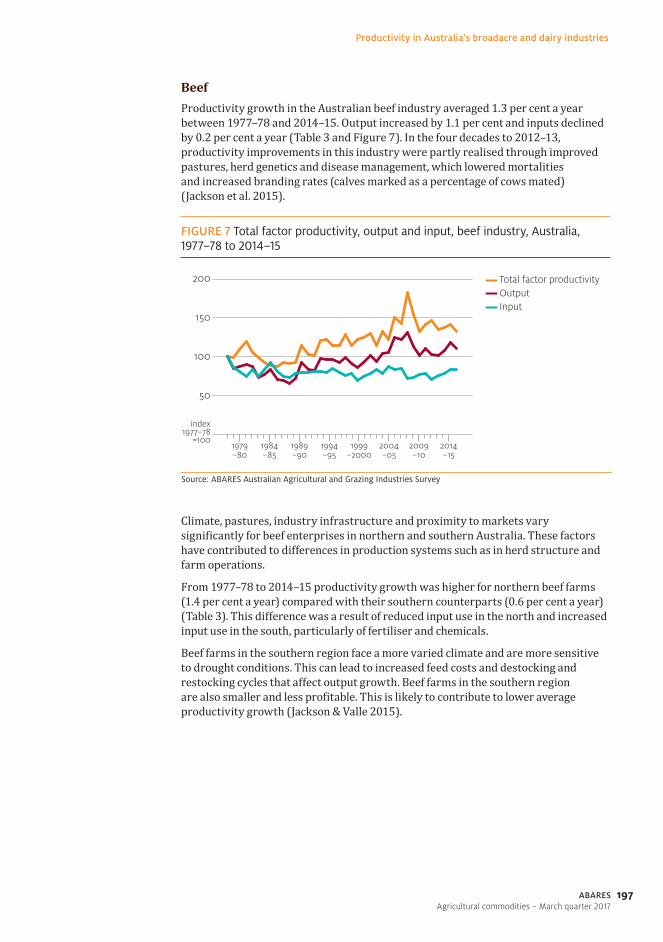
BeefProductivity growth in the Australian beef industry averaged 1.3 per cent a year between 1977–78 and 2014–15. Output increased by 1.1 per cent and inputs declined by 0.2 per cent a year (Table 3 and Figure 7). In the four decades to 2012–13, productivity improvements in this industry were partly realised through improved pastures, herd genetics and disease management, which lowered mortalities and increased branding rates (calves marked as a percentage of cows mated) (Jackson et al. 2015).
FIGURE 7 Total factor productivity, output and input, beef industry, Australia, 1977–78 to 2014–15
index1977–78
=100
Total factor productivityOutputInput
50
100
150
200
Source: ABARES Australian Agricultural and Grazing Industries Survey
2014–15
2009–10
2004–05
1999–2000
1994–95
1989–90
1984–85
1979–80
Climate, pastures, industry infrastructure and proximity to markets vary significantly for beef enterprises in northern and southern Australia. These factors have contributed to differences in production systems such as in herd structure and farm operations.
From 1977–78 to 2014–15 productivity growth was higher for northern beef farms (1.4 per cent a year) compared with their southern counterparts (0.6 per cent a year) (Table 3). This difference was a result of reduced input use in the north and increased input use in the south, particularly of fertiliser and chemicals.
Beef farms in the southern region face a more varied climate and are more sensitive to drought conditions. This can lead to increased feed costs and destocking and restocking cycles that affect output growth. Beef farms in the southern region are also smaller and less profitable. This is likely to contribute to lower average productivity growth (Jackson & Valle 2015).

Productivity in Australia’s broadacre and dairy industries
198 ABARESAgricultural commodities – March quarter 2017
SheepProductivity growth in the sheep industry averaged 0.3 per cent a year from 1977–78 to 2014–15 (Figure 8). Sheep industry productivity declined between 1978–88 and 1993–94 but has since rebounded. Sheep industry productivity grew by an average of 2.7 per cent a year from 2001–02 to 2014–15, the highest growth within the broadacre industries (Figure 4).
The Australian sheep industry has undergone significant adjustment since the early 1990s, when price support mechanisms for wool were removed. Many farmers shifted their enterprise mix from wool to cropping, resulting in lower sheep numbers. Numbers were further reduced by farmers destocking their properties during periods of drought. Productivity growth in the sheep industry has also been attributed to advances in animal breeding and genetics and improved herd, disease and fodder management (Gray et al. 2014b).
From the early 1990s to 2013 a significant increase in the share of ewes in flocks and a corresponding decline in that of wethers contributed to long-term growth in lamb production. However, wool production declined at a faster rate (Dahl et al. 2013). During that period, increased use of non-Merino rams, first-cross ewes and specialty meat breeds, combined with increased emphasis on selection and breeding for meat production traits, boosted productivity through higher lamb growth rates and greater incidence of twinning. Improved pastures and greater use of fodder crops and supplementary feed improved ewe fertility, reduced lamb mortality rates and increased average slaughter weights.
FIGURE 8 Total factor productivity, output and input, sheep industry, Australia, 1977–78 to 2014–15
index1977–78
=100
Total factor productivityOutputInput
50
100
150
200
250
Collapse of the wool reserve price scheme
Source: ABARES Australian Agricultural and Grazing Industries Survey
2014–15
2009–10
2004–05
1999–2000
1994–95
1989–90
1984–85
1979–80
TABLE 3 Total factor productivity, output and input growth, beef industry, by region, Australia, 1977–78 to 2014–15
Region TFP (%) Output (%) Input (%)
Northern 1.4 1 –0.3
Southern 0.6 1.2 0.6
Source: ABARES Australian Agricultural and Grazing Industries Survey
Productivity in Australia’s broadacre and dairy industries
199ABARESAgricultural commodities – March quarter 2017
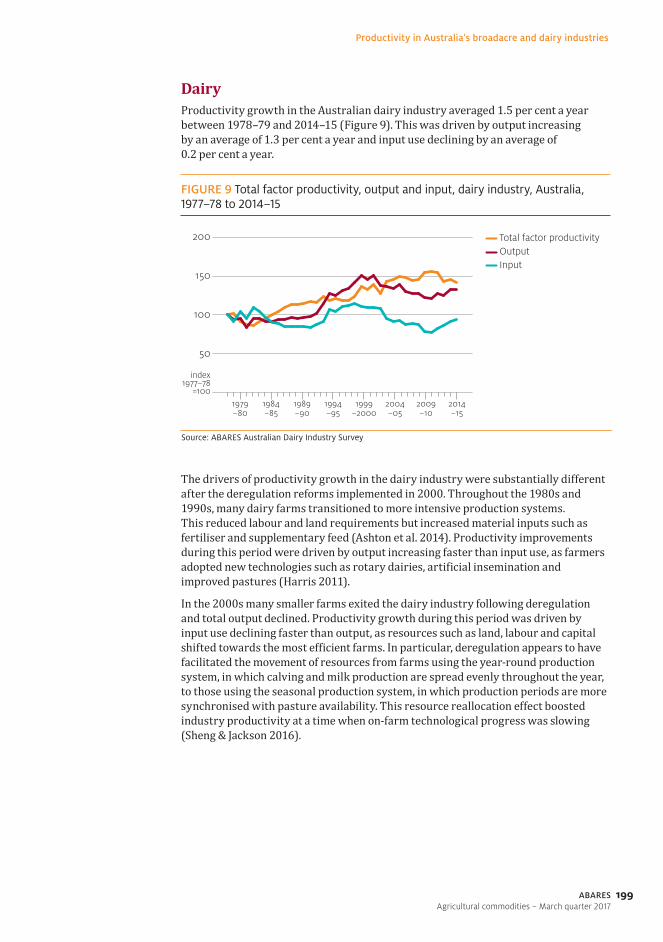
DairyProductivity growth in the Australian dairy industry averaged 1.5 per cent a year between 1978–79 and 2014–15 (Figure 9). This was driven by output increasing by an average of 1.3 per cent a year and input use declining by an average of 0.2 per cent a year.
FIGURE 9 Total factor productivity, output and input, dairy industry, Australia, 1977–78 to 2014–15
index1977–78
=100
Total factor productivityOutputInput
50
100
150
200
Source: ABARES Australian Dairy Industry Survey
2014–15
2009–10
2004–05
1999–2000
1994–95
1989–90
1984–85
1979–80
The drivers of productivity growth in the dairy industry were substantially different after the deregulation reforms implemented in 2000. Throughout the 1980s and 1990s, many dairy farms transitioned to more intensive production systems. This reduced labour and land requirements but increased material inputs such as fertiliser and supplementary feed (Ashton et al. 2014). Productivity improvements during this period were driven by output increasing faster than input use, as farmers adopted new technologies such as rotary dairies, artificial insemination and improved pastures (Harris 2011).
In the 2000s many smaller farms exited the dairy industry following deregulation and total output declined. Productivity growth during this period was driven by input use declining faster than output, as resources such as land, labour and capital shifted towards the most efficient farms. In particular, deregulation appears to have facilitated the movement of resources from farms using the year-round production system, in which calving and milk production are spread evenly throughout the year, to those using the seasonal production system, in which production periods are more synchronised with pasture availability. This resource reallocation effect boosted industry productivity at a time when on-farm technological progress was slowing (Sheng & Jackson 2016).
Productivity in Australia’s broadacre and dairy industries
200 ABARESAgricultural commodities – March quarter 2017
ReferencesABS 2013 Australian and New Zealand Standard Industrial Classification ANZSIC, 2006 (revision 2.0), cat. no. 1292.0, Australian Bureau of Statistics, Canberra.
Ashton, D, Cuevas-Cubria C, Leith, R & Jackson, T 2014, Productivity in the Australian dairy industry: pursuing new sources of growth, ABARES research report 14.11, Australian Bureau of Agricultural and Resource Economics and Sciences, Canberra, September.
CSIRO 2012, Climate and water availability in south-eastern Australia: a synthesis of findings from Phase 2 of the South Eastern Australian Climate Initiative (SEACI), Commonwealth Scientific and Industrial Research Organisation, Canberra, accessed 13 February 2017.
CSIRO & BoM 2014, State of the climate, Commonwealth Scientific and Industrial Research Organisation and the Australian Bureau of Meteorology, Canberra, accessed 13 February 2017.
—— 2016, State of the climate, Commonwealth Scientific and Industrial Research Organisation and the Australian Bureau of Meteorology, Canberra, accessed 13 February 2017.
Dahl, A, Leith, R & Gray, E 2013, ‘Productivity in the broadacre and dairy industries’ in Agricultural commodities: March quarter 2013, Australian Bureau of Agricultural and Resource Economics and Sciences, Canberra.
Gray, EM, Oss-Emer, M & Sheng, Y 2014a, Australian agricultural productivity growth: past reforms and future opportunities, ABARES research report 14.2, Australian Bureau of Agricultural and Resource Economics and Sciences, Canberra, February.
Gray, EM, Leith, R & Davidson, A 2014b, ‘Productivity in the broadacre and dairy industries’ in Agricultural commodities: March quarter 2014, Australian Bureau of Agricultural and Resource Economics and Sciences, Canberra.
GRDC 2015, Our grains industry, Grains Research and Development Corporation, Canberra, accessed 13 February 2017.
Harris, D 2011, Victoria’s dairy industry: an economic history of recent developments, report prepared for the Department of Primary Industries, Victoria and Dairy Australia Ltd, Melbourne, October.
Hughes, N, Lawson, K, Davidson, A, Jackson, T & Sheng, Y 2011, Productivity pathways: climate-adjusted production frontiers for the Australian broadacre cropping industry, paper presented at AARES 55th annual conference, Melbourne, 9–11 February
Hughes, N, Lawson, K & Valle, H 2017 forthcoming, Farm performance and climate: climate-adjusted productivity on broadacre cropping farms, Australian Bureau of Agricultural and Resource Economics and Sciences, Canberra.
Jackson, T 2010, Harvesting productivity: a report on the ABARE–GRDC workshops on grains productivity growth, ABARE research report 10.5 prepared for the Grains Research and Development Corporation, Australian Bureau of Agriculture and Resource Economics, Canberra, April.
Productivity in Australia’s broadacre and dairy industries
201ABARESAgricultural commodities – March quarter 2017
Jackson, T & Martin, P 2014, ‘Trends in the size of Australian farms’ in Agricultural commodities: September quarter 2014, Australian Bureau of Agricultural and Resource Economics and Sciences, Canberra.
Jackson, T, Dahl, A & Valle, H 2015, ‘Productivity in Australian broadacre and dairy industries’ in Agricultural commodities: March quarter 2015, Australian Bureau of Agricultural and Resource Economics and Sciences, Canberra.
Jackson, T & Valle, H 2015, ‘Profitability and productivity in Australia’s beef industry’ in Agricultural commodities: March quarter 2015, Australian Bureau of Agricultural and Resource Economics and Sciences, Canberra.
Knopke, P, O’Donnell, V & Shepherd, A 2000, Productivity growth in the Australian grains industry, ABARE research report 2000.1 for Grains Research and Development Corporation, Australian Bureau of Agricultural and Resource Economics, Canberra.
Llewellyn, RS, D’Emden, FH & Kuehne, G 2012, ‘Extensive use of no-tillage in grain growing regions of Australia’, Field Crops Research, vol. 132, pp. 204–12.
McKenzie, F 2014, ‘Trajectories of change in rural landscapes—the end of the mixed farm?’ in J Connell and R Dufty-Jones (eds), Rural change in Australia, Ashgate Publishing Ltd, Farnham.
Mullen, J 2007, Productivity growth and the returns from public investment in R&D in Australian broadacre agriculture, Australian Journal of Agricultural and Resource Economics, vol. 51, pp. 351–84, accessed 16 February 2017.
Nossal, K & Lim, K 2011, Innovation and productivity in the Australian grains industry, ABARES research report 11.6, Australian Bureau of Agricultural and Resource Economics and Sciences, Canberra, July.
Sheng, Y, Gray, E & Mullen, J 2011a, Public investment in R&D and extension and productivity in Australian broadacre agriculture, ABARES conference paper 11.08 presented to the Australian Agricultural and Resource Economics Society, 9–11 February 2011, Melbourne.
Sheng, Y, Mullen, J & Zhao, S 2011b, A turning point in agricultural productivity: consideration of the causes, ABARES research report 11.4 for the Grains Research and Development Corporation, Australian Bureau of Agricultural and Resource Economics and Sciences, Canberra, May.
Sheng, Y, Zhao, S, Nossal, K & Zhang, D 2014, Productivity and farm size in Australian agriculture: reinvestigating the returns to scale, Australian Journal of Agricultural and Resources Economics, vol. 59, issue 1, pp. 1–23, accessed 16 February 2017.
Sheng, Y & Jackson, T 2015, A manual for measuring total factor productivity in Australian agriculture, ABARES technical research report, Australian Bureau of Agricultural and Resource Economics and Sciences, Canberra, October.
Sheng, Y, Davidson, D, Fuglie, K & Zhang, D 2016a, Input substitution, productivity performance and farm size, Australian Journal of Agricultural and Resources Economics, vol. 60, pp. 327–47, accessed 16 February 2017.
Productivity in Australia’s broadacre and dairy industries
202 ABARESAgricultural commodities – March quarter 2017
Sheng, Y & Jackson, T 2016, Resource reallocation and productivity growth in the Australian dairy industry: implications of deregulation, ABARES technical research report, Australian Bureau of Agricultural and Resource Economics and Sciences, Canberra, July.
Sheng, Y, Jackson, T & Gooday, P 2016b, Resource reallocation and its contribution to productivity growth in Australian broadacre agriculture, Australian Journal of Agricultural and Resource Economics, vol. 61, issue 1, pp. 56–75, accessed 16 February 2017.
Zhao, S, Sheng, Y & Gray, E 2012, ‘Measuring productivity of the Australian broadacre and dairy industries: concepts, methodology and data’, in KO Fuglie, SL Wang & VE Ball (eds), Productivity growth in agriculture: an international perspective, CABI, Wallingford.