
Productivity growth, technical progress and efficiency...
22
Productivity growth, technical progress and efficiency change in Indian unorganized manufacturing sector: Did reforms deliver? Rajesh Raj S. N. . Malathy Duraisamy Abstract This paper analyses total factor productivity growth in the unorganized manufacturing sector in India using several rounds of the large scale National Sample Survey state-level data for 15 major Indian states for the period 1978-79 to 2000-01. Data Envelopment Analysis is used to compute Malmquist total factor productivity index and its components. The impact of economic reforms on efficiency and productivity is examined. Evidence suggests that total factor productivity registered a positive growth during the period in the country as a whole. Most states in the country witnessed higher total factor productivity growth in the post 1990s reform period than in the pre-reform years. Decomposition of the Malmquist productivity index shows that improvement in technical efficiency rather than technical progress had contributed to the observed acceleration in the growth rate. Econometric analysis of the determinants of total factor productivity growth demonstrates that ownership, literacy, farm growth and infrastructure availability significantly influence total factor productivity growth in the sector. Keywords Total Factor Productivity. Efficiency. Unorganized Manufacturing. Reforms. Indian states JEL Classifications D24. O47. R11 1 Introduction The manufacturing sector is an important sector in the Indian economy comprising about 31 percent of the non-agricultural sector, which makes up 75 percent of the overall GDP in India (Kalirajan and Bhide 2005). Available evidence suggests that the share of manufacturing sector in GDP in constant prices has been around 17 percent in the 1990s. The manufacturing activities in India take place in both the organized and unorganized sectors. The unorganized sector consists of units that employ less than 10 workers with the aid of power or less than 20 workers without the aid of power. All other units are classified under organized manufacturing sector. The organized sector accounts for the larger share in manufacturing output but the contribution of unorganized segment to total manufacturing employment is huge. Narayana (2006) reported that the size of unorganized manufacturing employment is three times higher than the organized manufacturing employment. Recent years witnessed structural changes within the manufacturing sector and the unorganized segment reported to be better performing than the organized segment of the sector. This can be primarily on account of substantial increase in outsourcing by the organized sector (Kalirajan and Bhide 2005). Given the crucial role of the manufacturing sector in India’s economic growth, more attention needs to be directed to the sector and this implies that the large unorganized segment of the sector cannot be ignored. Thus there is a need to examine growth of unorganized manufacturing sector in India. Productivity growth has long been recognized as an important driver of economic growth and a determinant of international competitiveness of a country relative to others. According to Krugman (1994), a higher growth in output due to growth in total factor productivity is preferred to an input driven growth as the inputs are subjected to diminishing returns. There is a large body of literature on productivity growth, its components and determinants of the organized manufacturing sector in India (see for instance Brahmananda 1982; Balakrishnan and Pushpangadhan 1994; Dholakia and Dholakia 1994; Goldar and Kumari 2003; Goldar 2004). However, only a small number of studies have examined productivity trends in unorganized manufacturing sector (Unni et al. 2001; Mukherjee 2004; Rani and Unni 2004). Little if Rajesh Raj S.N. (Corresponding author) Associate Fellow, Centre for Multi-Disciplinary Development Research (CMDR) Dharwad, Karnataka, India, Phone: 91-836-2460453 Fax: 91-936-2460464 e-mail: [email protected] Malathy D. Professor, Department of Humanities and Social Sciences, Indian Institute of Technology Madras Chennai - 600 036, India e-mail: [email protected]
Transcript of Productivity growth, technical progress and efficiency...

Productivity growth, technical progress and efficiency change in Indian unorganized manufacturing sector: Did reforms deliver?Rajesh Raj S. N.. Malathy Duraisamy
Abstract This paper analyses total factor productivity growth in the unorganized manufacturing sector in India using several rounds of the large scale National Sample Survey state-level data for 15 major Indian states for the period 1978-79 to 2000-01. Data Envelopment Analysis is used to compute Malmquist total factor productivity index and its components. The impact of economic reforms on efficiency and productivity is examined. Evidence suggests that total factor productivity registered a positive growth during the period in the country as a whole. Most states in the country witnessed higher total factor productivity growth in the post 1990s reform period than in the pre-reform years. Decomposition of the Malmquist productivity index shows that improvement in technical efficiency rather than technical progress had contributed to the observed acceleration in the growth rate. Econometric analysis of the determinants of total factor productivity growth demonstrates that ownership, literacy, farm growth and infrastructure availability significantly influence total factor productivity growth in the sector.
Keywords Total Factor Productivity. Efficiency. Unorganized Manufacturing. Reforms. Indian states
JEL Classifications D24. O47. R11
1 Introduction
The manufacturing sector is an important sector in the Indian economy comprising about 31 percent of the non-agricultural sector, which makes up 75 percent of the overall GDP in India (Kalirajan and Bhide 2005). Available evidence suggests that the share of manufacturing sector in GDP in constant prices has been around 17 percent in the 1990s. The manufacturing activities in India take place in both the organized and unorganized sectors. The unorganized sector consists of units that employ less than 10 workers with the aid of power or less than 20 workers without the aid of power. All other units are classified under organized manufacturing sector. The organized sector accounts for the larger share in manufacturing output but the contribution of unorganized segment to total manufacturing employment is huge. Narayana (2006) reported that the size of unorganized manufacturing employment is three times higher than the organized manufacturing employment. Recent years witnessed structural changes within the manufacturing sector and the unorganized segment reported to be better performing than the organized segment of the sector. This can be primarily on account of substantial increase in outsourcing by the organized sector (Kalirajan and Bhide 2005). Given the crucial role of the manufacturing sector in India’s economic growth, more attention needs to be directed to the sector and this implies that the large unorganized segment of the sector cannot be ignored. Thus there is a need to examine growth of unorganized manufacturing sector in India.
Productivity growth has long been recognized as an important driver of economic growth and a determinant of international competitiveness of a country relative to others. According to Krugman (1994), a higher growth in output due to growth in total factor productivity is preferred to an input driven growth as theinputs are subjected to diminishing returns. There is a large body of literature on productivity growth, its components and determinants of the organized manufacturing sector in India (see for instance Brahmananda 1982; Balakrishnan and Pushpangadhan 1994; Dholakia and Dholakia 1994; Goldar and Kumari 2003; Goldar 2004). However, only a small number of studies have examined productivity trends in unorganized manufacturing sector (Unni et al. 2001; Mukherjee 2004; Rani and Unni 2004). Little if
Rajesh Raj S.N. (Corresponding author)Associate Fellow, Centre for Multi-Disciplinary Development Research (CMDR)Dharwad, Karnataka, India, Phone: 91-836-2460453 Fax: 91-936-2460464e-mail: [email protected]
Malathy D. Professor, Department of Humanities and Social Sciences, Indian Institute of Technology MadrasChennai - 600 036, Indiae-mail: [email protected]

2
any attempt has been made to identify the sources of output/productivity growth in unorganized manufacturing.
A significant development in the Indian economy in the post 1990 period is the acceleration of the reform process that was initiated in the 1980s. The reforms were intended to improve the efficiency, productivity, and international competitiveness of Indian industry. Thus the impact of economic reforms on manufacturing productivity has been a subject of research inquiry but the findings are controversial and inconclusive. Krishna and Mitra (1998), Pattnayak and Thangavelu (2003), Unel (2003) and others argued that total factor productivity (TFP) growth was positive in the post-reforms period while others showed that economic reforms have adversely affected productivity (Goldar and Kumari 2003; Balakrishnan et al. 2000). The substantial variation in the impact of reforms across Indian states has been yet another subject of research interest. Ray (1997, 2002), Aghion et.al. (2003) and Kumar (2004) found evidence of tendency towards convergence in total factor productivity (TFP) growth rate among Indian states in the reform years in respect of organized manufacturing. Unni et al (2001) found that TFP growth in the unorganized manufacturing sector declined in the post-reform period. However the study has been restricted to one state in India. To our knowledge, the productivity performance of the unorganized manufacturing sector in the Indian states before and after the reforms has not been subject to systematic and rigorous analysis.
The primary objective of this study is to analyze the performance of the unorganized manufacturing sector in fifteen major Indian states in terms of total factor productivity growth and its components namely technical efficiency and technical change over the period 1978-79 to 2000-011. The study also compares the performance of the sector across the Indian states in the reforms period with that in the pre-reforms period2. Data for the study are drawn from five rounds of nationwide surveys of the unorganized manufacturing sector conducted by the National Sample Survey Organization (NSSO), India, during 1978-79 to 2000-01. Data Envelopment Analysis (DEA) and Malmquist multi-factor productivity index are used to measure total factor productivity growth and its components, technical efficiency change and technical change. Our study thus makes a methodological contribution as we are not aware of any study that has used a non-parametric approach such as DEA to analyze productivity growth in the Indian unorganized manufacturing sector, and that too at the sub-national level. Finally, we have also conducted an econometric analysis of the determinants of the inter-state variation in total factor productivity growth in the unorganized manufacturing sector.
The scheme of the paper is as follows. Section 2 discusses the theoretical framework underlying the Malmquist model and the decomposition of Malmquist TFP growth index into technical change and technical efficiency change. The database and variables used in the study are explained in section 3. The key reforms undertaken in the industrial sector are also discussed in this section. Section 4 presents some basic summary statistics intended to shed light on the state share and regional spread of unorganized manufacturing sector. The empirical analysis of TFP growth, decomposition into technical efficiency and technology change components and findings of the econometric exercise are reported in section 5. Section 6 provides the summary and concluding remarks.
2 Total factor productivity
It is widely believed that total factor productivity (TFP) is either measured by an index of outputs divided by an index of inputs, or as the shift in the production function. Technological change is also defined and measured as the shift in the production function and is thus often synonymous with TFP. However, when production is allowed to be inefficient, TFP change also includes technical efficiency change. In the empirical exercise attempted in this paper, we report Malmquist total factor productivity growth, which is estimated using a non-parametric method namely, Data Envelopment Analysis (DEA) method. Since we know little about the market structure for the products from the sector in different states, and since price
1 The states are Kerala, Tamil Nadu, Andhra Pradesh, Karnataka, Maharashtra, Gujarat, Madhya Pradesh, Orissa, Punjab, Rajasthan, Uttar Pradesh, West Bengal and Bihar. For the purpose of comparison, some of the newly formed states have been merged with their parent states such as Uttaranchal with Uttar Pradesh, Jharkhand with Bihar and Chattisgarh with Madhya Pradesh.2 It is a general practice in the literature to name the period after the introduction of New Industrial Policy (NIP) as post-reforms period. The present study prefers to call it as reforms period since reforms are an ongoing process.

3
information is weak, the Malmquist index is well justified. The main advantage of a non-parametric technology is that we do not have to specify a specific functional form.
Data envelopment analysis approach
The DEA approach was first proposed by Charnes et al. (1978) to construct a production frontier and since then there have been a vast range of applications in the literature using DEA (Fare and Lovell 1978; Banker et al. 1984; Zheng et al. 1998; Ray and Ping 2001; Mahadevan 2004). DEA envelopes observed input-output data without requiring a priori specification of functional form which turns out to be its major advantage. A production frontier is empirically constructed using linear programming methods from observed input-output data of sample firms. Efficiency of firms is then measured in terms of how far they are from the frontier. In contrast, different specifications of the production function under the parametric approach provide different results and this remains a methodological problem. Secondly, DEA is more appealing than the econometric model as inefficiency is likely to be correlated with the inputs (Gong and Sickles 1992). However, DEA is not free from drawbacks, either. These drawbacks include the following. First, measurement error and statistical noise are assumed to be nonexistent. Second, it does not allow for statistical tests typical of the parametric approach.
The Malmquist TFP growth
The Malmquist index is defined by using distance functions. In this study, an output distance function is used to consider a maximum proportional expansion of the output, given the inputs. The Malmquist TFP index measures the TFP growth change between two data points by calculating the ratio of the distances of each data point relative to a common technology. Following Färe et al. (1994), the output-oriented Malmquist TFP change index between period s (the base period) and period t (the terminal period) is given by
0
0 0 0
0 0 0
1/2( , ) ( , ) ( , )
( , ) ( , ) ( , )( , , , )
s s t t
s s st t t t s s
s t ts s t t s s
d y x d y x d y x
d y x d y x d y xm y x y x (1)
where the notation 0 ( , )st td y x represents the distance from the period t observation to the period s
technology. A value of m0 greater than one indicates positive TFP growth from period s to period t while a value less than one indicates a TFP growth decline. In equation (1), the term outside the square bracket measures the output-oriented measure of Farrell technical efficiency between period s and period t and the term inside measures technological change, which is the geometric mean of the shifts in technology observed in periods s and t. In other words, TFP growth can be decomposed as,
TFP Growth = Technical Efficiency Change (Catching up Effect) × Technical Change (Frontier Effect)
An important issue that has to be addressed while measuring TFP growth is the returns to scale properties of the technology in use. The present study uses a CRS technology because the estimates based on the assumption of VRS technology may not properly reflect the TFP gains or losses resulting from scale effects (Grifell-Tatjé and Lovell 1995). Hence it is important that CRS be imposed upon any technology that is used to estimate distance functions for the calculation of a Malmquist TFP index. We have used the linear programming (LP) technique known as data envelopment analysis (DEA) to calculate the distance functions3. This requires solving of four LPs for each industry. The LPs are:
3 For estimation, we have used DEAP 2.1, a program for data envelopment analysis developed by Coelli (1996).

4
1
0 ( , ) max ,
0,
0,
0,
tt t
it t
it t
d y x
st y Y
x X
1
0 ( , ) max ,
0,
0,
0,
ss s
is s
is s
d y x
st y Y
x X
1
0 ( , ) max ,
0,
0,
0,
ts s
is t
is t
d y x
st y Y
x X
and
1
0 ( , ) max ,
0,
0,
0,
st t
it s
it s
d y x
st y Y
x X
where yit is a MXI vector of output quantities for the i-th industry in the t-th year;xit is a KXI vector of input quantities for the i-th industry in the t-th year;Yt is a NXM matrix of output quantities for all N industries in the t-th year;Xt is a NXK matrix of input quantities for all N industries in the t-th year; is a NXI vector of weights and is a scalar.
3 Data and variables
The study is based on secondary data. The National Sample Survey Organization (NSSO) is the only agency, which collects data on various aspects of the enterprises in the unorganized manufacturing sector. The survey is conducted once in five years (quinquennially) as a follow up survey to the economic census. Till date, five rounds of surveys on the sector have been completed by the NSSO. Data for the present study are drawn from these five large scale national level surveys of unorganized manufacturing sector conducted by the NSSO in its 33rd (1978-79), 40th (1984-85), 45th (1989-90), 51st (1994-95) and 56th (2000-01) rounds. In order to examine the impact of the reforms, the entire time period (1978-2001) has been sub-divided into pre-reforms period (1978-79 to 1989-90) and reforms period (1989-90 to 2000-01). Following Unni et al (2001), the year 1989-90 was considered as the cut-off year. This cut-off year was selected based on the availability of data on the unorganized manufacturing sector. However, 1989-90 can be considered as the last year of the pre-reforms period.
Definition of output and inputs
The basic variables used extensively in this exercise are output, labour and capital. To make the figures comparable over time and across states, suitable deflators have been constructed. The definition of the variables and the deflators used are as given below:

5
(i) Output (V) is defined as gross value added in constant (1993-94) prices obtained by constructing appropriate price deflators using net state domestic product (NSDP) figures pertaining to the unregistered manufacturing sector with 1993-94 as the base year4. (ii) Capital Input (K) is defined as gross fixed assets of the unorganized manufacturing sector. This includes land, buildings and other construction, plant and machinery, transport equipment, tools and other fixed assets that have a normal economic life of more than one year from the date of acquisition. In this paper, gross fixed capital stock formation by unregistered manufacturing sector at the all India level has been used to deflate fixed capital stock in the unorganized manufacturing sector. The values are expressed in 1993-94 prices. (iii) Employment is the number of workers in the sector including full-time and part time, hired and other workers. A worker is defined as one who participates either full time or part time in the activity of the enterprise5. This number includes both paid and unpaid workers. The inclusion of unpaid workers - e.g., relatives in family run business not receiving direct monetary, or occasional or volunteer help, possibly remunerated in kind – allows us to measure the contribution of labour better, especially in these small establishments.
Key aspects of the reforms in the industrial sector
The measures to liberalize India's industrial policy framework begun in the late 1970s consisted of deregulation and delicensing in certain industries, assigning a larger role to the private sector, and a gradual shift from direct physical controls to indirect controls (Raj 1986; Chandrasekhar 1988). This process of liberalization accelerated in 1991….. “the changes that these reforms brought in were `fundamental' in nature compared to the `marginal' changes in the previous decade” (Ahluwalia 1991). The principal objective of the Industrial Policy announced in July 1991 was to free the industrial sector from barriers to entry, and from other restrictions to expansion, diversification and modification. The industrial licensing system was dismantled in all industries except in a small list of strategic and potentially hazardous industries and in a few industries reserved for the small-scale sector. Investment controls on large industrial houses enforced under MRTP act were removed. The areas once reserved for the public sector were opened up, and a decision is made to reduce the government share in public sector enterprises. Accordingly, the number of industries reserved for the public sector was reduced to 6 in 1994 from 17 in 1991. Alongside, many of the public sector enterprises were partially privatized while retaining the government share in excess of 51 percent. Licensing requirements for industrial investment were dispensed with in all but 18 industries.
Policy changes in the external sector such as reduction in tariff and removal of non-tariff restrictions on imports, liberalization of the foreign investment and technology import policies and exchange rate policy reforms could also produce a direct influence on the industrial sector. Licensing and other physical controls of imports were eliminated for non-consumer goods and tariff rates were drastically lowered. Import licensing was done away with for most goods except consumer goods; import-weighted tariff declined to 27 per cent from the pre-1991 level of 87 per cent; and exchange rates were devalued by 20 per cent (Ahluwalia and Little 1998). Scope for foreign direct investment was widened. Further several reform measures have been carried out in more recent years in public sector enterprises, financial and banking systems, capital markets and the energy sector that also could have a bearing on the performance of the industrial sector.
These policy reforms are likely to affect the industrial productivity through a variety of channels. These include (1) increased competitive pressure, (2) greater and cheaper access to better foreign technology and imported intermediate commodities, (3) removal of various constraints on input use, technology choices and investment decisions of industrial firms, (4) greater technological dynamism and (5) more realistic
4 The NSDP figures for the unorganized manufacturing sector of Indian states were obtained from the report on Domestic Products of States of India: 1960-61 to 2000-01 (EPWRF 2003). The values of NSDP for the years 1980-81 to 1996-97 are expressed in 1980-81 prices and for the years 1993-94 to 2001-02 are expressed in 1993-94 prices. These are converted into a common base period, 1993-94 using splicing method. 5 If he/she works for more than half of the period of normal working hours of the enterprise on a fairly regular basis, he/she is referred to as a full-time worker. Alternatively, a part-time worker is who works for less than half of the normal working hours of the enterprise on a fairly regular basis. Note that two part-time workers in an enterprise will be counted as 2 and not 1.

6
exchange rate and favorable economic conditions. In other words, the above said reforms were aimed at making Indian industry more efficient and productive, technologically up-to-date and competitive; with the expectation that efficiency and productivity improvement, technological up-gradation/change and enhancement of competitiveness would enable Indian industry achieve rapid growth.
In the recent past, performance of various types of activities that encompass the unorganized sector has been assigned due importance by the planners partly due to these structural changes taking place in the Indian economy. The significance of the unorganized sector activities in the process of India's development has been emphasized due to the following reasons: (i) there has been a decline in employment growth in the 1970s, 1980s and 1990s in the economy and the growth in employment was lower than the growth of labour force (Planning Commission 2002); (ii) reforms introduced in the 1990s have led to reduction in public sector spending on certain crucial sectors. As a result, decline in growth of organized sector employment was noticed during the 1990s especially in the later part of the 1990s. This was more evident in large scale organized manufacturing sector (Nagaraj 2004); (iii) the labour market is widely believed to be suffering from excessive intervention leading to substitution of capital for labour, and thereby creating a downward effect on employment growth in the organized sector. Added to this, labour market reforms such as reduction in the extent of protection and repealing of the job security clause might have accentuated the employment problem in the organized sector (Nagaraj 2004). Then again, with increasing deregulation and delicensing of economic activities, the process of casualisation and feminization of labour is on the rise (Mitra 2001). `Flexible specialization’ methods of production have encouraged the development of modern small-scale industries with flexible labour regimes (Unni and Rani 2003). These possibilities have renewed the interest in the unorganized sector and its role in the economy during this era of liberalization.
4 State-wise share of gross value added and employment
The state-wise share in gross value added (GVA) and employment during the period, 1978-79 to 2000-01 are reported in Tables 1 and 2. The state level analysis shows that a major part (85 percent) of gross value added is generated in 15 major states in 2000-01. This implies that remaining 15 per cent of gross value added has been mobilized in 13 other states and Union Territories during the said year (table 1). Further these 15 major states provide employment to 91 per cent of total people working in the unorganized manufacturing sector in 2000-01. The pattern of employment and gross value added reveals that relatively more output and employment is generated in the southern region representing the states of Tamil Nadu, Andhra Pradesh, Karnataka and Kerala in the most recent year, 2000-01. However, there is fast erosion in their dominance in the sector overtime as their share in GVA and employment went down from around 30 percent in 1978-79 to 24 percent in 2000-01 and 33 percent in 1978-79 to 27 percent in 2000-01 respectively. The state of Tamil Nadu in the region found to be the major loser as it reported a severe decline in its share in GVA, from 19 percent in 1978-79 to 10.17 percent in 2000-01, and in employment, from 13.07 percent in 1978-79 to 9.29 percent in 2000-01.
In contrast, the north-western states of Uttar Pradesh, Haryana, Punjab and Rajasthan have witnessed a marginal improvement in their relative position in GVA (from 19 percent in 1978-79 to 20 percent in 2000-01) and employment (from 19 percent in 1978-79 to 21 percent in 2000-01). The impressive performance of Uttar Pradesh in employment (12.49 percent in 1978-79 to 14.63 percent in 2000-01) and GVA (7.6 percent in 1978-79 to 10.52 percent in 2000-01) mainly aided the region improving its relative importance in the sector.
Interestingly, Maharashtra in the western region improved its share in GVA but recorded a decline in employment during the period. A striking finding is the relative position of West Bengal: the state recorded a marked decline in its share in GVA (20.46 % in 1978-79 to 10.74 % in 2000-01) but improved its share in employment, from 14 percent in 1978-79 to 15.83 percent in 2000-01.
As regards level of disparity, about one-third of gross value added is generated in top 3 states while the bottom three states account for close to 5 per cent of total in 2000-01. However, it is interesting to learn that level of concentration has come down over the years. The share of top 3 states in gross value added has

7
dropped from 51 per cent in 1978-79 to 34 per cent in 2000-01.Again, the Herfindhal index value reflects consistent fall in the level of concentration over the said period (0.12 in 1978-79 to 0.07 in 2000-01) 6.
Table 1 Share of major states in gross value added (GVA), unorganized manufacturing sector in India: 1978-79 to 2000-01 (values in percentages)
YearStates 1978-79 1984-85 1989-90 1994-95 2000-01Tamil Nadu 18.89 15.20 11.43 9.72 10.17Andhra Pradesh* 3.97 6.64 4.93 4.67 6.48Karnataka* 2.99 7.65 6.24 4.30 4.97Kerala 4.06 5.45 2.55 1.63 2.87South 29.91 34.94 25.15 20.33 24.49Maharashtra* 11.83 9.40 14.34 13.23 12.81Gujarat 7.79 4.95 11.03 9.22 7.68West* 19.62 14.35 25.36 22.45 20.49Uttar Pradesh* 7.60 18.00 12.13 14.48 10.52Haryana 3.84 2.72 1.87 2.33 1.89Punjab* 1.13 2.20 1.74 2.99 3.80Rajasthan 6.17 5.27 6.50 2.77 3.79North-West* 18.74 28.20 22.23 22.57 20.00West Bengal 20.46 10.96 13.28 9.50 10.74Assam 1.22 1.42 1.17 1.26 1.09Bihar* 3.30 2.11 1.82 4.77 3.98East 24.98 14.49 16.27 15.53 15.82Madhya Pradesh 4.32 2.73 2.45 3.60 2.56Orissa 2.42 1.24 1.41 2.25 1.91Central-East 6.74 3.96 3.86 5.85 4.47India 100.00 100.00 100.00 100.00 100.00Measures of Regional ConcentrationTop 3 States (%) 51.18 44.16 39.75 37.43 34.07Bottom 3 States (%) 6.59 4.77 4.32 5.84 4.89Herfindahl Index 0.117 0.1 0.091 0.076 0.069
Notes: States are arranged by their geographical location. The total share of each region is given in bold. States and regions marked with an asterisk sign (*) have increased their shares in total value added by India’s unorganized manufacturing sector between 1978-79 and 2000-01. Gross value added is measured in constant 1993-94 prices.Source: Computed using NSSO survey data.
6 Herfindahl index is used as a measure of concentration. It is in the form ∑si
2, where s is the share of the ith
state in total value added in the country. The index takes values in the range of 0 to 1. A value of 0 indicates zero concentration and a value of 1 indicates maximum concentration. For a detailed review on the generalized index of diversification see Gollop and Monahan (1991).

8
Table 2 Share of major states in employment, unorganized manufacturing sector in India: 1978-79 to 2000-01 (values in percentages)
YearStates
1978-79 1984-85 1989-90 1994-95 2000-01Tamil Nadu 13.07 11.34 9.51 8.69 9.29Andhra Pradesh* 8.87 8.09 9.02 7.68 8.90Karnataka* 4.59 4.40 5.15 5.57 5.48Kerala 6.24 3.86 3.81 2.05 2.89South 32.76 27.69 27.49 23.99 26.55Maharashtra 8.23 6.08 7.20 7.31 8.02Gujarat* 3.85 1.76 4.75 5.47 4.01West 12.08 7.83 11.95 12.78 12.03Uttar Pradesh* 12.49 28.63 14.70 17.87 14.63Haryana 1.93 1.11 1.19 1.01 1.13Punjab* 1.74 1.51 1.71 1.66 2.01Rajasthan* 2.43 3.40 3.67 2.63 3.09North-West* 18.58 34.66 21.27 23.16 20.86West Bengal* 14.00 12.90 17.30 13.19 15.83Assam* 0.88 1.08 0.88 1.88 1.35Bihar 7.07 7.13 6.00 7.64 4.13East 21.96 21.10 24.18 22.71 21.30Madhya Pradesh 6.11 3.96 3.78 4.01 4.00Orissa* 4.19 4.84 6.78 9.32 5.93Central-East 10.30 8.81 10.56 13.33 9.93India 100.00 100.00 100.00 100.00 100.00Top three states (%) 39.56 52.87 41.51 40.38 39.75
Notes: States arranged by their geographical location. The total share of each region is given in bold. States and regions marked with an asterisk sign (*) have increased their shares in total employment of Indian unorganized manufacturing sector between 1978-79 and 2000-01. Source: Computed using NSSO survey data.
5 Trends in technical efficiency and total factor productivity (TFP) across Indian states
This section analyses the performance of the unorganized manufacturing sector of Indian states from 1978-79 to 2000-01 based on total factor productivity growth (TFPG) and its components namely technical change and technical efficiency change. First, we decompose the TFPG rate at the state level into technical change and technical efficiency change, which is further decomposed into pure technical efficiency change and scale efficiency change. Next, a comparative analysis of the unorganized manufacturing sector of the Indian states in the pre-reforms and reforms periods is performed. Finally, the study identifies the major factors that account for the variation in TFPG in the unorganized manufacturing sector of Indian states.
Table 3 shows mean values of change in Malmquist total factor productivity index and its components (efficiency change and technical change) for the period 1978-79 to 2000-01. To be precise, the values of TFPG refer to the mean of changes between four periods, 1978-79 – 1984-85, 1984-85 – 1989-90, 1989-90 – 1994-95 and 1994-95 – 2000-01. Means are given for the ‘all’’ as well as for each of the 15 states. The Malmquist index value greater than one implies positive TFPG and the value less than one indicates TFPG decline. Note that while the product of the efficiency change and technical change components must by definition equal the Malmquist index, those components may be moving in opposite directions7. For all the states put together, the TFP has increased by 2.0 percent during the period under study.
7 For instance, a Malmquist index of 1.25 (which signals a productivity gain) could have an efficiency-change component less than one (say, 0.5) and a technical change component greater than 1 (say, 2.5).

9
Table 3 Changes in total factor productivity and its components
Components of TFPGComponents of Technical
Efficiency Change
StatesTotal factor productivity
change TechnologicalChange
Technical Efficiency
Change
Pure Technical Efficiency
Change
Scale Efficiency
Change
Andhra Pradesh 1.197 0.901 1.328 1.341 0.991Assam 0.949 0.887 1.071 1.000 1.071Bihar 1.211 0.896 1.352 1.345 1.005Gujarat 1.000 0.945 1.058 1.004 1.054Haryana 0.980 0.955 1.026 1.044 0.983Karnataka 1.130 0.900 1.256 1.234 1.019Kerala 1.032 0.913 1.131 1.128 1.002Madhya Pradesh 0.999 0.892 1.120 1.092 1.026Maharashtra 1.075 0.951 1.131 1.030 1.098Orissa 0.915 0.838 1.092 1.027 1.063Punjab 1.336 0.953 1.401 1.366 1.025Rajasthan 0.851 0.901 0.944 0.948 0.997Tamil Nadu 0.864 0.876 0.986 0.981 1.005Uttar Pradesh 1.062 0.887 1.196 1.202 0.995West Bengal 0.830 0.868 0.956 1.000 0.956Mean 1.020 0.904 1.128 1.108 1.019
Source: Computed using NSSO survey data.
An important question to investigate is whether the TFPG has been achieved by improvement in technical efficiency (catch-up) and/or improvement in technology (shift in production frontier)? The decomposition of TFPG into efficiency change and technical change also reported in the table 3 shows that technical efficiency change has been the main contributor to TFPG. The average technical efficiency was 12.8 percent per quinquennium, while the average technical change was negative {-9.6 percent per quinquennium}. This suggests that, in the states studied, technical regress has been the main barrier to achieving high level of TFP during the period under consideration.
Another interesting finding is that only 8 out of 15 states had registered growth in TFP during the period 1978-79 to 2000-01 (Table 3). Further, 12 out of 15 states recorded technical efficiency improvement. All the states experienced technical regress. States such as Assam, Haryana, Madhya Pradesh and Orissa registered a decline in TFP though they have registered an increase in technical efficiency. Technical regress refers to negative rate of technical change. It is not unusual to find technical regress in the manufacturing sector. While estimating TFPG in the organized manufacturing sector of major Indian states, Kumar (2004) observed technical regress in some states during the pre-reforms and reforms period. Similarly, another study on productivity growth in the organized manufacturing sector of Indian states by Ray (2002) also observed technical regress in a number of states.
We now turn to the mean overall technical efficiencies (Table 3, Column 3); they indicate overall positive trend overtime for the sample of states. Recall that a value greater than unity represents an improvement in efficiency and conversely a value below unity refers to efficiency decline. However, not all the states registered a similar performance during the period. Some states, for instance, Punjab, Bihar and Andhra Pradesh have experienced a big increase in overall technical efficiency during the period, while Rajasthan, West Bengal and Tamil Nadu experienced a negative growth in technical efficiency. The technical efficiency change is further decomposed into pure technical efficiency change and scale efficiency change given in the last two columns in table 3. Scale efficiency indicates whether the firm can increase its productivity by becoming larger. The results of the study show that both the pure and scale efficiency have contributed to the growth of overall efficiency. This suggests that, in achieving high levels of technical performance over time, technical efficiency is not a long run constraint.
The positive value of the scale efficiency (Table 3, last column) suggests that the unorganized manufacturing sector has succeeded in taking advantage of the growth in size of the sector, while the improvement in pure technical efficiency over the period 1978-79 to 2000-01 suggests that there was a learning process, as predicted by theories of intra-firm diffusion (Kalirajan and Shand, 2001). While

10
analyzing the trend of technical efficiency and its components, pure technical efficiency and scale efficiency, during 1978-79 to 2000-01, the study found that period-to-period fluctuations in pure technical efficiency has apparently contributed to the fluctuations in overall technical efficiency (Figure 1). This may be due to the difference between states in pure technical efficiency change which is in the range of 0.948 in Rajasthan to 1.366 in Punjab.
Figure 1 Trends in technical efficiency change and its components, 1978-2001Source: Computed using NSSO survey data.
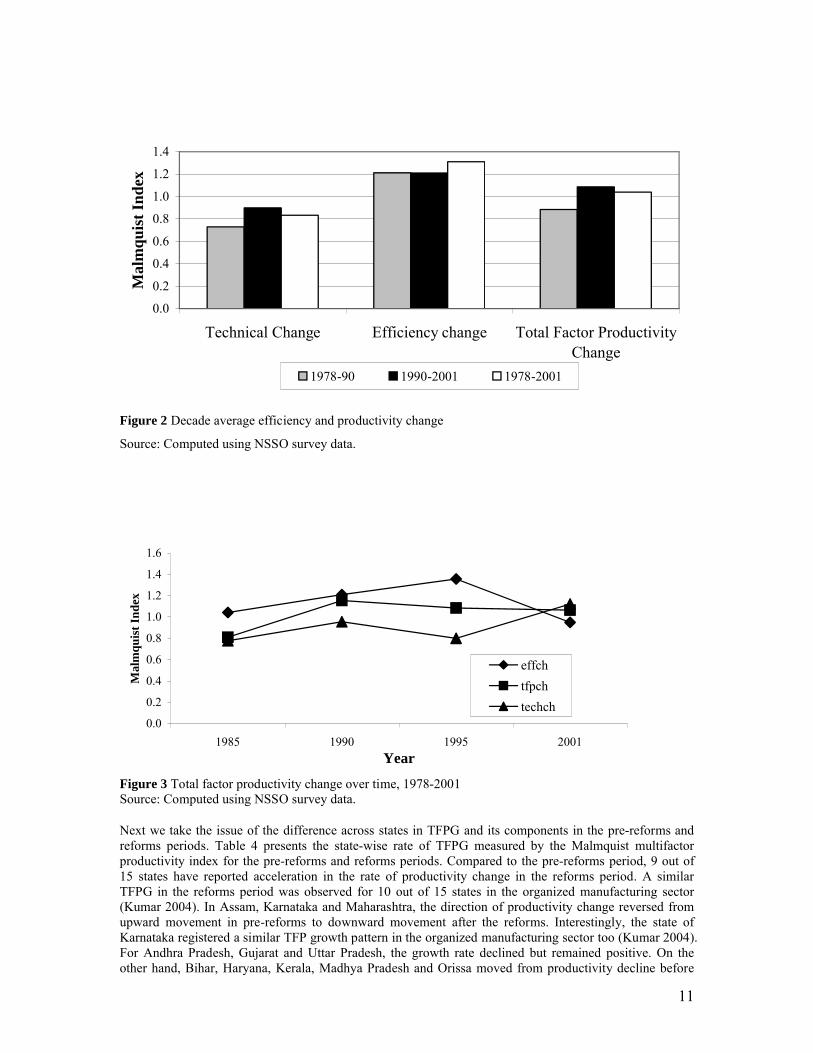
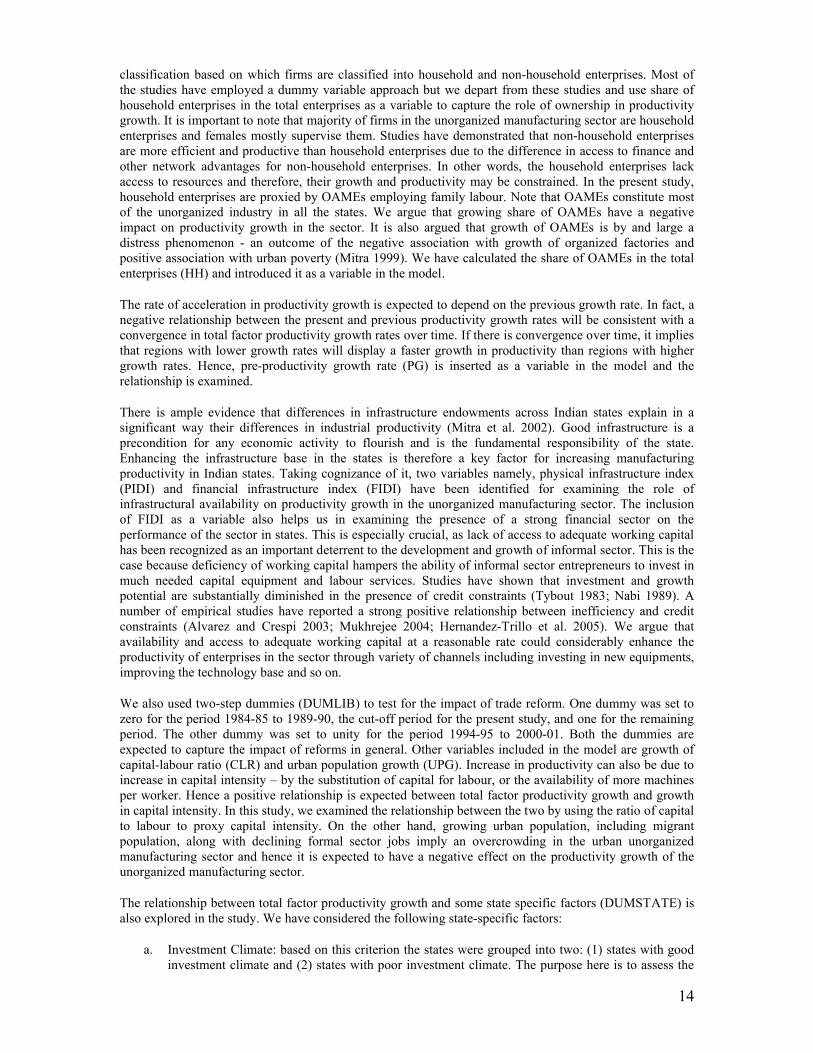
Figure 2 depicts technical efficiency change, technical change and TFPG for three periods – 1978-90 (pre-reforms period), 1990-2001 (reforms period) and 1978-2001 (overall period). The average annual growth rate of technical efficiency during the pre-reforms period was 1.9 percent per year, and in the same period technical change was negative {-2.5 percent per year} implying technical regress. In the reforms period, technological regress continued at a lower rate while the technical efficiency change remained stagnant. This may be due to the fact that the enterprises in the unorganized manufacturing sector of the states, in general, have tried to enhance the technological capability of the production process during the second half of the reforms period as observed from the Figure 3 where technological change reported a positive growth in the last quinquennium (in our analysis, technological change attained a positive figure only during 1994-95 to 2000-01) whereas the efficiency change has decelerated. It is also possible that the reforms introduced in the 1990s forced the states to make more investment in the fixed capital stock to remain more competitive.
0.0
0.2
0.4
0.6
0.8
1.0
1.2
1.4
1.6
1985 1990 1995 2001
Year
Mal
mqu
ist I
nde
x
effch pech sech
11
Figure 2 Decade average efficiency and productivity change
Source: Computed using NSSO survey data.
Figure 3 Total factor productivity change over time, 1978-2001Source: Computed using NSSO survey data.
Next we take the issue of the difference across states in TFPG and its components in the pre-reforms and reforms periods. Table 4 presents the state-wise rate of TFPG measured by the Malmquist multifactor productivity index for the pre-reforms and reforms periods. Compared to the pre-reforms period, 9 out of 15 states have reported acceleration in the rate of productivity change in the reforms period. A similar TFPG in the reforms period was observed for 10 out of 15 states in the organized manufacturing sector (Kumar 2004). In Assam, Karnataka and Maharashtra, the direction of productivity change reversed from upward movement in pre-reforms to downward movement after the reforms. Interestingly, the state of Karnataka registered a similar TFP growth pattern in the organized manufacturing sector too (Kumar 2004). For Andhra Pradesh, Gujarat and Uttar Pradesh, the growth rate declined but remained positive. On the other hand, Bihar, Haryana, Kerala, Madhya Pradesh and Orissa moved from productivity decline before
0.0
0.2
0.4
0.6
0.8
1.0
1.2
1.4
Technical Change Efficiency change Total Factor ProductivityChange
Mal
mq
uis
t In
dex
1978-90 1990-2001 1978-2001
0.0
0.2
0.4
0.6
0.8
1.0
1.2
1.4
1.6
1985 1990 1995 2001
Year
Mal
mq
uis
t In
dex
effch
tfpch
techch

12
reforms to productivity growth after reforms. Rajasthan, Tamil Nadu and West Bengal continued with productivity decline. Punjab experienced continued productivity growth at an accelerated rate. Even in the organized manufacturing sector, Punjab recorded a steady growth in productivity but at a decelerated rate (Kumar 2004). Thus the overall evidence from the Malmquist index is that the rate of productivity growth improved after the reforms in the unorganized manufacturing sector in most of the states. A similar finding for the organized manufacturing sector reported in Ray (2002) and Kumar (2004) implies that the Indian manufacturing sector as a whole has succeeded in enhancing the level of productivity in the reforms period.
Table 4 Efficiency and productivity change across the Indian states
Pre-reforms Period (1978-90) Reforms Period (1990-2001)
States TechnologicalChange
Technical efficiency
change
Total factor productivity
change
TechnologicalChange
Technical efficiency
change
Total factor productivity
changeAndhra Pradesh 0.685 2.246 1.538 0.842 1.386 1.167Assam 0.719 1.505 1.082 0.852 0.873 0.744Bihar 0.669 0.621 0.415 0.846 2.023 1.704Gujarat 0.827 1.252 1.035 1.006 1.000 1.006Haryana 0.870 0.859 0.747 1.006 1.288 1.295Karnataka 0.846 1.671 1.418 1.033 0.879 0.901Kerala 0.682 1.303 0.888 0.847 1.256 1.064Madhya Pradesh 0.717 1.249 0.895 0.883 1.258 1.111Maharashtra 0.740 1.729 1.280 0.955 0.947 0.904Orissa 0.637 0.600 0.383 0.744 2.371 1.764Punjab 0.838 1.702 1.427 1.058 2.261 2.393Rajasthan 0.725 0.924 0.670 0.914 0.861 0.787Tamil Nadu 0.699 0.986 0.689 0.868 0.960 0.834Uttar Pradesh 0.714 1.805 1.289 0.895 1.135 1.015West Bengal 0.629 1.000 0.629 0.790 0.834 0.658Mean 0.729 1.212 0.884 0.898 1.210 1.086
Source: Computed using NSSO survey data.
Having examined the direction of productivity change in the pre-reforms and reforms periods, it is important to examine which of the components has contributed to increase in productivity in the reforms period among the Indian states. The component measures of TFPG, efficiency change and technical change, show that efficiency has been the main contributor to TFPG in the reforms period (Table 4). On the other hand, the analysis also suggests that technical regress has been the main constraint in achieving high levels of TFP during 1990-2001 for most states.
Though the sector as a whole registered technological regress in the pre-reforms and reforms period, regress has slowed down in the reforms period. A number of states have reported positive technological change in the reforms period as compared to the pre-reforms period. The analysis suggests that technical change was positive in the states of Gujarat, Haryana, Karnataka and Punjab during the reforms period. In the states of Gujarat, Haryana and Punjab, TFP registered positive growth during the reforms period suggesting the positive role played by technology. Karnataka is an exception to this where technological change was positive in the reforms period and yet the state witnessed productivity decline in the reforms period. On the whole, two observations emerge: (1) a wide gap is observed between states in TFP and technical efficiency and (2) further improvement in TFP in the unorganized manufacturing sector of Indian states crucially depends on improvement in technology and its adoption by the sector.
Econometric analysis
The discussion above suggests wide variation across the states in the rate of acceleration in productivity growth rate. It is, therefore, important to analyze the factors that account for such variation. A multiple regression analysis has been applied to identify the determinants of TFPG in the unorganized manufacturing sector. The analysis is exploratory and several different models are estimated. The analysis is based on pooled cross-section (state-level) and time series (five rounds) data. Growth rates of TFP computed for three sub-periods (1984-85 to 1989-90, 1989-90 to 1994-95 and 1994-95 to 2000-01) for the

13
15 Indian states are pooled8. In addition, the study also regressed selected variables on changes in TFPG between two periods. The general regression equation is specified as:
)2(1098
7654321
uDUMLIBDUMSTATEFIDIPIDIUPG
CLRGOPGALHHASGRGTFPG
iiititit
itititititititit
In equation (2), TFPGit is the growth rate of TFP in state i in year t. The explanatory variables included in the model and the rationale for their inclusion are discussed below9.
The unorganized sector continued to survive and thrive in the era of liberalization mainly due to its direct or indirect linkage with organized sector units. Many Indian states have witnessed a spurt in unorganized manufacturing activity though at different pace during the 1990s. In the late 90s, the output of the unorganized sector increased at a faster rate than that of the organized sector (Kalirajan and Bhide 2005). It is claimed that the increased growth of unorganized sector is a result of substantial increases in outsourcing by the organized sector. It suggests that linkages with organized sector units are essential for the unorganized sector to maintain its growth performance. The present study examines the relationship between the two by including growth of registered manufacturing output as an explanatory variable (RG) in the regression model.
Evidences on the relationship between agricultural sector growth and growth of non-agricultural sector support a strong link between the two. The argument is that growth of non-farm sector is crucially dependent on the performance of agricultural sector. The farm-non-farm linkage operates through improvements in agricultural performance leading to stimulation of demand for both consumer goods and agro-inputs. As regards unorganized manufacturing sector, majority of enterprises (70 percent) are located in rural areas and therefore, growth of agricultural income plays a critical role in determining the performance of rural non-farm enterprises. In other words, size of the harvests can make a direct effect on growth and productivity in these enterprises through variations in both the price and availability of agricultural raw materials. Thus it may be hypothesized that agricultural growth positively affects productivity growth in the sector. The relationship between the two is examined in this study by introducing growth of agricultural sector (ASG) as an explanatory variable.
There is a large body of evidence that educated workers are not only more productive in performing given tasks, but they are more adept at critically evaluating new information and learning from it. States with a literate and more educated workforce are thus likely to be more efficient because of their greater ability to absorb and effectively utilize new technology. Taking cognizance of it, we included changes in adult literacy (AL) as a variable to capture the role of education in improving productivity in the unorganized manufacturing sector. It is hypothesized that improvement in literacy overtime in a state would enhance the overall human capital base in the sector thereby creating a positive impact on productivity.
Output growth in a sector or firm is usually found to have a strong effect on TFP growth. This is known as Verdoon’s Law, which states that high output growth increases TFP growth through scale economies. It is true that the empirical results might produce a spurious correlation since output growth also enters on the left hand side of the equations estimated namely, in the measures of productivity. Given this caution, we estimate models with output growth (GO) as an additional check on the robustness of our results.
Ownership is another factor that may explain the productivity performance of the sector in selected states. Several studies have employed different ownership-based classifications to examine the role of ownership in explaining technical inefficiencies in enterprises10. The present study, however, employs a different
8 Since we have also included Pre-TFPG as a variable to capture the convergence across states over time, we considered only the time period from 1984-85 to 2000-01 and TFPG for the previous sub-period enters as a variable in the right hand side. 9 Appendix-A discusses the details regarding the data sources on the explanatory variables used in the analysis. 10 Onder et al. (2003) and Margono and Sharma (2006) relied on the public-private ownership classification while Saygili and Taymaz (2001) used the state-mixed-private ownership classification. Pitt and Lee (1981) examined the impact of ownership on technical efficiency by dividing the firms into foreign owned and domestically owned.
14
classification based on which firms are classified into household and non-household enterprises. Most of the studies have employed a dummy variable approach but we depart from these studies and use share of household enterprises in the total enterprises as a variable to capture the role of ownership in productivity growth. It is important to note that majority of firms in the unorganized manufacturing sector are household enterprises and females mostly supervise them. Studies have demonstrated that non-household enterprises are more efficient and productive than household enterprises due to the difference in access to finance and other network advantages for non-household enterprises. In other words, the household enterprises lack access to resources and therefore, their growth and productivity may be constrained. In the present study, household enterprises are proxied by OAMEs employing family labour. Note that OAMEs constitute most of the unorganized industry in all the states. We argue that growing share of OAMEs have a negative impact on productivity growth in the sector. It is also argued that growth of OAMEs is by and large a distress phenomenon - an outcome of the negative association with growth of organized factories and positive association with urban poverty (Mitra 1999). We have calculated the share of OAMEs in the total enterprises (HH) and introduced it as a variable in the model.
The rate of acceleration in productivity growth is expected to depend on the previous growth rate. In fact, a negative relationship between the present and previous productivity growth rates will be consistent with a convergence in total factor productivity growth rates over time. If there is convergence over time, it implies that regions with lower growth rates will display a faster growth in productivity than regions with higher growth rates. Hence, pre-productivity growth rate (PG) is inserted as a variable in the model and the relationship is examined.
There is ample evidence that differences in infrastructure endowments across Indian states explain in a significant way their differences in industrial productivity (Mitra et al. 2002). Good infrastructure is a precondition for any economic activity to flourish and is the fundamental responsibility of the state. Enhancing the infrastructure base in the states is therefore a key factor for increasing manufacturing productivity in Indian states. Taking cognizance of it, two variables namely, physical infrastructure index (PIDI) and financial infrastructure index (FIDI) have been identified for examining the role of infrastructural availability on productivity growth in the unorganized manufacturing sector. The inclusion of FIDI as a variable also helps us in examining the presence of a strong financial sector on the performance of the sector in states. This is especially crucial, as lack of access to adequate working capital has been recognized as an important deterrent to the development and growth of informal sector. This is the case because deficiency of working capital hampers the ability of informal sector entrepreneurs to invest in much needed capital equipment and labour services. Studies have shown that investment and growth potential are substantially diminished in the presence of credit constraints (Tybout 1983; Nabi 1989). A number of empirical studies have reported a strong positive relationship between inefficiency and credit constraints (Alvarez and Crespi 2003; Mukhrejee 2004; Hernandez-Trillo et al. 2005). We argue that availability and access to adequate working capital at a reasonable rate could considerably enhance the productivity of enterprises in the sector through variety of channels including investing in new equipments, improving the technology base and so on.
We also used two-step dummies (DUMLIB) to test for the impact of trade reform. One dummy was set to zero for the period 1984-85 to 1989-90, the cut-off period for the present study, and one for the remaining period. The other dummy was set to unity for the period 1994-95 to 2000-01. Both the dummies are expected to capture the impact of reforms in general. Other variables included in the model are growth of capital-labour ratio (CLR) and urban population growth (UPG). Increase in productivity can also be due to increase in capital intensity – by the substitution of capital for labour, or the availability of more machines per worker. Hence a positive relationship is expected between total factor productivity growth and growth in capital intensity. In this study, we examined the relationship between the two by using the ratio of capital to labour to proxy capital intensity. On the other hand, growing urban population, including migrant population, along with declining formal sector jobs imply an overcrowding in the urban unorganized manufacturing sector and hence it is expected to have a negative effect on the productivity growth of the unorganized manufacturing sector.
The relationship between total factor productivity growth and some state specific factors (DUMSTATE) is also explored in the study. We have considered the following state-specific factors:
a. Investment Climate: based on this criterion the states were grouped into two: (1) states with good investment climate and (2) states with poor investment climate. The purpose here is to assess the

15
role of investment climate on productivity growth. Investment climate is measured as a dummy variable with states with poor investment climate being the reference category.
b. Labour Regulation: It is expected that differences in labour regulation across states could make an impact on the performance of the unorganized manufacturing sector. Accordingly, the states are classified into pro-worker, pro-employer and neutral states. Two dummies respectively for pro-worker and pro-employer states were used with neutral states being the reference category in both cases.
Regression results
Table 5 presents the results of the regression analysis. Seven different regression models are estimated. Regressions (1) and (2) differ in regard to the inclusion of FIDI variable in the latter. In regression (3) variables are same as in regression (2) but the dummies for pro-worker state, pro-employer state and investment climate in the state are also introduced as variables. Output growth enters as a variable in regression (4) but the variable, registered manufacturing growth, has been dropped. The specifications used in regressions (5) and (7) are similar to those in regression (2) except that growth in capital intensity appears as a variable in regression (5) and urban population growth in regression (7). In regression (6), growth of registered manufacturing output has been dropped and agricultural sector growth has been included. All the regression models above have been estimated by using the Ordinary Least Squares (OLS) method. We can draw several conclusions from the information furnished in Table 5.
We found a positive relationship between growth of registered manufacturing output and productivity, which was as expected. However, in none of the regressions shown in the table, is the coefficient statistically significant. In regression (1), the coefficient is significant at 10 percent level or more. Since a statistically insignificant coefficient is found in general, it may be inferred that this factor did not on balance have a positive impact on productivity growth in Indian unorganized manufacturing. In other words, the relationship between the two sectors is benign but it did not make a significant impact on productivity growth. The coefficient of agricultural growth (regression 6) is found to be positive and statistically significant at the 5 per cent level. This may be interpreted as showing the effect of agricultural growth on demand for products from the sector and hence on manufacturing productivity.
The regression results presented in table 5 show significant positive relationship between changes in adult literacy and productivity growth. The coefficient of AL is found to be consistently positive and it is statistically significant at 5 percent level in all the models but one. This result suggests that improving the educational base of workers involved in the sector could be a source of big productivity improvements in unorganized manufacturing sector. Therefore, efforts should be made to enhance the level of education of workers as well as to attract educated youth towards the sector.
The coefficient of HH is found to be negative. It is statistically significant at the 1 percent or higher level in the regressions. The result is as expected implying that increasing share of OAMEs would generate a downward effect on TFP growth. It also supports our claim that the growth of OAMEs in the sector is a distress driven phenomenon and may not contribute significantly to output growth thereby affecting productivity growth in the sector.
The coefficient of pre-productivity growth rate (PG) is found to be negative and significant in all the regressions. This may be interpreted as showing that there is evidence of conditional beta-convergence in total factor productivity growth across regions over time.
The result of regression (4) presented in Table 5 clearly shows a significant positive relationship between output growth and TFP growth. The coefficient of output growth is positive and statistically significant at the 1 percent level. Many studies in the Indian context have reported a positive relationship between output growth and productivity growth (Ahluwalia 1991; Goldar 1992). Note that inclusion of output does not change our main findings.
The coefficient of the DUMLIB is found to be positive and statistically significant at 10 percent level or more in most of the regressions. This variable is expected to capture the effect of economic reforms on productivity growth. The result may be interpreted as showing the productivity enhancing effect of reforms

16
through increased competitive pressure and growing outsourcing from the organized sector especially during the late 90s.
The coefficients of CLR and UPG are found to be negative. This relationship is obviously as expected but the coefficients are found to be insignificant. The insignificant role of CLR can be related with our early finding of lack of technological progress in the sector for over a period of time. This finding also stresses the need for making more capital investment in the sector. As regards UPG, the result shows that increase in number of migrant population did not make a significant impact on productivity growth in the sector.
The positive value of the coefficient of physical infrastructure development index (PIDI) was expected as better and improved infrastructure contributes to productivity growth in the sector. As expected, the coefficient of FIDI is positive and significant at 10 percent level or more in three regression models. This suggests that presence of a strong financial sector positively helps in enhancing the productivity levels in the sector. In view of this finding, efforts should be made to increase and improve the access of small firms to capital markets.

17
Table 5 Determinants of total factor productivity growth in unorganized manufacturingVariable 1 2 3 4 5 6 7
Constant93.21
(3.47)*76.90
(2.74)*72.48
(2.41)**60.70
(2.65)*68.9
(2.29)**68.6
(2.51)*77.98
(2.74)*
Registered manufacturing growth0434
(1.73)***0.379(1.54)
0.409(1.59)
0.361(1.45)
0.380(1.52)
Growth of agricultural sector1.546
(1.96)**
Share of OAMEs in total enterprises-1.164
(-3.89)*-1.060
(-3.54)*-1.050
(-3.36)*-0.804
(-3.27)*-0.978
(-3.06)*-0.991
(-3.41)*-1.059
(-3.50)*
Change in adult literacy0.784
(2.01)**0.772
(2.03)**0.826
(2.08)**0.543
(1.72)***0.794
(2.07)**0.814
(2.19)**0.816
(2.06)**
Dummy for trade liberalization6.765
(1.76)***6.449
(1.71)***6.637
(1.69)***4.910
(2.09)**5.554(1.40)
2.546(0.92)
6.192(1.65)***
Pre-productivity growth rate-0.350
(-2.63)*-0.370
(-2.83)*-0.378
(-2.81)*-0.246
(-2.28)**-0.339
(-2.48)*-0.424
(-3.18)*-0.365
(-2.76)*
PIDI2.943
(2.63)*3.103
(3.15)*2.671
(2.36)**1.919
(2.34)**2.832
(2.69)*2.821
(2.96)*3.042
(3.02)*
FIDI1.662
(1.65)***2.224(1.20)
1.016(1.22)
1.690(1.67)***
1.534(1.55)
1.687(1.66)***
Dummy for investment climate-3.835(-0.98)
Dummy for pro-worker states-0.270(-0.07)
Dummy for pro-employer states-0.054(-0.01)
Growth in output0.658
(4.67)*
Growth in capital-labour ratio0.089(0.76)
Urban population growth-0.061(-0.46)
R2 33.8 38.4 40.5 58.8 39.4 40.6 38.7Number of observations 45 45 45 45 45 45 45
Note: The dependent variable is the growth rate of total factor productivity. The data are drawn from the quinquennial rounds of NSSO for the period 1978 to 2001. We have considered five rounds and there are 15 industry groups giving 60 observations. The t-statistics are reported in parentheses. Details about the variables are given in the appendix. All equations are estimated with Ordinary Least Square (OLS) Method. We have checked for the presence of Multi-collinearity and Autocorrelation using VIF and Durbin-Watson statistics respectively.

18
As is evident from Table 6, the main findings remained the same even when we used changes in TFPG between periods as a dependent variable instead of TFP growth rate: the RG variable remains insignificant, the HH, AL and ASG still affect TFP, the trade reform dummy variable continues to be significant although its coefficient has dropped in the second regression and the evidence of conditional convergence remains unaffected.
Table 6 Determinants of changes in total factor productivity growth in unorganized manufacturingVariable 1 3
Constant105.67(2.77)*
104.02(2.80)*
Registered manufacturing growth0.689(1.64)
Growth of agricultural sector1.977
(1.97)***
Share of OAMEs in total enterprises-1.265
(-3.02)*-1.273
(-3.14)*
Change in adult literacy0.691(1.44)
0.743(1.66)***
Dummy for trade liberalization10.819(2.23)*
4.975(1.44)
Pre-productivity growth rate-1.281
(-7.48)*-1.374
(-8.09)*
PIDI4.317
(3.09)*4.176
(3.02)*R2 0.74 0.75Number of observations 30 30
The regression results were not impressive with regard to the country specific dummies. It may be due to the reason that they do not change over time and therefore they do not affect changes in productivity over time. Therefore, we found it more informative to look at simple cross-tabulation.
Tables 7 report the performance of unorganized manufacturing sector in technical efficiency change, technological change and total factor productivity growth for the overall period (1978-2001) and reforms period (1990-2001). It is evident that there are substantial differences across groups. Regions with good investment climate performed well in terms of total factor productivity during the whole period while the states where the investment climate is rated to be poor recorded decline in TFP. But the latter group considerably improved the TFP during the reforms period (Table 7).
Table 7 Average total factor productivity growth by selected performance characteristics during the overall period and reforms periodStates Technical Efficiency
ChangeTechnical Change Total Factor Productivity
GrowthOverall Period (1978-2001)
Investment Climate a
Good 1.160 0.925 1.074Poor 1.143 0.866 0.991Labour Regulation b
Proworker states 1.057 0.899 0.950Proemployer states 1.151 0.881 1.014Neutral States 1.200 0.915 1.098
Reforms Period (1990-2001)Investment Climate a
Good 1.083 0.972 1.053Poor 1.142 0.892 1.019Labour Regulation b
Proworker states 1.082 0.941 1.017Proemployer states 1.093 0.912 0.997Neutral States 1.315 0.955 1.256a – CII-World Bank (2002) b – Besley and Burgess (2002)

19
When we look at the impact of labour regulation, it appears that the pro-labour attitude did make a substantial difference. States labeled as neutral and pro-employer performed better than pro-worker states. But the sector also witnessed gradual erosion in their dominance during the reforms period.
Overall, we found that technical efficiency has improved over time in all the groups and technical change was the main constraint for achieving high levels of total factor productivity during the period under study.
6 Conclusions
In this paper, the efficiency and productivity performance of the unorganized manufacturing sector in the Indian states has been gauged using Data Envelopment Analysis during both the pre-reforms and reforms periods. The findings of the study reflect that the annual rate of productivity growth has been higher in the reforms period as compared to the pre-reforms period. The decomposition of productivity growth into technological change and efficiency change reveals that the latter has played a major role in the reforms period. The reforms period has also witnessed a decline in the pace of technical regress and a number of states have in fact reported technological progress during the same period.
The observed technical regress may be due to deterioration in the quality of inputs, an issue that needs to be addressed. Another interpretation for the technological regress is that acquisition of technology is relatively deficient in the unorganized manufacturing sector. Endogenous growth literature points out that this is crucial to the enhancement of productivity growth. In the production process, technology is largely embodied in the machinery, which suggests that the rapid decline could be due to the under-utilization of advanced technology - a fact that could be attributed to the changes in the macro policy environment in these states. Perhaps, technological upgradation could then help improve the output growth of the unorganized sector. In other words, any policy should be focused on reversing this technological decline rather than improving technical or scale efficiencies.
The most interesting finding is the evidence that in recent years interstate inequalities have come down across the board. They are still high but it can be said that the restructuring process in unorganized manufacturing has at least tended to reduce somewhat the wide gaps between productivity growth in one state and another. A regression analysis of the determinants of productivity growth shows that non-household ownership, literacy, farm growth and infrastructure availability contribute to total factor productivity growth in the sector. The study also observed a tendency towards convergence in the productivity growth rate across the Indian states.

20
Appendix – A
Major data sources
Domestic Product of States of India: 1960-61 to 2000-01, Economic and Political Weekly Research Foundation, Mumbai, June 2003. Handbook of Statistics on Indian Economy, Reserve Bank of India, Mumbai (Various Issues).National Account Statistics, 1950-51 to 2002-03, Economic and Political Weekly Research Foundation, Mumbai, December 2004.Surveys of the Unorganized Manufacturing Sector, National Sample Survey Organization, Ministry of Statistics and Programme Implementation, Government of India (Various Issues).
Data Sources on explanatory variables
Infrastructure data: In a recent study, Ghosh and De (2004) presented estimates for PIDI and FIDI for the years 1971-72, 1981-82, 1991-92 and 1997-98. These estimates have been used in the analysis. Theestimates for 1981-82, 1991-92 and 1997-98 were used for the periods 1984-85-1989-90, 1989-90-1994-95 and 1994-95-2000-01 respectively. Adult literacy rate: Data on Literacy level as a percentage of age group were drawn from various issues of Educational Statistics published by Human Resources Department, Ministry of Education, New Delhi. Registered manufacturing growth: estimated from the Annual Survey of Industries in the registered manufacturing sector published by Central Statistical Organization, New Delhi. Agricultural sector growth: Agricultural growth has been measured as the rate of change in gross domestic product of the agriculture and allied sectors at constant prices of 1980-81. The data have been taken from the Reserve Bank of India, Handbook of Statistics on Indian Economy (various issues). Share of OAMEs in total enterprises: calculated from the NSSO surveys on the unorganized manufacturing sector (various issues)Urban population growth: Data were drawn from the report on Economic Reforms and Employment Growth in India published by Town and Country Planning Organization, Ministry of Urban Development, Government of India, New Delhi, 2005. State-specific factors: Classification of states based on investment climate (IC) comes from CII-World Bank (2002). Besely and Burgess (2002) provided the classification based on labour regulation.

21
References
Aghion P, Burgess R, Redding S, Zilibotti F (2003) The unequal effects of liberalization: theory and evidence from India. Mimeo, Harvard, LSE, IIES Ahluwalia IJ (1991) Productivity growth in Indian manufacturing. Oxford University Press, New DelhiAhluwalia IJ, Little IMD (1998) Introduction. In: Ahluwalia IJ, Little IMD (eds) India’s economic reforms and eevelopment: essays for Manmohan Singh, Oxford University Press, New DelhiAlvarez R, Crespi G (2003) Determinants of technical efficiency in small firms. Small Bus Econ 20:233-44Balakrishnan P, Pushpangadan K (1994) Total factor productivity growth in manufacturing industry: a fresh look. Econ Polit Week 29:2028-2035Balakrishnan P, Pushpangadan K, Babu SM (2000) Trade liberalization and productivity growth in manufacturing: evidence from firm-level panel data. Econ Polit Week 35:3679–3682Banker RD, Charnes A, Cooper WW (1984) Some models for estimating technical and scale inefficiencies in data envelopment analysis. Manage Sci 30: 1078-1092Besley T, Burgess R (2002) Can labour regulation hinder economic performance? evidence from India. CEPR Discussion Paper No 3260, LondonBrahmananda PR (1982) Productivity in the Indian economy: rising inputs for falling outputs. Himalaya Publishing House, MumbaiChandrasekhar CP (1988) Aspects of growth and structural change in Indian industry. Econ Polit Week 23:2359-2370Charnes A, Cooper WW, Rhodes E (1978) Measuring the efficiency of decision making units. Europ J Operations Res 2:429-444CII-World Bank (2002) Competitiveness of Indian manufacturing: results from a firm level survey. Confederation of Indian Industry, New DelhiCoelli T (1996) A guide to DEAP version 2.1: a data envelopment analysis (computer) program. CEPA Working Paper 96/08, University of Queensland, Australia Dholakia RH, Dholakia BH (1994) Total factor productivity growth in Indian manufacturing. Econ Polit Week 29:342-344Fare R, Lovell CAK (1978) Measuring the technical efficiency of production. J Econ Theory 19:150-162 Fare R, Grosskopf S, Norris M, Zhang Z (1994) Productivity growth, technical progress, and efficiency change in industrialized countries. Amer Econ Rev 84: 66-83Ghosh B, De P (2004) How do different categories of infrastructure affect development? Evidence from Indian states. Econ Polit Week 34:4645-57Goldar B (1992) Productivity and factor use efficiency in Indian industry. In: Ghosh A, Subramanian KK,Eapen M, Brabu HA (eds) Indian industrialization: structure and policy issues, Oxford University Press, New Delhi Goldar B (2004) Productivity trends in Indian manufacturing in the pre- and post-reform periods. Working Paper No. 137, ICRIER, New Delhi Goldar B, Kumari A (2003) Import liberalization and productivity growth in the Indian manufacturing industries in the 1990s. Developing Economies 41: 436-460Gollop FM, Monahan JL (1991) A generalized index of diversification: trends in U.S. manufacturing. Rev Econ Statist 73:318-330 Gong BH, Sickles RC (1992) Finite sample evidence on the performance of stochastic frontiers and data envelopment analysis using panel data. J. Econometrics 51:259-84Grifell-Tatje E, Lovell CAK (1995) A note on the Malmquist productivity index. Econ Letters 47: 169-175Hernandez-Trillo F, Pagan JA, Paxton J (2005) Start-up capital, microenterprises and technical efficiency in Mexico. Rev Devel Econ 9:4-447 Kalirajan KP, Bhide S (2005) The Post-reform Performance of the manufacturing sector in India. Asian Econ Pap 3:126-157Kalirajan KP, Shand RT (2001) Technology and farm performance: paths of productive efficiencies over time. Agr Econ 24:297–306 Krishna P, Mitra D (1998) Trade liberalization, market discipline and productivity growth: new evidence from India. J Devel Econ 56:447-462 Krugman P (1994) The myth of Asia’s miracle. Foreign Aff 73:62-78. Kumar S (2004) A decomposition of total factor productivity growth: a regional analysis of Indian industrial manufacturing growth. Working Paper No. 22, NIPFP, New Delhi Mahadevan R (2004) The economics of productivity in Asia and Australia. Edward Elgar, Cheltenham Margono H, Sharma SC (2006) Efficiency and productivity analyses of Indonesian manufacturing industries. J Asian Econ (in press)Mitra A (1999) Employment in informal sector. Indian J Lab Econ 41:475-482

22
Mitra A (2001) Employment in the informal sector. In: Kundu A, Sharma AN (eds) Informal sector in India: perspectives and policies, Institute for Human Development, New Delhi Mitra A, Varoudakis A, Véganzonès-Varoudakis MA (2002) Productivity and technical efficiency in Indian states manufacturing: the role of infrastructure. Econ Devel Cult Change 50:395-426Mukherjee D (2004) Productivity in the small manufacturing enterprises: determinants and policy issues. Indian J Lab Econ 47:913-927Nabi I (1989) Investment in segmented capital markets. Quart J Econ 104:453-462 Nagaraj R (2004) Fall in the organised manufacturing employment. Econ Polit Week 29:3287-3390 Narayana MR (2006) Formal and informal enterprises: concept, definition, and measurement issues in India. In: Guha-Khasnobis B, Kanbur R, Ostrom E (eds) Linking the formal and informal economy: concepts and policies, Oxford University Press, Oxford Onder AO, Deliktas E, Langer A (2003) Efficiency in the manufacturing industry of selected provinces in Turkey: a stochastic frontier analysis. Emerging Markets Finan Trade 39:98-112Planning Commission (2002) Report of the task force on employment opportunities. Academic Foundation, New DelhiPattnayak SS, Thangavelu SM (2003) Economic reform and productivity growth in Indian manufacturing industries: an interaction of technical change and scale economies. Working Paper No. 0307, National University of Singapore, SingaporePitt MM, Lee LF (1981) The measurement and sources of technical inefficiency in the Indonesian weaving industry. J Devel Econ 9:43-64 Ra,, KN (1986) New Economic Policy. Oxford University Press, New Delhi Rani U, Unni J. (2004) Unorganized and organized manufacturing in India: potential for employment generating growth. Econ Polit Week 39:4568-4580 Ray SC (1997) Regional variations in productivity growth in Indian manufacturing: a nonparametric analysis. J Quant Econ 13:73-94 Ray SC, Ping Z (2001) Technical efficiency of state owned enterprises in China (1980-1989): an assessment of the economic reforms. Working Paper 2001-05, Department of Economics, University of Connecticut, CT Ray SC (2002) Did India’s economic reforms improve efficiency and productivity? a nonparametric analysis of the initial evidence from manufacturing. Indian Econ Rev 37:23-57 Saygili S, Taymaz E (2001) Privatization, ownership and technical efficiency: a study of the Turkish cement industry. Ann Public Coop Econ 74:581-605Tybout JR (1983) Credit rationing and investment behavior in a developing country. Rev Econ Statist 65:393-410 Unel B (2003) Productivity trends in India’s manufacturing sectors in the last two decades. Working Paper No. 03/22, IMF, WashingtonUnni J, Lalitha N, Rani U (2001) Economic reforms and productivity trends in Indian manufacturing. Econ Polit Week 36:3915-3922Unni J, Rani U (2003) Changing structure of the workforce in unorganized manufacturing. Indian J Lab Econ 46:983-98Zheng J, Liu X, Bigsten A (1998) Ownership structure and determinants of technical efficiency: an application of data envelopment analysis to Chinese enterprises (1986-1990). J Compar Econ 26:465-484