Producing more food with less water: a global challenge - Eric Ober (Broom's Barn Reserach Station)
48
Producing more food with less water: a global challenge Eric Ober Broom’s Barn Research Station
-
Upload
farming-futures -
Category
Technology
-
view
147 -
download
0
Transcript of Producing more food with less water: a global challenge - Eric Ober (Broom's Barn Reserach Station)

Producing more food with less water:
a global challenge
Eric OberBroom’s Barn Research Station

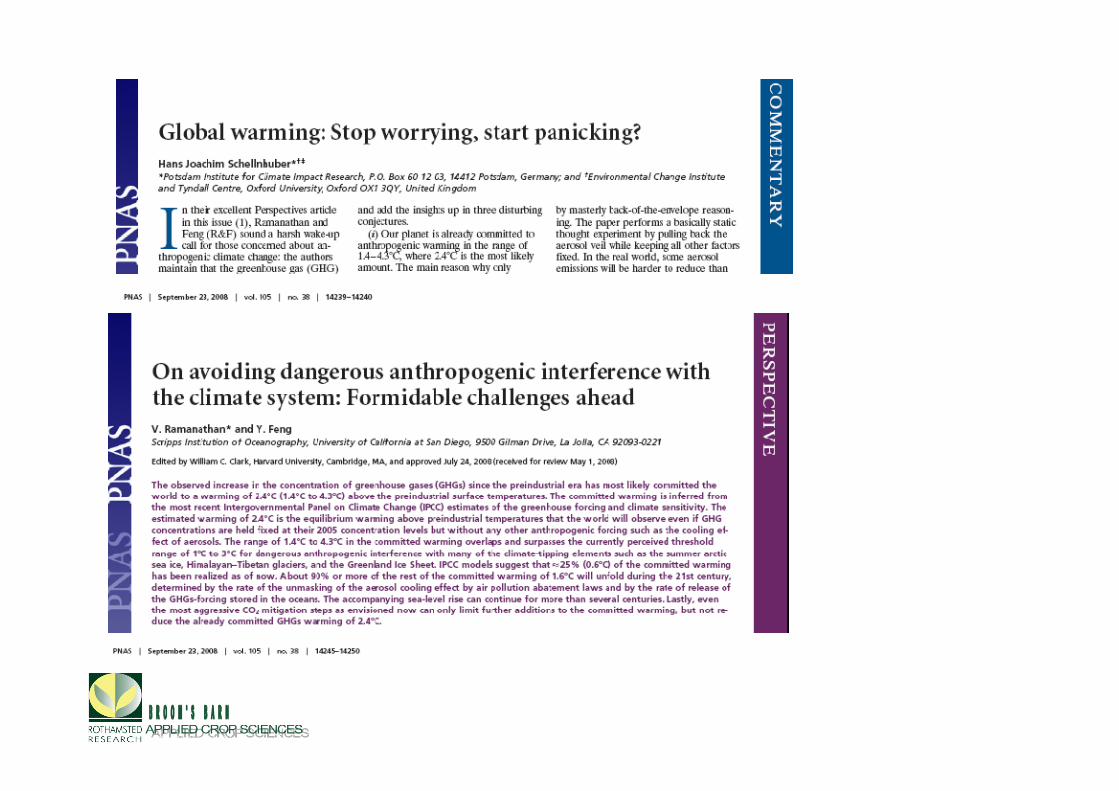
FAO Briefing paper: Hunger on the rise, Sep, 2008

FAO Food Outlook, November, 2008

“I wish to reaffirm that we know what needs to be done to eradicate the
hunger of 923 million people in the world. We also know what needs to be
done to double world food production and feed a population that is expected
to rise to 9 billion people by 2050. What we need ... is political will and
delivery on financial commitments, if we are to be able to make the essential
investments that are needed to promote sustainable agricultural
development and food security in the poorest countries of the world.”
--FAO Director-General Jacques Diouf, World Food Day, October, 2008

Challenges to global food production
• Climate change
• Competition with biofuels
• Soil fertility
• Input and commodity prices
• Availability of credit

CLIMATE CHANGE AND
FOOD SECURITY: A
FRAMEWORK DOCUMENT,
FAO, 2007

How does climate change affect crops?
• More CO2 and warmer temperatures will increase yields
• Greater evaporative demand and less rainfall
• Droughts will become more frequent and severe
• Increased probability and severity of heat waves

Month
1 2 3 4 5 6 7 8 9 10 11 12
Mo
nth
ly m
ax
imu
m t
em
pera
ture
(°C
)
0
5
10
15
20
25
30
Real (1976-2005)
Base
HI2020
HI2050
HI2080
By 2050 the maximum summertime temperatures
in East Anglia will have increased by 3 °C.

…and the amount of summertime rainfall
will have decreased.

How will future weather affect crop
production in the UK?

Scenarios
Baseline 2020HI 2050HI 2080HI
Su
ga
r yie
ld (
t/h
a)
0
5
10
15
20
Clay loam
Sandy
Sandy loam
Silt loam

Climate change effects on sugar beet
�Positive aspects
• Warmer Springs
• earlier sowing, faster canopy development, more light capture
• Increased CO2
• photosynthetic productivity
• Fewer winter freezing spells (-5°C)
• Less in-field frost damage

Climate change effects on sugar beet
�Negative aspects
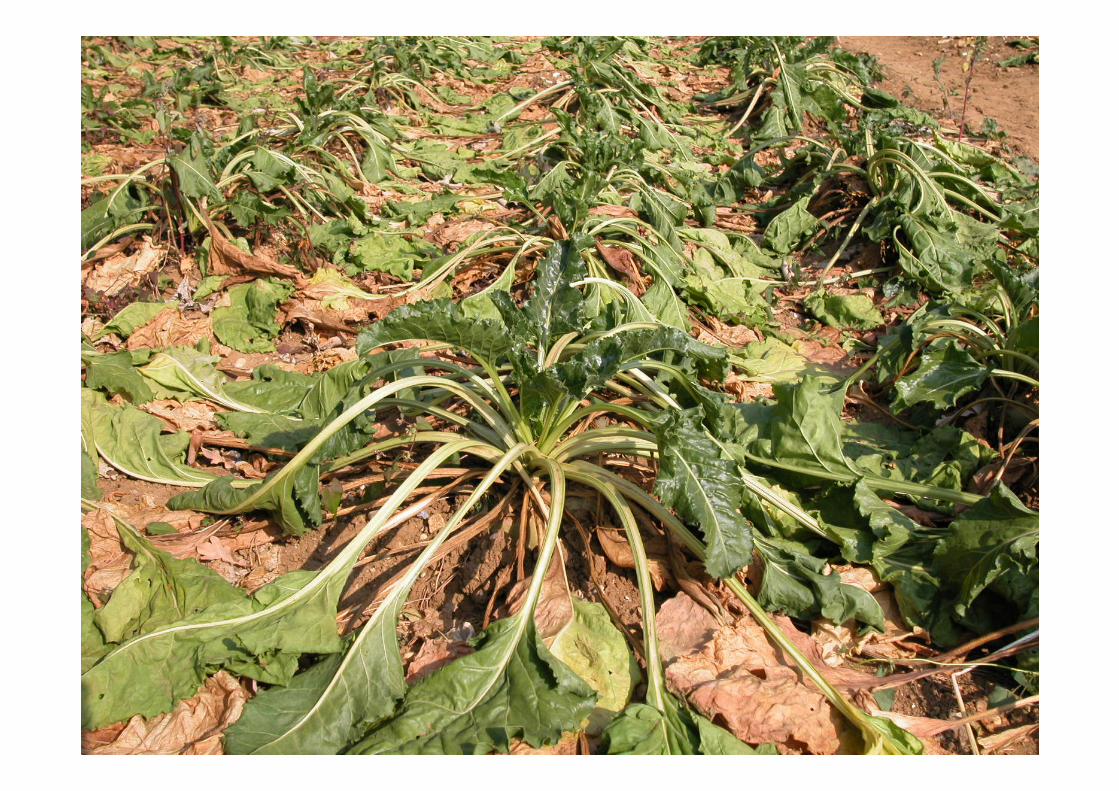
• Less summer rainfall, drought stress
• Higher summer temperatures
• heat stress, increased Cercospora
• Warmer winters, increased pest survival
• More variable weather, extreme events

25-7-08
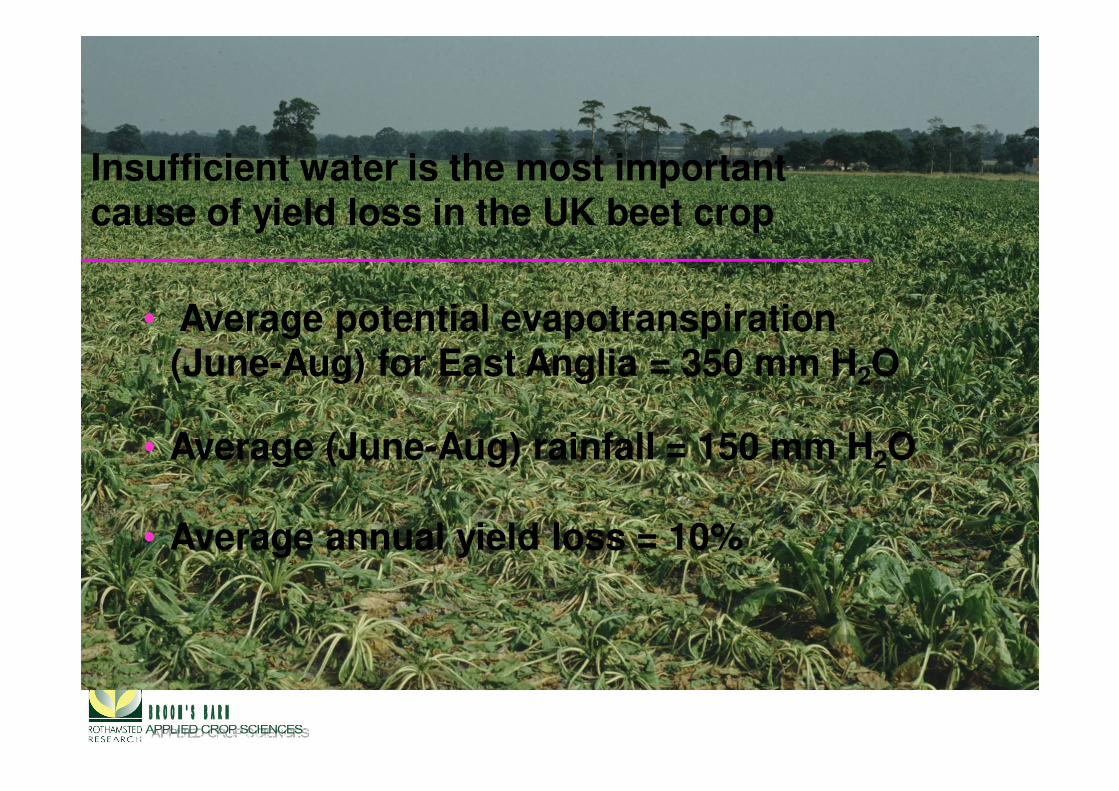
Insufficient water is the most important cause of yield loss in the UK beet crop
• Average potential evapotranspiration (June-Aug) for East Anglia = 350 mm H2O
• Average (June-Aug) rainfall = 150 mm H2O
• Average annual yield loss = 10%
• Jaggard et al. (1998) J Ag Sci 130: 337-43

Cost of drought to UK winter wheat production
• Annual losses (national average) of:
• 1-2 t ha-1
• >£ 40 million
• Foulkes et al. (2004) Proceedings of the 4th International Crop Science Congress, Brisbane, Australia
• 30% of wheat acreage grown on drought-prone land

• Increased demand for food
• Water availability limits yield
Increase rainwater catchment
Increase irrigation and irrigation
efficiency
Improve varieties
drought tolerance
water use efficiency
Improve soil fertility and water-
holding capacity

Research Objectives
• Identify genotypes with greater drought tolerance and water use efficiency (WUE) than current commercial varieties
• Identify traits that are associated with drought tolerance and WUE
• Develop screening tools that can be used by breeders to select superior varieties
• Use variety trial data to discover which current varieties show better drought tolerance or susceptibility

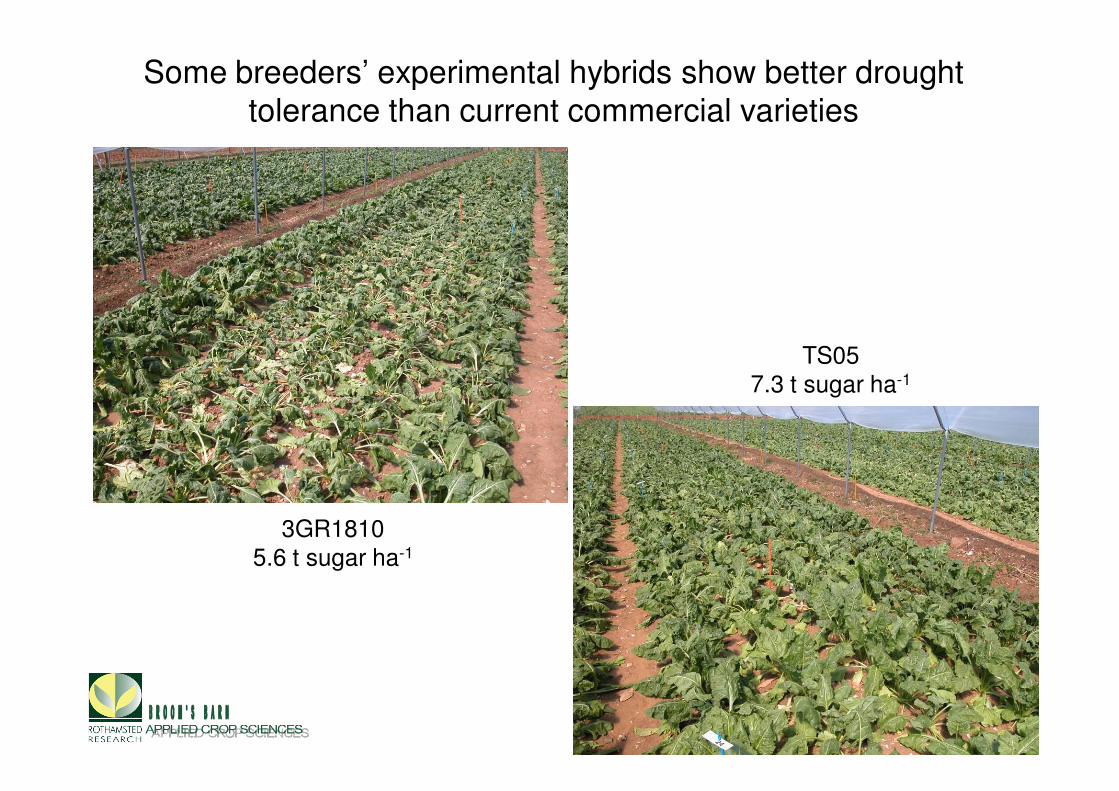
Some breeders’ experimental hybrids show better drought
tolerance than current commercial varieties
TS05
7.3 t sugar ha-1
3GR1810
5.6 t sugar ha-1

Characteristics of a successful drought tolerant variety
• Maintains productive foliage and delays
wilting and senescence
• Accesses more soil water
• Produces thinner leaves and cooler canopy
• Recovers growth faster following recovery
from stress

120 winter wheat genotypes grown under managed drought and irrigated conditions, 2008
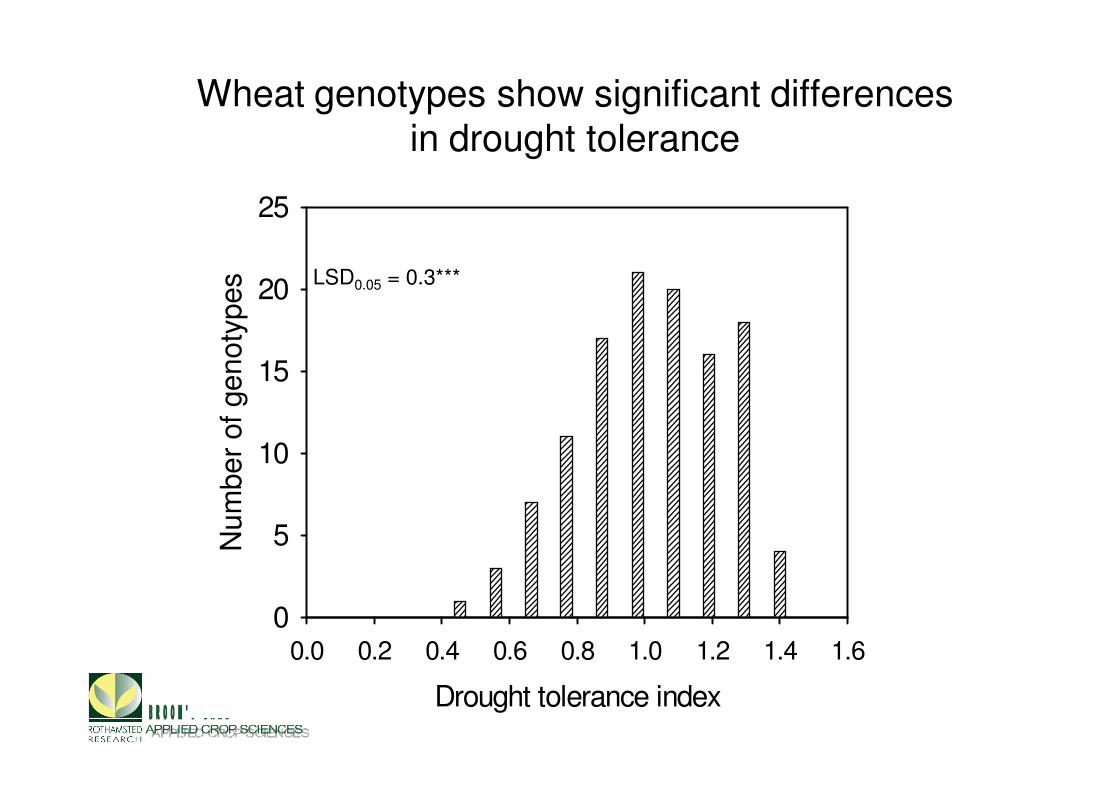
Wheat genotypes show significant differences in drought tolerance
Drought tolerance index
0.0 0.2 0.4 0.6 0.8 1.0 1.2 1.4 1.6
Num
ber
of
genoty
pes
0
5
10
15
20
25
LSD0.05 = 0.3***

Well watered grain yield (t ha-1)
2 4 6 8 10 12 14
Dro
ug
ht to
lera
nce ind
ex
0.2
0.4
0.6
0.8
1.0
1.2
1.4
1.6
r2 = 0.07
LSD
Drought tolerance does not necessarily demand a large penalty in yield potential
Select
Reject

CPBT W97
ExceptGatsby
Einstein

How to improve drought tolerance
Initial
crosses
Finished
variety
Screen for
secondary
traits
Evaluate performance
across multi-location
variety trials
Sta
bility
+
yie
ld p
ote
ntia
l
Varieties suited for
drought-prone land

Action
• Mitigation – adopting practices that reduce or remove greenhouse gas emissions • Analyse and improve your business’ ‘carbon footprint’
• Reduce nitrous oxide (N2O) emissions from soil N
• Look at what we grow and how we grow it
• Adaptation – making the changes necessary to be profitable in a changing environment• Invest in R&D
• Drought tolerance
• Disease resistance
Action-water resources
• Conduct ‘water use audit’
• Improve irrigation efficiency
• Decrease water waste
• Consider rainwater catchment, water
recycling
• Join local WAG, participate in CAMS

Action-water resources
• Irrigation efficiency• MOT equipment
• Check raingun pressure
• Use water meters
• Minimise wind effects
• Check uniformity
• Use scheduling

http://www.ukia.org
http://www.environment-agency.gov.uk/

“Weiji” = crisis
“Wei” = danger
“ji” = opportunity
Sponsors and collaborators: wheat

Sponsors and collaborators: sugar beet


Crop year
1975 1980 1985 1990 1995 2000 2005
Su
gar
yie
ld (
t h
a-1
)
0
2
4
6
8
10
12
14
16
Farmer delivered yield (111 kg/ha/yr)
Official variety trial yield (204 kg/ha/yr)
Sugar yields have been steadily increasing

Crop year
1975 1980 1985 1990 1995 2000 2005
Su
gar
yie
ld (
t h
a-1
)
0
2
4
6
8
10
12
14
16
18
Rain-fedIrrigated
Rainfed yields are more variable, and ~2 t less than irrigated yields.

Reasons for yield increases
• Improved varieties
• Better farming practices
• What about the weather?

Leaf wax score: 0 to 5
Genotypic diversity for waxiness

Climatic effects can explain much of recent
yield increases
kg sugar/ha per
year%
Total increase
(variety trials)204 100
Climate 114 56
Earlier sowing 25 12
Better varieties and
agronomy65 32
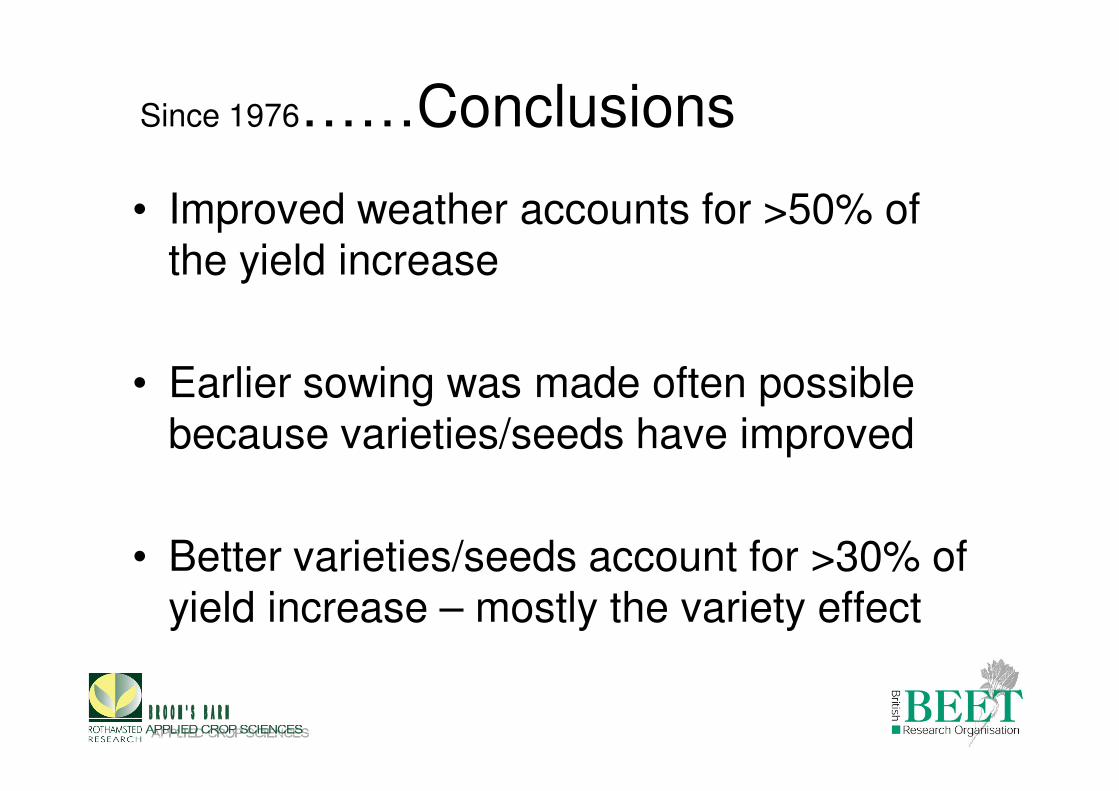
Since 1976……Conclusions
• Improved weather accounts for >50% of
the yield increase
• Earlier sowing was made often possible
because varieties/seeds have improved
• Better varieties/seeds account for >30% of
yield increase – mostly the variety effect

2006/07 2007/08 2008/09
Change: 2008/09
over
estim. f’cast 2007/08
million tonnes %
WORLD BALANCE
Production 596.6 610.5 677.0 10.9
Trade 113.3 111.2 119.0 7.0
Total utilization 619.2 615.8 643.3 4.5
Food 442.9 446.4 451.1 1.0
Feed 111.6 101.0 120.3 19.1
Other uses 64.6 68.4 72.0 5.3
Ending stocks 159.9 155.1 186.6 20.3
SUPPLY AND DEMAND INDICATORS
Per caput food consumption:
World (kg/year) 67.9 67.6 67.5 -0.2
LIFDC (kg/year) 58.4 58.1 58.0 -0.2
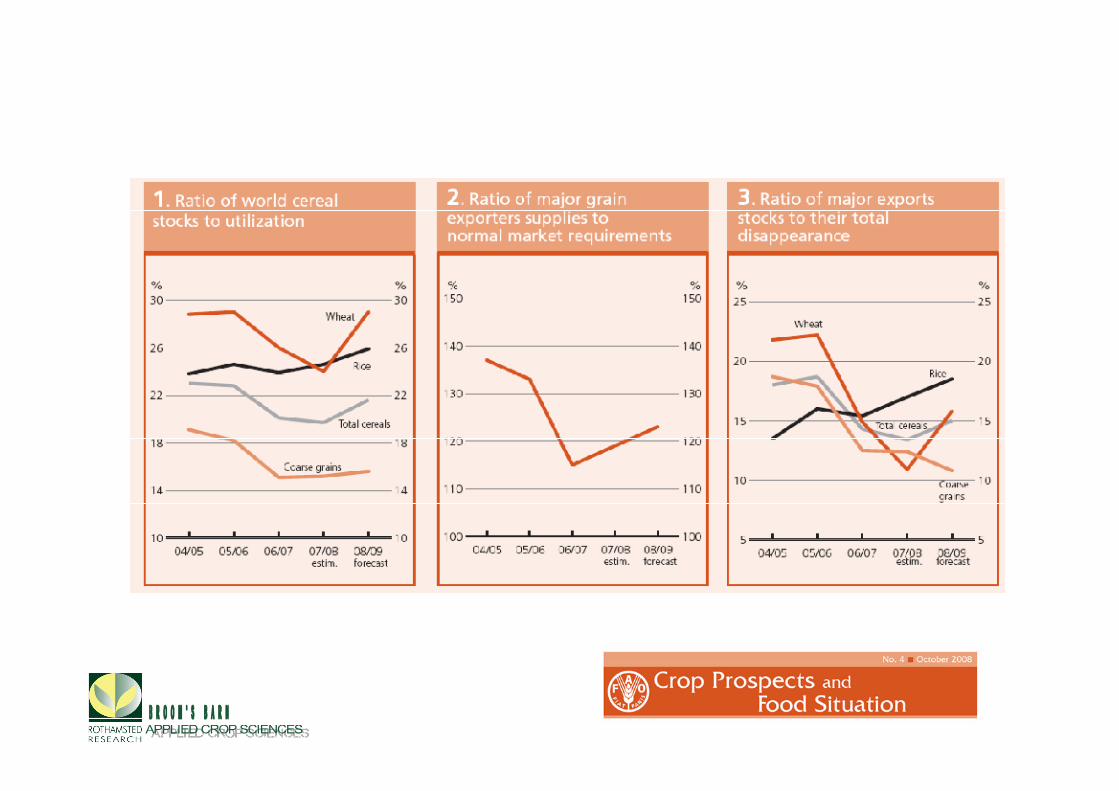
World stock-to-use ratio % 26.0 24.1 29.5
Major exporters’ stock-to-disappearance
ratio % 14.9 10.9 16.7
2006 2007 2008 Change:
Jan-Oct 2008
over
Jan-Oct 2007
Wheat Price Index %
(1998-2000=100) 145 216 302* 52
FAO Food Outlook, November, 2008
Wheat

• 70 per cent of all available freshwater is used for agriculture
• 0.5 t of water required to produce 1 kg grain or sugar
• >1 billion people lack access to safe drinking water
• Deficit in natural aquifers grows by 160 x 107 m3/yr
data: UNESCO
• Drought causes more crop losses than any other single biotic/abiotic factor
Boyer JS (1982) Science 218: 443-8
• United Nations
• International Decade for Action
Seasonal summed
water use
Water use efficiency (g kg-1
)
6 7 8 9 10 11 12
Lea
f D
elta
(p
art
s p
er
mil)
21.0
21.5
22.0
22.5
23.0
23.5
24.0
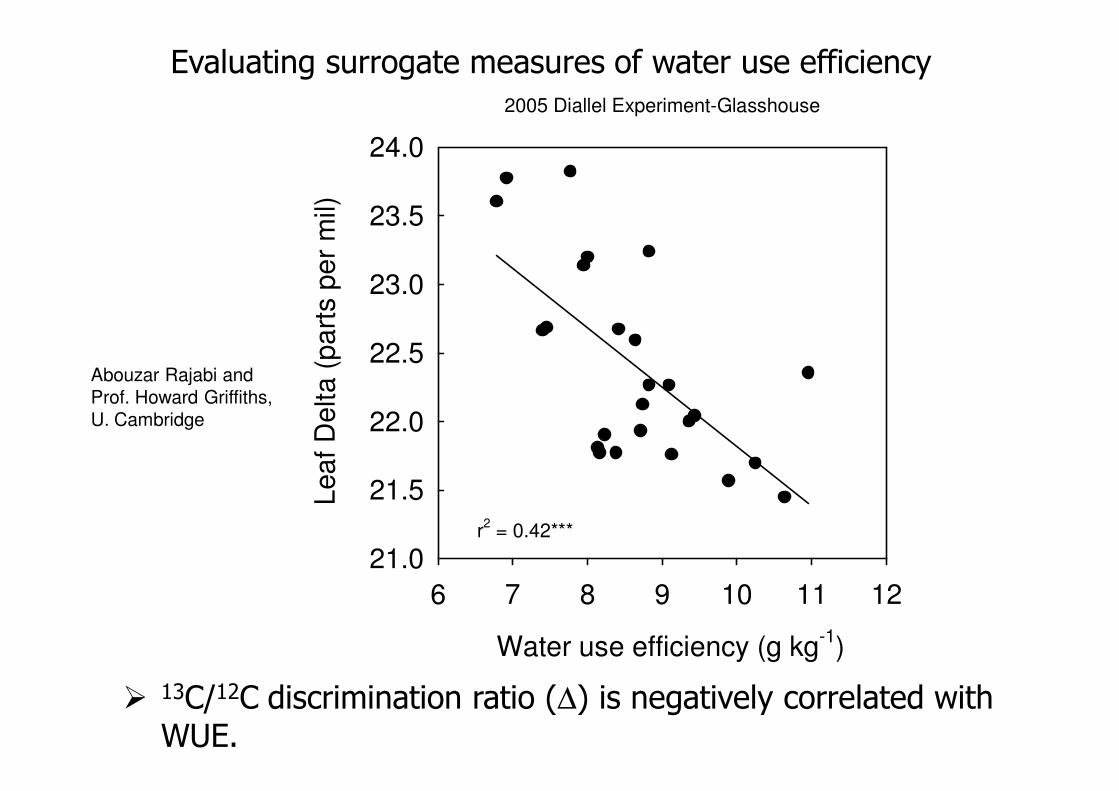
r2 = 0.42***
2005 Diallel Experiment-Glasshouse
Evaluating surrogate measures of water use efficiency
� 13C/12C discrimination ratio (∆) is negatively correlated with WUE.
Abouzar Rajabi and
Prof. Howard Griffiths,
U. Cambridge