NOT MY DSLR Alternative approaches for fun and creativity Andrée Lawrey 11 February 2014.
Upload
caren-elliottCategory
view
213download
0
Producing Hours Worked for the SNA in order to Measure
Productivity: the Canadian Experience
By Jean-Pierre Maynard, Andrée Girard and
Marc TanguayCanadian Productivity Accounts
April 2006

Outline
• Mandate• Methodology• Survey instruments• Estimation of jobs• Integration to the Accounts • Estimation of hours worked per job• Quality of the data• Concluding remarks

Mandate
• Produce an integrated database of labour statistics consistent with the Canadian System of National Accounts.
• Produce internationally comparable measures of labour input in terms of trends and levels.
• Official labour input use in Canadian productivity measures.


What is produced?
• Annual data :• Estimates of jobs, hours worked and FTEs for :
– 286 industries ;– 13 regions ( 10 provinces and 3 territories) ;– 3 SNA sectors (business, government and non-profit organisations) ;– 3 categories of workers (employee, self-employed employer jobs and own account self-employed jobs);
• Labour composition indices based on education and years of experience, nationally only (119 industries)• Quarterly data :• Jobs and hours worked estimates at national level for 15 industry groups and the business sector.

Methodology
• Two independent but concurrent exercises
• ∑∑∑(Jimn x Himn) = Vhimn
• J = Number of jobs• H = Average hours worked per job• Vh = Volume of hours worked• Where i= industry, m=region and
n=class of worker

Survey instruments
•Integration of two types of instrument:– Household surveys
• The Labour Force Survey• The Census of Population• The Survey of Labour Income Dynamics
– Establishment surveys• The Survey of Employment, Payroll and Hours worked, Public Institution Data• Census of Mining, Annual Survey of Manufacturing, Statistics on Income Tax

Strengths and weaknesses of labour data sources to measure annual hours worked
Household surveys• Almost full coverage.• Frame on current population
estimates.• Right concept of hours worked.• Convertible from ILO to SNA.• Drill down approach to collect
hours worked.• Proxy reporting.• Industry classification
consistency with other SNA sources.
• Only 12 reference weeks.
Establishment surveys• Industry classification
consistent with SNA other sources.
• Collect jobs and payrolls technically from a census
• Covers only the employee jobs.
• Do not cover agriculture, fishing, religious organizations and private households.
• Paid or standard hours only.• Many methodological
changes over its history.

Total number of employee jobs adjusted to SNA from the Labour Force Survey compared to the number of employee jobs from the Survey of Employment, Payroll and Hours both adjusted for industry and
geographical coverage, Annual
0
2000000
4000000
6000000
8000000
10000000
12000000
14000000
16000000
1983 1984 1985 1986 1987 1988 1989 1990 1991 1992 1993 1994 1995 1996 1997 1998 1999 2000 2001 2002 2003
0
200000
400000
600000
800000
1000000
1200000
1400000
1600000
1800000
2000000
Difference
LFS employee jobs
SEPH excl. North
Diff LFS-SEPH

Estimation of jobs
• In Canada, all job estimates are adjusted to a benchmark for the economy as a whole.• This benchmark starts with the Labour Force Survey estimate at the aggregate level.• The industry breakdown for the employee jobs rely mainly on the establishment survey.• In the case of self-employed categories, the industry detail is obtained by combining information from quinquennial census and from the Labour Force Survey.

Principles followed
To produce an integrated database of labour statistics consistent with the CSNA:
• Compliance with the SNA’s 1993 concept. (Chapter XV11)
• Compliance with the primary input data from SNA’s Industry Accounts.
• Respect for the trends and levels produced by the source data.

Integration to the Industry Accounts
• Based mainly on the comparison of payroll data between the source data and the I/O tables.
• Highly automated.• Labour input come from SEPH and LFS while IO
payrolls are built from industry surveys and T4$ data.
• Own account construction adjustments• Conceptual differences (retroactive payments,
bonus, options, tips, etc.)

Integration of employee jobs
Initial matrix of jobs and payroll from source data conceptually adjusted
X =
Industry Accounts (SNA) – Wages and Salaries
o By industry and sector
o Own Account Construction
Implicit Wages and Salaries per job
SNA number of jobs
Average earnings based on source data
Adjustments to the Industry Accounts
Hours worked per job
Volume of hours worked
Benchmarks mainly from LFS adjusted to SNA

Interprovincial flows of workers
• In the SNA, the allocation by province is based on the province of employment.
• In the Labour Force Survey, the number of jobs is allocated by province according to the province of residence.
• In the SNA, we used administrative data (T4’s slips) and the Census to estimate the number of persons working in another province than their province of residence.

Jobs and hours by SNA large sectors
• SNA labour statistics are decomposed into business, government and non-profit institutions servicing households.
• The government sector is benchmarked to the administrative data on employment produced by the Public Institutions Division of the SNA.
• Most of the non-profit institutions are found in industries composed of establishments from two or three SNA sectors. When it is the case we split the number of jobs on the basis of the labour income data by sector produced by IO.
• The business sector is obtained residually. This is the sector we used for productivity analysis.

Estimation of hours worked per job
• LFS is conducted each month during a reference week that usually includes the 15th day.
• This reference week is not always representative of previous and following weeks because of special events. (public holidays such as Good Friday, Thanksgiving, etc.)
• Hours lost information collected from the LFS are used to estimate the hours lost of special events happening between the reference weeks.
• Daily weights are used to estimate hours lost during start week and end week of the month/year.
• Estimated separately for private and public industries.

Average hours worked from LFS without holiday adjustments - Manufacturing - 1994 to 2002
34,0
35,0
36,0
37,0
38,0
39,0
40,0
41,0
42,0
Jan Feb Mar Apr May Jun Jul Aug Sep Oct Nov Dec
Avera
ge w
eekly
ho
urs
1994
1995
1996
1997
1998
1999
2000
2001
2002
Estimation of hours worked per job

Adjustment of hours worked for the year 2002 in Manufacturing, Ontario
5
10
15
20
25
30
35
40
45
-4 2 8 14 20 26 32 38 44 50Week
Ave
rag
e w
eekl
y h
ou
rs
AWH x 52
Standardized
Adjusted AWH
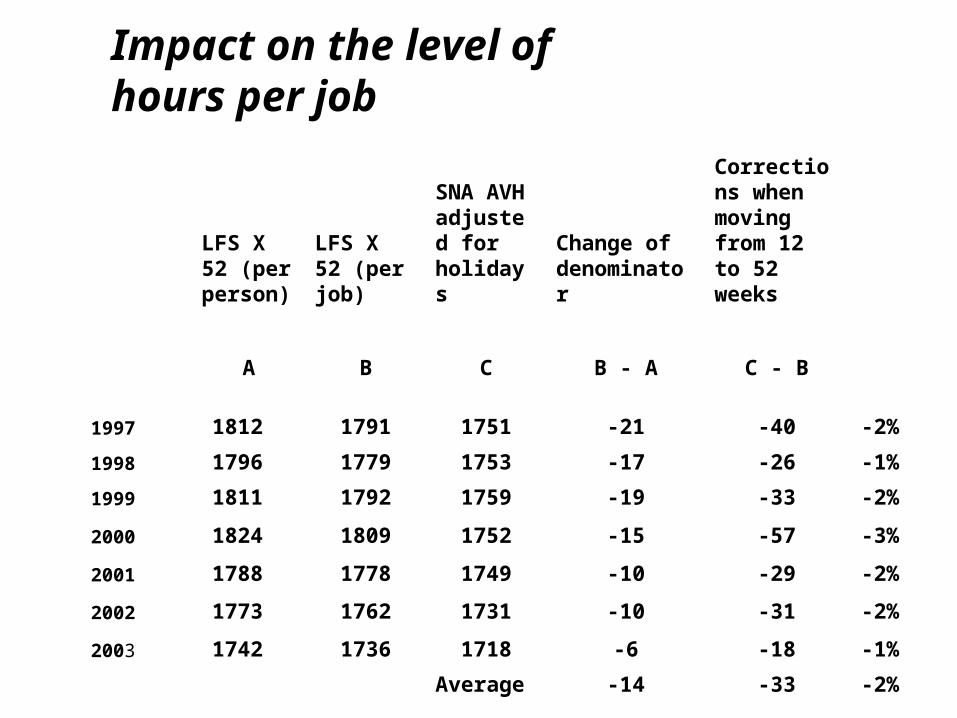
Impact on the level of hours per job
LFS X 52 (per person)
LFS X 52 (per job)
SNA AVH adjusted for holidays
Change of denominator
Corrections when moving from 12 to 52 weeks
A B C B - A C - B
1997 1812 1791 1751 -21 -40 -2%
1998 1796 1779 1753 -17 -26 -1%
1999 1811 1792 1759 -19 -33 -2%
2000 1824 1809 1752 -15 -57 -3%
2001 1788 1778 1749 -10 -29 -2%
2002 1773 1762 1731 -10 -31 -2%
2003 1742 1736 1718 -6 -18 -1%
Average -14 -33 -2%

Impact on the trend of hours worked per job
LFS X 52 (per person)
LFS X 52 (per job)
SNA AVH adjusted for holidays
Change of denominator
Corrections when moving from 12 to 52 weeks
Growth A
Growth B Growth C B - A C - B
1998/1997 -0,9 -0,7 0,1 0,2 0,8
1999/1998 0,8 0,7 0,3 -0,1 -0,4
2000/1999 0,7 0,9 -0,4 0,2 -1,3
2001/2000 -2,0 -1,7 -0,2 0,3 1,5
2002/2001 -0,9 -0,9 -1,0 0,0 -0,2
2003/2002 -1,7 -1,5 -0,8 0,3 0,7
Average 0,1 0,2

Quality of the data
• Statistics on hours lost by reason of absence provide some evidence that annual hours worked per job estimated from the LFS are reasonable. (Table 3)
• LFS-TUS comparisons for 1998 shows that the LFS does not overestimate the average number of hours worked in Canada. (Table 4)
• The industry coding from household survey and establishment survey are reasonably comparable, both in terms of levels and trends. (Table 5)

Concluding remarks
– In Canada, we rely heavily on the Labour Force Survey at the aggregate level to estimate the volume of work consistent with the SNA
• Main ingredient to produce a benchmark for the number of jobs (avoid the risk of double counting).
• Collect the right concept of hours worked.• Collect sufficient information to resolve the reference
week problem.• Evidence that they can be used to produce unbiased
estimates of hours worked per job.
– Its industry coding correlates sufficiently well with the one produce by establishment surveys used heavily in the SNA.