Producer Price Index (PPI) Compilation System m User · PDF fileProducer Price Index (PPI)...
88
Producer Price Index (PPI) Compilation System User Guide I I n n d d e e x x P P r r o o c c e e s s s s o o r r P P P P I I C C o o m m p p i i l l a a t t i i o o n n S S y y s s t t e e m m Price Index Processor Version II: Producer Price Index (Revised Version) DOCUMENTATION - i - August 2009
Transcript of Producer Price Index (PPI) Compilation System m User · PDF fileProducer Price Index (PPI)...

Producer Price Index (PPI) Compilation System
User Guide
II nndd e
e xx PP
rr oocc ee
ss ssoo rr
PPPP
II CC
oo mmpp ii
ll aatt ii oo
nn SS yy
ss ttee mm
Price Index Processor Version II: Producer Price Index
(Revised Version)
DOCUMENTATION - i - August 2009

Acknowledgements and disclaimer
The IMF Statistics Department (STA) and the Technology and General Services Department (TGS) developed the Price Index Processor Software (PIPS) to assist countries in improving their capabilities to process collected price observations and use them to compile price indices. Acknowledgements are due to Gangti Zhu for developing the software and Paul Armknecht as advisor on index number issues. The IMF has authorized UNECE Statistical Division, with whom the IMF has no other affiliation, to distribute, modify, and maintain the software. While the IMF retains ownership rights to the original software, the IMF assumes no responsibility to users for support or maintenance and has disclaimed all liability for any errors that may exist in the software and for any other claims relating to the software. This user guide is no more than a “guide” and the user is strongly advised to become very familiar with the software using a set of trial data, preferably from their own country, before adopting the software for use. It is for the user to decide on the basis of such a trial whether the software suits their needs. Neither the IMF nor UNECE Statistical Division are responsible for any errors of omission or commission in this documentation.
DRAFT DOCUMENTATION - ii - August 2009
DRAFT DOCUMENTATION - iii - August 2009
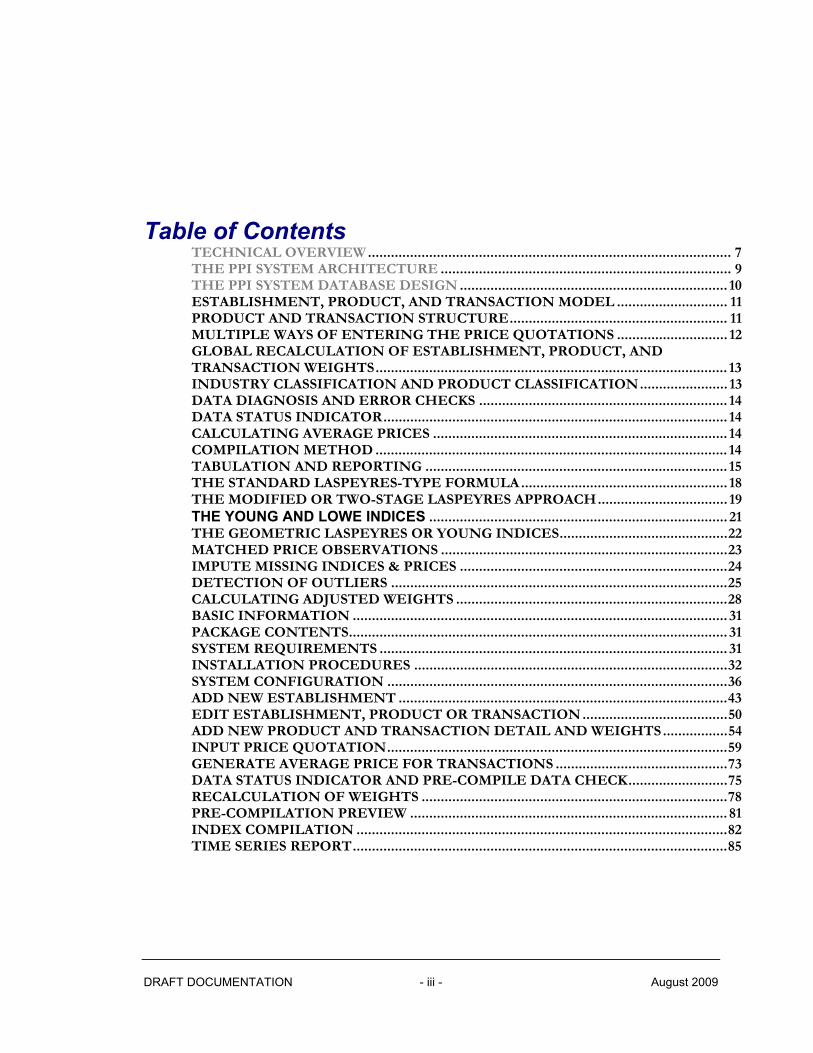
Table of Contents
TECHNICAL OVERVIEW............................................................................................... 7 THE PPI SYSTEM ARCHITECTURE ............................................................................ 9 THE PPI SYSTEM DATABASE DESIGN ...................................................................... 10 ESTABLISHMENT, PRODUCT, AND TRANSACTION MODEL ............................. 11 PRODUCT AND TRANSACTION STRUCTURE......................................................... 11 MULTIPLE WAYS OF ENTERING THE PRICE QUOTATIONS ............................. 12 GLOBAL RECALCULATION OF ESTABLISHMENT, PRODUCT, AND TRANSACTION WEIGHTS............................................................................................ 13 INDUSTRY CLASSIFICATION AND PRODUCT CLASSIFICATION....................... 13 DATA DIAGNOSIS AND ERROR CHECKS ................................................................. 14 DATA STATUS INDICATOR.......................................................................................... 14 CALCULATING AVERAGE PRICES ............................................................................. 14 COMPILATION METHOD ............................................................................................ 14 TABULATION AND REPORTING ............................................................................... 15 THE STANDARD LASPEYRES-TYPE FORMULA...................................................... 18 THE MODIFIED OR TWO-STAGE LASPEYRES APPROACH.................................. 19 THE YOUNG AND LOWE INDICES .............................................................................. 21 THE GEOMETRIC LASPEYRES OR YOUNG INDICES............................................22 MATCHED PRICE OBSERVATIONS ...........................................................................23 IMPUTE MISSING INDICES & PRICES ......................................................................24 DETECTION OF OUTLIERS ........................................................................................25 CALCULATING ADJUSTED WEIGHTS .......................................................................28 BASIC INFORMATION .................................................................................................. 31 PACKAGE CONTENTS................................................................................................... 31 SYSTEM REQUIREMENTS ........................................................................................... 31 INSTALLATION PROCEDURES ..................................................................................32 SYSTEM CONFIGURATION .........................................................................................36 ADD NEW ESTABLISHMENT ......................................................................................43 EDIT ESTABLISHMENT, PRODUCT OR TRANSACTION ......................................50 ADD NEW PRODUCT AND TRANSACTION DETAIL AND WEIGHTS.................54 INPUT PRICE QUOTATION.........................................................................................59 GENERATE AVERAGE PRICE FOR TRANSACTIONS .............................................73 DATA STATUS INDICATOR AND PRE-COMPILE DATA CHECK..........................75 RECALCULATION OF WEIGHTS ................................................................................78 PRE-COMPILATION PREVIEW ................................................................................... 81 INDEX COMPILATION .................................................................................................82 TIME SERIES REPORT..................................................................................................85

DOCUMENTATION - 4 - August 2009
Introduction
Price Index Processor - Version I: Producer Price Index System (PPI System) is an application software developed for assisting IMF member countries in compiling their PPIs. The system can also be
used for teaching, training, and research purposes. Its main function is to compile PPI for all items by industry, by product, by establishment, and by geographic location. The PPI measures the proportionate, or percentage changes in a set of producer’s prices over a period of time. It is an important indicator of macroeconomic performance. In particular, it measures price change component of the output of production by resident producers. Its components are crucial in the preparation of a country’s national accounts in volume terms. The PPI System follows the guidelines of the Manual – Producer Price Index Manual: Theory and Practice – (2004), Washington D.C. International Monetary Fund, et al. URL: http://www.imf.org/external/np/sta/tegppi/, which provides guidance about concepts, definitions, classifications, coverage, valuation, recording data, aggregation procedures, formulas, and so on. It also describes the international standards for PPI compilation. These standards draw upon the collective experience and expertise accumulated in many countries. The PPI System calculates indices as weighted averages of the percentage price changes for a specified set, or basket of products, the weights reflecting their relative importance in producer goods in some period. The current version PPI System consists of four parts: (1) Data Entry and Editing; (2) Data Diagnosis and Validation; (3) Index Imputation; and (4) Tabulation and Reporting. They are integrated into a single database environment. The System works with CPA (Classification of Products by Activity)1, CPC (Central Product Classification)2, and user defined product
1 Please visit web page: http://unstats.un.org/unsd/cr/ctryreg/ctrydetail.asp?id=254. 2 Please visit web page: http://unstats.un.org/unsd/cr/registry/regcst.asp?Cl=16
Chapter
1

DRAFT DOCUMENTATION - 5 - August 2009
classification system. It adopts ISIC (International Standard Industrial Classification of All Economic Activities)3 as the default industrial classification system. It allows the user to choose one of the two alternative formulae for aggregation: arithmetic or geometric with four basic compilation methods: compile by (a) industry; (b) product; (c) establishment; and (d) geographical area. It is stressed that the formula for aggregation is either arithmetic or geometric at all stages. Unlike the CPI processor, there is no distinction between elementary and higher level aggregation. An important assumption behind the use of the software is that weighting information is available from establishments in the weight reference period at the most detailed level, that is for a product specification within an establishment. Weights should be input by the user at all levels. If a user does not have such information and imputes them on the basis of equal weighting, this is equivalent to using a Jevons index if a geometric mean is selected and a Carli if an arithmetic mean is used. A Carli index fails the time reversal test and is less desirable than a Jevons index. Users are strongly advised to use actual weights rather than weights imputed on the assumption of equal weights. The weights used can be price updated to the reference period or can be actual weights. For the arithmetic option the resulting formulas would be a Lowe index (price-updated weights) and Young index (without price updating). For the geometric option the weights for a geometric Laspeyres, (also referred to as a Geometric Young) should not be price updated. Price updated weights should only be used with arithmetic aggregation. The System has flexible data input and output modules—the user can batch input and upload establishment information and price data using a spreadsheet and transfer them into the PPI system. Alternatively, the user can enter data into the system directly. Reports can be generated at different aggregation levels on an ad hoc basis or in time series format. All the compiled results have a tabulation format and can be easily exported to Excel, HTML formats. The System allows the user to define an additional dimension of transaction list in addition to CPA or CPC level. This transaction list reflects the particular production pattern of a country and can be unique to a specific country. Since each transaction list is connected to the product a parent, it is closely integrated
3 ISIC Rev.3.1: Please visit web page: http://unstats.un.org/unsd/cr/registry/regct.asp?Lg=1

with standard product classification systems. They are internationally comparable. The modified Laspeyres formula is used in the imputation process. The standard Laspeyres formula is decomposed into three components: Short-Term Price Relatives (STPRt) of current period; Long-Term Price Relatives (LTPRt-1) of previous period and Base Period Weight (Wt0 ). The modified approach has several advantages over the standard formulation: it facilitates (i) the introduction of new varieties as soon as two successive price quotations are available; (ii) data verification; and (iii) more reasonable assumptions of similar short-run price changes for imputing missing values. The PPI is calculated using the equivalent of a recursive procedure, in which last period’s cost weights (or base-weighted long-term price relatives, pt-1, q0) are updated by the current period’s price relatives (pt/pt-1) in order to obtain the corresponding current period cost weights. The price averages can be calculated on the basis of “matched observations”. Whenever a particular price observation is missing from either the previous month or the current month, the corresponding price observations are eliminated from the other period. This ensures a consistent sample of price quotations in each period. However, the system will be able to impute missing indices using next level data. Once the missing indices are estimated, the missing prices will be imputed and marked as red in the system The user can associate detailed meta data and notes (up to about 22 pages of MS Word document) to an establishment, product/transaction, or to a specific price observation. The PPI system has a flag to show whether the user has entered any meta data using different color coding. Each price observation can be flagged or un-flagged to indicate whether the price is imputed by the PPI system. The user can also create a new establishment by cloning an existing one. Each establishment is associated with a label which indicates its current status. The establishment status will determine whether the establishment will be included in the index calculation. This feature is important in conducting sample rotation and introducing new establishments. The user can also clone a transaction, through which quality adjustment is made possible. The base period price can be estimated through a calculated index as a deflator. Both non-statistical checking and statistical checking are available for identifying the possible errors and outliers of input data. Non-statistical checking is implemented to check whether specific price data has increased more than a designated threshold, which is definable by the user. The recorded prices will be compared to the previous prices of the same items. While this procedure may
DRAFT DOCUMENTATION - 6 - August 2009

detect obvious unusual price changes, it is far from certain that all possible errors will be detected. Three statistical methods (or filters) have been implemented to detect the possible errors and outliers of short term price relatives. The first one is based on Chebyshev’s theorem which applies to all possible price relative distributions. This theorem predicts that at least 88.8 percent of all the observations in a data set will lie in the range of the mean plus or minus 3 standard deviations and at least 75 percent will fall within the mean plus or minus 2 standard deviations. Alternatively, observations with z-score greater than 3 will be potential outliers. The second method is Box Plots, in which price relative data are re-sorted in ascending order, and median and 1st and 3rd quartiles are calculated. Observations that fall outside of outer quartiles are considered as possible outliers. The third method is to assume price relatives are log-normally distributed. Therefore, by transforming them into logarithmic form, the price relatives data will exhibit the normal distribution. The intervals are calculated multiplicatively, and any price relatives that lie outside of the mean plus or minus 2 standard deviations will be identified as the possible outliers. The System will impute price relatives for missing items and missing prices. If no price quotation is entered for any of the transactions, its price relative is imputed using average price relatives from the entire product group of the missing item. Missing prices of one or some transaction of a particular item are estimated as the previous period’s price multiplied by the current period’s price relative of that item.
Technical Overview
The PPI System is a Visual Basic® application that runs in the Microsoft Windows environment. It works with Windows 2000, Windows Server 2003, Windows XP and Windows Vista operation system. The System stores both cross-sectional (e.g. establishments, products and varieties information) and time series data (e.g. price quotations and price indices) in database. The
System supports three database environment Microsoft Access®, Microsoft SQL server® and Microsoft SQL Express® (formerly known as MSDE). The design makes use of a relational database architecture and object technology. In the PPI System, several objects are generated representing establishment, product, transaction and imputation. Each PPI System object contains an unique object name with its properties, attributes and methods.
DRAFT DOCUMENTATION - 7 - August 2009
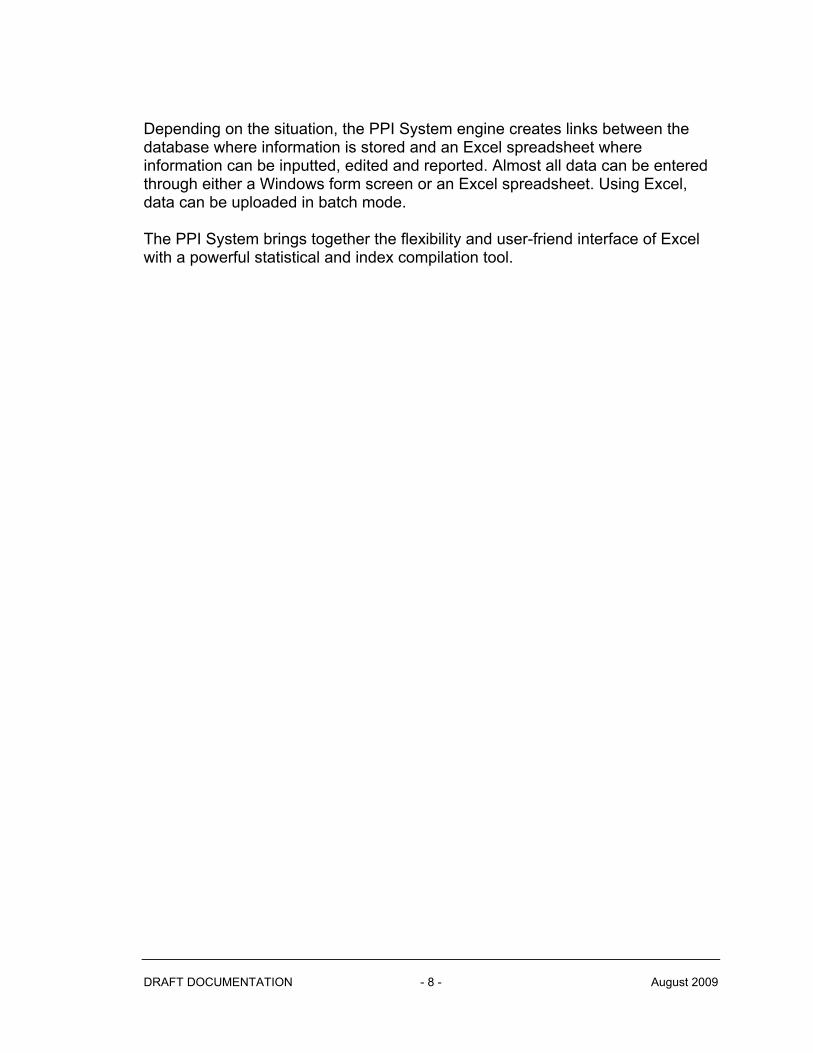
Depending on the situation, the PPI System engine creates links between the database where information is stored and an Excel spreadsheet where information can be inputted, edited and reported. Almost all data can be entered through either a Windows form screen or an Excel spreadsheet. Using Excel, data can be uploaded in batch mode. The PPI System brings together the flexibility and user-friend interface of Excel with a powerful statistical and index compilation tool.
DRAFT DOCUMENTATION - 8 - August 2009

The PPI System Architecture The diagram below shows the PPI System design and architect.
DRAFT DOCUMENTATION - 9 - August 2009

The PPI System Database Design
The PPI system allows the user to define, construct, and manipulate underline database using Microsoft ActiveX® Data Objects (ADO), same type of interface and library used by Access to programmatically access data. Database table design and relationships are illustrated in following diagram.
DRAFT DOCUMENTATION - 10 - August 2009

Chapter
2Main Features
Establishment, Product, and Transaction Model The System is developed based on establishment, product, and transaction model. It stores the establishment information as the key element. Each establishment can carry multiple products; each product can have multiple transactions. The user can specify the weight for transactions and product indicating their relative importance within an establishment. Each establishment is associated with a list of properties including contact information for both establishment and data collector. The user can create a meta data for keeping notes information for the establishment. The user can easily add, edit, and delete an establishment. One can also input, edit the establishments information in a spreadsheet and upload to the PPI database at one time. The System also keeps tracking the establishment status and sample group information. The establishment status indicates the current standing of the establishment as in one of following situations: 1 - refuse to participate; 2 - out of business; 3 - could not locate; 5 - initiated and reported; 6 - resending for initiation; 8 - no relevant product; 9 - not yet initiated; and 7 - unknown. Each establishment is classified into one of two sample groups, either certainty selected or probability selected group. The user can quickly find a specific establishment by using the search feature. An establishment can be searched by its ID, name, keyword, area it is located, or alphabetically.
Product and Transaction Structure The System allows the user to create a list of products for each establishment by selecting from a standard product classification scheme - ISIC, which is displayed in a hierarchical tree view structure. The user can not only search for a particular product by inputting some keywords in a description field, but also search for any digit in the ISIC product code.
DRAFT DOCUMENTATION - 11 - August 2009

After the product is selected, the user can create a transaction list that is defined under this product. At this level the user has the freedom to create its own transaction list, which can be specific to their country. The user is firstly offered a list that has been previously created. If she finds that the transaction that needs to be entered is in the list, she can select it. Alternatively, she can add a new transaction that will be stored in the database and shared across the establishments. In this way, the system provides an additional dimension for the user to reflect their country’s own unique production pattern. At the same time, each transaction is well integrated into a standard product classification system through a parent for international price comparison. The user can clone a transaction together with its price data. The duplicated transaction record will have the identical details except for two fields that are different from the original one. One is the transaction code – cloned transaction will have an new unique transaction code, and the other is the weight of that transaction, which is 0 by default for the cloned transaction. For each product or transaction, the user can maintain a note for keeping explanatory information about the product and transaction. The System provides a text editor for the user to enter and edit information. The user can also use copy/cut and paste feature to move a passage from another document to the System. The user can determine whether a product or transaction is active or inactive by checking or un-checking the Active box. This switch will determine whether a particular product or transaction will be included in the index calculation. If one product is activated, by default, all the transaction defined under this product will be activated as well. The user can set particular transaction inactive, while keeping the rest active. If the user activate a transaction, the product it belongs to will automatically be set as active.
Multiple Ways of Entering the Price Quotations Once the products and varieties are defined, the user is ready for the price observation input. The System offers multiple ways for entering the price quotes. The user can enter the prices for (a) all varieties in one establishment for three periods (base, previous and current period); or (b) one transaction for multiple periods in time series format; or (c) one transaction across all establishments in one year. The user can also (d) generate an Excel spreadsheet for price editing and inputting. This spreadsheet can be sent to the remote users for entering price and validation and it is reusable. Once it is finished, it can be uploaded into the PPI database.
DRAFT DOCUMENTATION - 12 - August 2009

For both time series and cross-establishment price entry, the system provides threshold validation feature, in which the user can define a threshold value. The user defined threshold value will apply globally until next time the program re-starts, which will reset to default value of 20%. When the price entered is greater or equal to the specified threshold, that particular number will be shown in red to warn the user of a possible data entry error for the price quotation. The system can also estimate the base period price of any particular variety using another calculated time series index as the deflator. The user can specify an imputed index series, select a particular period, and its index will be used to estimate the base period price. This feature is very useful in the case when a new product or variety is introduced to the System where base period price is not observable. At the “Input Price in Time Series Format” screen, the user can flag or un-flag a price observation. A price observation is flagged, if it is an imputed value instead of actual price recorded. Those flagged price observations will be shown in red in the System.
Global Recalculation of Establishment, Product, and Transaction Weights If an establishment status or assigned weight is changed, it will affect another establishment’s adjusted weights in the same industry. For example, if establishments are representative of other establishments, they can be labeled as such and the weights of the other establishments allocated to them (as explained in Chapter 3). Further, if establishments can be allocated to a group if an establishment is out of business, its nominal (assigned) weight will be taken and redistributed to the other active establishments. Global recalculation is necessary whenever the establishment status or weight field is changed. The global re-calculation feature provides the user a tool to reallocate the weights once the relevant information associated with the establishment is changed. Using this feature, the user can activate and deactivate an establishment easily.
Industry Classification and Product Classification The system uses ISIC as its default industry classification scheme. The user can select an industry code and assign it to an establishment. ISIC coding scheme is editable. The user can download a copy of ISIC code and edit it, and upload to the System as the main industry classification system.
DRAFT DOCUMENTATION - 13 - August 2009

Both CPC and CPA product classification schemes are available as the product classification for aggregation and compilation. Users can download the CPC or CPA structure, make modification, and upload it to the PPI software as a user-defined product classification scheme.
Data Diagnosis and Error Checks The System has a built-in module for the user to diagnose data errors and check for possible missing, critical variables. The System then generates a detail report if errors are detected. By double clicking on the error item, the user goes directly to the screen where such errors can be corrected.
Data Status Indicator The System has a graphical indicator to show the availability of all the establishment data for the compiling period. Indicators inform the compiler whether the price data are currently (1) available; (2) partially available; or (3) not yet ready. Data Status Indicator will also show establishment status (whether the establishment is initiated and reported or out of business, etc). By clicking on the establishment, the user will be prompted a screen where price can be entered or updated. This provides a useful and intuitive tool for the statistical staff at central office who can follow up any missing establishment price data and prepare for final compilation of the index.
Calculating Average Prices The PPI System has a separate module to calculate the average prices for the transactions across the establishments. The averages are imputed based on identical transactions in the same unit measure. Such transactions are maintained in the transaction list of the System.
Compilation Method The PPI System can compile price indices by (1) Industry; (2) product; (3) establishment; and (4) by geographical area using one of an arithmetic formula or (2) a geometric formula at levels. The software requires weights are available at all levels, built up from individual transactions at the establishment level. Thus the aggregation will be a Laspeyres-type or geometric Laspeyres-type throughout the index. Missing price indices will be imputed, which, in turn, are used to estimate the missing prices. The compilation results are stored in the database in time-series format.
DRAFT DOCUMENTATION - 14 - August 2009

Tabulation and Reporting The System generates both ad hoc and time-series reports in a tabular format. Short-term price relatives (STPR), long-term price relatives (PPI indices), and updated cost weights are the three key indices produced by the System. It reports the most detailed indices for all components. The user can choose report detail at different aggregation levels (from level 1 to level 8). The reports can be exported to Microsoft Excel spreadsheets, HTML for web publication and other formats.
DRAFT DOCUMENTATION - 15 - August 2009

Chapter
3Methodology
DRAFT DOCUMENTATION - 16 - August 2009

Many countries use the standard Laspeyres-type arithmetic mean of price relatives to compile their consumer price indices. Although the term ”Laspeyres” is often used to describe the formula, three points should be noted. First, Laspeyres requires that the weights reference period is the same as the price reference period, which is generally not the case. Weights may be from some prior survey period, say 2008, it taking some time to compile the weights for use with a price reference period of, say, January 2010. As noted below, the resulting index may more formally be a Young or Lowe index, depending on whether the weights are price-updated. The term “Laspeyres” or “Laspeyres-type” is used with this in mind. Second, for the CPI software, although such indices may be referred to as Laspeyres, aggregation is in two stages; the elementary level using an equally-weighted geometric mean (Jevons) index and the weighted higher level using a Laspeyres or geometric Laspeyres. This is not so for the PPI processor. The gains from weighting are considered to be substantial and weights can more feasibly be obtained from establishments for a PPI, than outlets for a CPI. Thus there is no elementary unweighted stage here. Third, a modified/two-stage formulation will be used, as outlined below.
Elementary Index Formulas Compilers should note that the PPI software does not have an elementary aggregation stage, though we note here the properties of such formula since this has implications for the index if no weights are available. The PPI Manual (Chapters 1 and 20) favors the use of geometric mean formula (Jevons index) on axiomatic grounds for equally-weighted index numbers. The Jevons index is defined as follows:
1/
01
(1)NtN
iJ
i i
pP
p
The arithmetic mean of price relatives (Carli index) is biased, especially in a chained form, and the ratio of arithmetic means of prices (Dutot index) is only suitable for strictly homogeneous varieties.
DRAFT DOCUMENTATION - 17 - August 2009

Although noted earlier, it is stressed that an important assumption behind the use of the software is that weighting information is available from establishments in the weight reference period at the most detailed level, that is for a product specification within an establishment. Weights should be input by the user at all levels. If a user does not have such information and imputes them on the basis of equal weighting, this is equivalent to using a Jevons index if a geometric mean is selected and a Carli if an arithmetic mean is used. A Carli index fails the time reversal test and is less desirable than a Jevons index. Users are strongly advised to use actual weights rather than weights imputed on the assumption of equal weights. This is especially important if an arithmetic aggregation is used.
The Standard Laspeyres-type Formula The standard Laspeyres-type formula, applicable up to the most detailed level of weighted items in the PPI basket, compares the base period output quantities valued at current period prices (the numerator) with the value of the base period revenue (the denominator) and can be written as:
0
0 0
0 00 0
0(2)
ti i
i i
i ii i
N
tNi=1 i
N0 t Ni=1
i
i=1i=1
q p p q p = I
pq pq p
=
where i = 1, ... , n stands for the products comprising the output basket and symbols 0,t respectively designate the price reference period (or the base price period and the current price period). The symbols p and q designate the prices and the quantities of the products in question, respectively. The ratio (pt,i /p0,i) is the price relative to the base period for item i (sometimes called the long-term price relative). By expressing the output share for the item i as a ratio of the total output during the base period as:
0 0
0
0 0
3 i i
i
i i
N
i=1
q p( ) =w
q p
Using the preceding expression formula (2) can be written in a slightly different form as:
DRAFT DOCUMENTATION - 18 - August 2009

DRAFT DOCUMENTATION - 19 - August 2009
00 0
1
(4)i
tNi
ti i
pI w
p
However, these versions of the Laspeyres formula do not provide the flexibility required for economies that are going through significant and rapid changes.
The Modified or Two-stage Laspeyres Approach There are several reasons why the Modified Laspeyres Approach is superior to the standard formula. First, in the standard formula, we are comparing price relatives for the current period to the base period. In practice, the editing of the current period’s price data is done by comparing the prices for the collection period for an item with those charged for the same item in the previous period. Any large variations falling outside a predetermined range checks (e.g. 0.8000 to 1.1000) might indicate either the wrong item has been priced or some kind of error has been made in recording the price. With formula (4), this comparison cannot easily be made as it uses, for each item i, the price relatives of current
period to the price reference period 0
ti
i
p
p
.
Second, the standard formula involves a comparison of changes in prices for each item over long time periods, requiring the continuity of priced item specifications. In practice varieties become permanently missing or unrepresentative and need to be replaced with new varieties for which there is no price in the reference period 0 to compare with. In these circumstances, it is advisable to apply a modified version of the Laspeyres formula that makes use of
0
ti
i
p
p
, the price relative to the previous period so that a new variety can be
introduced as soon as two successive price quotes are available. Third, when varieties are temporarily missing imputed prices may be used based on the overall price change of the product group in question. Imputations over the short run are likely to be more reasonable than long-run ones... The basic formula for computing the PPI can be written as:
1 0
0 0
11
1
5
ti i
i i
tNi
ti= i
0 t N
i
p p q
p( ) = 100I
p q

DRAFT DOCUMENTATION - 20 - August 2009
1 2
0 0
0 11,where
ti i
i it
i i
t i 0,i
p p p = ... p q p q
p p p
1
2
i
i
Formula (5), which is arithmetically equivalent to formulas (2) and (4), is considered more versatile than the formula using long-term price relative to the base period, as the linking process used facilitates the introduction of new varieties and/or items or substitution when the need arises and enables more reasonable imputations. Formula (5) can also be rewritten as:
1
0
1 0
t ti i
iti i
N
0 t
i=1
p p(6) = wI
p p
which can be interpreted as:
11
7 ti
tNi
0 t ti=1 i
p( ) = wI
p
where 1
1 0
0
ti
ti i
i
p= w w
p
is an updated weight sometimes referred to as a “cost
weight” of item i.
In other words, to obtain the index for the current period t, the Modified Laspeyres Approach involves multiplying individual price relatives of the latest
price compared period ( 1
iti
tp
p ) by the previous period’s updated weight ( 1tiw ), and
then summing them.4
The Modified Laspeyres formula has obvious advantages over the standard Laspeyres formula when we consider the problems arising from permanently unobservable varieties, and the need in due course to the bring in a new variety
TPR
4 Formula (6) can also be interpreted as:
n
0 t t-1 0,i0,i t t -1,ii=1
= w STPRI L
where STPRt→t-1,i is the short-term price relative of item i for current period (= 1t ti ip p ) and
LTPRt-1→0,i is the long-term price relative of item i for previous period (= 0ti ip p ).

DRAFT DOCUMENTATION - 21 - August 2009
to replace the missing one. There is a need to impute a base period price if the standard Laspeyres formula is used. Such imputation is unnecessary while using the Modified Laspeyres formula, in which case the current period weight for the replacement item is obtained by simply multiplying the last updated weight for the replaced item by the current period’s short-term price relative of the replacement item. The system uses the modified Laspeyres approach to calculate PPI based on monthly price quotations (or monthly average price quotations) and weights information. The price index is assigned a value of 100 in the base period and value of the index for other periods of time, which indicate the average proportionate, or percentage, change in price levels.
The Young and Lowe indices Instead of holding the weight reference period at 0, the PPI System allows the user to compile a PPI as a weighted geometric/arithmetic average of the individual price relatives holding constant the output revenue shares at period b. A preceding period b is used for weights since it takes time to compile the results for weights before they are used in the index. The resulting index is called a Young index. In this case, the formula should be revised as:
1
1 08
t tNi i
0 t b,i ti=1 i i
p p( ) = wI
p p
The weight reference period b is likely to precede price reference period 0 because it takes time to collect and process the output revenue data. For example, a monthly PPI may run from January 2010 onwards, with January 2010=100, but the quantities may be derived from the annual output business survey made in, say, 2008 or June 2008 to July 2009. In that case, we have the choice of assuming that either the quantities of period b remain constant or the output revenue shares in period b remain constant and equation (8) does the latter. A Lowe index holds quantities constant in period b, and is given by:
10,0
0 0 0(9)
o tb b i i
t bi i t tbii i b i ii i i
ib tib b i i i i iii i bi
i
p pp q
p q10
p pp pw
p p q pp q
p
p
Where are price updated weights given by: ,0b
iw

,00(10)
ob b ii i b
b ii
b b ii i bi
i
pp q
pw
pp q
p
Since the user is responsible for entering the weights they can enter price updated weights or weights without price updating as in (9) and (8) respectively.
The Geometric Laspeyres or Young Indices Aggregation can be either arithmetic, as above, or geometric. The geometric version of the modified Laspeyres index, a weighted geometric average is taken of the price relatives using the output revenue shares of period 0 as weights. It is defined as:
01
0 10
11it tN
i i0 t t
i i i
wp p
( ) = Ip p
Similarly, the geometric version of the Young Index if period b ≠ 0, that is, the output revenue shares are different from price reference period 0:
1
0 10
12bit tN
i i0 t t
i i i
wp p
( ) = Ip p
Users should note that period b weights should not be price-updated to
period 0 if using the Geometric formula, i.e. a geometric Young may be
used but not Geometric Lowe. The user chooses between these formulas by
the type of weights inputted: Geo-Young if not updated and Geo-Lowe if updated.
Further, whether the index is a Geometric Laspeyres or Geometric Young depends on whether the user enters weights for period 0 or a preceding period b, and whether the index is an arithmetic Laspeyres or Young or Lowe depends on whether the user enters weights for period 0 or a preceding period b, or price updated weights from b to 0. The software uses the terminology “Laspeyres” of “Laspeyres-type” leaving it to the user to define the exact nature of the formula by virtue of the weights used. Laspeyres-type formulas are generally used by countries at the higher level and geometric means at the lower level. In spite of this, the geometric Laspeyres-type index has some advantages. Geometric means are (i) not as sensitive as arithmetic means to the extreme values, (ii) are
DRAFT DOCUMENTATION - 22 - August 2009

circular, i.e., fulfill a multi-period transitivity property that the product of the price index change going from a period 1 to a period 2 times the price index change going from period 2 to a period 3 should equal the price index going directly from period 1 to 3; and (iii) are more likely to lie between the Laspeyres and Paasche bounds, a desirable property.
Matched Price Observations An average price is calculated in each of the geographical areas covered and for each variety comprising the PPI basket. The system allows a different number of areas and variety structure. The calculation of average prices would be simple if a set of price quotations were available for the current and previous month. In reality, this does not always happen. Quite often, some of the respondents are unable to quote a price for a particular variety because it is out of stock. Whenever a particular price observation is missing from either the previous month or the current month, the corresponding price observations are eliminated from the other period. This is equivalent to imputing the price of variety 1 in period t by the short-run price change of the other varieties in the product group. This ensures that the price averages are calculated on the basis of “matched observations”, i.e., a consistent sample of price quotations in each period. In the following example we consider that item’s prices are collected for four representative varieties 1,2,3, and 4. In the current month transaction 1's price cannot be collected (is missing).
Transaction v of item I
Month t-1
Month t
Transaction 1 1.50 -
Transaction 2 1.25 1.25
Transaction 3 1.25 1.50
Transaction 4 1.50 1.50
Average 1.37 1.41
Average for matched
observations 1.33 1.41
DRAFT DOCUMENTATION - 23 - August 2009

(Transaction 2, Transaction 3,
Transaction 4)
Short-term relative for item i 1.0627 (=1.41/1.33)
For the PPI calculation of month t, the geometric average price for month t-1 should be recalculated based on matched observations as (1.25*1.25*1.50)(1/3) = 1.33 and not (1.50*1.25*1.25*1.50)(1/4) = 1.37. The month t’s short-term price relative for item i is then 1.0627 (=1.41/1.33), and not 1.0309 (=1.41/1.37).
Impute Missing Indices & Prices The PPI System program will impute missing STPRs, LTPRs, and updated weights based on the information available from other price quotations of varieties in that commodity group. Imputed indices and prices will be stored database with a flag. These imputed indices and prices are shown in the tabulation in red color. Missing price index is estimated using its parent index as the proxy, i.e., if a specific variety’s index is missing due to the missing prices, the index of the product or item it belongs to will be taken to be representative. The system always uses the next available level index data in the same group or item for the missing index, e.g., if level 7 index is missing, level 6 index will be used; if level 6 index is missing, level 5 index will be used so on so forth. Holding missing prices for a variety constant by carrying the last observation forward (i.e., making the short-term price relative for that variety equal to 1.0) during a period of high inflation would cause short-term distortion in the index, because it would understate inflation while the variety was unavailable and then show a large increase in the index when the variety became available. The system therefore does not use carry-forward prices. We do not use the price for the same variety in another outlet to represent the missing price in this outlet. Thus if Coca-Cola price is missing in one particular outlet, the system will not take the other outlet’s Coca-Cola price as a proxy, instead it will take soft drink index in the same outlet to represent that of Coca-Cola. Since parent group price changes are always calculated as geometric mean changes, imputations are based on geometric means. Missing prices of one or some varieties then are estimated by multiplying the previous period’s price by the current period’s short-term price relative of that variety, which in turn was estimated using the index of the item/group. If the
DRAFT DOCUMENTATION - 24 - August 2009

previous period’s price is not available, the missing price will be estimated by multiplying the reference/base period price by the LTPRs. If both previous period price and base period price are not available, missing price will/can not be imputed. If no price is collected for any variety covered by a product (the prices for whole product is missing), Its price relatives will be imputed using average price relatives from the item group of the missing price.
Detection of Outliers What is an outlier An observation that is unusually large or small relative to the other values in a price relatives data set is called an outlier. Outliers are the observations that appear to be inconsistent with the remainder of the collected data. There are several possible sources for outliers:
1. The price quotation of a transaction or variety is observed, recorded, or entered into the computer incorrectly.
2. The price quotation come from a different population, or quality of that
transaction/variety has been changed.
3. The price quotation entered is correct, but represents a rare event or novel phenomenon.
Outliers occur when the relative frequency distribution of the data set is extremely skewed. Such distributions have a tendency to include extremely large or small observations. The PPI/CPI software implemented two procedures to identify the possible errors and outliers. The first one is non-statistical procedure, which is to find whether specific price observation falls outside some pre-specified acceptance interval. In the “Input Price in Time Series Format” screen, the user can specify a threshold value (default is 20%), for any price change is greater than the threshold, the increased percentage will be shown in red and bold which indicates the possibility of errors or outliers. The second one is the statistical procedure, in which three methods are implemented. In both cases outlier detection should not result in automatic deletion. Often price changes are undertaken after some time and the “pent-up” prices changes are unusually large. To delete them would bias the index downwards. The outlier detection is to alert the compiler about a possible error that needs further investigation.
DRAFT DOCUMENTATION - 25 - August 2009
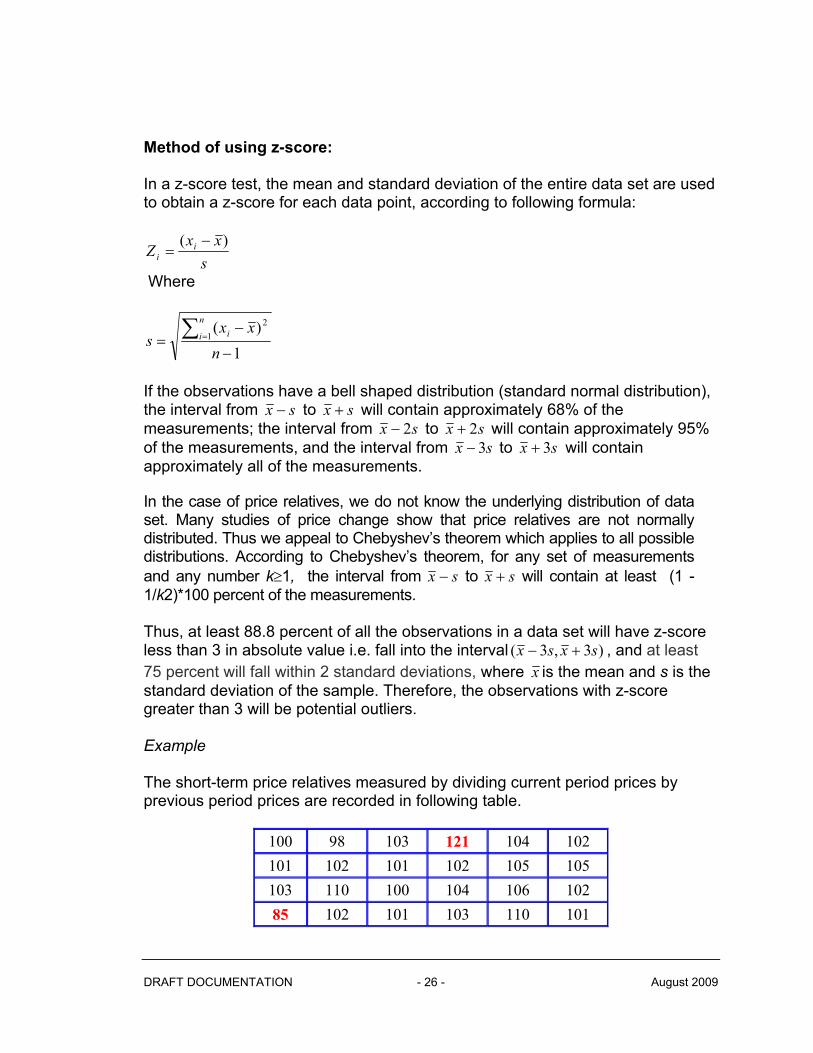
Method of using z-score: In a z-score test, the mean and standard deviation of the entire data set are used to obtain a z-score for each data point, according to following formula:
s
xxZ i
i
)(
Where
1
)(1
2
n
xxs
n
i i
If the observations have a bell shaped distribution (standard normal distribution), the interval from sx to sx will contain approximately 68% of the measurements; the interval from sx 2 to sx 2 will contain approximately 95% of the measurements, and the interval from sx 3 to sx 3 will contain approximately all of the measurements. In the case of price relatives, we do not know the underlying distribution of data set. Many studies of price change show that price relatives are not normally distributed. Thus we appeal to Chebyshev’s theorem which applies to all possible distributions. According to Chebyshev’s theorem, for any set of measurements and any number k1, the interval from sx to sx will contain at least (1 - 1/k2)*100 percent of the measurements. Thus, at least 88.8 percent of all the observations in a data set will have z-score less than 3 in absolute value i.e. fall into the interval )3,3( sxsx , and at least 75 percent will fall within 2 standard deviations, where x is the mean and s is the standard deviation of the sample. Therefore, the observations with z-score greater than 3 will be potential outliers.
Example The short-term price relatives measured by dividing current period prices by previous period prices are recorded in following table.
100 98 103 121 104 102
101 102 101 102 105 105
103 110 100 104 106 102
85 102 101 103 110 101
DRAFT DOCUMENTATION - 26 - August 2009

101 104 105 106 107 100
Sample Data for Short-Term Price Relatives
For this data set, x =103.1333, s= 5.4818, 3s=16.4454, z-score of the observation of 121 is (121-103.1333)/5.4818=3.2593, z-score of 85 is (85-103.1333)/5.4818 = -3.3079. Since the absolute values of z-score of 121 and 85 are more than 3, the price relatives 121 and the 85 are outliers in the data set. The Z-score method is biased by the problem that both the mean and standard deviation are affected by the outliers. Box Plots Method Another procedure for detecting outliers is to construct box plots of the price relatives data. They make no distributional assumptions and, since they rely on the median and quartiles as parameters, the method of detection is not influenced by the outliers themselves. Below are the steps implemented in constructing the box plots for the software.
The median M, lower and upper quartiles, QL and QU, and the inter-quartile range, IQR= QU - QL are calculated for the data set.
Two sets of limits on the box plot are constructed: inner fences are located a distance of below QL and above QU; outer fences are located a distance of below QL and above QU.
Observations that fall between the inner and outer fences are called suspect outliers. Locate the suspect outliers on the box plot using asterisks (*).Observations that fall outside the outer fences are called highly suspect outliers. How the Quartile is Calculated? Quartile calculation depends on the percentiles definition. The First quartile is the 25th percentile (noted Q1), the Median value is the 50th percentile (noted Median), and the Third quartile is the 75th percentile (noted Q3) The method to calculate the quartiles in CPI/PPI application is same as that used in Excel. It uses n-1 instead of n. the p-th percentile is defined by: y = (1-g)* x(j+1) + g*x(j+2) where (n-1)*p=j+g (and x(0) is taken to be x(1)).
DRAFT DOCUMENTATION - 27 - August 2009

DRAFT DOCUMENTATION - 28 - August 2009
Let n be the number of observations in a data set (here n=4), and X(1)…X(n) the ordered values of a data set. Let p be the p-th percentile we want to calculate (e.g. p=0.25, 0.5, or 0.75). We’ll calculate the product n*p. the product n*p can be split up between j and g, where j is the integer part of n*p and g is the decimal part of n*p. Example To better understand this method, we’ll apply them on an simple example. The data set studied is:
Variable X1 X2 X3 X4 Value 2 1 4 3
Once ordered it becomes:
Variable X1 X2 X3 X4 Value 1 2 3 4
In this example, for Q1, p=0.25, n=4, (n-1)*p=3*0.25=0.75*X(2) = 0.25*1+0.75*2 = 1.75, thus the 25th percentile is 1.75 with this method. Log-normal Method
Another procedure that has been implemented into the software to identify the possible errors and outliers is to use 2s from the log-normal distribution, excluding price relatives of 100 (no change of prices from previous to current period).5 It takes the natural logarithms of price relatives data, which is assumed log-normally distributed. The standard deviation and mean of the logged of all price relatives in the sample are calculated. Those price relatives that fall outside of 2 standard deviations (with 95% confidence level) are considered as possible outliers.
Calculating Adjusted Weights
If sampling establishments so that some are selected with certainty, say as a cut-off sample, and some are selected to be representative of the remaining establishments the weights of each establishment in the latter need to be
5 The reason to exclude those price relative with 100 value is that, presumably, there are a lot of “no change” price relatives. By including them we will observe a bimodal distribution. Since it is no longer normally distributed, we cannot apply a 2-sigma limit with 95% confidence to detect outliers.

DRAFT DOCUMENTATION - 29 - August 2009
adjusted. Further, establishments may disappear from the active sample and it may be necessary to redistribute the weight across the active sample. These two effects are picked up in an adjustment routine for the weights. The establishment adjusted weight is calculated based on the sample group to which the establishment is classified. For the sample group selected with certainty, an establishment adjusted weight is equal to the establishment assigned weight. They only represent themselves, wi
c. For the probability selected establishments, p, the weights are assumed equal for each establishment and assigned as wi
p = (WT – ∑ wi
c )/ n where WT is the total weight for the sample group and n the number of establishments in the probability group. However, if establishment(s) disappear from the sample, though still sell goods and services in reality, the weights of the remaining establishments can be adjusted so that those still active get allocated a prorata share of those that are “inactive” within its sample segment. If there were 5 selects initially and they each had a value weight of 20 and one disappears and 4 remain, each would get a weight of 25. An establishment adjusted value weight is equal to an establishment assigned value weight (20) divided by the total value weight of establishments that are active in the product group (80), then times the total value weight of establishments (both active and inactive establishments) of the product group (100) i.e.
Assignedadj Totali
i inactive i
ii
WW W
W
in which is adjusted weight of an establishment i; is assigned weight
of an establishment i, is the total weight of active establishments and
is the total weights of all the establishments. This is to say that weights
of those inactive establishments will be taken and redistributed to the active establishment based on its share in total active weights.
adjiW Assigned
iW
1
nactive
ii
W
1
nTotal
ii
W
In the probability selected group, the adjusted weight for an establishment being selected with probability is:
1Activeadj Total Total
i i iActive i
ii
WW W
nW
iW and the adjusted weight to represent
establishments no longer active is:

DRAFT DOCUMENTATION - 30 - August 2009
1 Total
iiadj Totali i
active ii
i
Compilers are strongly advised to run these adjustment procedures with trial data to ensure the understand their use. If in doubt adjustments can be made
WnW W
W
.
utside of the system and the adjusted weights used as the “assigned” weights. o

Chapter
4Installation of the Software
Basic Information The PPI System is developed using Microsoft Visual Basic ® 6.0. Both cross-section data and time-series data are stored in Microsoft Access format. The system uses Microsoft ActiveX® Data Objects (ADO 2.8) for the data access and database management. The data access object is included in Microsoft Data Access Components (MDAC). The system uses VideoSoft ActiveX Controls® VSFlexGrid® 7.0 and Formula One® for the tabulation, Wise InstallBuilder® 8.03 for software packaging and RoboHelp® for generating standard Microsoft HTML help file (.CHM file).
Package Contents The installation package on the PPI distribution CD-Rom includes all necessary files and ActiveX components for the system to operate. Microsoft data access components will be installed in user’s computer. The package contains database tables for industry classification of ISIC Rev 3.1, CPA 2002, and CPC version 1.1 product classifications. They are distributed by the United Nations and EUROSTAT respectfully.
System Requirements The system requirements are as follows: a) Operating Systems: Windows 98, Windows NT 4.0, Windows 2000, Windows
ME, or Windows XP. b) Microsoft Office 2000 or above. c) CPU: Pentium-600 MHz or higher d) 512 MB RAM or more e) 60 MB free disk space
DRAFT DOCUMENTATION - 31 - August 2009

f) VGA–True Color video mode, displays at 800 x 600 or 1024 x 768 pixels. The installation package on the PPI distribution CD-Rom includes all necessary files, including ActiveX components.
Installation Procedures
Insert the Price Index Processor CD-ROM in the CD drive, The user will see following screen:
Click either Install CPI Software or Install PPI Software button to trigger installation process. Click CPI User Manual or PPI User Manual to read the manual in PDF format.
DRAFT DOCUMENTATION - 32 - August 2009

Click Next
Click Next.
DRAFT DOCUMENTATION - 33 - August 2009

Click Next.
DRAFT DOCUMENTATION - 34 - August 2009

Wait until installation is complete. Click the Finish button to complete the installation process. Installation will create PPI System shortcut at Desktop.
DRAFT DOCUMENTATION - 35 - August 2009

Chapter
5The Basics
To start PPI program, Click Start, All Programs, PPI System, then click icon, or click PPI System icon from the desktop.
“1.0.30” is the application version number and “DB1” is the database version
System Configuration
DRAFT DOCUMENTATION - 36 - August 2009

The user can configure the PPI System work environment by clicking the
button in the main screen or clicking Options, Configure in toolbar. The user can define following settings:
(1) select the default database location; (2) select the default database name (the user can disconnect to a PPI
database and re-connect to another PPI database). If the database the user selected does not exist, the user will be prompted by following message:
If the user clicks Yes, the system will create a new database.
(3) create a new PPI database; (4) define default product classification system by selecting either CPA or
CPC or User Defined System. (5) define default imputation method. (6) define default elementary formula.
Click Apply after changes have been made. Click Refresh button to view most recent changes that have been made.
DRAFT DOCUMENTATION - 37 - August 2009

Click the Manage Product Classification button to invoke the import and export industry/product classification system. Click the Repair + Compact DB button to repair possible database errors and compact Access database. Click the Excel Data Transfer button to generate an Excel template to populate the PPI database from an Excel spreadsheet. Click the Set Compilation Date button to specify the compilation date.
DRAFT DOCUMENTATION - 38 - August 2009

This form is to provide the user with a feature to export and import the industry and product classification system. The user first selects whether she wants to export or import the product classification system. Then she will have to select the product classification system she will be working on and click the OK button. The selected system will be exported to the Excel spreadsheet. The user then can modify the classification system by adding or deleting items. It is important to note that the user must keep the existing hierarchical structure of industry and product classification scheme in order to be able to import it back to the database. The user has to save the specific Excel spreadsheet as Excel file. To import the revised the classification system back to the database, the user first selects the Import Classification Table into the Database radio button. Then selects either ISIC or User Defined product code; clicks the Browse button to select the Excel File that needs to be imported, and then clicks the OK button.
DRAFT DOCUMENTATION - 39 - August 2009

Select the file name and click Open button.
Click OK button again.
DRAFT DOCUMENTATION - 40 - August 2009

Select worksheet and click the Import button. To import the modified ISIC table into the system, the user can click the Import Classification Table into the Database and ISIC Code, browse for the file, and click the OK button.
DRAFT DOCUMENTATION - 41 - August 2009

DRAFT DOCUMENTATION - 42 - August 2009

Add New Establishment Click the button to add a new establishment. Enter the establishment information in each field. Fields with * indicate required fields.
Click Est ID Coding button to get a program generated establishment ID for newly added establishment.
Click the Auto Generate button to create Establishment ID using exiting coding structure. Enter the establishment name and other required fields indicated with *. Click the Help button or icon if help is needed.
DRAFT DOCUMENTATION - 43 - August 2009

Establishment ID is unique field. If the establishment ID is already taken, the following message will be displayed:
Click the Establishment Status dropdown list to define the establishment status; the default value is “Initiated and Reported”. The establishment status indicates the current standing of the establishment as in one of following situations:
1 - refuse to participate; 2 - out of business; 3 - could not locate; 5 - initiated and reported; 6 - resending for initiation; 8 - no relevant product;
DRAFT DOCUMENTATION - 44 - August 2009
9 - not yet initiated; and 7 - unknown.
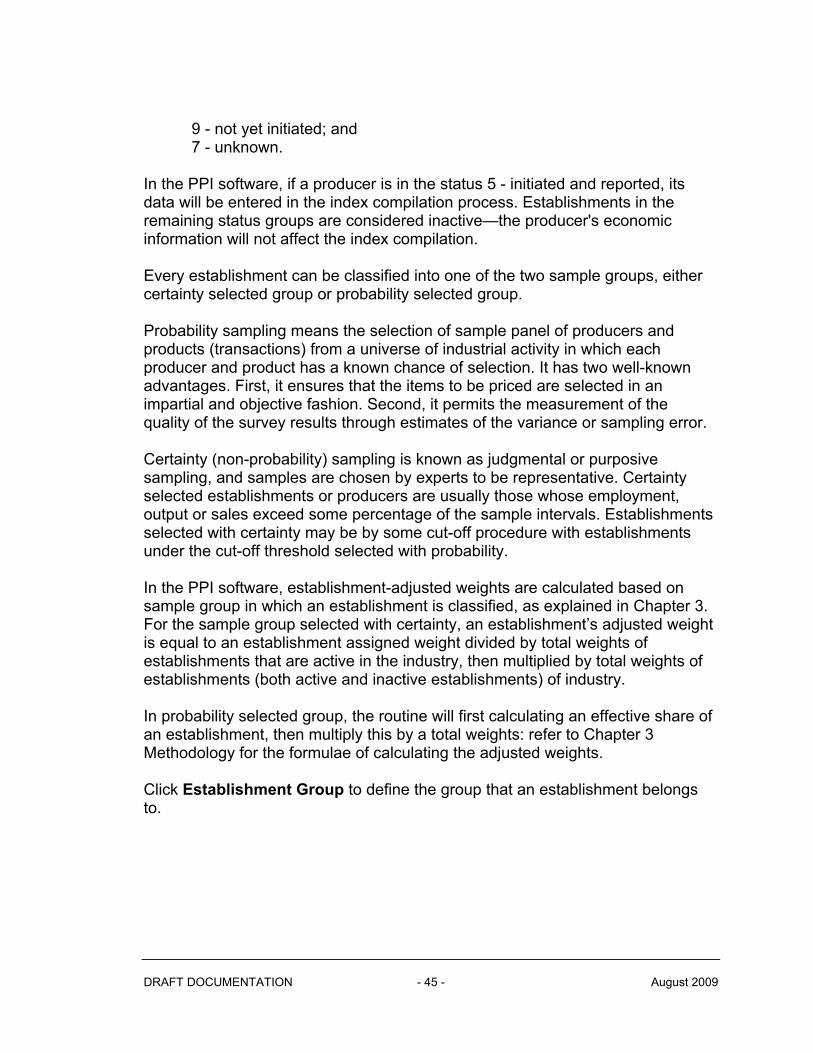
In the PPI software, if a producer is in the status 5 - initiated and reported, its data will be entered in the index compilation process. Establishments in the remaining status groups are considered inactive—the producer's economic information will not affect the index compilation. Every establishment can be classified into one of the two sample groups, either certainty selected group or probability selected group. Probability sampling means the selection of sample panel of producers and products (transactions) from a universe of industrial activity in which each producer and product has a known chance of selection. It has two well-known advantages. First, it ensures that the items to be priced are selected in an impartial and objective fashion. Second, it permits the measurement of the quality of the survey results through estimates of the variance or sampling error. Certainty (non-probability) sampling is known as judgmental or purposive sampling, and samples are chosen by experts to be representative. Certainty selected establishments or producers are usually those whose employment, output or sales exceed some percentage of the sample intervals. Establishments selected with certainty may be by some cut-off procedure with establishments under the cut-off threshold selected with probability. In the PPI software, establishment-adjusted weights are calculated based on sample group in which an establishment is classified, as explained in Chapter 3. For the sample group selected with certainty, an establishment’s adjusted weight is equal to an establishment assigned weight divided by total weights of establishments that are active in the industry, then multiplied by total weights of establishments (both active and inactive establishments) of industry. In probability selected group, the routine will first calculating an effective share of an establishment, then multiply this by a total weights: refer to Chapter 3 Methodology for the formulae of calculating the adjusted weights. Click Establishment Group to define the group that an establishment belongs to.
DRAFT DOCUMENTATION - 45 - August 2009

Click button to input or edit multiple establishments at a time. As is apparent from the above screen, the user designates whether the establishment is selected with certainty, in which case the weight for the establishment will represent the active sample, or whether the establishment is selected with a probability attached, in which case an adjustment can be made to the assigned weight. Again it is stressed that the compiler can always make adjustments to the weights outside of the system and enter the adjusted weights with certainty. If the probability options are used great care should be exercised by running trial data first.
DRAFT DOCUMENTATION - 46 - August 2009

Enter Est ID, Est Name, ISIC Code, Description, Region and Est Status information in the spreadsheet. Please note that Est Status is an optional field, if left blank, the entry will automatically be saved as active establishment - “initiated and report”. Otherwise, enter 1 for "Refused to participate"; 2 for “Out of business”; 3 for “Could not locate”; 5 for “Initiated and reported”; 6 for “Resending for initiation”; 8 for “No relevant product”; 9 for “Not yet initiated”; and 7 for “Unknown”.
DRAFT DOCUMENTATION - 47 - August 2009
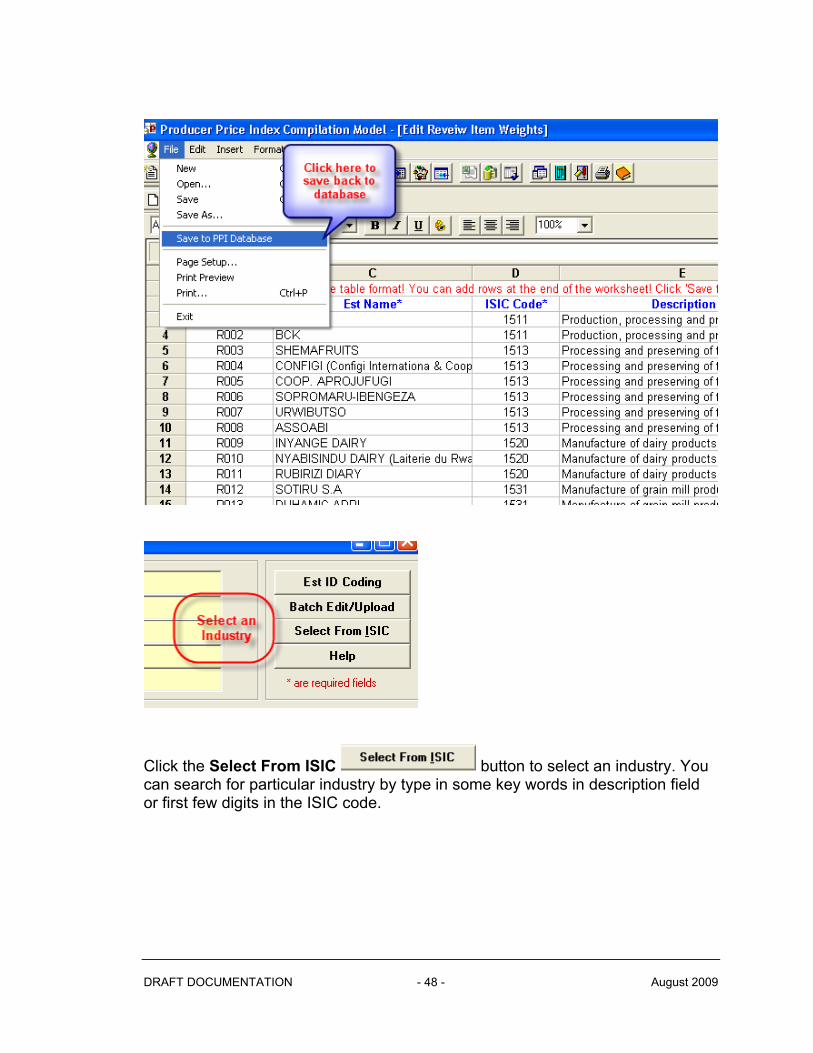
Click the Select From ISIC button to select an industry. You can search for particular industry by type in some key words in description field or first few digits in the ISIC code.
DRAFT DOCUMENTATION - 48 - August 2009

For example, you can search for an ISIC code with “29” as the first two digits.
DRAFT DOCUMENTATION - 49 - August 2009
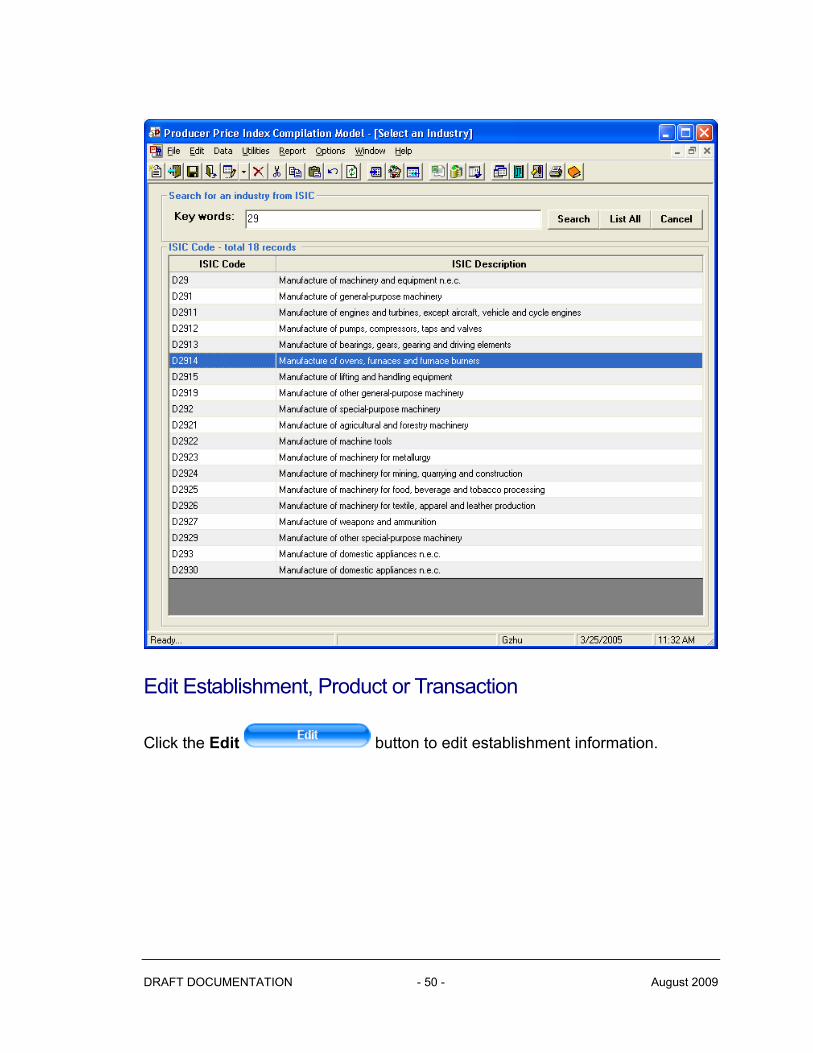
Edit Establishment, Product or Transaction
Click the Edit button to edit establishment information.
DRAFT DOCUMENTATION - 50 - August 2009

Double click the specific fixed (heading) row for re-sorting the field in ascending or descending order. Those establishments showed in grey color are inactive. The user can add notes to an establishment by double clicking icon in Est Notes column. An icon indicates that there is a note associated with this establishment.
DRAFT DOCUMENTATION - 51 - August 2009

It is important to note that metadata text length should not exceed 65,353 characters (a memo field in the database), which is approximately 24 pages of MS Word document. After adding a note, the user could save it to PPI database or save it externally for the future reference.
Select a specific establishment (by clicking once on the particular row), right click (once) to invoke an editing Menu. It is important to note that you can change an establishment ID provided that the ID is not taken. It the user wants to create a new establishment using an ID that already exists, she can either delete that ID first, or hit the save button three times. In that way, the existing establishment information in the database will be overwritten by the information newly inputted. The user can edit establishment, product or price information by clicking the appropriate button. The user can also edit the notes, clone/duplicate an establishment, or delete an establishment.
DRAFT DOCUMENTATION - 52 - August 2009

Grey color indicates that the establishment status is not active. Click the Edit Establishment button to invoke editing screen.
DRAFT DOCUMENTATION - 53 - August 2009

Add New Product and Transaction Detail and Weights Click the Edit button on the Main Menu screen.
To add product or transaction information, the user has to select an establishment first (single click), to which the product or transaction is going to be added. Click the Edit Product button, or click the Product button on the establishment edit screen as showed below.
DRAFT DOCUMENTATION - 54 - August 2009
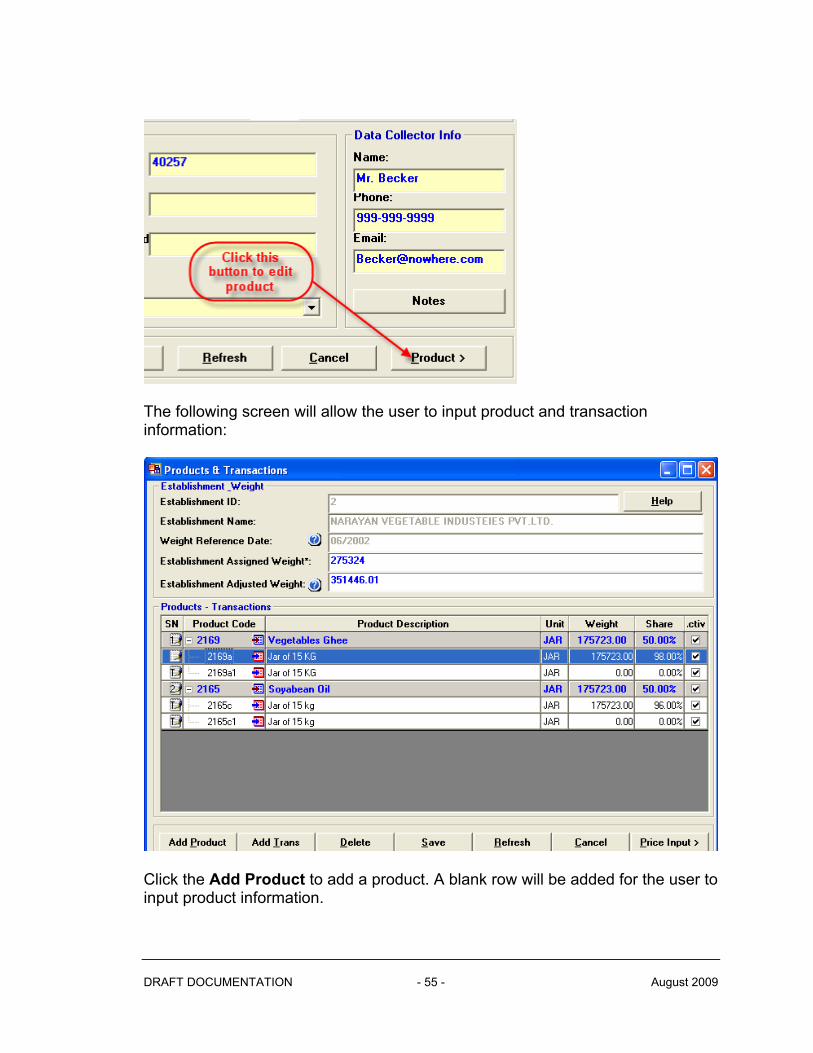
The following screen will allow the user to input product and transaction information:
Click the Add Product to add a product. A blank row will be added for the user to input product information.
DRAFT DOCUMENTATION - 55 - August 2009
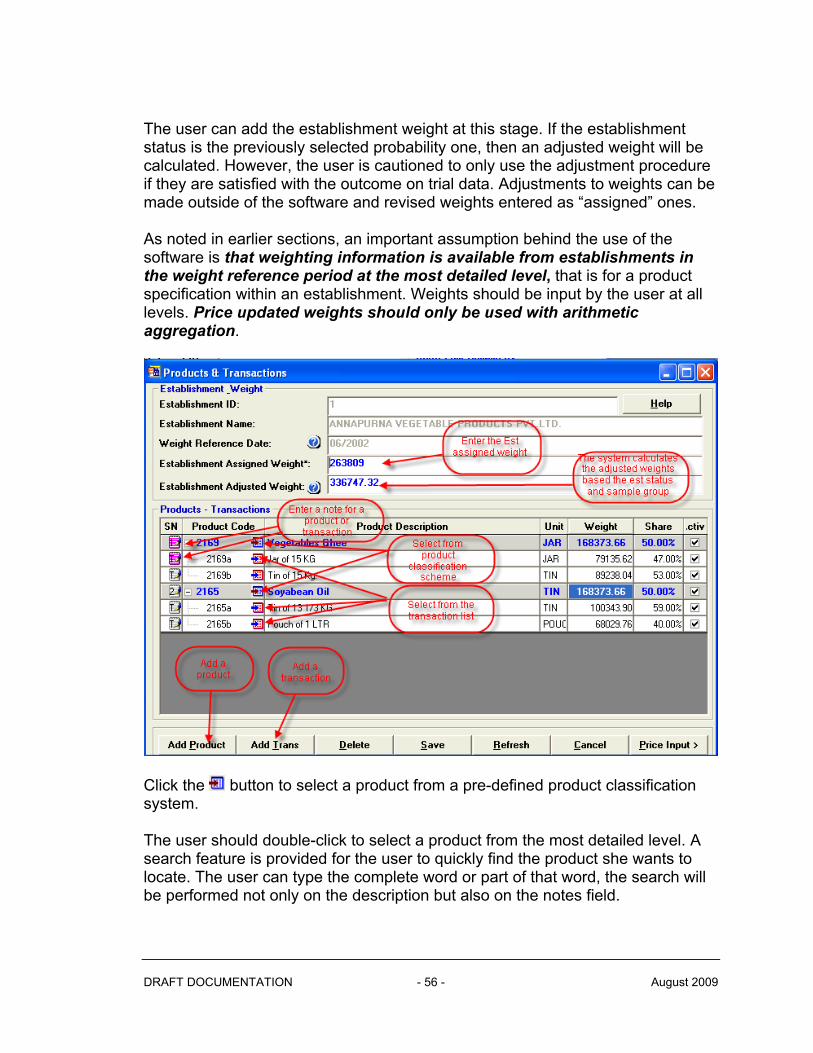
The user can add the establishment weight at this stage. If the establishment status is the previously selected probability one, then an adjusted weight will be calculated. However, the user is cautioned to only use the adjustment procedure if they are satisfied with the outcome on trial data. Adjustments to weights can be made outside of the software and revised weights entered as “assigned” ones. As noted in earlier sections, an important assumption behind the use of the software is that weighting information is available from establishments in the weight reference period at the most detailed level, that is for a product specification within an establishment. Weights should be input by the user at all levels. Price updated weights should only be used with arithmetic aggregation.
Click the button to select a product from a pre-defined product classification system. The user should double-click to select a product from the most detailed level. A search feature is provided for the user to quickly find the product she wants to locate. The user can type the complete word or part of that word, the search will be performed not only on the description but also on the notes field.
DRAFT DOCUMENTATION - 56 - August 2009

Double click the product the user wants to select, the product code with description will be extracted and displayed as a product selection screen. Product weights can be added at this stage. The user then can add transaction to this product by clicking the Add
Transaction button. Click the button to add a transaction from a transaction list. A transaction list is a user-defined list which extends the international standard product classification defined by CPA or CPC. The transaction list comprises many transaction items. Each transaction item can have an user-definable, unique code and description, such as package type, serving, number of units in package, size of unit, unit of measure, origin, seasonal availability, product characteristics etc. The transaction code is typically concatenated by its parent product code combined with additional one or two alphabetical letter. The
DRAFT DOCUMENTATION - 57 - August 2009

system will generate this code when the user press the Add New Code button and the user can change this code if she wants to. The transaction list allows each country to maintain additional dimensions of product/transaction information which reflect its own unique production pattern. Each transaction list has a parent, which is listed in the standard CPA or CPC product classification. In this way, the system maintains a international standard while provides each country with flexibility of creating additional dimensions of transactions with its unique characteristics.
It is important to note that one transaction specification can be used by multiple establishments, if one particular transaction is already used by another establishment, it can not be deleted from database until it is released from that establishment. The user should look at the transaction list carefully to decide whether an existing transaction code should be used or a new transaction should be created/entered; click the small grey button at right side of the first column to select a transaction; once a transaction is selected, the “Choose or Add Transaction” screen will disappear and the transaction information will show in the product screen. The
DRAFT DOCUMENTATION - 58 - August 2009

user has to click the Save button to store the product and transaction information. Please note, if there are multiple products in one establishment, the user has to designate a product under which she wants to add the transaction. The user can not add a transaction directly under another transaction. The user can also enter weights for each transaction.
Input Price Quotation After defining products and varieties structure, the user is ready to input price quotations. The user has several methods to input price: Method 1, Batch Price Data Input Click Utilities, Create Excel for Update from toolbar.
Select establishments by ticking the small square boxes in the first column. Then click Create Excel Sheet button.
DRAFT DOCUMENTATION - 59 - August 2009

The user will see following screen: which allows the user to specify the start period and the number of period.
Click the OK button. The user will see the previous screen with Excel Icon on the right hand side of the form.
DRAFT DOCUMENTATION - 60 - August 2009

Click the Open Excel File link or the Excel icon, the user will see the following Excel spreadsheet:
DRAFT DOCUMENTATION - 61 - August 2009

This worksheet is protected except for the yellow area, which is the area where the user can input price information. It is important to note that this is a pre-designed spreadsheet with a specific table format for price updating purposes. Some cell information is for technical purposes and the table structure can’t be change at the user’s discretion. Any unsolicited changes of the table structure will cause errors and data can then not be saved properly. But if it is absolutely necessary, the user can unprotect this worksheet by clicking Tools, Protection, Protect Sheet button. The password for unlocking this worksheet is “123”. Method 2, Enter/Update Price Through Windows Form
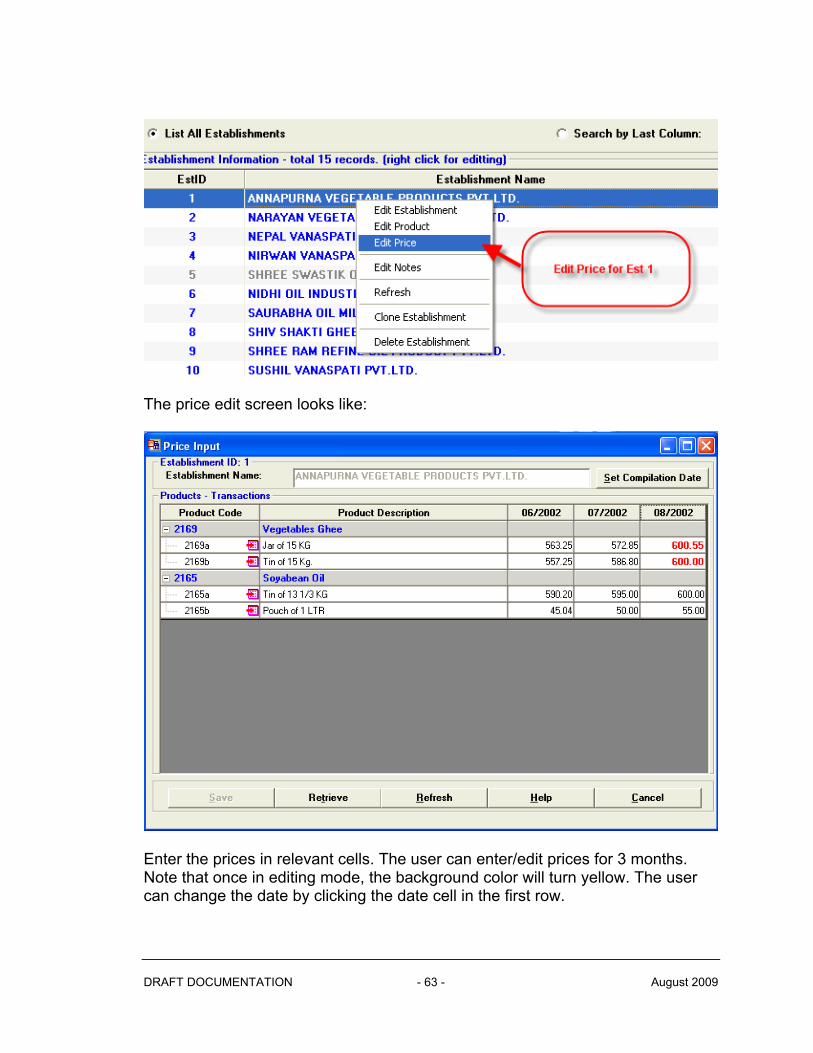
Click the Price Input button in edit product screen, or click Edit from main menu, select an establishment, right click, select Edit Price button as showed below:
DRAFT DOCUMENTATION - 62 - August 2009
DRAFT DOCUMENTATION - 63 - August 2009
he price edit screen looks like: T
nter the prices in relevant cells. The user can enter/edit prices for 3 months.
ENote that once in editing mode, the background color will turn yellow. The usercan change the date by clicking the date cell in the first row.

Alternatively, the user can set the PPI compilation date, the date in these columns will be reset accordingly corresponding to the base period, current period and previous period.
The user can retrieve historical price data by clicking the Retrieve button. To change the date, the user can click date cell. The price figures shown in red indicate that they are imputed values. If the user exits the price-editing form without saving the revised data, she will see following message:
DRAFT DOCUMENTATION - 64 - August 2009

Click Yes to save the information, click No to ignore the changes, click Cancel to cancel the exit and continue to edit the price. Method 3, Enter/Update Price in Time Series Format The user can enter/edit price data for one specific transaction for multiple periods in time series format. Click icon right to the transaction code.
The user will be given following screen for price entry and editing:
DRAFT DOCUMENTATION - 65 - August 2009

Select the specific price observation, right click, the user will see following menu:
DRAFT DOCUMENTATION - 66 - August 2009

At this screen, The user can (a) add an observation at the end of time series; (b) can also insert one between two observations; (c) remove/delete an observation; (d) estimate base period price using another series as a proxy (deflate the base period price). At this screen, the user can also define an outlier threshold value, which is expressed in percentage term. If the percentage increase exceeds this threshold value, the font color of the percentage change will be showed in red. Please note that if the price is in red, this indicates that this value is estimated value during the imputation.
Click the Estimate Base Price button to use another index series as the deflator. If there is an observation that it is earlier than or same as the base period, the following message will appear:
DRAFT DOCUMENTATION - 67 - August 2009

Delete this value if necessary by selecting the first column of the relevant row, right click, and click the Delete button in the pop-up menu as shown below.
Click the Estimate Base Price again. Then the user has to select the month on which the price will be deflated by using a calculated index. In the case showed below, the user selected 6/1/2003 price to be deflated.
DRAFT DOCUMENTATION - 68 - August 2009

In the next step, the user has to select an index series as the deflator. Click OK in the following dialogue box.
Click Preview button if the data is not populated.
DRAFT DOCUMENTATION - 69 - August 2009

The base period price will be estimated as showed below:
Click Save button to save the estimated base price.
DRAFT DOCUMENTATION - 70 - August 2009

It is important to note that the system is using the price and compiled index of a user selected period as a proxy in estimating the base price. Therefore, the index for the selected period must be ready before the base price can be estimated. The formula used is pretty straightforward:
0
t
t
PP
I where is the base price; is the price in t period and 0P tP tI is the index
in t period. Method 4, Enter/Update Price for Multiple Establishments and for Single Transaction The user can also enter or edit prices for multiple establishments for a single transaction. Click the Data, Cross Establishment Price Comparison button as shown below:
The user will see following screen:
DRAFT DOCUMENTATION - 71 - August 2009
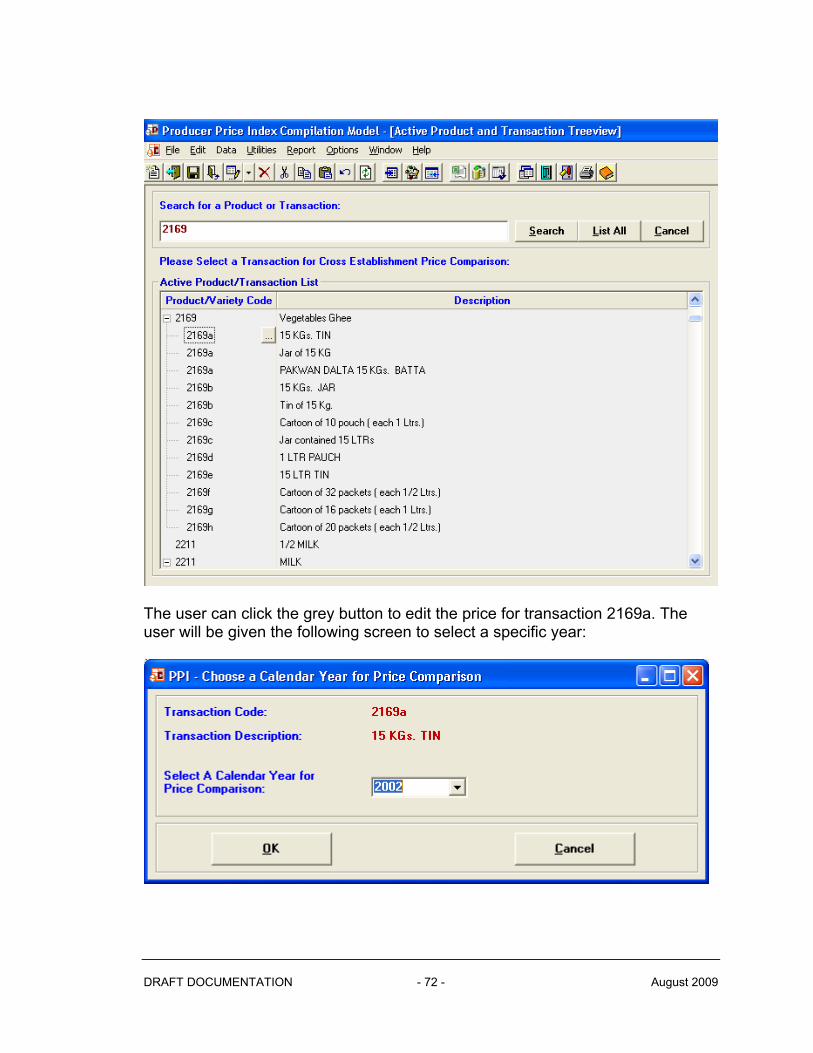
The user can click the grey button to edit the price for transaction 2169a. The user will be given the following screen to select a specific year:
DRAFT DOCUMENTATION - 72 - August 2009

Select year and then hit the OK button. If no data are available, the user will see this message box:
Otherwise, the user will see:
The user can change or input the price here and hit the Save button.
Generate Average Price for Transactions
DRAFT DOCUMENTATION - 73 - August 2009

The system can generate a report for average price for all the varieties across the establishments. The user can click Data, Generate Average Price button as showed below:
The user will see following screen:
The user can select one of average methods by choosing either arithmetic mean or geometric mean to be used in calculation. The user should also select Start Period, Number of Period and Decimal Point he would like to have in the report. Following report shows the arithmetic average price for different varieties across the establishments in the country for 3 periods.
DRAFT DOCUMENTATION - 74 - August 2009

Data Status Indicator and Pre-compile Data Check Data Status Indicator is a graphical feature provided to help the compiler to examine the data availability and status before undertaking the index compilation. The user has to determine the compilation period by selecting in the following screen.
DRAFT DOCUMENTATION - 75 - August 2009

Click OK button, the user will see following screen:
The user will have a graphic view of the data status. Green dots indicate that data are available; yellow dots indicate that data are partially available and red dots indicates that data are not available. Select the Establishment, right click, click the Edit Price button.
DRAFT DOCUMENTATION - 76 - August 2009

The user will be given the price edit screen; from there, the user can find the missing prices. If the user clicks the Edit Establishment, the user will be able to edit establishment information. This feature provides the user with quick access to the data to resolve the data missing problem. Different icons represent different establishment status. For example, represents Initiated and reported; represents Refuse to participate; represents Out of business; represents Could not locate; represents Not get initiated; represents Resending for initiation and for No relevant product. The user can change the base period and current period by clicking the Change button. To examine whether the data is good for compilation, the user can click Data, Pre-Compile Data Check button.
The system is able to find out following data errors: (1) missing establishment ID; (2) missing weight area; (3) missing product and transaction weights information; (4) missing establishment status; (5) missing establishment weights and (6) whether product and transaction weights exceed 100%. For example, the following screen shows that there are several errors for different establishment. They are interrelated: the establishment weight is missing and adjusted weight is missing.
DRAFT DOCUMENTATION - 77 - August 2009

Double click the red color the fonts, the program will bring to the screen where the error can be corrected. If no error has been found, the user will see following message box:
Recalculation of Weights
DRAFT DOCUMENTATION - 78 - August 2009

Global Impute/Save Weights triggers a recalculation based on establishment status and sample group the establishment belongs to and newly assigned weight. If excess weight is assigned to an establishment, these extra weight will be taken and re-allocated to other establishments. Similarly, if less weight is assigned to a particular establishment, the weight will be also re-calculated and redistributed along with the rest of establishments. An establishment is typically classified into either Certainty Group or Probability Group. Within Certainty Group, the weight distribution is based on the establishment status, whereas in Probability Group, each establishment will obtain equal weight, Calculating Adjusted Weights Please refer to Chapter 3 Methodology for the formulae of calculating the adjusted weights. Reset Update (Sample Rotation) The weights are key elements in the construction of an index number. Because some products have greater production or sales than others, each product is given a weight to represent its importance in total output or sales during the reference (base) period for the weights. The relative importance of such products keeps changing over the time, so weights have to be updated constantly. The system allows the user to undertake weights reset or update by clicking Utilities, Weight Update button.
DRAFT DOCUMENTATION - 79 - August 2009
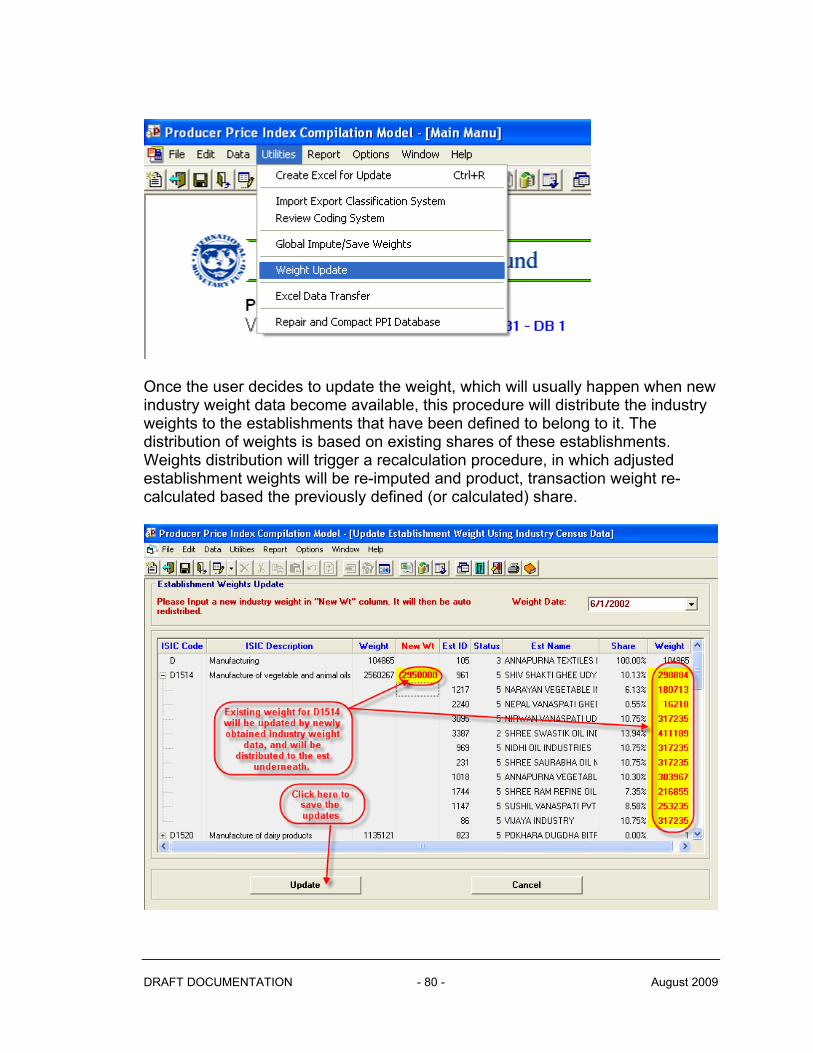
Once the user decides to update the weight, which will usually happen when new industry weight data become available, this procedure will distribute the industry weights to the establishments that have been defined to belong to it. The distribution of weights is based on existing shares of these establishments. Weights distribution will trigger a recalculation procedure, in which adjusted establishment weights will be re-imputed and product, transaction weight re-calculated based the previously defined (or calculated) share.
DRAFT DOCUMENTATION - 80 - August 2009

For example, existing industry weight for D1514 (Manufacture of vegetable and animal oils) is 2,560,267 which was the summation of all establishments that belong to it. When a new industry weight is available, the user can enter into New Wt column which will then be automatically redistributed to all the establishments below based on existing share.
Pre-compilation Preview
Click Report, Preview Data button at toolbar to preview the data before compilation. The user can select Weight Reference Date, Base Period, Current Period.
DRAFT DOCUMENTATION - 81 - August 2009

DRAFT DOCUMENTATION - 82 - August 2009
Index Compilation The user defines compilation method by choosing one of the options: By Industry, By Establishment, By Product or By Location. The equally-weighted elementary level compilation always uses the geometric mean. The user can also choose either Laspeyres-type or Geometric Laspeyres-type formula in the compilation at the weighted level. If Modified/Two-stage is checked, the system uses the previous period Long Term Price Relatives (LTPRt-1), which is price index number from period 0 to period t-1, in the calculation ( please refer the Chapter 3, Methodology for the details of formula). Alternatively, base period price Pt0, to previous period price Pt-1 and current period price, Pt will be used the imputation process. Imputation results will be showed in following screen:

The system generates three sets of results: (1) STPR, Short Term Price Relatives, which is the index of producer prices from last period to current period. (2) PPI, which is also Long Term Price Index, indicates a cumulated price change since period 0—in the above example the base and previous period are the same so the STPR=PPI. (3) Updated W is the price updated weights. The system updates weight for every period as part of the two-stage procedure. PPI indices will be plugged into the imputation as LTPRt-1 next period if Two-stage/modified index box is checked. Imputation results can be exported to the Excel easily. The user can click Export
to Excel, button, then an Excel icon will appear in the screen.
Click the link, imputation results will be exported to the Excel spreadsheet.
DRAFT DOCUMENTATION - 83 - August 2009

Missing price indices were imputed by taking the indices from its parent group. If parent group indices were missing, it has to go one level up again, until it finds the value. Imputed indices were indicated in red color. When the indices were saved to the database, missing price were automatically imputed and stored in the database with flag. It will show in price edit screen in red color as well. Current period missing price is imputed by multiplying the last period price by STPR of that transaction. If last period price is missing, then the price will take the product of base period and PPI index.
DRAFT DOCUMENTATION - 84 - August 2009

Time Series Report Indices in time series format (one index by multiple periods, each column indicates a period) can be generated. Details of such report are shown in following screen. Time series presentation will give the user one index at a time for the multiple periods. The user can select metadata columns (whether they would like to have metadata appear in their report. Time series report can be readily exported to an Excel spreadsheet.
DRAFT DOCUMENTATION - 85 - August 2009
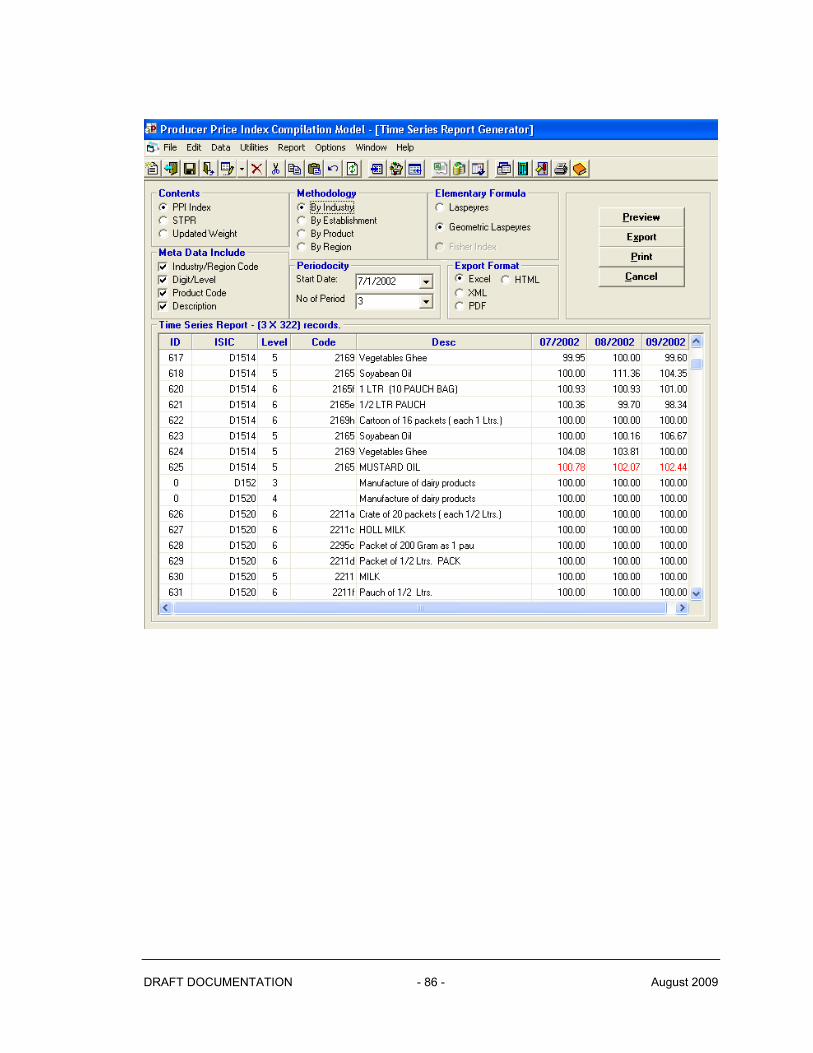
DRAFT DOCUMENTATION - 86 - August 2009
Chapter
6Suggested References
Producer Price Index Manual: Theory and Practice (2004), International Monetary Fund. http://www.imf.org/external/np/sta/tegppi/
CPC Version 1.1, Detailed Structure and Explanatory Notes,
http://unstats.un.org/unsd/cr/registry/regcst.asp?Cl=16 CPA, Detailed Structure and Explanatory Notes,
http://europa.eu.int/comm/eurostat/ramon/cpa_2002/cpa_2002_en.html ISIC Version 3.1, Detailed Structure and Explanatory Notes, http://unstats.un.org/unsd/cr/registry/regcst.asp?Cl=17&Lg=1
DRAFT DOCUMENTATION - 87 - August 2009

DRAFT DOCUMENTATION - 88 - August 2009
Index Add New, 43 Add New Product and Variety, 54 Add Product, 55 Average Price, 73, 74 Average Prices, 14 Base Period Weight, 6 Basics, 36 Batch Price Data Input, 59 Box Plots Method, 27 Chained Index, 82, 83 Chebyshev’s theorem, 7, 26 Compilation Method, 14 CPA, 5, 6, 14, 31, 37, 57, 87 CPC, 5, 6, 14, 31, 37, 57, 87 CPIs, 19, 21 Create Excel Sheet, 59 Cross Price Comparison, 71 Data Check, 75, 77 Data Diagnosis, 14 Data Status Indicator, 14, 75 Distribute Weights, 79 elementary formula, 37 Elementary Formulae, 14 Enter/Update Price, 62, 65, 71 Error Checks, 14 Estimate Base Price, 67 Geometric Laspeyres, 14 Global Impute Weights, 79 How the Quartile is Calculated, 27 imputation method, 37 Impute Missing Indices, 24 index compilation, 8, 75 Index Compilation, 82 Input Price, 59 Installation Procedures, 32
international price comparison, 12 ISIC, 6, 13, 31, 48, 87 Laspeyres, 14, 17, 18, 19, 20, 21, 22 Log-normal Method, 28 Long-Term Price Relatives. See LTPR Manual, 5, 87 matched observations, 7, 23, 24 Methodology, 16, 82 missing prices, 8, 14, 19 modified approach, 6 modified Laspeyres formula, 6 outlet, 13 outliers, 7, 25, 26, 27, 28 PPI, 5 Preview Data, 81 price index, 21, 23, 24 Price Index Processor, i, 5 Price Quotations, 12 price relatives, 7, 8, 15, 19, 20, 21, 22,
25 Producer Price Index Manual, 5 Reset Weight, 79 Sample Rotation, 79 Short-Term Price Relatives. See STPR status, 11, 14, 44, 77, 79 Status, 44 STPR, 15 System Configuration, 36 System Requirements, 31 Technical Overview, 8 Time Series, 65, 85 Transaction List, 57 unlock worksheet, 62 z-score, 7