Design Process. Design Process 1) generation Design Process 1) generation 2) selection.
1
PROCESS DESIGN IN AN INFORMATION-
INTENSIVE SERVICE DELIVERY SYSTEM:
AN EMPIRICAL STUDY
Submitted by
FREDERIC PONSIGNON
to the University of Exeter as a thesis for the degree of
DOCTOR OF PHILOSOPHY IN MANAGEMENT
March 2010
This thesis is available for Library use on the understanding that it is copyright material and that no quotation from the thesis may be published without proper acknowledgement. I certify that all material in this thesis which is not my own work has been identified and that no material has previously been submitted and approved for the award of a degree by this or any other University. …………………………………………… (Signature)
2
ABSTRACT The objective of this thesis is to explore the design of operational processes in
information-intensive service delivery systems. Empirical data is presented which
builds upon existing literature within the Business Process Management (BPM) and
Service Operations Management (SOM) disciplines. Adopting a theory building mode,
the thesis concludes with the formulation of several research propositions which specify
the design characteristics of the processes that provide the service concept to the
customer.
The research addresses a number of gaps in the literature. First, there is little empirical
evidence concerning the relationship between the service concept, customer inputs, and
process design. Second, service classification schemes promote homogeneous thinking
in the design of service systems delivering diverse service concepts. Third, the BPM
literature provides generic process design principles which offer limited theoretical
insights into the design requirements of operational processes. Finally, there is a need
for process design research in information-intensive service organisations.
A research framework that integrates theoretical models addressing service process
design is investigated using a single case study approach. Fieldwork was carried out
over a sixteen-month period in a large electricity supplier in the UK. In contrast to the
macro-orientation found within the literature, this study employs a more granular level
of analysis to address the unique requirements of ‘service concept – processes’ pairs.
This approach results in a number of important findings which, in several instances, are
in contradiction to current thinking. First, the results empirically validate the theoretical
relationship between service concept, customer inputs, and process design. Different
service concepts lead to different process designs, and the more customised the service
concept, the more the process is uniquely designed. Significant differences in the design
of the individual processes that collectively provide the service concept to the customer
are highlighted.
The results also provide some new insights into the design of front office – back office
activities as well as into the design characteristics of processes characterised by low
customer contact. In addition, the study refutes the view that generic process design
principles are universally applicable irrespective of the context in which the processes
operate. Finally, the research findings show that a process-based view of service
systems allows for heterogeneity; that is differences in the design of service delivery
processes within the same organisation.
3
ACKNOWLEDGEMENTS
Throughout the research I have benefited from the help and support of several people working at the University of Exeter and at the case company. I would particularly like to thank the following people. First and foremost, I would like to thank my supervisors, Andi and Roger. They offered me the opportunity to do the PhD in the first place and provided adequate financial support throughout the research period. Both of them were always available for a chat over a cup of coffee, they were happy to listen to my view of the world, they shared their expertise, and they offered their friendship. I would like to thank Phil Godsiff and Harry Maddern from the XSPO research group for our rich discussions about “service” and for insightful comments on the research at various stages in the project. Being part of a dynamic research group that includes talented and friendly individuals from various backgrounds was a truly rewarding experience. I also thank Carolyne Baker for making the research possible by opening doors at the case organisation. In addition, I would like to thank my good friends in Exeter, Sanjay, Paul, and James, who have provided a lot of entertainment and were there to keep me motivated and focused on my research in difficult times. I also thank Francine, our multi-talented assistant in the research group, for offering me accommodation and so much more in my last year in Exeter. My love, thanks and deepest gratitude go to my Mum and Dad for encouraging me to start this journey and sustaining me throughout. Finally, I should thank Aurélie for being there for me and for believing in me, as well as for letting me turn her flat into a PhD office for the past 6 months.
4
TABLE OF CONTENTS
Title page 1
Abstract 2
Acknowledgements 3
Table of contents 4
Publications 10
List of figures 11
List of tables 12
Chapter 1: INTRODUCTION 15
1.1 Introduction 15
1.2 Context and rationale for the research 15
1.2.1 The share of information-intensive services within the service economy 15
1.2.2 The process concept in operations management 17
1.2.3 Process design in the context of service operations 20
1.3 Research aims and objectives 21
1.4 Significance of the study 22
1.5 Organisation of the thesis 24
1.5.1 Chapter 2: Business Process Management literature review 25
1.5.2 Chapter 3: Service Operations Management literature review 26
1.5.3 Chapter 4: Research methodology 27
1.5.4 Chapter 5: Conceptual framework 27
1.5.5 Chapter 6, 7, and 8: Data analysis 27
1.5.6 Chapter 9: Discussion 28
1.5.7 Chapter 10: Implications and limitations 28
Chapter 2: PROCESS MANAGEMENT LITERATURE REVIEW 29
2.1 Introduction 29
2.2 Business Process Management 30
2.2.1 The emergence of Business Process Management 30
2.2.2 Defining Business Process Management 31
2.2.3 The promises of Business Process Management 32
5
2.3 The business process concept 35
2.3.1 Defining the business process concept 35
2.3.2 Characteristics of a business process 37
2.4 The concept of business process architecture 38
2.4.1 Defining the business process architecture 39
2.4.2 Categorising business processes 41
2.4.3 Focus on ‘operate’ processes 42
2.5 Business process design 45
2.5.1 The role of business process design 45
2.5.2 Principles of process design 45
2.5.3 Basics of business process modelling 48
2.5.4 IDEF-0: a technique for representing process architectures 49
2.6 Summary and conclusions 51
Chapter 3: SERVICE OPERATIONS LITERATURE REVIEW 53
3.1 Introduction 53
3.2 The Unified Services Theory (UST) 54
3.2.1 Different perspectives on service 54
3.2.1.1 The outcome-based view: the IHIP model 55
3.2.1.2 The all-encompassing view: the Service Dominant Logic 56
3.2.1.3 The process view: the Unified Services Theory 57
3.2.2 The relationship between customer inputs and process design 59
3.2.3 The UST: a bridge between SOM and the management literature 61
3.3 Service design 63
3.3.1 Models of strategic service alignment 63
3.3.2 Defining the service concept 65
3.3.3 Service delivery system design 66
3.3.3.1 Defining the service delivery system 66
3.3.3.2 Service system design issues 67
3.4 Process design in the SOM literature 68
3.4.1 Empirical studies on process design 68
3.4.2 Service blueprinting 70
3.5 Insights into process design from the manufacturing literature 71
6
3.5.1 Manufacturing-based frameworks for process design 72
3.5.2 Transferring manufacturing frameworks to service operations context 74
3.6 Service classification schemes 75
3.6.1 The role of service classification schemes 75
3.6.2 Overview of service classification schemes 76
3.6.2.1 The Customer Contact Model (CCM) 79
3.6.2.2 The service process matrix 81
3.6.2.3 The Service Process Model (SPM) 82
3.6.3 Design characteristics of service delivery systems 82
3.6.4 Critical assessment of service classifications 83
3.7 Summary and conclusions 85
3.8 Gaps, research objective, and research question 87
Chapter 4: RESEARCH METHODOLOGY 89
4.1 Introduction 89
4.2 Justification of the research philosophy 91
4.2.1 Discussion of the major research paradigms 91
4.2.2 The debate in operations management 95
4.2.3 Appropriateness of the realist paradigm 97
4.3 Justification for using a case study research design 100
4.4 Case selection and sampling 102
4.4.1 Defining the case organisation as an information-processing operation 103
4.4.2 Rationale for the selection of the case organisation 104
4.4.3 The units of analysis 105
4.4.4 Sampling logic for the embedded cases 106
4.5 Data collection process 107
4.6 Validity and reliability of the research 114
4.6.1 Construct validity and confirmability 115
4.6.2 Internal validity and credibility 115
4.6.3 External validity and transferability 116
4.6.4 Reliability and dependability 117
4.7 Ethical considerations 117
7
Chapter 5: CONCEPTUAL FRAMEWORK 119
5.1 Introduction 119
5.2 Conceptual framework 119
5.3 Operational definitions 122
5.3.1 Service concept 122
5.3.2 Customer inputs 125
5.3.3 Process design characteristics 126
5.3.3.1 Employee skills 129
5.3.3.2 Employee discretion 130
5.3.3.3 Task routineness 131
5.3.3.4 Automation 132
5.3.3.5 Front office (FO) – back office (BO) configurations 133
5.3.3.6 Location 133
5.3.3.7 Efficiency 134
5.3.3.8 Responsiveness 134
Chapter 6: DATA ANALYSIS: METHOD AND CONCEPTUAL MODEL
OF THE SERVICE DELIVERY SYSTEM 135
6.1. Introduction 135
6.2. Data analysis method 135
6.2.1. Document and code data 138
6.2.2. Organise data 142
6.2.3. Characterisation of cases across research variables 142
6.2.4. Validating the results 144
6.3. Conceptual model of the service delivery system 144
6.3.1. Overview of the service delivery system 144
6.3.2. Case oriented process models 146
6.3.2.1. Case A: “default” service concept 146
6.3.2.2. Case B: “standard” service concept 148
6.3.2.3. Cases C and D: “flexible” and “bespoke” service concepts 150
8
Chapter 7: DATA ANALYSIS: SERVICE CONCEPT AND CUSTOMER
INPUTS 154
7.1. Analysis of service concept data 154
7.1.1. Methodology 154
7.1.2. Overview of results 155
7.1.3. Degree of complexity of the service offering 156
7.1.4. Customer contact strategy 159
7.2. Analysis of customer inputs 161
7.2.1. Methodology 161
7.2.2. Overview of results 163
7.2.3. Customer inputs supplied to the ‘sell service’ processes 164
7.2.3.1. Type of customer inputs 164
7.2.3.2. Request variability 165
7.2.3.3. Arrival rate variability 166
7.2.3.4. Quantity of information 168
7.2.4. Customer inputs supplied to the ‘deliver service’ processes 170
7.2.4.1. Type of customer inputs 170
7.2.4.2. Request variability 170
7.2.4.3. Arrival rate variability 170
7.2.4.4. Quantity of information 172
Chapter 8: DATA ANALYSIS: PROCESS DESIGN CHARACTERISTICS 173
8.1. Methodology 173
8.2. Design characteristics of the ‘sell service’ processes 175
8.2.1. Task routineness 177
8.2.2. Automation 180
8.2.3. Employee skills 182
8.2.4. Employee discretion 184
8.2.5. Location 186
8.2.6. Front Office (FO) – Back Office (BO) configurations 187
8.2.7. Efficiency 188
8.2.8. Responsiveness 190
9
8.2.9. Summary of results for ‘sell service’ processes 191
8.3. Design characteristics of the ‘deliver service’ processes 192
8.3.1. Task routineness 194
8.3.2. Automation 196
8.3.3. Employee skills 198
8.3.4. Employee discretion 200
8.3.5. Location 201
8.3.6. Front Office (FO) – Back Office (BO) configurations 202
8.3.7. Efficiency 202
8.3.8. Responsiveness 204
8.3.9. Summary of results for ‘deliver service’ processes 205
Chapter 9: DISCUSSION 206
9.1. Introduction 206
9.2. Summary of findings
9.2.1. The relationship between service concept, customer inputs,
and process design characteristics 206
9.2.2. Differences in the design characteristics of interrelated ‘sell service’
and ‘deliver service’ processes 208
9.3. Discussion 210
9.3.1. Aligning service concept and customer inputs with process design 210
9.3.2. Process design characteristics 213
9.3.2.1. Design characteristics of the ‘sell service’ processes 213
9.3.2.2. Design characteristics of the ‘deliver service’ processes 220
9.3.3. Principles of business process design 225
Chapter 10: IMPLICATIONS AND LIMITATIONS 229
10.1. Introduction 229
10.2. Implications of the findings for theory 229
10.2.1. Empirical support for the theoretical relationship of service
design elements 229
10
10.2.2. Differences in the design of the individual ‘operate’ processes
that collectively provide the service concept to the customer 231
10.2.3. New insights into front office – back office configurations 232
10.2.4. New insights into the design characteristics of low-contact processes 233
10.2.5. Benefits from a process-based view of the service delivery system 235
10.2.6. Refuting generic principles of business process design 236
10.3. Implications of the findings for practice 238
10.4. Limitations of the research 240
10.5. Further research 242
REFERENCES 245
APPENDICES
Appendix 4A Case selection 259
Appendix 4B Case study protocol 262
Appendix 4C List of employees interviewed 267
Appendix 4D List of documents collected 268
Appendix 7A Coding items for the service concept variables 270
Appendix 7B Coding items for the customer input variables 276
Appendix 8A Coding items for the process design variables (‘sell service’) 283
Appendix 8B Coding items for the process design variables (‘deliver service’) 296
Appendix 8C Calculation details for flexible contracts 307
Appendix 8D Flowcharts of ‘deliver service’ processes 310
PUBLICATIONS
Publication 1 Service delivery systems: a business process perspective 316
Publication 2 Towards a Set of Principles for Process Design in
Information-Intensive Service Delivery Systems 330
11
LIST OF FIGURES
Figure 1.1: The input-output transformation model 15
Figure 1.2: Overview of research process 25
Figure 2.1: A business process in a functional organisation 33
Figure 2.2: The development of process perspectives 35
Figure 2.3: An integrated model of BPM 38
Figure 2.4: Typical levels in a hierarchical process architecture 40
Figure 2.5: A process classification framework 41
Figure 2.6: ‘Operate’ processes in the architecture 43
Figure 2.7: Classification of process modelling techniques 49
Figure 3.1: A service process based on the UST 59
Figure 3.2: The service strategy triad 63
Figure 3.3: The product-process matrix: matching product and process types 73
Figure 3.4: The service process matrix 81
Figure 4.1: The research onion 90
Figure 4.2: Positioning service concepts on the customisation continuum 107
Figure 4.3: Data collection framework 108
Figure 4.4: Information that should be collected about the process 109
Figure 4.5: Tracing the evidence: going forward and backwards 115
Figure 5.1: Conceptual framework 120
Figure 5.2: A process-based view of the service delivery system 121
Figure 5.3: Detailed view of the research framework 122
Figure 5.4: Theoretical model of the process rigidity-fluidity construct 129
Figure 6.1: The process of data analysis in this thesis 137
Figure 6.2: The operation of a diagram in IDEF-0 139
Figure 6.3: Conceptual model of the service delivery system 145
Figure 6.4: Case A – ‘Sell service’ process (A1) 147
Figure 6.5: Case A – ‘Deliver service’ process (A2) 148
Figure 6.6: Case B – ‘Sell service’ process (A1) 149
Figure 6.7: Case B – ‘Deliver service’ process (A2) 150
Figure 6.8: Cases C and D - ‘Sell service’ process (A1) 151
Figure 6.9: Cases C and D - ‘Deliver service’ process (A2) 152
Figure 6.10: Cases C and D - ‘Produce bills manually’ sub-process (A23) 153
Figure 7.1: Degree of customisation of selected service concepts 155
12
Figure 8.1: Case A - Conceptual model of the ‘sell service’ process 176
Figure 8.2: Case B - Conceptual model of the ‘sell service’ process 176
Figure 8.3: Case C - Conceptual model of the ‘sell service’ process 176
Figure 8.4: Case D - Conceptual model of the ‘sell service’ process 177
Figure 8.5: Case A - Conceptual model of the ‘deliver service’ process 192
Figure 8.6: Case B - Conceptual model of the ‘deliver service’ process 193
Figure 8.7: Case C - Conceptual model of the ‘deliver service’ process 193
Figure 8.8: Case D - Conceptual model of the ‘deliver service’ process 193
Figure 9.1: Data analysis results 207
Figure 10.1: Process design characteristics in an information-intensive service
delivery system 230
LIST OF TABLES
Table 1.1: The service industry as a percentage of GDP around the world 15
Table 1.2: Share of service-related articles in OM journals 16
Table 2.1: The traditional versus the process enterprise 33
Table 2.2: Business process characteristics 37
Table 2.3: Ten popular best practices in business process design 46
Table 3.1: An overview of service classification schemes 79
Table 3.2: Design characteristics of different delivery systems 83
Table 4.1: Assumptions associated with research paradigms 92
Table 4.2: Implications of deduction and induction for research 94
Table 4.3: Research methods in Operations Management 96
Table 4.4: Scientific paradigms: implications for research 98
Table 4.5: Assessing the reliability and validity of case study research 100
Table 4.6: Initial assessment of the number of customers processed 112
Table 5.1: Definition of the dimensions of the service concept variable 123
Table 5.2: Definition of the dimensions of the customer input variable 126
Table 5.3: Process design: issues and characteristics 127
Table 5.4: Design characteristics of rigid and fluid processes 128
Table 5.5: Definition of the dimensions of the rigidity-fluidity construct 129
Table 6.1: IDEF-0 Methodology 139
Table 6.2: The service concept coding category 141
13
Table 6.3: The customer inputs coding category 141
Table 6.4: The process design characteristics coding category 141
Table 7.1: Discrete pieces of code for the service concept variables 154
Table 7.2: Template for the analysis of service concept data 155
Table 7.3: Service concept - Summary of results 156
Table 7.4: Results of data analysis - Degree of complexity 156
Table 7.5: Degree of complexity – ‘COMPL’ coding items 158
Table 7.6: List of options available per service concept 158
Table 7.7: Results of data analysis - Customer contact strategy 159
Table 7.8: Customer Contact Strategy - ‘CONTSTRAT’ coding item 161
Table 7.9: Discrete pieces of code for the customer input variable 162
Table 7.10: Template for the analysis of customer inputs data 162
Table 7.11: Results of analysis – Customer inputs (‘sell’ processes) 163
Table 7.12: Results of analysis – Customer inputs (‘deliver’ processes) 163
Table 7.13: Type of inputs – ‘TYPINP’ coding items 165
Table 7.14: Request variability – ‘VARINP’ coding items 166
Table 7.15: Results of analysis - Arrival rate variability 167
Table 7.16: Results of analysis - Quantity of information 169
Table 7.17: Quantity of information – ‘INFQUANT’ coding items 169
Table 7.18: Number of sites and site profiles 171
Table 7.19: Results of analysis - Arrival rate variability 172
Table 7.20: Results of analysis - Quantity of information 172
Table 8.1: Coding items for process design variables (‘sell’ processes) 173
Table 8.2: Coding items for process design variables (‘deliver’ processes) 173
Table 8.3: Template for the analysis of process design data 175
Table 8.4: Results of data analysis - Task routineness 177
Table 8.5: Task routineness – ‘ROUT’ coding items 179
Table 8.6: Results of data analysis – Automation 180
Table 8.7: Automation – ‘AUTO’ coding items 182
Table 8.8: Results of data analysis - Employee skills 182
Table 8.9: Skills – ‘SKI’ coding items 183
Table 8.10: Results of data analysis - Employee discretion 184
Table 8.11: Employee discretion – ‘DISC’ coding items 186
Table 8.12: Location – ‘LOC’ coding items 186
Table 8.13: Results of data analysis - FO-BO configuration 187
14
Table 8.14: FO-BO configurations – ‘FOBO’ coding items 188
Table 8.15: Results of data analysis - Efficiency 189
Table 8.16: Efficiency – ‘COST’ coding items 190
Table 8.17: Results of data analysis – Responsiveness 190
Table 8.18: Responsiveness – ‘RESP’ coding items 191
Table 8.19: Degree of rigidity-fluidity - ‘Sell service’ processes 192
Table 8.20: Results of data analysis - Task routineness 194
Table 8.21: Task routineness – ‘ROUT’ coding items 196
Table 8.22: Results of data analysis – Automation 196
Table 8.23: Automation – ‘AUTO’ coding items 198
Table 8.24: Results of data analysis - Employee skills 198
Table 8.25: Skills – ‘SKI’ coding items 199
Table 8.26: Results of data analysis - Employee discretion 200
Table 8.27: Employee discretion – ‘DISC’ coding items 201
Table 8.28: Results of data analysis – Efficiency 203
Table 8.29: Efficiency – ‘COST’ coding items 203
Table 8.30: Results of data analysis - Responsiveness 204
Table 8.31: Degree of rigidity-fluidity - ‘Deliver service’ processes 205
Table 9.1: Definition of four principles of business process design 226
15
CHAPTER 1
INTRODUCTION
1.1. Introduction
This chapter introduces the topic and scope of this research and explains the structure of
the thesis. Section 1.2 describes the research context and outlines the rationale for the
research. Section 1.3 describes the aims and objectives of the research. Section 1.4
considers the significance of the study. Section 1.5 outlines the organisation of the
thesis and summarises the remaining chapters.
1.2. Context and rationale for the research
1.2.1. The share of information-intensive services within the service economy
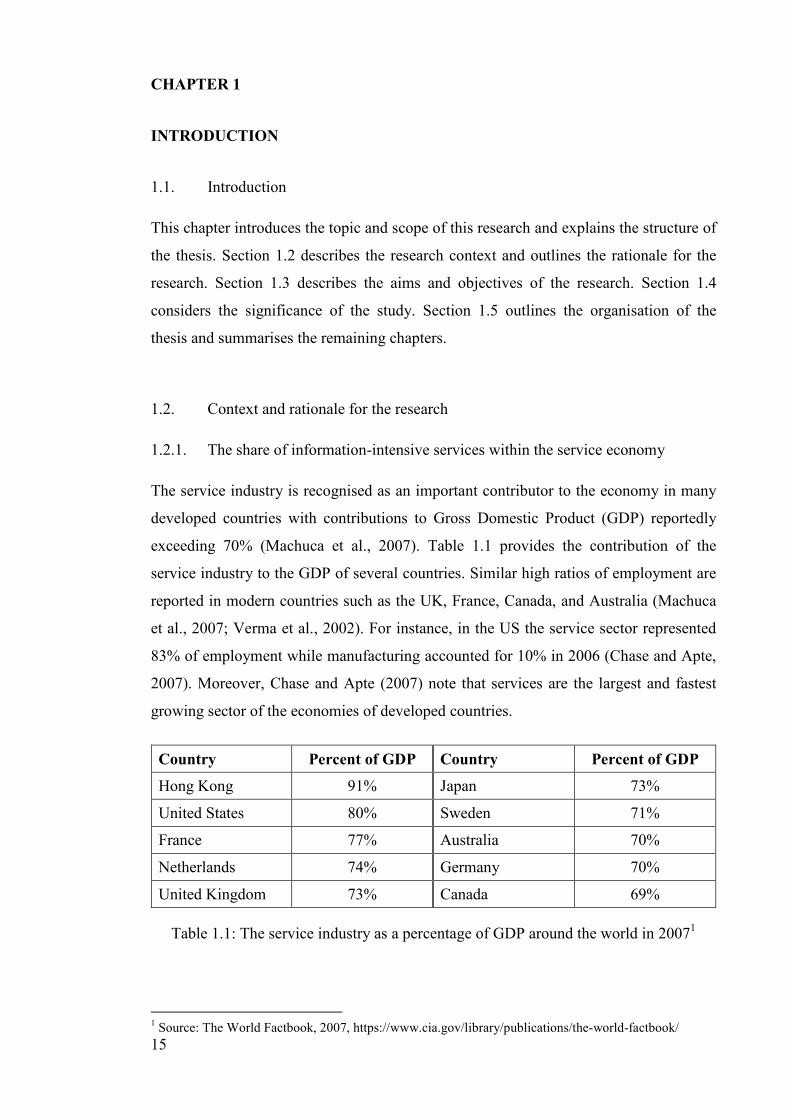
The service industry is recognised as an important contributor to the economy in many
developed countries with contributions to Gross Domestic Product (GDP) reportedly
exceeding 70% (Machuca et al., 2007). Table 1.1 provides the contribution of the
service industry to the GDP of several countries. Similar high ratios of employment are
reported in modern countries such as the UK, France, Canada, and Australia (Machuca
et al., 2007; Verma et al., 2002). For instance, in the US the service sector represented
83% of employment while manufacturing accounted for 10% in 2006 (Chase and Apte,
2007). Moreover, Chase and Apte (2007) note that services are the largest and fastest
growing sector of the economies of developed countries.
Country Percent of GDP Country Percent of GDP
Hong Kong 91% Japan 73%
United States 80% Sweden 71%
France 77% Australia 70%
Netherlands 74% Germany 70%
United Kingdom 73% Canada 69%
Table 1.1: The service industry as a percentage of GDP around the world in 20071
1 Source: The World Factbook, 2007, https://www.cia.gov/library/publications/the-world-factbook/
16
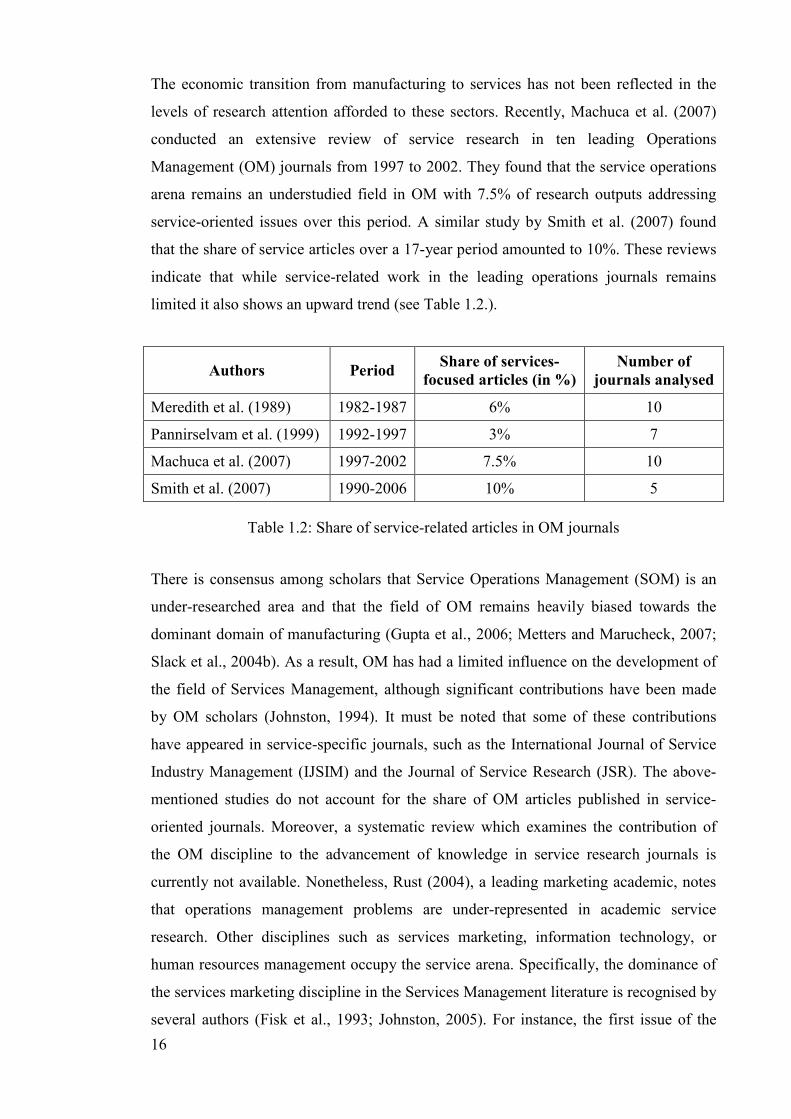
The economic transition from manufacturing to services has not been reflected in the
levels of research attention afforded to these sectors. Recently, Machuca et al. (2007)
conducted an extensive review of service research in ten leading Operations
Management (OM) journals from 1997 to 2002. They found that the service operations
arena remains an understudied field in OM with 7.5% of research outputs addressing
service-oriented issues over this period. A similar study by Smith et al. (2007) found
that the share of service articles over a 17-year period amounted to 10%. These reviews
indicate that while service-related work in the leading operations journals remains
limited it also shows an upward trend (see Table 1.2.).
Authors Period Share of services-
focused articles (in %)
Number of
journals analysed
Meredith et al. (1989) 1982-1987 6% 10
Pannirselvam et al. (1999) 1992-1997 3% 7
Machuca et al. (2007) 1997-2002 7.5% 10
Smith et al. (2007) 1990-2006 10% 5
Table 1.2: Share of service-related articles in OM journals
There is consensus among scholars that Service Operations Management (SOM) is an
under-researched area and that the field of OM remains heavily biased towards the
dominant domain of manufacturing (Gupta et al., 2006; Metters and Marucheck, 2007;
Slack et al., 2004b). As a result, OM has had a limited influence on the development of
the field of Services Management, although significant contributions have been made
by OM scholars (Johnston, 1994). It must be noted that some of these contributions
have appeared in service-specific journals, such as the International Journal of Service
Industry Management (IJSIM) and the Journal of Service Research (JSR). The above-
mentioned studies do not account for the share of OM articles published in service-
oriented journals. Moreover, a systematic review which examines the contribution of
the OM discipline to the advancement of knowledge in service research journals is
currently not available. Nonetheless, Rust (2004), a leading marketing academic, notes
that operations management problems are under-represented in academic service
research. Other disciplines such as services marketing, information technology, or
human resources management occupy the service arena. Specifically, the dominance of
the services marketing discipline in the Services Management literature is recognised by
several authors (Fisk et al., 1993; Johnston, 2005). For instance, the first issue of the
17
Journal of Services Marketing, which is entirely dedicated to the practice of marketing
in service organisations, was published in 1987. This illustrates the gap between
research and practice in OM and the lack of service research from an operations
perspective.
Similarly, the growing importance of information-based service organisations in the
economic landscape contrasts with the share of SOM research dedicated to these
contexts. Within the dominant service industry, companies focused on the provision of
information-intensive services make up a group which contributes a large proportion of
GDP. For instance, Karmarkar and Apte (2007) estimate that information-intensive
service organisations represented over 50% of the GDP of the United States in 1997.
Given this contribution it is disconcerting to observe that SOM research appears to have
neglected this segment of the service sector in favour of restaurants, hotels,
transportation, and parcel delivery services (Karmarkar and Apte, 2007). This argument
resonates with Machuca et al. (2007) who report that research in information-intensive
service contexts represented less than 25% of SOM research between 1997 and 2002.
For instance, the authors lament the fact that the sectors of financial services and
telecommunications only account for 9.4% and 6.9% of research respectively. A
previous study by Mabert (1982) produced similar findings. Other authors have
reinforced these views by specifically highlighting the contrast between the economic
significance of financial services and the relative paucity of research in this sector
(McCabe, 2000; Narasimhan and Jayaram, 1998). Karmarkar and Apte (2007) argue
that there are significant difficulties in applying existing, manufacturing-based concepts
and techniques in information-intensive service organisations. This leads them to
suggest that more research on traditional OM topics such as performance management,
process design, planning and capacity management, operations strategy, and quality
management is needed in these environments.
1.2.2. The process concept in operation management
Since this work is concerned with process design, it is important to examine the process
concept. For some researchers the process concept is firmly rooted in OM (Fowler,
1999; Silver, 2004). From this perspective, all operations are input-transformation-
output processes (Slack and Lewis, 2005). The role of operations management is to
evaluate the activities that transform inputs into desired outputs in the production,
18
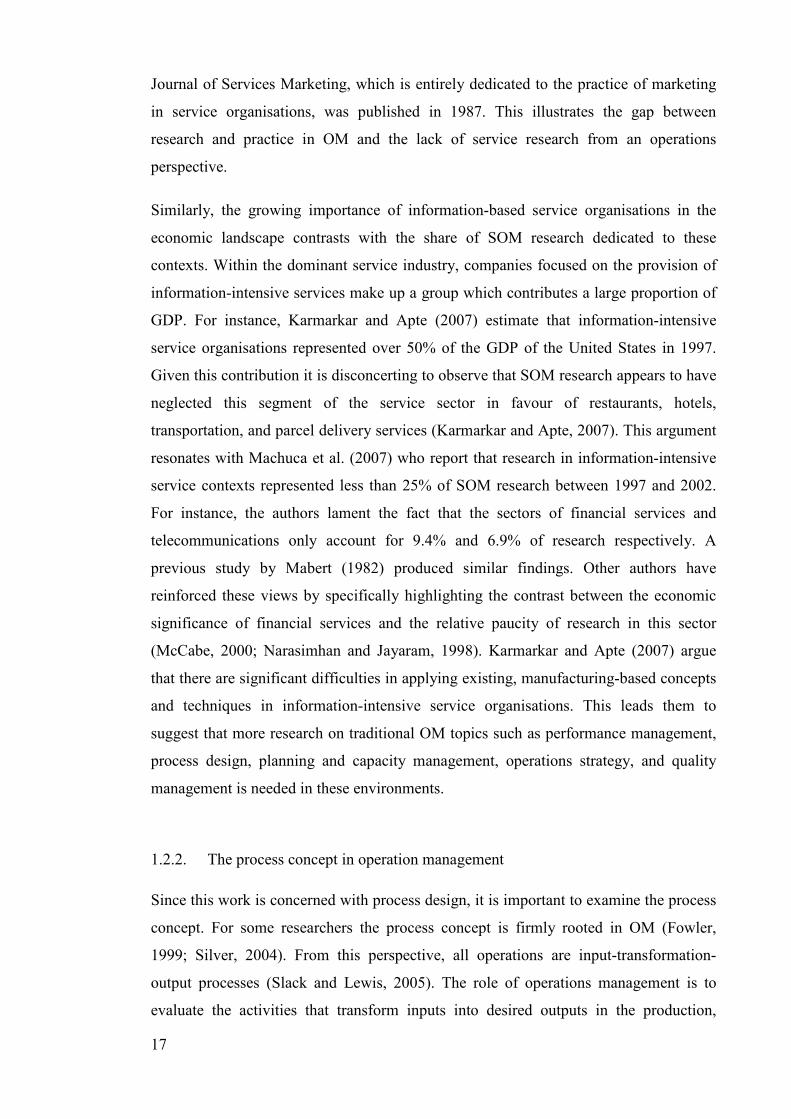
value-adding process (Bayraktar et al., 2007; Chopra et al., 2004). This view resonates
with earlier works in organisation theory which conceptualise organisations as open
systems that transform inputs into outputs (Katz and Khan, 1966; Miller and Rice,
1967). Figure 1.1 illustrates this widely-accepted perspective (Slack et al., 2004a).
Transformed
resources:
• Materials
• Information
• Customers
Transforming
resources:
• Facilities
• Staff
Input ResourcesOutputs products
and services
THE
TRANSFORMATION
PROCESS
Customers
Figure 1.1: The input-output transformation model
A definition of information-intensive service operations can be grounded in the input-
transformation-output model. According to Morris and Johnston (1987) there are three
basic entities that can be transformed in a process: materials, information, and
customers. These authors identify three broad categories of operations based on the
transformation which is said to be “dominant”: Material-Processing Operations (MPO),
Customer-Processing Operations (CPO), and Information-Processing Operations (IPO).
The concept of “dominance” relates to the purpose of the core, value-adding
transformation process. Put simply, it is about what an organisation does. Most
manufacturing operations are categorised as MPO as they primarily transform materials
into goods (Morris and Johnston, 1987). Service operations can be of all three types.
Hospitals are CPO as they transform patients into healthy people. Telecommunication
companies are IPO as they transform information from one place to another. Shipping
services are MPO as they change the location of materials from one place to another.
The terms “information-intensive” and “information-processing” are used
19
interchangeably in this work to characterise operations which are primarily concerned
with transforming information inputs.
Using the transformation model to classify operations is helpful. The challenges of
operations management are likely to differ significantly across these three broad
categories because the nature of what gets processed is different (Lovelock and Wirtz,
2004; Morris and Johnston, 1987; Wemmerloev, 1990). Operations practices such as
process design, inventory management, quality management, and capacity planning are
likely to require different managerial decision making in each category. However, the
implications of differentiating these categories for operations management have not
been fully explored. For instance, Morris and Johnston (1987) discuss the differences
between MPO and CPO but do not directly address IPO. These authors suggest that IPO
make up a homogeneous group but fail to articulate their distinctive characteristics. It
may be argued that this MPO-CPO dichotomy is reflected in the literature. The majority
of the OM literature has focused on manufacturing operations (i.e. MPO) (Machuca et
al., 2007; Pannirselvam et al., 1999) and the SOM literature has primarily focused on
customer-processing operations (Johnston, 1999; Slack et al., 2004b). This provides
further support for the view that more OM research is needed in information-intensive
service organisations.
While process is central to OM, significant interest in process also exists in other
disciplines. Researchers point to the emergence of a strategic approach to the
management of end-to-end processes, called Business Process Management (BPM). It is
arguable that process has provided the main focus for BPM which takes as its subject of
enquiry the coherent and integrated approach to process management found in many
organisations today (Armistead et al., 1999; Lee and Dale, 1998). This framework for
analysing process management is different from the process perspective found within
Operations Management. The business activity investigated through the BPM literature
is a relatively recent phenomenon and research is in its infancy. In spite of this relative
academic immaturity, the BPM literature offers valuable insights into current thinking
around the process concept. The BPM literature is reviewed in Chapter 2.
20
1.2.3. Process design in the context of service operations
The importance of the topic of process design is firmly established within the services
literature. Since an organisation’s value proposition is delivered to the customer through
the service process, it is arguable that a well-designed process is a driver of competitive
advantage. This link between process design and value delivery has been postulated by
many scholars (Frei and Harker, 1999; Roth and Menor, 2003b; Verma et al., 2002).
This may be summarised further by the assertion by Hammer (2007) that process design
determines performance.
The relationship between process design, customer satisfaction, customer loyalty, and
profitability has been highlighted by several authors. The purpose of service design is to
develop processes that consistently deliver high quality service outcomes to drive
customer satisfaction and customer retention (Johnston and Clark, 2005). Mayer et al.
(2003) point out that service firms need to get process design right because the result of
a service process is that the customer is satisfied or dissatisfied with service delivery.
The well-established service profit chain model (Heskett et al., 1994), in turn, links
customer satisfaction and retention to profitability. It posits that profit and growth are
stimulated primarily by customer loyalty, and that loyalty is a direct result of customer
satisfaction. Empirical research has broadly supported these linkages (Anderson and
Mittal, 2000; Bloemer and Kasper, 1995; Ittner and Larcker, 1998; Reichheld and
Sasser, 1990). These research findings resonate with the world of practice as OM
professionals ranked process design 6th out of 16 in response to the question “assess the
impact of this subject on overall business performance” (Slack et al., 2004b).
In general, operational issues that relate to the creation and delivery of services have not
been sufficiently explored (Wright and Mechling, 2002). Despite the importance of
process design in the context of service operations, a number of scholars have voiced
concerns about the paucity of research in this area (Balasubramanian and Gupta, 2005;
Fisk et al., 1993; Johnston, 1999; Kwortnik and Thompson, 2009; Tax and Stuart,
1997). For instance, Hill et al. (2002, p.197) lament the dominance of the practitioner-
focused literature: “a review of the ‘re-engineering’ and ‘service process design’
literatures finds thousands of ‘how-to’ managerial articles and company testimonials,
but surprisingly few articles published in academic journals”. This is consistent with the
results of a study by Slack et al. (2004b) who report that process design accounted for
less than 3% of the published papers in the International Journal of Operations and
21
Production Management (IJOPM) over the 2000-2003 period. Since the share of
service-oriented articles in the sample of articles studied was less than 20%, this gives
an idea of the limited research devoted to process design topics in a service context.
While many authors have recognised that current theory in process design in a service
context is limited, it would seem that the field of SOM is moving in the right direction.
A survey of OM academics conducted by Nie and Kellogg (1999) placed the topic of
service design in second place in a SOM research agenda. These authors note that this
area “needs a considerable amount of research attention” (p. 350). A recent study by
Machuca et al. (2007) found that service system design has become a relatively popular
topic in SOM research. Articles dealing with the design of the service delivery system
represented 9.3% of SOM research in the 1997-2002 period. Many OM scholars see
service design as one of the key areas to address and encourage researchers to focus
their efforts on this topic (Chase, 1996; Chopra et al., 2004; Hill et al., 2002; Johnston,
1999). Roth and Menor (2003b), in particular, call on researchers to investigate service
design issues through an operations management lens. This work responds to that call.
More specifically, this thesis examines process design issues in the context of
information-intensive service delivery systems.
Rigorous research seeks to build upon existing knowledge (Eisenhardt, 1989;
Schmenner, 1986). This research considers current frameworks and models that are
relevant to the topic of service process design from an operations perspective. The thesis
is informed by two main bodies of literature: Business Process Management and
Service Operations Management which are reviewed in detail in Chapters 2 and 3
respectively.
1.3. Research aims and objectives
The service process design problem is to develop processes that enable customers'
demands to be met in an effective way. The need for process design research in
information-intensive service organisations was noted in Section 1.2. In addition, there
are a number of gaps in the existing literature addressing process design in a service
environment. These gaps were identified through a review of the existing BPM and
SOM literature which can be found in Chapter 2 and Chapter 3 respectively. The BPM
literature provides generic business process design principles which offer limited
theoretical insights into the design requirements of operational processes. The SOM
22
literature is dominated by conceptual models emphasising the relationship between the
service concept, customer inputs, and process design characteristics. However, there is
little empirical evidence concerning the relationship between these elements. Moreover,
macro-oriented service classification schemes do not directly consider the operational
processes through which service concepts are provided to customers. High-level service
classifications promote homogeneous thinking in the design of large service delivery
systems which provide different service concepts to different target markets. To
summarise, the literature provides little assistance in specifying the specific design
characteristics of operational processes that provide different service concepts to
different customers. These gaps provide the basis for the objective of this research:
• To explore the design characteristics of operational processes in information-
intensive service delivery systems.
The objective of the study is researched using a theory-building approach. The
following research question is formulated and addressed empirically:
• What are the design characteristics of service delivery processes in an
information-intensive service system?
To address this research question, the relationship between service concepts, customer
inputs, and process design characteristics in an information-intensive service system is
explored and analysed empirically.
1.4. Significance of the study
Clearly the design of processes is a significant challenge particularly within the fast-
growing context of information-intensive service organisations. There is a need for
greater insight into process design in service environments, and recognition within the
academic community that Service Operations Management research has not adequately
addressed practitioner concerns. This research seeks to redress this imbalance through
robust theoretical analysis.
Addressing the research question provided contributions that will be presented in
Section 10.4. Several research propositions which specify the design characteristics of
the operational processes that provide the service concept to the customer are
23
formulated. In summary this research makes six contributions to the existing body of
knowledge.
First, empirical support was found for the theoretical relationship between service
concept, customer inputs, and process design characteristics. Therefore, this research
strongly suggests that process design characteristics are contingent on the degree of
customisation of the service concept and on the type and variability of customer inputs.
Different service concepts lead to different process designs and the more customised the
service concept, the more the process is uniquely designed. A set of design
characteristics for operational processes that deliver different service concepts in an
information-intensive service system is provided.
Second, this study extends existing SOM theory which had focused on the design
characteristics of single, individual service delivery processes. The research findings
show that the design characteristics of each of the individual processes that collectively
provide the service concept are significantly different. Specifically, design
characteristics in the ‘sell service’ process, such as employee skills, automation, and
employee discretion, are different to those in the ‘deliver service’ process. As a result of
these differences, it is argued that process design research must consider the design of
each of the individual processes that work together to provide a service concept to the
customer.
Third, the study extends existing theory related to the design of front-office and back-
office activities. The results strongly suggest that it is viable for a large organisation to
adopt different front office – back office configurations simultaneously in the service
system. The results show that the front office – back office design decision is made at
process level and in accordance with the service concept.
Fourth, the study refutes the view that business process design principles described in
the BPM literature are universally applicable regardless of the context in which
processes operate. The findings of this research strongly suggest that process design
principles are not acontextual. It is arguable that prescribing a universal approach to the
design of all service delivery processes is misleading.
Fifth, this study provides new insights into the design characteristics of processes
characterised by low customer contact. The results provide empirical evidence that the
importance of efficiency is not consistent across all low-contact processes. It is
24
empirically shown that low-contact processes for customised service concepts are less
efficient than low-contact processes for standardised service concepts. This finding
refines existing, traditional SOM theory which states that processes characterised by
low customer contact form a homogeneous group and are likely to be equally efficient.
Finally, in contrast to the macro-orientation of service classifications, this study
employs a more granular level of analysis to address the requirements of ‘service
concept – processes’ pairs in the service system. The findings provide evidence that the
entire service system is too gross a unit of analysis because information-intensive
service systems do not fit a single, homogeneous classification. This suggests that high-
level service classifications may be misleading since they promote homogeneous
thinking in the design of service delivery systems. Based on the findings, it may be
argued that designing a service delivery system requires the consideration of the
architecture of processes that provide diverse service concepts to customers. A process-
based view of service systems is important because it allows for heterogeneity; that is
differences in the design of service delivery processes within the same organisation.
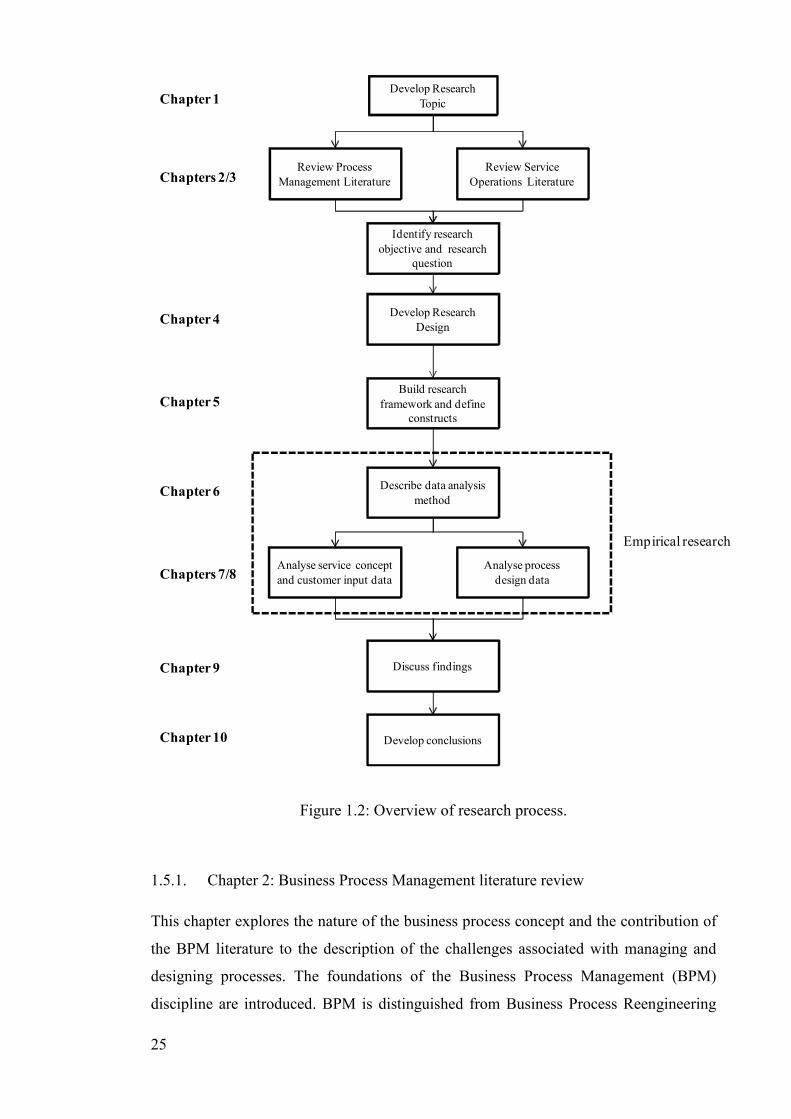
1.5. Organisation of the thesis
The thesis is presented in ten chapters as illustrated in Figure 1.2. This section outlines
the content of the chapters that form the remainder of this thesis.
25
Develop Research
Topic
Review Process
Management Literature
Review Service
Operations Literature
Develop Research
Design
Identify research
objective and research
question
Describe data analysis
method
Discuss findings
Empirical research
Chapter 6
Chapter 9
Chapters 2/3
Chapter 1
Chapter 4
Build research
framework and define
constructs
Chapter 5
Analyse process
design data
Analyse service concept
and customer input dataChapters 7/8
Chapter 10 Develop conclusions
Figure 1.2: Overview of research process.
1.5.1. Chapter 2: Business Process Management literature review
This chapter explores the nature of the business process concept and the contribution of
the BPM literature to the description of the challenges associated with managing and
designing processes. The foundations of the Business Process Management (BPM)
discipline are introduced. BPM is distinguished from Business Process Reengineering
26
(BPR) and the potential benefits associated with adopting a BPM mindset are provided.
A distinction is made between the concept of process as defined in OM and the concept
of business process. In addition, the key characteristics of a business process are
identified. This leads into a discussion about the concept of a process architecture which
is seen as a means for understanding the organisation from a business process
perspective. Within a generic architecture, business processes can be categorised into
three groups of ‘manage’, ‘operate’ and ‘support’ processes based on a well-accepted
classification scheme. Attention is paid to models that help to identify and describe the
operational processes of an organisation. This is followed by a discussion about
business process design. While the literature describes generic principles for business
process design, the paucity of research in this area is highlighted, particularly in relation
to ‘operate’ processes. Finally, the chapter ends with a description of business process
modelling techniques.
1.5.2. Chapter 3: Service Operations Management literature review
This chapter explores the service operations literature that is relevant to process design.
This chapter starts by considering different definitions of service. The Unified Services
Theory (UST) is described as a useful conceptualisation of service from an operations
management perspective. Support for the theoretical underpinning of the UST is
identified in several empirical studies examining the link between input uncertainty and
service system complexity. Conceptual models of strategic service alignment are
examined. Both the service concept and the service delivery system are described based
on the existing literature. In addition, a process-centric conceptualisation of the service
delivery system is suggested. This is followed by a critical assessment of empirical
studies that focus on process design as well as an examination of process mapping
techniques. Two important works addressing the design of manufacturing processes are
examined and the transferability of these frameworks to service operations contexts is
discussed. This leads into a description of service classification schemes. Important
design characteristics located in service classification schemes are identified and three
major service classification schemes are examined in detail. Moreover, the link between
service classifications and process design is examined carefully. Finally, this chapter
concludes by highlighting a number of gaps in the BPM and SOM literatures. These
gaps provide the basis for the main objective of the research. A research question is
formulated to address the objective of the study.
27
1.5.3. Chapter 4: Research methodology
This chapter describes and justifies the research methodology. The chapter aims to
provide assurance that appropriate methods and techniques were used throughout the
research project. Consideration is given to the philosophical underpinnings of
knowledge production, and two main scientific paradigms are identified. The relative
strengths and weaknesses of positivism and phenomenology are outlined. The affinity
of this research with the realist paradigm is then described. This is followed by a
presentation and justification of the research design. It is argued that a single case study
is both an appropriate and desirable approach for this research. The criteria for case
selection, the description of the case organisation as an information-processing
operation, the sampling logic for the embedded cases, and the units of analysis of the
research are explicated. This is followed by a description of the data collection
framework that was used in the empirical phase of the research. Finally, issues of
validity, reliability, and ethics are addressed.
1.5.4. Chapter 5: Conceptual framework
This chapter introduces the conceptual framework that is used to address the research
question and to guide data collection and data analysis. The variables that comprise the
research framework are defined.
1.5.5. Chapters 6, 7, and 8: Data analysis
These chapters report the empirical research carried out to address the research
question. They describe how empirical data was analysed and present the results of the
data analysis. Findings are presented in three chapters. Chapter 6 provides the detailed
techniques employed to analyse the data and presents a conceptual model of the service
delivery system of the case organisation. Chapter 7 presents the findings related to the
service concept and to the customer input variables. Chapter 8 presents the findings
related to the process design variables.

28
1.6. Chapter 9: Discussion
In this chapter, the findings from the data analysis chapters are discussed within the
context of existing literature to address the research question.
1.7. Chapter 10: Implications and limitations
This research provides new knowledge to the academic and business communities and
this contribution is discussed. Several research propositions which specify the design
characteristics of the operational processes that provide the service concept to the
customer are formulated. In addition, the main limitations of the research are
considered. The chapter concludes by identifying further research opportunities.
29
CHAPTER 2
REVIEW OF THE BUSINESS PROCESS MANAGEMENT LITERATURE
2.1. Introduction
In the previous chapter, it was suggested that the Business Process Management (BPM)
discipline offers a discrete theoretical domain that can provide valuable insights into
current thinking around the process concept. The purpose of this chapter is to inform the
topic of process design through a review of the relevant BPM literature.
This chapter is organised in six sections. Section 2.2 focuses on the emergence of a
coherent approach to managing business processes which researchers have labelled
Business Process Management (BPM). BPM is differentiated from Business Process
Re-engineering (BPR) and the benefits associated with BPM are highlighted.
In section 2.3 the business process concept is explored and consideration is given to
different definitions and perspectives. In addition, the key characteristics of the business
process concept are identified from the extant literature.
The concept of a business process architecture as a means for understanding the
organisation from a process perspective is introduced in section 2.4. An established
framework for categorising the business processes that form the architecture is
examined. Within this classification scheme, particular consideration is given to the
category of ‘operate’ processes which deliver goods and services to the external
customer.
Section 2.5 addresses business process design. The generic design principles that have
appeared in the literature are presented. The application of these principles to ‘operate’
processes is discussed. In addition, business process modelling is explicitly
distinguished from business process design. The characteristics of the IDEF-0
modelling method are examined in further detail.
Section 2.6 summarises the main findings from the business process literature review.
30
2.2. Business Process Management
2.2.1. The emergence of Business Process Management
The BPM discipline is an important area to address as it can provide useful insights into
the integrated approach to process management found in many organisations today.
Smart et al. (2009, p.494) argue that “critical to an understanding of BPM is the
disentangling of process from its re-engineering origins”. Business process re-
engineering (BPR) is a change management approach that emerged in the 1990s. It is
defined as “the fundamental rethinking and radical redesign of business processes to
achieve dramatic improvements in critical measures of performance, such as cost,
quality, service, and speed” (Hammer and Champy, 1993, p.32). In other words, BPR
involves changing everything radically, using business processes as the major unit of
analysis for triggering and implementing structural change. Businesses are attracted to
BPR by the expectation of important improvements in efficiency and effectiveness
which ultimately lead to significantly greater customer satisfaction and profitability
(Baker and Maddux, 2005). However, it has been widely reported that BPR has failed to
deliver on its ambitious promises (Al-Mashari and Zairi, 2000; Davenport, 1996).
Reasons for failure include association with restructuring and downsizing, inefficient
communication, ineffective change management initiatives, and failure to create
adequate support structures (Al-Mashari and Zairi, 2000; Davenport, 1996).
Many scholars, therefore, consider that BPR was a mere management fad as reported by
Maddern et al. (2007). An extensive review of the research topics covered in the
International Journal of Operations and Production Management by Pilkington and
Fitzgerald (2006) shows that interest in BPR has been declining significantly between
1994 and 2003. Even Hammer, the now defunct former BPR champion, stated: “I no
longer see myself as a radical person; instead I have become a process person”
(Hammer, 2001). In contrast, there is ample evidence that BPM has attracted and
sustained the attention of many businesses (Al-Mashari, 2002; Armistead, 1990;
Goldkuhl and Lind, 2008; Pritchard and Armistead, 1999; Smart et al., 2009). Regular
surveys on the state of BPM conducted by the BP Trends group have revealed that a
significant number of companies spend large amounts of money on BPM. For instance,
17% of the large companies surveyed in 2007 reported yearly expenditures of over $10
million (Harmon and Wolf, 2008). Business process management has evolved from its
manufacturing origins and has now been embraced by service organisations (Woodall,
31
2001). For example, both Gartner2 and Datamonitor3 report increasing interest in
processes, particularly in the Banking sector. As pointed out by Grover and Kettinger
(2000, p.16), “process thinking has become mainstream”. Fowler (2003, p.138)
summarises the importance of process by stating that “the issue of process has now
achieved equal status with strategy and organisation theory as a concern for debate and
analysis at the highest level within organisations”.
2.2.2. Defining Business Process Management
While the adoption of BPM in the business community has been extensive, it has also
been the subject of considerable academic interest. Theoretical foundations of BPM as a
discipline in its own right are relatively vague since the field is still in its infancy (Hung,
2006). BPM is generally seen as an ongoing management approach that promotes a new
way of thinking about organisations through a business process lens (Armistead and
Machin, 1997; Smart et al., 2009). The BPM discipline calls for organisations to see
themselves as a collection of highly integrated processes instead of a mere set of
functions and departments (McCormack and Johnson, 2001). It encourages a strong
customer-focus through the active management of end-to-end processes across the
entire enterprise (Lusk et al., 2005; Smart et al., 1997).
From a survey of BPM practice, Pritchard and Armistead (1999) identify a number of
key considerations for companies involved in implementing BPM:
- Clear articulation of BPM intentions
- Link between BPM and strategy
- Acquisition of process competencies, skills, and knowledge
- Willingness to address people issues when implementing a BPM programme
Zairi (1997, p.64) defines BPM as “a structured approach to analyse and continually
improve fundamental activities of a company’s operations”. He subsequently put
forward the following principles of managing business processes:
- Major activities have to be properly mapped and documented.
2 ‘Front-Office BPM Can Help Your Bank Achieve Customer-Focused Strategy’, Gartner brief no.
G00126425, 12th April 2005 3 ‘Business process management in European Financial Services’, DataMonitor brief BFTC 1039, 07/04
32
- BPM creates a focus on customers through horizontal linkages between key
activities.
- BPM relies on systems and documented procedures to ensure discipline, consistency
and repeatability of quality performance.
- BPM relies on measurement activity to assess the performance of each individual
process, set targets and deliver output levels which can meet corporate objectives.
- BPM has to be based on a continuous approach of optimisation through problem
solving and reaping out extra benefits.
- BPM has to be inspired by best practice to ensure that superior competitiveness is
achieved.
- BPM is an approach for culture change and does not result simply through having
good systems and the right structure in place.
2.2.3. The promises of Business Process Management
A number of authors have reported that significant benefits can be attained for
companies which adopt a BPM mindset. It must be noted that most accounts of benefits
associated with BPM rely on anecdotal evidence with the notable exception of a
longitudinal study carried out by Maddern et al. (2007). A brief summary of the main
benefits from BPM that have been reported in the literature is provided below.
Traditionally, companies divide activities vertically along the functional units
represented in the organisational chart. Functionally-organised companies have been
criticised for creating vertical silos that prevent processes from running smoothly across
the organisational structure (Hammer and Stanton, 1999). Vertical divisions can
represent a serious obstacle to reaching high levels of customer satisfaction since
functional departments may interfere with the horizontal value-adding flow (Cousins
and Stewart, 2002). On the other hand, a process view disregards the individual
departments that might be involved in a business process. Although information and
work would flow across various internal departments which complete different tasks, a
single process takes place from the perspective of the customer. Thus, BPM can help to
overcome the limitations of traditional functional management (Silvestro and Westley,
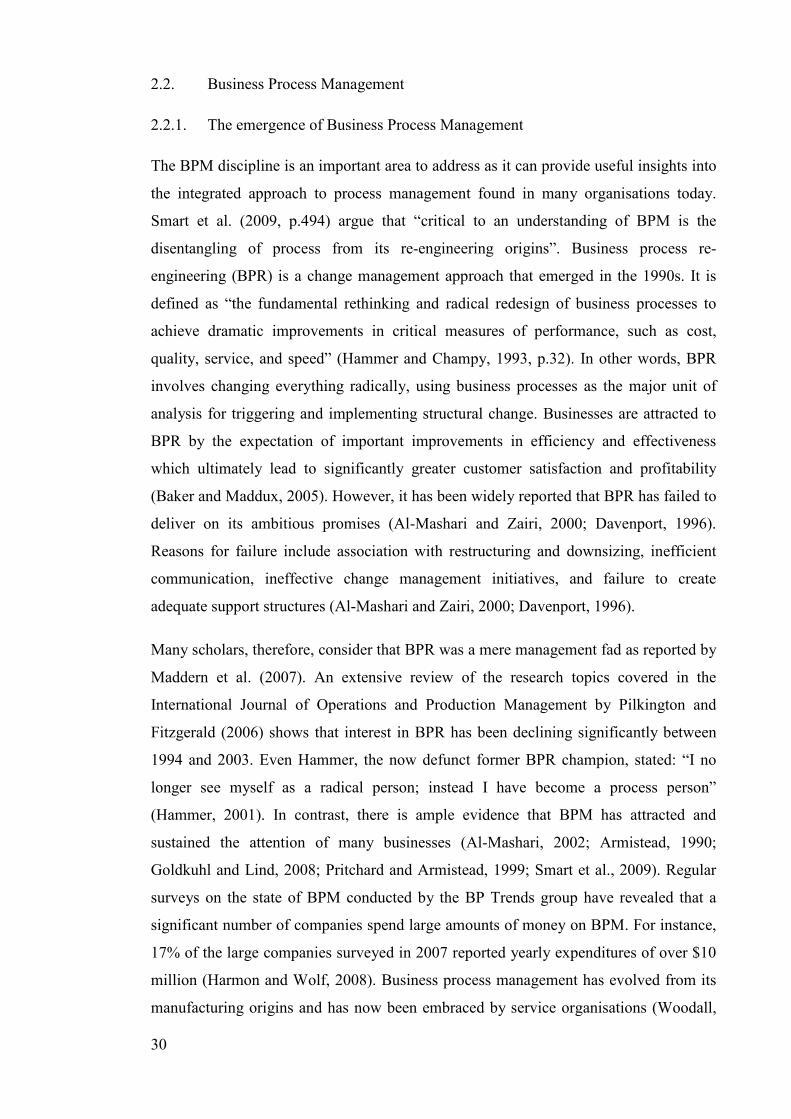
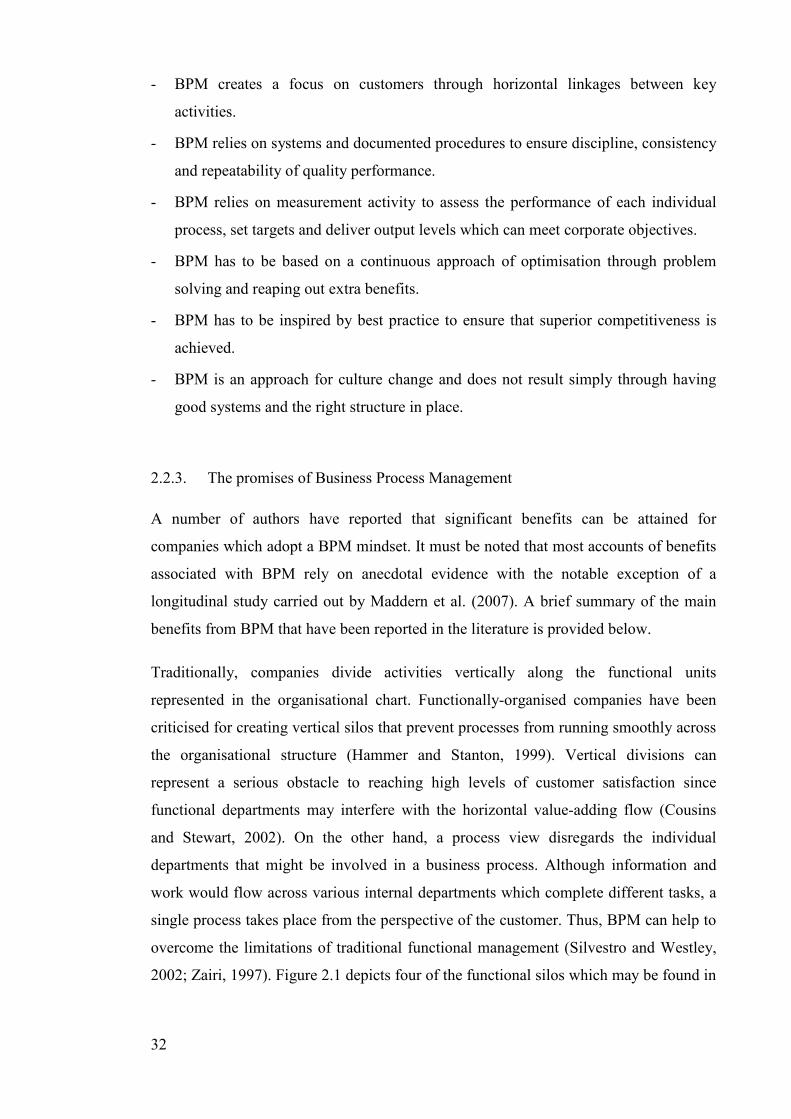
2002; Zairi, 1997). Figure 2.1 depicts four of the functional silos which may be found in
33
a bank. The horizontal line represents a process which flows across each of the four
functions.
Start End
Branch Back
Office
Back
Office
Branch
Figure 2.1: A business process in a functional organisation (adapted from Childe et al. (1994))
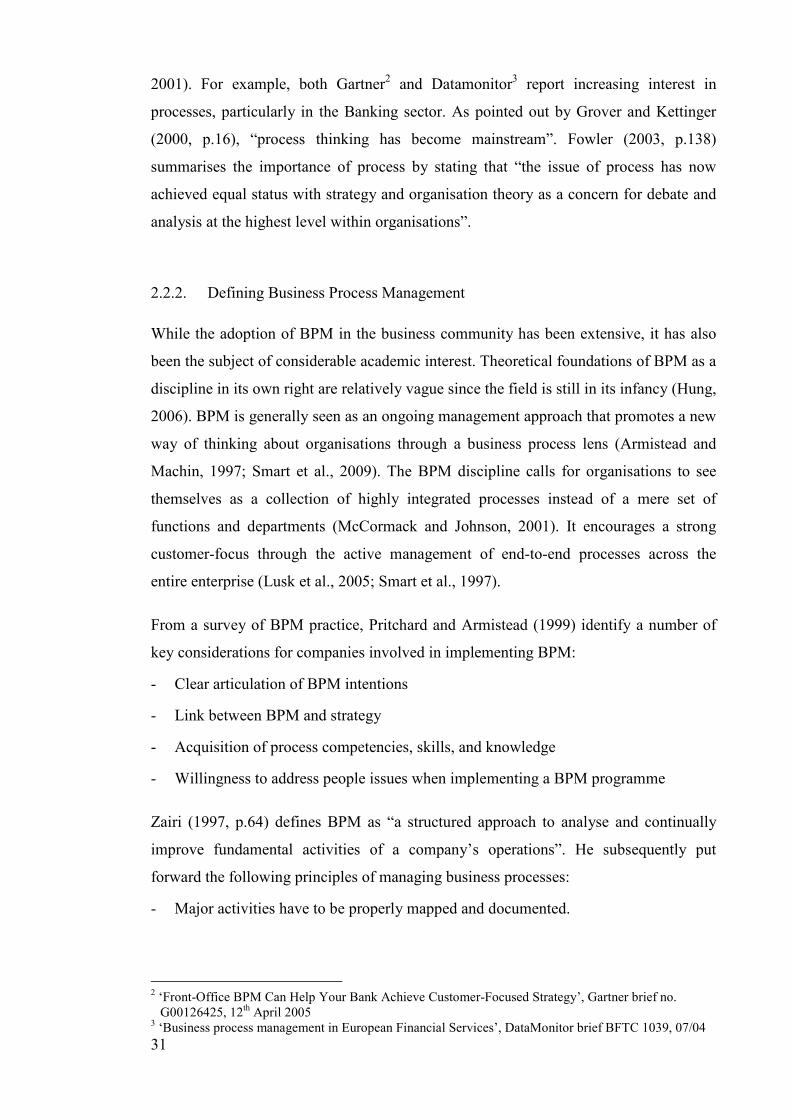
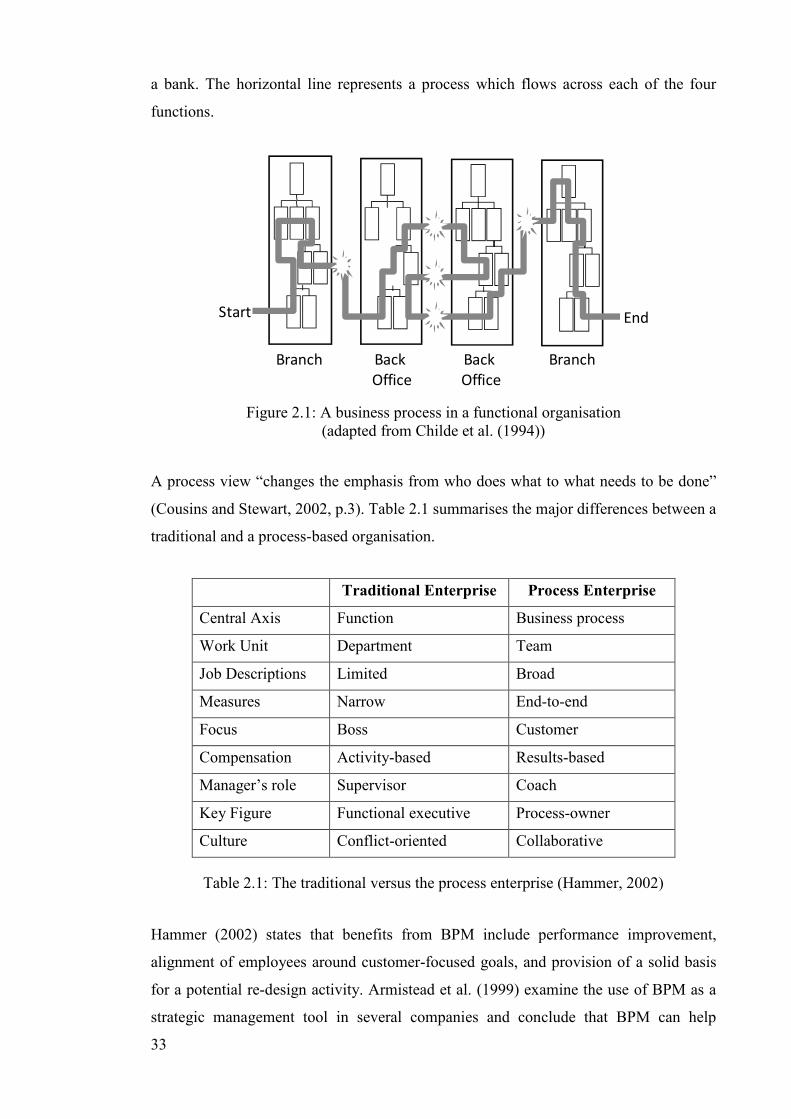
A process view “changes the emphasis from who does what to what needs to be done”
(Cousins and Stewart, 2002, p.3). Table 2.1 summarises the major differences between a
traditional and a process-based organisation.
Traditional Enterprise Process Enterprise
Central Axis Function Business process
Work Unit Department Team
Job Descriptions Limited Broad
Measures Narrow End-to-end
Focus Boss Customer
Compensation Activity-based Results-based
Manager’s role Supervisor Coach
Key Figure Functional executive Process-owner
Culture Conflict-oriented Collaborative
Table 2.1: The traditional versus the process enterprise (Hammer, 2002)
Hammer (2002) states that benefits from BPM include performance improvement,
alignment of employees around customer-focused goals, and provision of a solid basis
for a potential re-design activity. Armistead et al. (1999) examine the use of BPM as a
strategic management tool in several companies and conclude that BPM can help
34
companies improve the effectiveness of the whole organisation. This resonates with the
view that BPM is assumed to help companies develop and sustain competitive
advantage (Kilmann, 1995). Silvestro and Westley (2002) conduct case study research
with two large UK organisations which adopted a process-based structure in the 1990s.
They identify the following advantages associated with BPM: increased market
responsiveness, improved collaboration between functions, and better alignment of
operational objectives. Finally, Maddern et al. (2007) voice their concerns about the
lack of empirical evidence that supports the position that process management is a
success factor for companies. The authors start addressing this issue by empirically
examining the claim that BPM contributes significantly to customer satisfaction. The
results of their longitudinal case study show that BPM is a key driver of service quality
and customer satisfaction.
The literature has primarily focused on the benefits of process structures without
recognising their costs (Silvestro and Westley, 2002). While many organisations have
adopted a BPM mindset and have implemented process management practices, some
authors report that deploying and maintaining a BPM approach is difficult in practice
(Forsberg et al., 1999; Palmberg, 2010). For instance, introducing a process
management structure into a functionally-organised enterprise can result in increased
operational complexity and a duplication of functional expertise. Silvestro and Westley
(2002) argue that this has significant implications for the overall efficiency and
effectiveness of the organisation. To address these concerns, these authors suggest a
contingency approach to organisational design based on business strategy.
In summary, BPM has evolved from past management theories and practices such as
business process re-engineering (BPR) and has been embraced by many organisations.
BPM represents a fundamental shift in how organisations are managed. BPM is a way
of thinking about the entire organisation from a process-based, customer-centric
perspective. The BPM discipline considers that the business process concept is the point
of reference in organisations. Although there are difficulties in introducing a process
management structure in practice, it is contented that the conscious management of
business processes results in a number of significant benefits.
35
2.3. The business process concept
Since business processes are at the core of the BPM discipline, it is important to define
the business process concept clearly. From a management perspective, the origins of
process trace back to the development of scientific management by Taylor (Armistead
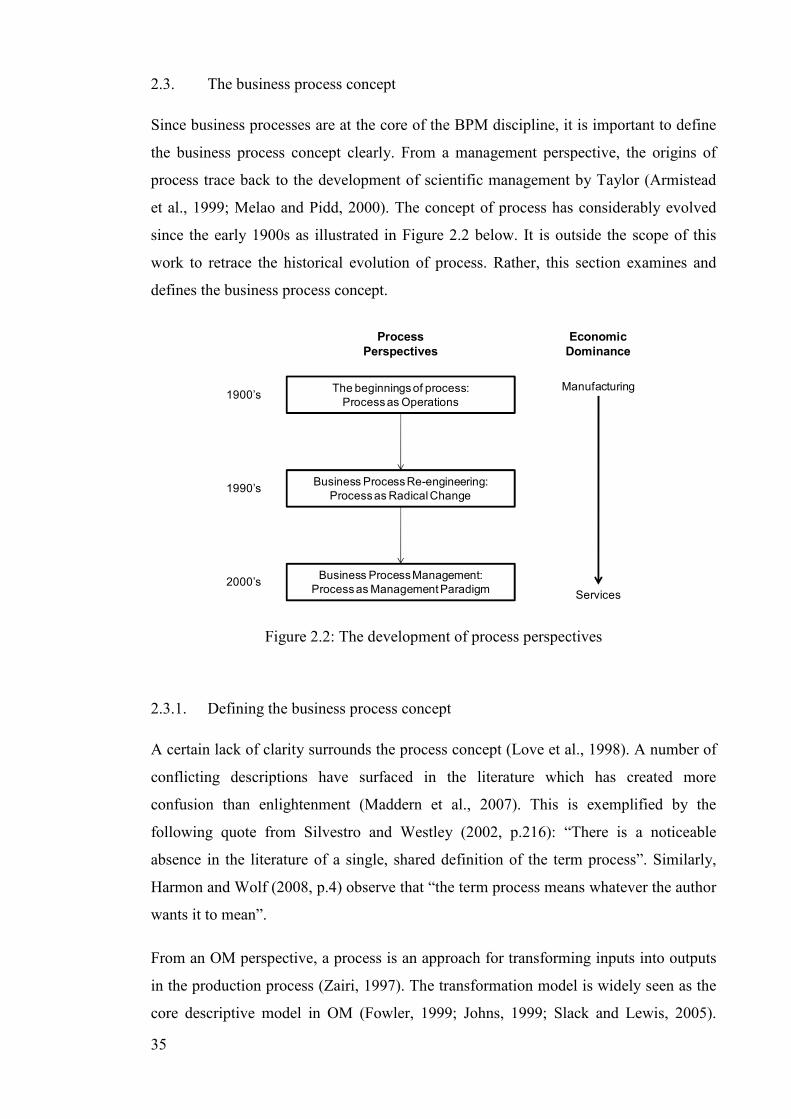
et al., 1999; Melao and Pidd, 2000). The concept of process has considerably evolved
since the early 1900s as illustrated in Figure 2.2 below. It is outside the scope of this
work to retrace the historical evolution of process. Rather, this section examines and
defines the business process concept.
The beginnings of process:
Process as Operations
Business Process Re-engineering:
Process as Radical Change
Business Process Management:
Process as Management Paradigm
1900’s
1990’s
2000’s
Process
Perspectives
Economic
Dominance
Manufacturing
Services
Figure 2.2: The development of process perspectives
2.3.1. Defining the business process concept
A certain lack of clarity surrounds the process concept (Love et al., 1998). A number of
conflicting descriptions have surfaced in the literature which has created more
confusion than enlightenment (Maddern et al., 2007). This is exemplified by the
following quote from Silvestro and Westley (2002, p.216): “There is a noticeable
absence in the literature of a single, shared definition of the term process”. Similarly,
Harmon and Wolf (2008, p.4) observe that “the term process means whatever the author
wants it to mean”.
From an OM perspective, a process is an approach for transforming inputs into outputs
in the production process (Zairi, 1997). The transformation model is widely seen as the
core descriptive model in OM (Fowler, 1999; Johns, 1999; Slack and Lewis, 2005).
36
While early process perspectives focused exclusively on the operational activity and on
the transformation process within the discrete operations function of an organisation
(Maddern and Smart, 2009), operations can also be described as activities that relate to
any transformation of inputs to produce outputs for internal or external customers. This
meaning of operations transcends organisational structures since it is found across the
whole organisation. From this perspective, “processes are a generic factor in all
organisations. They are the way things get done” (Armistead et al., 1999, p.105). In
other words, a process can be defined as conceptual notion of what an organisation does
(Smart et al., 2009). This view is closely aligned to the definitions of business process
used in the business process management literature.
Although there are different definitions of business process throughout the literature
(Lindsay et al., 2003; Love et al., 1998; Melao and Pidd, 2000; Silvestro and Westley,
2002), many views have a close proximity to the input-output transformation model
(Aguilar-Saven, 2004). For example, Coulson-Thomas (1994) suggests that a business
process consists of transforming inputs into value-adding activities that leads into one or
more outputs. Similarly, Palmberg (2009) defines a business process as a horizontal
flow of activities that transforms an input to an output to meet the needs of a customer
or stakeholder. In short, a business process can be fundamentally defined as a sequence
of activities which transform inputs into outputs for a customer (Lindsay et al., 2003).
Other definitions emphasise the importance of tasks and activities that are logically
related. For example, Davenport and Short (1990) suggest that a business process is a
collection of related tasks performed to achieve a defined business outcome. It is widely
acknowledged that Hammer was instrumental in placing the issue of process at the heart
of the business agenda. He defines a business process as “an organised group of related
activities that work together to create a result of value to customers” (Hammer, 2002,
p.27). Davenport (1993, p.7) suggests that “processes are the structure by which an
organisation does what is necessary to produce value for its customers”. Finally, Childe
et al. (1994, p.24) define a business process as “a series of continuous activities or
operations which are performed upon a commodity” which can be “conceptual or
material”.
37
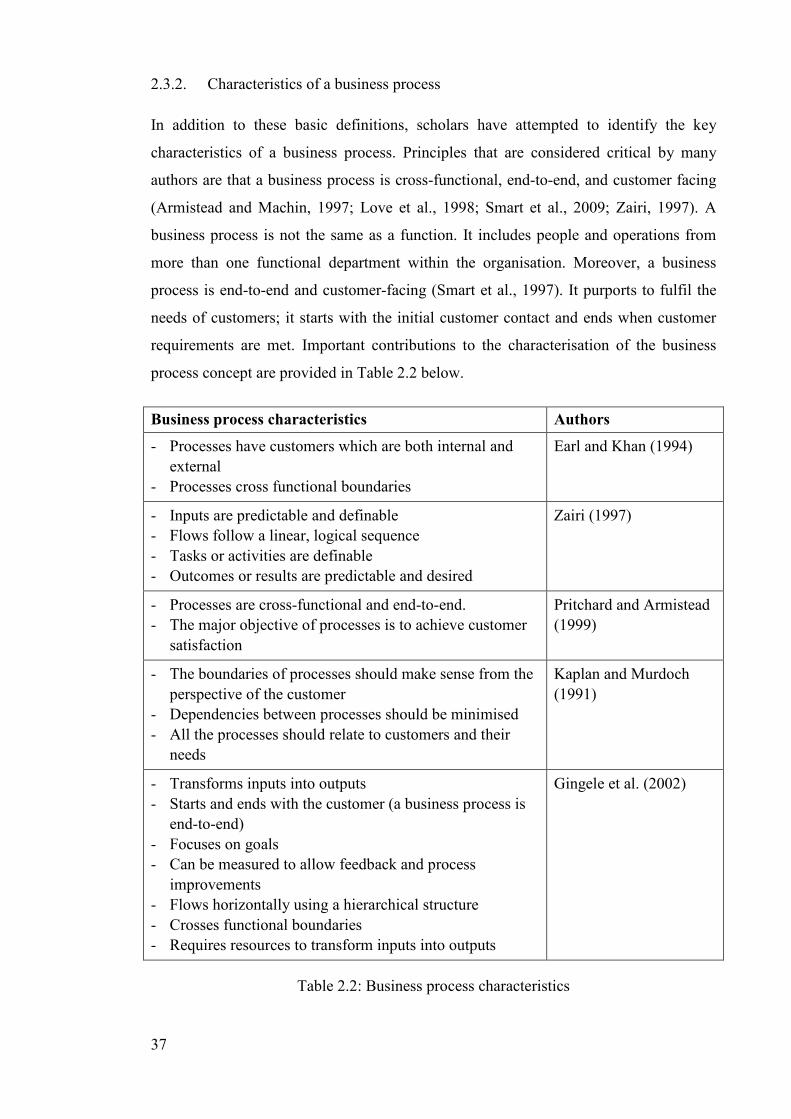
2.3.2. Characteristics of a business process
In addition to these basic definitions, scholars have attempted to identify the key
characteristics of a business process. Principles that are considered critical by many
authors are that a business process is cross-functional, end-to-end, and customer facing
(Armistead and Machin, 1997; Love et al., 1998; Smart et al., 2009; Zairi, 1997). A
business process is not the same as a function. It includes people and operations from
more than one functional department within the organisation. Moreover, a business
process is end-to-end and customer-facing (Smart et al., 1997). It purports to fulfil the
needs of customers; it starts with the initial customer contact and ends when customer
requirements are met. Important contributions to the characterisation of the business
process concept are provided in Table 2.2 below.
Business process characteristics Authors
- Processes have customers which are both internal and
external
- Processes cross functional boundaries
Earl and Khan (1994)
- Inputs are predictable and definable
- Flows follow a linear, logical sequence
- Tasks or activities are definable
- Outcomes or results are predictable and desired
Zairi (1997)
- Processes are cross-functional and end-to-end.
- The major objective of processes is to achieve customer
satisfaction
Pritchard and Armistead
(1999)
- The boundaries of processes should make sense from the
perspective of the customer
- Dependencies between processes should be minimised
- All the processes should relate to customers and their
needs
Kaplan and Murdoch
(1991)
- Transforms inputs into outputs
- Starts and ends with the customer (a business process is
end-to-end)
- Focuses on goals
- Can be measured to allow feedback and process
improvements
- Flows horizontally using a hierarchical structure
- Crosses functional boundaries
- Requires resources to transform inputs into outputs
Gingele et al. (2002)
Table 2.2: Business process characteristics
38
In summary, the input-output transformation model represents a well-accepted
conceptualisation of process from an operations perspective. A review of the definitions
of business process in the literature finds that the concept is closely aligned to the
transformation model. Furthermore, the literature emphasises that a business process is
end-to-end, cross-functional, and customer facing. A business process transcends
functional boundaries and emphasises what an organisation does. It is arguable that the
business process concept extends the OM-based view of process into the business
environment. A business process reflects a broader view of process and places the
process concept at the centre of the organisation.
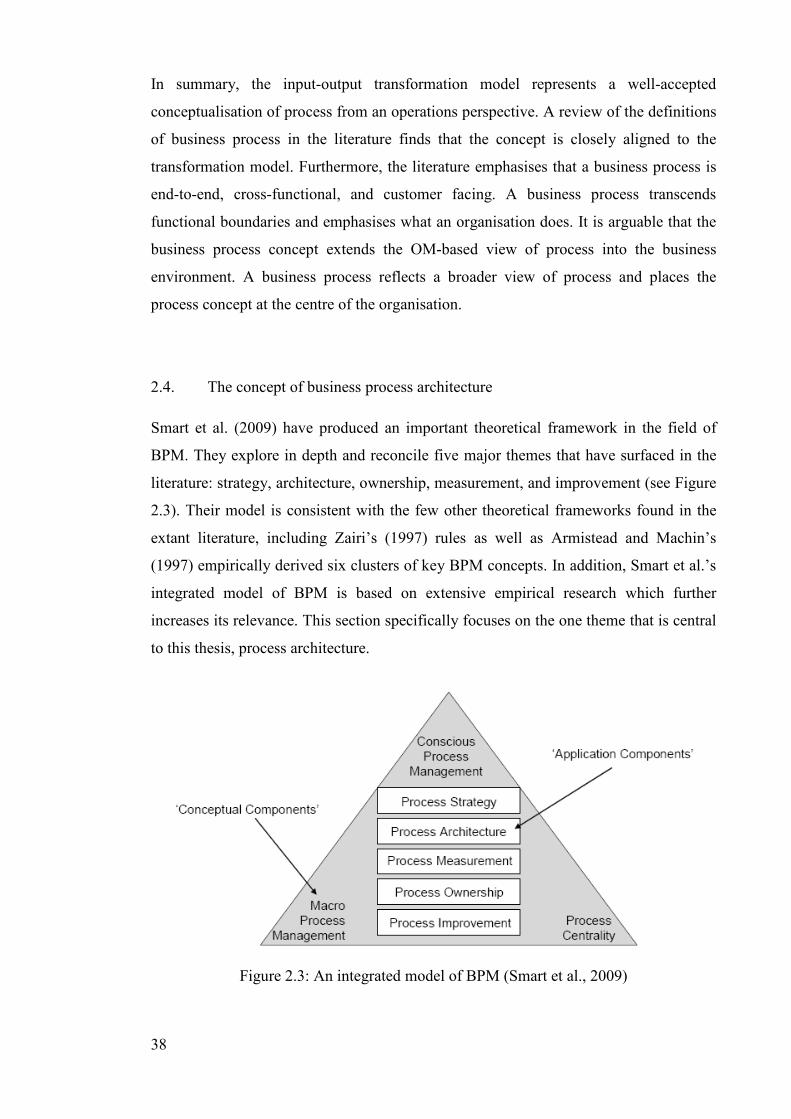
2.4. The concept of business process architecture
Smart et al. (2009) have produced an important theoretical framework in the field of
BPM. They explore in depth and reconcile five major themes that have surfaced in the
literature: strategy, architecture, ownership, measurement, and improvement (see Figure
2.3). Their model is consistent with the few other theoretical frameworks found in the
extant literature, including Zairi’s (1997) rules as well as Armistead and Machin’s
(1997) empirically derived six clusters of key BPM concepts. In addition, Smart et al.’s
integrated model of BPM is based on extensive empirical research which further
increases its relevance. This section specifically focuses on the one theme that is central
to this thesis, process architecture.
Figure 2.3: An integrated model of BPM (Smart et al., 2009)
39
2.4.1. Defining the business process architecture
It may be argued that an entire organisation can be conceptualised as a collection of
interrelated business processes which form a business process architecture. A business
process architecture is a written or graphical representation of the business processes
present in an organisation and of the relationships or flows between them (Barros, 2007;
Harmon, 2003). It provides an overview of all the processes in the organisation and
indicates how business processes relate to strategic goals (Zairi, 1997). It can be used as
a descriptive framework to inform the identification of the core business processes that
comprise an organisation and how they all fit together (Maull et al., 1995). Developing
a process architecture is seen as a critical requirement to the effective management of
business processes (Batista et al., 2008) since companies who are engaged in BPM seek
to understand the totality of processes, their boundaries, and interrelationships (Smart et
al., 2009).
The concept of business process architecture can be grounded in the systems discipline
(Checkland, 1981; Katz and Khan, 1966; Miller and Rice, 1967). It may be argued that
systems-thinking fostered the adoption of the view that an entire organisation could be
seen as a holistic system composed of interconnected, core business processes (i.e. sub-
systems) (Fowler, 1999). This view is in accord with Biazzo (2000) who argues that
conceptualising the whole organisation as a set of business processes is very similar to
the model of open systems. This perspective assumes that the organisation can be
divided into a set of business processes which interact together and with the external
environment. The concept of a business process architecture as a hierarchy of processes
resonates with Ackoff’s claim (1980) that systems are structurally divisible but
functionally indivisible. This conceptual view enables the consideration of each process
without losing the context of its purpose within the whole organisation (Smart et al.,
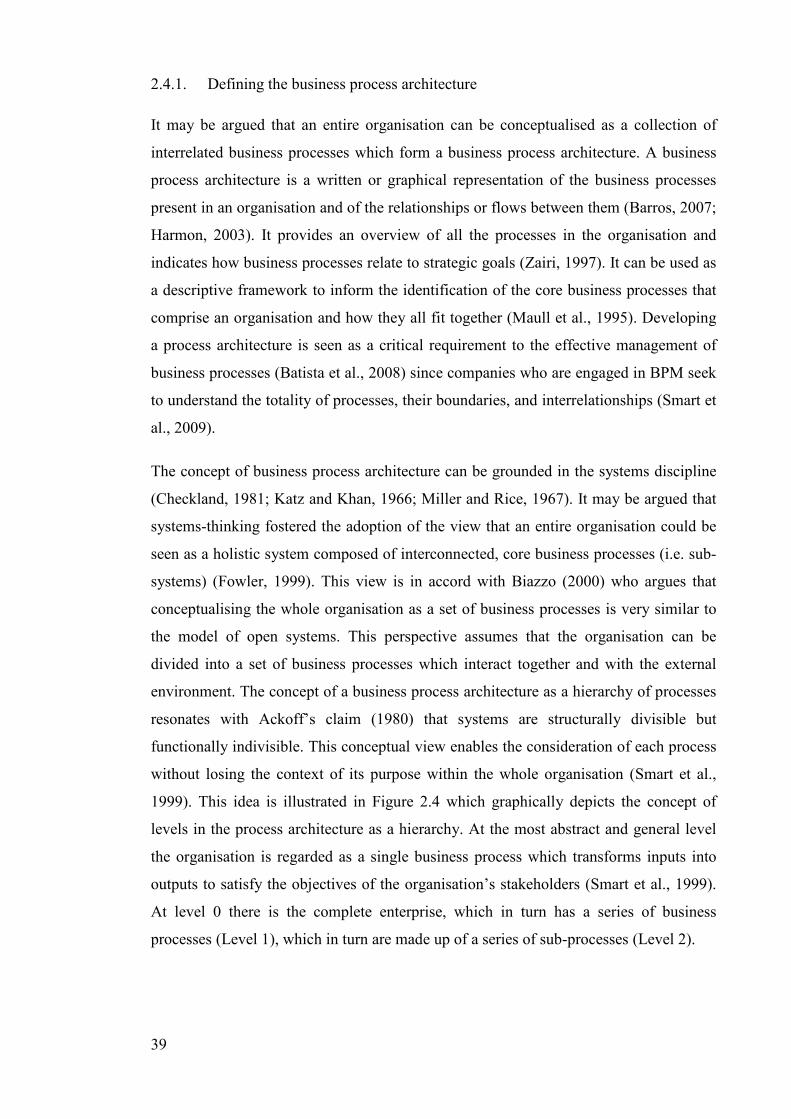
1999). This idea is illustrated in Figure 2.4 which graphically depicts the concept of
levels in the process architecture as a hierarchy. At the most abstract and general level
the organisation is regarded as a single business process which transforms inputs into
outputs to satisfy the objectives of the organisation’s stakeholders (Smart et al., 1999).
At level 0 there is the complete enterprise, which in turn has a series of business
processes (Level 1), which in turn are made up of a series of sub-processes (Level 2).
40
Enterprise
Level 0
Process
Level 1
Sub-Process
Level 2/3
Activity
Level 3/4
Task
Level 4/5
Workstep
Procedures
Level 5/6
Figure 2.4: Typical levels in a hierarchical process architecture
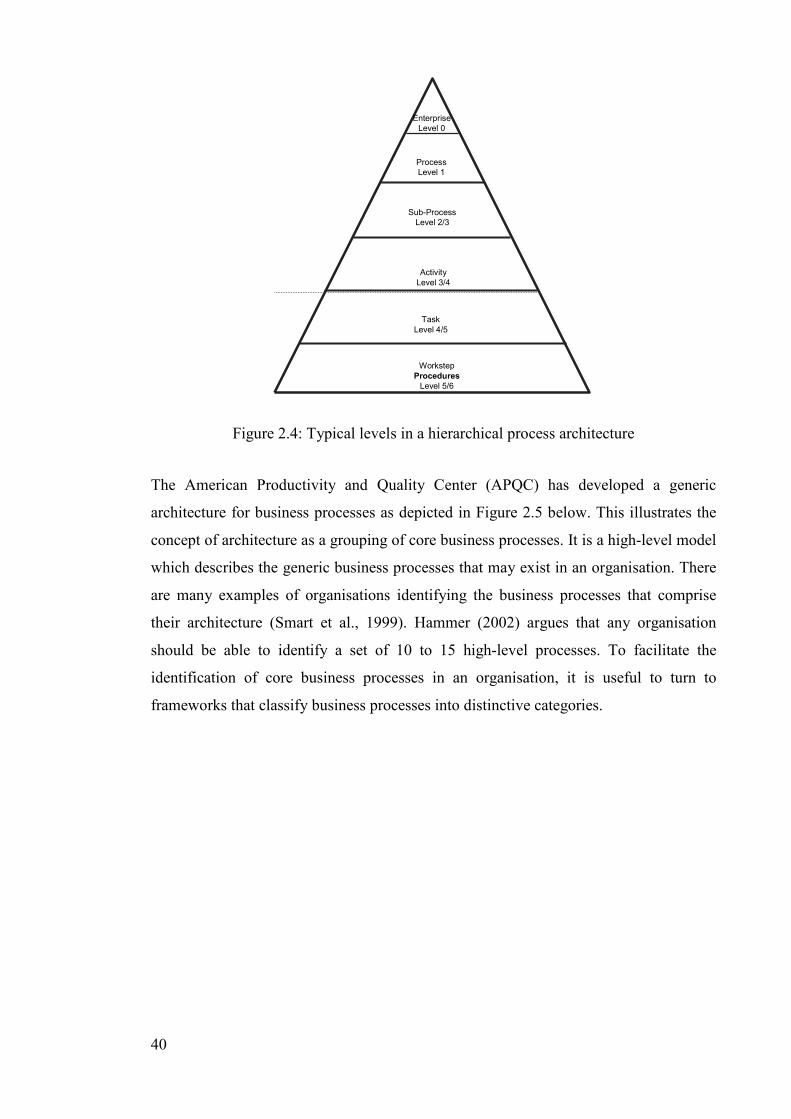
The American Productivity and Quality Center (APQC) has developed a generic
architecture for business processes as depicted in Figure 2.5 below. This illustrates the
concept of architecture as a grouping of core business processes. It is a high-level model
which describes the generic business processes that may exist in an organisation. There
are many examples of organisations identifying the business processes that comprise
their architecture (Smart et al., 1999). Hammer (2002) argues that any organisation
should be able to identify a set of 10 to 15 high-level processes. To facilitate the
identification of core business processes in an organisation, it is useful to turn to
frameworks that classify business processes into distinctive categories.
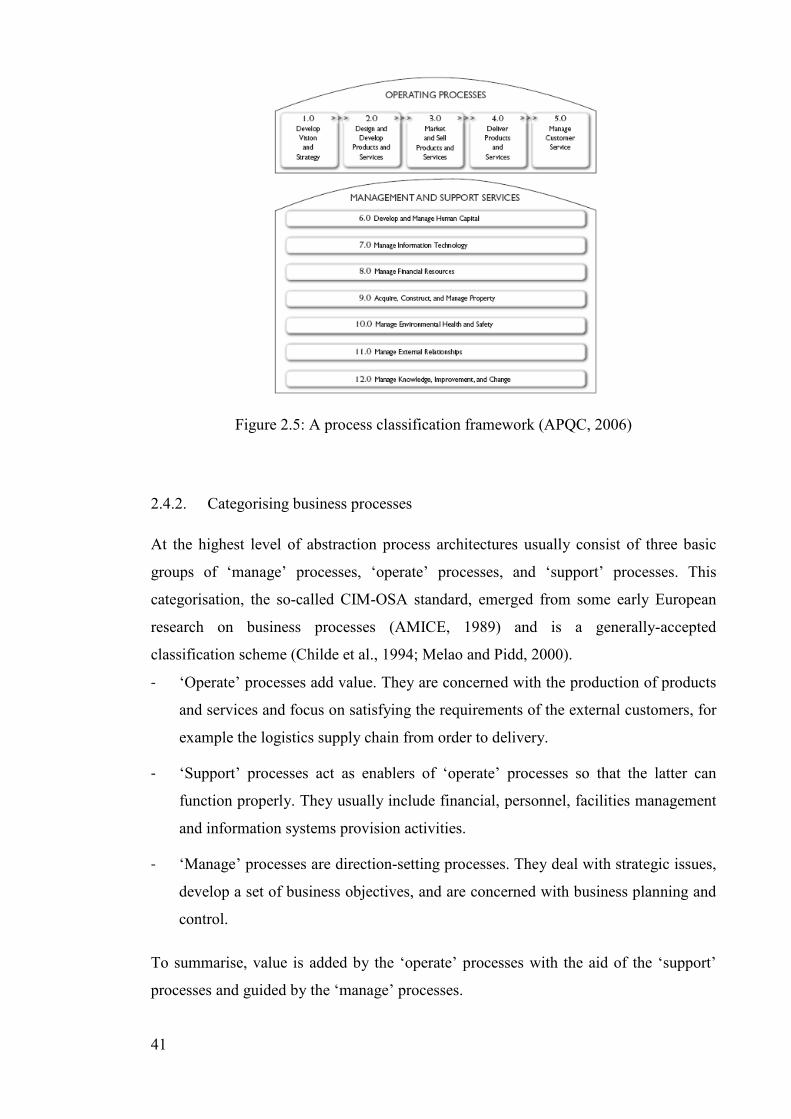
41
Figure 2.5: A process classification framework (APQC, 2006)
2.4.2. Categorising business processes
At the highest level of abstraction process architectures usually consist of three basic
groups of ‘manage’ processes, ‘operate’ processes, and ‘support’ processes. This
categorisation, the so-called CIM-OSA standard, emerged from some early European
research on business processes (AMICE, 1989) and is a generally-accepted
classification scheme (Childe et al., 1994; Melao and Pidd, 2000).
- ‘Operate’ processes add value. They are concerned with the production of products
and services and focus on satisfying the requirements of the external customers, for
example the logistics supply chain from order to delivery.
- ‘Support’ processes act as enablers of ‘operate’ processes so that the latter can
function properly. They usually include financial, personnel, facilities management
and information systems provision activities.
- ‘Manage’ processes are direction-setting processes. They deal with strategic issues,
develop a set of business objectives, and are concerned with business planning and
control.
To summarise, value is added by the ‘operate’ processes with the aid of the ‘support’
processes and guided by the ‘manage’ processes.
42
Multiple case-study research carried out in European companies which were early BPM
adopters led to a similar categorisation of process types (Armistead and Machin, 1997).
The grouping of business processes into ‘manage’, ‘operate’, and ‘support’ processes is
relatively similar to the four major groups of macro-processes proposed by Barros
(2007) and to the classification suggested by the APQC (2006). In addition, this
categorisation is consistent with the three broad types of activities inherent in any
enterprise identified by Miller and Rice (1967) as operating activities (i.e. ‘operate’
processes), maintenance activities (i.e. ‘support’ processes), and regulatory activities
(i.e. ‘manage’ processes).
2.4.3. Focus on ‘operate’ processes
The ‘operate’ processes deliver a product or service to the customer. They are the
processes that directly create value for the external customer and represent where the
greatest gains in competitive advantage can be made (Hammer and Champy, 1993).
Value is effectively added when the set of activities in the operational processes result
in the fulfilment of customer requirements (Smart et al., 1999). These processes include
the primary activities of the value chain (Melao and Pidd, 2000). ‘Operate’ processes
are highly relevant to this thesis which focuses on the design of operational processes in
a service context. Therefore, it is important to examine the concept of ‘operate’
processes more thoroughly.
‘Operate’ processes refer to what Beer (1984) calls the producer system, the producer of
the organisation. The producer system is concerned with generating the income on
which the organisation depends for its survival. Similarly, Katz and Khan (1966)
designate the production or technical system as the system where the major type of
work gets done. These views resonate strongly with the concept of primary task defined
by Miller and Rice (1967, p.25) as “the task that the organisation must perform if it is to
survive”. For instance, the primary task of a manufacturing organisation is to convert
raw materials into finished products. It follows that in the input-output transformation
model discussed previously, the dominant transformation may be termed the primary
task.
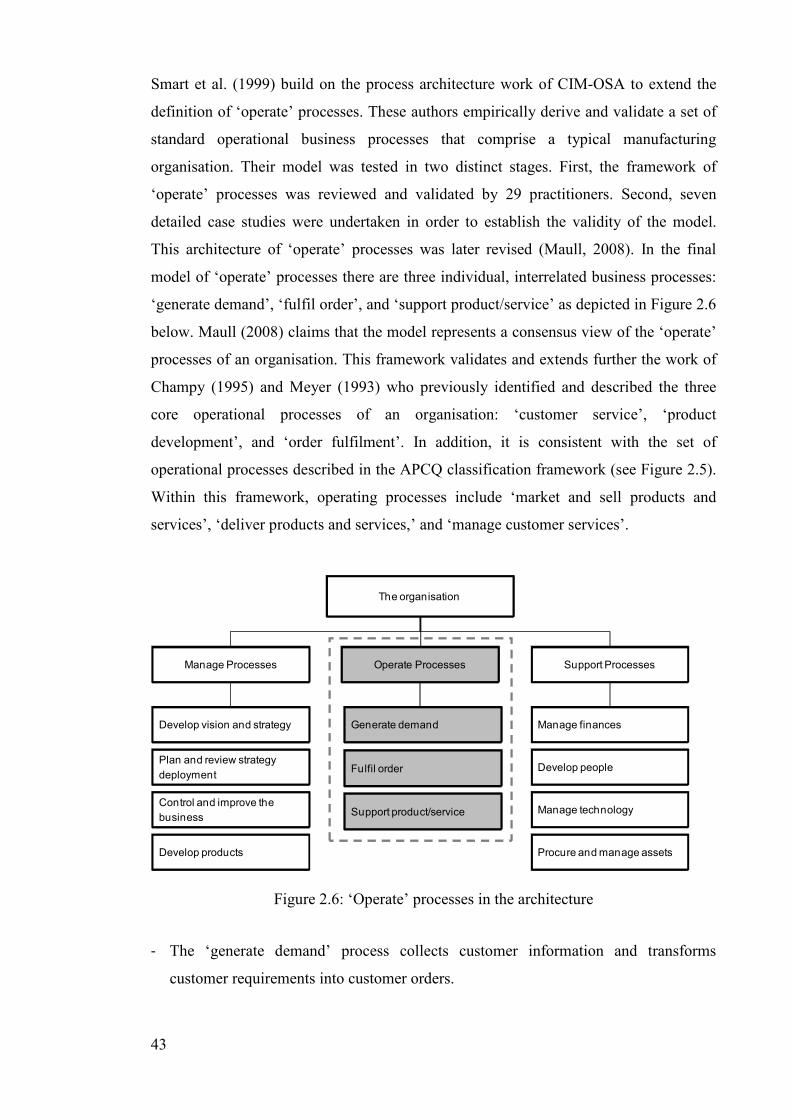
43
Smart et al. (1999) build on the process architecture work of CIM-OSA to extend the
definition of ‘operate’ processes. These authors empirically derive and validate a set of
standard operational business processes that comprise a typical manufacturing
organisation. Their model was tested in two distinct stages. First, the framework of
‘operate’ processes was reviewed and validated by 29 practitioners. Second, seven
detailed case studies were undertaken in order to establish the validity of the model.
This architecture of ‘operate’ processes was later revised (Maull, 2008). In the final
model of ‘operate’ processes there are three individual, interrelated business processes:
‘generate demand’, ‘fulfil order’, and ‘support product/service’ as depicted in Figure 2.6
below. Maull (2008) claims that the model represents a consensus view of the ‘operate’
processes of an organisation. This framework validates and extends further the work of
Champy (1995) and Meyer (1993) who previously identified and described the three
core operational processes of an organisation: ‘customer service’, ‘product
development’, and ‘order fulfilment’. In addition, it is consistent with the set of
operational processes described in the APCQ classification framework (see Figure 2.5).
Within this framework, operating processes include ‘market and sell products and
services’, ‘deliver products and services,’ and ‘manage customer services’.
The organisation
Manage Processes Operate Processes Support Processes
Develop vision and strategy
Plan and review strategy
deployment
Control and improve the
business
Generate demand
Fulfil order
Support product/service
Manage finances
Develop people
Manage technology
Procure and manage assetsDevelop products
Figure 2.6: ‘Operate’ processes in the architecture
- The ‘generate demand’ process collects customer information and transforms
customer requirements into customer orders.
44
- The ‘fulfil order’ process takes the order and produces and delivers the required
product or service to the customer.
- The ‘support product/service’ process deals with customer requests and customer
complaints in relation to the product or service that was delivered to the customer.
These processes are essentially transactional; they run on a regular basis and are what
the company does (Maull, 2008). They are generic processes that conform to the
principles of the business process concept described previously. In short, they are end-
to-end, cross-functional, and customer centric.
Moreover, it is critical to consider the relationships between these business processes
since they interact to deliver a product or a service to the external customer. In other
words, each ‘generate demand’ process has a corresponding ‘fulfil order’ process and a
corresponding ‘support product/service’ process. Smart et al. (1999) stress that
considering the links between business processes is essential. The authors argue that “by
considering any of these processes in isolation without taking into account the links
between them, sub-optimisation of the operate processes as a whole could be the result”
(p.476). Recently, Smart et al. (2009) re-emphasised the point they made ten years
earlier: “our experience indicates that many organisations focus on a discrete process
and fail to look at an integrated set of processes. Our experience is that many
organisations construct high level frameworks consisting of multiple processes, but fail
to identify the physical and information flows which integrate the processes” (p.496).
This suggests that process design research should consider the design of each of the
operational processes that provide the product or the service to the organisation.
To summarise, reference models of ‘operate’ processes are useful as descriptive
frameworks to help to identify and understand the core operational processes of an
organisation. An architecture of ‘operate’ processes consists of several interrelated
business processes which collectively deliver the product or service to the external
customer. Although models of ‘operate’ processes primarily developed out of empirical
research in a manufacturing environment, they are a useful starting point for the
identification of the operational processes of a service organisation. To date, a generic
model describing the operational processes of service organisations has not emerged in
the BPM literature. In addition, process reference models are descriptive frameworks
45
which do not directly address the design of individual operational processes. The next
section is concerned with the design of business processes.
2.5. Business process design
2.5.1. The role of business process design
Business process design is the conscious evaluation and organisation of the activities
that make up a business process. According to Hammer (2002) the role of process
design is to identify and specify the activities that are to be performed and the means by
which these activities are executed in the end-to-end process. Design includes the
specification of which people must perform what tasks, in what order, in what location,
under what circumstances, with what information, and to what degree of precision
(Hammer, 2007). This is broadly congruent with the position of Mertins and Jochem
(1999) who state that the design of a business process is governed by three main forces:
the nature of the tasks or activities to execute, the resources available for the execution
of the tasks, and the flow of information in the process. Similarly, Balasubramanian and
Gupta (2005) see business process design as a set of decisions about the configuration
of activities and the role of participants in the process. In other words, business process
design involves specifying the characteristics of the process and how it should operate.
2.5.2. Principles of business process design
The paucity of research in business process design in the BPM literature is
acknowledged by several authors (Balasubramanian and Gupta, 2005; BPD, 2008;
2009; Hill et al., 2002; Loch, 1998). The academic literature is sparse with works that
discuss “how the processes should be articulated in terms of tasks and resources” and
process design remains “more art than science” (Limam Mansar and Reijers, 2007,
p.193). As a result, business process design is not well understood from an academic
perspective.
In contrast, the practitioner literature on business process design is more developed (e.g.
Cousins and Stewart, 2002; Dershin, 2000; Galvin and Singer, 1996). Like some other
management paradigms BPM has been mainly led by practitioners who adopt a
prescriptive stance. Notably, general process design principles have been proposed in
influential books in the early BPR period (Davenport, 1993; Hammer and Champy,
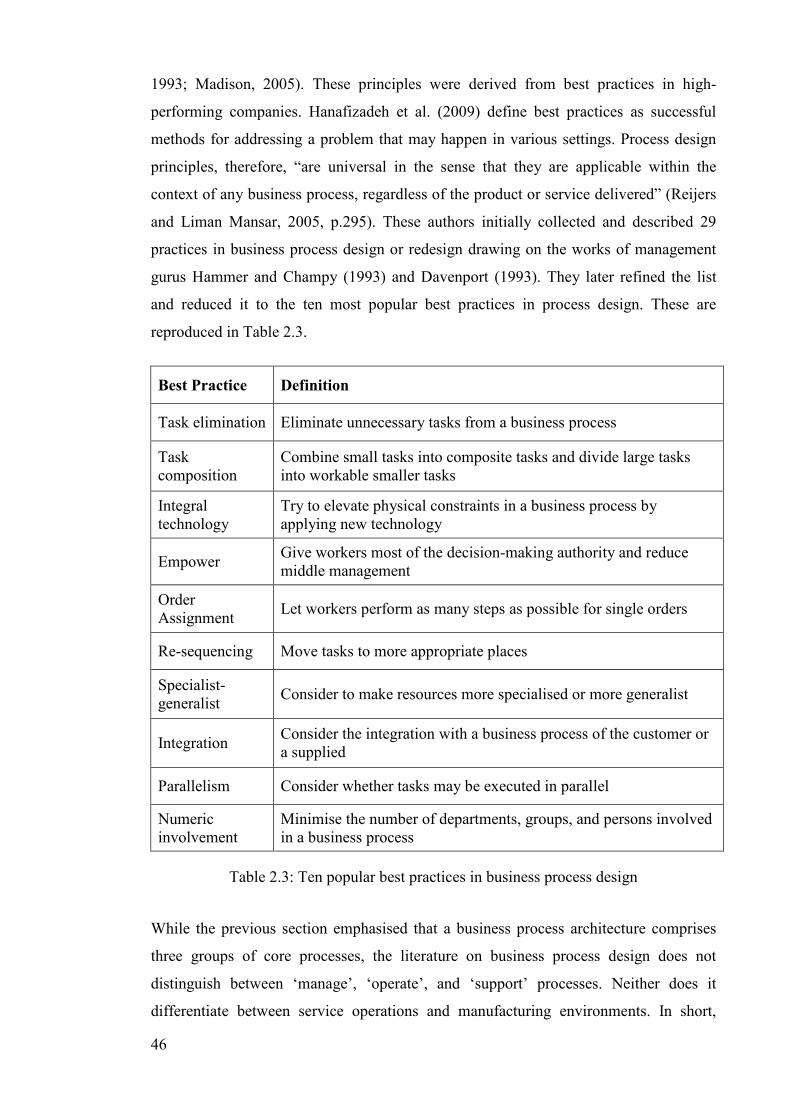
46
1993; Madison, 2005). These principles were derived from best practices in high-
performing companies. Hanafizadeh et al. (2009) define best practices as successful
methods for addressing a problem that may happen in various settings. Process design
principles, therefore, “are universal in the sense that they are applicable within the
context of any business process, regardless of the product or service delivered” (Reijers
and Liman Mansar, 2005, p.295). These authors initially collected and described 29
practices in business process design or redesign drawing on the works of management
gurus Hammer and Champy (1993) and Davenport (1993). They later refined the list
and reduced it to the ten most popular best practices in process design. These are
reproduced in Table 2.3.
Best Practice Definition
Task elimination Eliminate unnecessary tasks from a business process
Task composition
Combine small tasks into composite tasks and divide large tasks into workable smaller tasks
Integral technology
Try to elevate physical constraints in a business process by applying new technology
Empower Give workers most of the decision-making authority and reduce middle management
Order Assignment
Let workers perform as many steps as possible for single orders
Re-sequencing Move tasks to more appropriate places
Specialist-generalist
Consider to make resources more specialised or more generalist
Integration Consider the integration with a business process of the customer or a supplied
Parallelism Consider whether tasks may be executed in parallel
Numeric involvement
Minimise the number of departments, groups, and persons involved in a business process
Table 2.3: Ten popular best practices in business process design
While the previous section emphasised that a business process architecture comprises
three groups of core processes, the literature on business process design does not
distinguish between ‘manage’, ‘operate’, and ‘support’ processes. Neither does it
differentiate between service operations and manufacturing environments. In short,
47
process design principles advocate a “one size fits all” approach which does not offer
any discriminatory power between process categories and which, consequently, does
not directly pertain to operations management problems. The BPM discipline remains
vague about how to design ‘operate’ processes appropriately so that operational
performance is maximised (Loch, 1998).
Loch (1998) notes that the generic design principles advocated in the BPM literature
can help OM understand specific aspects of process design. Specifically, decisions
relating to the sequencing of activities, to the role of people, and to the assignment of
tasks to resources constitute three important elements of process design from an
operations perspective. Advocating that process design principles are universally
applicable, however, contrasts with the contingent approach of operations management
theory in general (Sousa and Voss, 2008). For instance, the manufacturing literature
advocates that process design principles are contingent on the volume and variety mix
of operations (Hayes and Wheelwright, 1979) and the many SOM scholars emphasise
that process design requirements vary with the degree of customer contact (Chase,
1978). Therefore, it is arguable that the BPM literature offers limited insights into the
design requirements of operational processes. Generic design principles do not provide
the adequate level of detail required to specify the design characteristics of ‘operate’
processes in a service context.
In addition to business process design principles, it is also important to consider
established process improvement initiatives. Lean and Six-Sigma are popular business
improvement methodologies which are well established in both manufacturing and
service organisations (Hammer, 2002; Woodall, 2001). These methods originated in a
manufacturing environment but are now widely applied in a wide range of service
industries such as health-care, the airline industry, and financial services (Antony et al.,
2007; Swank, 2003). Clearly, both six-sigma and lean are focused on business processes
(George, 2003). Hammer (2002) states that the aim of six-sigma is to improve quality
and reduce costs in a business process. This can be achieved through focusing on
measuring and reducing variability in processes (McAdam and Lafferty, 2004). The
defining characteristics of lean manufacturing include waste elimination from the value
chain of activities, increased customer focus in the delivery process, continuous
improvement, and worker empowerment (Bowen and Youngdahl, 1998). The successful
application of lean principles in service settings is widely reported by practitioners and
48
by academics4. Although both lean and six-sigma are widely recognised as useful
methodologies for improving the efficiency and effectiveness of business processes in a
variety of organisational contexts, there is still a need to explore the design of
operational processes in the context of service organisations.
2.5.3. Basics of business process modelling
Whilst business process design theory is in its infancy, the academic literature devotes
far more attention to the activity of business process modelling. A process model is the
representation of a business process in graphical form. It provides a view of what the
process does and how information flows between sub-processes and activities (Cousins
and Stewart, 2002). The purpose of process modelling is to describe the elements that
make up a business process and to display the inter-relationship between these elements
(Balasubramanian and Gupta, 2005). Thus, it facilitates an organisation’s understanding
of how it operates and of what it does. A model can be used as a platform for process
analysis (Weske et al., 2004).
According to Gummeson (1993), a modelling technique must exhibit the following four
qualities to be useful and effective:
- It must be comprehensible to employees. The model must be easy to read and to
understand. This can be achieved by involving staff in modelling activities.
- It must use a clear and consistent language throughout the models. This requires
using a standard methodology and rules.
- It must be activity-based and focus on what the system does. This links back to the
basic definition of process.
- It must be actively promoted by management which needs to support the modelling
activity.
Moreover, it is worth mentioning the typical procedures and phases that one should
follow in order to create good process models. There is considerable consensus in the
literature about the process to follow (Biazzo, 2000). The phases identified by the
author are briefly summarised below:
4 ‘Rethinking lean: beyond the shop floor’, 2009, The Boston Consulting Group and Knowledge @
Wharton
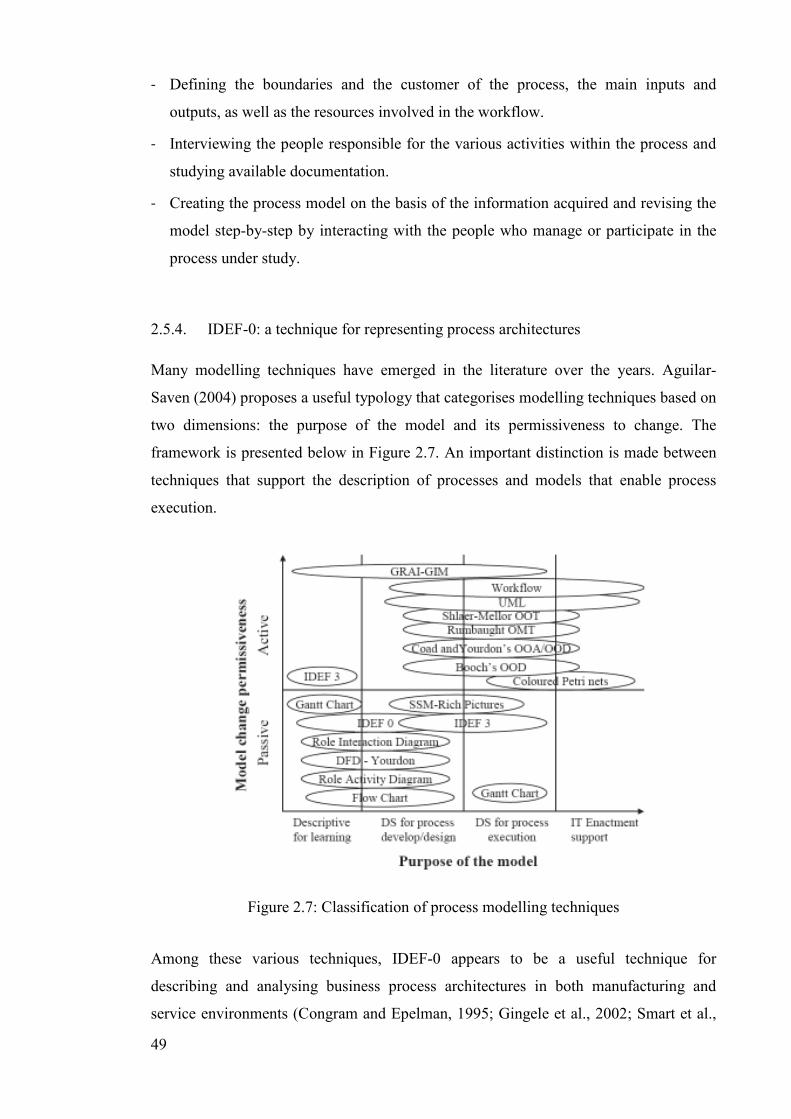
49
- Defining the boundaries and the customer of the process, the main inputs and
outputs, as well as the resources involved in the workflow.
- Interviewing the people responsible for the various activities within the process and
studying available documentation.
- Creating the process model on the basis of the information acquired and revising the
model step-by-step by interacting with the people who manage or participate in the
process under study.
2.5.4. IDEF-0: a technique for representing process architectures
Many modelling techniques have emerged in the literature over the years. Aguilar-
Saven (2004) proposes a useful typology that categorises modelling techniques based on
two dimensions: the purpose of the model and its permissiveness to change. The
framework is presented below in Figure 2.7. An important distinction is made between
techniques that support the description of processes and models that enable process
execution.
Figure 2.7: Classification of process modelling techniques
Among these various techniques, IDEF-0 appears to be a useful technique for
describing and analysing business process architectures in both manufacturing and
service environments (Congram and Epelman, 1995; Gingele et al., 2002; Smart et al.,
50
1999; Wu, 1994). A number of methods belong to the IDEF family which ranges from
IDEF-0 to IDEF-13 but the most popular one is IDEF-0 which stands for Integrated
Computer-Aided Manufacturing (ICAM) Definition Method 0. It was developed in
1977 by the US Air Force to describe a complex manufacturing system (Wu, 1994).
It is arguable that IDEF-0 encapsulates and promotes the adoption of a “systems”
mindset. This technique enables the representation and analysis of the entire set of
‘operate’ processes as part of the whole architecture. IDEF-0 provides multiple
interrelated diagrams that collectively describe the ‘operate’ processes and emphasises
the interdependences between processes and sub-processes (Wu, 1994). Moreover,
IDEF-0 uses decomposition to represent processes at different levels in the process
architecture. Processes are divided structurally but functions are maintained which is
consistent with Ackoff’s (1980, p.26) claim that “systems are structurally divisible but
functionally indivisible”. Decomposition diagrams represent the detail of a business
process by showing its lower level activities and their relationships.
IDEF-0 provides a useful technique for representing an architecture of ‘operate’
processes. Since it focuses on the characteristics of individual ‘operate’ processes and
on the relationships (i.e. flows) between these processes, IDEF-0 can facilitate the study
of the design of operational processes. Kettinger et al. (1997) argue that it can be used
both to capture the characteristics of existing processes and to model a new process
design. Modelling the ‘operate’ processes of an organisation requires identifying a
determinate boundary that defines the scope of the operational processes. It is arguable
that the boundary of the architecture of ‘operate’ processes includes all the activities
that add value for the external customer.
To summarise, process models serve to analyse and evaluate the characteristics of
business processes. However, modelling is not synonymous with and can not substitute
for design. Focusing efforts on modelling methods at the expense of developing design
principles “is similar to agreeing with the language without knowing what to say”5.
5 Call for papers, 5th International Workshop on Business Process Design, 2009, Ulm
51
2.6. Summary and conclusions
This section summarises the major findings from the review of the business process
management literature.
BPM is a management paradigm which promotes the ongoing management of business
processes across the entire organisation. Although the research in this area is primarily
exploratory there seems to be significant benefits to be gained for companies who adopt
a process-based view of the business, a BPM mindset.
The BPM literature extends the OM-based definition of process into the wider business
environment. While both the ‘process’ concept and the ‘business process’ concept rely
on the input-output transformation model, a business process reflects a broader view of
process and places the concept at the centre of the organisation. From this perspective,
processes are a generic factor in all organisations. They are a conceptual notion of how
things get done. Furthermore, there is significant consensus in the BPM literature about
the key characteristics of a business process which is end-to-end, cross-functional, and
customer-oriented.
An entire organisation may be conceptualised as a collection of interrelated business
processes which form a business process architecture. A business process architecture is
a conceptual model which informs the identification of the business processes that
comprise an organisation and how they all fit together. At a high level of abstraction,
three categories of business processes can be found in the architecture. These categories
are usually referred to as ‘manage’ processes, ‘operate’ processes, and ‘support’
processes.
Within a generic architecture attention is drawn to the category of ‘operate’ processes
which create value for the external customer. Since they deliver a product or service to
the external customer, ‘operate’ processes are highly relevant from an OM perspective.
This suggests that the concept of ‘operate’ processes is central to this thesis which
focuses on the design of operational processes in a service context.
Extensive research into manufacturing environments has led to the emergence of a
generic model of ‘operate’ processes. The framework emphasises that the organisation
comprises several interrelated, operational business processes which interact to deliver a
product or a service to the external customer. Despite claims that the model represents a
52
consensus view, there is little empirical evidence that the framework is applicable in
service organisations. A generic model describing the operational processes of service
organisations has not emerged in the BPM literature. Furthermore, while the framework
is a useful starting point for the identification of the operational processes of an
organisation, it does not directly address the design of each of the individual processes.
The BPM literature provides principles for designing business processes. These
principles are highly generic: they transcend all categories of business processes as well
as all operational contexts. In other words, the literature suggests that all business
processes should be designed using similar principles regardless of the context in which
they operate. However, since several ‘operate’ processes collectively deliver a product
or service, individual processes may each have different design requirements. In
addition, generic design principles do not distinguish between service operations and
manufacturing operations. This suggests, therefore, that generic design principles offer
limited theoretical insight into the design requirements of operational processes in a
service environment. The lack of established design principles for ‘operate’ processes in
a service context is another gap in the literature.
The design activity can be facilitated by developing models that represent business
processes graphically. While business process modelling techniques dominate the BPM
literature, it is emphasised that they are not synonymous with business process design.
Among the many techniques that have surfaced in the literature, IDEF appears to be an
appropriate tool for conceptualising business process architectures. This technique
depicts individual ‘operate’ processes as part of the overall architecture and emphasises
the flows and relationships between these processes. It is arguable that IDEF-0 is a
useful tool for empirical studies addressing the design of operational processes.
In contrast to the relative paucity of research on process design in the BPM literature,
especially with respect to ‘operate’ processes, the Service Operations Management
(SOM) literature offers a more mature body of knowledge which has developed from
the manufacturing roots of the OM discipline. SOM addresses the challenges of
providing services to customers (Roth and Menor, 2003b). The following chapter
reviews the SOM literature that informs the design of processes in a service context.
53
CHAPTER 3
REVIEW OF THE SERVICE OPERATIONS MANAGEMENT LITERATURE
3.1. Introduction
The previous chapter reviewed the business process management literature. The
business process concept was explored and defined. It was suggested that several,
interrelated ‘operate’ processes work together to deliver a product or service to the
external customer. In addition, it was emphasised that the theory addressing the design
of operational processes is currently limited in the BPM discipline.
The purpose of this chapter is to review the Service Operations Management (SOM)
literature which informs the design of processes in a service context.
The chapter is organised into eight sections. Section 3.2 defines and characterises
service. Four distinct perspectives on service are introduced. It is suggested that the
Unified Services Theory (UST) provides a useful conceptualisation of service from an
Operations Management (OM) perspective. The suggestion that there is a relationship
between customer inputs and process design characteristics is examined. In addition,
empirical studies emphasising the link between input uncertainty and service system
complexity are reviewed.
Section 3.3 deals with service design. Conceptual models of strategic service alignment
are examined. This leads to a discussion about the definition of the service concept in
the literature. In addition, important issues to consider for designing the service delivery
system are presented. Finally, it is argued that the service delivery system can be
conceptualised as an architecture of ‘operate’ processes.
Section 3.4 reviews existing empirical studies on process design and discusses process
mapping techniques.
Section 3.5 focuses on process design in the manufacturing literature. Two seminal
theoretical works that help to guide the design of manufacturing processes are
introduced. The transferability of these frameworks to service environments is assessed.
Section 3.6 is concerned with service classification schemes and examines their
appropriateness in guiding process design. The concept of a service classification
54
scheme is presented and the reasons why it is relevant to this work are given. An
overview of the numerous frameworks proposed in the literature is provided and three
prominent models are presented in further detail. Moreover, the design characteristics of
service systems are identified using insights from service classification schemes.
Finally, the lack of process-orientation of service classifications is challenged.
Section 3.7 summarises the major findings from the Service Operations Management
(SOM) literature review.
Section 3.8 concludes the two literature review chapters. The gaps identified in the
Business Process Management literature and in the Service Operations Management
literature are stated. These gaps provide the basis for the objectives of the research. The
research question that is addressed in this work is formulated and the research issues
that are explored empirically are articulated.
3.2. The Unified Services Theory (UST)
3.2.1. Different perspectives on service
As mentioned in Chapter 1, services can be thought of as an entire sector which is not
concerned with the production of manufactured goods. The service industry as a whole
comprises distinct segments such as financial services or telecommunications, which are
all different (Lovelock, 1983). Economists brought about this perspective for the
purpose of classifying and reporting non-manufacturing activities in national statistics
(Johns, 1999). Sampson and Froehle (2006, p.329) point out that this is a residual view
that treats services as “a notion embracing everything that is not agriculture, mining,
construction, or manufacturing. The only feature common to these service activities is
what they are not”. Regarding services as leftovers in the economy contrasts, however,
with the magnitude of the phenomenon in developed economies (Machuca et al., 2007).
From an operations standpoint, industry-based classification schemes are of limited
value since they assume that organisations in a specific sector face similar operational
challenges. For instance, it may be argued that the banking sector exhibits great
diversity as it comprises a number of different service operations such as retail banking,
private banking, corporate banking, and investment banking. It is likely that each
service operations context provides specific operational challenges. This suggests that
55
an industry-focused definition of service offers little insights into the operational
challenges facing service organisations.
To address the diversity of the service industry, academics have expended effort on the
definition and characterisation of services, especially their differentiation from goods.
Despite this work there is still a lack of consensus on a general definition of services
(Johns, 1999). Three other perspectives on service are provided in the following
paragraphs.
3.2.1.1. The outcome-based view: the IHIP model
First, a service can be seen as an outcome that the customer receives (Mohr and Bitner,
1995). It has been well documented that service outcomes share four characteristics,
often referred to as IHIP, that distinguish them from manufactured goods: Intangibility,
Heterogeneity, Inseparability, and Perishability (Sasser et al., 1978; Zeithaml et al.,
1985). According to the IHIP model services are different from goods since services are
intangible (e.g. they lack the tactile quality of goods), heterogeneous (e.g. they cannot
be standardised), inseparable (e.g. they are produced and consumed simultaneously),
and perishable (e.g. they cannot be produced ahead of time and inventoried). In other
words, IHIP defines service as a product that has these unique characteristics. IHIP
attributes are often regarded as the core paradigm in services marketing (Lovelock and
Gummeson, 2004), are present in the main operations management textbooks (Spring
and Araujo, 2009), and are widely accepted by OM academics (Kellogg and Nie, 1995).
Nonetheless, the dominance of IHIP has been increasingly challenged in recent years.
Many authors have argued that these traditional characteristics do not properly
distinguish services from goods and that they are not applicable to all services either
(Lovelock and Gummesson, 2004; Sampson and Froehle, 2006; Vargo and Lusch,
2004b). For instance, Johns (1999) states that both service outcomes and manufactured
products comprise tangible and intangible elements. Similarly, Lovelock and
Gummesson (2004) examine each IHIP characteristic and conclude that there is not a
single attribute which is generalisable to all services.
56
Specifically, the inseparability characteristic requires attention in the context of this
thesis. According to the inseparability claim the production and consumption of services
always occur simultaneously. Inseparability means that services cannot be delivered
without the customer being present, interacting, and participating in the service delivery
process (Berry et al., 2006). This contrasts with the sequential nature of production and
consumption that characterises manufactured products (Vargo and Lusch, 2004b).
Stauss (2005) emphasises, however, that there are many situations where services are
delivered and consumed without interactions between the customer and the service
provider. Environments where the customer is not directly involved in the production of
the service (Berry et al., 2006) and where the production and the consumption of the
service are decoupled both in time and in space (Nie and Kellogg, 1999) may be
referred to as “separable” service contexts (Lovelock and Gummesson, 2004). Lovelock
and Gummesson (2004) observe that there are many separable service environments, in
particular in information-based service organisations. Similarly, Karmakar and Apte
(2007) argue that the inseparability principle is not applicable in information-intensive
service contexts because these services can be produced without the presence of the
customer. Examples of separable services include financial services (Edvardsson et al.,
2005; Karmarkar and Apte, 2007; Vargo and Lusch, 2004b), telecommunications
(Karmarkar and Apte, 2007), dry cleaning (Edvardsson et al., 2005; Vargo and Lusch,
2004b), and freight transport (Edvardsson et al., 2005; Lovelock and Gummeson, 2004).
The presented examples are intended to be suggestive rather than exhaustive, yet this
anecdotal evidence suggests that information-intensive service organisations may be
defined as “separable” since the inseparability concept may not hold true in these
contexts.
After considering the arguments that challenge the IHIP model, Spring and Araujo
(2009, p.447) conclude that “product-centric views and IHIP are falling out of favour”.
Alternative perspectives on service from marketing and from OM are discussed below.
3.2.1.2. The all-encompassing view: the Service Dominant Logic
The recently proposed Service Dominant Logic (SDL) has sparked a strong impetus for
research in services (Vargo and Lusch, 2004a). These authors define service as the
application of specialized competences (i.e. knowledge and skills) through deeds,
processes, and performances for the benefit of another entity or the entity itself. SDL
57
represents a fundamental shift in perspectives on marketing, from a goods-centric
paradigm to a service-centric one, from the exchange of industrial goods to the
exchange of specialised competences. In SDL goods are seen as appliances for the
delivery of services and value is co-created in the interactions between the service
supplier and the customer who unlock value together. The position of the service-
dominant paradigm is that everything is service, thus, any management is service-
management. Stauss (2005, p.222) voices concerns “a definition that includes
everything virtually defines nothing”. Likewise, Sampson (2007) as well as Bowen and
Ford (2002) object that there are many significant differences associated with producing
manufactured goods on the one hand, and producing and delivering services on the
other hand. These differences are particularly relevant from an operations management
(OM) point of view since OM is primarily concerned with managing the processes that
produce and deliver goods and services. Sampson and Menor (forthcoming) argue that
SDL does not differentiate between “service” and “non-service” and does not recognise
that these activities should be managed differently. As a result it is arguable that at this
stage SDL does not provide sufficient insights into the operational challenges associated
with delivering services.
3.2.1.3. The process view: the Unified Services Theory
Finally, a service can be described as a process, “the manner in which the outcome is
transferred to the customer” (Mohr and Bitner, 1995, p.239). A process-centric
perspective is not new since the process concept has long been seen as a useful
description of service in both the marketing (Fisk et al., 1993; Lovelock, 1983) and
operations literature (Morris and Johnston, 1987; Wemmerloev, 1990). For example,
Shostack (1987, p.34) claims that in service organisations “the process is the product”
since service processes generally involve customer contact and customer participation
(Chase, 1978). Customer presence or customer involvement in the service delivery
process is often regarded as the most striking difference between manufacturing and
service operations (Edvardsson and Olsson, 1996; Nie and Kellogg, 1999; Walley and
Amin, 1994). Based on these descriptions it may be argued that the concept of customer
involvement is closely related to the notion of inseparability whose robustness was
questioned above.
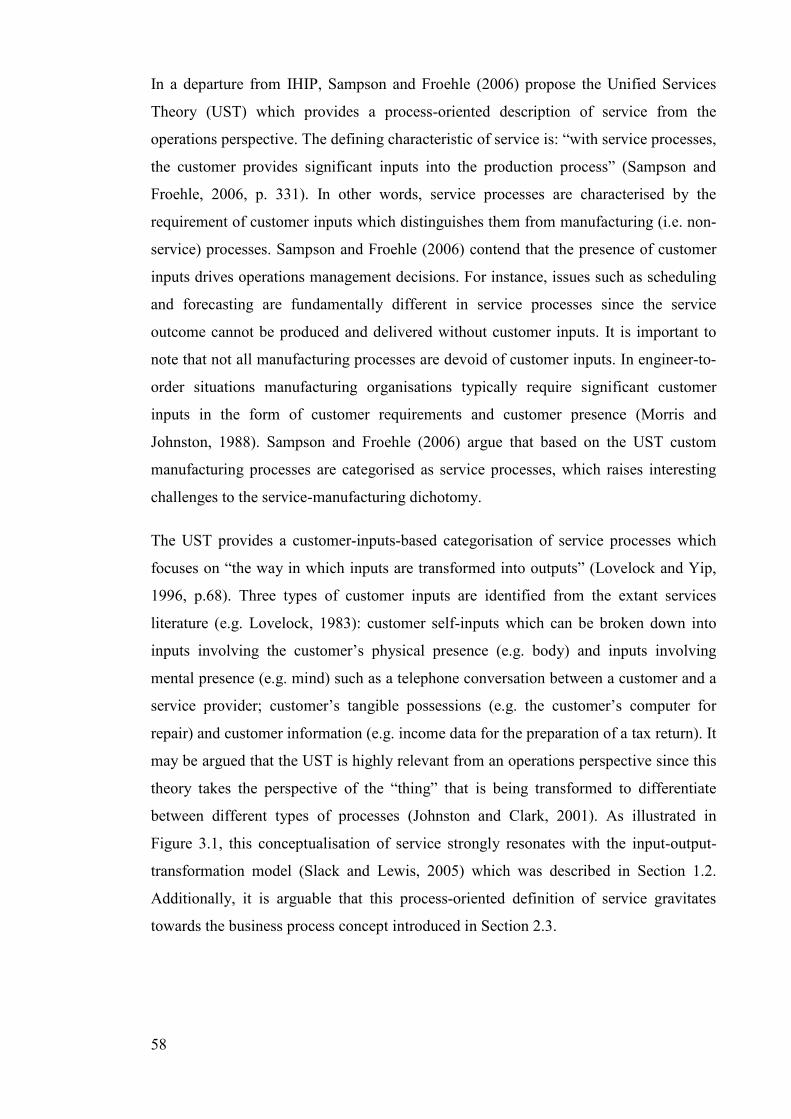
58
In a departure from IHIP, Sampson and Froehle (2006) propose the Unified Services
Theory (UST) which provides a process-oriented description of service from the
operations perspective. The defining characteristic of service is: “with service processes,
the customer provides significant inputs into the production process” (Sampson and
Froehle, 2006, p. 331). In other words, service processes are characterised by the
requirement of customer inputs which distinguishes them from manufacturing (i.e. non-
service) processes. Sampson and Froehle (2006) contend that the presence of customer
inputs drives operations management decisions. For instance, issues such as scheduling
and forecasting are fundamentally different in service processes since the service
outcome cannot be produced and delivered without customer inputs. It is important to
note that not all manufacturing processes are devoid of customer inputs. In engineer-to-
order situations manufacturing organisations typically require significant customer
inputs in the form of customer requirements and customer presence (Morris and
Johnston, 1988). Sampson and Froehle (2006) argue that based on the UST custom
manufacturing processes are categorised as service processes, which raises interesting
challenges to the service-manufacturing dichotomy.
The UST provides a customer-inputs-based categorisation of service processes which
focuses on “the way in which inputs are transformed into outputs” (Lovelock and Yip,
1996, p.68). Three types of customer inputs are identified from the extant services
literature (e.g. Lovelock, 1983): customer self-inputs which can be broken down into
inputs involving the customer’s physical presence (e.g. body) and inputs involving
mental presence (e.g. mind) such as a telephone conversation between a customer and a
service provider; customer’s tangible possessions (e.g. the customer’s computer for
repair) and customer information (e.g. income data for the preparation of a tax return). It
may be argued that the UST is highly relevant from an operations perspective since this
theory takes the perspective of the “thing” that is being transformed to differentiate
between different types of processes (Johnston and Clark, 2001). As illustrated in
Figure 3.1, this conceptualisation of service strongly resonates with the input-output-
transformation model (Slack and Lewis, 2005) which was described in Section 1.2.
Additionally, it is arguable that this process-oriented definition of service gravitates
towards the business process concept introduced in Section 2.3.
59
Service
transformation
processInputsSuppliers
CustomersOutputs
Inputs
- Physical presence
-Mental presence- Information- Material (belongings)
Figure 3.1: A service process based on the UST
Spring and Araujo (2009, p.448) argue that “the UST seems the most radical break with
IHIP thinking in OM”. Specifically, it may be argued that the UST allows for
“separability” since the customer can provide inputs without being directly involved or
present in the service delivery process. For instance, a customer who provides an
accountant with income data (i.e. a customer information input) does not need to be
physically present or to be directly involved in the service production process (i.e.
calculating income tax). The customer input concept is clearly distinct from customer
involvement and customer presence. This suggests that the UST represents a useful
alternative to IHIP for defining services. As a result, it offers a useful platform for
research in separable service environments, one that is especially relevant from an
operations perspective.
To summarise, it may be argued that “separable” service contexts, such as information-
intensive services, have been relatively neglected by SOM research due to the
dominance of IHIP and a focus on customer presence in existing definitions of service.
In contrast, the UST focuses on how customer inputs are transformed in the service
production process. The UST seems to offer a more appropriate model for service
operations research in information-intensive service organisations.
3.2.2. The relationship between customer inputs and process design
The UST provides a useful definition of service from the operations perspective since it
focuses on how customer inputs are transformed in the service delivery process. The
implications of the UST for process design are examined in the following paragraphs.
A major assertion of the UST is that process design characteristics are directly related to
the customer inputs supplied. Sampson and Froehle (2006) state that many insights
60
about managing service operations can be gained from applying the UST to operational
issues. The authors argue that process characteristics are directly related to “a
classification of customer inputs or the treatment of customer inputs” (p.336).
Specifically, the UST suggests a relationship between the type and variability of the
customer inputs supplied and the way the process operates. For instance, it is suggested
that high variability in customer inputs may prevent process automation and that the
presence of customer-self inputs requires the process to be located near the customer. It
is worth noting that many authors have argued that the most important dimension to
consider for service process design is the degree of customer contact. Sampson and
Froehle (2006) indicate, however, that the customer contact model becomes a sub-
division of the UST since customer contact equates to customer-self inputs. The UST
suggests that it is possible to gain insight into process design by analysing the
relationship between the customer inputs supplied and the design characteristics of the
service delivery process.
Furthermore, Collier and Meyer (1998) argue that one of the “pervading concepts” of
service classification schemes is that of “customer and employee involvement”
(p.1228), which focuses attention on the front-office part of the service system. In other
words, service classifications use front-office metrics such as the degree of customer
contact (Chase, 1978; Silvestro et al., 1992; Wemmerloev, 1990), customer involvement
(Kellogg and Nie, 1995), or customer interactions (Schemmer, 1986) to distinguish
between different categories of operations. This approach, however, is inconsistent with
Metters and Vargas’ research (2000) which shows that different design characteristics
can be observed in service systems that have the same degree of customer contact. In
comparison, the UST provides a framework which extends beyond front-office
boundary limitations since it focuses on the transformation process within the entire
service delivery process. This provides the opportunity for an important shift in
emphasis in service design research: it calls on scholars to take the perspective of how
inputs are transformed, a key theme in operations management. Similarly, Frei and
Harker (1999) argue that process design is about understanding how inputs are
converted into outputs in the service delivery process. The customer inputs view is
congruent with the works of Schmenner (2004) and of Loch (1999) who state that
design principles may be established based on the nature of the entity that flows through
the process.
61
It may be argued that the UST can be used to explore process design issues because it
suggests a relationship between the type and variability of customer inputs supplied and
the design characteristics of the service delivery process. It must be noted, however, that
the UST has not been extensively explored or used in empirical research. Wathen and
Anderson (1995) study the link between customer-supplied information and process
design. The authors show that the quantity of customer information received in the
process has implications for the design of service jobs. Whilst the relationship between
customer inputs and process design characteristics has not been examined empirically in
the SOM literature, it is supported by existing studies in the field of management. The
link between the UST and several empirical studies in management is described in the
next section.
3.2.3. The UST: a bridge between SOM and the management literature
The assumption that there is a relationship between customer inputs and process
characteristics resonates with a number of empirical studies in the management
literature. These studies emphasise the link between input uncertainty and service
system complexity (Buzacott, 2000).
According to Argote (1982, p.422) input uncertainty “stems from the external
environment with which the units are in continuous contact, yet it has an immediate
impact on the tasks that the units perform”. In other words, customer-induced input
uncertainty directly influences service delivery. In her study, input uncertainty is
defined as the number of patients in various conditions, which is closely related to the
concept of request variability (Frei, 2007). Argote (1982) empirically demonstrates that
the greater the variability in the condition of patients admitted to the hospital, the more
flexible the service delivery system. Similarly, Jones (1987) shows that there is a
relationship between the uncertainty caused by client-firm transactions and the degree
of complexity in the process of service delivery. Jones argues that the transaction
uncertainty construct is made up of three dimensions: specificity (i.e. variability in
customer requests), frequency of transactions, and duration of transactions.
Moreover, Larsson and Bowen (1989) propose a conceptual framework that builds on
these concepts. They review the management literature that deals with the input
62
uncertainty concept which they define through two main dimensions. For these authors
input uncertainty relates to the variability in customer demands and to the customer’s
willingness to participate in the process. They posit that the degree of customer input
uncertainty has direct implications for service system design and for the coordination of
operating units.
Finally, Skaggs and Huffman (2003) study the relationship between the uncertainty in
customer-service provider interactions and the characteristics of the service delivery
system. Uncertainty is defined as a set of three distinct dimensions: adaptability (degree
of customisation), focus (the range of the offering), and co-production (the extent of the
involvement of the customer in service production). Overall, their empirical results
indicate that more variability in customer demands causes more complexity in the
service system. However, in contrast to Larsson and Bowen (1989), Skaggs and
Huffman assume that “the level of client induced uncertainty is an independent event”
(p.77). In their view organisations have no control over the variability in inputs supplied
to the process by the customer. While this is mainly true in the context of a hospital for
instance (i.e. it is difficult to reject sick people) it seems reasonable to suggest that most
organisations are able to attenuate the level of variability they allow into their delivery
systems.
These studies are conducted at the macro-level and typically use the entire firm or the
entire service system as unit of analysis. For instance, Skaggs and Huffman (2003)
measure complexity based on the number of processes in the service system, the level of
interdependence of the processes, and the overall coordination required. Argote (1982)
defines complexity as the level of coordination in the entire service system. While it
may be inferred from these studies that input uncertainty affects service system design,
it is arguable that they do not provide adequate detail for addressing process design
from an operations standpoint.
After considering the arguments above it may be suggested that the premises of the
UST are supported by the works linking input uncertainty and complexity in the service
delivery system. Although the input uncertainty construct has been operationalised in
different ways in management studies it seems that a common thread is that of
variability in demand. This is consistent with Sampson and Froehle’s (2006) assumption
that the type and variability of customer inputs affect process characteristics. Building
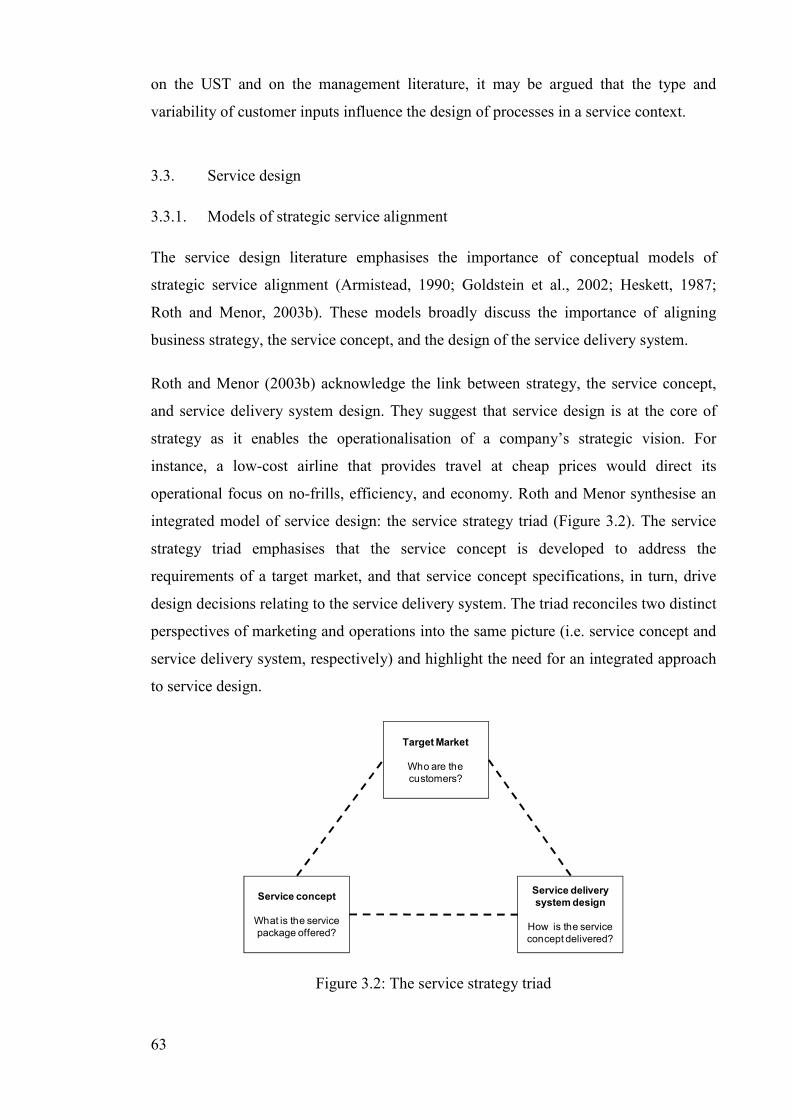
63
on the UST and on the management literature, it may be argued that the type and
variability of customer inputs influence the design of processes in a service context.
3.3. Service design
3.3.1. Models of strategic service alignment
The service design literature emphasises the importance of conceptual models of
strategic service alignment (Armistead, 1990; Goldstein et al., 2002; Heskett, 1987;
Roth and Menor, 2003b). These models broadly discuss the importance of aligning
business strategy, the service concept, and the design of the service delivery system.
Roth and Menor (2003b) acknowledge the link between strategy, the service concept,
and service delivery system design. They suggest that service design is at the core of
strategy as it enables the operationalisation of a company’s strategic vision. For
instance, a low-cost airline that provides travel at cheap prices would direct its
operational focus on no-frills, efficiency, and economy. Roth and Menor synthesise an
integrated model of service design: the service strategy triad (Figure 3.2). The service
strategy triad emphasises that the service concept is developed to address the
requirements of a target market, and that service concept specifications, in turn, drive
design decisions relating to the service delivery system. The triad reconciles two distinct
perspectives of marketing and operations into the same picture (i.e. service concept and
service delivery system, respectively) and highlight the need for an integrated approach
to service design.
Service concept
What is the service
package offered?
Service delivery
system design
How is the service
concept delivered?
Target Market
Who are the
customers?
Figure 3.2: The service strategy triad
64
In a seminal article Heskett (1987) describes his strategic service vision that explicates
the relationship between strategy and service design: it consists of identifying the target
market, developing a service concept for the targeted segment, determining an
operations strategy to support the service concept, and designing a service delivery
system to support the operating strategy. It follows that service design decisions are to
be aligned with the overall strategy of a business so that strategic requirements are
supported and realised at the operational level.
Similarly, Goldstein et al. (2002) argue that high-level strategic requirements can be
transposed onto the operational level through the service concept which then drives
service system design decisions. According to these authors the service concept
facilitates the operationalisation of the strategic intent of the firm. Service operations
require a clearly specified service concept that incorporates the needs of customers in
the target market (Edvardsson and Olsson, 1996; Gouillart and Sturdivant, 1994) and
the organisation’s operational capabilities.
Previous work has suggested that the alignment of the service concept with the service
system is a pre-requisite for improved performance (Heskett, 1987; Karwan and
Markland, 2006; Kellogg and Nie, 1995). For instance, Roth and Menor (2003b) argue
that organisations that realise the alignment benefit from increased competitiveness and
improved competitive capabilities. A study by Silvestro and Silvestro (2003) provides
empirical evidence that not realising the alignment has a detrimental effect on service
delivery performance. The authors evaluate the strategic alignment of a public sector
service organisation through an analysis of its service concept, its operational
objectives, and the design of its delivery system. They find that a misaligned delivery
system has critical implications for the capability of the organisation to deliver the
expected service outcome to the customer and to achieve its operational objectives.
After considering the arguments above, it may be argued that service design decisions
follow strategic requirements and ensure that the service delivery system supports the
realisation of the service concept. The view that there is a relationship between the
nature of the service being offered (i.e. the service concept) and the delivery system that
creates and delivers the service has been suggested by several authors (Collier and
Meyer, 1998; Kellogg and Nie, 1995; Shostack, 1987). In addition, achieving alignment
is assumed to lead to improved performance.
65
3.3.2. Defining the service concept
The service concept relates to the characteristics of the service offered to the target
market. Sasser et al. (1978) first described the service concept as “the bundle of goods
and services sold to the customer and the relative importance of each component to the
consumer” (p.14). This is consistent with the work of Roth and Menor (2003b) who
define the service concept as “the totality of the service elements that are either
important to target customers or are purchased by them” (p.150). The dominant view in
the extant literature is that the service concept can be seen as a package made up of a set
of tangible and intangible elements (Karwan and Markland, 2006). In other words, the
service concept is defined in terms of its constituent parts (Goldstein et al., 2002).
Alternative terms for the service concept include service offering, service package, and
service or product bundle.
Furthermore, the service concept conveys the benefits and value provided to customers
(Collier, 1994). In the literature, it is sometimes referred to as the way the organisation
wants the service outcome to be perceived by the customer (Edvardsson and Olsson,
1996; Lovelock and Wirtz, 2004). From this perspective, the service concept can be
regarded as the company’s value proposition (Heskett, 1987). Brohman et al. (2009)
support this view and argue that service offerings represent the core of a firm’s value
proposition. This is consistent with the idea introduced above that customer
requirements drive the specifications of the service concept. Scheuing and Johnson
(1989) summarise these views and contend that the service concept is a description of
the service offered in terms of both its features and benefits. From this it can be inferred
that different service concepts embodying different value propositions for different
markets require different configurations of the service delivery system (Goldstein et al.
2002; Roth and Menor 2003b; Schmenner, 1986). Put simply, different service concepts
require different mechanisms of service delivery.
Recently, Goldstein et al. (2002) argued in favour of adopting a conceptual definition of
the service concept which is much broader in scope. These authors suggest that the
service concept should capture all of the dimensions of the service as described below:
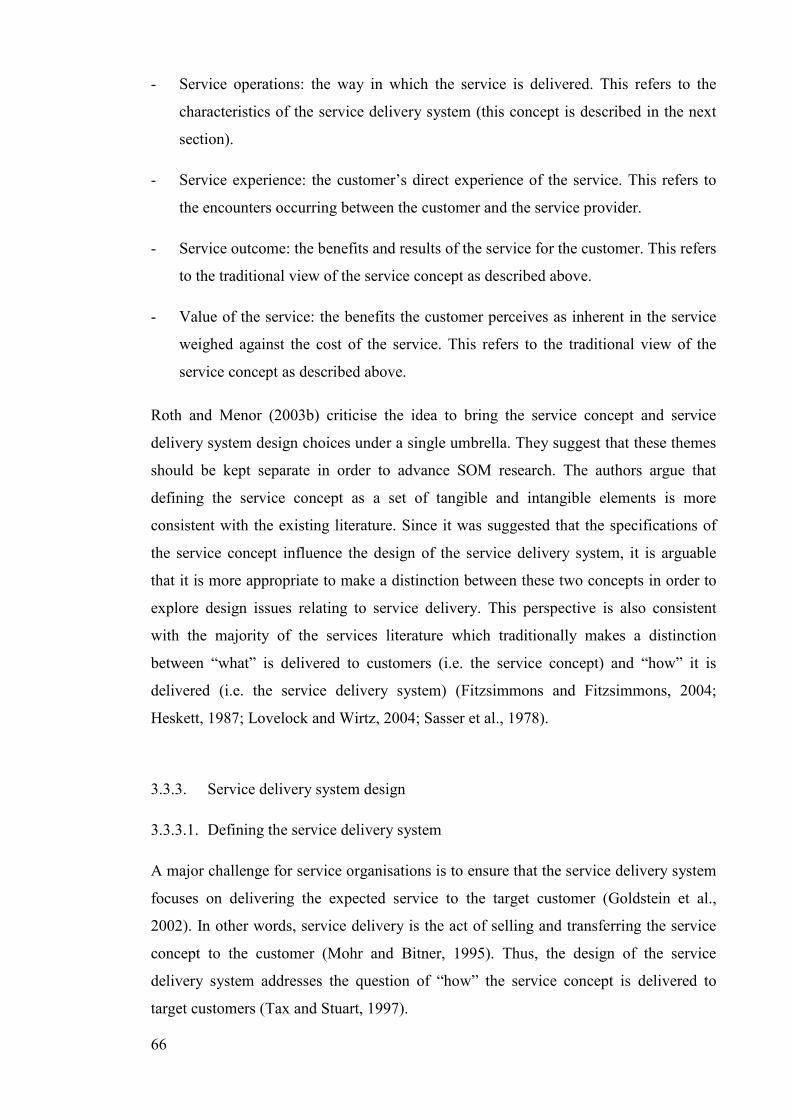
66
- Service operations: the way in which the service is delivered. This refers to the
characteristics of the service delivery system (this concept is described in the next
section).
- Service experience: the customer’s direct experience of the service. This refers to
the encounters occurring between the customer and the service provider.
- Service outcome: the benefits and results of the service for the customer. This refers
to the traditional view of the service concept as described above.
- Value of the service: the benefits the customer perceives as inherent in the service
weighed against the cost of the service. This refers to the traditional view of the
service concept as described above.
Roth and Menor (2003b) criticise the idea to bring the service concept and service
delivery system design choices under a single umbrella. They suggest that these themes
should be kept separate in order to advance SOM research. The authors argue that
defining the service concept as a set of tangible and intangible elements is more
consistent with the existing literature. Since it was suggested that the specifications of
the service concept influence the design of the service delivery system, it is arguable
that it is more appropriate to make a distinction between these two concepts in order to
explore design issues relating to service delivery. This perspective is also consistent
with the majority of the services literature which traditionally makes a distinction
between “what” is delivered to customers (i.e. the service concept) and “how” it is
delivered (i.e. the service delivery system) (Fitzsimmons and Fitzsimmons, 2004;
Heskett, 1987; Lovelock and Wirtz, 2004; Sasser et al., 1978).
3.3.3. Service delivery system design
3.3.3.1. Defining the service delivery system
A major challenge for service organisations is to ensure that the service delivery system
focuses on delivering the expected service to the target customer (Goldstein et al.,
2002). In other words, service delivery is the act of selling and transferring the service
concept to the customer (Mohr and Bitner, 1995). Thus, the design of the service
delivery system addresses the question of “how” the service concept is delivered to
target customers (Tax and Stuart, 1997).
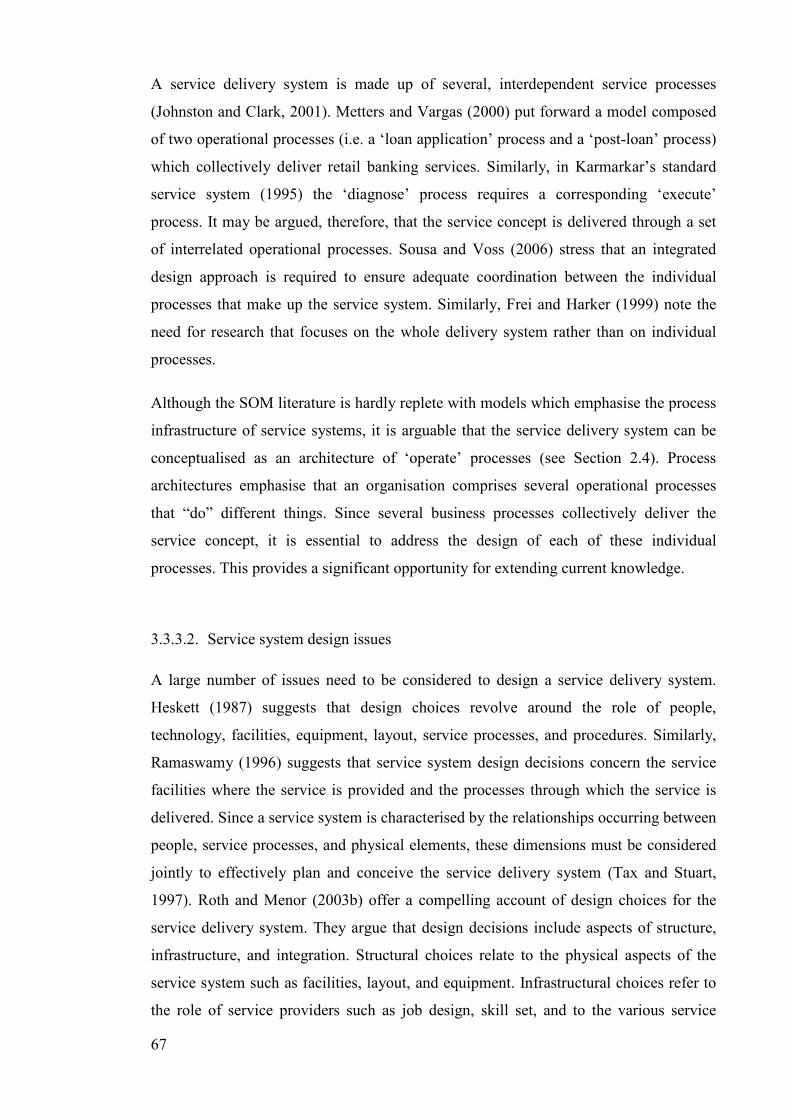
67
A service delivery system is made up of several, interdependent service processes
(Johnston and Clark, 2001). Metters and Vargas (2000) put forward a model composed
of two operational processes (i.e. a ‘loan application’ process and a ‘post-loan’ process)
which collectively deliver retail banking services. Similarly, in Karmarkar’s standard
service system (1995) the ‘diagnose’ process requires a corresponding ‘execute’
process. It may be argued, therefore, that the service concept is delivered through a set
of interrelated operational processes. Sousa and Voss (2006) stress that an integrated
design approach is required to ensure adequate coordination between the individual
processes that make up the service system. Similarly, Frei and Harker (1999) note the
need for research that focuses on the whole delivery system rather than on individual
processes.
Although the SOM literature is hardly replete with models which emphasise the process
infrastructure of service systems, it is arguable that the service delivery system can be
conceptualised as an architecture of ‘operate’ processes (see Section 2.4). Process
architectures emphasise that an organisation comprises several operational processes
that “do” different things. Since several business processes collectively deliver the
service concept, it is essential to address the design of each of these individual
processes. This provides a significant opportunity for extending current knowledge.
3.3.3.2. Service system design issues
A large number of issues need to be considered to design a service delivery system.
Heskett (1987) suggests that design choices revolve around the role of people,
technology, facilities, equipment, layout, service processes, and procedures. Similarly,
Ramaswamy (1996) suggests that service system design decisions concern the service
facilities where the service is provided and the processes through which the service is
delivered. Since a service system is characterised by the relationships occurring between
people, service processes, and physical elements, these dimensions must be considered
jointly to effectively plan and conceive the service delivery system (Tax and Stuart,
1997). Roth and Menor (2003b) offer a compelling account of design choices for the
service delivery system. They argue that design decisions include aspects of structure,
infrastructure, and integration. Structural choices relate to the physical aspects of the
service system such as facilities, layout, and equipment. Infrastructural choices refer to
the role of service providers such as job design, skill set, and to the various service
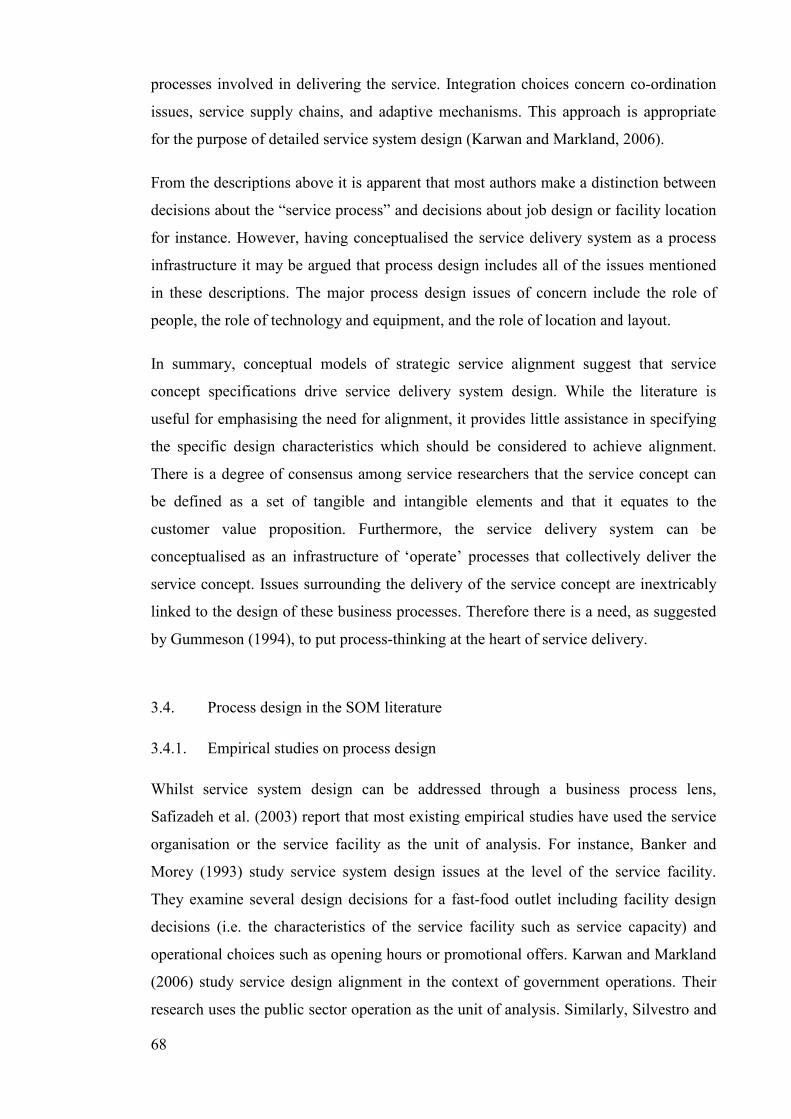
68
processes involved in delivering the service. Integration choices concern co-ordination
issues, service supply chains, and adaptive mechanisms. This approach is appropriate
for the purpose of detailed service system design (Karwan and Markland, 2006).
From the descriptions above it is apparent that most authors make a distinction between
decisions about the “service process” and decisions about job design or facility location
for instance. However, having conceptualised the service delivery system as a process
infrastructure it may be argued that process design includes all of the issues mentioned
in these descriptions. The major process design issues of concern include the role of
people, the role of technology and equipment, and the role of location and layout.
In summary, conceptual models of strategic service alignment suggest that service
concept specifications drive service delivery system design. While the literature is
useful for emphasising the need for alignment, it provides little assistance in specifying
the specific design characteristics which should be considered to achieve alignment.
There is a degree of consensus among service researchers that the service concept can
be defined as a set of tangible and intangible elements and that it equates to the
customer value proposition. Furthermore, the service delivery system can be
conceptualised as an infrastructure of ‘operate’ processes that collectively deliver the
service concept. Issues surrounding the delivery of the service concept are inextricably
linked to the design of these business processes. Therefore there is a need, as suggested
by Gummeson (1994), to put process-thinking at the heart of service delivery.
3.4. Process design in the SOM literature
3.4.1. Empirical studies on process design
Whilst service system design can be addressed through a business process lens,
Safizadeh et al. (2003) report that most existing empirical studies have used the service
organisation or the service facility as the unit of analysis. For instance, Banker and
Morey (1993) study service system design issues at the level of the service facility.
They examine several design decisions for a fast-food outlet including facility design
decisions (i.e. the characteristics of the service facility such as service capacity) and
operational choices such as opening hours or promotional offers. Karwan and Markland
(2006) study service design alignment in the context of government operations. Their
research uses the public sector operation as the unit of analysis. Similarly, Silvestro and
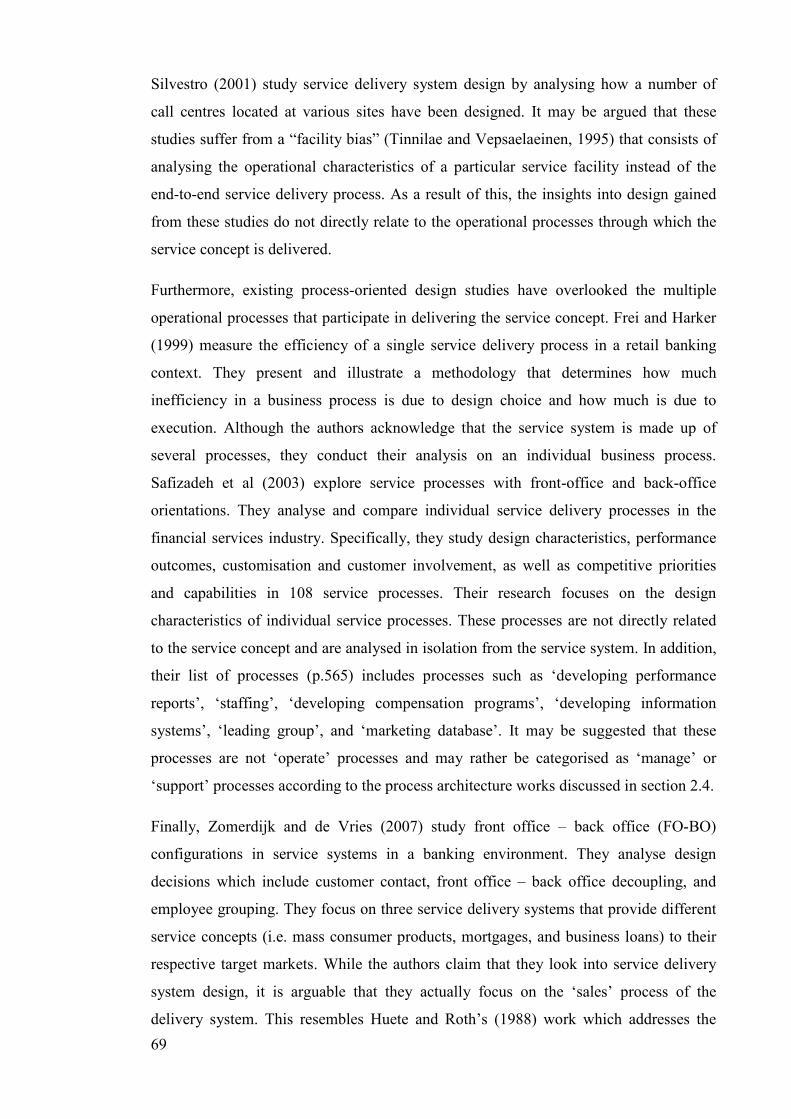
69
Silvestro (2001) study service delivery system design by analysing how a number of
call centres located at various sites have been designed. It may be argued that these
studies suffer from a “facility bias” (Tinnilae and Vepsaelaeinen, 1995) that consists of
analysing the operational characteristics of a particular service facility instead of the
end-to-end service delivery process. As a result of this, the insights into design gained
from these studies do not directly relate to the operational processes through which the
service concept is delivered.
Furthermore, existing process-oriented design studies have overlooked the multiple
operational processes that participate in delivering the service concept. Frei and Harker
(1999) measure the efficiency of a single service delivery process in a retail banking
context. They present and illustrate a methodology that determines how much
inefficiency in a business process is due to design choice and how much is due to
execution. Although the authors acknowledge that the service system is made up of
several processes, they conduct their analysis on an individual business process.
Safizadeh et al (2003) explore service processes with front-office and back-office
orientations. They analyse and compare individual service delivery processes in the
financial services industry. Specifically, they study design characteristics, performance
outcomes, customisation and customer involvement, as well as competitive priorities
and capabilities in 108 service processes. Their research focuses on the design
characteristics of individual service processes. These processes are not directly related
to the service concept and are analysed in isolation from the service system. In addition,
their list of processes (p.565) includes processes such as ‘developing performance
reports’, ‘staffing’, ‘developing compensation programs’, ‘developing information
systems’, ‘leading group’, and ‘marketing database’. It may be suggested that these
processes are not ‘operate’ processes and may rather be categorised as ‘manage’ or
‘support’ processes according to the process architecture works discussed in section 2.4.
Finally, Zomerdijk and de Vries (2007) study front office – back office (FO-BO)
configurations in service systems in a banking environment. They analyse design
decisions which include customer contact, front office – back office decoupling, and
employee grouping. They focus on three service delivery systems that provide different
service concepts (i.e. mass consumer products, mortgages, and business loans) to their
respective target markets. While the authors claim that they look into service delivery
system design, it is arguable that they actually focus on the ‘sales’ process of the
delivery system. This resembles Huete and Roth’s (1988) work which addresses the
70
front-office portion of the service delivery system in retail banks. These authors
conceptualise the service delivery system as the aggregate of delivery channels, which
are where the interactions between the customer and the service provider take place.
While insightful in many respects, these studies do not recognise that the service system
comprises a set of interrelated service delivery processes. As a result, they offer a partial
view of service systems which is inconsistent with the requirements of the service
strategy triad (Roth and Menor, 2003b) and with a business process perspective (Smart
et al., 1999). This claim is supported by Johnston (1999) who states that SOM research
generally fails to study the relationship between the front-office process and the back-
office process in the service delivery system. Similarly, Sousa and Voss (2006) report
that service firms increasingly use multiple channels of delivery but they also note that
existing research is generally concerned with single delivery channels observed in
isolation. It is arguable that process design research should focus on the entire chain of
business processes that deliver the service concept in order to advance knowledge.
3.4.2. Service blueprinting
In addition to empirical studies of process design, it is also important to consider the
technique for process design that dominates the literature. Over the past thirty years
service blueprinting, which is also referred to as service mapping, has gained
widespread support as a mapping tool used for the design of service processes (Kim and
Kim, 2001; Shieff and Brodie, 1995; Tax and Stuart, 1997). This modelling technique
originated a long time ago in traditional production management where flowcharts and
process maps are commonly used to facilitate the design of materials-focused processes.
Shostack (1984; 1987) demonstrated the applicability of process mapping to service
situations by incorporating into the model the customer and the customer’s actions in
the service system. The key feature of service blueprinting is to depict the service
process as it is experienced and viewed by the customer (Fisk et al., 1993). In short, a
service blueprint is an enhanced flowchart that represents all the steps, flows, and the
role of employees involved in service delivery as well as all the interactions that occur
between the customer and the organisation (Zeithaml et al., 2006). Although some
researchers (Fliess and Kleinaltenkamp, 2004; Kingman-Brundage, 1992) have built on,
modified, and refined service blueprinting the technique has not changed dramatically
since its inception.
71
Since service blueprints integrate the customer’s view of the process they seem
particularly adapted to service operations where the customer is physically present and
involved in the delivery process such as “inseparable”, customer-processing service
operations (i.e. CPO) (Tax and Stuart, 1997). A quick survey of the service operations
literature reveals that service maps have primarily been used in “inseparable”
environments such as restaurants, hotels, supermarkets, or hospitals (Baum, 1990;
Chuang, 2007; Getz et al., 2001; Kim and Kim, 2001; Southern, 1999; Tseng et al.,
1999).
While service blueprinting is regarded as a useful technique that supports the activity of
process analysis, Goldstein et al. (2002, p.125) voice their concerns that the SOM
literature assumes that “process design corresponds to the use of flowcharting
techniques”. This argument finds resonance with Fisk et al. (1993) who conducted an
extensive review of the services marketing literature which led them to conclude that
service blueprinting has almost become synonymous with process design. Similarly,
Tax and Stuart (1997) lament the dominance of service blueprinting in the service
design literature. It may be suggested that likening blueprinting to process design is
misleading because blueprinting does not have the power of a theory with principles for
guiding the design of service delivery processes (Chase, 1996). Blueprinting does not
inform the identification of process design characteristics. As pointed out in Section 2.5,
process mapping does not equate with process design.
3.5. Insights into process design from the manufacturing literature
Whilst SOM research in process design is relatively limited, the body of knowledge is
more mature in manufacturing environments (Machuca 2007; Slack et al., 2004b). The
OM literature is dominated by a manufacturing mindset and process design research in
OM is mostly concerned with the design of manufacturing processes. In effect,
examinations of OM research outputs in the periods 1982-1987 (Amoako-Gyampah and
Meredith, 1989) and 1992-1997 (Pannirselvam et al., 1999) found that process design
was one of the most popular research topics. It is important, therefore, to consider
insights into process design from the manufacturing literature and to assess the
transferability of manufacturing frameworks to service operations.
72
3.5.1. Manufacturing-based frameworks for process design
As mentioned previously, the dominant transformation type in a manufacturing context
is material. On this basis important theoretical models such as the product-process
matrix (Hayes and Wheelwright, 1979) and the theory of Swift, Even Flow (Schmenner
and Swink, 1998) were developed to inform the design of the manufacturing delivery
system. These two major theoretical perspectives are examined in turn in the following
paragraphs.
The product-process matrix of Hayes and Wheelwright (1979) had a significant
influence on the field of production and operations management, particularly by guiding
the selection of the appropriate type of production process based on the volume-variety
characteristics of the product. The authors propose a widely-accepted taxonomy of
manufacturing processes that are classified into job shops, batches, assembly lines, and
continuous flow according to their position along a volume-variety continuum. As
illustrated below in Figure 3.3, the vertical axis of the matrix represents the process type
ranging from jumbled flow (e.g. flexible) to continuous flow (e.g. inflexible and highly
productive) processes; the vertical axis describes the product’s volume-variety mix (e.g.
the number of products and their degree of standardisation-customisation). At one
extreme, jobs are defined as highly customised, one-off activities. At the other extreme,
continuous flow refers to the processing of a basic material through an automated plant.
The matrix identifies a natural match between product and process where the factory’s
performance is likely to be enhanced. Thus, most manufacturing companies or factories
want to be situated near the product-process diagonal where product and process type
correspond.
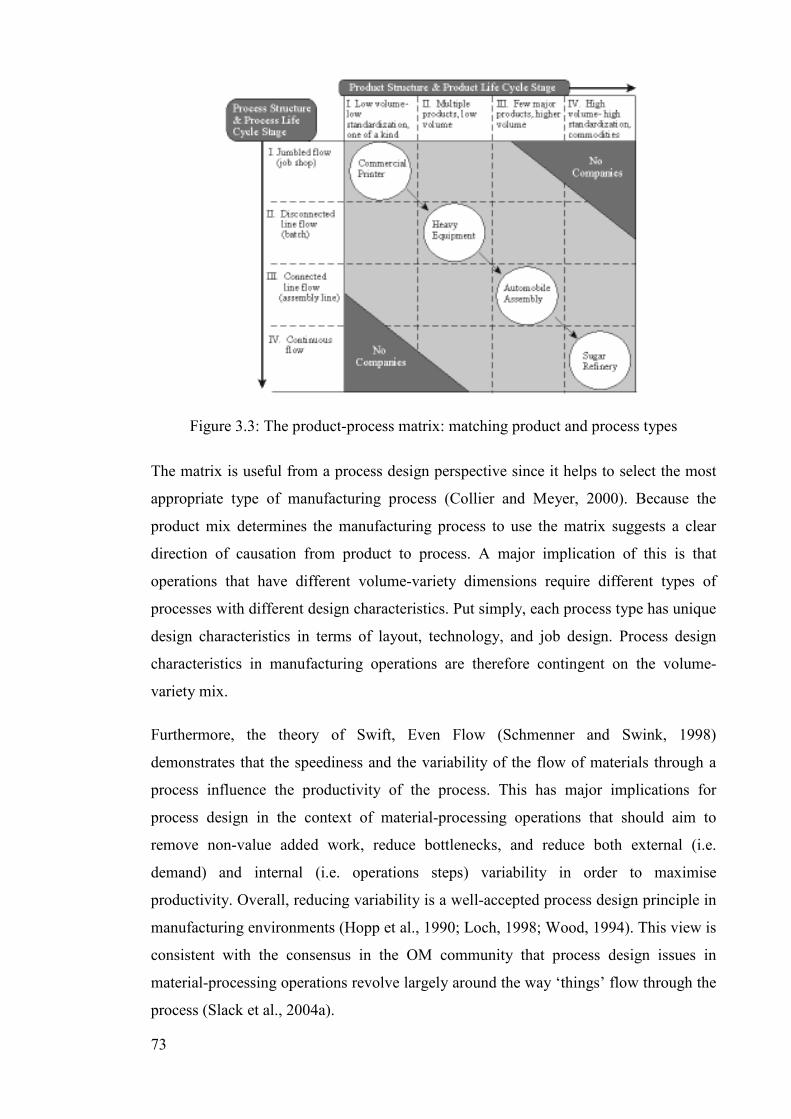
73
Figure 3.3: The product-process matrix: matching product and process types
The matrix is useful from a process design perspective since it helps to select the most
appropriate type of manufacturing process (Collier and Meyer, 2000). Because the
product mix determines the manufacturing process to use the matrix suggests a clear
direction of causation from product to process. A major implication of this is that
operations that have different volume-variety dimensions require different types of
processes with different design characteristics. Put simply, each process type has unique
design characteristics in terms of layout, technology, and job design. Process design
characteristics in manufacturing operations are therefore contingent on the volume-
variety mix.
Furthermore, the theory of Swift, Even Flow (Schmenner and Swink, 1998)
demonstrates that the speediness and the variability of the flow of materials through a
process influence the productivity of the process. This has major implications for
process design in the context of material-processing operations that should aim to
remove non-value added work, reduce bottlenecks, and reduce both external (i.e.
demand) and internal (i.e. operations steps) variability in order to maximise
productivity. Overall, reducing variability is a well-accepted process design principle in
manufacturing environments (Hopp et al., 1990; Loch, 1998; Wood, 1994). This view is
consistent with the consensus in the OM community that process design issues in
material-processing operations revolve largely around the way ‘things’ flow through the
process (Slack et al., 2004a).
74
3.5.2. Transferring manufacturing frameworks to service operations contexts
Since process design principles in a manufacturing context are well established, service
researchers have attempted to transfer existing frameworks to service businesses and
processes (Collier and Meyer, 1998). The application of the product-process matrix in a
service context has proven difficult because of the inherent variability created by the
direct participation of the customer in many service operations (Morris and Johnston,
1988). For instance, Blois (1983) observes that the simultaneity of production and
consumption (i.e. the inseparability characteristic in IHIP) makes it difficult to apply the
matrix in service organisations. This is especially true for “inseparable”, customer-
processing operations where customers are physically involved in service delivery,
interact with employees, and induce variability and uncertainty in the process (Mills and
Moberg, 1982; Sampson and Froehle, 2006; Thomas, 1978; Wemmerloev, 1990).
In addition, a number of authors have highlighted the issues associated with defining
and measuring volume in a service context. While volume is usually defined as the level
of output in a manufacturing context, there is no agreed operational definition of the
volume variable in the service operations literature. In service environments, it is
problematic to evaluate volume because it is unclear whether each customer or each
transaction should be measured (Collier and Meyer, 2000). A related issue is that there
may be different types of service concepts delivered through processes sharing the same
facility. In such cases, measuring volume based on the number of customers processed
is ambiguous unless the complexity of services is carefully factored into the measure
(Tinnilae and Vepsaelaeinen, 1995). Moreover, scholars have argued that output-based
measures are less meaningful and less concrete in services than in manufacturing
environments because of their intangibility (Collier and Meyer, 1998; Silvestro et al.,
1992). As a result, it is very difficult to measure or quantify the level of output of a
service process in useful terms (Karmarkar and Apte, 2007).
Furthermore, the role of volume as a driver of service process design has been
questioned by several authors (Collier and Meyer, 1998; Silvestro et al., 1992). First, it
has been suggested that the relationship between volume and process type is not always
found in the context of service operations. As opposed to manufacturing, service
businesses can often deal with increases in volume without altering the delivery system
(Silvestro et al., 1992). Collier and Meyer (1998) observe that many service businesses
such as retail shops, bank branches, or hotels can simply create new, identical service
75
facilities to deal with higher volumes of demand. Using a multi-site approach does not
require changing the design of the service delivery process. In summary, in service
environments “the volume of customers can fluctuate widely without a change in the
service delivery system” (Collier and Meyer, 1998, p.1225).
Finally, Schmenner (2004) uses Swift, Even Flow in the context of service operations.
He argues that Swift, Even Flow explain why certain service companies are more
productive than others. Although the author suggests that the theory applies to flows of
both materials and information, more research is required to account for the specificities
of information-processing service operations. Issues of process design, capacity, and
inventory, for example, necessitate further attention in this context. In addition, a
number of authors argue that transposing the variability-reduction mindset in service
operations is inadequate and risky because it may prevent the delivery system from
fulfilling customer requirements (Harvey et al., 1997; McLaughlin, 1996; Wood, 1994).
Due to the difficulty to transpose the product-process matrix to service environments,
this framework does not help service managers to choose the appropriate processes to
use in the delivery of the service concept. As a result of this difficulty, service
researchers have developed many classification schemes to deal with the specificities of
service operations. The next section examines service classifications and critically
assesses their usefulness in guiding process design.
3.6. Service classification schemes
3.6.1. The role of service classification schemes
Meyer et al. (1993, p.1179) highlight the importance of classification schemes by
stating that “discovering and investigating configurational patterns, types, and
categories is fundamental to social theory and research”. Although the terms typology,
taxonomy, matrix, and classification schemes have distinct meanings, they have been
used loosely in the services literature (Cook et al., 1999). Since the purpose of this
section is to review these works the terms service classification schemes and service
typologies are used interchangeably.
Since the service industry is characterised by a diverse set of organisations (Sampson
and Froehle, 2006), it is difficult to identify general principles about the management of
76
service operations (Chase and Apte, 2007). Service classification schemes help make
sense of diversity by identifying categories of service delivery systems that share a
number of similar attributes (Collier and Meyer, 2000). This helps to understand
similarities and differences in service operations (Safizadeh et al., 2003). Since service
operations that belong to the same category are expected to face similar management
issues (Schmenner, 1986; Silvestro, 1999), service typologies help to identify specific
managerial themes relevant to each category of service system (Collier and Meyer 2000;
Cook et al., 1999). It is also suggested that service operations that apply the
management principles associated with their classification are likely to improve their
performance (Schmenner, 1986).
Service classification schemes are highly relevant to this thesis because they play a
central role in providing insights into the design of different service delivery systems
(Chase and Tansik, 1983; Collier and Meyer, 1998; Verma and Thompson, 1999;
Wemmerloev, 1990). These frameworks contribute to the articulation of appropriate
design characteristics that vary according to the type of service system considered
(Safizadeh et al., 2003). Collier and Meyer (2000) argue that service classification
schemes can inform the selection of the right service delivery process to best meet
customer requirements.
3.6.2. Overview of service classification schemes
Many frameworks have surfaced in the service operations literature over the past thirty
years. Table 3.1 presents an overview of the major classification schemes that were
developed in the literature. Three major typologies are presented in further detail in the
next pages.
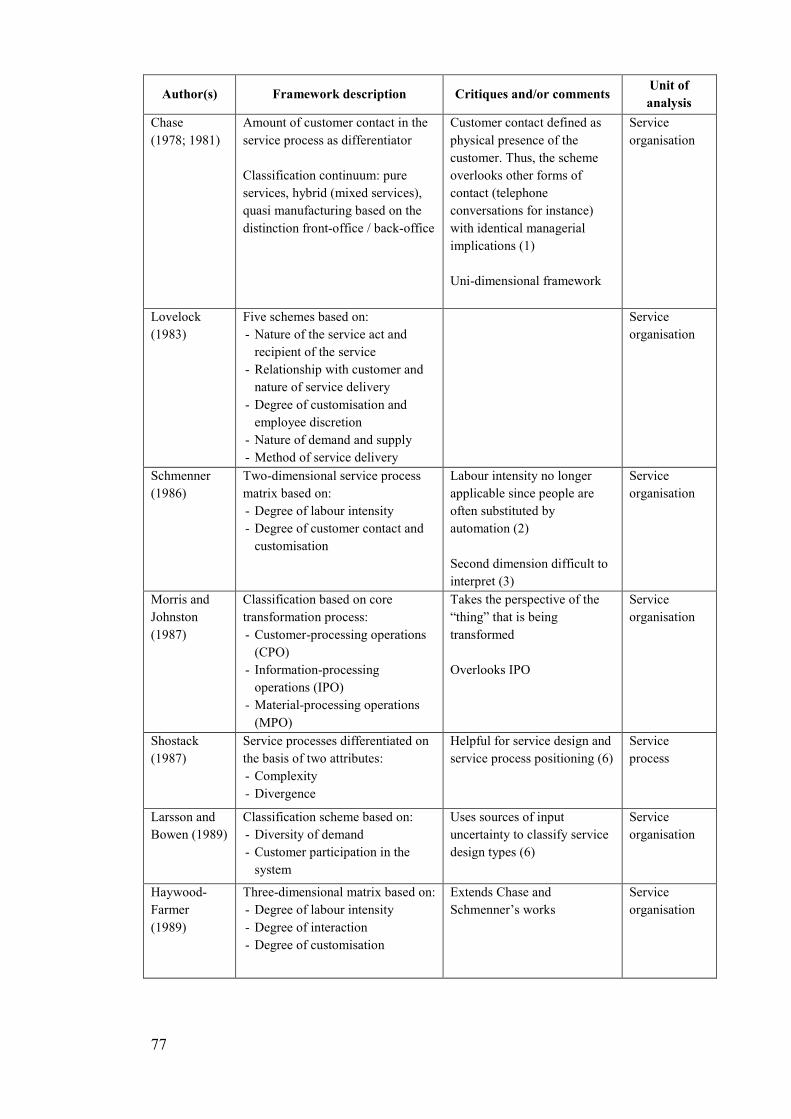
77
Author(s) Framework description Critiques and/or comments Unit of
analysis
Chase
(1978; 1981)
Amount of customer contact in the
service process as differentiator
Classification continuum: pure
services, hybrid (mixed services),
quasi manufacturing based on the
distinction front-office / back-office
Customer contact defined as
physical presence of the
customer. Thus, the scheme
overlooks other forms of
contact (telephone
conversations for instance)
with identical managerial
implications (1)
Uni-dimensional framework
Service
organisation
Lovelock
(1983)
Five schemes based on:
- Nature of the service act and
recipient of the service
- Relationship with customer and
nature of service delivery
- Degree of customisation and
employee discretion
- Nature of demand and supply
- Method of service delivery
Service
organisation
Schmenner
(1986)
Two-dimensional service process
matrix based on:
- Degree of labour intensity
- Degree of customer contact and
customisation
Labour intensity no longer
applicable since people are
often substituted by
automation (2)
Second dimension difficult to
interpret (3)
Service
organisation
Morris and
Johnston
(1987)
Classification based on core
transformation process:
- Customer-processing operations
(CPO)
- Information-processing
operations (IPO)
- Material-processing operations
(MPO)
Takes the perspective of the
“thing” that is being
transformed
Overlooks IPO
Service
organisation
Shostack
(1987)
Service processes differentiated on
the basis of two attributes:
- Complexity
- Divergence
Helpful for service design and
service process positioning (6)
Service
process
Larsson and
Bowen (1989)
Classification scheme based on:
- Diversity of demand
- Customer participation in the
system
Uses sources of input
uncertainty to classify service
design types (6)
Service
organisation
Haywood-
Farmer
(1989)
Three-dimensional matrix based on:
- Degree of labour intensity
- Degree of interaction
- Degree of customisation
Extends Chase and
Schmenner’s works
Service
organisation
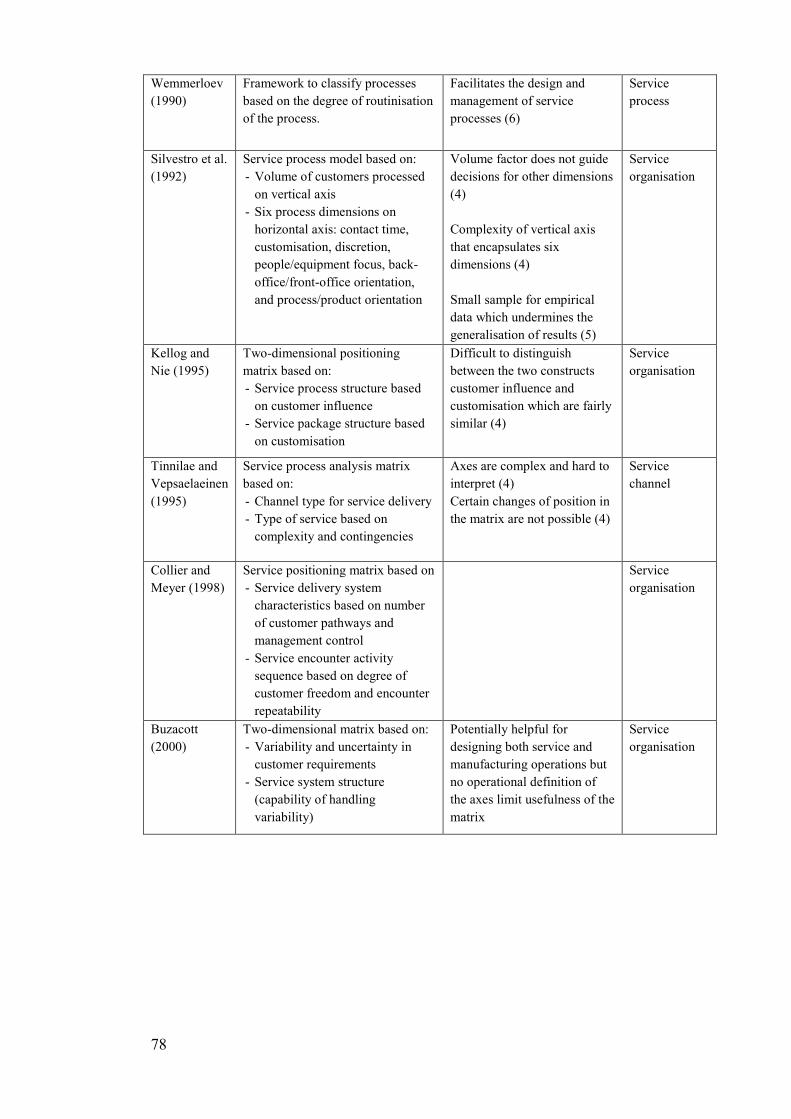
78
Wemmerloev
(1990)
Framework to classify processes
based on the degree of routinisation
of the process.
Facilitates the design and
management of service
processes (6)
Service
process
Silvestro et al.
(1992)
Service process model based on:
- Volume of customers processed
on vertical axis
- Six process dimensions on
horizontal axis: contact time,
customisation, discretion,
people/equipment focus, back-
office/front-office orientation,
and process/product orientation
Volume factor does not guide
decisions for other dimensions
(4)
Complexity of vertical axis
that encapsulates six
dimensions (4)
Small sample for empirical
data which undermines the
generalisation of results (5)
Service
organisation
Kellog and
Nie (1995)
Two-dimensional positioning
matrix based on:
- Service process structure based
on customer influence
- Service package structure based
on customisation
Difficult to distinguish
between the two constructs
customer influence and
customisation which are fairly
similar (4)
Service
organisation
Tinnilae and
Vepsaelaeinen
(1995)
Service process analysis matrix
based on:
- Channel type for service delivery
- Type of service based on
complexity and contingencies
Axes are complex and hard to
interpret (4)
Certain changes of position in
the matrix are not possible (4)
Service
channel
Collier and
Meyer (1998)
Service positioning matrix based on
- Service delivery system
characteristics based on number
of customer pathways and
management control
- Service encounter activity
sequence based on degree of
customer freedom and encounter
repeatability
Service
organisation
Buzacott
(2000)
Two-dimensional matrix based on:
- Variability and uncertainty in
customer requirements
- Service system structure
(capability of handling
variability)
Potentially helpful for
designing both service and
manufacturing operations but
no operational definition of
the axes limit usefulness of the
matrix
Service
organisation
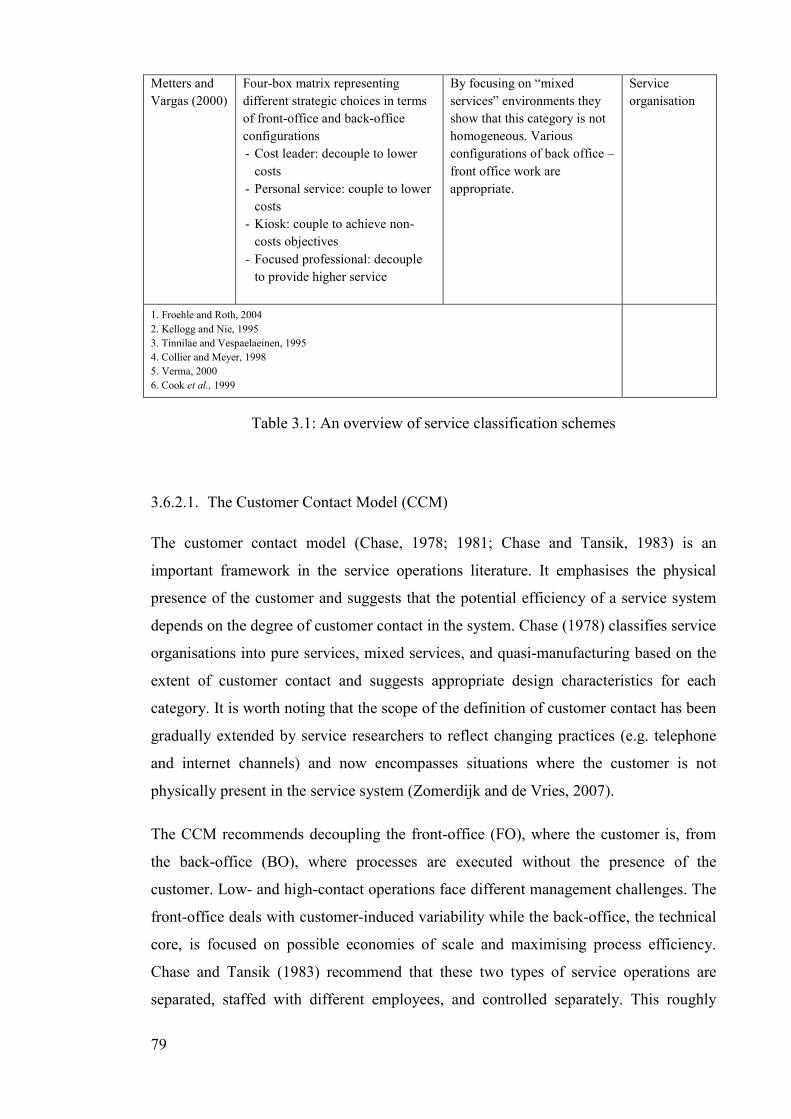
79
Metters and
Vargas (2000)
Four-box matrix representing
different strategic choices in terms
of front-office and back-office
configurations
- Cost leader: decouple to lower
costs
- Personal service: couple to lower
costs
- Kiosk: couple to achieve non-
costs objectives
- Focused professional: decouple
to provide higher service
By focusing on “mixed
services” environments they
show that this category is not
homogeneous. Various
configurations of back office –
front office work are
appropriate.
Service
organisation
1. Froehle and Roth, 2004
2. Kellogg and Nie, 1995
3. Tinnilae and Vespaelaeinen, 1995
4. Collier and Meyer, 1998
5. Verma, 2000
6. Cook et al., 1999
Table 3.1: An overview of service classification schemes
3.6.2.1. The Customer Contact Model (CCM)
The customer contact model (Chase, 1978; 1981; Chase and Tansik, 1983) is an
important framework in the service operations literature. It emphasises the physical
presence of the customer and suggests that the potential efficiency of a service system
depends on the degree of customer contact in the system. Chase (1978) classifies service
organisations into pure services, mixed services, and quasi-manufacturing based on the
extent of customer contact and suggests appropriate design characteristics for each
category. It is worth noting that the scope of the definition of customer contact has been
gradually extended by service researchers to reflect changing practices (e.g. telephone
and internet channels) and now encompasses situations where the customer is not
physically present in the service system (Zomerdijk and de Vries, 2007).
The CCM recommends decoupling the front-office (FO), where the customer is, from
the back-office (BO), where processes are executed without the presence of the
customer. Low- and high-contact operations face different management challenges. The
front-office deals with customer-induced variability while the back-office, the technical
core, is focused on possible economies of scale and maximising process efficiency.
Chase and Tansik (1983) recommend that these two types of service operations are
separated, staffed with different employees, and controlled separately. This roughly
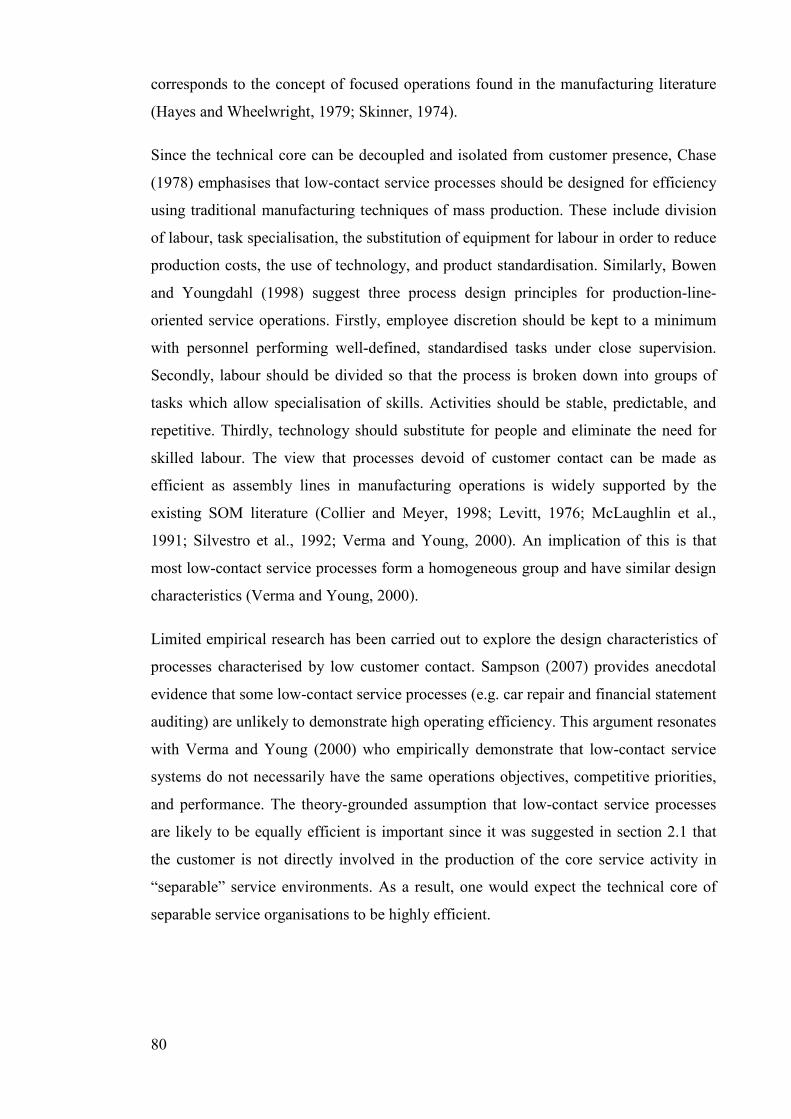
80
corresponds to the concept of focused operations found in the manufacturing literature
(Hayes and Wheelwright, 1979; Skinner, 1974).
Since the technical core can be decoupled and isolated from customer presence, Chase
(1978) emphasises that low-contact service processes should be designed for efficiency
using traditional manufacturing techniques of mass production. These include division
of labour, task specialisation, the substitution of equipment for labour in order to reduce
production costs, the use of technology, and product standardisation. Similarly, Bowen
and Youngdahl (1998) suggest three process design principles for production-line-
oriented service operations. Firstly, employee discretion should be kept to a minimum
with personnel performing well-defined, standardised tasks under close supervision.
Secondly, labour should be divided so that the process is broken down into groups of
tasks which allow specialisation of skills. Activities should be stable, predictable, and
repetitive. Thirdly, technology should substitute for people and eliminate the need for
skilled labour. The view that processes devoid of customer contact can be made as
efficient as assembly lines in manufacturing operations is widely supported by the
existing SOM literature (Collier and Meyer, 1998; Levitt, 1976; McLaughlin et al.,
1991; Silvestro et al., 1992; Verma and Young, 2000). An implication of this is that
most low-contact service processes form a homogeneous group and have similar design
characteristics (Verma and Young, 2000).
Limited empirical research has been carried out to explore the design characteristics of
processes characterised by low customer contact. Sampson (2007) provides anecdotal
evidence that some low-contact service processes (e.g. car repair and financial statement
auditing) are unlikely to demonstrate high operating efficiency. This argument resonates
with Verma and Young (2000) who empirically demonstrate that low-contact service
systems do not necessarily have the same operations objectives, competitive priorities,
and performance. The theory-grounded assumption that low-contact service processes
are likely to be equally efficient is important since it was suggested in section 2.1 that
the customer is not directly involved in the production of the core service activity in
“separable” service environments. As a result, one would expect the technical core of
separable service organisations to be highly efficient.
81
3.6.2.2. The service process matrix
The service process matrix (Schmenner, 1986) is another important service typology
that expands the CCM. The author identifies four classes of service processes based on
the relationship between the degree of interaction (i.e. customer contact) and
customisation, and the degree of labour intensity in the service process. The joint
measure of customer contact and customisation considers the amount of interactions
between the customer and the service provider and the associated degree of
customisation of the offering. Labour intensity is defined as the ratio of the labour cost
to the value of plant and equipment. A high labour intensity operation involves
relatively small plant and equipment investment but requires a significant amount of
worker time and cost.
The resulting two-by-two matrix is represented in Figure 3.4. According to the matrix,
service factories exhibit low customer contact and low labour intensity, service shops
are characterised by high customer contact and low labour intensity, mass services have
low customer contact and high labour intensity, and professional services exhibit high
customer contact and high labour intensity.
Figure 3.4: The service process matrix
Schmenner (1986) argues that management challenges differ across these four different
types of service systems. There are strategic and operational implications for service
organisations depending on where they fit within the framework. Specifically,
Schmenner suggests that the matrix helps service businesses to determine the choice of
the appropriate process design.
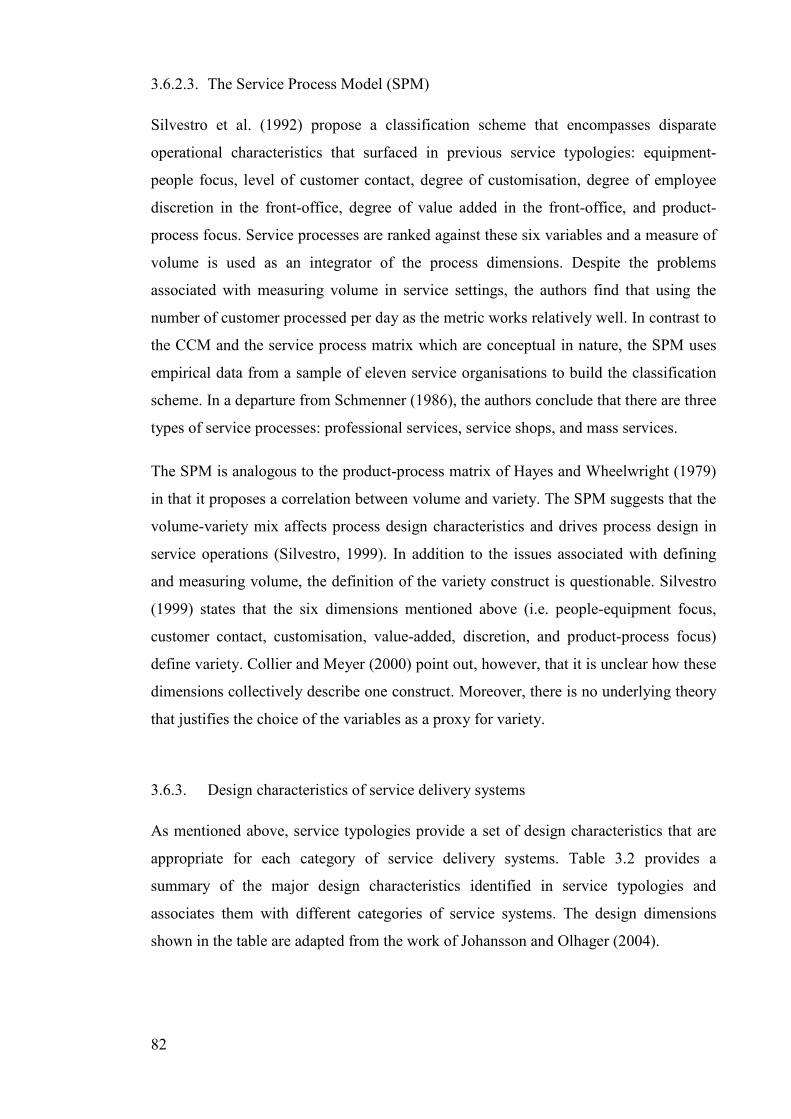
82
3.6.2.3. The Service Process Model (SPM)
Silvestro et al. (1992) propose a classification scheme that encompasses disparate
operational characteristics that surfaced in previous service typologies: equipment-
people focus, level of customer contact, degree of customisation, degree of employee
discretion in the front-office, degree of value added in the front-office, and product-
process focus. Service processes are ranked against these six variables and a measure of
volume is used as an integrator of the process dimensions. Despite the problems
associated with measuring volume in service settings, the authors find that using the
number of customer processed per day as the metric works relatively well. In contrast to
the CCM and the service process matrix which are conceptual in nature, the SPM uses
empirical data from a sample of eleven service organisations to build the classification
scheme. In a departure from Schmenner (1986), the authors conclude that there are three
types of service processes: professional services, service shops, and mass services.
The SPM is analogous to the product-process matrix of Hayes and Wheelwright (1979)
in that it proposes a correlation between volume and variety. The SPM suggests that the
volume-variety mix affects process design characteristics and drives process design in
service operations (Silvestro, 1999). In addition to the issues associated with defining
and measuring volume, the definition of the variety construct is questionable. Silvestro
(1999) states that the six dimensions mentioned above (i.e. people-equipment focus,
customer contact, customisation, value-added, discretion, and product-process focus)
define variety. Collier and Meyer (2000) point out, however, that it is unclear how these
dimensions collectively describe one construct. Moreover, there is no underlying theory
that justifies the choice of the variables as a proxy for variety.
3.6.3. Design characteristics of service delivery systems
As mentioned above, service typologies provide a set of design characteristics that are
appropriate for each category of service delivery systems. Table 3.2 provides a
summary of the major design characteristics identified in service typologies and
associates them with different categories of service systems. The design dimensions
shown in the table are adapted from the work of Johansson and Olhager (2004).
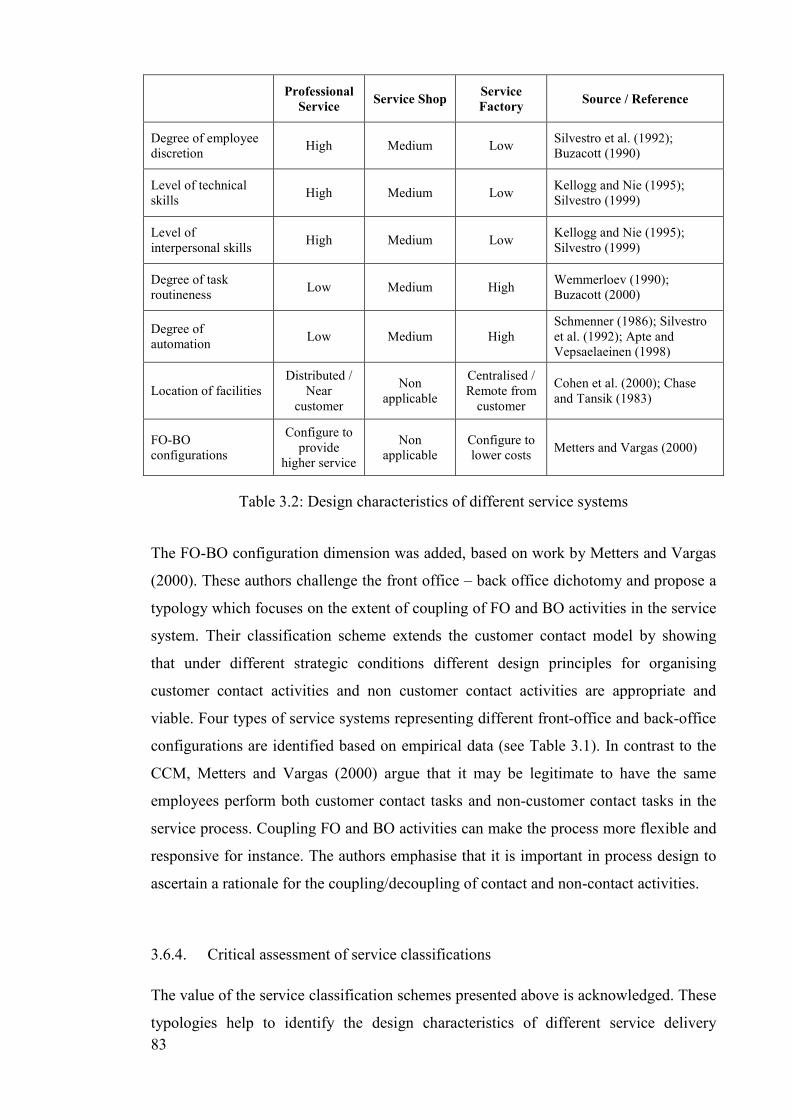
83
Professional
Service Service Shop
Service
Factory Source / Reference
Degree of employee discretion
High Medium Low Silvestro et al. (1992); Buzacott (1990)
Level of technical skills
High Medium Low Kellogg and Nie (1995); Silvestro (1999)
Level of interpersonal skills
High Medium Low Kellogg and Nie (1995); Silvestro (1999)
Degree of task routineness
Low Medium High Wemmerloev (1990); Buzacott (2000)
Degree of automation
Low Medium High Schmenner (1986); Silvestro et al. (1992); Apte and Vepsaelaeinen (1998)
Location of facilities Distributed /
Near customer
Non applicable
Centralised / Remote from
customer
Cohen et al. (2000); Chase and Tansik (1983)
FO-BO configurations
Configure to provide
higher service
Non applicable
Configure to lower costs
Metters and Vargas (2000)
Table 3.2: Design characteristics of different service systems
The FO-BO configuration dimension was added, based on work by Metters and Vargas
(2000). These authors challenge the front office – back office dichotomy and propose a
typology which focuses on the extent of coupling of FO and BO activities in the service
system. Their classification scheme extends the customer contact model by showing
that under different strategic conditions different design principles for organising
customer contact activities and non customer contact activities are appropriate and
viable. Four types of service systems representing different front-office and back-office
configurations are identified based on empirical data (see Table 3.1). In contrast to the
CCM, Metters and Vargas (2000) argue that it may be legitimate to have the same
employees perform both customer contact tasks and non-customer contact tasks in the
service process. Coupling FO and BO activities can make the process more flexible and
responsive for instance. The authors emphasise that it is important in process design to
ascertain a rationale for the coupling/decoupling of contact and non-contact activities.
3.6.4. Critical assessment of service classifications
The value of the service classification schemes presented above is acknowledged. These
typologies help to identify the design characteristics of different service delivery
84
systems (Table 3.2). With the limited exception of Shostack (1987) and Wemmerloev
(1990), service classification schemes are macro-oriented since they classify entire
organisations in an aggregate way (Cook et al., 1999; Heineke and Davis, 2007;
Wemmerloev, 1990) (see Table 3.1). Service classifications do not directly consider the
business processes that deliver service concepts. It is assumed that the design
characteristics provided transcend all the business processes that comprise the service
delivery system. It may be argued, therefore, that high-level service classifications
promote homogeneous thinking in the design of service systems. This is problematic
with regards to process design for two reasons.
First, the design of the individual ‘operate’ processes which collectively deliver the
service concept is not considered. Section 3.3.3 emphasised that the service delivery
systems is composed of a set of ‘operate’ processes. Most typologies do not account for
this as they provide general, aggregate design characteristics that do not distinguish
between these business processes. A macro-orientation may mask the specific design
characteristics of individual ‘operate’ processes (Safizadeh et al., 2003). As indicated
earlier, it is important to recognise that the service concept influences the design of each
of these processes.
Second, large organisations operate complex service delivery systems that offer a
diverse set of service concepts to different target markets (Larsson and Bowen, 1989;
Harvey, 1997; Kellogg and Nie, 1995). It is arguable that ‘operate’ processes focused on
different service concepts may require different design characteristics. This diversity is
overlooked by high-level classifications which offer a homogeneous view of service
systems. For instance, low-contact service systems are similar and should be designed
for efficiency (Chase, 1978) and utilities are characterised by low customer contact, low
customisation, and low labour intensity (Haywood-Farmer, 1988). Since many
organisations offer diverse service concepts to different target markets, there is the need
to explore the design of the multiple ‘operate’ processes embedded in the service
delivery system. It appears critical that SOM research addresses the differences and
similarities in operational processes found in large service systems.
Furthermore, it is worth noting that recent theory-testing research efforts have
challenged the validity of service classification schemes. Verma (2000) empirically test
whether management challenges differ across the four categories identified by
Schmenner (1986). The results show that only a small proportion of the management
85
challenges suggested by the matrix are relevant in practice. In other words, the
operations management challenges faced by service managers are not directly related to
the dimensions of customer contact-customisation and labour intensity. Similarly, a
study by Wright and Mechling (2002) investigate important operations management
problems in small service organisations. They found that OM issues in service
organisations are not connected to the dimensions proposed in Schmenner’s (1986)
matrix. Finally, an empirical study conducted by Collier and Meyer (2000) that
compares and evaluates three service matrices proposed in the literature (Collier and
Meyer, 1998; Kellogg and Nie, 1995; Silvestro et al., 1992) found that the models tested
are not as pertinent as the product-process matrix. They conclude by stating that an
equivalent framework for service operations has yet to be developed. As stated by
Chopra et al. (2004) the search for distinctive attributes of service operations continue.
In summary, this research concurs with the view that a lower-level perspective is
essential to gain a better understanding of the intricacies of service processes (Safizadeh
et al., 2003; Wemmerloev, 1990). A macro-view of service operations may be
misleading since it does not consider the process-infrastructure of service delivery
systems. There is a need, therefore, to explore the design of each of the individual
processes that deliver the service concept. In addition, since many organisations offer
diverse service concepts to different target markets, there is also the need to explore the
design of ‘operate’ processes focused on different service concepts. It is essential to
address the unique requirements of ‘service concept – service delivery processes’ pairs
and to co-locate these in a business process architecture focused on delivering value to
customers. Work that focuses on the design of service delivery systems from a business
process perspective represents an important opportunity for research.
3.7. Summary and conclusions
This section summarises the major findings and the gaps identified from the review of
the SOM literature.
The UST suggests a relationship between the type and variability of customer inputs
supplied and the design characteristics of the service delivery process. This resonates
with several empirical works in the management literature which emphasise the
relationship between input uncertainty and service system complexity. Building on the
UST and on the management literature, it may be argued that the type and variability of
86
customer inputs influence the design of processes in a service context. However, limited
empirical work has been undertaken to explore this proposition from an operations
management, process-oriented perspective.
Conceptual models of strategic service alignment discuss the importance of aligning the
design of the service delivery system with business strategy. More specifically, these
models emphasise that aligning the service concept and the design of the service system
leads to improved performance. Although service designs models have been subject to
limited empirical verification, they strongly suggest that the specifications of the service
concept drive the design of the service delivery system. In addition, while the literature
is useful for emphasising the need for alignment, it provides little assistance in
specifying the specific design characteristics which should be considered to achieve
alignment. This is an important gap in the literature.
Based on the extant literature, the service concept can be described as a set of tangible
and intangible elements that create value for the customer. The service delivery system
can be conceptualised as an architecture of ‘operate’ processes that collectively deliver
the service concept. It is therefore suggested that issues surrounding the design of the
service delivery system are inextricably linked to process design. From this it can be
inferred that the service concept influences the design of the entire process architecture.
In other words, it is important that process design research considers the design of each
of the individual operational processes that deliver the service concept.
A number of empirical studies addressing service process design have appeared in the
SOM literature. A major limitation of these studies is that their conceptualisation of the
service process is inconsistent with the business process perspective found in the BPM
discipline. Some research works suffer from a facility bias with consists of analysing
the service facility instead of the end-to-end delivery process. Other works do not focus
on the entire chain of ‘operate’ processes that deliver the service concept, and
consequently, offer a partial view of the service delivery system. This is another gap in
the literature.
The OM literature is dominated by a manufacturing mindset and insights into process
design from the manufacturing literature are considered. The well-established product-
process matrix suggests that process design characteristics in MPO are contingent on
the volume-variety mix of the products to manufacture. Because this framework does
87
not transfer well to service operations, scholars have developed classifications of service
delivery systems.
Service classifications have facilitated the identification of important design
characteristics in various categories of service systems. Due to their macro orientations,
service classifications do not directly consider the business processes that deliver the
service concept. They offer a homogeneous view of service operations and promote
homogeneous thinking in the design of service delivery systems. There is a need,
therefore, to explore the design of the individual processes that collectively deliver the
service concept. In addition, there is also the need to explore the design of processes
focused on different service concepts within a large service system. It is essential to
address the unique requirements of ‘service concept – processes’ pairs and to co-locate
these in a business process architecture focused on delivering value to customers.
3.8. Gaps, research objective, and research question
The two main bodies of literature that inform process design in a service context have
been examined. Seven significant gaps have been identified:
1. There is no established conceptual model representing the ‘operate’ processes of
service delivery systems.
2. The BPM literature offers limited theoretical insights into the design
characteristics of ‘operate’ processes in service organisations. Design principles
for ‘operate’ processes in service environments have not been articulated.
3. While the relationship between customer inputs and process design
characteristics has been suggested in the theoretical literature, it has not been
explored empirically.
4. Similarly, conceptual models of strategic service alignment have been subject to
limited empirical verification.
5. There is limited empirical research that considers the design of the individual,
interrelated processes that collectively provide the service concept to the
customer.
88
6. It is questionable whether high-level service classifications can inform the
design of service delivery systems providing different service concepts to
different target markets.
7. The SOM literature offers limited insights into the design characteristics of
processes characterised by low customer contact. The assumption that low-
contact service processes form a homogeneous group and are designed for
efficiency has received limited research attention.
These gaps provide the basis for the main objective of the research:
• To explore the design characteristics of operational processes in information-
intensive service delivery systems.
The objective of the study is researched using a theory-building approach. The
following research question is formulated and addressed empirically:
• What are the design characteristics of service delivery processes in an
information-intensive service system?
89
CHAPTER 4
RESEARCH METHODOLOGY
4.1. Introduction
The previous two chapters revealed a number of gaps in the literature which served as a
basis for developing the research question that forms the focus of this thesis. This
chapter describes and justifies the methodology followed to address the research
question. It aims to provide assurance that appropriate methods and techniques were
used throughout the research project.
In short, research methodology relates to the procedural framework within which the
research is conducted (Remenyi et al., 1998). In this thesis a broad interpretation of the
research methodology concept is taken, which encompasses both the research paradigm
and the research design. In other words, this chapter is concerned with the philosophical
perspective of the research in terms of ontological and epistemological assumptions (i.e.
research paradigm) and with the specific methods and techniques employed in the
research (i.e. research design).
As illustrated in Figure 4.1, the research onion depicts the entire spectrum of
philosophical themes and methodological issues that have to be taken into account when
contemplating a research project. Saunders et al. (2000) recommend that all themes and
issues are addressed by gradually examining the different layers that constitute the
research onion, from embracing a research paradigm to selecting appropriate research
methods. This is important since positioning the research philosophy directly influences
research design choices.
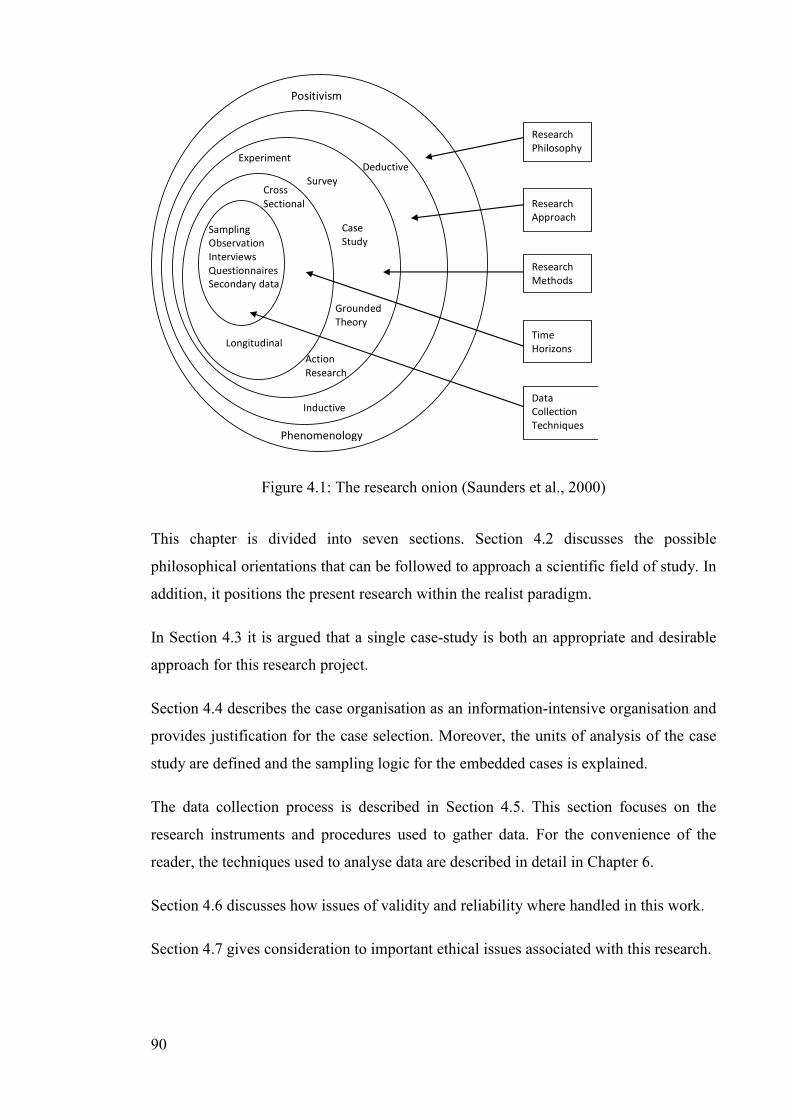
90
Positivism
Phenomenology
Deductive
Inductive
Experiment
Survey
Case
Study
Grounded
Theory
Action
Research
Cross
Sectional
Longitudinal
Sampling
Observation
Interviews
Questionnaires
Secondary data
Research
Philosophy
Research
Approach
Research
Methods
Time
Horizons
Data
Collection
Techniques
Figure 4.1: The research onion (Saunders et al., 2000)
This chapter is divided into seven sections. Section 4.2 discusses the possible
philosophical orientations that can be followed to approach a scientific field of study. In
addition, it positions the present research within the realist paradigm.
In Section 4.3 it is argued that a single case-study is both an appropriate and desirable
approach for this research project.
Section 4.4 describes the case organisation as an information-intensive organisation and
provides justification for the case selection. Moreover, the units of analysis of the case
study are defined and the sampling logic for the embedded cases is explained.
The data collection process is described in Section 4.5. This section focuses on the
research instruments and procedures used to gather data. For the convenience of the
reader, the techniques used to analyse data are described in detail in Chapter 6.
Section 4.6 discusses how issues of validity and reliability where handled in this work.
Section 4.7 gives consideration to important ethical issues associated with this research.
91
4.2. Justification of the research philosophy
First, two prominent, opposed paradigms are presented and the implications of
embracing either paradigm for conducting research are outlined. Then, the use and
appropriateness of these paradigms for operations management research is discussed.
Finally, justification is given for locating this research project within the realist
paradigm.
4.2.1. Discussion of the major research paradigms
In order to design and conduct a research project in a rigorous manner it is vital to start
with an adequate understanding of the scientific paradigm that underpins the research. A
paradigm represents a worldview and may be defined as a set of basic assumptions and
beliefs that are shared by members of a research community (Guba and Lincoln, 1994).
Determining the epistemological and ontological foundation of the research is important
because it directly affects the choice of particular techniques for collecting and
analysing data (Saunders et al., 2000). Ontology refers to the researcher’s basic
assumptions about the form and nature of reality while epistemology relates to the
nature, source, and limits of knowledge (Bryman and Bell, 2007). Epistemology
explicates the relationship between the researcher and reality (Guba and Lincoln, 1994).
As depicted in the research onion, positivism and phenomenology appear to be the two
major, opposed paradigms that may be followed to conduct scientific research and to
concur to knowledge creation and development (Remenyi et al., 1998; Saunders et al.,
2000). Since they rely on different ontological and epistemological assumptions these
two paradigms offer researchers different directions as to how to approach a research
project (Easterby-Smith et al., 2002). A succinct account of the main characteristics of
these two perspectives is provided in the following paragraphs.
Positivism aims at describing, explaining, and predicting phenomena in an objective
world that is assumed to exist independently of the context and of the observer
(Meredith, 1998). In other words, positivism considers that the researcher and the
phenomenon are separated out and the phenomenon does not change as it is being
observed. It is a way of exploring a unique, common reality using objective research
methods (Easterby-Smith et al., 2002). Positivist studies purport to discover the truth
which can usually be translated into a series of generalisable laws (Saunders et al.,
92
2000). Social scientists who follow principles from positivism apply the methods of
natural sciences to the study of social reality (Bryman and Bell, 2007).
A direct implication of adopting a positivist stance is the need to control events,
behaviours, and variables (Remenyi et al., 1998). Positivism usually relies on the
hypothetico-deductive approach which consists of using existing theory to develop a set
of hypotheses. Hypotheses can be empirically tested to identify important relationships
between variables and to examine the validity of extant frameworks and models
(Bryman and Bell, 2007; Riege, 2003). In other words, deduction involves going from
the general to the particular. Thus, positivism is traditionally associated with deductive,
quantitative, theory-testing research (Easterby-Smith et al., 2002).
In contrast, phenomenological studies follow a different logic of inquiry.
Phenomenology can be defined as “a theoretical point of view that advocates the study
of direct experience taken at face value; and one which sees behaviours as determined
by the phenomena of experience” (Cohen and Manion, 1987 in Remenyi et al., 1998).
This position assumes that there are multiple realities which are all to be considered
(Remenyi et al., 1998). Within the phenomenology paradigm reality is often subjective
and constructed by people (Easterby-Smith et al., 2002).
Furthermore, phenomenological research is context-driven, the researcher is part of the
phenomenon studied, and data collection usually occurs in uncontrolled natural settings
(Remenyi et al., 1998). It traditionally relies on an inductive research approach which
consists of developing general theoretical frameworks from specific observations
gathered in the real world (Colquitt and Zapata-Phelan, 2007). Generally, the purpose of
inductive research is to establish new sets of relationships, propositions, and
frameworks as well as to enable the development of new hypotheses that can be verified
in subsequent research (Gupta et al., 2006). As a result, phenomenology is generally
associated with inductive, theory-building research (Easterby-Smith et al., 2002). As it
emerges from the research onion a number of methods such as case-study, grounded
theory, or action research primarily rely on inductive reasoning (Colquitt and Zapata-
Phelan, 2007).
Remeniy et al. (1998) note that views usually differ regarding the meaning and direct
implications of phenomenology. This is hardly surprising since phenomenology is a
wide paradigm that embraces different philosophical positions. Three scientific
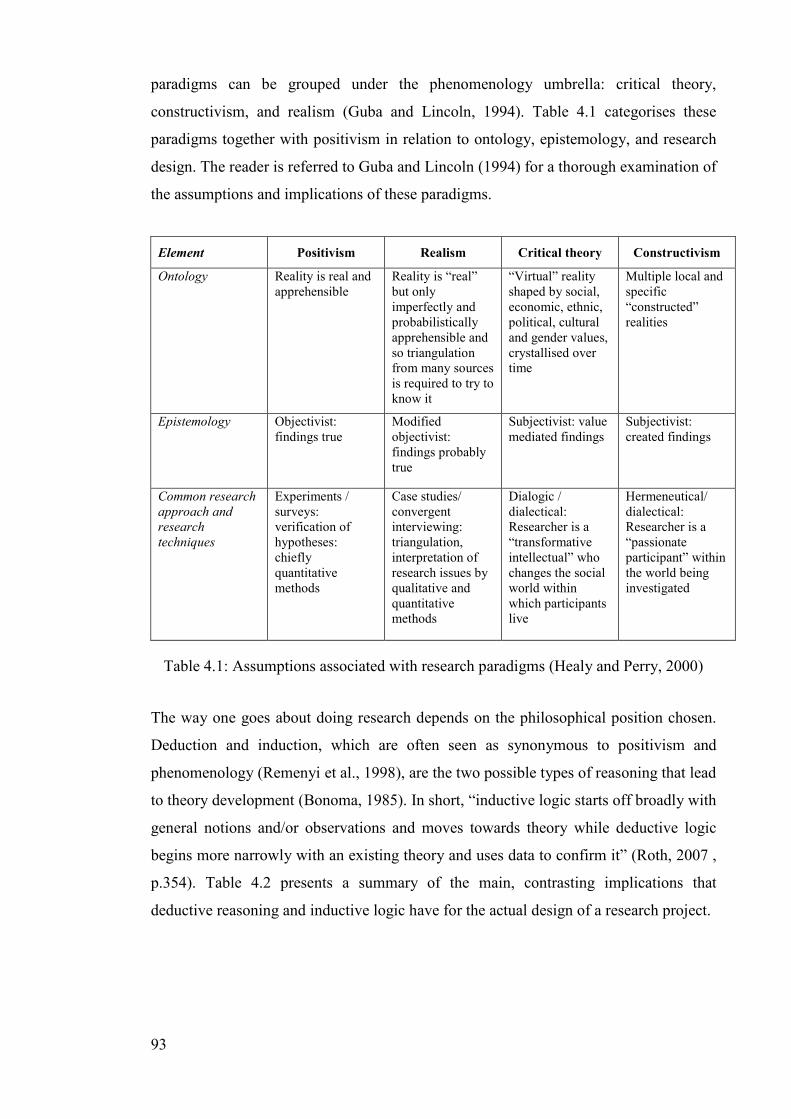
93
paradigms can be grouped under the phenomenology umbrella: critical theory,
constructivism, and realism (Guba and Lincoln, 1994). Table 4.1 categorises these
paradigms together with positivism in relation to ontology, epistemology, and research
design. The reader is referred to Guba and Lincoln (1994) for a thorough examination of
the assumptions and implications of these paradigms.
Element Positivism Realism Critical theory Constructivism
Ontology Reality is real and apprehensible
Reality is “real” but only imperfectly and probabilistically apprehensible and so triangulation from many sources is required to try to know it
“Virtual” reality shaped by social, economic, ethnic, political, cultural and gender values, crystallised over time
Multiple local and specific “constructed” realities
Epistemology Objectivist: findings true
Modified objectivist: findings probably true
Subjectivist: value mediated findings
Subjectivist: created findings
Common research
approach and
research
techniques
Experiments / surveys: verification of hypotheses: chiefly quantitative methods
Case studies/ convergent interviewing: triangulation, interpretation of research issues by qualitative and quantitative methods
Dialogic / dialectical: Researcher is a “transformative intellectual” who changes the social world within which participants live
Hermeneutical/ dialectical: Researcher is a “passionate participant” within the world being investigated
Table 4.1: Assumptions associated with research paradigms (Healy and Perry, 2000)
The way one goes about doing research depends on the philosophical position chosen.
Deduction and induction, which are often seen as synonymous to positivism and
phenomenology (Remenyi et al., 1998), are the two possible types of reasoning that lead
to theory development (Bonoma, 1985). In short, “inductive logic starts off broadly with
general notions and/or observations and moves towards theory while deductive logic
begins more narrowly with an existing theory and uses data to confirm it” (Roth, 2007 ,
p.354). Table 4.2 presents a summary of the main, contrasting implications that
deductive reasoning and inductive logic have for the actual design of a research project.
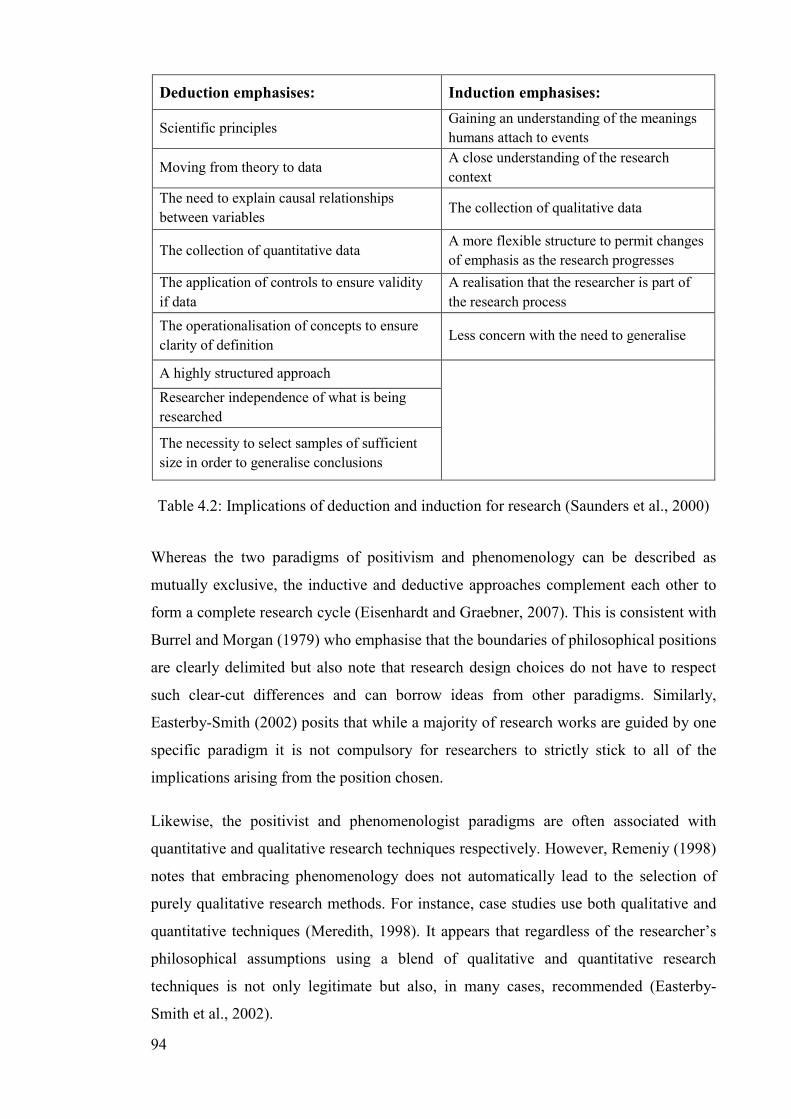
94
Deduction emphasises: Induction emphasises:
Scientific principles Gaining an understanding of the meanings
humans attach to events
Moving from theory to data A close understanding of the research
context
The need to explain causal relationships
between variables The collection of qualitative data
The collection of quantitative data A more flexible structure to permit changes
of emphasis as the research progresses
The application of controls to ensure validity
if data
A realisation that the researcher is part of
the research process
The operationalisation of concepts to ensure
clarity of definition Less concern with the need to generalise
A highly structured approach
Researcher independence of what is being
researched
The necessity to select samples of sufficient
size in order to generalise conclusions
Table 4.2: Implications of deduction and induction for research (Saunders et al., 2000)
Whereas the two paradigms of positivism and phenomenology can be described as
mutually exclusive, the inductive and deductive approaches complement each other to
form a complete research cycle (Eisenhardt and Graebner, 2007). This is consistent with
Burrel and Morgan (1979) who emphasise that the boundaries of philosophical positions
are clearly delimited but also note that research design choices do not have to respect
such clear-cut differences and can borrow ideas from other paradigms. Similarly,
Easterby-Smith (2002) posits that while a majority of research works are guided by one
specific paradigm it is not compulsory for researchers to strictly stick to all of the
implications arising from the position chosen.
Likewise, the positivist and phenomenologist paradigms are often associated with
quantitative and qualitative research techniques respectively. However, Remeniy (1998)
notes that embracing phenomenology does not automatically lead to the selection of
purely qualitative research methods. For instance, case studies use both qualitative and
quantitative techniques (Meredith, 1998). It appears that regardless of the researcher’s
philosophical assumptions using a blend of qualitative and quantitative research
techniques is not only legitimate but also, in many cases, recommended (Easterby-
Smith et al., 2002).
95
4.2.2. The debate in operations management
In addition to the two dominant scientific paradigms and their implications for research,
it is also important to examine the growing application of empirical science in
Operations Management.
Leading authors in OM suggest that the debate about where theory may come from is
one of rationalism versus empiricism (Meredith, 1998; Roth, 2007; Swamidass, 1991).
Rationalism is generally associated with a purely deductive, analytical approach and
with the use of quantitative research methods (Swamidass, 1991). Analytical, formal
sciences are closely related to positivism and exclusively develop theories through
deduction by making assumptions and using logic. In contrast, empiricism refers to the
generation of knowledge through direct and indirect observations (Roth, 2007). This
categorisation is consistent with the view of Wacker (1998) who differentiates
analytical sciences from empirical sciences.
A survey of the literature reveals that analytical, deductive approaches located within
the rationalism paradigm historically used to dominate research in operations
management (Meredith et al., 1989; Swamidass, 1991; Westbrook, 1995). For instance,
most of the research published in the fields of management science, operational
research, statistical theory, computer simulation, and modelling were located within
rationalism (Swamidass, 1991). Table 4.3 provides a summary of the frequency at
which various research methods were used in OM over the 1992-1997 period. Models
and simulations ranked first by a comfortable margin with a combined percentage of
71.4%. In contrast, empirical research articles accounted for 20.8% of published
research. Another study by Wacker (1998) on the use of research methods in OM
between 1991 and 1995 found that analytical research methods represented 81.8% of
the articles against 18.2% for empirical research methodologies.
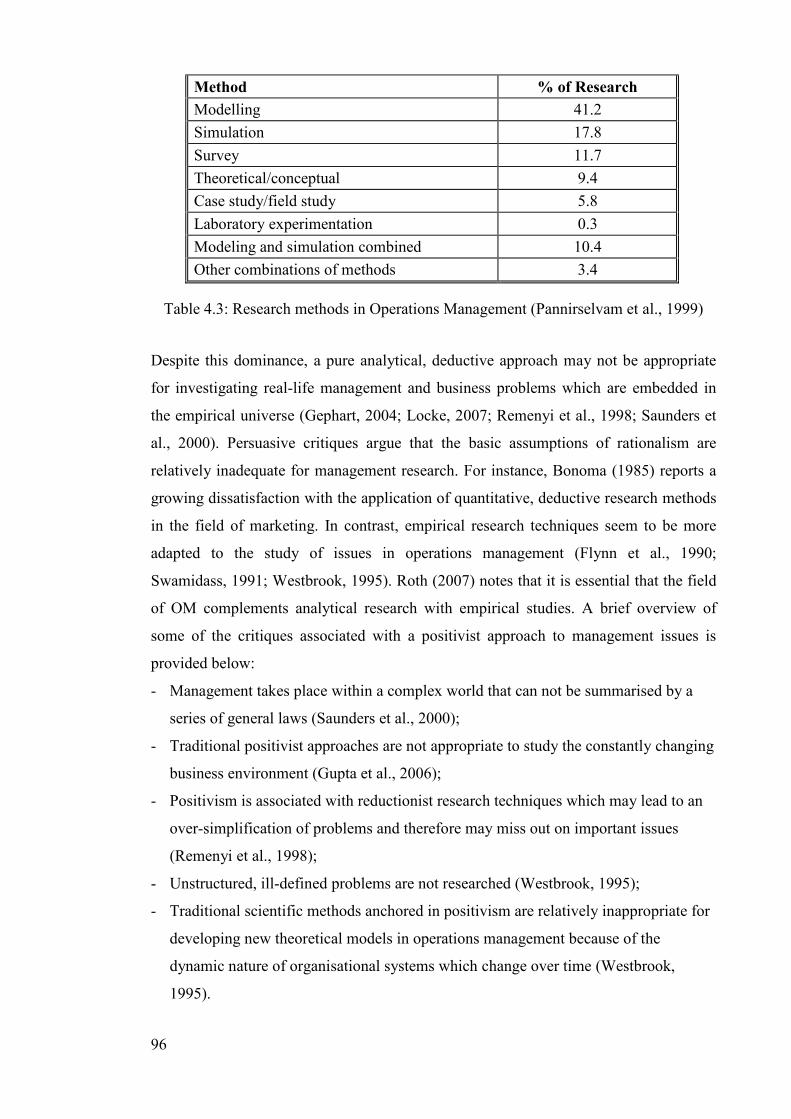
96
Method % of Research
Modelling 41.2
Simulation 17.8
Survey 11.7
Theoretical/conceptual 9.4
Case study/field study 5.8
Laboratory experimentation 0.3
Modeling and simulation combined 10.4
Other combinations of methods 3.4
Table 4.3: Research methods in Operations Management (Pannirselvam et al., 1999)
Despite this dominance, a pure analytical, deductive approach may not be appropriate
for investigating real-life management and business problems which are embedded in
the empirical universe (Gephart, 2004; Locke, 2007; Remenyi et al., 1998; Saunders et
al., 2000). Persuasive critiques argue that the basic assumptions of rationalism are
relatively inadequate for management research. For instance, Bonoma (1985) reports a
growing dissatisfaction with the application of quantitative, deductive research methods
in the field of marketing. In contrast, empirical research techniques seem to be more
adapted to the study of issues in operations management (Flynn et al., 1990;
Swamidass, 1991; Westbrook, 1995). Roth (2007) notes that it is essential that the field
of OM complements analytical research with empirical studies. A brief overview of
some of the critiques associated with a positivist approach to management issues is
provided below:
- Management takes place within a complex world that can not be summarised by a
series of general laws (Saunders et al., 2000);
- Traditional positivist approaches are not appropriate to study the constantly changing
business environment (Gupta et al., 2006);
- Positivism is associated with reductionist research techniques which may lead to an
over-simplification of problems and therefore may miss out on important issues
(Remenyi et al., 1998);
- Unstructured, ill-defined problems are not researched (Westbrook, 1995);
- Traditional scientific methods anchored in positivism are relatively inappropriate for
developing new theoretical models in operations management because of the
dynamic nature of organisational systems which change over time (Westbrook,
1995).
97
- Operations management research has been dominated by research in manufacturing
contexts where the application of quantitative research methods fits well. However,
this is less true for research in service environments which require different, less
quantifiable research methods (Roth and Menor, 2003b).
Against this background recent evidence shows that the field of SOM has been
experiencing a significant increase in empirical research methods. An extensive review
of the OM literature by Machuca et al. (2007) found that in the 1997-2002 period
empirical studies accounted for 46.2% of all SOM articles published in OM journals
(excluding operations research and management science journals). Other recent studies
found the same broad adoption of empirical research methods in OM. Pilkington and
Meredith (2009) analyse the topics published in three OM journals between 1980 and
2006. They conclude that empirical research articles are highly representative of the
structure of the OM field in the 2000s. Finally, Taylor and Taylor (2009) analyse the
articles published in the International Journal of Operations & Production Management
between 2004 and 2009. They report that surveys and case studies were the most
commonly used research methods and accounted for 57% of papers published during
this period.
To summarise, while a rationalist approach dominated operations management research
in previous decades, it seems to be relatively inappropriate for investigating real-world,
phenomena, especially in service environments. It appears that the field of SOM has
been recognising the need for more empirical research which is evidenced by the recent
surveys of the literature mentioned above.
4.2.3. Appropriateness of the realist paradigm
Whilst empiricism can be regarded as a desirable epistemological position for studying
SOM problems, the scope of empirical science is broad and many research
methodologies and approaches may be used when conducting empirical research.
Empirical research methods are employed within both the positivist and the
phenomenological paradigms (Remenyi et al., 1998). Similarly, Flynn et al. (1990)
emphasise that empirical research is useful for both theory-building and theory-testing
phases of theory development and may use both inductive and deductive logic to
generate theories. For instance, surveys are described as quantitative, theory-testing
empirical research methods and are generally located within the positivist paradigm.
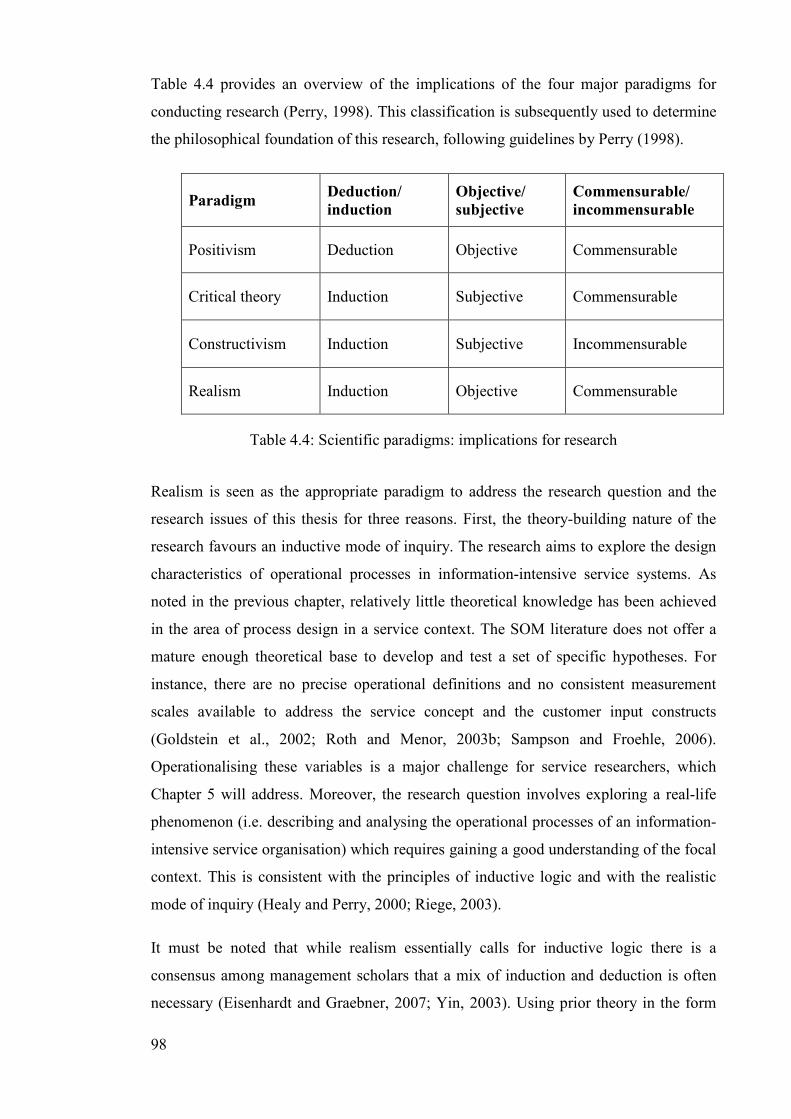
98
Table 4.4 provides an overview of the implications of the four major paradigms for
conducting research (Perry, 1998). This classification is subsequently used to determine
the philosophical foundation of this research, following guidelines by Perry (1998).
Paradigm Deduction/
induction
Objective/
subjective
Commensurable/
incommensurable
Positivism Deduction Objective Commensurable
Critical theory Induction Subjective Commensurable
Constructivism Induction Subjective Incommensurable
Realism Induction Objective Commensurable
Table 4.4: Scientific paradigms: implications for research
Realism is seen as the appropriate paradigm to address the research question and the
research issues of this thesis for three reasons. First, the theory-building nature of the
research favours an inductive mode of inquiry. The research aims to explore the design
characteristics of operational processes in information-intensive service systems. As
noted in the previous chapter, relatively little theoretical knowledge has been achieved
in the area of process design in a service context. The SOM literature does not offer a
mature enough theoretical base to develop and test a set of specific hypotheses. For
instance, there are no precise operational definitions and no consistent measurement
scales available to address the service concept and the customer input constructs
(Goldstein et al., 2002; Roth and Menor, 2003b; Sampson and Froehle, 2006).
Operationalising these variables is a major challenge for service researchers, which
Chapter 5 will address. Moreover, the research question involves exploring a real-life
phenomenon (i.e. describing and analysing the operational processes of an information-
intensive service organisation) which requires gaining a good understanding of the focal
context. This is consistent with the principles of inductive logic and with the realistic
mode of inquiry (Healy and Perry, 2000; Riege, 2003).
It must be noted that while realism essentially calls for inductive logic there is a
consensus among management scholars that a mix of induction and deduction is often
necessary (Eisenhardt and Graebner, 2007; Yin, 2003). Using prior theory in the form
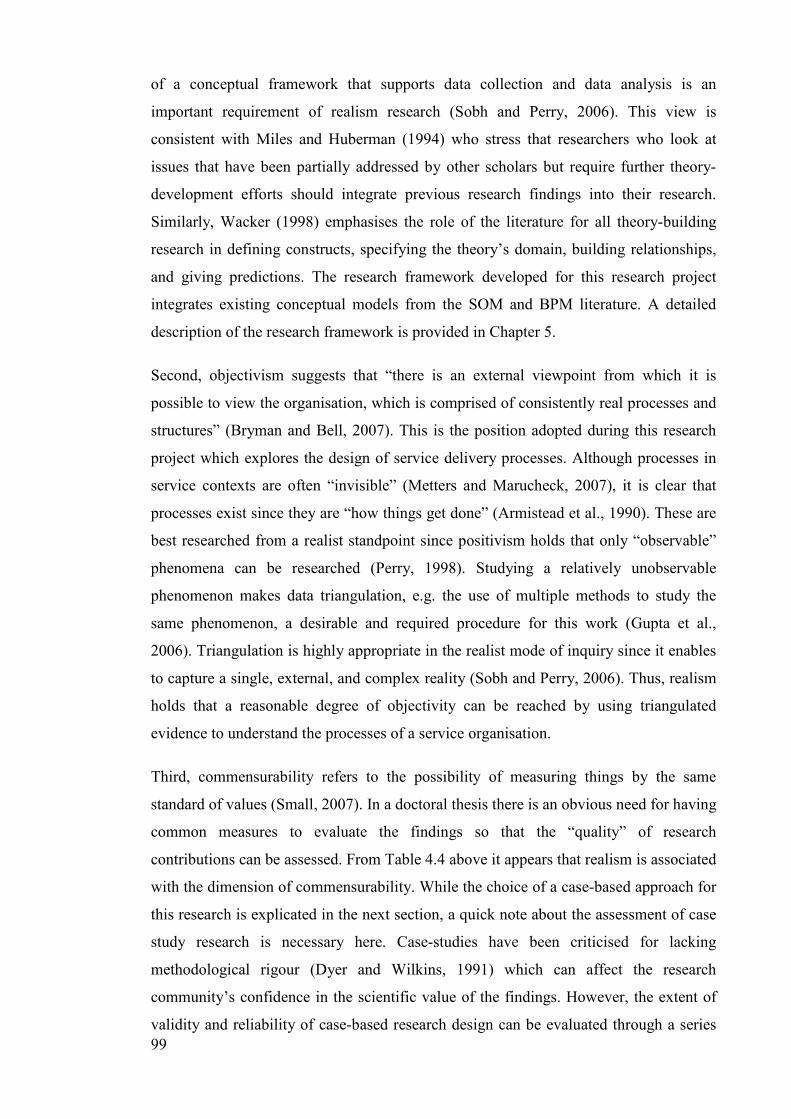
99
of a conceptual framework that supports data collection and data analysis is an
important requirement of realism research (Sobh and Perry, 2006). This view is
consistent with Miles and Huberman (1994) who stress that researchers who look at
issues that have been partially addressed by other scholars but require further theory-
development efforts should integrate previous research findings into their research.
Similarly, Wacker (1998) emphasises the role of the literature for all theory-building
research in defining constructs, specifying the theory’s domain, building relationships,
and giving predictions. The research framework developed for this research project
integrates existing conceptual models from the SOM and BPM literature. A detailed
description of the research framework is provided in Chapter 5.
Second, objectivism suggests that “there is an external viewpoint from which it is
possible to view the organisation, which is comprised of consistently real processes and
structures” (Bryman and Bell, 2007). This is the position adopted during this research
project which explores the design of service delivery processes. Although processes in
service contexts are often “invisible” (Metters and Marucheck, 2007), it is clear that
processes exist since they are “how things get done” (Armistead et al., 1990). These are
best researched from a realist standpoint since positivism holds that only “observable”
phenomena can be researched (Perry, 1998). Studying a relatively unobservable
phenomenon makes data triangulation, e.g. the use of multiple methods to study the
same phenomenon, a desirable and required procedure for this work (Gupta et al.,
2006). Triangulation is highly appropriate in the realist mode of inquiry since it enables
to capture a single, external, and complex reality (Sobh and Perry, 2006). Thus, realism
holds that a reasonable degree of objectivity can be reached by using triangulated
evidence to understand the processes of a service organisation.
Third, commensurability refers to the possibility of measuring things by the same
standard of values (Small, 2007). In a doctoral thesis there is an obvious need for having
common measures to evaluate the findings so that the “quality” of research
contributions can be assessed. From Table 4.4 above it appears that realism is associated
with the dimension of commensurability. While the choice of a case-based approach for
this research is explicated in the next section, a quick note about the assessment of case
study research is necessary here. Case-studies have been criticised for lacking
methodological rigour (Dyer and Wilkins, 1991) which can affect the research
community’s confidence in the scientific value of the findings. However, the extent of
validity and reliability of case-based research design can be evaluated through a series
100
of logical tests which are presented in Table 4.5. A detailed account of how reliability
and validity were achieved in this thesis is given in section 4.7.
Tests Case study tactic Phase of research in
which tactic occurs
Construct
validity
• Use multiple sources of evidence
• Establish chain of evidence
• Have key informants review draft case study
report
• Data collection
• Data collection
• Composition
Internal
validity
• Do pattern-matching
• Do explanation-building
• Address rival explanations
• Use logic models
• Data analysis
• Data analysis
• Data analysis
• Data analysis
External
validity
• Use theory in single-case studies
• Use replication logic in multiple-case studies
• Research design
• Research design
Reliability • Use case study protocol
• Develop case study database
• Data collection
• Data collection
Table 4.5: Assessing the reliability and validity of case study research (Yin, 2003)
The view that realism is the preferred paradigm for this thesis finds resonance with
Riege (2003) who argues for a shift towards realism to tackle real-world, practical
management issues. As stated in the introduction, affinity with a paradigm has major
consequences on research design decisions such as case selection, data collection, and
data analysis. These elements are discussed further in the following pages.
4.3. Justification for using a case study research design
The case study is regarded as a common approach to research within the realist
paradigm (Perry, 1998; Riege, 2003). Scholars have emphasised that the case study is
an appropriate research method for improving the understanding of operational issues
and for facilitating theory development in the fields of management and operations
management (Eisenhardt, 1989; Eisenhardt and Graebner, 2007; Meredith, 1998; Stuart
et al., 2002; Voss et al., 2002). In this section, it is argued that the choice of a single
case study design to address the research question is both desirable and appropriate.
101
A single service organisation, that offers diverse service concepts, is selected to explore
and analyse the relationship between service concept, customer inputs, and process
design. To achieve this it is necessary to focus on the multiple processes that comprise
the service delivery system. Silver (2004) argues that the case study method is
recommended when the research addresses complex delivery systems. This is because a
case study can provide a detailed view of the topic and can facilitate the construction of
an “as-near-as-complete” picture of the phenomenon studied (Meredith, 1998). In
addition, information-processing operations are complex and relatively uncharted
environments which lead Karmarkar and Apte (2007) to suggest the use of case studies
to address process issues in this context.
In this research, before design characteristics could be analysed, an in-depth study of the
organisation was required to build a comprehensive process architecture that identifies
and describes the service delivery processes. Collecting rich and detailed case data
during this exploratory and preliminary work was essential as it enabled the researcher
to become “intimately familiar” with the context addressed (Voss et al., 2002). A case-
based approach is recommended since it makes it possible to understand the design
characteristics of individual processes within the context of the whole service system.
For this reason, it was decided to focus exclusively on the study of a single organisation.
Furthermore, the nature and the purpose of the research guided the choice of the
research method. This research aims to build theory in service process design by
providing a set of process design characteristics for information-intensive service
systems. Several scholars have argued in favour of the case study approach to achieve
the rich insights necessary for theory development in the service design area (Karwan
and Markland, 2006; Tax and Stuart, 1997). This is because the case-study is useful for
generating insights into less mature topics in order to clarify the key constructs and
develop new frameworks (Meredith, 1998; Stuart et al., 2002; Voss et al., 2002). In
addition, the case study allows researchers to develop propositions that can be used as a
platform for future research (Eisenhardt and Graebner, 2007; Roth et al., 2008).
Although the topic of service system design has become relatively popular in recent
years (Machuca et al., 2007), the literature review has highlighted the need for a new,
process-centric perspective for SOM research. Since the existing literature does not
address the research question in a way that is entirely adequate it is legitimate for this
work to adopt a case-based approach.
102
Finally, case studies are recommended when the research seeks to be relevant to
practice (Meredith, 1998). Focusing on practitioners, who are one of the customers of
academic research, has long been seen as a key requirement for the management
research community (Bartunek, 2007). However, the gap between academic research
and practice has widened, and this has become a major concern for management
scholars (Pfeffer, 2007; Rynes et al., 1999) as well as for the wider business community
(Anonymous, 2007). For instance, Abraham and Aliio (2006) are worried that research
does not consider the needs of managers which causes research output to be almost
irrelevant to the world of business. Similarly, OM authors have voiced their concerns
that there is an important gap between research and real management problems and that
this gap prevents OM research from influencing OM practice (Slack et al., 2004b).
Meredith (1993) argues that the dominance of quantitative, theory-testing research and
the lack of theory-building efforts have caused OM research to be almost inapplicable in
the real world. This is consistent with the view of Swamidass (1991) who posits that the
field of operations management is driven by practitioners and consultants. Therefore,
increasing the relevance of academic research to management practice is regarded as a
critical imperative more than ever before (Rynes, 2007).
For OM research to be useful to those who practice business Westbrook (1995, p.13)
argues that “theories (…) must be developed out of practice”. One of the strengths of
case studies is to enable the study of a subject in its natural settings (Meredith, 1998).
New knowledge can be created based on actual observations of what happens in the
real-world where the researcher has little influence on actual events (Yin, 2003). Hence,
it would appear that theories emerging from empirical field studies are likely to be utile
and relevant to practitioners. This argument finds resonance with Rynes and McNatt
(2001) as well as with Voss (2002) who state that case studies are valued by managers.
4.4. Case selection and sampling
The research presented employs a single embedded case study design. First, the case
organisation is described as an IPO. Second, justification for the case selection is
provided. Third, the units of analysis are defined. Finally, the sampling logic for
choosing the embedded cases is examined.
103
4.4.1. Defining the case organisation as an information-processing operation
As outlined previously, the research investigates process design in the context of
information-processing service operations. It was argued in Chapter 1 that three types of
operations can be identified based on the core transformation that takes place. The
dominant transformed resource inputs of the operation determines whether the operation
is classified as MPO, CPO, or IPO.
The case company is an electricity supplier that provides a range of electricity services
in the business-to-business sector in the UK. Like most organisations electricity
suppliers transform a mixture of information, materials, and customers in their ‘operate’
processes (Morris and Johnston, 1987; Ponsignon et al., 2007). For example, some of
the activities involved in selling electricity products require direct contact with the
customer and giving them advice on their energy needs. Similarly, billing customers
requires printing invoices of customer accounts. In doing so, the operation is processing
customer-self inputs and inputs of materials respectively. However, most of the
activities involved in selling and supplying electricity are concerned with gathering and
processing customer requirements in energy as well as with monitoring consumption
and providing accurate bills to customers. These tasks involve, in the main, information-
processing. Information is the dominant input resource in the operations of an electricity
supplier and transforming information forms the focus of the operation. Therefore, the
case selected falls into the category of information-processing operations.
At first sight this company might appear to be an MPO, if one believes that their
primary task is to supply electricity (i.e. changing the physical location of electricity
particles). Wilson (1980) argues that the primary task of a system can only relate to
elements that are within the system boundary. Wilson’s primary task model omits
elements outside of the system control. In Great-Britain, electricity distribution
activities are separated out from supply activities. More specifically, electricity
transmission is owned and operated by the National Grid. This activity falls outside of
the boundary of the service delivery system and the primary task of the organisation is
not to deliver power. The case organisation is only responsible for the selling and the
billing of electricity. They are therefore not an MPO but an IPO.
104
4.4.2. Rationale for the selection of the case organisation
Purposeful sampling (Patton, 1990) was employed to select the case organisation. This
specific organisation was chosen for three reasons. Firstly, it was important to identify
the leading company in its sector. It is generally accepted that aligning the service
concept and the service delivery process is a pre-requisite for increased competitiveness
(Heskett, 1987; Kellogg and Nie, 1995; Roth and Menor, 2003b). Conducting the
research in ‘ordinary’ performers would provide little evidence of appropriateness of the
fit between service concept and process design. This view is supported by the work of
Smith and Reese (1999) which indicates that high-performing businesses realise the fit
between process design and business strategy, as embodied by the service concept.
Consequently the market leader in a competitive industry was sought out. The selected
company is part of one of Europe’s largest power companies. The Group leads the
European utilities industry, both in terms of revenues and generation capacity6. The case
organisation was the market leader in the UK in terms of volume of electricity sold in
2009. It has over performed its competitors in terms of customer satisfaction and
customer loyalty for a number of years (see Appendix 4A). Specifically, the
organisation has been consistently ranked in the top three electricity suppliers in
Datamonitor’s customer satisfaction ratings since 2004. Customer loyalty has also
averaged 78% between 2006 and 2009 against a market average of 77% during the same
period. Thus, it is arguable that the organisation operates a highly effective service
delivery system.
Secondly, information-richness was a critical factor in choosing the case. Yin (2003)
emphasises that in single-case design it is essential to maximise the access needed to
collect the case study evidence. Moreover, Field et al. (2006) note that process-oriented
empirical studies are rare because it is difficult to collect robust process data. The case
organisation permitted multiple methods of data collection over an extended period of
time. The company offered to provide a research desk in the organisation’s offices, a
corporate email account, and unrestricted access to their intranet and staff. After an
initial round of interviews was convened, with the support of the project champion, the
researcher was given direct access to all potential informants and to documentary
evidence. 97 separate documents were gathered resulting in over 900 pages of text for
analysis. Individuals of varying seniority from a variety of functions were interviewed
6Business Insights (2009), The Top 10 European Utility Companies.
105
at great length and in some cases several times. In total there were 41 interviews
undertaken during an empirical phase of research which spanned 16 months. These
dispositions facilitated the in-depth observations required to arrive at an appropriate
level of understanding of the service delivery system.
Thirdly, the organisation chosen has been deploying a business process management
programme for several years. It is considered that an organisation that is heavily
involved in a BPM programme has gone some way towards process implementation.
While few existing operational processes were formally designed at the outset, the
organisation has been engaged in process design and process improvement works for a
number of years (Maddern and Smart, 2009). It is more likely to obtain useful insights
about process design issues from a company which can be described as relatively
mature regarding BPM implementation and deployment.
4.4.3. The units of analysis
An embedded case study design contains multiple units of analysis (Yin 2003). The
main unit of analysis of the case study is the organisation’s entire service delivery
system. This is composed of an infrastructure of ‘operate’ processes that deliver various
service concepts. The unit of analysis of an embedded case is the set of individual
processes that collectively deliver a service concept. An embedded case is made up of a
“service concept – processes” pair. Further details on how the sub-units were selected
are provided in Section 4.4.4.
Since processes exist in a hierarchy they can be viewed at different levels of abstraction.
The process characteristics observed may vary depending on the degree of granularity
chosen. Therefore, precisely defining the level of analysis is critical. In this work, the
process concept is used in reference to some of the works introduced earlier (Batista et
al., 2008; Maddern et al., 2007; Smart et al., 2009) which focus on an end-to-end
business process.
An important issue to consider for this research is the question of where the system
boundary is placed (Miles and Huberman, 1994) as the customer arguably has a wider
and more participative role to play in service operations than in manufacturing
operations. Since this work examines process design from an OM point of view it is
sensible to assume the standpoint of the service provider and not the one of the
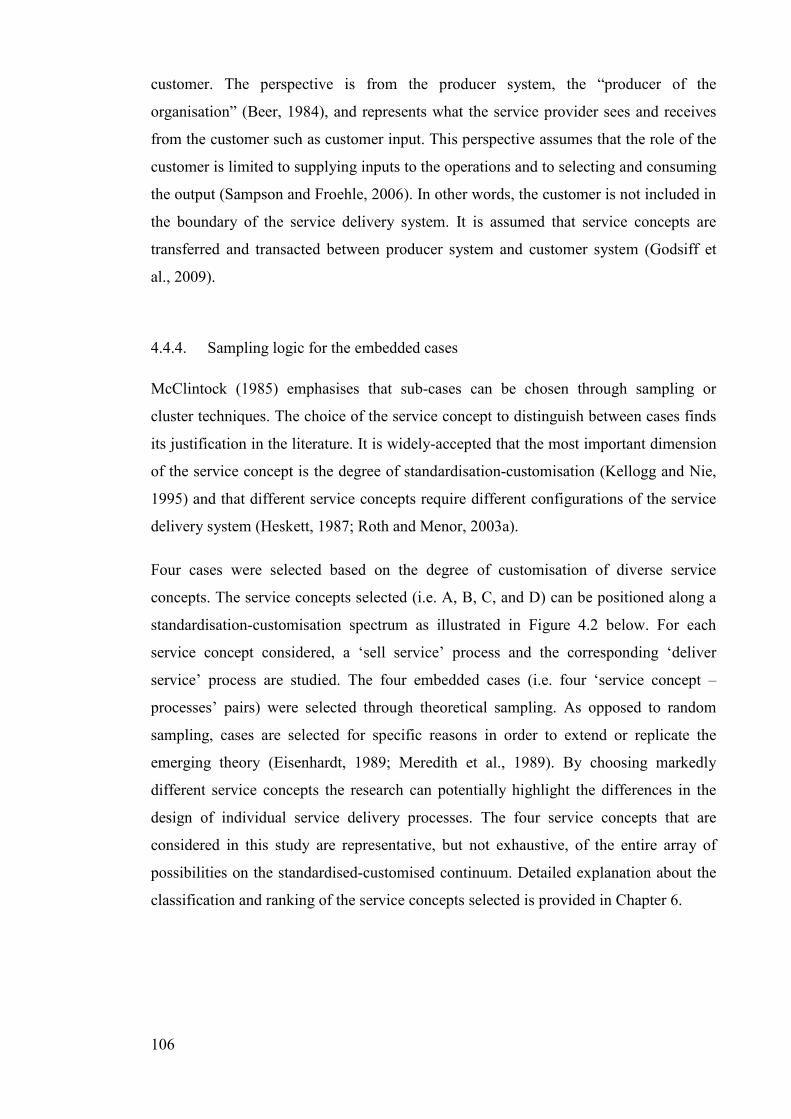
106
customer. The perspective is from the producer system, the “producer of the
organisation” (Beer, 1984), and represents what the service provider sees and receives
from the customer such as customer input. This perspective assumes that the role of the
customer is limited to supplying inputs to the operations and to selecting and consuming
the output (Sampson and Froehle, 2006). In other words, the customer is not included in
the boundary of the service delivery system. It is assumed that service concepts are
transferred and transacted between producer system and customer system (Godsiff et
al., 2009).
4.4.4. Sampling logic for the embedded cases
McClintock (1985) emphasises that sub-cases can be chosen through sampling or
cluster techniques. The choice of the service concept to distinguish between cases finds
its justification in the literature. It is widely-accepted that the most important dimension
of the service concept is the degree of standardisation-customisation (Kellogg and Nie,
1995) and that different service concepts require different configurations of the service
delivery system (Heskett, 1987; Roth and Menor, 2003a).
Four cases were selected based on the degree of customisation of diverse service
concepts. The service concepts selected (i.e. A, B, C, and D) can be positioned along a
standardisation-customisation spectrum as illustrated in Figure 4.2 below. For each
service concept considered, a ‘sell service’ process and the corresponding ‘deliver
service’ process are studied. The four embedded cases (i.e. four ‘service concept –
processes’ pairs) were selected through theoretical sampling. As opposed to random
sampling, cases are selected for specific reasons in order to extend or replicate the
emerging theory (Eisenhardt, 1989; Meredith et al., 1989). By choosing markedly
different service concepts the research can potentially highlight the differences in the
design of individual service delivery processes. The four service concepts that are
considered in this study are representative, but not exhaustive, of the entire array of
possibilities on the standardised-customised continuum. Detailed explanation about the
classification and ranking of the service concepts selected is provided in Chapter 6.
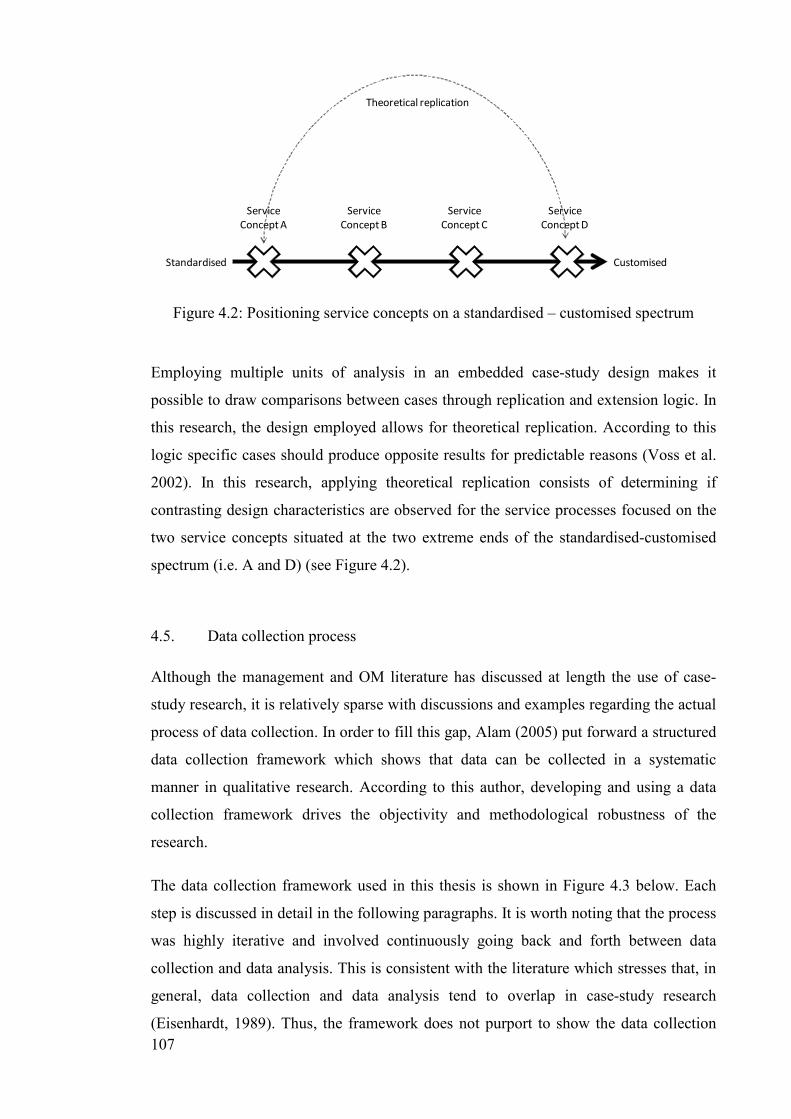
107
Service
Concept A
Service
Concept B
Service
Concept C
Service
Concept D
Standardised Customised
Theoretical replication
Figure 4.2: Positioning service concepts on a standardised – customised spectrum
Employing multiple units of analysis in an embedded case-study design makes it
possible to draw comparisons between cases through replication and extension logic. In
this research, the design employed allows for theoretical replication. According to this
logic specific cases should produce opposite results for predictable reasons (Voss et al.
2002). In this research, applying theoretical replication consists of determining if
contrasting design characteristics are observed for the service processes focused on the
two service concepts situated at the two extreme ends of the standardised-customised
spectrum (i.e. A and D) (see Figure 4.2).
4.5. Data collection process
Although the management and OM literature has discussed at length the use of case-
study research, it is relatively sparse with discussions and examples regarding the actual
process of data collection. In order to fill this gap, Alam (2005) put forward a structured
data collection framework which shows that data can be collected in a systematic
manner in qualitative research. According to this author, developing and using a data
collection framework drives the objectivity and methodological robustness of the
research.
The data collection framework used in this thesis is shown in Figure 4.3 below. Each
step is discussed in detail in the following paragraphs. It is worth noting that the process
was highly iterative and involved continuously going back and forth between data
collection and data analysis. This is consistent with the literature which stresses that, in
general, data collection and data analysis tend to overlap in case-study research
(Eisenhardt, 1989). Thus, the framework does not purport to show the data collection
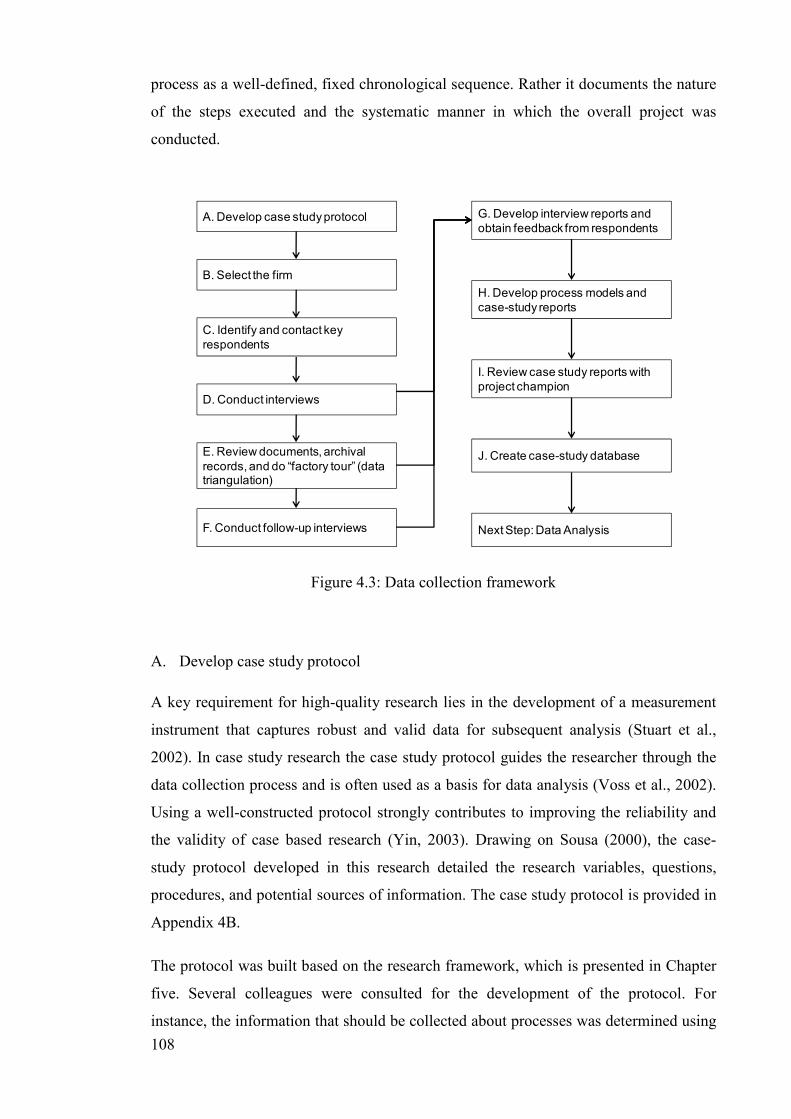
108
process as a well-defined, fixed chronological sequence. Rather it documents the nature
of the steps executed and the systematic manner in which the overall project was
conducted.
A. Develop case study protocol
B. Select the firm
C. Identify and contact key
respondents
D. Conduct interviews
E. Review documents, archival
records, and do “factory tour” (data triangulation)
F. Conduct follow-up interviews
G. Develop interview reports and
obtain feedback from respondents
H. Develop process models and
case-study reports
I. Review case study reports with
project champion
J. Create case-study database
Next Step: Data Analysis
Figure 4.3: Data collection framework
A. Develop case study protocol
A key requirement for high-quality research lies in the development of a measurement
instrument that captures robust and valid data for subsequent analysis (Stuart et al.,
2002). In case study research the case study protocol guides the researcher through the
data collection process and is often used as a basis for data analysis (Voss et al., 2002).
Using a well-constructed protocol strongly contributes to improving the reliability and
the validity of case based research (Yin, 2003). Drawing on Sousa (2000), the case-
study protocol developed in this research detailed the research variables, questions,
procedures, and potential sources of information. The case study protocol is provided in
Appendix 4B.
The protocol was built based on the research framework, which is presented in Chapter
five. Several colleagues were consulted for the development of the protocol. For
instance, the information that should be collected about processes was determined using
109
Figure 4.4. Interview scripts were developed based on the case-study protocol. These
scripts were subsequently pilot-tested on a senior colleague. Several interview scripts
were developed as the research project involved interviewing people in different roles
for different purposes. For example, interviews with sales or marketing staff primarily
aimed at, but were not restricted to, collecting data about the service concept.
The activities
Involved
Information
Used (input)
Where / who
the information comes from
What causes the
process to start(trigger)
What people or
departments areinvolved
What information
systems are used
What the process
produces (output)
Who the output is for/
where it goes
What constraints or
regulations affect the process
Process
Figure 4.4: Information that should be collected about the process
B. Select the organisation
The criteria for case selection were discussed in Section 4.4.2. After the consultation of
background information on several organisations using secondary information sources
(e.g. company’s websites, annual reports, press releases, company history, and existing
research outputs) the decision was made to initiate contact with a large electricity
supplier. The Head of Process of the target company was directly contacted via email.
This was made possible because of an existing relationship between the business school
and the company. An email that provided a general description of the research was sent
to invite the company to participate in the study. A meeting was set up to present the
objectives of the research, the areas to be addressed as well as the case study protocol.
The researcher was then required to sign a confidentiality agreement. It was also
decided that the Head of Process would act as the Project Champion, the main
coordinating link between the company and the researcher.
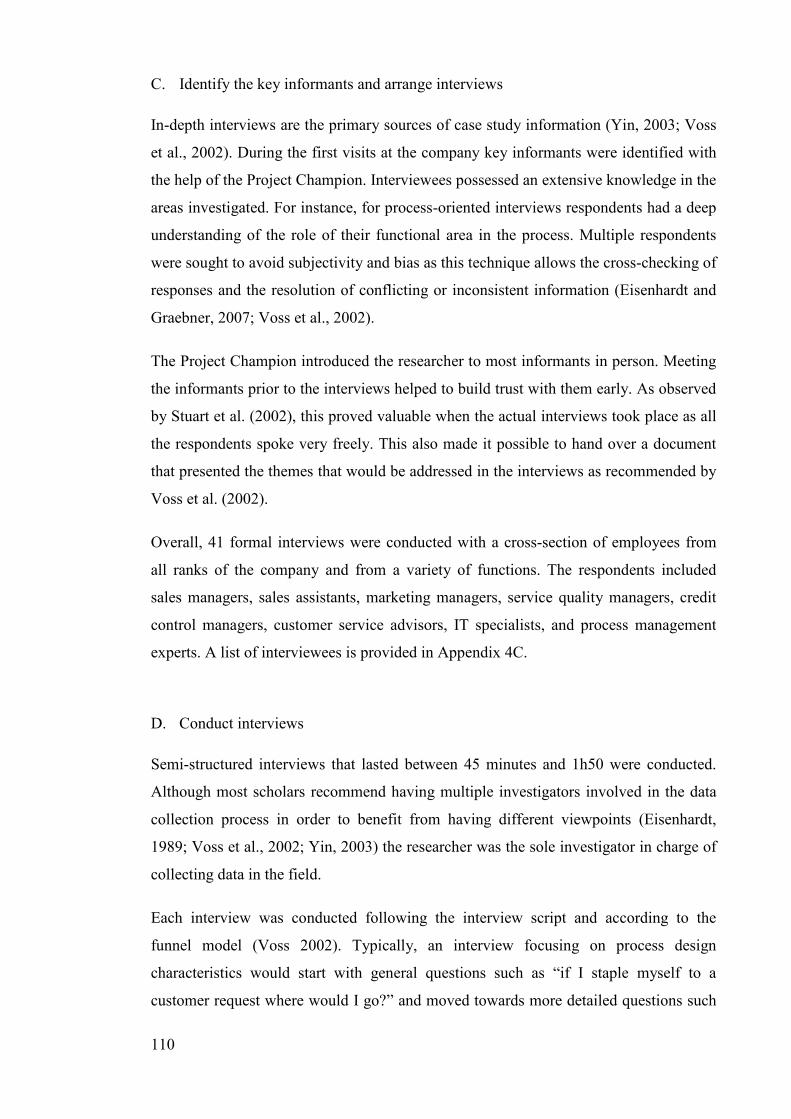
110
C. Identify the key informants and arrange interviews
In-depth interviews are the primary sources of case study information (Yin, 2003; Voss
et al., 2002). During the first visits at the company key informants were identified with
the help of the Project Champion. Interviewees possessed an extensive knowledge in the
areas investigated. For instance, for process-oriented interviews respondents had a deep
understanding of the role of their functional area in the process. Multiple respondents
were sought to avoid subjectivity and bias as this technique allows the cross-checking of
responses and the resolution of conflicting or inconsistent information (Eisenhardt and
Graebner, 2007; Voss et al., 2002).
The Project Champion introduced the researcher to most informants in person. Meeting
the informants prior to the interviews helped to build trust with them early. As observed
by Stuart et al. (2002), this proved valuable when the actual interviews took place as all
the respondents spoke very freely. This also made it possible to hand over a document
that presented the themes that would be addressed in the interviews as recommended by
Voss et al. (2002).
Overall, 41 formal interviews were conducted with a cross-section of employees from
all ranks of the company and from a variety of functions. The respondents included
sales managers, sales assistants, marketing managers, service quality managers, credit
control managers, customer service advisors, IT specialists, and process management
experts. A list of interviewees is provided in Appendix 4C.
D. Conduct interviews
Semi-structured interviews that lasted between 45 minutes and 1h50 were conducted.
Although most scholars recommend having multiple investigators involved in the data
collection process in order to benefit from having different viewpoints (Eisenhardt,
1989; Voss et al., 2002; Yin, 2003) the researcher was the sole investigator in charge of
collecting data in the field.
Each interview was conducted following the interview script and according to the
funnel model (Voss 2002). Typically, an interview focusing on process design
characteristics would start with general questions such as “if I staple myself to a
customer request where would I go?” and moved towards more detailed questions such
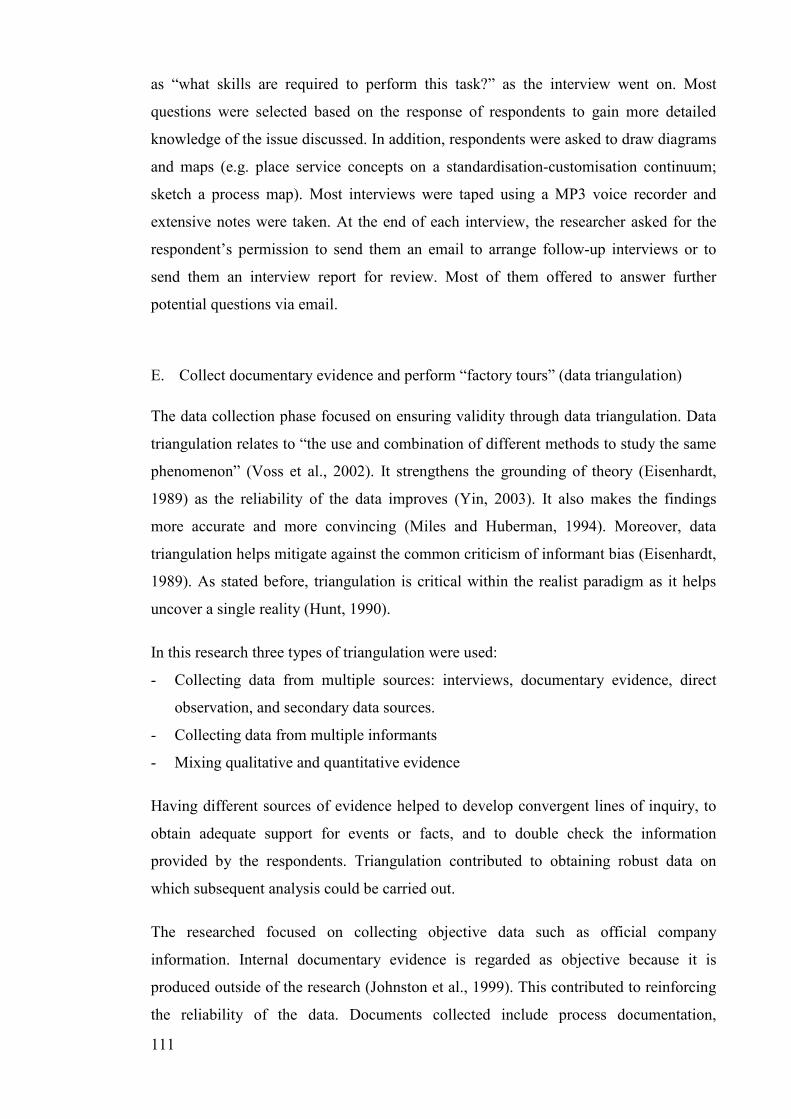
111
as “what skills are required to perform this task?” as the interview went on. Most
questions were selected based on the response of respondents to gain more detailed
knowledge of the issue discussed. In addition, respondents were asked to draw diagrams
and maps (e.g. place service concepts on a standardisation-customisation continuum;
sketch a process map). Most interviews were taped using a MP3 voice recorder and
extensive notes were taken. At the end of each interview, the researcher asked for the
respondent’s permission to send them an email to arrange follow-up interviews or to
send them an interview report for review. Most of them offered to answer further
potential questions via email.
E. Collect documentary evidence and perform “factory tours” (data triangulation)
The data collection phase focused on ensuring validity through data triangulation. Data
triangulation relates to “the use and combination of different methods to study the same
phenomenon” (Voss et al., 2002). It strengthens the grounding of theory (Eisenhardt,
1989) as the reliability of the data improves (Yin, 2003). It also makes the findings
more accurate and more convincing (Miles and Huberman, 1994). Moreover, data
triangulation helps mitigate against the common criticism of informant bias (Eisenhardt,
1989). As stated before, triangulation is critical within the realist paradigm as it helps
uncover a single reality (Hunt, 1990).
In this research three types of triangulation were used:
- Collecting data from multiple sources: interviews, documentary evidence, direct
observation, and secondary data sources.
- Collecting data from multiple informants
- Mixing qualitative and quantitative evidence
Having different sources of evidence helped to develop convergent lines of inquiry, to
obtain adequate support for events or facts, and to double check the information
provided by the respondents. Triangulation contributed to obtaining robust data on
which subsequent analysis could be carried out.
The researched focused on collecting objective data such as official company
information. Internal documentary evidence is regarded as objective because it is
produced outside of the research (Johnston et al., 1999). This contributed to reinforcing
the reliability of the data. Documents collected include process documentation,
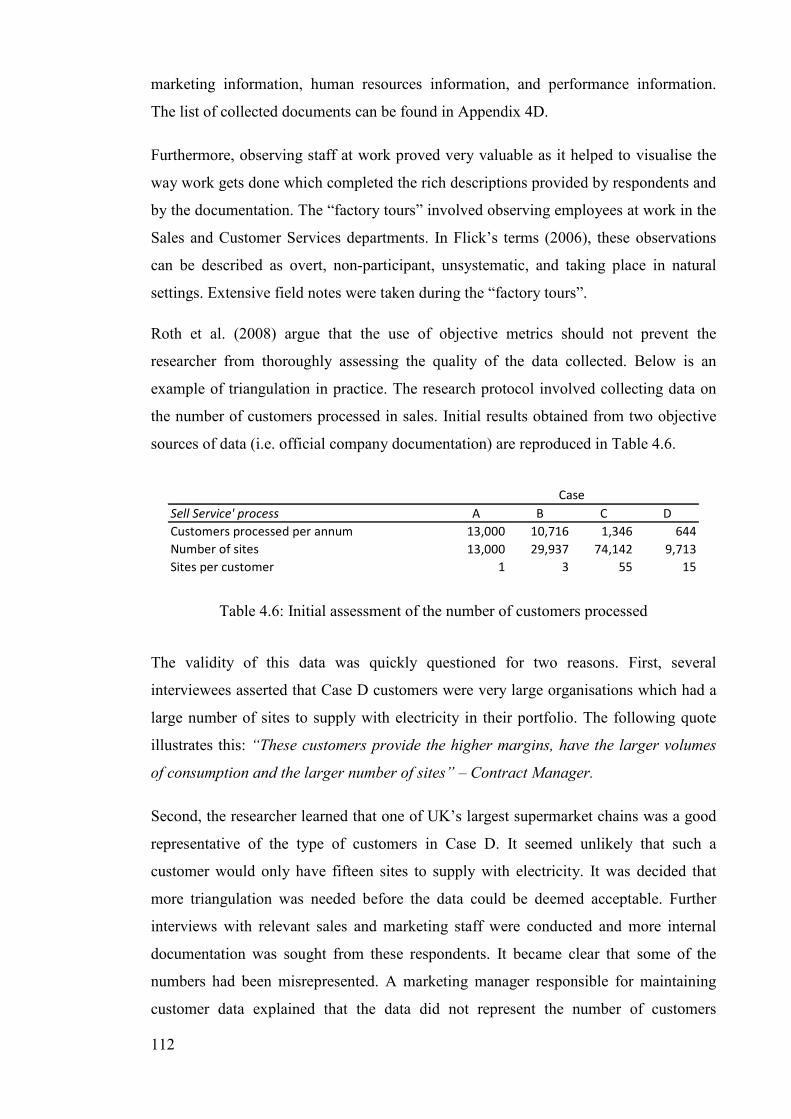
112
marketing information, human resources information, and performance information.
The list of collected documents can be found in Appendix 4D.
Furthermore, observing staff at work proved very valuable as it helped to visualise the
way work gets done which completed the rich descriptions provided by respondents and
by the documentation. The “factory tours” involved observing employees at work in the
Sales and Customer Services departments. In Flick’s terms (2006), these observations
can be described as overt, non-participant, unsystematic, and taking place in natural
settings. Extensive field notes were taken during the “factory tours”.
Roth et al. (2008) argue that the use of objective metrics should not prevent the
researcher from thoroughly assessing the quality of the data collected. Below is an
example of triangulation in practice. The research protocol involved collecting data on
the number of customers processed in sales. Initial results obtained from two objective
sources of data (i.e. official company documentation) are reproduced in Table 4.6.
Sell Service' process A B C D
Customers processed per annum 13,000 10,716 1,346 644
Number of sites 13,000 29,937 74,142 9,713
Sites per customer 1 3 55 15
Case
Table 4.6: Initial assessment of the number of customers processed
The validity of this data was quickly questioned for two reasons. First, several
interviewees asserted that Case D customers were very large organisations which had a
large number of sites to supply with electricity in their portfolio. The following quote
illustrates this: “These customers provide the higher margins, have the larger volumes
of consumption and the larger number of sites” – Contract Manager.
Second, the researcher learned that one of UK’s largest supermarket chains was a good
representative of the type of customers in Case D. It seemed unlikely that such a
customer would only have fifteen sites to supply with electricity. It was decided that
more triangulation was needed before the data could be deemed acceptable. Further
interviews with relevant sales and marketing staff were conducted and more internal
documentation was sought from these respondents. It became clear that some of the
numbers had been misrepresented. A marketing manager responsible for maintaining
customer data explained that the data did not represent the number of customers
113
processed by sales but the number of customer unique identifiers as recorded in the
billing IT system. In addition, he stated that for large customers the data did not exist at
customer level because of an IT system legacy. For instance, a large
telecommunications company had fifteen customer identification numbers in the system
although this company is one customer in the eyes of the electricity supplier.
F. Conduct follow-up interviews
Follow-up interviews were often required to fill the gaps in information and to clarify
some uncertainties that arose in the first interviews. Follow-up interviews were
conducted between two and three weeks after the first interview to allow time for
transcription and triangulation. This allowed the identification of areas where
conflicting or missing information existed.
G. Write interview reports and obtain feedback from respondents
Detailed interview reports were written after the interview(s) to consolidate and
summarise acquired knowledge. Interview reports were usually returned by the key
informants with slight modifications.
H. Develop process models and case-study reports
After the completion of the interviews and an extensive analysis of the documentation,
archival records, and field notes four detailed case-study reports were developed. Each
report contained a thorough description of the service concept, detailed process models,
as well as comprehensive process description. Following recommendations by
Eisenhardt (1989), the reports were written in narrative form and were very descriptive.
The reports were sent to the Project Champion for review. Case study reports are at
cross-road between data collection and data analysis. For the convenience of the reader,
data analysis procedures are discussed in Chapter 6.
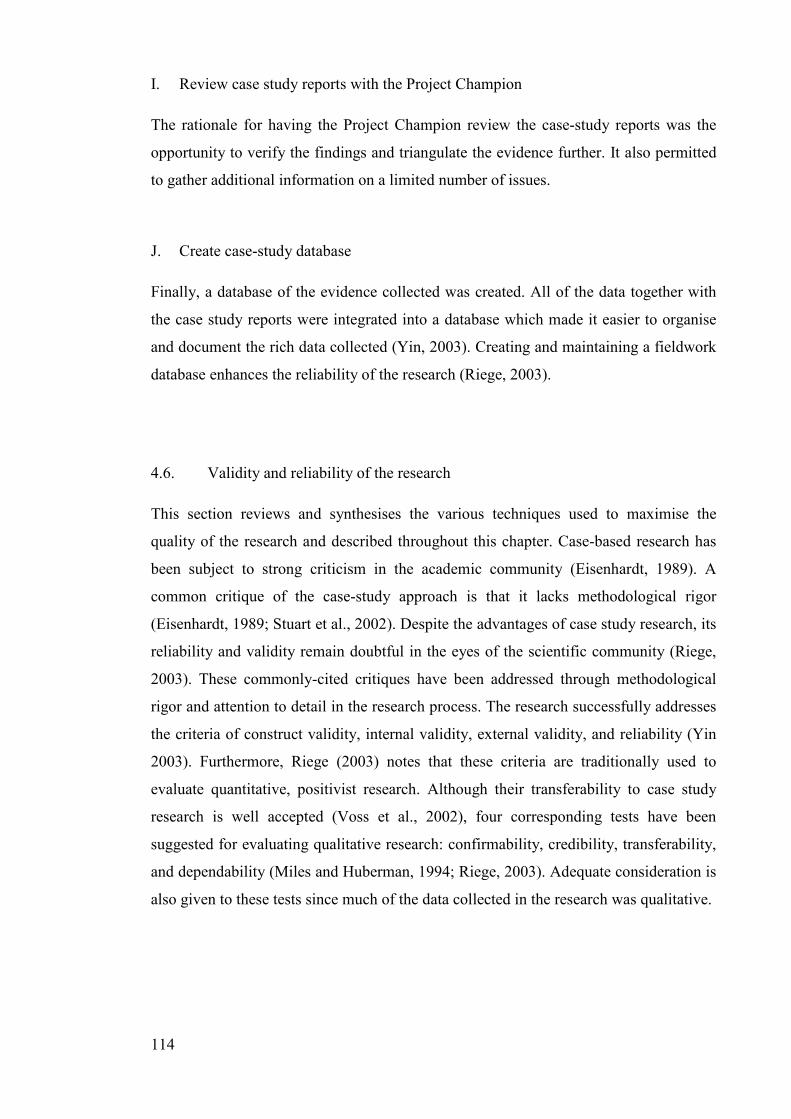
114
I. Review case study reports with the Project Champion
The rationale for having the Project Champion review the case-study reports was the
opportunity to verify the findings and triangulate the evidence further. It also permitted
to gather additional information on a limited number of issues.
J. Create case-study database
Finally, a database of the evidence collected was created. All of the data together with
the case study reports were integrated into a database which made it easier to organise
and document the rich data collected (Yin, 2003). Creating and maintaining a fieldwork
database enhances the reliability of the research (Riege, 2003).
4.6. Validity and reliability of the research
This section reviews and synthesises the various techniques used to maximise the
quality of the research and described throughout this chapter. Case-based research has
been subject to strong criticism in the academic community (Eisenhardt, 1989). A
common critique of the case-study approach is that it lacks methodological rigor
(Eisenhardt, 1989; Stuart et al., 2002). Despite the advantages of case study research, its
reliability and validity remain doubtful in the eyes of the scientific community (Riege,
2003). These commonly-cited critiques have been addressed through methodological
rigor and attention to detail in the research process. The research successfully addresses
the criteria of construct validity, internal validity, external validity, and reliability (Yin
2003). Furthermore, Riege (2003) notes that these criteria are traditionally used to
evaluate quantitative, positivist research. Although their transferability to case study
research is well accepted (Voss et al., 2002), four corresponding tests have been
suggested for evaluating qualitative research: confirmability, credibility, transferability,
and dependability (Miles and Huberman, 1994; Riege, 2003). Adequate consideration is
also given to these tests since much of the data collected in the research was qualitative.
115
4.6.1. Construct validity and confirmability
Construct validity assesses whether correct operational measures are established for the
concepts being studied (Voss et al., 2002). Within the realist paradigm construct validity
corresponds to confirmability which aims to ensure that one avoids making subjective
judgements in the research so that the conclusions drawn are reasonable (Riege, 2003).
Construct validity was addressed through the use of data triangulation, the
establishment of a chain of evidence, and the validation of the case study reports by the
project champion (Yin, 2003). As described in Section 4.5, a data collection framework
was used in a systematic way in the research project. More specifically, the robustness
of the data was ensured through the consistent use of data triangulation in the data
collection phase. Obtaining convergent information from multiple sources of evidence
indicates convergent validity and protects against researcher’s bias. Triangulation
safeguarded against researcher’s subjectivity and strengthened construct validity by
providing multiple measures of the same phenomenon.
Throughout the research, efforts were made to establish and maintain a robust chain of
evidence. A chain of evidence clearly shows how the evidence was derived and the
step-by-step process through which results were obtained (Yin 2003). It makes it
possible to trace the entire research process backwards, from the specific results and
conclusions up to the initial research question. Figure 4.5 illustrates the concept of a
chain of evidence in the context of this thesis.
Research
questionConclusionProtocol
Triangulated
data
Data
displays
ConclusionResearch
Question
Data
displaysProtocol
Research
framework
Research
framework
Triangulated
data
Figure 4.5: Tracing the evidence: going forward and backwards
4.6.2. Internal validity and credibility
Internal validity ensures that the research establishes valid causal relationships between
the variables studied as opposed to spurious relationships (Yin, 2003). At a fundamental
level, identifying which constructs have logical connections to other constructs is a key
step in theory-building research (Wacker, 1998). Within the realist paradigm, internal
116
validity corresponds to the test of credibility which purports to show that the inquiry
was conducted in a way that establishes the phenomena in a credible way (Riege, 2003).
The research addresses process design characteristics in an information-intensive
service delivery system. It consists of “exploratory”, “descriptive”, and “analytical”
components to investigate the relationship between service concept, customer inputs,
and process design characteristics. This study involves making empirical observations
about specific phenomena and analysing them. This does not require justifying internal
validity (Yin, 2003) since the research does not purport to establish causal relationships
between constructs (Perry, 1998). The issue of internal validity is not addressed in this
research.
Regarding credibility, two specific steps were taken to ensure that the findings made
sense and represented an authentic portrait of the phenomena studied. First, the peer-
debriefing technique suggested by Riege (2003) was extensively used. Regular meetings
with both supervisors and senior colleagues allowed the researcher to present the
progression of the data analysis phase as well as the conclusions drawn from it.
Receiving valuable feedback and critiques as the project progressed helped to address a
number of weaknesses in the research.
Second, process models, qualitative, quantitative data, and theoretical interpretations
were shared with key informants through both informal discussions and formal
exchanges (i.e. the feedback on interviews, the review of draft case study reports, and
the validation of the results of the data reduction stage) at various points in time during
the life of the project. Comments, feedback, and suggestions were taken into account in
the data analysis stage. This is recommended by Lincoln and Cuba (1985) to safeguard
against possible multiple interpretations of reality.
4.6.3. External validity and transferability
External validity is the extent to which a study’s findings can be generalised beyond the
immediate case study (Voss et al., 2002). Within the realist paradigm external validity
corresponds to transferability (Riege, 2003). These two criteria are identical.
The case study approach relies on analytical generalisation whereby the findings are
compared with conceptual frameworks and existing theory (McIntock, 1985; Yin,
117
2003). Analytical generalisation makes it possible to generalise particular findings to a
broader theory. This is in sharp contrast with survey research which relies on statistical
generalisation to generalise findings to a universe broader than the sample studied (Yin,
2003). The findings were constantly compared with the initial conceptual framework
and with existing, related theory in order to achieve analytical generalisation. In
addition, several research propositions for future theory-testing research are formulated.
These propositions can be found in Chapter 9.
4.6.4. Reliability and dependability
Reliability aims to ensure that a study can be repeated with the same results (Yin, 2003)
and, within the realist paradigm, reliability corresponds to dependability (Riege, 2003).
Both criteria are similar and evaluate whether other researchers using the same
procedures and techniques in the research process would obtain the same results (Riege,
2003).
Following recommendation by Yin (2003), two techniques were used in this research to
enhance reliability. First, a structured protocol was developed and used in the data
collection process. Second, all of the collected data were mechanically recorded in a
case study database. The reader is referred back to Section 4.5 for further details on the
development and use of protocol and of the database.
4.7. Ethical considerations
This final section discusses the major ethical issues of the research. Although
management research has traditionally been less concerned with defining and adopting
ethical codes or practices than other fields, such as medical science for instance
(Easterby-Smith et al., 2007), a number of steps were taken to ensure that the research
was conducted in an ethically-appropriate way. Of the ten principles of “good” ethical
practice described by Bell and Bryman (2007), three themes were found to be
particularly relevant to this case-study research: ensuring the confidentiality of collected
data, protecting the anonymity of the organisation, and ensuring a fully informed
consent of informants.
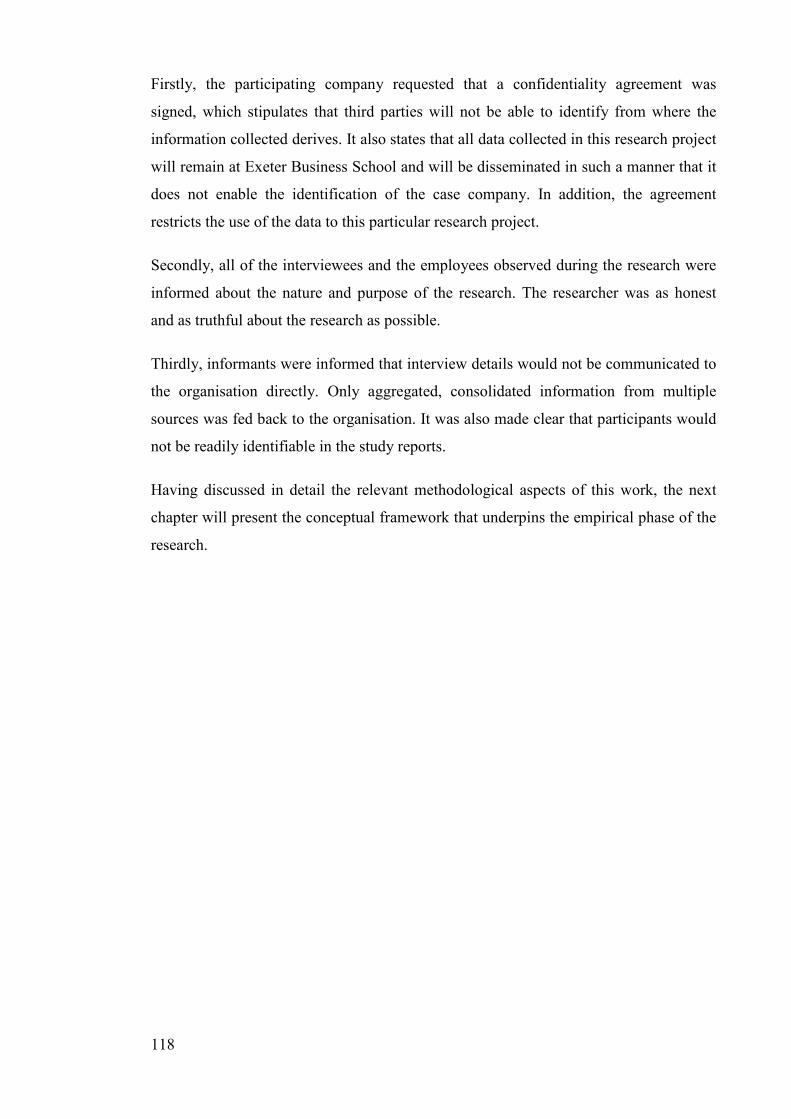
118
Firstly, the participating company requested that a confidentiality agreement was
signed, which stipulates that third parties will not be able to identify from where the
information collected derives. It also states that all data collected in this research project
will remain at Exeter Business School and will be disseminated in such a manner that it
does not enable the identification of the case company. In addition, the agreement
restricts the use of the data to this particular research project.
Secondly, all of the interviewees and the employees observed during the research were
informed about the nature and purpose of the research. The researcher was as honest
and as truthful about the research as possible.
Thirdly, informants were informed that interview details would not be communicated to
the organisation directly. Only aggregated, consolidated information from multiple
sources was fed back to the organisation. It was also made clear that participants would
not be readily identifiable in the study reports.
Having discussed in detail the relevant methodological aspects of this work, the next
chapter will present the conceptual framework that underpins the empirical phase of the
research.
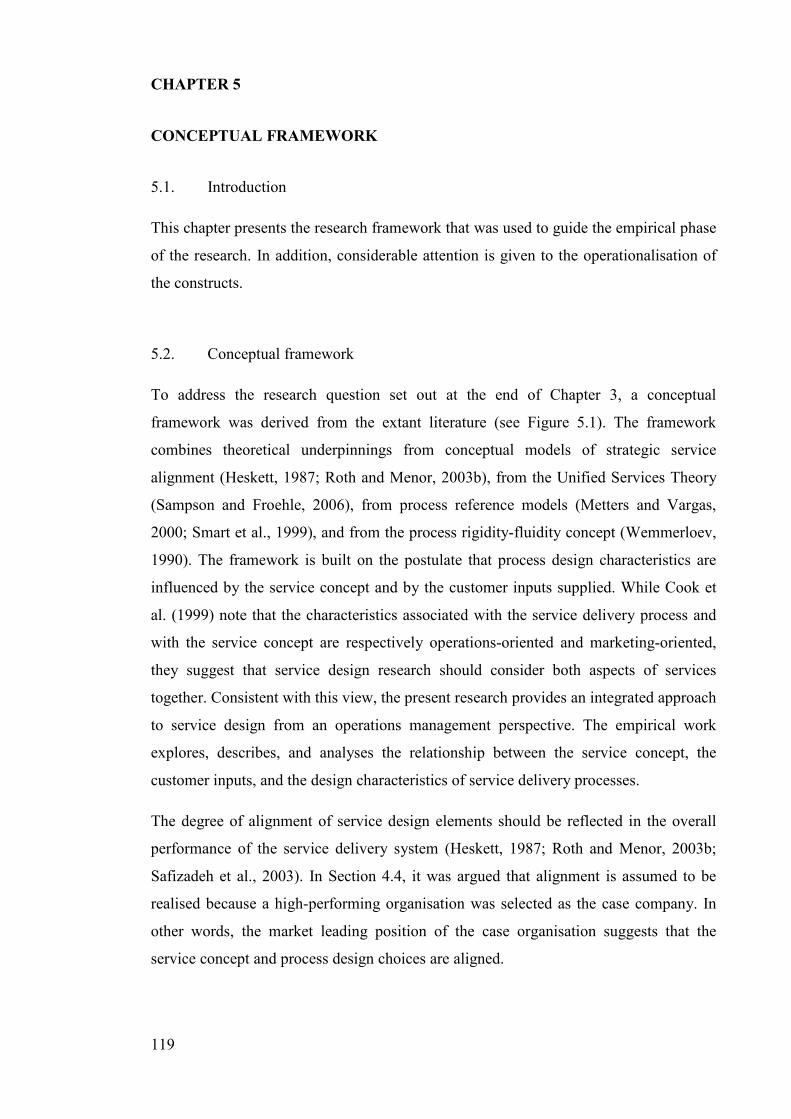
119
CHAPTER 5
CONCEPTUAL FRAMEWORK
5.1. Introduction
This chapter presents the research framework that was used to guide the empirical phase
of the research. In addition, considerable attention is given to the operationalisation of
the constructs.
5.2. Conceptual framework
To address the research question set out at the end of Chapter 3, a conceptual
framework was derived from the extant literature (see Figure 5.1). The framework
combines theoretical underpinnings from conceptual models of strategic service
alignment (Heskett, 1987; Roth and Menor, 2003b), from the Unified Services Theory
(Sampson and Froehle, 2006), from process reference models (Metters and Vargas,
2000; Smart et al., 1999), and from the process rigidity-fluidity concept (Wemmerloev,
1990). The framework is built on the postulate that process design characteristics are
influenced by the service concept and by the customer inputs supplied. While Cook et
al. (1999) note that the characteristics associated with the service delivery process and
with the service concept are respectively operations-oriented and marketing-oriented,
they suggest that service design research should consider both aspects of services
together. Consistent with this view, the present research provides an integrated approach
to service design from an operations management perspective. The empirical work
explores, describes, and analyses the relationship between the service concept, the
customer inputs, and the design characteristics of service delivery processes.
The degree of alignment of service design elements should be reflected in the overall
performance of the service delivery system (Heskett, 1987; Roth and Menor, 2003b;
Safizadeh et al., 2003). In Section 4.4, it was argued that alignment is assumed to be
realised because a high-performing organisation was selected as the case company. In
other words, the market leading position of the case organisation suggests that the
service concept and process design choices are aligned.
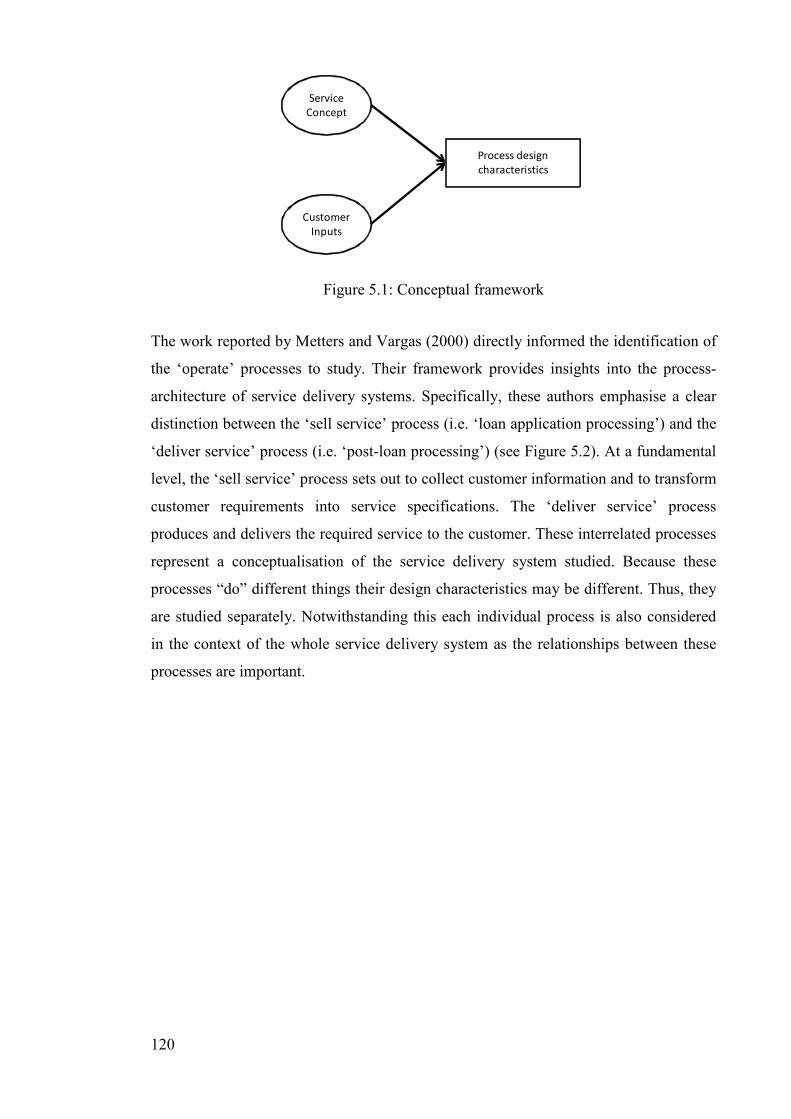
120
Service
Concept
Customer
Inputs
Process design
characteristics
Figure 5.1: Conceptual framework
The work reported by Metters and Vargas (2000) directly informed the identification of
the ‘operate’ processes to study. Their framework provides insights into the process-
architecture of service delivery systems. Specifically, these authors emphasise a clear
distinction between the ‘sell service’ process (i.e. ‘loan application processing’) and the
‘deliver service’ process (i.e. ‘post-loan processing’) (see Figure 5.2). At a fundamental
level, the ‘sell service’ process sets out to collect customer information and to transform
customer requirements into service specifications. The ‘deliver service’ process
produces and delivers the required service to the customer. These interrelated processes
represent a conceptualisation of the service delivery system studied. Because these
processes “do” different things their design characteristics may be different. Thus, they
are studied separately. Notwithstanding this each individual process is also considered
in the context of the whole service delivery system as the relationships between these
processes are important.
121
‘Sell service’
process
‘Deliver service’
process
Customer
enquiry
Customer
requirements
Service offering
specifications
Service as required
The service delivery system
Figure 5.2: A process-based view of the service delivery system
Figure 5.3 presents the refined conceptual framework that was used as basis for
exploring the research question. The framework incorporates insights from the case
selection and from the sampling logic section (Section 4.4). The study comprises four
embedded cases (i.e. A, B, C, D) which represent four ‘service concept – processes’
pairs. For instance, a ‘sell service’ process (i.e. A₁) and a ‘deliver service’ process (i.e.
A₂) collectively provide service concept A to the customer. In addition, the framework
emphasises that examining process design issues requires an understanding of the
customer inputs supplied to the process architecture of the service delivery system.
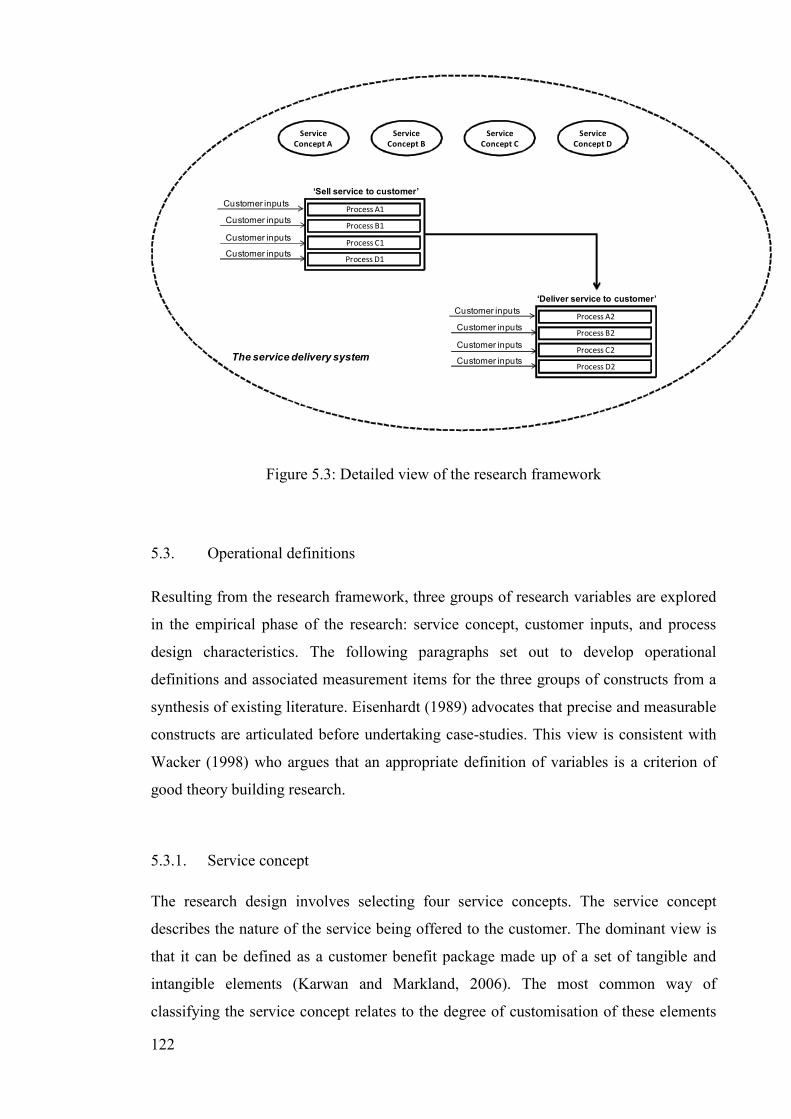
122
Service
Concept A
Service
Concept B
Service
Concept C
Service
Concept D
‘Sell service to customer’
Process A1
Process B1
Process D1
Process C1
Customer inputs
Customer inputs
Customer inputs
Customer inputs
‘Deliver service to customer’
Process A2
Process B2
Process D2
Process C2
Customer inputs
Customer inputs
Customer inputs
Customer inputs
The service delivery system
Figure 5.3: Detailed view of the research framework
5.3. Operational definitions
Resulting from the research framework, three groups of research variables are explored
in the empirical phase of the research: service concept, customer inputs, and process
design characteristics. The following paragraphs set out to develop operational
definitions and associated measurement items for the three groups of constructs from a
synthesis of existing literature. Eisenhardt (1989) advocates that precise and measurable
constructs are articulated before undertaking case-studies. This view is consistent with
Wacker (1998) who argues that an appropriate definition of variables is a criterion of
good theory building research.
5.3.1. Service concept
The research design involves selecting four service concepts. The service concept
describes the nature of the service being offered to the customer. The dominant view is
that it can be defined as a customer benefit package made up of a set of tangible and
intangible elements (Karwan and Markland, 2006). The most common way of
classifying the service concept relates to the degree of customisation of these elements
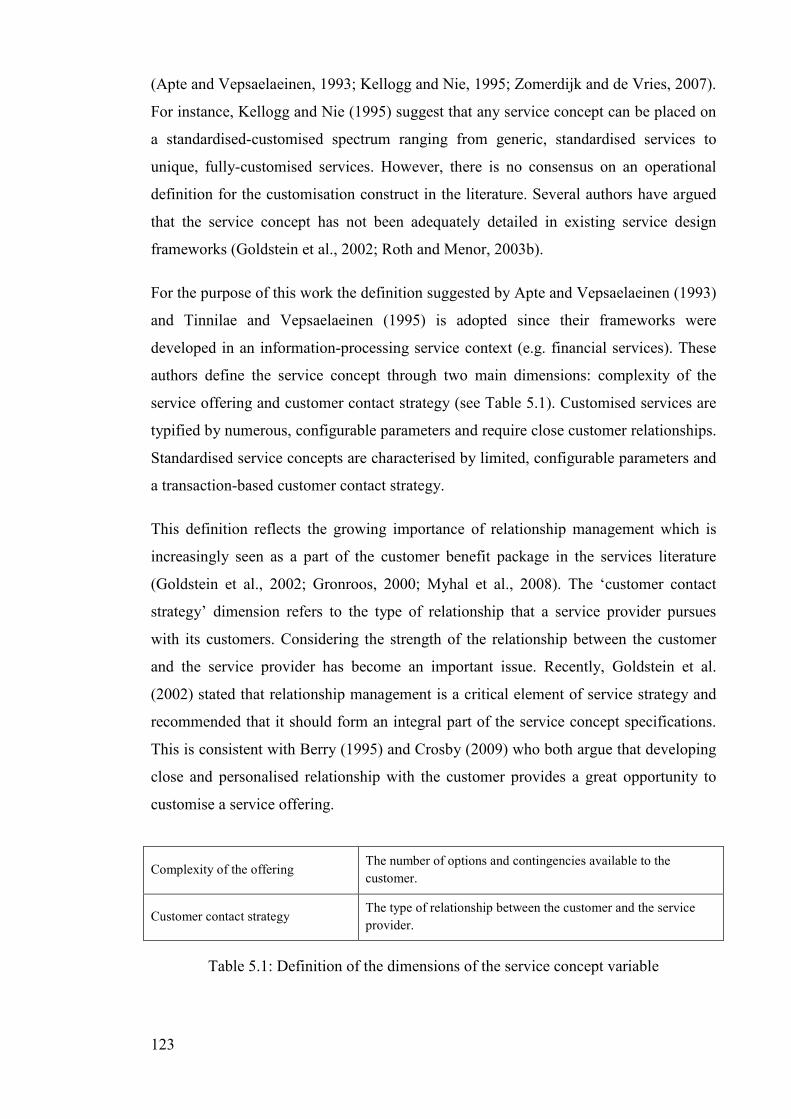
123
(Apte and Vepsaelaeinen, 1993; Kellogg and Nie, 1995; Zomerdijk and de Vries, 2007).
For instance, Kellogg and Nie (1995) suggest that any service concept can be placed on
a standardised-customised spectrum ranging from generic, standardised services to
unique, fully-customised services. However, there is no consensus on an operational
definition for the customisation construct in the literature. Several authors have argued
that the service concept has not been adequately detailed in existing service design
frameworks (Goldstein et al., 2002; Roth and Menor, 2003b).
For the purpose of this work the definition suggested by Apte and Vepsaelaeinen (1993)
and Tinnilae and Vepsaelaeinen (1995) is adopted since their frameworks were
developed in an information-processing service context (e.g. financial services). These
authors define the service concept through two main dimensions: complexity of the
service offering and customer contact strategy (see Table 5.1). Customised services are
typified by numerous, configurable parameters and require close customer relationships.
Standardised service concepts are characterised by limited, configurable parameters and
a transaction-based customer contact strategy.
This definition reflects the growing importance of relationship management which is
increasingly seen as a part of the customer benefit package in the services literature
(Goldstein et al., 2002; Gronroos, 2000; Myhal et al., 2008). The ‘customer contact
strategy’ dimension refers to the type of relationship that a service provider pursues
with its customers. Considering the strength of the relationship between the customer
and the service provider has become an important issue. Recently, Goldstein et al.
(2002) stated that relationship management is a critical element of service strategy and
recommended that it should form an integral part of the service concept specifications.
This is consistent with Berry (1995) and Crosby (2009) who both argue that developing
close and personalised relationship with the customer provides a great opportunity to
customise a service offering.
Complexity of the offering The number of options and contingencies available to the
customer.
Customer contact strategy The type of relationship between the customer and the service
provider.
Table 5.1: Definition of the dimensions of the service concept variable
124
The definition and measurement of the ‘complexity’ dimension draws on Apte and
Vepsaelaeinen (1993). Complexity is measured by reviewing the discrete options
available to the customer in establishing the specifications of the offering.
The ‘customer contact strategy’ variable ranges on a continuum from a transaction-
based strategy to a relationship-based strategy (Apte and Vepsaelaeinen, 1993). A
transaction-based strategy means that there are not many encounters between the
customer and the organisation and that service encounters are typified by short time
exchanges (Rao and Perry, 2002). In addition, there are no individual members of staff
that have personal responsibility for individual customer accounts (Silvestro, 1999). In
contrast, a relationship-based strategy consists of building long-term partnerships
involving multiple, linked service encounters over time (Rao and Perry, 2002). The
customer usually develops a relationship with specific employees who have personal
responsibility for individual customer accounts (Fitzgerald, 1991). The transaction-
based – relationship-based dichotomy corresponds to the concepts of transactional
customers and relational customers developed in the relationship marketing literature
(Gronroos, 2000).
Based on these descriptions, two items are used to measure the customer contact
strategy construct. First, the ratio of contract managers per customer is computed. This
reflects the degree to which individual members of staff have personal responsibility for
individual customer accounts (Silvestro, 1999). Second, following Dagger et al. (2009),
customer contact frequency is measured by reviewing the number of planned encounters
between the customer and the service provider over a one-year period. This is consistent
with recent empirical studies which have found that contact frequency positively
correlates with relationship strength (Dagger et al., 2009; Danaher et al., 2008). In this
study, customer contact is defined as planned, direct encounters between a customer and
a service provider that take place in the same time but not necessarily in the same place,
and have the opportunity for interaction. This view follows recent, extended definitions
of customer contact that include situations where the customer is virtually present such
as telephone conversations (i.e. virtual customer-self inputs in UST’s terms) (Sampson
and Froehle, 2006; Zomerdijk and de Vries, 2007).
125
5.3.2. Customer inputs
The research framework involves considering the customer inputs supplied to the
processes studied. Section 3.2 emphasised that both the type and the variability of inputs
should be taken into account in the research. However, Sampson and Froehle (2006)
provide little assistance regarding the operationalisation and the use of the customer
input variable in empirical research.
Customer input type is a categorical construct. Four categories are identified from the
extant literature: customer-self inputs (physical presence), customer-self inputs (mental
presence), customer possession, and customer information. This categorisation is based
on the works of Sampson and Froehle (2006) and Lovelock (1983).
The importance of input variability for process design in service operations research is
little understood and measuring variability is a major challenge (Godsiff et al., 2009).
Since the research focuses on information-processing service operations, customer
information is the primary input to the service delivery process. Previous research in
organisational theory suggests that there are two ways of describing information inputs:
equivocality and quantity (Daft and Lengel, 1986; Daft and Macintosh, 1981). It may be
argued that both dimensions affect process design requirements (Mills and Turk, 1986;
Wathen and Anderson, 1995).
First, equivocality of information relates to the variability in information provided by
customers. In this research, variability is defined as the difference between customer
information inputs provided to the process. Frei (2007) argues that the variability
concept has multiple dimensions. In the present research variability is conceptualised as
request variability and arrival rate variability. Request variability refers to the extent to
which customers have different requirements and provide different information inputs
to the process (Frei 2007, Harvey et al., 1997; Larsson and Bowen, 1989). Arrival rate
variability is defined as the degree to which customers inputs arrive in the process at
different times (Frei, 2007; Harvey et al., 1997). Arrival variability is closely related to
the concept of variation in demand which has been extensively discussed in the
manufacturing literature (Chen and Paulraj, 2004; Slack et al., 2004a). In this research,
arrival variability is measured by computing the monthly variation in the arrival rate of
customer inputs.
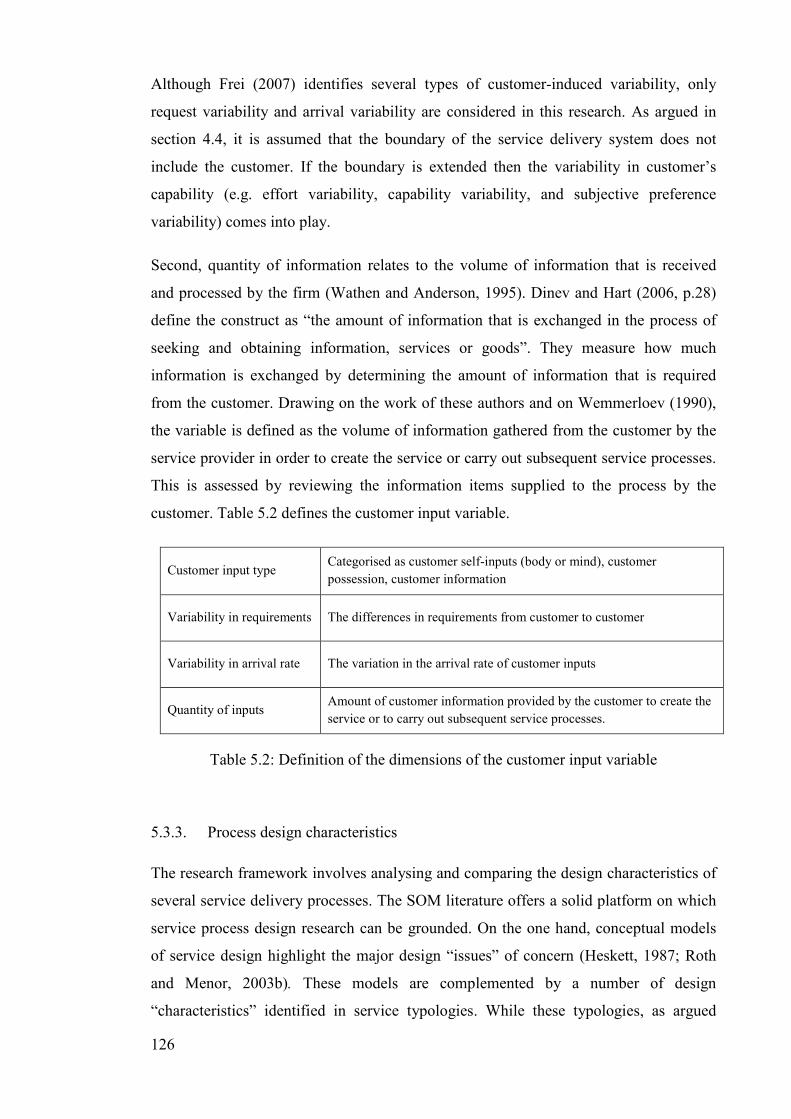
126
Although Frei (2007) identifies several types of customer-induced variability, only
request variability and arrival variability are considered in this research. As argued in
section 4.4, it is assumed that the boundary of the service delivery system does not
include the customer. If the boundary is extended then the variability in customer’s
capability (e.g. effort variability, capability variability, and subjective preference
variability) comes into play.
Second, quantity of information relates to the volume of information that is received
and processed by the firm (Wathen and Anderson, 1995). Dinev and Hart (2006, p.28)
define the construct as “the amount of information that is exchanged in the process of
seeking and obtaining information, services or goods”. They measure how much
information is exchanged by determining the amount of information that is required
from the customer. Drawing on the work of these authors and on Wemmerloev (1990),
the variable is defined as the volume of information gathered from the customer by the
service provider in order to create the service or carry out subsequent service processes.
This is assessed by reviewing the information items supplied to the process by the
customer. Table 5.2 defines the customer input variable.
Customer input type Categorised as customer self-inputs (body or mind), customer
possession, customer information
Variability in requirements The differences in requirements from customer to customer
Variability in arrival rate The variation in the arrival rate of customer inputs
Quantity of inputs Amount of customer information provided by the customer to create the
service or to carry out subsequent service processes.
Table 5.2: Definition of the dimensions of the customer input variable
5.3.3. Process design characteristics
The research framework involves analysing and comparing the design characteristics of
several service delivery processes. The SOM literature offers a solid platform on which
service process design research can be grounded. On the one hand, conceptual models
of service design highlight the major design “issues” of concern (Heskett, 1987; Roth
and Menor, 2003b). These models are complemented by a number of design
“characteristics” identified in service typologies. While these typologies, as argued
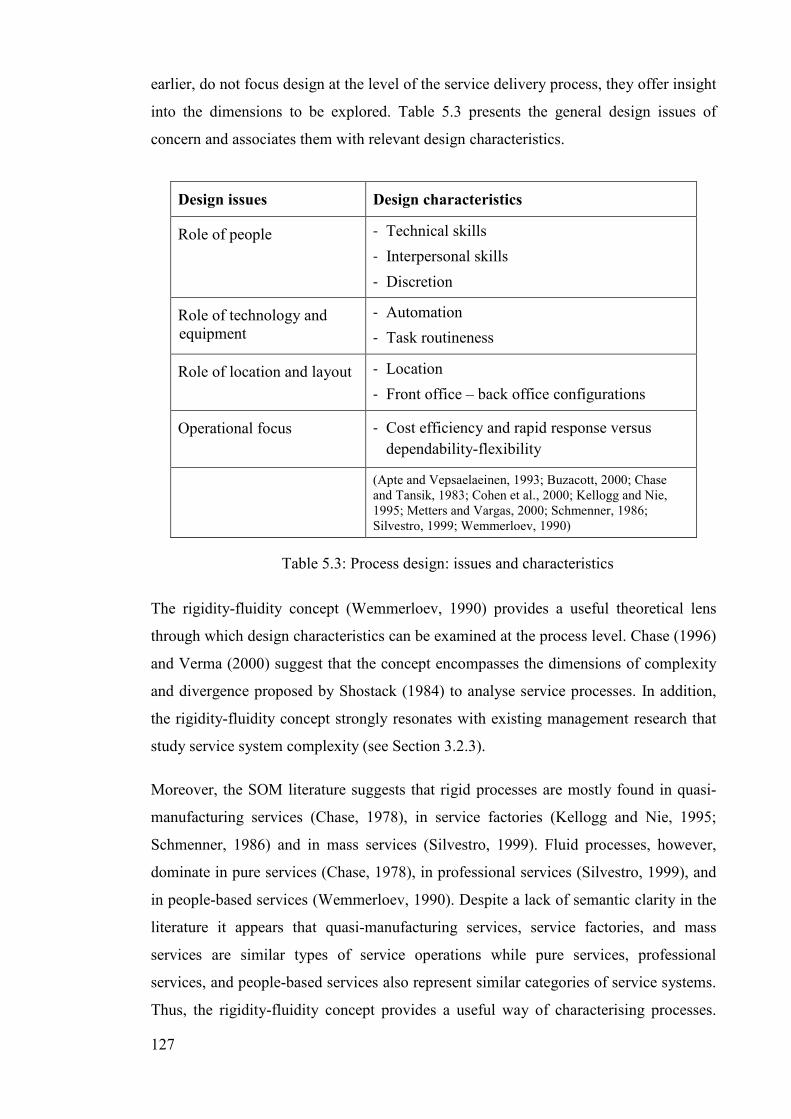
127
earlier, do not focus design at the level of the service delivery process, they offer insight
into the dimensions to be explored. Table 5.3 presents the general design issues of
concern and associates them with relevant design characteristics.
Design issues Design characteristics
Role of people
- Technical skills
- Interpersonal skills
- Discretion
Role of technology and equipment
- Automation
- Task routineness
Role of location and layout
- Location
- Front office – back office configurations
Operational focus - Cost efficiency and rapid response versus
dependability-flexibility
(Apte and Vepsaelaeinen, 1993; Buzacott, 2000; Chase and Tansik, 1983; Cohen et al., 2000; Kellogg and Nie, 1995; Metters and Vargas, 2000; Schmenner, 1986; Silvestro, 1999; Wemmerloev, 1990)
Table 5.3: Process design: issues and characteristics
The rigidity-fluidity concept (Wemmerloev, 1990) provides a useful theoretical lens
through which design characteristics can be examined at the process level. Chase (1996)
and Verma (2000) suggest that the concept encompasses the dimensions of complexity
and divergence proposed by Shostack (1984) to analyse service processes. In addition,
the rigidity-fluidity concept strongly resonates with existing management research that
study service system complexity (see Section 3.2.3).
Moreover, the SOM literature suggests that rigid processes are mostly found in quasi-
manufacturing services (Chase, 1978), in service factories (Kellogg and Nie, 1995;
Schmenner, 1986) and in mass services (Silvestro, 1999). Fluid processes, however,
dominate in pure services (Chase, 1978), in professional services (Silvestro, 1999), and
in people-based services (Wemmerloev, 1990). Despite a lack of semantic clarity in the
literature it appears that quasi-manufacturing services, service factories, and mass
services are similar types of service operations while pure services, professional
services, and people-based services also represent similar categories of service systems.
Thus, the rigidity-fluidity concept provides a useful way of characterising processes.
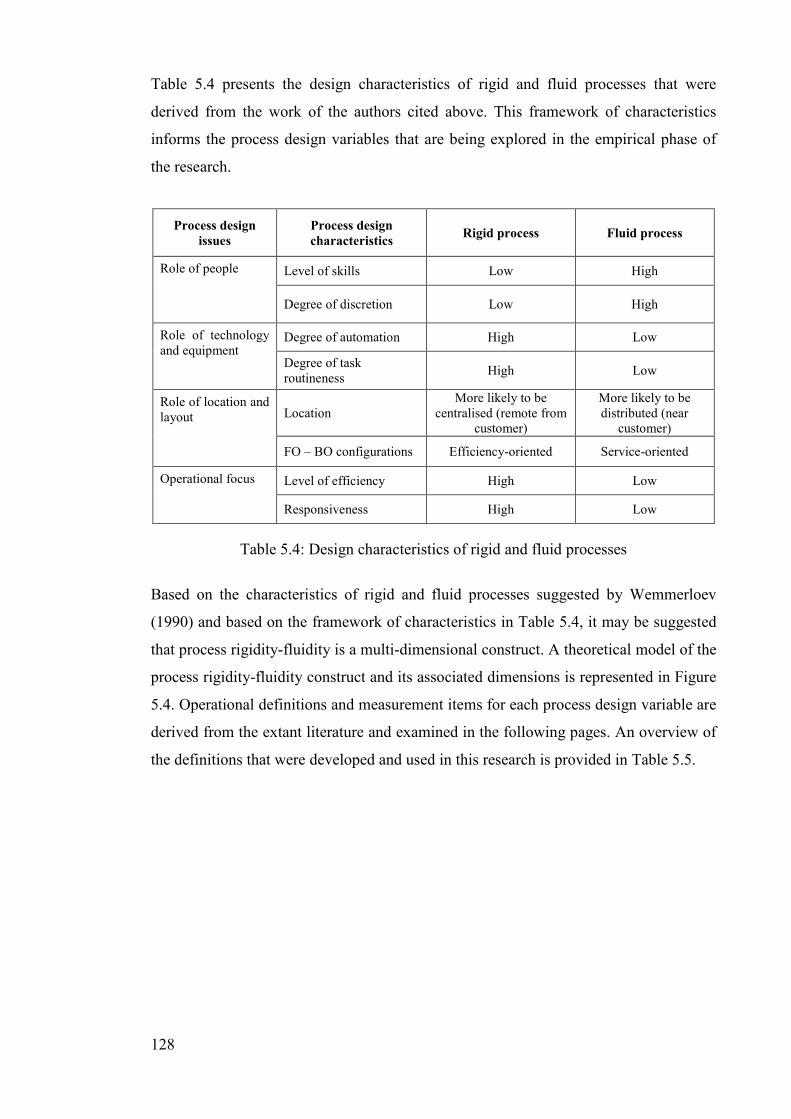
128
Table 5.4 presents the design characteristics of rigid and fluid processes that were
derived from the work of the authors cited above. This framework of characteristics
informs the process design variables that are being explored in the empirical phase of
the research.
Process design
issues
Process design
characteristics Rigid process Fluid process
Role of people Level of skills Low High
Degree of discretion Low High
Role of technology and equipment
Degree of automation High Low
Degree of task routineness
High Low
Role of location and layout Location
More likely to be centralised (remote from
customer)
More likely to be distributed (near
customer)
FO – BO configurations Efficiency-oriented Service-oriented
Operational focus Level of efficiency High Low
Responsiveness High Low
Table 5.4: Design characteristics of rigid and fluid processes
Based on the characteristics of rigid and fluid processes suggested by Wemmerloev
(1990) and based on the framework of characteristics in Table 5.4, it may be suggested
that process rigidity-fluidity is a multi-dimensional construct. A theoretical model of the
process rigidity-fluidity construct and its associated dimensions is represented in Figure
5.4. Operational definitions and measurement items for each process design variable are
derived from the extant literature and examined in the following pages. An overview of
the definitions that were developed and used in this research is provided in Table 5.5.
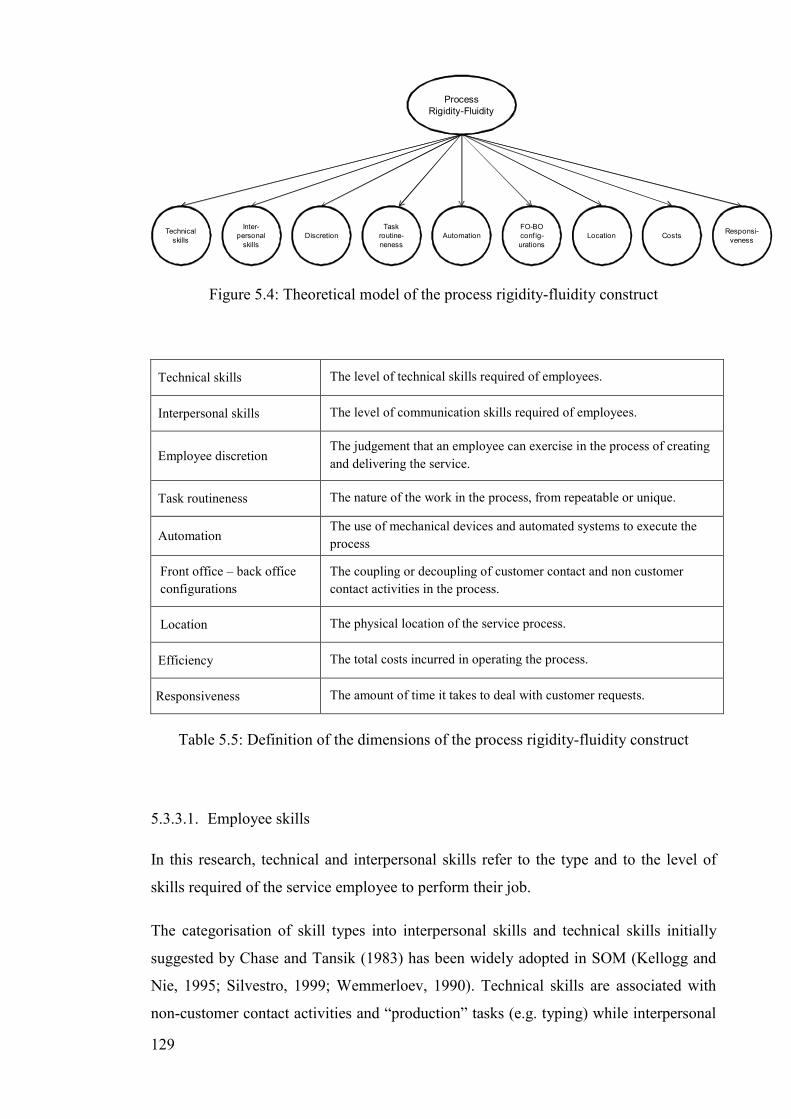
129
Process
Rigidity-Fluidity
Inter-
personal
skills
Technical
skills
Task
routine-
neness
Automation
FO-BO
conf ig-
urations
Location CostsDiscretionResponsi-
veness
Figure 5.4: Theoretical model of the process rigidity-fluidity construct
Technical skills The level of technical skills required of employees.
Interpersonal skills The level of communication skills required of employees.
Employee discretion The judgement that an employee can exercise in the process of creating
and delivering the service.
Task routineness The nature of the work in the process, from repeatable or unique.
Automation The use of mechanical devices and automated systems to execute the
process
Front office – back office
configurations
The coupling or decoupling of customer contact and non customer
contact activities in the process.
Location The physical location of the service process.
Efficiency The total costs incurred in operating the process.
Responsiveness The amount of time it takes to deal with customer requests.
Table 5.5: Definition of the dimensions of the process rigidity-fluidity construct
5.3.3.1. Employee skills
In this research, technical and interpersonal skills refer to the type and to the level of
skills required of the service employee to perform their job.
The categorisation of skill types into interpersonal skills and technical skills initially
suggested by Chase and Tansik (1983) has been widely adopted in SOM (Kellogg and
Nie, 1995; Silvestro, 1999; Wemmerloev, 1990). Technical skills are associated with
non-customer contact activities and “production” tasks (e.g. typing) while interpersonal
130
skills are closely related to customer contact activities and “communication” tasks (e.g.
interacting with the customer).
Rolfe (1990) notes that a lack of clarity surrounds the skill construct. She observes that
both direct and indirect measures can be used to measure the skill level of employees.
Direct measures of skills focus on the task and include dimensions such as task
complexity or knowledge required to perform the task. Indirect measures of skill
include staff grades, wages, years of education, years of experience, and training levels
(Napoleon and Gaimon, 2004). Batt (2002), for instance, captures the skill level of
employees by creating a skill index based the number of years of formal education of a
typical employee and the number of years of formal and on-the-job training needed for a
new employee to become proficient.
This research evaluates the level of employee skills required to execute the process.
This is achieved using staff grades. The staff grading structure is an objective, indirect
measure of skill which may sometimes be flawed as the skill level required for a job and
the actual skill level of an employee are not necessarily the same (Pagell et al., 2000).
Since this thesis addresses process design, it is interested in measuring the level of skills
of employees that management deems necessary to perform their job. It is arguable that
the level of skills needed to meet the requirements of the job is reflected by the staff
grading structure. This perspective is consistent with the work of Kellogg and Nie
(1995).
5.3.3.2. Employee discretion
This work uses the definition of Cook et al. (1999) who describe employee discretion as
the degree of judgement that an employee can exercise in the process of creating and
delivering the service without referring to supervisors. The construct is defined through
two main dimensions: discretion over the offering and discretion over the process.
Discretion over the offering refers to the judgement that an employee can exercise in
defining or changing the nature of the service being provided to the customer (Silvestro,
1999). Discretion over the process refers to the freedom that an employee can have in
deciding what tasks to perform and how to perform them (Soteriou and Chase, 1998).
131
Employee discretion relates to the concept of employee empowerment in the
manufacturing literature which is defined by Curkovic et al. (2000) as allowing
employees to decide how to go about doing their work without reference to supervisors.
Specifically in service settings, Silvestro et al. (1992) describe employee discretion as
the possibility for front-office personnel to exercise judgement in altering the service
package or process without referring to supervisors. Similarly, Rolfe (1990) refers to
discretion as the employee’s capacity to make decisions or to use judgement in relation
to a process, product, or general job performance. Lovelock (1983) defines discretion in
general terms as the extent to which customer contact personnel exercise judgment in
meeting individual customer needs. From a wider management perspective, Boreham
(1992, p.16) refers to discretion as “the extent to which individuals are constrained
within the parameters of their own job”. He explains that such constraints can range
from direct personal control, control through equipment or technical production
systems, to routine procedures and work practices.
The degree of employee discretion is measured by assessing the degree of freedom of
employees in relation to each individual dimension of the construct (i.e. discretion over
the service offering and discretion over the service process).
5.3.3.3. Task routineness
Task routineness relates to the repeatability or to the uniqueness of the work that is
performed. The construct addresses the range and diversity of tasks in the process.
This is consistent with previous research. Safizadeh et al. (2003) argue a routinized
process deals with hardly any exceptional cases. They measure the construct through a
single-item metric. Similarly, Jones (1987) notes that the nature of the tasks executed in
a process ranges from repeatable (i.e. the work does not vary much from customer to
customer) to unique (i.e. the work is different for every customer).
Routineness is closely related to the concept of task variety which is defined as the
extent to which the nature of the work to be performed varies from customer to
customer (Daft and Macintosh, 1981; Dean and Snell, 1991). In the work of many
authors, high task variety means that a specific employee performs diverse and distinct
tasks (Coetzer, 2006; DeVaro et al., 2007; Hackman and Oldham, 1975; Lee et al.,
1988; Seyal et al., 2004). In these studies, task variety is analysed at the level of the
132
employee (Narayanan et al., 2009). In this research, this definition is extended to
include all of the activities in the process. Task routineness is concerned with the variety
of the tasks performed in the entire process. This definition accounts for the differences
in the way the process is executed and addresses the sequential structure of work
inherent in the process (Pentland, 2003; Shostack, 1987). Determining whether the
process is executed in the same way most of the time requires a good grasp of the nature
of the activities, of their sequence, and of the people who perform these activities.
5.3.3.4. Automation
Automation relates to the use of mechanical devices and automated systems to execute
the process.
This definition refers to a phenomenon which Levitt (1976) calls “the industrialisation”
of service operations. In an industrialised or automated service, process technology and
systems provide a substitute for people as the transforming resources. Typically,
executing a process through automated systems contributes to improving process
efficiency (Hill et al., 2002). Collier (1983) broadly defines automation as the use of
machines to perform a sequence of tasks. Machines include technical equipment,
information systems, and communication technology. In recent times, the role of the
internet in offering opportunities for automation has been increasingly recognised
(Boyer et al., 2002; Sousa and Voss, 2006). Applications of automated equipment have
been reported in both customer contact operations and in non-customer contact
environments (Froehle and Roth, 2004; Walley and Amin, 1994). In other words,
technology can be used to substitute for both front-office employees and back-office
employees. Basabrumanian and Gupta (2005) distinguish between interactive activities
and automated activities. An interactive activity is defined as an activity performed by
an employee and assisted through a system. An automated activity is entirely performed
by a system.
There are no standard instruments available in the literature for measuring this variable.
Huete and Roth (1989) measure an industrialisation score based on the number of
employee-executed activities that are directly involved in service delivery. The fewer
employee activities directly involved in the delivery activities the higher the
industrialisation level. Building on this approach, the degree of process automation is
133
assessed by determining whether activities are performed by employees, entirely
executed by technology, or performed by employees and assisted through technology.
5.3.3.5. Front office (FO) – back office (BO) configurations
This construct refers to the allocation of FO work and BO work to employees in the
process. In a coupled process, customer contact activities and non-customer contact
activities are allocated to the same employees. In a decoupled process, these activities
are allocated to different employees (Metters and Vargas, 2000; Zomerdijk and de
Vries, 2007).
Front-office activities are performed in the presence of the customer while back-office
work is performed remotely from the customer (Shostack, 1984). Traditionally,
decoupling has been defined as separating a process into front-office activities and
back-office activities and segregating these activities into distinct jobs (Chase and
Tansik, 1983). Since the idea that different decoupling decisions are possible at process
level is relatively new in SOM research (see Section 3.5), a standard instrument for
measuring this variable does not exist. Assessing the extent of decoupling in the process
first involves classifying process activities into customer contact activities (FO) and
non-customer contact activities (BO). Second, it involves determining whether contact
activities and non-contact activities are allocated to the same employees or to different
employees.
5.3.3.6. Location
The location dimension refers to the physical location of the process (Chase and Tansik,
1983; Cohen et al., 2000). Organisations may decide to operate the process from a
centralised service facility located remotely from the customer or from a distributed
facility situated nearer the customer. Assessing location consists of determining where
the process is executed and whether all of the activities in the process are performed in
the same geographical location.
134
5.3.3.7. Efficiency
Usually, the efficiency of a service system is determined by the costs involved in
delivering the intended service (Mersha, 1990). Following Balasabrumanian and Gupta
(2005), efficiency is defined as the total costs incurred in operating the process.
In this research, the number of employees (i.e. Full Time Equivalents) per customer
served was the proxy used to evaluate process costs. This is consistent with the view
that in service operations the costs of service delivery are the transforming resources
required to execute the process (Mersha, 1990). In addition, this proxy is deemed
appropriate as it is the standard practice to measure efficiency in the utility sector
(Picazo-Tadeo et al., 2009). It is also in line with the work of Hyer et al. (2009) who
study the performance of a hospital unit by computing a measure of cost per injured
patient.
5.3.3.8. Responsiveness
Responsiveness is defined as the time it takes for the organisation to respond to a
customer request or query.
Responsiveness is one of the dimensions of the well-known service quality model
Servqual (Parasuraman et al., 1985; 1988). In Servqual responsiveness is described as
the organisation’s “willingness to help customers and provide prompt service”. In the
operations literature, responsiveness to customers is operationalised as the ability to
respond in a timely manner to the needs and wants of a customer (Curkovic et al., 2000)
or as the ability to minimise the time it takes to cater to customer needs (Droege et al.,
2004). The construct refers to the question of how rapidly a customer request or query is
handled. The response time dimension is measured through a single measurement item
corresponding to the amount of time elapsed between the time when a customer request
is received until the time when a response is given to the customer.
Having discussed in detail the conceptual framework that underpins the empirical work
and the definition of the research variables, the next chapter presents the techniques
employed to analyse data and provides case study data in relation to the research
variables.
135
CHAPTER 6
DATA ANALYSIS: METHOD AND CONCEPTUAL MODEL OF THE
SERVICE DELIVERY SYSTEM
6.1. Introduction
This chapter and the following two chapters describe how the case study data was
analysed and presents patterns of results. The general data analysis strategy relied
heavily on the research framework (see Figure 5.3) and on the case study protocol (see
Appendix 4B), which focused the researcher’s attention on certain data. The objective
of the data analysis was to measure and classify the research variables presented in
Chapter 5 to enable the researcher to address the research question. Specifically, the
relationship between service concepts, customer inputs, and the design characteristics of
the service delivery processes was explored empirically.
This chapter is divided into three sections as follows: Section 6.2 describes the method
of data analysis employed in this work; Section 6.3 presents a conceptual model of the
service delivery system of the case organisation. Detailed process models and process
descriptions are provided.
Chapter 7 presents the results of the analysis of service concept data as well as the
results of the analysis of customer input data. Chapter 8 addresses the analysis of
process design data.
It must be noted that these three data analysis chapters are restricted to the presentation
and analysis of the collected data. Chapter 10 summarises the patterns of results
presented in the data analysis chapters and compares the findings to the existing
literature.
6.2. Data analysis method
This section describes how the data was reduced and displayed to facilitate data analysis
and thus to allow the research question to be addressed. Essentially, the data analysis
process enabled the characterisation of each individual case using the three research
variables introduced earlier: service concept, customer inputs, and process design
characteristics. Miles and Huberman (1994) argue that there are three concurrent,

136
intertwined stages of data analysis: data reduction, data display, and conclusion
drawing. The approach presented here is consistent with these recommendations. Data
analysis took place in three phases. Phase one consisted of documenting and coding the
data. Phase two consisted of coherently organising the data in a variety of data displays.
Phase three was concerned with ranking the cases and classifying them across the
research variables. Figure 6.1 illustrates the steps performed in the data analysis
process. Each phase is discussed in further detail in the following pages.
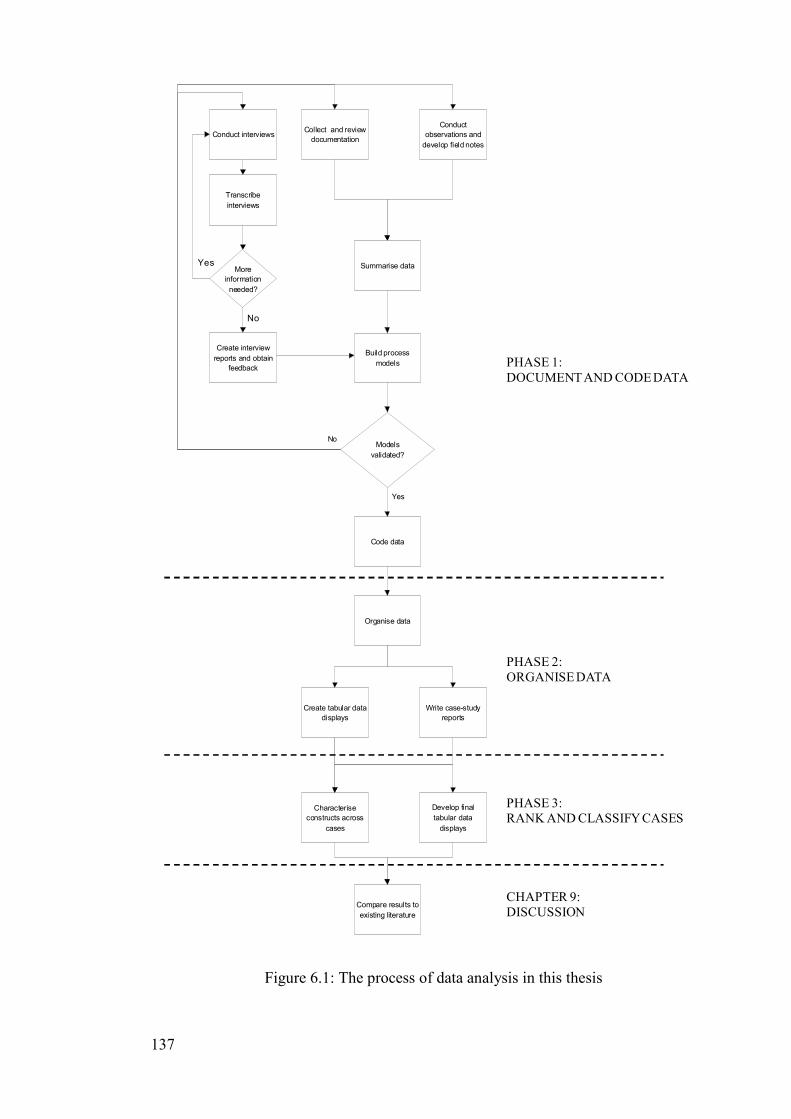
137
Conduct interviewsCollect and review
documentation
Conduct
observations and
develop field notes
Transcribe
interviews
More
information
needed?
Yes
Create interview
reports and obtain
feedback
Models
validated?
No
Code data
Organise data
No
Yes
Build process
models
Create tabular data
displays
Write case-study
reports
Characterise
constructs across
cases
Summarise data
Develop final
tabular data
displays
Compare results to
existing literature
PHASE 1: DOCUMENT AND CODE DATA
PHASE 2: ORGANISE DATA
PHASE 3: RANK AND CLASSIFY CASES
CHAPTER 9: DISCUSSION
Figure 6.1: The process of data analysis in this thesis
138
6.2.1. Document and code data
Case study data was documented and coded following guidelines by Miles and
Huberman (1994). First, the collected data was converted into text files. Interviews were
taped with a MP3 voice recorder and transcribed as soon as possible after the field trip.
The decision was made to record interviews as it was felt that it was important to
capture exactly what people said and to ensure that no information would get lost. The
difficulty of collecting process data in a relatively unknown environment and the
necessity to gather a vast amount of data drove this decision. Field notes were typed as
soon as possible to maximise recall. Each transcript was analysed based on the research
protocol and the relevant information was extracted, compiled, and summarised in a
coherent way in an interview report. As recommended by Voss et al. (2002), the
interview reports were then sent to the key informants for review. In situations where a
second interview had to be arranged, a single interview report was sent after the follow-
up interview to avoid making the interviewees feel overwhelmed with the research.
Other data such as company’s internal documents or field notes were either summarised
or kept in original form.
When conflicting information surfaced in different sources of data (for instance when
interview data and information found in the documentation did not match) this issue
was investigated and resolved. In general, clarification was sought from the informant.
When it was difficult to obtain a satisfactory response that explained the divergence
observed, the respondent was asked to identify another potential informant to discuss
the issue further. The use of multiple respondents who represent different perspectives
allows for data triangulation (Voss et al., 2002). Once it was felt that the information
collected was an accurate reflection of accounts given by key informants and was
consistent with other data, process models were built.
Developing models of the service delivery processes of the organisation was part of the
theory-building process. Process models can be regarded as conceptual models that
represent the service system of the organisation (Meredith et al., 1989). As discussed in
Section 3.3, the service delivery system was conceptualised as an architecture of
‘operate’ processes. Detailed models were constructed, using IDEF-0 methodology (see
Table 6.1 and Figure 6.2), allowing relevant process information to be displayed
consistently across all cases. An IDEF-0 process model displays what inputs are being
transformed into what outputs; what influences, controls, regulates, or constrains these
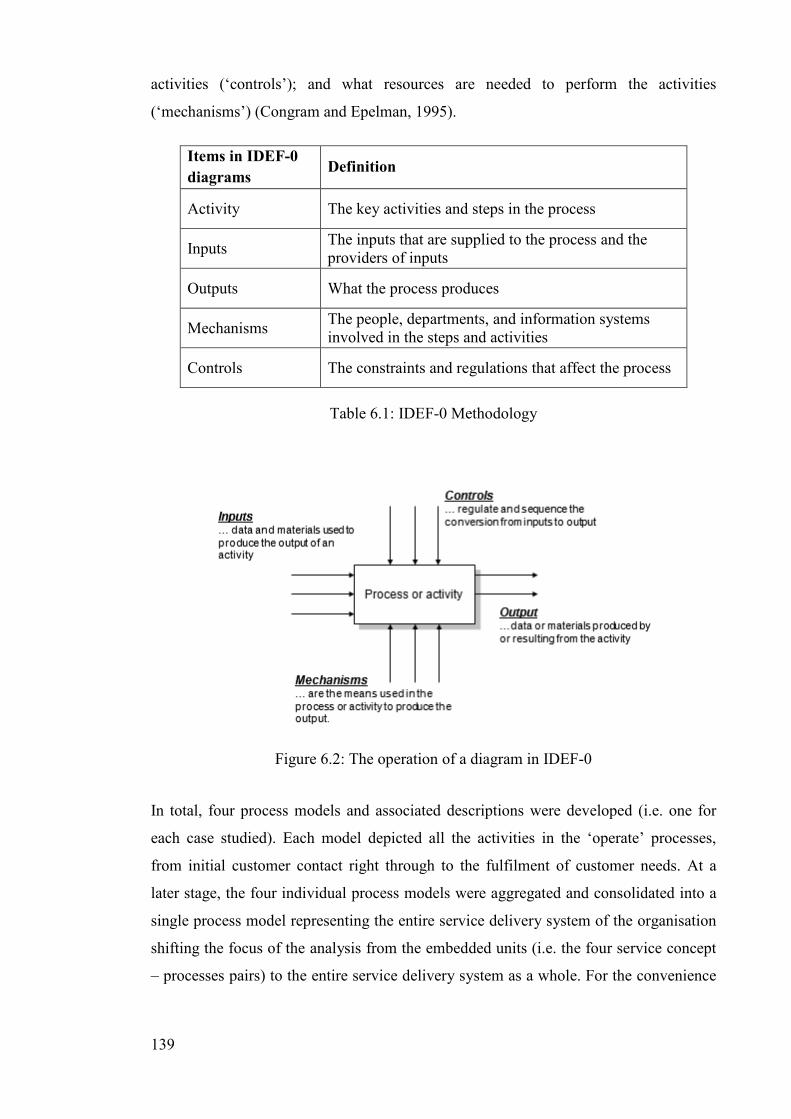
139
activities (‘controls’); and what resources are needed to perform the activities
(‘mechanisms’) (Congram and Epelman, 1995).
Items in IDEF-0
diagrams Definition
Activity The key activities and steps in the process
Inputs The inputs that are supplied to the process and the providers of inputs
Outputs What the process produces
Mechanisms The people, departments, and information systems involved in the steps and activities
Controls The constraints and regulations that affect the process
Table 6.1: IDEF-0 Methodology
Figure 6.2: The operation of a diagram in IDEF-0
In total, four process models and associated descriptions were developed (i.e. one for
each case studied). Each model depicted all the activities in the ‘operate’ processes,
from initial customer contact right through to the fulfilment of customer needs. At a
later stage, the four individual process models were aggregated and consolidated into a
single process model representing the entire service delivery system of the organisation
shifting the focus of the analysis from the embedded units (i.e. the four service concept
– processes pairs) to the entire service delivery system as a whole. For the convenience
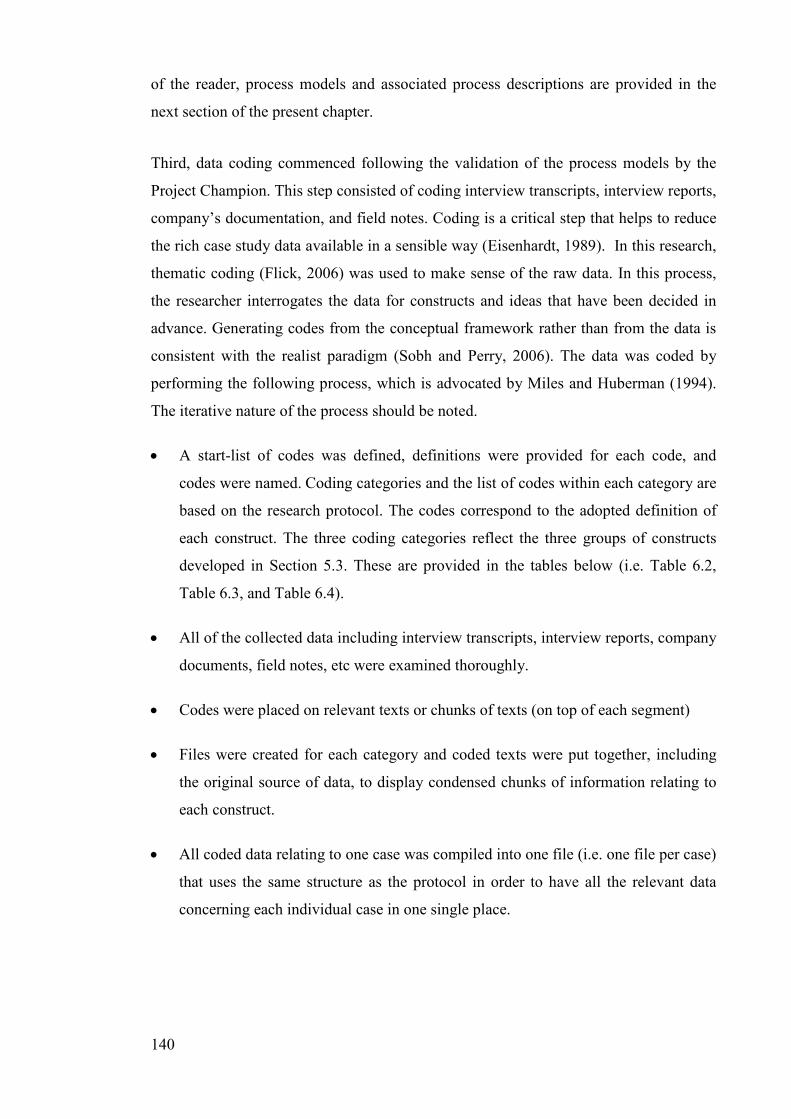
140
of the reader, process models and associated process descriptions are provided in the
next section of the present chapter.
Third, data coding commenced following the validation of the process models by the
Project Champion. This step consisted of coding interview transcripts, interview reports,
company’s documentation, and field notes. Coding is a critical step that helps to reduce
the rich case study data available in a sensible way (Eisenhardt, 1989). In this research,
thematic coding (Flick, 2006) was used to make sense of the raw data. In this process,
the researcher interrogates the data for constructs and ideas that have been decided in
advance. Generating codes from the conceptual framework rather than from the data is
consistent with the realist paradigm (Sobh and Perry, 2006). The data was coded by
performing the following process, which is advocated by Miles and Huberman (1994).
The iterative nature of the process should be noted.
• A start-list of codes was defined, definitions were provided for each code, and
codes were named. Coding categories and the list of codes within each category are
based on the research protocol. The codes correspond to the adopted definition of
each construct. The three coding categories reflect the three groups of constructs
developed in Section 5.3. These are provided in the tables below (i.e. Table 6.2,
Table 6.3, and Table 6.4).
• All of the collected data including interview transcripts, interview reports, company
documents, field notes, etc were examined thoroughly.
• Codes were placed on relevant texts or chunks of texts (on top of each segment)
• Files were created for each category and coded texts were put together, including
the original source of data, to display condensed chunks of information relating to
each construct.
• All coded data relating to one case was compiled into one file (i.e. one file per case)
that uses the same structure as the protocol in order to have all the relevant data
concerning each individual case in one single place.
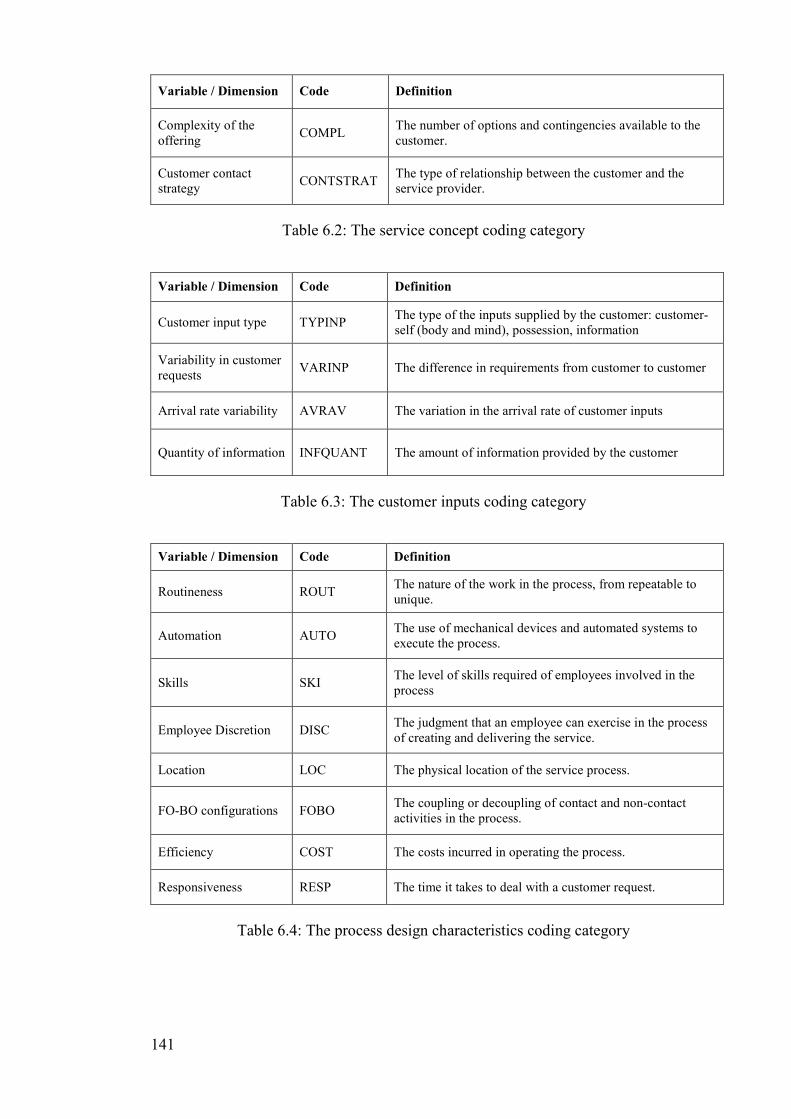
141
Variable / Dimension Code Definition
Complexity of the offering
COMPL The number of options and contingencies available to the customer.
Customer contact strategy
CONTSTRAT The type of relationship between the customer and the service provider.
Table 6.2: The service concept coding category
Variable / Dimension Code Definition
Customer input type TYPINP The type of the inputs supplied by the customer: customer-self (body and mind), possession, information
Variability in customer requests
VARINP The difference in requirements from customer to customer
Arrival rate variability AVRAV The variation in the arrival rate of customer inputs
Quantity of information INFQUANT The amount of information provided by the customer
Table 6.3: The customer inputs coding category
Variable / Dimension Code Definition
Routineness ROUT The nature of the work in the process, from repeatable to unique.
Automation AUTO The use of mechanical devices and automated systems to execute the process.
Skills SKI The level of skills required of employees involved in the process
Employee Discretion DISC The judgment that an employee can exercise in the process of creating and delivering the service.
Location LOC The physical location of the service process.
FO-BO configurations FOBO The coupling or decoupling of contact and non-contact activities in the process.
Efficiency COST The costs incurred in operating the process.
Responsiveness RESP The time it takes to deal with a customer request.
Table 6.4: The process design characteristics coding category
142
6.2.2. Organise data
The coded data was then organised within cases by building various tabular displays.
The data was sorted and re-arranged to group together and summarise the information
relating to each construct in a meaningful way. Drawing on Sousa’s research (2000), a
table which presents the sorted data in connection with the constructs was produced for
each individual case. The table has the same structure as the research protocol and
systematically displays the relevant information about each individual case (see case
study protocol in Appendix 4B). At this stage, each case was treated as an individual
study. The result of this process was four case-oriented data displays documenting how
each case addresses the research variables.
In parallel, a detailed, descriptive summary of each case was then produced in order to
become “intimately familiar with each case as a stand-alone entity” (Eisenhardt, 1989,
p.540). The process models formed an important part of the case study reports. As
mentioned in Section 4.5., the four case-study reports were sent to the Project
Champion for review. Validated reports formed a robust basis for supporting the cross-
case data analysis.
In the cross-case analysis, the cases studied were compared with one another. A set of
tabular, construct-oriented displays were produced to systematically present the relevant
information about each construct across the cases. The information displayed was used
to compare, measure, and rank the research constructs across the cases. Each construct
was classified using robust, triangulated data.
Ultimately, after constructs were classified, final data displays in the form of case-
oriented tables were built to summarise the results of the data analysis.
6.2.3. Characterisation of cases across research variables
In the process of building data displays, each variable was ranked from 1 to 4 using an
ordinal scale. This enabled the study to draw cross-case conclusions about each
variable. Since much of the collected data was qualitative, characterising the constructs
across the cases required some degree of interpretation by the researcher. Throughout
the process, the focus was on searching for clear and established similarities and
differences across the cases. For each variable studied, cases were ranked relative to
143
each other using a 1-4 ordinal scale. Using an ordinal scale is appropriate since no scale
that allows the measurement of the variables studied in absolute terms has been
developed in the literature. In order to achieve consistency in the measurement, the
same scale was used to measure each variable. If two cases were very similar (i.e. no
clear or established differences between two specific cases could be established) they
were given the same rating. Although some variables were measured and ranked using
mostly qualitative data, this still enables the comparison of cases and their classification
in relation to each other. Whenever possible, quantitative data was provided to
strengthen qualitative evidence. The measurement of quantitative items was supported
by qualitative evidence.
The following rules, derived from Sousa and Voss (2001), were used to measure the
variables.
RULE 1: Rule for rating uni-dimensional variables:
R1.1 Quantitative items (numerical values): The dimensions were ranked from 1 to 4 in
an ordinal way; 1 being attributed to the dimension that scored the lowest and 4 to the
highest.
R1.2 Qualitative items (textual descriptions): The cases were ranked from 1 to 4 based
on the dimension observed.
RULE 2: Rule for rating multi-dimensional constructs:
R2. Each dimension was ranked from 1 to 4 following rule R1.1 or R1.2. The values (1
to 4) of the individual dimension were added to give a total score for the construct
considered. The construct was then rated from 1 to 4 using rule R1.1.
An important issue to consider when measuring multi-dimensional items is the relative
importance of the indicators of each dimension. This is often operationalised by
assigning weights to individual dimensions (Law et al., 1998). Regarding the research
presented here, existing SOM theory was deemed not detailed enough to prescribe the
exact arithmetic relation between the constructs under study and their dimensions. As a
result, the decision was made not to use weights. Each multi-item variable was assumed
to be represented by the simple sum of its dimensions. This is a conservative approach
that assumes that all indicators have the same importance.
144
6.2.4. Validating the results
After the data was analysed according to the procedures described above, a follow-up
meeting was arranged with the Project Champion and one of her managers to discuss
the results. In this instance, the Project Champion was asked to invite a manager who
did not take part in previous interviews in order to have “fresh eyes” on the results. The
findings were validated in two distinct stages. First, the two informants were asked to
rank each construct from 1 to 4 across the four cases studied. For example, they were
asked to evaluate the degree of flexibility of the four ‘sell service’ processes studied and
to rank them from low-perceived flexibility to high-perceived flexibility. This enabled
to triangulate the results obtained. Second, they were asked to discuss the findings in
detail and to comment on each result.
6.3. Conceptual model of the service delivery system
This section presents a conceptual model of the service delivery system. In this
research, the service delivery system is conceptualised as a set of ‘operate’ processes.
To analyse the research variables, a first step was to identify and understand the service
delivery processes and develop detailed process models.
6.3.1. Overview of the service delivery system
Figure 6.2 represents the organisation’s service delivery system using the IDEF-0
modelling technique. It is a general, high-level process model that gives an overview of
what the entire service system looks like. The model depicts the core processes, the
customer inputs supplied, the major information flows between the processes, as well as
the resources that perform the processes. The importance of taking an end-to-end
process-based perspective of service delivery was highlighted by a manager in charge of
service quality and customer satisfaction in the case company:
• “To me, it’s key to understand the process holistically, from a customer
perspective” – Head of service quality (TT)
The organisation’s service delivery system comprises two types of ‘operate’ processes:
‘sell service to customer’ (A1) and ‘deliver service to customer’ (A2), as illustrated in
Figure 6.2.
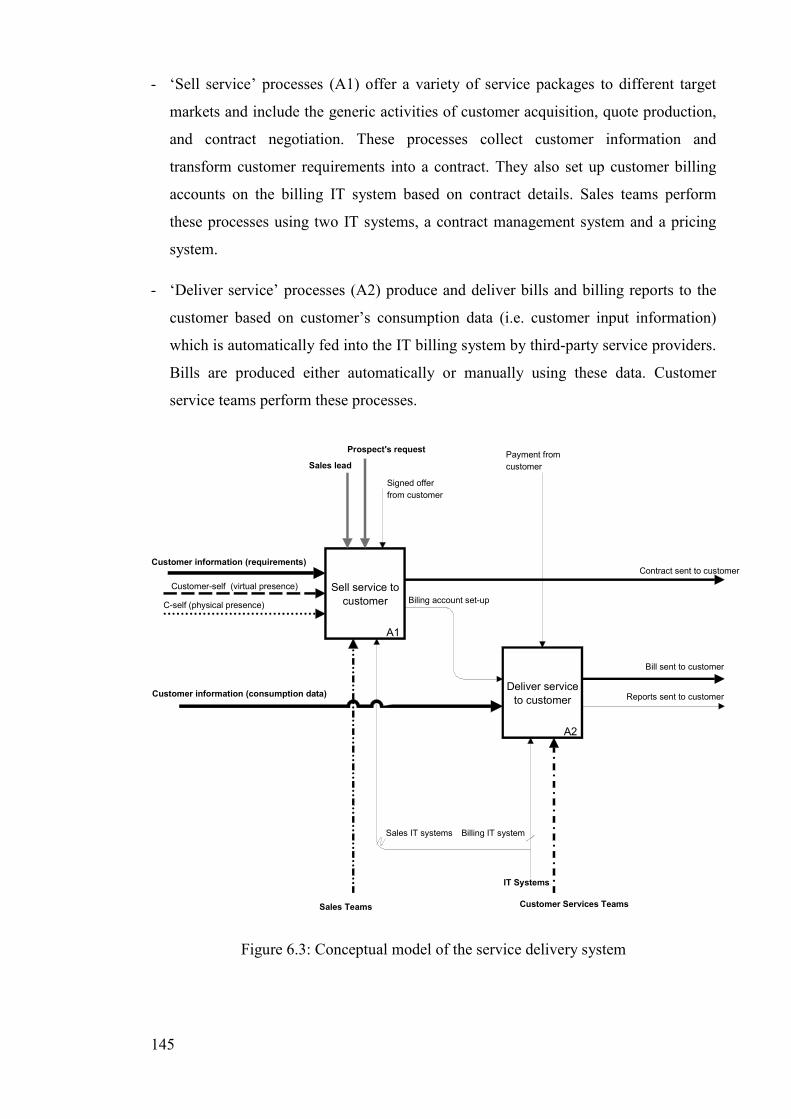
145
- ‘Sell service’ processes (A1) offer a variety of service packages to different target
markets and include the generic activities of customer acquisition, quote production,
and contract negotiation. These processes collect customer information and
transform customer requirements into a contract. They also set up customer billing
accounts on the billing IT system based on contract details. Sales teams perform
these processes using two IT systems, a contract management system and a pricing
system.
- ‘Deliver service’ processes (A2) produce and deliver bills and billing reports to the
customer based on customer’s consumption data (i.e. customer input information)
which is automatically fed into the IT billing system by third-party service providers.
Bills are produced either automatically or manually using these data. Customer
service teams perform these processes.
Sell service to
customer
A1
Deliver service
to customer
A2
C-self (physical presence)
Customer information (requirements)
Customer-self (virtual presence)
Prospect's request
Signed offer
from customer
Contract sent to customer
Bill sent to customer
Biling account set-up
Customer Services Teams
IT Systems
Sales IT systems Billing IT system
Sales lead
Reports sent to customer
Payment from
customer
Sales Teams
Customer information (consumption data)
Figure 6.3: Conceptual model of the service delivery system
146
6.3.2. Case-oriented process models
To enable the analysis and measurement of customer inputs and process design
variables, the high-level model of ‘operate’ processes represented above can be
decomposed into lower-level models. A detailed process model displays the various
activities that make up the entire process. For each service concept selected, a model
representing the activities of both the ‘sell service’ process (A1) and the ‘deliver
service’ process (A2) was built at a lower level of granularity. In total, four sets of
process models were constructed (i.e. one for each case studied). Associated process
descriptions were developed. Both the detailed process models and the process
descriptions were submitted to the business for review and approval. The measurement
of customer inputs variables and of process design variables was conducted on the
validated models. The models presented here are logical ‘as-is’ models which purport to
describe existing processes.
6.3.2.1. Case A: “default” service concept
‘Sell service to customer’ (A1) (Figure 6.4)
This process sets out to produce deemed offers for customers who move into premises
that are already being supplied with electricity by the case organisation. The process
starts when a notification of a change of tenancy is received from the customer. The
‘raise enquiry’ activity (A11) consists of: verifying that the information provided by the
customer is both accurate and complete; and logging the enquiry in a local database.
Incoming customers provide information by filling out an application form and sending
it to the team through the mail. Although information may be provided over the
telephone, a completed application form is necessary for the process to go ahead. The
‘manage customer record’ activity (A12) consists of creating or updating customer
information on the Customer Data Management System (CCMS) and of allocating the
supply point to the new customer in the system. The ‘create and send offer’ activity
(A13) consists of generating an offer in the pricing system, referred to as Pricing Expert
(PE), and sending the contract to the customer. In parallel, account details are
transferred to the IT billing system. The process is performed by a team of Customer
Service Advisors (CSA).
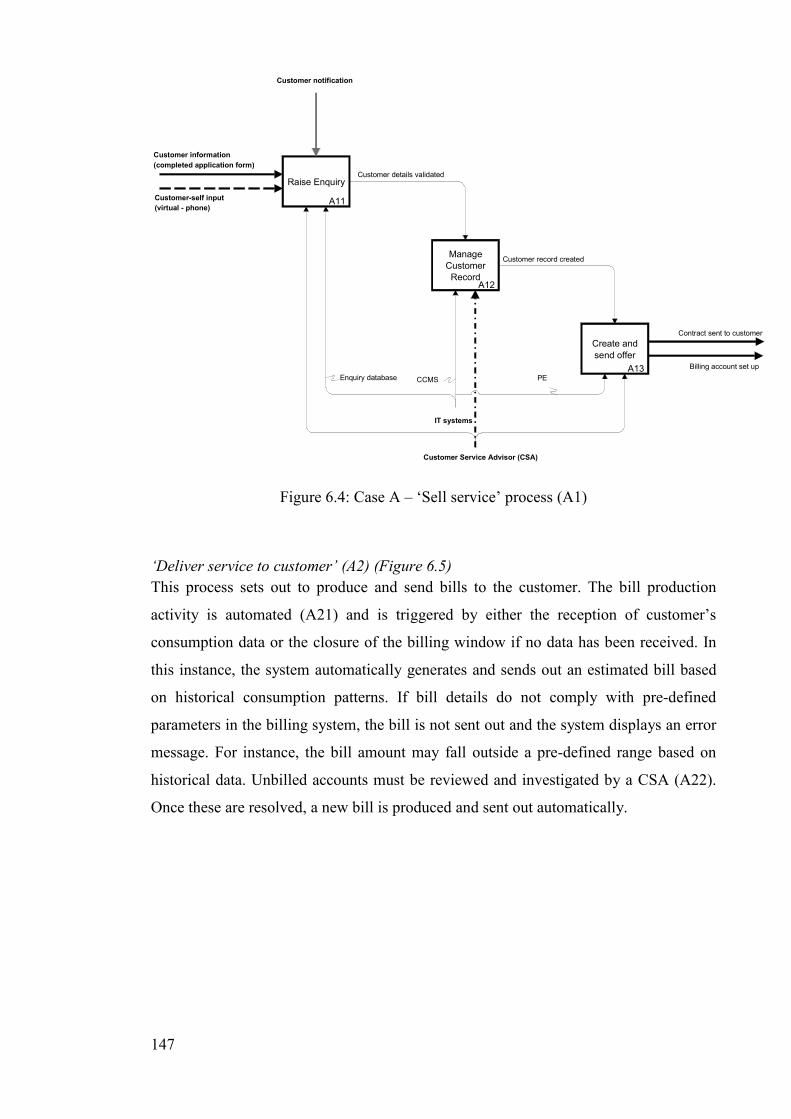
147
Raise Enquiry
A11
Manage
Customer
RecordA12
Create and
send offer
A13
Contract sent to customer
Customer information
(completed application form)
Customer details validated
Customer record created
Billing account set up
Customer Service Advisor (CSA)
Customer notification
Customer-self input
(virtual - phone)
IT systems
Enquiry database PECCMS
Figure 6.4: Case A – ‘Sell service’ process (A1)
‘Deliver service to customer’ (A2) (Figure 6.5)
This process sets out to produce and send bills to the customer. The bill production
activity is automated (A21) and is triggered by either the reception of customer’s
consumption data or the closure of the billing window if no data has been received. In
this instance, the system automatically generates and sends out an estimated bill based
on historical consumption patterns. If bill details do not comply with pre-defined
parameters in the billing system, the bill is not sent out and the system displays an error
message. For instance, the bill amount may fall outside a pre-defined range based on
historical data. Unbilled accounts must be reviewed and investigated by a CSA (A22).
Once these are resolved, a new bill is produced and sent out automatically.
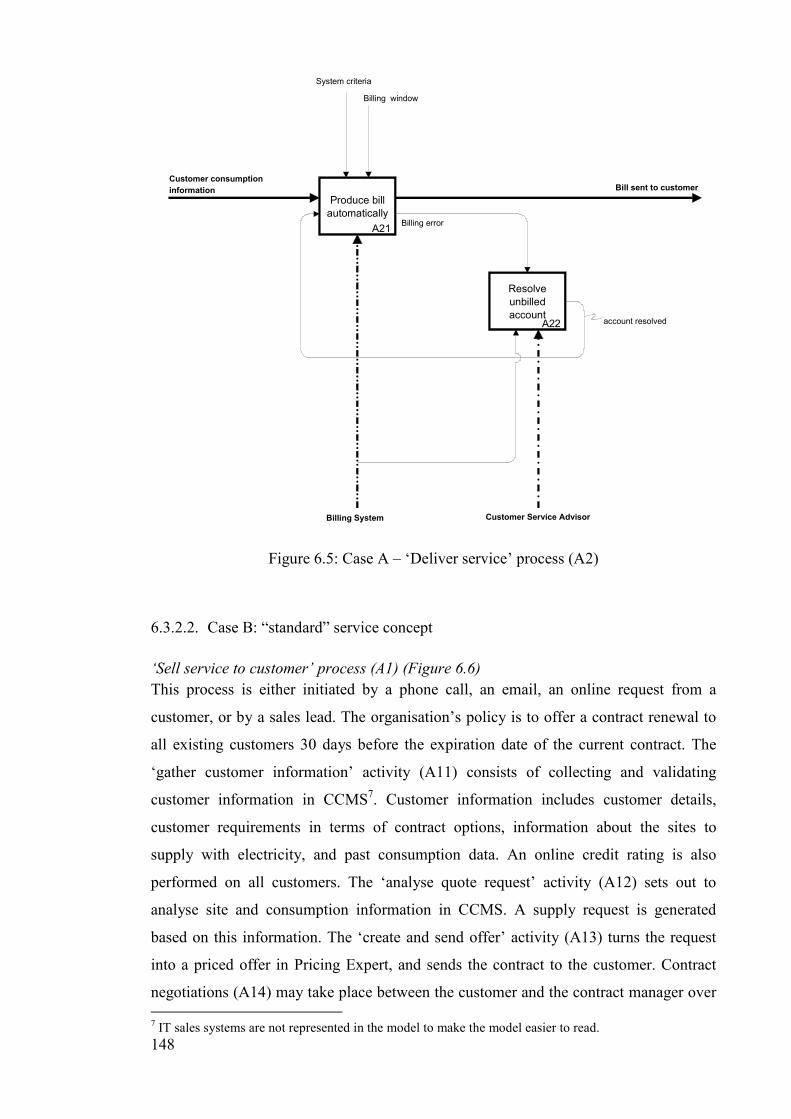
148
Produce bill
automatically
A21
Resolve
unbilled
accountA22
Bill sent to customer
Billing error
Billing System Customer Service Advisor
account resolved
System criteria
Billing window
Customer consumption
information
Figure 6.5: Case A – ‘Deliver service’ process (A2)
6.3.2.2. Case B: “standard” service concept
‘Sell service to customer’ process (A1) (Figure 6.6)
This process is either initiated by a phone call, an email, an online request from a
customer, or by a sales lead. The organisation’s policy is to offer a contract renewal to
all existing customers 30 days before the expiration date of the current contract. The
‘gather customer information’ activity (A11) consists of collecting and validating
customer information in CCMS7. Customer information includes customer details,
customer requirements in terms of contract options, information about the sites to
supply with electricity, and past consumption data. An online credit rating is also
performed on all customers. The ‘analyse quote request’ activity (A12) sets out to
analyse site and consumption information in CCMS. A supply request is generated
based on this information. The ‘create and send offer’ activity (A13) turns the request
into a priced offer in Pricing Expert, and sends the contract to the customer. Contract
negotiations (A14) may take place between the customer and the contract manager over
7 IT sales systems are not represented in the model to make the model easier to read.
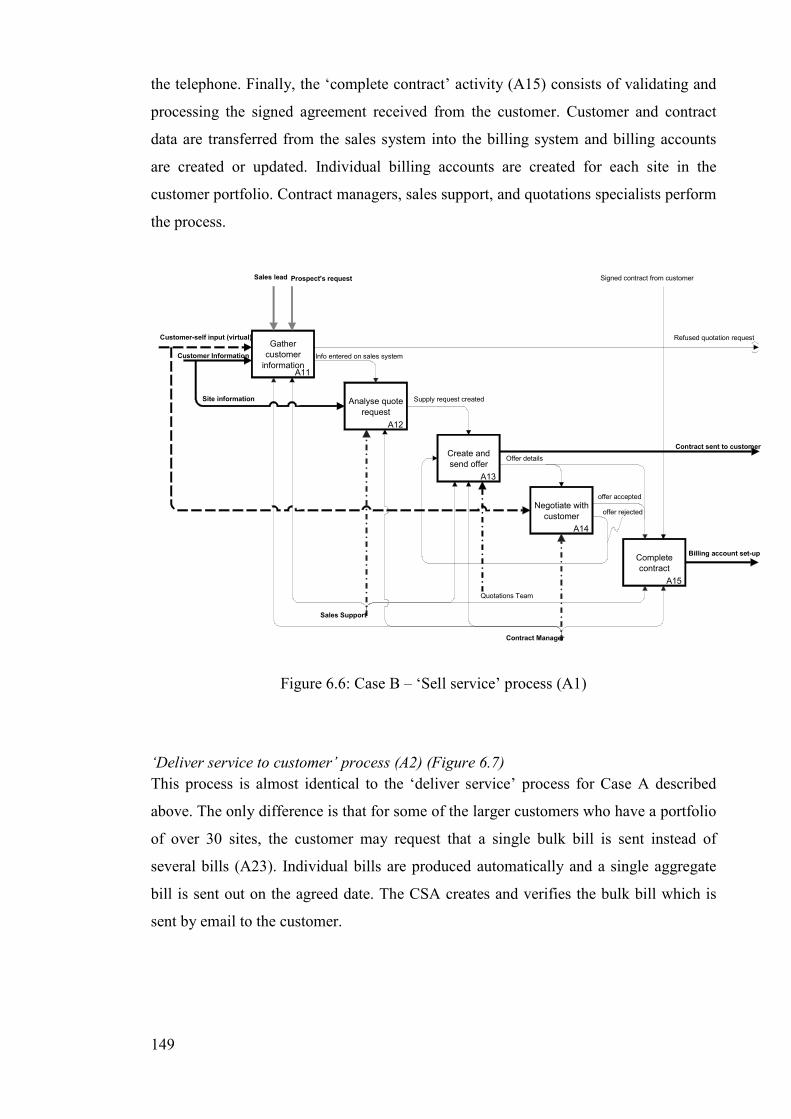
149
the telephone. Finally, the ‘complete contract’ activity (A15) consists of validating and
processing the signed agreement received from the customer. Customer and contract
data are transferred from the sales system into the billing system and billing accounts
are created or updated. Individual billing accounts are created for each site in the
customer portfolio. Contract managers, sales support, and quotations specialists perform
the process.
Gather
customer
informationA11
Analyse quote
request
A12
Create and
send offer
A13
Negotiate with
customer
A14
Complete
contract
A15
Contract sent to customer
Info entered on sales system
Supply request created
Contract Manager
Sales Support
Offer details
Prospect's requestSales lead
Customer Information
Signed contract from customer
Customer-self input (virtual)
Billing account set-up
Refused quotation request
Site information
Quotations Team
offer rejected
offer accepted
Figure 6.6: Case B – ‘Sell service’ process (A1)
‘Deliver service to customer’ process (A2) (Figure 6.7)
This process is almost identical to the ‘deliver service’ process for Case A described
above. The only difference is that for some of the larger customers who have a portfolio
of over 30 sites, the customer may request that a single bulk bill is sent instead of
several bills (A23). Individual bills are produced automatically and a single aggregate
bill is sent out on the agreed date. The CSA creates and verifies the bulk bill which is
sent by email to the customer.
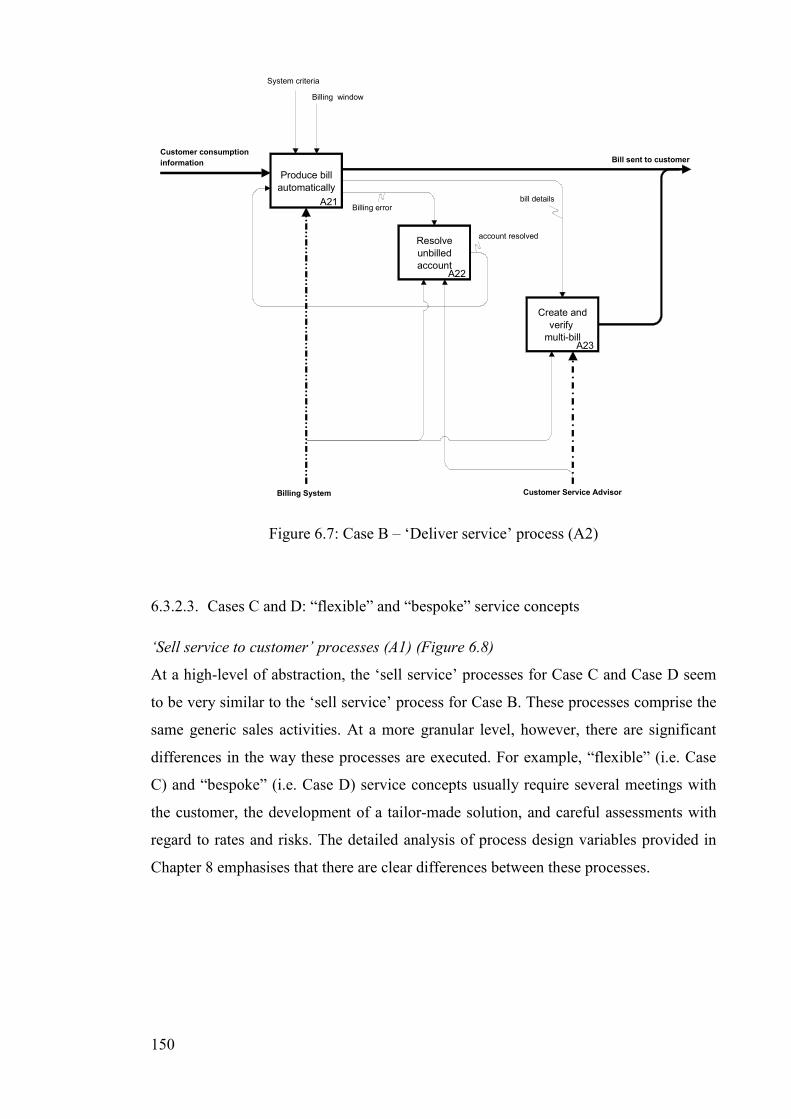
150
Produce bill
automatically
A21
Resolve
unbilled
accountA22
Create and
verify
multi-billA23
Bill sent to customer
Billing error
Billing System Customer Service Advisor
account resolved
System criteria
Billing window
Customer consumption
information
bill details
Figure 6.7: Case B – ‘Deliver service’ process (A2)
6.3.2.3. Cases C and D: “flexible” and “bespoke” service concepts
‘Sell service to customer’ processes (A1) (Figure 6.8)
At a high-level of abstraction, the ‘sell service’ processes for Case C and Case D seem
to be very similar to the ‘sell service’ process for Case B. These processes comprise the
same generic sales activities. At a more granular level, however, there are significant
differences in the way these processes are executed. For example, “flexible” (i.e. Case
C) and “bespoke” (i.e. Case D) service concepts usually require several meetings with
the customer, the development of a tailor-made solution, and careful assessments with
regard to rates and risks. The detailed analysis of process design variables provided in
Chapter 8 emphasises that there are clear differences between these processes.
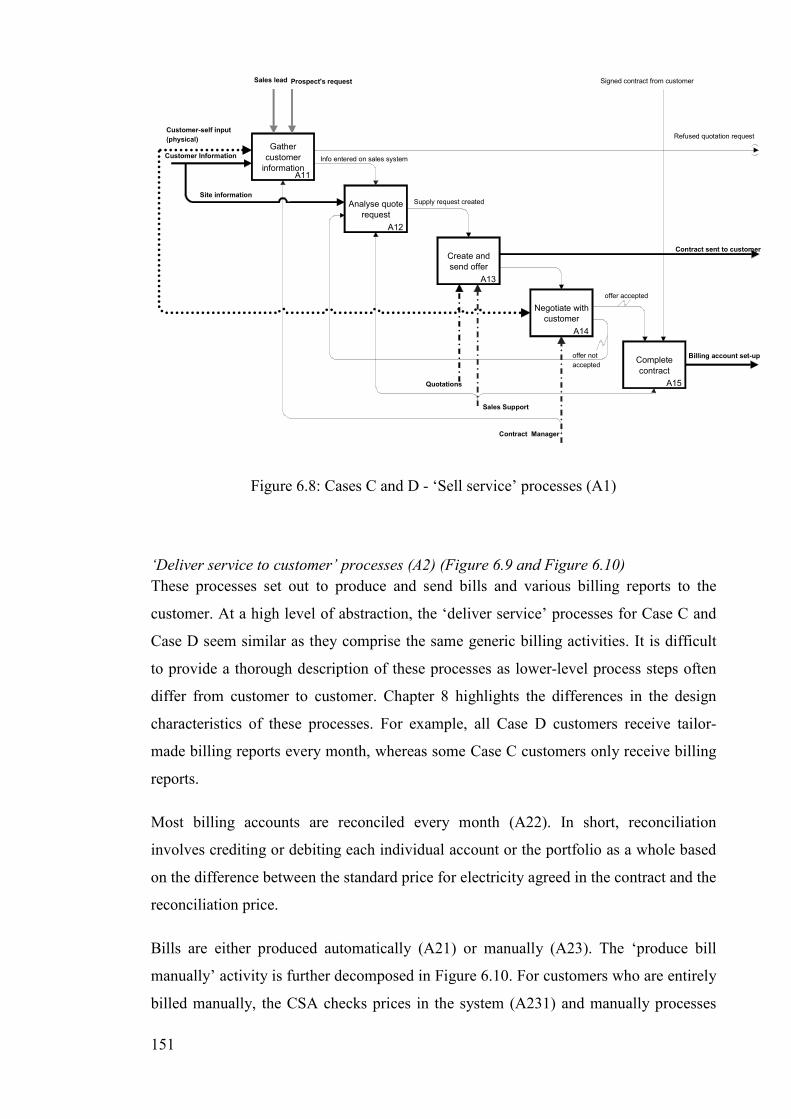
151
Gather
customer
informationA11
Analyse quote
request
A12
Create and
send offer
A13
Negotiate with
customer
A14
Complete
contract
A15
Contract sent to customer
Info entered on sales system
Supply request created
Contract Manager
Sales Support
Prospect's requestSales lead
Customer Information
Signed contract from customer
Customer-self input
(physical)
Billing account set-up
Refused quotation request
Site information
Quotations
offer not
accepted
offer accepted
Figure 6.8: Cases C and D - ‘Sell service’ processes (A1)
‘Deliver service to customer’ processes (A2) (Figure 6.9 and Figure 6.10)
These processes set out to produce and send bills and various billing reports to the
customer. At a high level of abstraction, the ‘deliver service’ processes for Case C and
Case D seem similar as they comprise the same generic billing activities. It is difficult
to provide a thorough description of these processes as lower-level process steps often
differ from customer to customer. Chapter 8 highlights the differences in the design
characteristics of these processes. For example, all Case D customers receive tailor-
made billing reports every month, whereas some Case C customers only receive billing
reports.
Most billing accounts are reconciled every month (A22). In short, reconciliation
involves crediting or debiting each individual account or the portfolio as a whole based
on the difference between the standard price for electricity agreed in the contract and the
reconciliation price.
Bills are either produced automatically (A21) or manually (A23). The ‘produce bill
manually’ activity is further decomposed in Figure 6.10. For customers who are entirely
billed manually, the CSA checks prices in the system (A231) and manually processes
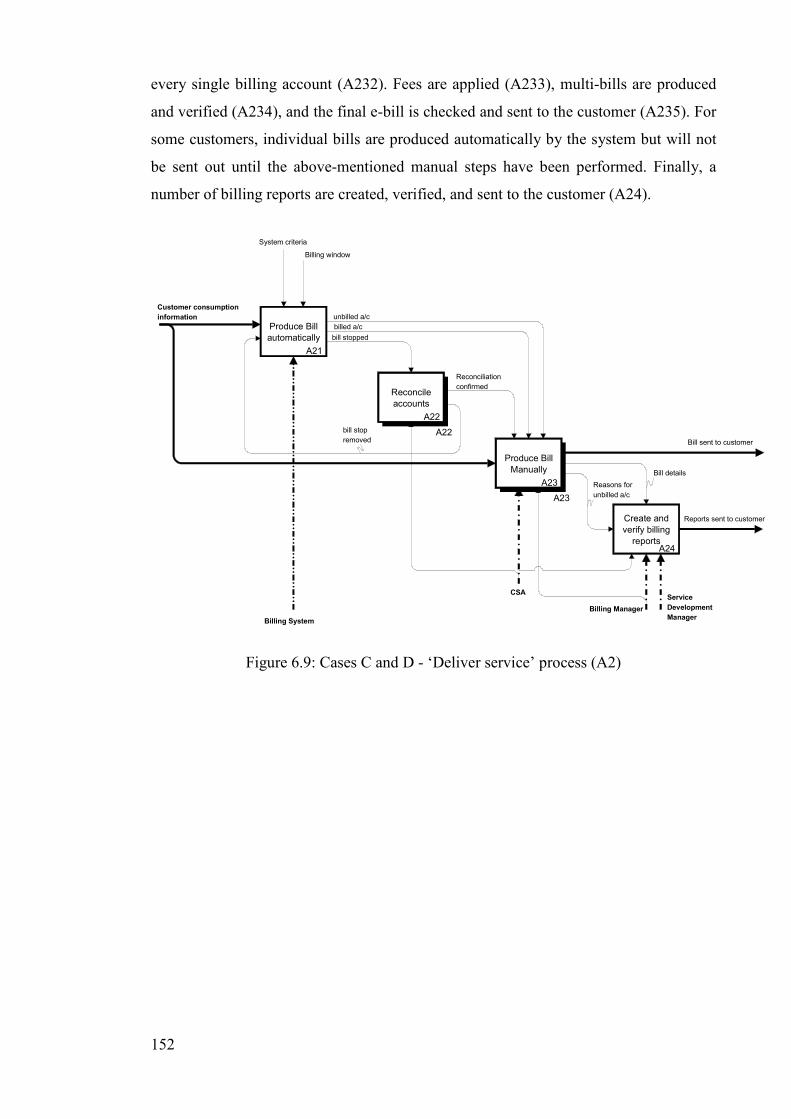
152
every single billing account (A232). Fees are applied (A233), multi-bills are produced
and verified (A234), and the final e-bill is checked and sent to the customer (A235). For
some customers, individual bills are produced automatically by the system but will not
be sent out until the above-mentioned manual steps have been performed. Finally, a
number of billing reports are created, verified, and sent to the customer (A24).
Produce Bill
Manually
A23
A23
Bill sent to customer
Reports sent to customer
Bill details
Create and
verify billing
reportsA24
CSAService
Development
Manager
Reconcile
accounts
A22
A22
Billing System
unbilled a/c
Reasons for
unbilled a/c
Produce Bill
automatically
A21
bill stopped
billed a/c
bill stop
removed
Reconciliation
confirmed
Billing window
System criteria
Billing Manager
Customer consumption
information
Figure 6.9: Cases C and D - ‘Deliver service’ process (A2)
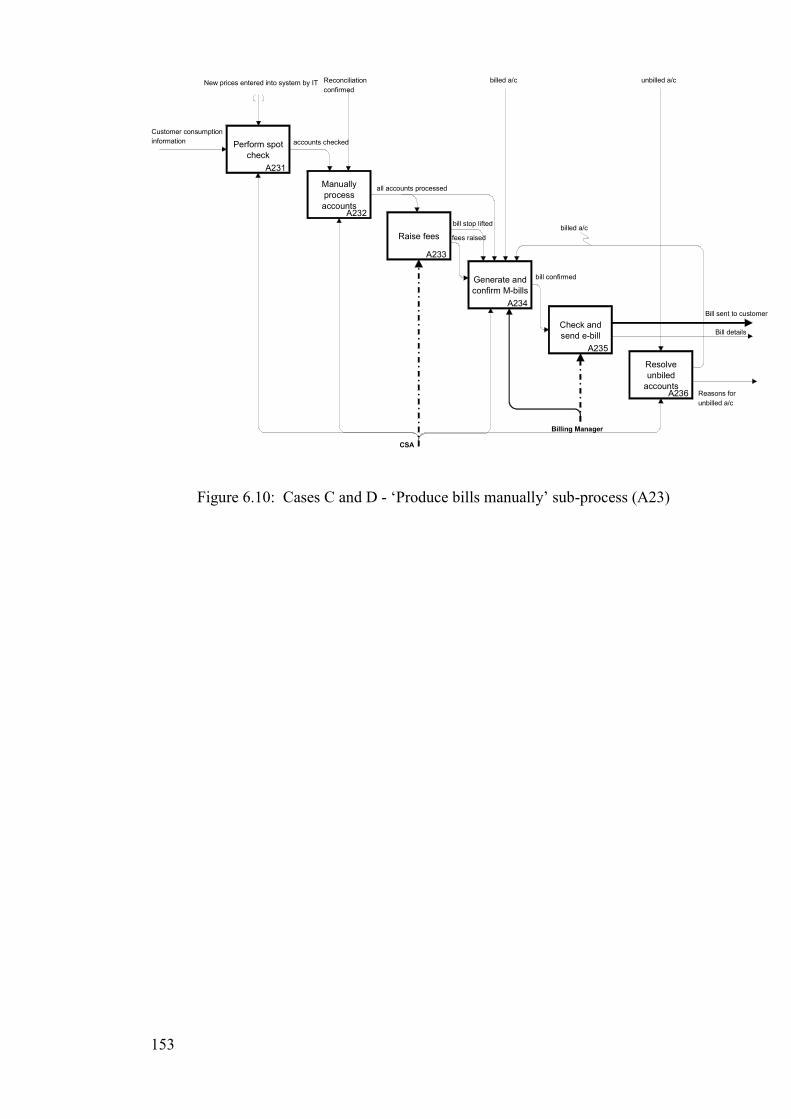
153
Perform spot
check
A231
Manually
process
accountsA232
Check and
send e-bill
A235
Bill sent to customer
Bill details
Raise fees
A233
all accounts processed
fees raised
New prices entered into system by IT
accounts checked
Generate and
confirm M-bills
A234
bill confirmed
Resolve
unbiled
accountsA236
unbilled a/c
bill stop lifted
Reasons for
unbilled a/c
CSA
billed a/c
billed a/cReconciliation
confirmed
Billing Manager
Customer consumption
information
Figure 6.10: Cases C and D - ‘Produce bills manually’ sub-process (A23)
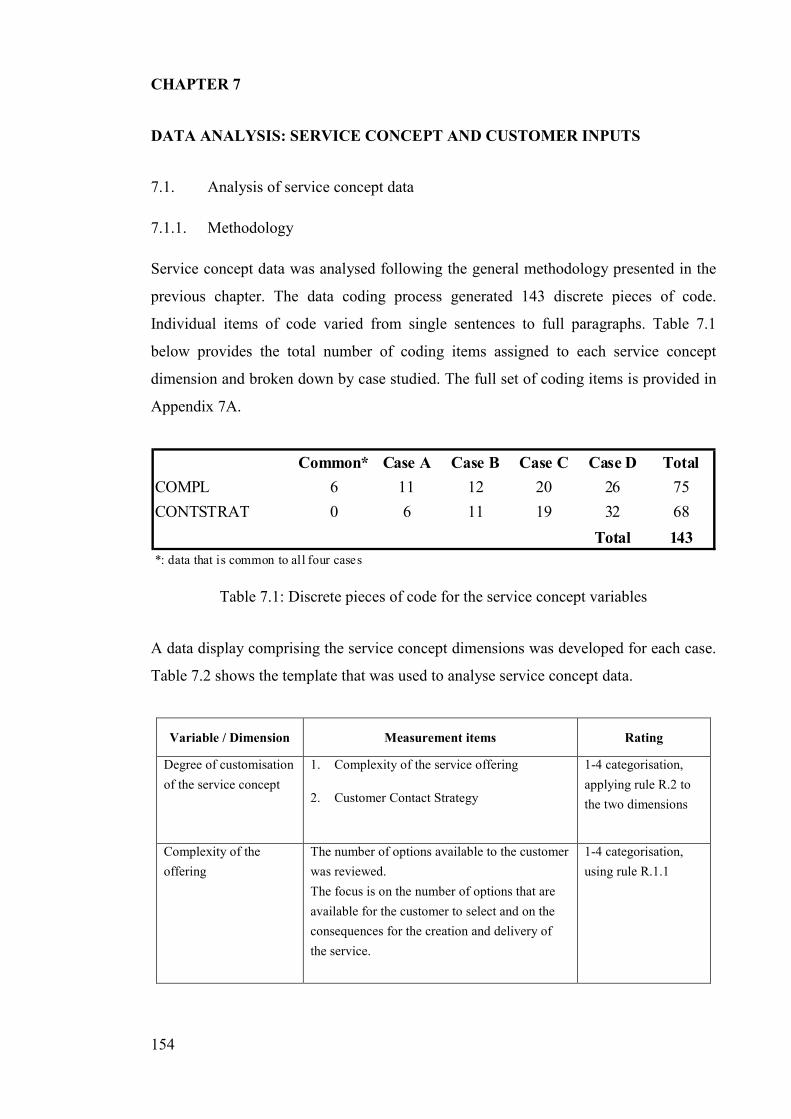
154
CHAPTER 7
DATA ANALYSIS: SERVICE CONCEPT AND CUSTOMER INPUTS
7.1. Analysis of service concept data
7.1.1. Methodology
Service concept data was analysed following the general methodology presented in the
previous chapter. The data coding process generated 143 discrete pieces of code.
Individual items of code varied from single sentences to full paragraphs. Table 7.1
below provides the total number of coding items assigned to each service concept
dimension and broken down by case studied. The full set of coding items is provided in
Appendix 7A.
Common* Case A Case B Case C Case D Total
COMPL 6 11 12 20 26 75
CONTSTRAT 0 6 11 19 32 68
Total 143
*: data that is common to all four cases
Table 7.1: Discrete pieces of code for the service concept variables
A data display comprising the service concept dimensions was developed for each case.
Table 7.2 shows the template that was used to analyse service concept data.
Variable / Dimension Measurement items Rating
Degree of customisation
of the service concept
1. Complexity of the service offering
2. Customer Contact Strategy
1-4 categorisation,
applying rule R.2 to
the two dimensions
Complexity of the
offering
The number of options available to the customer
was reviewed.
The focus is on the number of options that are
available for the customer to select and on the
consequences for the creation and delivery of
the service.
1-4 categorisation,
using rule R.1.1
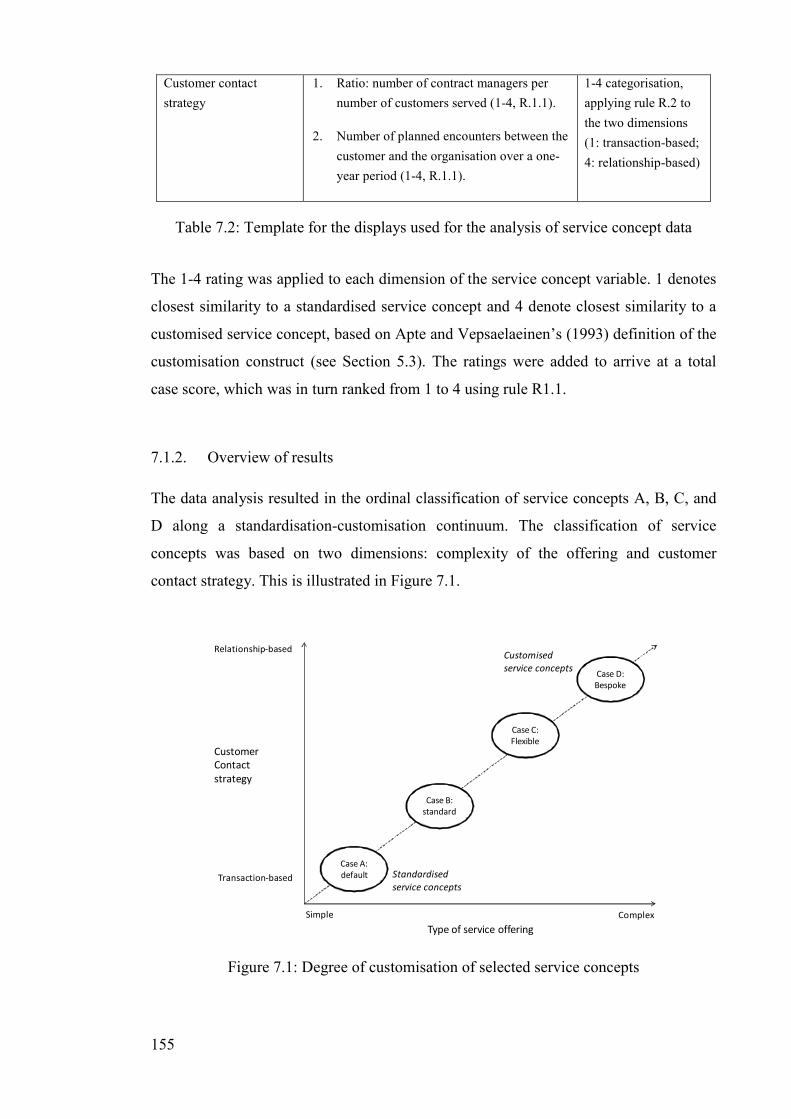
155
Customer contact
strategy
1. Ratio: number of contract managers per
number of customers served (1-4, R.1.1).
2. Number of planned encounters between the
customer and the organisation over a one-
year period (1-4, R.1.1).
1-4 categorisation,
applying rule R.2 to
the two dimensions
(1: transaction-based;
4: relationship-based)
Table 7.2: Template for the displays used for the analysis of service concept data
The 1-4 rating was applied to each dimension of the service concept variable. 1 denotes
closest similarity to a standardised service concept and 4 denote closest similarity to a
customised service concept, based on Apte and Vepsaelaeinen’s (1993) definition of the
customisation construct (see Section 5.3). The ratings were added to arrive at a total
case score, which was in turn ranked from 1 to 4 using rule R1.1.
7.1.2. Overview of results
The data analysis resulted in the ordinal classification of service concepts A, B, C, and
D along a standardisation-customisation continuum. The classification of service
concepts was based on two dimensions: complexity of the offering and customer
contact strategy. This is illustrated in Figure 7.1.
Simple Complex
Customer
Contact
strategy
Relationship-based
Transaction-based
Type of service offering
Case A:
default
Case B:
standard
Case C:
Flexible
Case D:
Bespoke
Customised
service concepts
Standardised
service concepts
Figure 7.1: Degree of customisation of selected service concepts
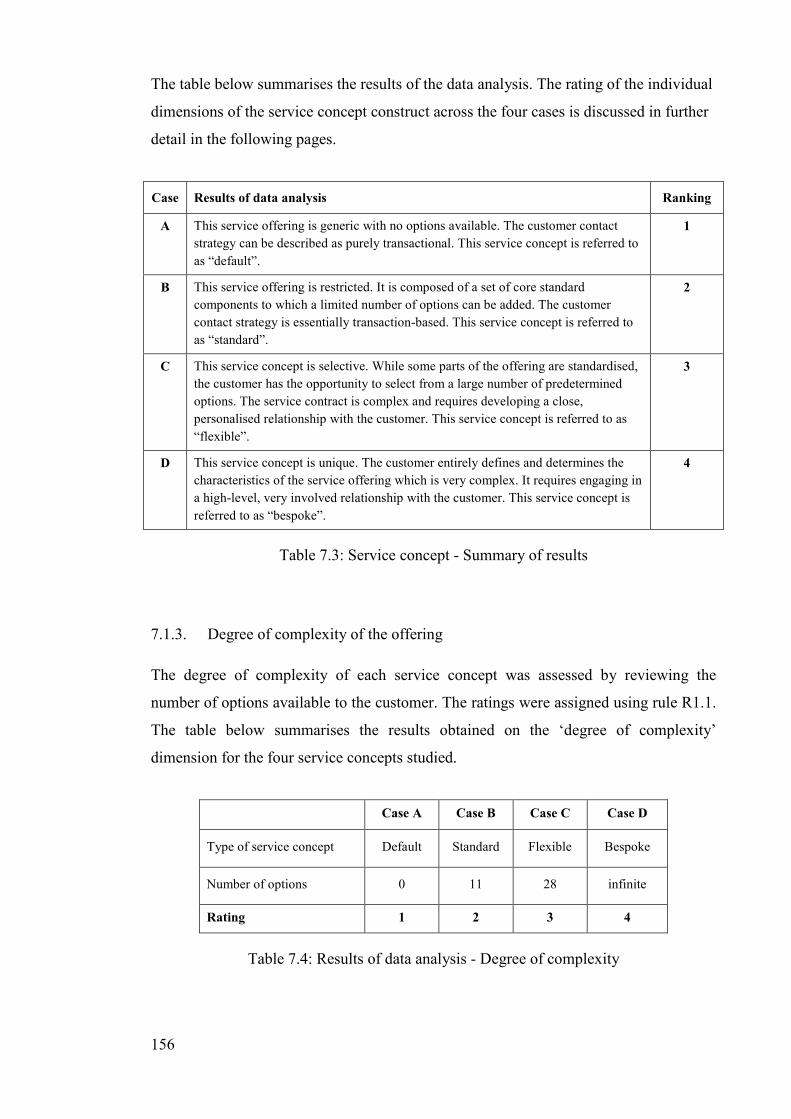
156
The table below summarises the results of the data analysis. The rating of the individual
dimensions of the service concept construct across the four cases is discussed in further
detail in the following pages.
Case Results of data analysis Ranking
A This service offering is generic with no options available. The customer contact
strategy can be described as purely transactional. This service concept is referred to
as “default”.
1
B This service offering is restricted. It is composed of a set of core standard
components to which a limited number of options can be added. The customer
contact strategy is essentially transaction-based. This service concept is referred to
as “standard”.
2
C This service concept is selective. While some parts of the offering are standardised,
the customer has the opportunity to select from a large number of predetermined
options. The service contract is complex and requires developing a close,
personalised relationship with the customer. This service concept is referred to as
“flexible”.
3
D This service concept is unique. The customer entirely defines and determines the
characteristics of the service offering which is very complex. It requires engaging in
a high-level, very involved relationship with the customer. This service concept is
referred to as “bespoke”.
4
Table 7.3: Service concept - Summary of results
7.1.3. Degree of complexity of the offering
The degree of complexity of each service concept was assessed by reviewing the
number of options available to the customer. The ratings were assigned using rule R1.1.
The table below summarises the results obtained on the ‘degree of complexity’
dimension for the four service concepts studied.
Case A Case B Case C Case D
Type of service concept Default Standard Flexible Bespoke
Number of options 0 11 28 infinite
Rating 1 2 3 4
Table 7.4: Results of data analysis - Degree of complexity
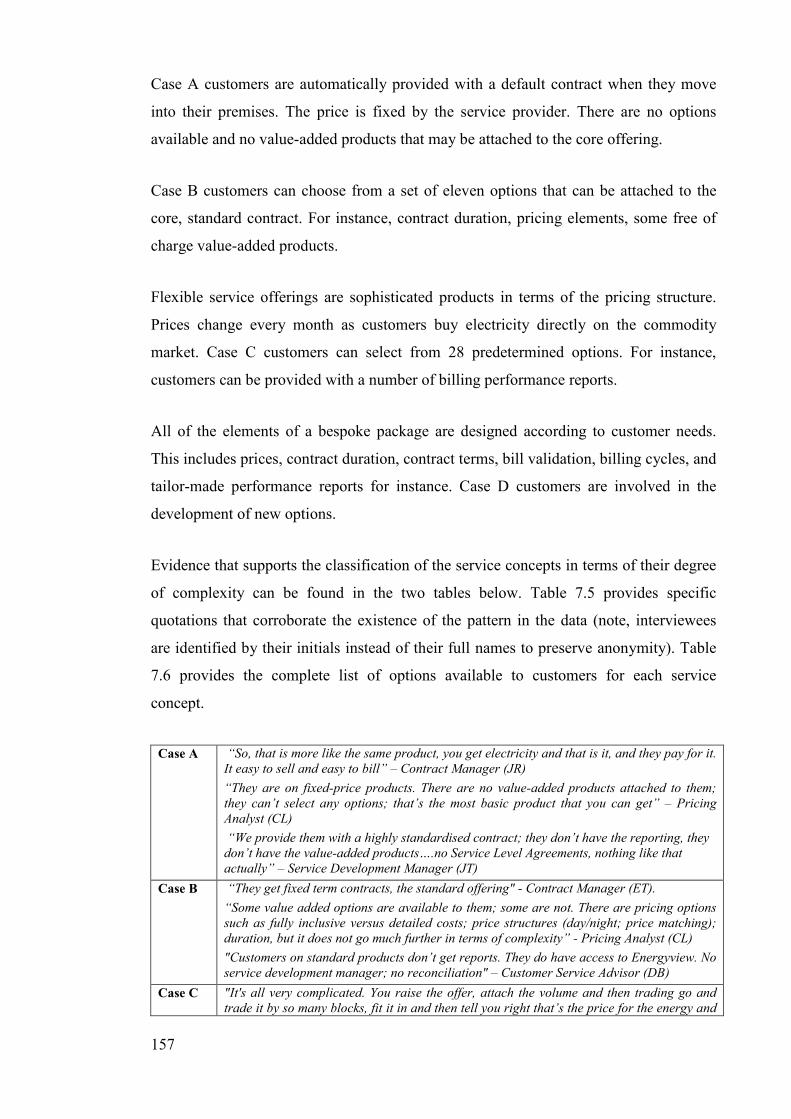
157
Case A customers are automatically provided with a default contract when they move
into their premises. The price is fixed by the service provider. There are no options
available and no value-added products that may be attached to the core offering.
Case B customers can choose from a set of eleven options that can be attached to the
core, standard contract. For instance, contract duration, pricing elements, some free of
charge value-added products.
Flexible service offerings are sophisticated products in terms of the pricing structure.
Prices change every month as customers buy electricity directly on the commodity
market. Case C customers can select from 28 predetermined options. For instance,
customers can be provided with a number of billing performance reports.
All of the elements of a bespoke package are designed according to customer needs.
This includes prices, contract duration, contract terms, bill validation, billing cycles, and
tailor-made performance reports for instance. Case D customers are involved in the
development of new options.
Evidence that supports the classification of the service concepts in terms of their degree
of complexity can be found in the two tables below. Table 7.5 provides specific
quotations that corroborate the existence of the pattern in the data (note, interviewees
are identified by their initials instead of their full names to preserve anonymity). Table
7.6 provides the complete list of options available to customers for each service
concept.
Case A “So, that is more like the same product, you get electricity and that is it, and they pay for it.
It easy to sell and easy to bill” – Contract Manager (JR)
“They are on fixed-price products. There are no value-added products attached to them;
they can’t select any options; that’s the most basic product that you can get” – Pricing
Analyst (CL)
“We provide them with a highly standardised contract; they don’t have the reporting, they
don’t have the value-added products….no Service Level Agreements, nothing like that
actually” – Service Development Manager (JT)
Case B “They get fixed term contracts, the standard offering" - Contract Manager (ET).
“Some value added options are available to them; some are not. There are pricing options
such as fully inclusive versus detailed costs; price structures (day/night; price matching);
duration, but it does not go much further in terms of complexity” - Pricing Analyst (CL)
"Customers on standard products don’t get reports. They do have access to Energyview. No
service development manager; no reconciliation" – Customer Service Advisor (DB)
Case C "It's all very complicated. You raise the offer, attach the volume and then trading go and
trade it by so many blocks, fit it in and then tell you right that’s the price for the energy and
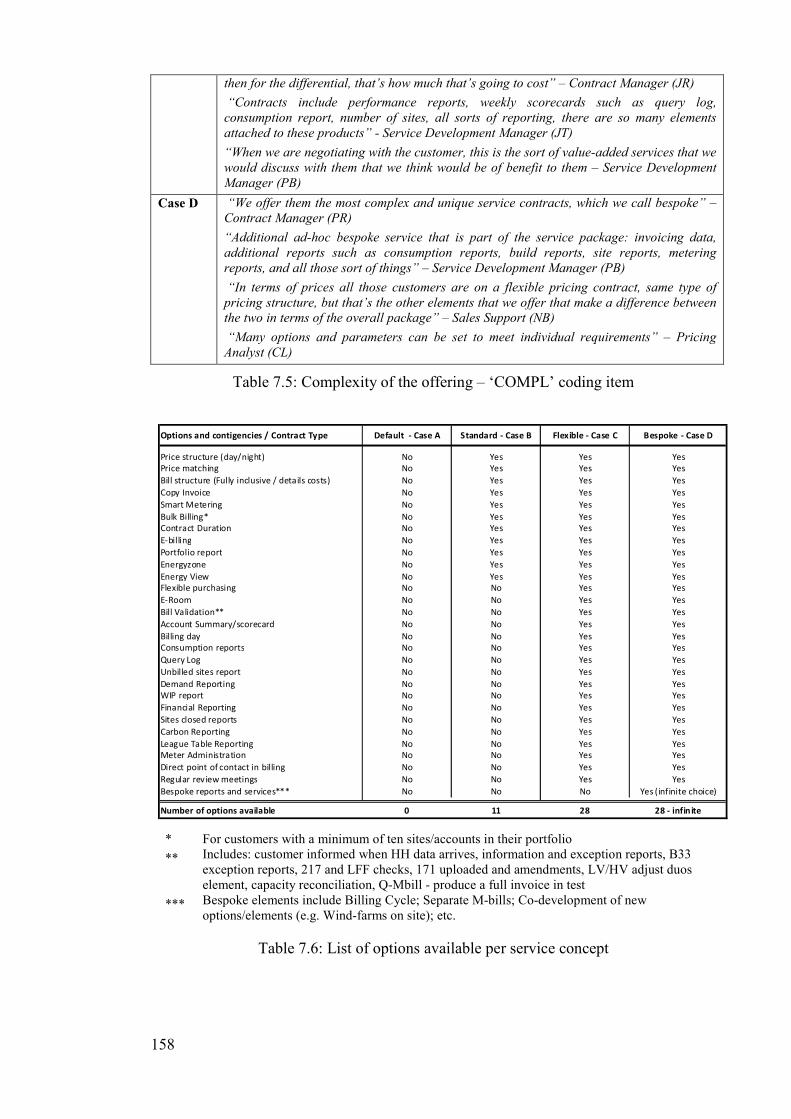
158
then for the differential, that’s how much that’s going to cost” – Contract Manager (JR)
“Contracts include performance reports, weekly scorecards such as query log,
consumption report, number of sites, all sorts of reporting, there are so many elements
attached to these products” - Service Development Manager (JT)
“When we are negotiating with the customer, this is the sort of value-added services that we
would discuss with them that we think would be of benefit to them – Service Development
Manager (PB)
Case D “We offer them the most complex and unique service contracts, which we call bespoke” –
Contract Manager (PR)
“Additional ad-hoc bespoke service that is part of the service package: invoicing data,
additional reports such as consumption reports, build reports, site reports, metering
reports, and all those sort of things” – Service Development Manager (PB)
“In terms of prices all those customers are on a flexible pricing contract, same type of
pricing structure, but that’s the other elements that we offer that make a difference between
the two in terms of the overall package” – Sales Support (NB)
“Many options and parameters can be set to meet individual requirements” – Pricing
Analyst (CL)
Table 7.5: Complexity of the offering – ‘COMPL’ coding item
Options and contigencies / Contract Type Default - Case A Standard - Case B Flexible - Case C Bespoke - Case D
Price structure (day/night) No Yes Yes Yes
Price matching No Yes Yes Yes
Bill structure (Fully inclusive / details costs) No Yes Yes Yes
Copy Invoice No Yes Yes Yes
Smart Metering No Yes Yes Yes
Bulk Billing* No Yes Yes Yes
Contract Duration No Yes Yes Yes
E-billing No Yes Yes Yes
Portfolio report No Yes Yes Yes
Energyzone No Yes Yes Yes
Energy View No Yes Yes Yes
Flexible purchasing No No Yes Yes
E-Room No No Yes Yes
Bill Validation** No No Yes Yes
Account Summary/scorecard No No Yes Yes
Billing day No No Yes Yes
Consumption reports No No Yes Yes
Query Log No No Yes Yes
Unbilled sites report No No Yes Yes
Demand Reporting No No Yes Yes
WIP report No No Yes Yes
Financial Reporting No No Yes Yes
Sites closed reports No No Yes Yes
Carbon Reporting No No Yes Yes
League Table Reporting No No Yes Yes
Meter Administration No No Yes Yes
Direct point of contact in billing No No Yes Yes
Regular rev iew meetings No No Yes Yes
Bespoke reports and services*** No No No Yes (infinite choice)
Number of options available 0 11 28 28 - infin ite
* For customers with a minimum of ten sites/accounts in their portfolio
** Includes: customer informed when HH data arrives, information and exception reports, B33 exception reports, 217 and LFF checks, 171 uploaded and amendments, LV/HV adjust duos element, capacity reconciliation, Q-Mbill - produce a full invoice in test
*** Bespoke elements include Billing Cycle; Separate M-bills; Co-development of new options/elements (e.g. Wind-farms on site); etc.
Table 7.6: List of options available per service concept
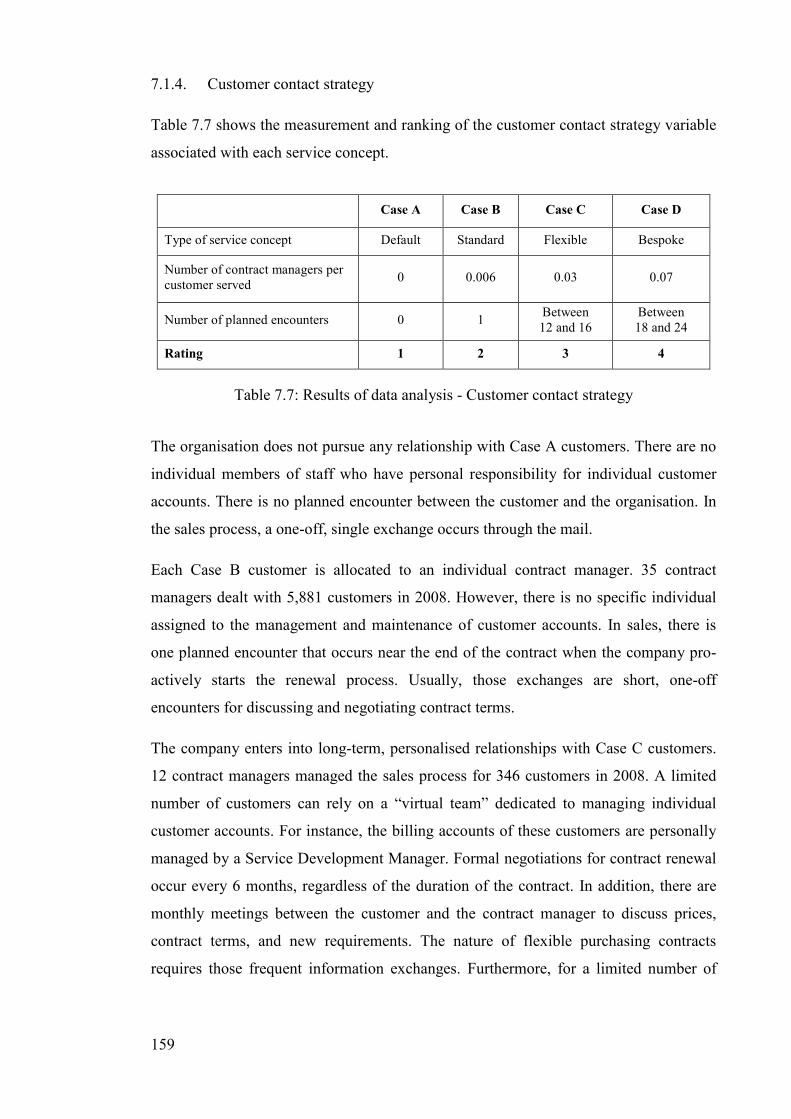
159
7.1.4. Customer contact strategy
Table 7.7 shows the measurement and ranking of the customer contact strategy variable
associated with each service concept.
Case A Case B Case C Case D
Type of service concept Default Standard Flexible Bespoke
Number of contract managers per customer served
0 0.006 0.03 0.07
Number of planned encounters 0 1 Between 12 and 16
Between 18 and 24
Rating 1 2 3 4
Table 7.7: Results of data analysis - Customer contact strategy
The organisation does not pursue any relationship with Case A customers. There are no
individual members of staff who have personal responsibility for individual customer
accounts. There is no planned encounter between the customer and the organisation. In
the sales process, a one-off, single exchange occurs through the mail.
Each Case B customer is allocated to an individual contract manager. 35 contract
managers dealt with 5,881 customers in 2008. However, there is no specific individual
assigned to the management and maintenance of customer accounts. In sales, there is
one planned encounter that occurs near the end of the contract when the company pro-
actively starts the renewal process. Usually, those exchanges are short, one-off
encounters for discussing and negotiating contract terms.
The company enters into long-term, personalised relationships with Case C customers.
12 contract managers managed the sales process for 346 customers in 2008. A limited
number of customers can rely on a “virtual team” dedicated to managing individual
customer accounts. For instance, the billing accounts of these customers are personally
managed by a Service Development Manager. Formal negotiations for contract renewal
occur every 6 months, regardless of the duration of the contract. In addition, there are
monthly meetings between the customer and the contract manager to discuss prices,
contract terms, and new requirements. The nature of flexible purchasing contracts
requires those frequent information exchanges. Furthermore, for a limited number of
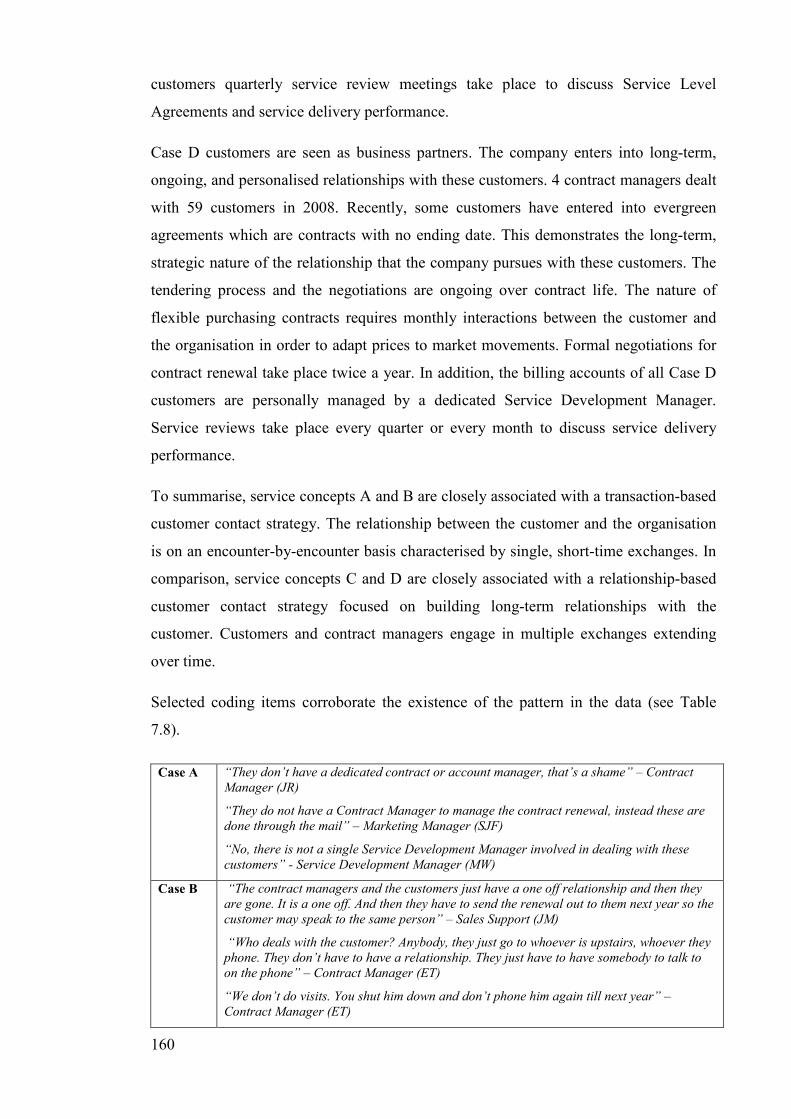
160
customers quarterly service review meetings take place to discuss Service Level
Agreements and service delivery performance.
Case D customers are seen as business partners. The company enters into long-term,
ongoing, and personalised relationships with these customers. 4 contract managers dealt
with 59 customers in 2008. Recently, some customers have entered into evergreen
agreements which are contracts with no ending date. This demonstrates the long-term,
strategic nature of the relationship that the company pursues with these customers. The
tendering process and the negotiations are ongoing over contract life. The nature of
flexible purchasing contracts requires monthly interactions between the customer and
the organisation in order to adapt prices to market movements. Formal negotiations for
contract renewal take place twice a year. In addition, the billing accounts of all Case D
customers are personally managed by a dedicated Service Development Manager.
Service reviews take place every quarter or every month to discuss service delivery
performance.
To summarise, service concepts A and B are closely associated with a transaction-based
customer contact strategy. The relationship between the customer and the organisation
is on an encounter-by-encounter basis characterised by single, short-time exchanges. In
comparison, service concepts C and D are closely associated with a relationship-based
customer contact strategy focused on building long-term relationships with the
customer. Customers and contract managers engage in multiple exchanges extending
over time.
Selected coding items corroborate the existence of the pattern in the data (see Table
7.8).
Case A “They don’t have a dedicated contract or account manager, that’s a shame” – Contract
Manager (JR)
“They do not have a Contract Manager to manage the contract renewal, instead these are
done through the mail” – Marketing Manager (SJF)
“No, there is not a single Service Development Manager involved in dealing with these
customers” - Service Development Manager (MW)
Case B “The contract managers and the customers just have a one off relationship and then they
are gone. It is a one off. And then they have to send the renewal out to them next year so the
customer may speak to the same person” – Sales Support (JM)
“Who deals with the customer? Anybody, they just go to whoever is upstairs, whoever they
phone. They don’t have to have a relationship. They just have to have somebody to talk to
on the phone” – Contract Manager (ET)
“We don’t do visits. You shut him down and don’t phone him again till next year” –
Contract Manager (ET)
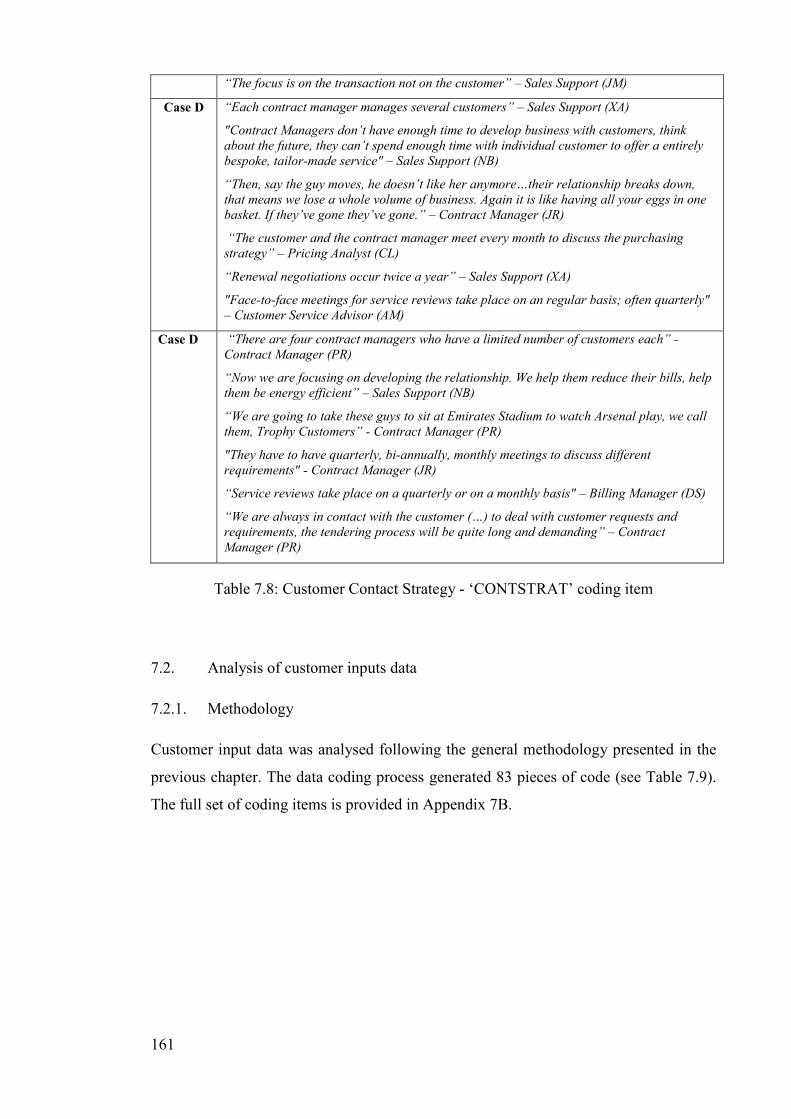
161
“The focus is on the transaction not on the customer” – Sales Support (JM)
Case D “Each contract manager manages several customers” – Sales Support (XA)
"Contract Managers don’t have enough time to develop business with customers, think
about the future, they can’t spend enough time with individual customer to offer a entirely
bespoke, tailor-made service" – Sales Support (NB)
“Then, say the guy moves, he doesn’t like her anymore…their relationship breaks down,
that means we lose a whole volume of business. Again it is like having all your eggs in one
basket. If they’ve gone they’ve gone.” – Contract Manager (JR)
“The customer and the contract manager meet every month to discuss the purchasing
strategy” – Pricing Analyst (CL)
“Renewal negotiations occur twice a year” – Sales Support (XA)
"Face-to-face meetings for service reviews take place on an regular basis; often quarterly"
– Customer Service Advisor (AM)
Case D “There are four contract managers who have a limited number of customers each” -
Contract Manager (PR)
“Now we are focusing on developing the relationship. We help them reduce their bills, help
them be energy efficient” – Sales Support (NB)
“We are going to take these guys to sit at Emirates Stadium to watch Arsenal play, we call
them, Trophy Customers” - Contract Manager (PR)
"They have to have quarterly, bi-annually, monthly meetings to discuss different
requirements" - Contract Manager (JR)
“Service reviews take place on a quarterly or on a monthly basis" – Billing Manager (DS)
“We are always in contact with the customer (…) to deal with customer requests and
requirements, the tendering process will be quite long and demanding” – Contract
Manager (PR)
Table 7.8: Customer Contact Strategy - ‘CONTSTRAT’ coding item
7.2. Analysis of customer inputs data
7.2.1. Methodology
Customer input data was analysed following the general methodology presented in the
previous chapter. The data coding process generated 83 pieces of code (see Table 7.9).
The full set of coding items is provided in Appendix 7B.
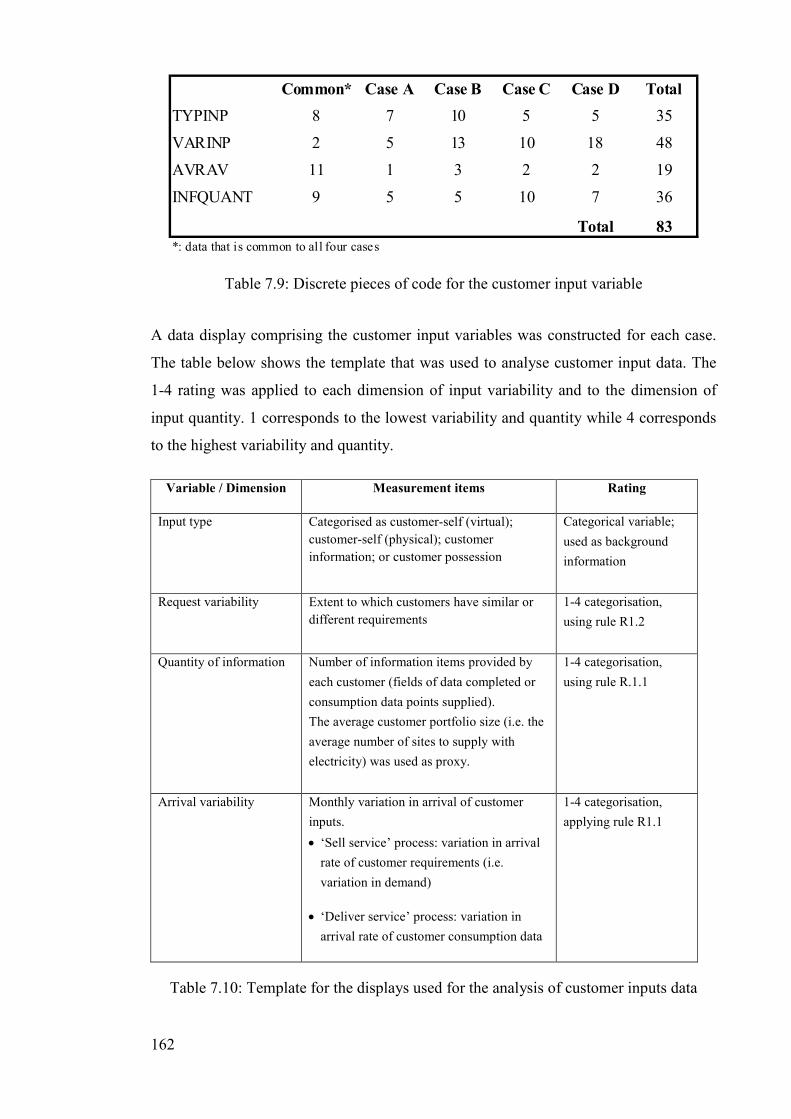
162
Common* Case A Case B Case C Case D Total
TYPINP 8 7 10 5 5 35
VARINP 2 5 13 10 18 48
AVRAV 11 1 3 2 2 19
INFQUANT 9 5 5 10 7 36
Total 83
*: data that is common to all four cases
Table 7.9: Discrete pieces of code for the customer input variable
A data display comprising the customer input variables was constructed for each case.
The table below shows the template that was used to analyse customer input data. The
1-4 rating was applied to each dimension of input variability and to the dimension of
input quantity. 1 corresponds to the lowest variability and quantity while 4 corresponds
to the highest variability and quantity.
Variable / Dimension Measurement items Rating
Input type Categorised as customer-self (virtual);
customer-self (physical); customer
information; or customer possession
Categorical variable;
used as background
information
Request variability Extent to which customers have similar or
different requirements
1-4 categorisation,
using rule R1.2
Quantity of information Number of information items provided by
each customer (fields of data completed or
consumption data points supplied).
The average customer portfolio size (i.e. the
average number of sites to supply with
electricity) was used as proxy.
1-4 categorisation,
using rule R.1.1
Arrival variability Monthly variation in arrival of customer
inputs.
• ‘Sell service’ process: variation in arrival
rate of customer requirements (i.e.
variation in demand)
• ‘Deliver service’ process: variation in
arrival rate of customer consumption data
1-4 categorisation,
applying rule R1.1
Table 7.10: Template for the displays used for the analysis of customer inputs data
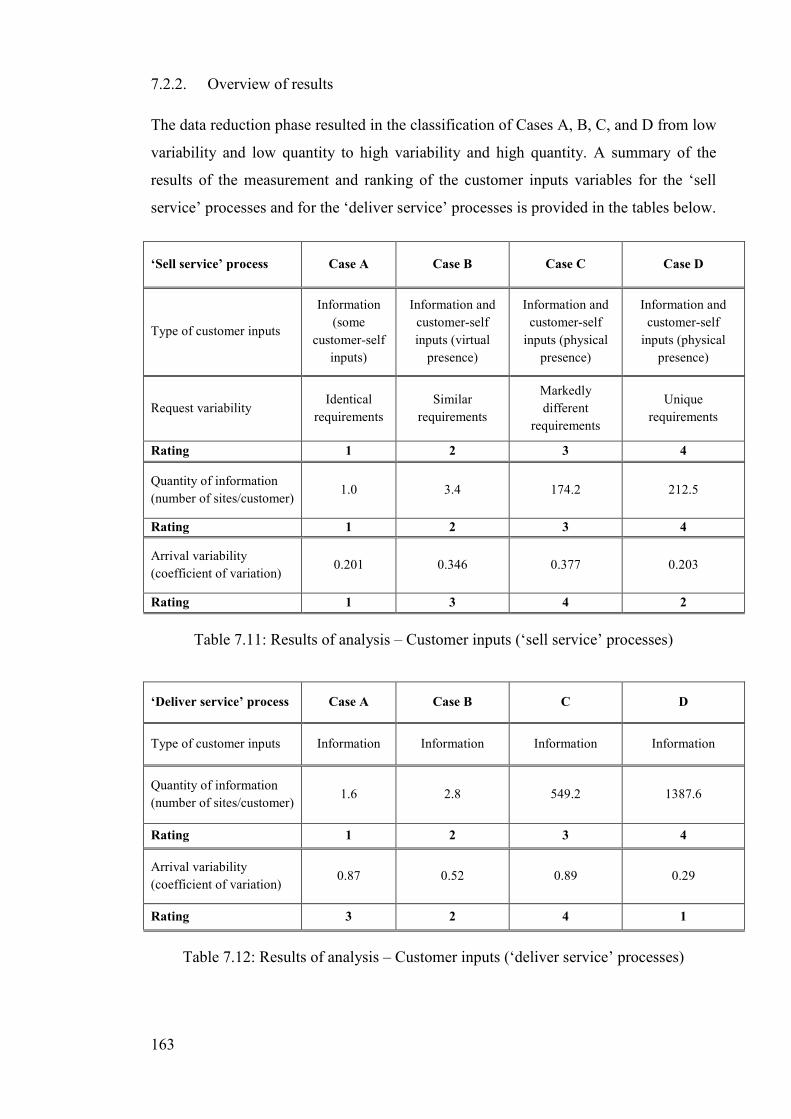
163
7.2.2. Overview of results
The data reduction phase resulted in the classification of Cases A, B, C, and D from low
variability and low quantity to high variability and high quantity. A summary of the
results of the measurement and ranking of the customer inputs variables for the ‘sell
service’ processes and for the ‘deliver service’ processes is provided in the tables below.
‘Sell service’ process Case A Case B Case C Case D
Type of customer inputs
Information
(some
customer-self
inputs)
Information and
customer-self
inputs (virtual
presence)
Information and
customer-self
inputs (physical
presence)
Information and
customer-self
inputs (physical
presence)
Request variability Identical
requirements
Similar
requirements
Markedly
different
requirements
Unique
requirements
Rating 1 2 3 4
Quantity of information
(number of sites/customer) 1.0 3.4 174.2 212.5
Rating 1 2 3 4
Arrival variability
(coefficient of variation) 0.201 0.346 0.377 0.203
Rating 1 3 4 2
Table 7.11: Results of analysis – Customer inputs (‘sell service’ processes)
‘Deliver service’ process Case A Case B C D
Type of customer inputs Information Information Information Information
Quantity of information
(number of sites/customer) 1.6 2.8 549.2 1387.6
Rating 1 2 3 4
Arrival variability
(coefficient of variation) 0.87 0.52 0.89 0.29
Rating 3 2 4 1
Table 7.12: Results of analysis – Customer inputs (‘deliver service’ processes)
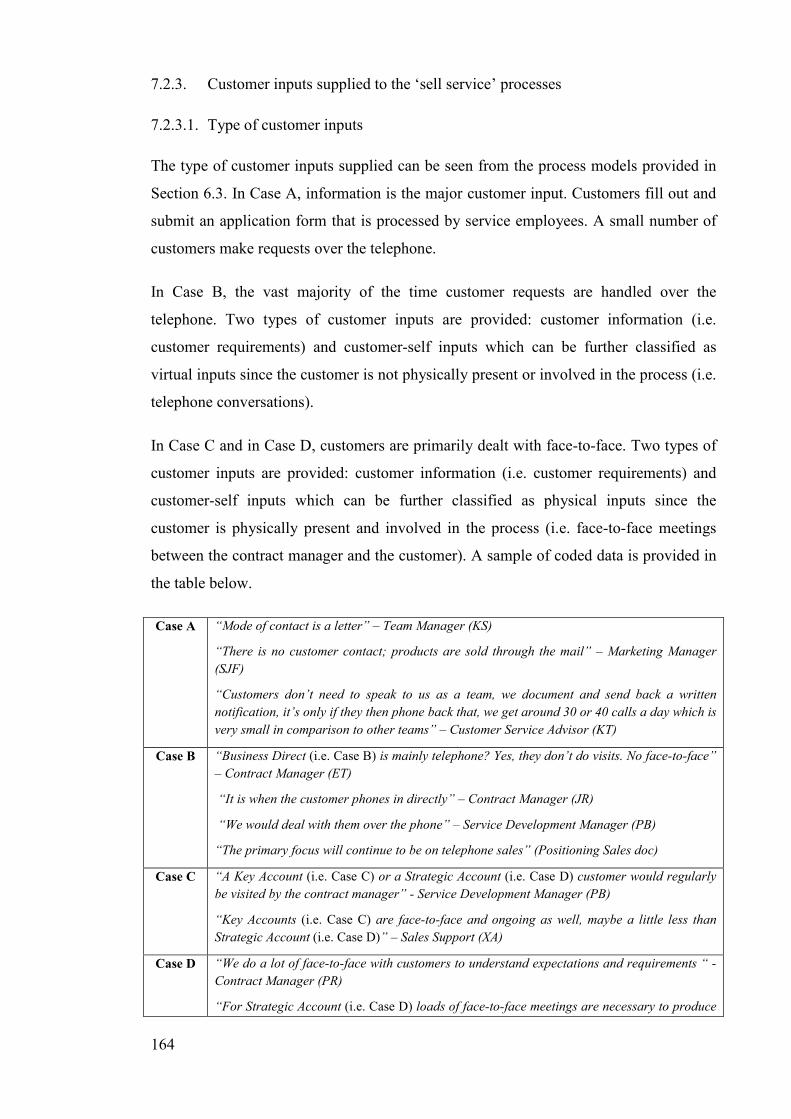
164
7.2.3. Customer inputs supplied to the ‘sell service’ processes
7.2.3.1. Type of customer inputs
The type of customer inputs supplied can be seen from the process models provided in
Section 6.3. In Case A, information is the major customer input. Customers fill out and
submit an application form that is processed by service employees. A small number of
customers make requests over the telephone.
In Case B, the vast majority of the time customer requests are handled over the
telephone. Two types of customer inputs are provided: customer information (i.e.
customer requirements) and customer-self inputs which can be further classified as
virtual inputs since the customer is not physically present or involved in the process (i.e.
telephone conversations).
In Case C and in Case D, customers are primarily dealt with face-to-face. Two types of
customer inputs are provided: customer information (i.e. customer requirements) and
customer-self inputs which can be further classified as physical inputs since the
customer is physically present and involved in the process (i.e. face-to-face meetings
between the contract manager and the customer). A sample of coded data is provided in
the table below.
Case A “Mode of contact is a letter” – Team Manager (KS)
“There is no customer contact; products are sold through the mail” – Marketing Manager
(SJF)
“Customers don’t need to speak to us as a team, we document and send back a written
notification, it’s only if they then phone back that, we get around 30 or 40 calls a day which is
very small in comparison to other teams” – Customer Service Advisor (KT)
Case B “Business Direct (i.e. Case B) is mainly telephone? Yes, they don’t do visits. No face-to-face”
– Contract Manager (ET)
“It is when the customer phones in directly” – Contract Manager (JR)
“We would deal with them over the phone” – Service Development Manager (PB)
“The primary focus will continue to be on telephone sales” (Positioning Sales doc)
Case C “A Key Account (i.e. Case C) or a Strategic Account (i.e. Case D) customer would regularly
be visited by the contract manager” - Service Development Manager (PB)
“Key Accounts (i.e. Case C) are face-to-face and ongoing as well, maybe a little less than
Strategic Account (i.e. Case D)” – Sales Support (XA)
Case D “We do a lot of face-to-face with customers to understand expectations and requirements “ -
Contract Manager (PR)
“For Strategic Account (i.e. Case D) loads of face-to-face meetings are necessary to produce
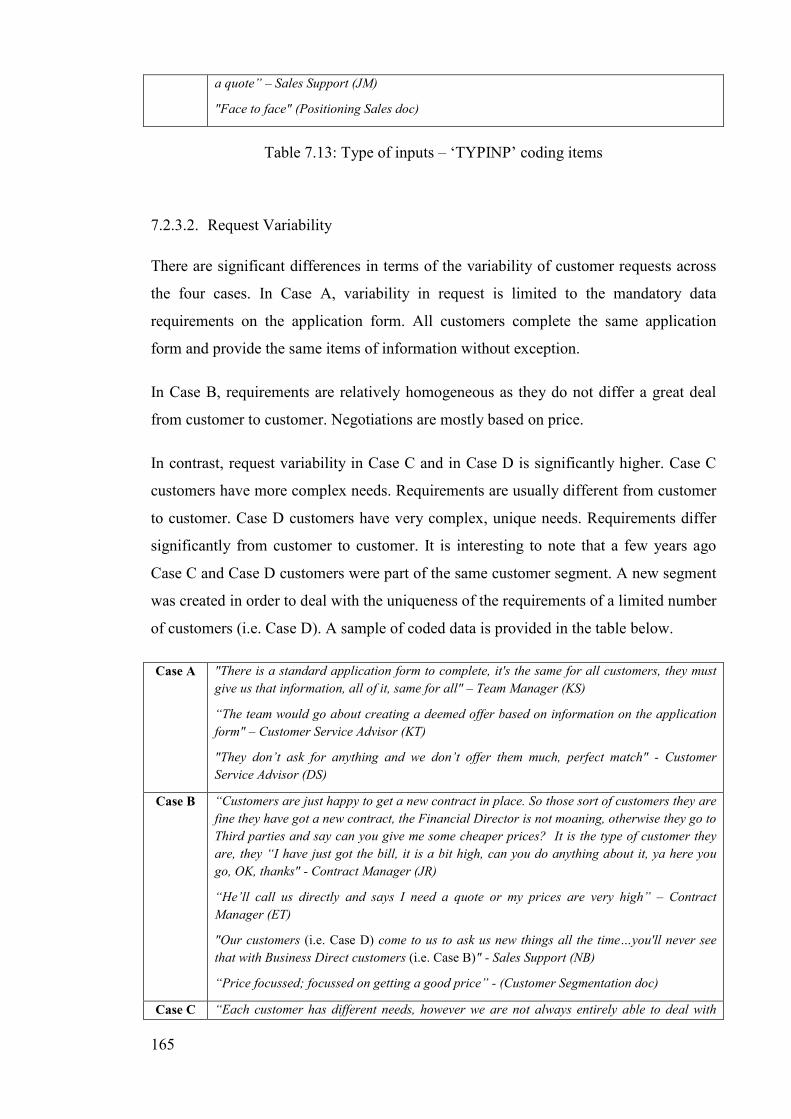
165
a quote” – Sales Support (JM)
"Face to face" (Positioning Sales doc)
Table 7.13: Type of inputs – ‘TYPINP’ coding items
7.2.3.2. Request Variability
There are significant differences in terms of the variability of customer requests across
the four cases. In Case A, variability in request is limited to the mandatory data
requirements on the application form. All customers complete the same application
form and provide the same items of information without exception.
In Case B, requirements are relatively homogeneous as they do not differ a great deal
from customer to customer. Negotiations are mostly based on price.
In contrast, request variability in Case C and in Case D is significantly higher. Case C
customers have more complex needs. Requirements are usually different from customer
to customer. Case D customers have very complex, unique needs. Requirements differ
significantly from customer to customer. It is interesting to note that a few years ago
Case C and Case D customers were part of the same customer segment. A new segment
was created in order to deal with the uniqueness of the requirements of a limited number
of customers (i.e. Case D). A sample of coded data is provided in the table below.
Case A "There is a standard application form to complete, it's the same for all customers, they must
give us that information, all of it, same for all" – Team Manager (KS)
“The team would go about creating a deemed offer based on information on the application
form" – Customer Service Advisor (KT)
"They don’t ask for anything and we don’t offer them much, perfect match" - Customer
Service Advisor (DS)
Case B “Customers are just happy to get a new contract in place. So those sort of customers they are
fine they have got a new contract, the Financial Director is not moaning, otherwise they go to
Third parties and say can you give me some cheaper prices? It is the type of customer they
are, they “I have just got the bill, it is a bit high, can you do anything about it, ya here you
go, OK, thanks" - Contract Manager (JR)
“He’ll call us directly and says I need a quote or my prices are very high” – Contract
Manager (ET)
"Our customers (i.e. Case D) come to us to ask us new things all the time…you'll never see
that with Business Direct customers (i.e. Case B)" - Sales Support (NB)
“Price focussed; focussed on getting a good price” - (Customer Segmentation doc)
Case C “Each customer has different needs, however we are not always entirely able to deal with
166
them, it’s a time issue.” – Sales Support (XA)
“We don’t have a flexible contract as such. Each one is different and has customer-specific
service level agreements” – Contract Manager (JR)
"The key have certain service level agreements that might be negotiated with the customer
that they then have to have regular meetings to discuss different requirements" – Sales
Support (JM)
Case D “Every customer is different, they bring in different expertise, different purchasing strategy,
different needs" – Marketing Analyst (CL)
“Complexity of customer requirements in terms of service products; prices; service levels
such as performance/reporting, bespoke reports weekly and monthly on billing, problem
resolution; account management; market trends and specific reports created on behalf of
customers” – Sales Support (NB)
“The more complex, demanding, high profiles always have different things in their Service
Level Agreements” - Service Development Manager (MW)
“This segment developed out of Key Accounts (i.e. Case C) because of the complex nature of
the requirements and demand of some very large customers” – Contract Manager (PR)
Table 7.14: Request variability – ‘VARINP’ coding items
7.2.3.3. Arrival rate variability
The data suggests that there are differences across the four cases in relation to the
variability in arrival rate of customer inputs. Arrival rate variability was assessed by
observing the variation in the arrival of customer requirements over a 12-month period
(i.e. from January 2008 to December 2008). The monthly variation in the number of
customers processed by sales was used as a proxy to measure arrival rate variability.
The standard deviation was computed but since the datasets have markedly different
means it seemed more appropriate to use the coefficient of variation to look at the
dispersion. The table below presents the results obtained for the variable.
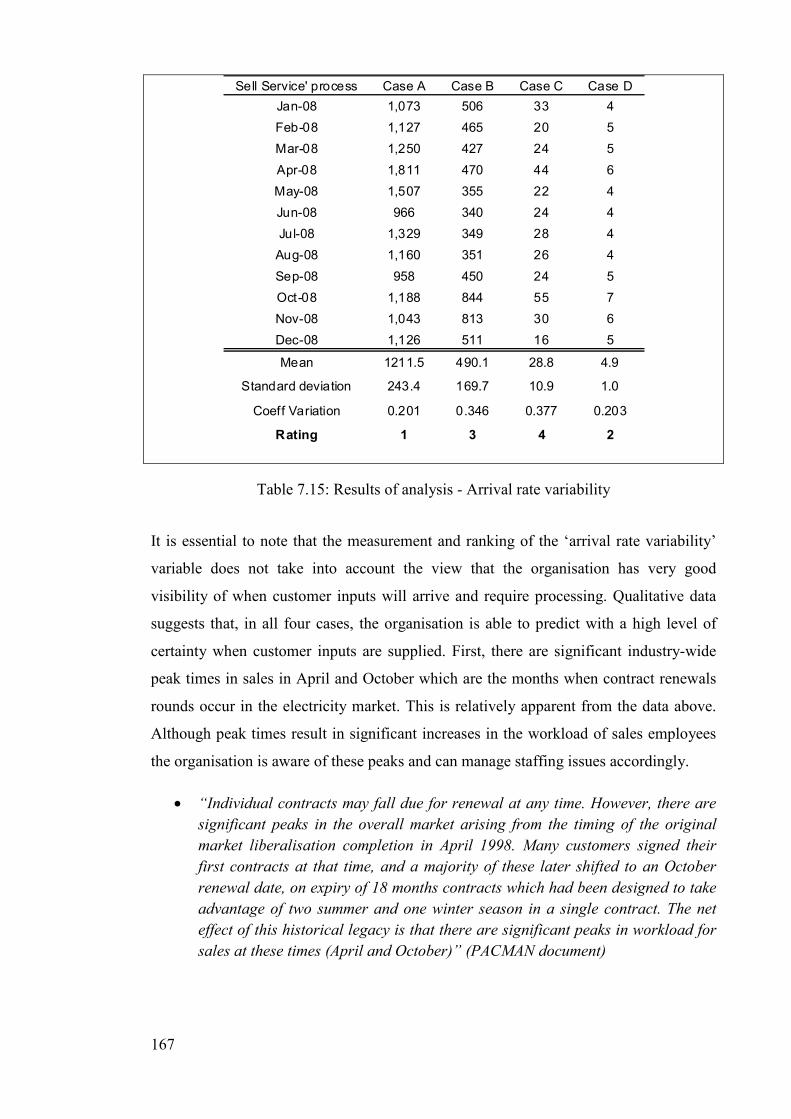
167
Sell Service' process Case A Case B Case C Case D
Jan-08 1,073 506 33 4
Feb-08 1,127 465 20 5
Mar-08 1,250 427 24 5
Apr-08 1,811 470 44 6
May-08 1,507 355 22 4
Jun-08 966 340 24 4
Jul-08 1,329 349 28 4
Aug-08 1,160 351 26 4
Sep-08 958 450 24 5
Oct-08 1,188 844 55 7
Nov-08 1,043 813 30 6
Dec-08 1,126 511 16 5
Mean 1211.5 490.1 28.8 4.9
Standard deviation 243.4 169.7 10.9 1.0
Coeff Variation 0.201 0.346 0.377 0.203
Rating 1 3 4 2
Table 7.15: Results of analysis - Arrival rate variability
It is essential to note that the measurement and ranking of the ‘arrival rate variability’
variable does not take into account the view that the organisation has very good
visibility of when customer inputs will arrive and require processing. Qualitative data
suggests that, in all four cases, the organisation is able to predict with a high level of
certainty when customer inputs are supplied. First, there are significant industry-wide
peak times in sales in April and October which are the months when contract renewals
rounds occur in the electricity market. This is relatively apparent from the data above.
Although peak times result in significant increases in the workload of sales employees
the organisation is aware of these peaks and can manage staffing issues accordingly.
• “Individual contracts may fall due for renewal at any time. However, there are
significant peaks in the overall market arising from the timing of the original
market liberalisation completion in April 1998. Many customers signed their
first contracts at that time, and a majority of these later shifted to an October
renewal date, on expiry of 18 months contracts which had been designed to take
advantage of two summer and one winter season in a single contract. The net
effect of this historical legacy is that there are significant peaks in workload for
sales at these times (April and October)” (PACMAN document)
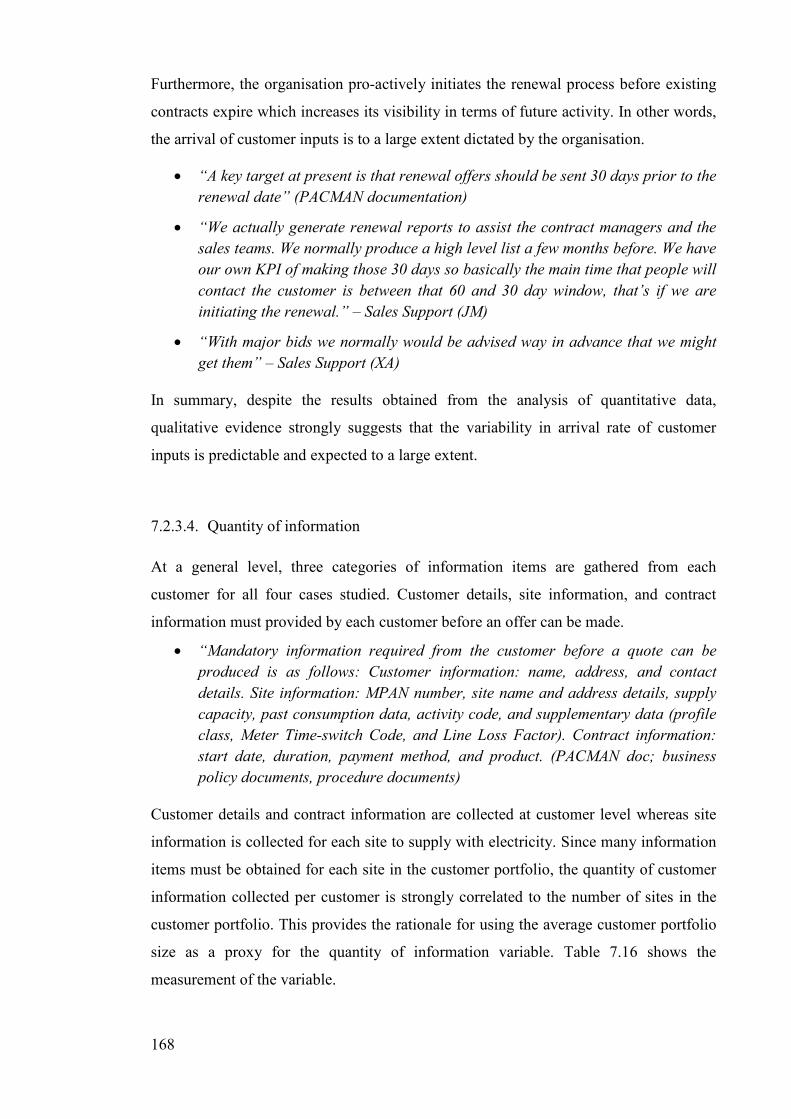
168
Furthermore, the organisation pro-actively initiates the renewal process before existing
contracts expire which increases its visibility in terms of future activity. In other words,
the arrival of customer inputs is to a large extent dictated by the organisation.
• “A key target at present is that renewal offers should be sent 30 days prior to the
renewal date” (PACMAN documentation)
• “We actually generate renewal reports to assist the contract managers and the
sales teams. We normally produce a high level list a few months before. We have
our own KPI of making those 30 days so basically the main time that people will
contact the customer is between that 60 and 30 day window, that’s if we are
initiating the renewal.” – Sales Support (JM)
• “With major bids we normally would be advised way in advance that we might
get them” – Sales Support (XA)
In summary, despite the results obtained from the analysis of quantitative data,
qualitative evidence strongly suggests that the variability in arrival rate of customer
inputs is predictable and expected to a large extent.
7.2.3.4. Quantity of information
At a general level, three categories of information items are gathered from each
customer for all four cases studied. Customer details, site information, and contract
information must provided by each customer before an offer can be made.
• “Mandatory information required from the customer before a quote can be
produced is as follows: Customer information: name, address, and contact
details. Site information: MPAN number, site name and address details, supply
capacity, past consumption data, activity code, and supplementary data (profile
class, Meter Time-switch Code, and Line Loss Factor). Contract information:
start date, duration, payment method, and product. (PACMAN doc; business
policy documents, procedure documents)
Customer details and contract information are collected at customer level whereas site
information is collected for each site to supply with electricity. Since many information
items must be obtained for each site in the customer portfolio, the quantity of customer
information collected per customer is strongly correlated to the number of sites in the
customer portfolio. This provides the rationale for using the average customer portfolio
size as a proxy for the quantity of information variable. Table 7.16 shows the
measurement of the variable.
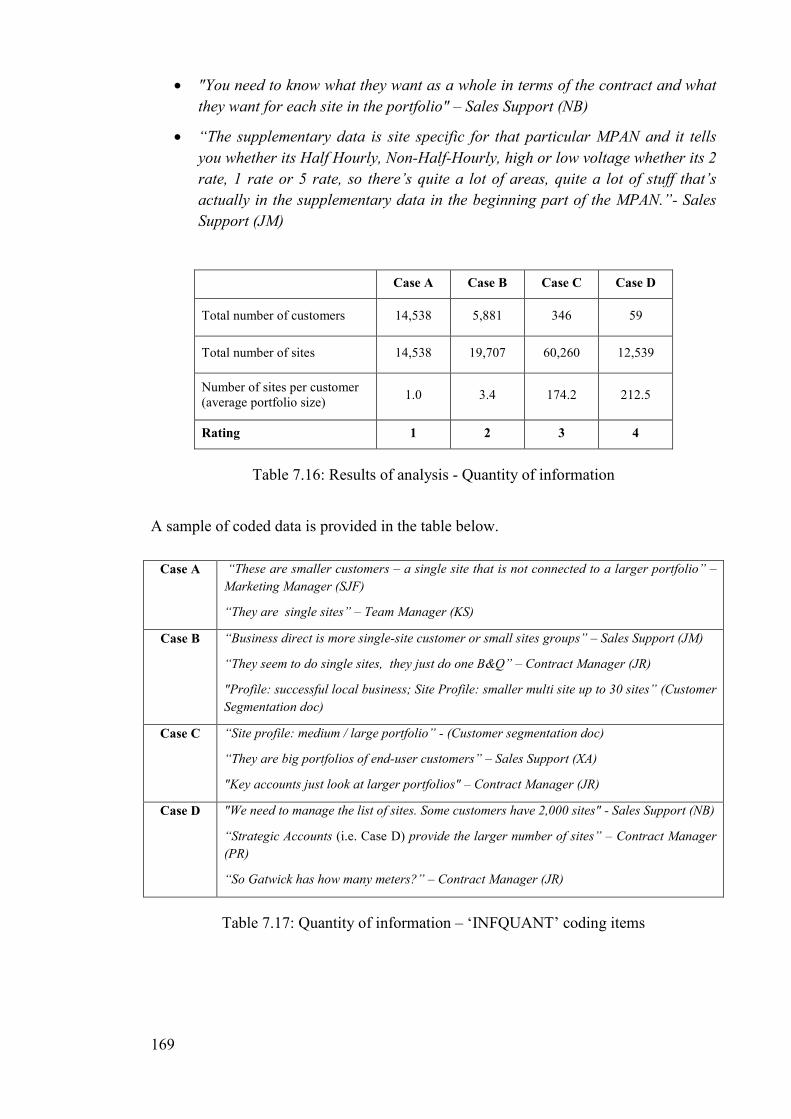
169
• "You need to know what they want as a whole in terms of the contract and what
they want for each site in the portfolio" – Sales Support (NB)
• “The supplementary data is site specific for that particular MPAN and it tells
you whether its Half Hourly, Non-Half-Hourly, high or low voltage whether its 2
rate, 1 rate or 5 rate, so there’s quite a lot of areas, quite a lot of stuff that’s
actually in the supplementary data in the beginning part of the MPAN.”- Sales
Support (JM)
Case A Case B Case C Case D
Total number of customers 14,538 5,881 346 59
Total number of sites 14,538 19,707 60,260 12,539
Number of sites per customer (average portfolio size)
1.0 3.4 174.2 212.5
Rating 1 2 3 4
Table 7.16: Results of analysis - Quantity of information
A sample of coded data is provided in the table below.
Case A “These are smaller customers – a single site that is not connected to a larger portfolio” –
Marketing Manager (SJF)
“They are single sites” – Team Manager (KS)
Case B “Business direct is more single-site customer or small sites groups” – Sales Support (JM)
“They seem to do single sites, they just do one B&Q” – Contract Manager (JR)
"Profile: successful local business; Site Profile: smaller multi site up to 30 sites” (Customer
Segmentation doc)
Case C “Site profile: medium / large portfolio” - (Customer segmentation doc)
“They are big portfolios of end-user customers” – Sales Support (XA)
"Key accounts just look at larger portfolios" – Contract Manager (JR)
Case D "We need to manage the list of sites. Some customers have 2,000 sites" - Sales Support (NB)
“Strategic Accounts (i.e. Case D) provide the larger number of sites” – Contract Manager
(PR)
“So Gatwick has how many meters?” – Contract Manager (JR)
Table 7.17: Quantity of information – ‘INFQUANT’ coding items
170
7.2.4. Customer inputs supplied to the ‘deliver service’ processes
7.2.4.1. Type of customer inputs
The main focus of the ‘deliver service’ process is on the delivery of bills to the
customer. As it can be seen from the process models (Section 6.3.1), customer’s
consumption information is the only customer input supplied for all four cases.
Customer information is the significant input supplied.
• “Consumption gets fed into the billing system, that’s the bit of data that’s
important, how much energy have I used, and the system calculates how much
money you now owe me, that would produce an invoice, and it gets sent out” –
Service Development Manager (MW)
• “The trigger for generating and sending out an invoice can be either the billing
window or the consumption data having been received. As soon as data becomes
available in the system on that day, overnight we try to bill it” - Service
Development Manager (PB)
• “Data comes in, bill is generated. That’s it” – Billing Manager (RW)
7.2.4.2. Request Variability
This variable does not apply to the ‘deliver service’ process. Customer requirements are
supplied to the ‘sell service’ process and transformed into a contract. The ‘deliver
service’ process sets out to fulfil the contract. In other words, the role of the ‘deliver
service’ process is to deliver against customer requirements as specified in the contract.
7.2.4.3. Arrival rate variability
Consumption data is received either on a monthly basis or on a quarterly basis
depending on the profile of the site supplied with electricity. Consumption data for
Half-Hourly (HH) sites and for Non-Half-Hourly monthly (NHHm) sites are provided
every month. Consumption data for Non-Half-Hourly quarterly sites (NHHq) is
provided every quarter. Table 7.18 shows the number of sites broken down by site
profile for each case.
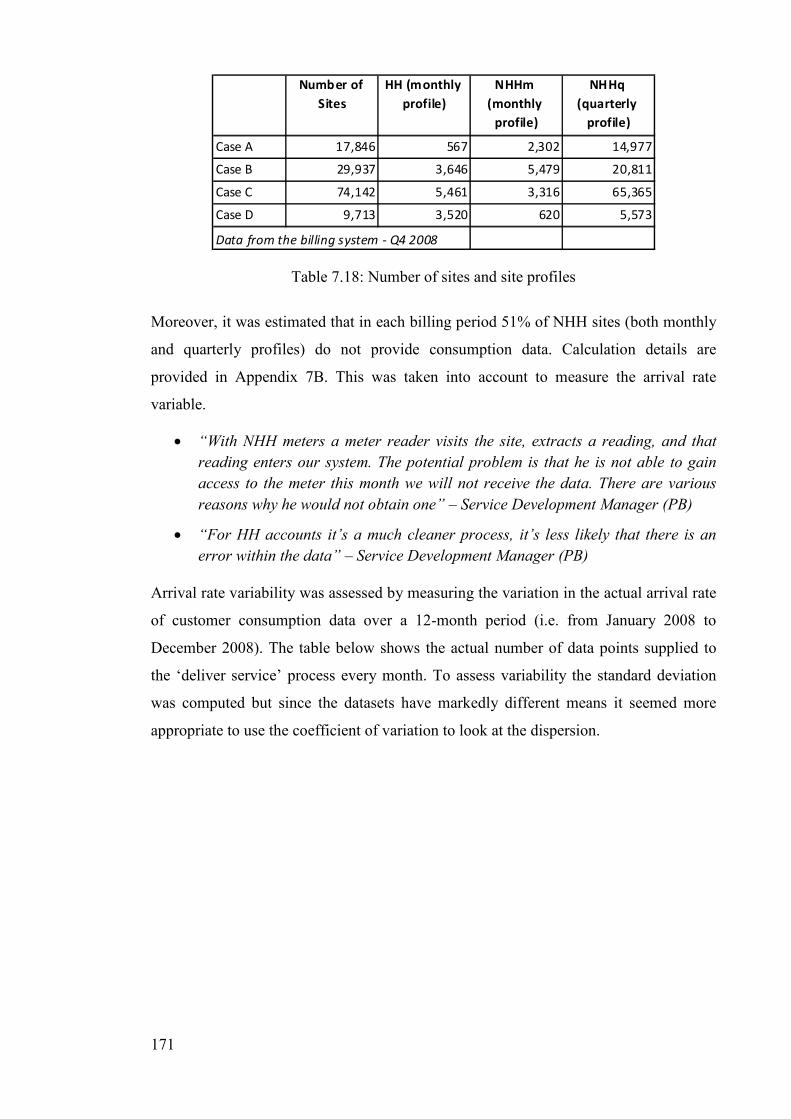
171
Case A 17,846 567 2,302 14,977
Case B 29,937 3,646 5,479 20,811
Case C 74,142 5,461 3,316 65,365
Case D 9,713 3,520 620 5,573
Data from the billing system - Q4 2008
Number of
Sites
NHHq
(quarterly
profile)
HH (monthly
profile)
NHHm
(monthly
profile)
Table 7.18: Number of sites and site profiles
Moreover, it was estimated that in each billing period 51% of NHH sites (both monthly
and quarterly profiles) do not provide consumption data. Calculation details are
provided in Appendix 7B. This was taken into account to measure the arrival rate
variable.
• “With NHH meters a meter reader visits the site, extracts a reading, and that
reading enters our system. The potential problem is that he is not able to gain
access to the meter this month we will not receive the data. There are various
reasons why he would not obtain one” – Service Development Manager (PB)
• “For HH accounts it’s a much cleaner process, it’s less likely that there is an
error within the data” – Service Development Manager (PB)
Arrival rate variability was assessed by measuring the variation in the actual arrival rate
of customer consumption data over a 12-month period (i.e. from January 2008 to
December 2008). The table below shows the actual number of data points supplied to
the ‘deliver service’ process every month. To assess variability the standard deviation
was computed but since the datasets have markedly different means it seemed more
appropriate to use the coefficient of variation to look at the dispersion.
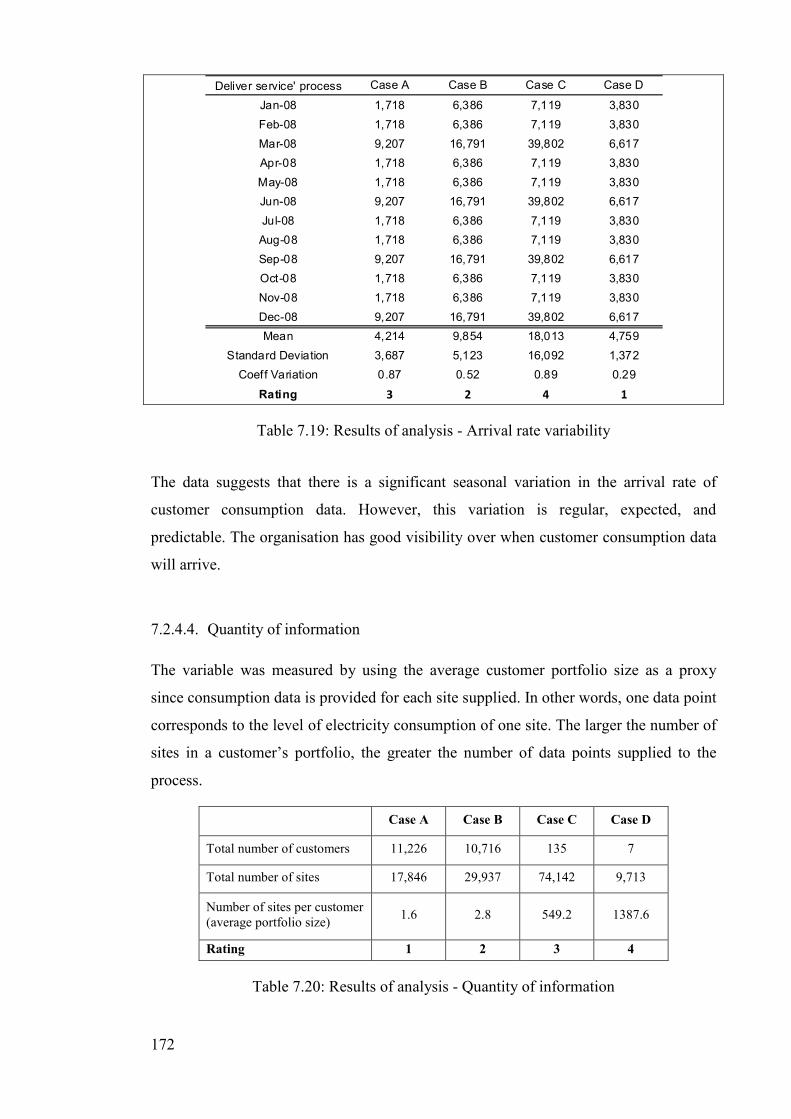
172
Deliver service' process
Jan-08 1,718 6,386 7,119 3,830
Feb-08 1,718 6,386 7,119 3,830
Mar-08 9,207 16,791 39,802 6,617
Apr-08 1,718 6,386 7,119 3,830
May-08 1,718 6,386 7,119 3,830
Jun-08 9,207 16,791 39,802 6,617
Jul-08 1,718 6,386 7,119 3,830
Aug-08 1,718 6,386 7,119 3,830
Sep-08 9,207 16,791 39,802 6,617
Oct-08 1,718 6,386 7,119 3,830
Nov-08 1,718 6,386 7,119 3,830
Dec-08 9,207 16,791 39,802 6,617
Mean 4,214 9,854 18,013 4,759
Standard Deviation 3,687 5,123 16,092 1,372
Coeff Variation 0.87 0.52 0.89 0.29
Rating 3 2 4 1
Case A Case B Case C Case D
Table 7.19: Results of analysis - Arrival rate variability
The data suggests that there is a significant seasonal variation in the arrival rate of
customer consumption data. However, this variation is regular, expected, and
predictable. The organisation has good visibility over when customer consumption data
will arrive.
7.2.4.4. Quantity of information
The variable was measured by using the average customer portfolio size as a proxy
since consumption data is provided for each site supplied. In other words, one data point
corresponds to the level of electricity consumption of one site. The larger the number of
sites in a customer’s portfolio, the greater the number of data points supplied to the
process.
Case A Case B Case C Case D
Total number of customers 11,226 10,716 135 7
Total number of sites 17,846 29,937 74,142 9,713
Number of sites per customer (average portfolio size)
1.6 2.8 549.2 1387.6
Rating 1 2 3 4
Table 7.20: Results of analysis - Quantity of information
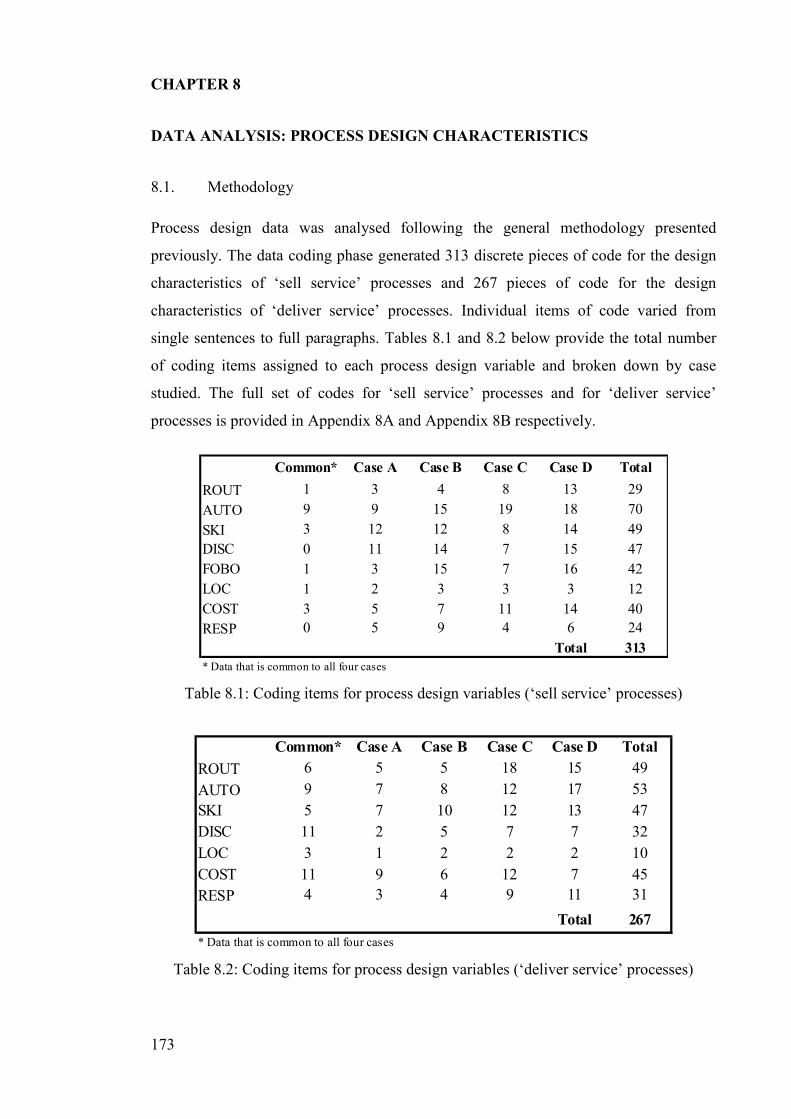
173
CHAPTER 8
DATA ANALYSIS: PROCESS DESIGN CHARACTERISTICS
8.1. Methodology
Process design data was analysed following the general methodology presented
previously. The data coding phase generated 313 discrete pieces of code for the design
characteristics of ‘sell service’ processes and 267 pieces of code for the design
characteristics of ‘deliver service’ processes. Individual items of code varied from
single sentences to full paragraphs. Tables 8.1 and 8.2 below provide the total number
of coding items assigned to each process design variable and broken down by case
studied. The full set of codes for ‘sell service’ processes and for ‘deliver service’
processes is provided in Appendix 8A and Appendix 8B respectively.
Common* Case A Case B Case C Case D Total
ROUT 1 3 4 8 13 29
AUTO 9 9 15 19 18 70
SKI 3 12 12 8 14 49
DISC 0 11 14 7 15 47
FOBO 1 3 15 7 16 42
LOC 1 2 3 3 3 12
COST 3 5 7 11 14 40
RESP 0 5 9 4 6 24
Total 313
* Data that is common to all four cases
Table 8.1: Coding items for process design variables (‘sell service’ processes)
Common* Case A Case B Case C Case D Total
ROUT 6 5 5 18 15 49
AUTO 9 7 8 12 17 53
SKI 5 7 10 12 13 47
DISC 11 2 5 7 7 32
LOC 3 1 2 2 2 10
COST 11 9 6 12 7 45
RESP 4 3 4 9 11 31
Total 267
* Data that is common to all four cases
Table 8.2: Coding items for process design variables (‘deliver service’ processes)
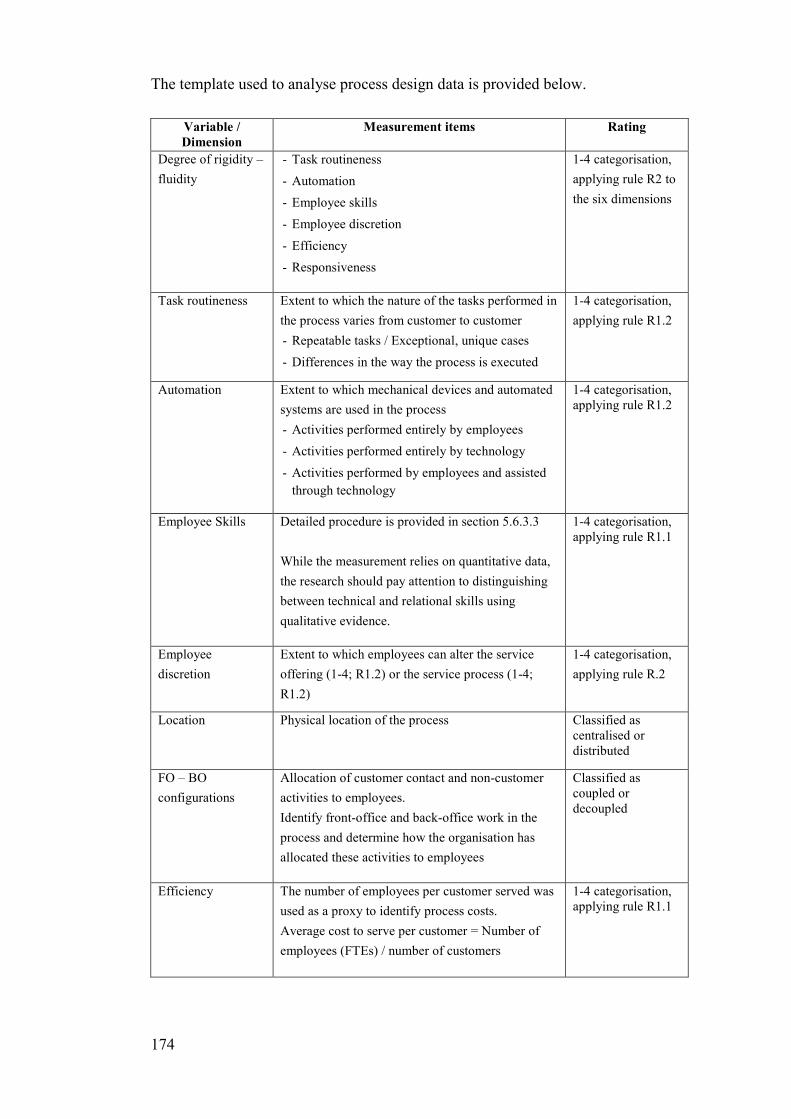
174
The template used to analyse process design data is provided below.
Variable /
Dimension
Measurement items Rating
Degree of rigidity –
fluidity
- Task routineness
- Automation
- Employee skills
- Employee discretion
- Efficiency
- Responsiveness
1-4 categorisation,
applying rule R2 to
the six dimensions
Task routineness Extent to which the nature of the tasks performed in
the process varies from customer to customer
- Repeatable tasks / Exceptional, unique cases
- Differences in the way the process is executed
1-4 categorisation,
applying rule R1.2
Automation Extent to which mechanical devices and automated
systems are used in the process
- Activities performed entirely by employees
- Activities performed entirely by technology
- Activities performed by employees and assisted
through technology
1-4 categorisation, applying rule R1.2
Employee Skills Detailed procedure is provided in section 5.6.3.3
While the measurement relies on quantitative data,
the research should pay attention to distinguishing
between technical and relational skills using
qualitative evidence.
1-4 categorisation, applying rule R1.1
Employee
discretion
Extent to which employees can alter the service
offering (1-4; R1.2) or the service process (1-4;
R1.2)
1-4 categorisation,
applying rule R.2
Location Physical location of the process Classified as centralised or distributed
FO – BO
configurations
Allocation of customer contact and non-customer
activities to employees.
Identify front-office and back-office work in the
process and determine how the organisation has
allocated these activities to employees
Classified as coupled or decoupled
Efficiency The number of employees per customer served was
used as a proxy to identify process costs.
Average cost to serve per customer = Number of
employees (FTEs) / number of customers
1-4 categorisation, applying rule R1.1
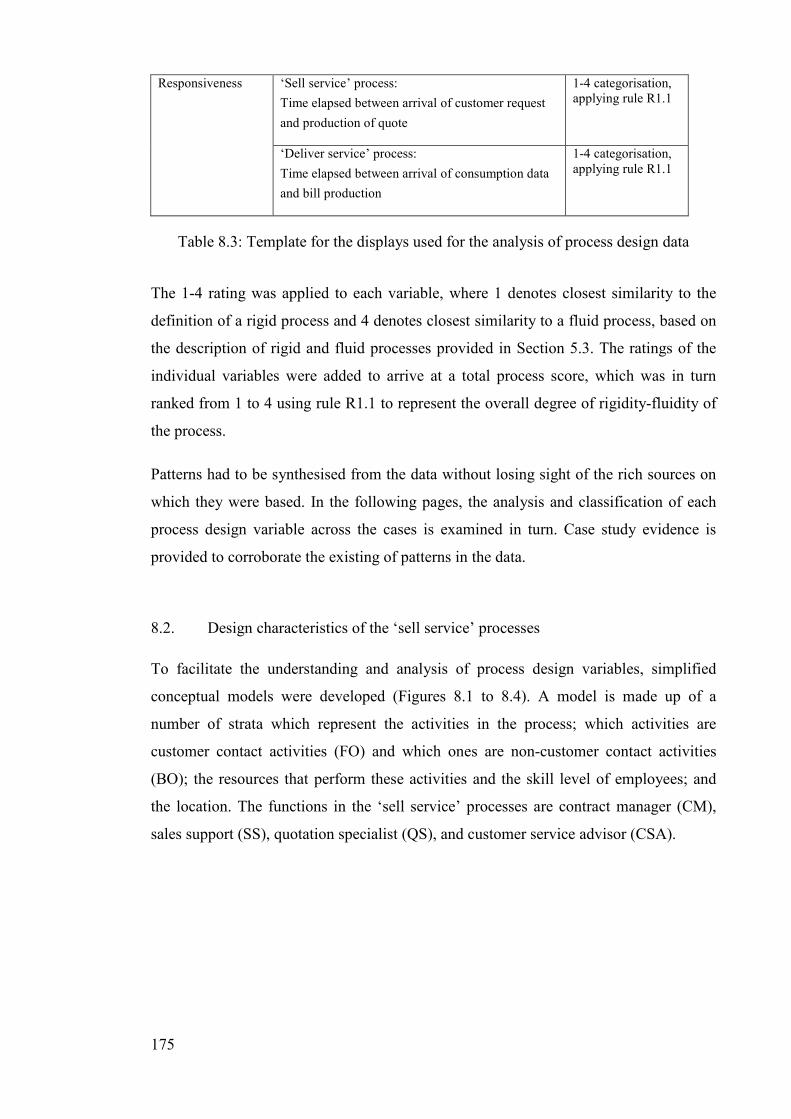
175
Responsiveness ‘Sell service’ process:
Time elapsed between arrival of customer request
and production of quote
1-4 categorisation, applying rule R1.1
‘Deliver service’ process:
Time elapsed between arrival of consumption data
and bill production
1-4 categorisation, applying rule R1.1
Table 8.3: Template for the displays used for the analysis of process design data
The 1-4 rating was applied to each variable, where 1 denotes closest similarity to the
definition of a rigid process and 4 denotes closest similarity to a fluid process, based on
the description of rigid and fluid processes provided in Section 5.3. The ratings of the
individual variables were added to arrive at a total process score, which was in turn
ranked from 1 to 4 using rule R1.1 to represent the overall degree of rigidity-fluidity of
the process.
Patterns had to be synthesised from the data without losing sight of the rich sources on
which they were based. In the following pages, the analysis and classification of each
process design variable across the cases is examined in turn. Case study evidence is
provided to corroborate the existing of patterns in the data.
8.2. Design characteristics of the ‘sell service’ processes
To facilitate the understanding and analysis of process design variables, simplified
conceptual models were developed (Figures 8.1 to 8.4). A model is made up of a
number of strata which represent the activities in the process; which activities are
customer contact activities (FO) and which ones are non-customer contact activities
(BO); the resources that perform these activities and the skill level of employees; and
the location. The functions in the ‘sell service’ processes are contract manager (CM),
sales support (SS), quotation specialist (QS), and customer service advisor (CSA).
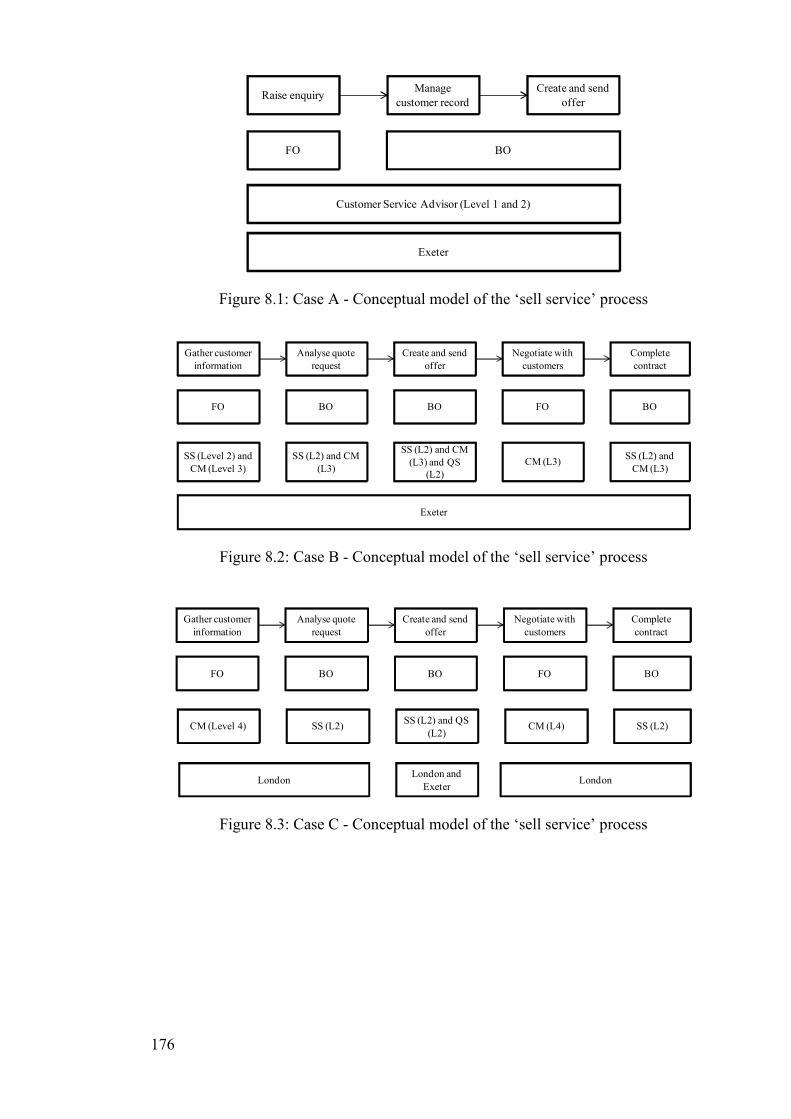
176
Raise enquiryManage
customer record
Create and send
offer
FO BO
Customer Service Advisor (Level 1 and 2)
Exeter
Figure 8.1: Case A - Conceptual model of the ‘sell service’ process
Gather customer
information
Analyse quote
request
Create and send
offer
Negotiate with
customers
Complete
contract
FO BO BO FO BO
SS (Level 2) and
CM (Level 3)
SS (L2) and CM
(L3)
SS (L2) and CM
(L3) and QS
(L2)
CM (L3)SS (L2) and
CM (L3)
Exeter
Figure 8.2: Case B - Conceptual model of the ‘sell service’ process
CM (Level 4) SS (L2)SS (L2) and QS
(L2)CM (L4) SS (L2)
Gather customer
information
Analyse quote
request
Create and send
offer
Negotiate with
customers
Complete
contract
FO BO BO FO BO
London LondonLondon and
Exeter
Figure 8.3: Case C - Conceptual model of the ‘sell service’ process
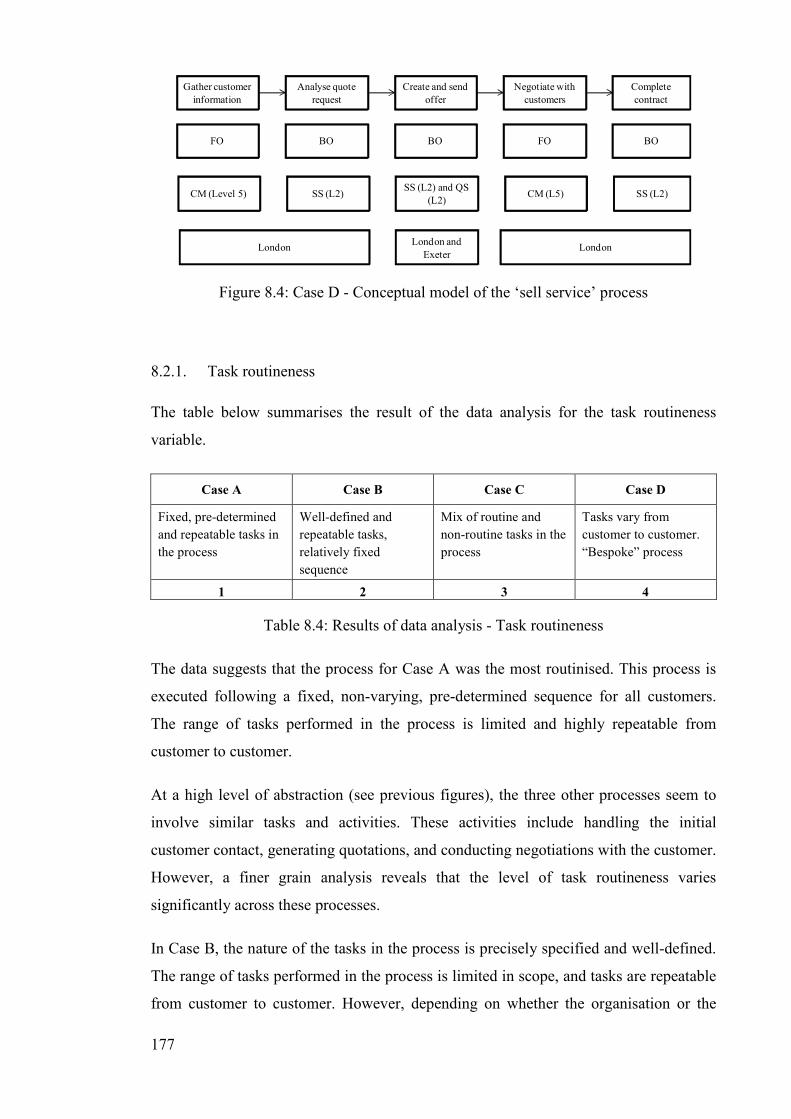
177
CM (Level 5) SS (L2)SS (L2) and QS
(L2)CM (L5) SS (L2)
Gather customer
information
Analyse quote
request
Create and send
offer
Negotiate with
customers
Complete
contract
FO BO BO FO BO
London LondonLondon and
Exeter
Figure 8.4: Case D - Conceptual model of the ‘sell service’ process
8.2.1. Task routineness
The table below summarises the result of the data analysis for the task routineness
variable.
Case A Case B Case C Case D
Fixed, pre-determined
and repeatable tasks in
the process
Well-defined and
repeatable tasks,
relatively fixed
sequence
Mix of routine and
non-routine tasks in the
process
Tasks vary from
customer to customer.
“Bespoke” process
1 2 3 4
Table 8.4: Results of data analysis - Task routineness
The data suggests that the process for Case A was the most routinised. This process is
executed following a fixed, non-varying, pre-determined sequence for all customers.
The range of tasks performed in the process is limited and highly repeatable from
customer to customer.
At a high level of abstraction (see previous figures), the three other processes seem to
involve similar tasks and activities. These activities include handling the initial
customer contact, generating quotations, and conducting negotiations with the customer.
However, a finer grain analysis reveals that the level of task routineness varies
significantly across these processes.
In Case B, the nature of the tasks in the process is precisely specified and well-defined.
The range of tasks performed in the process is limited in scope, and tasks are repeatable
from customer to customer. However, depending on whether the organisation or the
178
customer initiates the sales process, the type of tasks performed as well as the
sequencing of these tasks change. In addition, the ‘negotiate with customers’ activity is
only performed when the customer rejects the initial offer.
There is significantly more diversity in the tasks performed in the processes in Case C
and in Case D as illustrated by the following quote:
• “There are some significant variations on the general pricing process for
flexible and bespoke contracts” (PACMAN doc)
The process for Case C involves a mix of routine and non-routine tasks. For instance,
the manner in which negotiations are conducted is highly customer-specific. Moreover,
the process does not follow a fixed, linear sequence. For instance, offers may be re-
quoted and re-evaluated on a daily basis on behalf of customers to reflect market
changes. The process also involves relational activities that aim to develop and maintain
the relationship with the customer. These activities were not represented in the process
model because they are not well defined and highly customer-specific.
The type of activities performed in the process for Case D changes from customer to
customer. Although the same basic transactional tasks (e.g. collect information, produce
a quote) are performed, each customer is dealt with in a personalised way in the process.
For instance, customer requirements for energy efficiency and specific purchasing
strategies demand, change the nature of the activities performed from customer to
customer. As succinctly expressed by a contract manager:
• “The process is also bespoke. Every customer is different. They bring in
different expertise, different purchasing strategy, different needs so the work will
do will be totally different from customer to customer” – Contract Manager
(PR)
Moreover, employees in Case D are entrusted with a number of complex, non-
transactional tasks such as developing financial models or creating business plans as
part of each tendering process. A sample of coded items is provided in the table below.
Case A “The basic process is the same for all customers without exception” – Team Manager (KS)
“I would say there is little variation in the process. In essence each request has to follow
the same process and system updates. The only variant is if at the outset we do not have the
relevant information at which point it will be necessary to contact the customer and obtain
required details. We do also receive phone calls and this will vary the task dependant on the
type of call.” - Customer Service Advisor (KT)
"The process is the same" – Customer Service Advisor (KT)
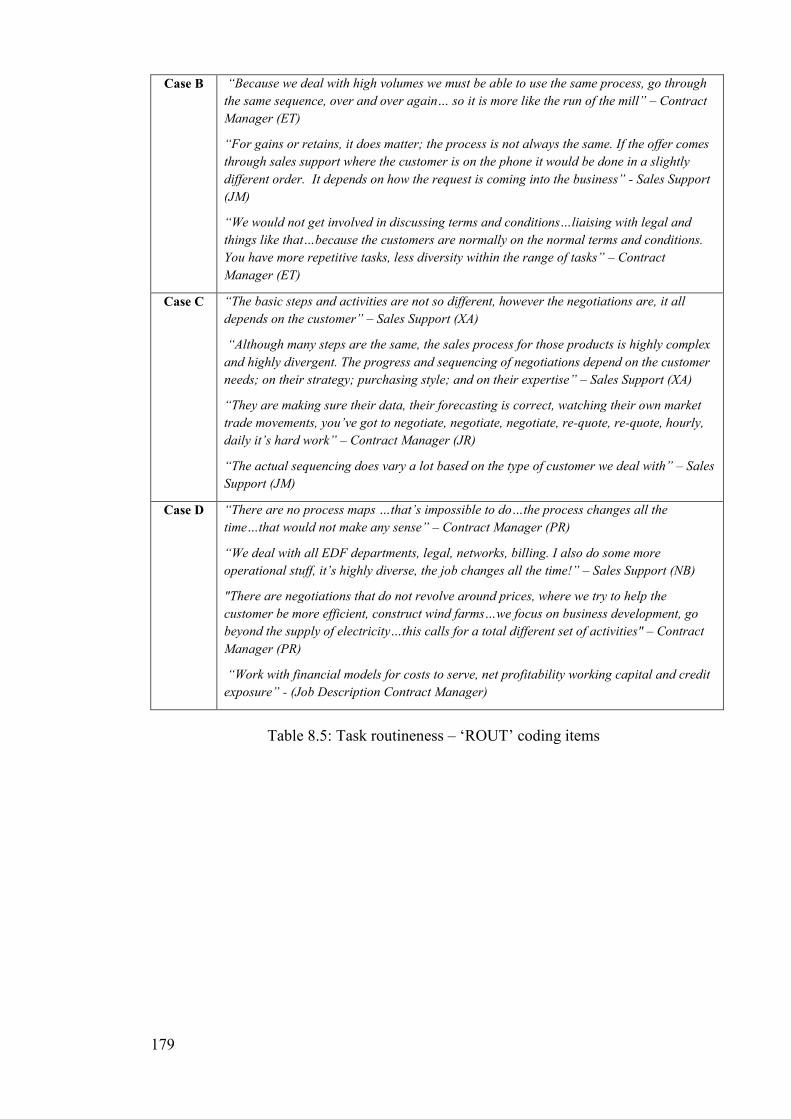
179
Case B “Because we deal with high volumes we must be able to use the same process, go through
the same sequence, over and over again… so it is more like the run of the mill” – Contract
Manager (ET)
“For gains or retains, it does matter; the process is not always the same. If the offer comes
through sales support where the customer is on the phone it would be done in a slightly
different order. It depends on how the request is coming into the business” - Sales Support
(JM)
“We would not get involved in discussing terms and conditions…liaising with legal and
things like that…because the customers are normally on the normal terms and conditions.
You have more repetitive tasks, less diversity within the range of tasks” – Contract
Manager (ET)
Case C “The basic steps and activities are not so different, however the negotiations are, it all
depends on the customer” – Sales Support (XA)
“Although many steps are the same, the sales process for those products is highly complex
and highly divergent. The progress and sequencing of negotiations depend on the customer
needs; on their strategy; purchasing style; and on their expertise” – Sales Support (XA)
“They are making sure their data, their forecasting is correct, watching their own market
trade movements, you’ve got to negotiate, negotiate, negotiate, re-quote, re-quote, hourly,
daily it’s hard work” – Contract Manager (JR)
“The actual sequencing does vary a lot based on the type of customer we deal with” – Sales
Support (JM)
Case D “There are no process maps …that’s impossible to do…the process changes all the
time…that would not make any sense” – Contract Manager (PR)
“We deal with all EDF departments, legal, networks, billing. I also do some more
operational stuff, it’s highly diverse, the job changes all the time!” – Sales Support (NB)
"There are negotiations that do not revolve around prices, where we try to help the
customer be more efficient, construct wind farms…we focus on business development, go
beyond the supply of electricity…this calls for a total different set of activities" – Contract
Manager (PR)
“Work with financial models for costs to serve, net profitability working capital and credit
exposure” - (Job Description Contract Manager)
Table 8.5: Task routineness – ‘ROUT’ coding items
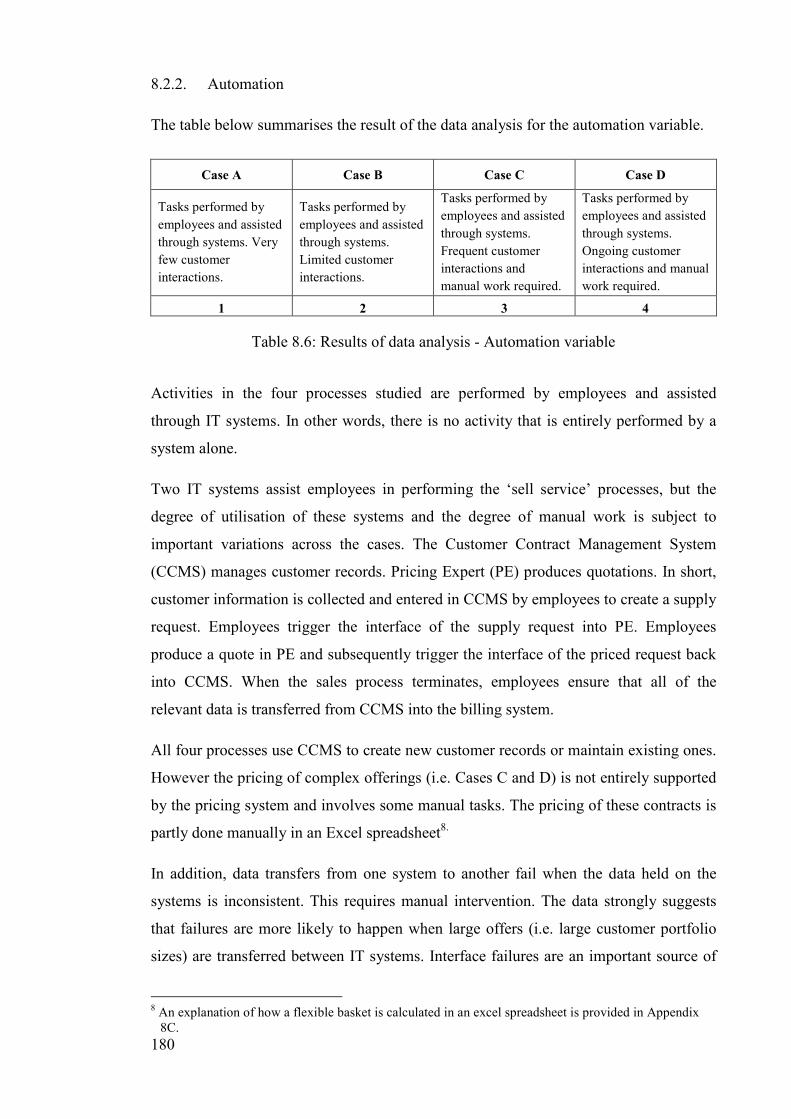
180
8.2.2. Automation
The table below summarises the result of the data analysis for the automation variable.
Case A Case B Case C Case D
Tasks performed by
employees and assisted
through systems. Very
few customer
interactions.
Tasks performed by
employees and assisted
through systems.
Limited customer
interactions.
Tasks performed by
employees and assisted
through systems.
Frequent customer
interactions and
manual work required.
Tasks performed by
employees and assisted
through systems.
Ongoing customer
interactions and manual
work required.
1 2 3 4
Table 8.6: Results of data analysis - Automation variable
Activities in the four processes studied are performed by employees and assisted
through IT systems. In other words, there is no activity that is entirely performed by a
system alone.
Two IT systems assist employees in performing the ‘sell service’ processes, but the
degree of utilisation of these systems and the degree of manual work is subject to
important variations across the cases. The Customer Contract Management System
(CCMS) manages customer records. Pricing Expert (PE) produces quotations. In short,
customer information is collected and entered in CCMS by employees to create a supply
request. Employees trigger the interface of the supply request into PE. Employees
produce a quote in PE and subsequently trigger the interface of the priced request back
into CCMS. When the sales process terminates, employees ensure that all of the
relevant data is transferred from CCMS into the billing system.
All four processes use CCMS to create new customer records or maintain existing ones.
However the pricing of complex offerings (i.e. Cases C and D) is not entirely supported
by the pricing system and involves some manual tasks. The pricing of these contracts is
partly done manually in an Excel spreadsheet8.
In addition, data transfers from one system to another fail when the data held on the
systems is inconsistent. This requires manual intervention. The data strongly suggests
that failures are more likely to happen when large offers (i.e. large customer portfolio
sizes) are transferred between IT systems. Interface failures are an important source of
8 An explanation of how a flexible basket is calculated in an excel spreadsheet is provided in Appendix
8C.
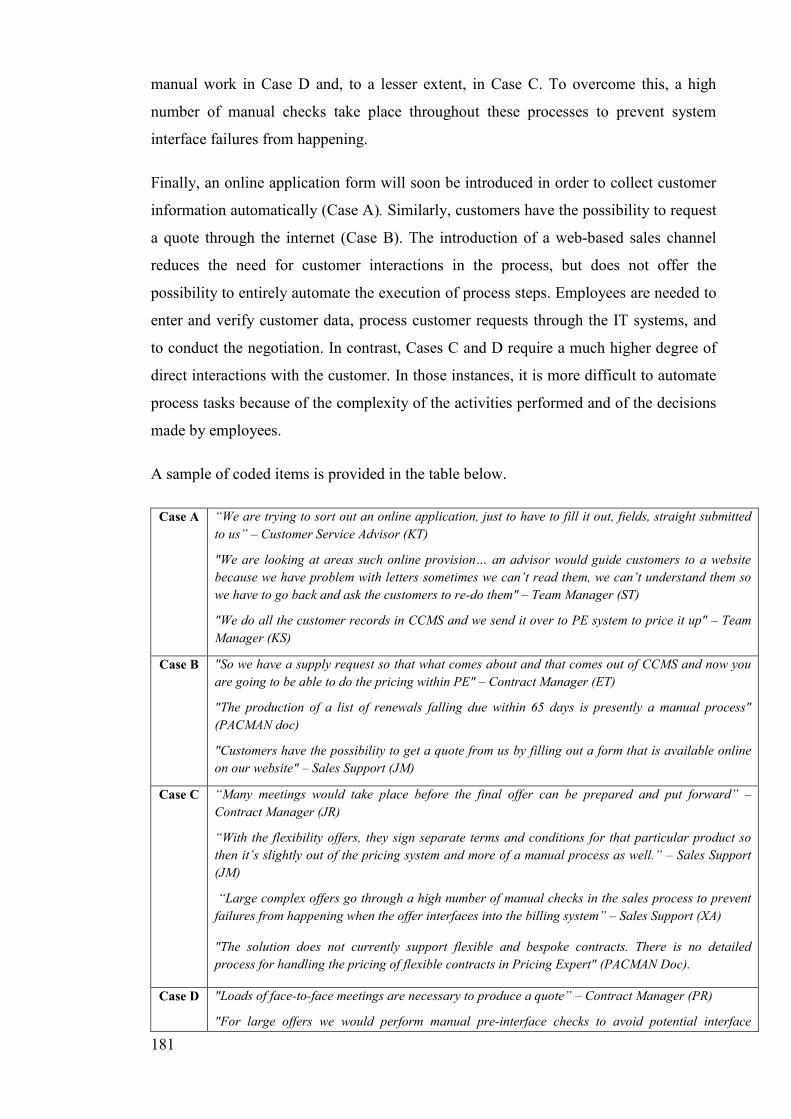
181
manual work in Case D and, to a lesser extent, in Case C. To overcome this, a high
number of manual checks take place throughout these processes to prevent system
interface failures from happening.
Finally, an online application form will soon be introduced in order to collect customer
information automatically (Case A). Similarly, customers have the possibility to request
a quote through the internet (Case B). The introduction of a web-based sales channel
reduces the need for customer interactions in the process, but does not offer the
possibility to entirely automate the execution of process steps. Employees are needed to
enter and verify customer data, process customer requests through the IT systems, and
to conduct the negotiation. In contrast, Cases C and D require a much higher degree of
direct interactions with the customer. In those instances, it is more difficult to automate
process tasks because of the complexity of the activities performed and of the decisions
made by employees.
A sample of coded items is provided in the table below.
Case A “We are trying to sort out an online application, just to have to fill it out, fields, straight submitted
to us” – Customer Service Advisor (KT)
"We are looking at areas such online provision… an advisor would guide customers to a website
because we have problem with letters sometimes we can’t read them, we can’t understand them so
we have to go back and ask the customers to re-do them" – Team Manager (ST)
"We do all the customer records in CCMS and we send it over to PE system to price it up" – Team
Manager (KS)
Case B "So we have a supply request so that what comes about and that comes out of CCMS and now you
are going to be able to do the pricing within PE" – Contract Manager (ET)
"The production of a list of renewals falling due within 65 days is presently a manual process"
(PACMAN doc)
"Customers have the possibility to get a quote from us by filling out a form that is available online
on our website" – Sales Support (JM)
Case C “Many meetings would take place before the final offer can be prepared and put forward” –
Contract Manager (JR)
“With the flexibility offers, they sign separate terms and conditions for that particular product so
then it’s slightly out of the pricing system and more of a manual process as well.” – Sales Support
(JM)
“Large complex offers go through a high number of manual checks in the sales process to prevent
failures from happening when the offer interfaces into the billing system” – Sales Support (XA)
"The solution does not currently support flexible and bespoke contracts. There is no detailed
process for handling the pricing of flexible contracts in Pricing Expert" (PACMAN Doc).
Case D "Loads of face-to-face meetings are necessary to produce a quote” – Contract Manager (PR)
"For large offers we would perform manual pre-interface checks to avoid potential interface
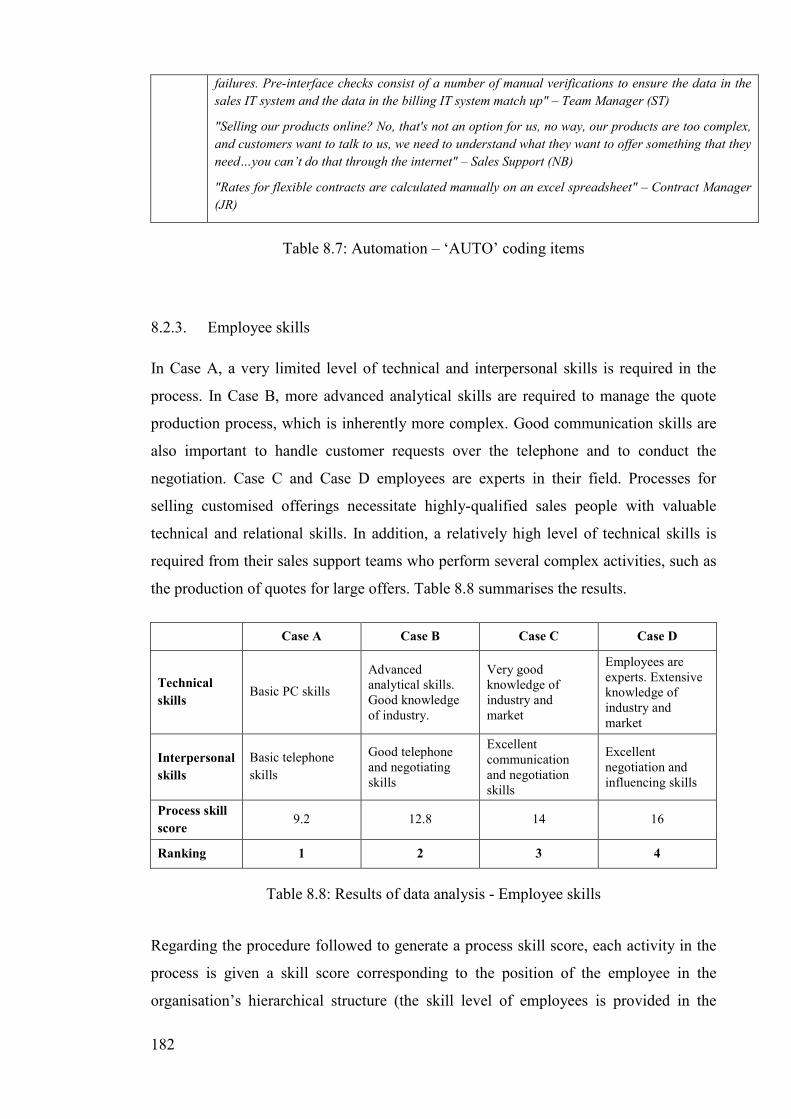
182
failures. Pre-interface checks consist of a number of manual verifications to ensure the data in the
sales IT system and the data in the billing IT system match up" – Team Manager (ST)
"Selling our products online? No, that's not an option for us, no way, our products are too complex,
and customers want to talk to us, we need to understand what they want to offer something that they
need…you can’t do that through the internet" – Sales Support (NB)
"Rates for flexible contracts are calculated manually on an excel spreadsheet" – Contract Manager
(JR)
Table 8.7: Automation – ‘AUTO’ coding items
8.2.3. Employee skills
In Case A, a very limited level of technical and interpersonal skills is required in the
process. In Case B, more advanced analytical skills are required to manage the quote
production process, which is inherently more complex. Good communication skills are
also important to handle customer requests over the telephone and to conduct the
negotiation. Case C and Case D employees are experts in their field. Processes for
selling customised offerings necessitate highly-qualified sales people with valuable
technical and relational skills. In addition, a relatively high level of technical skills is
required from their sales support teams who perform several complex activities, such as
the production of quotes for large offers. Table 8.8 summarises the results.
Case A Case B Case C Case D
Technical
skills Basic PC skills
Advanced analytical skills. Good knowledge of industry.
Very good knowledge of industry and market
Employees are experts. Extensive knowledge of industry and market
Interpersonal
skills
Basic telephone
skills
Good telephone and negotiating skills
Excellent communication and negotiation skills
Excellent negotiation and influencing skills
Process skill
score 9.2 12.8 14 16
Ranking 1 2 3 4
Table 8.8: Results of data analysis - Employee skills
Regarding the procedure followed to generate a process skill score, each activity in the
process is given a skill score corresponding to the position of the employee in the
organisation’s hierarchical structure (the skill level of employees is provided in the
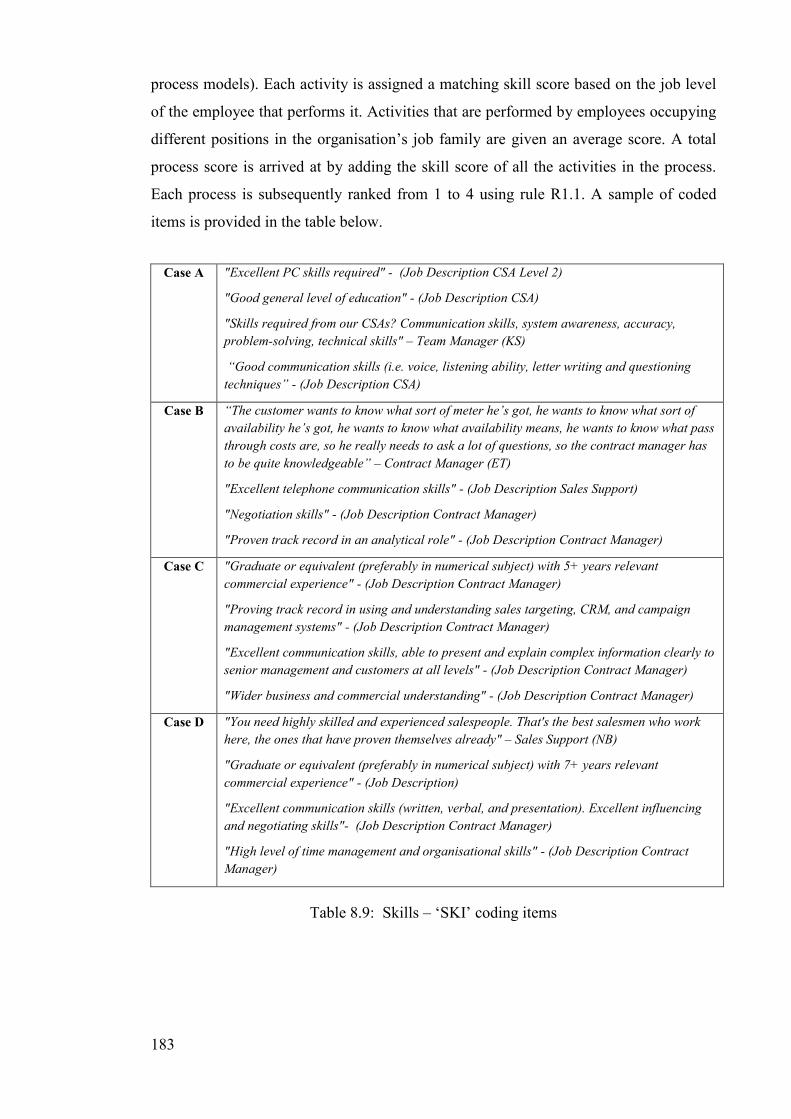
183
process models). Each activity is assigned a matching skill score based on the job level
of the employee that performs it. Activities that are performed by employees occupying
different positions in the organisation’s job family are given an average score. A total
process score is arrived at by adding the skill score of all the activities in the process.
Each process is subsequently ranked from 1 to 4 using rule R1.1. A sample of coded
items is provided in the table below.
Case A "Excellent PC skills required" - (Job Description CSA Level 2)
"Good general level of education" - (Job Description CSA)
"Skills required from our CSAs? Communication skills, system awareness, accuracy,
problem-solving, technical skills" – Team Manager (KS)
“Good communication skills (i.e. voice, listening ability, letter writing and questioning
techniques” - (Job Description CSA)
Case B “The customer wants to know what sort of meter he’s got, he wants to know what sort of
availability he’s got, he wants to know what availability means, he wants to know what pass
through costs are, so he really needs to ask a lot of questions, so the contract manager has
to be quite knowledgeable” – Contract Manager (ET)
"Excellent telephone communication skills" - (Job Description Sales Support)
"Negotiation skills" - (Job Description Contract Manager)
"Proven track record in an analytical role" - (Job Description Contract Manager)
Case C "Graduate or equivalent (preferably in numerical subject) with 5+ years relevant
commercial experience" - (Job Description Contract Manager)
"Proving track record in using and understanding sales targeting, CRM, and campaign
management systems" - (Job Description Contract Manager)
"Excellent communication skills, able to present and explain complex information clearly to
senior management and customers at all levels" - (Job Description Contract Manager)
"Wider business and commercial understanding" - (Job Description Contract Manager)
Case D "You need highly skilled and experienced salespeople. That's the best salesmen who work
here, the ones that have proven themselves already" – Sales Support (NB)
"Graduate or equivalent (preferably in numerical subject) with 7+ years relevant
commercial experience" - (Job Description)
"Excellent communication skills (written, verbal, and presentation). Excellent influencing
and negotiating skills"- (Job Description Contract Manager)
"High level of time management and organisational skills" - (Job Description Contract
Manager)
Table 8.9: Skills – ‘SKI’ coding items
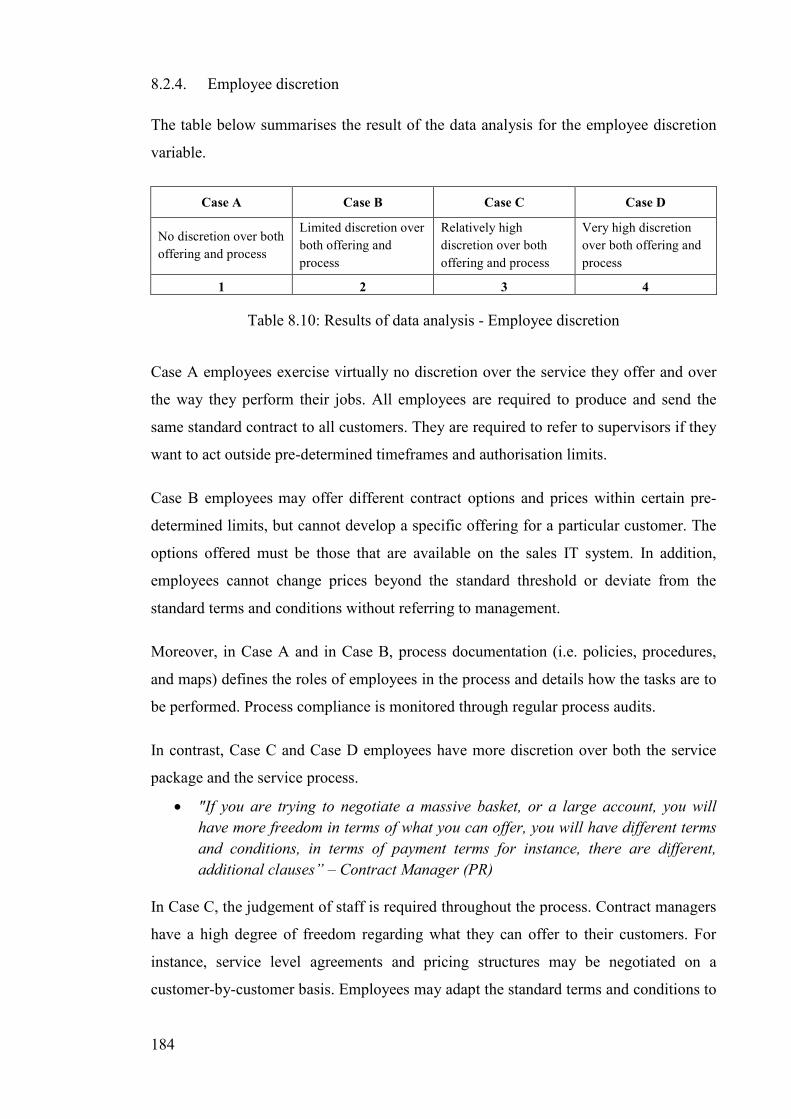
184
8.2.4. Employee discretion
The table below summarises the result of the data analysis for the employee discretion
variable.
Case A Case B Case C Case D
No discretion over both
offering and process
Limited discretion over
both offering and
process
Relatively high
discretion over both
offering and process
Very high discretion
over both offering and
process
1 2 3 4
Table 8.10: Results of data analysis - Employee discretion
Case A employees exercise virtually no discretion over the service they offer and over
the way they perform their jobs. All employees are required to produce and send the
same standard contract to all customers. They are required to refer to supervisors if they
want to act outside pre-determined timeframes and authorisation limits.
Case B employees may offer different contract options and prices within certain pre-
determined limits, but cannot develop a specific offering for a particular customer. The
options offered must be those that are available on the sales IT system. In addition,
employees cannot change prices beyond the standard threshold or deviate from the
standard terms and conditions without referring to management.
Moreover, in Case A and in Case B, process documentation (i.e. policies, procedures,
and maps) defines the roles of employees in the process and details how the tasks are to
be performed. Process compliance is monitored through regular process audits.
In contrast, Case C and Case D employees have more discretion over both the service
package and the service process.
• "If you are trying to negotiate a massive basket, or a large account, you will
have more freedom in terms of what you can offer, you will have different terms
and conditions, in terms of payment terms for instance, there are different,
additional clauses” – Contract Manager (PR)
In Case C, the judgement of staff is required throughout the process. Contract managers
have a high degree of freedom regarding what they can offer to their customers. For
instance, service level agreements and pricing structures may be negotiated on a
customer-by-customer basis. Employees may adapt the standard terms and conditions to
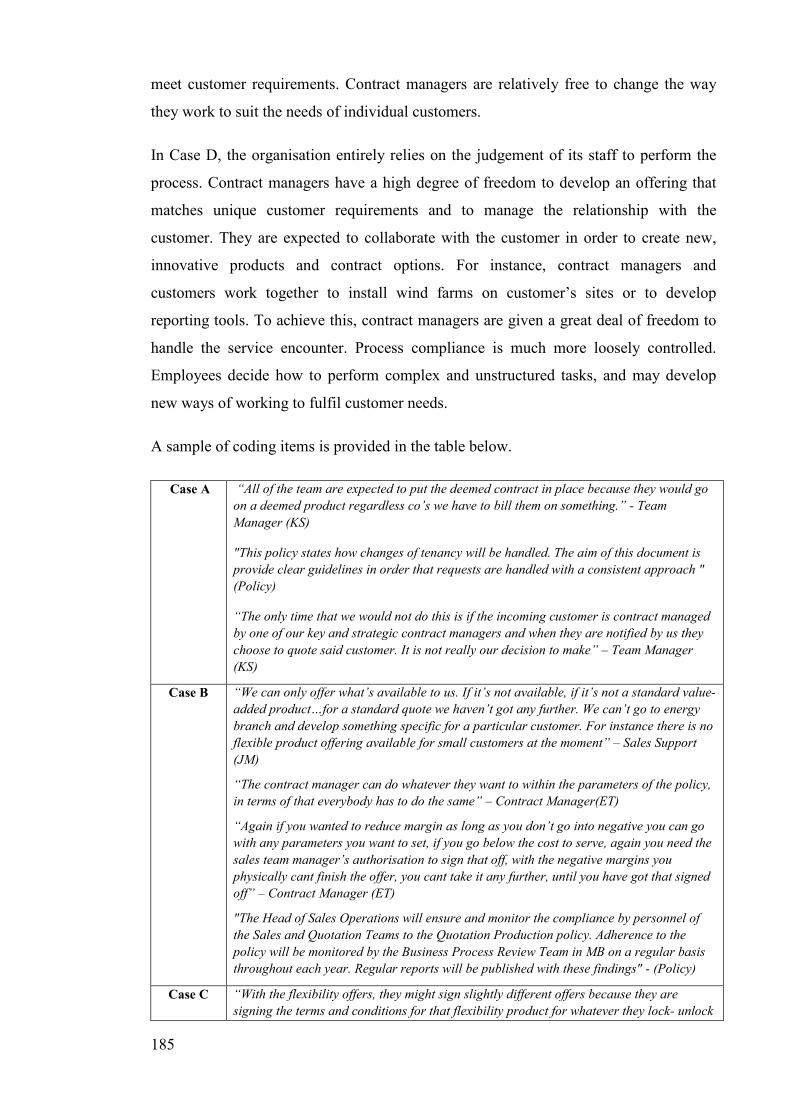
185
meet customer requirements. Contract managers are relatively free to change the way
they work to suit the needs of individual customers.
In Case D, the organisation entirely relies on the judgement of its staff to perform the
process. Contract managers have a high degree of freedom to develop an offering that
matches unique customer requirements and to manage the relationship with the
customer. They are expected to collaborate with the customer in order to create new,
innovative products and contract options. For instance, contract managers and
customers work together to install wind farms on customer’s sites or to develop
reporting tools. To achieve this, contract managers are given a great deal of freedom to
handle the service encounter. Process compliance is much more loosely controlled.
Employees decide how to perform complex and unstructured tasks, and may develop
new ways of working to fulfil customer needs.
A sample of coding items is provided in the table below.
Case A “All of the team are expected to put the deemed contract in place because they would go
on a deemed product regardless co’s we have to bill them on something.” - Team
Manager (KS)
"This policy states how changes of tenancy will be handled. The aim of this document is
provide clear guidelines in order that requests are handled with a consistent approach "
(Policy)
“The only time that we would not do this is if the incoming customer is contract managed
by one of our key and strategic contract managers and when they are notified by us they
choose to quote said customer. It is not really our decision to make” – Team Manager
(KS)
Case B “We can only offer what’s available to us. If it’s not available, if it’s not a standard value-
added product…for a standard quote we haven’t got any further. We can’t go to energy
branch and develop something specific for a particular customer. For instance there is no
flexible product offering available for small customers at the moment” – Sales Support
(JM)
“The contract manager can do whatever they want to within the parameters of the policy,
in terms of that everybody has to do the same” – Contract Manager(ET)
“Again if you wanted to reduce margin as long as you don’t go into negative you can go
with any parameters you want to set, if you go below the cost to serve, again you need the
sales team manager’s authorisation to sign that off, with the negative margins you
physically cant finish the offer, you cant take it any further, until you have got that signed
off” – Contract Manager (ET)
"The Head of Sales Operations will ensure and monitor the compliance by personnel of
the Sales and Quotation Teams to the Quotation Production policy. Adherence to the
policy will be monitored by the Business Process Review Team in MB on a regular basis
throughout each year. Regular reports will be published with these findings" - (Policy)
Case C “With the flexibility offers, they might sign slightly different offers because they are
signing the terms and conditions for that flexibility product for whatever they lock- unlock
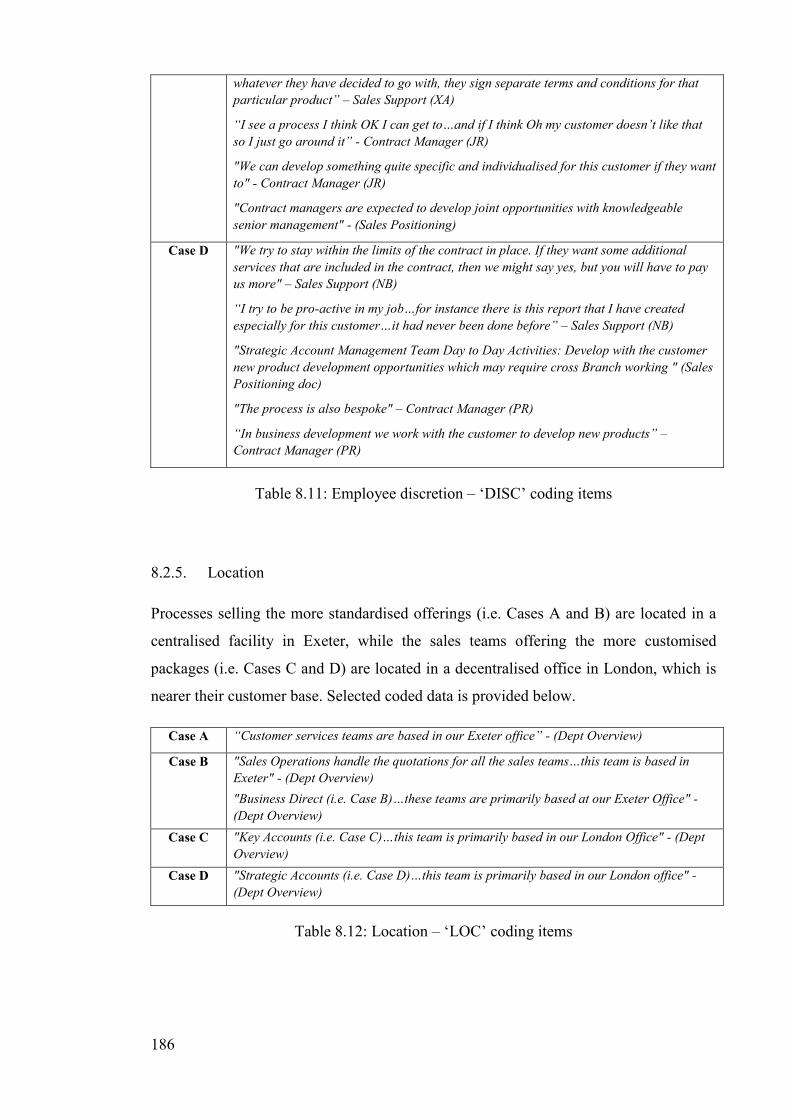
186
whatever they have decided to go with, they sign separate terms and conditions for that
particular product” – Sales Support (XA)
“I see a process I think OK I can get to…and if I think Oh my customer doesn’t like that
so I just go around it” - Contract Manager (JR)
"We can develop something quite specific and individualised for this customer if they want
to" - Contract Manager (JR)
"Contract managers are expected to develop joint opportunities with knowledgeable
senior management" - (Sales Positioning)
Case D "We try to stay within the limits of the contract in place. If they want some additional
services that are included in the contract, then we might say yes, but you will have to pay
us more" – Sales Support (NB)
“I try to be pro-active in my job…for instance there is this report that I have created
especially for this customer…it had never been done before” – Sales Support (NB)
"Strategic Account Management Team Day to Day Activities: Develop with the customer
new product development opportunities which may require cross Branch working " (Sales
Positioning doc)
"The process is also bespoke" – Contract Manager (PR)
“In business development we work with the customer to develop new products” –
Contract Manager (PR)
Table 8.11: Employee discretion – ‘DISC’ coding items
8.2.5. Location
Processes selling the more standardised offerings (i.e. Cases A and B) are located in a
centralised facility in Exeter, while the sales teams offering the more customised
packages (i.e. Cases C and D) are located in a decentralised office in London, which is
nearer their customer base. Selected coded data is provided below.
Case A “Customer services teams are based in our Exeter office” - (Dept Overview)
Case B "Sales Operations handle the quotations for all the sales teams…this team is based in
Exeter" - (Dept Overview)
"Business Direct (i.e. Case B)…these teams are primarily based at our Exeter Office" -
(Dept Overview)
Case C "Key Accounts (i.e. Case C)…this team is primarily based in our London Office" - (Dept
Overview)
Case D "Strategic Accounts (i.e. Case D)…this team is primarily based in our London office" -
(Dept Overview)
Table 8.12: Location – ‘LOC’ coding items
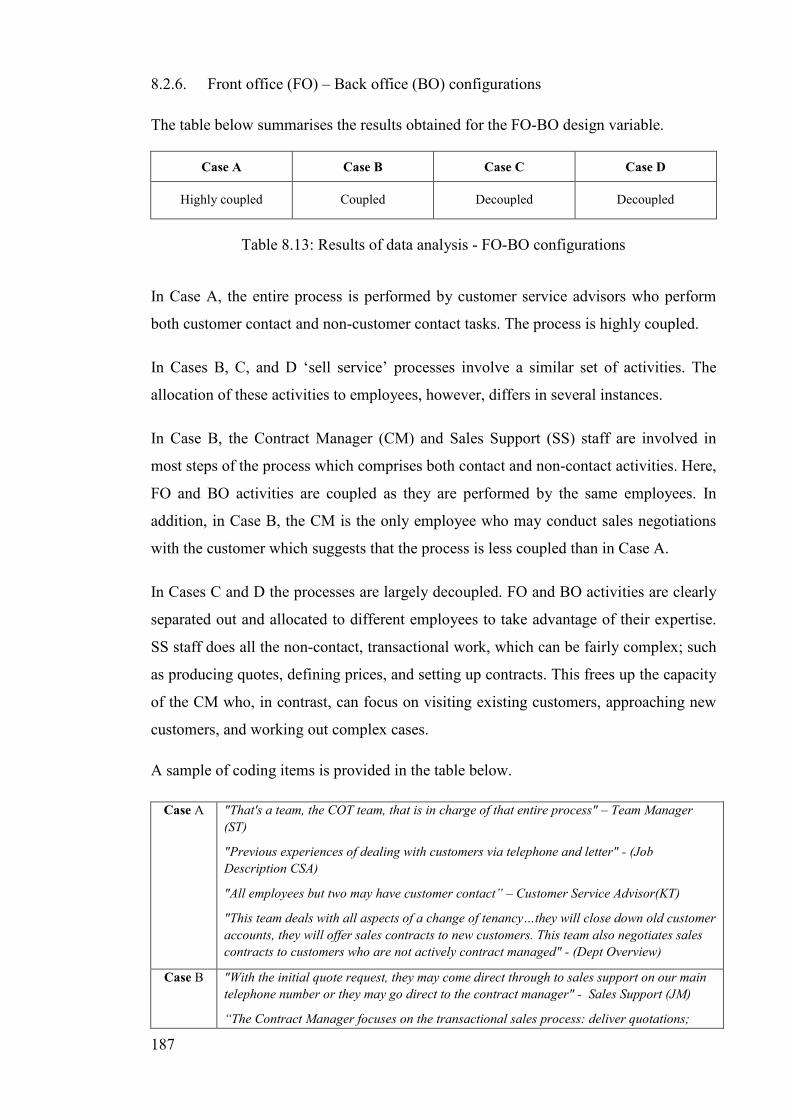
187
8.2.6. Front office (FO) – Back office (BO) configurations
The table below summarises the results obtained for the FO-BO design variable.
Case A Case B Case C Case D
Highly coupled Coupled Decoupled Decoupled
Table 8.13: Results of data analysis - FO-BO configurations
In Case A, the entire process is performed by customer service advisors who perform
both customer contact and non-customer contact tasks. The process is highly coupled.
In Cases B, C, and D ‘sell service’ processes involve a similar set of activities. The
allocation of these activities to employees, however, differs in several instances.
In Case B, the Contract Manager (CM) and Sales Support (SS) staff are involved in
most steps of the process which comprises both contact and non-contact activities. Here,
FO and BO activities are coupled as they are performed by the same employees. In
addition, in Case B, the CM is the only employee who may conduct sales negotiations
with the customer which suggests that the process is less coupled than in Case A.
In Cases C and D the processes are largely decoupled. FO and BO activities are clearly
separated out and allocated to different employees to take advantage of their expertise.
SS staff does all the non-contact, transactional work, which can be fairly complex; such
as producing quotes, defining prices, and setting up contracts. This frees up the capacity
of the CM who, in contrast, can focus on visiting existing customers, approaching new
customers, and working out complex cases.
A sample of coding items is provided in the table below.
Case A "That's a team, the COT team, that is in charge of that entire process" – Team Manager
(ST)
"Previous experiences of dealing with customers via telephone and letter" - (Job
Description CSA)
"All employees but two may have customer contact” – Customer Service Advisor(KT)
"This team deals with all aspects of a change of tenancy…they will close down old customer
accounts, they will offer sales contracts to new customers. This team also negotiates sales
contracts to customers who are not actively contract managed" - (Dept Overview)
Case B "With the initial quote request, they may come direct through to sales support on our main
telephone number or they may go direct to the contract manager" - Sales Support (JM)
“The Contract Manager focuses on the transactional sales process: deliver quotations;
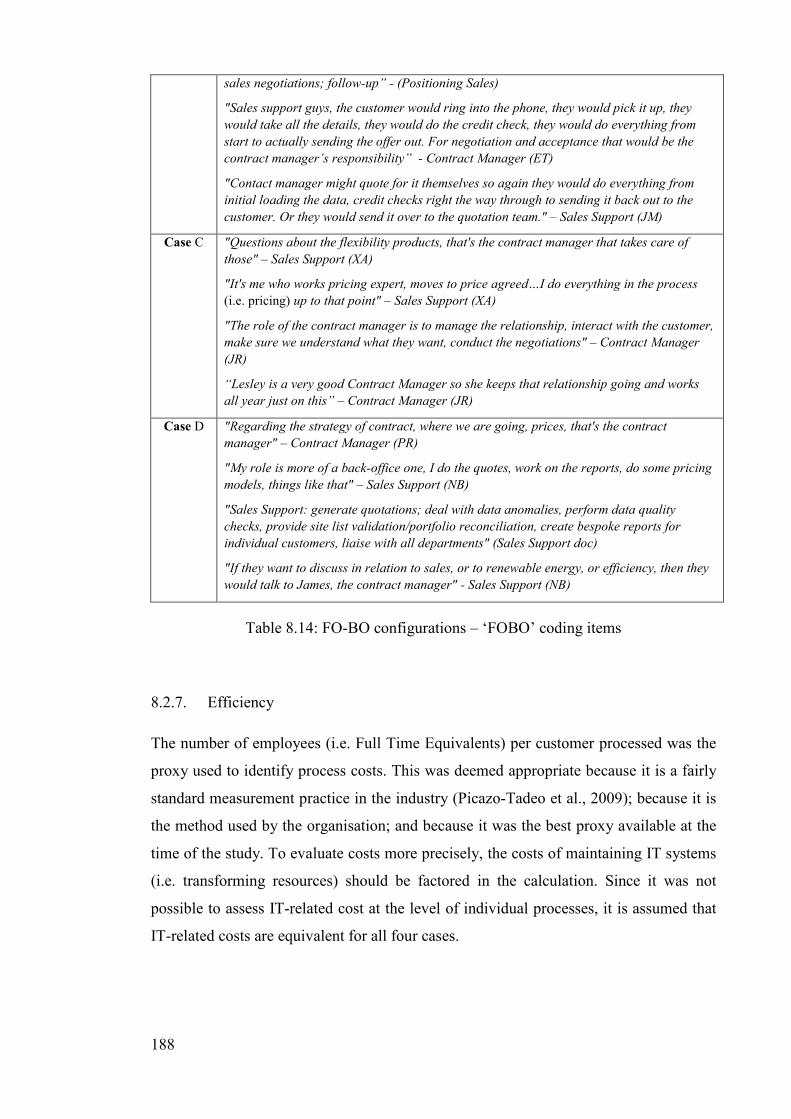
188
sales negotiations; follow-up” - (Positioning Sales)
"Sales support guys, the customer would ring into the phone, they would pick it up, they
would take all the details, they would do the credit check, they would do everything from
start to actually sending the offer out. For negotiation and acceptance that would be the
contract manager’s responsibility” - Contract Manager (ET)
"Contact manager might quote for it themselves so again they would do everything from
initial loading the data, credit checks right the way through to sending it back out to the
customer. Or they would send it over to the quotation team." – Sales Support (JM)
Case C "Questions about the flexibility products, that's the contract manager that takes care of
those" – Sales Support (XA)
"It's me who works pricing expert, moves to price agreed…I do everything in the process
(i.e. pricing) up to that point" – Sales Support (XA)
"The role of the contract manager is to manage the relationship, interact with the customer,
make sure we understand what they want, conduct the negotiations" – Contract Manager
(JR)
“Lesley is a very good Contract Manager so she keeps that relationship going and works
all year just on this” – Contract Manager (JR)
Case D "Regarding the strategy of contract, where we are going, prices, that's the contract
manager" – Contract Manager (PR)
"My role is more of a back-office one, I do the quotes, work on the reports, do some pricing
models, things like that" – Sales Support (NB)
"Sales Support: generate quotations; deal with data anomalies, perform data quality
checks, provide site list validation/portfolio reconciliation, create bespoke reports for
individual customers, liaise with all departments" (Sales Support doc)
"If they want to discuss in relation to sales, or to renewable energy, or efficiency, then they
would talk to James, the contract manager" - Sales Support (NB)
Table 8.14: FO-BO configurations – ‘FOBO’ coding items
8.2.7. Efficiency
The number of employees (i.e. Full Time Equivalents) per customer processed was the
proxy used to identify process costs. This was deemed appropriate because it is a fairly
standard measurement practice in the industry (Picazo-Tadeo et al., 2009); because it is
the method used by the organisation; and because it was the best proxy available at the
time of the study. To evaluate costs more precisely, the costs of maintaining IT systems
(i.e. transforming resources) should be factored in the calculation. Since it was not
possible to assess IT-related cost at the level of individual processes, it is assumed that
IT-related costs are equivalent for all four cases.
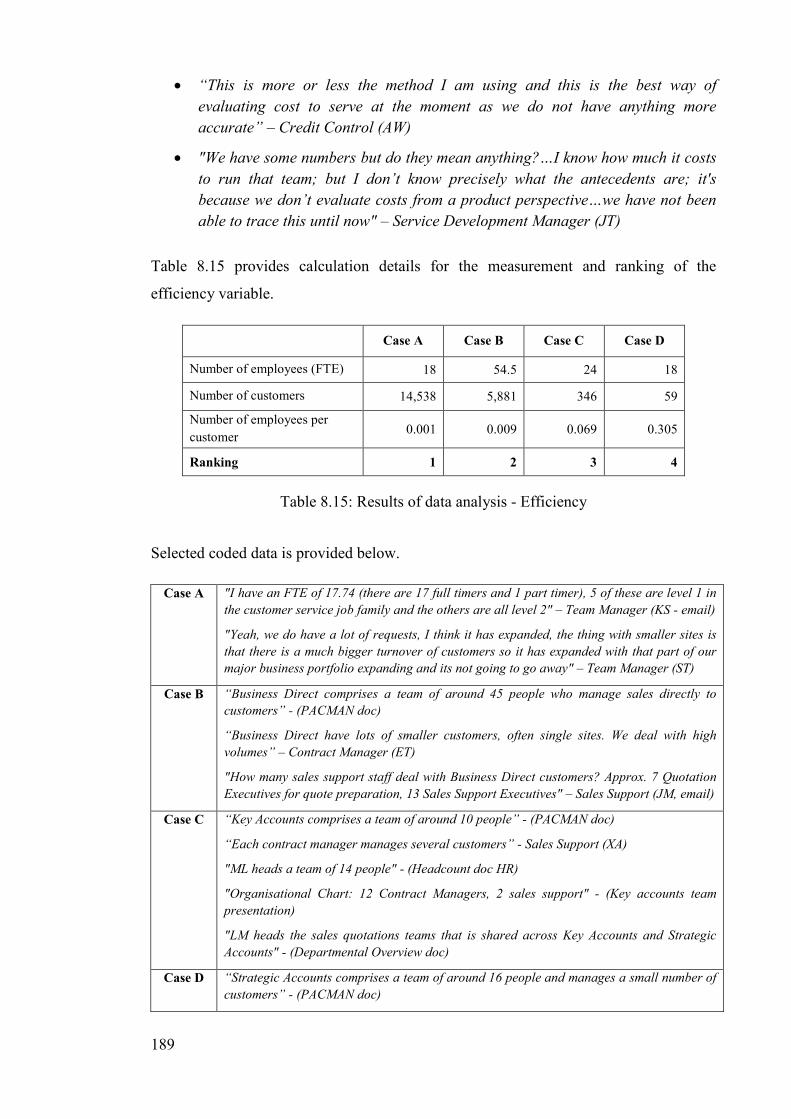
189
• “This is more or less the method I am using and this is the best way of
evaluating cost to serve at the moment as we do not have anything more
accurate” – Credit Control (AW)
• "We have some numbers but do they mean anything?…I know how much it costs
to run that team; but I don’t know precisely what the antecedents are; it's
because we don’t evaluate costs from a product perspective…we have not been
able to trace this until now" – Service Development Manager (JT)
Table 8.15 provides calculation details for the measurement and ranking of the
efficiency variable.
Case A Case B Case C Case D
Number of employees (FTE) 18 54.5 24 18
Number of customers 14,538 5,881 346 59
Number of employees per
customer 0.001 0.009 0.069 0.305
Ranking 1 2 3 4
Table 8.15: Results of data analysis - Efficiency
Selected coded data is provided below.
Case A "I have an FTE of 17.74 (there are 17 full timers and 1 part timer), 5 of these are level 1 in
the customer service job family and the others are all level 2" – Team Manager (KS - email)
"Yeah, we do have a lot of requests, I think it has expanded, the thing with smaller sites is
that there is a much bigger turnover of customers so it has expanded with that part of our
major business portfolio expanding and its not going to go away" – Team Manager (ST)
Case B “Business Direct comprises a team of around 45 people who manage sales directly to
customers” - (PACMAN doc)
“Business Direct have lots of smaller customers, often single sites. We deal with high
volumes” – Contract Manager (ET)
"How many sales support staff deal with Business Direct customers? Approx. 7 Quotation
Executives for quote preparation, 13 Sales Support Executives" – Sales Support (JM, email)
Case C “Key Accounts comprises a team of around 10 people” - (PACMAN doc)
“Each contract manager manages several customers” - Sales Support (XA)
"ML heads a team of 14 people" - (Headcount doc HR)
"Organisational Chart: 12 Contract Managers, 2 sales support" - (Key accounts team
presentation)
"LM heads the sales quotations teams that is shared across Key Accounts and Strategic
Accounts" - (Departmental Overview doc)
Case D “Strategic Accounts comprises a team of around 16 people and manages a small number of
customers” - (PACMAN doc)
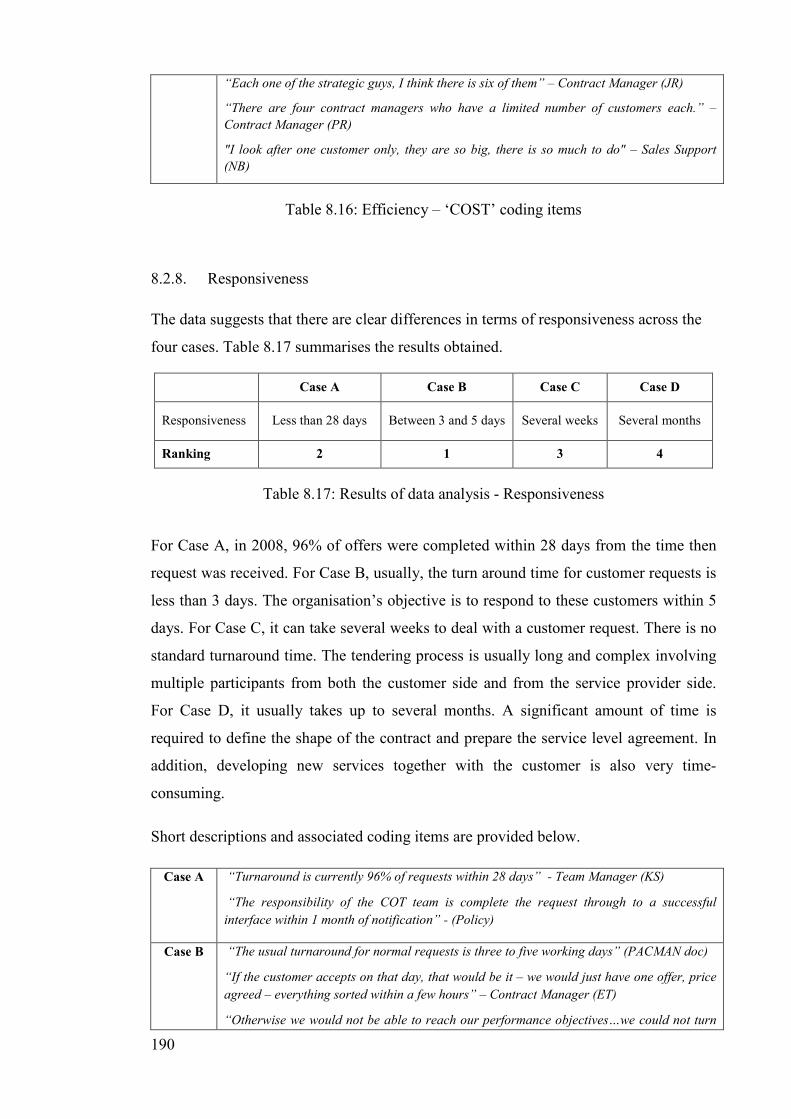
190
“Each one of the strategic guys, I think there is six of them” – Contract Manager (JR)
“There are four contract managers who have a limited number of customers each.” –
Contract Manager (PR)
"I look after one customer only, they are so big, there is so much to do" – Sales Support
(NB)
Table 8.16: Efficiency – ‘COST’ coding items
8.2.8. Responsiveness
The data suggests that there are clear differences in terms of responsiveness across the
four cases. Table 8.17 summarises the results obtained.
Case A Case B Case C Case D
Responsiveness Less than 28 days Between 3 and 5 days Several weeks Several months
Ranking 2 1 3 4
Table 8.17: Results of data analysis - Responsiveness
For Case A, in 2008, 96% of offers were completed within 28 days from the time then
request was received. For Case B, usually, the turn around time for customer requests is
less than 3 days. The organisation’s objective is to respond to these customers within 5
days. For Case C, it can take several weeks to deal with a customer request. There is no
standard turnaround time. The tendering process is usually long and complex involving
multiple participants from both the customer side and from the service provider side.
For Case D, it usually takes up to several months. A significant amount of time is
required to define the shape of the contract and prepare the service level agreement. In
addition, developing new services together with the customer is also very time-
consuming.
Short descriptions and associated coding items are provided below.
Case A “Turnaround is currently 96% of requests within 28 days” - Team Manager (KS)
“The responsibility of the COT team is complete the request through to a successful
interface within 1 month of notification” - (Policy)
Case B “The usual turnaround for normal requests is three to five working days” (PACMAN doc)
“If the customer accepts on that day, that would be it – we would just have one offer, price
agreed – everything sorted within a few hours” – Contract Manager (ET)
“Otherwise we would not be able to reach our performance objectives…we could not turn
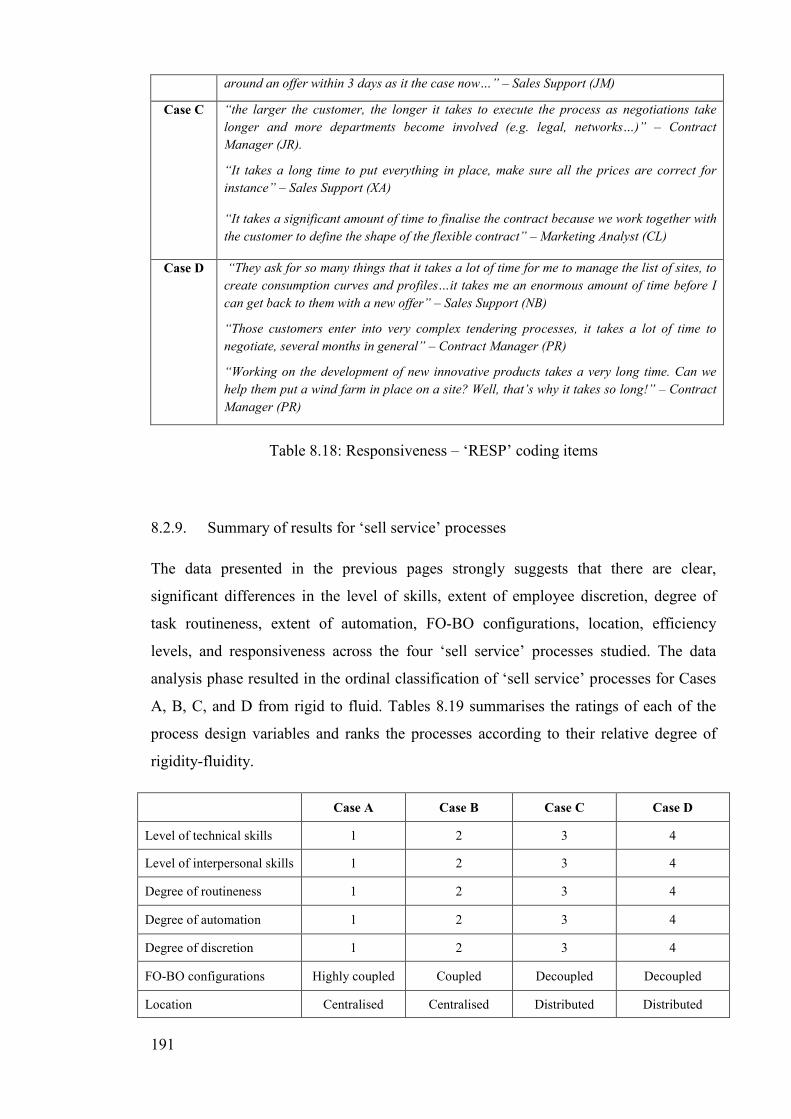
191
around an offer within 3 days as it the case now…” – Sales Support (JM)
Case C “the larger the customer, the longer it takes to execute the process as negotiations take
longer and more departments become involved (e.g. legal, networks…)” – Contract
Manager (JR).
“It takes a long time to put everything in place, make sure all the prices are correct for
instance” – Sales Support (XA)
“It takes a significant amount of time to finalise the contract because we work together with
the customer to define the shape of the flexible contract” – Marketing Analyst (CL)
Case D “They ask for so many things that it takes a lot of time for me to manage the list of sites, to
create consumption curves and profiles…it takes me an enormous amount of time before I
can get back to them with a new offer” – Sales Support (NB)
“Those customers enter into very complex tendering processes, it takes a lot of time to
negotiate, several months in general” – Contract Manager (PR)
“Working on the development of new innovative products takes a very long time. Can we
help them put a wind farm in place on a site? Well, that’s why it takes so long!” – Contract
Manager (PR)
Table 8.18: Responsiveness – ‘RESP’ coding items
8.2.9. Summary of results for ‘sell service’ processes
The data presented in the previous pages strongly suggests that there are clear,
significant differences in the level of skills, extent of employee discretion, degree of
task routineness, extent of automation, FO-BO configurations, location, efficiency
levels, and responsiveness across the four ‘sell service’ processes studied. The data
analysis phase resulted in the ordinal classification of ‘sell service’ processes for Cases
A, B, C, and D from rigid to fluid. Tables 8.19 summarises the ratings of each of the
process design variables and ranks the processes according to their relative degree of
rigidity-fluidity.
Case A Case B Case C Case D
Level of technical skills 1 2 3 4
Level of interpersonal skills 1 2 3 4
Degree of routineness 1 2 3 4
Degree of automation 1 2 3 4
Degree of discretion 1 2 3 4
FO-BO configurations Highly coupled Coupled Decoupled Decoupled
Location Centralised Centralised Distributed Distributed
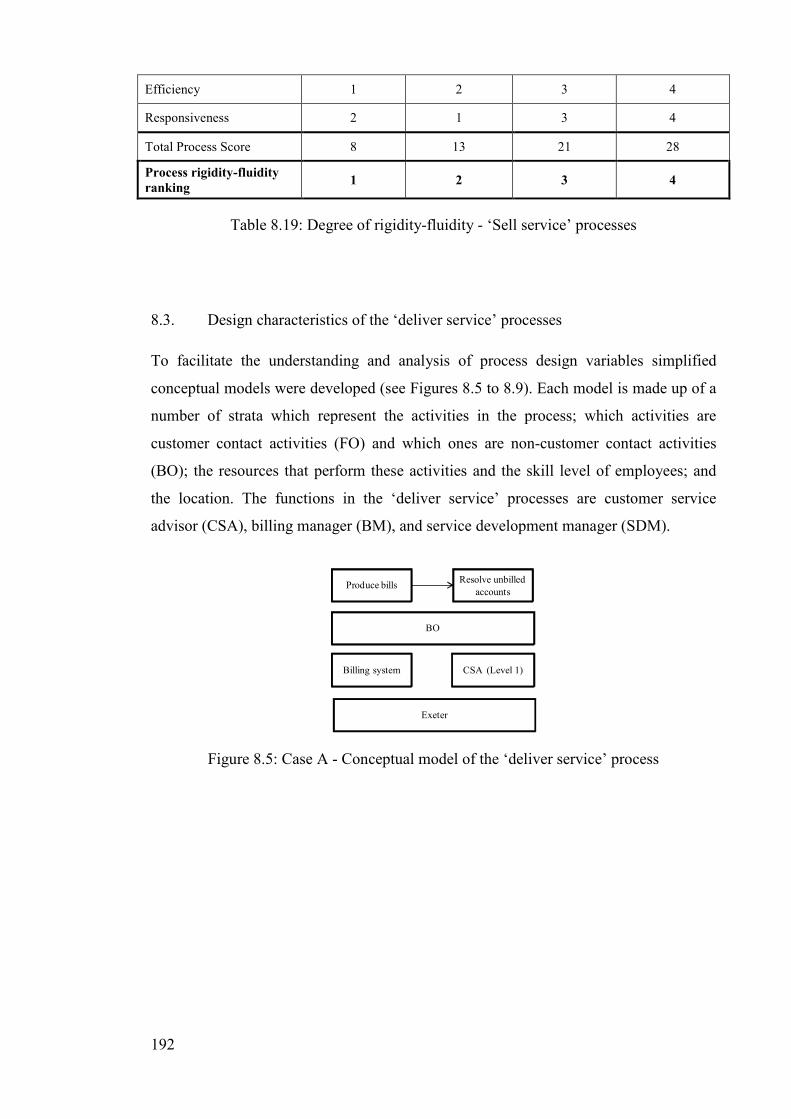
192
Efficiency 1 2 3 4
Responsiveness 2 1 3 4
Total Process Score 8 13 21 28
Process rigidity-fluidity
ranking 1 2 3 4
Table 8.19: Degree of rigidity-fluidity - ‘Sell service’ processes
8.3. Design characteristics of the ‘deliver service’ processes
To facilitate the understanding and analysis of process design variables simplified
conceptual models were developed (see Figures 8.5 to 8.9). Each model is made up of a
number of strata which represent the activities in the process; which activities are
customer contact activities (FO) and which ones are non-customer contact activities
(BO); the resources that perform these activities and the skill level of employees; and
the location. The functions in the ‘deliver service’ processes are customer service
advisor (CSA), billing manager (BM), and service development manager (SDM).
Produce billsResolve unbilled
accounts
BO
Billing system CSA (Level 1)
Exeter
Figure 8.5: Case A - Conceptual model of the ‘deliver service’ process
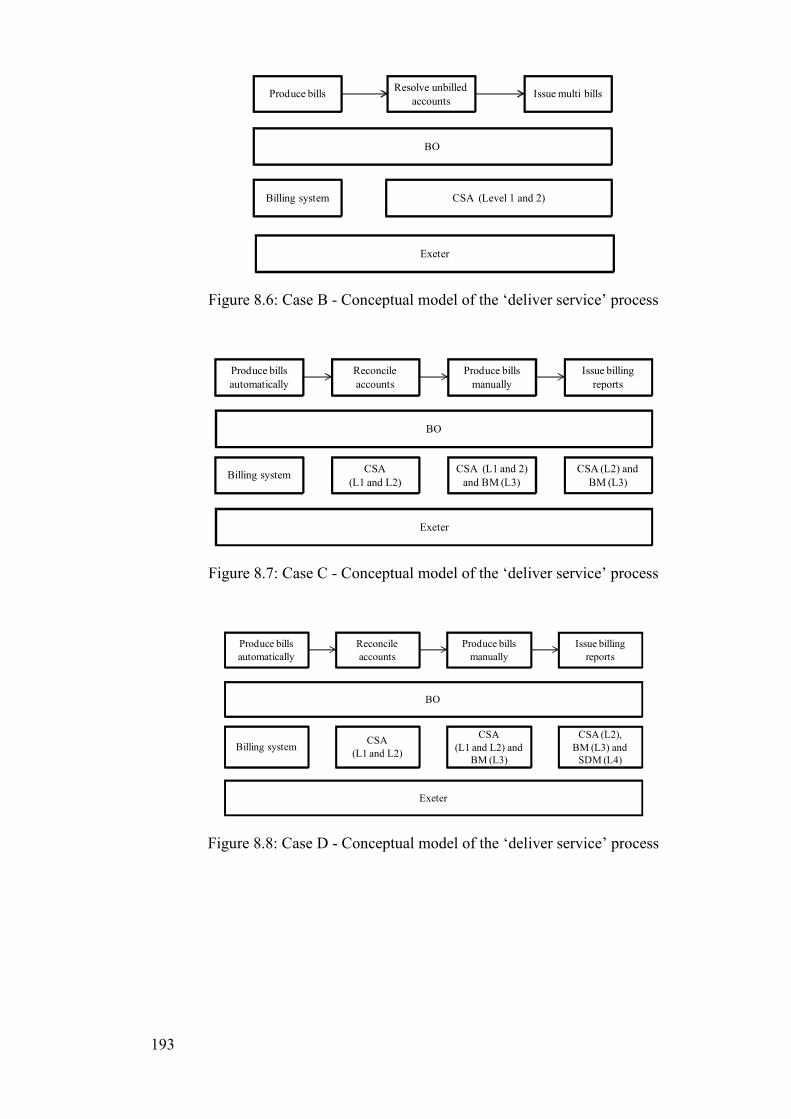
193
Produce billsResolve unbilled
accountsIssue multi bills
BO
Billing system CSA (Level 1 and 2)
Exeter
Figure 8.6: Case B - Conceptual model of the ‘deliver service’ process
Produce bills
automatically
Reconcile
accounts
Produce bills
manually
Issue billing
reports
BO
Billing systemCSA
(L1 and L2)
CSA (L1 and 2)
and BM (L3)
CSA (L2) and
BM (L3)
Exeter
Figure 8.7: Case C - Conceptual model of the ‘deliver service’ process
Produce bills
automatically
Reconcile
accounts
Produce bills
manually
Issue billing
reports
BO
Billing systemCSA
(L1 and L2)
CSA
(L1 and L2) and
BM (L3)
CSA (L2),
BM (L3) and
SDM (L4)
Exeter
Figure 8.8: Case D - Conceptual model of the ‘deliver service’ process
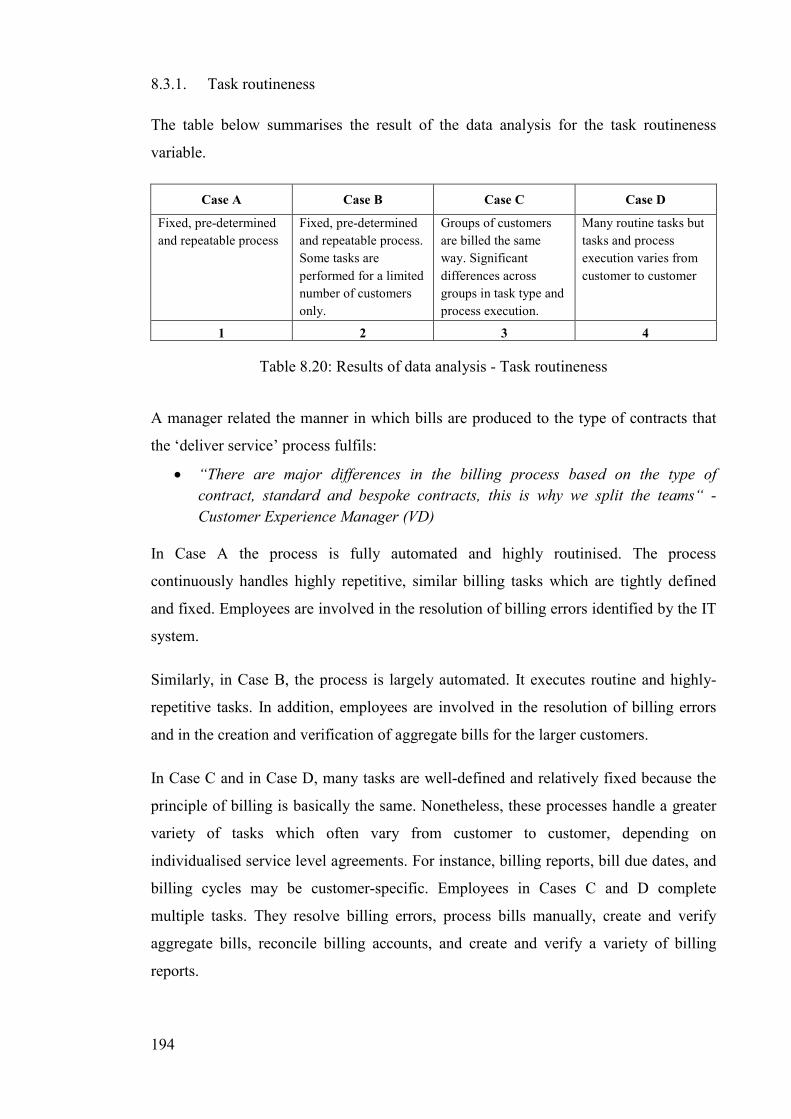
194
8.3.1. Task routineness
The table below summarises the result of the data analysis for the task routineness
variable.
Case A Case B Case C Case D
Fixed, pre-determined
and repeatable process
Fixed, pre-determined
and repeatable process.
Some tasks are
performed for a limited
number of customers
only.
Groups of customers
are billed the same
way. Significant
differences across
groups in task type and
process execution.
Many routine tasks but
tasks and process
execution varies from
customer to customer
1 2 3 4
Table 8.20: Results of data analysis - Task routineness
A manager related the manner in which bills are produced to the type of contracts that
the ‘deliver service’ process fulfils:
• “There are major differences in the billing process based on the type of
contract, standard and bespoke contracts, this is why we split the teams“ -
Customer Experience Manager (VD)
In Case A the process is fully automated and highly routinised. The process
continuously handles highly repetitive, similar billing tasks which are tightly defined
and fixed. Employees are involved in the resolution of billing errors identified by the IT
system.
Similarly, in Case B, the process is largely automated. It executes routine and highly-
repetitive tasks. In addition, employees are involved in the resolution of billing errors
and in the creation and verification of aggregate bills for the larger customers.
In Case C and in Case D, many tasks are well-defined and relatively fixed because the
principle of billing is basically the same. Nonetheless, these processes handle a greater
variety of tasks which often vary from customer to customer, depending on
individualised service level agreements. For instance, billing reports, bill due dates, and
billing cycles may be customer-specific. Employees in Cases C and D complete
multiple tasks. They resolve billing errors, process bills manually, create and verify
aggregate bills, reconcile billing accounts, and create and verify a variety of billing
reports.
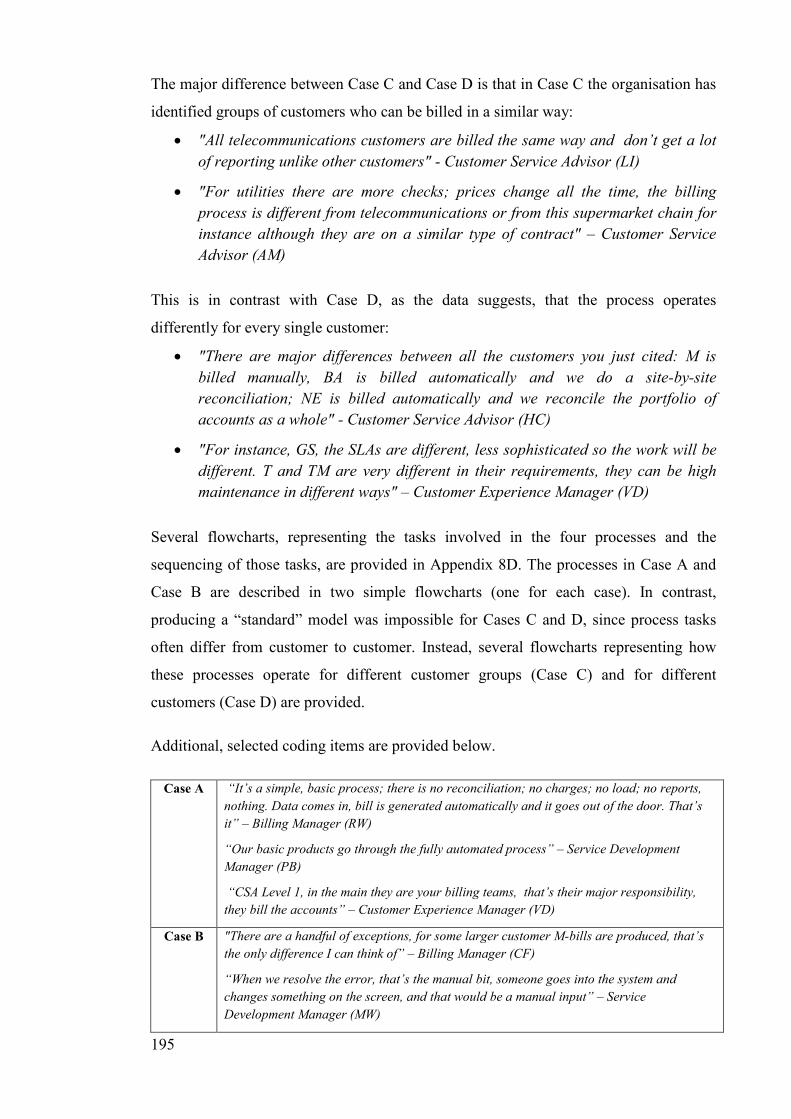
195
The major difference between Case C and Case D is that in Case C the organisation has
identified groups of customers who can be billed in a similar way:
• "All telecommunications customers are billed the same way and don’t get a lot
of reporting unlike other customers" - Customer Service Advisor (LI)
• "For utilities there are more checks; prices change all the time, the billing
process is different from telecommunications or from this supermarket chain for
instance although they are on a similar type of contract" – Customer Service
Advisor (AM)
This is in contrast with Case D, as the data suggests, that the process operates
differently for every single customer:
• "There are major differences between all the customers you just cited: M is
billed manually, BA is billed automatically and we do a site-by-site
reconciliation; NE is billed automatically and we reconcile the portfolio of
accounts as a whole" - Customer Service Advisor (HC)
• "For instance, GS, the SLAs are different, less sophisticated so the work will be
different. T and TM are very different in their requirements, they can be high
maintenance in different ways" – Customer Experience Manager (VD)
Several flowcharts, representing the tasks involved in the four processes and the
sequencing of those tasks, are provided in Appendix 8D. The processes in Case A and
Case B are described in two simple flowcharts (one for each case). In contrast,
producing a “standard” model was impossible for Cases C and D, since process tasks
often differ from customer to customer. Instead, several flowcharts representing how
these processes operate for different customer groups (Case C) and for different
customers (Case D) are provided.
Additional, selected coding items are provided below.
Case A “It’s a simple, basic process; there is no reconciliation; no charges; no load; no reports,
nothing. Data comes in, bill is generated automatically and it goes out of the door. That’s
it” – Billing Manager (RW)
“Our basic products go through the fully automated process” – Service Development
Manager (PB)
“CSA Level 1, in the main they are your billing teams, that’s their major responsibility,
they bill the accounts” – Customer Experience Manager (VD)
Case B "There are a handful of exceptions, for some larger customer M-bills are produced, that’s
the only difference I can think of” – Billing Manager (CF)
“When we resolve the error, that’s the manual bit, someone goes into the system and
changes something on the screen, and that would be a manual input” – Service
Development Manager (MW)
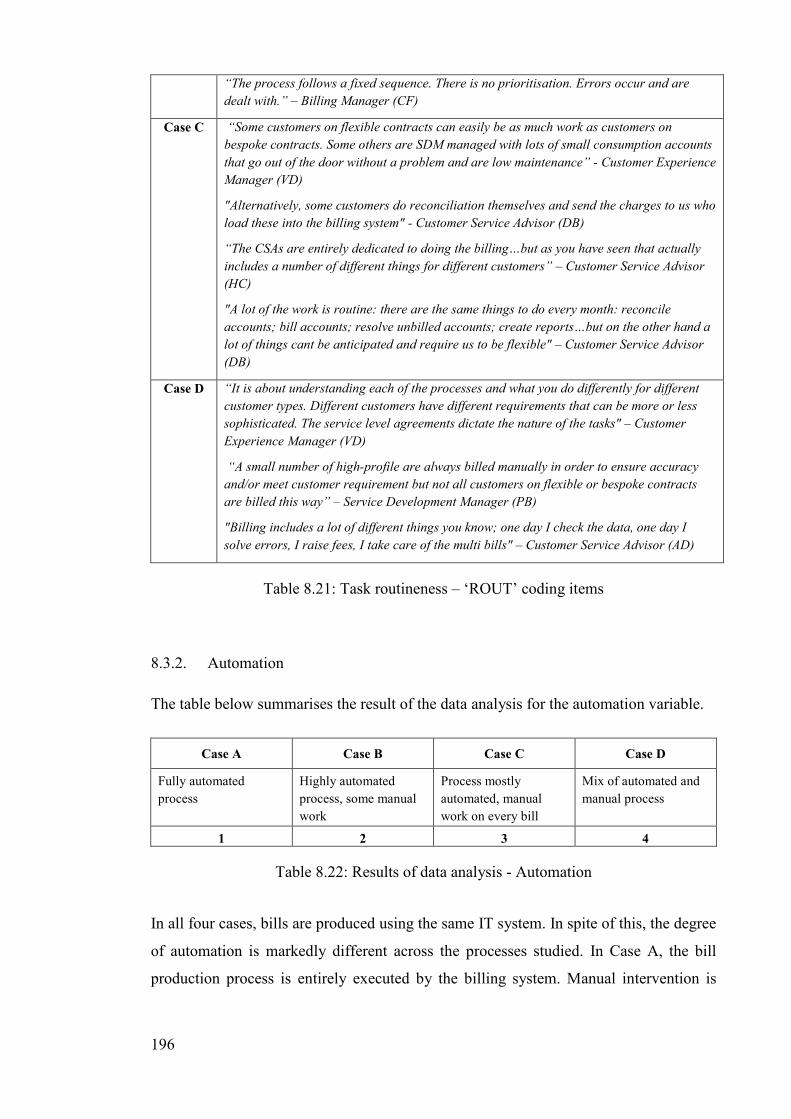
196
“The process follows a fixed sequence. There is no prioritisation. Errors occur and are
dealt with.” – Billing Manager (CF)
Case C “Some customers on flexible contracts can easily be as much work as customers on
bespoke contracts. Some others are SDM managed with lots of small consumption accounts
that go out of the door without a problem and are low maintenance” - Customer Experience
Manager (VD)
"Alternatively, some customers do reconciliation themselves and send the charges to us who
load these into the billing system" - Customer Service Advisor (DB)
“The CSAs are entirely dedicated to doing the billing…but as you have seen that actually
includes a number of different things for different customers” – Customer Service Advisor
(HC)
"A lot of the work is routine: there are the same things to do every month: reconcile
accounts; bill accounts; resolve unbilled accounts; create reports…but on the other hand a
lot of things cant be anticipated and require us to be flexible" – Customer Service Advisor
(DB)
Case D “It is about understanding each of the processes and what you do differently for different
customer types. Different customers have different requirements that can be more or less
sophisticated. The service level agreements dictate the nature of the tasks" – Customer
Experience Manager (VD)
“A small number of high-profile are always billed manually in order to ensure accuracy
and/or meet customer requirement but not all customers on flexible or bespoke contracts
are billed this way” – Service Development Manager (PB)
"Billing includes a lot of different things you know; one day I check the data, one day I
solve errors, I raise fees, I take care of the multi bills" – Customer Service Advisor (AD)
Table 8.21: Task routineness – ‘ROUT’ coding items
8.3.2. Automation
The table below summarises the result of the data analysis for the automation variable.
Case A Case B Case C Case D
Fully automated
process
Highly automated
process, some manual
work
Process mostly
automated, manual
work on every bill
Mix of automated and
manual process
1 2 3 4
Table 8.22: Results of data analysis - Automation
In all four cases, bills are produced using the same IT system. In spite of this, the degree
of automation is markedly different across the processes studied. In Case A, the bill
production process is entirely executed by the billing system. Manual intervention is
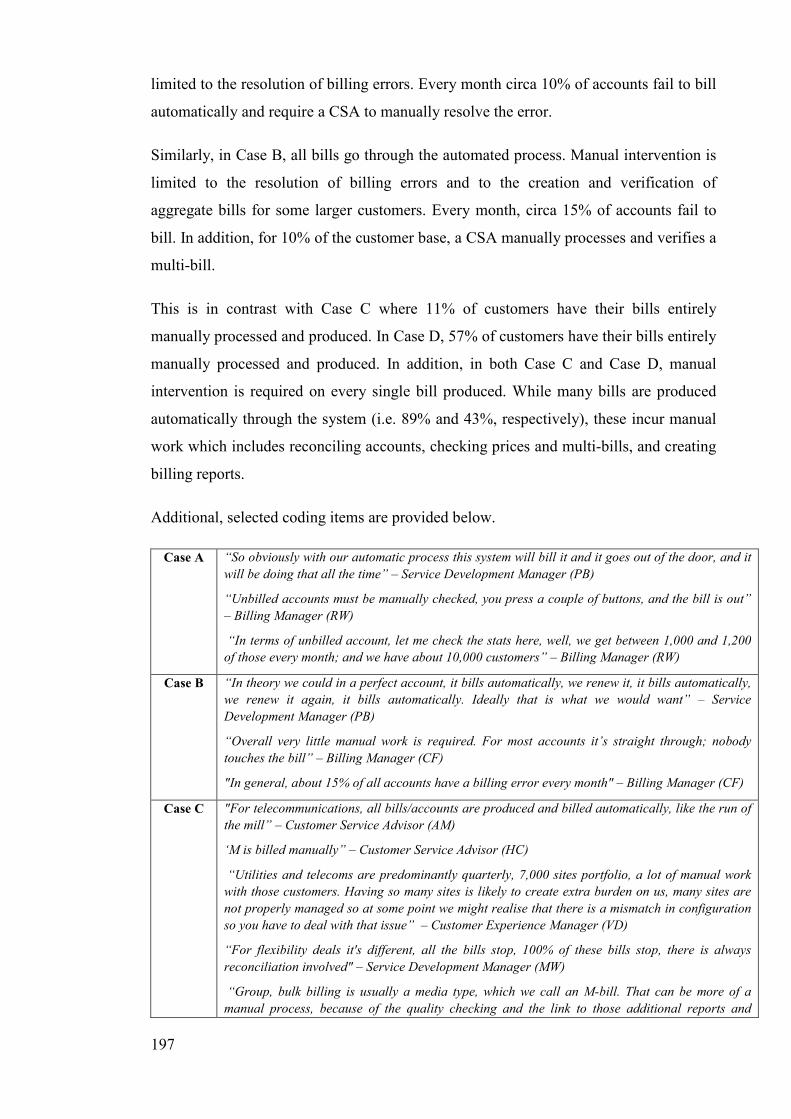
197
limited to the resolution of billing errors. Every month circa 10% of accounts fail to bill
automatically and require a CSA to manually resolve the error.
Similarly, in Case B, all bills go through the automated process. Manual intervention is
limited to the resolution of billing errors and to the creation and verification of
aggregate bills for some larger customers. Every month, circa 15% of accounts fail to
bill. In addition, for 10% of the customer base, a CSA manually processes and verifies a
multi-bill.
This is in contrast with Case C where 11% of customers have their bills entirely
manually processed and produced. In Case D, 57% of customers have their bills entirely
manually processed and produced. In addition, in both Case C and Case D, manual
intervention is required on every single bill produced. While many bills are produced
automatically through the system (i.e. 89% and 43%, respectively), these incur manual
work which includes reconciling accounts, checking prices and multi-bills, and creating
billing reports.
Additional, selected coding items are provided below.
Case A “So obviously with our automatic process this system will bill it and it goes out of the door, and it
will be doing that all the time” – Service Development Manager (PB)
“Unbilled accounts must be manually checked, you press a couple of buttons, and the bill is out”
– Billing Manager (RW)
“In terms of unbilled account, let me check the stats here, well, we get between 1,000 and 1,200
of those every month; and we have about 10,000 customers” – Billing Manager (RW)
Case B “In theory we could in a perfect account, it bills automatically, we renew it, it bills automatically,
we renew it again, it bills automatically. Ideally that is what we would want” – Service
Development Manager (PB)
“Overall very little manual work is required. For most accounts it’s straight through; nobody
touches the bill” – Billing Manager (CF)
"In general, about 15% of all accounts have a billing error every month" – Billing Manager (CF)
Case C "For telecommunications, all bills/accounts are produced and billed automatically, like the run of
the mill” – Customer Service Advisor (AM)
‘M is billed manually” – Customer Service Advisor (HC)
“Utilities and telecoms are predominantly quarterly, 7,000 sites portfolio, a lot of manual work
with those customers. Having so many sites is likely to create extra burden on us, many sites are
not properly managed so at some point we might realise that there is a mismatch in configuration
so you have to deal with that issue” – Customer Experience Manager (VD)
“For flexibility deals it's different, all the bills stop, 100% of these bills stop, there is always
reconciliation involved" – Service Development Manager (MW)
“Group, bulk billing is usually a media type, which we call an M-bill. That can be more of a
manual process, because of the quality checking and the link to those additional reports and
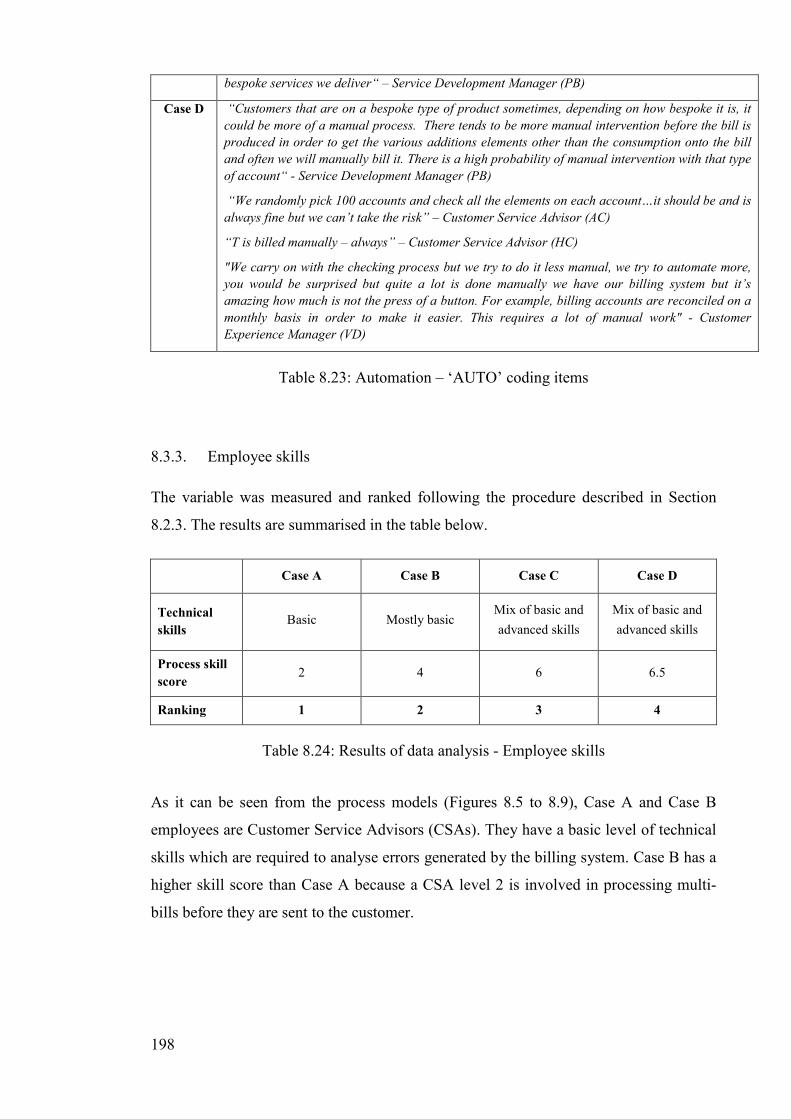
198
bespoke services we deliver“ – Service Development Manager (PB)
Case D “Customers that are on a bespoke type of product sometimes, depending on how bespoke it is, it
could be more of a manual process. There tends to be more manual intervention before the bill is
produced in order to get the various additions elements other than the consumption onto the bill
and often we will manually bill it. There is a high probability of manual intervention with that type
of account“ - Service Development Manager (PB)
“We randomly pick 100 accounts and check all the elements on each account…it should be and is
always fine but we can’t take the risk” – Customer Service Advisor (AC)
“T is billed manually – always” – Customer Service Advisor (HC)
"We carry on with the checking process but we try to do it less manual, we try to automate more,
you would be surprised but quite a lot is done manually we have our billing system but it’s
amazing how much is not the press of a button. For example, billing accounts are reconciled on a
monthly basis in order to make it easier. This requires a lot of manual work" - Customer
Experience Manager (VD)
Table 8.23: Automation – ‘AUTO’ coding items
8.3.3. Employee skills
The variable was measured and ranked following the procedure described in Section
8.2.3. The results are summarised in the table below.
Case A Case B Case C Case D
Technical
skills Basic Mostly basic
Mix of basic and
advanced skills
Mix of basic and
advanced skills
Process skill
score 2 4 6 6.5
Ranking 1 2 3 4
Table 8.24: Results of data analysis - Employee skills
As it can be seen from the process models (Figures 8.5 to 8.9), Case A and Case B
employees are Customer Service Advisors (CSAs). They have a basic level of technical
skills which are required to analyse errors generated by the billing system. Case B has a
higher skill score than Case A because a CSA level 2 is involved in processing multi-
bills before they are sent to the customer.
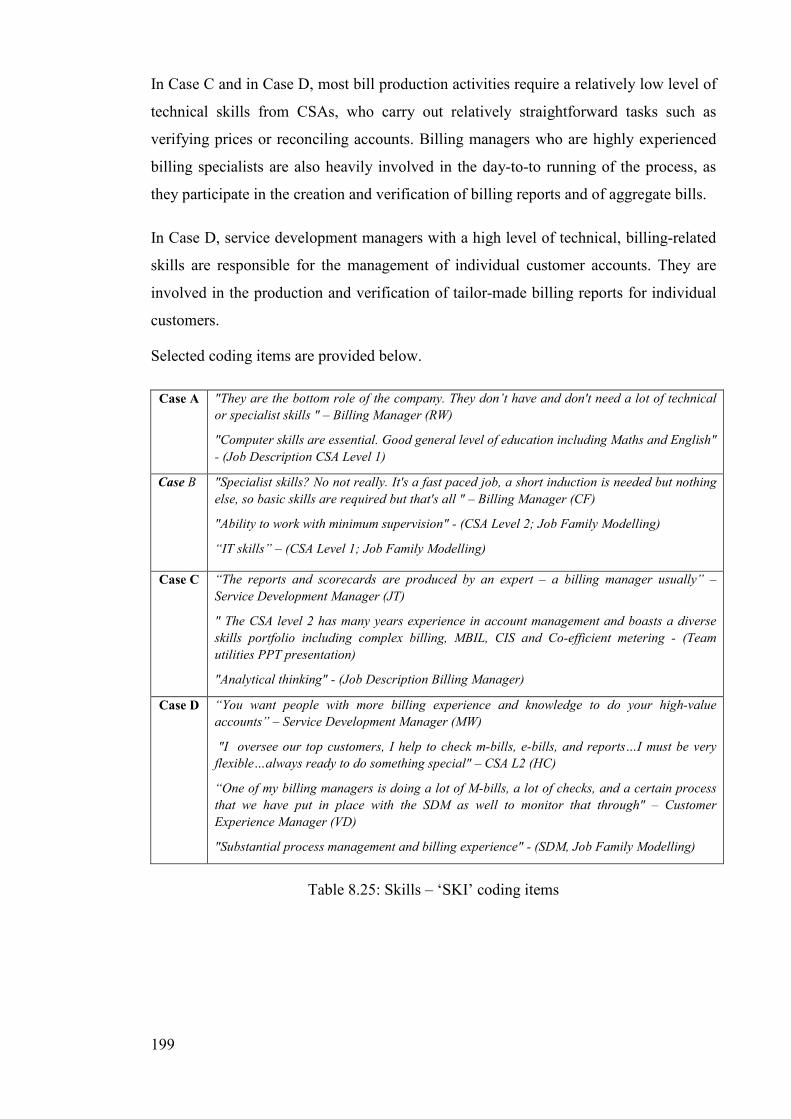
199
In Case C and in Case D, most bill production activities require a relatively low level of
technical skills from CSAs, who carry out relatively straightforward tasks such as
verifying prices or reconciling accounts. Billing managers who are highly experienced
billing specialists are also heavily involved in the day-to-to running of the process, as
they participate in the creation and verification of billing reports and of aggregate bills.
In Case D, service development managers with a high level of technical, billing-related
skills are responsible for the management of individual customer accounts. They are
involved in the production and verification of tailor-made billing reports for individual
customers.
Selected coding items are provided below.
Case A "They are the bottom role of the company. They don’t have and don't need a lot of technical
or specialist skills " – Billing Manager (RW)
"Computer skills are essential. Good general level of education including Maths and English"
- (Job Description CSA Level 1)
Case B "Specialist skills? No not really. It's a fast paced job, a short induction is needed but nothing
else, so basic skills are required but that's all " – Billing Manager (CF)
"Ability to work with minimum supervision" - (CSA Level 2; Job Family Modelling)
“IT skills” – (CSA Level 1; Job Family Modelling)
Case C “The reports and scorecards are produced by an expert – a billing manager usually” –
Service Development Manager (JT)
" The CSA level 2 has many years experience in account management and boasts a diverse
skills portfolio including complex billing, MBIL, CIS and Co-efficient metering - (Team
utilities PPT presentation)
"Analytical thinking" - (Job Description Billing Manager)
Case D “You want people with more billing experience and knowledge to do your high-value
accounts” – Service Development Manager (MW)
"I oversee our top customers, I help to check m-bills, e-bills, and reports…I must be very
flexible…always ready to do something special" – CSA L2 (HC)
“One of my billing managers is doing a lot of M-bills, a lot of checks, and a certain process
that we have put in place with the SDM as well to monitor that through" – Customer
Experience Manager (VD)
"Substantial process management and billing experience" - (SDM, Job Family Modelling)
Table 8.25: Skills – ‘SKI’ coding items
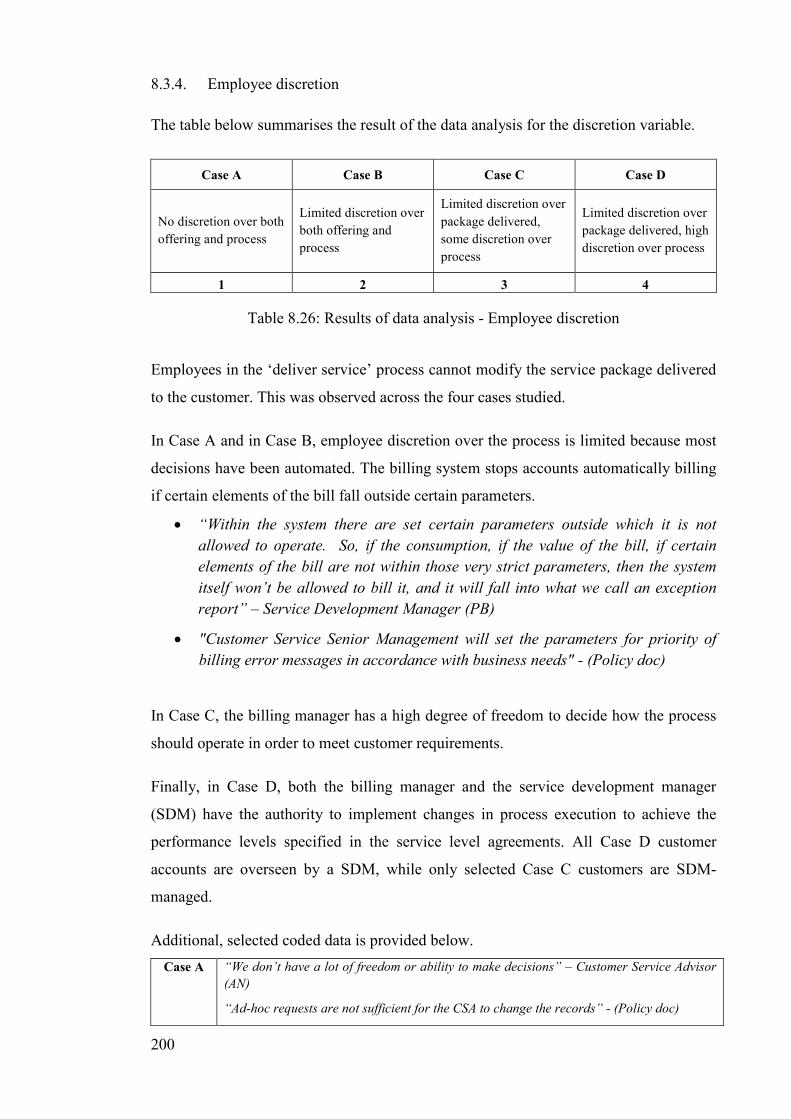
200
8.3.4. Employee discretion
The table below summarises the result of the data analysis for the discretion variable.
Case A Case B Case C Case D
No discretion over both
offering and process
Limited discretion over
both offering and
process
Limited discretion over
package delivered,
some discretion over
process
Limited discretion over
package delivered, high
discretion over process
1 2 3 4
Table 8.26: Results of data analysis - Employee discretion
Employees in the ‘deliver service’ process cannot modify the service package delivered
to the customer. This was observed across the four cases studied.
In Case A and in Case B, employee discretion over the process is limited because most
decisions have been automated. The billing system stops accounts automatically billing
if certain elements of the bill fall outside certain parameters.
• “Within the system there are set certain parameters outside which it is not
allowed to operate. So, if the consumption, if the value of the bill, if certain
elements of the bill are not within those very strict parameters, then the system
itself won’t be allowed to bill it, and it will fall into what we call an exception
report” – Service Development Manager (PB)
• "Customer Service Senior Management will set the parameters for priority of
billing error messages in accordance with business needs" - (Policy doc)
In Case C, the billing manager has a high degree of freedom to decide how the process
should operate in order to meet customer requirements.
Finally, in Case D, both the billing manager and the service development manager
(SDM) have the authority to implement changes in process execution to achieve the
performance levels specified in the service level agreements. All Case D customer
accounts are overseen by a SDM, while only selected Case C customers are SDM-
managed.
Additional, selected coded data is provided below.
Case A “We don’t have a lot of freedom or ability to make decisions” – Customer Service Advisor
(AN)
“Ad-hoc requests are not sufficient for the CSA to change the records” - (Policy doc)
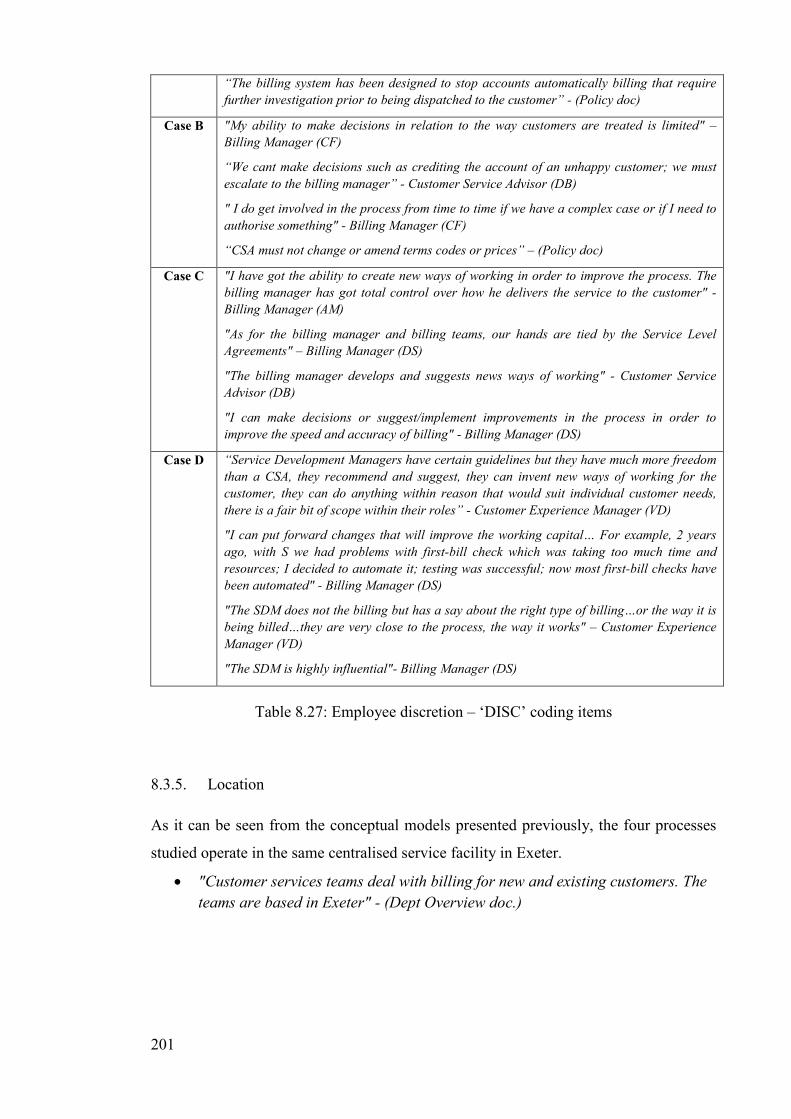
201
“The billing system has been designed to stop accounts automatically billing that require
further investigation prior to being dispatched to the customer” - (Policy doc)
Case B "My ability to make decisions in relation to the way customers are treated is limited" –
Billing Manager (CF)
“We cant make decisions such as crediting the account of an unhappy customer; we must
escalate to the billing manager” - Customer Service Advisor (DB)
" I do get involved in the process from time to time if we have a complex case or if I need to
authorise something" - Billing Manager (CF)
“CSA must not change or amend terms codes or prices” – (Policy doc)
Case C "I have got the ability to create new ways of working in order to improve the process. The
billing manager has got total control over how he delivers the service to the customer" -
Billing Manager (AM)
"As for the billing manager and billing teams, our hands are tied by the Service Level
Agreements" – Billing Manager (DS)
"The billing manager develops and suggests news ways of working" - Customer Service
Advisor (DB)
"I can make decisions or suggest/implement improvements in the process in order to
improve the speed and accuracy of billing" - Billing Manager (DS)
Case D “Service Development Managers have certain guidelines but they have much more freedom
than a CSA, they recommend and suggest, they can invent new ways of working for the
customer, they can do anything within reason that would suit individual customer needs,
there is a fair bit of scope within their roles” - Customer Experience Manager (VD)
"I can put forward changes that will improve the working capital… For example, 2 years
ago, with S we had problems with first-bill check which was taking too much time and
resources; I decided to automate it; testing was successful; now most first-bill checks have
been automated" - Billing Manager (DS)
"The SDM does not the billing but has a say about the right type of billing…or the way it is
being billed…they are very close to the process, the way it works" – Customer Experience
Manager (VD)
"The SDM is highly influential"- Billing Manager (DS)
Table 8.27: Employee discretion – ‘DISC’ coding items
8.3.5. Location
As it can be seen from the conceptual models presented previously, the four processes
studied operate in the same centralised service facility in Exeter.
• "Customer services teams deal with billing for new and existing customers. The
teams are based in Exeter" - (Dept Overview doc.)
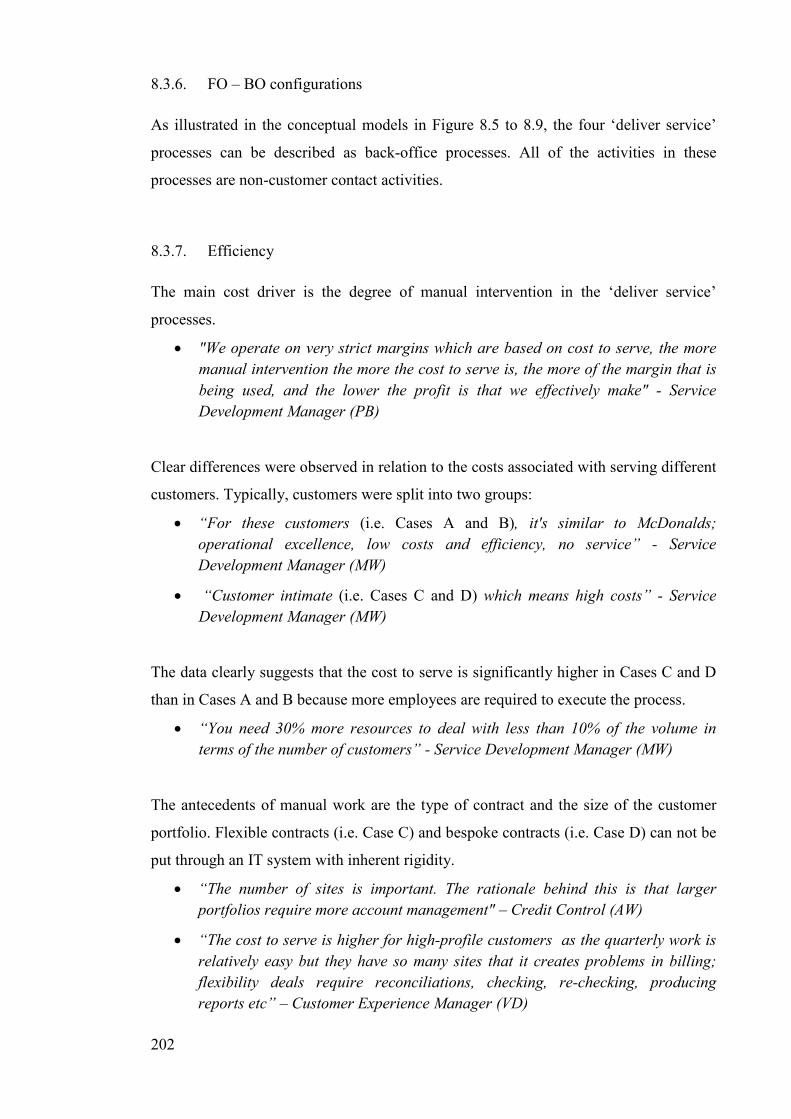
202
8.3.6. FO – BO configurations
As illustrated in the conceptual models in Figure 8.5 to 8.9, the four ‘deliver service’
processes can be described as back-office processes. All of the activities in these
processes are non-customer contact activities.
8.3.7. Efficiency
The main cost driver is the degree of manual intervention in the ‘deliver service’
processes.
• "We operate on very strict margins which are based on cost to serve, the more
manual intervention the more the cost to serve is, the more of the margin that is
being used, and the lower the profit is that we effectively make" - Service
Development Manager (PB)
Clear differences were observed in relation to the costs associated with serving different
customers. Typically, customers were split into two groups:
• “For these customers (i.e. Cases A and B), it's similar to McDonalds;
operational excellence, low costs and efficiency, no service” - Service
Development Manager (MW)
• “Customer intimate (i.e. Cases C and D) which means high costs” - Service
Development Manager (MW)
The data clearly suggests that the cost to serve is significantly higher in Cases C and D
than in Cases A and B because more employees are required to execute the process.
• “You need 30% more resources to deal with less than 10% of the volume in
terms of the number of customers” - Service Development Manager (MW)
The antecedents of manual work are the type of contract and the size of the customer
portfolio. Flexible contracts (i.e. Case C) and bespoke contracts (i.e. Case D) can not be
put through an IT system with inherent rigidity.
• “The number of sites is important. The rationale behind this is that larger
portfolios require more account management" – Credit Control (AW)
• “The cost to serve is higher for high-profile customers as the quarterly work is
relatively easy but they have so many sites that it creates problems in billing;
flexibility deals require reconciliations, checking, re-checking, producing
reports etc” – Customer Experience Manager (VD)
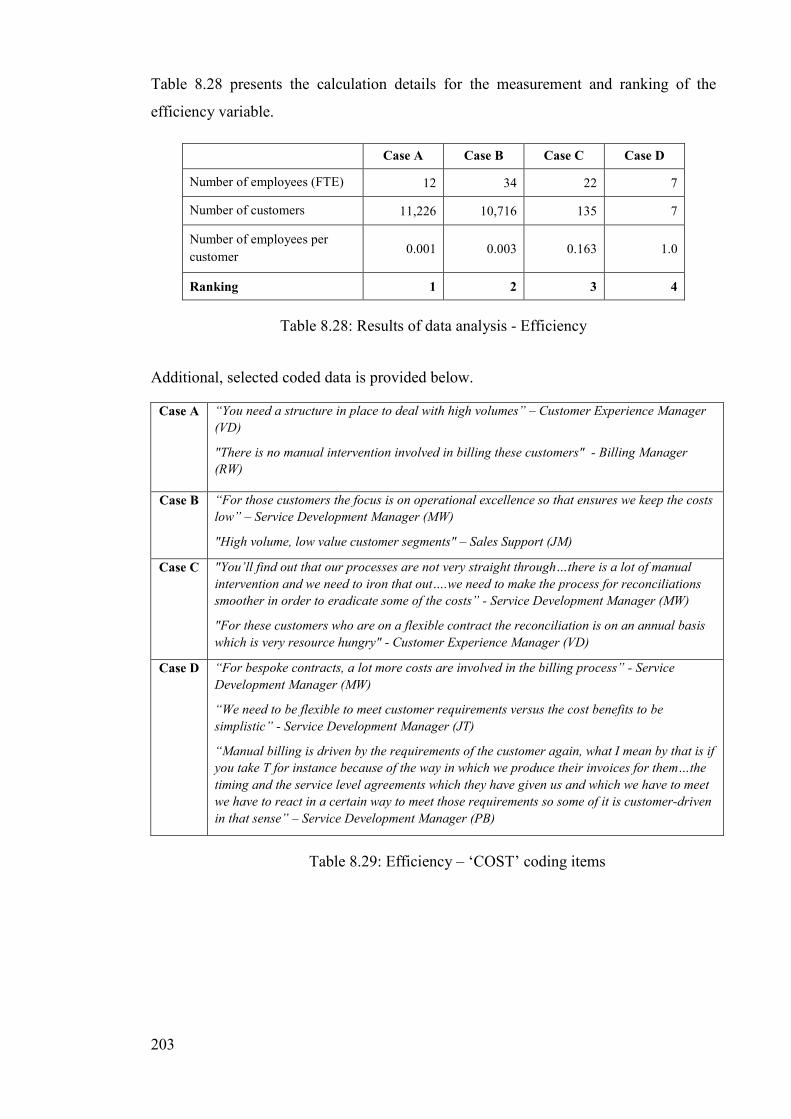
203
Table 8.28 presents the calculation details for the measurement and ranking of the
efficiency variable.
Case A Case B Case C Case D
Number of employees (FTE) 12 34 22 7
Number of customers 11,226 10,716 135 7
Number of employees per
customer 0.001 0.003 0.163 1.0
Ranking 1 2 3 4
Table 8.28: Results of data analysis - Efficiency
Additional, selected coded data is provided below.
Case A “You need a structure in place to deal with high volumes” – Customer Experience Manager
(VD)
"There is no manual intervention involved in billing these customers" - Billing Manager
(RW)
Case B “For those customers the focus is on operational excellence so that ensures we keep the costs
low” – Service Development Manager (MW)
"High volume, low value customer segments" – Sales Support (JM)
Case C "You’ll find out that our processes are not very straight through…there is a lot of manual
intervention and we need to iron that out….we need to make the process for reconciliations
smoother in order to eradicate some of the costs” - Service Development Manager (MW)
"For these customers who are on a flexible contract the reconciliation is on an annual basis
which is very resource hungry" - Customer Experience Manager (VD)
Case D “For bespoke contracts, a lot more costs are involved in the billing process” - Service
Development Manager (MW)
“We need to be flexible to meet customer requirements versus the cost benefits to be
simplistic” - Service Development Manager (JT)
“Manual billing is driven by the requirements of the customer again, what I mean by that is if
you take T for instance because of the way in which we produce their invoices for them…the
timing and the service level agreements which they have given us and which we have to meet
we have to react in a certain way to meet those requirements so some of it is customer-driven
in that sense” – Service Development Manager (PB)
Table 8.29: Efficiency – ‘COST’ coding items
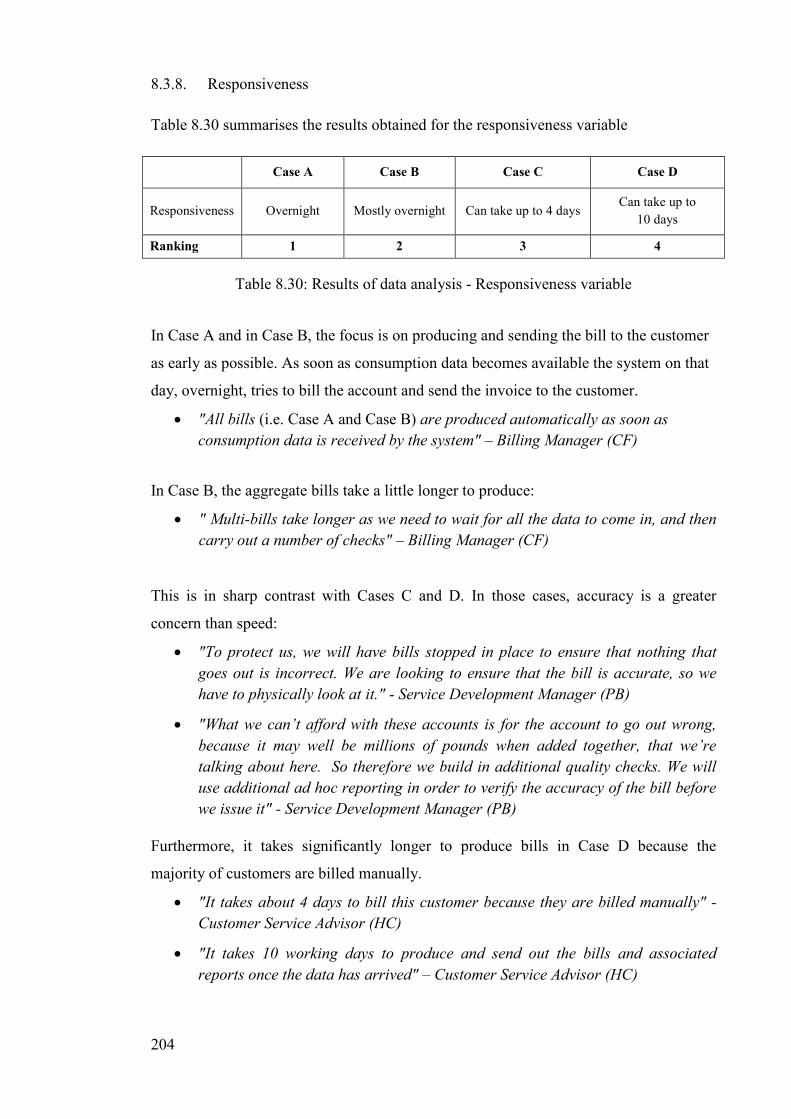
204
8.3.8. Responsiveness
Table 8.30 summarises the results obtained for the responsiveness variable
Case A Case B Case C Case D
Responsiveness Overnight Mostly overnight Can take up to 4 days Can take up to
10 days
Ranking 1 2 3 4
Table 8.30: Results of data analysis - Responsiveness variable
In Case A and in Case B, the focus is on producing and sending the bill to the customer
as early as possible. As soon as consumption data becomes available the system on that
day, overnight, tries to bill the account and send the invoice to the customer.
• "All bills (i.e. Case A and Case B) are produced automatically as soon as
consumption data is received by the system" – Billing Manager (CF)
In Case B, the aggregate bills take a little longer to produce:
• " Multi-bills take longer as we need to wait for all the data to come in, and then
carry out a number of checks" – Billing Manager (CF)
This is in sharp contrast with Cases C and D. In those cases, accuracy is a greater
concern than speed:
• "To protect us, we will have bills stopped in place to ensure that nothing that
goes out is incorrect. We are looking to ensure that the bill is accurate, so we
have to physically look at it." - Service Development Manager (PB)
• "What we can’t afford with these accounts is for the account to go out wrong,
because it may well be millions of pounds when added together, that we’re
talking about here. So therefore we build in additional quality checks. We will
use additional ad hoc reporting in order to verify the accuracy of the bill before
we issue it" - Service Development Manager (PB)
Furthermore, it takes significantly longer to produce bills in Case D because the
majority of customers are billed manually.
• "It takes about 4 days to bill this customer because they are billed manually" -
Customer Service Advisor (HC)
• "It takes 10 working days to produce and send out the bills and associated
reports once the data has arrived" – Customer Service Advisor (HC)
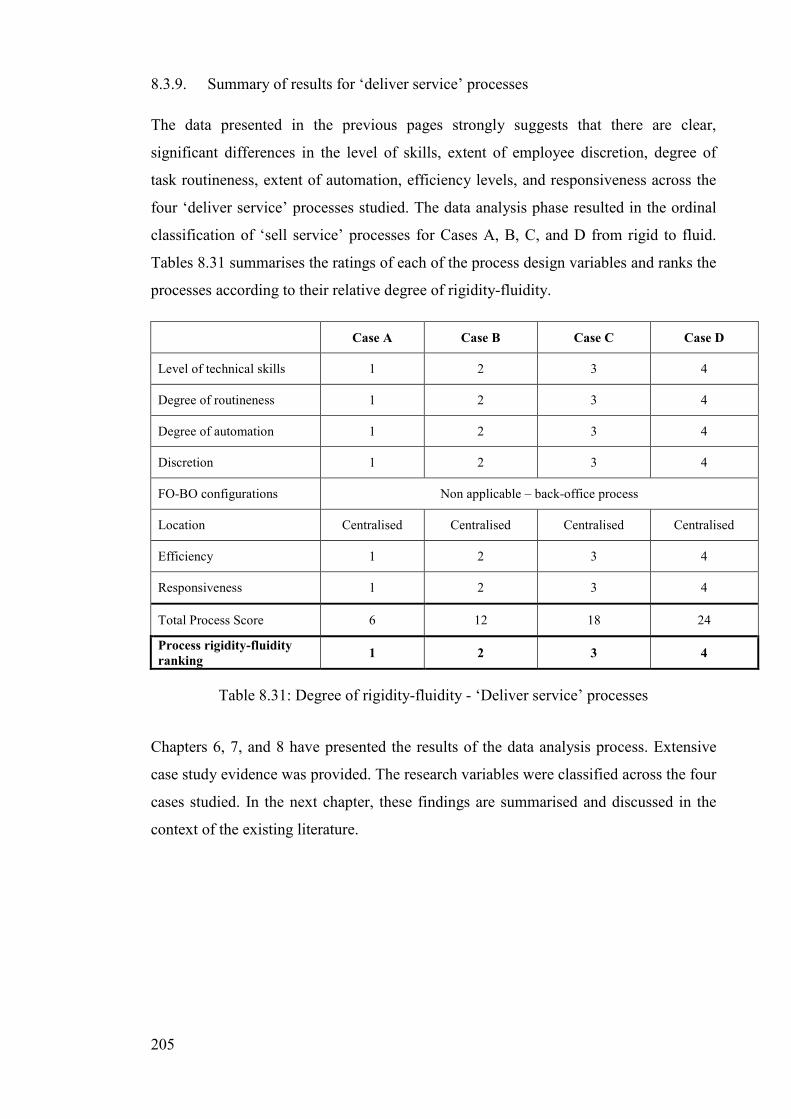
205
8.3.9. Summary of results for ‘deliver service’ processes
The data presented in the previous pages strongly suggests that there are clear,
significant differences in the level of skills, extent of employee discretion, degree of
task routineness, extent of automation, efficiency levels, and responsiveness across the
four ‘deliver service’ processes studied. The data analysis phase resulted in the ordinal
classification of ‘sell service’ processes for Cases A, B, C, and D from rigid to fluid.
Tables 8.31 summarises the ratings of each of the process design variables and ranks the
processes according to their relative degree of rigidity-fluidity.
Case A Case B Case C Case D
Level of technical skills 1 2 3 4
Degree of routineness 1 2 3 4
Degree of automation 1 2 3 4
Discretion 1 2 3 4
FO-BO configurations Non applicable – back-office process
Location Centralised Centralised Centralised Centralised
Efficiency 1 2 3 4
Responsiveness 1 2 3 4
Total Process Score 6 12 18 24
Process rigidity-fluidity
ranking 1 2 3 4
Table 8.31: Degree of rigidity-fluidity - ‘Deliver service’ processes
Chapters 6, 7, and 8 have presented the results of the data analysis process. Extensive
case study evidence was provided. The research variables were classified across the four
cases studied. In the next chapter, these findings are summarised and discussed in the
context of the existing literature.
206
CHAPTER 9
DISCUSSION
9.1. Introduction
This chapter summarises the results presented in the previous three data analysis
chapters and discusses these results in relation to the existing literature. First, the results
are presented in a condensed and meaningful way so that the major patterns emerging
from the data can be easily understood. Second, the research findings are discussed
within the context of the existing literature.
9.2. Summary of findings
9.2.1. The relationship between service concept, customer inputs, and process design
characteristics
Figure 9.1 summarises and presents the findings in graphical form. The processes
studied are placed on a rigidity-fluidity spectrum and ordered according to the degree of
customisation of their respective service concepts, and according to the variability and
quantity of customer information supplied. The visual pattern suggests that process
design characteristics are dependent on the service concept and on customer inputs. As
the degree of customisation of the service concept increases, and as the variability and
quantity of customer information supplied increases, the degree of fluidity of the service
process also increases. When customers value customisation (i.e. each customer wants a
personalised service concept), the actions for providing this service concept can not be
easily specified and flexible processes are necessary. For instance, contract managers
need to have enough freedom in managing their interactions with the customer and in
performing their jobs in order to develop an offering that conforms closely to the
requirements of the target customer. More generally, the greater the degree of
customisation required by the customer, the higher the level of skills, the higher the
level of employee discretion, the higher the costs, the lower the degree of task
routineness, the lower the level of automation, and the lower the responsiveness in the
service delivery process. As two managers succinctly expressed it:
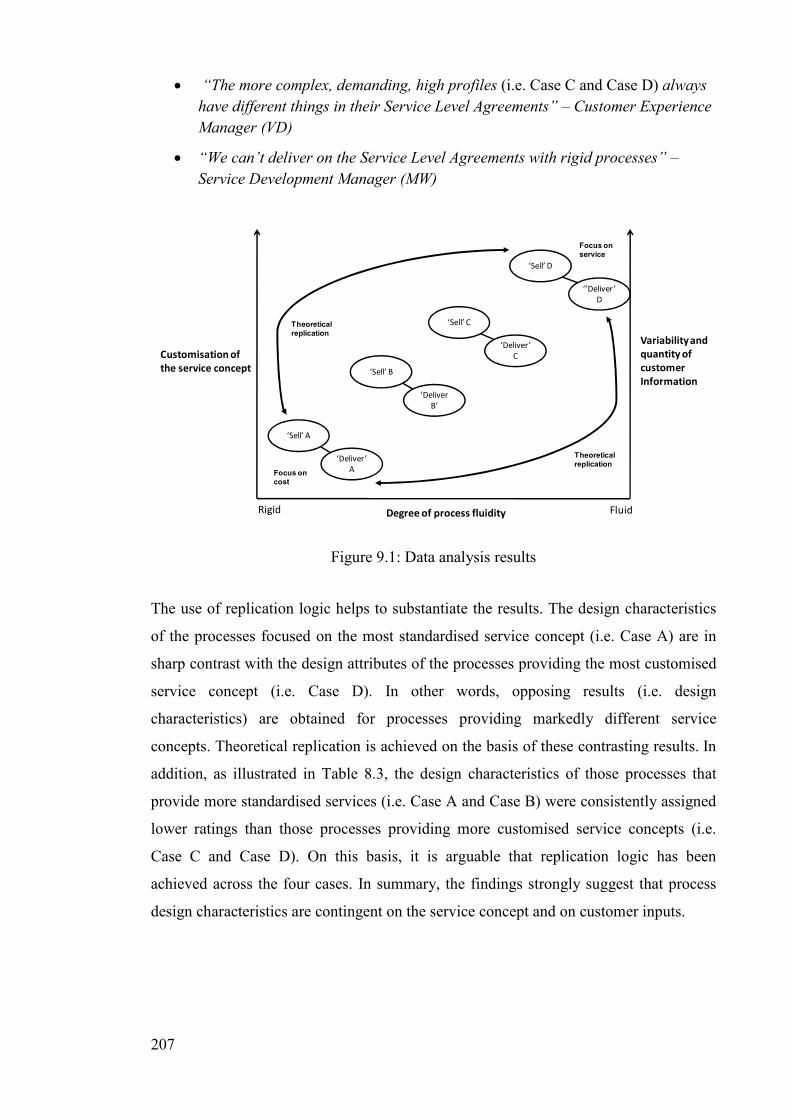
207
• “The more complex, demanding, high profiles (i.e. Case C and Case D) always
have different things in their Service Level Agreements” – Customer Experience
Manager (VD)
• “We can’t deliver on the Service Level Agreements with rigid processes” –
Service Development Manager (MW)
Rigid Fluid
Variability and
quantity of
customer
Information
Degree of process fluidity
‘Sell’ A
‘Sell’ B
‘Sell’ C
‘Sell’ D
Customisation of
the service concept
Theoretical
replication
‘Deliver’
A
‘Deliver
B’
‘Deliver’
C
‘’Deliver’
D
Focus on
cost
Focus on
service
Theoretical
replication
Figure 9.1: Data analysis results
The use of replication logic helps to substantiate the results. The design characteristics
of the processes focused on the most standardised service concept (i.e. Case A) are in
sharp contrast with the design attributes of the processes providing the most customised
service concept (i.e. Case D). In other words, opposing results (i.e. design
characteristics) are obtained for processes providing markedly different service
concepts. Theoretical replication is achieved on the basis of these contrasting results. In
addition, as illustrated in Table 8.3, the design characteristics of those processes that
provide more standardised services (i.e. Case A and Case B) were consistently assigned
lower ratings than those processes providing more customised service concepts (i.e.
Case C and Case D). On this basis, it is arguable that replication logic has been
achieved across the four cases. In summary, the findings strongly suggest that process
design characteristics are contingent on the service concept and on customer inputs.
208
9.2.2. Differences in the design characteristics of interrelated ‘sell service’ and
‘deliver service’ processes
This study emphasises that a ‘sell service’ process and a ‘deliver service’ process work
together to provide the service concept to the customer. Across the four cases studied,
the findings indicate that the design of the ‘sell service’ process and the design of the
corresponding ‘deliver service’ process are broadly aligned. For instance, it is apparent
from the visual pattern in Figure 9.1 that the ‘sell service’ process for service concept D
is more fluid than the ‘sell service’ processes for service concepts A, B, and C.
Similarly, the ‘deliver service’ process for service concept D is more fluid than the
‘deliver service’ processes for service concepts A, B, and C. In summary, the greater the
degree of customisation of the service concept, the more fluid the ‘sell service’ process
and the ‘deliver service’ process. Conversely, the greater the degree of standardisation
of the service concept, the more rigid the ‘sell service’ process and the corresponding
‘deliver service’ process.
The alignment of interrelated processes, focused on the same service concept, is
apparent when the multiple design variables studied are summarised and aggregated
into the generic “fluid” or “rigid” process descriptors, as illustrated in Figure 9.1.
However, this is not the complete picture. At a more granular level the specific design
characteristics of each of the individual processes that collectively provide a service
concept are significantly different. In this study, clear differences between ‘sell service’
processes and ‘deliver service’ processes were observed in the extent of employee
discretion, in the type of employee skills, in the extent of automation, and in the
location decision. These differences are discussed below.
First, regarding employee discretion, the general pattern is that the greater the
customisation of the service concept, the greater the level of employee discretion. In
addition to this general pattern, the results show that, in the customised cases (i.e. Case
C and Case D), employees in the ‘sell service’ process exercise discretion over both the
service offering and the service process, whereas employees in the ‘deliver service’
process have discretion over the process only. In the ‘sell service’ process contract
managers have considerable discretion over the configuration of the contract and over
how they execute the process. The Service Level Agreements (SLAs) are determined
and specified in the ‘sell service’ process. In the corresponding ‘deliver service’
process, employees do not have the freedom to change the service package being
209
delivered since the role of this process is to fulfil customer requirements based on the
SLAs. Nonetheless, the billing manager and the service development manager have
great latitude in deciding how tasks are accomplished and how the process operates to
achieve the service levels required by the customer. This suggests that, in the case of
customised service concepts, employee discretion is higher in the ‘sell service’ process
than in the corresponding ‘deliver service’ process.
Second, regarding the type of employee skills, the results indicate that the four ‘sell
service’ processes require both interpersonal and technical skills. In comparison, the
‘deliver service’ processes require technical skills only. This may be explained by the
different types of customer inputs supplied to these processes. The presence of
customer-self inputs (i.e. customer presence) was observed in all four ‘sell service’
processes while ‘deliver service’ processes receive customer information inputs only.
This suggests that employee interpersonal skills are higher in the ‘sell service’ process
than in the corresponding ‘deliver service’ process.
Third, regarding automation, the general pattern is that the greater the customisation, the
lower the degree of automation. In addition to this general pattern, the results show that,
in the four cases, the degree of automation is higher in the ‘deliver service’ process than
in the corresponding ‘sell service’ process. The commonality between the four ‘sell
service’ processes is that there is not a single activity that is entirely performed by a
system alone. In the standardised cases, the ‘sell service’ processes have a human
interface to handle customer queries (i.e. Case A), as well as to discuss the service being
offered with the customer and to gather customer requirements (i.e. Case B). Human
intervention is also needed to process the supply request through the sales IT systems.
In contrast, the ‘deliver service’ processes for standardised offerings are highly
automated. In the customised cases, three elements show that automating the ‘sell
service’ process is difficult. First, contract managers co-develop the service package and
maintain a close relationship with the customer. Second, the pricing of “flexible” offers
is not supported by the IT system. Third, data transfers between IT systems require a
significant amount of manual intervention before and after the transfers take place. In
comparison, in the ‘deliver service’ processes the execution of billing tasks is relatively
automated although a significant manual work is required for effectiveness and risk
mitigation. To summarise, in the ‘sell service’ processes most activities are performed
by employees and assisted through technology. In the ‘deliver service’ processes, most
billing activities are performed entirely by the IT system alone. This suggest that a
210
greater potential for automation exists in ‘deliver service’ processes than in ‘sell
service’ processes.
Fourth, regarding the location decision, the findings show that different processes
operate in different geographical locations. Specifically, in the case of customised
service concepts, the ‘sell service’ processes and ‘deliver service’ processes were
geographically dispersed. This is due to the type of customer inputs supplied to these
processes. The presence of physical customer-self inputs requires locating the ‘sell
service’ process, or some parts of it, near the customer in order to manage the customer
interface.
9.3. Discussion
First, the findings relating to the alignment of service design elements are discussed.
Second, the design characteristics of ‘sell service’ processes and ‘deliver service’
processes are discussed in detail. Third, the results are compared to the process design
principles advocated in the BPM literature.
9.3.1. Aligning service concept and customer inputs with process design
The research framework integrates conceptual models of service design (e.g. Roth and
Menor, 2003b; Sampson and Froehle, 2006; Wemmerloev, 1990). The service strategy
triad (Roth and Menor, 2003b) and the strategic service vision (Heskett, 1987) suggest a
linear relationship between the specifications of the service concept and the design
characteristics of the service delivery system. Specifically, these models highlight the
importance for organisations to align the service concept with the service delivery
system in order to achieve enhanced competitiveness in the marketplace. The literature
has broadly discussed the role of strategic service alignment but limited empirical
research has been conducted to date (e.g. Silvestro and Silvestro, 2001). Consistent with
the call for empirical research integrating concepts from both the marketing field (i.e.
service concept) and the operations field (i.e. service delivery system) (Cook et al.,
1999), this research provides empirical evidence that supports the conceptual models of
strategic service alignment. While theoretical models in the SOM literature emphasise
the relationship between the service concept and service delivery system design choices,
211
this research advocates a requirement for aligning the service concept with the design
characteristics of the ‘operate’ processes.
Moreover, this study departs from macro-oriented service classification schemes by
focusing on the individual ‘operate’ processes that compose the service delivery system.
By employing a lower level of granularity, the research has shown that the service
delivery system of a large organisation is heterogeneous since it operates different
processes focused on different service concepts. The findings strongly suggest that
different service concepts require different process designs. Similarity was observed
between this research and the work of Hall and Johnson (2009). The case organisation
employs a rigid ‘sell service’ process for low-risk, low-reward sales efforts (i.e. Case A)
and a flexible process for high-risk, high-reward sales efforts (i.e. Case D). These
processes are distinct and require different designs because they support the realisation
of different service concepts. This research, therefore, concurs with Hall and Johnson
(2009) who assert that integrating or merging such processes would be
counterproductive. It may be argued that attempting to compete on multiple service
concepts with a system-wide design would constrain performance. A major implication
for service design is that analysing design characteristics at the level of the process is
more appropriate than at the macro level. Such an approach makes it possible to identify
similarities and differences in the design of the service delivery processes of an
organisation. Therefore, this research advocates a requirement for aligning the service
concepts with the design of the associated ‘operate’ processes that comprise the service
delivery system.
The research framework also incorporates principles of the Unified Services Theory
(Sampson and Froehle, 2006) to address service process design. The literature suggests
that the degree of customisation of the service concept should be aligned to the level of
variability in customer requirements. In the words of Sampson and Froehle (2006,
p.336): “customisation only occurs as a response to comply with unique customer
inputs”. Similarly, Larsson and Bowen (1989, p.218) state that “customization-
standardization can be seen as the designed diversity of service supply that can be
matched to the diversity of demand”. The concepts of service concept and of customer
request variability are interrelated but clearly distinct. The empirical results confirm that
there must be alignment between the service concept and customer requirements for
service delivery to take place. In discussions with some very large customers, the
organisation realised that its existing service concepts were insufficient in meeting the
212
needs of these customers. It was decided that a “bespoke” service concept was required
to address these unique requirements. In other words, the organisation realised that what
it offered was misaligned with what customers wanted. Further, the findings provide
empirical support for the conceptual works of Sampson and Froehle (2006) and
Buzacott (2000) who suggest a relationship between variability in customer inputs and
process design characteristics. The results show that the greater the variability in
customer requirements, the greater the degree of fluidity in the service delivery process.
This research finding also resonates with several empirical studies which empirically
demonstrate that uncertainty in customer-provided inputs leads to complexity in the
service delivery system (Argote, 1982; Jones, 1987; Skaggs and Huffman, 2003).
Moreover, the literature suggests that service processes receive and process different
volumes of customer information (Wathen and Anderson, 1995). Wemmerloev (1990)
posits that customised service concepts are associated with a higher amount of customer
information than standardised service concepts. Similarly, empirical evidence in the
context of financial services shows that customised service offerings require a
significant exchange of information between the customer and the service provider
about service specifications (Zomerdijk and de Vries, 2007). The research findings are
consistent with these views. Customers with unique needs actively participate in the
process of defining the specifications of the service offering. Creating a bespoke service
requires the customer to detail their individual requirements and involves lengthy
negotiations. Therefore, the quantity of information exchanged between the customer
and the service employee to specify the exact nature of the desired service is fairly
large. Contrary, customers having similar needs can select the options and components
of the offering from a pre-determined list. As postulated by Kellogg and Nie (1995), in
the case of standardised offerings, the volume of information provided by the customer
is restricted by the limited number of options available. For instance, in Case A, the
amount of customer-supplied information is specified on an application form that
precisely details the data fields to be filled out. By having the customer complete a
standardised application form the organisation leaves little room for the provision of
additional information items. This limits both the quantity of information and the
variability in information that the customer may supply to the service process.
213
Finally, the findings relating to the variability in arrival rate of customer inputs are
worth discussing. Analysis of demand patterns has shown that there is some variability
in customer arrival rate in the ‘sell service’ processes. Despite this variability, it was
argued that these patterns are predictable and expected by the organisation. The
“variability in arrival rate” variable does not capture the predictability of the arrival of
customer inputs. This research suggests that the concept of workflow uncertainty
proposed by Mills and Moberg (1982) is a useful conceptualisation of the issues
associated with customer input arrival rate. These authors define workflow uncertainty
as “the lack of predictability of client arrival, service, and exit patterns over time”
(p.472). Similarly, Tummers et al. (2002) interpret workflow uncertainty as the level of
awareness about when customer inputs will arrive. These views describe the uncertainty
associated with the arrival of customers and are closely related to the concept of demand
uncertainty (Germain et al., 2001). It may be suggested, therefore, that both the
“variability in arrival rate” construct and the “uncertainty in arrival rate” construct
should be consider in future research on service process design.
9.3.2. Process design characteristics
9.3.2.1. Design characteristics of the ‘sell service’ processes
Task routineness
Tasks in the processes selling standardised offerings are precisely specified and well-
defined. These processes are highly routinized and follow relatively fixed process steps
executed in a sequential fashion. This finding resonates with Kellogg and Nie (1995)
who argue that processes for standard service packages are characterised by the
repetitive nature of their tasks. For instance, in Case B, employees complete simple and
standard operations such as handling the initial customer contact, producing quotations,
and conducting negotiations. Although these activities may be executed following a
different sequence, the type of activities performed does not vary great deal.
In comparison, customised service concepts require processes to handle a variety of
requirements across the customer base. As suggested by Wemmerloev (1990), this
creates more diversity in the tasks to execute. Customer requirements for energy
efficiency and specific purchasing strategies, for example, demand specific responses
and constantly change the type of tasks performed in the process. This is also consistent
214
with Buzacott (2000) who argues that higher input variability requires the process to be
less routinised and to have increased exception handling capability. In addition, process
tasks do not follow a fixed sequence and comprise a set of feedback loops. For instance,
offers are regularly re-quoted to reflect changes in the customer’s site portfolio or to
adapt to market movements. This triggers new negotiations on an ongoing basis over
contract’s life.
Automation
In the four ‘sell service’ processes studied, most activities are performed by employees
and assisted trough systems. Importantly, no activity is performed entirely by a system
alone.
As suggested by several authors (Kellogg and Nie, 1995; Wemmerloev, 1990), the
limited variability in customer requests and the repeatability of the tasks make the
processes selling standardised offerings more suited for automation than the processes
selling customised services. This resonates with Apte and Vepsaelaeinen (1993) who
argue that standardised services are best sold through technology-centred processes.
While all four processes studied use the same pricing system to generate quotations, the
system is unable to cope with the complex pricing structure of customised service
concepts. Some pricing tasks have to be performed manually. For instance, sales
employees develop and use off-system tools such as spreadsheets to calculate “flexible
baskets” comprising several supply points with different energy requirements (i.e. Cases
C and D). This provides support for the view that it is often difficult to find automated
systems capable of handling highly customised offerings (Buzacott, 2000; Sampson and
Froehle, 2006).
Furthermore, in Case A and in Case B, although the implementation of an online
application form aims to automate the customer interface, other activities in the process
necessitate the involvement of employees supported by technology. For instance, in
Case B, employees are required to gather customer requirements, to help the customer
select the most appropriate options, and to conduct the negotiation. For the more
customised offerings, the role of contract managers is essential in advising the customer
on the configuration of the service contract. The opportunity for automation is reduced
further because it is important to deal with the unique specificities of each customer. A
described by Silvestro (1999), developing a close relationship with the customer
215
requires the expertise and knowledge of people. The findings provide empirical support
for the view that automating processes selling customised offerings can be difficult
because employees often have to make complex decisions (Napoleon and Gaimon,
2004).
Finally, systems integration involves the connection of separate IT systems (Markus,
2001). The research findings show that the more complex contracts are more likely to
fail the interface between the different IT systems. Ensuring error-free data transfers is
an important driver of manual work. As the quantity of information supplied by the
customer (i.e. characterised by the size of the customer portfolio) increases, a greater
proportion of manual intervention, aimed at preventing interface failures, occurs.
In summary, the findings suggest that as the degree of customisation of the service
concept increases, the opportunity for substituting technology for people decreases. This
is consistent with the work of Huete and Roth (1988) who found that as the complexity
of service offerings increases, the potential for automation diminishes. Similarly, Apte
and Vepsaelaeinen (1993) argue that a human-centred process is often required to sell
customised service offerings.
Employee skills
Processes for standardised service concepts require a relatively limited degree of
technical and interpersonal skills. In Case A, for instance, since over 14,000 customers
have the same contract, the service concept may be regarded as homogeneous. As a
result of this, employees require basic technical skills to perform routine activities. The
results are consistent with Napoleon and Gaimon (2004) who posit that employees
dealing with standardised services usually occupy entry level positions in an
organisation’s job family structure. Similarly, support was found for the conceptual
work of Wemmerloev (1990) who states that when the range of tasks in the process is
narrow, and activities are mostly routine, the technical skill level is likely to be
relatively low. In addition, opportunities for interaction are limited since telephone-
based service encounters to discuss the offering focus on speedy resolution. As
suggested by Kellogg and Nie (1995), in such situations, relatively basic
communication skills are needed.
216
The greater the degree of customisation of the service concept, the more the employees
fit the description of the “professional service” type (Kellogg and Nie, 1995;
Schmenner, 1986; Silvestro, 1999). As suggested by Silvestro (1999), contract
managers are highly qualified people with valuable technical and interpersonal skills.
Advanced technical skills, such as a thorough understanding of both the market and
industry, enable these employees to address sophisticated customer requirements.
Contract managers face challenging problems such as helping customers to be more
energy efficient as well as negotiating complex deals to supply a large portfolio of sites
with electricity. This is in line with the definition of “knowledge workers” who are
often found in fluid processes (Wemmerloev, 1990). The findings are also consistent
with Kellogg and Nie’s (1995) conceptual framework which suggests that staff selling
customised offerings require a highly specialised knowledge typically acquired through
years of education and work experience. For instance, contract managers selling flexible
or bespoke services are required to be "graduate or equivalent with 5+ or 7+ years
relevant commercial experience".
In addition, contract managers have regular face-to-face meetings with customers to
create the offering as well as to develop new services. Specific employees are
responsible for individual customer accounts and possess excellent communication
skills. This allows them to develop a personal understanding of customer requirements.
These findings are consistent with the works of several authors (Chase and Tansik,
1983; Kellogg and Nie, 1995; Silvestro, 1999). In contrast, sales support staff only
require technical skills as they perform relatively complex activities but are rarely in
direct contact with the customer.
Employee discretion
Because customer requirements are essentially homogeneous and the specifications of
the service offering are pre-determined, there is little room for employee discretion in
the processes selling standardised services. In Case B, for instance, staff can only offer
the limited set of options that is available to them in the sales IT system. This is
consistent with the view of Napoleon and Gaimon (2004) who note that decisions are
likely to be automated in such processes. Similarly, Kelley et al. (1996) argue that
standardised service offerings are typically sold through processes characterised by
“routine discretion”. In addition, the strict application of policies reduces the
employee’s ability to change the service offered and the manner in which tasks are
217
performed. This is in line with Schmenner (1986) who argues that standard operating
procedures often dictate the way in which the work is accomplished. Similarly, Tansik
(1990) states that in such situations the degree to which employees comply with
procedures and policies is tightly controlled through the use of regular audits.
In contrast, highly skilled contract managers are heavily involved in the creation of
tailor-made service packages. They exercise a high degree of discretion over both the
specifications of the offering and over how they perform their job. They require a high
degree of freedom to perform complex tasks, to handle the service encounter, and to
assess whether the organisation is capable of providing a unique, “never been asked
before” service. This is consistent with Silvestro’s (1999) description of professional
services since in this situation professional judgment replaces routine procedures.
Similarly, Buzacott (2000) argues that because of the unpredictability in requested
services, employees need some decision-making authority to evaluate whether the
service can actually be delivered. As suggested by Wemmerloev (1990), this authority
is delegated to the employee. This lends support to the theoretical relationship between
skill level and discretion postulated by Napoleon and Gaimon (2004). The findings are
also consistent with the view of Bowen and Layler (1992) who state that empowering
employees is likely to be effective in situations where developing close customer
relationships is essential.
Location
In the case of the more standardised service concepts, processes are located in a central
service facility. Simple and relatively homogeneous customer requirements are dealt
with through emails and over the telephone. Because customers provide “virtual self-
inputs” only (e.g. telephone conversations) (Sampson and Froehle, 2006), these
processes can be located in a centralised, remote location. Regarding customised
offerings, the processes are located in a distributed service facility close to the customer
base. The sophistication of customer requirements and the need for a personalised
relationship call for frequent face-to-face encounters. The presence of “physical
customer-self inputs” requires the process to be situated nearer the customer. In
summary, the findings are congruent with the Unified Services Theory (Sampson and
Froehle, 2006) which states that the decision about where to locate the service process is
closely related to the presence or absence of customer-self inputs.
218
Front office (FO) – back office (BO) configurations
The process selling the most standardised service offering (i.e. Case A) is highly
coupled. All of the employees involved in the process execute the same activities which
include both customer contact and non-customer contact tasks. Additionally, in Case B,
FO and BO activities are also coupled. These findings seem inconsistent with traditional
SOM theory which argues that contact and non-contact jobs should be allocated to
different employees (Chase and Tansik, 1983). The reason for this inconsistency
appears to be that tasks are kept coupled to maximise the productivity of staff through
task switching enabling idle time reduction. This leads to a better utilisation of capacity
and a tighter control of costs, as suggested by Zomerdijk and Vries (2007). These
configurations are similar to the “kiosk” type described by Metters and Vargas (2000).
Evidence also suggests that, in Case B, an activity deviates from the general coupled
configuration. In some instances, the contract manager and sales support staff require
specialist skills for the production of quotes. This is consistent with the work of Metters
and Vargas (2000) which found that complex work can be decoupled and centralised
within a predominantly coupled process.
Finally, finding this type of configuration in a large organisation contradicts Metters and
Vargas (2000) who associate “kiosks” with small service systems. The reason for this
inconsistency appears to be that these authors argue that coupling activities is more
beneficial to small service facilities than to large facilities. Drawing on queuing theory
they explicate that smaller service facilities suffer from idle time problems more than
large service facilities. Unpredictable demand patterns require several small service
systems to have more employees to serve the same average number of customers than a
single large facility. Metters and Vargas contend that large front offices can pool the
variance of customer arrival and, therefore, require fewer employees. This, however,
does not mean that large service facilities can not benefit from coupling. Although
having enough customer contact staff was less of an issue since customer arrival rate
was fairly predictable, the benefits associated with coupling activities (i.e. keep costs
low by maximising employee utilisation) were still obtained.
In contrast, the processes for customised services (i.e. Cases C and D) are decoupled.
FO and BO activities are allocated to different employees to take advantage of their
expertise. Sales support staff perform all the non-contact work, such as producing
quotes, defining prices, and setting up contracts. This enables contract managers to
219
focus on visiting existing customers, approaching new customers, and working out
complex cases. These processes exhibit characteristics of the “focused professional”
type (Metters and Vargas, 2000) as non-contact work is decoupled “with a primary goal
to support the front office, rather than cost control” (p.675). In addition, support is
found for the idea that the design of the interface between front office employees (i.e.
contract manager) and back office employees (i.e. sales support staff) is important in
these situations. The data suggests that individual, dedicated back office workers are
assigned to each front office employee. In other words, small sales teams consisting of
the pair “contract manager – sales support employee” are constituted to deal with
specific customers. This finding is consistent with the work of Zomerdijk and de Vries
(2007) who show that decoupled ‘sell service’ processes for customised service
concepts establish sales teams to facilitate coordination and the handover of work. Such
close links contribute to enhancing flexibility and customer service (Metters and
Vargas, 2000).
Operational focus
Overall, well-defined rigid processes are significantly more efficient and more
responsive than fluid processes. The research findings are consistent with the conceptual
model of Kellogg and Nie (1995) which suggests that the greater the degree of
customisation of the service concept, the less efficient and the less responsive the
process is. Zomerdijk and de Vries (2007) find that ‘sell service’ processes for
standardised service offerings can be largely coupled to ensure high responsiveness
levels. In the research presented here, responsiveness is high because personnel can
perform all the tasks in the process and switch between tasks.
As postulated by Napoleon and Gaimon (2004), processes for customised services are
less concerned with productivity and efficiency gains since individual customers are
personally managed by dedicated contract managers, and since the processes incur a
higher degree of manual work. In addition, establishing complex tailor-made contracts
is substantially more time-consuming than producing standard ones.
220
9.3.2.2. Design characteristics of the ‘deliver service’ processes
Task routineness
The processes delivering standardised services resemble the “service factory” or “mass
service” types discussed in several service typologies (Kellogg and Nie, 1995;
Schmenner, 1986; Silvestro, 1989), as they execute routine and highly-repetitive billing
tasks in the same fixed sequence.
As postulated by Buzacott (2000), processes for delivering customised services have to
handle a variety of both automated and manual tasks. The manual work is relatively
varied as it involves solving billing errors, processing prices manually, reconciling
billing accounts, generating and checking aggregate bills, as well as creating and
verifying billing reports. Most of the tasks performed are dependent on individualised
customer requirements. For instance, billing reports, bill due dates, and billing cycles
often vary from customer to customer. Similarly, the process steps for manually
producing bills and reports usually differ from customer to customer. Requirements also
change during the life of the contract which forces the process to be adapted. This is
consistent with Wemmerloev’s (1990) definition of fluid processes.
Automation
Processes for standardised service offerings are highly automated. Automating the
execution of activities is a well-accepted design principle in mass-manufacturing
operations and in “service factories” (Loch, 1998) as well as in processes devoid of
customer contact (Chase and Tansik, 1983). In Case A and in Case B, 100% and 90% of
bills respectively, are produced and delivered automatically. In Case A, manual work is
limited to solving errors identified by the billing system. Additionally, in Case B, some
large bills have to be manually verified before being sent to the customer. These
findings are consistent with a production-line approach which states that in these
contexts technology should substitute for people (Bowen and Youngdhal, 1998).
Having a technology-centred delivery process is possible because information is the
only customer input supplied (Sampson and Froehle, 2006) and because of the
repetitiveness of the tasks (Wemmerloev, 1990).
In comparison, in the customised cases, while many bills are produced automatically
through the system (i.e. 89% and 43%, in Case C and in Case D, respectively), these
221
incur additional manual work such as checking the accuracy of the bill, creating reports,
and reconciling accounts. The organisation is unable to rely solely on the billing IT
system for performing these activities. For instance, a significant amount of manual
checks are required to ensure that the agreed service levels are met. The level of
customisation of the service offered, and the level of variability in customer
requirements, make it difficult to find technology that is sufficiently flexible (Buzacott,
2000; Sampson and Froehle, 2006; Wemmerloev, 1990).
Employee skills
Because standardised service concepts are fulfilled through a highly automated process,
employees (i.e. CSAs) are required to have a basic level of skill. Consistent with the
traditional description of service factories and of low customer contact service
operations, basic technical skills are required to analyse and resolve errors generated by
the billing system. These advisors are similar to Wemmerloev’s (1990) definition of
“service workers” who “spend all their working hours in front of a computer screen”
(p.34).
In processes for customised service concepts, CSAs carry out straightforward, well-
defined bill production activities, such as verifying prices and consumption data as well
as reconciling accounts. They fit the description of “service workers” introduced above.
These tasks require a basic level of technical skills such as computer skills and an
attention to detail. In contrast, the billing manager performs more challenging tasks
such as completing billing reports, verifying complex bills, and resolving intricate
billing errors. This requires extensive experience and knowledge in technical billing
issues. In addition to CSAs and to the billing manager, several service development
managers are required for the billing and for the management of individual customer
accounts. These employees possess advanced analytical skills as they have to determine
how the process can best deliver on customer-specific service level agreements. In
summary, a wide range of technical skills is observed in ‘deliver service’ processes for
customised service concepts.
222
Employee discretion
In processes delivering standardised services, CSAs have a limited amount of discretion
in undertaking their job. The need for employees with decision-making authority is
eliminated through the use of a mechanised process which automates routine decisions.
Employees exercise virtually no discretion over either the offering or the process, as
postulated in the description of the “service factory”. This is also consistent with
Napoleon and Gaimon (2004) who argue that most decisions can be automated in
processes for standardised services.
In the case of customised services, while no employee can modify the service package
delivered to the customer, both the billing manager and the service development
manager have complete freedom to decide how the process should operate to achieve
the performance levels specified in the SLAs. This finding is in accord with
Wemmerloev (1990) who notes that when work activities in the process vary, the
expertise and flexibility of service workers as well as their ability to make decisions are
very important. As suggested by Schmenner (1986), in these situations, it is difficult to
apply standardised procedures because there is no pre-determined process for
performing against the outcomes detailed in the SLAs.
Overall, the findings support Wemmerloev’s (1990) claim that rigid processes exhibit a
lower level of skills and a lower level of employee discretion than fluid processes. The
results also extend his work by showing that, in the customised cases, employees in the
‘sell service’ process have decision-making authority over both the service package and
the service process. In contrast, employees in the corresponding ‘deliver service’
process can exercise discretion over the service process only. Furthermore, while the
SOM literature usually associates discretion with "front-office employees" or "customer
contact personnel" (Lovelock, 1983; Silvestro, 1999), the findings are inconsistent with
this claim. The research adds to existing knowledge by providing evidence that non-
customer contact personnel (i.e. the billing manager) may enjoy considerable latitude in
deciding how the process operates.
Location
The four ‘deliver service’ processes are situated in the same service facility in a
centralised location remote from the customer. Customer information is the sole
223
customer input supplied to these processes (see process models in Section 6.3). The lack
of customer physical presence (i.e. customer-self inputs) in the process removes the
need for locating the service facility close to the customer (Sampson and Froehle,
2006).
It has been suggested in the literature that the absence of the customer-self in the
delivery of the core service activity is the defining characteristic of “separable” services
(Lovelock and Gummesson, 2004) and an important difference between Customer
Processing Operations and Information Processing Operations (Morris and Johnston,
1988). In the research, the ‘deliver service’ processes are concerned with the production
of the core service activity (i.e. the production of bills). The findings provide empirical
evidence that the concept of “separability” also applies at the process level. Therefore, it
may be argued that a “separable” service delivery system is characterised by an absence
of customer-self inputs in the ‘deliver service’ process.
FO – BO configurations
The four ‘deliver service’ processes can be classified as “back-office” processes as they
are devoid of customer contact (Chase and Tansik, 1983) or of customer-self inputs
(Sampson and Froehle, 2006). As argued above, this confirms the postulate that
information-intensive services may be seen as “separable” services since the customer-
self does not participate in the production of the core service activity.
Operational focus
The research findings in the ‘deliver service’ processes match the findings in the ‘sell
service’ processes in that the greater the degree of customisation of the service concept,
the higher the costs incurred. As mentioned earlier, processes focused on standardised
offerings resemble “service factories” or “mass services”. Karmarkar (1995) noted that
in such contexts service processes typically focus on efficiency and cost reduction.
From an operations strategy perspective, Kellogg and Nie (1995) argue that service
factories often pursue a cost leadership strategy. This is because standardised service
offerings do not command premium prices (Safizadeh et al., 2003). The findings are
consistent with this stream of literature.
224
Moreover, as mentioned above, the findings show that there is no customer contact (i.e.
no customer-self inputs) in all four billing processes observed. These processes can be
referred to as back-office, quasi-manufacturing processes (Chase and Tansik, 1983).
However, the importance of efficiency is not consistent in all four processes. Data
analysis shows that ‘deliver’ processes for standardised service concepts achieve higher
efficiency. This is because the organisation is able to advantage of the uniformity and
rigidity of the billing activities to fully automate these processes. In contrast, ‘deliver
service’ processes for the more customised offerings do not manifest such
characteristics. Significantly more fluid processes are necessary to deliver on complex
and individualised service level agreements. Although these processes are isolated from
customer-self inputs, the variety of tasks in the processes significantly reduces the
opportunity for automation. A great deal of manual work is required to achieve the
performance levels specified in the SLAs, and manual work is a major cost driver. For
instance, many checks and verifications take place in the process of producing complex,
individualised bills and reports. This is necessary to mitigate the risk of errors. Against
this background, achieving the same efficiency levels as an automated process is simply
not possible. Rather, the focus is on meeting sophisticated, sometimes unique, customer
requirements. As a billing manager succinctly expressed it: “we cannot deliver on the
service level agreements with rigid processes”. In other words, it is necessary to allow
sufficient flexibility in the process to perform against the outcomes detailed in the
SLAs.
This is a major finding which contradicts the widely-accepted view that processes
devoid of customer contact can be designed for efficiency using mass manufacturing
design principles (Bowen and Youngdahl, 1998; Collier and Meyer, 1998; Mc
Laughlin, 1991) since “the presence of the customer is the dominant constraint on the
efficiency of the process” (Chase, 1981). The arguments presented above strongly
suggest that low-contact processes delivering customised services do not exhibit the
characteristics of a “service factory”. This study provides empirical evidence that low-
contact processes for customised service concepts are less efficient than low-contact
processes for standardised service concepts. It may be argued, therefore, that the extent
of customisation of the service concept can explain the differences in the design of low-
contact processes. This proposition refines existing, traditional SOM theory which
states that most low-contact processes are designed for efficiency, as reported by Verma
and Young (2000). In addition, whilst Sampson and Froehle (2006) suggest that
225
“variability in customer inputs is the enemy of efficiency”, they do not provide
empirical evidence for their claim. The empirical evidence presented here strongly
suggests that the variability in customer requirements (i.e. personalised service level
agreements) affects the efficiency of the ‘deliver service’ processes which set out to
achieve the agreed service levels.
To summarise, it may be argued, therefore, that the design characteristics of low-contact
‘deliver service’ processes in an information-intensive service system are contingent on
the degree of customisation of the service concept and on the variability of customer
information inputs supplied.
9.3.3. Principles of business process design
Typically, the principles of business process design found in the BPM literature were
derived from best practices of world-class organisations (Loch, 1998). Reijers and
Liman Mansar (2005) conducted an extensive review of the BPM literature and
identified 29 best practices in the process design area. These best practices are thought
to have a wide applicability across various industries. According to this logic any
organisation can apply a generic set of design principles to any business process in
order to enhance operational performance. In the words of the authors: “the presented
best practices are universal in the sense that they are applicable within the context of
any business process, regardless of the product or service delivered” (Reijers and Liman
Mansar, 2005, p.295). Process design principles described in the BPM literature include
automating tasks, empowering employees, reducing customer contact, and assigning
single customer requests to employees. These principles were selected because they are
closely related to some of the central issues of this thesis (see Table 9.1). They are
discussed in relation to the findings presented in this work.
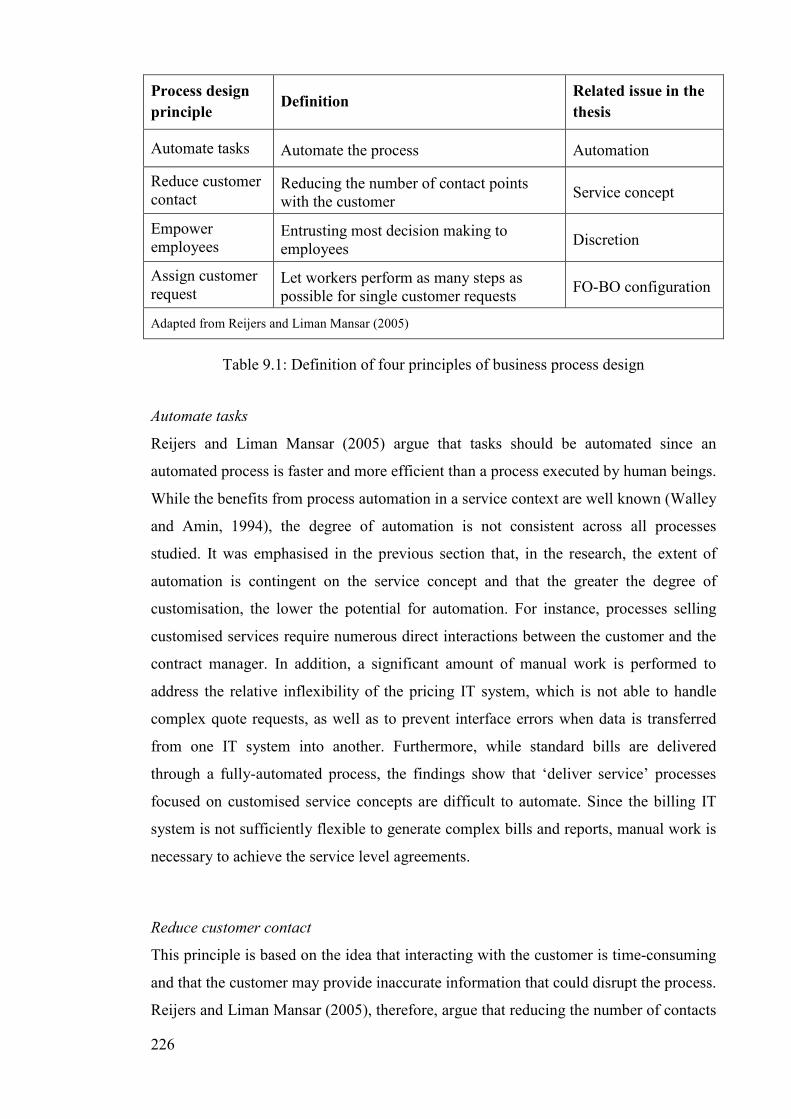
226
Process design
principle Definition
Related issue in the
thesis
Automate tasks Automate the process Automation
Reduce customer contact
Reducing the number of contact points with the customer
Service concept
Empower employees
Entrusting most decision making to employees
Discretion
Assign customer request
Let workers perform as many steps as possible for single customer requests
FO-BO configuration
Adapted from Reijers and Liman Mansar (2005)
Table 9.1: Definition of four principles of business process design
Automate tasks
Reijers and Liman Mansar (2005) argue that tasks should be automated since an
automated process is faster and more efficient than a process executed by human beings.
While the benefits from process automation in a service context are well known (Walley
and Amin, 1994), the degree of automation is not consistent across all processes
studied. It was emphasised in the previous section that, in the research, the extent of
automation is contingent on the service concept and that the greater the degree of
customisation, the lower the potential for automation. For instance, processes selling
customised services require numerous direct interactions between the customer and the
contract manager. In addition, a significant amount of manual work is performed to
address the relative inflexibility of the pricing IT system, which is not able to handle
complex quote requests, as well as to prevent interface errors when data is transferred
from one IT system into another. Furthermore, while standard bills are delivered
through a fully-automated process, the findings show that ‘deliver service’ processes
focused on customised service concepts are difficult to automate. Since the billing IT
system is not sufficiently flexible to generate complex bills and reports, manual work is
necessary to achieve the service level agreements.
Reduce customer contact
This principle is based on the idea that interacting with the customer is time-consuming
and that the customer may provide inaccurate information that could disrupt the process.
Reijers and Liman Mansar (2005), therefore, argue that reducing the number of contacts
227
can lead to faster process execution and improved quality. This principle contrasts with
the findings of this research. It was shown that providing a customised service concept
involves developing a close, personalised relationship with the customer. In this
instance, frequent encounters take place between the contract manager and the customer
to co-develop the service package and to define the service level agreements as well as
to discuss new customer requirements. It may be argued that reducing the opportunities
for information-exchanges between the customer and the contract manager would make
it more difficult for the customer to precisely detail and communicate their
requirements. Similarly, it would hardly allow the contract manager to gather the
information needed to offer a service package that meets customer requirements.
Empower employees
The rationale for this principle is that managers often spend time on verifying and
authorising the work of employees. Decision-making authority should be transferred to
the employee to increase the speed of process execution and to lower labour costs
(Reijers and Liman Mansar, 2005). The findings of this research, however, are
inconsistent with the view that employees should be empowered in all circumstances.
The empirical evidence presented in this work indicates that employees involved in
selling and delivering standardised service concepts are given a very limited amount of
discretion in undertaking their job. For instance, in the ‘deliver service’ processes for
standardised services the need for employees with decision-making authority is
eliminated through the use of a mechanised process which automates routine decisions.
In contrast, contract managers selling customised services benefit from substantial
freedom in their work. This allows them to address complex and unique customer
requirements.
Assign customer request
This principle prescribes to let workers perform as many steps as possible for single
customer requests (Reijers and Liman Mansar, 2005). It is directly related to the design
decision to couple or decouple customer contact activities and non customer contact
activities. The findings show that the processes selling standardised service offerings
use a “whole-case-worker” approach since a single employee may perform all of the
activities in the process. In contrast, in the case of customised service concepts,
customer contact tasks and non customer contact tasks are allocated to different
228
employees to take advantage of their expertise in specific areas. For instance, in the case
of bespoke service offerings, the contract manager is entirely focused on interacting
with the customer and on managing the customer relationship. Sales support staff are
responsible for processing and pricing customer requests. This suggests that letting
workers perform as many steps as possible in the process may not be appropriate for
every design context.
To summarise, the results of this research are inconsistent with the view that the
business process design principles described in the BPM literature are universal and can
be applied irrespective of the context in which processes operate. The reason for this
inconsistency seems to be that best practices of process design have been developed at a
very general organisational level (Loch, 1998). Process architecture works (e.g. Childe
et al., 1994; CIMOSA-AMICE, 1989, Smart et al., 1999) have emphasised that an
organisation comprises three core groups of processes and that it is important to
differentiate between the categories of ‘manage’, ‘operate’, and ‘support’ processes.
The literature addressing business design principles, however, does not distinguish
between categories of business processes. Reijer and Liman Mansar (2005) argue that
these principles can be used as a “check-list” for process design across various
industries and business processes. This perspective assumes that all business processes
have relatively similar design requirements. This approach to process design is
inconsistent with the research findings which show that different service concepts
require different process design. The evidence presented in this work strongly suggests
that process design is contingent on the degree of customisation of the service concept.
It may be argued, therefore, applying the design principles mentioned above to ‘operate’
processes, without considering the service concept that is provided to the customer, is
potentially misleading.
Having discussed the results of this research in the context of the existing literature, the
next chapter will present the contributions of this research to the current body of
knowledge.
229
CHAPTER 10
IMPLICATIONS AND LIMITATIONS
10.1. Introduction
This chapter draws conclusions from, and summarises, the outcomes of this research.
The research provides new knowledge to the academic and business communities and
this contribution is discussed. The limitations of the research are considered and
opportunities for further research are identified.
10.2. Implications of the findings for theory
Clearly the design of processes is a significant challenge particularly within the fast-
growing context of information-intensive service organisations. It was argued in
Chapter 1 that there is a need for greater insight into process design in information-
intensive service environments, and recognition within the academic community that
Service Operations Management research has not adequately addressed practitioner
concerns. This research contributes to redressing this imbalance through robust
theoretical analysis.
The focus of this section is on summarising the important contributions to knowledge
arising from the findings. Specifically, this thesis makes six major contributions to the
Service Operations Management literature. These contributions inform process design
in the context of information-intensive service delivery systems. The section concludes
with the formulation of a set of research propositions.
10.2.1. Empirical support for the theoretical relationship of service design elements
First, empirical support was found for the theoretical relationship between the service
concept, customer inputs, and process design characteristics. The study illustrates the
relationship between these elements and how they must be jointly considered to
effectively design a service delivery system. Therefore, this research strongly suggests
that process design characteristics are contingent on the degree of customisation of the
service concept and on the type and variability of customer inputs.
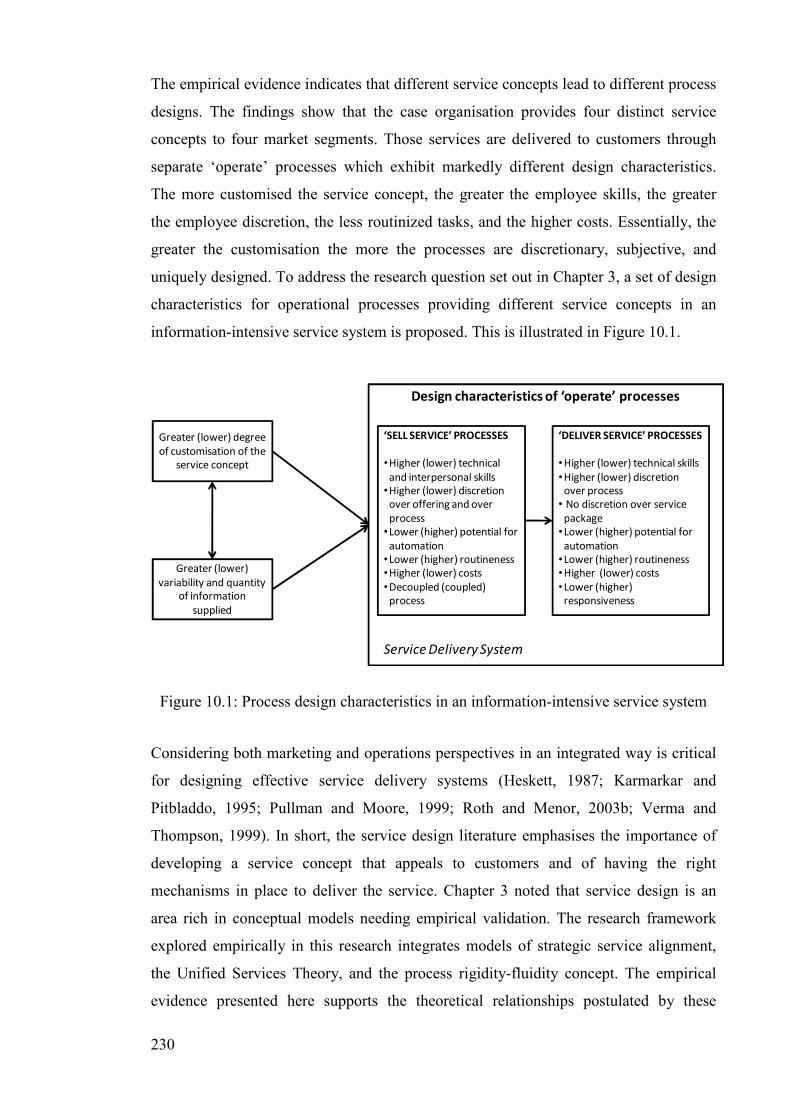
230
The empirical evidence indicates that different service concepts lead to different process
designs. The findings show that the case organisation provides four distinct service
concepts to four market segments. Those services are delivered to customers through
separate ‘operate’ processes which exhibit markedly different design characteristics.
The more customised the service concept, the greater the employee skills, the greater
the employee discretion, the less routinized tasks, and the higher costs. Essentially, the
greater the customisation the more the processes are discretionary, subjective, and
uniquely designed. To address the research question set out in Chapter 3, a set of design
characteristics for operational processes providing different service concepts in an
information-intensive service system is proposed. This is illustrated in Figure 10.1.
Greater (lower) degree
of customisation of the
service concept
Greater (lower)
variability and quantity
of information
supplied
Design characteristics of ‘operate’ processes
‘SELL SERVICE’ PROCESSES
•Higher (lower) technical
and interpersonal skills
•Higher (lower) discretion
over offering and over
process
•Lower (higher) potential for
automation
•Lower (higher) routineness
•Higher (lower) costs
•Decoupled (coupled)
process
‘DELIVER SERVICE’ PROCESSES
•Higher (lower) technical skills
•Higher (lower) discretion
over process
• No discretion over service
package
•Lower (higher) potential for
automation
•Lower (higher) routineness
•Higher (lower) costs
•Lower (higher)
responsiveness
Service Delivery System
Figure 10.1: Process design characteristics in an information-intensive service system
Considering both marketing and operations perspectives in an integrated way is critical
for designing effective service delivery systems (Heskett, 1987; Karmarkar and
Pitbladdo, 1995; Pullman and Moore, 1999; Roth and Menor, 2003b; Verma and
Thompson, 1999). In short, the service design literature emphasises the importance of
developing a service concept that appeals to customers and of having the right
mechanisms in place to deliver the service. Chapter 3 noted that service design is an
area rich in conceptual models needing empirical validation. The research framework
explored empirically in this research integrates models of strategic service alignment,
the Unified Services Theory, and the process rigidity-fluidity concept. The empirical
evidence presented here supports the theoretical relationships postulated by these
231
models. These findings resonate with much of the existing literature which suggests that
the conceptual components of service design should be aligned. The research adds to
existing knowledge by empirically describing and analysing the linkages between
service concepts, customer inputs, and process design characteristics. In addition to this,
this study offers several major points of departure from current thinking. These are
discussed below.
10.2.2. Differences in the design of the individual ‘operate’ processes that collectively
provide the service concept to the customer
The research findings show that the design characteristics of the ‘sell service’ process
are significantly different from those of the corresponding ‘deliver service’ process. In
particular, differences were observed in the type of employee skills, in the extent of
employee discretion, in the degree of automation, and in the location (see Section
9.2.2). It may be argued, therefore, that it is crucially important to consider the design
characteristics of each of the individual processes that collectively provide the service
concept to the customer.
This is an important contribution to the existing SOM literature because no similar
study is currently available in the literature addressing service process design. The
categorisation of processes into ‘operate’, ‘manage’, and ‘support’ and the further
decomposition of ‘operate’ processes into a set of interrelated business processes, which
appear in the BPM literature, have been driven by existing practices (APQC, 2006;
Childe et al., 1994; Smart et al., 1999). It was suggested in Chapter 3 that a business
process perspective on service systems has been relatively ignored in the development
of SOM theoretical knowledge. Macro-oriented service classifications offer generic
design guidelines that do not consider the differences in the design of the individual
‘operate’ processes that provide the service concept to the customer (Chase and Tansik,
1983; Kellogg and Nie, 1995; Metters and Vargas, 2000; Schmenner, 1986; Silvestro et
al., 1992). Some empirical studies suffer from “facility bias” which consists of
analysing the characteristics of a service facility (e.g. a bank branch or a call centre)
instead of the ‘operate’ processes. Moreover, existing process-based studies have
focused on independent, individual service delivery processes analysed in isolation or
on portions of the service delivery system (e.g. Frei and Harker, 1999; Safizadeh et al.,
2003). For instance, Zomerdijk and de Vries (2007) highlight the similarities and
232
differences in the design of ‘sell service’ processes but the authors disregard the
corresponding ‘deliver service’ processes in their analysis.
Based on the findings, it can be argued that the service concept is provided to the
external customer through several interrelated ‘operate’ processes. These interrelated
processes are broadly aligned since customised service concepts require fluid ‘sell
service’ and fluid ‘deliver service’ processes. Therefore, these processes may appear to
require similar design decisions. However, this is not the complete picture. The research
findings strongly suggest that, at a more granular level, the design characteristics of
individual processes focusing on the same service concept are significantly different.
The research presented here extends existing knowledge by demonstrating the
importance of considering the design characteristics of each of the processes that work
together to provide the service concept to the customer. Moreover, the research findings
provide the design characteristics that are appropriate for the ‘sell service’ process and
for the ‘deliver service’ process (see Figure 10.1).
10.2.3. New insights into front office – back office configurations
The study extends existing theory related to the design of front office and back office
activities in the service delivery system. The findings that address front office – back
office configurations within the ‘sell service’ processes analysed are revealing. They
contradict traditional SOM theory which argues that contact and non-contact jobs call
for different sets of activities which are to be allocated to different employees (Chase
and Tansik, 1983). This is so that front office personnel can focus on the customer and
back office work can be rationalised by traditional division of labour techniques and
managed for cost reduction and efficiency gains (McLaughlin, 1996). Metters and
Vargas (2000) note that decoupling has been largely advocated in the practitioner
literature and has been a popular practice in various service industries. This traditional
view of separating the front-office from the back-office may be considered somewhat
obsolete because this division is not always clear cut in practice as pointed out by
Zomerdijk and de Vries (2007). This led these authors to study the extent of coupling-
decoupling in the context of so-called “mixed services” to focus an on service
operations context which contains both customer contact and non customer contact
work. Both articles demonstrate empirically that diverse configurations are appropriate
under different strategic conditions. The findings presented here are consistent with the
233
work of both Metters and Vargas (2000) and Zomerdijk and de Vries (2007). Both
coupling and decoupling approaches were identified in the focal service delivery
system, as discussed in the previous section. In particular, it was shown that customer
contact activities and non customer contact activities in ‘sell service’ processes can be
either coupled to maximise process efficiency or decoupled to improve customer
service.
Furthermore, this research also extends further the work of Metters and Vargas (2000).
By linking the FO-BO design decision to the strategy of the firm these authors argue
that different configurations may not be viable within the same service system. The
findings of the research presented here suggest otherwise. The results show that the
organisation studied uses both coupled and decoupled approaches in its ‘sell service’
processes. This strongly suggests that it is viable for a large organisation to adopt
different configurations (i.e. the “kiosk” and “focused professional” types in this case
study) simultaneously in the service system. While Metters and Vargas associate the
decoupling decision with “individual firm strategy” (p.664), the empirical evidence
presented here suggests that FO-BO configurations seem to be determined according to
the service concept and the associated processes. The service concept is often seen as a
link between strategy and service system design (Roth and Menor, 2003b) and different
service concepts can be provided to different customers through the same delivery
system. Process design, therefore, requires an understanding of the strategy of the
service organisation as embodied in the specification of the service concepts offered.
Different front office – back office configurations within the same organisation are
appropriate for different service concepts. From a process design perspective the overall
strategy of a service organisation can be supported and realised through careful
consideration of the service concepts.
10.2.4. New insights into the design characteristics of low customer contact processes
This study provides new insights into the design challenges for low customer contact
service delivery processes, which contradict existing SOM theory. The research
findings clearly indicate that there is no customer-self inputs (e.g. no customer presence,
contact, or involvement) (Sampson and Froehle, 2006) in any of the four ‘deliver
service’ processes studied. These processes are concerned with the production of the
core service activity (i.e. the production of bills). Therefore it may be argued that a
234
separable service system is characterised by an absence of customer-self inputs in the
‘deliver’ service processes. These processes may be referred to as back-office processes
since they are characterised by a lack of customer contact (Chase and Tansik, 1983).
There is consensus in the SOM literature that back office processes can be made as
efficient as assembly lines in manufacturing using mass production design principles
such as automation (Bowen and Youngdhal, 1998; McLaughlin, 1996). Verma and
Young (2000) argue that this perspective assumes that low contact processes form a
homogeneous group, have similar design requirements, and that they are always
designed for efficiency. This consensus view may explain why limited empirical
research has been conducted in the context of low contact service operations. Verma
and Young (2000) empirically explore the differences between two low-contact service
delivery systems. The authors conclude that low-contact service operations are
comprised of multiple groups, which differ from each other in terms of their operational
objectives, competitive priorities, and performance. The research presented here adds to
the limited body of knowledge addressing the characteristics of low customer contact
processes. The research findings provide empirical evidence that low-contact processes
for customised service concepts are less efficient than low-contact processes for
standardised service concepts. Fluid low-contact processes are required to fulfil
complex and individualised service level agreements. Low-contact ‘deliver service’
processes for customised service concepts do not exhibit the characteristics of a “service
factory” (Kellogg and Nie, 1995). The design characteristics of these processes are
inconsistent with a production-line approach to process design which is suggested by
many scholars (Bowen and Youngdahl, 1998; Chase and Tansik, 1983; McLaughlin,
1996). Suggesting that all low customer contact processes form a homogeneous group
and have a consistent approach to efficiency is in contradiction with these research
findings. It may be argued, therefore, that addressing the design characteristics of back-
office, ‘deliver service’ processes require an understanding of the service concept and of
the associated ‘sell service’ processes.
235
10.2.5. Benefits from a process-based view of the service delivery system
In contrast to the macro-orientation of service classifications, this study employs a more
granular level of analysis to address the requirements of ‘service concept – processes’
pairs in the service delivery system. A process perspective is beneficial from a design
standpoint because it helps to understand the heterogeneity inherent in service delivery
systems providing multiple service concepts.
High-level service classifications assume homogeneity in the design of the service
delivery system (see Section 3.6). Based on the findings of this process-oriented study,
it is clear that identifying design characteristics at the firm level is a significant
challenge. It is arguable that it would be difficult to characterise the entire service
system clearly because it comprises multiple, heterogeneous processes. If design
characteristics were applied at the level of the entire service system, this would provide
some contradictory indications. As it can be inferred from above, it would require a
service system that provides standardised service concepts and customised service
concepts to have all combinations of tight and loose front office - back office coupling,
low and high degrees of skills, low to high degrees of employee discretion, and low to
high routinization and automation. It is arguable, therefore, that studying the service
system as a whole leads to confounded and unfocused results. This is obviously a highly
confusing message to give practising managers.
The heart of this problem is that the service system is too gross a unit of analysis for
process design considerations. For instance, Metters and Vargas (2000) state that there
are inherent difficulties in adopting different FO-BO design configurations within the
same service delivery system. This contrasts with the results presented here which show
that it is viable for an organisation to operate both coupled service processes and
decoupled service processes. Similarly, utility companies are typically classified as
service factories. Haywood-Farmer’s framework (1988), for example, states that all
utilities are characterised by low customisation, low labour intensity, and low customer
contact. The research findings suggest otherwise.
The findings provide evidence that the information-intensive service system studied
does not fit a single, homogeneous classification. This suggests that high-level service
classifications may be misleading since they promote homogeneous thinking in the
design of the service delivery system. Since organisations operate various processes to
support the realisation of different service concepts, a macro-view of operations is likely
236
to lead to an incoherent description of the service delivery system. In contrast, adopting
a lower level of granularity enables the comparison of service delivery processes at the
level where design characteristics can be more directly identified.
Based on the findings, this research asserts that designing a service delivery system
requires the consideration of the architecture of ‘operate’ processes that provide diverse
service concepts to customers. Analysing service system design necessitates a detailed
understanding of the service concepts and of how individual processes operate. A
process-centric view of service systems is important because it allows for heterogeneity;
that is differences in the design of operational processes within the same service
organisation. Using the service concept as driver of process design helps to provide a
coherent picture of an entire service delivery system.
10.2.6. Refuting generic principles of business process design
Finally, this study refutes the view that business process design principles described in
the BPM literature are universal and can be applied regardless of the context in which
processes operate. The application of generic process design principles in a service
delivery system has received limited consideration in the BPM literature. In the
previous section, it was argued that five of these business process design principles do
not apply consistently across the service delivery processes studied. The reasons for this
inconsistency appear to be that generic business process design principles do not
directly relate to operations management challenges associated with delivering goods
and services to external customers (Loch, 1998). A service operations management
perspective is missing in the BPM literature that focuses on business process design.
While the BPM literature advocates a “one size fits all” approach to process design, this
research asserts that one design does not fit all ‘operate’ processes. The process design
principles provided in the BPM literature are not equally appropriate for all ‘operate’
processes. As discussed above, the results presented in this work strongly suggest that
the design of operational processes is contingent on the service concept.
237
To summarise, this empirical study represents an important step towards the
identification of the design characteristics of service delivery processes in an
information-intensive service delivery system. The findings provide a set of design
characteristics for the ‘operate’ processes that deliver different service concepts in an
IPO (see Figure 10.1).
This therefore leads to the formulation of a set of propositions that can be used as a
platform for theory development in the process design area. These propositions specify
the design characteristics of the operational processes that provide the service concept to
the customer in an information-intensive service delivery system.
1. The greater the degree of customisation of the service concept, the greater the
variability in customer requirements and the greater the amount of customer
information supplied to the process.
2. The more customised the service concept, the higher the level of skills, the
greater the employee discretion, the less routine, the less opportunity for
automation, the less efficiency, and the less responsiveness in the ‘sell service to
customer’ process.
3. In the ‘deliver service to customer’ process, the more customised the service
concept, the greater the employee discretion in carrying out the task, the less
opportunity for automation, and the lower the efficiency.
4. For customised service concepts, employee interpersonal skills and employee
discretion are higher in the ‘sell service’ process than in the corresponding
‘deliver service’ process.
5. For any given service concept, opportunities for automation are lower in the ‘sell
service’ process than in the corresponding ‘deliver service’ process.
6. Decisions about front office – back office configurations are made at process
level and contingent on the service concept.
7. Process design principles derived from best practices are not universally
applicable across all service delivery processes.
These propositions now need further research and a theory testing approach.
238
10.3. Implications of the findings for practice
This research has implications for those managers involved in the design of service
systems. While the research does not prescribe a set of design characteristics for service
delivery processes, it seeks to influence practice by fostering the thinking of operations
managers in order to help them conceptualise issues related to service delivery.
The first and most important issue is the decision regarding the service concept. The
degree of customisation of the service concept has considerable implications for all the
aspects of process design, outlined in Figure 10.1. The findings can serve to inform
process design decisions in practice. This case-based research shows that the complexity
of the contract, the customer relationship strategy, the type of customer inputs as well as
the variability and quantity of customer information supplied are important elements to
consider for managers involved in the design of service delivery processes.
While the issue of process is often central in service organisations (Maddern et al.,
2007), few empirically-derived principles of process design are available to managers
involved in the delivery of services. The importance of taking a process view to explore
managerial challenges inherent in information-intensive service operations is
emphasised in this research. Processes are what an organisation does (Armistead and
Machin, 1997). This study illustrates that a separation of the ‘sell service’ process from
its corresponding ‘deliver service’ process provides insights into the level of skills and
knowledge, automation, discretion, and front office – back office configurations that are
appropriate for service provision. Crucially, the research emphasises the need to
distinguish between each of the individual, interrelated processes that work together to
provide the service concept to the customer when planning or analysing a service
delivery system.
The BPM practitioner literature is replete with articles providing generic principles of
process design (Hill et al., 2002). While these works provide useful guidelines to help to
think about process design in general terms, this research contends that considering the
service concept is essential when designing ‘operate’ processes in a service
environment. Since existing design principles developed in the BPM literature were not
consistently applicable across the operational processes of the high-performing service
organisation studied, it is reasonable to suggest that these principles may not be
appropriate for all information-intensive service delivery systems. It may be argued,
therefore, that prescribing a universal approach to process design is likely to give
239
operations managers misleading advice about the design requirements of individual
service delivery processes.
Moreover, the BPM literature makes a distinction between two alternative situations in
which process design may take place. First, an existing business process may be taken
as a starting point for its redesign. Second, organisations may use the so-called “clean-
sheet approach”, where the process is entirely designed from scratch. Taking the
existing process as a starting point is, in practice, the most common way of developing a
new business process (Aldowaisan and Gaafar, 1999). Operations managers may use the
insights derived from this research to evaluate the appropriateness of the design of
existing service delivery processes. Assessing the alignment between service concept,
customer inputs, and the design characteristics of existing service processes can help
operations managers determine whether the right processes are in place to provide the
service to the customer.
Finally, this research provides an integrated view of service design that considers both
“what” is delivered (i.e. service concept) and “how” this is delivered (i.e. service
process). Based on the findings, it may be argued that, in practice, the integration of
marketing and operations must be well managed too. Service firms often develop and
provide numerous derivatives of the same core offering (Goldstein et al., 2002). This is
usually the responsibility of the marketing or sales departments (Cooke et al., 1999). On
the other hand, operations managers are usually concerned with planning the service
process design to deliver the service concept (Roth and Menor, 2003b). Providing a new
service concept may, therefore, require planning a new process design or modifying an
existing one. In this situation, it is essential that managers are aware of the possible
legacy constraints to overcome such as IT system constraints, since the firm will have
existing staff and technology in place in the existing service delivery system. Tax and
Stuart (1997) have shown empirically that existing processes may be affected by the
introduction of a new service concept. For instance, in the case organisation the
capability of the IT billing system in place may restrict the nature of the new services
that may be offered in the future. There are a number of IT system constraints which
may be prohibitive for future planned designs. These require a coordinated effort from
both marketing managers and operations managers to ensure that the organisations will
be capable of delivering the newly developed service concept.
240
10.4. Limitations of the research
While the research provides new knowledge to both academics and practitioners, it is
necessary to examine its limitations as a guide to future empirical research. This section
discusses the main limitations of this study and how these were handled.
The generic limitations of case-based research have been extensively discussed in the
literature (e.g. Voss et al., 2002, Stuart et al., 2002). In particular, single case studies are
not always well received in the research community (Dyer and Wilkins, 1991). Given
this situation, scholars emphasise the rigour which needs to be applied for case based
research to obtain peer acceptance. It is essential that the research design demonstrates
rigour to convince both practitioners and the academic community that the research
findings are reliable. With this in mind, this research has outlined how data was
collected and what research protocol was employed, it has carefully described the data
analysis procedures, and it has offered up much of the collected data for inspection.
Section 4.6 made the case that the research was conducted with the issues of validity
and reliability in mind and that steps were taken to ensure these were achieved. In
addition, Parkhe (1993) recognises that the breadth and scope of most case-study
research, which focuses on collecting rich data, can lead to very complex theories.
Using a theoretical framework that guides the empirical phase of the research was a
good way of alleviating this issue.
Second, this study takes a market-led, outside-in view of strategy based on market
positioning and customer requirements (see for example, Heskett, 1987; Roth and
Menor, 2003b). This position assumes that the service concept directly influences
process design. Collier and Meyer (2000) note, however, that a clear direction of
causation from service concept to service system design similar to the one established
by the product-process matrix has not been established in SOM. From a practical
perspective, it is clear that organisations that are not in a ‘green field’ will be adding
additional service concepts to an existing portfolio. They will have existing process
capabilities which might influence the services that they can offer. It may be argued that
process design decisions can be seen as a necessary interplay between the inside-out and
outside-in perspectives. Whilst the inside-out perspective has not been considered, it is
important to recognise that the relationship between service concept and process design
is not always unidirectional.
241
Third, it was assumed that fit between service concept and process design
characteristics was realised because the chosen company is the market leader in its
sector. In addition, the organisation selected has been engaged in a comprehensive
business process management programme including process design work for several
years. The research considers that this organisation is more mature than organisations
that are not explicitly addressing the management of business processes. The researcher
is confident that the assumption that alignment is achieved is reasonable within the OM
contingency paradigm that links “good” practice to performance (Sousa and Voss,
2008). In the interaction approach to contingency theory the context (i.e. in this case the
service concept) is mediated through process design which affects performance.
Nonetheless, it is acknowledged that it is a limitation.
A more general limitation concerns the scope of the research. The research has
addressed process design in the context of an information-processing service delivery
system using a single case design. The data was collected in a single firm which reduces
the generasibility of the findings since there is a concern with generalising from a single
case to other situations (Kennedy, 1979; Yin, 2003). Generally multiple case-studies are
preferred for theory-building efforts because they allow for the use of replication logic
across several cases (Eisenhardt, 1989; Voss et al., 2002). While the results are
significant, valid, and reliable it is unclear whether they may be representative and
generalisable. Although the findings may have a wider remit, particularly across other
information-intensive service organisations, their applicability beyond the organisation
studied remains to be established. Therefore, this research can not make the claim that
the results are generalisable to other situations. Nonetheless, a number of research
propositions have been formulated based on the research findings. These propositions
require testing across a larger sample of service organisations to provide for replication.
Finally, while collecting and analysing data from a single organisation is recognised as
a limitation with regards to external validity, there were a number of advantages to this
approach. Throughout the fieldwork, the researcher enjoyed access to a wide range of
data from this company, including material often considered too sensitive for external
review. In addition, the researcher benefited from the active co-operation of
management and staff.
242
10.5. Further research
The research presented here contributes to building theory in service process design.
Nonetheless, it is clear that no single approach to theory development can produce a
well-rounded theory (Weick, 1989). This research has a number of major implications
for future research work. The study of service system design issues from a process
perspective promises to be an exciting avenue for future research trajectories in service
operations management.
Further research is needed to test the research propositions derived from this research on
a larger scale within information-intensive service operations and across material-
processing service operations (e.g. parcel delivery services and repair services) and
customer-processing service operations (e.g. hospitals and restaurants) The propositions
will have to be tested for statistical generalisability in more quantitative research. Key
questions which must be addressed are: Are the results applicable in other information-
intensive service organisations? Are the results applicable in MPO and in CPO? What
are the differences in the design of service delivery processes between the contexts of
IPO, CPO, and MPO?
It is possible to suggest a future research project which could potentially replicate the
findings of this study. The research design would involve selecting a low-performing
information-processing service delivery system to carry out a similar study. This
approach is consistent with the theoretical sampling logic (Voss et al., 2002). The case
would be selected based on the assumption that in a low-performing organisation the
service concepts and the service delivery system are likely to be misaligned. Such a
study would allow for theoretical replication as one would expect to find results that
are different from the research findings presented here.
Sazidadeh et al. (2003) argue that limited empirical research has been conducted at the
level of the service process. By showing that a macro-orientation is likely to offer a
confounding picture of the service system this research has made a strong case for
adopting a process-centric perspective in SOM research. There is a need, as suggested
by Gummesson (1990), to put process thinking at the heart of service delivery. A
process-based view of service systems is consistent with recent developments in the
Operations Management literature. Several authors have called for OM to focus more
on process management (Klassen and Menor, 2007; Sampson and Froehle, 2006; Silver,
2004). In this spirit, this call is extended to include service operations management
243
within the process perspective. Many benefits can be gained in SOM from studies that
directly consider the management and design of service delivery processes. Future
research could to study similarities and differences in service delivery processes in a
variety of service operations contexts in order to establish process design principles for
various service systems.
The relationship between the service concept and design decisions about front office –
back office work in service processes also requires further investigation. The evidence
from the research suggests that customised services are sold through decoupled
processes and that standardised services are sold through coupled processes. This is
consistent with the findings of Zomerdjik and de Vries (2007), but contrasts with
Metters and Vargas (2000) who argue that the degree of customisation of the service
concept does not drive the coupling decision. This research concurs with Zomerdjik and
de Vries (2007) who suggest that linking the FO-BO design decision to the nature of the
service being delivered is an important avenue for future research.
Furthermore, the organisation’s service delivery system has been conceptualised as a set
of two interrelated ‘operate’ processes. The research emphasised that the service
concept is provided to the customer through the ‘sell service’ process and its
corresponding ‘deliver service’ process. This opens a new avenue for SOM research. It
would be beneficial for process design research to develop process reference models
similar to the one which is established in the manufacturing literature (Smart et al.,
1999). Identifying and understanding the core operational processes in a variety of
service delivery systems may be seen as pre-requisite to the articulation of process
design characteristics. Key questions to be addressed here are: can all service delivery
systems be represented in a standard model of ‘operate’ processes? What are the
differences between process-oriented conceptual models of manufacturing systems and
models of service delivery systems?
A related issue concerns the integration of interrelated ‘operate’ processes. Whilst the
study focused on the design characteristics of the processes that collectively provide the
service concept to the customer, it is arguable that the integration of these processes is
an important issue to consider for effective service delivery. The BPM literature
emphasises that process integration is paramount. Berente et al. (2009) note that
considerable semantic confusion surrounds the use of the concept of process integration.
In the context of this research, process integration addresses the question of how an
244
organisation manages the seamless co-ordination of individual processes across the
service delivery system (Frohlich and Westbrook, 2001). The areas where interrelated
processes intersect must be managed. Identifying the mechanisms through which
service organisations achieve process integration for different service concepts is a
promising avenue for future research.
The research has started to challenge the universal applicability of the business process
design principles described in the BPM literature. More work is required to determine
which principles are applicable in which contexts, and why. While this research has
focused on the category of ‘operate’ processes, it would be interesting to examine the
similarities and differences in process design across the categories of ‘manage’ and
‘support’ processes. Reijers and Liman Mansar (2005) identified 29 popular principles
of process design in the extant literature. Future research could explore the applicability
of each principle in various organisational contexts. This would be consistent with the
contingency approach that characterises much empirical research in OM (Sousa and
Voss, 2008).
Finally, more research is also needed to study the impact of strategic service alignment
on performance. Future research could focus on assessing the fit between service
concept, customer inputs, and process design characteristics directly using process-
oriented performance measures. The difficulty associated with collecting “good”
performance data at process level has been noted by Safizadeh et al. (2003). For
instance, these authors use a perceptual measure of performance in their study of service
processes in the financial services sector. To overcome this issue, a larger number of
case studies or longitudinal data over a longer time period would be required. For
instance, Smith and Reese (1999) study the relationship between strategy, fit,
productivity, and business performance in 30 service operations using a case-based
approach. Future research could look for organisations that realise the alignment and
organisations that do not in order to assess the extent to which misaligning service
concept and service system affects performance. Key questions to be addressed here
are: do organisations that realise the alignment perform better than other firms? What is
the impact of misalignment on customer satisfaction and on efficiency?

245
REFERENCES
Abraham, S. and R. J. Aliio (2006), "The troubled strategic-business-advice industry: why it's failing
decision makers," Strategy & Leadership, 34(3), 4-13.
Ackoff, R. L. (1980), "The systems revolution," in Organizations as Systems, M Lockett, R Spear, eds.
Milton Keynes: The Open University Press, 26-33.
Aguilar-Saven, R. S. (2004), "Business process modelling: Review and framework," International Journal
of Production Economics, 90(2), 129-149.
Alam, I. (2005), "Fieldwork and data collection in qualitative marketing research," Qualitative Market Research: An International Journal, 8(1), 97-112.
Aldowaisan, T. A. and L. K. Gaafar (1999), "Business process reengineering: an approach for process
mapping," Omega, 27(5), 515-524.
Al-Mashari, M. (2002), "Editorial," Business Process Management Journal, 8(1), 1-2.
Al-Mashari, M. and M. Zairi (2000), "Revisiting BPR: a holistic review of practice and development," Business Process Management Journal, 6(1), 10-42.
AMICE (1989), CIM-OSA: Open Systems Architecture for CIM. Berlin: Springer-Verlag.
Anderson, E. W. and V. Mittal (2000), "Strengthening the Satisfaction-Profit Chain," Journal of Service
Research, 3(2), 107-120.
Anonymous. 2007. Practically irrelevant?, The Economist,
http://www.economist.com/displaystory.cfm?story_id=9707498
Antony, J., F. J. Antony, M. Kumar and B. R. Cho (2007), "Six sigma in service organisations: Benefits, challenges and difficulties, common myths, empirical observations and success factors," International
Journal of Quality and Reliability Management, 24(3), 294-311.
APQC (2006), "Process Classification Framework," Version 4.0.0
Apte, U. and A. P. J. Vepsaelaeinen (1993), "High tech or high touch? Efficient channel strategies for delivering financial services," Journal of Strategic Information Systems, 2(1), 39-54.
Argote, L. (1982), "Input Uncertainty and Organizational Coordination in Hospital Emergency Units," Administrative Science Quarterly, 27(3), 420-434.
Armistead, C. (1990), "Service Operations Strategy: Framework for Matching the Service Operations Task and the Service Delivery System," International Journal of Service Industry Management, 1(2), 6-
16.
Armistead, C. and S. Machin (1997), "Implications of business process management for operations management," International Journal of Operations & Production Management, 17(9/10), 886-898.
Armistead, C., J.-P. Pritchard and S. Machin (1999), "Strategic Business Process Management for
Organisational Effectiveness," Long Range Planning, 32(1), 96-106.
Baker, G. and H. Maddux (2005), "Enhancing Organizational Performance: Facilitating the Critical Transition to a Process View of Management," SAM Advanced Management Journal, Autumn 2005, 43-60.
Balasubramanian, S. and M. Gupta (2005), "Structural metrics for goal based business process design and evaluation," Business Process Management Journal, 11(6), 680-694.
Banker, R. D. and R. C. Morey (1993), "Integrated system design and operational decisions for service
sector outlets," Journal of Operations Management, 11(1), 81-98.
Barros, O. (2007), "Business Processes Architecture and Design," BPTrends, www.bptrends.com.
Bartunek, J. M. (2007), "Academic-practitioner collaboration need not require joint or relevant research: toward a relational scholarship of integration," Academy of Management Journal, 50(6), 1323-1333.
Batista, L., A. Smart and R. Maull (2008), "The systemic perspective of service processes: underlying
theory, architecture and approach," Production Planning & Control, 19(5), 535 - 544.

246
Batt, R. (2002), "Managing Customer Services: Human Resource Practices, Quit Rates, and Sales Growth," The Academy of Management Journal, 45(3), 587-597.
Baum, S. H. (1990), "Making your service blueprint pay off!," Journal of Services Marketing, 4(3), 45-
53.
Bayraktar, E., M. C. Jothishankar, E. Tatoglu and T. Wu (2007), "Evolution of operations management:
past, present and future," Management Research News, 30(11), 843-871.
Beer, S. (1984), "The Viable System Model: Its Provenance, Development, Methodology and Pathology," The Journal of the Operational Research Society, 35(1), 7-25.
Bell, E. and A. Bryman (2007), "The Ethics of Management Research: An Exploratory Content
Analysis," British Journal of Management, 18(1), 63-77.
Berente, N., B. Vandenbosch and B. Aubert (2009), "Information flows and business process integration,"
Business Process Management Journal, 15(1), 119-141.
Berry, L. L. (1995), "Relationship Marketing of Services--Growing Interest, Emerging Perspectives," Journal of the Academy of Marketing Science, 23(4), 236-245.
Berry, L. L., V. Shankar, J. T. Parish, S. Cadwallader and T. Dotzel (2006), "Creating New Markets
Through Service Innovation," MIT Sloan Management Review, 47(2), 56-63.
Biazzo, S. (2000), "Approaches to business process analysis: a review," Business Process Management
Journal, 6(2), 99-112.
Bloemer, J. M. M. and H. D. P. Kasper (1995), "The complex relationship between consumer satisfaction and brand loyalty," Journal of Economic Psychology, 16(2), 311-329.
Blois, K. J. (1983), "The Structure of Service Firms and Their Marketing Policies," Strategic
Management Journal, 4(3), 251-261.
Bonoma, T. V. (1985), "Case Research in Marketing: Opportunities, Problems, and a Process," Journal of Marketing Research, 22(2), 199-208.
Boreham, P. (1992), "The Myth of Post-Fordist Management: Work Organization and Employee Discretion in Seven Countries," Employee Relations, 14(2), 13-24.
Bowen, D. E. and W. E. Youngdahl (1998), "Lean service: in defense of a production-line approach,"
International Journal of Service Industry Management, 9(3), 207-225.
Bowen, J. and C. R. Ford (2002), "Managing Service Organizations: Does Having a "Thing" Make a Difference?," Journal of Management, 28(3), 447-469.
Boyer, K. K., R. Hallowell and A. V. Roth (2002), "E-services: operating strategy--a case study and a method for analyzing operational benefits," Journal of Operations Management, 20(2), 175-188.
BPD (2008), "Workshop background", 4th International Workshop on Business Process Design,
Eindhoven
Brohman, M. K., G. Piccoli, P. Martin, F. H. Zulkernine, A. Parasuraman and R. T. Watson (2009), "A Design Theory Approach to Building Strategic Network-based Customer Service Systems," Decision
Sciences, 40(3), 403-430.
Bryman, A. and E. Bell (2007), Business Research Methods, 2nd ed. Oxford: Oxford University Press.
Burrell, G. and G. Morgan (1979), Sociological paradigms and organisational analysis: Elements of the
sociology of corporate life. London: Heinemann.
Buzacott, J. A. (2000), "Service system structure," International Journal of Production Economics, 68(1), 15-27.
Champy, J. (1995), Reengineering Management. New York: Harper Business Books.
Chase, R. B. (1978), "Where does the customer fit in a service operation?," Harvard Business Review,
56(6), 137-142.
Chase, R. B. (1981), "The Customer Contact Approach to Services: Theoretical Bases and Practical Extensions," Operations Research, 29(4), 698-706.

247
Chase, R. B. (1996), "The mall is my factory: reflections of a service junkie," Production & Operations Management, 5(4), 298-308.
Chase, R. B. and U. M. Apte (2007), "A history of research in service operations: What's the big idea?,"
Journal of Operations Management, 25(2), 375-386.
Chase, R. B. and D. A. Tansik (1983), "The customer contact model for organization design,"
Management Science, 29(9), 1037-1050.
Checkland, P. (1981), Systems thinking, systems practice, John Wiley & Sons Ltd.
Chen, I. and A. Paulraj (2004), "Towards a theory of supply chain management: the constructs and measurements," Journal of Operations Management, 22(2), 119-150.
Childe, S. J., R. S. Maull and J. Bennett (1994), "Frameworks for Understanding Business Process Re-
engineering," International Journal of Operations & Production Management, 14(12), 22-34.
Chopra, S., W. Lovejoy and C. Yano (2004), "Five Decades of Operations Management and the Prospects Ahead," Management Science, 50(1), 8-14.
Chuang, P.-T. (2007), "Combining Service Blueprint and FMEA for Service Design," The Service Industries Journal, 27(2), 91-104.
Coetzer, A. (2006), "Employee learning in New Zealand small manufacturing firms," Employee
Relations: An International Journal, 28(4), 311-325.
Cohen, M. A., C. Cull, H. L. Lee and D. Willen (2000), "Saturn's Supply-Chain Innovation: High Value in After-Sales Service," MIT Sloan Management Review, 41(4), 93-101.
Cohen, L. and L. Manion (1987), Research Methods in Education, 2nd ed. London: Croom Helm.
Collier, D. A. (1983), "The service sector revolution: The automation of services," Long Range Planning,
16(6), 10-20.
Collier, D. A. (1994), The Service Quality solution: Using Service Management to gain Competitive Advantage. New York: NY: Irwin.
Collier, D. A. and S. M. Meyer (1998), "A service positioning matrix," International Journal of Operations & Production Management, 18(12), 1223-1244.
Collier, D. A. and S. M. Meyer (2000), "An empirical comparison of service matrices," International
Journal of Operations & Production Management, 20(6), 705-729.
Colquitt, J. A. and C. P. Zapata-Phelan (2007), "Trends in theory building and theory testing: a five-decade study of the academy of management journal," Academy of Management Journal, 50(6), 1281-
1303.
Congram, C. and M. Epelman (1995), "How to describe your service," International Journal of Service
Industry Management, 6(2), 6-23.
Cook, D. P., C.-H. Goh and C. H. Chung (1999), "Service Typologies: A State of the Art Survey,"
Production & Operations Management, 8(3), 318-338.
Coulson-Thomas, C. (1994), "Business process re-engineering: nirvana or nemesis for Europe?," in Business Process Re-engineering: Myth and Reality, Coulson-Thomas, ed. London: Kogan Page, 17-40.
Cousins, J. and T. Stewart (2002), "What is business process design and why should I care?," Rivcom
Ltd.
Crosby, L. (2009), "From Provider to Partner: Service Relationships that Transform Businesses," Creating Value Through Service symposium, Shanghai.
Curkovic, S., S. Vickery and C. Droege (2000), "Quality-related Action Programs: Their Impact on Quality Performance and Firm Performance," Decision Sciences, 31(4), 885-902.
Daft, R. L. and R. H. Lengel (1986), "Organizational Information Requirements, Media Richness and
Structural Design," Management Science, 32(5), 554-571.
Daft, R. L. and N. B. Macintosh (1981), "A Tentative Exploration into the Amount and Equivocality of Information Processing in Organizational Work Units," Administrative Science Quarterly, 26(2), 207-
224.

248
Dagger, T. S., P. J. Danaher and B. J. Gibbs (2009), "How Often Versus How Long: The Interplay of Contact Frequency and Relationship Duration in Customer-Reported Service Relationship Strength,"
Journal of Service Research, 11(4), 371-388.
Danaher, P. J., D. M. Conroy and J. R. McColl-Kennedy (2008), "Who wants a relationship anyway? Conditions when consumers expect a relationship with their service provider," Journal of Service
Research, 11(1), 43-62.
Davenport, T. (1993), Process Innovation: Reengineering work through information technology. Boston: Harvard Business School Press.
Davenport, T. (1996), "Why re-engineering failed: the fad that forgot people," Fast Company, 170-174.
Dean, J. W., Jr. and S. A. Snell (1991), "Integrated Manufacturing and Job Design: Moderating Effects of
Organizational Inertia," The Academy of Management Journal, 34(4), 776-804.
Dershin, H. (2000), "Business process design - completing the DNA", Supply Chain Management Review, 4(2), 74-82.
DeVaro, J., R. Li and D. Brookshire (2007), "Analysing the job characteristics model: new support from a cross-section of establishments," The International Journal of Human Resource Management, 18(6), 986 -
1003.
Dinev, T. and P. Hart (2006), "Privacy Concerns and Levels of Information Exchange: An Empirical
Investigation of Intended e-Services Use," e-Service Journal, 4(3), 25-59.
Droege, C., J. Jayaram and S. K. Vickery (2004), "The effects of internal versus external integration practices on time-based performance and overall firm performance," Journal of Operations Management,
22(6), 557-573.
Dyer, W. G., Jr. and A. L. Wilkins (1991), "Better Stories, Not Better Constructs, to Generate Better
Theory: A Rejoinder to Eisenhardt," The Academy of Management Review, 16(3), 613-619.
Earl, M. and B. Khan (1994), "How new is business process redesign?," European Management Journal, 12(1), 20-30.
Easterby-Smith, M., R. Thorpe and A. Lowe (2002), Management Research, 2nd ed. London: Sage
Publications.
Edvardsson, B., A. Gustafsson and I. Roos (2005), "Service portraits in service research: a critical
review", International Journal of Service Industry Management, 16(1), 107-121.
Edvardsson, B. and J. Olsson (1996), "Key Concepts for New Service Development," Service Industries Journal, 16(2), 140-164.
Eisenhardt, K. M. (1989), "Building Theories from Case Study Research," Academy of Management
Review, 14(4), 532-550.
Eisenhardt, K. M. and M. E. Graebner (2007), "Theory building from cases: opportunities and
challenges," Academy of Management Journal, 50(1), 25-32.
Field, J. M., L. P. Ritzman, M. H. Safizadeh and C. E. Downing (2006), "Uncertainty Reduction Approaches, Uncertainty Coping Approaches, and Process Performance in Financial Services," Decision
Sciences, 37(2), 149-175.
Fisk, R. P., S. W. Brown and M. J. Bitner (1993), "Tracking the Evolution of Services Marketing
Literature," Journal of Retailing, 69(1), 61-103.
Fitzgerald, L. (1991), Performance measurement in service businesses, Chartered Institute of Management Accountants, London.
Fitzsimmons, J. A. and M. J. Fitzsimmons (2004), Service Management, 4th ed. Boston, MA: McGraw
Hill Irwin.
Flick, U. (2006), An Introduction to Qualitative Research, 3rd ed. London: Sage.
Fliess, S. and M. Kleinaltenkamp (2004), "Blueprinting the service company: Managing service processes efficiently," Journal of Business Research, 57(4), 392-404.
Flynn, B. B., S. Sakakibara, R. G. Schroeder, K. A. Bates and E. J. Flynn (1990), "Empirical research methods in operations management," Journal of Operations Management, 9(2), 250-284.

249
Forsberg, T., L. Nilsson and M. Antoni (1999), "Process orientation: the Swedish experience," Total Quality Management, 10(4/5), 540-548.
Fowler, A. (1999), "Feedback and feedforward as systemic frameworks for operations control,"
International Journal of Operations & Production Management, 19(2), 182-204.
Fowler, A. (2003), "Systems modelling, simulation, and the dynamics of strategy," Journal of Business
Research, 56(2), 135-144.
Frei, F. X. (2007), "Breaking the Trade-Off Between Efficiency and Service," Harvard Business Review, 85(3), 93-101.
Frei, F. X. and P. T. Harker (1999), "Measuring the Efficiency of Service Delivery Processes: An
Application to Retail Banking," Journal of Service Research, 1(4), 300-312.
Froehle, C. M. and A. V. Roth (2004), "New measurement scales for evaluating perceptions of the
technology-mediated customer service experience," Journal of Operations Management, 22(1), 1-21.
Frohlich, M. T. and R. Westbrook (2001), "Arcs of integration: an international study of supply chain strategies," Journal of Operations Management, 19(2), 185-200.
Galvin, R. and D. L. Singer (1996), "Business process design: The new common sense," Association
Management, 48(2), 50-80.
George, M. L. (2003), Lean Six Sigma for Service. New York: McGraw-Hill.
Gephart, R. P. (2004), "Qualitative Research and the Academy of Management Journal," Academy of Management Journal, 47(4), 454-462.
Germain, R., C. Droege and W. Christensen (2001), "The mediating role of operations knowledge in the relationship of context with performance," Journal of Operations Management, 19(4), 453-469.
Getz, D., M. O'Neill and J. Carlsen (2001), "Service Quality Evaluation at Events through Service
Mapping," Journal of Travel Research, 39(4), 380-390.
Gingele, J., S. J. Childe and M. E. Miles (2002), "A modelling technique for re-engineering business processes controlled by ISO 9001," Computers in Industry, 49(3), 235-251.
Godsiff, P., R. S. Maull, F. Ponsignon and A. Smart (2009), "Operationalising variety," QUIS11 – The
service conference, Wolfsburg, Germany.
Goldkuhl, G. and M. Lind (2008), "Coordination and transformation in business processes: towards an
integrated view," Business Process Management Journal, 14( 6), 761-777.
Goldstein, S. M., R. Johnston, J. Duffy and J. Rao (2002), "The service concept: the missing link in service design research?," Journal of Operations Management, 20(2), 121-134.
Gouillart, F. J. and F. D. Sturdivant (1994), "Spend a Day in the Life of Your Customers," Harvard
Business Review, 72(1), 116-125.
Gronroos, C. (2000), Service Management and Marketing: A Customer Relationship Management
Approach. Chichester: John Wiley & Sons.
Grover, V. and W. J. Kettinger (2000), "Business process change in the 21st century," Business & Economic Review, 46(2), 14-18.
Guba, E. G. and Y. S. Lincoln (1994), "Competing paradigms in qualitative research," in Handbook of
Qualitative Research, NK Senzin, YS Lincoln, eds. Thousand Oaks: CA: Sage.
Gummesson, E. (1993), Quality Management in Service Organizations; An Interpretation of the Service Quality Phenomenon and a Synthesis of International Research. New York: NY: International Service
Quality Association.
Gummesson, E. (1994), "Service Management: An Evaluation and the Future," International Journal of
Service Industry Management, 5(1), 77-96.
Gummesson, E. (1990), "Service Design," The Total Quality Magazine, 2(2), 97-101.
Gupta, S., R. Verma and L. Victorino (2006), "Empirical Research Published in Production and Operations Management (1992-2005): Trends and Future Research Directions," Production & Operations
Management, 15(3), 432-448.

250
Hackman, J. R. and G. R. Oldham (1975), "Development of the Job Diagnostic Survey," Journal of Applied Psychology, 60(2), 159-170.
Hall, M. J. and M. E. Johnson (2009), "When Should a Process Be Art, Not Science?," Harvard Business
Review, 87(3), 58-65.
Hammer, M. (2001), The Agenda. London: Harper Collins.
Hammer, M. (2002), "Process Management and the Future of Six Sigma," MIT Sloan Management Review, 43(2), 26-32.
Hammer, M. (2007), "The Process Audit," Harvard Business Review, 85(4), 111-123.
Hammer, M. and J. Champy (1993), Reengineering the Corporation: A manifesto for business
Revolution. New York: Harper Business.
Hammer, M. and S. Stanton (1999), "How Process Enterprises Really Work," Harvard Business Review,
77(6), 108-118.
Hanafizadeh, P., M. Moosakhani and J. Bakhshi (2009), "Selecting the best strategic practices for business process redesign," Business Process Management Journal, 15(4), 609-627.
Harmon, P. (2003), "Business Process Architectures," BP Trends, www.bptrends.com
Harmon, P. and C. Wolf (2008), "The State of Business Process Management," BP Trends,
www.bptrends.com
Harvey, J., L. A. Lefebvre and E. Lefebvre (1997), "Flexibility and technology in services: a conceptual model," International Journal of Operations & Production Management, 17(1), 29-45.
Hayes, R. H. and S. C. Wheelwright (1979), "Link manufacturing process and product life cycles," Harvard Business Review, 57(1), 133-140.
Haywood-Farmer, J. (1988), "A Conceptual Model of Service Quality," International Journal of
Operations & Production Management, 8(6), 19-29.
Healy, M. and C. Perry (2000), "Comprehensive criteria to judge validity and reliability of qualitative research within the realism paradigm," Qualitative Market Research, 3(3), 118-126.
Heineke, J. and M. M. Davis (2007), "The emergence of service operations management as an academic
discipline," Journal of Operations Management, 25(2), 364-374.
Heskett, J. L. (1987), "Lessons in the service sector," Harvard Business Review, 65(2), 118-126.
Heskett, J. L., T. O. Jones, G. W. Loveman, W. E. Sasser Jr and L. A. Schlesinger (1994), "Putting the Service-Profit Chain to Work," Harvard Business Review, 72(2), 164-170.
Hill, A. V., D. A. Collier, C. M. Froehle, J. C. Goodale, R. D. Metters and R. Verma (2002), "Research opportunities in service process design," Journal of Operations Management, 20(2), 189-202.
Hopp, W., M. Spearman and D. Woodruff (1990), "Practical Strategies for Lead Time Reduction,"
Manufacturing Review, 3(2), 78-84.
Huete, L. M. and A. V. Roth (1988), "The Industrialisation and Span of Retail Banks' Delivery Systems," International Journal of Operations & Production Management, 8(3), 46-66.
Hung, R. Y.-Y. (2006), "Business process management as competitive advantage: a review and empirical study," Total Quality Management & Business Excellence, 17(1), 21-40.
Hunt, S. D. (1990), "Truth in Marketing Theory and Research," The Journal of Marketing, 54(3), 1-15.
Hyer, N. L., U. Wemmerlöv and J. A. Morris Jr (2009), "Performance analysis of a focused hospital unit: The case of an integrated trauma center," Journal of Operations Management, 27(3), 203-219.
Ittner, C. D. and D. F. Larcker (1998), "Are Nonfinancial Measures Leading Indicators of Financial Performance? An Analysis of Customer Satisfaction," Journal of Accounting Research, 36, 1-35.
Johansson, P. and J. Olhager (2004), "Industrial service profiling: Matching service offerings and
processes," International Journal of Production Economics, 89(3), 309-320.
Johns, N. (1999), "What is this thing called service?," European Journal of Marketing, 33(9/10), 958-974.

251
Johnston, R. (1994), "Operations: From Factory to Service Management," International Journal of Service Industry Management, 5(1), 49-63.
Johnston, R. (1999), "Service operations management: return to roots," International Journal of
Operations & Production Management, 19(2), 104-124.
Johnston, R. (2005), "Service operations management: from the roots up," International Journal of
Operations and Production Management, 25(12), 1298-1308.
Johnston, R. and G. Clark (2005), Service Operations Management: Improving Service Delivery, 2nd ed. Harlow, England: FT Prentice Hall.
Johnston, W. J., M. P. Leach and A. H. Liu (1999), "Theory Testing Using Case Studies in Business-to-
Business Research," Industrial Marketing Management, 28(3), 201-213.
Jones, G. R. (1987), "Organization-Client Transactions and Organizational Governance Structures," The
Academy of Management Journal, 30(2), 197-218.
Kaplan, R. S. and L. Murdoch (1991), "Rethinking the corporation: core process redesign," The McKinsey Quarterly, 2(Summer), 27-43.
Karmarkar, U. S. and U. M. Apte (2007), "Operations management in the information economy:
Information products, processes, and chains," Journal of Operations Management, 25(2), 438-453.
Karmarkar, U. S. and R. Pitbladdo (1995), "Service markets and competition," Journal of Operations
Management, 12(3-4), 397-411.
Karwan, K. R. and R. E. Markland (2006), "Integrating service design principles and information technology to improve delivery and productivity in public sector operations: The case of the South
Carolina DMV," Journal of Operations Management, 24(4), 347-362.
Katz, D. and R. L. Khan (1966), The Social Psychology of Organisations. New York: Wiley.
Kelley, S. W., T. Longfellow and J. Malehorn (1996), "Organizational determinants of service employees' exercise of routine, creative, and deviant discretion," Journal of Retailing, 72(2), 135-157.
Kellogg, D. L. and W. Nie (1995), "A framework for strategic service management," Journal of Operations Management, 13(4), 323-337.
Kennedy, M. M. (1979), "Generalizing from single case studies," Evaluation Quarterly, 3(4), 661-678.
Kettinger, W. J., J. T. C. Teng and S. Guha (1997), "Business Process Change: A Study of
Methodologies, Techniques, and Tools," MIS Quarterly, 21(1), 55-80.
Kilmann, R. (1995), "A holistic program and critical success factors of corporate transformation," European Management Journal, 13(2), 175-186.
Kim, H.-W. and Y.-G. Kim (2001), "Rationalizing the customer service process," Business Process
Management Journal, 7(2), 139-156.
Kingman-Brundage, J. (1992), "The ABCs of service system blueprinting," in Designing a winning
service strategy, CH Lovelock, ed. Englewood Cliffs, NJ: Prentice Hall, 96-102.
Klassen, R. D. and L. J. Menor (2007), "The process management triangle: An empirical investigation of process trade-offs," Journal of Operations Management, 25(5), 1015-1034.
Kwortnik, R. J. and G. M. Thompson (2009), "Unifying service marketing and service operations with
service experience management," Journal of Service Research, 4(11), 389-406.
Law, K. S., W. Chi-Sum and W. M. Mobley (1998), "Toward a taxonomy of multidimensional constructs," Academy of Management Review, 23(4), 741-755.
Lee, R. G. and B. G. Dale (1998), "Business process management: a review and evaluation," Business Process Management Journal, 4214-225.
Lee, C., P. C. Earley and L. A. Hanson (1988), "Are Type A's Better Performers?," Journal of
Organizational Behavior, 9(3), 263-269.
Levitt, T. (1976), "The industrialization of service," Harvard Business Review, 54(5), 63-74.

252
Limam Mansar, S. and H. A. Reijers (2007), "Best practices in business process redesign: use and impact," Business Process Management Journal, 13(2), 193-213.
Lindsay, A., D. Downs and K. Lunn (2003), "Business processes--attempts to find a definition,"
Information and Software Technology, 45(15), 1015-1019.
Loch, C. (1998), "Operations Management and Reengineering," European Management Journal, 16(3),
306-317.
Locke, E. A. (2007), "The Case for Inductive Theory Building," Journal of Management, 33(6), 867-890.
Love, P. E. D., A. Gunasekaran and H. Li (1998), "Putting an engine into re-engineering: toward a process-oriented organisation," International Journal of Operations & Production Management, 18(9/10),
937-949.
Lovelock, C. and E. Gummesson (2004), "Whither Services Marketing?: In Search of a New Paradigm
and Fresh Perspectives," Journal of Service Research, 7(1), 20-41.
Lovelock, C. H. (1983), "Classifying Services to Gain Strategic Marketing Insights," Journal of Marketing, 47(3), 9-20.
Lovelock, C. H. and J. Wirtz (2004), Services marketing: people, technology, strategy, 5th ed. Upper
Saddle River, NJ: Pearson Prentice Hall.
Lusk, S., S. Paley and A. Spanyi (2005), "The evolution of Business Process Management as a
professional discipline," BP Trends, www.bptrends.com
Mabert, V. A. (1982), "Service operations management: Research and application," Journal of Operations Management, 2(4), 203-209.
Machuca, J. A. D., M. M. Gonzalez-Zamora and V. G. Aguilar-Escobar (2007), "Service Operations
Management research," Journal of Operations Management, 25(3), 585-603.
Maddern, H., R. Maull, A. Smart and P. Baker (2007), "Customer satisfaction and service quality in UK financial services," International Journal of Operations & Production Management, 27(9), 999-1019.
Maddern, H. and P. A. Smart (2009), "Implementing Business Process Management: implications for the transformation model," 16th EurOMA conference: Goeteborg, Sweden
Madison, D. (2005), Process Mapping, Process Improvement, and Process Management: Paton Press.
Markus, M. L. (2001), "Reflections on the systems integration enterprise," Business Process Management
Journal, 7(3), 1-8.
Maull, R. S. (2008), "An Introduction to Developing a Business Process Architecture," Working paper, University of Exeter.
Maull, R. S., A. M. Weaver, S. J. Childe, P. A. Smart and J. Bennett (1995), "Current issues in business
process re-engineering," International Journal of Operations & Production Management, 15(11), 37-52.
Mayer, K. J., J. T. Bowen and M. R. Moulton (2003), "A proposed model of the descriptors of service
process," Journal of Services Marketing, 17(6), 17621-17639.
McAdam, R. and B. Lafferty (2004), "A multilevel case study critique of six sigma: statistical control or strategic change?," International Journal of Operations and Production Management, 24(5), 530-549.
McCabe, D. (2000), "The Swings and Roundabouts of Innovating for Quality in UK Financial Services,"
The Service Industries Journal, 20(4), 1 - 20.
McClintock, C. (1985), "Process Sampling: A Method for Case Study Research on Administrative Behavior," Educational Administration Quarterly, 21(3), 205-222.
McCormack, K. and B. Johnson (2001), "Business process orientation, supply chain management, and the e-corporation," IIE Solutions, 33(10), 33-37.
McLaughlin, C. P. (1996), "Why variation reduction is not everything: a new paradigm for service
operations," International Journal of Service Industry Management, 7(3), 17 - 30.
McLaughlin, C. P., R. T. Pannesi and N. Kathuria (1991), "The Different Operations Strategy Planning Process for Service Operations," International Journal of Operations & Production Management, 11(3),
63-76.

253
Melao, N. and M. Pidd (2000), "A conceptual framework for understanding business processes and business process modelling," Information Systems Journal, 10(2), 105-129.
Meredith, J. (1993), "Theory Building through Conceptual Methods," International Journal of Operations
& Production Management, 13(5), 3-11.
Meredith, J. (1998), "Building operations management theory through case and field research," Journal of
Operations Management, 16(4), 441-454.
Meredith, J. R., A. Raturi, K. Amoako-Gyampah and B. Kaplan (1989), "Alternative research paradigms in operations," Journal of Operations Management, 8(4), 297-326.
Mersha, T. (1990), "Enhancing the customer contact model," Journal of Operations Management, 9(3),
391-405.
Mertins, K. and R. Jochem (1999), Quality-Oriented Design of Business Processes. Dordrecht: Kluwer
Academic Publishers.
Metters, R. and A. Marucheck (2007), "Service Management - Academic Issues and Scholarly Reflections from Operations Management Researchers," Decision Sciences, 38(2), 195-214.
Metters, R. and V. Vargas (2000), "A typology of de-coupling strategies in mixed services," Journal of
Operations Management, 18(6), 663-682.
Meyer, C. (1993), Fast Cycle Time. NY: The Free Press.
Meyer, A. D., A. S. Tsui and C. R. Hinings (1993), "Configurational Approaches to Organizational Analysis," Academy of Management Journal, 36(6), 1175-1195.
Miles, M. B. and A. M. Huberman (1994), Qualitative Data Analysis - An Expanded Sourcebook. Newbury Park: CA: Sage.
Miller, E. J. and A. K. Rice (1967), Systems of Organization: The control of task and sentient boundaries.
London: Tavistock Publications.
Mills, P. K. and D. J. Moberg (1982), "Perspectives on the Technology of Service Operations," The Academy of Management Review, 7(3), 467-478.
Mills, P. K. and T. Turk (1986), "A Preliminary Investigation Into the Influence of Customer-Firm Interface on Information Processing and Task Activities in Service Organizations," Journal of
Management, 12(1), 91-104.
Mohr, L. A. and M. J. Bitner (1995), "The Role of Employee Effort in Satisfaction with Service Transactions," Journal of Business Research, 32(3), 239-252.
Morris, B. and R. Johnston (1987), "Dealing with Inherent Variability: The Difference Between Manufacturing and Service?," International Journal of Operations & Production Management, 7(4), 13-
22.
Myhal, G. C., J. Kang and J. A. Murphy (2008), "Retaining customers through relationship quality: a
services business marketing case," Journal of Services Marketing, 22(6), 445-453.
Napoleon, K. and C. Gaimon (2004), "The Creation of Output and Quality in Services: A Framework to Analyze Information Technology-Worker Systems," Production & Operations Management, 13(3), 245-
259.
Narasimhan, R. and J. Jayaram (1998), "Reengineering service operations: a longitudinal case study,"
Journal of Operations Management, 17(1), 7-22.
Narayanan, S., S. Balasubramanian and J. M. Swaminathan (2009), "A Matter of Balance: Specialization, Task Variety, and Individual Learning in a Software Maintenance Environment," Management Science,
55(11), 1861-1876.
Nie, W. and D. L. Kellogg (1999), "How professors of operations management view service operations?,"
Production & Operations Management, 8(3), 339-355.
Pagell, M., R. B. Handfield and A. E. Barber (2000), "Effects of operational employee skills on advanced manufacturing technology performance," Production and Operations Management, 9(3), 222-238.
Palmberg, K. (2009), "Exploring process management: are there any widespread models and definitions?," The TQM Journal, 21(2), 203-215.

254
Palmberg, K. (2010), "Experiences of implementing process management: a multiple-case study," Business Process Management Journal, 16(1), 93-112.
Pannirselvam, G. P., L. A. Ferguson, R. C. Ash and S. P. Siferd (1999), "Operations management
research: an update for the 1990s," Journal of Operations Management, 18(1), 95-112.
Parasuraman, A., V. A. Zeithaml and L. L. Berry (1985), "A Conceptual Model of Service Quality and Its
Implications for Future Research," Journal of Marketing, 49(4), 41-50.
Parasuraman, A., V. A. Zeithaml and L. L. Berry (1988), "SERVQUAL: A Multiple-Item Scale for Measuring Consumer Perceptions of Service Quality," Journal of Retailing, 64(1), 12-40.
Parkhe, A. (1993), ""Messy" Research, Methodological Predispositions, and Theory Development in
International Joint Ventures," The Academy of Management Review, 18(2), 227-268.
Patton, M. Q. (1990), Qualitative evaluation and research methods. Thousand Oaks, CA: Sage
Publications.
Pentland, B. T. (2003), "Conceptualizing and Measuring Variety in the Execution of Organizational Work Processes," Management Science, 49(7), 857-870.
Perry, C. (1998), "Processes of a case study methodology for postgraduate research in marketing,"
European Journal of Marketing, 32(9/10), 785-702.
Pfeffer, J. (2007), "A modest proposal: how we might change the process and product of managerial
research," Academy of Management Journal, 50(6), 1334-1345.
Picazo-Tadeo, A. J., F. Gonzalez-Gomez and F. J. Saez-Fernandez (2009), "Accounting for operating environments in measuring water utilities' managerial efficiency," The Service Industries Journal, 29(6),
761-773.
Pilkington, A. and R. Fitzgerald (2006), "Operations management themes, concepts and relationships: a forward retrospective of IJOPM," International Journal of Operations & Production Management, 26(11), 1255-1275.
Pilkington, A. and J. Meredith (2009), "The evolution of the intellectual structure of operations management--1980-2006: A citation/co-citation analysis," Journal of Operations Management, 27(3),
185-202.
Ponsignon, F., A. Smart and R. S. Maull (2007), "A new perspective on service delivery systems: the
transformational context," Working Paper, University of Exeter,
Pritchard, J.-P. and C. Armistead (1999), "Business process management - lessons from European business," Business Process Management Journal, 5(1), 10-35.
Pullman, M. E. and W. L. Moore (1999), "Optimal service design: integrating marketing and operations
perspectives," International Journal of Service Industry Management, 10(2), 239-261.
Ramaswamy, R. (1996), Design and management of service processes: keeping customers for life.
Reading, MA: Addison-Wesley.
Rao, S. and C. Perry (2002), "Thinking about relationship marketing: where are we now?," The Journal of Business and Industrial Marketing, 17(7), 598-614.
Reichheld, F. F. and E. W. Sasser (1990), "Zero defections: Quality comes to services," Harvard Business
Review, 68(5), 105-111.
Reijers, H. A. and S. Liman Mansar (2005), "Best practices in business process redesign: an overview and
qualitative evaluation of successful redesign heuristics," Omega, 33(4), 283-306.
Remenyi, D., B. Williams, A. Money and E. Swartz (1998), Doing Research in Business and Management: An Introduction to Process and Method. London: Sage Publications.
Riege, A. M. (2003), "Validity and reliability tests in case study research: a literature review with "hands-on" applications for each research phase," Qualitative Market Research: An International Journal, 6(2),
75-86.
Rolfe, H. (1990), "In the name of progress? skill and attitudes towards technological change," New Technology, Work and Employment, 5(2), 107-121.

255
Roth, A. V. (2007), "Applications of Empirical Science in Manufacturing and Service Operations," Manufacturing & Service Operations Management, 9(4), 353-367.
Roth, A. V. and L. J. Menor (2003a), "Designing and managing service operations: introduction to the
special issue," Production & Operations Management, 12(2), 141-144.
Roth, A. V. and L. J. Menor (2003b), "Insights into service operations management: a research agenda,"
Production & Operations Management, 12(2), 145-164.
Roth, A. V., R. G. Schroeder, X. Huang and M. M. Kristal (2008), Handbook of metrics for research in operations management: Multi-item measurement scales and objective items. Thousand Oaks, CA: Sage.
Rust, R. (2004), "A Call for a Wider Range of Service Research," Journal of Service Research, 6(3), 211-
213.
Rynes, S. (2007), "Let's create a tipping point: what academics and practitioners can do, alone and
together," Academy of Management Journal, 50(5), 1046-1054.
Rynes, S. L. and D. B. McNatt (2001), "Bringing the organization into organizational research: an examination of academic research inside organizations," Journal of Business & Psychology, 16(1), 3-20.
Rynes, S. L., D. B. McNatt and R. D. Bretz (1999), "Academic research inside organizations: inputs,
processes, and outcomes," Personnel Psychology, 52(4), 869-898.
Safizadeh, M. H., J. M. Field and L. P. Ritzman (2003), "An empirical analysis of financial services processes with a front-office or back-office orientation," Journal of Operations Management, 21(5), 557-576.
Sampson, S. E. (2007), "(Why we need) An Operations Paradigm for Services?," POMS / College of Service Operations: London.
Sampson, S. E. and C. M. Froehle (2006), "Foundations and Implications of a Proposed Unified Services
Theory," Production & Operations Management, 15(2), 329-343.
Sampson, S. E. and L. J. Menor (forthcoming), "Applying Service Logic and Theory to Entrepreneurship"
Sasser, E. W., P. R. Olsen and D. D. Wyckoff (1978), Management of Service Operations: Text, Cases, and Readings. Boston, MA: Allyn & Bacon.
Saunders, M., P. Lewis and A. Thornhill (2000), Research Methods for Research Students, 2nd ed.
Harlow: Pearson Education Limited.
Scheuing, E. Z. and E. M. Johnson (1989), "A proposed model for new service development," Journal of Services Marketing, 3(2), 25-34.
Schmenner, R. W. (1986), "How Can Service Businesses Survive and Prosper?," Sloan Management Review, 27(3), 21-32.
Schmenner, R. W. (2004), "Service Businesses and Productivity," Decision Sciences, 35(3), 333-347.
Seyal, A. H., M. M. Awais, S. Shamail and A. Abbas (2004), "Determinants of Electronic Commerce in Pakistan: Preliminary Evidence from Small and Medium Enterprises," Electronic Markets, 14(4), 372 - 387.
Shieff, D. and R. Brodie (1995), "Customer service mapping: How to make customer satisfaction research deliver actionable results to managers," Australian Journal of Market Research, 3(1), 31-37.
Shostack, G. L. (1984), "Designing services that deliver," Harvard Business Review, 62(1), 133-139.
Shostack, G. L. (1987), "Service Positioning Through Structural Change," Journal of Marketing, 51(1), 34-43.
Silver, E. A. (2004), "Process Management Instead of Operations Management," Manufacturing and Service Operations Management, 6(4), 273-279.
Silvestro, R. (1999), "Positioning services along the volume-variety diagonal," International Journal of
Operations & Production Management, 19(3/4), 399-420.
Silvestro, R., L. Fitzgerald, R. Johnston and C. A. Voss (1992), "Towards a classification of service processes," International Journal of Service Industry Management, 3(3), 62-75.

256
Silvestro, R. and C. Silvestro (2003), "New service design in the NHS: an evaluation of the strategic alignment of NHS Direct," International Journal of Operations & Production Management, 23(4), 401-
417.
Silvestro, R. and C. Westley (2002), "Challenging the paradigm of the process enterprise: a case-study
analysis of BPR implementation," Omega-International Journal of Management Science, 30(3), 215-225.
Skaggs, B. C. and T. R. Huffman (2003), "A customer interaction approach to strategy and production complexity alignment in service firms," Academy of Management Journal, 46(6), 775-786.
Skinner, W. (1974), "The focused factory," Harvard Business Review, 52(3), 113-121.
Slack, N., S. Chambers and R. Johnston (2004a), Operations management, 4th ed. Harlow, England: FT
Prentice Hall.
Slack, N. and M. Lewis (2005), "Towards a definitional model of business process technology,"
International Journal of Process Management and Benchmarking, 1(1), 3-24.
Slack, N., M. Lewis and H. Bates (2004b), "The two worlds of operations management research and practice: Can they meet, should they meet?," International Journal of Operations & Production
Management, 24(4), 372-387.
Small, M. W. 2007. Encyclopedia of Business Ethics and Society. Sage.
Smart, P., R. S. Maull, S. J. Childe and A. M. Weaver (1997), "Integration in small and medium enterprises specification of a business process re-engineering methodology," in Enterprise Engineering and Integration: Building International Consensus, K Kosanke, J-G Nell, eds. Berlin: Springer, 449-458.
Smart, P. A., H. Maddern and R. S. Maull (2009), "Understanding Business Process Management: Implications for Theory and Practice," British Journal of Management, 20(4), 491-507.
Smart, P. A., R. S. Maull and S. J. Childe (1999), "A reference model of 'operate' processes for process-
based change," International Journal of Computer Integrated Manufacturing, 12(6), 471-482.
Smith, T. M. and J. S. Reece (1999), "The relationship of strategy, fit, productivity, and business performance in a services setting," Journal of Operations Management, 17(2), 145-161.
Sobh, R. and C. Perry (2006), "Research design and data analysis in realism research," European Journal
of Marketing, 40(11/12), 1194-1209.
Soteriou, A. C. and R. B. Chase (1998), "Linking the customer contact model to service quality," Journal
of Operations Management, 16(4), 495-508.
Sousa, R. (2000), "Quality management practice: Universal or context-dependent? An empirical investigation," Unpublished PhD thesis, London Business School, London.
Sousa, R. and C. Voss (2001), "Quality Management: Universal or Context Dependent?," Production &
Operations Management, 10(4), 383-404.
Sousa, R. and C. A. Voss (2006), "Service Quality in Multichannel Services Employing Virtual
Channels," Journal of Service Research, 8(4), 356-371.
Sousa, R. and C. A. Voss (2008), "Contingency research in operations management practices," Journal of Operations Management, 26(6), 697-713.
Southern, G. (1999), "A systems approach to performance measurement in hospitality," International
Journal of Contemporary Hospitality Management, 11(7), 366-376.
Spring, M. and L. Araujo (2009), "Service, services and products: rethinking operations strategy," International Journal of Operations & Production Management, 29(5), 444-467.
Stauss, B. (2005), "A Pyrrhic victory: The implications of an unlimited broadening of the concept of services," Managing Service Quality, 15(3), 219-229.
Stuart, I., D. McCutcheon, R. Handfield, R. McLachlin and D. Samson (2002), "Effective case research in
operations management: a process perspective," Journal of Operations Management, 20(5), 419-433.
Swamidass, P. M. (1991), "Empirical science: new frontier in operations management research," Academy of Management Review, 16(4), 793-314.
Swank, C. (2003), "The lean service machine," Harvard Business Review, 81(10), 123-129.

257
Tansik, D. A. (1990), "Balance in service systems design," Journal of Business Research, 20(1), 55-61.
Tax, S. S. and I. Stuart (1997), "Designing and Implementing New Services: The Challenges of Integrating Service Systems," Journal of Retailing, 73(1), 105-134.
Taylor, A. and M. Taylor (2009), "Operations management research: contemporary themes, trends and potential future directions," International Journal of Operations & Production Management, 29(12), 1316-
1340.
Thomas, D. R. E. (1978), "Strategy is different in service businesses," Harvard Business Review, 56(4), 158-165.
Tinnilae, M. and A. P. J. Vepsaelaeinen (1995), "A model for strategic repositioning of service
processes," International Journal of Service Industry Management, 6(4), 57-80.
Tseng, M. M., M. Qinha and C.-J. Su (1999), "Mapping customers' service experience for operations
improvement," Business Process Management Journal, 5(1), 50-64.
Tummers, G. E. R., J. A. Landeweerd and G. G. van Merode (2002), "Work Organization, Work Characteristics, and Their Psychological Effects on Nurses in the Netherlands," International Journal of
Stress Management, 9(3), 183-206.
Vargo, S. L. and R. F. Lusch (2004a), "Evolving to a New Dominant Logic for Marketing," Journal of
Marketing, 68(1), 1-17.
Vargo, S. L. and R. F. Lusch (2004b), "The Four Service Marketing Myths: Remnants of a Goods-Based, Manufacturing Model," Journal of Service Research, 6(4), 324-335.
Verma, R. (2000), "An empirical analysis of management challenges in service factories, service shops, mass services and professional services," International Journal of Service Industry Management, 11(1), 8-
25.
Verma, R., J. Fitzsimmons, J. Heineke and M. Davis (2002), "New issues and opportunities in service design research," Journal of Operations Management, 20(2), 117-120.
Verma, R. and G. M. Thompson (1999), "Managing service operations based on customer preferences," International Journal of Operations & Production Management, 19(9), 891-908.
Verma, R. and S. T. Young (2000), "Configurations of low-contact services," Journal of Operations
Management, 18(6), 643-661.
Voss, C., N. Tsikriktsis and M. Frohlich (2002), "Case research in operations management," International Journal of Operations & Production Management, 22(2), 195-219.
Wacker, J. G. (1998), "A definition of theory: research guidelines for different theory-building research methods in operations management," Journal of Operations Management, 16(4), 361-385.
Walley, P. and V. Amin (1994), "Automation in a Customer Contact Environment," International Journal
of Operations & Production Management, 14(5), 86-100.
Wathen, S. and J. C. Anderson (1995), "Designing services: an information-processing approach," International Journal of Service Industry Management, 6(1), 64-76.
Weick, K. E. (1989), "Theory Construction as Disciplined Imagination," The Academy of Management Review, 14(4), 516-531.
Wemmerloev, U. (1990), "A Taxonomy for Service Processes and its Implications for System Design,"
International Journal of Service Industry Management, 1(3), 20-40.
Weske, M., W. M. P. van der Aalst and H. M. W. Verbeek (2004), "Advances in business process management," Data & Knowledge Engineering, 50(1), 1-8.
Westbrook, R. (1995), "Action research: a new paradigm for research in production and operations
management," International Journal of Operations & Production Management, 15(12), 6-20.
Wilson, B. (1980), Systems: Concepts, Methodologies and Applications. London: John Wiley.
Wood, M. (1994), "Statistical Methods for Monitoring Service Processes," International Journal of Service Industry Management, 5(4), 53-68.

258
Woodall, T. (2001), "Six Sigma and Service Quality: Christian Groenroos Revisited," Journal of Marketing Management, 17(5/6), 595-607.
Wright, C. M. and G. Mechling (2002), "The importance of operations management problems in service
organizations," Omega, 30, 77-87.
Wu, B. (1994), Manufacturing systems design and analysis, 2nd ed. London: Chapman & Hall.
Yin, R. K. (2003), Case study research: design and methods, 3rd ed. Thousand Oaks: CA: Sage Publications.
Zairi, M. (1997), "Business process management: a boundaryless approach to modern competitiveness," Business Process Management Journal, 3(1), 64-80.
Zeithaml, V. A., M. J. Bitner and D. D. Gremler (2006), Services marketing, 4th ed. Boston, MA:
McGraw-Hill/Irwin.
Zeithaml, V. A., A. Parasuraman and L. L. Berry (1985), "Problems and Strategies in Services Marketing," Journal of Marketing, 49(2), 33-36.
Zomerdijk, L. G. and J. de Vries (2007), "Structuring front office and back office work in service delivery systems," International Journal of Operations & Production Management, 27(1), 108-131.
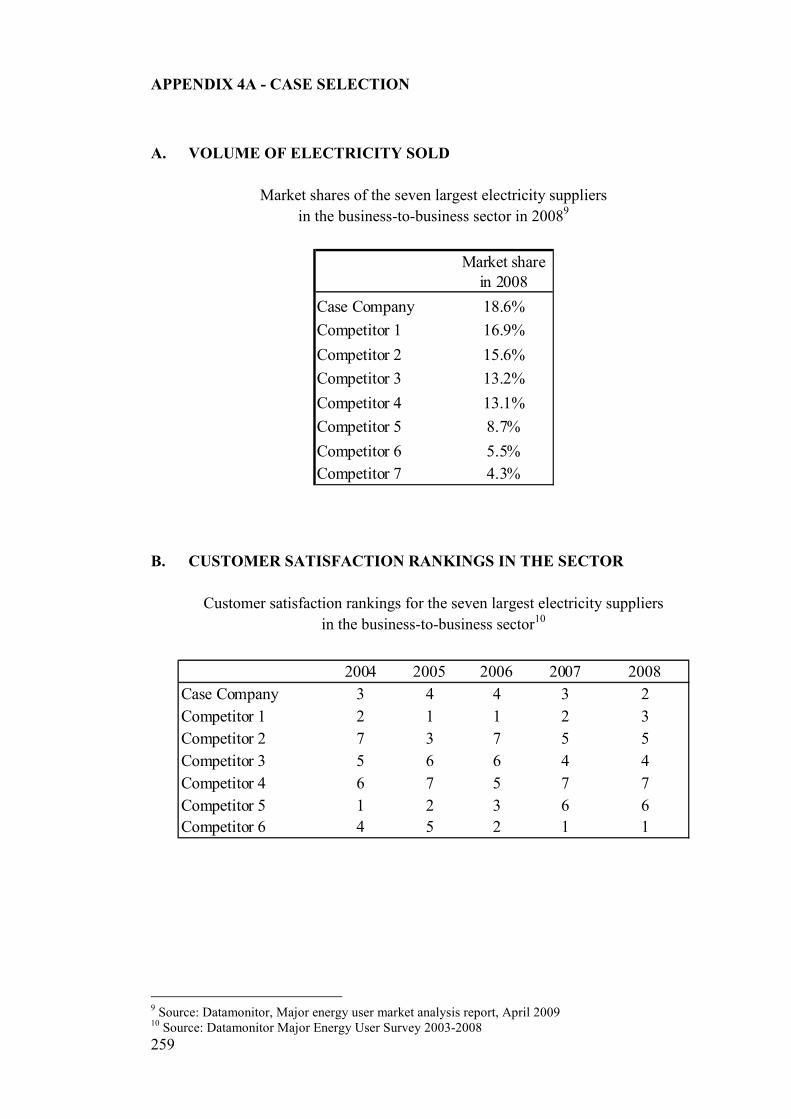
259
APPENDIX 4A - CASE SELECTION
A. VOLUME OF ELECTRICITY SOLD
Market shares of the seven largest electricity suppliers
in the business-to-business sector in 20089
Market share
in 2008
Case Company 18.6%
Competitor 1 16.9%
Competitor 2 15.6%
Competitor 3 13.2%
Competitor 4 13.1%
Competitor 5 8.7%
Competitor 6 5.5%
Competitor 7 4.3%
B. CUSTOMER SATISFACTION RANKINGS IN THE SECTOR
Customer satisfaction rankings for the seven largest electricity suppliers
in the business-to-business sector10
2004 2005 2006 2007 2008
Case Company 3 4 4 3 2
Competitor 1 2 1 1 2 3
Competitor 2 7 3 7 5 5
Competitor 3 5 6 6 4 4
Competitor 4 6 7 5 7 7
Competitor 5 1 2 3 6 6
Competitor 6 4 5 2 1 1
9 Source: Datamonitor, Major energy user market analysis report, April 2009 10 Source: Datamonitor Major Energy User Survey 2003-2008
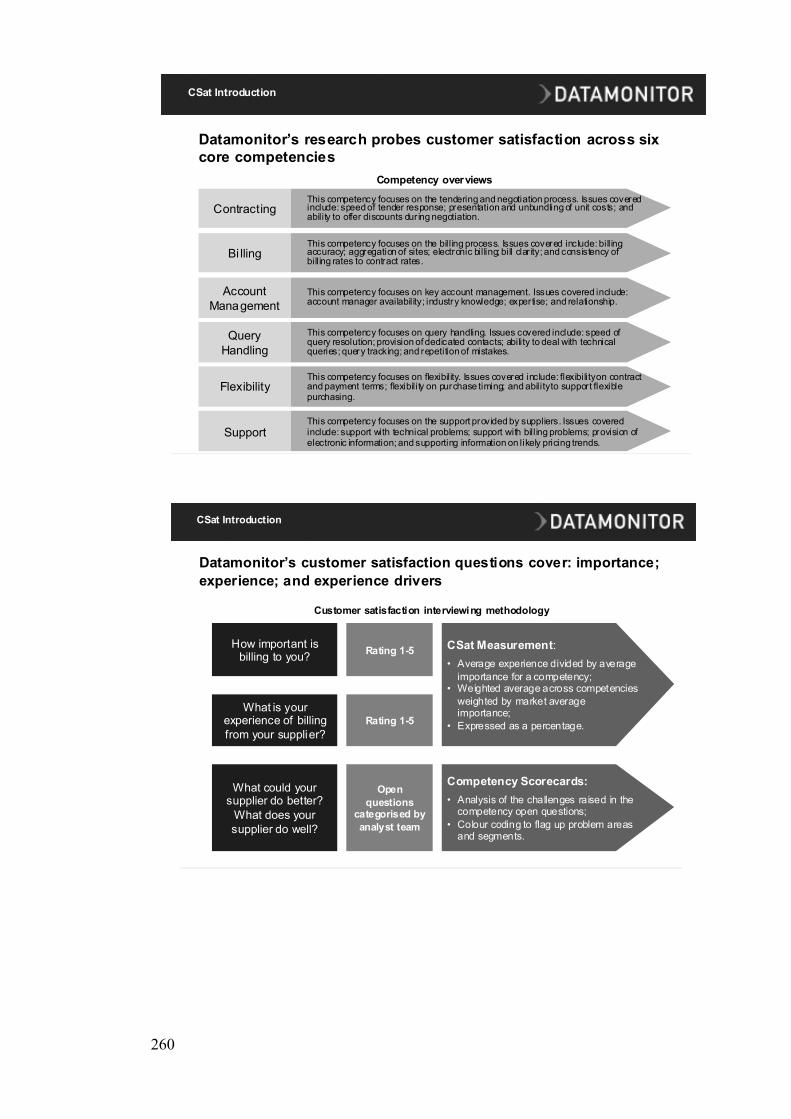
260
Datamonitor’s research probes customer satisfaction across six
core competencies
Competency overviews
ContractingThis competency focuses on the tendering and negotiation process. Issues covered include: speed of tender response; presentation and unbundling of unit costs; and ability to offer discounts during negotiation.
Bi llingThis competency focuses on the billing process. Issues covered include: billing accuracy; aggregation of sites; electronic billing; bill clar ity; and consistency of billing rates to contract rates.
Account
Management
This competency focuses on key account management. Issues covered include: account manager availability; industry knowledge; expertise; and relationship.
Query
Handling
This competency focuses on query handling. Issues covered include: speed of query resolution; provision of dedicated contacts; ability to deal with technical queries; query tracking; and repetition of mistakes.
FlexibilityThis competency focuses on flexibility. Issues covered include: flexibility on contract and payment terms; flexibility on purchase timing; and ability to support flexible purchasing.
SupportThis competency focuses on the support provided by suppliers. Issues covered include: support with technical problems; support with billing problems; provision of electronic information; and supporting information on likely pricing trends.
CSat Introduction
Datamonitor’s customer satisfaction questions cover: importance;
experience; and experience drivers
How important is billing to you?
What is your experience of billing
from your supplier?
What could your supplier do better?
What does your
supplier do well?
CSat Measurement:
• Average experience divided by average
importance for a competency;• Weighted average across competencies
weighted by market average importance;
• Expressed as a percentage.
Rating 1-5
Rating 1-5
Open
questions categorised by
analyst team
Competency Scorecards:
• Analysis of the challenges raised in the competency open questions;
• Colour coding to flag up problem areas and segments.
Customer satisfaction interviewing methodology
CSat Introduction
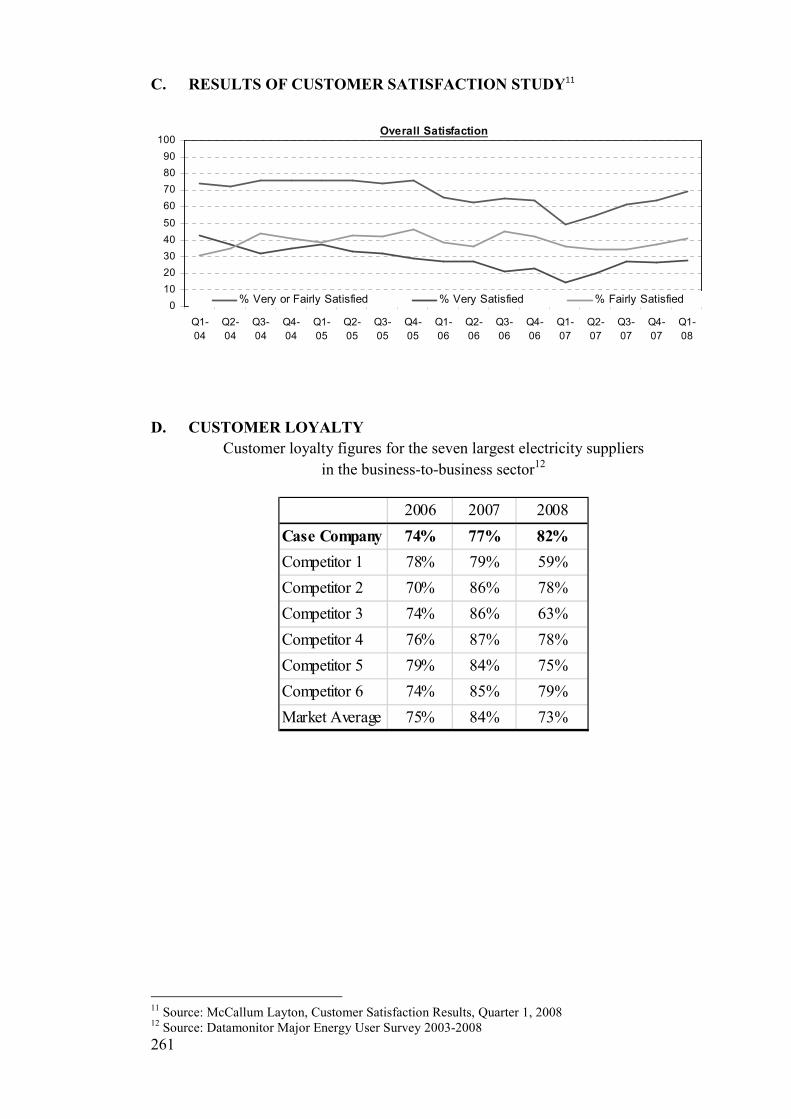
261
C. RESULTS OF CUSTOMER SATISFACTION STUDY11
Overall Satisfaction
0
10
20
30
40
50
60
70
80
90
100
Q1-
04
Q2-
04
Q3-
04
Q4-
04
Q1-
05
Q2-
05
Q3-
05
Q4-
05
Q1-
06
Q2-
06
Q3-
06
Q4-
06
Q1-
07
Q2-
07
Q3-
07
Q4-
07
Q1-
08
% Very or Fairly Satisfied % Very Satisfied % Fairly Satisfied
D. CUSTOMER LOYALTY
Customer loyalty figures for the seven largest electricity suppliers
in the business-to-business sector12
2006 2007 2008
Case Company 74% 77% 82%
Competitor 1 78% 79% 59%
Competitor 2 70% 86% 78%
Competitor 3 74% 86% 63%
Competitor 4 76% 87% 78%
Competitor 5 79% 84% 75%
Competitor 6 74% 85% 79%
Market Average 75% 84% 73%
11 Source: McCallum Layton, Customer Satisfaction Results, Quarter 1, 2008 12 Source: Datamonitor Major Energy User Survey 2003-2008
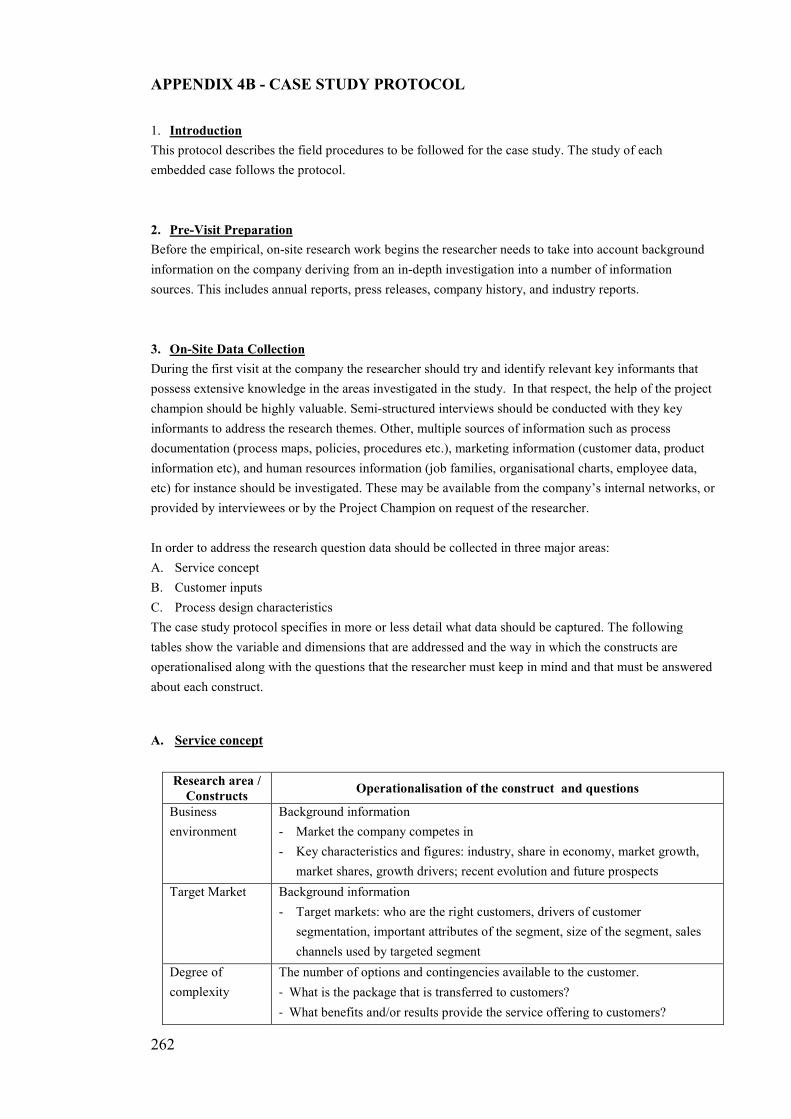
262
APPENDIX 4B - CASE STUDY PROTOCOL
1. Introduction
This protocol describes the field procedures to be followed for the case study. The study of each
embedded case follows the protocol.
2. Pre-Visit Preparation
Before the empirical, on-site research work begins the researcher needs to take into account background
information on the company deriving from an in-depth investigation into a number of information
sources. This includes annual reports, press releases, company history, and industry reports.
3. On-Site Data Collection
During the first visit at the company the researcher should try and identify relevant key informants that
possess extensive knowledge in the areas investigated in the study. In that respect, the help of the project
champion should be highly valuable. Semi-structured interviews should be conducted with they key
informants to address the research themes. Other, multiple sources of information such as process
documentation (process maps, policies, procedures etc.), marketing information (customer data, product
information etc), and human resources information (job families, organisational charts, employee data,
etc) for instance should be investigated. These may be available from the company’s internal networks, or
provided by interviewees or by the Project Champion on request of the researcher.
In order to address the research question data should be collected in three major areas:
A. Service concept
B. Customer inputs
C. Process design characteristics
The case study protocol specifies in more or less detail what data should be captured. The following
tables show the variable and dimensions that are addressed and the way in which the constructs are
operationalised along with the questions that the researcher must keep in mind and that must be answered
about each construct.
A. Service concept
Research area /
Constructs Operationalisation of the construct and questions
Business
environment
Background information
- Market the company competes in
- Key characteristics and figures: industry, share in economy, market growth,
market shares, growth drivers; recent evolution and future prospects
Target Market Background information
- Target markets: who are the right customers, drivers of customer
segmentation, important attributes of the segment, size of the segment, sales
channels used by targeted segment
Degree of
complexity
The number of options and contingencies available to the customer.
- What is the package that is transferred to customers?
- What benefits and/or results provide the service offering to customers?
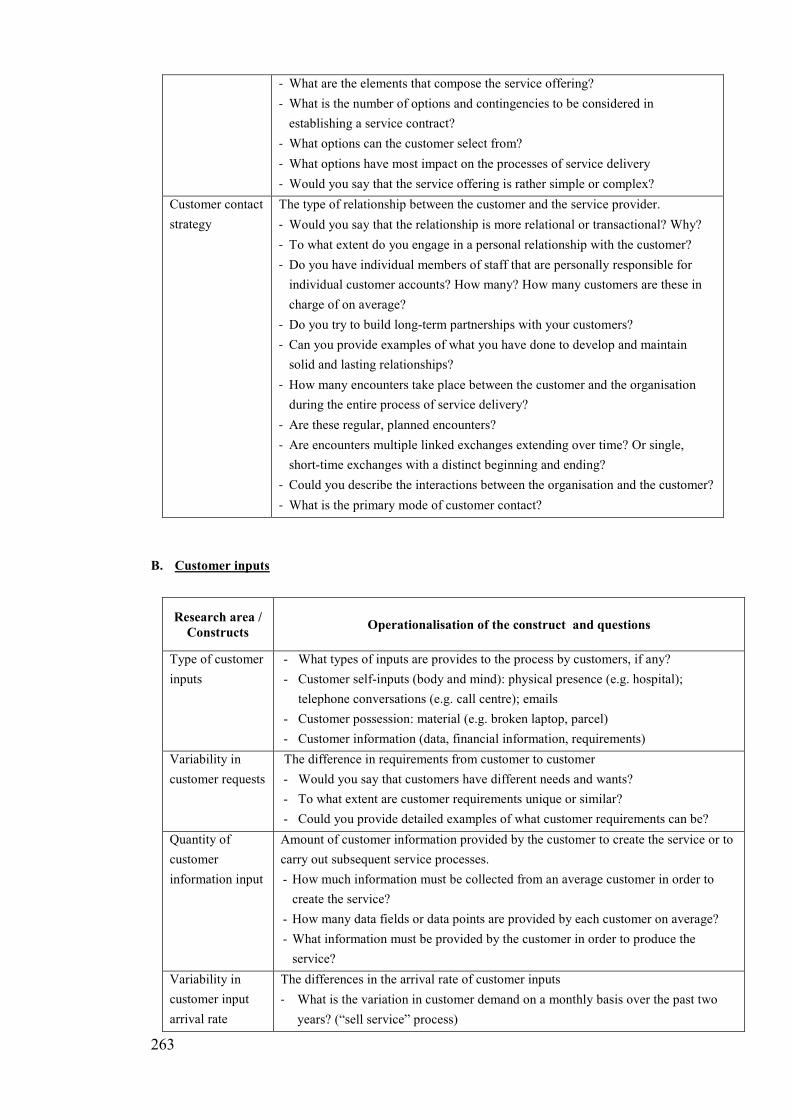
263
- What are the elements that compose the service offering?
- What is the number of options and contingencies to be considered in
establishing a service contract?
- What options can the customer select from?
- What options have most impact on the processes of service delivery
- Would you say that the service offering is rather simple or complex?
Customer contact
strategy
The type of relationship between the customer and the service provider.
- Would you say that the relationship is more relational or transactional? Why?
- To what extent do you engage in a personal relationship with the customer?
- Do you have individual members of staff that are personally responsible for
individual customer accounts? How many? How many customers are these in
charge of on average?
- Do you try to build long-term partnerships with your customers?
- Can you provide examples of what you have done to develop and maintain
solid and lasting relationships?
- How many encounters take place between the customer and the organisation
during the entire process of service delivery?
- Are these regular, planned encounters?
- Are encounters multiple linked exchanges extending over time? Or single,
short-time exchanges with a distinct beginning and ending?
- Could you describe the interactions between the organisation and the customer?
- What is the primary mode of customer contact?
B. Customer inputs
Research area /
Constructs Operationalisation of the construct and questions
Type of customer
inputs
- What types of inputs are provides to the process by customers, if any?
- Customer self-inputs (body and mind): physical presence (e.g. hospital);
telephone conversations (e.g. call centre); emails
- Customer possession: material (e.g. broken laptop, parcel)
- Customer information (data, financial information, requirements)
Variability in
customer requests
The difference in requirements from customer to customer
- Would you say that customers have different needs and wants?
- To what extent are customer requirements unique or similar?
- Could you provide detailed examples of what customer requirements can be?
Quantity of
customer
information input
Amount of customer information provided by the customer to create the service or to
carry out subsequent service processes.
- How much information must be collected from an average customer in order to
create the service?
- How many data fields or data points are provided by each customer on average?
- What information must be provided by the customer in order to produce the
service?
Variability in
customer input
arrival rate
The differences in the arrival rate of customer inputs
- What is the variation in customer demand on a monthly basis over the past two
years? (“sell service” process)
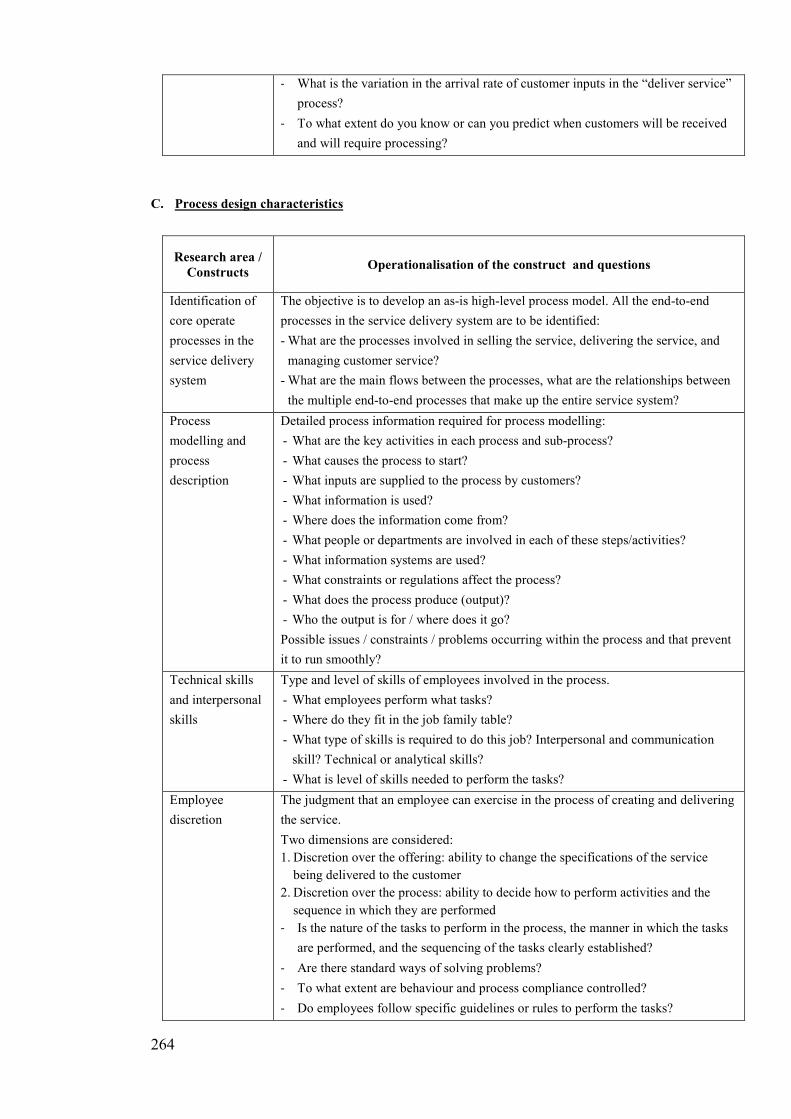
264
- What is the variation in the arrival rate of customer inputs in the “deliver service”
process?
- To what extent do you know or can you predict when customers will be received
and will require processing?
C. Process design characteristics
Research area /
Constructs Operationalisation of the construct and questions
Identification of
core operate
processes in the
service delivery
system
The objective is to develop an as-is high-level process model. All the end-to-end
processes in the service delivery system are to be identified:
- What are the processes involved in selling the service, delivering the service, and
managing customer service?
- What are the main flows between the processes, what are the relationships between
the multiple end-to-end processes that make up the entire service system?
Process
modelling and
process
description
Detailed process information required for process modelling:
- What are the key activities in each process and sub-process?
- What causes the process to start?
- What inputs are supplied to the process by customers?
- What information is used?
- Where does the information come from?
- What people or departments are involved in each of these steps/activities?
- What information systems are used?
- What constraints or regulations affect the process?
- What does the process produce (output)?
- Who the output is for / where does it go?
Possible issues / constraints / problems occurring within the process and that prevent
it to run smoothly?
Technical skills
and interpersonal
skills
Type and level of skills of employees involved in the process.
- What employees perform what tasks?
- Where do they fit in the job family table?
- What type of skills is required to do this job? Interpersonal and communication
skill? Technical or analytical skills?
- What is level of skills needed to perform the tasks?
Employee
discretion
The judgment that an employee can exercise in the process of creating and delivering
the service.
Two dimensions are considered:
1. Discretion over the offering: ability to change the specifications of the service
being delivered to the customer
2. Discretion over the process: ability to decide how to perform activities and the
sequence in which they are performed
- Is the nature of the tasks to perform in the process, the manner in which the tasks
are performed, and the sequencing of the tasks clearly established?
- Are there standard ways of solving problems?
- To what extent are behaviour and process compliance controlled?
- Do employees follow specific guidelines or rules to perform the tasks?
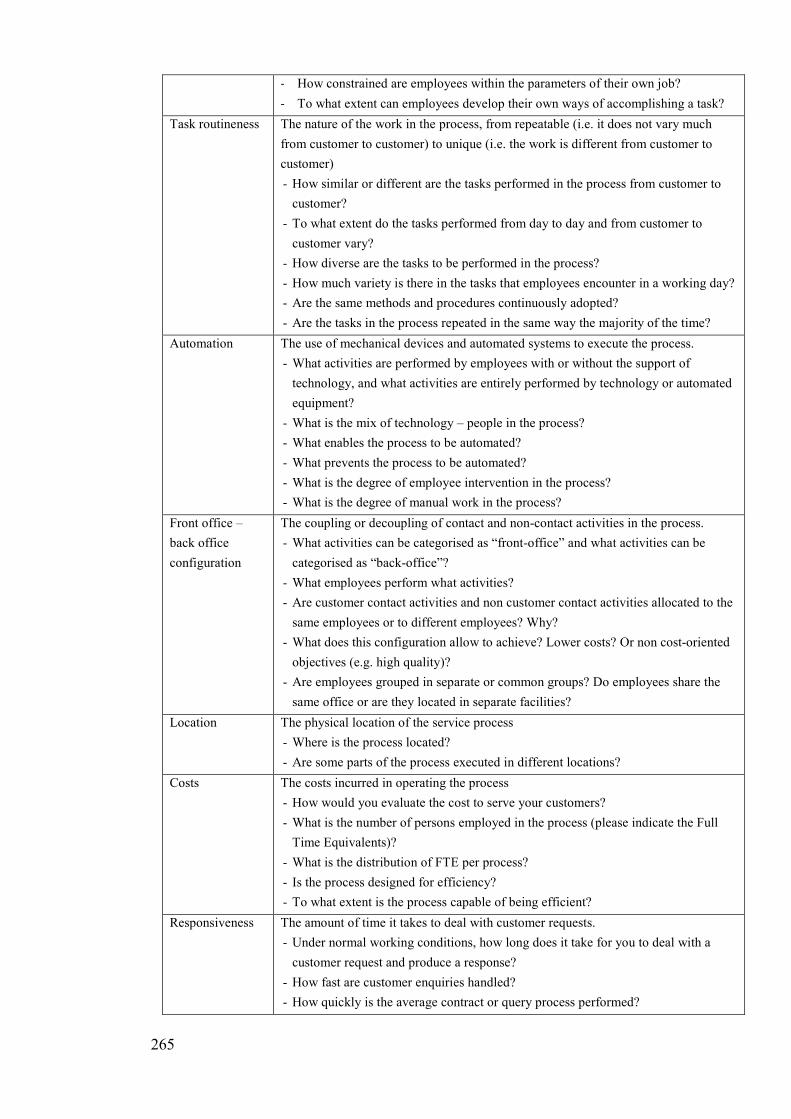
265
- How constrained are employees within the parameters of their own job?
- To what extent can employees develop their own ways of accomplishing a task?
Task routineness The nature of the work in the process, from repeatable (i.e. it does not vary much
from customer to customer) to unique (i.e. the work is different from customer to
customer)
- How similar or different are the tasks performed in the process from customer to
customer?
- To what extent do the tasks performed from day to day and from customer to
customer vary?
- How diverse are the tasks to be performed in the process?
- How much variety is there in the tasks that employees encounter in a working day?
- Are the same methods and procedures continuously adopted?
- Are the tasks in the process repeated in the same way the majority of the time?
Automation The use of mechanical devices and automated systems to execute the process.
- What activities are performed by employees with or without the support of
technology, and what activities are entirely performed by technology or automated
equipment?
- What is the mix of technology – people in the process?
- What enables the process to be automated?
- What prevents the process to be automated?
- What is the degree of employee intervention in the process?
- What is the degree of manual work in the process?
Front office –
back office
configuration
The coupling or decoupling of contact and non-contact activities in the process.
- What activities can be categorised as “front-office” and what activities can be
categorised as “back-office”?
- What employees perform what activities?
- Are customer contact activities and non customer contact activities allocated to the
same employees or to different employees? Why?
- What does this configuration allow to achieve? Lower costs? Or non cost-oriented
objectives (e.g. high quality)?
- Are employees grouped in separate or common groups? Do employees share the
same office or are they located in separate facilities?
Location The physical location of the service process
- Where is the process located?
- Are some parts of the process executed in different locations?
Costs The costs incurred in operating the process
- How would you evaluate the cost to serve your customers?
- What is the number of persons employed in the process (please indicate the Full
Time Equivalents)?
- What is the distribution of FTE per process?
- Is the process designed for efficiency?
- To what extent is the process capable of being efficient?
Responsiveness The amount of time it takes to deal with customer requests.
- Under normal working conditions, how long does it take for you to deal with a
customer request and produce a response?
- How fast are customer enquiries handled?
- How quickly is the average contract or query process performed?

266
4. Post-visits Stage
A case report should be produced shortly after all of the above data has been collected and coded. It
should contain all notes and documents categorised by construct and organised into a coherent text within
each category. The report should be sent to the Process Champion in order to receive feedback about the
validity and reliability of the data collected.
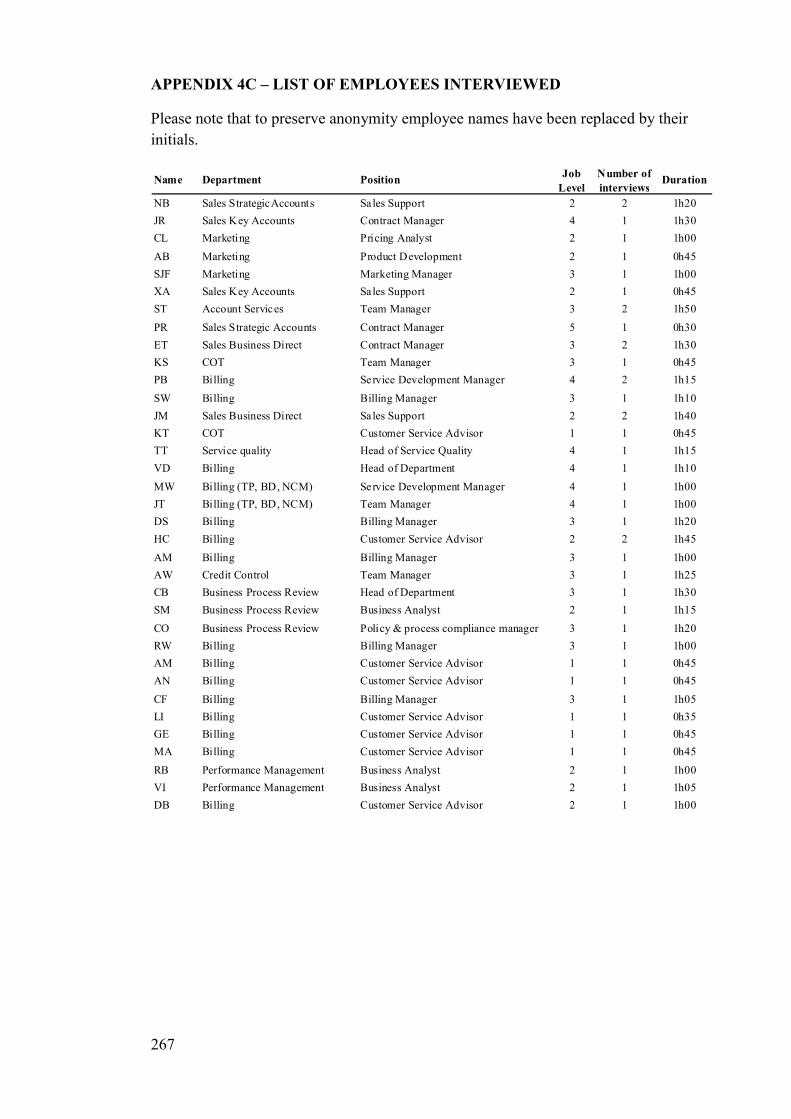
267
APPENDIX 4C – LIST OF EMPLOYEES INTERVIEWED
Please note that to preserve anonymity employee names have been replaced by their
initials.
Name Department PositionJob
Level
Number of
interviewsDuration
NB Sales StrategicAccounts Sales Support 2 2 1h20
JR Sales Key Accounts Contract Manager 4 1 1h30
CL Marketing Pricing Analyst 2 1 1h00
AB Marketing Product Development 2 1 0h45
SJF Marketing Marketing Manager 3 1 1h00
XA Sales Key Accounts Sales Support 2 1 0h45
ST Account Services Team Manager 3 2 1h50
PR Sales Strategic Accounts Contract Manager 5 1 0h30
ET Sales Business Direct Contract Manager 3 2 1h30
KS COT Team Manager 3 1 0h45
PB Billing Service Development Manager 4 2 1h15
SW Billing Billing Manager 3 1 1h10
JM Sales Business Direct Sales Support 2 2 1h40
KT COT Customer Service Advisor 1 1 0h45
TT Service quality Head of Service Quality 4 1 1h15
VD Billing Head of Department 4 1 1h10
MW Billing (TP, BD, NCM) Service Development Manager 4 1 1h00
JT Billing (TP, BD, NCM) Team Manager 4 1 1h00
DS Billing Billing Manager 3 1 1h20
HC Billing Customer Service Advisor 2 2 1h45
AM Billing Billing Manager 3 1 1h00
AW Credit Control Team Manager 3 1 1h25
CB Business Process Review Head of Department 3 1 1h30
SM Business Process Review Business Analyst 2 1 1h15
CO Business Process Review Policy & process compliance manager 3 1 1h20
RW Billing Billing Manager 3 1 1h00
AM Billing Customer Service Advisor 1 1 0h45
AN Billing Customer Service Advisor 1 1 0h45
CF Billing Billing Manager 3 1 1h05
LI Billing Customer Service Advisor 1 1 0h35
GE Billing Customer Service Advisor 1 1 0h45
MA Billing Customer Service Advisor 1 1 0h45
RB Performance Management Business Analyst 2 1 1h00
VI Performance Management Business Analyst 2 1 1h05
DB Billing Customer Service Advisor 2 1 1h00

268
APPENDIX 4D – LIST OF DOCUMENTS COLLECTED
Document name Description Publication dateNumber of
Pages
Departmental Overview Provides an overview of the organisation's department Jan-08 53
Press Briefing Introduction to the Group Jan-08 15
Glossary Glossary of terms Mar-07 29
Employee Satisfaction Survey Customers Branch results (Year on year comparisons.) Mar-08 77
Project PACMANDescribes the end-to-end business processes for the
company's sales and contract set-up activities.Dec-07 136
FAQ PACMAN Project FAQ Dec-07 16
Account Services Overview of Account Services Mar-08 12
Team Structure Account Services Organisational chart Jun-08 1
Team Util ities Presentation Overview of Utilities team in Account Services Jul-08 7
COT presentation Presents the role and structure of the COT team Feb-08 12
COT team structure Organigramm of the NCOT team Feb-08 1
COT - process flowchart Process flowchart Nov-06 1
Conduct the sale - Sales offering/documentation Business policy Jul-08 7
Conduct the sale - Sales offering/documentation Procedure Jul-08 9
Conduct the sale - Sales offering/documentation Process Map Jul-08 1
Conduct the sale - Quotation production Business policy Feb-08 10
Conduct the sale - Quotation production Procedure Feb-08 11
Conduct the sale - Quotation production Process Map Feb-08 1
Conduct the sale - credit vett ing Business policy Feb-08 14
Conduct the sale - credit vett ing Procedure Feb-08 12
Conduct the sale - credit vett ing Process Map Feb-08 1
Conduct the sale - Sales negotiation Business policy Feb-07 11
Conduct the sale - Sales negotiation Procedure Feb-07 10
Conduct the sale - Sales negotiation Process Map Feb-07 1
Process the sale - Sales Acceptance Business policy Feb-07 11
Process the sale - Sales Acceptance Procedure Feb-07 13
Process the sale - Sales Acceptance Process Map Feb-07 1
Process the sale - Account Set Up Business policy Dec-07 7
Process the sale - Account Set Up Procedure Dec-07 6
Process the sale - Account Set Up Process Map Dec-07 1
Process the sale - Contract Acceptance Business policy Aug-07 9
Process the sale - Contract Acceptance Procedure Aug-07 10
Process the sale - Contract Acceptance Process Map Aug-07 1
Serve the customer - Account Allocation Business policy Oct-07 8
Serve the customer - Account Allocation Procedure Oct-07 8
Serve the customer - Account Allocation Process Map Oct-07 1
Serve the customer - Manual Billing Business policy Oct-07 12
Serve the customer - Manual Billing Procedure Oct-07 13
Serve the customer - Manual Billing Process Map Oct-07 2
Serve the customer - Re-billing Business policy Dec-07 10
Serve the customer - Re-billing Procedure Dec-07 8
Serve the customer - Re-billing Process Map Dec-07 1
Serve the customer - Chance of Tenancy (COT) Business policy Jan-08 13
Serve the customer - Chance of Tenancy (COT) Procedure Jan-08 14
Serve the customer - Chance of Tenancy (COT) Process Map Jan-08 1
Serve the customer - Manage correspondence Business policy Dec-06 7
Serve the customer - Manage correspondence Procedure Dec-06 7
Serve the customer - Manage correspondence Process Map Dec-06 1
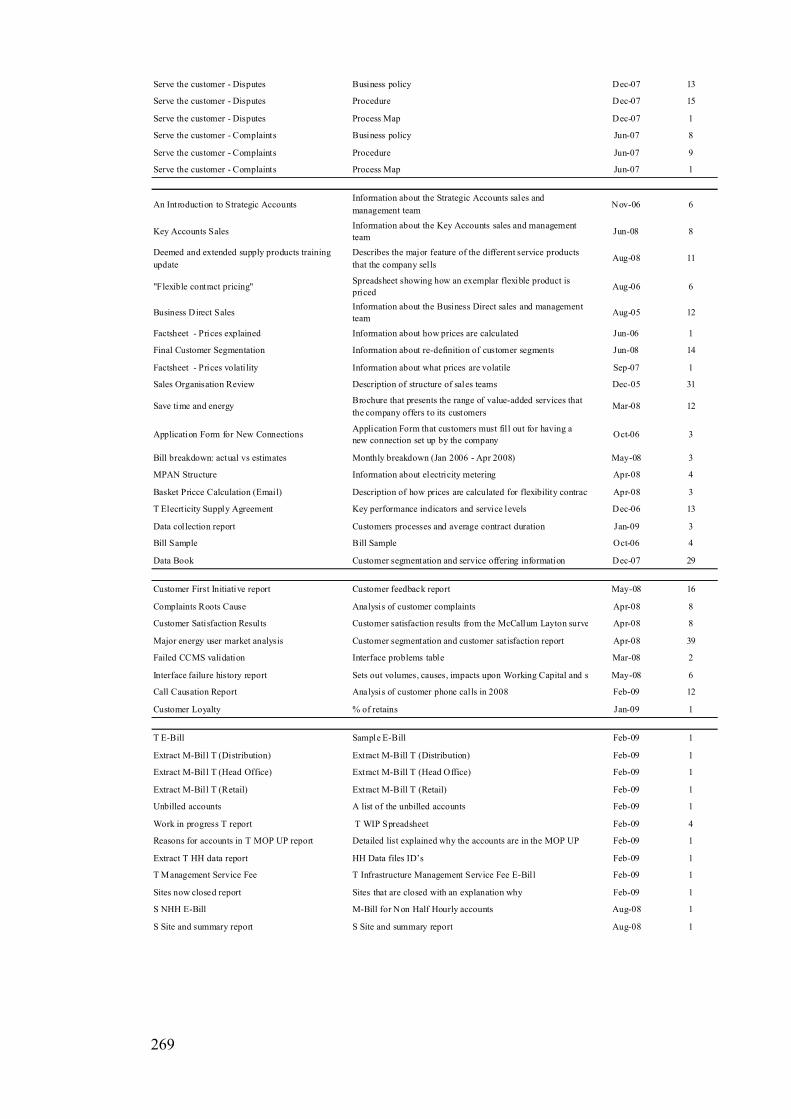
269
Serve the customer - Disputes Business policy Dec-07 13
Serve the customer - Disputes Procedure Dec-07 15
Serve the customer - Disputes Process Map Dec-07 1
Serve the customer - Complaints Business policy Jun-07 8
Serve the customer - Complaints Procedure Jun-07 9
Serve the customer - Complaints Process Map Jun-07 1
An Introduction to Strategic AccountsInformation about the Strategic Accounts sales and
management teamNov-06 6
Key Accounts SalesInformation about the Key Accounts sales and management
teamJun-08 8
Deemed and extended supply products training
update
Describes the major feature of the different service products
that the company sellsAug-08 11
"Flexible contract pricing"Spreadsheet showing how an exemplar flexible product is
pricedAug-06 6
Business Direct SalesInformation about the Business Direct sales and management
teamAug-05 12
Factsheet - Prices explained Information about how prices are calculated Jun-06 1
Final Customer Segmentation Information about re-definition of customer segments Jun-08 14
Factsheet - Prices volatility Information about what prices are volatile Sep-07 1
Sales Organisation Review Description of structure of sales teams Dec-05 31
Save time and energyBrochure that presents the range of value-added services that
the company offers to its customersMar-08 12
Application Form for New ConnectionsApplication Form that customers must fil l out for having a
new connection set up by the companyOct-06 3
Bill breakdown: actual vs estimates Monthly breakdown (Jan 2006 - Apr 2008) May-08 3
MPAN Structure Information about electricity metering Apr-08 4
Basket Pricce Calculation (Email) Description of how prices are calculated for flexibility contracts Apr-08 3
T Elecrticity Supply Agreement Key performance indicators and service levels Dec-06 13
Data collection report Customers processes and average contract duration Jan-09 3
Bill Sample Bill Sample Oct-06 4
Data Book Customer segmentation and service offering information Dec-07 29
Customer First Initiative report Customer feedback report May-08 16
Complaints Roots Cause Analysis of customer complaints Apr-08 8
Customer Satisfaction Results Customer satisfaction results from the McCallum Layton survey Apr-08 8
Major energy user market analysis Customer segmentation and customer satisfaction report Apr-08 39
Failed CCMS validation Interface problems table Mar-08 2
Interface failure history report Sets out volumes, causes, impacts upon Working Capital and suggested remedies May-08 6
Call Causation Report Analysis of customer phone calls in 2008 Feb-09 12
Customer Loyalty % of retains Jan-09 1
T E-Bill Sample E-Bill Feb-09 1
Extract M-Bill T (Distribution) Extract M-Bill T (Distribution) Feb-09 1
Extract M-Bill T (Head Office) Extract M-Bill T (Head Office) Feb-09 1
Extract M-Bill T (Retail) Extract M-Bill T (Retail) Feb-09 1
Unbilled accounts A list of the unbilled accounts Feb-09 1
Work in progress T report T WIP Spreadsheet Feb-09 4
Reasons for accounts in T MOP UP report Detailed list explained why the accounts are in the MOP UP Feb-09 1
Extract T HH data report HH Data files ID’s Feb-09 1
T Management Service Fee T Infrastructure Management Service Fee E-Bill Feb-09 1
Sites now closed report Sites that are closed with an explanation why Feb-09 1
S NHH E-Bill M-Bill for Non Half Hourly accounts Aug-08 1
S Site and summary report S Site and summary report Aug-08 1
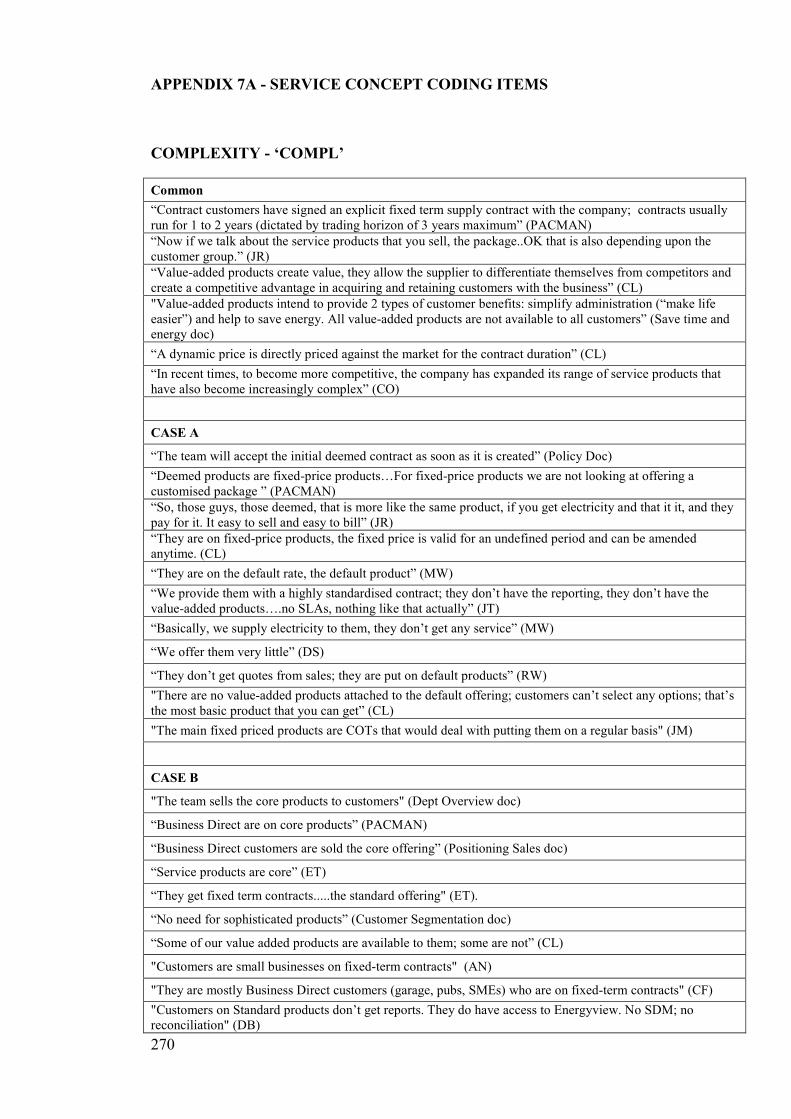
270
APPENDIX 7A - SERVICE CONCEPT CODING ITEMS
COMPLEXITY - ‘COMPL’
Common
“Contract customers have signed an explicit fixed term supply contract with the company; contracts usually run for 1 to 2 years (dictated by trading horizon of 3 years maximum” (PACMAN)
“Now if we talk about the service products that you sell, the package..OK that is also depending upon the customer group.” (JR)
“Value-added products create value, they allow the supplier to differentiate themselves from competitors and create a competitive advantage in acquiring and retaining customers with the business” (CL)
"Value-added products intend to provide 2 types of customer benefits: simplify administration (“make life easier”) and help to save energy. All value-added products are not available to all customers” (Save time and energy doc)
“A dynamic price is directly priced against the market for the contract duration” (CL)
“In recent times, to become more competitive, the company has expanded its range of service products that have also become increasingly complex” (CO)
CASE A
“The team will accept the initial deemed contract as soon as it is created” (Policy Doc)
“Deemed products are fixed-price products…For fixed-price products we are not looking at offering a customised package ” (PACMAN)
“So, those guys, those deemed, that is more like the same product, if you get electricity and that it it, and they pay for it. It easy to sell and easy to bill” (JR)
“They are on fixed-price products, the fixed price is valid for an undefined period and can be amended anytime. (CL)
“They are on the default rate, the default product” (MW)
“We provide them with a highly standardised contract; they don’t have the reporting, they don’t have the value-added products….no SLAs, nothing like that actually” (JT)
“Basically, we supply electricity to them, they don’t get any service” (MW)
“We offer them very little” (DS)
“They don’t get quotes from sales; they are put on default products” (RW)
"There are no value-added products attached to the default offering; customers can’t select any options; that’s the most basic product that you can get” (CL)
"The main fixed priced products are COTs that would deal with putting them on a regular basis" (JM)
CASE B
"The team sells the core products to customers" (Dept Overview doc)
“Business Direct are on core products” (PACMAN)
“Business Direct customers are sold the core offering” (Positioning Sales doc)
“Service products are core” (ET)
“They get fixed term contracts.....the standard offering" (ET).
“No need for sophisticated products” (Customer Segmentation doc)
“Some of our value added products are available to them; some are not” (CL)
"Customers are small businesses on fixed-term contracts" (AN)
"They are mostly Business Direct customers (garage, pubs, SMEs) who are on fixed-term contracts" (CF)
"Customers on Standard products don’t get reports. They do have access to Energyview. No SDM; no reconciliation" (DB)
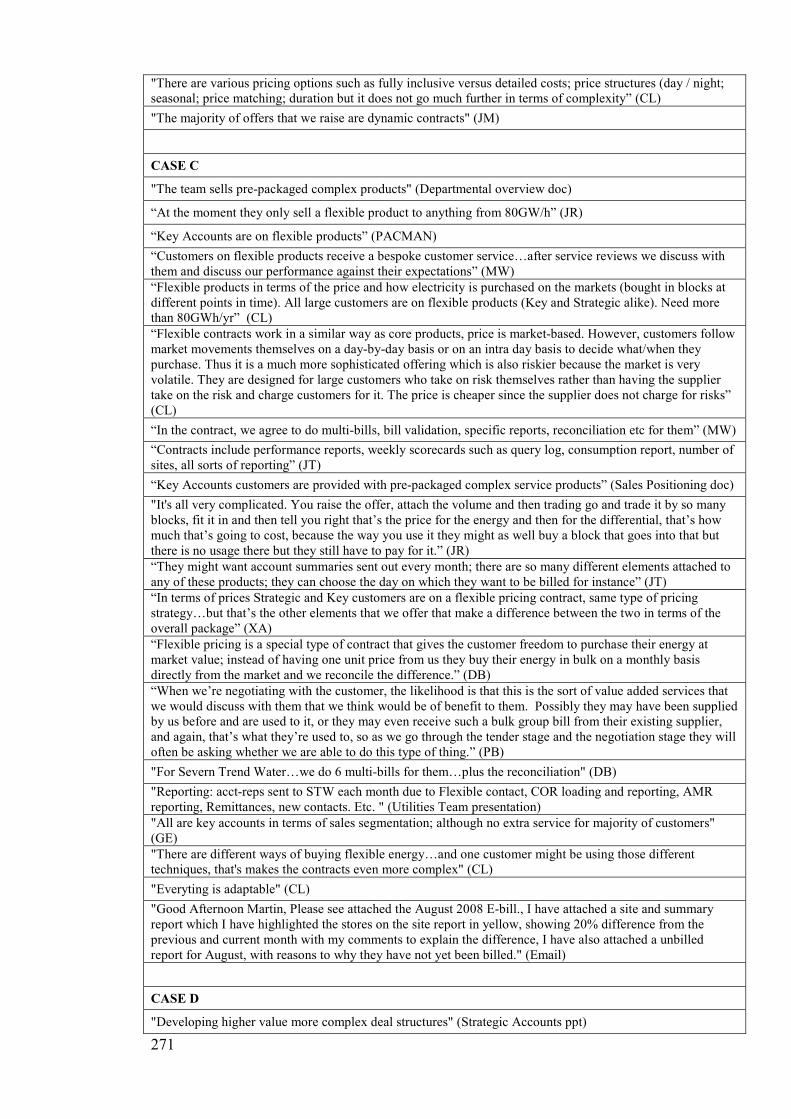
271
"There are various pricing options such as fully inclusive versus detailed costs; price structures (day / night; seasonal; price matching; duration but it does not go much further in terms of complexity” (CL)
"The majority of offers that we raise are dynamic contracts" (JM)
CASE C
"The team sells pre-packaged complex products" (Departmental overview doc)
“At the moment they only sell a flexible product to anything from 80GW/h” (JR)
“Key Accounts are on flexible products” (PACMAN)
“Customers on flexible products receive a bespoke customer service…after service reviews we discuss with them and discuss our performance against their expectations” (MW)
“Flexible products in terms of the price and how electricity is purchased on the markets (bought in blocks at different points in time). All large customers are on flexible products (Key and Strategic alike). Need more than 80GWh/yr” (CL)
“Flexible contracts work in a similar way as core products, price is market-based. However, customers follow market movements themselves on a day-by-day basis or on an intra day basis to decide what/when they purchase. Thus it is a much more sophisticated offering which is also riskier because the market is very volatile. They are designed for large customers who take on risk themselves rather than having the supplier take on the risk and charge customers for it. The price is cheaper since the supplier does not charge for risks” (CL)
“In the contract, we agree to do multi-bills, bill validation, specific reports, reconciliation etc for them” (MW)
“Contracts include performance reports, weekly scorecards such as query log, consumption report, number of sites, all sorts of reporting” (JT)
“Key Accounts customers are provided with pre-packaged complex service products” (Sales Positioning doc)
"It's all very complicated. You raise the offer, attach the volume and then trading go and trade it by so many blocks, fit it in and then tell you right that’s the price for the energy and then for the differential, that’s how much that’s going to cost, because the way you use it they might as well buy a block that goes into that but there is no usage there but they still have to pay for it.” (JR)
“They might want account summaries sent out every month; there are so many different elements attached to any of these products; they can choose the day on which they want to be billed for instance” (JT)
“In terms of prices Strategic and Key customers are on a flexible pricing contract, same type of pricing strategy…but that’s the other elements that we offer that make a difference between the two in terms of the overall package” (XA)
“Flexible pricing is a special type of contract that gives the customer freedom to purchase their energy at market value; instead of having one unit price from us they buy their energy in bulk on a monthly basis directly from the market and we reconcile the difference.” (DB)
“When we’re negotiating with the customer, the likelihood is that this is the sort of value added services that we would discuss with them that we think would be of benefit to them. Possibly they may have been supplied by us before and are used to it, or they may even receive such a bulk group bill from their existing supplier, and again, that’s what they’re used to, so as we go through the tender stage and the negotiation stage they will often be asking whether we are able to do this type of thing.” (PB)
"For Severn Trend Water…we do 6 multi-bills for them…plus the reconciliation" (DB)
"Reporting: acct-reps sent to STW each month due to Flexible contact, COR loading and reporting, AMR reporting, Remittances, new contacts. Etc. " (Utilities Team presentation)
"All are key accounts in terms of sales segmentation; although no extra service for majority of customers" (GE)
"There are different ways of buying flexible energy…and one customer might be using those different techniques, that's makes the contracts even more complex" (CL)
"Everyting is adaptable" (CL)
"Good Afternoon Martin, Please see attached the August 2008 E-bill., I have attached a site and summary report which I have highlighted the stores on the site report in yellow, showing 20% difference from the previous and current month with my comments to explain the difference, I have also attached a unbilled report for August, with reasons to why they have not yet been billed." (Email)
CASE D
"Developing higher value more complex deal structures" (Strategic Accounts ppt)
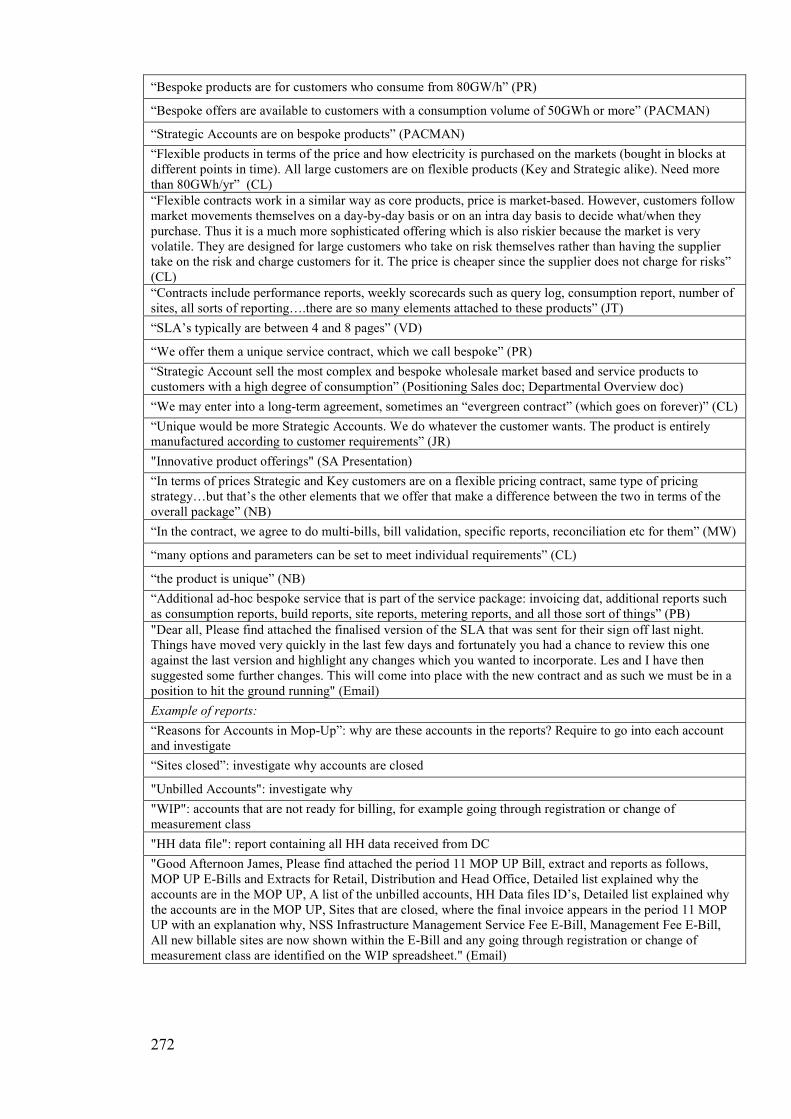
272
“Bespoke products are for customers who consume from 80GW/h” (PR)
“Bespoke offers are available to customers with a consumption volume of 50GWh or more” (PACMAN)
“Strategic Accounts are on bespoke products” (PACMAN)
“Flexible products in terms of the price and how electricity is purchased on the markets (bought in blocks at different points in time). All large customers are on flexible products (Key and Strategic alike). Need more than 80GWh/yr” (CL)
“Flexible contracts work in a similar way as core products, price is market-based. However, customers follow market movements themselves on a day-by-day basis or on an intra day basis to decide what/when they purchase. Thus it is a much more sophisticated offering which is also riskier because the market is very volatile. They are designed for large customers who take on risk themselves rather than having the supplier take on the risk and charge customers for it. The price is cheaper since the supplier does not charge for risks” (CL)
“Contracts include performance reports, weekly scorecards such as query log, consumption report, number of sites, all sorts of reporting….there are so many elements attached to these products” (JT)
“SLA’s typically are between 4 and 8 pages” (VD)
“We offer them a unique service contract, which we call bespoke” (PR)
“Strategic Account sell the most complex and bespoke wholesale market based and service products to customers with a high degree of consumption” (Positioning Sales doc; Departmental Overview doc)
“We may enter into a long-term agreement, sometimes an “evergreen contract” (which goes on forever)” (CL)
“Unique would be more Strategic Accounts. We do whatever the customer wants. The product is entirely manufactured according to customer requirements” (JR)
"Innovative product offerings" (SA Presentation)
“In terms of prices Strategic and Key customers are on a flexible pricing contract, same type of pricing strategy…but that’s the other elements that we offer that make a difference between the two in terms of the overall package” (NB)
“In the contract, we agree to do multi-bills, bill validation, specific reports, reconciliation etc for them” (MW)
“many options and parameters can be set to meet individual requirements” (CL)
“the product is unique” (NB)
“Additional ad-hoc bespoke service that is part of the service package: invoicing dat, additional reports such as consumption reports, build reports, site reports, metering reports, and all those sort of things” (PB)
"Dear all, Please find attached the finalised version of the SLA that was sent for their sign off last night. Things have moved very quickly in the last few days and fortunately you had a chance to review this one against the last version and highlight any changes which you wanted to incorporate. Les and I have then suggested some further changes. This will come into place with the new contract and as such we must be in a position to hit the ground running" (Email)
Example of reports:
“Reasons for Accounts in Mop-Up”: why are these accounts in the reports? Require to go into each account and investigate
“Sites closed”: investigate why accounts are closed
"Unbilled Accounts": investigate why
"WIP": accounts that are not ready for billing, for example going through registration or change of measurement class
"HH data file": report containing all HH data received from DC
"Good Afternoon James, Please find attached the period 11 MOP UP Bill, extract and reports as follows, MOP UP E-Bills and Extracts for Retail, Distribution and Head Office, Detailed list explained why the accounts are in the MOP UP, A list of the unbilled accounts, HH Data files ID’s, Detailed list explained why the accounts are in the MOP UP, Sites that are closed, where the final invoice appears in the period 11 MOP UP with an explanation why, NSS Infrastructure Management Service Fee E-Bill, Management Fee E-Bill, All new billable sites are now shown within the E-Bill and any going through registration or change of measurement class are identified on the WIP spreadsheet." (Email)
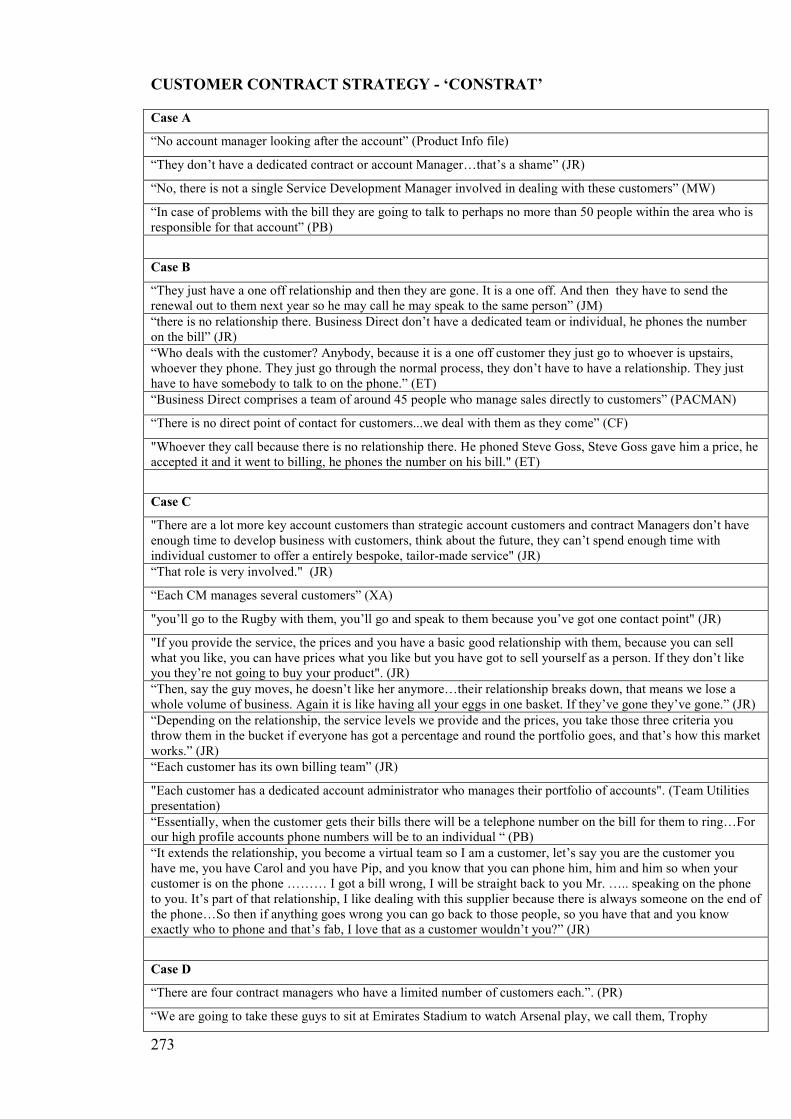
273
CUSTOMER CONTRACT STRATEGY - ‘CONSTRAT’
Case A
“No account manager looking after the account” (Product Info file)
“They don’t have a dedicated contract or account Manager…that’s a shame” (JR)
“No, there is not a single Service Development Manager involved in dealing with these customers” (MW)
“In case of problems with the bill they are going to talk to perhaps no more than 50 people within the area who is responsible for that account” (PB)
Case B
“They just have a one off relationship and then they are gone. It is a one off. And then they have to send the renewal out to them next year so he may call he may speak to the same person” (JM)
“there is no relationship there. Business Direct don’t have a dedicated team or individual, he phones the number on the bill” (JR)
“Who deals with the customer? Anybody, because it is a one off customer they just go to whoever is upstairs, whoever they phone. They just go through the normal process, they don’t have to have a relationship. They just have to have somebody to talk to on the phone.” (ET)
“Business Direct comprises a team of around 45 people who manage sales directly to customers” (PACMAN)
“There is no direct point of contact for customers...we deal with them as they come” (CF)
"Whoever they call because there is no relationship there. He phoned Steve Goss, Steve Goss gave him a price, he accepted it and it went to billing, he phones the number on his bill." (ET)
Case C
"There are a lot more key account customers than strategic account customers and contract Managers don’t have enough time to develop business with customers, think about the future, they can’t spend enough time with individual customer to offer a entirely bespoke, tailor-made service" (JR)
“That role is very involved." (JR)
“Each CM manages several customers” (XA)
"you’ll go to the Rugby with them, you’ll go and speak to them because you’ve got one contact point" (JR)
"If you provide the service, the prices and you have a basic good relationship with them, because you can sell what you like, you can have prices what you like but you have got to sell yourself as a person. If they don’t like you they’re not going to buy your product". (JR)
“Then, say the guy moves, he doesn’t like her anymore…their relationship breaks down, that means we lose a whole volume of business. Again it is like having all your eggs in one basket. If they’ve gone they’ve gone.” (JR)
“Depending on the relationship, the service levels we provide and the prices, you take those three criteria you throw them in the bucket if everyone has got a percentage and round the portfolio goes, and that’s how this market works.” (JR)
“Each customer has its own billing team” (JR)
"Each customer has a dedicated account administrator who manages their portfolio of accounts". (Team Utilities presentation)
“Essentially, when the customer gets their bills there will be a telephone number on the bill for them to ring…For our high profile accounts phone numbers will be to an individual “ (PB)
“It extends the relationship, you become a virtual team so I am a customer, let’s say you are the customer you have me, you have Carol and you have Pip, and you know that you can phone him, him and him so when your customer is on the phone ……… I got a bill wrong, I will be straight back to you Mr. ….. speaking on the phone to you. It’s part of that relationship, I like dealing with this supplier because there is always someone on the end of the phone…So then if anything goes wrong you can go back to those people, so you have that and you know exactly who to phone and that’s fab, I love that as a customer wouldn’t you?” (JR)
Case D
“There are four contract managers who have a limited number of customers each.”. (PR)
“We are going to take these guys to sit at Emirates Stadium to watch Arsenal play, we call them, Trophy

274
Customers.” (PR)
“So now how do you differentiate yourself from the strategic chap at EON, British Energy can supply that have they have more generation and cheaper, they have got more to offload, so they go in at cheaper prices, but is that guy as nice as Ian? So how you differentiate is based on relationship management? Yes, I think it is. It is human nature, you are going to interact with me.” (PR)
"Let’s take Ian Hunter, Ian Hunter is strategic, he has one customer which is BAA airports so he has Gatwick, Heathrow, Stansted, and I think some other so that’s huge" (JR)
“It requires having a contract manager entirely dedicated to one customer” (NB)
“If I was the procurement manager of Gatwick or Heathrow I would think “I don’t like that guy”. When you don’t like someone you don’t trust them. You might end up being forced to take his stuff in perhaps if his price is really good but all the time at the back of your head you think … you need to trust that person, you need to understand and ask any questions, they have got the answer for you and the price.” (PR)
“Strategic Accounts comprises a team of around 16 people and manages a small number of customers” (PACMAN)
“A key or strategic account would be regularly visited by the contract manager” (PB)
“Wants to work with energy partner” (Customer segmentation doc)
“One customer perhaps all year that you’ve got to negotiate, negotiate, negotiate, re-quote, re-quote, hourly, daily it’s hard work” (NB)
"So that’s one strategic account and it takes Ian Hunter all year to sign that up. " (JR)
“This customer has signed an evergreen contract…a contract that never ends…that’s fantastic for us!....they will be with us for a very long time unless we do something wrong” (NB)
“we try to build something with them on the long run” (PR)
“Now we are focusing on developing the relationship..help them reduce their bills, help them be energy efficient…” (PR)
"There is a lot of new legal stuff that comes into play..you know energy efficency…that’s really important for Key and Strategic Accounts…that gives us more room to co-operate with them even more…look for innovative solutions together” (NB)
“Yes they look after the Contract Manager so each one of the strategic guys I think there is six of them they have a billing team each. And the Key Accounts? More or less the same thing? Ya.” (JR)
“There is a dedicated virtual team that cuts across the entire business (sales, account set up, billing, credit control) that is available to them. The customer would always contact the same people, that's service” (NB)
"With our high-profile accounts they would have a direct line on the bill to the person the individual that’s responsible for looking after that account…that’s part of the bespoke service we mentioned earlier" (PB)
"The idea is to provide a dedicated team to the customers that helps build solid and long-lasting partnerships. The depth of knowledge these teams provide is an added benefit and service that can help customers." (ST)
“On select accounts, the SDM supports the customer relationship by providing face-to-face management of service issues” (Major Business Account Services doc)
“They are allocated a Service Development Manager…he is the customer’s advocate, he does the service reviews, manage the relationship, meets them face-to-face” (MW)
“All your key customers are under the wing of the SDM…they put a lot of focus onto the customers they look after..they are very close to the operations” (VD)
Case A
“There is no customer contact” (SJF)
“No contact for them” (JR)
Case B
“Overall it is fairly low customer contact as you don’t talk to them every single day. You shut him down and don’t phone him again till next year.” (ET)
“They just have a one off relationship and then they are gone. It is a one off. And then they have to send the renewal out to them next year so he may call he may speak to the same person” (JM)
“A small volume customer may well be never visited by anybody" (PB)
"The customer might come to us if they are aware of what’s happing in the market, or he might come to
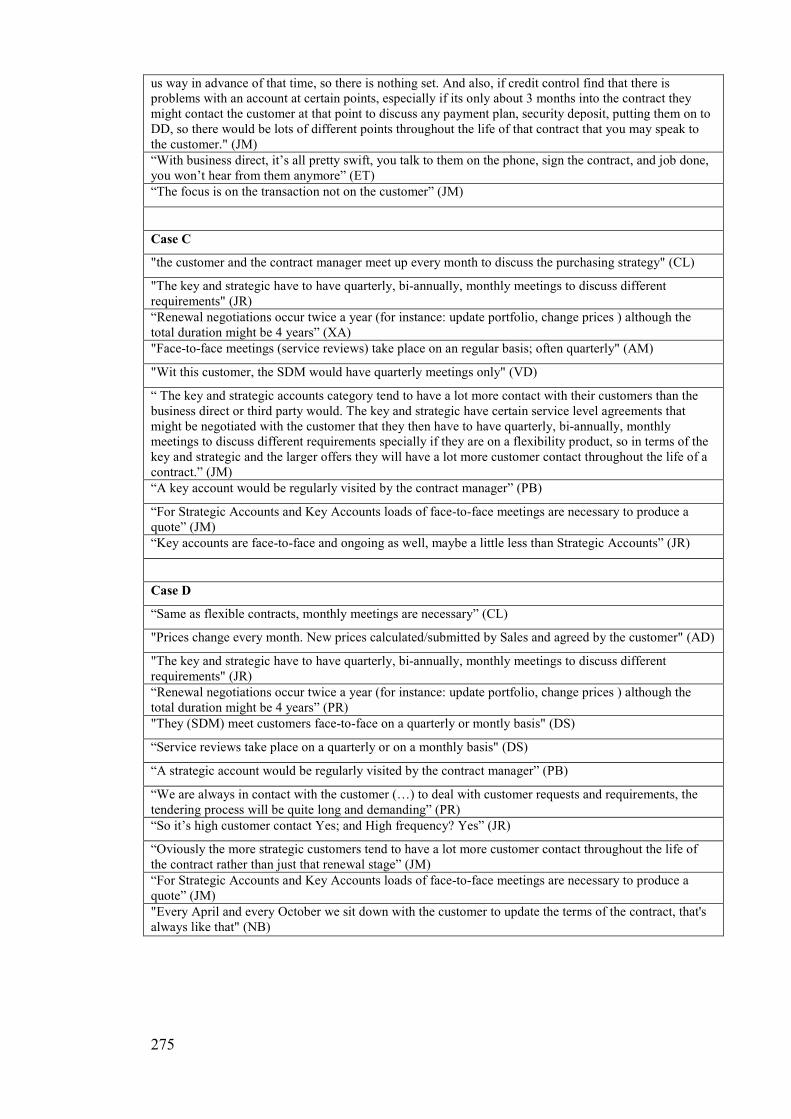
275
us way in advance of that time, so there is nothing set. And also, if credit control find that there is problems with an account at certain points, especially if its only about 3 months into the contract they might contact the customer at that point to discuss any payment plan, security deposit, putting them on to DD, so there would be lots of different points throughout the life of that contract that you may speak to the customer." (JM)
“With business direct, it’s all pretty swift, you talk to them on the phone, sign the contract, and job done, you won’t hear from them anymore” (ET)
“The focus is on the transaction not on the customer” (JM)
Case C
"the customer and the contract manager meet up every month to discuss the purchasing strategy" (CL)
"The key and strategic have to have quarterly, bi-annually, monthly meetings to discuss different requirements" (JR)
“Renewal negotiations occur twice a year (for instance: update portfolio, change prices ) although the total duration might be 4 years” (XA)
"Face-to-face meetings (service reviews) take place on an regular basis; often quarterly" (AM)
"Wit this customer, the SDM would have quarterly meetings only" (VD)
“ The key and strategic accounts category tend to have a lot more contact with their customers than the business direct or third party would. The key and strategic have certain service level agreements that might be negotiated with the customer that they then have to have quarterly, bi-annually, monthly meetings to discuss different requirements specially if they are on a flexibility product, so in terms of the key and strategic and the larger offers they will have a lot more customer contact throughout the life of a contract.” (JM)
“A key account would be regularly visited by the contract manager” (PB)
“For Strategic Accounts and Key Accounts loads of face-to-face meetings are necessary to produce a quote” (JM)
“Key accounts are face-to-face and ongoing as well, maybe a little less than Strategic Accounts” (JR)
Case D
“Same as flexible contracts, monthly meetings are necessary” (CL)
"Prices change every month. New prices calculated/submitted by Sales and agreed by the customer" (AD)
"The key and strategic have to have quarterly, bi-annually, monthly meetings to discuss different requirements" (JR)
“Renewal negotiations occur twice a year (for instance: update portfolio, change prices ) although the total duration might be 4 years” (PR)
"They (SDM) meet customers face-to-face on a quarterly or montly basis" (DS)
“Service reviews take place on a quarterly or on a monthly basis" (DS)
“A strategic account would be regularly visited by the contract manager” (PB)
“We are always in contact with the customer (…) to deal with customer requests and requirements, the tendering process will be quite long and demanding” (PR)
“So it’s high customer contact Yes; and High frequency? Yes” (JR)
“Oviously the more strategic customers tend to have a lot more customer contact throughout the life of the contract rather than just that renewal stage” (JM)
“For Strategic Accounts and Key Accounts loads of face-to-face meetings are necessary to produce a quote” (JM)
"Every April and every October we sit down with the customer to update the terms of the contract, that's always like that" (NB)
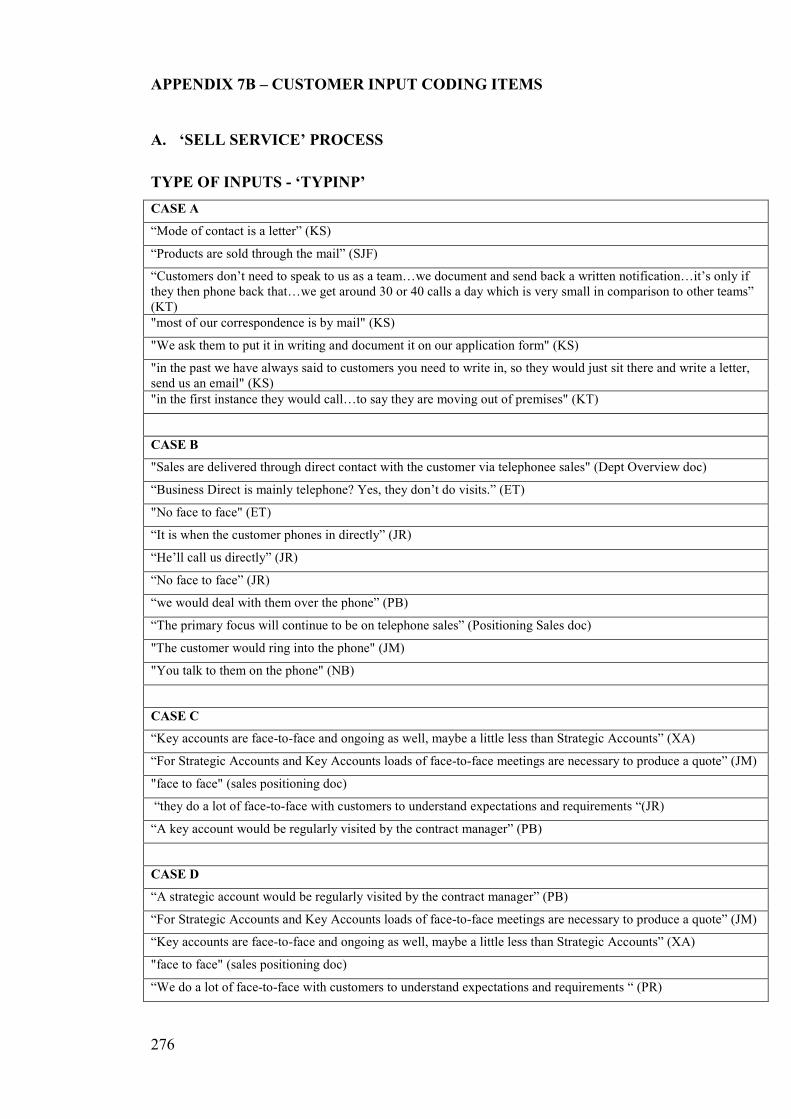
276
APPENDIX 7B – CUSTOMER INPUT CODING ITEMS
A. ‘SELL SERVICE’ PROCESS
TYPE OF INPUTS - ‘TYPINP’
CASE A
“Mode of contact is a letter” (KS)
“Products are sold through the mail” (SJF)
“Customers don’t need to speak to us as a team…we document and send back a written notification…it’s only if they then phone back that…we get around 30 or 40 calls a day which is very small in comparison to other teams” (KT)
"most of our correspondence is by mail" (KS)
"We ask them to put it in writing and document it on our application form" (KS)
"in the past we have always said to customers you need to write in, so they would just sit there and write a letter, send us an email" (KS)
"in the first instance they would call…to say they are moving out of premises" (KT)
CASE B
"Sales are delivered through direct contact with the customer via telephonee sales" (Dept Overview doc)
“Business Direct is mainly telephone? Yes, they don’t do visits.” (ET)
"No face to face" (ET)
“It is when the customer phones in directly” (JR)
“He’ll call us directly” (JR)
“No face to face” (JR)
“we would deal with them over the phone” (PB)
“The primary focus will continue to be on telephone sales” (Positioning Sales doc)
"The customer would ring into the phone" (JM)
"You talk to them on the phone" (NB)
CASE C
“Key accounts are face-to-face and ongoing as well, maybe a little less than Strategic Accounts” (XA)
“For Strategic Accounts and Key Accounts loads of face-to-face meetings are necessary to produce a quote” (JM)
"face to face" (sales positioning doc)
“they do a lot of face-to-face with customers to understand expectations and requirements “(JR)
“A key account would be regularly visited by the contract manager” (PB)
CASE D
“A strategic account would be regularly visited by the contract manager” (PB)
“For Strategic Accounts and Key Accounts loads of face-to-face meetings are necessary to produce a quote” (JM)
“Key accounts are face-to-face and ongoing as well, maybe a little less than Strategic Accounts” (XA)
"face to face" (sales positioning doc)
“We do a lot of face-to-face with customers to understand expectations and requirements “ (PR)
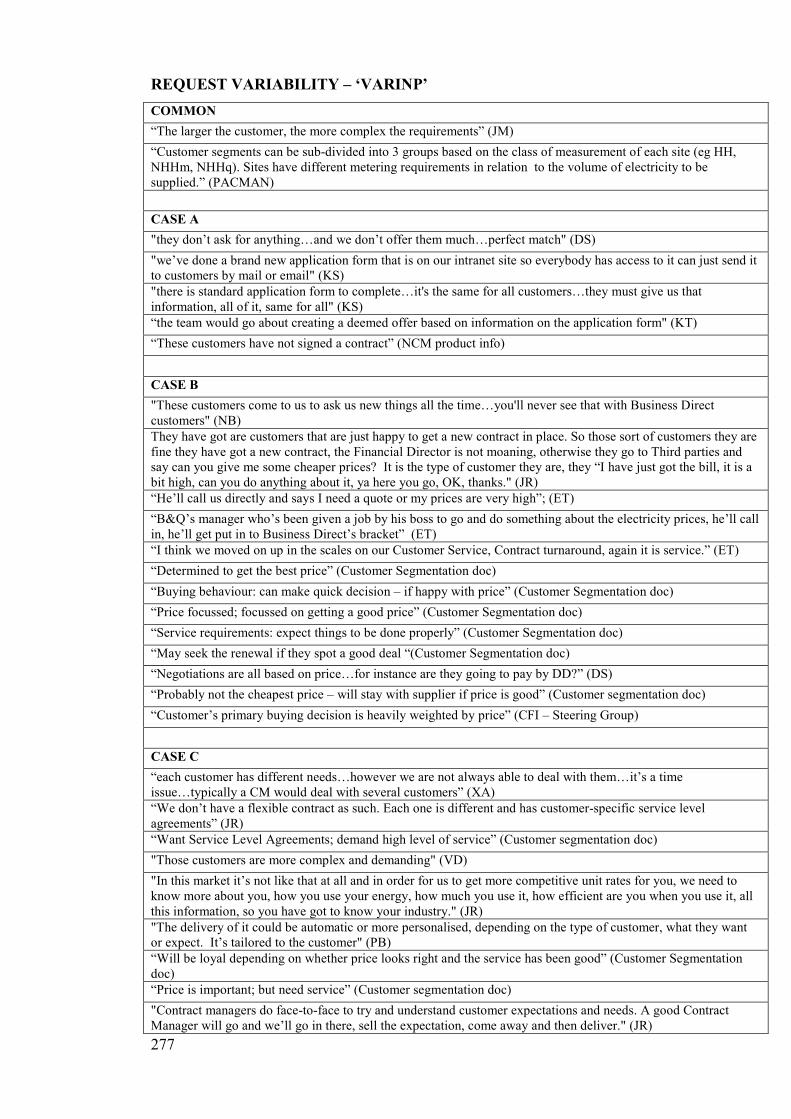
277
REQUEST VARIABILITY – ‘VARINP’
COMMON
“The larger the customer, the more complex the requirements” (JM)
“Customer segments can be sub-divided into 3 groups based on the class of measurement of each site (eg HH, NHHm, NHHq). Sites have different metering requirements in relation to the volume of electricity to be supplied.” (PACMAN)
CASE A
"they don’t ask for anything…and we don’t offer them much…perfect match" (DS)
"we’ve done a brand new application form that is on our intranet site so everybody has access to it can just send it to customers by mail or email" (KS)
"there is standard application form to complete…it's the same for all customers…they must give us that information, all of it, same for all" (KS)
“the team would go about creating a deemed offer based on information on the application form" (KT)
“These customers have not signed a contract” (NCM product info)
CASE B
"These customers come to us to ask us new things all the time…you'll never see that with Business Direct customers" (NB)
They have got are customers that are just happy to get a new contract in place. So those sort of customers they are fine they have got a new contract, the Financial Director is not moaning, otherwise they go to Third parties and say can you give me some cheaper prices? It is the type of customer they are, they “I have just got the bill, it is a bit high, can you do anything about it, ya here you go, OK, thanks." (JR)
“He’ll call us directly and says I need a quote or my prices are very high”; (ET)
“B&Q’s manager who’s been given a job by his boss to go and do something about the electricity prices, he’ll call in, he’ll get put in to Business Direct’s bracket” (ET)
“I think we moved on up in the scales on our Customer Service, Contract turnaround, again it is service.” (ET)
“Determined to get the best price” (Customer Segmentation doc)
“Buying behaviour: can make quick decision – if happy with price” (Customer Segmentation doc)
“Price focussed; focussed on getting a good price” (Customer Segmentation doc)
“Service requirements: expect things to be done properly” (Customer Segmentation doc)
“May seek the renewal if they spot a good deal “(Customer Segmentation doc)
“Negotiations are all based on price…for instance are they going to pay by DD?” (DS)
“Probably not the cheapest price – will stay with supplier if price is good” (Customer segmentation doc)
“Customer’s primary buying decision is heavily weighted by price” (CFI – Steering Group)
CASE C
“each customer has different needs…however we are not always able to deal with them…it’s a time issue…typically a CM would deal with several customers” (XA)
“We don’t have a flexible contract as such. Each one is different and has customer-specific service level agreements” (JR)
“Want Service Level Agreements; demand high level of service” (Customer segmentation doc)
"Those customers are more complex and demanding" (VD)
"In this market it’s not like that at all and in order for us to get more competitive unit rates for you, we need to know more about you, how you use your energy, how much you use it, how efficient are you when you use it, all this information, so you have got to know your industry." (JR)
"The delivery of it could be automatic or more personalised, depending on the type of customer, what they want or expect. It’s tailored to the customer" (PB)
“Will be loyal depending on whether price looks right and the service has been good” (Customer Segmentation doc)
“Price is important; but need service” (Customer segmentation doc)
"Contract managers do face-to-face to try and understand customer expectations and needs. A good Contract Manager will go and we’ll go in there, sell the expectation, come away and then deliver." (JR)
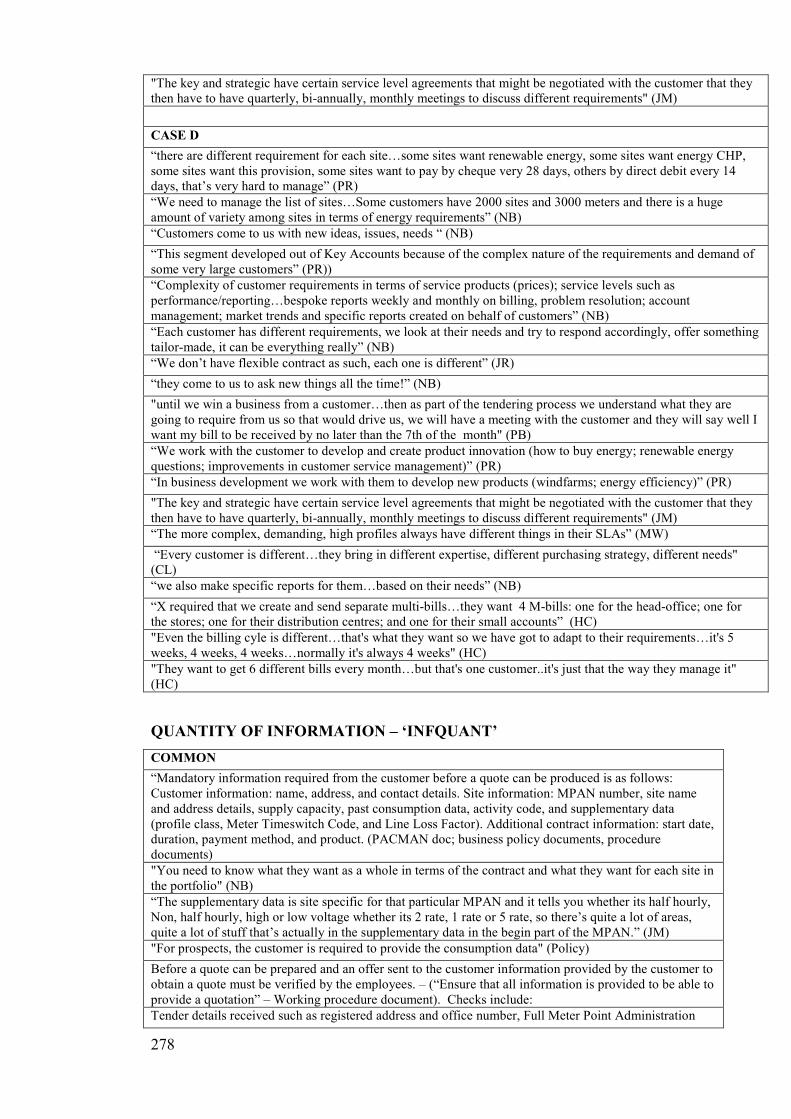
278
"The key and strategic have certain service level agreements that might be negotiated with the customer that they then have to have quarterly, bi-annually, monthly meetings to discuss different requirements" (JM)
CASE D
“there are different requirement for each site…some sites want renewable energy, some sites want energy CHP, some sites want this provision, some sites want to pay by cheque very 28 days, others by direct debit every 14 days, that’s very hard to manage” (PR)
“We need to manage the list of sites…Some customers have 2000 sites and 3000 meters and there is a huge amount of variety among sites in terms of energy requirements” (NB)
“Customers come to us with new ideas, issues, needs “ (NB)
“This segment developed out of Key Accounts because of the complex nature of the requirements and demand of some very large customers” (PR))
“Complexity of customer requirements in terms of service products (prices); service levels such as performance/reporting…bespoke reports weekly and monthly on billing, problem resolution; account management; market trends and specific reports created on behalf of customers” (NB)
“Each customer has different requirements, we look at their needs and try to respond accordingly, offer something tailor-made, it can be everything really” (NB)
“We don’t have flexible contract as such, each one is different” (JR)
“they come to us to ask new things all the time!” (NB)
"until we win a business from a customer…then as part of the tendering process we understand what they are going to require from us so that would drive us, we will have a meeting with the customer and they will say well I want my bill to be received by no later than the 7th of the month" (PB)
“We work with the customer to develop and create product innovation (how to buy energy; renewable energy questions; improvements in customer service management)” (PR)
“In business development we work with them to develop new products (windfarms; energy efficiency)” (PR)
"The key and strategic have certain service level agreements that might be negotiated with the customer that they then have to have quarterly, bi-annually, monthly meetings to discuss different requirements" (JM)
“The more complex, demanding, high profiles always have different things in their SLAs” (MW)
“Every customer is different…they bring in different expertise, different purchasing strategy, different needs" (CL)
“we also make specific reports for them…based on their needs” (NB)
“X required that we create and send separate multi-bills…they want 4 M-bills: one for the head-office; one for the stores; one for their distribution centres; and one for their small accounts” (HC)
"Even the billing cyle is different…that's what they want so we have got to adapt to their requirements…it's 5 weeks, 4 weeks, 4 weeks…normally it's always 4 weeks" (HC)
"They want to get 6 different bills every month…but that's one customer..it's just that the way they manage it" (HC)
QUANTITY OF INFORMATION – ‘INFQUANT’
COMMON
“Mandatory information required from the customer before a quote can be produced is as follows: Customer information: name, address, and contact details. Site information: MPAN number, site name and address details, supply capacity, past consumption data, activity code, and supplementary data (profile class, Meter Timeswitch Code, and Line Loss Factor). Additional contract information: start date, duration, payment method, and product. (PACMAN doc; business policy documents, procedure documents)
"You need to know what they want as a whole in terms of the contract and what they want for each site in the portfolio" (NB)
“The supplementary data is site specific for that particular MPAN and it tells you whether its half hourly, Non, half hourly, high or low voltage whether its 2 rate, 1 rate or 5 rate, so there’s quite a lot of areas, quite a lot of stuff that’s actually in the supplementary data in the begin part of the MPAN.” (JM)
"For prospects, the customer is required to provide the consumption data" (Policy)
Before a quote can be prepared and an offer sent to the customer information provided by the customer to obtain a quote must be verified by the employees. – (“Ensure that all information is provided to be able to provide a quotation” – Working procedure document). Checks include:
Tender details received such as registered address and office number, Full Meter Point Administration
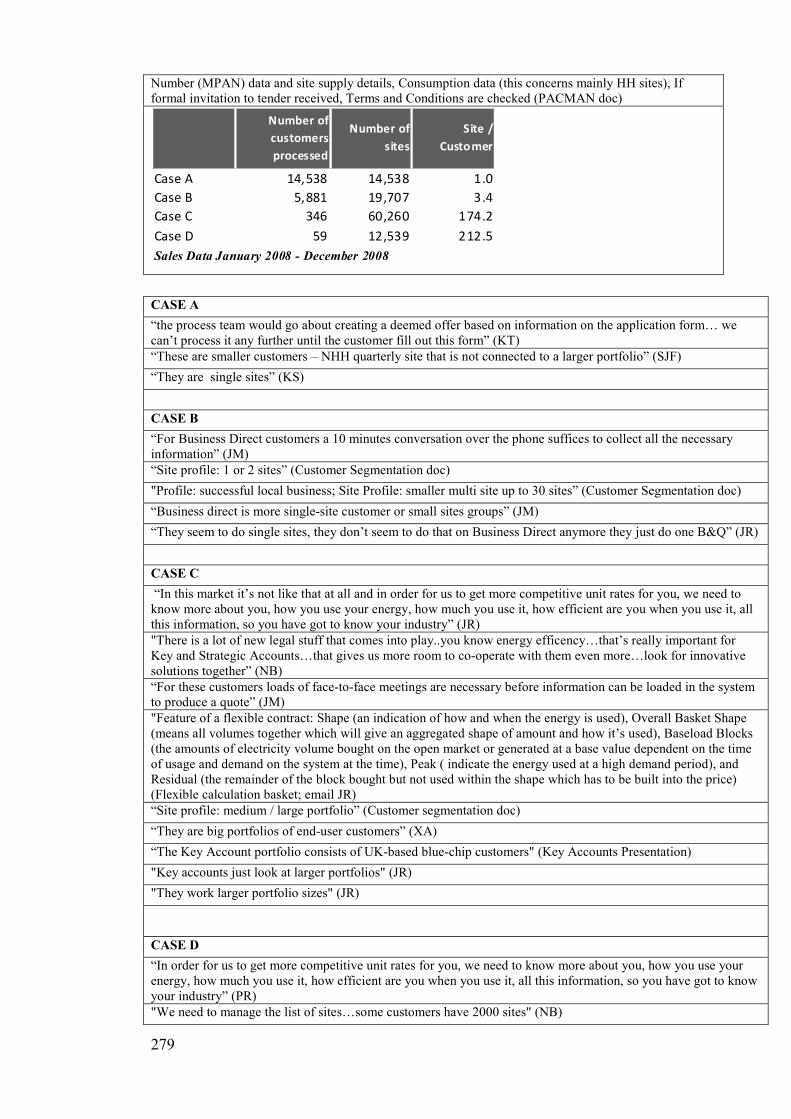
279
Number (MPAN) data and site supply details, Consumption data (this concerns mainly HH sites), If formal invitation to tender received, Terms and Conditions are checked (PACMAN doc)
Number of
customers
processed
Number of
sites
Site /
Customer
Case A 14,538 14,538 1.0
Case B 5,881 19,707 3.4
Case C 346 60,260 174.2
Case D 59 12,539 212.5
Sales Data January 2008 - December 2008
CASE A
“the process team would go about creating a deemed offer based on information on the application form… we can’t process it any further until the customer fill out this form” (KT)
“These are smaller customers – NHH quarterly site that is not connected to a larger portfolio” (SJF)
“They are single sites” (KS)
CASE B
“For Business Direct customers a 10 minutes conversation over the phone suffices to collect all the necessary information” (JM)
“Site profile: 1 or 2 sites” (Customer Segmentation doc)
"Profile: successful local business; Site Profile: smaller multi site up to 30 sites” (Customer Segmentation doc)
“Business direct is more single-site customer or small sites groups” (JM)
“They seem to do single sites, they don’t seem to do that on Business Direct anymore they just do one B&Q” (JR)
CASE C
“In this market it’s not like that at all and in order for us to get more competitive unit rates for you, we need to know more about you, how you use your energy, how much you use it, how efficient are you when you use it, all this information, so you have got to know your industry” (JR)
"There is a lot of new legal stuff that comes into play..you know energy efficency…that’s really important for Key and Strategic Accounts…that gives us more room to co-operate with them even more…look for innovative solutions together” (NB)
“For these customers loads of face-to-face meetings are necessary before information can be loaded in the system to produce a quote” (JM)
"Feature of a flexible contract: Shape (an indication of how and when the energy is used), Overall Basket Shape (means all volumes together which will give an aggregated shape of amount and how it’s used), Baseload Blocks (the amounts of electricity volume bought on the open market or generated at a base value dependent on the time of usage and demand on the system at the time), Peak ( indicate the energy used at a high demand period), and Residual (the remainder of the block bought but not used within the shape which has to be built into the price) (Flexible calculation basket; email JR)
“Site profile: medium / large portfolio” (Customer segmentation doc)
“They are big portfolios of end-user customers” (XA)
“The Key Account portfolio consists of UK-based blue-chip customers" (Key Accounts Presentation)
"Key accounts just look at larger portfolios" (JR)
"They work larger portfolio sizes" (JR)
CASE D
“In order for us to get more competitive unit rates for you, we need to know more about you, how you use your energy, how much you use it, how efficient are you when you use it, all this information, so you have got to know your industry” (PR)
"We need to manage the list of sites…some customers have 2000 sites" (NB)
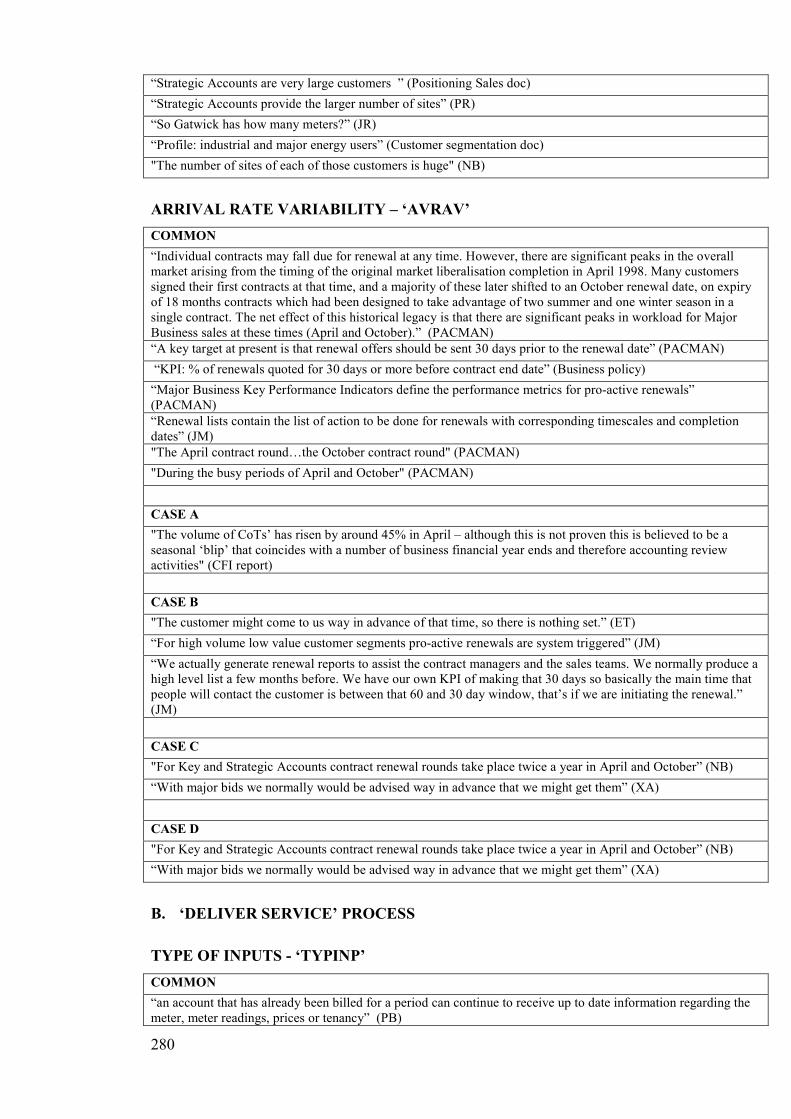
280
“Strategic Accounts are very large customers ” (Positioning Sales doc)
“Strategic Accounts provide the larger number of sites” (PR)
“So Gatwick has how many meters?” (JR)
“Profile: industrial and major energy users” (Customer segmentation doc)
"The number of sites of each of those customers is huge" (NB)
ARRIVAL RATE VARIABILITY – ‘AVRAV’
COMMON
“Individual contracts may fall due for renewal at any time. However, there are significant peaks in the overall market arising from the timing of the original market liberalisation completion in April 1998. Many customers signed their first contracts at that time, and a majority of these later shifted to an October renewal date, on expiry of 18 months contracts which had been designed to take advantage of two summer and one winter season in a single contract. The net effect of this historical legacy is that there are significant peaks in workload for Major Business sales at these times (April and October).” (PACMAN)
“A key target at present is that renewal offers should be sent 30 days prior to the renewal date” (PACMAN)
“KPI: % of renewals quoted for 30 days or more before contract end date” (Business policy)
“Major Business Key Performance Indicators define the performance metrics for pro-active renewals” (PACMAN)
“Renewal lists contain the list of action to be done for renewals with corresponding timescales and completion dates” (JM)
"The April contract round…the October contract round" (PACMAN)
"During the busy periods of April and October" (PACMAN)
CASE A
"The volume of CoTs’ has risen by around 45% in April – although this is not proven this is believed to be a seasonal ‘blip’ that coincides with a number of business financial year ends and therefore accounting review activities" (CFI report)
CASE B
"The customer might come to us way in advance of that time, so there is nothing set.” (ET)
“For high volume low value customer segments pro-active renewals are system triggered” (JM)
“We actually generate renewal reports to assist the contract managers and the sales teams. We normally produce a high level list a few months before. We have our own KPI of making that 30 days so basically the main time that people will contact the customer is between that 60 and 30 day window, that’s if we are initiating the renewal.” (JM)
CASE C
"For Key and Strategic Accounts contract renewal rounds take place twice a year in April and October” (NB)
“With major bids we normally would be advised way in advance that we might get them” (XA)
CASE D
"For Key and Strategic Accounts contract renewal rounds take place twice a year in April and October” (NB)
“With major bids we normally would be advised way in advance that we might get them” (XA)
B. ‘DELIVER SERVICE’ PROCESS
TYPE OF INPUTS - ‘TYPINP’
COMMON
“an account that has already been billed for a period can continue to receive up to date information regarding the meter, meter readings, prices or tenancy” (PB)
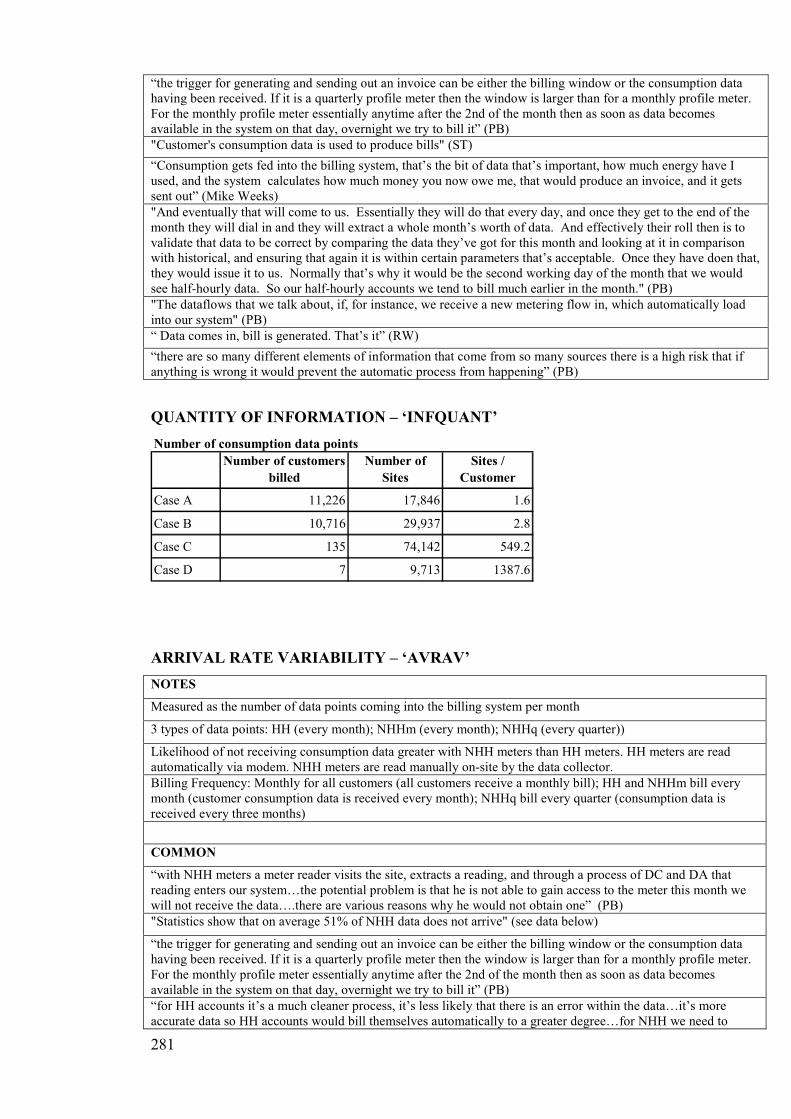
281
“the trigger for generating and sending out an invoice can be either the billing window or the consumption data having been received. If it is a quarterly profile meter then the window is larger than for a monthly profile meter. For the monthly profile meter essentially anytime after the 2nd of the month then as soon as data becomes available in the system on that day, overnight we try to bill it” (PB)
"Customer's consumption data is used to produce bills" (ST)
“Consumption gets fed into the billing system, that’s the bit of data that’s important, how much energy have I used, and the system calculates how much money you now owe me, that would produce an invoice, and it gets sent out” (Mike Weeks)
"And eventually that will come to us. Essentially they will do that every day, and once they get to the end of the month they will dial in and they will extract a whole month’s worth of data. And effectively their roll then is to validate that data to be correct by comparing the data they’ve got for this month and looking at it in comparison with historical, and ensuring that again it is within certain parameters that’s acceptable. Once they have doen that, they would issue it to us. Normally that’s why it would be the second working day of the month that we would see half-hourly data. So our half-hourly accounts we tend to bill much earlier in the month." (PB)
"The dataflows that we talk about, if, for instance, we receive a new metering flow in, which automatically load into our system" (PB)
“ Data comes in, bill is generated. That’s it” (RW)
“there are so many different elements of information that come from so many sources there is a high risk that if anything is wrong it would prevent the automatic process from happening” (PB)
QUANTITY OF INFORMATION – ‘INFQUANT’
Number of consumption data points
Case A 11,226 17,846 1.6
Case B 10,716 29,937 2.8
Case C 135 74,142 549.2
Case D 7 9,713 1387.6
Number of customers
billed
Number of
Sites
Sites /
Customer
ARRIVAL RATE VARIABILITY – ‘AVRAV’
NOTES
Measured as the number of data points coming into the billing system per month
3 types of data points: HH (every month); NHHm (every month); NHHq (every quarter))
Likelihood of not receiving consumption data greater with NHH meters than HH meters. HH meters are read automatically via modem. NHH meters are read manually on-site by the data collector.
Billing Frequency: Monthly for all customers (all customers receive a monthly bill); HH and NHHm bill every month (customer consumption data is received every month); NHHq bill every quarter (consumption data is received every three months)
COMMON
“with NHH meters a meter reader visits the site, extracts a reading, and through a process of DC and DA that reading enters our system…the potential problem is that he is not able to gain access to the meter this month we will not receive the data….there are various reasons why he would not obtain one” (PB)
"Statistics show that on average 51% of NHH data does not arrive" (see data below)
“the trigger for generating and sending out an invoice can be either the billing window or the consumption data having been received. If it is a quarterly profile meter then the window is larger than for a monthly profile meter. For the monthly profile meter essentially anytime after the 2nd of the month then as soon as data becomes available in the system on that day, overnight we try to bill it” (PB)
“for HH accounts it’s a much cleaner process, it’s less likely that there is an error within the data…it’s more accurate data so HH accounts would bill themselves automatically to a greater degree…for NHH we need to

282
obtain a reading from the DC” (PB)
The table below shows the number of estimated bills (i.e. consumption data was not received) versus the
number of actual bills (i.e. bill calculated based on actual consumption data) from January 2006 to April
2008. On average 46% of bills are estimated bills.
0%
10%
20%
30%
40%
50%
60%
70%
Actual Estimated
Below it is shown how the percentage of Non-Half-Hourly accounts which do not receive consumption
data was estimated.
% of estimated bills 46% Historical data actual bills versus estimated bills - 12 months average
Total HH accounts 13,194
Total NHH accounts 118,444
Total Accounts 131,638
HH accounts always bill - billing data always arrives Multiple interviews; multiple sources of evidence
NHH?
Equation to be solved: total estimated bills = total estimated NHH bills
thus: 46% * 131,638 = 118,444 * x
x 51%
Therefore, one can infer that, on average, 51% of NHH accounts do not receive customer comsumption data
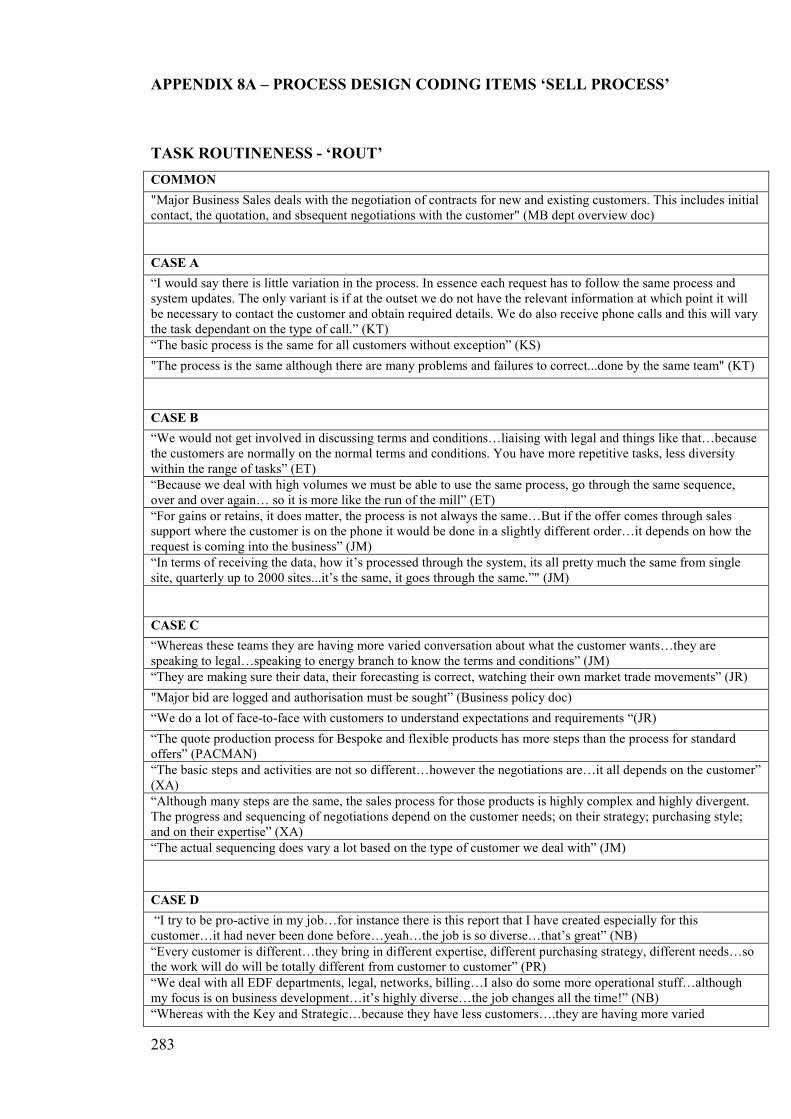
283
APPENDIX 8A – PROCESS DESIGN CODING ITEMS ‘SELL PROCESS’
TASK ROUTINENESS - ‘ROUT’
COMMON
"Major Business Sales deals with the negotiation of contracts for new and existing customers. This includes initial contact, the quotation, and sbsequent negotiations with the customer" (MB dept overview doc)
CASE A
“I would say there is little variation in the process. In essence each request has to follow the same process and system updates. The only variant is if at the outset we do not have the relevant information at which point it will be necessary to contact the customer and obtain required details. We do also receive phone calls and this will vary the task dependant on the type of call.” (KT)
“The basic process is the same for all customers without exception” (KS)
"The process is the same although there are many problems and failures to correct...done by the same team" (KT)
CASE B
“We would not get involved in discussing terms and conditions…liaising with legal and things like that…because the customers are normally on the normal terms and conditions. You have more repetitive tasks, less diversity within the range of tasks” (ET)
“Because we deal with high volumes we must be able to use the same process, go through the same sequence, over and over again… so it is more like the run of the mill” (ET)
“For gains or retains, it does matter, the process is not always the same…But if the offer comes through sales support where the customer is on the phone it would be done in a slightly different order…it depends on how the request is coming into the business” (JM)
“In terms of receiving the data, how it’s processed through the system, its all pretty much the same from single site, quarterly up to 2000 sites...it’s the same, it goes through the same.”" (JM)
CASE C
“Whereas these teams they are having more varied conversation about what the customer wants…they are speaking to legal…speaking to energy branch to know the terms and conditions” (JM)
“They are making sure their data, their forecasting is correct, watching their own market trade movements” (JR)
"Major bid are logged and authorisation must be sought” (Business policy doc)
“We do a lot of face-to-face with customers to understand expectations and requirements “(JR)
“The quote production process for Bespoke and flexible products has more steps than the process for standard offers” (PACMAN)
“The basic steps and activities are not so different…however the negotiations are…it all depends on the customer” (XA)
“Although many steps are the same, the sales process for those products is highly complex and highly divergent. The progress and sequencing of negotiations depend on the customer needs; on their strategy; purchasing style; and on their expertise” (XA)
“The actual sequencing does vary a lot based on the type of customer we deal with” (JM)
CASE D
“I try to be pro-active in my job…for instance there is this report that I have created especially for this customer…it had never been done before…yeah…the job is so diverse…that’s great” (NB)
“Every customer is different…they bring in different expertise, different purchasing strategy, different needs…so the work will do will be totally different from customer to customer” (PR)
“We deal with all EDF departments, legal, networks, billing…I also do some more operational stuff…although my focus is on business development…it’s highly diverse…the job changes all the time!” (NB)
“Whereas with the Key and Strategic…because they have less customers….they are having more varied
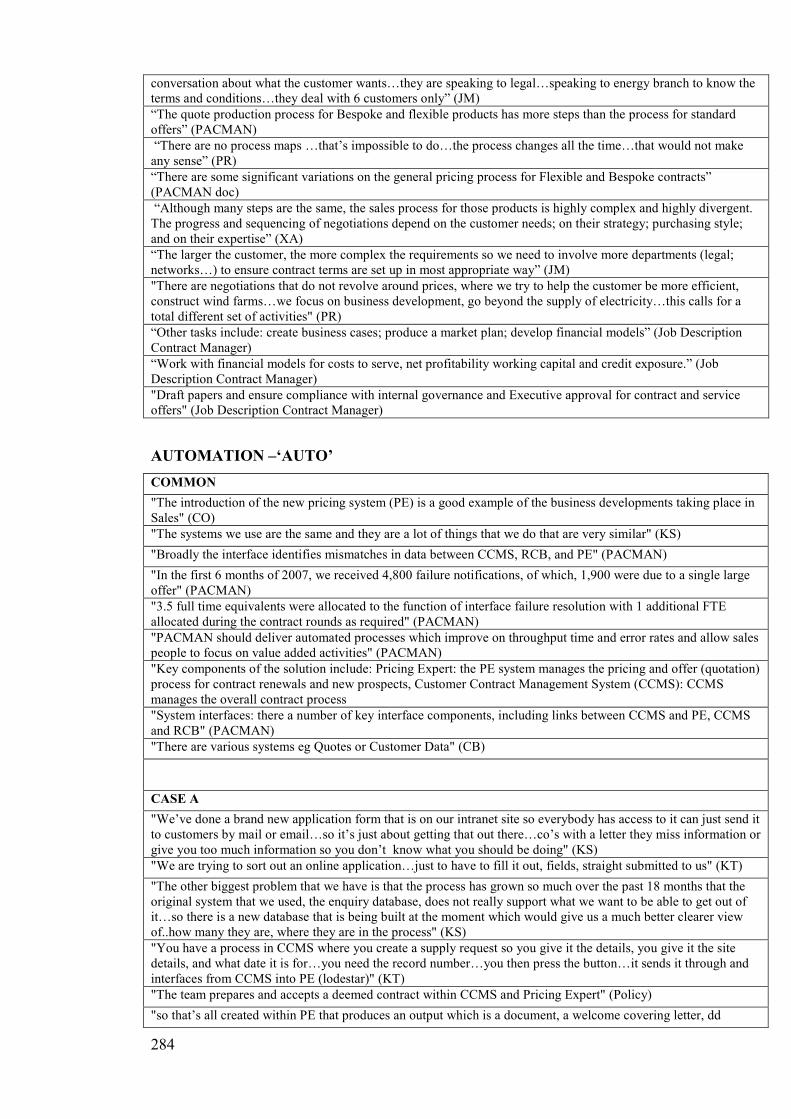
284
conversation about what the customer wants…they are speaking to legal…speaking to energy branch to know the terms and conditions…they deal with 6 customers only” (JM)
“The quote production process for Bespoke and flexible products has more steps than the process for standard offers” (PACMAN)
“There are no process maps …that’s impossible to do…the process changes all the time…that would not make any sense” (PR)
“There are some significant variations on the general pricing process for Flexible and Bespoke contracts” (PACMAN doc)
“Although many steps are the same, the sales process for those products is highly complex and highly divergent. The progress and sequencing of negotiations depend on the customer needs; on their strategy; purchasing style; and on their expertise” (XA)
“The larger the customer, the more complex the requirements so we need to involve more departments (legal; networks…) to ensure contract terms are set up in most appropriate way” (JM)
"There are negotiations that do not revolve around prices, where we try to help the customer be more efficient, construct wind farms…we focus on business development, go beyond the supply of electricity…this calls for a total different set of activities" (PR)
“Other tasks include: create business cases; produce a market plan; develop financial models” (Job Description Contract Manager)
“Work with financial models for costs to serve, net profitability working capital and credit exposure.” (Job Description Contract Manager)
"Draft papers and ensure compliance with internal governance and Executive approval for contract and service offers" (Job Description Contract Manager)
AUTOMATION –‘AUTO’
COMMON
"The introduction of the new pricing system (PE) is a good example of the business developments taking place in Sales" (CO)
"The systems we use are the same and they are a lot of things that we do that are very similar" (KS)
"Broadly the interface identifies mismatches in data between CCMS, RCB, and PE" (PACMAN)
"In the first 6 months of 2007, we received 4,800 failure notifications, of which, 1,900 were due to a single large offer" (PACMAN)
"3.5 full time equivalents were allocated to the function of interface failure resolution with 1 additional FTE allocated during the contract rounds as required" (PACMAN)
"PACMAN should deliver automated processes which improve on throughput time and error rates and allow sales people to focus on value added activities" (PACMAN)
"Key components of the solution include: Pricing Expert: the PE system manages the pricing and offer (quotation) process for contract renewals and new prospects, Customer Contract Management System (CCMS): CCMS manages the overall contract process
"System interfaces: there a number of key interface components, including links between CCMS and PE, CCMS and RCB" (PACMAN)
"There are various systems eg Quotes or Customer Data" (CB)
CASE A
"We’ve done a brand new application form that is on our intranet site so everybody has access to it can just send it to customers by mail or email…so it’s just about getting that out there…co’s with a letter they miss information or give you too much information so you don’t know what you should be doing" (KS)
"We are trying to sort out an online application…just to have to fill it out, fields, straight submitted to us" (KT)
"The other biggest problem that we have is that the process has grown so much over the past 18 months that the original system that we used, the enquiry database, does not really support what we want to be able to get out of it…so there is a new database that is being built at the moment which would give us a much better clearer view of..how many they are, where they are in the process" (KS)
"You have a process in CCMS where you create a supply request so you give it the details, you give it the site details, and what date it is for…you need the record number…you then press the button…it sends it through and interfaces from CCMS into PE (lodestar)" (KT)
"The team prepares and accepts a deemed contract within CCMS and Pricing Expert" (Policy)
"so that’s all created within PE that produces an output which is a document, a welcome covering letter, dd

285
mandate, terms and conditions, a glossary of terms,…a 12 page package…which we mail out to the customer" (KT)
"we do all the customer records in CCMS and we send it over to PE system to price it up" (KS)
"Once we’ve priced it it then interfaces back into CCMS to finish the process…PE only does the pricing, CCMS does all the other bits" (KS)
"we are looking at areas such online provision… an advisor would guide customers to a website …cos’ we have problem with letters sometimes we can’t read them, we can’t understand them so we have to go back and ask the customers to re-do them…" (ST)
CASE B
"We perform online rating through D&B website" (JM)
"The multi-site upload is a spreadsheet which allows you to load all the data and then you upload directly into CCMS and that creates all your supply points, creates all your addresses, all your metering details for you." (JM)
"If you had a single site you would create the supply request you would associate that site, send it across to PE." (ET)
"With the multi site upload you almost do it a little bit backwards, you create all those sites, load it all in and that creates your supply request for you and automatically associates those sites, you don’t have to go in and manually associate them and it does certain checks when you are uploading into CCMS for you" (JM)
"with the multi set upload we tend to use it for anything over about 20 odd sites, just because to do the multi set upload is quicker than manually doing it, so roughly about that amount of sites we will weigh up and say actually its quicker to do it the MSU way, so we tend to use that for a lot business direct customers if they’ve got small groups as well, so we will use that for across the board and across all the sales teams. Really" (JM)
"So we have a supply request so that what comes about and that comes out of CCMS and now you are going to be able to do the pricing within PE" (ET)
"When you get to price agreed basically the price agreed is almost the last point of the sales activity. So the offer would come out of the pricing expert " (JM)
"whoever would create the supply request, send it over to pricing expert then create an offer within pricing expert load specific margins, payment terms, VAPS they would then submit that offer and then produce the output. " (JM)
"If it’s failing at the quote stage, it will get picked up by whoever in the quotes...But it will ultimately be owned, be the responsibility of the team it fails in." (JM)
"if you have a single site like in BD that might not necessarily need an e-bill or energy-zone..then that’s not gonna fail" (ET)
"Customers have the possibility to get a quote from us by filling out a form that is available online on our website" (JM)
website is not provided so that the organisation can not be readily identified
"All standard offers sent to customers, including renewals, are system produced" (Policy)
"proactive renewals for high volume customer classifications tend to be system triggered" (PACMAN)
"The production of a list of renewals falling due within 65 days is presently a manual process" (PACMAN)
CASE C
“With the flexibility offers, they sign separate terms and conditions for that particular product so then its out of the pricing system and more of a manual process as well.” (JM)
"The solution does not currently support flexible contracts. There is no detailed process for handling the pricing of flexible contracts in PE" (PACMAN)
"Functionality to support "flexible contracts" has not yet been delivered" (PACMAN)
"Functionality to support "Group Average Pricing" has not yet been delivered" (PACMAN)
“Large complex offers go through a high number of manual checks in the sales process to prevent failures from happening when the offer interfaces into the billing system…” (XA)
“We do a lot of face-to-face with customers to understand expectations and requirements“ (JR)
"For large offers we would perform manual pre-interface checks to avoid potential interface failures. The larger the portfolio the greater the risk of failure as each individual site that fails would cause the entire portfolio to fail. Pre-interface checks consist of a number of manual verifications to ensure the data in the sales IT system and the data in the billing IT system match up" (ST)
"For the larger accounts there are more likely to have different value-added products and if they don’t get added correctly then they would fail" (XA)
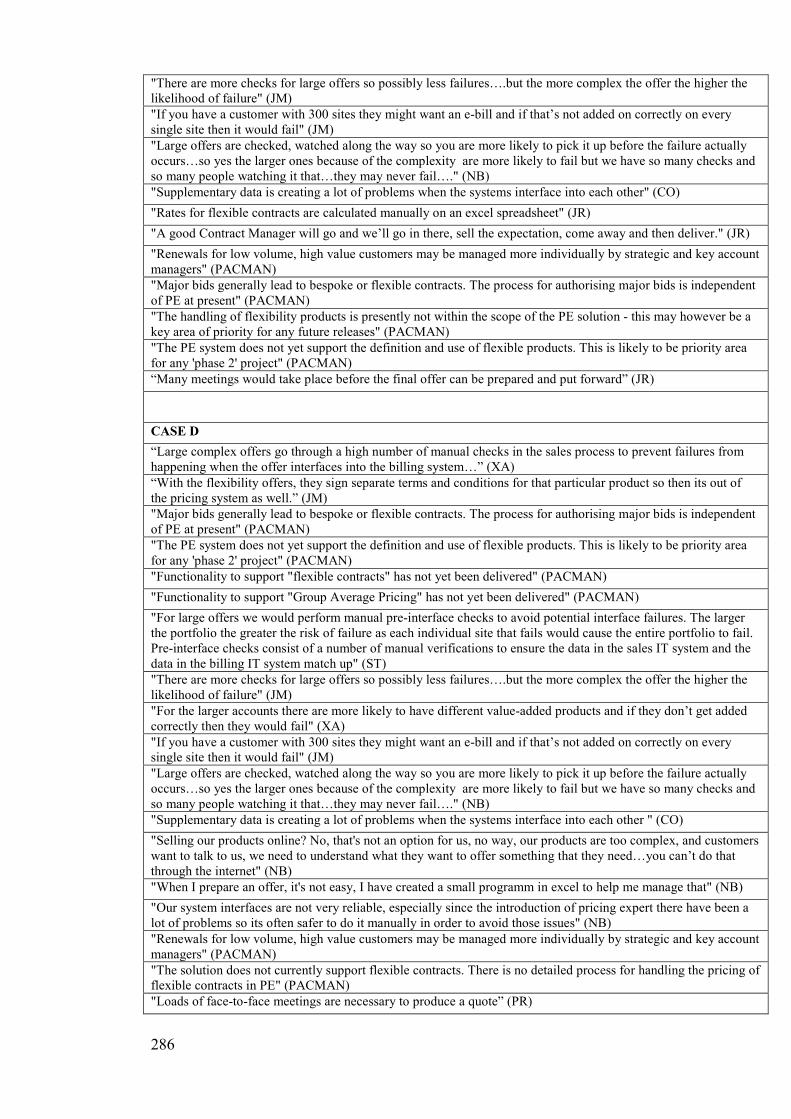
286
"There are more checks for large offers so possibly less failures….but the more complex the offer the higher the likelihood of failure" (JM)
"If you have a customer with 300 sites they might want an e-bill and if that’s not added on correctly on every single site then it would fail" (JM)
"Large offers are checked, watched along the way so you are more likely to pick it up before the failure actually occurs…so yes the larger ones because of the complexity are more likely to fail but we have so many checks and so many people watching it that…they may never fail…." (NB)
"Supplementary data is creating a lot of problems when the systems interface into each other" (CO)
"Rates for flexible contracts are calculated manually on an excel spreadsheet" (JR)
"A good Contract Manager will go and we’ll go in there, sell the expectation, come away and then deliver." (JR)
"Renewals for low volume, high value customers may be managed more individually by strategic and key account managers" (PACMAN)
"Major bids generally lead to bespoke or flexible contracts. The process for authorising major bids is independent of PE at present" (PACMAN)
"The handling of flexibility products is presently not within the scope of the PE solution - this may however be a key area of priority for any future releases" (PACMAN)
"The PE system does not yet support the definition and use of flexible products. This is likely to be priority area for any 'phase 2' project" (PACMAN)
“Many meetings would take place before the final offer can be prepared and put forward” (JR)
CASE D
“Large complex offers go through a high number of manual checks in the sales process to prevent failures from happening when the offer interfaces into the billing system…” (XA)
“With the flexibility offers, they sign separate terms and conditions for that particular product so then its out of the pricing system as well.” (JM)
"Major bids generally lead to bespoke or flexible contracts. The process for authorising major bids is independent of PE at present" (PACMAN)
"The PE system does not yet support the definition and use of flexible products. This is likely to be priority area for any 'phase 2' project" (PACMAN)
"Functionality to support "flexible contracts" has not yet been delivered" (PACMAN)
"Functionality to support "Group Average Pricing" has not yet been delivered" (PACMAN)
"For large offers we would perform manual pre-interface checks to avoid potential interface failures. The larger the portfolio the greater the risk of failure as each individual site that fails would cause the entire portfolio to fail. Pre-interface checks consist of a number of manual verifications to ensure the data in the sales IT system and the data in the billing IT system match up" (ST)
"There are more checks for large offers so possibly less failures….but the more complex the offer the higher the likelihood of failure" (JM)
"For the larger accounts there are more likely to have different value-added products and if they don’t get added correctly then they would fail" (XA)
"If you have a customer with 300 sites they might want an e-bill and if that’s not added on correctly on every single site then it would fail" (JM)
"Large offers are checked, watched along the way so you are more likely to pick it up before the failure actually occurs…so yes the larger ones because of the complexity are more likely to fail but we have so many checks and so many people watching it that…they may never fail…." (NB)
"Supplementary data is creating a lot of problems when the systems interface into each other " (CO)
"Selling our products online? No, that's not an option for us, no way, our products are too complex, and customers want to talk to us, we need to understand what they want to offer something that they need…you can’t do that through the internet" (NB)
"When I prepare an offer, it's not easy, I have created a small programm in excel to help me manage that" (NB)
"Our system interfaces are not very reliable, especially since the introduction of pricing expert there have been a lot of problems so its often safer to do it manually in order to avoid those issues" (NB)
"Renewals for low volume, high value customers may be managed more individually by strategic and key account managers" (PACMAN)
"The solution does not currently support flexible contracts. There is no detailed process for handling the pricing of flexible contracts in PE" (PACMAN)
"Loads of face-to-face meetings are necessary to produce a quote” (PR)
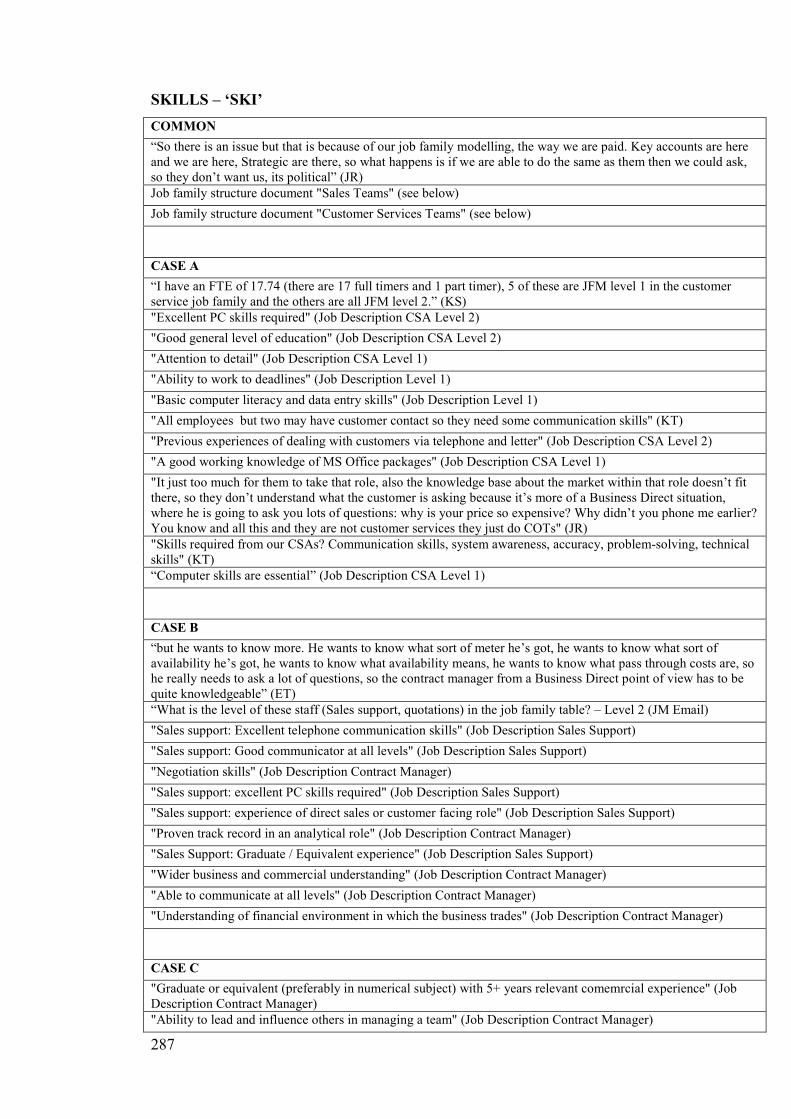
287
SKILLS – ‘SKI’
COMMON
“So there is an issue but that is because of our job family modelling, the way we are paid. Key accounts are here and we are here, Strategic are there, so what happens is if we are able to do the same as them then we could ask, so they don’t want us, its political” (JR)
Job family structure document "Sales Teams" (see below)
Job family structure document "Customer Services Teams" (see below)
CASE A
“I have an FTE of 17.74 (there are 17 full timers and 1 part timer), 5 of these are JFM level 1 in the customer service job family and the others are all JFM level 2.” (KS)
"Excellent PC skills required" (Job Description CSA Level 2)
"Good general level of education" (Job Description CSA Level 2)
"Attention to detail" (Job Description CSA Level 1)
"Ability to work to deadlines" (Job Description Level 1)
"Basic computer literacy and data entry skills" (Job Description Level 1)
"All employees but two may have customer contact so they need some communication skills" (KT)
"Previous experiences of dealing with customers via telephone and letter" (Job Description CSA Level 2)
"A good working knowledge of MS Office packages" (Job Description CSA Level 1)
"It just too much for them to take that role, also the knowledge base about the market within that role doesn’t fit there, so they don’t understand what the customer is asking because it’s more of a Business Direct situation, where he is going to ask you lots of questions: why is your price so expensive? Why didn’t you phone me earlier? You know and all this and they are not customer services they just do COTs" (JR)
"Skills required from our CSAs? Communication skills, system awareness, accuracy, problem-solving, technical skills" (KT)
“Computer skills are essential” (Job Description CSA Level 1)
CASE B
“but he wants to know more. He wants to know what sort of meter he’s got, he wants to know what sort of availability he’s got, he wants to know what availability means, he wants to know what pass through costs are, so he really needs to ask a lot of questions, so the contract manager from a Business Direct point of view has to be quite knowledgeable” (ET)
“What is the level of these staff (Sales support, quotations) in the job family table? – Level 2 (JM Email)
"Sales support: Excellent telephone communication skills" (Job Description Sales Support)
"Sales support: Good communicator at all levels" (Job Description Sales Support)
"Negotiation skills" (Job Description Contract Manager)
"Sales support: excellent PC skills required" (Job Description Sales Support)
"Sales support: experience of direct sales or customer facing role" (Job Description Sales Support)
"Proven track record in an analytical role" (Job Description Contract Manager)
"Sales Support: Graduate / Equivalent experience" (Job Description Sales Support)
"Wider business and commercial understanding" (Job Description Contract Manager)
"Able to communicate at all levels" (Job Description Contract Manager)
"Understanding of financial environment in which the business trades" (Job Description Contract Manager)
CASE C
"Graduate or equivalent (preferably in numerical subject) with 5+ years relevant comemrcial experience" (Job Description Contract Manager)
"Ability to lead and influence others in managing a team" (Job Description Contract Manager)
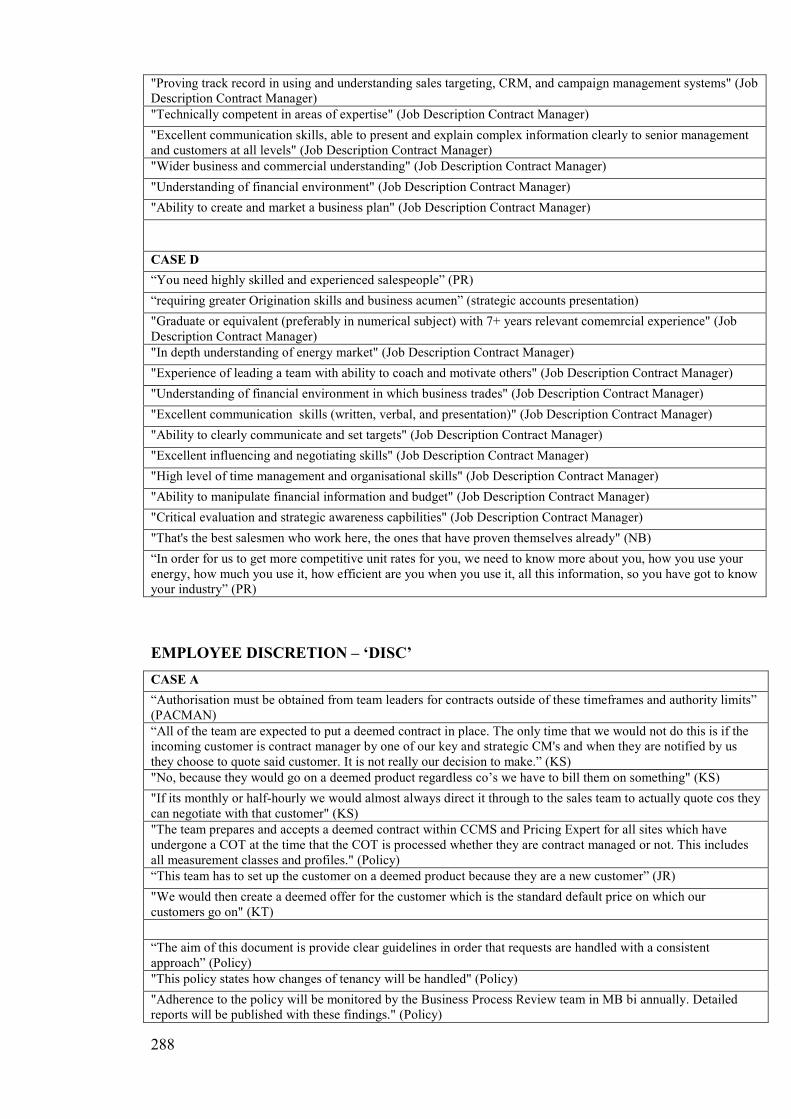
288
"Proving track record in using and understanding sales targeting, CRM, and campaign management systems" (Job Description Contract Manager)
"Technically competent in areas of expertise" (Job Description Contract Manager)
"Excellent communication skills, able to present and explain complex information clearly to senior management and customers at all levels" (Job Description Contract Manager)
"Wider business and commercial understanding" (Job Description Contract Manager)
"Understanding of financial environment" (Job Description Contract Manager)
"Ability to create and market a business plan" (Job Description Contract Manager)
CASE D
“You need highly skilled and experienced salespeople” (PR)
“requiring greater Origination skills and business acumen” (strategic accounts presentation)
"Graduate or equivalent (preferably in numerical subject) with 7+ years relevant comemrcial experience" (Job Description Contract Manager)
"In depth understanding of energy market" (Job Description Contract Manager)
"Experience of leading a team with ability to coach and motivate others" (Job Description Contract Manager)
"Understanding of financial environment in which business trades" (Job Description Contract Manager)
"Excellent communication skills (written, verbal, and presentation)" (Job Description Contract Manager)
"Ability to clearly communicate and set targets" (Job Description Contract Manager)
"Excellent influencing and negotiating skills" (Job Description Contract Manager)
"High level of time management and organisational skills" (Job Description Contract Manager)
"Ability to manipulate financial information and budget" (Job Description Contract Manager)
"Critical evaluation and strategic awareness capbilities" (Job Description Contract Manager)
"That's the best salesmen who work here, the ones that have proven themselves already" (NB)
“In order for us to get more competitive unit rates for you, we need to know more about you, how you use your energy, how much you use it, how efficient are you when you use it, all this information, so you have got to know your industry” (PR)
EMPLOYEE DISCRETION – ‘DISC’
CASE A
“Authorisation must be obtained from team leaders for contracts outside of these timeframes and authority limits” (PACMAN)
“All of the team are expected to put a deemed contract in place. The only time that we would not do this is if the incoming customer is contract manager by one of our key and strategic CM's and when they are notified by us they choose to quote said customer. It is not really our decision to make.” (KS)
"No, because they would go on a deemed product regardless co’s we have to bill them on something" (KS)
"If its monthly or half-hourly we would almost always direct it through to the sales team to actually quote cos they can negotiate with that customer" (KS)
"The team prepares and accepts a deemed contract within CCMS and Pricing Expert for all sites which have undergone a COT at the time that the COT is processed whether they are contract managed or not. This includes all measurement classes and profiles." (Policy)
“This team has to set up the customer on a deemed product because they are a new customer” (JR)
"We would then create a deemed offer for the customer which is the standard default price on which our customers go on" (KT)
“The aim of this document is provide clear guidelines in order that requests are handled with a consistent approach” (Policy)
"This policy states how changes of tenancy will be handled" (Policy)
"Adherence to the policy will be monitored by the Business Process Review team in MB bi annually. Detailed reports will be published with these findings." (Policy)
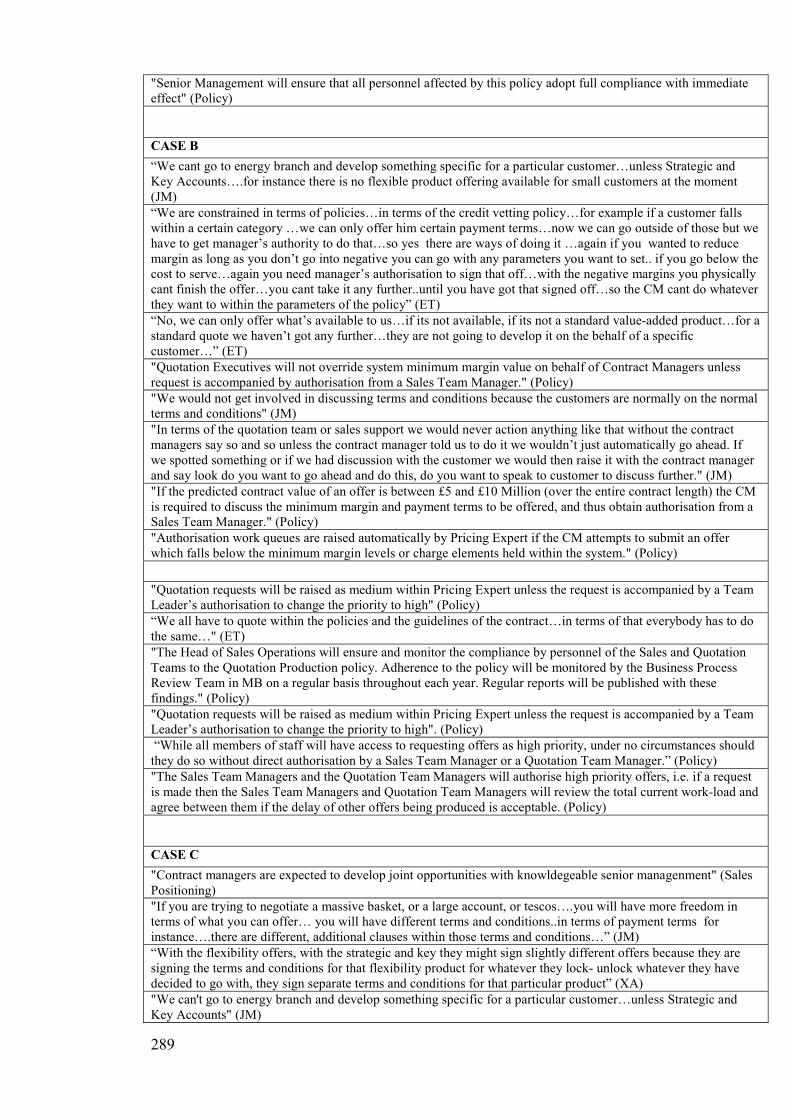
289
"Senior Management will ensure that all personnel affected by this policy adopt full compliance with immediate effect" (Policy)
CASE B
“We cant go to energy branch and develop something specific for a particular customer…unless Strategic and Key Accounts….for instance there is no flexible product offering available for small customers at the moment (JM)
“We are constrained in terms of policies…in terms of the credit vetting policy…for example if a customer falls within a certain category …we can only offer him certain payment terms…now we can go outside of those but we have to get manager’s authority to do that…so yes there are ways of doing it …again if you wanted to reduce margin as long as you don’t go into negative you can go with any parameters you want to set.. if you go below the cost to serve…again you need manager’s authorisation to sign that off…with the negative margins you physically cant finish the offer…you cant take it any further..until you have got that signed off…so the CM cant do whatever they want to within the parameters of the policy” (ET)
“No, we can only offer what’s available to us…if its not available, if its not a standard value-added product…for a standard quote we haven’t got any further…they are not going to develop it on the behalf of a specific customer…” (ET)
"Quotation Executives will not override system minimum margin value on behalf of Contract Managers unless request is accompanied by authorisation from a Sales Team Manager." (Policy)
"We would not get involved in discussing terms and conditions because the customers are normally on the normal terms and conditions" (JM)
"In terms of the quotation team or sales support we would never action anything like that without the contract managers say so and so unless the contract manager told us to do it we wouldn’t just automatically go ahead. If we spotted something or if we had discussion with the customer we would then raise it with the contract manager and say look do you want to go ahead and do this, do you want to speak to customer to discuss further." (JM)
"If the predicted contract value of an offer is between £5 and £10 Million (over the entire contract length) the CM is required to discuss the minimum margin and payment terms to be offered, and thus obtain authorisation from a Sales Team Manager." (Policy)
"Authorisation work queues are raised automatically by Pricing Expert if the CM attempts to submit an offer which falls below the minimum margin levels or charge elements held within the system." (Policy)
"Quotation requests will be raised as medium within Pricing Expert unless the request is accompanied by a Team Leader’s authorisation to change the priority to high" (Policy)
“We all have to quote within the policies and the guidelines of the contract…in terms of that everybody has to do the same…" (ET)
"The Head of Sales Operations will ensure and monitor the compliance by personnel of the Sales and Quotation Teams to the Quotation Production policy. Adherence to the policy will be monitored by the Business Process Review Team in MB on a regular basis throughout each year. Regular reports will be published with these findings." (Policy)
"Quotation requests will be raised as medium within Pricing Expert unless the request is accompanied by a Team Leader’s authorisation to change the priority to high". (Policy)
“While all members of staff will have access to requesting offers as high priority, under no circumstances should they do so without direct authorisation by a Sales Team Manager or a Quotation Team Manager.” (Policy)
"The Sales Team Managers and the Quotation Team Managers will authorise high priority offers, i.e. if a request is made then the Sales Team Managers and Quotation Team Managers will review the total current work-load and agree between them if the delay of other offers being produced is acceptable. (Policy)
CASE C
"Contract managers are expected to develop joint opportunities with knowldegeable senior managenment" (Sales Positioning)
"If you are trying to negotiate a massive basket, or a large account, or tescos….you will have more freedom in terms of what you can offer… you will have different terms and conditions..in terms of payment terms for instance….there are different, additional clauses within those terms and conditions…” (JM)
“With the flexibility offers, with the strategic and key they might sign slightly different offers because they are signing the terms and conditions for that flexibility product for whatever they lock- unlock whatever they have decided to go with, they sign separate terms and conditions for that particular product” (XA)
"We can't go to energy branch and develop something specific for a particular customer…unless Strategic and Key Accounts" (JM)
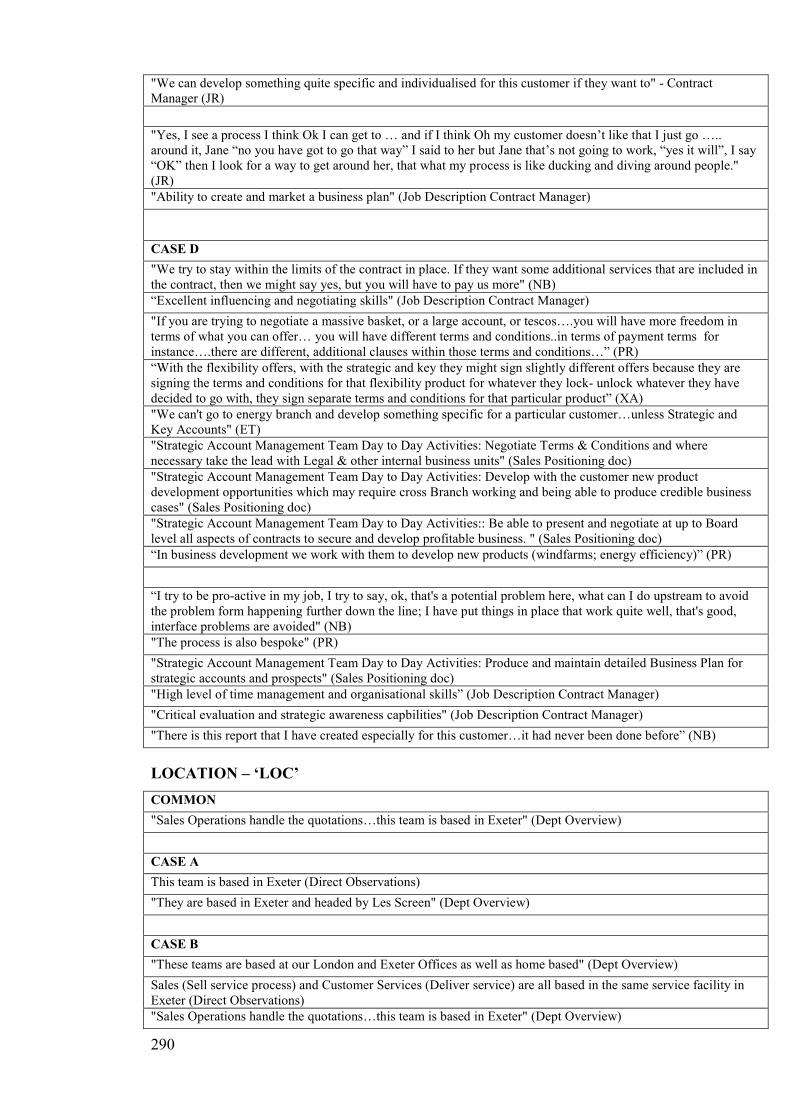
290
"We can develop something quite specific and individualised for this customer if they want to" - Contract Manager (JR)
"Yes, I see a process I think Ok I can get to … and if I think Oh my customer doesn’t like that I just go ….. around it, Jane “no you have got to go that way” I said to her but Jane that’s not going to work, “yes it will”, I say “OK” then I look for a way to get around her, that what my process is like ducking and diving around people." (JR)
"Ability to create and market a business plan" (Job Description Contract Manager)
CASE D
"We try to stay within the limits of the contract in place. If they want some additional services that are included in the contract, then we might say yes, but you will have to pay us more" (NB)
“Excellent influencing and negotiating skills" (Job Description Contract Manager)
"If you are trying to negotiate a massive basket, or a large account, or tescos….you will have more freedom in terms of what you can offer… you will have different terms and conditions..in terms of payment terms for instance….there are different, additional clauses within those terms and conditions…” (PR)
“With the flexibility offers, with the strategic and key they might sign slightly different offers because they are signing the terms and conditions for that flexibility product for whatever they lock- unlock whatever they have decided to go with, they sign separate terms and conditions for that particular product” (XA)
"We can't go to energy branch and develop something specific for a particular customer…unless Strategic and Key Accounts" (ET)
"Strategic Account Management Team Day to Day Activities: Negotiate Terms & Conditions and where necessary take the lead with Legal & other internal business units" (Sales Positioning doc)
"Strategic Account Management Team Day to Day Activities: Develop with the customer new product development opportunities which may require cross Branch working and being able to produce credible business cases" (Sales Positioning doc)
"Strategic Account Management Team Day to Day Activities:: Be able to present and negotiate at up to Board level all aspects of contracts to secure and develop profitable business. " (Sales Positioning doc)
“In business development we work with them to develop new products (windfarms; energy efficiency)” (PR)
“I try to be pro-active in my job, I try to say, ok, that's a potential problem here, what can I do upstream to avoid the problem form happening further down the line; I have put things in place that work quite well, that's good, interface problems are avoided" (NB)
"The process is also bespoke" (PR)
"Strategic Account Management Team Day to Day Activities: Produce and maintain detailed Business Plan for strategic accounts and prospects" (Sales Positioning doc)
"High level of time management and organisational skills” (Job Description Contract Manager)
"Critical evaluation and strategic awareness capbilities" (Job Description Contract Manager)
"There is this report that I have created especially for this customer…it had never been done before” (NB)
LOCATION – ‘LOC’
COMMON
"Sales Operations handle the quotations…this team is based in Exeter" (Dept Overview)
CASE A
This team is based in Exeter (Direct Observations)
"They are based in Exeter and headed by Les Screen" (Dept Overview)
CASE B
"These teams are based at our London and Exeter Offices as well as home based" (Dept Overview)
Sales (Sell service process) and Customer Services (Deliver service) are all based in the same service facility in Exeter (Direct Observations)
"Sales Operations handle the quotations…this team is based in Exeter" (Dept Overview)
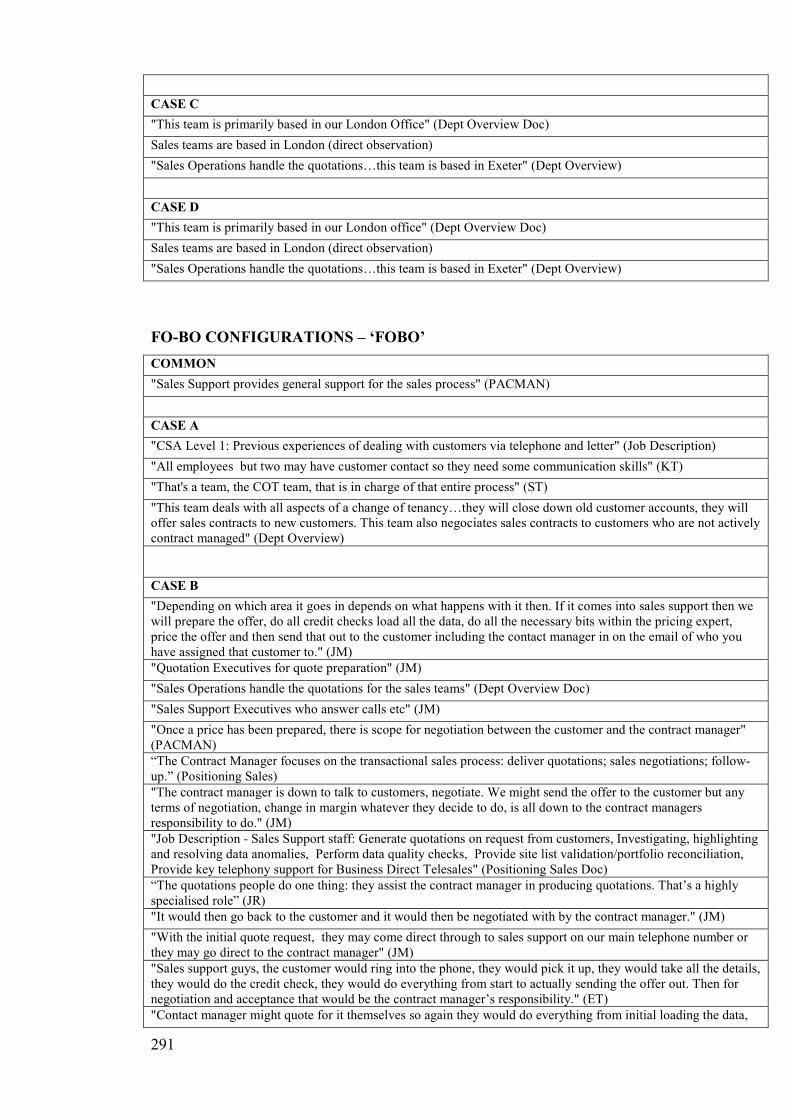
291
CASE C
"This team is primarily based in our London Office" (Dept Overview Doc)
Sales teams are based in London (direct observation)
"Sales Operations handle the quotations…this team is based in Exeter" (Dept Overview)
CASE D
"This team is primarily based in our London office" (Dept Overview Doc)
Sales teams are based in London (direct observation)
"Sales Operations handle the quotations…this team is based in Exeter" (Dept Overview)
FO-BO CONFIGURATIONS – ‘FOBO’
COMMON
"Sales Support provides general support for the sales process" (PACMAN)
CASE A
"CSA Level 1: Previous experiences of dealing with customers via telephone and letter" (Job Description)
"All employees but two may have customer contact so they need some communication skills" (KT)
"That's a team, the COT team, that is in charge of that entire process" (ST)
"This team deals with all aspects of a change of tenancy…they will close down old customer accounts, they will offer sales contracts to new customers. This team also negociates sales contracts to customers who are not actively contract managed" (Dept Overview)
CASE B
"Depending on which area it goes in depends on what happens with it then. If it comes into sales support then we will prepare the offer, do all credit checks load all the data, do all the necessary bits within the pricing expert, price the offer and then send that out to the customer including the contact manager in on the email of who you have assigned that customer to." (JM)
"Quotation Executives for quote preparation" (JM)
"Sales Operations handle the quotations for the sales teams" (Dept Overview Doc)
"Sales Support Executives who answer calls etc" (JM)
"Once a price has been prepared, there is scope for negotiation between the customer and the contract manager" (PACMAN)
“The Contract Manager focuses on the transactional sales process: deliver quotations; sales negotiations; follow-up.” (Positioning Sales)
"The contract manager is down to talk to customers, negotiate. We might send the offer to the customer but any terms of negotiation, change in margin whatever they decide to do, is all down to the contract managers responsibility to do." (JM)
"Job Description - Sales Support staff: Generate quotations on request from customers, Investigating, highlighting and resolving data anomalies, Perform data quality checks, Provide site list validation/portfolio reconciliation, Provide key telephony support for Business Direct Telesales" (Positioning Sales Doc)
“The quotations people do one thing: they assist the contract manager in producing quotations. That’s a highly specialised role” (JR)
"It would then go back to the customer and it would then be negotiated with by the contract manager." (JM)
"With the initial quote request, they may come direct through to sales support on our main telephone number or they may go direct to the contract manager" (JM)
"Sales support guys, the customer would ring into the phone, they would pick it up, they would take all the details, they would do the credit check, they would do everything from start to actually sending the offer out. Then for negotiation and acceptance that would be the contract manager’s responsibility." (ET)
"Contact manager might quote for it themselves so again they would do everything from initial loading the data,
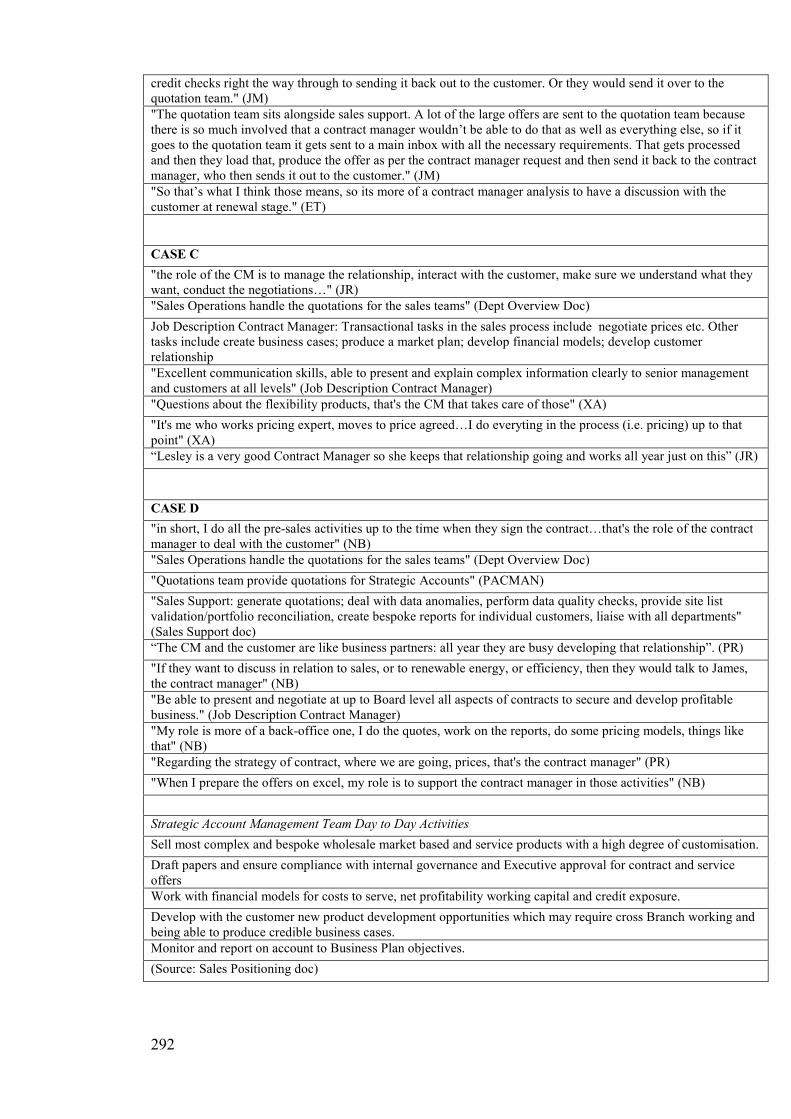
292
credit checks right the way through to sending it back out to the customer. Or they would send it over to the quotation team." (JM)
"The quotation team sits alongside sales support. A lot of the large offers are sent to the quotation team because there is so much involved that a contract manager wouldn’t be able to do that as well as everything else, so if it goes to the quotation team it gets sent to a main inbox with all the necessary requirements. That gets processed and then they load that, produce the offer as per the contract manager request and then send it back to the contract manager, who then sends it out to the customer." (JM)
"So that’s what I think those means, so its more of a contract manager analysis to have a discussion with the customer at renewal stage." (ET)
CASE C
"the role of the CM is to manage the relationship, interact with the customer, make sure we understand what they want, conduct the negotiations…" (JR)
"Sales Operations handle the quotations for the sales teams" (Dept Overview Doc)
Job Description Contract Manager: Transactional tasks in the sales process include negotiate prices etc. Other tasks include create business cases; produce a market plan; develop financial models; develop customer relationship
"Excellent communication skills, able to present and explain complex information clearly to senior management and customers at all levels" (Job Description Contract Manager)
"Questions about the flexibility products, that's the CM that takes care of those" (XA)
"It's me who works pricing expert, moves to price agreed…I do everyting in the process (i.e. pricing) up to that point" (XA)
“Lesley is a very good Contract Manager so she keeps that relationship going and works all year just on this” (JR)
CASE D
"in short, I do all the pre-sales activities up to the time when they sign the contract…that's the role of the contract manager to deal with the customer" (NB)
"Sales Operations handle the quotations for the sales teams" (Dept Overview Doc)
"Quotations team provide quotations for Strategic Accounts" (PACMAN)
"Sales Support: generate quotations; deal with data anomalies, perform data quality checks, provide site list validation/portfolio reconciliation, create bespoke reports for individual customers, liaise with all departments" (Sales Support doc)
“The CM and the customer are like business partners: all year they are busy developing that relationship”. (PR)
"If they want to discuss in relation to sales, or to renewable energy, or efficiency, then they would talk to James, the contract manager" (NB)
"Be able to present and negotiate at up to Board level all aspects of contracts to secure and develop profitable business." (Job Description Contract Manager)
"My role is more of a back-office one, I do the quotes, work on the reports, do some pricing models, things like that" (NB)
"Regarding the strategy of contract, where we are going, prices, that's the contract manager" (PR)
"When I prepare the offers on excel, my role is to support the contract manager in those activities" (NB)
Strategic Account Management Team Day to Day Activities
Sell most complex and bespoke wholesale market based and service products with a high degree of customisation.
Draft papers and ensure compliance with internal governance and Executive approval for contract and service offers
Work with financial models for costs to serve, net profitability working capital and credit exposure.
Develop with the customer new product development opportunities which may require cross Branch working and being able to produce credible business cases.
Monitor and report on account to Business Plan objectives.
(Source: Sales Positioning doc)

293
EFFICIENCY – ‘COST’
COMMON
Evaluating costs by using the number of employees as a proxy: "C’est a peu pres la methode que j’utilise et c’est probablement ce qu’il y a de mieux en l’absence de plus precis. Neanmoins, si la part de temps passe par les equipes sur le « Autres » est important et non mesure, les erreurs d’evaluation peuvent etre importantes. La facon de reduire le risque d’erreur est alors d’essayer d’identifier et de quantifier en meme temps toutes les taches effectuees de manière a verifier que la somme n’excede pas completement les ressources effectives. " (AW)
"Major Business Headcount June 2008: Sales: 156" (Human Resources Headcount doc)
"3.5 full time equivalents were allocated to the function of interface failure resolution with 1 additional FTE allocated during the contract rounds as required" (PACMAN)
CASE A
"High volume, low value customer segments" (KS)
"I have an FTE of 17.74 (there are 17 full timers and 1 part timer), 5 of these are JFM level 1 in the customer service job family and the others are all JFM level 2" (KS - email)
"Yeah, we do have a lot of COTs, I think it has expanded mainly because what constitutes a major customer has expanded..it used to be HH and profiles 5 to 8..that was major business…but with housing authorities, government bodies, consultants with large portfolios…we have a lot more of profiles….the thing with smaller sites is that there is a much bigger turnover of customers so it has expanded with that part of our major business portfolio expanding..and its not going to go away…especially with housing authorities we are getting a whole porfolio of housing authorities…and then over a period of two years people are moving in and out of those houses continuously" (ST)
"These customers are less profitable so there are less resources dedicated to them" (CL)
Line Manager's Name Perm Temp Grand Total (HR Headcount doc)
Mrs KS 17 1 18
CASE B
"High volume, low value customer segments" (JM)
“Business Direct comprises a team of around 45 people who manage sales directly to customers” (PACMAN)
"How many Contract Managers deal with Business Direct customers? Approx 35" (JM, email)
"How many sales ops/support staff deal with Business Direct customers? Approx. 7 Quotation Executives for quote preparation, 13 Sales Support Executives" (JM, email)
"Team is headed by Mike G." (Dept Overview doc)
"Because we deal with high volumes…” (ET)
“BD have lots of small customers, often single sites” (ET)
CASE C
"The team is headed by Mike L." (Dept Overview doc)
"Mike L. heads a team of 14 people" (Headcount doc HR)
“Key Accounts comprises a team of around 10 people” (PACMAN)
"Organisational Chart: 12 Contract Managers, 1 commercial support (L2), 1 admin support (L2)" (Key accounts team presentation)
“Each CM manages several customers” (XA)
“Whereas with the Key and Strategic…because they have less customers" (JM)
"You might get more people working on 2000 laser sites and get more problems" (JR)
"Organisational Chart: see below"
"LM heads the sales quotations teams that is shared across Key Accounts and Strategic Accounts"
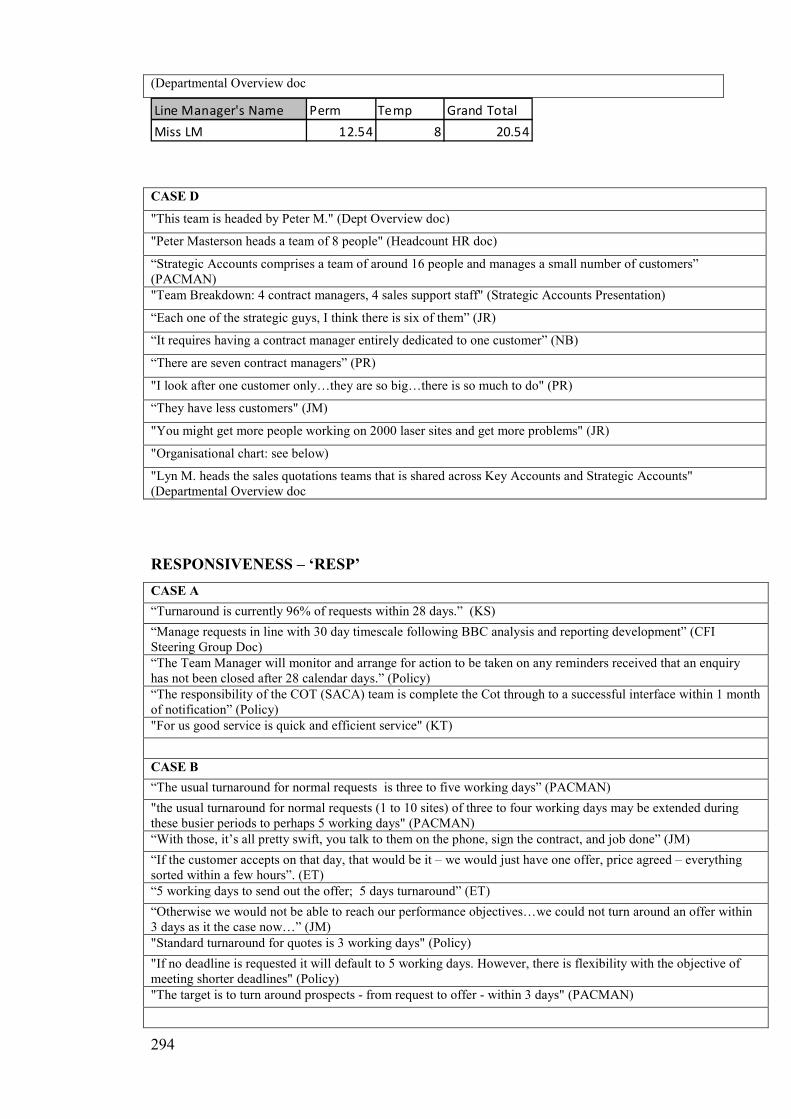
294
(Departmental Overview doc
Line Manager's Name Perm Temp Grand Total
Miss LM 12.54 8 20.54
CASE D
"This team is headed by Peter M." (Dept Overview doc)
"Peter Masterson heads a team of 8 people" (Headcount HR doc)
“Strategic Accounts comprises a team of around 16 people and manages a small number of customers” (PACMAN)
"Team Breakdown: 4 contract managers, 4 sales support staff" (Strategic Accounts Presentation)
“Each one of the strategic guys, I think there is six of them” (JR)
“It requires having a contract manager entirely dedicated to one customer” (NB)
“There are seven contract managers” (PR)
"I look after one customer only…they are so big…there is so much to do" (PR)
“They have less customers" (JM)
"You might get more people working on 2000 laser sites and get more problems" (JR)
"Organisational chart: see below)
"Lyn M. heads the sales quotations teams that is shared across Key Accounts and Strategic Accounts" (Departmental Overview doc
RESPONSIVENESS – ‘RESP’
CASE A
“Turnaround is currently 96% of requests within 28 days.” (KS)
“Manage requests in line with 30 day timescale following BBC analysis and reporting development” (CFI Steering Group Doc)
“The Team Manager will monitor and arrange for action to be taken on any reminders received that an enquiry has not been closed after 28 calendar days.” (Policy)
“The responsibility of the COT (SACA) team is complete the Cot through to a successful interface within 1 month of notification” (Policy)
"For us good service is quick and efficient service" (KT)
CASE B
“The usual turnaround for normal requests is three to five working days” (PACMAN)
"the usual turnaround for normal requests (1 to 10 sites) of three to four working days may be extended during these busier periods to perhaps 5 working days" (PACMAN)
“With those, it’s all pretty swift, you talk to them on the phone, sign the contract, and job done” (JM)
“If the customer accepts on that day, that would be it – we would just have one offer, price agreed – everything sorted within a few hours”. (ET)
“5 working days to send out the offer; 5 days turnaround” (ET)
“Otherwise we would not be able to reach our performance objectives…we could not turn around an offer within 3 days as it the case now…” (JM)
"Standard turnaround for quotes is 3 working days" (Policy)
"If no deadline is requested it will default to 5 working days. However, there is flexibility with the objective of meeting shorter deadlines" (Policy)
"The target is to turn around prospects - from request to offer - within 3 days" (PACMAN)
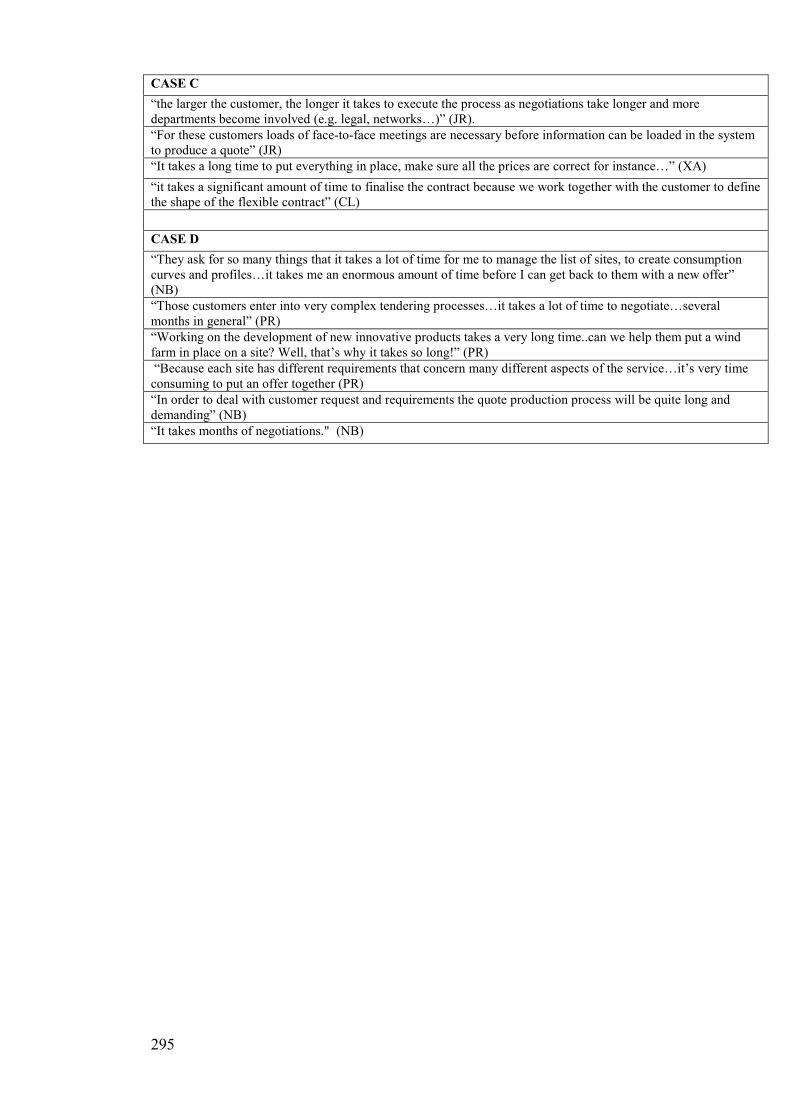
295
CASE C
“the larger the customer, the longer it takes to execute the process as negotiations take longer and more departments become involved (e.g. legal, networks…)” (JR).
“For these customers loads of face-to-face meetings are necessary before information can be loaded in the system to produce a quote” (JR)
“It takes a long time to put everything in place, make sure all the prices are correct for instance…” (XA)
“it takes a significant amount of time to finalise the contract because we work together with the customer to define the shape of the flexible contract” (CL)
CASE D
“They ask for so many things that it takes a lot of time for me to manage the list of sites, to create consumption curves and profiles…it takes me an enormous amount of time before I can get back to them with a new offer” (NB)
“Those customers enter into very complex tendering processes…it takes a lot of time to negotiate…several months in general” (PR)
“Working on the development of new innovative products takes a very long time..can we help them put a wind farm in place on a site? Well, that’s why it takes so long!” (PR)
“Because each site has different requirements that concern many different aspects of the service…it’s very time consuming to put an offer together (PR)
“In order to deal with customer request and requirements the quote production process will be quite long and demanding” (NB)
“It takes months of negotiations." (NB)
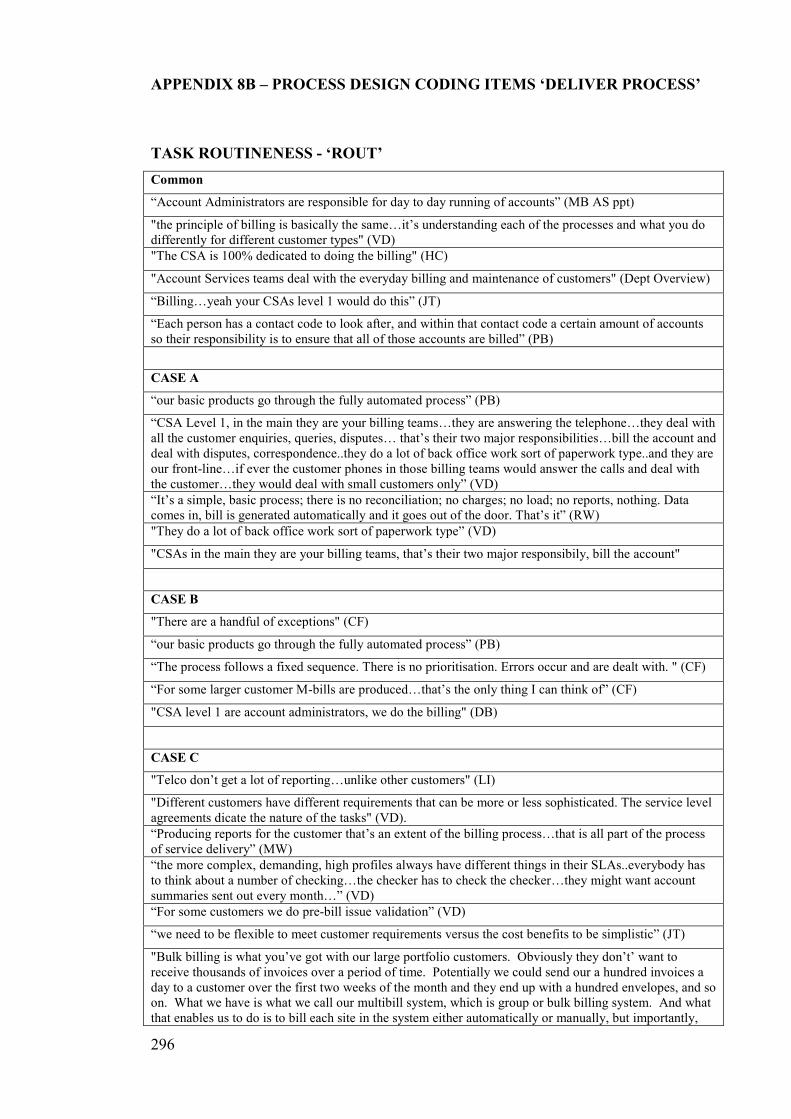
296
APPENDIX 8B – PROCESS DESIGN CODING ITEMS ‘DELIVER PROCESS’
TASK ROUTINENESS - ‘ROUT’
Common
“Account Administrators are responsible for day to day running of accounts” (MB AS ppt)
"the principle of billing is basically the same…it’s understanding each of the processes and what you do differently for different customer types" (VD)
"The CSA is 100% dedicated to doing the billing" (HC)
"Account Services teams deal with the everyday billing and maintenance of customers" (Dept Overview)
“Billing…yeah your CSAs level 1 would do this” (JT)
“Each person has a contact code to look after, and within that contact code a certain amount of accounts so their responsibility is to ensure that all of those accounts are billed” (PB)
CASE A
“our basic products go through the fully automated process” (PB)
“CSA Level 1, in the main they are your billing teams…they are answering the telephone…they deal with all the customer enquiries, queries, disputes… that’s their two major responsibilities…bill the account and deal with disputes, correspondence..they do a lot of back office work sort of paperwork type..and they are our front-line…if ever the customer phones in those billing teams would answer the calls and deal with the customer…they would deal with small customers only” (VD)
“It’s a simple, basic process; there is no reconciliation; no charges; no load; no reports, nothing. Data comes in, bill is generated automatically and it goes out of the door. That’s it” (RW)
"They do a lot of back office work sort of paperwork type” (VD)
"CSAs in the main they are your billing teams, that’s their two major responsibily, bill the account"
CASE B
"There are a handful of exceptions" (CF)
“our basic products go through the fully automated process” (PB)
“The process follows a fixed sequence. There is no prioritisation. Errors occur and are dealt with. " (CF)
“For some larger customer M-bills are produced…that’s the only thing I can think of” (CF)
"CSA level 1 are account administrators, we do the billing" (DB)
CASE C
"Telco don’t get a lot of reporting…unlike other customers" (LI)
"Different customers have different requirements that can be more or less sophisticated. The service level agreements dicate the nature of the tasks" (VD).
“Producing reports for the customer that’s an extent of the billing process…that is all part of the process of service delivery” (MW)
“the more complex, demanding, high profiles always have different things in their SLAs..everybody has to think about a number of checking…the checker has to check the checker…they might want account summaries sent out every month…” (VD)
“For some customers we do pre-bill issue validation” (VD)
“we need to be flexible to meet customer requirements versus the cost benefits to be simplistic” (JT)
"Bulk billing is what you’ve got with our large portfolio customers. Obviously they don’t’ want to receive thousands of invoices over a period of time. Potentially we could send our a hundred invoices a day to a customer over the first two weeks of the month and they end up with a hundred envelopes, and so on. What we have is what we call our multibill system, which is group or bulk billing system. And what that enables us to do is to bill each site in the system either automatically or manually, but importantly,
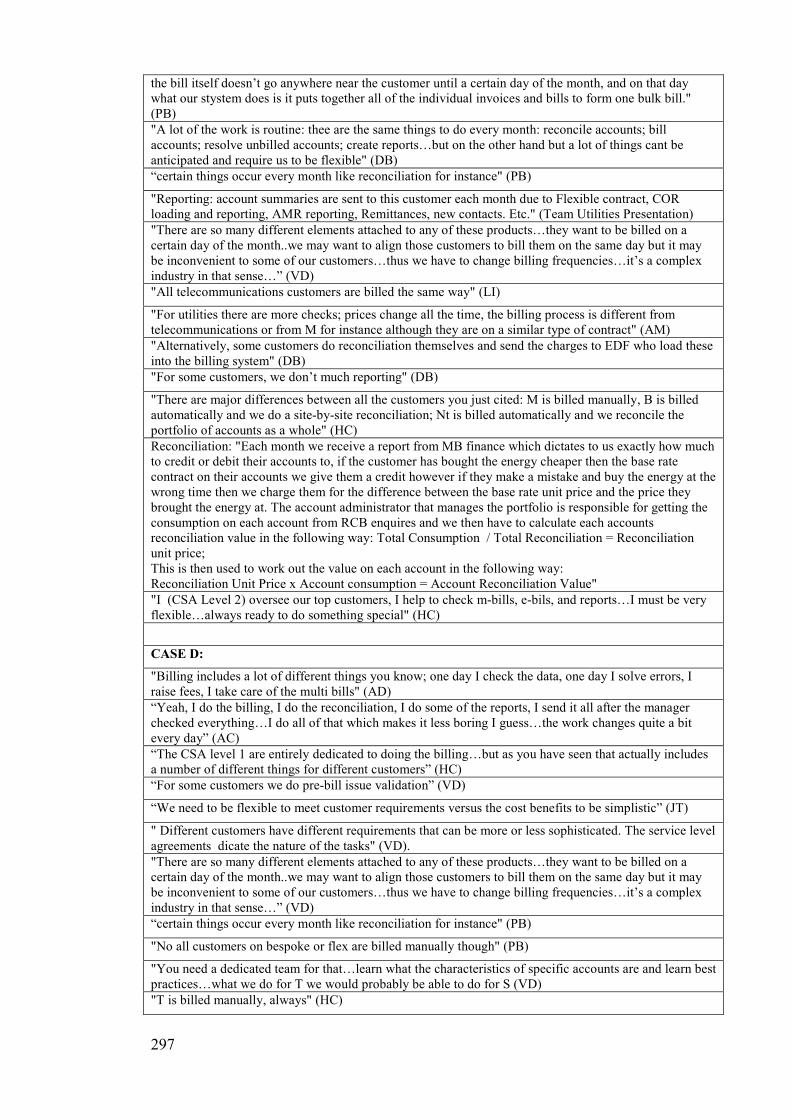
297
the bill itself doesn’t go anywhere near the customer until a certain day of the month, and on that day what our stystem does is it puts together all of the individual invoices and bills to form one bulk bill." (PB)
"A lot of the work is routine: thee are the same things to do every month: reconcile accounts; bill accounts; resolve unbilled accounts; create reports…but on the other hand but a lot of things cant be anticipated and require us to be flexible" (DB)
“certain things occur every month like reconciliation for instance" (PB)
"Reporting: account summaries are sent to this customer each month due to Flexible contract, COR loading and reporting, AMR reporting, Remittances, new contacts. Etc." (Team Utilities Presentation)
"There are so many different elements attached to any of these products…they want to be billed on a certain day of the month..we may want to align those customers to bill them on the same day but it may be inconvenient to some of our customers…thus we have to change billing frequencies…it’s a complex industry in that sense…” (VD)
"All telecommunications customers are billed the same way" (LI)
"For utilities there are more checks; prices change all the time, the billing process is different from telecommunications or from M for instance although they are on a similar type of contract" (AM)
"Alternatively, some customers do reconciliation themselves and send the charges to EDF who load these into the billing system" (DB)
"For some customers, we don’t much reporting" (DB)
"There are major differences between all the customers you just cited: M is billed manually, B is billed automatically and we do a site-by-site reconciliation; Nt is billed automatically and we reconcile the portfolio of accounts as a whole" (HC)
Reconciliation: "Each month we receive a report from MB finance which dictates to us exactly how much to credit or debit their accounts to, if the customer has bought the energy cheaper then the base rate contract on their accounts we give them a credit however if they make a mistake and buy the energy at the wrong time then we charge them for the difference between the base rate unit price and the price they brought the energy at. The account administrator that manages the portfolio is responsible for getting the consumption on each account from RCB enquires and we then have to calculate each accounts reconciliation value in the following way: Total Consumption / Total Reconciliation = Reconciliation unit price; This is then used to work out the value on each account in the following way: Reconciliation Unit Price x Account consumption = Account Reconciliation Value"
"I (CSA Level 2) oversee our top customers, I help to check m-bills, e-bils, and reports…I must be very flexible…always ready to do something special" (HC)
CASE D:
"Billing includes a lot of different things you know; one day I check the data, one day I solve errors, I raise fees, I take care of the multi bills" (AD)
“Yeah, I do the billing, I do the reconciliation, I do some of the reports, I send it all after the manager checked everything…I do all of that which makes it less boring I guess…the work changes quite a bit every day” (AC)
“The CSA level 1 are entirely dedicated to doing the billing…but as you have seen that actually includes a number of different things for different customers” (HC)
“For some customers we do pre-bill issue validation” (VD)
“We need to be flexible to meet customer requirements versus the cost benefits to be simplistic” (JT)
" Different customers have different requirements that can be more or less sophisticated. The service level agreements dicate the nature of the tasks" (VD).
"There are so many different elements attached to any of these products…they want to be billed on a certain day of the month..we may want to align those customers to bill them on the same day but it may be inconvenient to some of our customers…thus we have to change billing frequencies…it’s a complex industry in that sense…” (VD)
“certain things occur every month like reconciliation for instance" (PB)
"No all customers on bespoke or flex are billed manually though" (PB)
"You need a dedicated team for that…learn what the characteristics of specific accounts are and learn best practices…what we do for T we would probably be able to do for S (VD)
"T is billed manually, always" (HC)
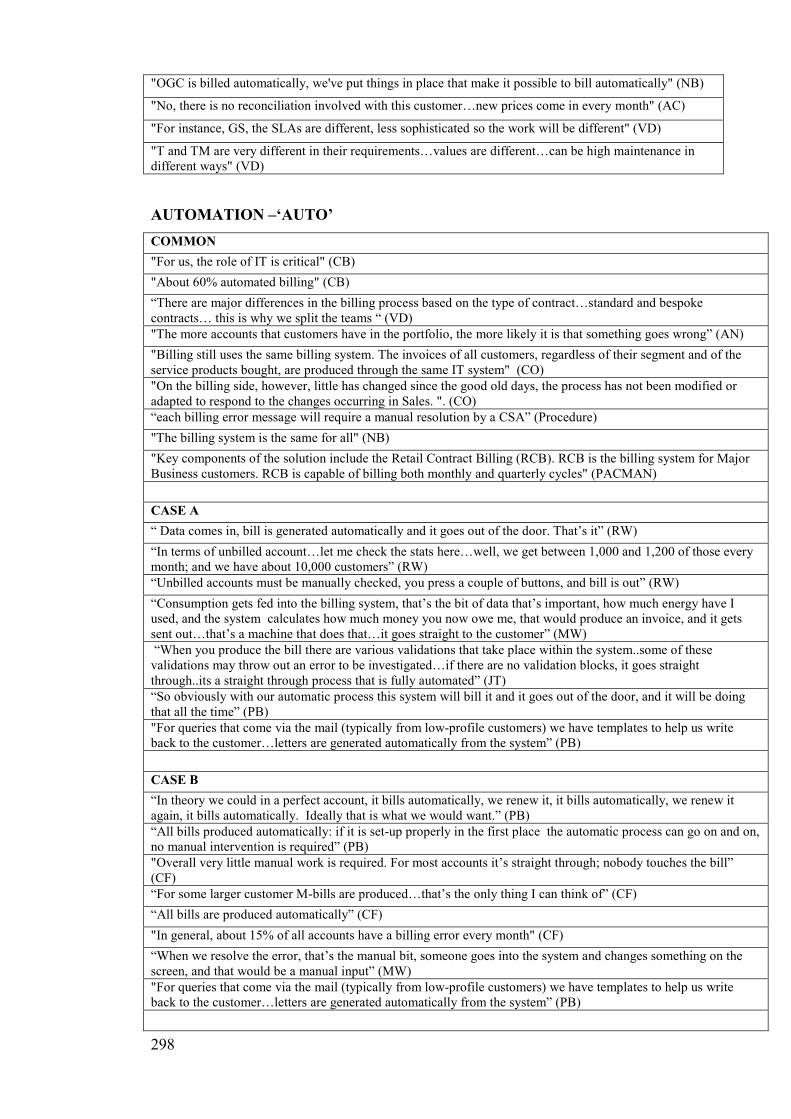
298
"OGC is billed automatically, we've put things in place that make it possible to bill automatically" (NB)
"No, there is no reconciliation involved with this customer…new prices come in every month" (AC)
"For instance, GS, the SLAs are different, less sophisticated so the work will be different" (VD)
"T and TM are very different in their requirements…values are different…can be high maintenance in different ways" (VD)
AUTOMATION –‘AUTO’
COMMON
"For us, the role of IT is critical" (CB)
"About 60% automated billing" (CB)
“There are major differences in the billing process based on the type of contract…standard and bespoke contracts… this is why we split the teams “ (VD)
"The more accounts that customers have in the portfolio, the more likely it is that something goes wrong” (AN)
"Billing still uses the same billing system. The invoices of all customers, regardless of their segment and of the service products bought, are produced through the same IT system" (CO)
"On the billing side, however, little has changed since the good old days, the process has not been modified or adapted to respond to the changes occurring in Sales. ". (CO)
“each billing error message will require a manual resolution by a CSA” (Procedure)
"The billing system is the same for all" (NB)
"Key components of the solution include the Retail Contract Billing (RCB). RCB is the billing system for Major Business customers. RCB is capable of billing both monthly and quarterly cycles" (PACMAN)
CASE A
“ Data comes in, bill is generated automatically and it goes out of the door. That’s it” (RW)
“In terms of unbilled account…let me check the stats here…well, we get between 1,000 and 1,200 of those every month; and we have about 10,000 customers” (RW)
“Unbilled accounts must be manually checked, you press a couple of buttons, and bill is out” (RW)
“Consumption gets fed into the billing system, that’s the bit of data that’s important, how much energy have I used, and the system calculates how much money you now owe me, that would produce an invoice, and it gets sent out…that’s a machine that does that…it goes straight to the customer” (MW)
“When you produce the bill there are various validations that take place within the system..some of these validations may throw out an error to be investigated…if there are no validation blocks, it goes straight through..its a straight through process that is fully automated” (JT)
“So obviously with our automatic process this system will bill it and it goes out of the door, and it will be doing that all the time” (PB)
"For queries that come via the mail (typically from low-profile customers) we have templates to help us write back to the customer…letters are generated automatically from the system” (PB)
CASE B
“In theory we could in a perfect account, it bills automatically, we renew it, it bills automatically, we renew it again, it bills automatically. Ideally that is what we would want.” (PB)
“All bills produced automatically: if it is set-up properly in the first place the automatic process can go on and on, no manual intervention is required” (PB)
"Overall very little manual work is required. For most accounts it’s straight through; nobody touches the bill” (CF)
“For some larger customer M-bills are produced…that’s the only thing I can think of” (CF)
“All bills are produced automatically” (CF)
"In general, about 15% of all accounts have a billing error every month" (CF)
“When we resolve the error, that’s the manual bit, someone goes into the system and changes something on the screen, and that would be a manual input” (MW)
"For queries that come via the mail (typically from low-profile customers) we have templates to help us write back to the customer…letters are generated automatically from the system” (PB)
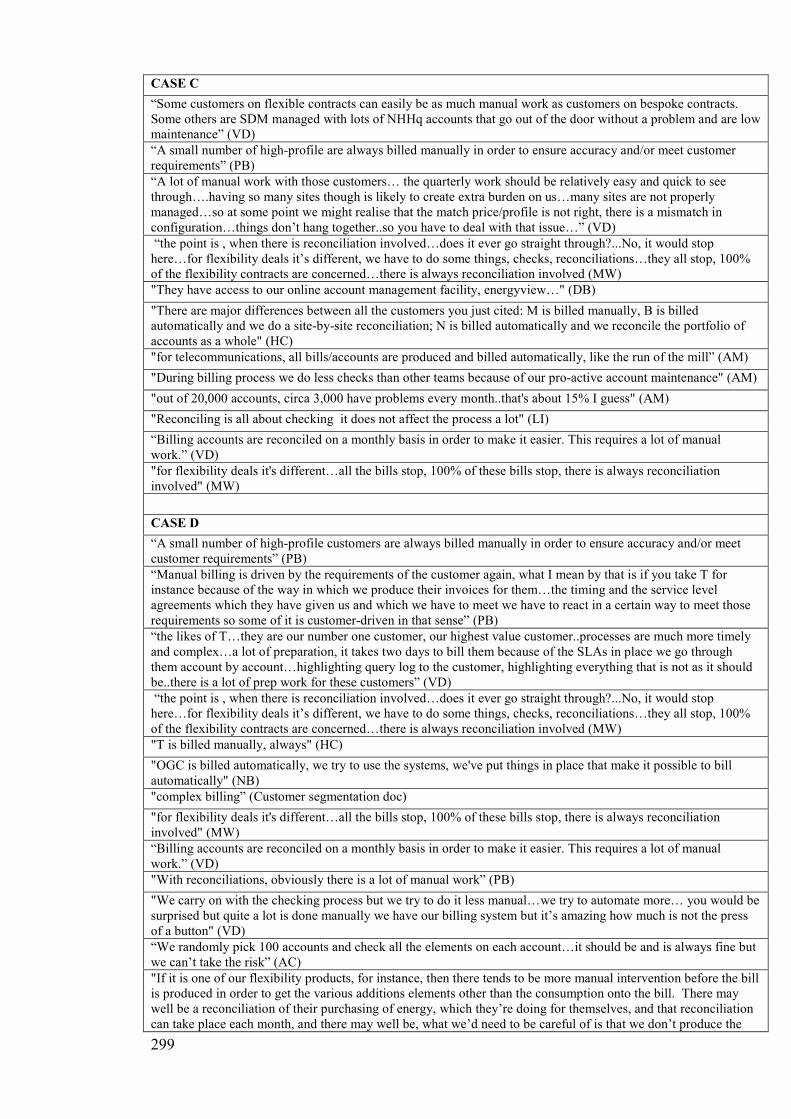
299
CASE C
“Some customers on flexible contracts can easily be as much manual work as customers on bespoke contracts. Some others are SDM managed with lots of NHHq accounts that go out of the door without a problem and are low maintenance” (VD)
“A small number of high-profile are always billed manually in order to ensure accuracy and/or meet customer requirements” (PB)
“A lot of manual work with those customers… the quarterly work should be relatively easy and quick to see through….having so many sites though is likely to create extra burden on us…many sites are not properly managed…so at some point we might realise that the match price/profile is not right, there is a mismatch in configuration…things don’t hang together..so you have to deal with that issue…” (VD)
“the point is , when there is reconciliation involved…does it ever go straight through?...No, it would stop here…for flexibility deals it’s different, we have to do some things, checks, reconciliations…they all stop, 100% of the flexibility contracts are concerned…there is always reconciliation involved (MW)
"They have access to our online account management facility, energyview…" (DB)
"There are major differences between all the customers you just cited: M is billed manually, B is billed automatically and we do a site-by-site reconciliation; N is billed automatically and we reconcile the portfolio of accounts as a whole" (HC)
"for telecommunications, all bills/accounts are produced and billed automatically, like the run of the mill” (AM)
"During billing process we do less checks than other teams because of our pro-active account maintenance" (AM)
"out of 20,000 accounts, circa 3,000 have problems every month..that's about 15% I guess" (AM)
"Reconciling is all about checking it does not affect the process a lot" (LI)
“Billing accounts are reconciled on a monthly basis in order to make it easier. This requires a lot of manual work.” (VD)
"for flexibility deals it's different…all the bills stop, 100% of these bills stop, there is always reconciliation involved" (MW)
CASE D
“A small number of high-profile customers are always billed manually in order to ensure accuracy and/or meet customer requirements” (PB)
“Manual billing is driven by the requirements of the customer again, what I mean by that is if you take T for instance because of the way in which we produce their invoices for them…the timing and the service level agreements which they have given us and which we have to meet we have to react in a certain way to meet those requirements so some of it is customer-driven in that sense” (PB)
“the likes of T…they are our number one customer, our highest value customer..processes are much more timely and complex…a lot of preparation, it takes two days to bill them because of the SLAs in place we go through them account by account…highlighting query log to the customer, highlighting everything that is not as it should be..there is a lot of prep work for these customers” (VD)
“the point is , when there is reconciliation involved…does it ever go straight through?...No, it would stop here…for flexibility deals it’s different, we have to do some things, checks, reconciliations…they all stop, 100% of the flexibility contracts are concerned…there is always reconciliation involved (MW)
"T is billed manually, always" (HC)
"OGC is billed automatically, we try to use the systems, we've put things in place that make it possible to bill automatically" (NB)
"complex billing” (Customer segmentation doc)
"for flexibility deals it's different…all the bills stop, 100% of these bills stop, there is always reconciliation involved" (MW)
“Billing accounts are reconciled on a monthly basis in order to make it easier. This requires a lot of manual work.” (VD)
"With reconciliations, obviously there is a lot of manual work” (PB)
"We carry on with the checking process but we try to do it less manual…we try to automate more… you would be surprised but quite a lot is done manually we have our billing system but it’s amazing how much is not the press of a button" (VD)
“We randomly pick 100 accounts and check all the elements on each account…it should be and is always fine but we can’t take the risk” (AC)
"If it is one of our flexibility products, for instance, then there tends to be more manual intervention before the bill is produced in order to get the various additions elements other than the consumption onto the bill. There may well be a reconciliation of their purchasing of energy, which they’re doing for themselves, and that reconciliation can take place each month, and there may well be, what we’d need to be careful of is that we don’t produce the
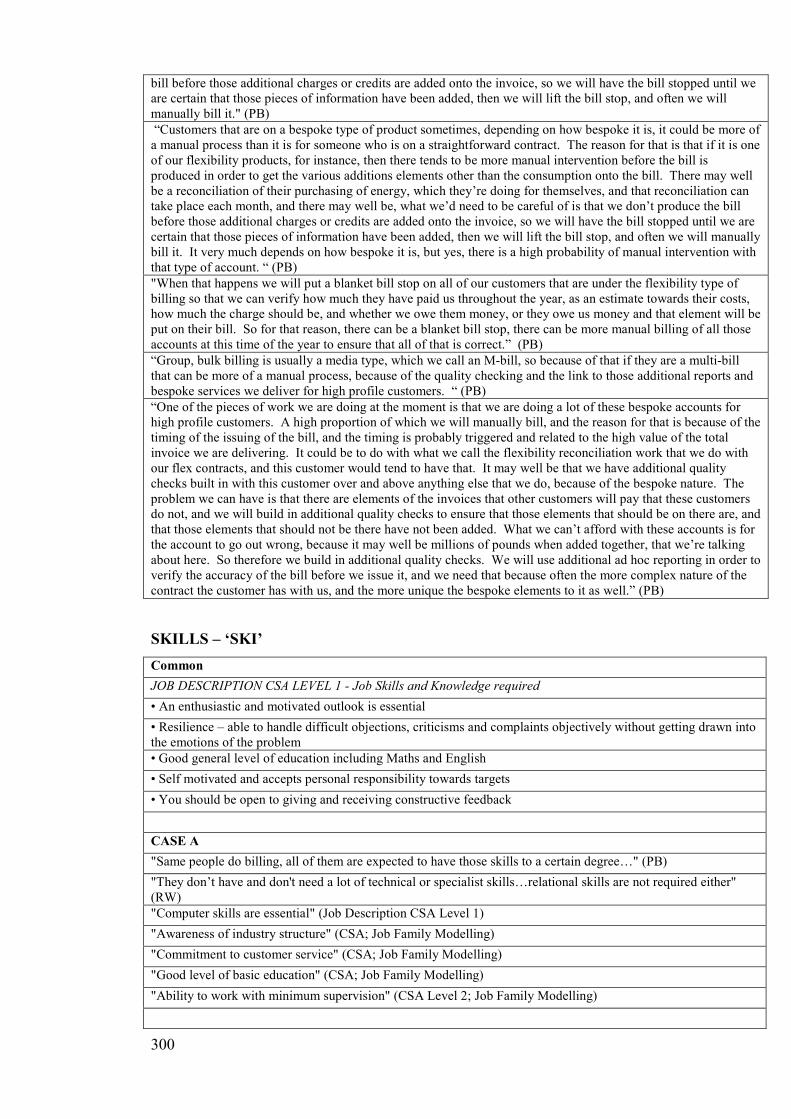
300
bill before those additional charges or credits are added onto the invoice, so we will have the bill stopped until we are certain that those pieces of information have been added, then we will lift the bill stop, and often we will manually bill it." (PB)
“Customers that are on a bespoke type of product sometimes, depending on how bespoke it is, it could be more of a manual process than it is for someone who is on a straightforward contract. The reason for that is that if it is one of our flexibility products, for instance, then there tends to be more manual intervention before the bill is produced in order to get the various additions elements other than the consumption onto the bill. There may well be a reconciliation of their purchasing of energy, which they’re doing for themselves, and that reconciliation can take place each month, and there may well be, what we’d need to be careful of is that we don’t produce the bill before those additional charges or credits are added onto the invoice, so we will have the bill stopped until we are certain that those pieces of information have been added, then we will lift the bill stop, and often we will manually bill it. It very much depends on how bespoke it is, but yes, there is a high probability of manual intervention with that type of account. “ (PB)
"When that happens we will put a blanket bill stop on all of our customers that are under the flexibility type of billing so that we can verify how much they have paid us throughout the year, as an estimate towards their costs, how much the charge should be, and whether we owe them money, or they owe us money and that element will be put on their bill. So for that reason, there can be a blanket bill stop, there can be more manual billing of all those accounts at this time of the year to ensure that all of that is correct.” (PB)
“Group, bulk billing is usually a media type, which we call an M-bill, so because of that if they are a multi-bill that can be more of a manual process, because of the quality checking and the link to those additional reports and bespoke services we deliver for high profile customers. “ (PB)
“One of the pieces of work we are doing at the moment is that we are doing a lot of these bespoke accounts for high profile customers. A high proportion of which we will manually bill, and the reason for that is because of the timing of the issuing of the bill, and the timing is probably triggered and related to the high value of the total invoice we are delivering. It could be to do with what we call the flexibility reconciliation work that we do with our flex contracts, and this customer would tend to have that. It may well be that we have additional quality checks built in with this customer over and above anything else that we do, because of the bespoke nature. The problem we can have is that there are elements of the invoices that other customers will pay that these customers do not, and we will build in additional quality checks to ensure that those elements that should be on there are, and that those elements that should not be there have not been added. What we can’t afford with these accounts is for the account to go out wrong, because it may well be millions of pounds when added together, that we’re talking about here. So therefore we build in additional quality checks. We will use additional ad hoc reporting in order to verify the accuracy of the bill before we issue it, and we need that because often the more complex nature of the contract the customer has with us, and the more unique the bespoke elements to it as well.” (PB)
SKILLS – ‘SKI’
Common
JOB DESCRIPTION CSA LEVEL 1 - Job Skills and Knowledge required
• An enthusiastic and motivated outlook is essential
• Resilience – able to handle difficult objections, criticisms and complaints objectively without getting drawn into the emotions of the problem
• Good general level of education including Maths and English
• Self motivated and accepts personal responsibility towards targets
• You should be open to giving and receiving constructive feedback
CASE A
"Same people do billing, all of them are expected to have those skills to a certain degree…" (PB)
"They don’t have and don't need a lot of technical or specialist skills…relational skills are not required either" (RW)
"Computer skills are essential" (Job Description CSA Level 1)
"Awareness of industry structure" (CSA; Job Family Modelling)
"Commitment to customer service" (CSA; Job Family Modelling)
"Good level of basic education" (CSA; Job Family Modelling)
"Ability to work with minimum supervision" (CSA Level 2; Job Family Modelling)
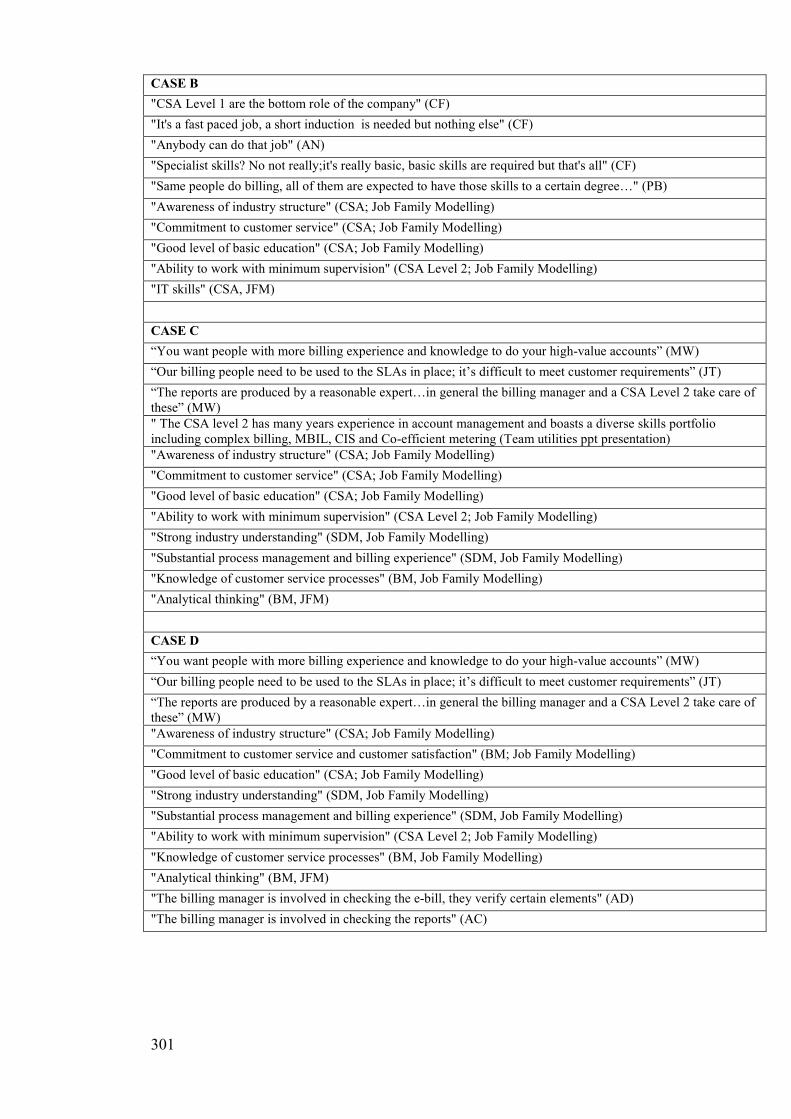
301
CASE B
"CSA Level 1 are the bottom role of the company" (CF)
"It's a fast paced job, a short induction is needed but nothing else" (CF)
"Anybody can do that job" (AN)
"Specialist skills? No not really;it's really basic, basic skills are required but that's all" (CF)
"Same people do billing, all of them are expected to have those skills to a certain degree…" (PB)
"Awareness of industry structure" (CSA; Job Family Modelling)
"Commitment to customer service" (CSA; Job Family Modelling)
"Good level of basic education" (CSA; Job Family Modelling)
"Ability to work with minimum supervision" (CSA Level 2; Job Family Modelling)
"IT skills" (CSA, JFM)
CASE C
“You want people with more billing experience and knowledge to do your high-value accounts” (MW)
“Our billing people need to be used to the SLAs in place; it’s difficult to meet customer requirements” (JT)
“The reports are produced by a reasonable expert…in general the billing manager and a CSA Level 2 take care of these” (MW)
" The CSA level 2 has many years experience in account management and boasts a diverse skills portfolio including complex billing, MBIL, CIS and Co-efficient metering (Team utilities ppt presentation)
"Awareness of industry structure" (CSA; Job Family Modelling)
"Commitment to customer service" (CSA; Job Family Modelling)
"Good level of basic education" (CSA; Job Family Modelling)
"Ability to work with minimum supervision" (CSA Level 2; Job Family Modelling)
"Strong industry understanding" (SDM, Job Family Modelling)
"Substantial process management and billing experience" (SDM, Job Family Modelling)
"Knowledge of customer service processes" (BM, Job Family Modelling)
"Analytical thinking" (BM, JFM)
CASE D
“You want people with more billing experience and knowledge to do your high-value accounts” (MW)
“Our billing people need to be used to the SLAs in place; it’s difficult to meet customer requirements” (JT)
“The reports are produced by a reasonable expert…in general the billing manager and a CSA Level 2 take care of these” (MW)
"Awareness of industry structure" (CSA; Job Family Modelling)
"Commitment to customer service and customer satisfaction" (BM; Job Family Modelling)
"Good level of basic education" (CSA; Job Family Modelling)
"Strong industry understanding" (SDM, Job Family Modelling)
"Substantial process management and billing experience" (SDM, Job Family Modelling)
"Ability to work with minimum supervision" (CSA Level 2; Job Family Modelling)
"Knowledge of customer service processes" (BM, Job Family Modelling)
"Analytical thinking" (BM, JFM)
"The billing manager is involved in checking the e-bill, they verify certain elements" (AD)
"The billing manager is involved in checking the reports" (AC)
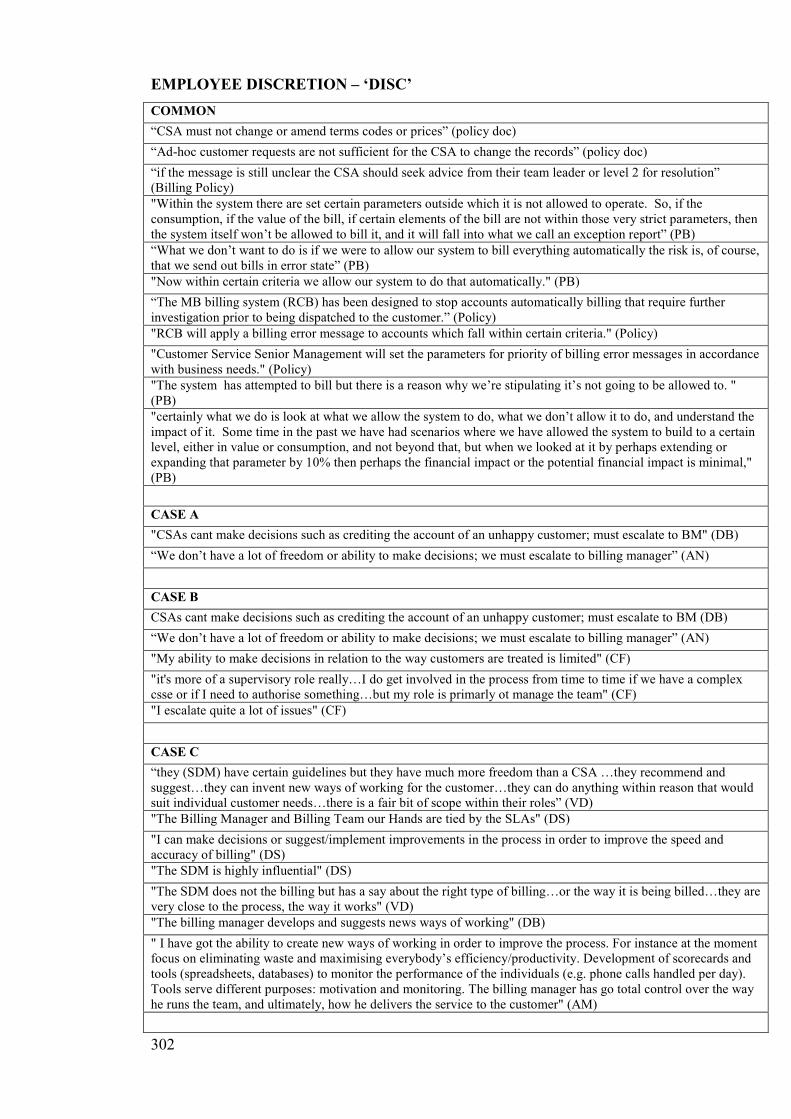
302
EMPLOYEE DISCRETION – ‘DISC’
COMMON
“CSA must not change or amend terms codes or prices” (policy doc)
“Ad-hoc customer requests are not sufficient for the CSA to change the records” (policy doc)
“if the message is still unclear the CSA should seek advice from their team leader or level 2 for resolution” (Billing Policy)
"Within the system there are set certain parameters outside which it is not allowed to operate. So, if the consumption, if the value of the bill, if certain elements of the bill are not within those very strict parameters, then the system itself won’t be allowed to bill it, and it will fall into what we call an exception report” (PB)
“What we don’t want to do is if we were to allow our system to bill everything automatically the risk is, of course, that we send out bills in error state” (PB)
"Now within certain criteria we allow our system to do that automatically." (PB)
“The MB billing system (RCB) has been designed to stop accounts automatically billing that require further investigation prior to being dispatched to the customer.” (Policy)
"RCB will apply a billing error message to accounts which fall within certain criteria." (Policy)
"Customer Service Senior Management will set the parameters for priority of billing error messages in accordance with business needs." (Policy)
"The system has attempted to bill but there is a reason why we’re stipulating it’s not going to be allowed to. " (PB)
"certainly what we do is look at what we allow the system to do, what we don’t allow it to do, and understand the impact of it. Some time in the past we have had scenarios where we have allowed the system to build to a certain level, either in value or consumption, and not beyond that, but when we looked at it by perhaps extending or expanding that parameter by 10% then perhaps the financial impact or the potential financial impact is minimal," (PB)
CASE A
"CSAs cant make decisions such as crediting the account of an unhappy customer; must escalate to BM" (DB)
“We don’t have a lot of freedom or ability to make decisions; we must escalate to billing manager” (AN)
CASE B
CSAs cant make decisions such as crediting the account of an unhappy customer; must escalate to BM (DB)
“We don’t have a lot of freedom or ability to make decisions; we must escalate to billing manager” (AN)
"My ability to make decisions in relation to the way customers are treated is limited" (CF)
"it's more of a supervisory role really…I do get involved in the process from time to time if we have a complex csse or if I need to authorise something…but my role is primarly ot manage the team" (CF)
"I escalate quite a lot of issues" (CF)
CASE C
“they (SDM) have certain guidelines but they have much more freedom than a CSA …they recommend and suggest…they can invent new ways of working for the customer…they can do anything within reason that would suit individual customer needs…there is a fair bit of scope within their roles” (VD)
"The Billing Manager and Billing Team our Hands are tied by the SLAs" (DS)
"I can make decisions or suggest/implement improvements in the process in order to improve the speed and accuracy of billing" (DS)
"The SDM is highly influential" (DS)
"The SDM does not the billing but has a say about the right type of billing…or the way it is being billed…they are very close to the process, the way it works" (VD)
"The billing manager develops and suggests news ways of working" (DB)
" I have got the ability to create new ways of working in order to improve the process. For instance at the moment focus on eliminating waste and maximising everybody’s efficiency/productivity. Development of scorecards and tools (spreadsheets, databases) to monitor the performance of the individuals (e.g. phone calls handled per day). Tools serve different purposes: motivation and monitoring. The billing manager has go total control over the way he runs the team, and ultimately, how he delivers the service to the customer" (AM)
303
CASE D
“the Service Development Managers have certain guidelines but they have much more freedom than a CSA …they recommend and suggest…they can invent new ways of working for the customer…they can do anything within reason that would suit individual customer needs…there is a fair bit of scope within their roles” (VD)
"The Billing Manager and Billing Team our hands are tied by the Service Level Agreements" (DS)
"I can put forward changes that will improve the working capital" (DS)
"For example, 2 years ago, with S we had problems with first-bill check which was taking too much time and resources; I decided to automate it; testing was successful; now most first-bill checks have been automated" (DS)
"regarding the management of customer complaints; I have the freedom to credit an account up to 5,000GBP without referring to anybody" (DS)
"The SDM is highly influential" (DS)
"The SDM does not the billing but has a say about the right type of billing…or the way it is being billed…they are very close to the process, the way it works" (VD)
LOCATION – ‘LOC’
COMMON
"MB customer services deals with billing and credit control for new and existing customers. The teams are based in Exeter" (Dept Overview)
"Account Services teams are based in Exeter" (Dept Overview)
"Customer service centre: Exeter - Major Customers, Regional Head office" (Press Briefing)
CASE A
This team is based in Exeter (Direct Observations)
CASE B
"These teams are based at our London and Exeter Offices as well as home based" (Dept Overview)
Sales (Sell service process) and Customer Services (Deliver service) are all based in the same service facility in Exeter (Direct Observations)
CASE C
Customer services teams are based in Exeter (direct observation)
SDM (part of customer services team) need to be near enough customer base because of frequent meetings in London and across UK
CASE D
Customer services teams are based in Exeter (direct observation)
SDM (part of customer services team) need to be near enough customer base because of frequent meetings in London and across UK
EFFICIENCY – ‘COST’
COMMON
"We operate on very strict margins which are based on cost to serve, the more manual intervention the more the cost to serve is, the more of the margin that is being used, and the lower the profit is that we effectively make" (PB)
Evaluating costs by counting the number of employees as a proxy: "C’est a peu pres la methode que j’utilise et c’est probablement ce qu’il y a de mieux en l’absence de plus precis. Neanmoins, si la part de temps passe par les equipes sur le « Autres » est important et non mesure, les erreurs d’evaluation peuvent etre importantes. La facon de reduire le risque d’erreur est alors d’essayer d’identifier et de quantifier en meme temps toutes les taches effectuees de manière a verifier que la somme n’excede pas completement les ressources effectives. " (AW)
"Cost to Serve: These are the costs that are incurred as an electricity supplier. These include the costs of maintaining IT systems, paying staff to manage customer accounts." (PACMAN doc)
304
"However, other factors affect CTS: more specifically Working Capital and Bad Debt"(ET)
"cost to serve is calculated based on 3 criteria: teams, profile type of MPAN, number of sites" (PACMAN)
"the number of sites is important. The rationale behind this is that larger portfolios require more account management" (AW)
"we don’t know Cost To Serve…that's the project for next year" (MW)
"if you can help us work that out that would be very valuable" (MW)
"we have some numbers but do they mean anything…I know how much it costs to run that team; but I don’t know precisely what the antecedents are; it's because we don’t evaluate costs from a product perspective…we have not been able to trace this until now" (JT)
"Major Business Headcount June 2008: Customer Services: 392" (Human Resources Headcount doc)
"so if it’s 15 customers you are looking at 16 people across the department that would be involved in manual billing" (PB)
CASE A
"Staff: 9 L1; 2 L2 so 11 people in total" (RW)
Line Manager's Name: Mr RW: FTE = 10.61 (HR Headcount doc)
“you need a structure in place to deal with high volumes” (VD)
“For those customers the focus is on operational excellence so that ensures we keep the costs low” (MW)
"it's similar to McDonalds; operational excellence, low costs and efficient, no SDM, no service" (MW)
"There is no manual intervention involved in billing these customers" (RW)
"if there are no validation blocks, it goes straight through, it's a straight through process, fully automated" (JT0
"High volume, low value customer segments" (JM)
"these customers are less profitable so there are less resources dedicated to them" (CL)
CASE B
"6000 customers; 14500 accounts" (CF)
"16 staff: 2 L2s, 14 L1s" (CF)
“For those customers operational excellence so that ensures we keep the costs low” (CF)
"it's similar to McDonalds; operational excellence, low costs and efficient, no SDM, no service" (MW)
"High volume, low value customer segments" (JM)
“there is a lot of volume” (PB)
CASE C
"You’ll find out that our processes are not very straight through…there is a lot of manual intervention and we need to iron that out….we need to make the process for reconciliations smoother in order to eradicate some of the costs” (MW)
“we need to be flexible to meet customer requirements versus the cost benefits to be simplistic” (JT)
“You need 30% more resources to deal with less than 10% of the volume in terms of the number of customers” (MW)
“KA and SA – customer intimate - high costs” (MW)
"The cost to serve is higher for high-profile customers as the quarterly work is relatively easy but they have so many sites that it creates problems in billing; flexibility deals require reconciliations, checking, re-checking, producing reports etc" (ET)
“these value added products cost us money” (ST)
"for flexibility deals it's different…all the bills stop, 100% of these bills stop, there is always reconciliation involved" (MW)
"for these customers who are on a flexible contract…the reconciliation is on an annual basis which is very resource hungry." (VD)
UTILITIES: 10 big customers (Key Account customers); 10 staff (1 BM, 1L2, 8L1) (DB)
UTILITIES (I/C Resource allocation file: 585HH; 1,000NHHm; 10,400NHHq)
Telco: Mostly NHHq, loads of accounts 20,000 NHHq, few customers (10); 600 monthly accounts
305
Telco: 7 L1s; 1 L2; 1 L3; 1SDM
CASE D
“for bespoke contracts, a lot more costs are involved in the billing process” (MW)
“you need 30% more resources to deal with less than 10% of the volume in terms of the number of customers” (MW)
“KA and SA – customer intimate à high costs” MW
"The cost to serve is higher for high-profile customers as the quarterly work is relatively easy but they have so many sites that it creates problems in billing; flexibility deals require reconciliations, checking, re-checking, producing reports etc" (AW)
“these value added products cost us money” (ST)
"for these customers who are on a flexible contract…the reconciliation is on an annual basis which is very resource hungry." (VD)
"the customer requires it, so obviously the job is then to meet the customer’s requirements" (PB)
RESPONSIVENESS – ‘RESP’
COMMON
"then as soon as data becomes available a system on that day, overnight will try to bill it" (PB)
"So obviously with our automatic process this system will bill it and it goes out of the door, and it will be doing that all the time. " (PB)
"Potentiall we could send our a hundred invoices a day to a customer over the first two weeks of the month and they end up with a hundred envelopes, and so on. What we have is what we call our multibill system, which is group or bulk billing system. And what that enables us to do is to bill each site in the system either automatically or manually, but importantly, the bill itself doesn’t go anywhere near the customer until a certain day of the month, and on that day what our stystem does is it puts together all of the individual invoices and bills to form one bulk bill. " (PB)
"I’m sure, as you’ve seen, that the aim is to get the bill out as early as possible in the month, simply because until we deliver it, the customer is not going to pay. If they don’t pay, we don’t’ have income, and so it goes on. " (PB)
CASE A
"Data comes in; bill is generated automatically and goes out of the door" (RW)
"40/50 billing errors per day which must be manually checked, press a couple of buttons, and bill is out" (RW)
"Small customers are billed overnight" (VD)
CASE B
"customers want to be billed on time” (CF)
"All bills are produced automatically as soon as consumption data is received by the system" (CF)
"on day 5 the system estimates the accounts that have not received consumption data; on day 6 look at the billing figures" (CF)
"For some larger customer: M-bills are produced, which takes longer as we need to wait for all the data to come in, and then carry out a number of checks" (CF)
Case C
"There are more checks which take time" (AM)
"All accounts are bill stopped: consumption data from DC/DA comes into the billing system but the bill is not produced" (DB)
"It takes about 4 days to bill morrisons because they are billed manually" (HC)
"Every day we run an “unbilled accounts” report, go into the billing system and try to bill them manually" (AM)
"there tends to be more manual intervention before the bill is produced in order to get the various additions elements other than the consumption onto the bill. There may well be a reconciliation of their purchasing of energy, which they’re doing for themselves, and that reconciliation can take place each month, and there may well
306
be, what we’d need to be careful of is that we don’t produce the bill before those additional charges or credits are added onto the invoice, so we will have the bill stopped until we are certain that those pieces of information have been added, then we will lift the bill stop, and often we will manually bill it." (PB)
"A high proportion of which we will manually bill, and the reason for that is because of the timing of the issuing of the bill, and the timing is probably triggered and related to the high value of the total invoice we are delivering. It could be to do with what we call the flexibility reconciliation work that we do with our flex contracts, and this customer would tend to have that." (PB)
"To protect us, we will have bills stopped in place to ensure that nothing that goes out is incorrect." (PB)
"so manually we would always be 24h longer than the automatic process…but also there are very clear reasons why we would not allow it to…although we may send it out a day late, because it goes out a day late correct, there is no hold up in the payment and there is no dispute" (PB)
"those customers are more complex and demanding…it’s difficult to meet their requirements" (VD)
CASE D
"Although consumption data has come in, all the accounts are bill stopped; some bills must be manually processed" (PB)
"It takes 10 working days to produce and send out the bills and associated reports once the data has arrived" (HC)
"there tends to be more manual intervention before the bill is produced in order to get the various additions elements other than the consumption onto the bill. There may well be a reconciliation of their purchasing of energy, which they’re doing for themselves, and that reconciliation can take place each month, and there may well be, what we’d need to be careful of is that we don’t produce the bill before those additional charges or credits are added onto the invoice, so we will have the bill stopped until we are certain that those pieces of information have been added, then we will lift the bill stop, and often we will manually bill it." (PB)
"It very much depends on how bespoke it is, but yes, there is a high probability of manual intervention with that type of account. The likelihood is it is a high profile name, and high value account, and therefore the need for accuracy is greater, and the risk of it not being accurate is also greater. " (PB)
"the customer requires it, so obviously the job is then to meet the customer’s requirements" (PB)
"What we can’t afford with these accounts is for the account to go out wrong, because it may well be millions of pounds when added together, that we’re talking about here. So therefore we build in additional quality checks. We will use additional ad hoc reporting in order to verify the accuracy of the bill before we issue it, and we need that because often the more complex nature of the contract the customer has with us, and the more unique the bespoke elements to it as well." (PB)
" It may well be that we have additional quality checks built in with this customer over and above anything else that we do, because of the bespoke nature. The problem we can have is that there are elements of the invoices that other customers will pay that these customers do not, and we will build in additional quality checks to ensure that those elements that should be on there are, and that those elements that should not be there have not been added. " (PB)
"Certainly, we are looking to ensure that the bill is accurate, so we have to physically look at it. " (PB)
"so manually we would always be 24h longer than the automatic process…but also there are very clear reasons why we would not allow it to…although we may send it out a day late, because it goes out a day late correct, there is no hold up in the payment and there is no dispute" (PB)
"the likes of T…they are our number one customer, our highest value customer..processes are much more timely and complex…a lot of preparation, it takes two days to bill them …because of the SLAs in place we go through them account by account…highlighting query log to the customer, highlighting everything that is not as it should be" (VD)
"we must do exactly what the customer wants" (VD)
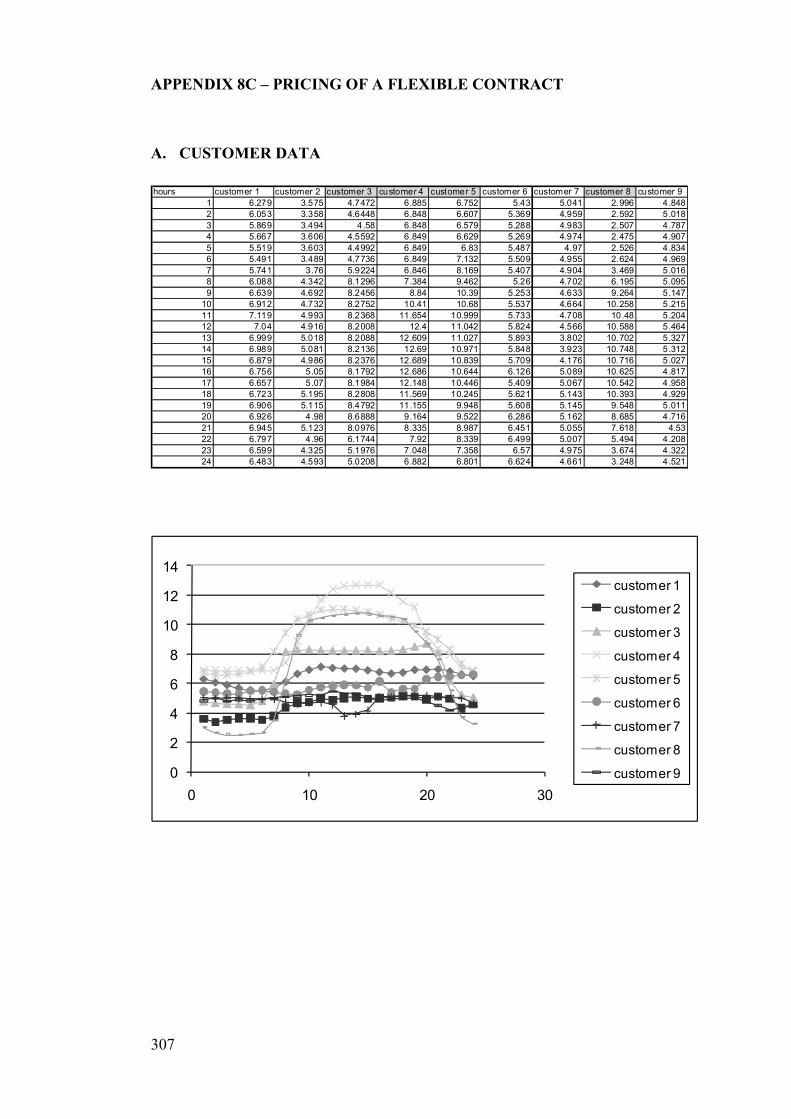
307
APPENDIX 8C – PRICING OF A FLEXIBLE CONTRACT
A. CUSTOMER DATA
hours customer 1 customer 2 customer 3 customer 4 customer 5 customer 6 customer 7 customer 8 customer 9
1 6.279 3.575 4.7472 6.885 6.752 5.43 5.041 2.996 4.848
2 6.053 3.358 4.6448 6.848 6.607 5.369 4.959 2.592 5.018
3 5.869 3.494 4.58 6.848 6.579 5.288 4.983 2.507 4.787
4 5.667 3.606 4.5592 6.849 6.629 5.269 4.974 2.475 4.907
5 5.519 3.603 4.4992 6.849 6.83 5.487 4.97 2.526 4.834
6 5.491 3.489 4.7736 6.849 7.132 5.509 4.955 2.624 4.969
7 5.741 3.76 5.9224 6.846 8.169 5.407 4.904 3.469 5.016
8 6.088 4.342 8.1296 7.384 9.462 5.26 4.702 6.195 5.095
9 6.639 4.692 8.2456 8.84 10.39 5.253 4.633 9.264 5.147
10 6.912 4.732 8.2752 10.41 10.68 5.537 4.664 10.258 5.215
11 7.119 4.993 8.2368 11.654 10.999 5.733 4.708 10.48 5.204
12 7.04 4.916 8.2008 12.4 11.042 5.824 4.566 10.588 5.464
13 6.999 5.018 8.2088 12.609 11.027 5.893 3.802 10.702 5.327
14 6.989 5.081 8.2136 12.69 10.971 5.848 3.923 10.748 5.312
15 6.879 4.986 8.2376 12.689 10.839 5.709 4.176 10.716 5.027
16 6.756 5.05 8.1792 12.686 10.644 6.126 5.089 10.625 4.817
17 6.657 5.07 8.1984 12.148 10.446 5.409 5.067 10.542 4.958
18 6.723 5.195 8.2808 11.569 10.245 5.621 5.143 10.393 4.929
19 6.906 5.115 8.4792 11.155 9.948 5.608 5.145 9.548 5.011
20 6.926 4.98 8.6888 9.164 9.522 6.286 5.162 8.685 4.716
21 6.945 5.123 8.0976 8.335 8.987 6.451 5.055 7.618 4.53
22 6.797 4.96 6.1744 7.92 8.339 6.499 5.007 5.494 4.208
23 6.599 4.325 5.1976 7.048 7.358 6.57 4.975 3.674 4.322
24 6.483 4.593 5.0208 6.882 6.801 6.624 4.661 3.248 4.521
0
2
4
6
8
10
12
14
0 10 20 30
customer 1
customer 2
customer 3
customer 4
customer 5
customer 6
customer 7
customer 8
customer 9
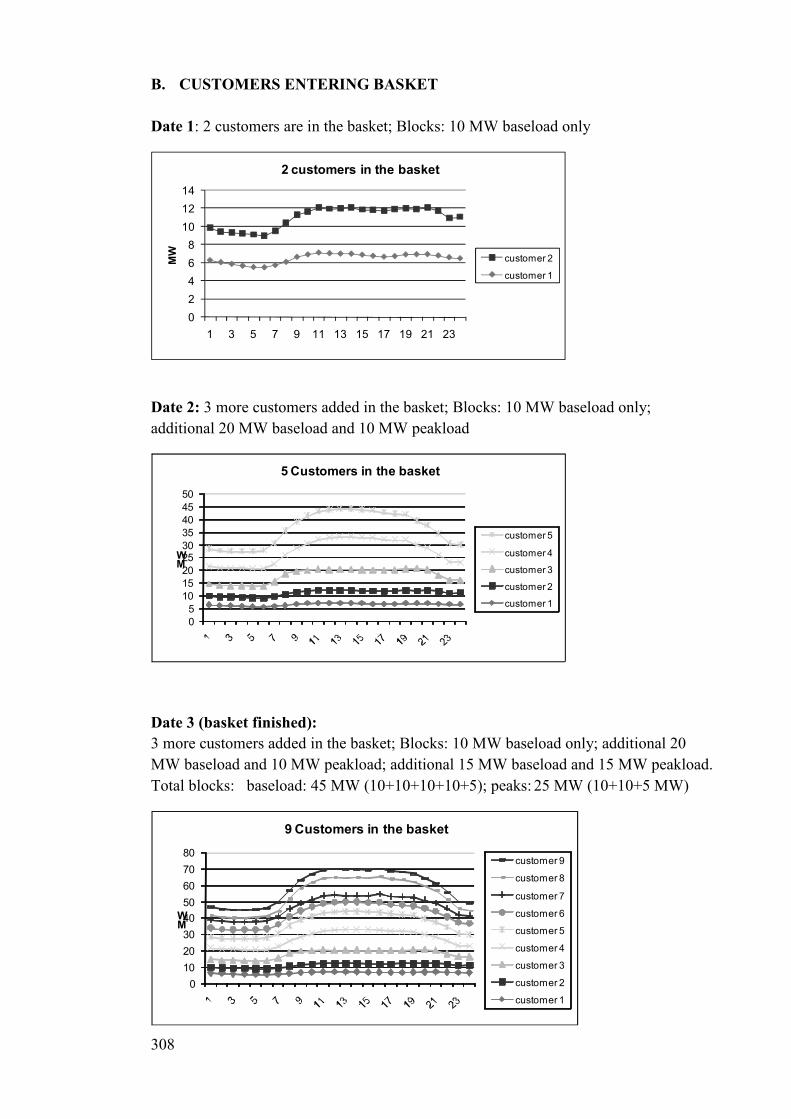
308
B. CUSTOMERS ENTERING BASKET
Date 1: 2 customers are in the basket; Blocks: 10 MW baseload only
0
2
4
6
8
10
12
14
1 3 5 7 9 11 13 15 17 19 21 23
MW
2 customers in the basket
customer 2
customer 1
Date 2: 3 more customers added in the basket; Blocks: 10 MW baseload only;
additional 20 MW baseload and 10 MW peakload
0
5
10
15
20
2530
35
40
45
50
MW
5 Customers in the basket
customer 5
customer 4
customer 3
customer 2
customer 1
Date 3 (basket finished):
3 more customers added in the basket; Blocks: 10 MW baseload only; additional 20
MW baseload and 10 MW peakload; additional 15 MW baseload and 15 MW peakload.
Total blocks: baseload: 45 MW (10+10+10+10+5); peaks: 25 MW (10+10+5 MW)
0
10
20
30
40
50
60
70
80
MW
9 Customers in the basket
customer 9
customer 8
customer 7
customer 6
customer 5
customer 4
customer 3
customer 2
customer 1

309
C. FINISHED BASKET
hours
Overall
basket
shape (MW)
Baseload
blocks
(MW)
Peak
blocks
(MW)
Residual
shape (MW)
baseload
blocks
overall
price
(resulting
from
various
purchases)
(£/MWh)
peakload
blocks
overall
price
(resulting
from
various
purchases)
(£/MWh)
Residual
Price
(£/MWh)
Basket
forwards
price
(£/MWh)
1 46.5532 45 0 1.5532 58.00£ -£ 33.60£ 57.19£
2 45.4488 45 0 0.4488 58.00£ -£ 34.20£ 57.76£
3 44.935 45 0 -0.065 58.00£ -£ 34.08£ 58.03£
4 44.9352 45 0 -0.0648 58.00£ -£ 33.48£ 58.04£
5 45.1172 45 0 0.1172 58.00£ -£ 33.60£ 57.94£
6 45.7916 45 0 0.7916 58.00£ -£ 36.00£ 57.62£
7 49.2344 45 25 -20.7656 58.00£ 73.00£ 44.55£ 71.29£
8 56.6576 45 25 -13.3424 58.00£ 73.00£ 64.80£ 63.02£
9 63.1036 45 25 -6.8964 58.00£ 73.00£ 81.70£ 61.35£
10 66.6832 45 25 -3.3168 58.00£ 73.00£ 86.00£ 62.23£
11 69.1268 45 25 -0.8732 58.00£ 73.00£ 81.60£ 63.13£
12 70.0408 45 25 0.0408 58.00£ 73.00£ 76.00£ 63.36£
13 69.5858 45 25 -0.4142 58.00£ 73.00£ 72.40£ 63.30£
14 69.7756 45 25 -0.2244 58.00£ 73.00£ 73.00£ 63.33£
15 69.2586 45 25 -0.7414 58.00£ 73.00£ 72.00£ 63.26£
16 69.9722 45 25 -0.0278 58.00£ 73.00£ 74.90£ 63.35£
17 68.4954 45 25 -1.5046 58.00£ 73.00£ 85.40£ 62.87£
18 68.0988 45 25 -1.9012 58.00£ 73.00£ 88.60£ 62.65£
19 66.9152 45 0 21.9152 58.00£ -£ 84.00£ 66.52£
20 64.1298 45 0 19.1298 58.00£ -£ 78.84£ 64.22£
21 61.1416 45 0 16.1416 58.00£ -£ 54.00£ 56.94£
22 55.3984 45 0 10.3984 58.00£ -£ 42.00£ 55.00£
23 50.0686 45 0 5.0686 58.00£ -£ 37.20£ 55.89£
24 48.8338 45 0 3.8338 58.00£ -£ 38.40£ 56.46£
Overall basket costs over one day: 62,640.00£ 21,900.00£ 1,983.51£ 86,523.51£
The basket overall cost is split on each customer. This is achieved by pricing each
customer against the basket forwards price curve.
customer 1 customer 2 customer 3 customer 4 customer 5 customer 6 customer 7 customer 8 customer 9 basket
cost on one day 9,537.12£ 6,615.58£ 10,210.88£ 13,760.63£ 13,305.95£ 8,410.97£ 7,027.63£ 10,425.25£ 7,229.50£ 86,523.51£
price 61.11£ 61.22£ 61.59£ 61.55£ 61.49£ 60.94£ 60.97£ 62.07£ 61.17£ 61.39£
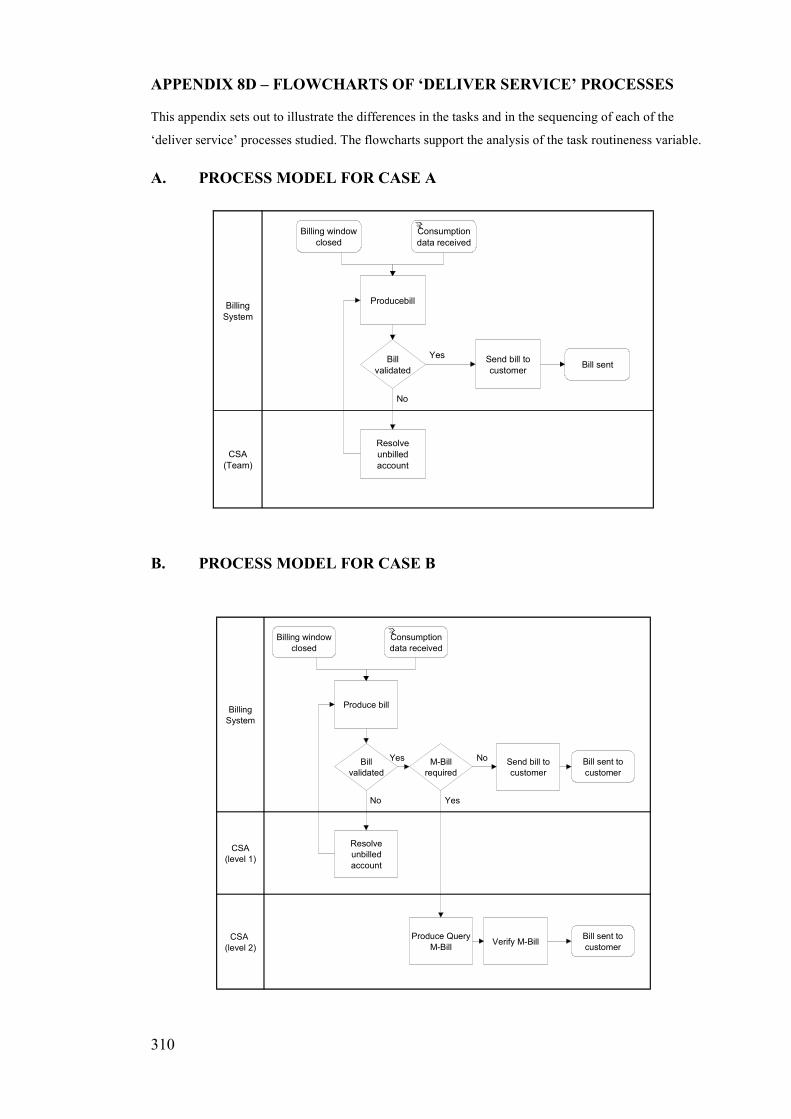
310
APPENDIX 8D – FLOWCHARTS OF ‘DELIVER SERVICE’ PROCESSES
This appendix sets out to illustrate the differences in the tasks and in the sequencing of each of the
‘deliver service’ processes studied. The flowcharts support the analysis of the task routineness variable.
A. PROCESS MODEL FOR CASE A
Billing
System
CSA
(Team)
Consumption
data received
Billing window
closed
Producebill
Bill
validated
Send bill to
customerBill sent
Resolve
unbilled
account
Yes
No
B. PROCESS MODEL FOR CASE B
Billing
System
CSA
(level 1)
CSA
(level 2)
Consumption
data received
Billing window
closed
Produce bill
Bill
validated
Send bill to
customer
Bill sent to
customer
Resolve
unbilled
account
Yes
No
M-Bill
required
No
Produce Query
M-Bill
Yes
Verify M-BillBill sent to
customer
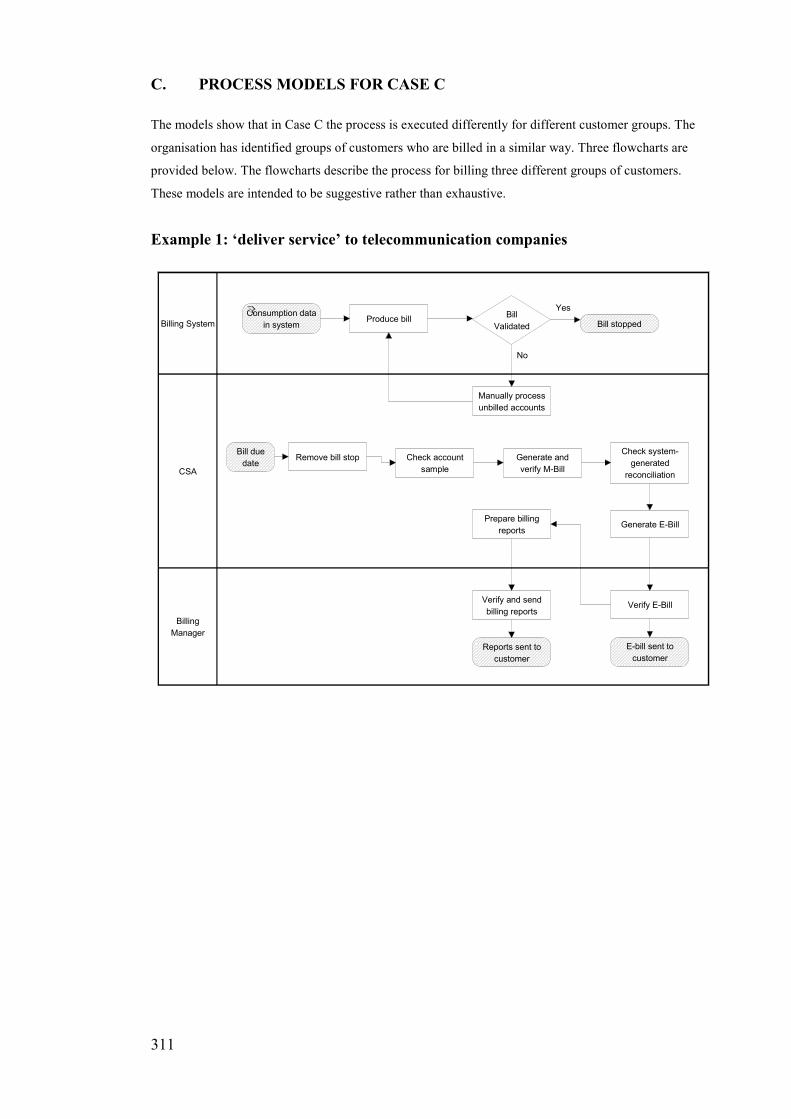
311
C. PROCESS MODELS FOR CASE C
The models show that in Case C the process is executed differently for different customer groups. The
organisation has identified groups of customers who are billed in a similar way. Three flowcharts are
provided below. The flowcharts describe the process for billing three different groups of customers.
These models are intended to be suggestive rather than exhaustive.
Example 1: ‘deliver service’ to telecommunication companies
Billing System
CSA
Billing
Manager
Consumption data
in system
Manually process
unbilled accounts
Produce billBill stopped
Check account
sample
Generate and
verify M-Bill
Generate E-Bill
Verify E-Bill
Prepare billing
reports
Verify and send
billing reports
E-bill sent to
customer
Reports sent to
customer
Check system-
generated
reconciliation
Bill
Validated
No
Yes
Bill due
dateRemove bill stop
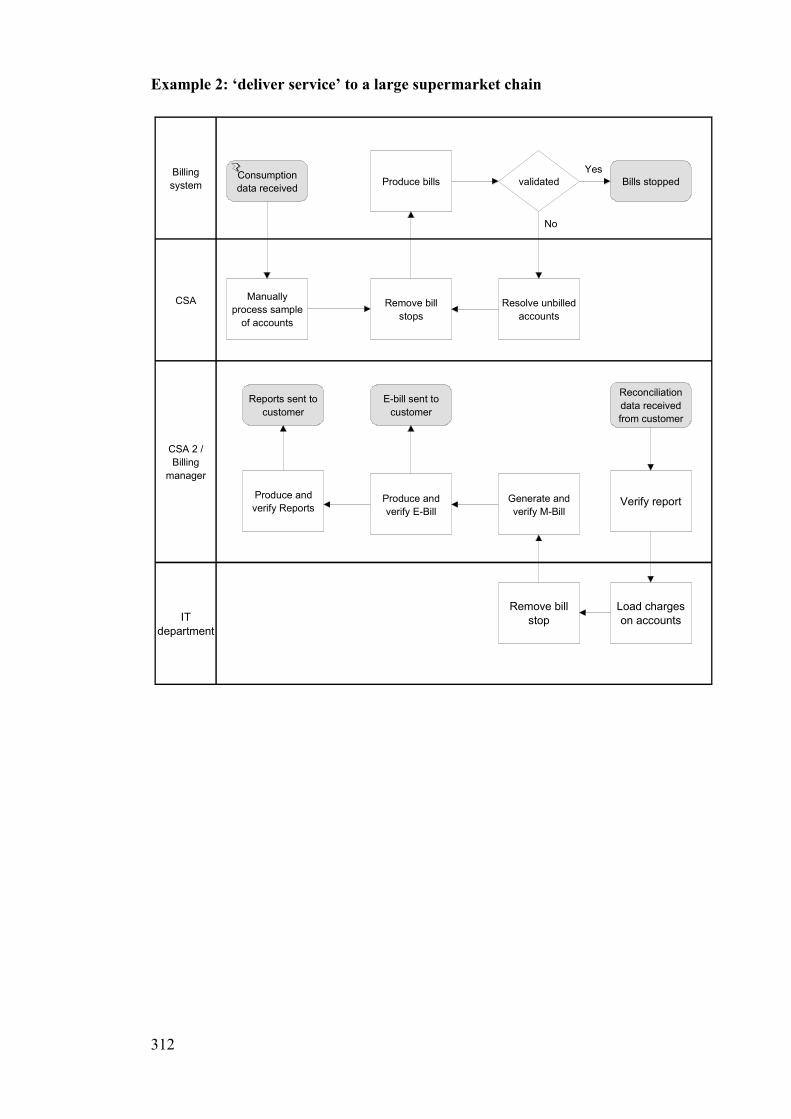
312
Example 2: ‘deliver service’ to a large supermarket chain
Billing
system
CSA
CSA 2 /
Billing
manager
IT
department
Consumption
data received
Manually
process sample
of accounts
Generate and
verify M-Bill
Produce and
verify E-Bill
Produce and
verify Reports
Remove bill
stops
Produce bills validated Bills stopped
Yes
Resolve unbilled
accounts
No
Reconciliation
data received
from customer
Verify report
Load charges
on accounts
Remove bill
stop
E-bill sent to
customer
Reports sent to
customer
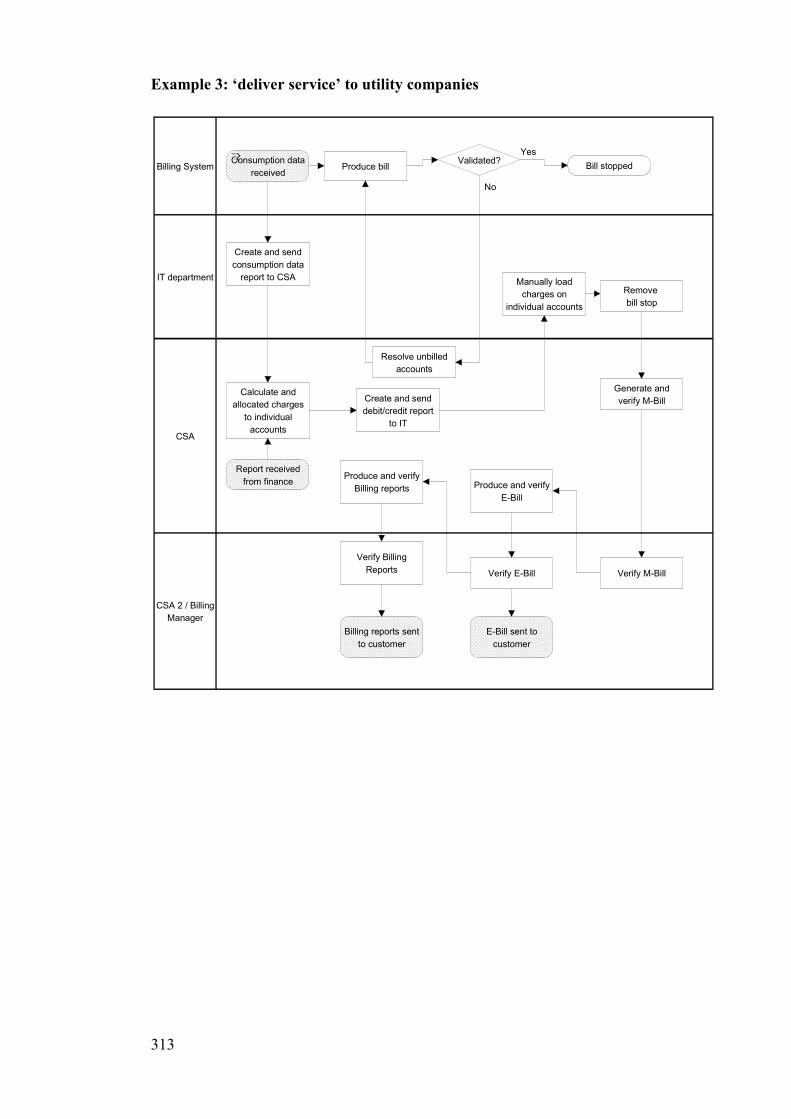
313
Example 3: ‘deliver service’ to utility companies
Billing System
IT department
CSA
CSA 2 / Billing
Manager
Consumption data
received
Resolve unbilled
accounts
Produce billValidated?
No
Bill stopped
Yes
Create and send
consumption data
report to CSA
Report received
from finance
Calculate and
allocated charges
to individual
accounts
Create and send
debit/credit report
to IT
Manually load
charges on
individual accounts
Generate and
verify M-Bill
Remove
bill stop
Verify M-BillVerify E-Bill
Verify Billing
Reports
E-Bill sent to
customer
Produce and verify
E-Bill
Produce and verify
Billing reports
Billing reports sent
to customer
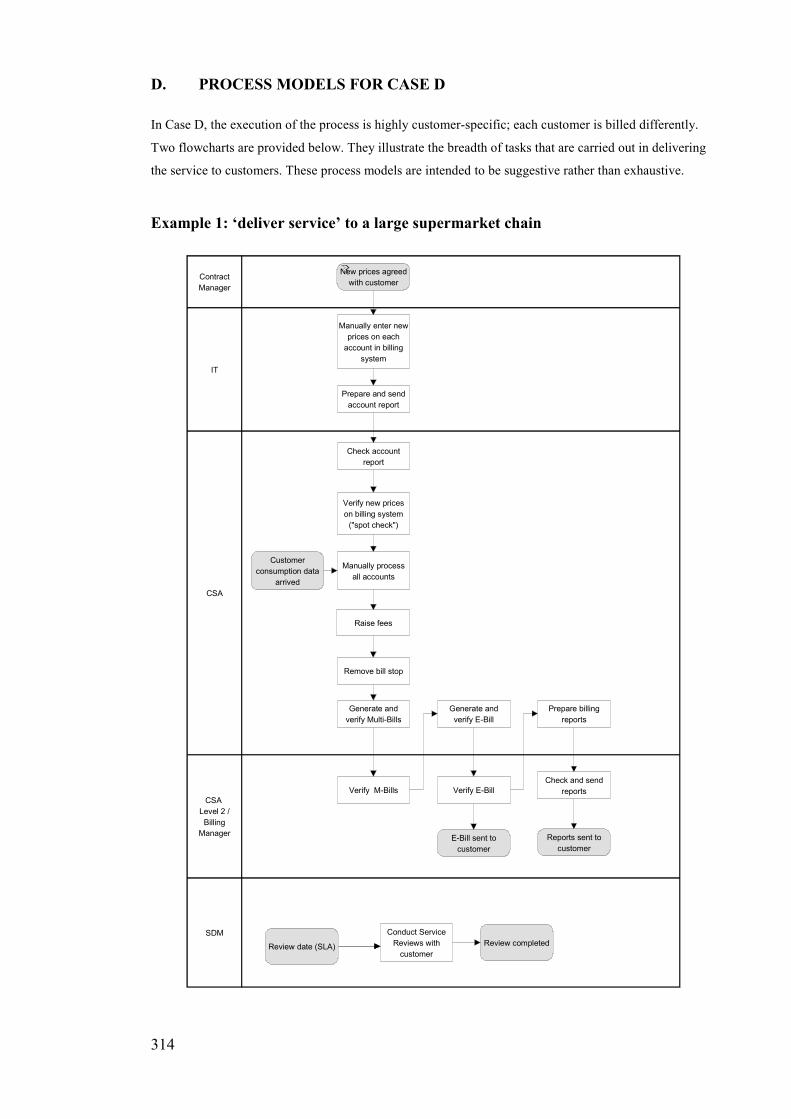
314
D. PROCESS MODELS FOR CASE D
In Case D, the execution of the process is highly customer-specific; each customer is billed differently.
Two flowcharts are provided below. They illustrate the breadth of tasks that are carried out in delivering
the service to customers. These process models are intended to be suggestive rather than exhaustive.
Example 1: ‘deliver service’ to a large supermarket chain
Contract
Manager
IT
CSA
CSA
Level 2 /
Billing
Manager
SDM
New prices agreed
with customer
Check account
report
Manually process
all accounts
E-Bill sent to
customer
Verify M-Bills
Raise fees
Conduct Service
Reviews with
customerReview date (SLA)
Manually enter new
prices on each
account in billing
system
Check and send
reports
Prepare billing
reports
Prepare and send
account report
Verify new prices
on billing system
("spot check")
Customer
consumption data
arrived
Remove bill stop
Generate and
verify Multi-Bills
Generate and
verify E-Bill
Verify E-Bill
Review completed
Reports sent to
customer
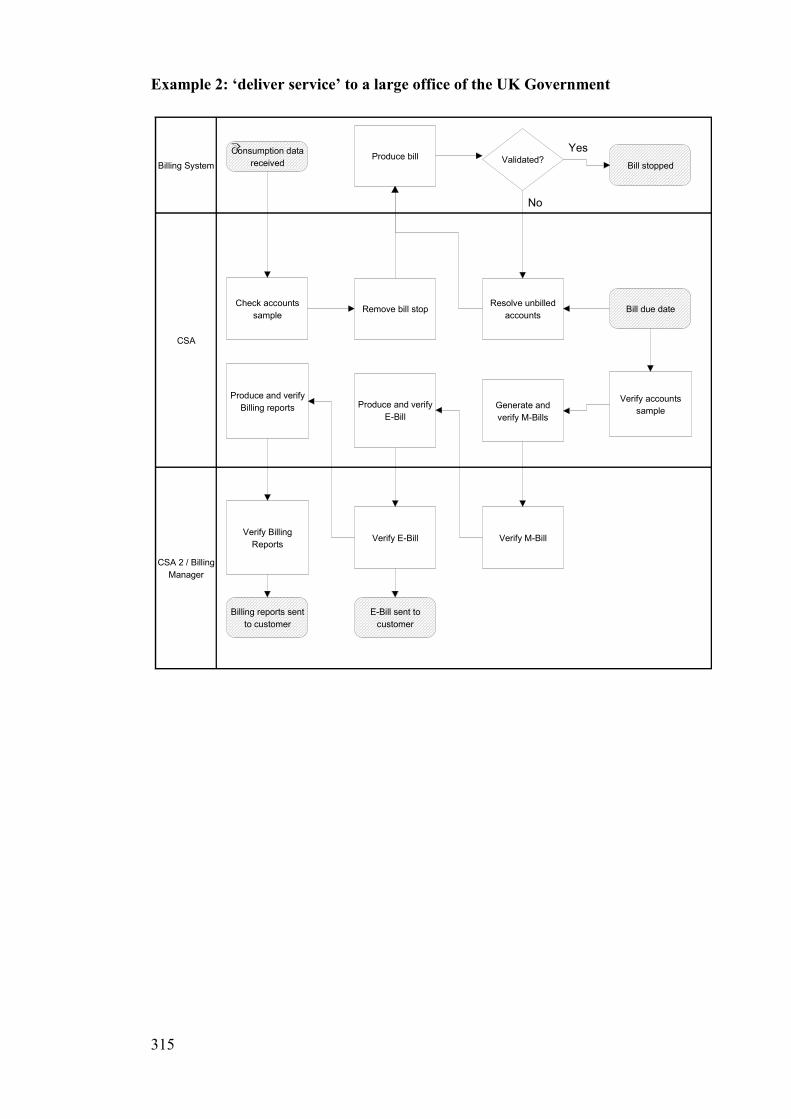
315
Example 2: ‘deliver service’ to a large office of the UK Government
Billing System
CSA
CSA 2 / Billing
Manager
Consumption data
receivedProduce bill Validated?
Check accounts
sample
Generate and
verify M-Bills
Verify M-BillVerify E-BillVerify Billing
Reports
E-Bill sent to
customer
Produce and verify
E-Bill
Produce and verify
Billing reports
Billing reports sent
to customer
Remove bill stop
Verify accounts
sample
Resolve unbilled
accounts
No
Bill due date
Bill stopped
Yes

316
PUBLICATION 1
Ponsignon F., Smart P.A., and Maull R.S., (2007), Service delivery systems: a
business process perspective, EurOMA / POMS College of Service Operations,
London Business School, 12-13 July.
Best Student Paper Competition: High Commendation Award
317
SERVICE DELIVERY SYSTEMS: A BUSINESS PROCESS PERSPECTIVE
F Ponsignon, Dr PA Smart, Prof RS Maull
Exeter Centre for Strategic Processes and Operations (XSPO), School of Business and Economics, University of Exeter
ABSTRACT
Although services now account for between 60 and 80% of GDP and employment in many modern economies and despite a growing evidence of servicization in those economies (Bettley et al., 2005; Cook et al., 2006; Howells, 2004; Wise & Baumgartner, 1999), where manufacturers attempt to increase revenues and the bottom line by integrating service activities and/or components into their traditional product offering, service operations management research remains worryingly meagre (Machuca et al., 2007; Roth & Menor, 2003; Slack et al., 2004b). This paper suggests that many of the extant frameworks found within the Services literature require re-appraisal to ensure their relevance and utility in a radically changing business landscape. Engaging a ‘synthetic’ mode of thinking, approaching inquiry from a General Systems Theory perspective, in pursuit of middle-range theory, the paper suggests a new framework for future research. This framework, drawing on recent developments such as UST, suggests that research is needed to address the process configurations of service delivery systems. In particular the correlation of ‘customer input’ type with ‘transformation type’, categorised by material, information, and customer, is suggested. This potentially provides archetypical forms of service delivery systems which are more closely aligned to organisational practice. These archetypes may be used for the logical derivation of future hypothetical propositions and subsequent confirmation through empirical investigation and thus provides a platform for future research. We suggest that this approach facilitates the pursuit of theory which informs organisational practice in a changing and expanding service context.
WHAT ARE SERVICES?
An inhibiting factor in engaging with services research is the scope of the discipline where markedly different perspectives, such as Marketing, Consumer behaviour, Economics, Human resource management, and Operations (Johnston, 1994) introduce different interpretations throughout much of the existing research. Over the past three decades academics have devoted a great deal of energy to discussing and documenting the major aspects that define services. A prevalent theme of this research has been the characterisation of ‘services’, particularly their differentiation from manufacturing firms and manufactured products. In spite of these efforts unifying the field of services has been an enduring challenge and some semantic confusion remains about the word ‘services’ (Johns, 1999). In order to bring some clarification to this issue it is helpful to describe services from three different, basic perspectives. First, services can be thought of as a whole industry that encompasses a number of economic sectors that are not concerned with the production of manufactured goods and
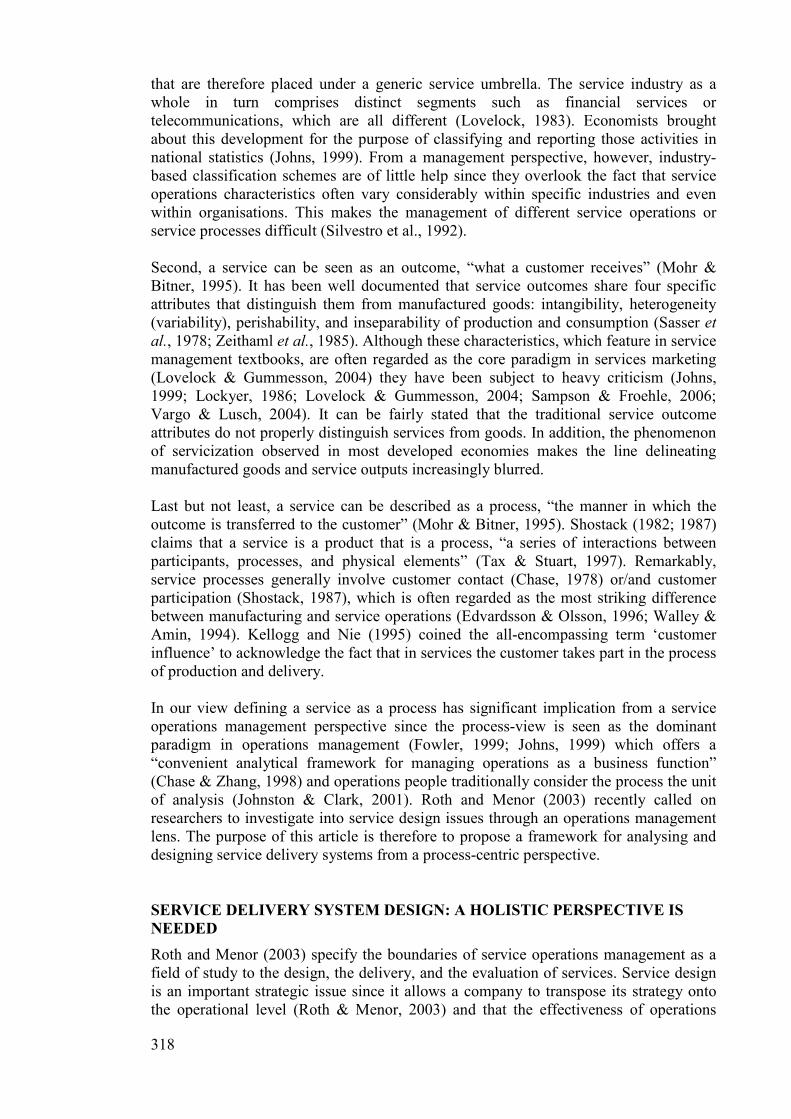
318
that are therefore placed under a generic service umbrella. The service industry as a whole in turn comprises distinct segments such as financial services or telecommunications, which are all different (Lovelock, 1983). Economists brought about this development for the purpose of classifying and reporting those activities in national statistics (Johns, 1999). From a management perspective, however, industry-based classification schemes are of little help since they overlook the fact that service operations characteristics often vary considerably within specific industries and even within organisations. This makes the management of different service operations or service processes difficult (Silvestro et al., 1992). Second, a service can be seen as an outcome, “what a customer receives” (Mohr & Bitner, 1995). It has been well documented that service outcomes share four specific attributes that distinguish them from manufactured goods: intangibility, heterogeneity (variability), perishability, and inseparability of production and consumption (Sasser et al., 1978; Zeithaml et al., 1985). Although these characteristics, which feature in service management textbooks, are often regarded as the core paradigm in services marketing (Lovelock & Gummesson, 2004) they have been subject to heavy criticism (Johns, 1999; Lockyer, 1986; Lovelock & Gummesson, 2004; Sampson & Froehle, 2006; Vargo & Lusch, 2004). It can be fairly stated that the traditional service outcome attributes do not properly distinguish services from goods. In addition, the phenomenon of servicization observed in most developed economies makes the line delineating manufactured goods and service outputs increasingly blurred. Last but not least, a service can be described as a process, “the manner in which the outcome is transferred to the customer” (Mohr & Bitner, 1995). Shostack (1982; 1987) claims that a service is a product that is a process, “a series of interactions between participants, processes, and physical elements” (Tax & Stuart, 1997). Remarkably, service processes generally involve customer contact (Chase, 1978) or/and customer participation (Shostack, 1987), which is often regarded as the most striking difference between manufacturing and service operations (Edvardsson & Olsson, 1996; Walley & Amin, 1994). Kellogg and Nie (1995) coined the all-encompassing term ‘customer influence’ to acknowledge the fact that in services the customer takes part in the process of production and delivery. In our view defining a service as a process has significant implication from a service operations management perspective since the process-view is seen as the dominant paradigm in operations management (Fowler, 1999; Johns, 1999) which offers a “convenient analytical framework for managing operations as a business function” (Chase & Zhang, 1998) and operations people traditionally consider the process the unit of analysis (Johnston & Clark, 2001). Roth and Menor (2003) recently called on researchers to investigate into service design issues through an operations management lens. The purpose of this article is therefore to propose a framework for analysing and designing service delivery systems from a process-centric perspective.
SERVICE DELIVERY SYSTEM DESIGN: A HOLISTIC PERSPECTIVE IS
NEEDED
Roth and Menor (2003) specify the boundaries of service operations management as a field of study to the design, the delivery, and the evaluation of services. Service design is an important strategic issue since it allows a company to transpose its strategy onto the operational level (Roth & Menor, 2003) and that the effectiveness of operations
319
strategy is contingent upon making the right design choices (Heskett, 1987). The figure below illustrates that the design activity encompasses a number of elements – customers, service concept, and service delivery system – that must be considered in an integrated way.
Looking at the big picture: the service strategy triad
Adapted from Roth and Menor, 2003
Understanding the needs and expectations of customers is a pivotal factor of success in service design (Goldstein et al., 2002; Gouillart & Sturdivant, 1994; Roth & Menor, 2003). Generally, the overarching purpose of the design activity is to create a service that matches or exceeds customer expectations (Slack et al., 2004a). Good design therefore ensures that both the service outcome and the process of service delivery are perceived as being of good quality by customers (Mohr & Bitner, 1995) so as to generate customer satisfaction (Dabholkar & Overby, 2005) which in turns drives customer retention (Cronin & Taylor, 1992). The critical importance of retaining customers with the business is explained by the long-term value of loyal customers (Reichheld & Sasser, 1990), the high costs associated with acquiring new customers (Brown, 2000; Hart et al., 1990), and the impact of negative word-of-mouth on the existing customer base (Brown, 1997). Designing a service the right way therefore gives service businesses leverage to gain, or at least maintain, a competitive edge in the marketplace (Shostack, 1984; Verma et al., 2002). As mentioned earlier, a service can be described as an outcome, the what, and as a process, the how. Since customers that purchase the outcome also participate in the process, conceiving a service involves designing both the outcome and the process that produces the result. Although these two constructs overlap (Cooper & Chew, 1996; Gouillart & Sturdivant, 1994), they have often been discussed separately in the services literature (Lovelock & Wirtz, 2004). While developing the service outcome is predominantly affected by a service marketing orientation (Cook et al., 1999), operations managers are usually concerned with managing the process of service delivery (Johnston & Clark, 2001). The service concept refers to the outcome that is received by the customer (Lovelock & Wirtz, 2004) and is made up of a “portfolio of core and supporting elements” (Roth &
320
Menor, 2003) which can be both tangible and intangible (Goldstein et al., 2002). It is a description of the service in terms of its features and elements as well as in terms of the benefits and value it intends to provide customers with (Heskett, 1987; Scheuing & Johnson, 1989). As alternatives to service concept, academics coined the terms service offering, service package, and service or product bundle (Roth & Menor, 2003). Since a service process leads to an outcome resulting in the customer being either satisfied or dissatisfied with the service experience (Mayer et al., 2003), it is of paramount importance that service organisations pay attention to designing the system by which service concepts are produced and delivered to customers (Brown et al., 1994). It is the role of ‘delivery’ to ensure that the expected service outcome is received by the customer (Goldstein et al., 2002). A service delivery system is made up of multiple, interdependent service processes (Johnston & Clark, 2001). The entire set of interrelated service processes constitutes a hierarchically-organised process architecture. A service process can, in turn, be described as the sequence of activities and steps, the flows and interactions between these activities, and the resources required for producing and delivering the service outcome (Slack et al., 2004a). Heskett (1987) proposes that designing a service delivery system involves defining the roles of people, technology, facilities, equipment, layout, and processes that generate the service outcome. Over the past thirty years service blueprinting and service maps have gained widespread support as a holistic tool used for service process design (Kim & Kim, 2001; Lynch & Cross, 1995; Shieff & Brodie, 1995). Although this modelling technique has its origins in systems-thinking and production management where flowcharts are commonly used to design manufacturing processes, Shostack (1982; 1984; 1987) demonstrated its applicability to service situations by integrating the view of the customer into the model. A service blueprint is an enhanced flowchart that represents all the steps, flows, and the role of employees involved in the delivery of the service as well as all the interactions that occur between the customer and the organisation in the process of service delivery (Zeithaml et al., 2006). The blueprinting technique enables the depiction of an entire process from a holistic perspective. This emphasises the relationships between the parts of the process instead of focusing on specific, individual elements in isolation (Shostack, 1987). Southern (1999) showed that adopting a systems-approach through the use of service system maps facilitates the understanding of the way operational processes function within the overall service system. One of the major shortcomings of service blueprinting, however, is the lack of a standard, unifying methodology which causes comprehensibility and consistency problems (Congram & Epelman, 1995; Zeithaml et al., 2006). In addition, blueprinting does not have the power of a theory or a methodology with unchallenged rules and principles for service process design; it is merely a technique. In general, service businesses seem to have somewhat missed out on the opportunity to exploit the potential of service maps (Antony, 2004). Congram and Epelman (1995) provide interesting thoughts about the reasons that may explain why it is difficult to describe and model a service process. Among others they blame the functional-orientation adopted by many organisations which does not foster collaboration and synergies between the various departments involved in executing the process and that it usually lacks an identifiable process owner. Since “there is no general methodology for designing services” (Gummesson, 1994) a major challenge for SOM research is to find general principles that guide the design of service systems. General Systems Thinking is well-established in the literature as a
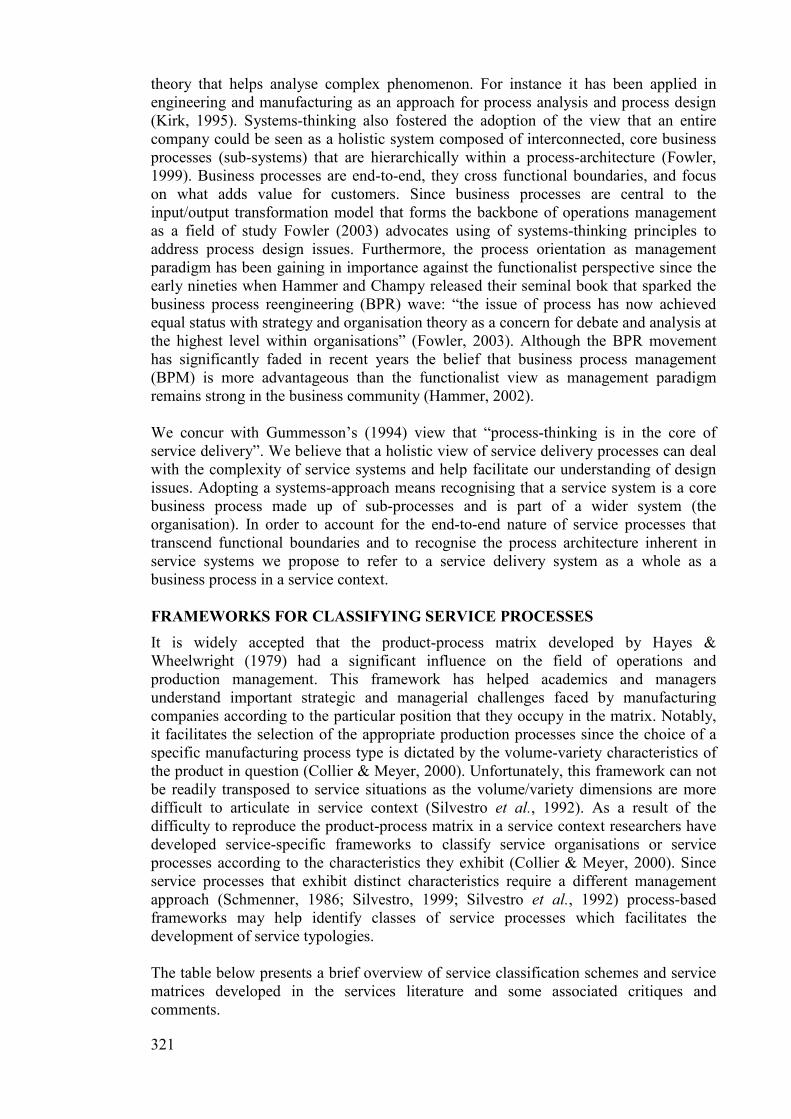
321
theory that helps analyse complex phenomenon. For instance it has been applied in engineering and manufacturing as an approach for process analysis and process design (Kirk, 1995). Systems-thinking also fostered the adoption of the view that an entire company could be seen as a holistic system composed of interconnected, core business processes (sub-systems) that are hierarchically within a process-architecture (Fowler, 1999). Business processes are end-to-end, they cross functional boundaries, and focus on what adds value for customers. Since business processes are central to the input/output transformation model that forms the backbone of operations management as a field of study Fowler (2003) advocates using of systems-thinking principles to address process design issues. Furthermore, the process orientation as management paradigm has been gaining in importance against the functionalist perspective since the early nineties when Hammer and Champy released their seminal book that sparked the business process reengineering (BPR) wave: “the issue of process has now achieved equal status with strategy and organisation theory as a concern for debate and analysis at the highest level within organisations” (Fowler, 2003). Although the BPR movement has significantly faded in recent years the belief that business process management (BPM) is more advantageous than the functionalist view as management paradigm remains strong in the business community (Hammer, 2002). We concur with Gummesson’s (1994) view that “process-thinking is in the core of service delivery”. We believe that a holistic view of service delivery processes can deal with the complexity of service systems and help facilitate our understanding of design issues. Adopting a systems-approach means recognising that a service system is a core business process made up of sub-processes and is part of a wider system (the organisation). In order to account for the end-to-end nature of service processes that transcend functional boundaries and to recognise the process architecture inherent in service systems we propose to refer to a service delivery system as a whole as a business process in a service context.
FRAMEWORKS FOR CLASSIFYING SERVICE PROCESSES
It is widely accepted that the product-process matrix developed by Hayes & Wheelwright (1979) had a significant influence on the field of operations and production management. This framework has helped academics and managers understand important strategic and managerial challenges faced by manufacturing companies according to the particular position that they occupy in the matrix. Notably, it facilitates the selection of the appropriate production processes since the choice of a specific manufacturing process type is dictated by the volume-variety characteristics of the product in question (Collier & Meyer, 2000). Unfortunately, this framework can not be readily transposed to service situations as the volume/variety dimensions are more difficult to articulate in service context (Silvestro et al., 1992). As a result of the difficulty to reproduce the product-process matrix in a service context researchers have developed service-specific frameworks to classify service organisations or service processes according to the characteristics they exhibit (Collier & Meyer, 2000). Since service processes that exhibit distinct characteristics require a different management approach (Schmenner, 1986; Silvestro, 1999; Silvestro et al., 1992) process-based frameworks may help identify classes of service processes which facilitates the development of service typologies. The table below presents a brief overview of service classification schemes and service matrices developed in the services literature and some associated critiques and comments.
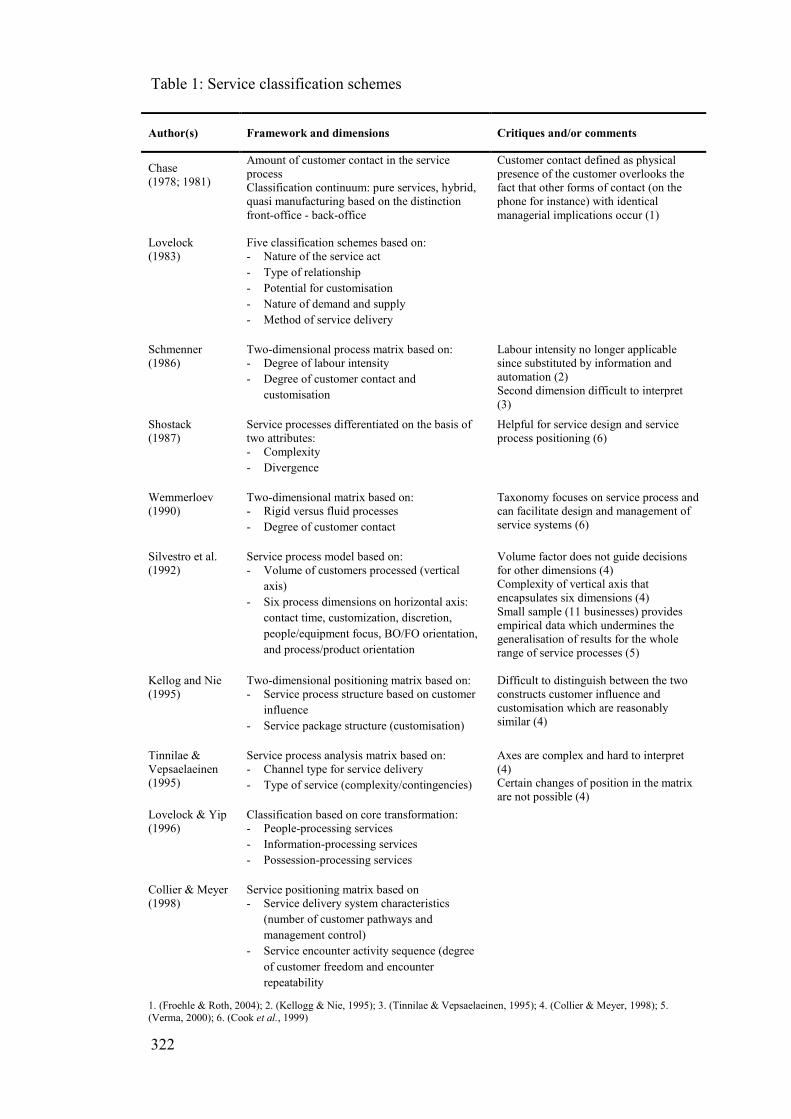
322
Table 1: Service classification schemes
Author(s) Framework and dimensions Critiques and/or comments
Chase (1978; 1981)
Amount of customer contact in the service process Classification continuum: pure services, hybrid, quasi manufacturing based on the distinction front-office - back-office
Customer contact defined as physical presence of the customer overlooks the fact that other forms of contact (on the phone for instance) with identical managerial implications occur (1)
Lovelock (1983)
Five classification schemes based on: - Nature of the service act
- Type of relationship
- Potential for customisation
- Nature of demand and supply
- Method of service delivery
Schmenner (1986)
Two-dimensional process matrix based on: - Degree of labour intensity
- Degree of customer contact and
customisation
Labour intensity no longer applicable since substituted by information and automation (2) Second dimension difficult to interpret (3)
Shostack (1987)
Service processes differentiated on the basis of two attributes: - Complexity
- Divergence
Helpful for service design and service process positioning (6)
Wemmerloev (1990)
Two-dimensional matrix based on: - Rigid versus fluid processes
- Degree of customer contact
Taxonomy focuses on service process and can facilitate design and management of service systems (6)
Silvestro et al. (1992)
Service process model based on: - Volume of customers processed (vertical
axis)
- Six process dimensions on horizontal axis:
contact time, customization, discretion,
people/equipment focus, BO/FO orientation,
and process/product orientation
Volume factor does not guide decisions for other dimensions (4) Complexity of vertical axis that encapsulates six dimensions (4) Small sample (11 businesses) provides empirical data which undermines the generalisation of results for the whole range of service processes (5)
Kellog and Nie (1995)
Two-dimensional positioning matrix based on: - Service process structure based on customer
influence
- Service package structure (customisation)
Difficult to distinguish between the two constructs customer influence and customisation which are reasonably similar (4)
Tinnilae & Vepsaelaeinen (1995)
Service process analysis matrix based on: - Channel type for service delivery
- Type of service (complexity/contingencies)
Axes are complex and hard to interpret (4) Certain changes of position in the matrix are not possible (4)
Lovelock & Yip (1996)
Classification based on core transformation: - People-processing services
- Information-processing services
- Possession-processing services
Collier & Meyer (1998)
Service positioning matrix based on - Service delivery system characteristics
(number of customer pathways and
management control)
- Service encounter activity sequence (degree
of customer freedom and encounter
repeatability
1. (Froehle & Roth, 2004); 2. (Kellogg & Nie, 1995); 3. (Tinnilae & Vepsaelaeinen, 1995); 4. (Collier & Meyer, 1998); 5. (Verma, 2000); 6. (Cook et al., 1999)
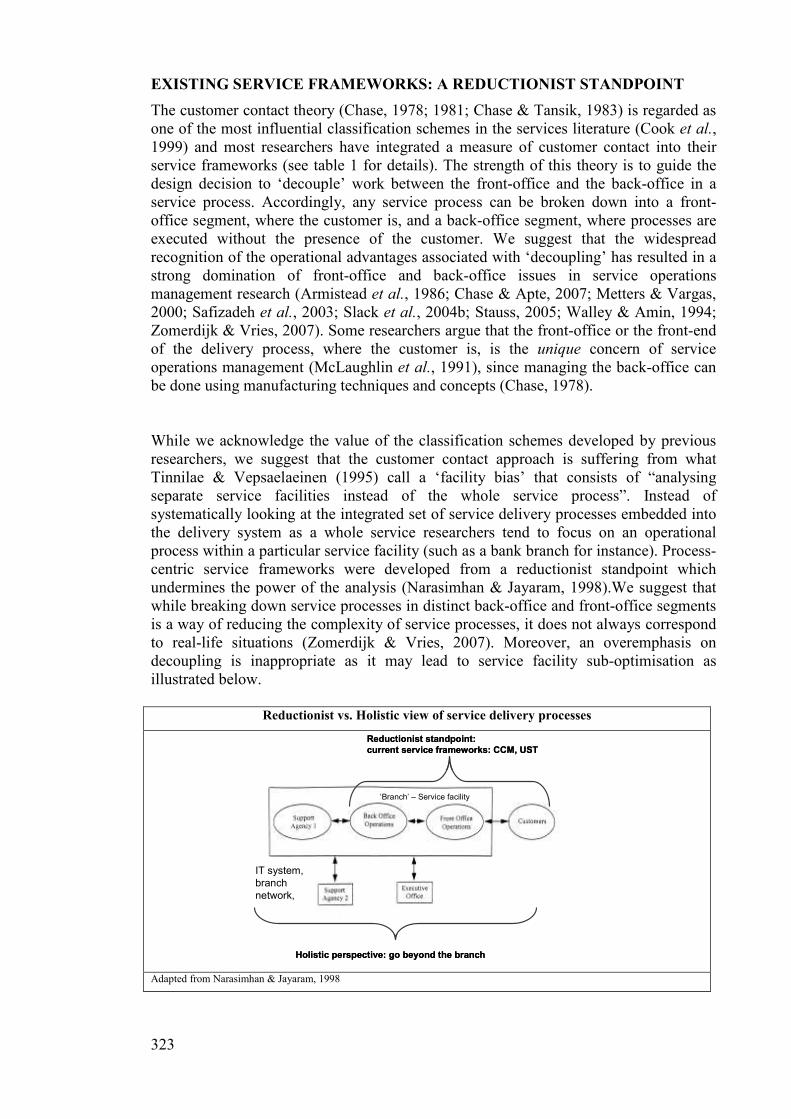
323
EXISTING SERVICE FRAMEWORKS: A REDUCTIONIST STANDPOINT
The customer contact theory (Chase, 1978; 1981; Chase & Tansik, 1983) is regarded as one of the most influential classification schemes in the services literature (Cook et al., 1999) and most researchers have integrated a measure of customer contact into their service frameworks (see table 1 for details). The strength of this theory is to guide the design decision to ‘decouple’ work between the front-office and the back-office in a service process. Accordingly, any service process can be broken down into a front-office segment, where the customer is, and a back-office segment, where processes are executed without the presence of the customer. We suggest that the widespread recognition of the operational advantages associated with ‘decoupling’ has resulted in a strong domination of front-office and back-office issues in service operations management research (Armistead et al., 1986; Chase & Apte, 2007; Metters & Vargas, 2000; Safizadeh et al., 2003; Slack et al., 2004b; Stauss, 2005; Walley & Amin, 1994; Zomerdijk & Vries, 2007). Some researchers argue that the front-office or the front-end of the delivery process, where the customer is, is the unique concern of service operations management (McLaughlin et al., 1991), since managing the back-office can be done using manufacturing techniques and concepts (Chase, 1978).
While we acknowledge the value of the classification schemes developed by previous researchers, we suggest that the customer contact approach is suffering from what Tinnilae & Vepsaelaeinen (1995) call a ‘facility bias’ that consists of “analysing separate service facilities instead of the whole service process”. Instead of systematically looking at the integrated set of service delivery processes embedded into the delivery system as a whole service researchers tend to focus on an operational process within a particular service facility (such as a bank branch for instance). Process-centric service frameworks were developed from a reductionist standpoint which undermines the power of the analysis (Narasimhan & Jayaram, 1998).We suggest that while breaking down service processes in distinct back-office and front-office segments is a way of reducing the complexity of service processes, it does not always correspond to real-life situations (Zomerdijk & Vries, 2007). Moreover, an overemphasis on decoupling is inappropriate as it may lead to service facility sub-optimisation as illustrated below.
Reductionist vs. Holistic view of service delivery processes
Reductionist standpoint:
current service frameworks: CCM, UST
‘Branch’ – Service facility
IT system,
branch
network,
Holistic perspective: go beyond the branch
Reductionist standpoint:
current service frameworks: CCM, UST
‘Branch’ – Service facility
IT system,
branch
network,
Holistic perspective: go beyond the branch
Adapted from Narasimhan & Jayaram, 1998
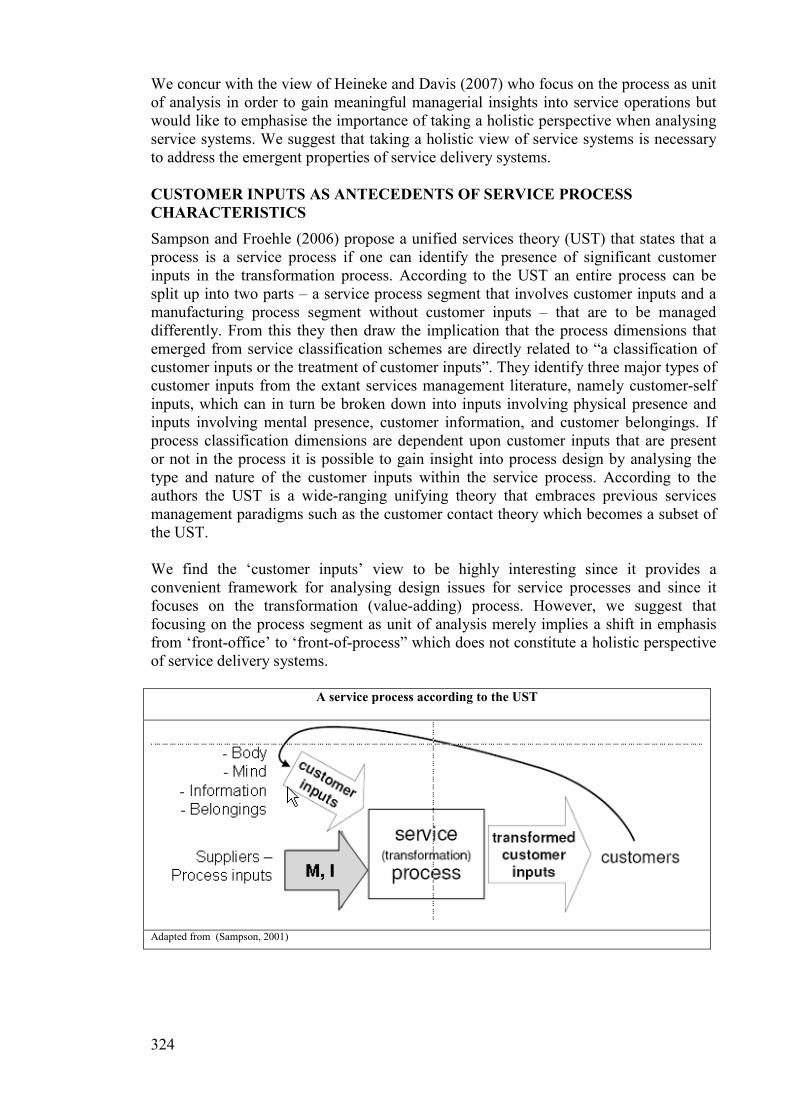
324
We concur with the view of Heineke and Davis (2007) who focus on the process as unit of analysis in order to gain meaningful managerial insights into service operations but would like to emphasise the importance of taking a holistic perspective when analysing service systems. We suggest that taking a holistic view of service systems is necessary to address the emergent properties of service delivery systems.
CUSTOMER INPUTS AS ANTECEDENTS OF SERVICE PROCESS
CHARACTERISTICS
Sampson and Froehle (2006) propose a unified services theory (UST) that states that a process is a service process if one can identify the presence of significant customer inputs in the transformation process. According to the UST an entire process can be split up into two parts – a service process segment that involves customer inputs and a manufacturing process segment without customer inputs – that are to be managed differently. From this they then draw the implication that the process dimensions that emerged from service classification schemes are directly related to “a classification of customer inputs or the treatment of customer inputs”. They identify three major types of customer inputs from the extant services management literature, namely customer-self inputs, which can in turn be broken down into inputs involving physical presence and inputs involving mental presence, customer information, and customer belongings. If process classification dimensions are dependent upon customer inputs that are present or not in the process it is possible to gain insight into process design by analysing the type and nature of the customer inputs within the service process. According to the authors the UST is a wide-ranging unifying theory that embraces previous services management paradigms such as the customer contact theory which becomes a subset of the UST. We find the ‘customer inputs’ view to be highly interesting since it provides a convenient framework for analysing design issues for service processes and since it focuses on the transformation (value-adding) process. However, we suggest that focusing on the process segment as unit of analysis merely implies a shift in emphasis from ‘front-office’ to ‘front-of-process” which does not constitute a holistic perspective of service delivery systems.
A service process according to the UST
Adapted from (Sampson, 2001)
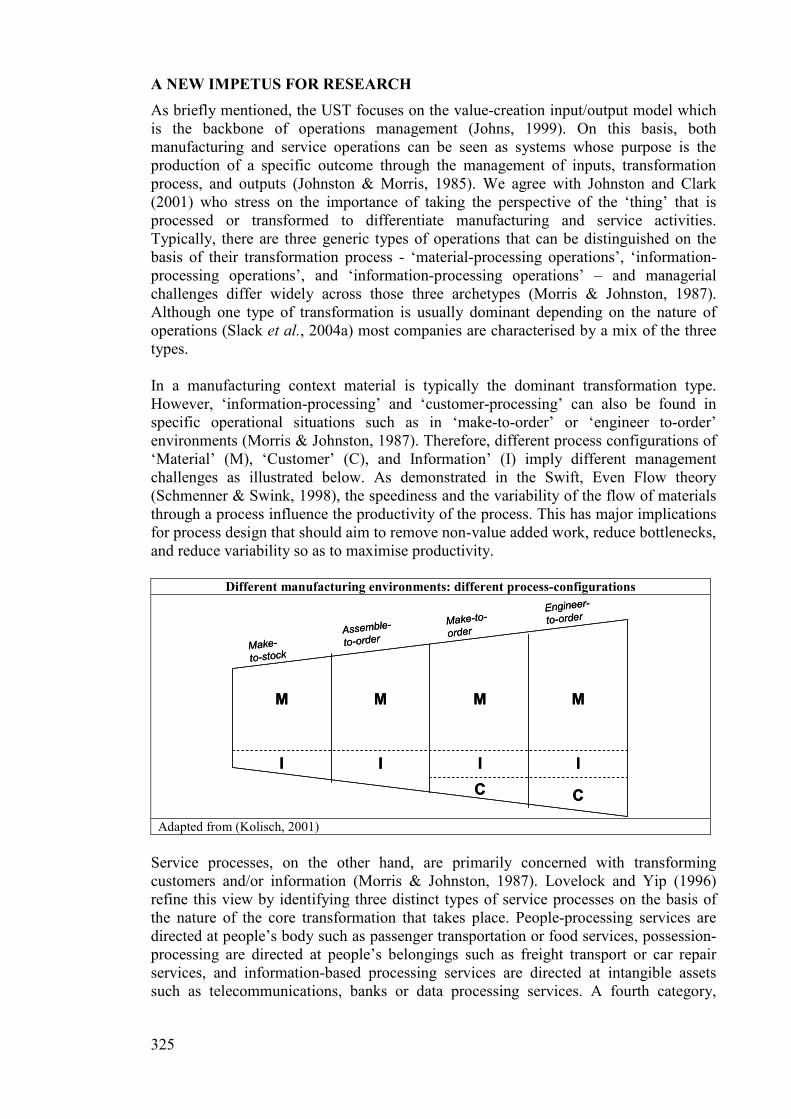
325
A NEW IMPETUS FOR RESEARCH
As briefly mentioned, the UST focuses on the value-creation input/output model which is the backbone of operations management (Johns, 1999). On this basis, both manufacturing and service operations can be seen as systems whose purpose is the production of a specific outcome through the management of inputs, transformation process, and outputs (Johnston & Morris, 1985). We agree with Johnston and Clark (2001) who stress on the importance of taking the perspective of the ‘thing’ that is processed or transformed to differentiate manufacturing and service activities. Typically, there are three generic types of operations that can be distinguished on the basis of their transformation process - ‘material-processing operations’, ‘information-processing operations’, and ‘information-processing operations’ – and managerial challenges differ widely across those three archetypes (Morris & Johnston, 1987). Although one type of transformation is usually dominant depending on the nature of operations (Slack et al., 2004a) most companies are characterised by a mix of the three types. In a manufacturing context material is typically the dominant transformation type. However, ‘information-processing’ and ‘customer-processing’ can also be found in specific operational situations such as in ‘make-to-order’ or ‘engineer to-order’ environments (Morris & Johnston, 1987). Therefore, different process configurations of ‘Material’ (M), ‘Customer’ (C), and Information’ (I) imply different management challenges as illustrated below. As demonstrated in the Swift, Even Flow theory (Schmenner & Swink, 1998), the speediness and the variability of the flow of materials through a process influence the productivity of the process. This has major implications for process design that should aim to remove non-value added work, reduce bottlenecks, and reduce variability so as to maximise productivity.
Different manufacturing environments: different process-configurations
C C
I I I I
M M M M
Make-
to-stock
Assemble-
to-order
Make-to-
order
Engineer-
to-order
C C
I I I I
M M M M
Make-
to-stock
Assemble-
to-order
Make-to-
order
Engineer-
to-order
Adapted from (Kolisch, 2001)
Service processes, on the other hand, are primarily concerned with transforming customers and/or information (Morris & Johnston, 1987). Lovelock and Yip (1996) refine this view by identifying three distinct types of service processes on the basis of the nature of the core transformation that takes place. People-processing services are directed at people’s body such as passenger transportation or food services, possession-processing are directed at people’s belongings such as freight transport or car repair services, and information-based processing services are directed at intangible assets such as telecommunications, banks or data processing services. A fourth category,
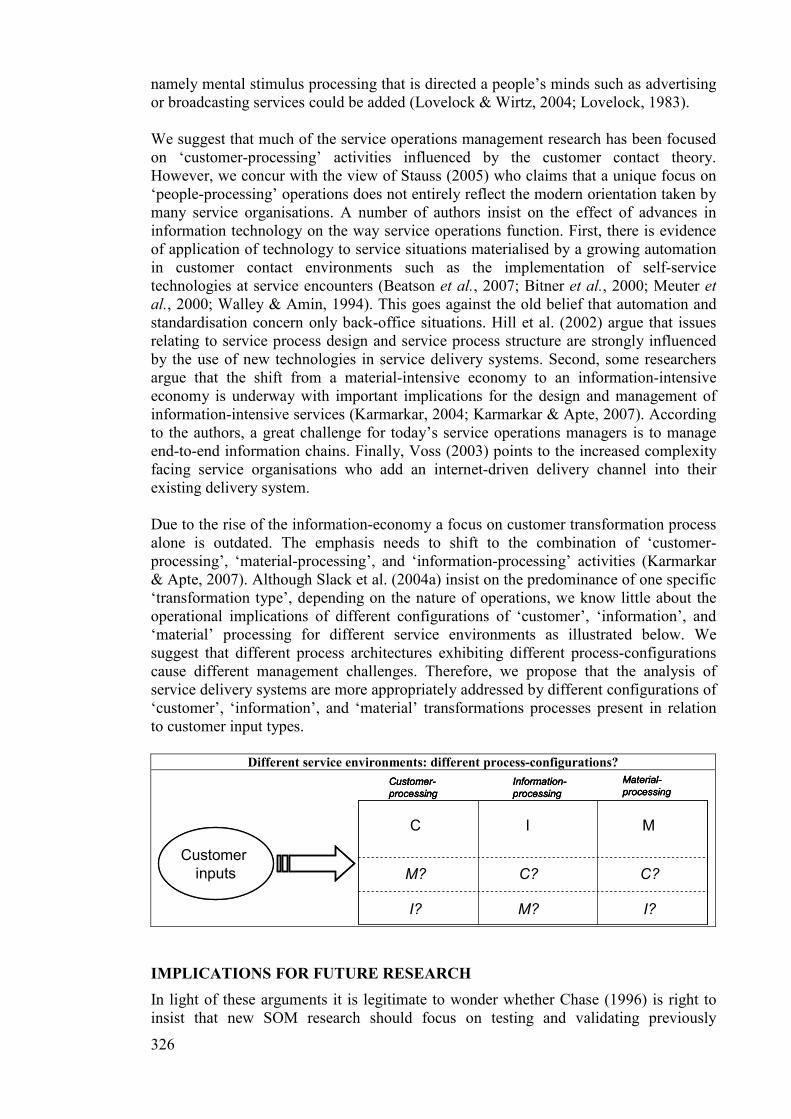
326
namely mental stimulus processing that is directed a people’s minds such as advertising or broadcasting services could be added (Lovelock & Wirtz, 2004; Lovelock, 1983). We suggest that much of the service operations management research has been focused on ‘customer-processing’ activities influenced by the customer contact theory. However, we concur with the view of Stauss (2005) who claims that a unique focus on ‘people-processing’ operations does not entirely reflect the modern orientation taken by many service organisations. A number of authors insist on the effect of advances in information technology on the way service operations function. First, there is evidence of application of technology to service situations materialised by a growing automation in customer contact environments such as the implementation of self-service technologies at service encounters (Beatson et al., 2007; Bitner et al., 2000; Meuter et al., 2000; Walley & Amin, 1994). This goes against the old belief that automation and standardisation concern only back-office situations. Hill et al. (2002) argue that issues relating to service process design and service process structure are strongly influenced by the use of new technologies in service delivery systems. Second, some researchers argue that the shift from a material-intensive economy to an information-intensive economy is underway with important implications for the design and management of information-intensive services (Karmarkar, 2004; Karmarkar & Apte, 2007). According to the authors, a great challenge for today’s service operations managers is to manage end-to-end information chains. Finally, Voss (2003) points to the increased complexity facing service organisations who add an internet-driven delivery channel into their existing delivery system. Due to the rise of the information-economy a focus on customer transformation process alone is outdated. The emphasis needs to shift to the combination of ‘customer-processing’, ‘material-processing’, and ‘information-processing’ activities (Karmarkar & Apte, 2007). Although Slack et al. (2004a) insist on the predominance of one specific ‘transformation type’, depending on the nature of operations, we know little about the operational implications of different configurations of ‘customer’, ‘information’, and ‘material’ processing for different service environments as illustrated below. We suggest that different process architectures exhibiting different process-configurations cause different management challenges. Therefore, we propose that the analysis of service delivery systems are more appropriately addressed by different configurations of ‘customer’, ‘information’, and ‘material’ transformations processes present in relation to customer input types.
Different service environments: different process-configurations?
Customer-
processing
Information-
processing
Material-
processing
I
I?
M
M?
I? M?
C
C?C?
Customer
inputs
Customer-
processing
Information-
processing
Material-
processing
I
I?
M
M?
I? M?
C
C?C?
Customer-
processing
Information-
processing
Material-
processing
I
I?
M
M?
I? M?
C
C?C?
Customer
inputs
IMPLICATIONS FOR FUTURE RESEARCH
In light of these arguments it is legitimate to wonder whether Chase (1996) is right to insist that new SOM research should focus on testing and validating previously
327
established frameworks. Alternatively, we suggest that there may be a need to conduct exploratory research further in an attempt to discover a new paradigm that would contribute to shape the uniqueness of service operations management as a field of study as suggested by Nie & Kellogg (1999). This paper suggests that a new framework for future research on service delivery processes grounded within the systems discipline needs to be developed. Using service maps as an analytical tool, our research work proposes to look at the design dimensions of business processes in a service context in an attempt to identify specific process design archetypes. Given specific configurations of material, customer, and information transformation types within a business process and the nature of customer inputs involved in the process, we ask whether it is possible to shed light on distinctive or common design characteristics for service delivery systems.
REFERENCES
Antony J. 2004. Six Sigma in the UK service organisations: results from a pilot survey. Managerial Auditing Journal 19(8): 1006-1013 Armistead C, Johnston R, Voss CA. 1986. Introducing Service Industries in Operations Management Teaching. International Journal of Operations & Production Management 6(3): 21-29 Beatson A, Lee N, Coote LV. 2007. Self-Service Technology and the Service Encounter. Service Industries Journal 27(1): 75-89 Bettley A, Mayle D, Tantoush T. 2005. Introduction to Theme 1: Operations as Strategy. In A Bettley, D Mayle, T Tantoush (Eds.), Operations Management: A Strategic Approach. Sage Publications Ltd Bitner MJ, Brown SW, Meuter ML. 2000. Technology Infusion in Service Encounters. Journal of the Academy of Marketing Science 28(1): 138 Brown SW. 1997. Service Recovery Through IT. Marketing Management 6(3): 25-27 Brown SW. 2000. Practicing best-in-class service recovery. Marketing Management 9(2): 8-9 Brown SW, Fisk RP, Bitner MJ. 1994. The Development and Emergence of Services Marketing Thought. International Journal of Service Industry Management 5(1): 21-48 Chase RB. 1978. Where does the customer fit in a service operation? Harvard Business Review 56(6): 137-142 Chase RB. 1981. The Customer Contact Approach to Services: Theoretical Bases and Practical Extensions. Operations Research 29(4): 698-706 Chase RB. 1996. The mall is my factory: reflections of a service junkie. Production & Operations Management 5(4): 298-308 Chase RB, Apte UM. 2007. A history of research in service operations: What's the big idea? Journal of Operations Management 25(2): 375-386 Chase RB, Tansik DA. 1983. The customer contact model for organization design. Management Science 29(9): 1037-1050 Chase RB, Zhang A. 1998. Operations management: internationalization and interdisciplinary integration. International Journal of Operations & Production Management 18(7): 663-667 Collier DA, Meyer SM. 1998. A service positioning matrix. International Journal of Operations & Production Management 18: 1223-1244 Collier DA, Meyer SM. 2000. An empirical comparison of service matrices. International Journal of Operations & Production Management 20(6): 705 - 729 Congram C, Epelman M. 1995. How to describe your service. International Journal of Service Industry Management 6(2): 6 Cook DP, Goh C-H, Chung CH. 1999. Service Typologies: A State of the Art Survey. Production & Operations Management 8(3): 318-338 Cook MB, Bhamra TA, Lemon M. 2006. The transfer and application of Product Service Systems: from academia to UK manufacturing firms. Journal of Cleaner Production 14(17): 1455-1465 Cooper R, Chew WB. 1996. Control Tomorrow's Costs Through Today's Designs. Harvard Business Review 74(1): 88-97 Cronin JJ, Taylor SA. 1992. Measuring service quality: A reexamination and extension. Journal of Marketing 56(3): 55 Dabholkar PA, Overby JW. 2005. Linking process and outcome to service quality and customer satisfaction evaluations: An investigation of real estate agent service. International Journal of Service Industry Management 16: 10-27 Edvardsson B, Olsson J. 1996. Key Concepts for New Service Development. Service Industries Journal 16(2): 140-164 Fowler A. 1999. Feedback and feedforward as systemic frameworks for operations control. International Journal of Operations & Production Management 19(2): 182-204 Fowler A. 2003. Systems modelling, simulation, and the dynamics of strategy. Journal of Business Research 56(2): 135-144 Froehle CM, Roth AV. 2004. New measurement scales for evaluating perceptions of the technology-mediated customer service experience. Journal of Operations Management 22(1): 1-21 Goldstein SM, Johnston R, Duffy J, Rao J. 2002. The service concept: the missing link in service design research? Journal of Operations Management 20(2): 121-134 Gouillart FJ, Sturdivant FD. 1994. Spend a Day in the Life of Your Customers. Harvard Business Review 72(1): 116 Gummesson E. 1994. Service Management: An Evaluation and the Future. International Journal of Service Industry Management 5(1): 77-96 Hammer M. 2002. Process Management and the Future of Six Sigma. MIT Sloan Management Review 43(2): 26-32 Hart CWL, Heskett JL, Sasser Jr WE. 1990. The Profitable Art of Service Recovery. Harvard Business Review 68(4): 148-156 Hayes RH, Wheelwright SC. 1979. Link manufacturing process and product life cycles. Harvard Business Review 57(1): 133-140 Heineke J, Davis MM. 2007. The emergence of service operations management as an academic discipline. Journal of Operations Management 25(2): 364-374 Heskett JL. 1987. Lessons in the service sector. Harvard Business Review 65(2): 118-126 Hill AV, Collier DA, Froehle CM, Goodale JC, Metters RD, Verma R. 2002. Research opportunities in service process design. Journal of Operations Management 20(2): 189-202

328
Howells J. 2004. Innovation, Consumption and Services: Encapsulation and the Combinatorial Role of Services. Service Industries Journal 24(1): 19-36 Johns N. 1999. What is this thing called service? European Journal of Marketing 33: 958-974 Johnston B, Morris B. 1985. Monitoring and Control in Service Operations. International Journal of Operations & Production Management 5(1): 32-38 Johnston R. 1994. Operations: From Factory to Service Management. International Journal of Service Industry Management 5(1): 49 - 63 Johnston R, Clark G. 2001. Service Operations Management. FT Prentice Hall: London Karmarkar U. 2004. Will You Survive the Services Revolution? Harvard Business Review 82(6): 100-107 Karmarkar US, Apte UM. 2007. Operations management in the information economy: Information products, processes, and chains. Journal of Operations Management 25(2): 438-453 Kellogg DL, Nie W. 1995. A framework for strategic service management. Journal of Operations Management 13(4): 323-337 Kim H-W, Kim Y-G. 2001. Rationalizing the customer service process. Business Process Management Journal 7(2): 139-156 Kirk D. 1995. Hard and soft systems: a common paradigm for operations management? International Journal of Contemporary Hospitality Management 7(5): 13-16 Kolisch R. 2001. Make-To-Order Assembly Management. Springer: Berlin Lockyer K. 1986. Service - A Polemic and a Proposal. International Journal of Operations & Production Management 6(3): 5-9 Lovelock C, Gummesson E. 2004. Whither Services Marketing?: In Search of a New Paradigm and Fresh Perspectives. Journal of Service Research 7(1): 20-41 Lovelock C, Wirtz J. 2004. Services marketing: people, technology, strategy (5th ed.). Pearson Prentice Hall: Upper Saddle River, NJ Lovelock CH. 1983. Classifying Services to Gain Strategic Marketing Insights. Journal of Marketing 47(3): 9-20 Lovelock CH, Yip GS. 1996. Developing Global Strategies for Service Businesses. California Management Review 38(2): 64-86 Lynch RR, Cross FK. 1995. Measure up! : yardsticks for continuous improvement (2nd ed. ed.). Blackwell Publishers: Cambridge, MA Machuca JAD, Gonzalez-Zamora MdM, Aguilar-Escobar VG. 2007. Service Operations Management research. Journal of Operations Management 25(3): 585-603 Mayer KJ, Bowen JT, Moulton MR. 2003. A proposed model of the descriptors of service process. Journal of Services Marketing 17: 621-639 McLaughlin CP, Pannesi RT, Kathuria N. 1991. The Different Operations Strategy Planning Process for Service Operations. International Journal of Operations & Production Management 11(3): 63-76 Metters R, Vargas V. 2000. A typology of de-coupling strategies in mixed services. Journal of Operations Management 18(6): 663-682 Meuter ML, Ostrom AL, Roundtree RI, Bitner MJ. 2000. Self-Service Technologies: Understanding Customer Satisfaction with Technology-Based Service Encounters. Journal of Marketing 64(3): 50-64 Mohr LA, Bitner MJ. 1995. The Role of Employee Effort in Satisfaction with Service Transactions. Journal of Business Research 32(3): 239-252 Morris B, Johnston R. 1987. Dealing with Inherent Variability: The Difference Between Manufacturing and Service? International Journal of Operations & Production Management 7(4): 13-22 Narasimhan R, Jayaram J. 1998. Reengineering service operations: a longitudinal case study. Journal of Operations Management 17(1): 7-22 Nie W, Kellogg DL. 1999. How professors of operations management view service operations? Production & Operations Management 8(3): 339-355 Reichheld FF, Sasser EW. 1990. Zero defections: Quality comes to services. Harvard Business Review 68(5): 105-111 Roth AV, Menor LJ. 2003. Insights into service operations management: a research agenda. Production & Operations Management 12(2): 145-164 Safizadeh MH, Field JM, Ritzman LP. 2003. An empirical analysis of financial services processes with a front-office or back-office orientation. Journal of Operations Management 21(5): 557-576 Sampson SE. 2001. Understanding Service Businesses: Applying Principles of the Unified Services Theory (2nd ed.). John Wiley & Sons: New York Sampson SE, Froehle CM. 2006. Foundations and Implications of a Proposed Unified Services Theory. Production & Operations Management 15(2): 329-343 Sasser EW, Olsen PR, Wyckoff DD. 1978. Management of Service Operations: Text, Cases, and Readings. Allyn & Bacon: Boston, MA Scheuing EZ, Johnson EM. 1989. A proposed model for new service development. Journal of Services Marketing 3(2): 25-34 Schmenner RW. 1986. How Can Service Businesses Survive and Prosper? Sloan Management Review 27(3): 21-32 Schmenner RW, Swink ML. 1998. On theory in operations management. Journal of Operations Management 17(1): 97-113 Shieff D, Brodie R. 1995. Customer service mapping: How to make customer satisfaction research deliver actionable results to managers. Australian Journal of Market Research 3(1): 31-37 Shostack GL. 1982. How to Design a Service. European Journal of Marketing 16(1): 49-63 Shostack GL. 1984. Designing services that deliver. Harvard Business Review 62(1): 133-139 Shostack GL. 1987. Service Positioning Through Structural Change. Journal of Marketing 51(1) Silvestro R. 1999. Positioning services along the volume-variety diagonal. International Journal of Operations & Production Management 19(3/4): 399-420 Silvestro R, Fitzgerald L, Johnston R, Voss CA. 1992. Towards a classification of service processes. International Journal of Service Industry Management 3(3): - Slack N, Chambers S, Johnston R. 2004a. Operations management (4th ed.). Prentice Hall Financial Times: Harlow, England Slack N, Lewis M, Bates H. 2004b. The two worlds of operations management research and practice: Can they meet, should they meet? International Journal of Operations & Production Management 24(4): 372-387 Southern G. 1999. A systems approach to performance measurement in hospitality. International Journal of Contemporary Hospitality Management 11(7): 366-376 Stauss B. 2005. A Pyrrhic victory: The implications of an unlimited broadening of the concept of services. Managing Service Quality 15(3): 219-229 Tax SS, Stuart I. 1997. Designing and Implementing New Services: The Challenges of Integrating Service Systems. Journal of Retailing 73(1): 105-134 Tinnilae M, Vepsaelaeinen APJ. 1995. A model for strategic repositioning of service processes. International Journal of Service Industry Management 6(4): 57 - 80

329
Vargo SL, Lusch RF. 2004. The Four Service Marketing Myths: Remnants of a Goods-Based, Manufacturing Model. Journal of Service Research 6(4): 324-335 Verma R. 2000. An empirical analysis of management challenges in service factories, service shops, mass services and professional services. International Journal of Service Industry Management 11(1): 8-25 Verma R, Fitzsimmons J, Heineke J, Davis M. 2002. New issues and opportunities in service design research. Journal of Operations Management 20(2): 117-120 Voss CA. 2003. Rethinking paradigms of service: Service in a virtual environment. International Journal of Operations & Production Management 23(1): 88-104 Walley P, Amin V. 1994. Automation in a Customer Contact Environment. International Journal of Operations & Production Management 14: 86-100 Wemmerloev U. 1990. A Taxonomy for Service Processes and its Implications for System Design. International Journal of Service Industry Management 1(3) Wise R, Baumgartner P. 1999. Go Downstream: The New Profit Imperative in Manufacturing. Harvard Business Review 77(5): 133-141 Zeithaml VA, Bitner MJ, Gremler DD. 2006. Services marketing (4th ed.). McGraw-Hill/Irwin: Boston: Ma Zeithaml VA, Parasuraman A, Berry LL. 1985. Problems and Strategies in Services Marketing. Journal of Marketing 49(2): 33-36 Zomerdijk LG, Vries Jd. 2007. Structuring front office and back office work in service delivery systems. International Journal of Operations & Production Management 27(1): 108-131

333
PUBLICATION 2
Ponsignon, F., Smart A., Maull R.S. (2009), “Towards a Set of Principles for
Process Design in Information-Intensive Service Delivery Systems”, Proceedings of
the European Operations Management Association Conference, Göteborg.
The paper was shortlisted for The Chris Voss Best Paper Award and the authors were subsequently invited to submit a revised manuscript for the IJOPM special issue associated with Euroma 2009. The manuscript is currently under second review.
334
Towards a set of principles for process design in
information-intensive service delivery systems Frederic Ponsignon, Prof Andi Smart, Prof Roger Maull University of Exeter, Centre for Research in Strategic Process and Operations (XSPO)
Abstract This study identifies a set of principles to help to design processes in information-intensive service systems. The findings show that, in order to maximise performance, customised service concepts and high variety in customer inputs necessitate fluid processes while standardised service offerings and low variety in customer inputs require rigid delivery processes. Implications for process design are drawn. Keywords: Service operations, Process design, Information-intensive services
Introduction
The rise and the size of the information-intensive service economy makes it important to focus on information-processing operations (IPO) (Karmarkar and Apte, 2007). A review of the literature reveals that IPO are treated in varying ways. Morris and Johnston (1985) suggest that IPO make up a homogeneous group that is distinct from customer-processing operations (CPO), the focus of traditional SOM research, and material-processing operations (MPO) which dominate in manufacturing environments. For instance, in contrast with CPO, most IPO can be described as separable services and therefore do not always require customer presence in the actual production of the core service activity (Lovelock and Gummesson, 2004). From this perspective, many IPO fall into a category of low customer contact services which are also treated as a homogeneous group in the literature (Verma and Young, 2000). On the other hand, popular service classification schemes provide examples of IPOs that span across the entire spectrum of service systems implying that there are few commonalities among these. This inconsistency of treatment suggests the need for greater investigation into this rapidly-growing type of service systems. A service delivery system comprises multiple, interdependent processes (Johnston and Clark, 2001) which constitute a hierarchically-organised process architecture (Smart et al., 1999). Grounding our understanding of the process concept in systems-thinking, processes are structurally divisible but functionally indivisible (Ackoff, 1980). Service outcomes are created and delivered by a set of processes and sub-processes. Therefore, issues surrounding the design of service systems are inextricably linked to process design choices. The OM literature on process design is dominated by a manufacturing mindset (Hayes and Wheelwright, 1979, Slack et al., 2004) but it is accepted that service operations require a different approach. The service classification schemes developed by Chase (1981), Schmener (1986), and Silvestro et al. (1992) contribute to the articulation of relevant process dimensions that vary according to the type of service operations under study. However, these frameworks suffer from “facility bias” (Tinnilae and Vepsaelaeinen, 1995) that consists of “analysing separate service facilities instead of the whole service process” and a reductionist perspective, which fails to consider the entire set of activities in the end-to-end processes (i.e. processes are divided functionally). We find that the process concept has been used very loosely in the SOM literature. In addition, by focusing on service facilities that are differentiated on the basis of front-office variables (e.g. customer contact) their frameworks miss out on the
335
interconnection of the processes that comprise the service delivery system (Larsson and Bowen, 1989). These weaknesses limit the usefulness of service frameworks for guiding process design. Although recent articles have addressed service design issues, no principles for process design in specific service contexts are available which is highlighted as a gap in the literature (Tax and Stuart, 1997). This article is a step towards filling this gap as it identifies a set of principles to help to design processes in information-intensive service environments. It aims at building theory by addressing the question: what are the appropriate process design characteristics of information-intensive service delivery systems? We integrate existing conceptual frameworks from the SOM literature including the service strategy triad (Roth and Menor, 2003), the Unified Services Theory (UST) (Sampson and Froehle, 2006), and the process rigidity/fluidity approach (Wemmerloev, 1990) to empirically investigate how service delivery processes operate and if they perform well. We then draw implications for process design. The structure of the article is as follows. First, we describe the research design. Second, we discuss research methodology. Third, we describe the data reduction stage. Fourth, we address the research question and discuss the implications of the findings. Finally, we present our conclusions.
Research Design
The research design is strongly determined by the postulate that process characteristics are contingent on the nature of the service concept and of the customer inputs supplied. Consistent with the requirements of contingency research in OM (Sousa and Voss, 2008), we empirically study the relationship between service concept, customer inputs, process characteristics, and performance outcomes to draw implications for process design. It is well established in the SOM literature that the nature of the service concept drives service delivery system design decisions to ensure alignment between the offering and the processes by which it is created and delivered (Roth and Menor, 2003). Different service concepts require different configurations of the service delivery system. Thus, we examine the characteristics of processes delivering selected service concepts with different degrees of customisation. While is it recognised that the volume-variety mix is a key parameter to consider when designing processes, measuring volume and variety in a service context is difficult (Silvestro et al., 1992). We suggest that the UST is an appropriate framework for investigating process from a volume-variety perspective as the UST postulates a relationship between the nature of the customer inputs supplied to the process and the way the process operates. This view is supported by management research that found a link between input uncertainty and complexity in service systems (Buzacott, 2000). Process characteristics are analysed through a rigidity-fluidity lens (Wemmerloev, 1990). Seminal work on process architecture by Weaver et al. (1995) informed the identification of the processes to study. We deviate from the original model as evidence found in the case study suggested that “support product/service” activities were an integral part of the “fulfil order” (e.g. deliver service) process. Thus, in this research a service system comprises two end-to-end processes: “sell service” and “deliver service”. We assess the appropriateness of process characteristics observed with respect to different service concepts and volume-variety mix of customer inputs by analysing the performance of the service delivery system as a whole. The research framework used to address the research question is illustrated below:
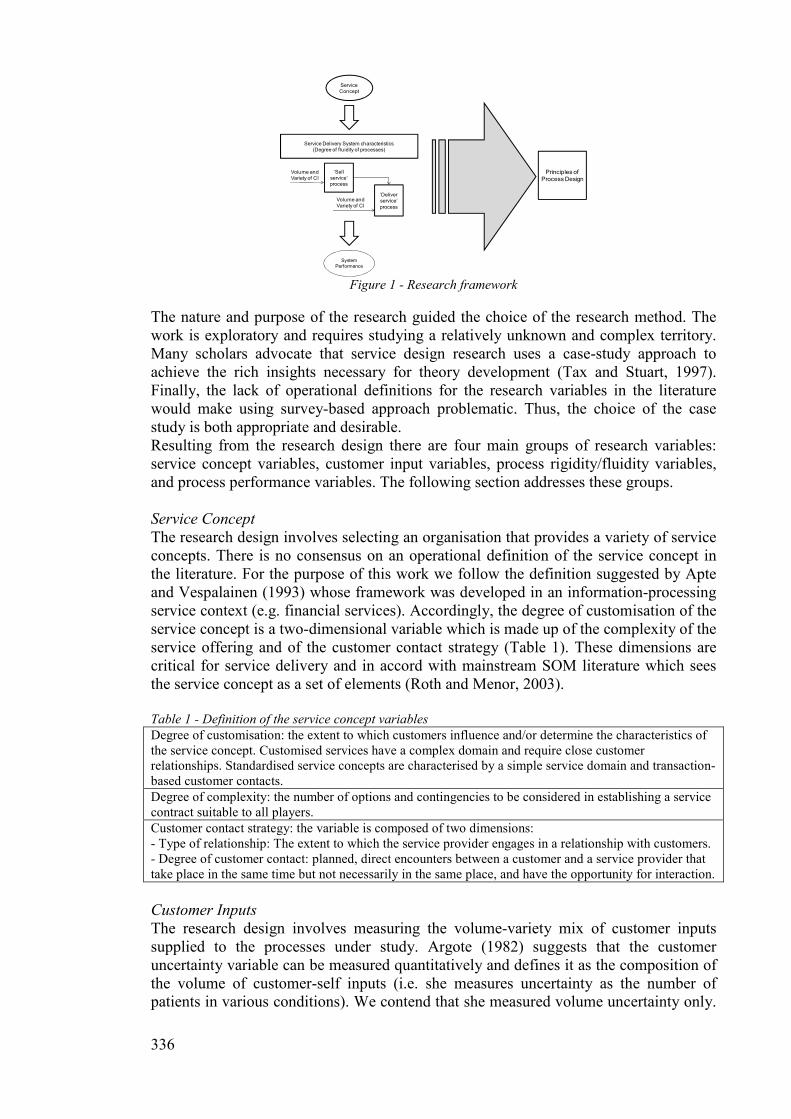
336
Service
Concept
Service Delivery System characteristics
(Degree of fluidity of processes)
‘Sell
service’
process
‘Deliver
service’
process
Volume and
Variety of CI
Volume and
Variety of CI
System
Performance
Principles of Process Design
Figure 1 - Research framework
The nature and purpose of the research guided the choice of the research method. The work is exploratory and requires studying a relatively unknown and complex territory. Many scholars advocate that service design research uses a case-study approach to achieve the rich insights necessary for theory development (Tax and Stuart, 1997). Finally, the lack of operational definitions for the research variables in the literature would make using survey-based approach problematic. Thus, the choice of the case study is both appropriate and desirable. Resulting from the research design there are four main groups of research variables: service concept variables, customer input variables, process rigidity/fluidity variables, and process performance variables. The following section addresses these groups. Service Concept
The research design involves selecting an organisation that provides a variety of service concepts. There is no consensus on an operational definition of the service concept in the literature. For the purpose of this work we follow the definition suggested by Apte and Vespalainen (1993) whose framework was developed in an information-processing service context (e.g. financial services). Accordingly, the degree of customisation of the service concept is a two-dimensional variable which is made up of the complexity of the service offering and of the customer contact strategy (Table 1). These dimensions are critical for service delivery and in accord with mainstream SOM literature which sees the service concept as a set of elements (Roth and Menor, 2003). Table 1 - Definition of the service concept variables
Degree of customisation: the extent to which customers influence and/or determine the characteristics of the service concept. Customised services have a complex domain and require close customer relationships. Standardised service concepts are characterised by a simple service domain and transaction-based customer contacts.
Degree of complexity: the number of options and contingencies to be considered in establishing a service contract suitable to all players.
Customer contact strategy: the variable is composed of two dimensions: - Type of relationship: The extent to which the service provider engages in a relationship with customers. - Degree of customer contact: planned, direct encounters between a customer and a service provider that take place in the same time but not necessarily in the same place, and have the opportunity for interaction.
Customer Inputs
The research design involves measuring the volume-variety mix of customer inputs supplied to the processes under study. Argote (1982) suggests that the customer uncertainty variable can be measured quantitatively and defines it as the composition of the volume of customer-self inputs (i.e. she measures uncertainty as the number of patients in various conditions). We contend that she measured volume uncertainty only.
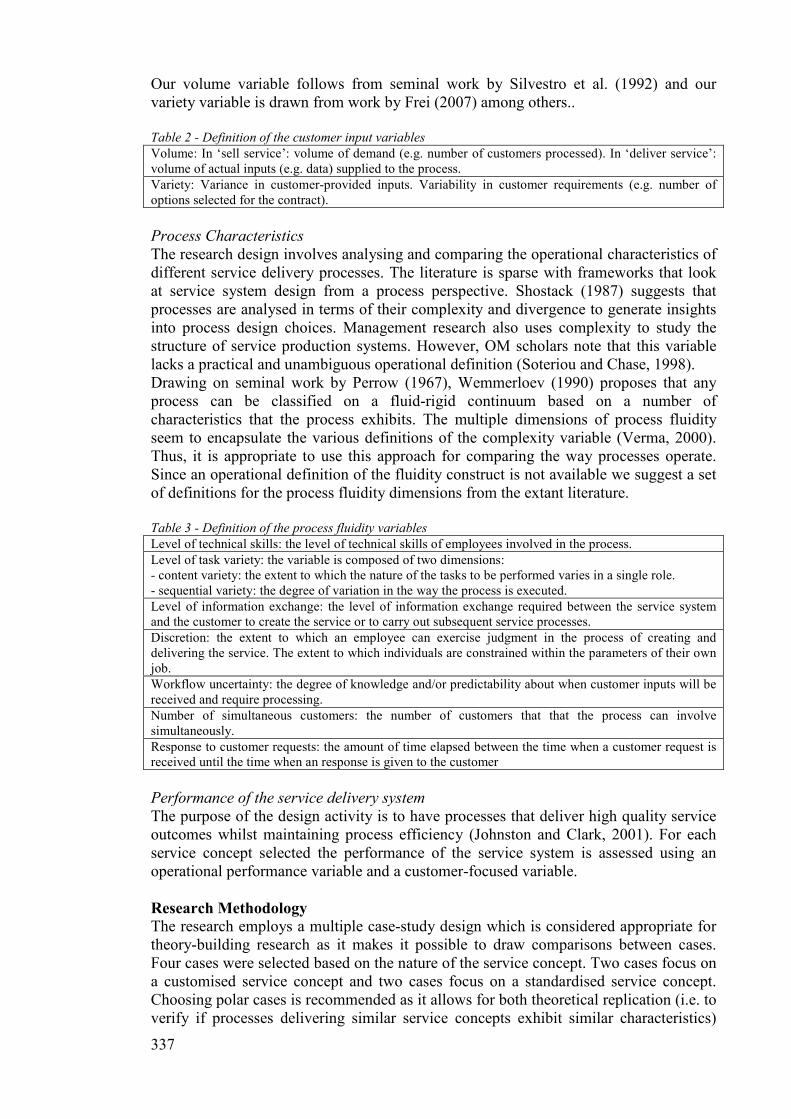
337
Our volume variable follows from seminal work by Silvestro et al. (1992) and our variety variable is drawn from work by Frei (2007) among others.. Table 2 - Definition of the customer input variables
Volume: In ‘sell service’: volume of demand (e.g. number of customers processed). In ‘deliver service’: volume of actual inputs (e.g. data) supplied to the process.
Variety: Variance in customer-provided inputs. Variability in customer requirements (e.g. number of options selected for the contract).
Process Characteristics
The research design involves analysing and comparing the operational characteristics of different service delivery processes. The literature is sparse with frameworks that look at service system design from a process perspective. Shostack (1987) suggests that processes are analysed in terms of their complexity and divergence to generate insights into process design choices. Management research also uses complexity to study the structure of service production systems. However, OM scholars note that this variable lacks a practical and unambiguous operational definition (Soteriou and Chase, 1998). Drawing on seminal work by Perrow (1967), Wemmerloev (1990) proposes that any process can be classified on a fluid-rigid continuum based on a number of characteristics that the process exhibits. The multiple dimensions of process fluidity seem to encapsulate the various definitions of the complexity variable (Verma, 2000). Thus, it is appropriate to use this approach for comparing the way processes operate. Since an operational definition of the fluidity construct is not available we suggest a set of definitions for the process fluidity dimensions from the extant literature. Table 3 - Definition of the process fluidity variables
Level of technical skills: the level of technical skills of employees involved in the process.
Level of task variety: the variable is composed of two dimensions: - content variety: the extent to which the nature of the tasks to be performed varies in a single role. - sequential variety: the degree of variation in the way the process is executed.
Level of information exchange: the level of information exchange required between the service system and the customer to create the service or to carry out subsequent service processes.
Discretion: the extent to which an employee can exercise judgment in the process of creating and delivering the service. The extent to which individuals are constrained within the parameters of their own job.
Workflow uncertainty: the degree of knowledge and/or predictability about when customer inputs will be received and require processing.
Number of simultaneous customers: the number of customers that that the process can involve simultaneously.
Response to customer requests: the amount of time elapsed between the time when a customer request is received until the time when an response is given to the customer
Performance of the service delivery system
The purpose of the design activity is to have processes that deliver high quality service outcomes whilst maintaining process efficiency (Johnston and Clark, 2001). For each service concept selected the performance of the service system is assessed using an operational performance variable and a customer-focused variable.
Research Methodology
The research employs a multiple case-study design which is considered appropriate for theory-building research as it makes it possible to draw comparisons between cases. Four cases were selected based on the nature of the service concept. Two cases focus on a customised service concept and two cases focus on a standardised service concept. Choosing polar cases is recommended as it allows for both theoretical replication (i.e. to verify if processes delivering similar service concepts exhibit similar characteristics)
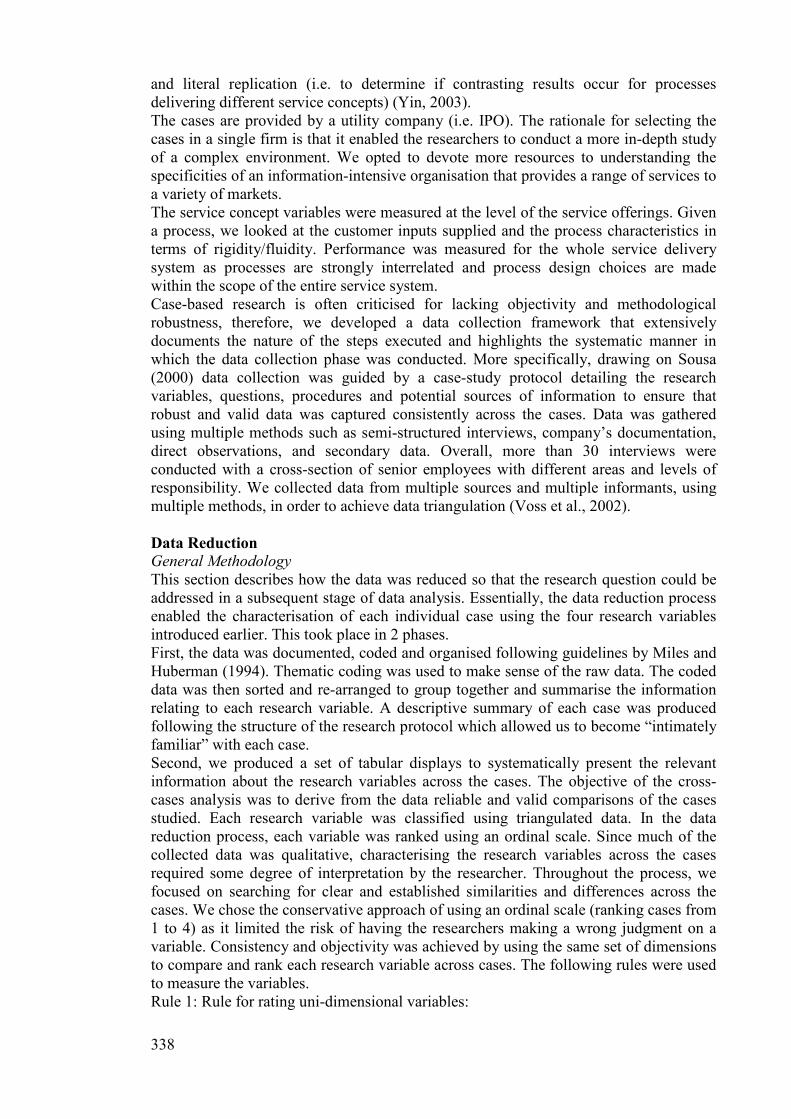
338
and literal replication (i.e. to determine if contrasting results occur for processes delivering different service concepts) (Yin, 2003). The cases are provided by a utility company (i.e. IPO). The rationale for selecting the cases in a single firm is that it enabled the researchers to conduct a more in-depth study of a complex environment. We opted to devote more resources to understanding the specificities of an information-intensive organisation that provides a range of services to a variety of markets. The service concept variables were measured at the level of the service offerings. Given a process, we looked at the customer inputs supplied and the process characteristics in terms of rigidity/fluidity. Performance was measured for the whole service delivery system as processes are strongly interrelated and process design choices are made within the scope of the entire service system. Case-based research is often criticised for lacking objectivity and methodological robustness, therefore, we developed a data collection framework that extensively documents the nature of the steps executed and highlights the systematic manner in which the data collection phase was conducted. More specifically, drawing on Sousa (2000) data collection was guided by a case-study protocol detailing the research variables, questions, procedures and potential sources of information to ensure that robust and valid data was captured consistently across the cases. Data was gathered using multiple methods such as semi-structured interviews, company’s documentation, direct observations, and secondary data. Overall, more than 30 interviews were conducted with a cross-section of senior employees with different areas and levels of responsibility. We collected data from multiple sources and multiple informants, using multiple methods, in order to achieve data triangulation (Voss et al., 2002).
Data Reduction
General Methodology
This section describes how the data was reduced so that the research question could be addressed in a subsequent stage of data analysis. Essentially, the data reduction process enabled the characterisation of each individual case using the four research variables introduced earlier. This took place in 2 phases. First, the data was documented, coded and organised following guidelines by Miles and Huberman (1994). Thematic coding was used to make sense of the raw data. The coded data was then sorted and re-arranged to group together and summarise the information relating to each research variable. A descriptive summary of each case was produced following the structure of the research protocol which allowed us to become “intimately familiar” with each case. Second, we produced a set of tabular displays to systematically present the relevant information about the research variables across the cases. The objective of the cross-cases analysis was to derive from the data reliable and valid comparisons of the cases studied. Each research variable was classified using triangulated data. In the data reduction process, each variable was ranked using an ordinal scale. Since much of the collected data was qualitative, characterising the research variables across the cases required some degree of interpretation by the researcher. Throughout the process, we focused on searching for clear and established similarities and differences across the cases. We chose the conservative approach of using an ordinal scale (ranking cases from 1 to 4) as it limited the risk of having the researchers making a wrong judgment on a variable. Consistency and objectivity was achieved by using the same set of dimensions to compare and rank each research variable across cases. The following rules were used to measure the variables. Rule 1: Rule for rating uni-dimensional variables:
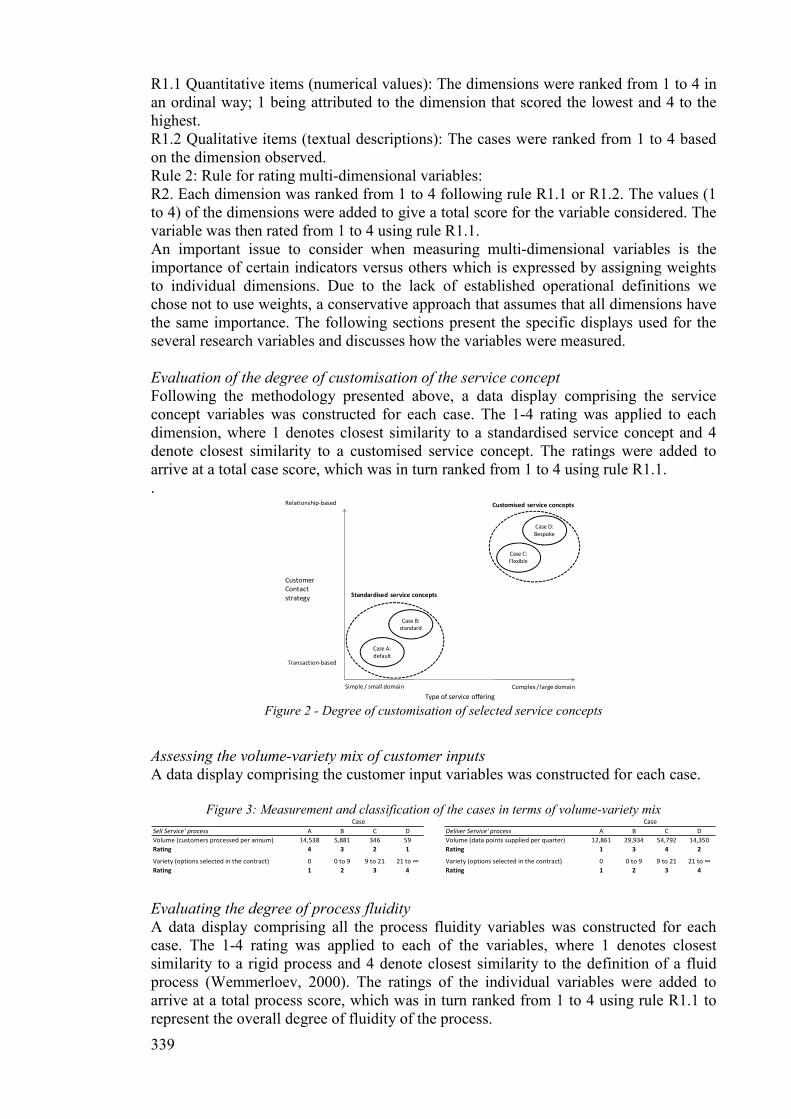
339
R1.1 Quantitative items (numerical values): The dimensions were ranked from 1 to 4 in an ordinal way; 1 being attributed to the dimension that scored the lowest and 4 to the highest. R1.2 Qualitative items (textual descriptions): The cases were ranked from 1 to 4 based on the dimension observed. Rule 2: Rule for rating multi-dimensional variables: R2. Each dimension was ranked from 1 to 4 following rule R1.1 or R1.2. The values (1 to 4) of the dimensions were added to give a total score for the variable considered. The variable was then rated from 1 to 4 using rule R1.1. An important issue to consider when measuring multi-dimensional variables is the importance of certain indicators versus others which is expressed by assigning weights to individual dimensions. Due to the lack of established operational definitions we chose not to use weights, a conservative approach that assumes that all dimensions have the same importance. The following sections present the specific displays used for the several research variables and discusses how the variables were measured. Evaluation of the degree of customisation of the service concept
Following the methodology presented above, a data display comprising the service concept variables was constructed for each case. The 1-4 rating was applied to each dimension, where 1 denotes closest similarity to a standardised service concept and 4 denote closest similarity to a customised service concept. The ratings were added to arrive at a total case score, which was in turn ranked from 1 to 4 using rule R1.1. .
Simple / small domain Complex / large domain
Customer
Contact
strategy
Relationship-based
Transaction-based
Type of service offering
Case A:
default
Case B:
standard
Case C:
Flexible
Case D:
Bespoke
Customised service concepts
Standardised service concepts
Figure 2 - Degree of customisation of selected service concepts
Assessing the volume-variety mix of customer inputs
A data display comprising the customer input variables was constructed for each case.
Figure 3: Measurement and classification of the cases in terms of volume-variety mix
Sell Service' process A B C D Deliver Service' process A B C D
Volume (customers processed per annum) 14,538 5,881 346 59 Volume (data points supplied per quarter) 12,861 29,934 54,792 14,350
Rating 4 3 2 1 Rating 1 3 4 2 Variety (options selected in the contract) 0 0 to 9 9 to 21 21 to ∞ Variety (options selected in the contract) 0 0 to 9 9 to 21 21 to ∞
Rating 1 2 3 4 Rating 1 2 3 4
Case Case
Evaluating the degree of process fluidity
A data display comprising all the process fluidity variables was constructed for each case. The 1-4 rating was applied to each of the variables, where 1 denotes closest similarity to a rigid process and 4 denote closest similarity to the definition of a fluid process (Wemmerloev, 2000). The ratings of the individual variables were added to arrive at a total process score, which was in turn ranked from 1 to 4 using rule R1.1 to represent the overall degree of fluidity of the process.
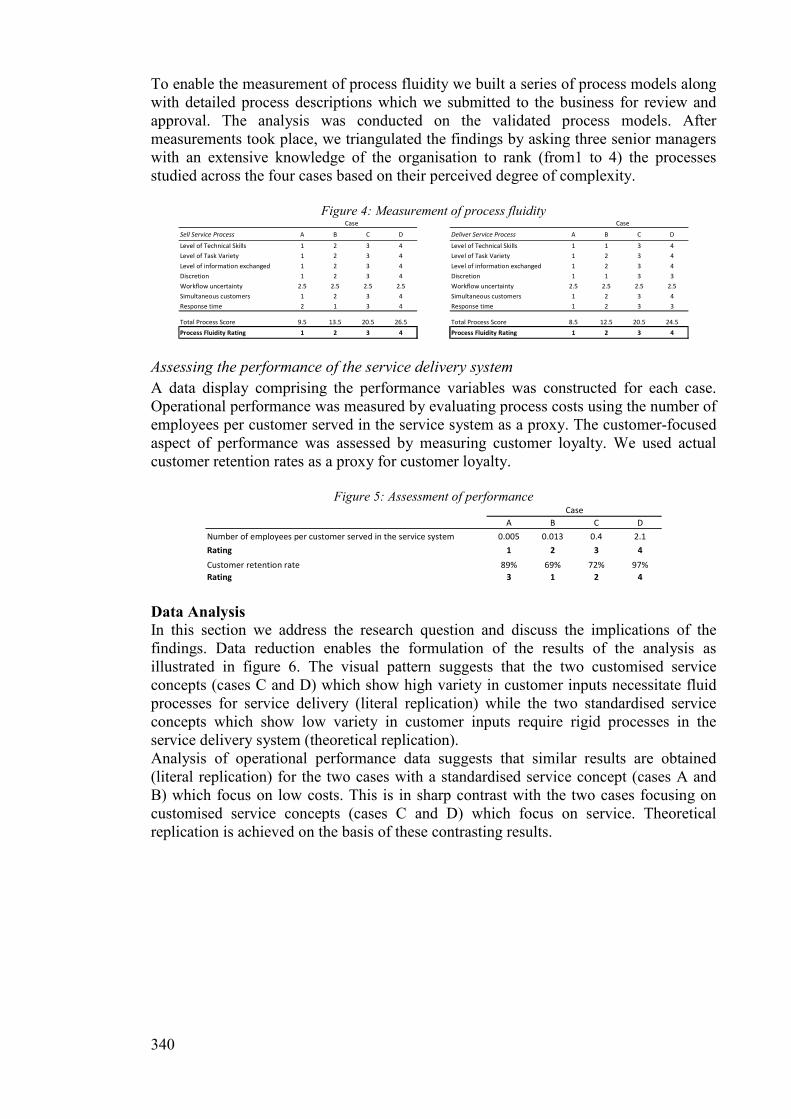
340
To enable the measurement of process fluidity we built a series of process models along with detailed process descriptions which we submitted to the business for review and approval. The analysis was conducted on the validated process models. After measurements took place, we triangulated the findings by asking three senior managers with an extensive knowledge of the organisation to rank (from1 to 4) the processes studied across the four cases based on their perceived degree of complexity.
Figure 4: Measurement of process fluidity
Sell Service Process A B C D Deliver Service Process A B C D
Level of Technical Skills 1 2 3 4 Level of Technical Skills 1 1 3 4
Level of Task Variety 1 2 3 4 Level of Task Variety 1 2 3 4
Level of information exchanged 1 2 3 4 Level of information exchanged 1 2 3 4
Discretion 1 2 3 4 Discretion 1 1 3 3
Workflow uncertainty 2.5 2.5 2.5 2.5 Workflow uncertainty 2.5 2.5 2.5 2.5
Simultaneous customers 1 2 3 4 Simultaneous customers 1 2 3 4
Response time 2 1 3 4 Response time 1 2 3 3
Total Process Score 9.5 13.5 20.5 26.5 Total Process Score 8.5 12.5 20.5 24.5
Process Fluidity Rating 1 2 3 4 Process Fluidity Rating 1 2 3 4
Case Case
Assessing the performance of the service delivery system
A data display comprising the performance variables was constructed for each case. Operational performance was measured by evaluating process costs using the number of employees per customer served in the service system as a proxy. The customer-focused aspect of performance was assessed by measuring customer loyalty. We used actual customer retention rates as a proxy for customer loyalty.
Figure 5: Assessment of performance
A B C D
Number of employees per customer served in the service system 0.005 0.013 0.4 2.1
Rating 1 2 3 4 Customer retention rate 89% 69% 72% 97%
Rating 3 1 2 4
Case
Data Analysis
In this section we address the research question and discuss the implications of the findings. Data reduction enables the formulation of the results of the analysis as illustrated in figure 6. The visual pattern suggests that the two customised service concepts (cases C and D) which show high variety in customer inputs necessitate fluid processes for service delivery (literal replication) while the two standardised service concepts which show low variety in customer inputs require rigid processes in the service delivery system (theoretical replication). Analysis of operational performance data suggests that similar results are obtained (literal replication) for the two cases with a standardised service concept (cases A and B) which focus on low costs. This is in sharp contrast with the two cases focusing on customised service concepts (cases C and D) which focus on service. Theoretical replication is achieved on the basis of these contrasting results.
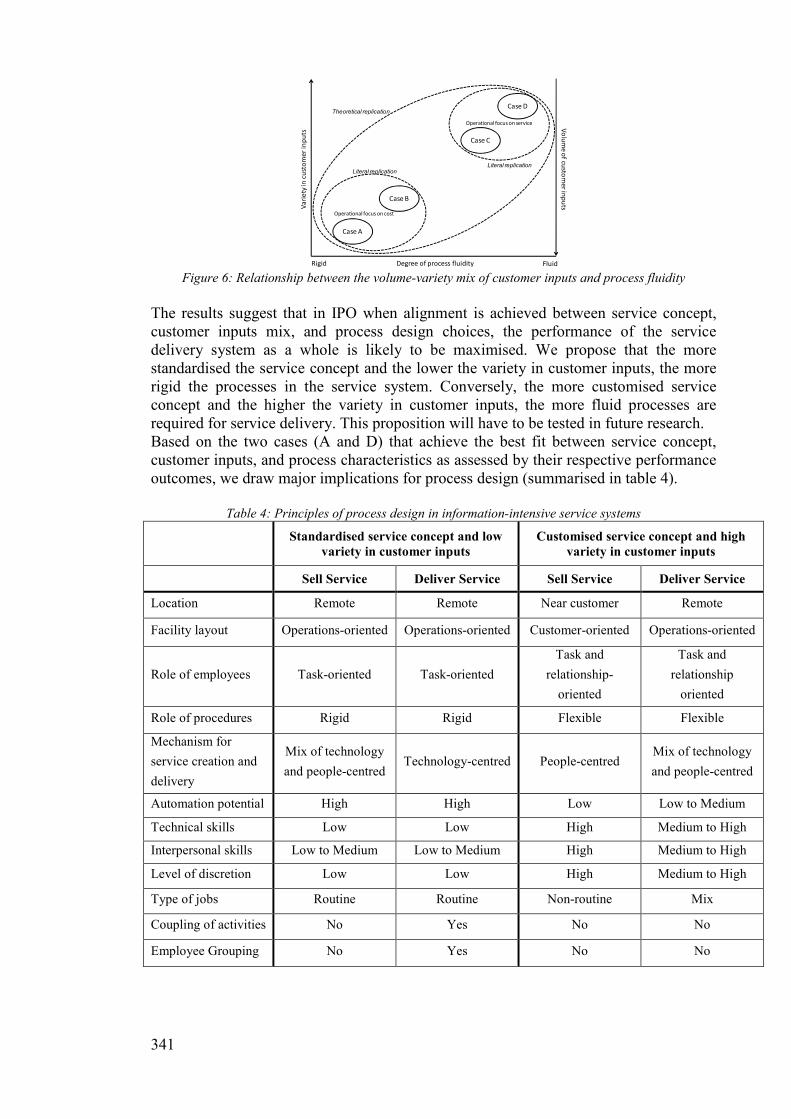
341
Rigid Fluid
Va
rie
ty in
cu
sto
me
r in
pu
ts
Degree of process fluidity
Case A
Case B
Case C
Case D
Operational focus on service
Operational focus on cost
Literal replicationLiteral replication
Theoretical replication
Vo
lum
e o
f custo
me
r inp
uts
Figure 6: Relationship between the volume-variety mix of customer inputs and process fluidity
The results suggest that in IPO when alignment is achieved between service concept, customer inputs mix, and process design choices, the performance of the service delivery system as a whole is likely to be maximised. We propose that the more standardised the service concept and the lower the variety in customer inputs, the more rigid the processes in the service system. Conversely, the more customised service concept and the higher the variety in customer inputs, the more fluid processes are required for service delivery. This proposition will have to be tested in future research. Based on the two cases (A and D) that achieve the best fit between service concept, customer inputs, and process characteristics as assessed by their respective performance outcomes, we draw major implications for process design (summarised in table 4).
Table 4: Principles of process design in information-intensive service systems
Standardised service concept and low
variety in customer inputs
Customised service concept and high
variety in customer inputs
Sell Service Deliver Service Sell Service Deliver Service
Location Remote Remote Near customer Remote
Facility layout Operations-oriented Operations-oriented Customer-oriented Operations-oriented
Role of employees Task-oriented Task-oriented
Task and
relationship-
oriented
Task and
relationship
oriented
Role of procedures Rigid Rigid Flexible Flexible
Mechanism for
service creation and
delivery
Mix of technology
and people-centred Technology-centred People-centred
Mix of technology
and people-centred
Automation potential High High Low Low to Medium
Technical skills Low Low High Medium to High
Interpersonal skills Low to Medium Low to Medium High Medium to High
Level of discretion Low Low High Medium to High
Type of jobs Routine Routine Non-routine Mix
Coupling of activities No Yes No No
Employee Grouping No Yes No No
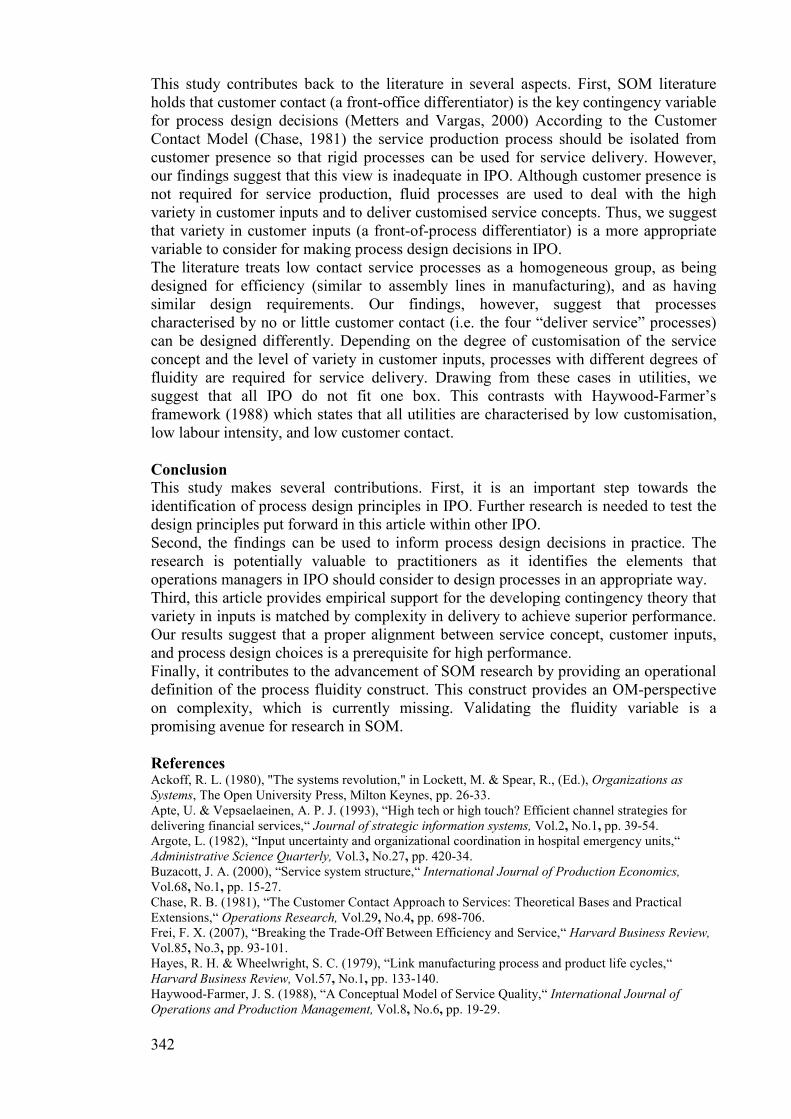
342
This study contributes back to the literature in several aspects. First, SOM literature holds that customer contact (a front-office differentiator) is the key contingency variable for process design decisions (Metters and Vargas, 2000) According to the Customer Contact Model (Chase, 1981) the service production process should be isolated from customer presence so that rigid processes can be used for service delivery. However, our findings suggest that this view is inadequate in IPO. Although customer presence is not required for service production, fluid processes are used to deal with the high variety in customer inputs and to deliver customised service concepts. Thus, we suggest that variety in customer inputs (a front-of-process differentiator) is a more appropriate variable to consider for making process design decisions in IPO. The literature treats low contact service processes as a homogeneous group, as being designed for efficiency (similar to assembly lines in manufacturing), and as having similar design requirements. Our findings, however, suggest that processes characterised by no or little customer contact (i.e. the four “deliver service” processes) can be designed differently. Depending on the degree of customisation of the service concept and the level of variety in customer inputs, processes with different degrees of fluidity are required for service delivery. Drawing from these cases in utilities, we suggest that all IPO do not fit one box. This contrasts with Haywood-Farmer’s framework (1988) which states that all utilities are characterised by low customisation, low labour intensity, and low customer contact.
Conclusion This study makes several contributions. First, it is an important step towards the identification of process design principles in IPO. Further research is needed to test the design principles put forward in this article within other IPO. Second, the findings can be used to inform process design decisions in practice. The research is potentially valuable to practitioners as it identifies the elements that operations managers in IPO should consider to design processes in an appropriate way. Third, this article provides empirical support for the developing contingency theory that variety in inputs is matched by complexity in delivery to achieve superior performance. Our results suggest that a proper alignment between service concept, customer inputs, and process design choices is a prerequisite for high performance. Finally, it contributes to the advancement of SOM research by providing an operational definition of the process fluidity construct. This construct provides an OM-perspective on complexity, which is currently missing. Validating the fluidity variable is a promising avenue for research in SOM.
References Ackoff, R. L. (1980), "The systems revolution," in Lockett, M. & Spear, R., (Ed.), Organizations as Systems, The Open University Press, Milton Keynes, pp. 26-33. Apte, U. & Vepsaelaeinen, A. P. J. (1993), “High tech or high touch? Efficient channel strategies for delivering financial services,“ Journal of strategic information systems, Vol.2, No.1, pp. 39-54. Argote, L. (1982), “Input uncertainty and organizational coordination in hospital emergency units,“ Administrative Science Quarterly, Vol.3, No.27, pp. 420-34. Buzacott, J. A. (2000), “Service system structure,“ International Journal of Production Economics, Vol.68, No.1, pp. 15-27. Chase, R. B. (1981), “The Customer Contact Approach to Services: Theoretical Bases and Practical Extensions,“ Operations Research, Vol.29, No.4, pp. 698-706. Frei, F. X. (2007), “Breaking the Trade-Off Between Efficiency and Service,“ Harvard Business Review, Vol.85, No.3, pp. 93-101. Hayes, R. H. & Wheelwright, S. C. (1979), “Link manufacturing process and product life cycles,“ Harvard Business Review, Vol.57, No.1, pp. 133-140. Haywood-Farmer, J. S. (1988), “A Conceptual Model of Service Quality,“ International Journal of Operations and Production Management, Vol.8, No.6, pp. 19-29.

343
Johnston, B. & Morris, B. (1985), “Monitoring and Control in Service Operations,“ International Journal of Operations & Production Management, Vol.5, No.1, pp. 32-38. Johnston, R. & Clark, G. (2001), Service Operations Management, FT Prentice Hall, Harlow, England. Karmarkar, U. S. & Apte, U. M. (2007), “Operations management in the information economy: Information products, processes, and chains,“ Journal of Operations Management, Vol.25, No.2, pp. 438-53. Larsson, R. & Bowen, D. E. (1989), “Organization and Customer: Managing Design and Coordination of Services,“ The Academy of Management Review, Vol.14, No.2, pp. 213-233. Lovelock, C. & Gummesson, E. (2004), “Whither Services Marketing?: In Search of a New Paradigm and Fresh Perspectives,“ Journal of Service Research, Vol.7, No.1, pp. 20-41. Metters, R. & Vargas, V. (2000), “A typology of de-coupling strategies in mixed services,“ Journal of Operations Management, Vol.18, No.6, pp. 663-682. Perrow, C. (1967), “A Framework for the Comparative Analysis of Organizations,“ American Sociological Review, Vol.32, No.2, pp. 194-208. Roth, A. V. & Menor, L. J. (2003), “Insights into service operations management: a research agenda,“ Production & Operations Management, Vol.12, No.2, pp. 145-164. Sampson, S. E. & Froehle, C. M. (2006), “Foundations and Implications of a Proposed Unified Services Theory,“ Production & Operations Management, Vol.15, No.2, pp. 329-343. Schmenner, R. W. (1986), “How Can Service Businesses Survive and Prosper?,“ Sloan Management Review, Vol.27, No.3, pp. 21-32. Shostack, G. L. (1987), “Service Positioning Through Structural Change,“ Journal of Marketing, Vol.51, No.1, pp. 34-43. Silvestro, R., Fitzgerald, L., Johnston, R. & Voss, C. A. (1992), “Towards a classification of service processes,“ International Journal of Service Industry Management, Vol.3, No.3, pp. 62-75. Slack, N., Chambers, S. & Johnston, R. (2004), Operations management, FT Prentice Hall Harlow, England. Smart, P. A., Maull, R. S. & Childe, S. J. (1999), “A reference model of 'operate' processes for process-based change,“ International Journal of Computer Integrated Manufacturing, Vol.12, No.6, pp. 471-82. Soteriou, A. C. & Chase, R. B. (1998), “Linking the customer contact model to service quality,“ Journal of Operations Management, Vol.16, No.4, pp. 495-508. Sousa, R. (2000), Quality Management Practice: Universal or Context Dependent?, Unpublished PhD thesis, London Business School, London, UK. Sousa, R. & Voss, C. A. (2008), “Contingency research in operations management practices,“ Journal of Operations Management, Vol.26, No.6, pp. 697-713. Tax, S. S. & Stuart, I. (1997), “Designing and Implementing New Services: The Challenges of Integrating Service Systems,“ Journal of Retailing, Vol.73, No.1, pp. 105-134. Tinnilae, M. & Vepsaelaeinen, A. P. J. (1995), “A model for strategic repositioning of service processes,“ International Journal of Service Industry Management, Vol.6, No.4, pp. 57-80. Verma, R. (2000), “An empirical analysis of management challenges in service factories, service shops, mass services and professional services,“ International Journal of Service Industry Management, Vol.11, No.1, pp. 8-25. Verma, R. & Young, S. T. (2000), “Configurations of low-contact services,“ Journal of Operations Management, Vol.18, No.6, pp. 643-61. Voss, C., Tsikriktsis, N. & Frohlich, M. (2002), “Case research in operations management,“ International Journal of Operations & Production Management, Vol.22, No.2, pp. 195-219. Weaver, A. M., Maull, R. S., Childe, S. J., Smart, P. A. & Bennett, J. (1995) The development and application of a generic "order fulfilment" process model. 3rd International Conference on Computer Integrated Manufacturing. Singapore. Wemmerloev, U. (1990), “A Taxonomy for Service Processes and its Implications for System Design,“ International Journal of Service Industry Management, Vol.1, No.3, pp. 20-40. Yin, R. K. (2003), Case study research: design and methods, Sage Publications, Thousand Oaks: CA.