PROJECT DESIGN DOCUMENT (PDD) - CDM Loan...
84
UNFCCC/CCNUCC CDM – Executive Board Page 1 PROJECT DESIGN DOCUMENT FORM FOR SMALL-SCALE CDM PROJECT ACTIVITIES (F-CDM-SSC-PDD) Version 04.0 PROJECT DESIGN DOCUMENT (PDD) Title of the project activity Autoclaved Aerated Concrete blocks/panel manufacturing unit based on an energy efficient brick manufacturing technology Version number of the PDD 04 Completion date of the PDD 20/12/2012 Project participant(s) M/s UAL INDUSTRIES LTD Host Party(ies) India Sectoral scope(s) and selected methodology(ies) Sectoral Scope: 04 -Manufacturing Industries Methodology: AMS III.Z. - “Fuel switch, process improvement and energy efficiency in brick manufacture” Version 4.0 Estimated amount of annual average GHG emission reductions 40619 tCO 2 e per annum (approximate)
Transcript of PROJECT DESIGN DOCUMENT (PDD) - CDM Loan...

UNFCCC/CCNUCC
CDM – Executive Board Page 1
PROJECT DESIGN DOCUMENT FORM
FOR SMALL-SCALE CDM PROJECT ACTIVITIES (F-CDM-SSC-PDD)
Version 04.0
PROJECT DESIGN DOCUMENT (PDD)
Title of the project activity Autoclaved Aerated Concrete blocks/panel
manufacturing unit based on an energy efficient
brick manufacturing technology
Version number of the PDD 04
Completion date of the PDD 20/12/2012
Project participant(s) M/s UAL INDUSTRIES LTD
Host Party(ies) India
Sectoral scope(s) and selected methodology(ies) Sectoral Scope: 04 -Manufacturing Industries
Methodology: AMS III.Z. - “Fuel switch,
process improvement and energy efficiency in
brick manufacture” Version 4.0
Estimated amount of annual average GHG
emission reductions
40619 tCO2e per annum (approximate)

UNFCCC/CCNUCC
CDM – Executive Board Page 2
SECTION A. Description of project activity
A.1. Purpose and general description of project activity
>>
M/s UAL INDUSTRIES LTD1
proposes to undertake the project activity at its new unit UAL-
KON_CRETE, which entails manufacturing of the Autoclaved Aerated Concrete (hereafter referred to as
AAC) blocks and panels with an energy efficient brick manufacturing technology supplied by HESS,
Netherland.
The prime objective of the project activity is to produce a high-quality, load-bearing and well insulating
building material by adopting an efficient low energy intensive brick production process instead of a high
energy intensive brick production process like Clay Brick Bull‟s trench kilns (BTKs) and positively
impact the energy consumption pattern both at the brick production level and at the building operation
level.
While attaining the prime objective the project activity will also
(1) Reduce GHG emissions associated to energy consumption (both fossil fuel and electricity) in the high
energy intensive BTKs by an energy efficient brick making technology.
(2) Reduce air pollution by introducing robust air treatment facilities in the project activity; the clay brick
kiln technology is adopted by an unorganized sector with very poor air treatment facilities; and
(3) Enhance the use of fly ash, an industrial -waste, as an ingredient of building material.
The project activity entails production of AAC blocks, which is a steam-cured mix of sand or pulverized
fuel ash (PFA), cement, lime, anhydrite (gypsum) and an aeration agent. The high-pressure steam-curing
in autoclaves achieves a physically and chemically stable and light weight product, comprising myriads of
tiny non-connecting air bubbles which give AAC its diverse qualities and makes it such an excellent
insulating material.
Production process of AAC blocks does not involve sintering or kiln heating for blocks consolidation and
thus completely eliminates the burning of fossil fuels as required in the clay brick production by adopting
the green waste mixing technology in PFA slurry process, ultimately contributing to the reduction of
greenhouse gas emissions. The core of this technology is the AAC blocks composition and its chemistry,
with fly ash from thermal plants mixed with lime and gypsum, which enable the blocks to acquire the
mechanical properties required during the hydration and curing process without being sintered.
The production process consists of the following steps:
1. Dosing and mixing of fly ash with lime, Ordinary Portland Cement (OPC), stabilisers and
gypsum at a high dosing speed at very high accuracy. 2. Casting and rising/pre curing of the mixture to enable the fresh mix to rise and harden to a firm
green cake with the volume of the mould.
3. Tilting mould cakes with the tilt manipulator on to a cutter machine and oiling to prevent the
sticking of the green cakes for reuse.
4. Horizontal and cross cutting the cakes by cutter which are equipped with broken-wire-detection
system.
5. Milling and back tilting onto a cooking frame.
6. Green separation of cut cakes by passing through the green separator to avoid sticking of cut
layers during autoclaving and eliminating further mechanical separation in white state.
7. Curing with a steam at pressure of approximately 12 Bar in autoclave system for 12 hrs period.
8. A post autoclaving, after buffering and de-stacking of hardened cakes from the cooking frames to
the packaging line for final packaging.
1 www.ualindia.com
2 Due to its high insulating properties it would reduce the building‟s heat load thereby affecting the air
conditioning related energy consumption patterns
UNFCCC/CCNUCC
CDM – Executive Board Page 3
The machines will be supplied by HESS, Netherland. These types of machines require electricity and/or
fuel oil as fuels for their steam generation and operation.2 The consumption of such forms of energy
(electricity and/or Fuel oil in high efficiency boilers) however is much lower compared to the thermal
energy consumed for production of burnt clay bricks. AAC block technology needs cement and lime as
process inputs, which are sources of emissions during their production. However, such emissions are
negligible when compared to the emissions from baseline activity, thereby leading to emission reductions.
The project activity description provided above is a summary of the details provided to UAL Industries
Ltd by the technology provider HESS AAC Systems BV in their proposal and contract.
The scenario existing prior to the implementation of the project activity and the baseline scenario:
This is a green field project. Presently there is no AAC block/brick manufacturing facility in the project
location. The fly ash is dumped in the open and disposed of without using them at Kolaghat Thermal
Power Station. The following reference Indian Journal for spatial science - Link:
http://www.etravers.net/Art_010.pdf provides further information on flyash disposal practices at KTPS.
Clay brick manufacturing, an alternative brick manufacturing technology and the baseline scenario as
identified in section B.4 below involves two key processes: (a) producing green bricks and (b)
sintering/firing the green bricks in a kiln. The sintering process requires huge amount of thermal energy
inputs which is sourced majorly from the fossil fuel-coal combustion with a small quantum from
combustion of biomass in the form of fuel wood. Production of AAC blocks and panels does not require
any sintering process as the project activity eliminates the burning of fossil fuel as required in the clay
brick production.So the amount of such energy, which is required in the project activity scenario, is much
lower than the thermal energy required in clay brick manufacturing process. Therefore, the project
activity enables total energy reduction and its associated GHG reduction due to change in brick
production process. It may be worthwhile to note that there will be some emissions associated to
production of raw materials (cement and lime) used in the project activity, which will be accounted for as
leakages to project activity.
Annual emission reductions over the chosen crediting period for the 1st year of operation would be 20367
tCO2 and thereafter emission reductions for 2nd
year and 3rd
year onwards would be 41864 tCO2 and
42996 tCO2 .Annual average emission reductions over 10 years crediting period would be 40619 tCO2.
Contribution to sustainable development
The project activity contributes to sustainable development and mitigation of climate change through the
following:
Environmental Benefits:
Reduction of energy resources consumption: Since there is no sintering or cooking in the project activity,
this technology is more efficient in terms of energy consumption and results in lower energy consumption
than the clay brick manufacturing.
Reduction of fossil fuels consumption: Clay brick manufacturing process are fossil fuel based
technologies, especially coal, in India. With the implementation of the proposed project activity,
consumption of fossil fuels for building material manufacturing will be avoided, thus contributing to
reduce GHG emissions.
Utilisation of a waste materials from other industries as raw materials: The raw materials used in the
project activity are mostly (to the extent of 67%) waste materials or by products from other industries.
Pulverized fuel ash (PFA), is a waste that creates both problems regarding its disposal and environmental
degradation due to its potential to pollute both air and water. Indian coals have very high ash content to
the tune of 25 and 45%. However, coal with an ash content of around 40% is predominantly used in India
for thermal power generation. As a consequence, a huge amount of fly ash is generated in thermal power
plants, causing several disposal-related problems.
According to the Annual Report 2010-11 from the Ministry of Environmental and Forests of India, the
annual generation of fly ash is expected to be around One hundred seventy five million tonnes by the end
2 Annex II of HESS contract signed between UAL Industries limited and HESS AAC system.
UNFCCC/CCNUCC
CDM – Executive Board Page 4
of the XIth five year plan period, two hundred twenty five million tonnes by end of XII
th five year plan
period around five hundred million tonnes3.With this alternative use of fly ash, the problem of the
management of this waste will be slightly reduced.
Reduction of resources consumption: fly ash utilisation in the proposed project activity will contribute to
savings in natural resources, mainly the land (and top soil), water, coal and limestone. The utilisation of
fly ash in the manufacture of building blocks, as in the proposed project activity, will release considerable
amounts of land. Also, water will be saved due to reduced fly ash disposal from thermal power plants.
Reduction of waste generation in the manufacturing process: No waste material is generated in the
manufacturing process of AAC blocks and panels. On the contrary, waste materials from other industries
are used but no wastes are generated.
Social benefits:
Improvement of air quality in the nearby region: With the avoidance of fossil fuel combustion in the
proposed project activity, the exhaust gas emissions and direct air pollution will be substantially reduced
in the neighbouring region.
Better quality employment creation: The proposed project activity will be situated in the Bagnan, Howrah
in state of West Bengal. Since the proposed project activity is a green field project it will create a huge
amount of employment benefits in the entire project area.
Economical Benefits:
Reduction of dependence from fossil fuels: The project activity will reduce to the maximum the
dependence of the brick manufacturing process from fossil fuels. This will reduce the overall dependence
of the whole region from the imports and availability of fossil fuels and will allow other industries to use
energy resources which will allow their development.
Technical Benefits:
Enhancement of the use of green building material:
The following are the eco logical green building quality and characteristics of AAC blocks:
• Energy efficient
• Lower energy consumption per cum in production process
• Best thermal insulation, 6 to 10 times better than regular concrete
• Non-toxic, environmentally friendly
• Un-suppressed fire resistance • Excellent sound absorption
• No waste of raw materials
AAC blocks/panels are a high quality product with high insulating capabilities – their use would lead to
lower energy consumption at the air conditioning end of the construction building and would partly help
the building in achieving the green building status. Its low density properties would enable the building
structure to be light weight and thus would require less deep foundations.
A.2. Location of project activity
A.2.1. Host Party(ies)
>> India
A.2.2. Region/State/Province etc.
>> West Bengal
A.2.3. City/Town/Community etc.
>> Bagnan, Howrah
3 http://envfor.nic.in/downloads/public-information/Draft-Report-to-the-People-on-Environment-and-Forests-2010-
11.pdf
UNFCCC/CCNUCC
CDM – Executive Board Page 5
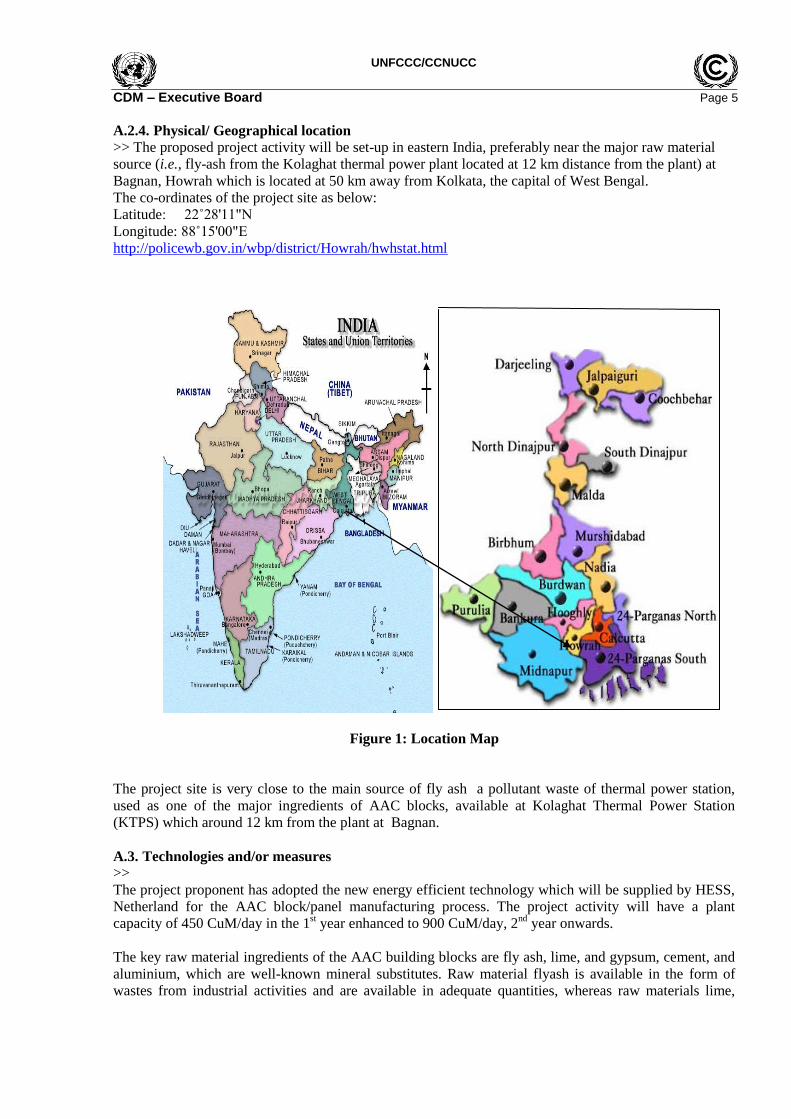
A.2.4. Physical/ Geographical location
>> The proposed project activity will be set-up in eastern India, preferably near the major raw material
source (i.e., fly-ash from the Kolaghat thermal power plant located at 12 km distance from the plant) at
Bagnan, Howrah which is located at 50 km away from Kolkata, the capital of West Bengal.
The co-ordinates of the project site as below:
Latitude: 22˚28'11"N
Longitude: 88˚15'00"E
http://policewb.gov.in/wbp/district/Howrah/hwhstat.html
Figure 1: Location Map
The project site is very close to the main source of fly ash a pollutant waste of thermal power station,
used as one of the major ingredients of AAC blocks, available at Kolaghat Thermal Power Station
(KTPS) which around 12 km from the plant at Bagnan.
A.3. Technologies and/or measures
>>
The project proponent has adopted the new energy efficient technology which will be supplied by HESS,
Netherland for the AAC block/panel manufacturing process. The project activity will have a plant
capacity of 450 CuM/day in the 1st year enhanced to 900 CuM/day, 2
nd year onwards.
The key raw material ingredients of the AAC building blocks are fly ash, lime, and gypsum, cement, and
aluminium, which are well-known mineral substitutes. Raw material flyash is available in the form of
wastes from industrial activities and are available in adequate quantities, whereas raw materials lime,
UNFCCC/CCNUCC
CDM – Executive Board Page 6
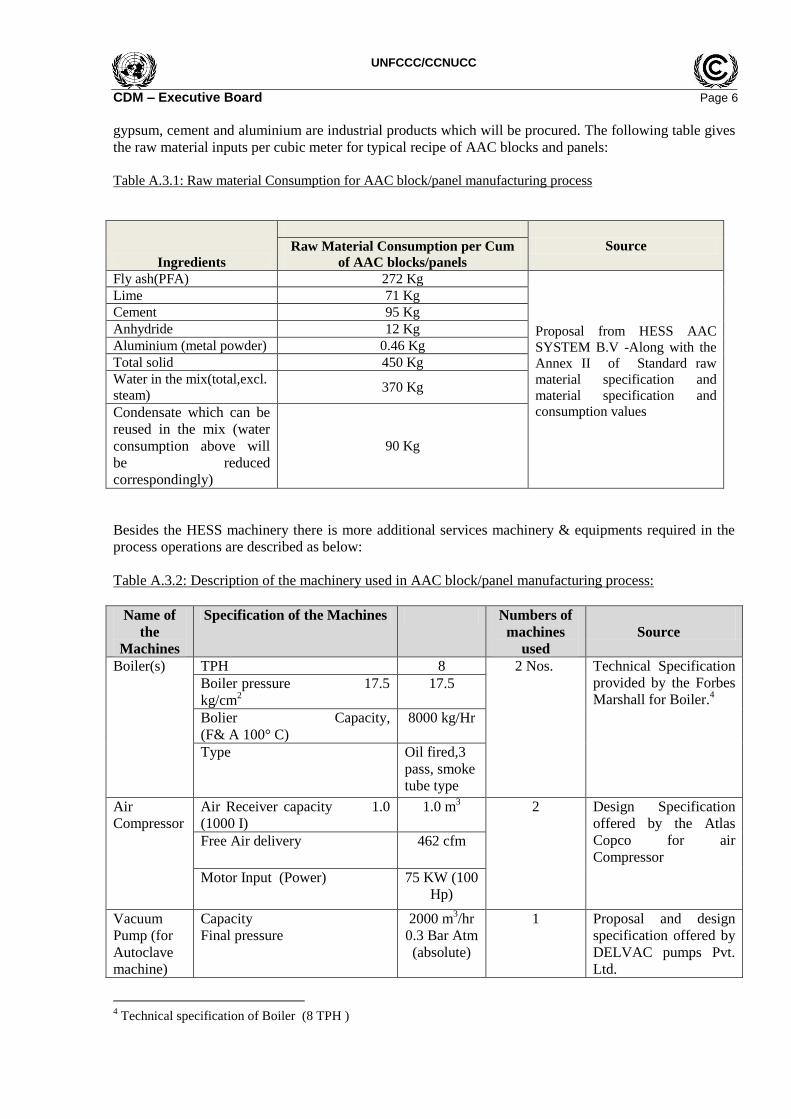
gypsum, cement and aluminium are industrial products which will be procured. The following table gives
the raw material inputs per cubic meter for typical recipe of AAC blocks and panels:
Table A.3.1: Raw material Consumption for AAC block/panel manufacturing process
Ingredients
Source Raw Material Consumption per Cum
of AAC blocks/panels
Fly ash(PFA) 272 Kg
Proposal from HESS AAC
SYSTEM B.V -Along with the
Annex II of Standard raw
material specification and
material specification and
consumption values
Lime 71 Kg
Cement 95 Kg
Anhydride 12 Kg
Aluminium (metal powder) 0.46 Kg
Total solid 450 Kg
Water in the mix(total,excl.
steam) 370 Kg
Condensate which can be
reused in the mix (water
consumption above will
be reduced
correspondingly)
90 Kg
Besides the HESS machinery there is more additional services machinery & equipments required in the
process operations are described as below:
Table A.3.2: Description of the machinery used in AAC block/panel manufacturing process:
Name of
the
Machines
Specification of the Machines Numbers of
machines
used
Source
Boiler(s) TPH 8 2 Nos. Technical Specification
provided by the Forbes
Marshall for Boiler.4
Boiler pressure 17.5
kg/cm2
17.5
Bolier Capacity,
(F& A 100° C)
8000 kg/Hr
Type Oil fired,3
pass, smoke
tube type
Air
Compressor
Air Receiver capacity 1.0
(1000 I)
1.0 m3 2 Design Specification
offered by the Atlas
Copco for air
Compressor Free Air delivery 462 cfm
Motor Input (Power) 75 KW (100
Hp)
Vacuum
Pump (for
Autoclave
machine)
Capacity
Final pressure
2000 m3/hr
0.3 Bar Atm
(absolute)
1 Proposal and design
specification offered by
DELVAC pumps Pvt.
Ltd.
4 Technical specification of Boiler (8 TPH )

UNFCCC/CCNUCC
CDM – Executive Board Page 7
Auto clave
Dimension (Dia x
Lengh)
2.9mx43.7m 1 Design specification
from Rooftech
Engineering and
Consultancy Steam Pressure 12 bar
Main
Transformer
Specification 1250 kVA,
11kV/440V,
Indore type
1 Design specification
from Consultant
Consortium
DG Set
Capacity 750 kVA 1 Proposal and design
specification offered by
RAI POWER
All the equipments of the plant are purchased as new so the average life time of all the equipments is 20
years.
The project technology is environmentally safe and sound as compared to the baseline technology of
producing red clay bricks. The project would help the reduction of fly ash dumping problem faced by
thermal power plants (classified under hazardous materials category by MOEF - GOI) by making useful
application of fly ash for producing building construction material. Also, the technology would be less
energy and carbon intensive as compared to conventional bricks manufacturing technology in India.

UNFCCC/CCNUCC
CDM – Executive Board Page 8
The Figure 2: provides „Detailed Schematic Diagram of the project activity production process:
PFA Lime Cement Gypsum
Dosing and mixing
Mixing up the raw materials in the control system of the mixing tower with hot and cold
water released through the spray nozzles, Aluminium dry powder is being added in the mixer
additionally for making a homogeneous mix of raw materials.
Casting & Rising/pre-curing
Casting the mix with a mould system with inside dimensions of 6.16 x1.58x0.69 m .the mix
is poured into the mould and vibrated so that the entrained air is released. The moulds are
then parked in a parking area where the mass inside the mould rises like a cake. Once the
cake is harder end enough, the mould is transported to a tilting station and the cake is
separated from the mould on a platform which goes through horizontal and cross cutters.
Vertical/Horizontal /Cross cutting and back tilting
Cutting and milling the cakes with cutter among them horizontal cutter are equipped with
broken –wire –detection system to indicate the wire which has broken. After cutting the
cakes these are being transfer to the milling unit attached with the cutting unit for milling up
each side of the cakes. After that the cakes are conveyed to the tilting table for back tilting
for giving the extra hardness to the cakes.
Bed waste removal/Green separation/Stacking and buffering of the green cakes
All the sticking impurities are being separated in the green separator for avoiding the
sticking of layer during the process of Autoclaves.
Autoclaving & packaging
The cakes are cured with steam at a pressure of approx 12 bars in auto clave machine. After
autoclaving the cakes are taken out of autoclaves unloaded from the cooking frame and proceed
to the packaging line for final packaging.
Despatch to the market
UNFCCC/CCNUCC
CDM – Executive Board Page 9
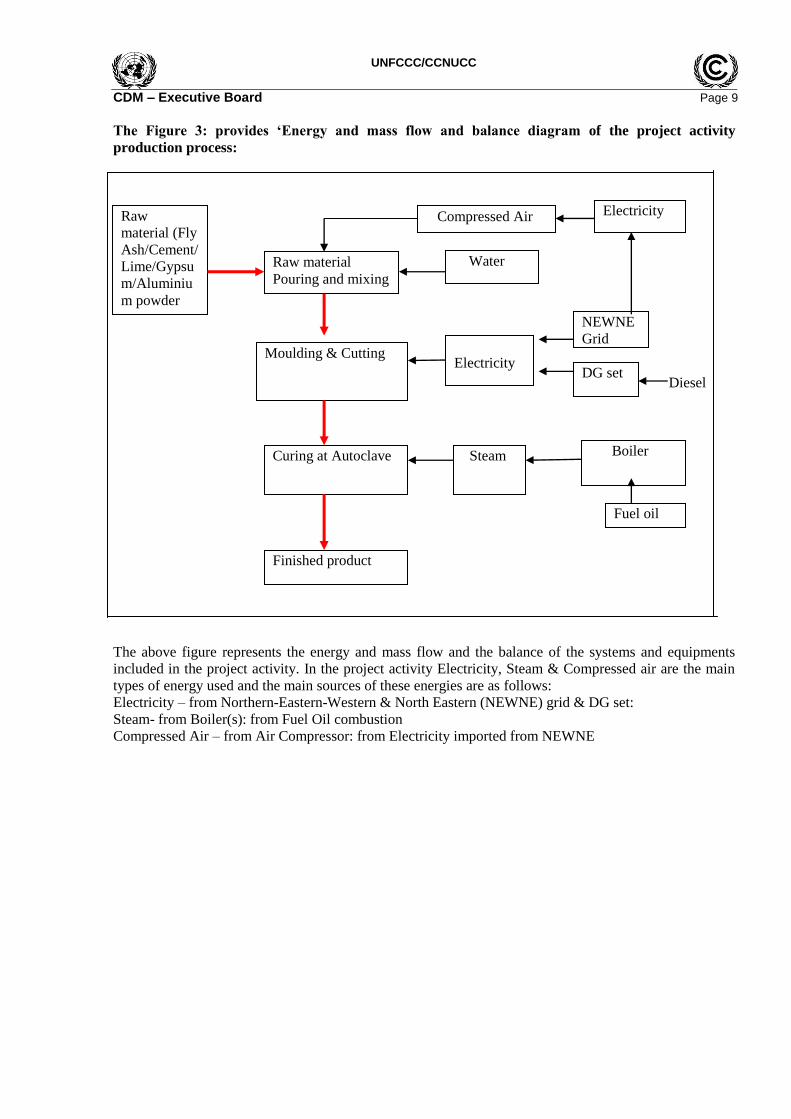
The Figure 3: provides „Energy and mass flow and balance diagram of the project activity
production process:
Diesel
The above figure represents the energy and mass flow and the balance of the systems and equipments
included in the project activity. In the project activity Electricity, Steam & Compressed air are the main
types of energy used and the main sources of these energies are as follows:
Electricity – from Northern-Eastern-Western & North Eastern (NEWNE) grid & DG set:
Steam- from Boiler(s): from Fuel Oil combustion
Compressed Air – from Air Compressor: from Electricity imported from NEWNE
Raw
material (Fly
Ash/Cement/
Lime/Gypsu
m/Aluminiu
m powder
Raw material
Pouring and mixing
Compressed Air
Moulding & Cutting
Electricity
NEWNE
Grid
DG set
Curing at Autoclave Steam Boiler
Finished product
Water
Fuel oil
Electricity

UNFCCC/CCNUCC
CDM – Executive Board Page 10
A.4. Parties and project participants
Party involved
(host) indicates a host Party
Private and/or public
entity(ies) project participants
(as applicable)
Indicate if the Party involved
wishes to be considered as
project participant (Yes/No)
India M/s UAL INDUSTRIES LTD No
A.5. Public funding of project activity
>> No public funding from Annex – I countries is being received by this project as confirmed vide Annex
2.
A.6. Debundling for project activity
>> Reference to Appendix C to the simplified modalities and procedures for the small scale CDM project
activities; further reference “Guidelines on assessment of de-bundling for SSC project activities”, Version
035 (EB 54, Annex 13):
As per paragraph 2: A proposed small-scale project activity shall be deemed to be a de-bundled
component of a large project activity if there is a registered small-scale CDM project activity or an
application to register another small scale.
CDM project activity:
(a) With the same project participants
(b) In the same project category and technology/measure
(c) Registered within the previous 2 years
(d) Whose project boundary is within 1 km of the project boundary of the proposed small scale activity at
the closest point?
There is no registered project activity or application to register another CDM project activity with the
same project participants. Thus it can be concluded that the project activity is not a de-bundled
component of a large scale project activity.
5 http://cdm.unfccc.int/Reference/Guidclarif/ssc/methSSC_guid17.pdf

UNFCCC/CCNUCC
CDM – Executive Board Page 11
SECTION B. Application of selected approved baseline and monitoring methodology
B.1. Reference of methodology
>>
Type III: Other project types
Methodology Applied: AMSIIIZ. “Fuel Switch, process improvement and energy efficiency in brick
manufacture”
Sectoral Scope: 04
EB 67,
http://cdm.unfccc.int/filestorage/R/H/E/RHEASNU01VILTFY6ZG7W3XDKOCBM59/EB67_repan21_
Revisionof%20AMS-III.Z_ver04.0.pdf?t=Snp8bWV4NHNlfDAkmUBMd0ZaBlU9IrotCghV
Version 4.0
Valid from 25th May 2012 onwards.
Applied Methodological Tool:
1.“Tool to calculate project or leakage CO2 emissions from fossil fuel combustion” Version 02, Annex
11, EB 41.
http://cdm.unfccc.int/methodologies/PAmethodologies/tools/am-tool-03-v2.pdf
2. “Tool to calculate baseline, project and/or leakage emissions from electricity consumption”, Version
01, Annex 7, EB 39.
http://cdm.unfccc.int/methodologies/PAmethodologies/tools/am-tool-05-v1.pdf
3. “Project and leakage emissions from road transportation of freight” Version 01.0.0, Annex 10 of EB63
http://cdm.unfccc.int/methodologies/PAmethodologies/tools/am-tool-12-v1.pdf
4. “Tool for the demonstration and assessment of additionality”, Version (06.1.0), (EB 69)
http://cdm.unfccc.int/methodologies/PAmethodologies/tools/am-tool-01-v6.1.0.pdf
B.2. Project activity eligibility
>> As per the “GLOSSARY OF THE CDM TERMS” Version 06.0.0, Annex 63, EB 666 “A measure,
operation or action that aims to reduce GHG emissions, whether as a whole project or as a component of
a project, in one of the following categories:
(a)Type I project activities: Renewable energy project activities which have an output capacity up to 15
megawatts (or an appropriate equivalent), in accordance with the CDM rules and requirements;
(b)Type II project activities: Energy efficiency improvement project activities which reduce energy
consumption, on the supply and/or demand side, to a maximum output of 60 GWh per year (or an
appropriate equivalent) in accordance with the CDM rules and requirements;
(c) Type III project activities: SSC CDM project activities other than Type I and Type II project activities
that result in emission reductions of less than or equal to 60 kt carbon dioxide equivalent annually, in
accordance with the CDM rules and requirements”.
The project activity does not fall under Type I and Type II project activities category and aims to reduce
GHG emissions of less than 60kt carbon dioxide equivalent annually in accordance with the CDM rules
and requirements. Please refer to B.6.4 Summary of ex-ante estimates of emission reductions for data
values. Therefore the project activity falls under the SSC Category Type III project activities
The selected category for the proposed project activity is as follows:
Type III - Other Project Types
Methodology AMS IIIZ “Fuel Switch, process improvement and energy efficiency in brick
manufacture”
Version: 4.0
EB 67
6 http://cdm.unfccc.int/Reference/Guidclarif/glos_CDM.pdf

UNFCCC/CCNUCC
CDM – Executive Board Page 12
Criteria
Justification
1.The methodology comprises one or more
technology/measures listed below in brick
production facilities:
Shift to an alternative brick
production
technology/process; or
Complete/Partial substitution
of fossil fuels with renewable
biomass (including solid
biomass residues such as
sawdust and food industry
organic liquid residues); or
Complete/partial substitution
of high carbon fossil fuels with
low carbon fossil fuels
The project activity is a New facility (Greenfield
project activity) which entails shift from baseline
scenario brick production technology Fixed
chimney BTK (a high energy intensive process) to
project scenario - an alternative brick production
technology AAC Technology (low energy
intensive process) – therefore the project activity
meets the applicability criterion.
2. Complete or partial fuel substitution and
associated activities may also result in
improved energy efficiency of existing facility;
however project activities primarily aimed at
emission reductions from energy efficiency
measures shall apply AMS-II.D “Energy
efficiency and fuel switching measures for
industrial facilities”. Thus, the methodology is
applicable for the production of:
(a) Bricks that are the same in the project
and baseline cases; or
(b) Bricks that are different in the project
case versus the baseline case due to a
change(s) in raw materials, use of
different additives, and/or production
process changes resulting in reduced use
or avoidance of fossil fuels for forming,
sintering (firing) or drying or other
applications in the facility as long as it
can be demonstrated that the service
level of the project brick is comparable
to that of the baseline brick (as per
paragraph 11) Examples include
pressed mud blocks (soil blocks) with
cement or lime stabilization and other
„unburned‟ bricks that attain strength
due to fly ash, lime/cement and gypsum
chemistry.
It may be noted that bricks are different in the
project case versus the baseline cases due to
changes in the raw materials, use of different
additives and production process changes resulting
in avoidance of fossil fuels for forming, sintering
or drying. However it can be demonstrated that the
service level of the project bricks is better than the
baseline brick. Please refer to Para 11, Table: B.2.2
for details on Comparison on Service level of the
project bricks with baseline bricks:
Therefore the project activity meets the
applicability criterion.
3. The measures may replace, modify, retrofit
or add capacity to systems in existing
facilities or be installed in a new facility.
The project activity measure itself is a whole new
facility. Thus, the project activity meets the
applicability criterion.

UNFCCC/CCNUCC
CDM – Executive Board Page 13
4. New facilities (Greenfield projects) and
project activities involving capacity
additions are only eligible if they comply
with the requirements for Greenfield
projects and capacity increase projects
specified in the “General Guidelines for
SSC CDM methodologies”.
The project falls under the Type III Greenfield
projects (new facilities) and the most plausible
baseline scenario for this project activity is “the
burnt clay brick manufacturing using conventional
technologies”. This project activity baseline is in
line with the baseline requirements of the Type III
small-scale methodology.
Thus, the project activity meets the applicability
criterion.
5. The requirements concerning
demonstration of the remaining lifetime of
the replaced equipment shall be met as
described in the General Guidance for SSC
methodologies. If the remaining life time of
the affected systems increases due to the
project activity, the crediting period shall
be limited to the estimated remaining
lifetime, i.e, the time when the affected
systems would have replaced in the
absence of the project activity.
The project activity is not a replacement or retrofit
to an existing facility. The project activity is being
implemented as a New facility (Greenfield project).
Thus the criterion under discussion is not
applicable.
6. For existing facilities, it shall be
demonstrated, with historical data, that for
at least three years immediately prior to
the start date of the project
implementation, only fossil fuels (no
renewable biomass) were used in the brick
production systems that are being modified
or retrofitted. In cases where small
quantities of biomass were used for
experimental purposes this can be
excluded.
The project activity is not a replacement or retrofit
to an existing facility. The project activity is being
implemented as a New facility (Greenfield project).
Thus the criterion under discussion is not
applicable.
7. The renewable biomass utilized by the
project activity shall not be chemically
processed (e.g. esterification to produce
biodiesel, degumming and/or
neutralization by chemical reagents) prior
to the combustion but it may be processed
mechanically (e.g. pressing,
filtering)/thermally (e.g. gasification to
produce syngas)
In the proposed project activity there is no use of
renewable biomass.
So there is no scope of any mechanical or chemical
treatment of the renewable biomass through the
project activity.
Thus the criterion under discussion is not
applicable.
UNFCCC/CCNUCC
CDM – Executive Board Page 14
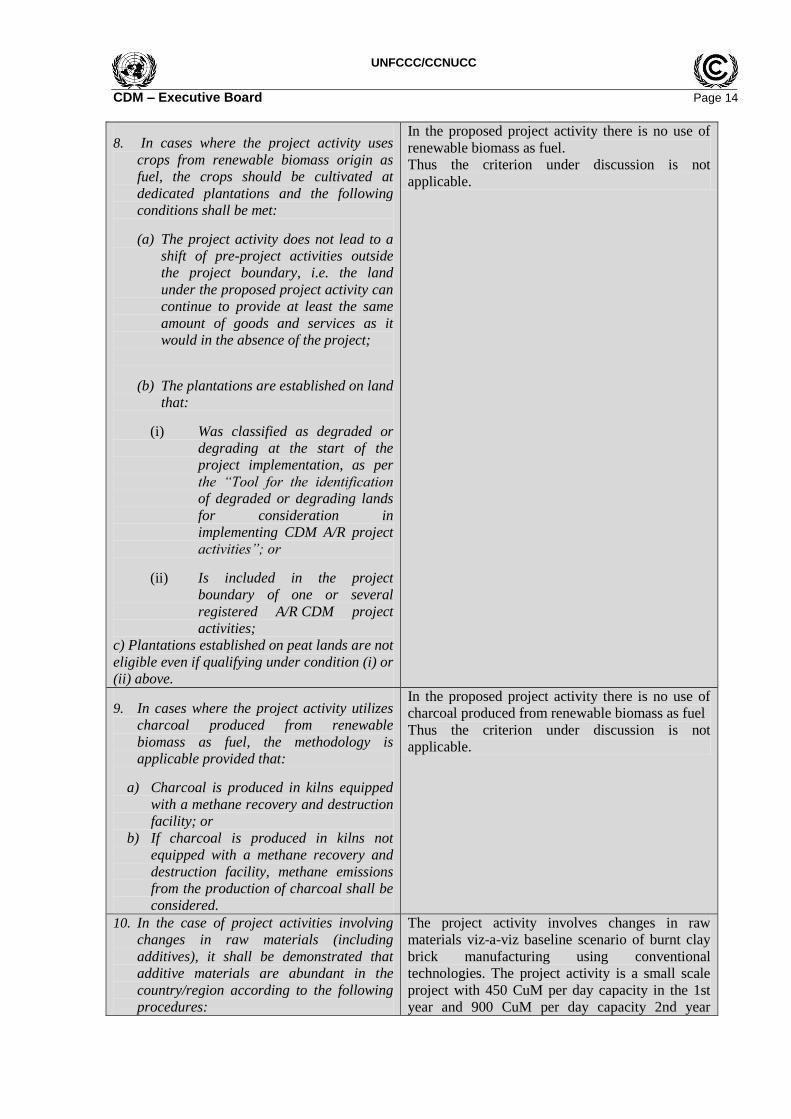
8. In cases where the project activity uses
crops from renewable biomass origin as
fuel, the crops should be cultivated at
dedicated plantations and the following
conditions shall be met:
(a) The project activity does not lead to a
shift of pre-project activities outside
the project boundary, i.e. the land
under the proposed project activity can
continue to provide at least the same
amount of goods and services as it
would in the absence of the project;
(b) The plantations are established on land
that:
(i) Was classified as degraded or
degrading at the start of the
project implementation, as per
the “Tool for the identification
of degraded or degrading lands
for consideration in
implementing CDM A/R project
activities”; or
(ii) Is included in the project
boundary of one or several
registered A/R CDM project
activities;
c) Plantations established on peat lands are not
eligible even if qualifying under condition (i) or
(ii) above.
In the proposed project activity there is no use of
renewable biomass as fuel.
Thus the criterion under discussion is not
applicable.
9. In cases where the project activity utilizes
charcoal produced from renewable
biomass as fuel, the methodology is
applicable provided that:
a) Charcoal is produced in kilns equipped
with a methane recovery and destruction
facility; or
b) If charcoal is produced in kilns not
equipped with a methane recovery and
destruction facility, methane emissions
from the production of charcoal shall be
considered.
In the proposed project activity there is no use of
charcoal produced from renewable biomass as fuel
Thus the criterion under discussion is not
applicable.
10. In the case of project activities involving
changes in raw materials (including
additives), it shall be demonstrated that
additive materials are abundant in the
country/region according to the following
procedures:
The project activity involves changes in raw
materials viz-a-viz baseline scenario of burnt clay
brick manufacturing using conventional
technologies. The project activity is a small scale
project with 450 CuM per day capacity in the 1st
year and 900 CuM per day capacity 2nd year

UNFCCC/CCNUCC
CDM – Executive Board Page 15
Step 1: Using relevant literature and/or
interviews with experts, a list of raw materials
to be utilized is prepared based on the historic
and/or present consumption of such raw
materials.
Step 2: The current supply situation for each
type of raw material to be utilized is assessed
and their surplus availability is demonstrated
using one of the approaches below:
·Approach 1: Demonstrate that the raw
materials to be utilized, in the region of the
project activity, are not fully utilized. For this
purpose, demonstrate that the quantity of
material is at least 25% greater than the
demand for such materials or the availability of
alternative materials for at least one year prior
to the project implementation.
.Approach 2: Demonstrate that suppliers of
raw materials to be utilized, in the region of the
project activity, are not able to sell all of their
supply of these materials. For this purpose,
project participants shall demonstrate that a
representative sample of suppliers of the raw
materials to be utilized, in the region, had a
surplus of material (e.g., at the end of the
period during which the raw material is
sold),which they could not sell and which is not
utilized.
As per SSC_518 „The underlying rationale
regarding the requirement on demonstration of
the availability abundance of the raw materials
is that the alternative raw materials used in the
manufacturing of alternative bricks are “waste
products”. The assessment as per paragraph 6
(in version 03 and paragraph 10 in version 04)
is not intended for industrial products with
commercial value used as raw materials or
additives.‟
onwards.
The assessment as per this applicability criterion is
intended for raw materials, which are waste
products and not industrial products with
commercial value.
The project activity‟s raw material requirements
include Fly-ash, Lime, Gypsum, Cement and
Aluminium. Fly-ash is a waste product, gypsum is
a by-product but used in very small quantity,
whereas Lime, cement and aluminium are
industrial products.
Therefore the assessment has been conducted only
for fly-ash.
Step 1: As per the manufacturer, the project
activity‟s annual requirement of Fly-ash, is as
follows –
Table B.2.1: Quantity of raw material
consumption for AAC block manufacturing
process7
Parameter-Comment Quantity Required
(MT)
Fly ash – Maximum
quantity
33048 MT – 1st year
67932 MT – 2nd
year
Step 2: The current supply situation of Flyash to be
utilized is assessed below and their abundance is
demonstrated -
Fly ash - The annual nationwide generation of fly
ash is over 130 million tons.
(http://www.dst.gov.in/whats_new/what_new08/fly
-ash.pdf). Being a by product of coal based thermal
power plants with annual generation in millions of
tons, fly ash is abundantly available within a
feasible distance from the plant.
Fly ash source for the project activity is Kolaghat
Thermal Power Station (KTPS) which is 20 km
away from the plant. KTPS is generating 7500-
8000 MT of fly ash per day (i.e. to the tune of
2625000-2800000MT per annum) by using 18000
tonnes of coal per day8. The fly ash is disposed on
land and causes soil as well as water pollution and
affects the environmental ecosystem. Further to
dispose the generated fly ash the plant authority
would require 1250 acre land in its whole life span9
i.e, the growth of generation of fly ash is much
higher compared to recycling procedure.
Thus, it may be concluded that flyash is available
in abundance and the project activity meets the
applicability criterion.
7 UAL_Financials_Version03
8 Indian Journal for spatial science.Link: http://www.etravers.net/Art_010.pdf
9 http://www.etravers.net/Art_010.pdf
UNFCCC/CCNUCC
CDM – Executive Board Page 16
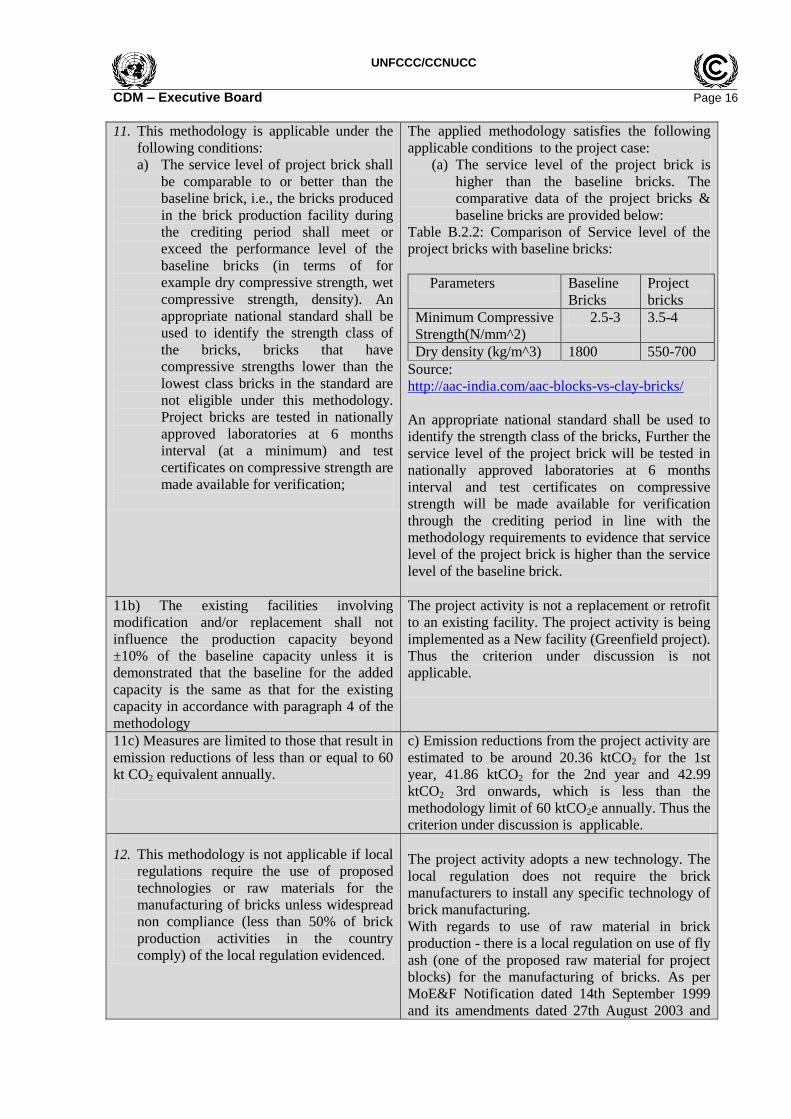
11. This methodology is applicable under the
following conditions:
a) The service level of project brick shall
be comparable to or better than the
baseline brick, i.e., the bricks produced
in the brick production facility during
the crediting period shall meet or
exceed the performance level of the
baseline bricks (in terms of for
example dry compressive strength, wet
compressive strength, density). An
appropriate national standard shall be
used to identify the strength class of
the bricks, bricks that have
compressive strengths lower than the
lowest class bricks in the standard are
not eligible under this methodology.
Project bricks are tested in nationally
approved laboratories at 6 months
interval (at a minimum) and test
certificates on compressive strength are
made available for verification;
The applied methodology satisfies the following
applicable conditions to the project case:
(a) The service level of the project brick is
higher than the baseline bricks. The
comparative data of the project bricks &
baseline bricks are provided below:
Table B.2.2: Comparison of Service level of the
project bricks with baseline bricks:
Parameters Baseline
Bricks
Project
bricks
Minimum Compressive
Strength(N/mm^2)
2.5-3 3.5-4
Dry density (kg/m^3) 1800 550-700
Source:
http://aac-india.com/aac-blocks-vs-clay-bricks/
An appropriate national standard shall be used to
identify the strength class of the bricks, Further the
service level of the project brick will be tested in
nationally approved laboratories at 6 months
interval and test certificates on compressive
strength will be made available for verification
through the crediting period in line with the
methodology requirements to evidence that service
level of the project brick is higher than the service
level of the baseline brick.
11b) The existing facilities involving
modification and/or replacement shall not
influence the production capacity beyond
±10% of the baseline capacity unless it is
demonstrated that the baseline for the added
capacity is the same as that for the existing
capacity in accordance with paragraph 4 of the
methodology
The project activity is not a replacement or retrofit
to an existing facility. The project activity is being
implemented as a New facility (Greenfield project).
Thus the criterion under discussion is not
applicable.
11c) Measures are limited to those that result in
emission reductions of less than or equal to 60
kt CO2 equivalent annually.
c) Emission reductions from the project activity are
estimated to be around 20.36 ktCO2 for the 1st
year, 41.86 ktCO2 for the 2nd year and 42.99
ktCO2 3rd onwards, which is less than the
methodology limit of 60 ktCO2e annually. Thus the
criterion under discussion is applicable.
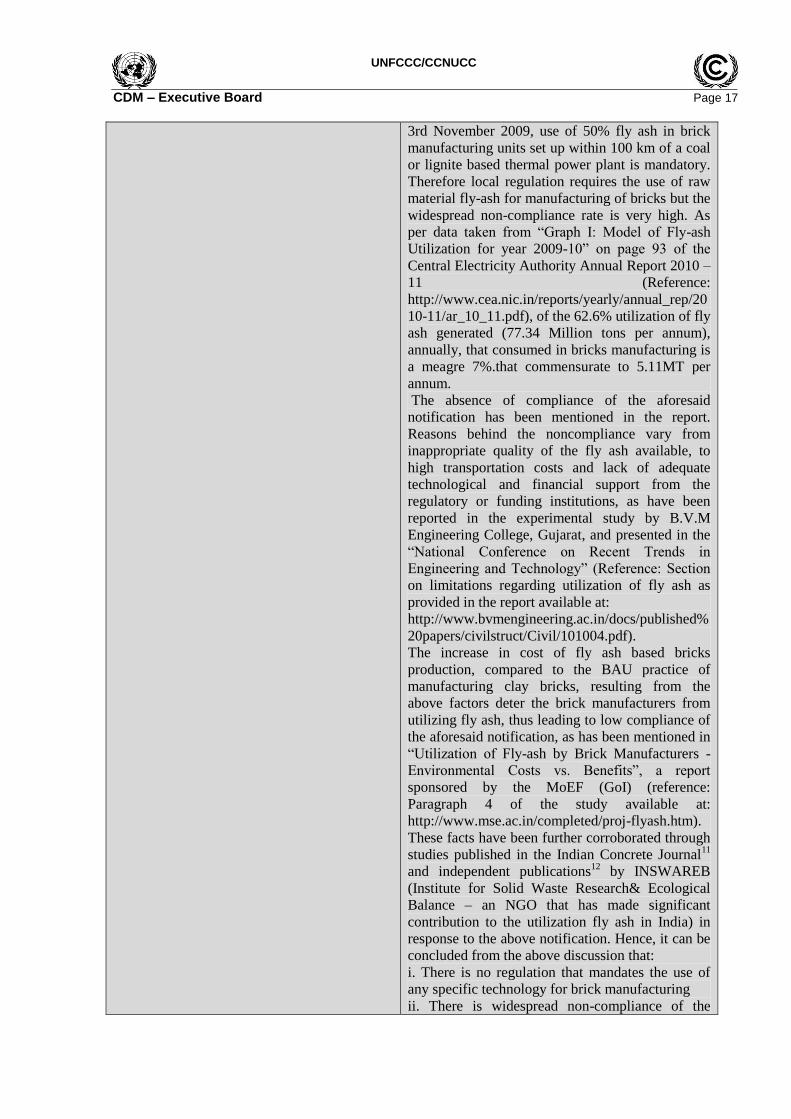
12. This methodology is not applicable if local
regulations require the use of proposed
technologies or raw materials for the
manufacturing of bricks unless widespread
non compliance (less than 50% of brick
production activities in the country
comply) of the local regulation evidenced.
The project activity adopts a new technology. The
local regulation does not require the brick
manufacturers to install any specific technology of
brick manufacturing.
With regards to use of raw material in brick
production - there is a local regulation on use of fly
ash (one of the proposed raw material for project
blocks) for the manufacturing of bricks. As per
MoE&F Notification dated 14th September 1999
and its amendments dated 27th August 2003 and
UNFCCC/CCNUCC
CDM – Executive Board Page 17
3rd November 2009, use of 50% fly ash in brick
manufacturing units set up within 100 km of a coal
or lignite based thermal power plant is mandatory.
Therefore local regulation requires the use of raw
material fly-ash for manufacturing of bricks but the
widespread non-compliance rate is very high. As
per data taken from “Graph I: Model of Fly-ash
Utilization for year 2009-10” on page 93 of the
Central Electricity Authority Annual Report 2010 –
11 (Reference:
http://www.cea.nic.in/reports/yearly/annual_rep/20
10-11/ar_10_11.pdf), of the 62.6% utilization of fly
ash generated (77.34 Million tons per annum),
annually, that consumed in bricks manufacturing is
a meagre 7%.that commensurate to 5.11MT per
annum.
The absence of compliance of the aforesaid
notification has been mentioned in the report.
Reasons behind the noncompliance vary from
inappropriate quality of the fly ash available, to
high transportation costs and lack of adequate
technological and financial support from the
regulatory or funding institutions, as have been
reported in the experimental study by B.V.M
Engineering College, Gujarat, and presented in the
“National Conference on Recent Trends in
Engineering and Technology” (Reference: Section
on limitations regarding utilization of fly ash as
provided in the report available at:
http://www.bvmengineering.ac.in/docs/published%
20papers/civilstruct/Civil/101004.pdf).
The increase in cost of fly ash based bricks
production, compared to the BAU practice of
manufacturing clay bricks, resulting from the
above factors deter the brick manufacturers from
utilizing fly ash, thus leading to low compliance of
the aforesaid notification, as has been mentioned in
“Utilization of Fly-ash by Brick Manufacturers -
Environmental Costs vs. Benefits”, a report
sponsored by the MoEF (GoI) (reference:
Paragraph 4 of the study available at:
http://www.mse.ac.in/completed/proj-flyash.htm).
These facts have been further corroborated through
studies published in the Indian Concrete Journal11
and independent publications12
by INSWAREB
(Institute for Solid Waste Research& Ecological
Balance – an NGO that has made significant
contribution to the utilization fly ash in India) in
response to the above notification. Hence, it can be
concluded from the above discussion that:
i. There is no regulation that mandates the use of
any specific technology for brick manufacturing
ii. There is widespread non-compliance of the

UNFCCC/CCNUCC
CDM – Executive Board Page 18
regulation to use 50% of fly-ash for brick
manufacturing within 100 km of a thermal power
plant.
Hence the applicability condition is applicable to
the proposed project activity.
Thus, the project activity fulfils the applicability criteria of AMS-III.Z, version 4.0, and accordingly the
application of the methodology is justified.

UNFCCC/CCNUCC
CDM – Executive Board Page 19
B.3. Project boundary
>> As per paragraph 13 of the methodology, “The project boundary is the physical, geographical site
where the brick production takes place during both the baseline and crediting periods. It also includes all
installations, processes or equipment affected by the switching. In cases where the renewable biomass is
sourced from dedicated plantations it also includes the area of the plantations. In cases involving thermo-
mechanical processing of the biomass (e.g. charcoal; briquettes; syngas) the sites where these processes
are carried out shall be within the project boundary.”
In both Baseline & Project Scenario, boundary is depicted diagrammatically as below:
Transportation (LEy)
CO2,
CO2(PEy) CO2(PEy)
Steam
CO2(PEy)
CO2
(PEy)
Service level is better & more Energy Efficient than Baseline
= Baseline Emission (BEy) = Project Emission (PEy) = Leakage Emission (LEy)
Figure 3: Schematic diagram of boundary at the crediting period
Raw material
storage
Raw material
Mixing
Block
moulding
Autoclave
Curing
Pressing &
Cutting
Raw materials
AAC
Blocks/Panels
(finished product)
Electricity
NEWNE
DG Set Diesel
oil
Boiler Fuel
oil
Mineral storage &
preparation of raw
Materials
Forming the
brick
Drying &
cutting
Firing &
Cooling
De-stacking & Storage of
BTK Clay bricks (Finished
Product)
Boiler
Electr
icity
Coal
Project Boundary
UNFCCC/CCNUCC
CDM – Executive Board Page 20
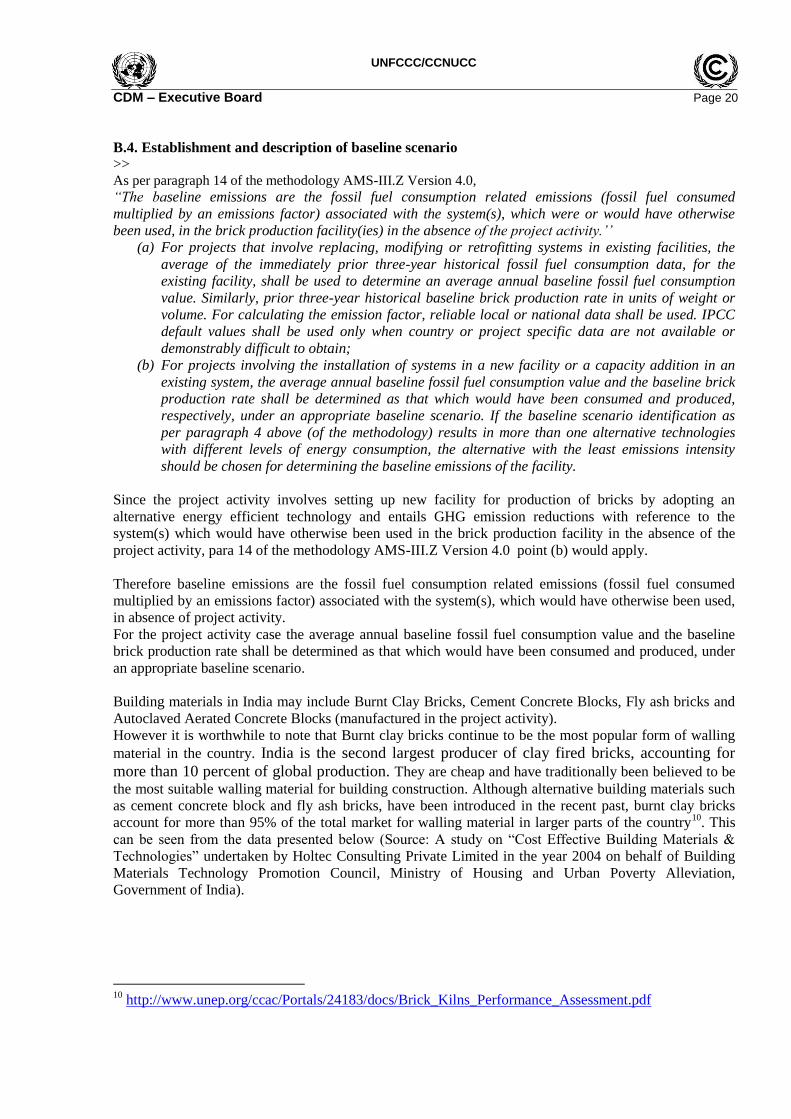
B.4. Establishment and description of baseline scenario
>> As per paragraph 14 of the methodology AMS-III.Z Version 4.0,
“The baseline emissions are the fossil fuel consumption related emissions (fossil fuel consumed
multiplied by an emissions factor) associated with the system(s), which were or would have otherwise
been used, in the brick production facility(ies) in the absence of the project activity.‟‟
(a) For projects that involve replacing, modifying or retrofitting systems in existing facilities, the
average of the immediately prior three-year historical fossil fuel consumption data, for the
existing facility, shall be used to determine an average annual baseline fossil fuel consumption
value. Similarly, prior three-year historical baseline brick production rate in units of weight or
volume. For calculating the emission factor, reliable local or national data shall be used. IPCC
default values shall be used only when country or project specific data are not available or
demonstrably difficult to obtain;
(b) For projects involving the installation of systems in a new facility or a capacity addition in an
existing system, the average annual baseline fossil fuel consumption value and the baseline brick
production rate shall be determined as that which would have been consumed and produced,
respectively, under an appropriate baseline scenario. If the baseline scenario identification as
per paragraph 4 above (of the methodology) results in more than one alternative technologies
with different levels of energy consumption, the alternative with the least emissions intensity
should be chosen for determining the baseline emissions of the facility.
Since the project activity involves setting up new facility for production of bricks by adopting an
alternative energy efficient technology and entails GHG emission reductions with reference to the
system(s) which would have otherwise been used in the brick production facility in the absence of the
project activity, para 14 of the methodology AMS-III.Z Version 4.0 point (b) would apply.
Therefore baseline emissions are the fossil fuel consumption related emissions (fossil fuel consumed
multiplied by an emissions factor) associated with the system(s), which would have otherwise been used,
in absence of project activity.
For the project activity case the average annual baseline fossil fuel consumption value and the baseline
brick production rate shall be determined as that which would have been consumed and produced, under
an appropriate baseline scenario.
Building materials in India may include Burnt Clay Bricks, Cement Concrete Blocks, Fly ash bricks and
Autoclaved Aerated Concrete Blocks (manufactured in the project activity).
However it is worthwhile to note that Burnt clay bricks continue to be the most popular form of walling
material in the country. India is the second largest producer of clay fired bricks, accounting for
more than 10 percent of global production. They are cheap and have traditionally been believed to be
the most suitable walling material for building construction. Although alternative building materials such
as cement concrete block and fly ash bricks, have been introduced in the recent past, burnt clay bricks
account for more than 95% of the total market for walling material in larger parts of the country10
. This
can be seen from the data presented below (Source: A study on “Cost Effective Building Materials &
Technologies” undertaken by Holtec Consulting Private Limited in the year 2004 on behalf of Building
Materials Technology Promotion Council, Ministry of Housing and Urban Poverty Alleviation,
Government of India).
10
http://www.unep.org/ccac/Portals/24183/docs/Brick_Kilns_Performance_Assessment.pdf
UNFCCC/CCNUCC
CDM – Executive Board Page 21
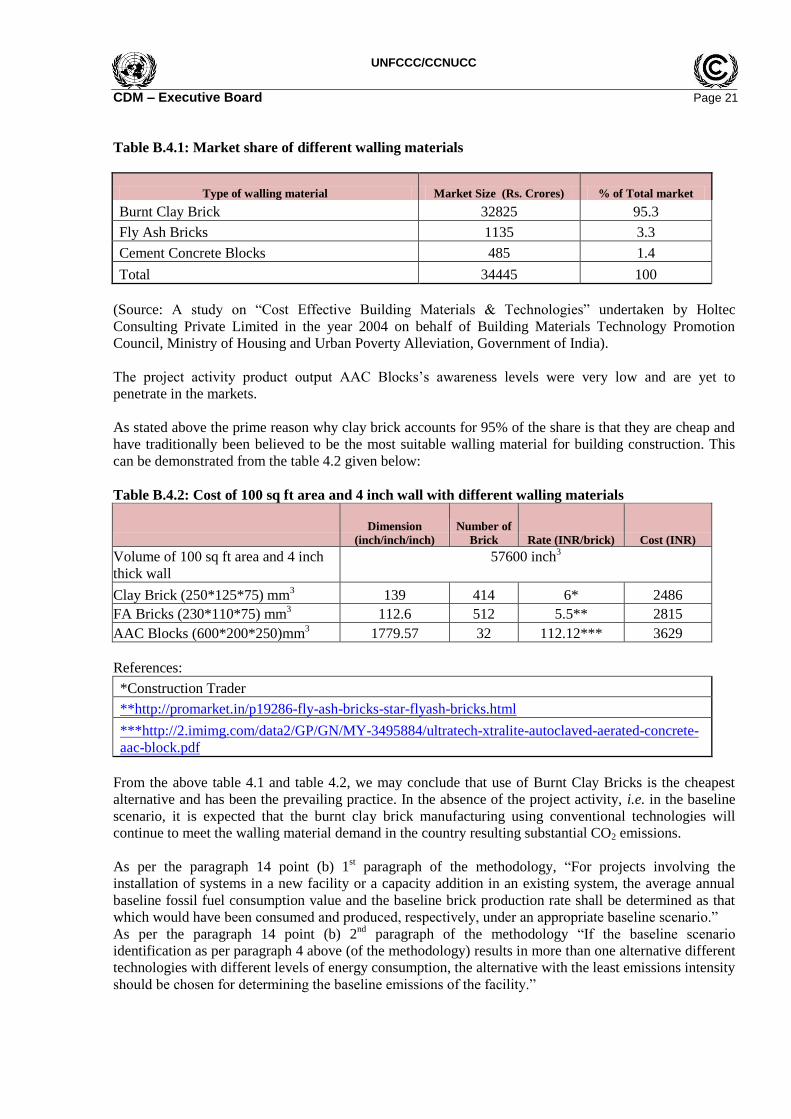
Table B.4.1: Market share of different walling materials
Type of walling material Market Size (Rs. Crores) % of Total market
Burnt Clay Brick 32825 95.3
Fly Ash Bricks 1135 3.3
Cement Concrete Blocks 485 1.4
Total 34445 100
(Source: A study on “Cost Effective Building Materials & Technologies” undertaken by Holtec
Consulting Private Limited in the year 2004 on behalf of Building Materials Technology Promotion
Council, Ministry of Housing and Urban Poverty Alleviation, Government of India).
The project activity product output AAC Blocks‟s awareness levels were very low and are yet to
penetrate in the markets.
As stated above the prime reason why clay brick accounts for 95% of the share is that they are cheap and
have traditionally been believed to be the most suitable walling material for building construction. This
can be demonstrated from the table 4.2 given below:
Table B.4.2: Cost of 100 sq ft area and 4 inch wall with different walling materials
Dimension
(inch/inch/inch)
Number of
Brick Rate (INR/brick) Cost (INR)
Volume of 100 sq ft area and 4 inch
thick wall
57600 inch3
Clay Brick (250*125*75) mm3 139 414 6* 2486
FA Bricks (230*110*75) mm3 112.6 512 5.5** 2815
AAC Blocks (600*200*250)mm3 1779.57 32 112.12*** 3629
References:
*Construction Trader
**http://promarket.in/p19286-fly-ash-bricks-star-flyash-bricks.html
***http://2.imimg.com/data2/GP/GN/MY-3495884/ultratech-xtralite-autoclaved-aerated-concrete-
aac-block.pdf
From the above table 4.1 and table 4.2, we may conclude that use of Burnt Clay Bricks is the cheapest
alternative and has been the prevailing practice. In the absence of the project activity, i.e. in the baseline
scenario, it is expected that the burnt clay brick manufacturing using conventional technologies will
continue to meet the walling material demand in the country resulting substantial CO2 emissions.
As per the paragraph 14 point (b) 1st paragraph of the methodology, “For projects involving the
installation of systems in a new facility or a capacity addition in an existing system, the average annual
baseline fossil fuel consumption value and the baseline brick production rate shall be determined as that
which would have been consumed and produced, respectively, under an appropriate baseline scenario.”
As per the paragraph 14 point (b) 2nd
paragraph of the methodology “If the baseline scenario
identification as per paragraph 4 above (of the methodology) results in more than one alternative different
technologies with different levels of energy consumption, the alternative with the least emissions intensity
should be chosen for determining the baseline emissions of the facility.”

UNFCCC/CCNUCC
CDM – Executive Board Page 22
Production of burnt clay bricks employs different technologies with different levels of coal consumption.
However some technologies are not comparable and some are legally not acceptable. The brick
manufacturing technologies were analyzed to determine the appropriate baseline selection for burnt clay
brick manufacturing in line with General Guidelines for SSC CDM Methodologies, Version 19.0, Annex
27, EB 69 and „Guidelines on the demonstration of additionality of small-scale project activities‟ Version
09.
The Guidelines for SSC CDM Methodologies requires PP to follow four Steps
Step 1: Identify the various alternatives available to the project proponent that deliver comparable levels
of service, including the proposed project activity or PoA undertaken without being registered as a CDM
project activity or PoA.
Bull‟s trench kilns (BTKs) and clamps are two prominent firing technologies used for brick making in
India.
Table B.4.3: Identification of Various alternatives
Kiln type Comments
*Typical production capacity range for Kiln Type: Clamps 0.05 – 1 (Million bricks per year)
Clamps are used for smaller production levels. A variety of fuels such as coal, firewood, various types of
agricultural residues and dung cakes are used in clamps. Large variations are observed in the shape, size,
stacking of bricks and firing techniques in clamps. Generally, energy efficiencies of clamps are lower.
*Typical production capacity range for Kiln Type: BTK–Fixed
chimney§
3 – 10 (Million bricks per year)
The BTK is a continuous type kiln and has higher production capacities. Coal is the main fuel used in
BTKs, however a very small quantum of fuel wood.is also used in FC-BTK.. It also has better energy
efficiency compared to clamps. FC BTK Accounts for more than 70% of total brick production in India.
(Reference: Therefore, FC-BTK can be considered as a realistic baseline option. “Although there are
many brick production technologies existent but almost all the brick kilns in entire Varanasi cluster are of
the traditional coal fired fixed chimney Bull‟s Trench Kilns (BTK) type, with fixed natural draft
chimneys except a few kilns which are operating using induced draft fans for better airflow in the firing/
cooling zone.” - BEE, 2010, Detailed Project Report on Induced Draft Fan in Brick Industry, Brick SME
Cluster, Varanasi, Uttar Pradesh (India), New Delhi: Bureau of Energy Efficiency; Detail Project Report
No.: VRN/BRK/IDF/04.
*Typical production capacity range for Kiln Type: BTK–
Moving chimney
2– 8 (Million bricks per year)
Regulatory interventions in the form of stricter emission standards and non-approval of new MCBTKs
have been made since 1990‟s in order to control the increasing pollution from the brick industry
(http://www.cpcb.nic.in/standard8.htm ). The regulatory intervention has been further strengthened with a
Supreme Court ruling, which has banned the use of MCBTK nationwide.
*Typical production capacity range for Kiln Type: High
draft/zig-zag firing
3 – 5 (Million bricks per year)
HDKs are very limited in number (only 200) as they have not been widely accepted by brick entrepreneurs.
One of the major considerations in operation of HDKs is the use of forced draught which is created using
electrically operated fans. In view of the highly unreliable electricity supply situation in rural areas, the issue
of reliable operation remained a high concern for brick entrepreneurs. Backup supply of electricity with
captive sources is not financially viable. The entrepreneurs who earlier opted for this technology have already
closed down their HDK plants.
*Typical production capacity range for Kiln Type: Vertical shaft
brick kiln (VSBK)
0.5 – 4 (Million bricks per year)
Regulatory authorities have been promoting VSBK technology since it is considered to be one of the
efficient technologies amongst those available. VSBKs are very limited in number (only 100) as they have
not been widely accepted by brick entrepreneurs due to several barriers. The commonly used clamp
technology only requires a limited amount of working capital and capital investment. For instance, a brick unit
using the clamp technology with an annual production capacity of 1.8 million bricks requires a capital

UNFCCC/CCNUCC
CDM – Executive Board Page 23
investment of US$ 5,000. In contrast, the capital investment associated with a VSBK unit with an equivalent
production capacity is about US$ 20,000, i.e. a cost increase of around 400%. Profitability in the brick
business largely depends on the sales volume as the profit margin per brick is low. Given limited capital
resources, the manufacturers generally prefer to increase production capacity by setting up a new plant in a
new location over investing in cleaner and efficient technologies. The appreciation of energy saving and
related savings in the operational cost continues to be low among the brick manufacturers. Given this reality,
the brick manufacturers are unlikely to investing in the more costly VSBK technology..In March 2005, as a
part of the Community Development C Fund, Technology and Action for Rural Advancement (TARA) was to
facilitate installation of 100 VSBKs across 4 states. TARA was to provide the technology package and existing
kiln owners the finance. Reference: CDCF Project: Vertical Shaft Brick Kiln Cluster Project.
AAC Technology 450 CuM
This technology has been considered by the Project participant as the project activity. The project activity
is an efficient brick manufacturing technology which entails lower CO2 emissions, but has been found to
be a low returns investment. Please refer to the Section B.5 Demonstration of additionality for further
details.
*Comprehensive industry document with emission standards, guidelines and stack height regulation for
vertical shaft brick kilns (VSBK) viz-a-viz pollution control measures, COINDS/71/2007, CPCB, MoEF, May
2007.
Outcome: List of various alternatives available to PP
- Clamps Technology
- Fixed Chimney BTK Technology
- Moving Chimney BTK Technology
- Zig-Zag Firing /High Draft Kiln technology
- Vertical Shaft Brick Kiln technology
- AAC Technology undertaken without being registered as a CDM project activity
Step 2: List the alternatives identified in Step 1 that are in compliance with local regulations. If any of the
identified baselines is not in compliance with local regulations, then exclude that alternative from further
consideration).
As stated above the Moving Chimney BTK Technology is the only technology which has been banned by
the regulatory bodies from operation. Therefore the following technologies are in compliance with local
regulations and may not face regulatory hindrances for operation. - Clamps Technology
- Fixed Chimney BTK Technology
- Zig-Zag Firing /High Draft Kiln technology
- Vertical Shaft Brick Kiln technology
- AAC Technology undertaken without being registered as a CDM project activity
Step 3: Eliminate and rank the alternatives identified in Step 2 taking into account barrier tests
specified in the “Guidelines on the demonstration of additionality of small-scale project activities”.
Project participants shall provide an explanation to show that the project activity would not have
occurred anyway due to at least one of the following barriers:
(a) Investment barrier: a financially more viable alternative to the project activity would have led to
higher emissions;
(b) Technological barrier: a less technologically advanced alternative to the project activity involves
lower risks due to the performance uncertainty or low market share of the new technology adopted for the
project activity and so would have led to higher emissions;
(c) Barrier due to prevailing practice: prevailing practice or existing regulatory or policy requirements
would have led to implementation of a technology with higher emissions;
(d) Other barriers: without the project activity, for another specific reason identified by the project
participant, such as institutional barriers or limited information, managerial resources, organizational
capacity, financial resources, or capacity to absorb new technologies, emissions would have been higher.

UNFCCC/CCNUCC
CDM – Executive Board Page 24
Table B.4.4: Barrier Analysis
Technology Barrier
AAC Technology undertaken without being
registered as a CDM project activity
Yes; Investment Barrier: As per the Investment
Analysis conducted in Section B.5 Demonstration of
Additionality „The project activity has lower
returns than the benchmark returns calculated at
the time of investment decision. Even the 10%
increase in the important parameters that affects
the returns on the project does not make project
financially viable in the absence of the CDM
revenue. Thus, the CDM revenue is critical for the
financial viability of the project activity‟. Therefore
ACC technology cannot be considered as the
baseline scenario.
Zig-Zag Firing /High Draft Kiln technology Yes; Technological Barrier: One of the major
considerations in operation of HDKs is the use of
forced draught which is created using electrically
operated fans. In view of the highly unreliable
electricity supply situation in rural areas, the issue of
reliable operation remained a high concern for brick
entrepreneurs. Backup supply of electricity with
captive sources is not financially viable. The
entrepreneurs who earlier opted for this technology
have already closed down their HDK plants, which
have lead to low production. As stated in Table B.4.5
below HDK has very low production contribution in
the Indian Brick Sector – it is a meager 0.2% of the
total production. Therefore HDK technology cannot be considered as
the baseline scenario
Vertical Shaft Brick Kiln technology Yes; Barrier due to prevailing practice; as stated in
Table B.4.5 below VSBK has very low production
contribution in the Indian Brick Sector – it is a
meager 0.1% of the total production and the
technology faces barriers since it is not a prevailing
practice; Further technology diffusion is a very slow
process taking several decades in the brick industry
sector. The generally observed slow rate of diffusion
of technology in the brick industry is mainly
attributed to the following factors:
• conservative nature of the industry;
• absence of scientific innovation and a general lack
of requisite technical and managerial capability to
handle new technology;
• lack of in-house R&D;
• poor information dissemination in the industry;
• lack of government support for technology
development and dissemination, and
• poor access to institutional finance.
.In fact VSBK technology in India has been
conceptualized as CDM project activity due to the
these barriers it faces. Please refer to
Project 0582 : India - Vertical Shaft Brick Kiln

UNFCCC/CCNUCC
CDM – Executive Board Page 25
Cluster Project -
http://cdm.unfccc.int/Projects/DB/DNV-
CUK1157015776.99/view for further details
Therefore VSBK technology cannot be considered
as the baseline scenario
Clamps Technology No; As stated in Table B.4.5 below Clamps
Technology has a nominal production
contribution in the Indian Brick Sector – it is
around 8.8% of the total production. Therefore
Clamp technology may be considered as the
baseline scenario
Fixed Chimney BTK Technology No; As stated in Table B.4.3 below FC-BTK has a
major production contribution in the Indian
Brick Sector – it comprises of 90.9% of the total
production. Therefore FC-BTK technology may be
considered as the baseline scenario
Production Contributions and technology penetration were analyzed to further substantiate the barriers faced
by some technology and identify the baseline scenarios.
Typical lower and higher range of production capacity for the 4 technologies (Clamps, FC-BTK, Zig-zag
firing and VSBK) were extracted from “Comprehensive industry document with emission standards,
guidelines and stack height regulation for vertical shaft brick kilns (VSBK) viz-a-viz pollution control
measures, COINDS/71/2007, CPCB, MoEF, May 2007.” Average production capacity of that of the lower
and upper range was calculated for the 4 technologies. The latest data on the number of existing kilns for
each technology type was collated from a letter written by Indian brick association to finance minister
(www.brick-india.com/images/finace-minister.jpg) and CDCF Project: Vertical Shaft Brick Kiln Cluster
Project. Total Annual Production Rate for each technology type was determined as the product of average
production range, number of kilns for each technology type and the standard volume of brick as presented
in the table B.4.5 below.
Table B.4.5 –provides the Annual Production Rate of brick production.
Kiln
type
Typical production capacity
range
(Million bricks per year)*
Kilns Total
Production
Volume of
brick****
Total
production
Production
%
Lower
Range
(l)
Higher
Range
(h)
Average
(l+h)/2
Number
(n)
Million
bricks
(l+h)/2*n
m3
(v)
m3/year
(l+h)/2*n*v
Clamps 0.05 1 0.525 60000** 31500 0.0015 4847850 8.8% FC
BTK 3 10 6.5 50000** 325000 0.0015 50017500
90.9% Zig-zag
firing 3 5 4.5 200 900 0.0015 13851
0.2%
VSBK 0.5 4 2,25 100*** 225 0.0015 34627.5 0.1%
AAC Data Not Available
* Reference: Table 1.1 of the survey report of "Comprehensive Industry Document with Emission Standards, Guidelines and
Stack Height regulation for Vertical Shaft Brick Kilns(VSBK) vis-à-vis Pollution Control Measures" by Central Pollution
Control Board minister of Environment & Forest at May 2007
** Reference: Letter written by Indian brick association to finance minister (www.brick-india.com/images/finace-minister.jpg)
*** Reference: CDCF Project: Vertical Shaft Brick Kiln Cluster Project
**** Reference: Indian Standard for Specification for Heavy duty Burnt clay Building Bricks (Third Version)
Therefore as per the above analysis Clamps Technology and FC-BTK face no barriers and the Clamp
technology production contribution is 8.8% and FC-BTK technology‟s production contribution is 90.9%.
However both these technologies have been considered as probable baseline scenarios
UNFCCC/CCNUCC
CDM – Executive Board Page 26
However, as per the paragraph 14 point (b) of the methodology “If the baseline scenario identification as
per paragraph 4 (of the methodology) above results in more than one alternative different technologies
with different levels of energy consumption, the alternative with the least emissions intensity should be
chosen for determining the baseline emissions of the facility.”
The two energy consumption performance of both Clamps Technology and FC-BTK Technology were
collated in Table B.4.6
Kiln Type
Energy consumption (MJ/kg of brick) Specific Coal Consumption (kg Coal/kg
brick)
Specific Coal Consumption (kg Coal/m3
brick) Lower Range Upper Range Average
Clamps** 2 4.5 3.25 0.125968992 314.9224806
FC BTK* 1.1 2 1.55 0.060077519 150.1937984
It may be noted that the Specific Coal Consumption for Clamps Technology is higher than the Specific
coal consumption for FC-BTK Technology. Therefore in line with the guidance provided in the
methodology 14(b), the FC-BTK Technology has been chosen as the baseline scenario for determining
the baseline emissions of the facility since this alternative has the least emission intensity.
Further as per the paragraph 14 point (b) of the methodology, “For projects involving the installation of
systems in a new facility or a capacity addition in an existing system, the average annual baseline fossil
fuel consumption value and the baseline brick production rate shall be determined as that which would
have been consumed and produced, respectively, under an appropriate baseline scenario.”
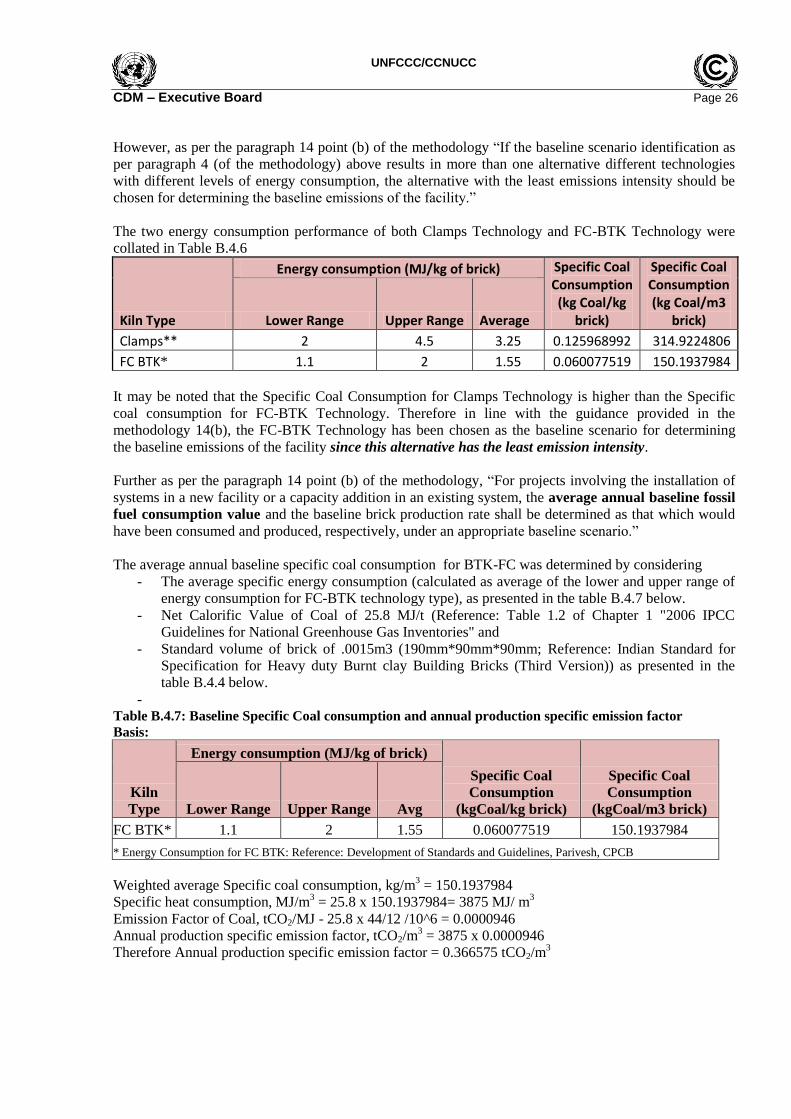
The average annual baseline specific coal consumption for BTK-FC was determined by considering
- The average specific energy consumption (calculated as average of the lower and upper range of
energy consumption for FC-BTK technology type), as presented in the table B.4.7 below.
- Net Calorific Value of Coal of 25.8 MJ/t (Reference: Table 1.2 of Chapter 1 "2006 IPCC
Guidelines for National Greenhouse Gas Inventories" and
- Standard volume of brick of .0015m3 (190mm*90mm*90mm; Reference: Indian Standard for
Specification for Heavy duty Burnt clay Building Bricks (Third Version)) as presented in the
table B.4.4 below.
- Table B.4.7: Baseline Specific Coal consumption and annual production specific emission factor
Basis:
Kiln
Type
Energy consumption (MJ/kg of brick)
Specific Coal
Consumption
(kgCoal/kg brick)
Specific Coal
Consumption
(kgCoal/m3 brick) Lower Range Upper Range Avg
FC BTK* 1.1 2 1.55 0.060077519 150.1937984
* Energy Consumption for FC BTK: Reference: Development of Standards and Guidelines, Parivesh, CPCB
Weighted average Specific coal consumption, kg/m3 = 150.1937984
Specific heat consumption, MJ/m3 = 25.8 x 150.1937984= 3875 MJ/ m
3
Emission Factor of Coal, tCO2/MJ - 25.8 x 44/12 /10^6 = 0.0000946
Annual production specific emission factor, tCO2/m3 = 3875 x 0.0000946
Therefore Annual production specific emission factor = 0.366575 tCO2/m3
UNFCCC/CCNUCC
CDM – Executive Board Page 27
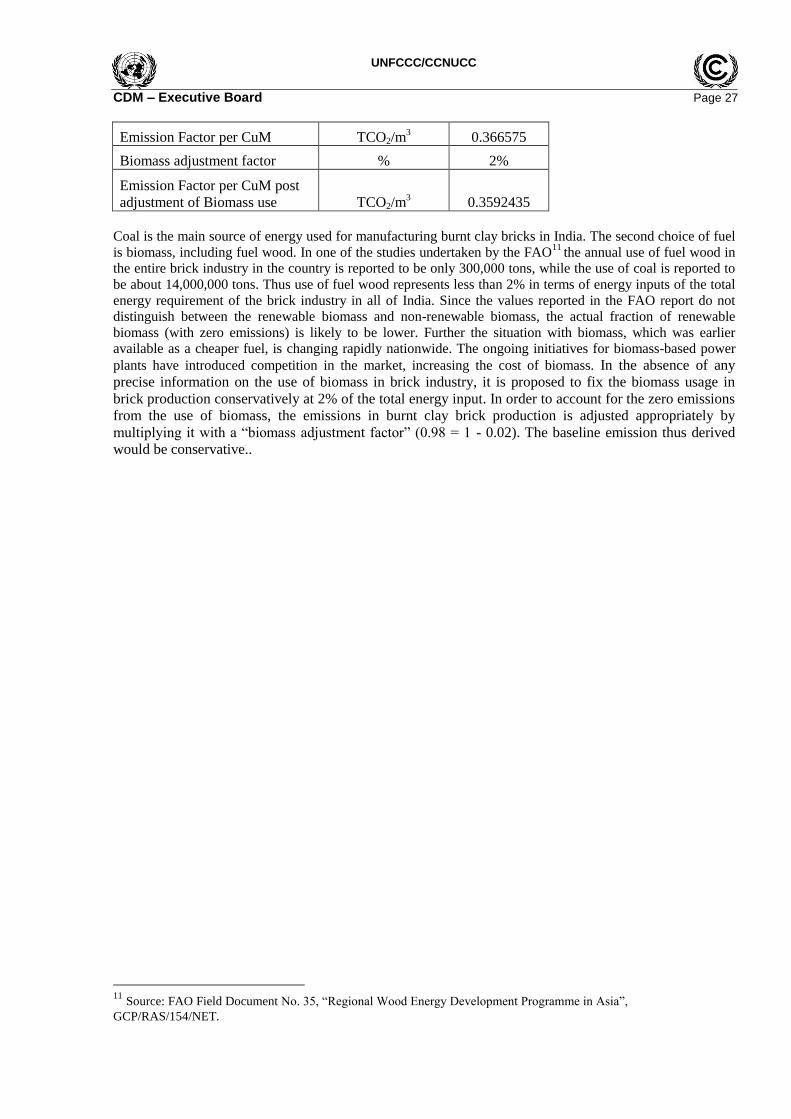
Emission Factor per CuM TCO2/m3 0.366575
Biomass adjustment factor % 2%
Emission Factor per CuM post
adjustment of Biomass use TCO2/m3 0.3592435
Coal is the main source of energy used for manufacturing burnt clay bricks in India. The second choice of fuel
is biomass, including fuel wood. In one of the studies undertaken by the FAO11
the annual use of fuel wood in
the entire brick industry in the country is reported to be only 300,000 tons, while the use of coal is reported to
be about 14,000,000 tons. Thus use of fuel wood represents less than 2% in terms of energy inputs of the total
energy requirement of the brick industry in all of India. Since the values reported in the FAO report do not
distinguish between the renewable biomass and non-renewable biomass, the actual fraction of renewable
biomass (with zero emissions) is likely to be lower. Further the situation with biomass, which was earlier
available as a cheaper fuel, is changing rapidly nationwide. The ongoing initiatives for biomass-based power
plants have introduced competition in the market, increasing the cost of biomass. In the absence of any
precise information on the use of biomass in brick industry, it is proposed to fix the biomass usage in
brick production conservatively at 2% of the total energy input. In order to account for the zero emissions
from the use of biomass, the emissions in burnt clay brick production is adjusted appropriately by
multiplying it with a “biomass adjustment factor” (0.98 = 1 - 0.02). The baseline emission thus derived
would be conservative..
11
Source: FAO Field Document No. 35, “Regional Wood Energy Development Programme in Asia”,
GCP/RAS/154/NET.
UNFCCC/CCNUCC
CDM – Executive Board Page 28
B.5. Demonstration of additionality:
>>
The Project„s additionality should be demonstrated and assessed using the latest version of “Tool for the
demonstration and assessment of additionality”.
The following steps from the additionality tool have been presented below:
STEP 1 – Identification of alternatives to the project activity consistent with current laws and regulations
STEP 2 – Investment analysis
STEP 3 – Barriers analysis
STEP 4 – Common practice analysis
Step1. Identification of alternatives to the project activity consistent with current laws and
regulations
As per the approved methodology, the project proponent have identified the above mentioned realistic
and credible alternative(s) that were available to them and that would provide output and services
comparable to the project activity (refer section B.4).These alternatives are in compliance with all
applicable legal and regulatory requirements.
Step2. Investment analysis
The tool requires project proponent to
-Determine whether the proposed project activity is not:
(a) The most economically or financially attractive; or
(b) Economically or financially feasible, without the revenue from the sale of certified emission
reductions (CERs).
To conduct the investment analysis, used the following sub-steps:
Sub-step 2a. Determine appropriate analysis method
In the “Tool for the demonstration and assessment of additionality” (Version 06.1.0), three options are
available for investment analysis: the simple cost analysis (Option I), the investment comparison analysis
(Option II) and the benchmark analysis (Option III).
Option I - Simple Cost Analysis - Since the Project will receive additional revenues from the sale of
AAC blocks &panels obtained as output, the simple cost analysis is not applicable.
a) Option II - Investment Comparison Analysis –The Analysis is based on the comparison of
returns of the project investment with the investment required for an alternative to the project. In
this case, none of the credible alternatives to the CDM project activity involve investments and
returns that could be compared to the project. The project activity service output - AAC Blocks
will be replacing the burnt clay bricks and entail reduction in coal consumption and its associated
CO2 emissions. However the investments involved in project activity are much higher than that of
the burnt clay bricks. Therefore the two investments are not comparable. Further it may also be
noted that burnt clay brick manufacturing projects are small capacity projects (75-1500
m3/annum) but the project activity is a large capacity project (1,20,285-2,53,935 m3/annum). The
project capacity difference establishes the fact that they are non-comparable. Therefore
investment comparison analysis approach was not found appropriate; benchmark analysis was
adopted to assess the project‟s financial capability. Therefore, Option-II is also not applicable to
this project.
According to the Additionality Tool, if the alternative to the CDM project activity does not include
investments of comparable scale to the project, then Option III must be used.
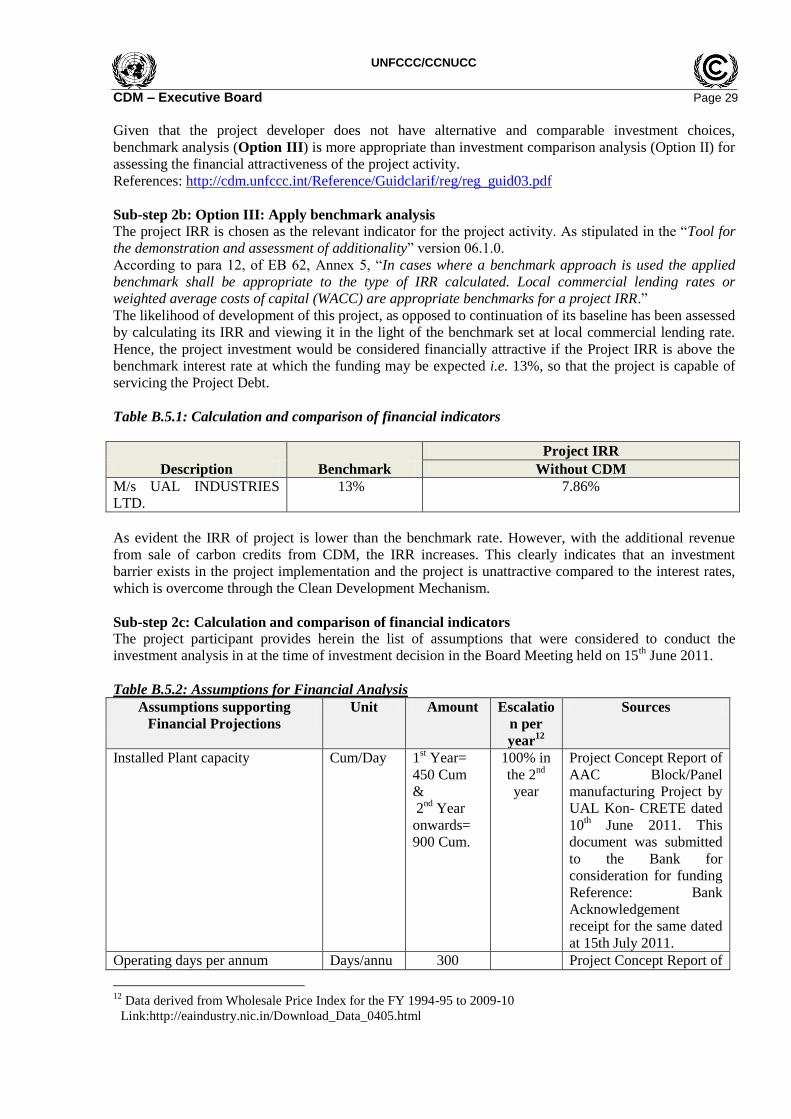
UNFCCC/CCNUCC
CDM – Executive Board Page 29
Given that the project developer does not have alternative and comparable investment choices,
benchmark analysis (Option III) is more appropriate than investment comparison analysis (Option II) for
assessing the financial attractiveness of the project activity.
References: http://cdm.unfccc.int/Reference/Guidclarif/reg/reg_guid03.pdf
Sub-step 2b: Option III: Apply benchmark analysis The project IRR is chosen as the relevant indicator for the project activity. As stipulated in the “Tool for
the demonstration and assessment of additionality” version 06.1.0.
According to para 12, of EB 62, Annex 5, “In cases where a benchmark approach is used the applied
benchmark shall be appropriate to the type of IRR calculated. Local commercial lending rates or
weighted average costs of capital (WACC) are appropriate benchmarks for a project IRR.”
The likelihood of development of this project, as opposed to continuation of its baseline has been assessed
by calculating its IRR and viewing it in the light of the benchmark set at local commercial lending rate.
Hence, the project investment would be considered financially attractive if the Project IRR is above the
benchmark interest rate at which the funding may be expected i.e. 13%, so that the project is capable of
servicing the Project Debt.
Table B.5.1: Calculation and comparison of financial indicators
Description Benchmark
Project IRR
Without CDM
M/s UAL INDUSTRIES
LTD.
13% 7.86%
As evident the IRR of project is lower than the benchmark rate. However, with the additional revenue
from sale of carbon credits from CDM, the IRR increases. This clearly indicates that an investment
barrier exists in the project implementation and the project is unattractive compared to the interest rates,
which is overcome through the Clean Development Mechanism.
Sub-step 2c: Calculation and comparison of financial indicators The project participant provides herein the list of assumptions that were considered to conduct the
investment analysis in at the time of investment decision in the Board Meeting held on 15th June 2011.
Table B.5.2: Assumptions for Financial Analysis
Assumptions supporting
Financial Projections
Unit Amount Escalatio
n per
year12
Sources
Installed Plant capacity Cum/Day 1st Year=
450 Cum
&
2nd
Year
onwards=
900 Cum.
100% in
the 2nd
year
Project Concept Report of
AAC Block/Panel
manufacturing Project by
UAL Kon- CRETE dated
10th June 2011. This
document was submitted
to the Bank for
consideration for funding
Reference: Bank
Acknowledgement
receipt for the same dated
at 15th July 2011.
Operating days per annum Days/annu 300 Project Concept Report of
12
Data derived from Wholesale Price Index for the FY 1994-95 to 2009-10
Link:http://eaindustry.nic.in/Download_Data_0405.html
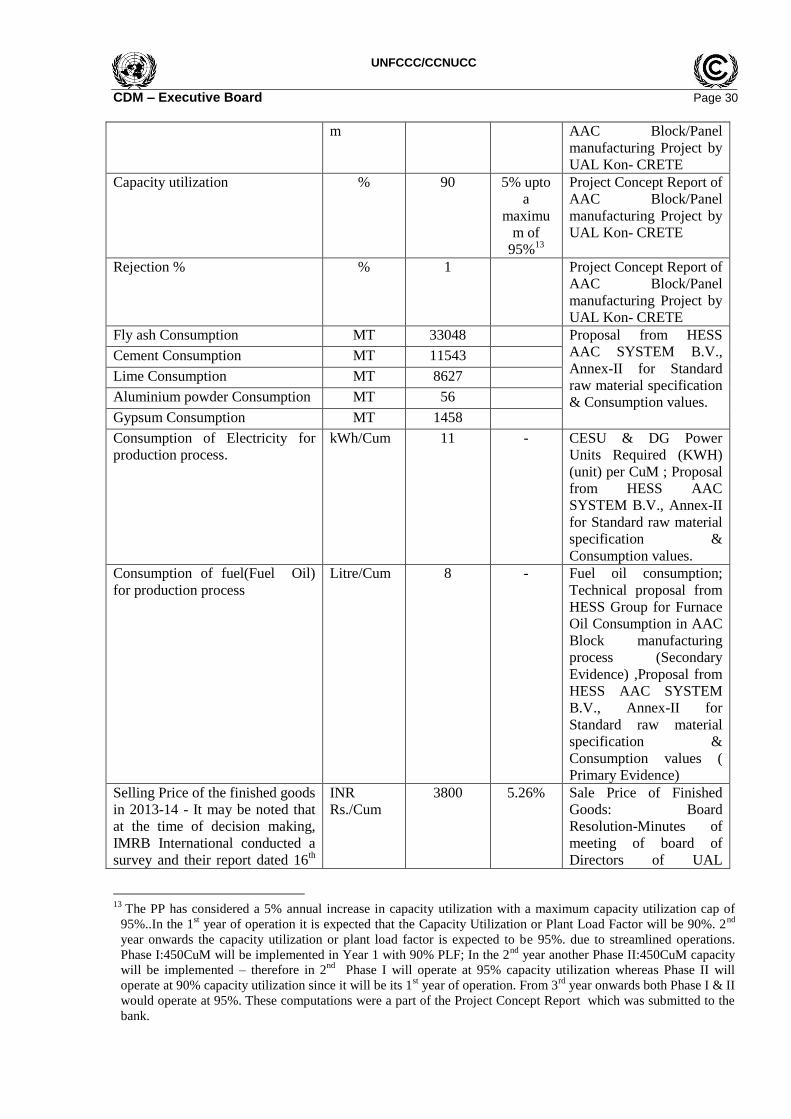
UNFCCC/CCNUCC
CDM – Executive Board Page 30
m AAC Block/Panel
manufacturing Project by
UAL Kon- CRETE
Capacity utilization % 90 5% upto
a
maximu
m of
95%13
Project Concept Report of
AAC Block/Panel
manufacturing Project by
UAL Kon- CRETE
Rejection % % 1 Project Concept Report of
AAC Block/Panel
manufacturing Project by
UAL Kon- CRETE
Fly ash Consumption MT 33048 Proposal from HESS
AAC SYSTEM B.V.,
Annex-II for Standard
raw material specification
& Consumption values.
Cement Consumption MT 11543
Lime Consumption MT 8627
Aluminium powder Consumption MT 56
Gypsum Consumption MT 1458
Consumption of Electricity for
production process.
kWh/Cum 11 - CESU & DG Power
Units Required (KWH)
(unit) per CuM ; Proposal
from HESS AAC
SYSTEM B.V., Annex-II
for Standard raw material
specification &
Consumption values.
Consumption of fuel(Fuel Oil)
for production process
Litre/Cum 8 - Fuel oil consumption;
Technical proposal from
HESS Group for Furnace
Oil Consumption in AAC
Block manufacturing
process (Secondary
Evidence) ,Proposal from
HESS AAC SYSTEM
B.V., Annex-II for
Standard raw material
specification &
Consumption values (
Primary Evidence)
Selling Price of the finished goods
in 2013-14 - It may be noted that
at the time of decision making,
IMRB International conducted a
survey and their report dated 16th
INR
Rs./Cum
3800 5.26% Sale Price of Finished
Goods: Board
Resolution-Minutes of
meeting of board of
Directors of UAL
13
The PP has considered a 5% annual increase in capacity utilization with a maximum capacity utilization cap of
95%..In the 1st year of operation it is expected that the Capacity Utilization or Plant Load Factor will be 90%. 2
nd
year onwards the capacity utilization or plant load factor is expected to be 95%. due to streamlined operations.
Phase I:450CuM will be implemented in Year 1 with 90% PLF; In the 2nd
year another Phase II:450CuM capacity
will be implemented – therefore in 2nd
Phase I will operate at 95% capacity utilization whereas Phase II will
operate at 90% capacity utilization since it will be its 1st year of operation. From 3
rd year onwards both Phase I & II
would operate at 95%. These computations were a part of the Project Concept Report which was submitted to the
bank.

UNFCCC/CCNUCC
CDM – Executive Board Page 31
Feb 2011, stated the optimum
price of the AAC block was
Rs.2250 per CuM. 42% of the
total builders showed interest in
using AAC Blocks for their future
projects – of these 42%, 68%
mentioned to use it at Rs 2250,
thus if we look at the overall
builder segment around 28%
would be willing to use this
product at the price of Rs.
2250/per cubic meter. Similarly
10% of the total builders would
be willing to use it at Rs 3500/per
cubic meter.
However with such low prices as
Rs 2250-3500 per CuM, the
project feasibility was found to be
very poor. Therefore the UAL
board set a target sale price of
Rs3800 per CuM so that the
project may be considered for
investment. It is worthwhile to
note that the sale price set is 9%
higher than the highest price
attainable and 69% higher than
the optimum price of Rs 2250 per
CuM.
Industries Limited held
on 15.06.2011. IMRB
International report dated
16th Feb 2011.
Cost of fly ash in 2010-11 INRRs/ton 212 0% Fly ash cost ;Proposal
from A.I. Enterprise
dated at 05.06.2011 ;
Cost of Cement in 2010-11 INR
Rs./ton
4115 4.69% Cement cost; Proposal
from Ultratech Cement
Ltd dated 29.05.2011
Cost of Lime in 2010-11 INR-
Million/ton
4080 -4.17% Lime cost; Proposal from
Niki Chemical Industries
dated at 28 .04.2011
Cost of Aluminium powder in
2010-11
INR-
Rs./ton
218985 4.64% Aluminium Cost;
Proposal from THE
ARASAN ALUMINUM
INDUSTRIES PVT.
LTD. Dated at
14.03.2011
Cost of Gypsum in 2010-11 INR-
Rs./ton
3369 4.63% Gypsum cost; Proposal
from Tanfac Industries
Limited dated at
29.03.2011
Furnace oil price in 2010-11 INR-
Rs./litre
29 11.30% Fuel Oil Price; Source
from MCX for the
statistical analysis for the
estimation of the fuel oil
price.
DG fuel Price in 2010-11 INR- 9.467 10.37% CESU & DG Power

UNFCCC/CCNUCC
CDM – Executive Board Page 32
Rs/litre Units Required (KWH)
(unit) per CuM ; Proposal
from HESS AAC
SYSTEM B.V., Annex-II
for Standard raw material
specification &
Consumption values
Transportation cost of finished
goods in 2010-11
INR-
Rs./Ton
739.66 10.37% Transportation cost of
Finished goods ;Freight
Details provided by
Pragati Carrier for the
month May 2011 dated at
01.06.2011
Fly ash Transportation in 2010-11 INR-
Rs./Ton
192.6 10.37% Fly ash cost ;Proposal
from A.I. Enterprise
dated at 05.06.2011 ;
Cement Transportation in 2010-
11
INR-
Rs./Ton
129 10.37% Cement cost; Proposal
from Ultratech Cement
Ltd dated 29.05.2011
Lime Transportation in 2010-11 INR-
Rs./Ton
3488 10.37% Lime cost; Proposal from
Niki Chemical Industries
dated at 28 .04.2011
Gypsum Transportation in 2010-
11
INR-
Rs./Ton
3488 10.37% Gypsum cost; Proposal
from Tanfac Industries
Limited dated at
29.03.2011
Aluminium Powder
Transportation in 2010-11
INR-
Rs./Ton
5129 10.37% Aluminium Cost;
Proposal from THE
ARASAN ALUMINUM
INDUSTRIES PVT.
LTD. Dated at
14.03.2011
Salary and wages in 2010-11 INR-
Rs./Cum
132 5.26% Salary and wages ; Sheet
for salary & wages detail
provided by the project
proponent
Tariff of Electricity in 2010-11 INR-
Rs./kWh
5.8 5.55% Electricity & DG Fuel
Cost; Statement for cost
of the power consumption
from Grid & D.G for the
period of 2010-11 dated
between June-May 2011.
Tariff rate of electricity purchased
from grid in 2013-14
INR
Rs./kWh
6.8 - Calculated; 5.55%
escalation per year of
Average unit charge (Rs./
Kwh) of June-May 2011
CESU power contribution 0.844 - Project Concept Report of
AAC Block/Panel
manufacturing Project by
UAL Kon- CRETE along
with the Bank
Acknowledgement
receipt for the same dated

UNFCCC/CCNUCC
CDM – Executive Board Page 33
at 15th July 2011.
CESU cost per Cum INR -Rs 63.31 - Calculated
DG power contribution 0.156 Project Concept Report of
AAC Block/Panel
manufacturing Project by
UAL Kon- CRETE along
with the Bank
Acknowledgement
receipt for the same dated
at 15th July 2011.
Total DG cost per Cum INR- Rs. 21.84 Calculated; DG Units
Required (KWH) (unit)
per CuM*Cost/KWH
(Rs.) of DG* DG power
assumed to be used
Total fuel cost per Cum in 2013-
14
INR- Rs. 405.03 - Calculated; Total CESU
Cost per CuM+Total DG
Cost per CuM+ Total fuel
Cost per CuM
Cost of stores and consumable in
2013-14
INR-
Rs./Cum
120.37 - Hess Proposal for
commissioning spare
parts dated at 24th May
2011.
Advertising expenses in 2013-14 % of sale
value
2% Project Concept Report of
AAC Block/Panel
manufacturing Project by
UAL Kon- CRETE along
with the Bank
Acknowledgement
receipt for the same dated
at 15th July 2011.
General administrative expenses
in 2013-14
INR-
Rs./Cum
88.89 Project Concept Report of
AAC Block/Panel
manufacturing Project by
UAL Kon- CRETE along
with the Bank
Acknowledgement
receipt for the same dated
at 15th July 2011.
Repair & maintenance Cost in
2013-14
INR –
Rs./Cum
88.56 UAL financial sheet
Interest Rate in 2013-14 % 13 Previous Bank agreement
for loan sanction
Moratorium Period
Years 2 Previous Bank agreement
for loan sanction
Total No. of Instalment Nos. 24 Previous Bank agreement
for loan sanction
Depreciation on Civil work % 3.34% Depreciation ; Rate of
Depreciation as per
Company Act 1956
Depreciation on plant &
machinery
% 10.34% Depreciation ; Rate of
Depreciation as per
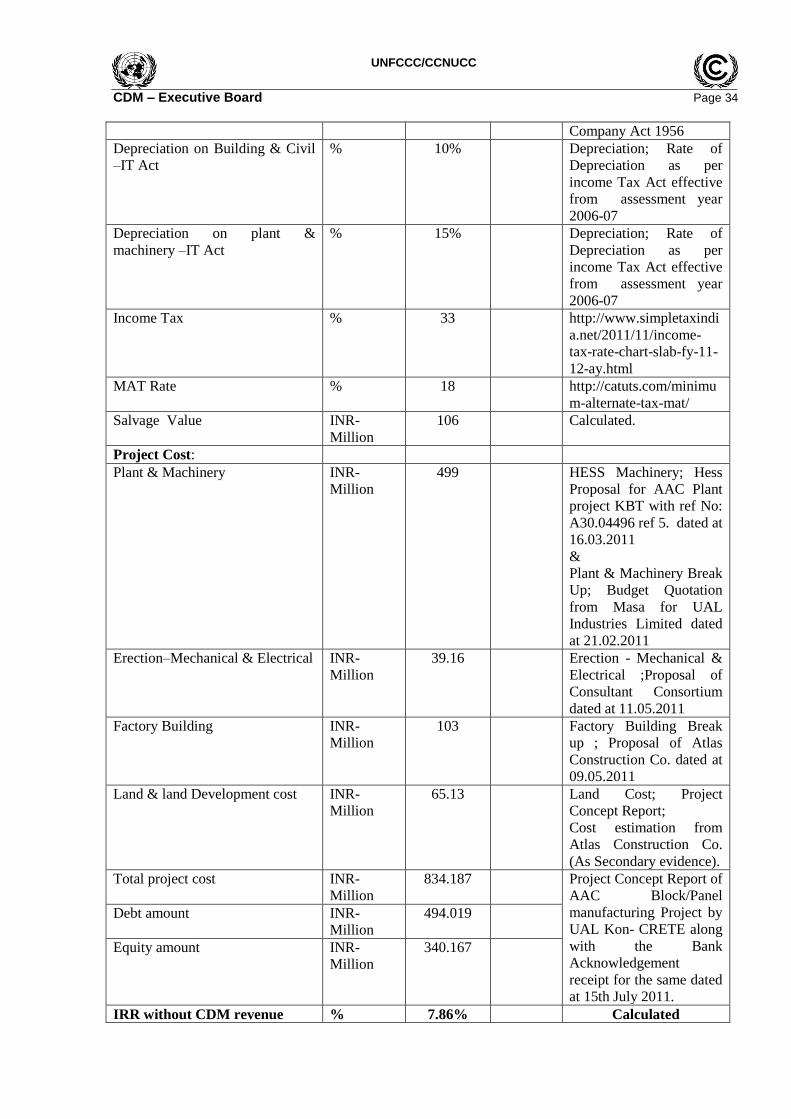
UNFCCC/CCNUCC
CDM – Executive Board Page 34
Company Act 1956
Depreciation on Building & Civil
–IT Act
% 10% Depreciation; Rate of
Depreciation as per
income Tax Act effective
from assessment year
2006-07
Depreciation on plant &
machinery –IT Act
% 15% Depreciation; Rate of
Depreciation as per
income Tax Act effective
from assessment year
2006-07
Income Tax % 33 http://www.simpletaxindi
a.net/2011/11/income-
tax-rate-chart-slab-fy-11-
12-ay.html
MAT Rate % 18 http://catuts.com/minimu
m-alternate-tax-mat/
Salvage Value INR-
Million
106 Calculated.
Project Cost:
Plant & Machinery INR-
Million
499 HESS Machinery; Hess
Proposal for AAC Plant
project KBT with ref No:
A30.04496 ref 5. dated at
16.03.2011
&
Plant & Machinery Break
Up; Budget Quotation
from Masa for UAL
Industries Limited dated
at 21.02.2011
Erection–Mechanical & Electrical INR-
Million
39.16 Erection - Mechanical &
Electrical ;Proposal of
Consultant Consortium
dated at 11.05.2011
Factory Building INR-
Million
103 Factory Building Break
up ; Proposal of Atlas
Construction Co. dated at
09.05.2011
Land & land Development cost INR-
Million
65.13 Land Cost; Project
Concept Report;
Cost estimation from
Atlas Construction Co.
(As Secondary evidence).
Total project cost INR-
Million
834.187 Project Concept Report of
AAC Block/Panel
manufacturing Project by
UAL Kon- CRETE along
with the Bank
Acknowledgement
receipt for the same dated
at 15th July 2011.
Debt amount INR-
Million
494.019
Equity amount INR-
Million
340.167
IRR without CDM revenue % 7.86% Calculated
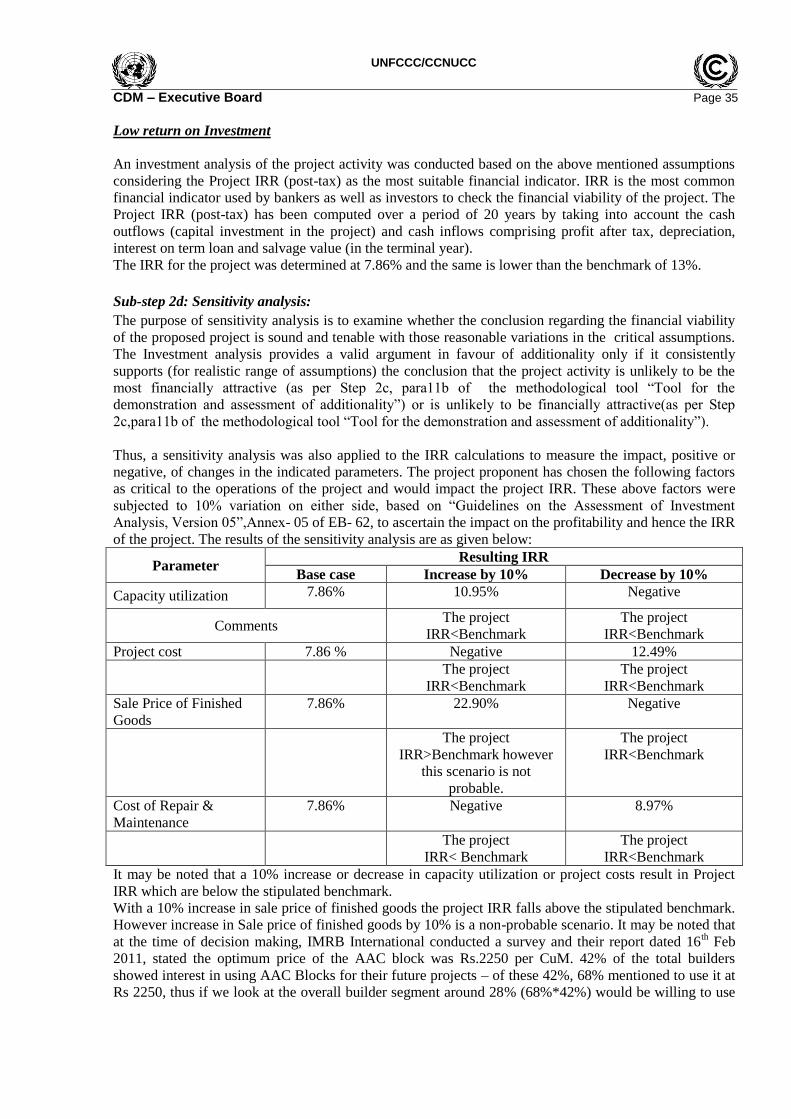
UNFCCC/CCNUCC
CDM – Executive Board Page 35
Low return on Investment
An investment analysis of the project activity was conducted based on the above mentioned assumptions
considering the Project IRR (post-tax) as the most suitable financial indicator. IRR is the most common
financial indicator used by bankers as well as investors to check the financial viability of the project. The
Project IRR (post-tax) has been computed over a period of 20 years by taking into account the cash
outflows (capital investment in the project) and cash inflows comprising profit after tax, depreciation,
interest on term loan and salvage value (in the terminal year).
The IRR for the project was determined at 7.86% and the same is lower than the benchmark of 13%.
Sub-step 2d: Sensitivity analysis:
The purpose of sensitivity analysis is to examine whether the conclusion regarding the financial viability
of the proposed project is sound and tenable with those reasonable variations in the critical assumptions.
The Investment analysis provides a valid argument in favour of additionality only if it consistently
supports (for realistic range of assumptions) the conclusion that the project activity is unlikely to be the
most financially attractive (as per Step 2c, para11b of the methodological tool “Tool for the
demonstration and assessment of additionality”) or is unlikely to be financially attractive(as per Step
2c,para11b of the methodological tool “Tool for the demonstration and assessment of additionality”).
Thus, a sensitivity analysis was also applied to the IRR calculations to measure the impact, positive or
negative, of changes in the indicated parameters. The project proponent has chosen the following factors
as critical to the operations of the project and would impact the project IRR. These above factors were
subjected to 10% variation on either side, based on “Guidelines on the Assessment of Investment
Analysis, Version 05”,Annex- 05 of EB- 62, to ascertain the impact on the profitability and hence the IRR
of the project. The results of the sensitivity analysis are as given below:
Parameter Resulting IRR
Base case Increase by 10% Decrease by 10%
Capacity utilization 7.86% 10.95% Negative
Comments The project
IRR<Benchmark
The project
IRR<Benchmark
Project cost 7.86 % Negative 12.49%
The project
IRR<Benchmark
The project
IRR<Benchmark
Sale Price of Finished
Goods
7.86% 22.90% Negative
The project
IRR>Benchmark however
this scenario is not
probable.
The project
IRR<Benchmark
Cost of Repair &
Maintenance
7.86% Negative 8.97%
The project
IRR< Benchmark
The project
IRR<Benchmark
It may be noted that a 10% increase or decrease in capacity utilization or project costs result in Project
IRR which are below the stipulated benchmark.
With a 10% increase in sale price of finished goods the project IRR falls above the stipulated benchmark.
However increase in Sale price of finished goods by 10% is a non-probable scenario. It may be noted that
at the time of decision making, IMRB International conducted a survey and their report dated 16th Feb
2011, stated the optimum price of the AAC block was Rs.2250 per CuM. 42% of the total builders
showed interest in using AAC Blocks for their future projects – of these 42%, 68% mentioned to use it at
Rs 2250, thus if we look at the overall builder segment around 28% (68%*42%) would be willing to use

UNFCCC/CCNUCC
CDM – Executive Board Page 36
this product at the price of Rs. 2250/per cubic meter. Similarly 10% of the total builders (42%*25%)
would be willing to use it at Rs 3500/per cubic meter.
However with such low prices as Rs 2250-3500 per CuM, the project feasibility was found to be very
poor. Therefore the UAL board set a target sale price of Rs 3800 per CuM so that the project may be
considered for investment. It is worthwhile to note that the sale price set is 9% higher than the highest
price attainable and 69% higher than the optimum price of Rs 2250 per CuM. With a 10% increase in the
highest sale price attainable as per the IMRB Report i.e. 3500, the Project IRR is 12.68% which is lower
than the benchmark of 13%. Further it may be noted that the sale price has been escalated in line with the
inflation rates. Therefore further sensitivity on the sale price of finished goods was not found to be
appropriate.
Parameter
Base Case: 7.86%; Benchmark: 13%
Variation at
which IRR will be
equal/breach the
benchmark
IRR Comments
Capacity
utilization
10% 10.95% Since capacity utilization factor range can be 90-95%
no further change in Project IRR with any further
increase in variation.
Project cost
-12% 13.24% Reduction in Project Cost by 12% is a non-probable
scenario. Latest project cost estimates re-affirm that
the project costs have increased from the date of
decision making.
Sale Price of
finished Goods
2% 14.04% Increase of 2% of the sale price of finished goods is a
non-probable scenario because as stated above, the
sale price value assumed herein is 69% above the
optimum sale price and 9% above the highest sale
price expected.
Cost of Repair
& Maintenance
-89% 13.02% Reduction in Cost of Repair & maintenance by 89% is
a non-probable scenario.
Further the following parameters were considered but found to constitute less than 20% of the project
costs and project revenue. Therefore these parameters were not subject to variations.
Parameter Value
% Variation
with Project
Cost
% Variation
with Project
Revenue
Project Cost 8342 x
Sales Value 9890 x
Total Flyash Cost (Lakh INR) 338 4% 3%
Total Lime Cost 1528 18% 15%
Total Cement Cost 1218 15% 12%
Total Gypsum Cost 276 3% 3%
Total Aluminium Cost 310 4% 3%
Total Cost of Power and Fuel 1114 13% 11%
Total Salary & Administration Cost (INR) 637 8% 6%
Total Transportation Cost 1357 16% 14%
Total Packaging Cost 275 3% 3%
Total Advertising Cost 198 2% 2%
UNFCCC/CCNUCC
CDM – Executive Board Page 37
Thus, the sensitivity analysis reveals that even with significant changes in various parameters, the project
IRR does not cross benchmark rate. Therefore, the project is additional and is not a business – as – usual
Scenario. The project can become financially attractive only with the CDM benefit.
The project activity has lower returns than the benchmark returns calculated at the time of investment
decision. Even the 10% increase in the important parameters that affects the returns on the project does
not make project financially viable in the absence of the CDM revenue. Thus, the CDM revenue is
critical for the financial viability of the project activity.
In view of the above it is concluded that CDM project activity is unlikely to be the most financially
attractive proposition.
CDM Consideration
As per the requirement of EB 48, Annex 61; for project activities with a starting date on or after 02
August 2008, the project participant must inform a Host Party DNA and the UNFCCC secretariat in
writing of the commencement of the project activity and of their intention to seek CDM status. Such
notification must be made within six months of the project activity start date and shall contain the precise
geographical location and a brief description of the proposed project activity, using the standardized
form F-CDM Prior Consideration.
A duly filled Prior Consideration Form has thus been sent to UNFCCC and host country DNA (Ministry
of Environment and Forests, MoEF)14
. The start date of the project activity is 28th July 2011
15, date on
which first work order was issued for the project while prior consideration form was submitted to
UNFCCC and MoEF (Host Country DNA) on 17 the January 2012, i.e., within a period of six months
from start date.
B.6. Emission reductions
B.6.1. Explanation of methodological choices
>>Methodology Applied: AMSIIIZ. “Fuel Switch, process improvement and energy efficiency in brick
manufacture”
Link;
http://cdm.unfccc.int/filestorage/R/H/E/RHEASNU01VILTFY6ZG7W3XDKOCBM59/EB67_repan21_
Revisionof%20AMS-III.Z_ver04.0.pdf?t=Snp8bWV4NHNlfDAkmUBMd0ZaBlU9IrotCghV
Version 4.0
Valid from 25th May 2012 onwards
Applied Methodological Tool:
1.“Tool to calculate project or leakage CO2 emissions from fossil fuel combustion” Version 02, Annex
11, EB 41.
http://cdm.unfccc.int/methodologies/PAmethodologies/tools/am-tool-03-v2.pdf
2.“Tool to calculate baseline, project and/or leakage emissions from electricity consumption”, Version
01,Annex 7,EB 39.
http://cdm.unfccc.int/methodologies/PAmethodologies/tools/am-tool-05-v1.pdf
3. “Tool for the demonstration and assessment of additionality””, Version (06.1.0), (EB 69)
http://cdm.unfccc.int/methodologies/PAmethodologies/tools/am-tool-01-v6.1.0.pdf
4. “Guidelines on the Assessment of Investment Analysis, Version 05”
http://cdm.unfccc.int/Reference/Guidclarif/reg/reg_guid03.pdf
Emission reduction:
Emission reduction as the result of the project activity is calculated using the following equation:
14
Prior consideration sent to UNFCCC & NCDMA 15
Work Order dated 28th July 2011 issued by UAL –Kon_CRETE to HESS AAC System B.V for the
supply of Plant and machinery and technical documentation for the autoclaved aerated concrete plant
project.
UNFCCC/CCNUCC
CDM – Executive Board Page 38
ERy =BEy- PEy –LEy (1)
Where,
ERy Emission reduction in year y (tCO2e/yr)
BEy Baseline emission in year y (tCO2e/yr)
PEy Project emissions in year y (tCO2/yr)
LEy Leakage emissions in year y (tCO2/yr)
As per the approved methodology the emission associated with baseline, project and the leakage are
calculated as below in series:
Baseline Emission:
“The baseline emissions are the fossil fuel consumption related emissions (fossil fuel consumed multiplied
by an emissions factor) associated with the system(s), which were or would have otherwise been used, in
the brick production facility (ies) in the absence of the project activity.”
As per Section B.4 of the PDD, the baseline to the project activity is – Production of equivalent baked
clay bricks with the FC-BTK technology. For clay brick production process the baseline emissions can be
calculated as below:
BEy=EFBL×PPJ,y (2)
Where,
BE y The annual baseline emission from fossil fuels displaced by the project activity in tCO2e in
year y (of the crediting period).
EF BL The annual production specific emission factor for year y, in tCO2/Kg or m3.
P PJ,y The annual net production of the facility in year y, in kg or m3.
As per the methodology, paragraph 17, “Annual production specific emission factor (EFBL) for
installation of systems in a new facility or for capacity addition in an existing system shall be determined
using one of the options below:
(a) Using manufacturers‟ specifications such as for brick production rate, energy consumption in the
process;
(b) Using specifications of comparable units having similar techno-economic parameters;
(c) Using reference plant approach”
In the project activity scenario annual production specific emission factor for installation of systems in a
new facility is determined using option (b) as stated above.
Indian Brick Industry falls under the unorganized small and medium enterprise category, wherein the
economic considerations are comparable.
It may further be noted that annual production specific emission factor for the baseline has been estimated
for FC-BTK technology based units operational in India with comparable production capacity in the
range of 15,000-50,000 bricks per day, same technology, similar regulatory environment throughout the
country and comparable economic parameters. However, the specific energy consumption in BTKs
depends on the operation practices, clay characteristics, quality of the product, fuel used, local climatic
conditions etc. The specific energy consumption varies between 1.1 MJ per kg to 2.0 MJ per kg of fired
bricks. Therefore as per 14(b) average annual baseline fossil fuel consumption value is determined for
computation of annual production specific emission factor based on average specific energy consumption
in BTK operational in India, net calorific value of coal and biomass adjustment factor.
Coal is the fossil fuel, which are generally used in the traditional brick manufacturing. j is the fuel
type considered in the baseline scenario is with 98% Coal with 2% Biomass used as the adjustment
factor as detailed out in the section B.4
UNFCCC/CCNUCC
CDM – Executive Board Page 39
Leakage Emissions:
As per the paragraph. 18 & 19 of the methodology,,
“Leakage emissions on account of the diversion of biomass from other uses (competing uses) shall be
calculated as per “General guidance on leakage in biomass project activities”.
“In the case of project activities involving change in production process or a change in type and quantity
or raw and /or additive materials as compared with the baseline, the incremental emissions associated
with the production/ consumption and transport of those raw materials consumed as compared to
baseline, shall be calculated as leakage.”
As per the methodology, the project activity entails two types of leakage due to change in production
process which leads to change in type and quantity of raw and/or additive materials as compared to
baseline
- Emissions associated with consumption of raw and/or additive materials
- Emissions associated with transportation of raw and/or additive materials
The applicable equation is as below for calculating the leakage emission:
LEy = LErm,prod,y+ LETR,m (4)
Where,
LEy Leakage emissions associated with consumption and transport of raw and/or additive
materials in the year y.
LErm,prod,y Leakage emissions associated with consumption of raw and/or additive materials in the
year y
LETR,m Leakage emission associated with transportation of raw and/or additive materials in the
year y
Leakage emission associated with consumption of raw and/or additive materials:
Aluminium Powder & Gypsum are used for the production of AAC block at very lower amount. In this
project cement and lime are two major inputs with significant emissions during their production; the fraction of
the contribution of Aluminium Powder & Gypsum in per Cum AAC Block production is very lower. However
the Leakage due to the Allumium Powder production has been considered as a conservative approach.
On the other hand, the Gypsum is a by product from hydrofluoric acid and fertiliser industries which is
available commercially in the market..Thus it needs not to be considered in the leakage computation.
LErm,prod,y = Qcement,y × EFcement + Qlime,y × EFlime + QAluminium,,y × EFAluminium (5)
where,
LErm,prod,y Leakage emissions associated with consumption of raw and/or additive materials in the
year y
Qcement,y Quantity of cement consumed for the production of AAC blocks/panels in the year y.
EF cement CO2 emission factor of the cement production.
Qlime,y Quantity of lime consumed for the production of AAC blocks/panels in the year y.
EF lime CO2 emission factor of the lime production.
QAluminium,y Quantity of Aluminium Powder consumed for the production of AAC blocks/panels in
the year y.
EFAluminium CO2 emission factor of the Aluminium production.

UNFCCC/CCNUCC
CDM – Executive Board Page 40
Leakage emission due to raw material transportation:
As per the methodological tool “Project and leakage emissions from road transportation of freight”
Version 01 the emissions due to the raw material transportation can be calculated as below:
LE TR,m= ∑ Dfm xFRf,mxEF CO2,f x10-6
(6)
Where,
LE TR,m Leakage emission from road transportation of freight monitoring period m (tC02).
Dfm Return trip road distance between the origin and destination of freight transportation
activity f in monitoring period m (km).
FRf,m Total mass of freight transported in freight transportation activity f in monitoring
period m (t).
EF CO2,f Default CO2 emission factor for freight transportation activity f (g CO2 / t km).
f Freight transportation activities conducted in the project activity in monitoring
period m
Project emission:
As per approved methodology project activity emissions (PEy) consist of those emissions associated with
the use of electricity from grid and fossil fuel (nd Fuel oil).The emission during the project activity can be
calculated in accordance with the “Tool to calculate baseline, project and /or leakage emissions from
electricity consumption”, “Tool to calculate the emission factor for an electricity system”16
, version 2.2.1
and “Tool to calculate project or leakage CO2 emissions from fossil fuel combustion” (tCO2e).
The project activity will consume
- Fossil fuel (Fuel Oil) for its high-pressure steam-curing operations and the associated project
emissions will be computed in line with the “Tool to calculate project or leakage CO2 emissions
from fossil fuel combustion”.
- Electricity for its operations, which will primarily be sourced from grid with a standby option
from Diesel Generator Set; and the associated project emissions, will be computed in line with
the “Tool to calculate baseline, project and/or leakage emissions from electricity consumption”
and
Therefore as per eq.20 of applied methodology;
The project emissions should be calculated as follows:
yCHyncultivatioytransportyfossilfuelyelec PEPEPEPEPE ,4,,,,yPE (7)
Where:
yPE Project emissions in year y (tCO2)
yelecPE , Project emissions due to electricity consumption in year y (tCO2)
yfossilfuelPE , Project emissions due to fossil fuel consumption in year y (tCO2)
16
http://cdm.unfccc.int/methodologies/PAmethodologies/tools/am-tool-07-v2.pdf
UNFCCC/CCNUCC
CDM – Executive Board Page 41
ytransportPE , Project emissions from transportation of the renewable biomass from the places of
their origin to the manufacturing facility site in year y (tCO2)
yncultivatioPE , Project emissions from renewable biomass cultivation in year y (tCO2e)
yCHPE ,4 Project emissions due to the production of charcoal in kilns not equipped with a
methane recovery and destruction facility in year y (tCO2e)
Calculation of yelecPE ,
“The emissions include electricity consumption (including auxiliary use) yelecPE , associated with the
operation of the manufacturing process and the biomass treatment and processing, calculated as per the
tool “Tool to calculate baseline, project and/or leakage emissions from electricity consumption”.
The project emission from the consumption of electricity can be calculated from the methodological tool
“Tool to calculate baseline, project and/or leakage emission from electricity consumption”, Version 01,
EB 39, Annex 717
are as follows:
Electricity is used for the operation of the manufacturing process. However there is no electricity
associated with the biomass treatment and processing since no biomass is used in the project activity.
In the generic approach, project emissions from consumption of electricity is calculated based on the
quantity of electricity consumed, an emission factor for electricity generation and a factor to account for
transmission losses, as follows:
PE EC,y = ∑ EC PJ,j,y X EF EL,j,y X (1+ TDL j,y) (8)
PEEC,y
= Project emissions from electricity consumption in year y (tCO2/yr)
ECBL,k,y
= Quantity of electricity that would be consumed by the baseline electricity consumption
source k in year y (MWh/yr)
EFEL,j,y
= Emission factor for electricity generation for source j in year y (tCO2/MWh)
TDLj,y
= Average technical transmission and distribution losses for providing electricity to source
j in year y
j = Sources of electricity consumption in the project
As per the tool, the following three scenarios apply to the sources of electricity consumption:
Scenario A: Electricity consumption from grid.
Scenario B: Electricity consumption from (an) off-grid fossil fuel fired captive power plants(s).
Scenario C: Electricity consumption from the grid and (a) fossil fuel fired captive power plants.
Scenario C: Electricity consumption from the grid and (a) fossil fuel fired captive power plant(s)
Under this scenario, the consumption of electricity in the project, the baseline or as a source of leakage
may result in different emission levels, depending on the situation of the project activity. The following
three cases can be differentiated:
Case C.I: Grid electricity. The implementation of the project activity only affects the quantity of
electricity that is supplied from the grid and not the operation of the captive power plant. This applies, for
example,
17
http://cdm.unfccc.int/methodologies/PAmethodologies/tools/am-tool-05-v1.pdf
UNFCCC/CCNUCC
CDM – Executive Board Page 42
If at all times during the monitored period the total electricity demand at the site of the captive
power plant(s) is, both with the project activity and in the absence of the project activity, larger
than the electricity generation capacity of the captive power plant(s); or
If the captive power plant is operated continuously (apart from maintenance) and feeds any
excess electricity into the grid, because the revenues for feeding electricity into the grid are above
the plant operation costs; or
If the captive power plant is centrally dispatched and the dispatch of the captive power plant is
thus outside the control of the project participants.
Case C.II: Electricity from captive power plant(s). The implementation of the project activity is clearly
demonstrated to only affect the quantity of electricity that is generated in the captive power plant(s) and
does not affect the quantity of electricity supplied from the grid. This applies, for example, in the
following situation: A fixed quantity of electricity is purchased from the grid due to physical
transmission constraints, such as a limited capacity of the transformer that provides electricity to the
relevant source. In this situation, case C.II would apply if the total electricity demand at the site of the
captive power plant(s) is at all times during the monitored period, both with the project activity and in
the absence of the project activity, larger than the quantity of the electricity that can physically be
supplied by the grid. Case C.III: Electricity from both the grid and captive power plant(s). The implementation of the
project activity may affect both the quantity of electricity that is generated in the captive power plant(s)
and the quantity of electricity supplied from the grid. This applies, for example: If the captive power plant(s) is/are not operating continuously; or If grid electricity is purchased
during a part of the monitored period; or
If electricity from the captive power plant is fed into the grid during a part of the monitored
period.
The project plant would consume the electricity from grid and Diesel Generator Set in absence of grid
connectivity i.e. “the captive power plant(s) is/are not operating continuously”, thus the applicable criteria
is Scenario C.
Where case C.III has been identified, as a conservative simple approach, the emission factor for
electricity generation should be the more conservative value between the emission factor determined as
per guidance for scenario A and B respectively.
Scenario A: Electricity consumption from the grid:
In this case, project participants may choose among the following options:
Option A1: Calculate the combined margin emission factor of the applied electricity system, using the
procedures in the latest approval version of the “Tool to calculate the emission factor for an electricity
system” (EF EL,j/k/l,y = EF grid,CM,y ).
Option A2: Use the following conservative default values:
• A value of 1.3 tCO2 /MWh if
(a) Scenario A applied only to project and/or leakage electricity consumption sources but not to
baseline electricity consumption sources ;or
(b) Scenario A applied to: both baseline and project (and /or leakage) electricity consumption
sources; and the electricity consumption of the project and leakage sources is greater than the
electricity consumption of the baseline sources.
• A value of 0.4 tCO2/MWh for electricity grids where hydro power plants constitute less than 50% of
total grid generation in 1) average of the five most recent years ,or 2) based on long-term averages for
hydroelectricity production, and a value of 0.25 tCO2/MWh for other electricity grids. These values can
be used if

UNFCCC/CCNUCC
CDM – Executive Board Page 43
(a) Scenario A applied only to baseline electricity consumption sources but not to project or leakage
electricity consumption sources; or
(b) Scenario A applied to: both baseline and project (and/or leakage) electricity consumption
sources; and the electricity consumption of the baseline sources is greater than the electricity
consumption of the project and leakage sources.
The project emissions from electricity consumption can be calculated based on the quantity of electricity
consumed from grid by the use of Option A1 of the Scenario A.
To calculate the combined margin emission factor of the applicability system the PP have used the procedures
in the latest approved version of the “Tool to calculate the emission factor for an electricity system” Ver.
02.2.1, EB 19, Annex 19.
The following steps are applied for calculating the combined margin emission factor:
STEP 1: Identify the relevant electricity systems;
STEP 2: Choose whether to include off-grid power plants in the project electricity system (optional);
STEP 3: Select a method to determine the operating margin (OM);
STEP 4: Calculate the operating margin emission factor according to the selected method;
STEP 5: Calculate the build margin (BM) emission factor;
STEP 6: Calculate the combined margin (CM) emission factor.
Step 1: Identify the relevant electricity systems
For determining the electricity emission factors, identify the relevant project electricity system
Similarly, identify any connected electricity systems. If a connected electricity system is located partially
or totally in Annex-I countries, then the emission factor of that connected electricity system should be
considered zero.
If the DNA of the host country has published a delineation of the project electricity system and connected
electricity systems, these delineations should be used. If this information is not available, project
participants should define the project electricity system and any connected electricity system, and justify
and document their assumptions in the CDM-PDD.
Since the Project Participant (PP) has proposed to establish their project activity of the manufacturing
facility of the AAC block/panel manufacturing unit at Howrah, West Bengal, the PP is will draw the
electricity from the eastern regional grid system which is a part of the NEWNE grid.
Therefore NEWNE grid is the regional grid system for the relevant electricity system.
Step 2: Choose whether to include off-grid power plants in the project electricity system (optional)
Only grid power plants are included in the calculation.
Step 3: Select a method to determine operating margin (OM) As per the tool, the calculation of the operating margin emission factor (EFgrid, OM,y) can be calculated by
any of the following:
(a) Simple OM, or
(b) Simple adjusted OM, or
(c) Dispatch data analysis OM, or
(d) Average OM
Simple OM method (Option a) has been adopted.
UNFCCC/CCNUCC
CDM – Executive Board Page 44
Step 4. Calculate the operating margin (OM) emission factor according to the selected method.
The Central Electricity Authority (CEA) of Government of India (GOI) has calculated based on the
weighted average of the CO2 Operating Margin emission factor of NEWNE Grid. The following table
gives the average of the CO2 Operating Margin emission for the last three financial year of 2008-09,
2009-10 & 2010-11:
Grid Operating Margin (OM)
NEWNE
Year Values Net Generation
in Operating
Margin
Product
2008-09 1.020625307 421802.6329 430502.44
2009-10 0.989137344 458043.0846 453067.52
2010-11 0.98207948 476986.7213 468438.87 Weighted
Average 0.996444951 1356832.439 1352008.833
Step 5. Calculate the build margin (BM) emission factor
Central Electricity Authority (CEA) of Government of India has calculated the CO2 Build Margin
emission factor of NEWNE Grid for the year 2010-11. The following table gives the CO2Build Margin
emission factor of NEWNE Grid as provided by CEA in “CO2 Baseline Database for the Indian Power
Sector / Version 7.0 dated January 2012”.
Grid Year BM
NEWNE 2010-11 0.858781329
Step 6. Calculate the combined margin (CM) emission factor
As per the “Tool to calculate the emission factor for an electricity system” Ver. 02.2.1, Annex 19 EB 63:
The combined margin emissions factor is calculated as follows:
BMyBMgridOMyOMgridyCMgrid wEFwEFEF ,,,,,, (9)
Where:
EFgrid,BM,y Build margin CO2 emission factor for the year y (tCO2/MWh)
EFgrid,OM,y Operating margin CO2 emission factor for the year y (tCO2/MWh)
wOM Weighting of operating margin emission factors (%)
wBM Weighting of build margin emission factors (%)
The following default values should be used for WOM and WBM
• Wind and solar power generation project activities: WOM = 0.75 and WBM = 0.25 (owing to their
intermittent and non-dispatch able nature) for the first crediting period and for subsequent Crediting
periods;
• All other projects: WOM = 0.5 and WBM = 0.5 for the first crediting period, and WOM = 0.25 and WBM=
0.75 for the second and third crediting period, unless otherwise specified in the approved methodology
which refers to this tool. Alternative weights can be proposed, as long as WOM + WBM = 1, for
consideration by the Executive Board, taking into account the guidance as described below. The values
for WOM+ WBM applied by project participants should be fixed for a crediting period and may be revised
at the renewal of the crediting period.
As stated above, the tool specifies that for other project activities: wOM = 0.5 and wBM =0.5 for the first
crediting period.
UNFCCC/CCNUCC
CDM – Executive Board Page 45
The Central Electricity Authority (CEA), under the Ministry of Power, Government of India, has
estimated the operating margin of the NEWNE grid to be 0.99 (the average of last three years) and the
build margin to be 0.86. These values are taken from version 7.0, the most recently available data
published by the Central Electricity Authority in January 2012.
Therefore the combined margin emission factor of the NEWNE Grid (Excluding Import) has been be
calculated as,
Description tCO2/MWh
Operating Margin 0.9964
Build Margin 0. 8587
Combined Margin (0.9964 *0.5)+( 0. 8587 *0.5) = 0.9276
Hence, the combined margin emission factor for the NEWNE Grid is 0.9276 tCO2e/ MWh.
Scenario B: Electricity consumption from an off-grid captive power plant
In this case, project participants may choose among the following options:
Option B1: The emission factor for electricity generation is determined based on the CO2 emissions from
fuel combustion and the electricity generation in the captive power plant (s) installed at the site of the
electricity consumption source.
The emission factor of the captive power plant(s) is calculated as follows:
EF EL,j/k/l,y = (∑∑FC n,i,t X NCV i,t X EF CO2,i,t)/∑ EGn,t (10)
EFEL,j/k/l,y
= Emission factor for electricity generation for source j, k or l in year y (tCO2/MWh)
FCn,i,t
= Quantity of fossil fuel type i fired in the captive power plant n in the time period t
(mass or volume unit)
NCVi,t
= Average net calorific value of fossil fuel type i used in the period t (GJ / mass or
volume unit)
EFCO2,i,t
= Average CO2 emission factor of fossil fuel type i used in the period t (tCO
2 / GJ)
EGn,t
= Quantity of electricity generated in captive power plant n in the time period t (MWh)
i = are the fossil fuel types fired in captive power plant n in the time period t
j = Sources of electricity consumption in the project
k = Sources of electricity consumption in the baseline
l = Leakage sources of electricity consumption
n = Fossil fuel fired captive power plants installed at the site of the electricity
consumption source j, k or l
t = Time period for which the emission factor for electricity generation is determined
(see further guidance below)
Option B2: Use the following conservative default values:
• A value of 1.3 tCO2/MWh if
(a) The electricity consumption source is a project or leakage electricity consumption source; or
(b) The electricity consumption source is a baseline electricity consumption source; and the electricity
consumption of all baseline electricity consumptions sources at the site of the captive power plant(s) is
less than the electricity consumption of all project electricity consumption sources at the site of the
captive power plant(s).
• A value of 0.4 tCO2/MWh if

UNFCCC/CCNUCC
CDM – Executive Board Page 46
(a) The electricity consumption source is a baseline electricity consumption source; or
(b) The electricity consumption source is a project electricity consumption source and the electricity
consumption of all baseline electricity consumptions sources at the site of the captive power plant(s) is
greater than the electricity consumption of all project electricity consumption sources at the site of the
captive power plant(s).
Option B1 was adopted to determine the Emission Factor of electricity under Scenario B;
The emission factor for NEWNE Grid is 0.9276 tCO2/MWh where as the calculated value of emission
factor for the DG set (750 kVA) is 0.5984 tCO2/MWh, which has been computed & derived as below;
DG Set Emission Factor
NCV of Diesel (TJ/ton) 0.04
2006 IPCC Guidelines for National
Greenhouse Gas Inventories, Table 1.2-
Default Net Calorific Values (NCVs) and
Upper limit of the 95% confidence intervals.
CO2 emission factor (TCO2/TJ) 74.8
2006 IPCC Guidelines for National
Greenhouse Gas Inventories Table 1.4 –
Default CO2 emission factors for
combustion, Upper value of 95% confidence
interval
Specific fuel consumption(
kg/kWh) 0.2 Manufacturer‟s data input
Emission factor of DG Set 0.5984 tCO2/MWh
So emission factor for electricity generation determined as per guidance for scenario A: Electricity
consumption from the grid was found to higher and therefore more conservative than emission factor for
electricity generation determined as per guidance for scenario B: Electricity consumption from an off-grid
captive power plant.
Calculation of yfossilfuelPE ,
“The emissions include fossil fuel consumption (including auxiliary use) yfossilfuelPE , associated with the
operation of the manufacturing process and the biomass treatment and processing, calculated as per the
“Tool to calculate project or leakage CO2 emissions from fossil fuel combustion”.
As per Baseline Methodology Procedure of the “Tool to calculated project or leakage CO2 emissions from
fossil fuel combustion” Version 02, the CO2 emission from fossil fuel combustion in process j are
calculated based on the quantity of fuels combusted and the CO2 emission coefficient of those fuels ,as
follows:
PEFC,j,y = ∑FC i,j,y × COEF i,y (11)
Where,
PEFC,j,y Are the CO2 emissions from fossil fuel combustion in process j during the year y (tCO2/yr).
FCi,j,y Is the quantity of fuel type i combusted in process j during the year y (mass or volume
unit/yr).
COEFi,y Is the CO2 emission co-efficient of fuel type i in year y (tCO2/mass or volume unit).
i Are the fuel types combusted in process j during the year y.

UNFCCC/CCNUCC
CDM – Executive Board Page 47
Fuel oil is used as the fuel type i for the production activity of the AAC blocks/panels. There is no fossil
fuel consumption associated with the biomass treatment and processing since no biomass is used in the
project activity.
The CO2 emission co efficient COEFi,y can be calculated using one of the following two options
,depending on the availability of data on the fossil fuel type i, as follows:
Option A: The CO2 emission coefficient COEF
i,y is calculated based on the chemical composition of the
fossil fuel type i, using the following approach:
If FCi,j,y
is measured in a mass unit: COEF i,y = W c,i,y x 44/12 (i)
If FCi,j,y
is measured in a volume unit: COEF i,y = W c,i,y xⱣ i,y x 44/12 (ii)
Where,
COEFi,y Is the CO2 emission coefficient of fuel type i (tCO
2/mass or volume unit);
W c,i,y Is the weighted average mass fraction of carbon in fuel type i in year y (tC/mass unit of the
fuel);
Ᵽ i,y Is the weighted average density of fuel type i in year y (mass unit/volume unit of the fuel)
i Are the fuel types combusted in process j during the year y.
Option B:
The CO2 emission coefficient COEFi,y is calculated based on net calorific value and CO2 emission factor
of fuel type i ,as follows:
COEFi,y = NCV i,y × EFCO2,i,y (12)
Where:
COEFi,y Is the CO2 emission of fuel type i in year y (tCO2/mass or volume unit).
NCVi,y Is the weighting average net calorific value of the fuel type i in year y (GJ/mass or volume
unit).
EF CO2,i,y Is the weighted average CO2 emission factor of type i in year y (tCO2/GJ).
i Are the fuel types combusted in process j during the year y.
The Option B has been adopted in the project case to calculate the project emissions.
UNFCCC/CCNUCC
CDM – Executive Board Page 48
Calculation of ytransportPE ,
“Project emissions from the transportation of the renewable biomass from its source to the
manufacturing production site shall be accounted for following the procedures in AMS-III.AK “Biodiesel
production and use for transport applications” if the transportation distance is more than 200 km,
otherwise they can be neglected.”
PP does not opt for any use of renewable biomass for their AAC Block/Panel manufacturing process.
Electricity & Coal are the only sources of the energy for their production process. So there is no scope of
transportation of the renewable biomass from its source to the manufacturing plant and the parameter
ytransportPE , is zero for the project activity.
Calculation of yncultivatioPE ,
“In cases where the project activity utilizes biomass sourced from dedicated plantations, the project
emissions from renewable biomass cultivation shall be calculated as per the relevant provisions of AMS-
III.AK “Biodiesel production and use for transport applications”.
The proposed project does not involve utilizing any biomass sourced from dedicated plantation. So the
emission from renewable biomass cultivation is considered as zero.
Calculation of yCHPE ,4
“The project methane emissions from the charcoal produced in kilns not equipped with a methane
recovery and destruction facility and methane emissions from the production of charcoal shall be
accounted for as per the relevant procedures of AMS-III.K “Avoidance of methane release from charcoal
production by shifting from traditional open-ended methods to mechanized charcoaling process”.
Alternatively, conservative emission factor values from peer reviewed literature or from a registered
CDM project activity can be used, provided that it can be demonstrated that the parameters from these
are comparable, e.g. the source of biomass, characteristics of biomass such as moisture, carbon content,
type of kiln and operating conditions such as ambient temperature.”
PP does not involve any use of charcoal in the project activity. Basically it is an Autoclaved curing
process. The AAC blocks are to be processed through Autoclaved curing method. So there is no scope of
generation of methane emission from the project activity.
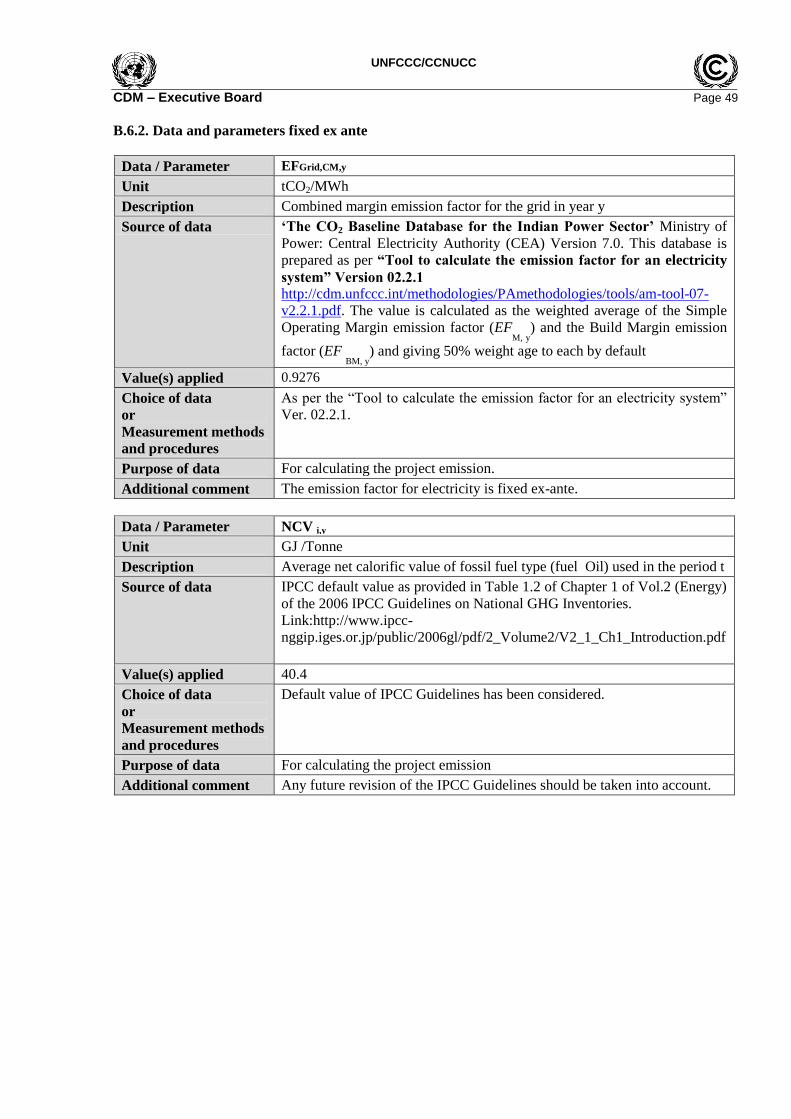
UNFCCC/CCNUCC
CDM – Executive Board Page 49
B.6.2. Data and parameters fixed ex ante
Data / Parameter EFGrid,CM,y
Unit tCO2/MWh
Description Combined margin emission factor for the grid in year y
Source of data „The CO2 Baseline Database for the Indian Power Sector‟ Ministry of
Power: Central Electricity Authority (CEA) Version 7.0. This database is
prepared as per “Tool to calculate the emission factor for an electricity
system” Version 02.2.1
http://cdm.unfccc.int/methodologies/PAmethodologies/tools/am-tool-07-
v2.2.1.pdf. The value is calculated as the weighted average of the Simple
Operating Margin emission factor (EFM, y
) and the Build Margin emission
factor (EF BM, y
) and giving 50% weight age to each by default
Value(s) applied 0.9276
Choice of data
or
Measurement methods
and procedures
As per the “Tool to calculate the emission factor for an electricity system”
Ver. 02.2.1.
Purpose of data For calculating the project emission.
Additional comment The emission factor for electricity is fixed ex-ante.
Data / Parameter NCV i,y
Unit GJ /Tonne
Description Average net calorific value of fossil fuel type (fuel Oil) used in the period t
Source of data IPCC default value as provided in Table 1.2 of Chapter 1 of Vol.2 (Energy)
of the 2006 IPCC Guidelines on National GHG Inventories.
Link:http://www.ipcc-
nggip.iges.or.jp/public/2006gl/pdf/2_Volume2/V2_1_Ch1_Introduction.pdf
Value(s) applied 40.4
Choice of data
or
Measurement methods
and procedures
Default value of IPCC Guidelines has been considered.
Purpose of data For calculating the project emission
Additional comment Any future revision of the IPCC Guidelines should be taken into account.

UNFCCC/CCNUCC
CDM – Executive Board Page 50
Data / Parameter Ᵽi,y
Unit Kg/Litre
Description Weighted average density of fuel type ( fuel oil) in year y
Source of data Table 1.1 of IPCC 2006 Guideline of National GHG Inventories.
http://www.ipcc.ch/meetings/session25/doc4a4b/vol2.pdf
Value(s) applied 0.91
Choice of data
or
Measurement methods
and procedures
The density of the fuel should be obtained for each fuel delivery, from
which weighted average annual values should be calculated.
Purpose of data For calculating the project emission
Additional comment
Data / Parameter EFCO2
Unit tCO2/GJ
Description Weighted average CO2 emission factor of fuel type (fuel oil) in year y
Source of data IPCC default values at the upper limit of the uncertainty at 95%confidence
interval as provided in table 1.4 of the Chapter 1 of Vol.2 (energy) of 2006
IPCC Guidelines on National GHG Inventories.
http://www.ipcc-
nggip.iges.or.jp/public/2006gl/pdf/2_Volume2/V2_1_Ch1_Introduction.pdf
Value(s) applied 0.0774
Choice of data
or
Measurement methods
and procedures
Default value of IPCC Guidelines has been considered.
Purpose of data For calculating the project emission
Additional comment Any future revision of the IPCC Guideline should be taken into account.
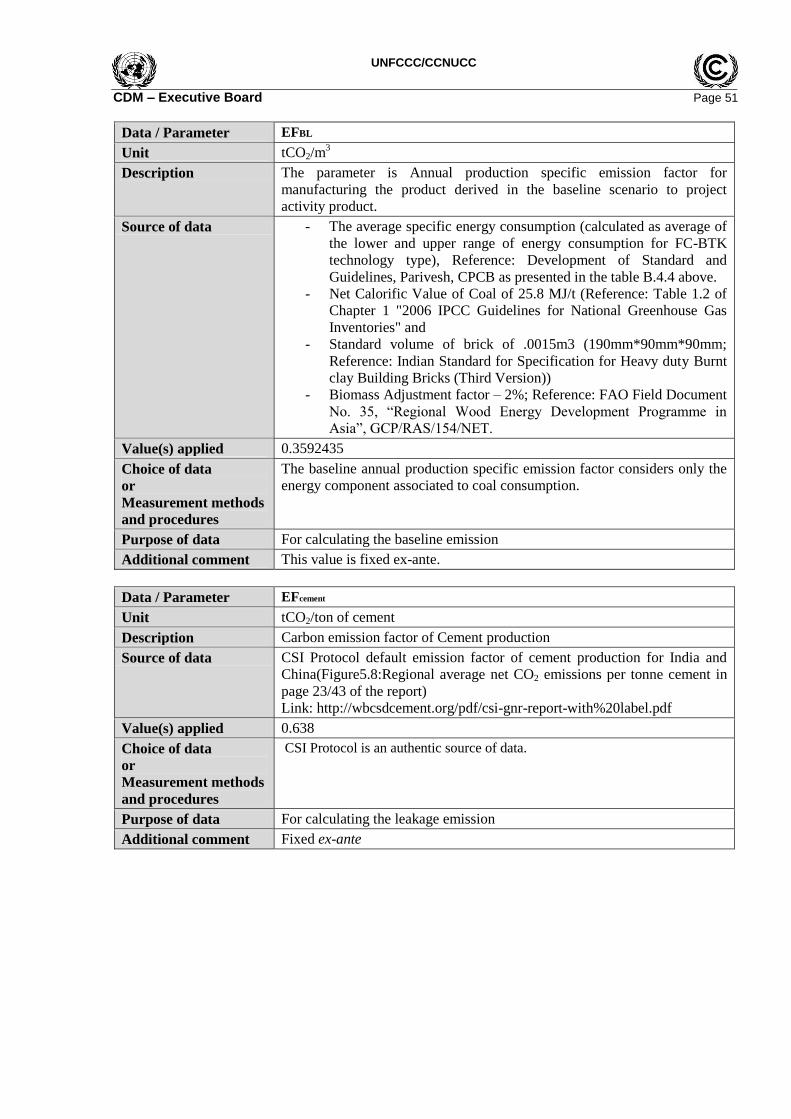
UNFCCC/CCNUCC
CDM – Executive Board Page 51
Data / Parameter EFBL
Unit tCO2/m3
Description The parameter is Annual production specific emission factor for
manufacturing the product derived in the baseline scenario to project
activity product.
Source of data - The average specific energy consumption (calculated as average of
the lower and upper range of energy consumption for FC-BTK
technology type), Reference: Development of Standard and
Guidelines, Parivesh, CPCB as presented in the table B.4.4 above.
- Net Calorific Value of Coal of 25.8 MJ/t (Reference: Table 1.2 of
Chapter 1 "2006 IPCC Guidelines for National Greenhouse Gas
Inventories" and
- Standard volume of brick of .0015m3 (190mm*90mm*90mm;
Reference: Indian Standard for Specification for Heavy duty Burnt
clay Building Bricks (Third Version))
- Biomass Adjustment factor – 2%; Reference: FAO Field Document
No. 35, “Regional Wood Energy Development Programme in
Asia”, GCP/RAS/154/NET.
Value(s) applied 0.3592435
Choice of data
or
Measurement methods
and procedures
The baseline annual production specific emission factor considers only the
energy component associated to coal consumption.
Purpose of data For calculating the baseline emission
Additional comment This value is fixed ex-ante.
Data / Parameter EFcement
Unit tCO2/ton of cement
Description Carbon emission factor of Cement production
Source of data CSI Protocol default emission factor of cement production for India and
China(Figure5.8:Regional average net CO2 emissions per tonne cement in
page 23/43 of the report)
Link: http://wbcsdcement.org/pdf/csi-gnr-report-with%20label.pdf
Value(s) applied 0.638
Choice of data
or
Measurement methods
and procedures
CSI Protocol is an authentic source of data.
Purpose of data For calculating the leakage emission
Additional comment Fixed ex-ante

UNFCCC/CCNUCC
CDM – Executive Board Page 52
Data / Parameter EFAluminium
Unit tCO2/ton of Aluminium
Description Carbon emission factor of Aluminium Powder production
Source of data Table 17: Industrial processes-emission factors and activity data
Value(s) applied 1.89
Choice of data
or
Measurement
methods and
procedures
IPCC 2006 refers to emission factor of 1.7 tCO2/t of Aluminium; However National Greenhouse Accounts (NGA) Factors, Table 17: Industrial processes-
emission factors and activity data takes into consideration CO2 emissions and CF4
and C2F6 emissions due to production of aluminium. The NGA factors have been
taken to be on a conservative side.
Purpose of data For calculating the leakage emission
Additional
comment
Fixed ex-ante
Data / Parameter EFLime
Unit tCO2/ ton of CaCO3.
Description Carbon emission factor of Lime
Source of data Chapter 2 of "Mineral Industry Emissions" of 2006 IPCC Guidelines for
National Greenhouse Gas Inventories.
Link:http://www.ipcc-
nggip.iges.or.jp/public/2006gl/pdf/3_Volume3/V3_2_Ch2_Mineral_Industry.pdf
Value(s) applied 0.439 tCO2/ ton of CaO.
Choice of data
or
Measurement
methods and
procedures
In the general practice lime from mineral source is available with a purity of 30-45%
in terms of CaO that results in lesser emissions. However the project activity
requires 85% purity in terms of CaO. The emission factor is computed using the
stoichio-metric ratio of 0.43 tones CO2/ ton of lime.
Purpose of data For calculating the leakage emission
Additional
comment
The emission factor for lime is fixed ex-ante. However should there be any
revision in IPCC values in future the same would be taken for Verification.
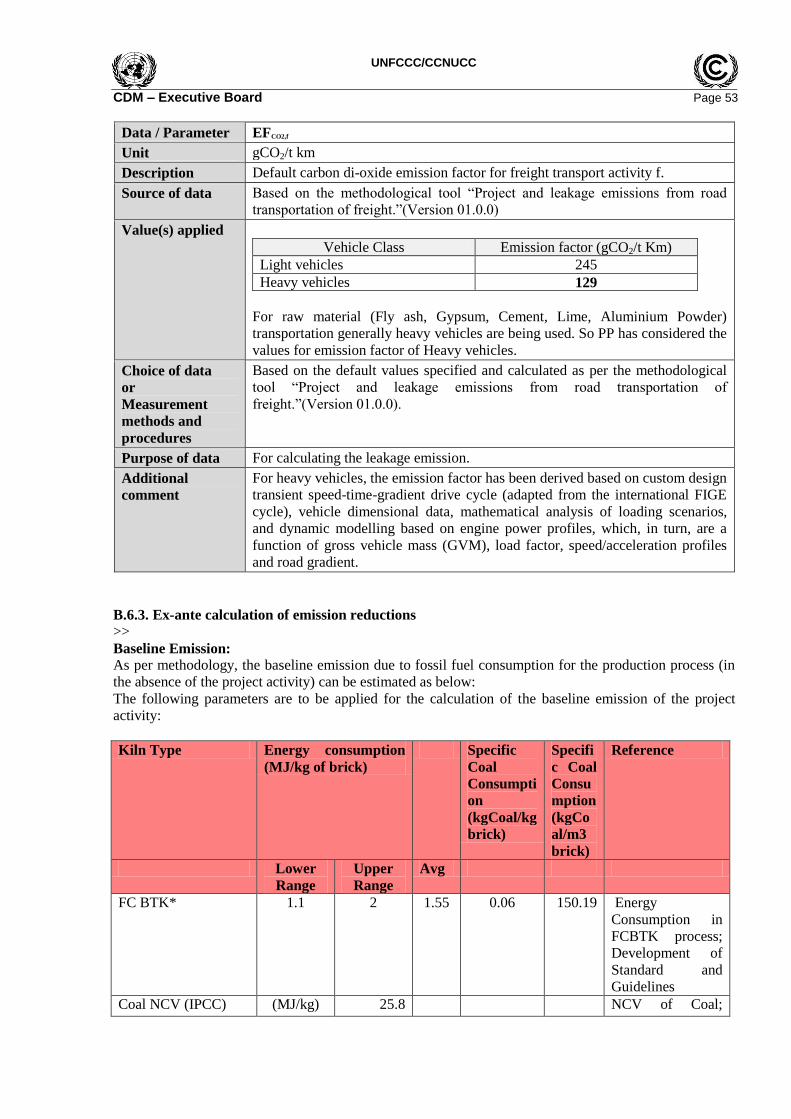
UNFCCC/CCNUCC
CDM – Executive Board Page 53
Data / Parameter EFCO2,f
Unit gCO2/t km
Description Default carbon di-oxide emission factor for freight transport activity f.
Source of data Based on the methodological tool “Project and leakage emissions from road
transportation of freight.”(Version 01.0.0)
Value(s) applied
Vehicle Class Emission factor (gCO2/t Km)
Light vehicles 245
Heavy vehicles 129
For raw material (Fly ash, Gypsum, Cement, Lime, Aluminium Powder)
transportation generally heavy vehicles are being used. So PP has considered the
values for emission factor of Heavy vehicles.
Choice of data
or
Measurement
methods and
procedures
Based on the default values specified and calculated as per the methodological
tool “Project and leakage emissions from road transportation of
freight.”(Version 01.0.0).
Purpose of data For calculating the leakage emission.
Additional
comment
For heavy vehicles, the emission factor has been derived based on custom design
transient speed-time-gradient drive cycle (adapted from the international FIGE
cycle), vehicle dimensional data, mathematical analysis of loading scenarios,
and dynamic modelling based on engine power profiles, which, in turn, are a
function of gross vehicle mass (GVM), load factor, speed/acceleration profiles
and road gradient.
B.6.3. Ex-ante calculation of emission reductions
>>
Baseline Emission:
As per methodology, the baseline emission due to fossil fuel consumption for the production process (in
the absence of the project activity) can be estimated as below:
The following parameters are to be applied for the calculation of the baseline emission of the project
activity:
Kiln Type Energy consumption
(MJ/kg of brick)
Specific
Coal
Consumpti
on
(kgCoal/kg
brick)
Specifi
c Coal
Consu
mption
(kgCo
al/m3
brick)
Reference
Lower
Range
Upper
Range
Avg
FC BTK* 1.1 2 1.55 0.06 150.19 Energy
Consumption in
FCBTK process;
Development of
Standard and
Guidelines
Coal NCV (IPCC) (MJ/kg) 25.8 NCV of Coal;

UNFCCC/CCNUCC
CDM – Executive Board Page 54
Table 1.2of
chapter 1 of
"2006 IPCC
Guidelines for
National
Greenhouse Gas
Inventories"
Bulk Density of brick (kg/m3) 2500 Bulk Density of
Brick ; Indian
Standard for
Specification for
Heavy duty Burnt
clay Building
Bricks (Third
Version)
Coal Consumption
per CuM
kgcoal/m3 150.19380
Energy Consumption
per CuM
MJ/m3 3875
Emission Factor per
MJ
TCO2/MJ 0.0000946
Emission Factor per
CuM
TCO2/m3 0.366575
Emission Factor per
CuM post adjustment
of Biomass use
TCO2/m3 0.3592435
The total Estimated Baseline carbon emission (BEy) from the total coal consumption in the baseline
scenario during total crediting period as follow:
Description Unit
Value
2014 2015 2016 2017 2018 2019 2020 2021 2022 2023
Net brick
production
Cum/
yr
12028
5
24725
3
25393
5
25393
5
25393
5
25393
5
25393
5
25393
5
25393
5
25393
5
The annual
production
specific
emission
factor for year
y
tCO2e/
m^3 0.3592 0.3592 0.3592 0.3592 0.3592 0.3592 0.3592 0.3592 0.3592 0.3592
Annual
baseline
emission
from fossil
fuels
tCO2e/
Year 43211 88823 91224 91224 91224 91224 91224 91224 91224 91224
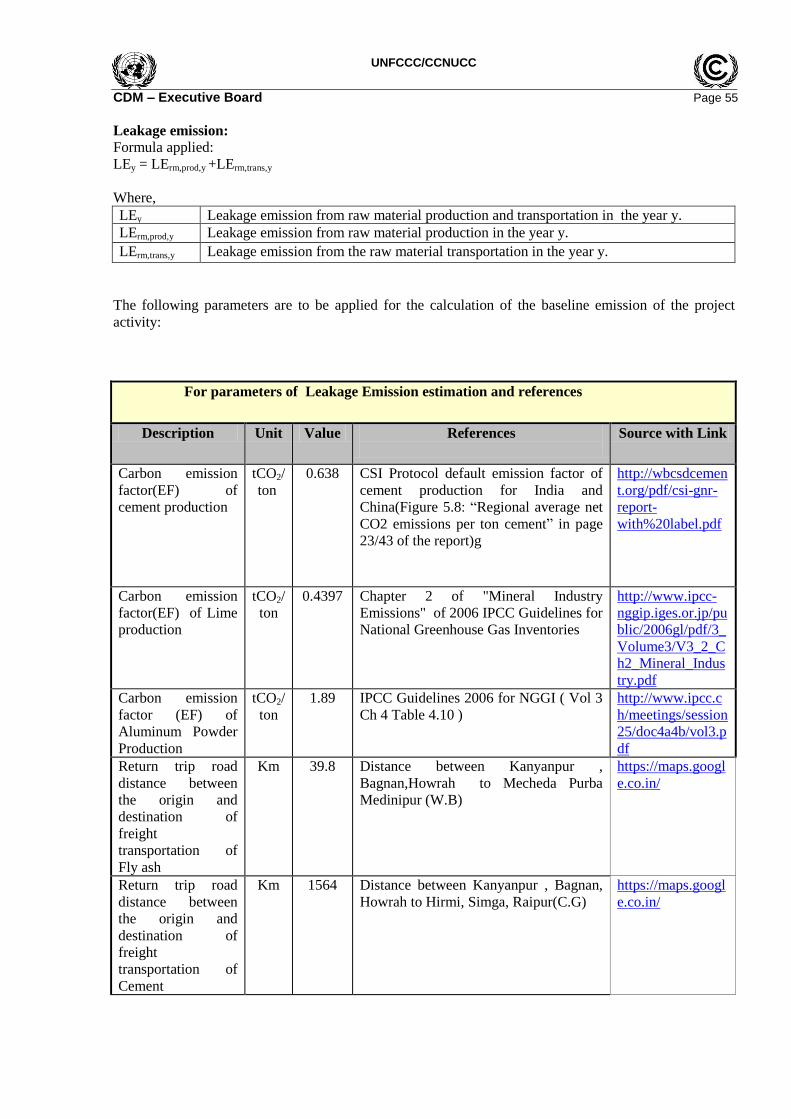
UNFCCC/CCNUCC
CDM – Executive Board Page 55
Leakage emission:
Formula applied:
LEy = LErm,prod,y +LErm,trans,y
Where,
LEy Leakage emission from raw material production and transportation in the year y.
LErm,prod,y Leakage emission from raw material production in the year y.
LErm,trans,y Leakage emission from the raw material transportation in the year y.
The following parameters are to be applied for the calculation of the baseline emission of the project
activity:
For parameters of Leakage Emission estimation and references
Description Unit Value References
Source with Link
Carbon emission
factor(EF) of
cement production
tCO2/
ton
0.638 CSI Protocol default emission factor of
cement production for India and
China(Figure 5.8: “Regional average net
CO2 emissions per ton cement” in page
23/43 of the report)g
http://wbcsdcemen
t.org/pdf/csi-gnr-
report-
with%20label.pdf
Carbon emission
factor(EF) of Lime
production
tCO2/
ton
0.4397 Chapter 2 of "Mineral Industry
Emissions" of 2006 IPCC Guidelines for
National Greenhouse Gas Inventories
http://www.ipcc-
nggip.iges.or.jp/pu
blic/2006gl/pdf/3_
Volume3/V3_2_C
h2_Mineral_Indus
try.pdf
Carbon emission
factor (EF) of
Aluminum Powder
Production
tCO2/
ton
1.89 IPCC Guidelines 2006 for NGGI ( Vol 3
Ch 4 Table 4.10 )
http://www.ipcc.c
h/meetings/session
25/doc4a4b/vol3.p
df
Return trip road
distance between
the origin and
destination of
freight
transportation of
Fly ash
Km 39.8 Distance between Kanyanpur ,
Bagnan,Howrah to Mecheda Purba
Medinipur (W.B)
https://maps.googl
e.co.in/
Return trip road
distance between
the origin and
destination of
freight
transportation of
Cement
Km 1564 Distance between Kanyanpur , Bagnan,
Howrah to Hirmi, Simga, Raipur(C.G)
https://maps.googl
e.co.in/
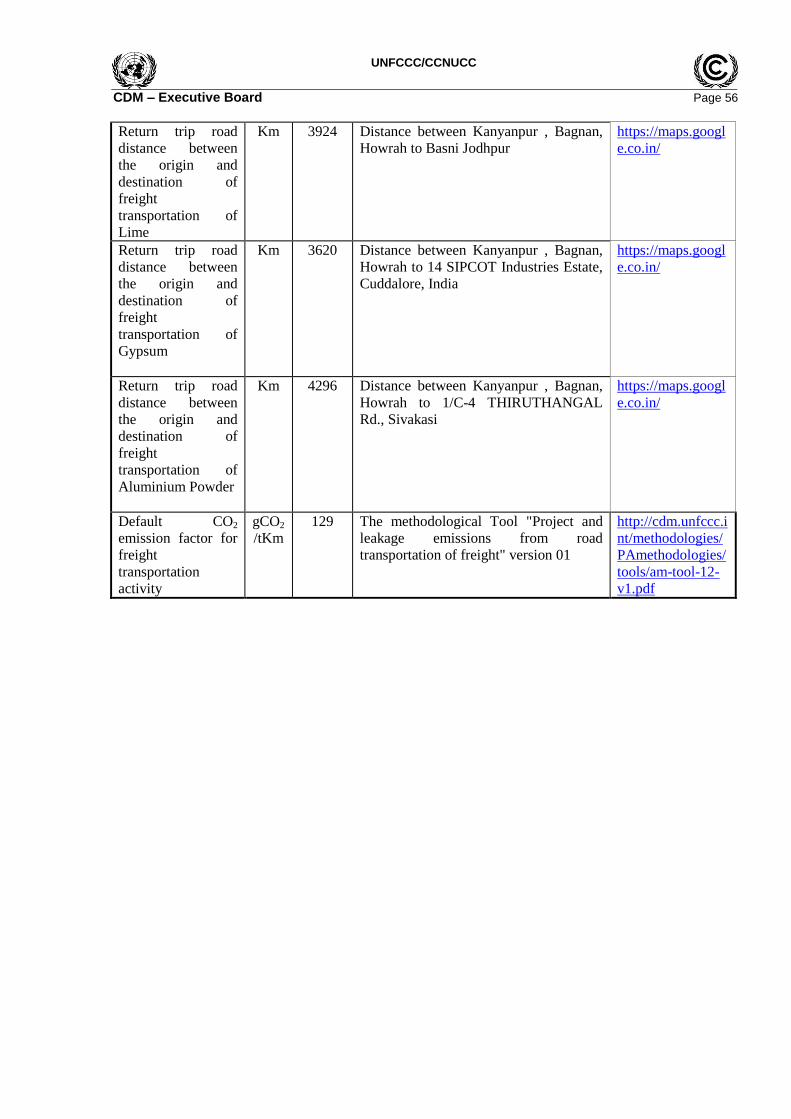
UNFCCC/CCNUCC
CDM – Executive Board Page 56
Return trip road
distance between
the origin and
destination of
freight
transportation of
Lime
Km 3924 Distance between Kanyanpur , Bagnan,
Howrah to Basni Jodhpur
https://maps.googl
e.co.in/
Return trip road
distance between
the origin and
destination of
freight
transportation of
Gypsum
Km 3620 Distance between Kanyanpur , Bagnan,
Howrah to 14 SIPCOT Industries Estate,
Cuddalore, India
https://maps.googl
e.co.in/
Return trip road
distance between
the origin and
destination of
freight
transportation of
Aluminium Powder
Km 4296 Distance between Kanyanpur , Bagnan,
Howrah to 1/C-4 THIRUTHANGAL
Rd., Sivakasi
https://maps.googl
e.co.in/
Default CO2
emission factor for
freight
transportation
activity
gCO2
/tKm
129 The methodological Tool "Project and
leakage emissions from road
transportation of freight" version 01
http://cdm.unfccc.i
nt/methodologies/
PAmethodologies/
tools/am-tool-12-
v1.pdf
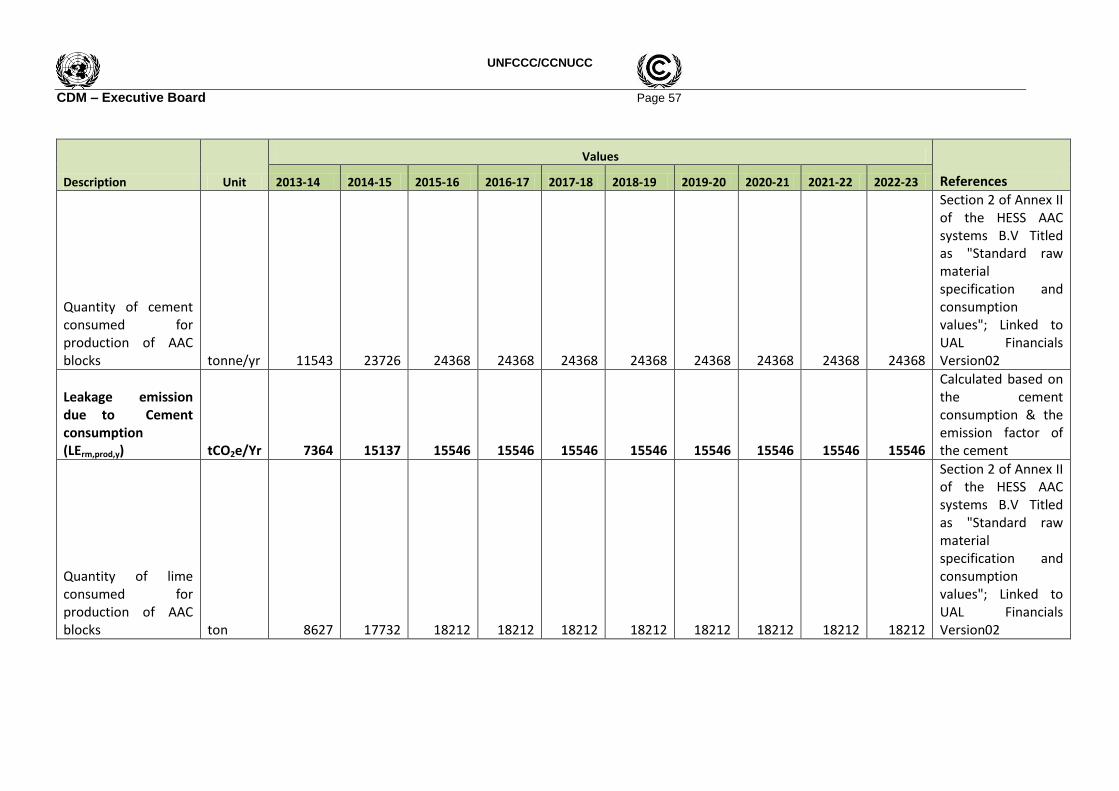
UNFCCC/CCNUCC
CDM – Executive Board Page 57
Description Unit
Values
References 2013-14 2014-15 2015-16 2016-17 2017-18 2018-19 2019-20 2020-21 2021-22 2022-23
Quantity of cement consumed for production of AAC blocks tonne/yr 11543 23726 24368 24368 24368 24368 24368 24368 24368 24368
Section 2 of Annex II of the HESS AAC systems B.V Titled as "Standard raw material specification and consumption values"; Linked to UAL Financials Version02
Leakage emission due to Cement consumption (LErm,prod,y) tCO2e/Yr 7364 15137 15546 15546 15546 15546 15546 15546 15546 15546
Calculated based on the cement consumption & the emission factor of the cement
Quantity of lime consumed for production of AAC blocks ton 8627 17732 18212 18212 18212 18212 18212 18212 18212 18212
Section 2 of Annex II of the HESS AAC systems B.V Titled as "Standard raw material specification and consumption values"; Linked to UAL Financials Version02
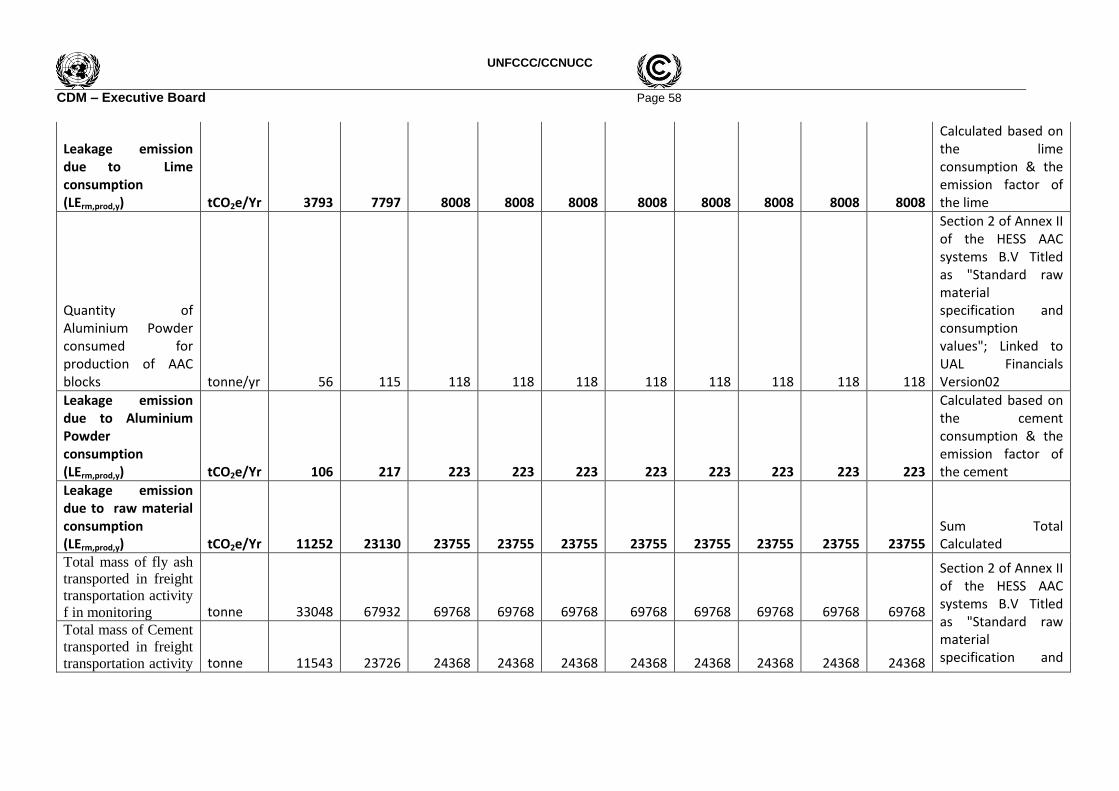
UNFCCC/CCNUCC
CDM – Executive Board Page 58
Leakage emission due to Lime consumption (LErm,prod,y) tCO2e/Yr 3793 7797 8008 8008 8008 8008 8008 8008 8008 8008
Calculated based on the lime consumption & the emission factor of the lime
Quantity of Aluminium Powder consumed for production of AAC blocks tonne/yr 56 115 118 118 118 118 118 118 118 118
Section 2 of Annex II of the HESS AAC systems B.V Titled as "Standard raw material specification and consumption values"; Linked to UAL Financials Version02
Leakage emission due to Aluminium Powder consumption (LErm,prod,y) tCO2e/Yr 106 217 223 223 223 223 223 223 223 223
Calculated based on the cement consumption & the emission factor of the cement
Leakage emission due to raw material consumption (LErm,prod,y) tCO2e/Yr 11252 23130 23755 23755 23755 23755 23755 23755 23755 23755
Sum Total Calculated
Total mass of fly ash
transported in freight
transportation activity
f in monitoring tonne 33048 67932 69768 69768 69768 69768 69768 69768 69768 69768
Section 2 of Annex II of the HESS AAC systems B.V Titled as "Standard raw material specification and
Total mass of Cement
transported in freight
transportation activity tonne 11543 23726 24368 24368 24368 24368 24368 24368 24368 24368

UNFCCC/CCNUCC
CDM – Executive Board Page 59
f in monitoring consumption values"; Linked to UAL Financials Version02 Total mass of Lime
transported in freight
transportation activity
f in monitoring tonne 8627 17732 18212 18212 18212 18212 18212 18212 18212 18212 Total mass of
Gypsum transported
in freight
transportation activity
f in monitoring tonne 1458 2997 3078 3078 3078 3078 3078 3078 3078 3078 Total mass of
Aluminium Powder
transported in freight
transportation activity
f in monitoring tonne 56 115 118 118 118 118 118 118 118 118 Leakage emission
due to Fly ash
transportation tCO2e/Yr 170 349 358 358 358 358 358 358 358 358 Calculated Leakage emission
due to Cement
transportation tCO2e/Yr 2329 4787 4916 4916 4916 4916 4916 4916 4916 4916 Calculated Leakage emission
due to Lime
transportation tCO2e/Yr 4367 8976 9219 9219 9219 9219 9219 9219 9219 9219 Calculated Leakage emission
due to Gypsum
transportation tCO2e/Yr 681 1400 1437 1437 1437 1437 1437 1437 1437 1437 Calculated Leakage emission
due to Aluminium
Powder tCO2e/Yr 31 64 65 65 65 65 65 65 65 65 Calculated
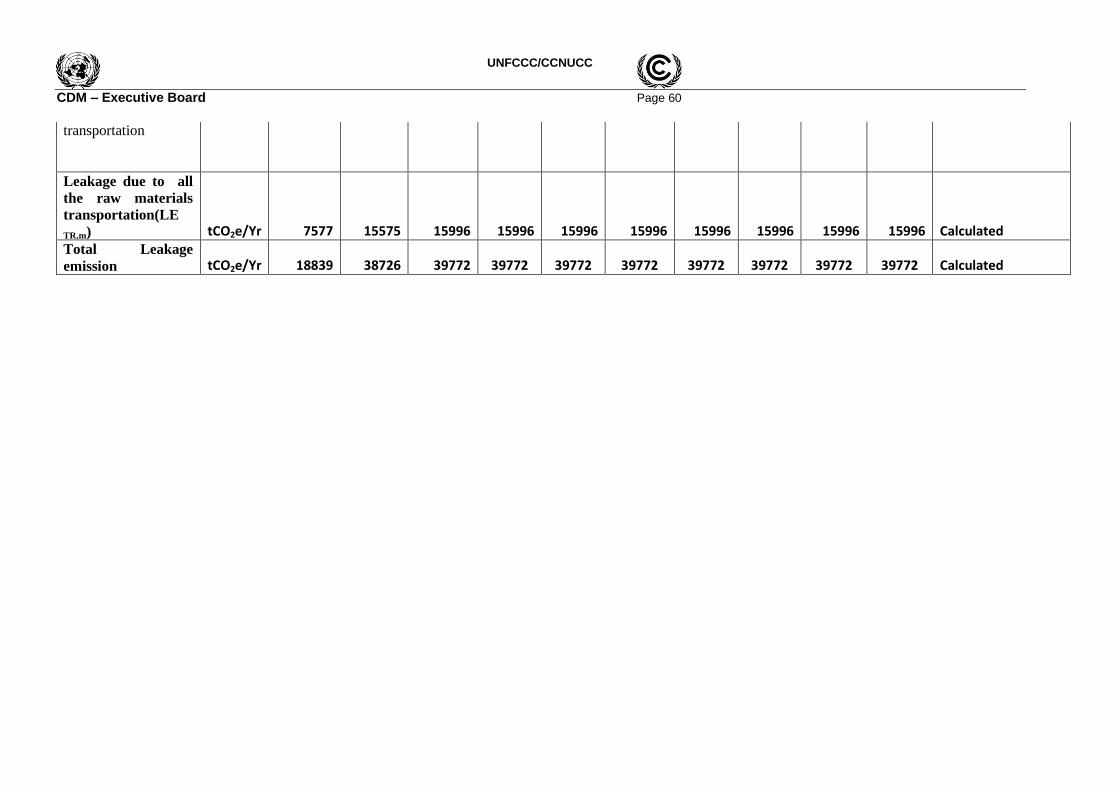
UNFCCC/CCNUCC
CDM – Executive Board Page 60
transportation
Leakage due to all
the raw materials
transportation(LE
TR,m) tCO2e/Yr 7577 15575 15996 15996 15996 15996 15996 15996 15996 15996 Calculated
Total Leakage
emission tCO2e/Yr 18839 38726 39772 39772 39772 39772 39772 39772 39772 39772 Calculated
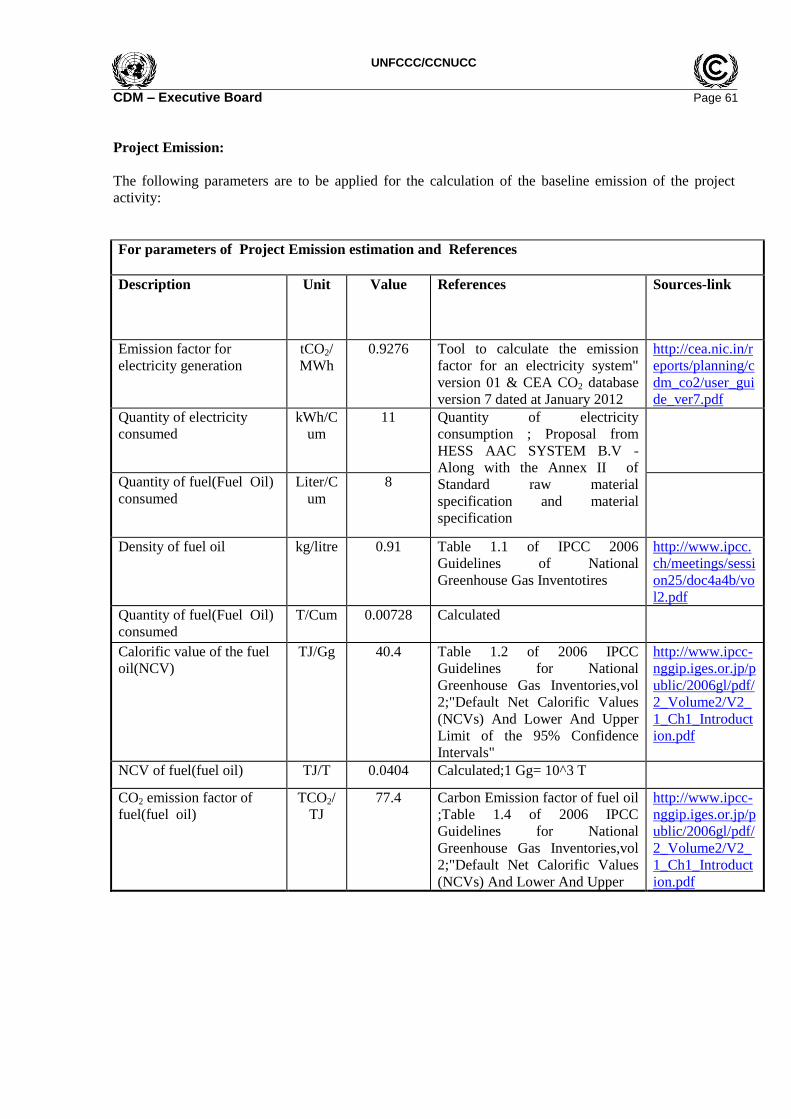
UNFCCC/CCNUCC
CDM – Executive Board Page 61
Project Emission:
The following parameters are to be applied for the calculation of the baseline emission of the project
activity:
For parameters of Project Emission estimation and References
Description Unit Value References Sources-link
Emission factor for
electricity generation
tCO2/
MWh
0.9276 Tool to calculate the emission
factor for an electricity system"
version 01 & CEA CO2 database
version 7 dated at January 2012
http://cea.nic.in/r
eports/planning/c
dm_co2/user_gui
de_ver7.pdf
Quantity of electricity
consumed
kWh/C
um
11 Quantity of electricity
consumption ; Proposal from
HESS AAC SYSTEM B.V -
Along with the Annex II of
Standard raw material
specification and material
specification
Quantity of fuel(Fuel Oil)
consumed
Liter/C
um
8
Density of fuel oil kg/litre 0.91 Table 1.1 of IPCC 2006
Guidelines of National
Greenhouse Gas Inventotires
http://www.ipcc.
ch/meetings/sessi
on25/doc4a4b/vo
l2.pdf
Quantity of fuel(Fuel Oil)
consumed
T/Cum 0.00728 Calculated
Calorific value of the fuel
oil(NCV)
TJ/Gg 40.4 Table 1.2 of 2006 IPCC
Guidelines for National
Greenhouse Gas Inventories,vol
2;"Default Net Calorific Values
(NCVs) And Lower And Upper
Limit of the 95% Confidence
Intervals"
http://www.ipcc-
nggip.iges.or.jp/p
ublic/2006gl/pdf/
2_Volume2/V2_
1_Ch1_Introduct
ion.pdf
NCV of fuel(fuel oil) TJ/T 0.0404 Calculated;1 Gg= 10^3 T
CO2 emission factor of
fuel(fuel oil)
TCO2/
TJ
77.4 Carbon Emission factor of fuel oil
;Table 1.4 of 2006 IPCC
Guidelines for National
Greenhouse Gas Inventories,vol
2;"Default Net Calorific Values
(NCVs) And Lower And Upper
http://www.ipcc-
nggip.iges.or.jp/p
ublic/2006gl/pdf/
2_Volume2/V2_
1_Ch1_Introduct
ion.pdf

UNFCCC/CCNUCC
CDM – Executive Board Page 62
Description Unit
Value
References 2013-14 2014-15 2015-16 2016-17 2017-18 2018-19 2019-20 2020-21 2021-22 2022-23
Gross AAC
Blocks 121500 249750 256500 256500 256500 256500 256500 256500 256500 256500
Quantity of
electricity
consumed MWh/yr 1336.5 2747.25 2821.5 2821.5 2821.5 2821.5 2821.5 2821.5 2821.5 2821.5
Section 2 of
Annex II
document of
HESS AAC
System B.V
"Standard raw
material
specification
and
consumpton
values "
Project
emission from
electricity
consumption tCO2/yr 1239.75 2548.385 2617.2605 2617.26 2617.26 2617.26 2617.26 2617.26 2617.26 2617.26 Calculated
Quantity of
fuel consumed Tonnes/yr 884.52 1818.18 1867.32 1867.32 1867.32 1867.32 1867.32 1867.32 1867.32 1867.32
Section 2 of
Annex II
document of
HESS AAC
System B.V
"Standard raw
material
specification

UNFCCC/CCNUCC
CDM – Executive Board Page 63
and
consumption
values "
Project
emission from
fuel
consumption tCO2/yr 2766 5685 5839 5839 5839 5839 5839 5839 5839 5839 Calculated
Total Project
Emission tCO2/yr 4005 8233 8456 8456 8456 8456 8456 8456 8456 8456 Calculated
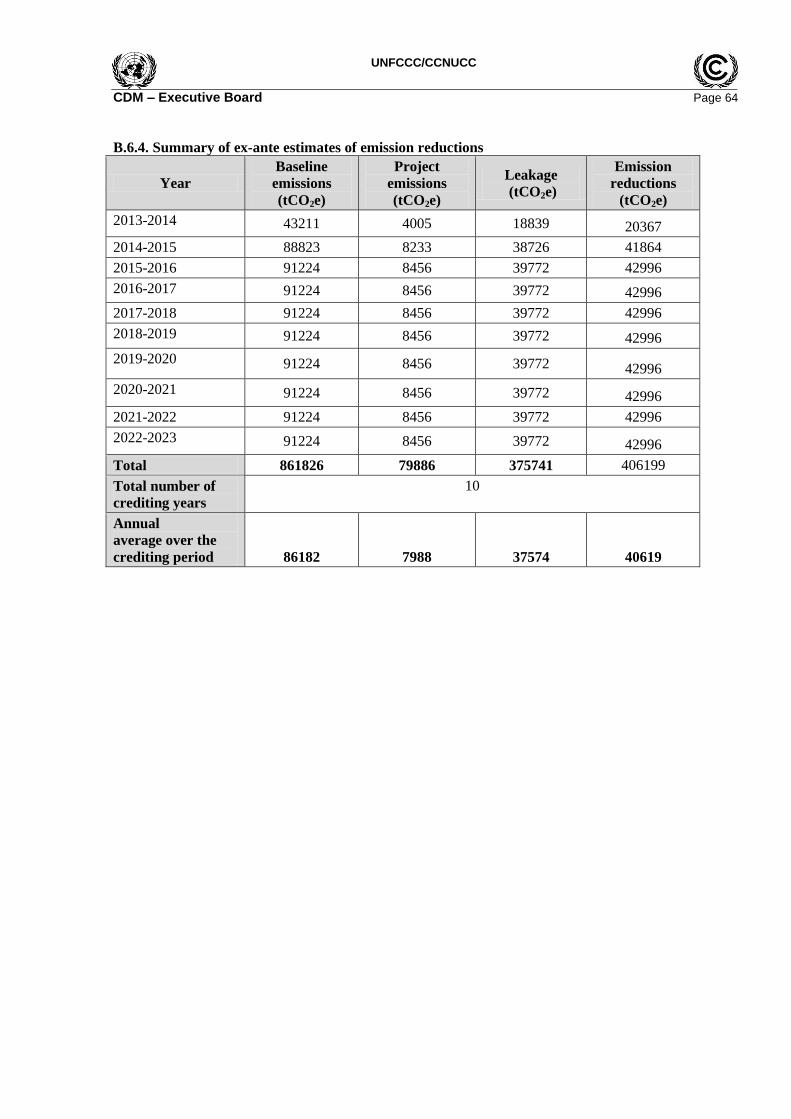
UNFCCC/CCNUCC
CDM – Executive Board Page 64
B.6.4. Summary of ex-ante estimates of emission reductions
Year
Baseline
emissions
(tCO2e)
Project
emissions
(tCO2e)
Leakage
(tCO2e)
Emission
reductions
(tCO2e)
2013-2014 43211 4005 18839 20367
2014-2015 88823 8233 38726 41864
2015-2016 91224 8456 39772 42996
2016-2017 91224 8456 39772 42996
2017-2018 91224 8456 39772 42996
2018-2019 91224 8456 39772 42996
2019-2020 91224 8456 39772 42996
2020-2021 91224 8456 39772 42996
2021-2022 91224 8456 39772 42996
2022-2023 91224 8456 39772 42996
Total 861826 79886 375741 406199
Total number of
crediting years
10
Annual
average over the
crediting period 86182 7988 37574 40619
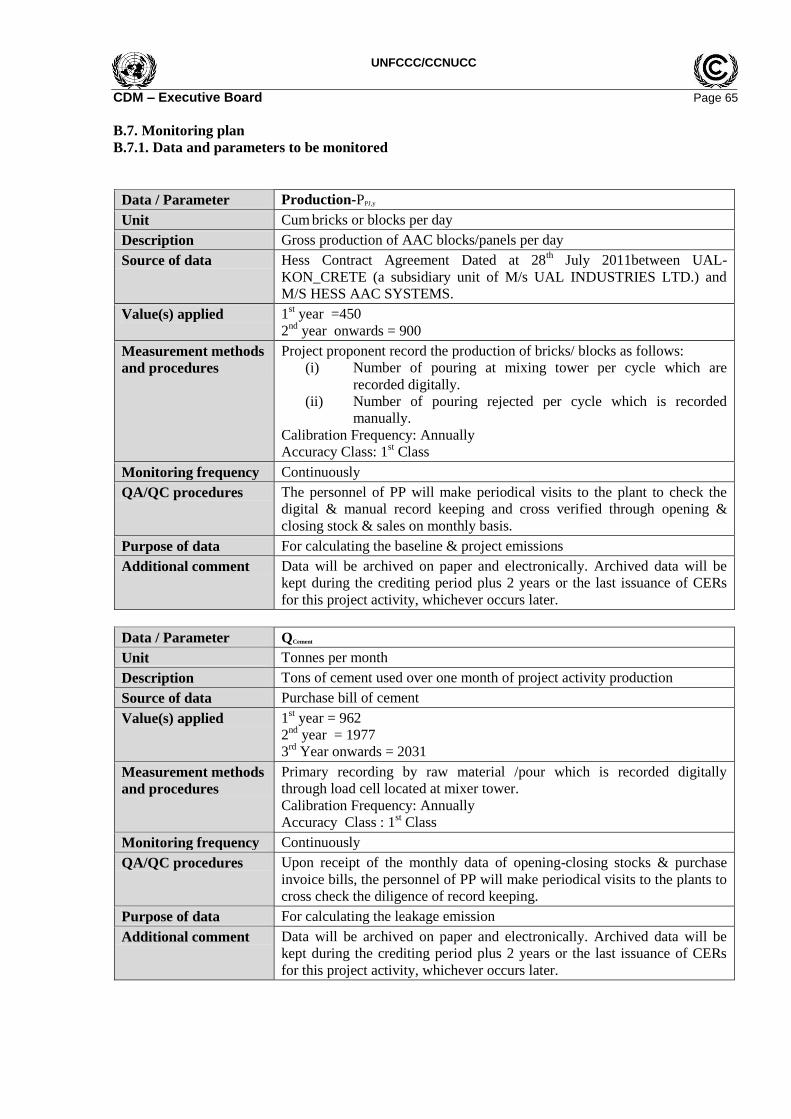
UNFCCC/CCNUCC
CDM – Executive Board Page 65
B.7. Monitoring plan
B.7.1. Data and parameters to be monitored
Data / Parameter Production-PPJ,y
Unit Cum bricks or blocks per day
Description Gross production of AAC blocks/panels per day
Source of data Hess Contract Agreement Dated at 28th July 2011between UAL-
KON_CRETE (a subsidiary unit of M/s UAL INDUSTRIES LTD.) and
M/S HESS AAC SYSTEMS.
Value(s) applied 1st year =450
2nd
year onwards = 900
Measurement methods
and procedures
Project proponent record the production of bricks/ blocks as follows:
(i) Number of pouring at mixing tower per cycle which are
recorded digitally.
(ii) Number of pouring rejected per cycle which is recorded
manually.
Calibration Frequency: Annually
Accuracy Class: 1st Class
Monitoring frequency Continuously
QA/QC procedures The personnel of PP will make periodical visits to the plant to check the
digital & manual record keeping and cross verified through opening &
closing stock & sales on monthly basis.
Purpose of data For calculating the baseline & project emissions
Additional comment Data will be archived on paper and electronically. Archived data will be
kept during the crediting period plus 2 years or the last issuance of CERs
for this project activity, whichever occurs later.
Data / Parameter QCement
Unit Tonnes per month
Description Tons of cement used over one month of project activity production
Source of data Purchase bill of cement
Value(s) applied 1st year = 962
2nd
year = 1977
3rd
Year onwards = 2031
Measurement methods
and procedures
Primary recording by raw material /pour which is recorded digitally
through load cell located at mixer tower.
Calibration Frequency: Annually
Accuracy Class : 1st Class
Monitoring frequency Continuously
QA/QC procedures Upon receipt of the monthly data of opening-closing stocks & purchase
invoice bills, the personnel of PP will make periodical visits to the plants to
cross check the diligence of record keeping.
Purpose of data For calculating the leakage emission
Additional comment Data will be archived on paper and electronically. Archived data will be
kept during the crediting period plus 2 years or the last issuance of CERs
for this project activity, whichever occurs later.
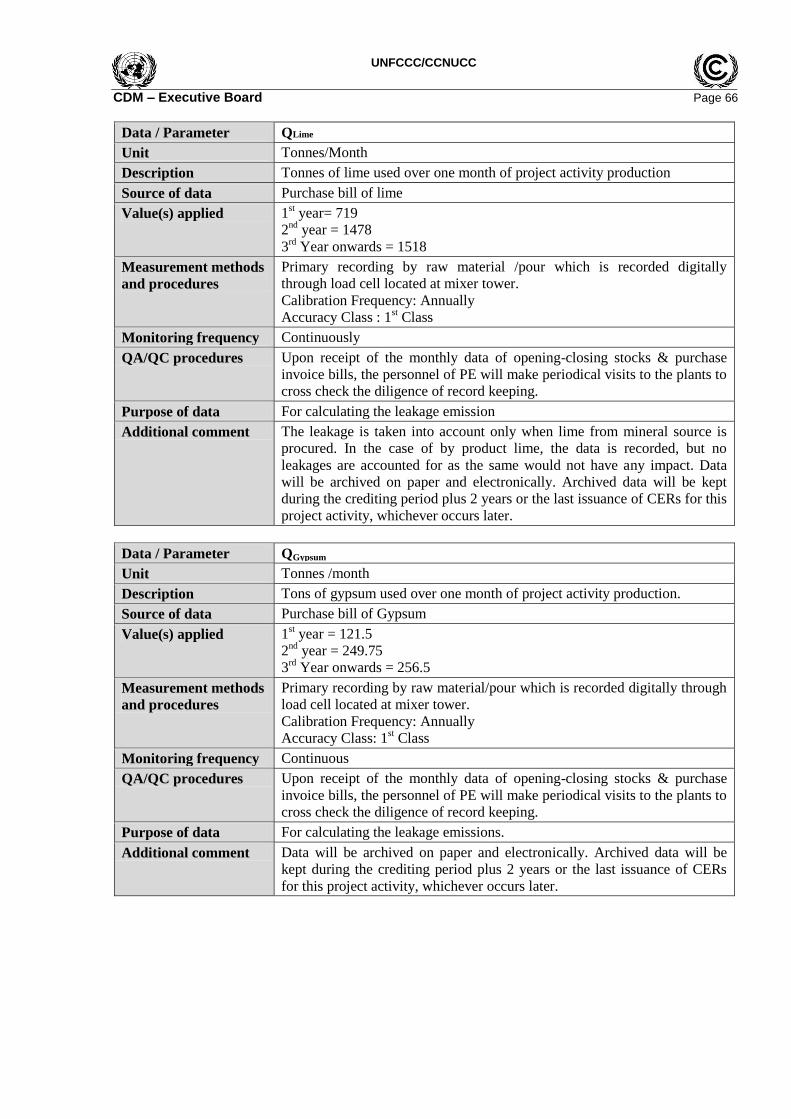
UNFCCC/CCNUCC
CDM – Executive Board Page 66
Data / Parameter QLime
Unit Tonnes/Month
Description Tonnes of lime used over one month of project activity production
Source of data Purchase bill of lime
Value(s) applied 1st year= 719
2nd
year = 1478
3rd
Year onwards = 1518
Measurement methods
and procedures
Primary recording by raw material /pour which is recorded digitally
through load cell located at mixer tower.
Calibration Frequency: Annually
Accuracy Class : 1st Class
Monitoring frequency Continuously
QA/QC procedures Upon receipt of the monthly data of opening-closing stocks & purchase
invoice bills, the personnel of PE will make periodical visits to the plants to
cross check the diligence of record keeping.
Purpose of data For calculating the leakage emission
Additional comment The leakage is taken into account only when lime from mineral source is
procured. In the case of by product lime, the data is recorded, but no
leakages are accounted for as the same would not have any impact. Data
will be archived on paper and electronically. Archived data will be kept
during the crediting period plus 2 years or the last issuance of CERs for this
project activity, whichever occurs later.
Data / Parameter QGypsum
Unit Tonnes /month
Description Tons of gypsum used over one month of project activity production.
Source of data Purchase bill of Gypsum
Value(s) applied 1st year = 121.5
2nd
year = 249.75
3rd
Year onwards = 256.5
Measurement methods
and procedures
Primary recording by raw material/pour which is recorded digitally through
load cell located at mixer tower.
Calibration Frequency: Annually
Accuracy Class: 1st Class
Monitoring frequency Continuous
QA/QC procedures Upon receipt of the monthly data of opening-closing stocks & purchase
invoice bills, the personnel of PE will make periodical visits to the plants to
cross check the diligence of record keeping.
Purpose of data For calculating the leakage emissions.
Additional comment Data will be archived on paper and electronically. Archived data will be
kept during the crediting period plus 2 years or the last issuance of CERs
for this project activity, whichever occurs later.

UNFCCC/CCNUCC
CDM – Executive Board Page 67
Data / Parameter QAluminium
Unit Tonnes /Month
Description Tons of Aluminium used over one month of project activity production
Source of data Purchase Bill of Aluminium
Value(s) applied 1st year = 4.6
2nd
year = 9.5
3rd
onwards = 9.8
Measurement methods
and procedures
Primary recording by raw material /pour which is recorded digitally
through load cell located at mixer tower.
Calibration Frequency: Annually
Accuracy Class: 1st Class
Monitoring frequency Continuous
QA/QC procedures Upon receipt of the monthly data of opening-closing stocks & purchase
invoice bills, the personnel of PE will make periodical visits to the plants to
cross check the diligence of record keeping.
Purpose of data For calculating the leakage emissions
Additional comment Data will be archived on paper and electronically. Archived data will be
kept during the crediting period plus 2 years or the last issuance of CERs
for this project activity, whichever occurs later.
Data / Parameter QFly Ash
Unit Tonnes /Month
Description Tons of fly ash used over one month of project activity production
Source of data Purchase Bill of Fly ash
Value(s) applied 1st year = 2754
2nd
year = 5661
3rd
Year onwards = 5814
Measurement methods
and procedures
Primary recording by raw material /pour which is recorded digitally
through load cell located at mixer tower.
Calibration Frequency: Annually
Accuracy Class: 1st Class
Monitoring frequency Continuous
QA/QC procedures Upon receipt of the monthly data of opening-closing stocks & purchase
invoice bills, the personnel of PE will make periodical visits to the plants to
cross check the diligence of record keeping.
Purpose of data For calculating the leakage emissions.
Additional comment Data will be archived on paper and electronically. Archived data will be
kept during the crediting period plus 2 years or the last issuance of CERs
for this project activity, whichever occurs later.
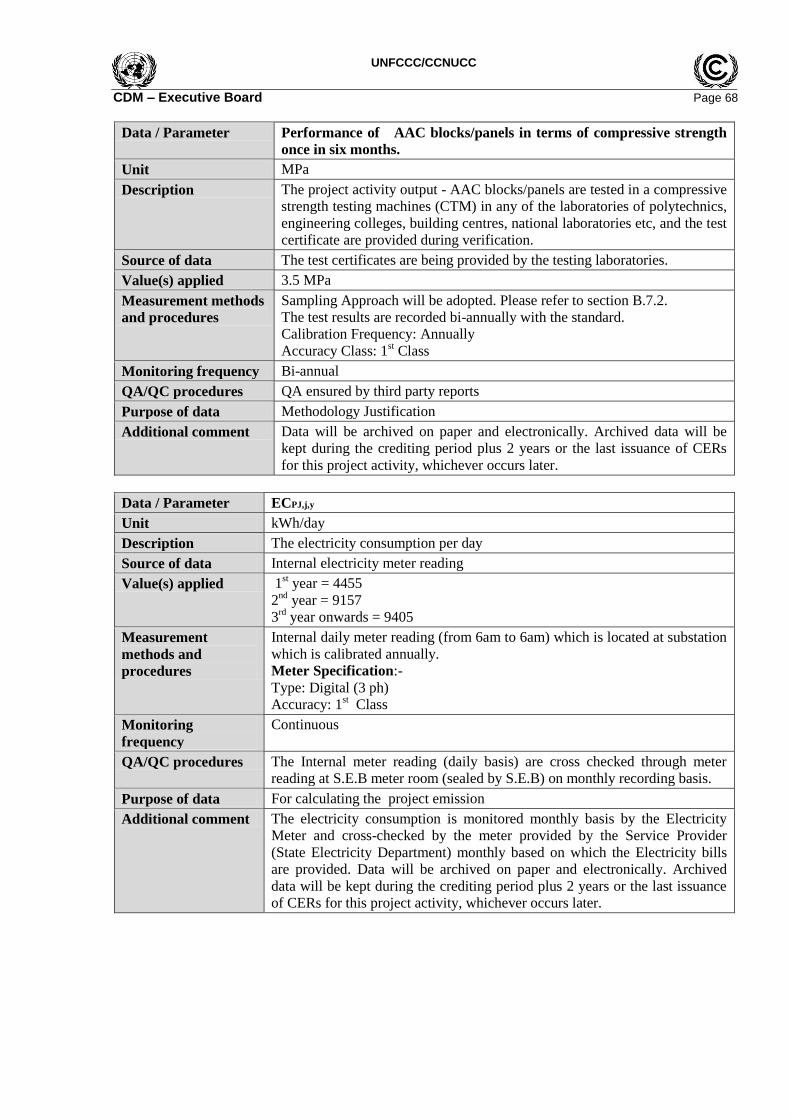
UNFCCC/CCNUCC
CDM – Executive Board Page 68
Data / Parameter Performance of AAC blocks/panels in terms of compressive strength
once in six months.
Unit MPa
Description The project activity output - AAC blocks/panels are tested in a compressive
strength testing machines (CTM) in any of the laboratories of polytechnics,
engineering colleges, building centres, national laboratories etc, and the test
certificate are provided during verification.
Source of data The test certificates are being provided by the testing laboratories.
Value(s) applied 3.5 MPa
Measurement methods
and procedures
Sampling Approach will be adopted. Please refer to section B.7.2.
The test results are recorded bi-annually with the standard.
Calibration Frequency: Annually
Accuracy Class: 1st Class
Monitoring frequency Bi-annual
QA/QC procedures QA ensured by third party reports
Purpose of data Methodology Justification
Additional comment Data will be archived on paper and electronically. Archived data will be
kept during the crediting period plus 2 years or the last issuance of CERs
for this project activity, whichever occurs later.
Data / Parameter ECPJ,j,y
Unit kWh/day
Description The electricity consumption per day
Source of data Internal electricity meter reading
Value(s) applied 1st year = 4455
2nd
year = 9157
3rd
year onwards = 9405
Measurement
methods and
procedures
Internal daily meter reading (from 6am to 6am) which is located at substation
which is calibrated annually.
Meter Specification:-
Type: Digital (3 ph)
Accuracy: 1st Class
Monitoring
frequency
Continuous
QA/QC procedures The Internal meter reading (daily basis) are cross checked through meter
reading at S.E.B meter room (sealed by S.E.B) on monthly recording basis.
Purpose of data For calculating the project emission
Additional comment The electricity consumption is monitored monthly basis by the Electricity
Meter and cross-checked by the meter provided by the Service Provider
(State Electricity Department) monthly based on which the Electricity bills
are provided. Data will be archived on paper and electronically. Archived
data will be kept during the crediting period plus 2 years or the last issuance
of CERs for this project activity, whichever occurs later.
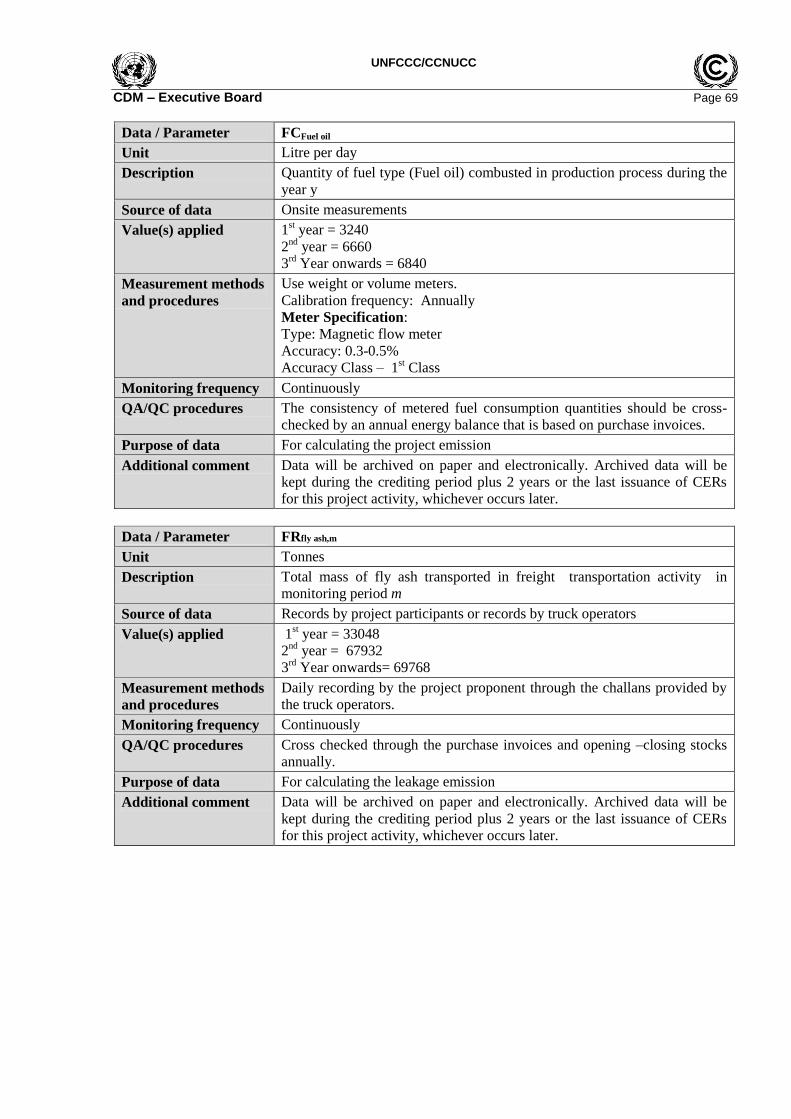
UNFCCC/CCNUCC
CDM – Executive Board Page 69
Data / Parameter FCFuel oil
Unit Litre per day
Description Quantity of fuel type (Fuel oil) combusted in production process during the
year y
Source of data Onsite measurements
Value(s) applied 1st year = 3240
2nd
year = 6660
3rd
Year onwards = 6840
Measurement methods
and procedures
Use weight or volume meters.
Calibration frequency: Annually
Meter Specification:
Type: Magnetic flow meter
Accuracy: 0.3-0.5%
Accuracy Class – 1st Class
Monitoring frequency Continuously
QA/QC procedures The consistency of metered fuel consumption quantities should be cross-
checked by an annual energy balance that is based on purchase invoices.
Purpose of data For calculating the project emission
Additional comment Data will be archived on paper and electronically. Archived data will be
kept during the crediting period plus 2 years or the last issuance of CERs
for this project activity, whichever occurs later.
Data / Parameter FRfly ash,m
Unit Tonnes
Description Total mass of fly ash transported in freight transportation activity in
monitoring period m
Source of data Records by project participants or records by truck operators
Value(s) applied 1st year = 33048
2nd
year = 67932
3rd
Year onwards= 69768
Measurement methods
and procedures
Daily recording by the project proponent through the challans provided by
the truck operators.
Monitoring frequency Continuously
QA/QC procedures Cross checked through the purchase invoices and opening –closing stocks
annually.
Purpose of data For calculating the leakage emission
Additional comment Data will be archived on paper and electronically. Archived data will be
kept during the crediting period plus 2 years or the last issuance of CERs
for this project activity, whichever occurs later.
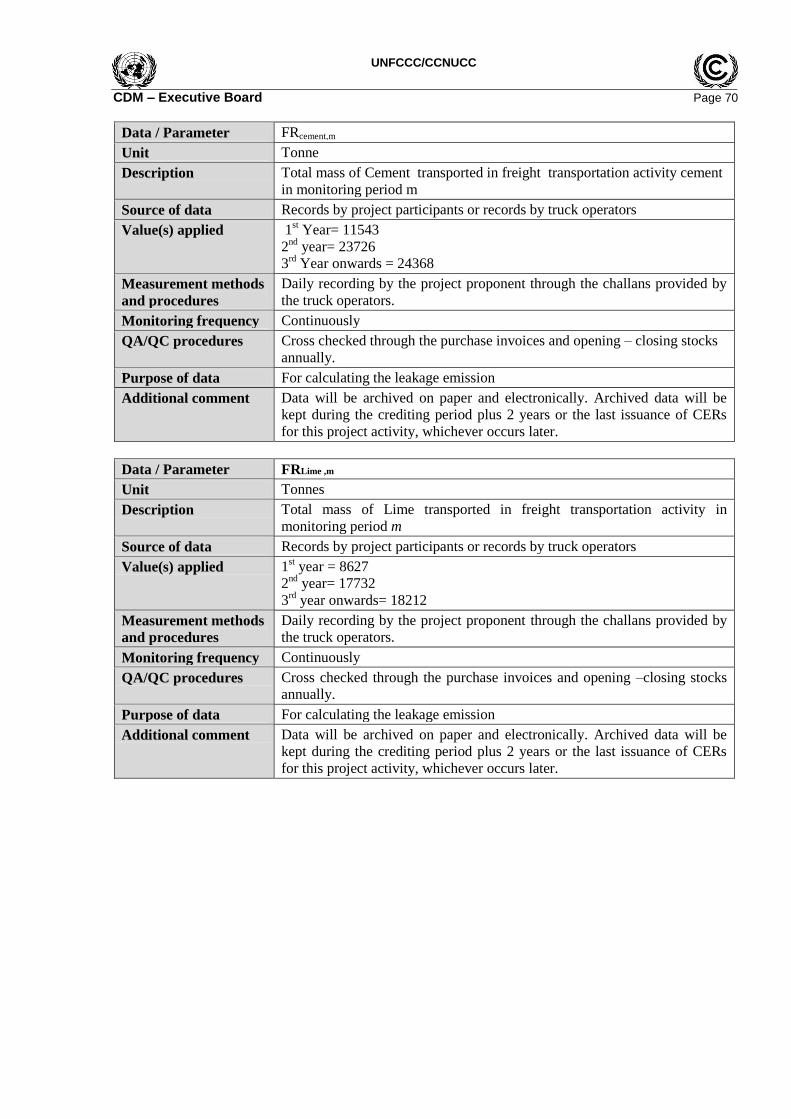
UNFCCC/CCNUCC
CDM – Executive Board Page 70
Data / Parameter FRcement,m
Unit Tonne
Description Total mass of Cement transported in freight transportation activity cement
in monitoring period m
Source of data Records by project participants or records by truck operators
Value(s) applied 1st Year= 11543
2nd
year= 23726
3rd
Year onwards = 24368
Measurement methods
and procedures
Daily recording by the project proponent through the challans provided by
the truck operators.
Monitoring frequency Continuously
QA/QC procedures Cross checked through the purchase invoices and opening – closing stocks
annually.
Purpose of data For calculating the leakage emission
Additional comment Data will be archived on paper and electronically. Archived data will be
kept during the crediting period plus 2 years or the last issuance of CERs
for this project activity, whichever occurs later.
Data / Parameter FRLime ,m
Unit Tonnes
Description Total mass of Lime transported in freight transportation activity in
monitoring period m
Source of data Records by project participants or records by truck operators
Value(s) applied 1st year = 8627
2nd
year= 17732
3rd
year onwards= 18212
Measurement methods
and procedures
Daily recording by the project proponent through the challans provided by
the truck operators.
Monitoring frequency Continuously
QA/QC procedures Cross checked through the purchase invoices and opening –closing stocks
annually.
Purpose of data For calculating the leakage emission
Additional comment Data will be archived on paper and electronically. Archived data will be
kept during the crediting period plus 2 years or the last issuance of CERs
for this project activity, whichever occurs later.

UNFCCC/CCNUCC
CDM – Executive Board Page 71
Data / Parameter FRGypsum, m
Unit Tonnes
Description Total mass of Gypsum transported in freight transportation activity in
monitoring period m
Source of data Records by project participants or records by truck operators
Value(s) applied 1st Year= 1458
2nd
Year = 2997
3rd
Year onwards = 3078
Measurement methods
and procedures
Daily recording by the project proponent through the challans provided by
the truck operators.
Monitoring frequency Continuously
QA/QC procedures Cross checked through the purchase invoices and opening –closing stocks
annually.
Purpose of data For calculating the leakage emission
Additional comment Data will be archived on paper and electronically. Archived data will be
kept during the crediting period plus 2 years or the last issuance of CERs
for this project activity, whichever occurs later.
Data / Parameter FR Alumium,m
Unit Tonnes
Description Total mass of Aluminium transported in freight transportation activity in
monitoring period m
Source of data Records by project participants or records by truck operators
Value(s) applied 1st year = 56
2nd
year= 115
3rd
year onwards = 118
Measurement methods
and procedures
Daily recording by the project proponent through the challans provided by
the truck operators.
Monitoring frequency Continuously
QA/QC procedures Cross checked through the purchase invoices and opening –closing stocks
annually.
Purpose of data For calculating the leakage emission
Additional comment Data will be archived on paper and electronically. Archived data will be
kept during the crediting period plus 2 years or the last issuance of CERs
for this project activity, whichever occurs later.

UNFCCC/CCNUCC
CDM – Executive Board Page 72
Data / Parameter Df,m,flyash
Unit Km
Description Return trip road distance between the origin and destination of fly ash
transportation activity f in monitoring period m
Source of data Records of vehicle operator or records by project participants
Value(s) applied 39.8
Measurement methods
and procedures
Determined once for each freight transportation activity f for a reference
trip using the vehicle odometer or any other appropriate sources (e.g. on-
line sources).
Calibration Frequency: Once in a year
Accuracy Class: 1st Class
Monitoring frequency Continuously
QA/QC procedures The data should be recorded in Log book (Per trip of incoming of raw
material) & it would be cross-checked through the invoiced/Challan
provided by the supplier or Vendors.
Purpose of data For calculating the leakage emission
Additional comment This value is fixed and ex ante for the specified production procedure.
Data / Parameter Df,m,cement
Unit Km
Description Return trip road distance between the origin and destination of cement
transportation activity f in monitoring period m
Source of data Records of vehicle operator or records by project participants
Value(s) applied 160
Measurement methods
and procedures
Determined once for each freight transportation activity f for a reference
trip using the vehicle odometer or any other appropriate sources (e.g. on-
line sources).
Calibration Frequency: Annually
Accuracy Class: 1st Class
Monitoring frequency Continuously
QA/QC procedures The data should be recorded in Log book (Per trip of incoming of raw
material ) & it would be cross-checked through the invoiced/Challan
provided by the supplier or Vendors
Purpose of data For calculating the leakage emission
Additional comment This value is fixed and ex ante for the specified production procedure.

UNFCCC/CCNUCC
CDM – Executive Board Page 73
Data / Parameter Df,m,lime
Unit Km
Description Return trip road distance between the origin and destination of lime
transportation activity f in monitoring period m
Source of data Records of vehicle operator or records by project participants
Value(s) applied 3924
Measurement methods
and procedures
Determined once for each freight transportation activity f for a reference
trip using the vehicle odometer or any other appropriate sources (e.g. on-
line sources)
Calibration Frequency: Annually
Accuracy Class: 1st Class
Monitoring frequency Continuously
QA/QC procedures The data should be recorded in Log book (Per trip of incoming of raw
material ) & it would be cross-checked through the invoiced/Challan
provided by the supplier or Vendors
Purpose of data For calculating the leakage emission
Additional comment This value is fixed and ex ante for the specified production procedure.
Data / Parameter Df,m,gypsum
Unit Km
Description Return trip road distance between the origin and destination of Gypsum
transportation activity f in monitoring period m
Source of data Records of vehicle operator or records by project participants
Value(s) applied 3620
Measurement methods
and procedures
Determined once for each freight transportation activity f for a reference
trip using the vehicle odometer or any other appropriate sources (e.g. on-
line sources)
Calibration Frequency: Annually
Accuracy Class: 1st Class
Monitoring frequency Continuously
QA/QC procedures The data should be recorded in Log book (Per trip of incoming of raw
material ) & it would be cross-checked through the invoiced/Challan
provided by the supplier or Vendors
Purpose of data For calculating the leakage emission
Additional comment This value is fixed and ex-ante for the specified production procedure.
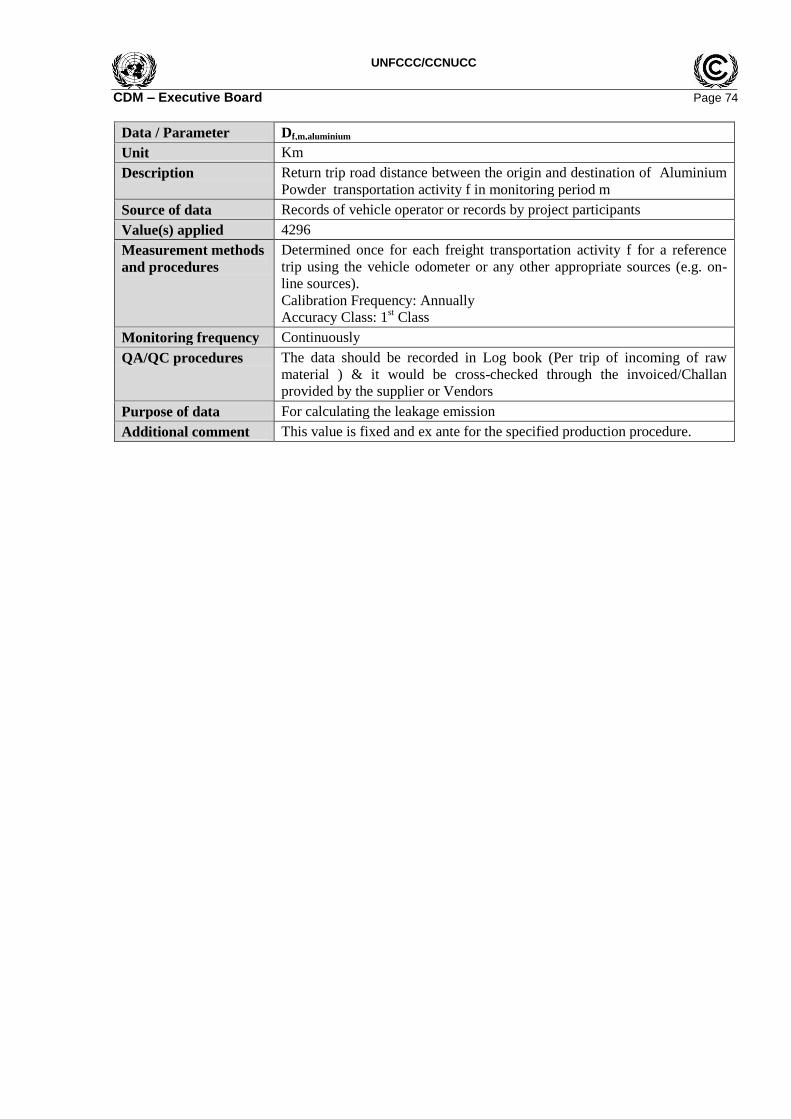
UNFCCC/CCNUCC
CDM – Executive Board Page 74
Data / Parameter Df,m,aluminium
Unit Km
Description Return trip road distance between the origin and destination of Aluminium
Powder transportation activity f in monitoring period m
Source of data Records of vehicle operator or records by project participants
Value(s) applied 4296
Measurement methods
and procedures
Determined once for each freight transportation activity f for a reference
trip using the vehicle odometer or any other appropriate sources (e.g. on-
line sources).
Calibration Frequency: Annually
Accuracy Class: 1st Class
Monitoring frequency Continuously
QA/QC procedures The data should be recorded in Log book (Per trip of incoming of raw
material ) & it would be cross-checked through the invoiced/Challan
provided by the supplier or Vendors
Purpose of data For calculating the leakage emission
Additional comment This value is fixed and ex ante for the specified production procedure.

UNFCCC/CCNUCC
CDM – Executive Board Page 75
B.7.2. Sampling plan
>>
Quality of the Product
Tests will be conducted to validate that the project bricks meet the performance requirements and
specifications in line with the following sampling plan which includes the following information -
To validate that the service level of product is better than that of the baseline product, PP will monitor the
mean value of the dry compressive strength of the project activity output at six-month intervals during the
crediting period and with a 90/10 confidence. The product that does not match necessary compressive
strength requirements will be excluded from the production.
Target population will be the production of AAC Blocks starting from the 1st output obtained on the date
of commercial operation and thereafter every six months.
The simple random sampling method will be used.
Simple random sampling is suited to populations that are homogeneous. Since the AAC Blocks are
manufactured through a fixed composition the output is homogenous in nature.
Sample size the estimated target number of “units” – pieces of equipment, solar cookers, buildings,
motors, log-books, etc. – which are to be studied (i.e. the sample size).
The sample size calculations are based on a proportion (or percentage) of interest being the objective of
the project, under Simple random sampling method. The following are pre-determined in order to
estimate the sample size:
(a) The value that the proportion is expected to take;
(b) The level of precision, and confidence in that precision (90/10 for all small-scale projects)
The equation to give us the required sample size is:
ppp
1645.11.01-N
p-1pN 1.645 n
222
2
Where:
n - Sample size
N - Total Production (57,000)
p - Our expected proportion (0.50)
1.645- Represents the 90% confidence required
0.1 -Represents the 10% relative precision
Substituting in our values gives:
5.015.0645.15.01.01-57000
0.5-15.070005 1.645 n
222
2
Where
n 269.32;
n=270;
Sampling frame would include the AAC Block production on the date of commercial operation and
thereafter production every six months.
Data will be collected randomly by the operators and submitted to Supervisor manager for further testing.

UNFCCC/CCNUCC
CDM – Executive Board Page 76
B.7.3. Other elements of monitoring plan
>>
The data monitoring will involve all the parameters mentioned in the section B.7.1. Due care will be
taken for the measurement of all these parameters and maintenance of records. Proper training would be
imparted to concerned personnel for accurate measurement and collection of data for each parameter.
The CDM monitoring team will composed the following staff:
Position Report to:
Operator Project owner
Supervisor managers (technical/maintenance)
Plant manager
CDM monitoring project manager Project owner/External CDM consultant
The allocation of responsibility to ensure compliance with the monitoring requirement of the
methodology is given here below:
Sl.
No.
Task description Operator(s) Supervisor Plant
Manager
CDM monitoring
project manager
Monitoring activity
1. Recording of monitored data √ √
Quality assurance and quality control
2 Verification of data monitored
(consistency and
completeness)
√ √
3 Ensuring adequate training of
staff
√ √
4 Ensuring adequate
maintenance
√ √ √
5 Ensuring calibration of
monitoring instruments
√ √ √
6 Data archiving: ensuring
adequate storage of data
monitored (integrity and
backup)
√ √
7 Identification of non-
conformance and
corrective/preventive actions
and monitoring plan
improvement
√ √
8 Emergency procedures √ √
Calculation of GHG emission reductions and reporting
9 Processing of data and
calculation of emission
reductions
√
10 Monitoring report:
management review of
monitoring report (internal
audit)
√ √
All data would be collected in paper log books and would be converted to spreadsheet form on a 6 months
basis.
UNFCCC/CCNUCC
CDM – Executive Board Page 77
Various templates are made to record the data to be monitored. The monitoring personnel of PE would be
provided with such templates. As the steps involved in monitoring are simple, in-house training is
imparted in recording the data and to translate the same into the computation of ERs.
SECTION C. Duration and crediting period
C.1. Duration of project activity
C.1.1. Start date of project activity
>>
The start date of the project activity is the day at which first advance payment placed to the HESS AAC
system B.V dated at 28th July 2011.
C.1.2. Expected operational lifetime of project activity
>>
20 years 0 months18
C.2. Crediting period of project activity
C.2.1. Type of crediting period
>>
Fixed
C.2.2. Start date of crediting period
>> 01/07/2013 or the actual registration date of the project – whichever is later.
C.2.3. Length of crediting period
>>
10 years 0 months g
18
Supportive for operational lifetime of the project activity dated at 29th
August 2012 provided by HESS AAC
system.

UNFCCC/CCNUCC
CDM – Executive Board Page 78
SECTION D. Environmental impacts
D.1. Analysis of environmental impacts
>>
As per the prevailing regulations of the Host Party i.e. India represented by the Ministry of Environment
and Forests (MoEF), Govt. of India, Environment Impact Assessment Notification 2006, the project
activity does not require Environment Impact Assessment to be conducted.
The facility does not produce any pollution in manufacturing process but proposes to use the waste
products like fly ash which create environmental pollution by increasing dust levels of atmosphere. The
fossil fuel consumption by the project activity is much lower, as demonstrated earlier, compared to fired
clay brick manufacturing units of equivalent capacity. Hence there is positive impact on the environment
due to this small scale project activity of reducing the pollution caused by fly ash and fossil fuels.
The following conditions are applicable to establish that the project activity is environment friendly:
i. There shall be no nuisance due to industrial activity to surroundings.
ii. The handling of fly ash i.e. transport, loading and storage shall be done in a scientific manner
so as to avoid fugitive emissions and nuisance.
iii. Water shall be sprinkled on stored fly ash to avoid fugitive emissions.
The project activity has obtained the No Objection Certificate for Consent to Establish from the West
Bengal Pollution Control Board and No Objection Certificate from the Kalyanpur Gram Panchayat,
Howrah, for establishing the manufacturing unit of Autoclaves Aerated Concrete (AAC) Blocks by using
fly ash as the main raw material which is the by-products of the nearby thermal power station.
SECTION E. Local stakeholder consultation
E.1. Solicitation of comments from local stakeholders
>>
The stakeholder consultation for AAC block manufacturing project was held at on 20th April 2012 from
11 am onwards.
Objective
· To conduct open discussion where stakeholders are encouraged to raise questions, express their concern
and comments about the proposed project through a participatory process.
· To list down the concerns of stakeholders
The identified stakeholders were villagers, officers from the Municipal Corporation, farmers around the
project area, and representatives of project developers.
These identified stakeholders were invited through letters. Stakeholders were given project introduction
and informed about its objective through a verbal presentation. The information shared included the
project description, objective, environmental impacts and benefits, applicability of technology,
implementation strategy, case studies where technology implemented has been successful internationally,
global and local benefits, contribution towards sustainable development, and status of project
implementation.
The presentation was followed by a detailed open discussion with the identified stakeholders, the details
of which are provided below in Section E.2.
E.2. Summary of comments received
>>
The stakeholders‟ consultation started with a brief presentation from representatives of UAL-
KON_CRETE about the project activity and its benefits. The stakeholders‟ consultations were well
attended with a number of participants coming from the local residents, farmers around the project area
and representatives from UAL-KON_CRETE.
The consultation process started with welcome speech by UAL-KON_CRETE representative, who gave
brief description about the company, about the process of AAC block/panel manufacturing technology
and its positive environmental benefits. The stakeholders raised their concern on environmental and social
impact of the project, its financial viability and marketability of the finished product. These concerns

UNFCCC/CCNUCC
CDM – Executive Board Page 79
were appropriately addressed by the project proponent, and following table briefs the concerns raised by
stakeholders and their corresponding response.
Stake holder‟s Concerns Answers from Representatives of UAL-
KON_CRETE, (a subsidiary unit of M/s
UAL INDUSTRIES LTD.) 1. What are the specific employment
opportunities? What are the qualifications
required?
The project will open up many job opportunities.
Villagers in the neighbourhood would be recruited
for both the civil as well as the operational
requirements of the plant. Employment generation
opportunity will be in the following areas:
- the collection, transportation and sizing of
the raw materials –unskilled labour
- plant operation – skilled labour
- Packaging & transportation – skilled &
unskilled labours.
2. What are the safety issues? The proposed project activity will equipped with
latest and modern equipments, so there is no
chance of accidents.
3. Whether there will be any pollution for the
process plant?
Main fuel used for the power project is electricity
mainly from grid & fuel oil whose pollution
(carbon emission factor) is much lower than the
coal use for clay brick manufacturing so there is a
chance of lower carbon emission through the
project activity. More over the plant equipment and
accessories will be latest and as per pollution
control board norms. So there is no chance for
pollution.
E.3. Report on consideration of comments received
>>
The project proponent will take up suggestion and inform the stakeholders regularly on the progress of
project. The project proponent were commended for their action towards environment protection. Apart
from the above comments and questions, no major issues were raised that could be related to the
environmental or CDM aspect of the project. All comments and questions were duly taken into account
by the project developer. The main concern of the community was related to the environmental, social
and monetary impacts to the local community which were addressed by the project developer.
The feedbacks from different stakeholders of the project activity are positive and encouraging. A
summary of the same is given below:
Serial No. Name of the
stake holders
Mode of
Communication
Comments
1. Arun Roy Verbal communication The proposed project is an example of
energy efficient technology which will
reduce the fossil fuel consumption as well as
will minimize the environmental pollution.
2. Partha Manna Verbal communication The project activity proposed to use the
industrial by product fly ash as their raw
material in the production purpose which is
very good for our environment as because
this fly ash generally create soil and water
pollution and destroy the environmental

UNFCCC/CCNUCC
CDM – Executive Board Page 80
ecosystem.
3. Tapas Das Verbal
communication
This proposed project activity will generate
the employment opportunity to the local
peoples.
4. Sujata Paul Verbal communication The project activity is environment friendly
and will replace the traditional clay brick
manufacturing technology which is much
energy incentive and create huge carbon
emission through their production process.
5. Manas maity Verbal communication The finished product of the project activity is
AAC blocks/panels which has much higher
technical characteristics like thermal
resistance, load sharing capacity etc. than the
traditional clay bricks and can be use as
appropriate materials for the construction
purposes.
6. Narayan Maity Verbal
communication
As the plant is equipped with the energy
efficient machineries so there is a no chance
of accident and as well as no doubt regarding
the safety issue of the operators.
SECTION F. Approval and authorization
>>
The letter(s) of approval from Party for carrying out the project activity is available at the time of
submitting the PDD to the validating DoE and same has been provided along with the PDD.
- - - - -
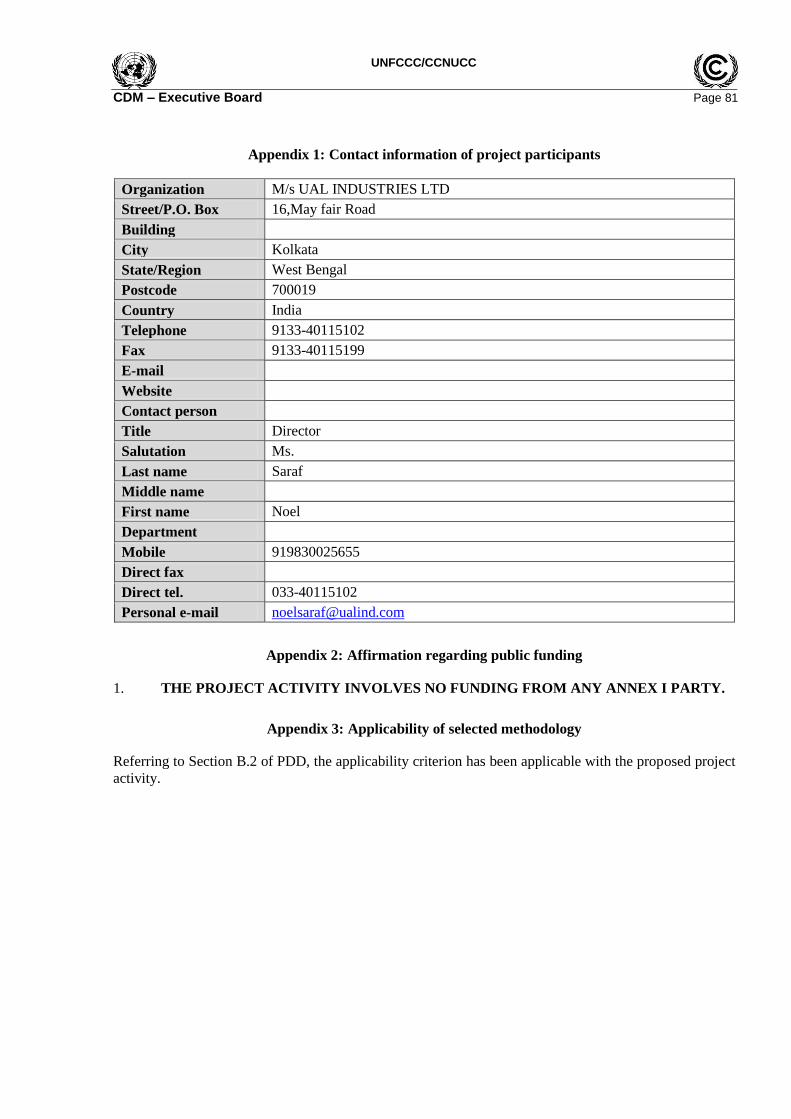
UNFCCC/CCNUCC
CDM – Executive Board Page 81
Appendix 1: Contact information of project participants
Organization M/s UAL INDUSTRIES LTD
Street/P.O. Box 16,May fair Road
Building
City Kolkata
State/Region West Bengal
Postcode 700019
Country India
Telephone 9133-40115102
Fax 9133-40115199
Website
Contact person
Title Director
Salutation Ms.
Last name Saraf
Middle name
First name Noel
Department
Mobile 919830025655
Direct fax
Direct tel. 033-40115102
Personal e-mail [email protected]
Appendix 2: Affirmation regarding public funding
1. THE PROJECT ACTIVITY INVOLVES NO FUNDING FROM ANY ANNEX I PARTY.
Appendix 3: Applicability of selected methodology
Referring to Section B.2 of PDD, the applicability criterion has been applicable with the proposed project
activity.

UNFCCC/CCNUCC
CDM – Executive Board Page 82
Appendix 4: Further background information on ex ante calculation of emission reductions
Source: “BASELINE CARBON DIOXIDE EMISSION FROM POWER SECTOR, Government of India,
Ministry of Power, Central Electricity Authority, Sewa Bhavan, R.K.Puram,New Delhi -66
http://cea.nic.in/reports/planning/cdm_co2/user_guide_ver7.pdf
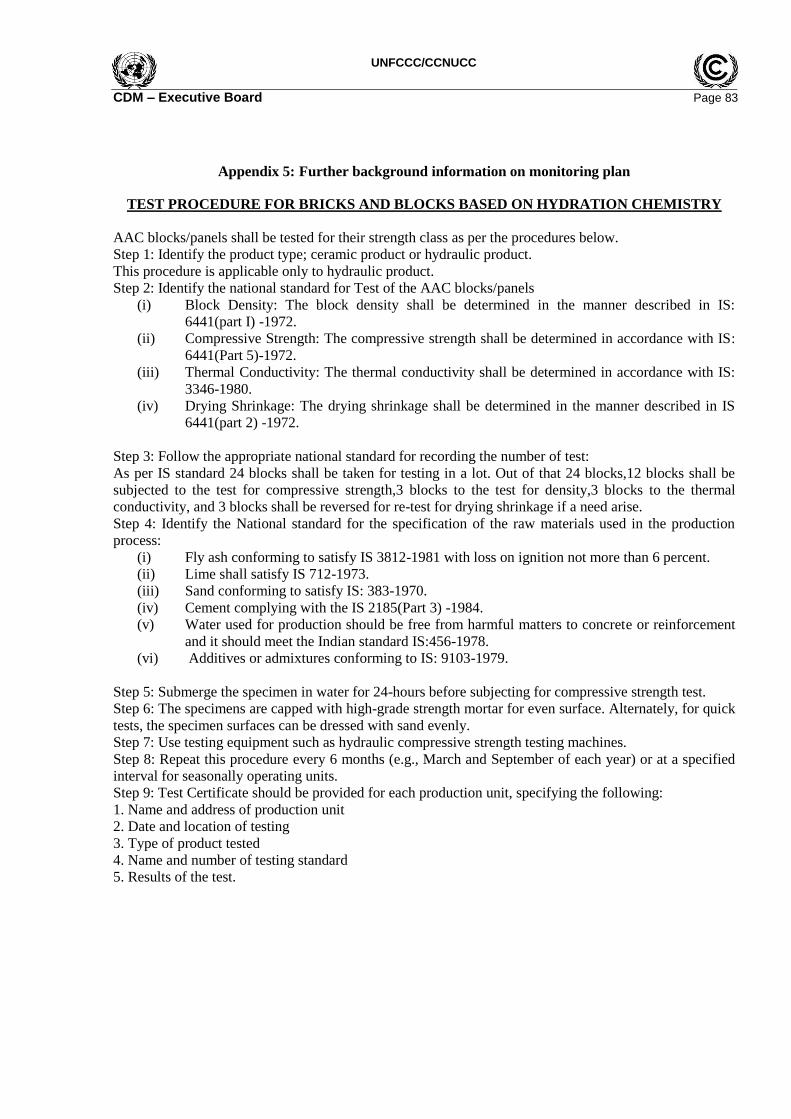
UNFCCC/CCNUCC
CDM – Executive Board Page 83
Appendix 5: Further background information on monitoring plan
TEST PROCEDURE FOR BRICKS AND BLOCKS BASED ON HYDRATION CHEMISTRY
AAC blocks/panels shall be tested for their strength class as per the procedures below.
Step 1: Identify the product type; ceramic product or hydraulic product.
This procedure is applicable only to hydraulic product.
Step 2: Identify the national standard for Test of the AAC blocks/panels
(i) Block Density: The block density shall be determined in the manner described in IS:
6441(part I) -1972.
(ii) Compressive Strength: The compressive strength shall be determined in accordance with IS:
6441(Part 5)-1972.
(iii) Thermal Conductivity: The thermal conductivity shall be determined in accordance with IS:
3346-1980.
(iv) Drying Shrinkage: The drying shrinkage shall be determined in the manner described in IS
6441(part 2) -1972.
Step 3: Follow the appropriate national standard for recording the number of test:
As per IS standard 24 blocks shall be taken for testing in a lot. Out of that 24 blocks,12 blocks shall be
subjected to the test for compressive strength,3 blocks to the test for density,3 blocks to the thermal
conductivity, and 3 blocks shall be reversed for re-test for drying shrinkage if a need arise.
Step 4: Identify the National standard for the specification of the raw materials used in the production
process:
(i) Fly ash conforming to satisfy IS 3812-1981 with loss on ignition not more than 6 percent.
(ii) Lime shall satisfy IS 712-1973.
(iii) Sand conforming to satisfy IS: 383-1970.
(iv) Cement complying with the IS 2185(Part 3) -1984.
(v) Water used for production should be free from harmful matters to concrete or reinforcement
and it should meet the Indian standard IS:456-1978.
(vi) Additives or admixtures conforming to IS: 9103-1979.
Step 5: Submerge the specimen in water for 24-hours before subjecting for compressive strength test.
Step 6: The specimens are capped with high-grade strength mortar for even surface. Alternately, for quick
tests, the specimen surfaces can be dressed with sand evenly.
Step 7: Use testing equipment such as hydraulic compressive strength testing machines.
Step 8: Repeat this procedure every 6 months (e.g., March and September of each year) or at a specified
interval for seasonally operating units.
Step 9: Test Certificate should be provided for each production unit, specifying the following:
1. Name and address of production unit
2. Date and location of testing
3. Type of product tested
4. Name and number of testing standard
5. Results of the test.

UNFCCC/CCNUCC
CDM – Executive Board Page 84
Appendix 6: Summary of post registration changes
No changes will be incurred yet for the project activity.
- - - - -
History of the document
Version Date Nature of revision
04.0 EB 66
13 March 2012
Revision required to ensure consistency with the “Guidelines for completing the
project design document form for small-scale CDM project activities” (EB 66,
Annex 9).
03 22 December 2006 The Board agreed to revise the CDM project design document for small-scale
activities (CDM-SSC-PDD), taking into account CDM-PDD and CDM-NM.
02 8 July 2005 The Board agreed to revise the CDM SSC PDD to reflect guidance and
clarifications provided by the Board since version 01 of this document.
As a consequence, the guidelines for completing CDM SSC PDD have been
revised accordingly to version 2. The latest version can be found at
<http://cdm.unfccc.int/Reference/Documents>.
01 21 January 2003 Initial adoption.
Decision Class: Regulatory
Document Type: Form
Business Function: Registration