
Proc. R. Soc. A-2008-Sezer-3107-28
23
December 2008 , published 8 , doi: 10.1098/rspa.2008.0190 464 2008 Proc. R. Soc. A Ismet Sezer and Atilla Bilgin second laws of thermodynamics operation via the combination of the first and Mathematical analysis of spark ignition engine References html#ref-list-1 http://rspa.royalsocietypublishing.org/content/464/2100/3107.full. This article cites 16 articles Subject collections (222 articles) mechanical engineering Articles on similar topics can be found in the following collections Email alerting service here the box at the top right-hand corner of the article or click Receive free email alerts when new articles cite this article - sign up in http://rspa.royalsocietypublishing.org/subscriptions go to: Proc. R. Soc. A To subscribe to on September 17, 2014 rspa.royalsocietypublishing.org Downloaded from on September 17, 2014 rspa.royalsocietypublishing.org Downloaded from
-
Upload
santiago-del-rio-oliveira -
Category
Documents
-
view
16 -
download
1
description
Proc. R. Soc. A-2008-Sezer-3107-28
Transcript of Proc. R. Soc. A-2008-Sezer-3107-28

December 2008, published 8, doi: 10.1098/rspa.2008.0190464 2008 Proc. R. Soc. A
Ismet Sezer and Atilla Bilgin second laws of thermodynamicsoperation via the combination of the first and Mathematical analysis of spark ignition engine
Referenceshtml#ref-list-1http://rspa.royalsocietypublishing.org/content/464/2100/3107.full.
This article cites 16 articles
Subject collections (222 articles)mechanical engineering �
Articles on similar topics can be found in the following collections
Email alerting service herethe box at the top right-hand corner of the article or click Receive free email alerts when new articles cite this article - sign up in
http://rspa.royalsocietypublishing.org/subscriptions go to: Proc. R. Soc. ATo subscribe to
on September 17, 2014rspa.royalsocietypublishing.orgDownloaded from on September 17, 2014rspa.royalsocietypublishing.orgDownloaded from

on September 17, 2014rspa.royalsocietypublishing.orgDownloaded from
Mathematical analysis of spark ignition engineoperation via the combination of the first and
second laws of thermodynamics
BY ISMET SEZER1,* AND ATILLA BILGIN
2
1Besikduzu Vocational School, and 2Mechanical Engineering Department,Karadeniz Technical University, 61080 Trabzon, Turkey
This study aims at the theoretical exergetic evaluation of spark ignition engine operation. Forthis purpose, a two-zone quasi-dimensional cycle model was installed, not considering thecomplex calculation of fluid motions. The cycle simulation consists of compression, combus-tion and expansion processes. The combustion phase is simulated as a turbulent flamepropagation process. Intake and exhaust processes are also computed by a simple approxima-tion method. The results of the model were compared with experimental data to demonstratethe validation of the model. Principles of the second law are applied to the model to performthe exergy (or availability) analysis. In the exergy analysis, the effects of various operationalparameters, i.e. fuel–air equivalence ratio, engine speed and spark timing on exergetic termshave been investigated. The results of exergy analysis show that variations of operationalparameters examined have considerably affected the exergy transfers, irreversibilities andefficiencies. For instance, an increase in equivalence ratio causes an increase in irreversibilities,while it decreases the first and also the second law efficiencies. The irreversibilities haveminimum values for the specified engine speed and optimum spark timing, while the firstand second law efficiencies reach a maximum at the same engine speed and optimumspark timing.
Keywords: spark ignition engine; quasi-dimensional model; availability;irreversibilities; exergy analysis
*A
RecAcc
1. Introduction
The cyclemodels of spark ignition (SI) engines are one of the most effective tools forthe analysis of engine performance, parametric examinations and assistance to newdevelopments. These models are mainly classified as thermodynamics-basedmodels and fluid dynamics-based models, namely computational fluid dynamics(CFD) models. Thermodynamic-based models consist of zero- and quasi-dimensional (QD) models. Zero-dimensional (ZD) models do not have any spatialresolutions and the cylinder composition is regarded as mean values. Geometricfeatures of the fluid motion cannot be predicted in these models due to the non-existence of fluid flow modelling. However, they are fast and cheap in terms ofcomputation. On the other hand, fluid dynamics-based models are multi-dimensional (MD) models that are a solution of the full conservation differential
Proc. R. Soc. A (2008) 464, 3107–3128
doi:10.1098/rspa.2008.0190
Published online 22 July 2008
uthor for correspondence ([email protected]).
eived 7 May 2008epted 27 June 2008 3107 This journal is q 2008 The Royal Society
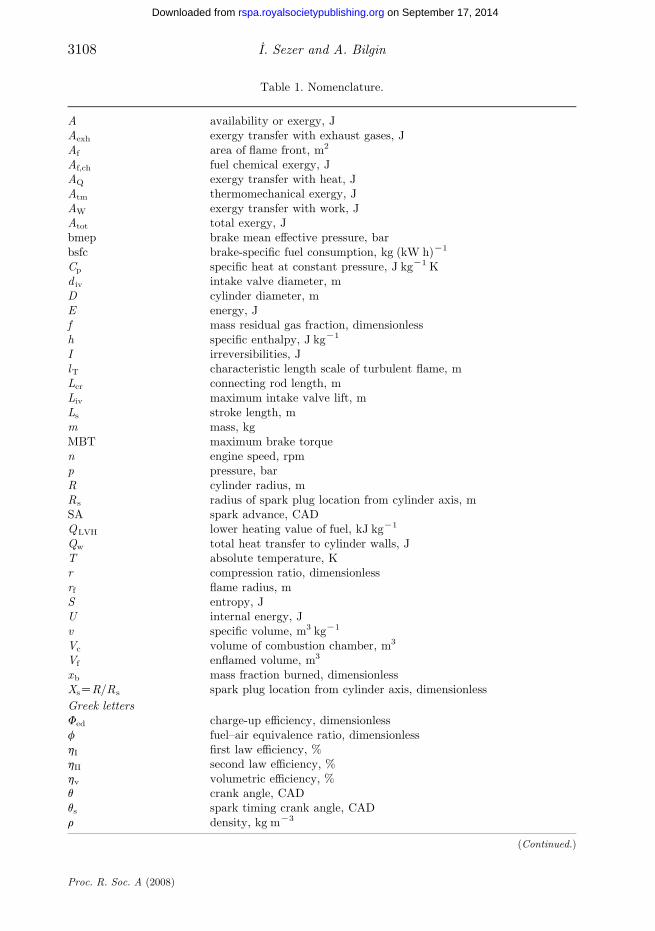
Table 1. Nomenclature.
A availability or exergy, JAexh exergy transfer with exhaust gases, JAf area of flame front, m2
Af,ch fuel chemical exergy, JAQ exergy transfer with heat, JAtm thermomechanical exergy, JAW exergy transfer with work, JAtot total exergy, Jbmep brake mean effective pressure, barbsfc brake-specific fuel consumption, kg (kW h)K1
Cp specific heat at constant pressure, J kgK1 Kd iv intake valve diameter, mD cylinder diameter, mE energy, Jf mass residual gas fraction, dimensionlessh specific enthalpy, J kgK1
I irreversibilities, JlT characteristic length scale of turbulent flame, mLcr connecting rod length, mLiv maximum intake valve lift, mLs stroke length, mm mass, kgMBT maximum brake torquen engine speed, rpmp pressure, barR cylinder radius, mRs radius of spark plug location from cylinder axis, mSA spark advance, CADQLVH lower heating value of fuel, kJ kgK1
Qw total heat transfer to cylinder walls, JT absolute temperature, Kr compression ratio, dimensionlessrf flame radius, mS entropy, JU internal energy, Jv specific volume, m3 kgK1
Vc volume of combustion chamber, m3
Vf enflamed volume, m3
xb mass fraction burned, dimensionlessXsZR/Rs spark plug location from cylinder axis, dimensionless
Greek lettersFed charge-up efficiency, dimensionlessf fuel–air equivalence ratio, dimensionlesshI first law efficiency, %hII second law efficiency, %hv volumetric efficiency, %q crank angle, CADqs spark timing crank angle, CADr density, kg mK3
(Continued.)
I. Sezer and A. Bilgin3108
Proc. R. Soc. A (2008)
on September 17, 2014rspa.royalsocietypublishing.orgDownloaded from

Table 1. (Continued.)
tb characteristic burning time of eddy at size of lT, su angular speed, sK1
subscripts0 reference or dead-state conditionsa intake conditionsb burnedcr connecting rodcomb combustiondest destructione entrainmentg gaskin kineticmax maximumpot potentialr exhaust conditionss sparktot totalT turbulentu unburnedw wall
3109Exergy analysis of SI engine operation
on September 17, 2014rspa.royalsocietypublishing.orgDownloaded from
(Navier–Stokes) equations in both time and spatial dimensions. CFD models canpredict chamber geometry and fluid motion in detail. Many sub-models forturbulence, combustion and chemical reactions are required in CFD models.Moreover, a computational mesh and detailed boundary and initial conditions arealso needed for the solution. For these reasons, they are very slow and expensive interms of computation. Furthermore, CFD models suffer from some uncertaintiesduring numerical modelling due to the complexity of engine processes. Therefore,CFD models are mostly used to determine the turbulent fluid flow field andoptimum combustion chamber geometry in the case of no combustion conditions(Wengang 1995; Tallio 1998; Sezer 2008). QD models, on the other hand, arefundamentally thermodynamics-based models, as cited before, and they needempirical inputs for turbulent intensities and mass burn rate. QD models have theadvantages of both ZD andMDmodels due to some influence of chamber geometryand fluid motion, are fast in terms of computation time and are easy to use (Daiet al. 1996;Caton2001;Georgios 2005; Sezer 2008).For these reasons,QDmodels havebeen widely used for predicting the effects of flow parameters, mixture compositionand combustion chamber geometry in SI engine combustion and heat transfer,and also overall engine performance and emissions (Agarwal et al. 1998; table 1).
Both ZD and QD models have been commonly used over the years for researchand design studies, but most such simulation studies have been used only for thefirst law of thermodynamics. Furthermore, in the few past decades, it has beenclearly understood that the first law of thermodynamics is not capable of providinga suitable insight into engine operations. For this reason, the use of the second lawof thermodynamics has been intensified in internal combustion engines (Caton2000a; Rakopoulos & Giakoumis 2006). The analysis of a process or a system withthe second law of thermodynamics is termed availability or exergy analysis.
Proc. R. Soc. A (2008)

I. Sezer and A. Bilgin3110
on September 17, 2014rspa.royalsocietypublishing.orgDownloaded from
The application of exergy analysis in engineering systems is very useful becauseit provides quantitative information about irreversibilities and exergy losses in thesystem. In this way, the thermodynamic efficiency can be quantified and poorefficiency areas identified, so that systems can be designed and operated moreefficiently (Cengel & Boles 1994; Moran & Shapiro 2000; Rezac &Metghalchi 2004).
A series of papers was published on second law or exergy analysis appliedto internal combustion engines in the last few decades. A review study waspublished by Caton (2000a) and was extended by Rakopoulos & Giakoumis(2006). It can be seen from these review papers that numerous studies have beenperformed on the application of exergy analysis to SI engines (Shapiro & VanGerpen 1989; Gallo & Milanez 1992; Rakopoulos 1993; Alasfour 1997; Caton1999a, 2000b, 2002; Kopac & Kokturk 2005) and compression ignition engines(Flynn et al. 1984; Alkidas 1988; Kumar et al. 1989; Van Gerpen & Shapiro 1990;Velasquez & Milanez 1994; Rakopoulos & Giakoumis 1997; Kanoglu et al. 2005;Parlak et al. 2005). In most SI engine studies, the combustion process has beengenerally simulated by using simple empirical equations (Shapiro & Van Gerpen1989; Gallo & Milanez 1992; Caton 1999a, 2000b), and studies performed withdetailed combustion models are limited (Rakopoulos 1993; Caton 2002).However, the combustion process is the most important stage during SI engineoperation and modelling of combustion in a realistic way is very important forexergetic computations. Therefore, this study has been devoted to the investiga-tion of SI engine operation from the second law perspective by using a QDtwo-zone cycle model, and the combustion period is simulated as a turbulententrainment process. The details of the cycle model and exergy analysis arepresented in the next sections.
2. Mathematical model
(a ) Governing equations of the cycle model
A QD thermodynamic cycle model, which is mainly based on the model ofFerguson (1985), has been used in this study. Equations of the original modelhave been rearranged for the model used here. The governing equations of thecycle model were derived from the first law of thermodynamics (the energyequation) by assuming that the cylinder content obeys the ideal gas law. Theenergy equation in crank angle basis is written as
DU ZQKW0mdu
dqCu
dm
dqZ
dQ
dqKp
dV
dq; ð2:1Þ
where m is the mass of cylinder content; u is the specific internal energy; Q is theheat transfer; p is the pressure; V is the volume; and q is the crank angle.Equation (2.1) shows the variations of the thermodynamic properties withrespect to the crank angle. Moreover, these thermodynamic properties are alsofunctions of temperature and pressure, which will be determined in the model.
To determine instantaneous cylinder volume, pressure, and burned andunburned gas temperatures, the following governing equations have been used:
V ðqÞZVc 1CrK1
21Kcos qC
1
rcr
h1Kð1Kr 2cr sin
2qÞ0:5i� �� �
; ð2:2Þ
Proc. R. Soc. A (2008)

3111Exergy analysis of SI engine operation
on September 17, 2014rspa.royalsocietypublishing.orgDownloaded from
where rcr is half of the ratio of stroke length Ls to connecting rod length Lcr,rcrZLs/2Lcr.
dp
dqZ
ACBCC
DCE; ð2:3Þ
where
AZ1
m
dV
dq; BZ
hg
um
vbCpb
v lnvbv lnTb
1KTw
Tb
� �AbC
vuCpu
v lnvuv lnTu
1KTw
Tu
� �Au
� �;
CZKdxbdq
ðvbKvuÞCvbv lnvbv lnTb
hbKhu
CpbTb
� �; DZx b
v2bCpbTb
v lnvbv lnTb
� �2
Cvbp
v lnvbv lnp
� �
and
EZð1KxbÞv2u
CpuTu
v lnvuv lnTu
� �2
Cvup
v lnvuv lnp
� �:
dTb
dqZ
KhgAbðTbKTwÞumCpbxb
CvbCpb
v ln vbv ln Tb
dp
dqC
huK hbxbCpb
dxbdq
ð2:4Þ
and
dTu
dqZ
KhgAuðTuKTwÞumCpuð1K xbÞ
dp
dqC
vuCpu
v ln vuv ln Tu
: ð2:5Þ
The extra governing equations are also used to compute work output and heat loss,
dW
dqZ p
dV
dqð2:6Þ
and
dQw
dqZ
hg
u½AbðTbKTwÞCAuðTuKTwÞ�: ð2:7Þ
In the above equations, heat transfer coefficients hg and the cylinder walltemperature Tw are taken as 500 W mK2 KK1 and 400 K, respectively, assuggested by Ferguson (1985). Ab and Au are also the wetted areas by burnedand unburned gases, respectively, which are computed by a geometrical sub-modelgiven below. Further details of the cycle model can be found in Ferguson (1985)and Sezer (2008).
(b ) Combustion model
After the initiation of combustion at a specified crank angle, two zones, namelyburned and unburned, exist in the combustion chamber. Each zone is assumed tobe uniform in temperature and homogeneous in composition. It is also assumedthat a uniform pressure distribution exists in the cylinder. The combustion processis simulated as turbulent flame propagation and it is supposed that the flame
Proc. R. Soc. A (2008)

I. Sezer and A. Bilgin3112
on September 17, 2014rspa.royalsocietypublishing.orgDownloaded from
front progresses spherically in the unburned gases. Under these assumptions, thefollowing equations, first presented by Blizard & Keck (1974) and Keck (1982),developed by Tabaczynski et al. (1977, 1980) and also by Bayraktar & Durgun(2003), have been used for the determination of burnt mass fraction:
dme
dqZ ruAfUe; ð2:8Þ
dmb
dqZ ruAfSLCmeKmb=tb ð2:9Þ
and
tb Z lT=SL; ð2:10Þwhere Af is the area of the flame front and tb is the characteristic burning time ofthe eddy of size lT.
The rate of mass burned is proportional to the flame front area and the flamespeed. The Af has been computed instantaneously depending on the enflamedvolume Vf with the help of the geometrical sub-model. Moreover, the followingequations were used for determining the turbulent entrainment speed Ue, theturbulent speed UT and the characteristic length scale of the turbulent flame lT:
Ue ZUTCSL; ð2:11Þ
UT Z 0:08 �U iðri=reÞ1=2; ð2:12Þ
�U i ZhvðApc=AivÞLsn
30ð2:13Þ
and
lT Z 0:8L ivðre=riÞ3=4; ð2:14Þ
where �U i is the speed of gases entering the cylinder during induction; Apc is thearea of the piston crown; Aiv is the maximum opening area of the intake valve;and L iv is the maximum intake valve lift.
Laminar flame speed SL is also calculated by the equations developed byGulder (1984),
SLðf;T ; pÞZSL;0½Tu=T0�a½p=p0�bð1Kjf Þ; ð2:15Þ
where SL,0 is the laminar flame speed at standard conditions; T0Z298 K; andp0Z1 bar and is calculated as
SL;0ðfÞZZWfh exp½KxðfK1:075Þ2�: ð2:16Þ
The values of a, b, Z, W, h and x are given in Gulder (1984) and j is selected as2.5 for 0%fR0.3.
(c ) Geometric sub-model
In the geometric sub-model, it is supposed that the spherical flame propagatesfrom the spark plug through the combustion chamber, as shown in figure 1.Under this assumption, the enflamed volume Vf, flame surface area Af and heat
Proc. R. Soc. A (2008)

spark plug cylinder axis
Figure 1. Flame front geometry.
3113Exergy analysis of SI engine operation
on September 17, 2014rspa.royalsocietypublishing.orgDownloaded from
transfer surface area Aw have been computed, depending on the instantaneousenflamed volume Vf and chamber height h, by using an iterative method. Thevalues of Vf and h have been determined from the thermodynamic cycle modelas follows:
VfðqÞZVbðqÞC ½meðqÞKmbðqÞ�=ru ð2:17Þ
and
hðqÞZLs½1KðrK1Þ�C0:5½1KcosðqÞ�: ð2:18Þ
The geometric features of the flame front in figure 1 have been determined forany flame radius from the following mathematical relations (Blizard & Keck1974; Keck 1982; Bilgin 2002):
AfðrfÞZ 2rf
ðzZy
zZ0aðzÞdz ð2:19Þ
and
VfðrfÞZ 2rf
ðzZy
zZ0½aðzÞr2ðzÞCbðzÞR2KXsR sin bðzÞ�dz; ð2:20Þ
where cos aZðX2s Cr2ðzÞKR2Þ=½2XsrðzÞ�; cos bZðX2
s Cr2ðzÞKR2Þ=½2XsrðzÞ�;and r2ðzÞZr 2f Kz2.
The total combustion chamber surface area wetted by the burned gases is thesum of the areas of the cylinder head, cylinder wall and piston crown wetted by
Proc. R. Soc. A (2008)

I. Sezer and A. Bilgin3114
on September 17, 2014rspa.royalsocietypublishing.orgDownloaded from
the burned gases as below,
AwðrfÞZAw;chðrfÞCAw;cwðrfÞCAw;pcðrfÞ; ð2:21Þ
Aw;chðrfÞZað0Þr2ð0ÞCbð0ÞR2KXsR sin bð0Þ; ð2:22Þ
Aw;cwðrfÞZ 2
ðzZy
zZ0RbðzÞdz ð2:23Þ
and
Aw;pcðrfÞZaðyÞr2ðyÞCbðyÞR2KXsR sin bðyÞ: ð2:24ÞThe area wetted by the unburned gases is determined by assuming the total
chamber area is the sum of the areas in contact with the burned and unburnedzones as follows:
Atot ZAb CAu: ð2:25Þ
(d ) Computation of the cycle
As known, SI engine cycles consist of four consecutive processes, namelyintake, compression, expansion and exhaust. Intake and exhaust processes arecomputed by using the approximation method given by Bayraktar & Durgun(2003). In this method, pressure loss during the intake process is calculated fromthe Bernoulli equation for one-dimensional uncompressible flow, and intakepressure and temperature are determined as
pa Z p0KDpa ð2:26Þ
and
Ta Z ðT0 CDT CgrTrÞ=ð1CgrTrÞ; ð2:27Þ
where p0 and T0 are the ambient pressure and temperature, respectively, and Dpais the pressure loss.
The volumetric efficiency is determined as
hv ZFed
r
rK1
pap0
T0
T0CDT CgrTr
; ð2:28Þ
where Fed is the charge-up efficiency; r is the compression ratio; and gr is themolar residual gas fraction.
Compression, combustion and expansion processes have been computed byarranging the governing equations (2.3)–(2.7) for each process in a suitable manner.
Exhaust pressure pr and exhaust temperature Tr are also specified in terms ofambient pressure p0 and burned gas temperature Tb, respectively (Bayraktar &Durgun 2003),
pr Z ð1:05K1:25Þp0 ð2:29Þand
Tr ZTb=ðpb=prÞ1=3: ð2:30Þ
Proc. R. Soc. A (2008)

3115Exergy analysis of SI engine operation
on September 17, 2014rspa.royalsocietypublishing.orgDownloaded from
Once the computation of cycle is completed, engine performance parameters,i.e. brake mean effective pressure (bmep) and brake-specific fuel consumption(bsfc), can be determined by using well-known equations (Ferguson 1985;Bayraktar & Durgun 2003; Sezer 2008).
(e ) The second law (exergy ) concept
The second law is analogous to the statement of entropy balance as follows(Cengel & Boles 1994; Moran & Shapiro 2000):
DS Z
ððQ=TÞboundaryCs; ð2:31Þ
where s is the total entropy generated due to the internal irreversibilities.Considering the combination of the first and second laws of thermodynamics, theexergy or availability equation can be stated for a closed system (Cengel & Boles1994; Moran & Shapiro 2000),
AZECp0VKT0S; ð2:32Þwhere E is the total energy, which is the sum of the internal, kinetic and potentialenergies (EtotZUCEkinCEpot); V and S are the volume and entropy of thesystem, respectively; and p0 and T0 are the fixed pressure and temperature ofthe dead state, respectively.
Availability (or exergy) is defined as the maximum theoretical work that canbe obtained from a combined system (combination of a system and its referenceenvironment) when the system comes into equilibrium (as thermally,mechanically and chemically) with the environment (Cengel & Boles 1994;Caton 2000a; Moran & Shapiro 2000; Rezac & Metghalchi 2004; Rakopoulos &Giakoumis 2006). The maximum available work from a system emerges as thesum of two contributions: thermomechanical exergy Atm and chemical exergyAch. Thermomechanical exergy is defined as the maximum extractable work fromthe combined system as the system comes into thermal and mechanical equilibriawith the environment, and it is determined as (Van Gerpen & Shapiro 1990;Moran & Shapiro 2000; Rakopoulos & Giakoumis 2006)
Atm ZECp0VKT0SKX
m0;im i; ð2:33Þ
where m i and m0,i are the mass and chemical potential of species ‘i’, respectively,calculated at restricted dead-state conditions.
At the restricted dead-state conditions, the system is in thermal andmechanical equilibria with the environment and no work potential exists betweenthe system and the environment due to temperature and pressure differences. Butthe system does not reach chemical equilibrium with the environment, as thecontents of the system are not permitted to mix with the environment or enterthe chemical reaction by environmental components (Van Gerpen & Shapiro1990). In principle, the difference between the compositions of the system at therestricted dead-state conditions and the environment can be used to obtainadditional work to reach chemical equilibrium. The maximum work obtained inthis way is called chemical exergy and is determined as (Van Gerpen & Shapiro1990; Moran & Shapiro 2000; Rakopoulos & Giakoumis 2006)
Ach ZX
m i m0;iKm0i
� �; ð2:34Þ
Proc. R. Soc. A (2008)

I. Sezer and A. Bilgin3116
on September 17, 2014rspa.royalsocietypublishing.orgDownloaded from
where m0i is the chemical potential of species ‘i ’ calculated at true dead-
state conditions.The availability balance for a closed system for any process can also be written
as (Caton 1999a, 2000a,b)
DAZA2KA1 ZAQKAWKAdest; ð2:35Þwhere DA is the variation of the total system availability; A2 is the totalavailability at the end of the process; A1 is the total availability at the start ofthe process; AQ is the availability transfer due to heat transfer interactions; AW
is the availability transfer due to work interactions; and Adest is the destroyedavailability by irreversible processes.
Considering fuel chemical exergy, the exergy balance equation for the enginecylinder is written as (Zhang 2002; Sezer 2008)
dA
dqZ 1K
T0
T
� �dQ
dqK
dW
dqK p0
dV
dq
� �C
m f
m
dxbdq
a f;chKdIcomb
dq: ð2:36Þ
The left-hand side of equation (2.36) is the rate of change in the total exergy ofthe cylinder contents. The first and second terms on the right-hand siderepresent exergy transfers with heat and work, respectively. The third term onthe right-hand side corresponds to burned fuel exergy; here, m f and mtot are themasses of fuel and total cylinder contents and af,ch is the fuel chemical exergy.a f,ch is calculated by using the following equation that is developed for liquidfuels by Kotas (1995):
Af;ch Z a f;chm f ZQLHV 1:0401C0:01728h 0
c 0C0:0432
o0
c 0
�
C0:2196s 0
c 0 1K2:0628h 0
c 0
� ��; ð2:37Þ
where QLHV is the lower heating value of the fuel that is calculated by using theMendeleyev formula
QLHV Z ½33:91c0 C125:6h 0K10:89ðo0Ks 0ÞK2:51ð9h 0Kw 0Þ�: ð2:38Þ
The quantities h0, c0, o0, s0 and w0 in equations (2.37) and (2.38) represent themass fractions of the elements carbon, hydrogen, oxygen, sulphur and watercontent in the fuel, respectively.
The last term on the right-hand side of equation (2.36) illustrates exergydestruction in the cylinder due to combustion. It is calculated as
_Icomb ZT0_S comb; ð2:39Þ
where _S comb is the rate of entropy generation due to combustion irreversibilities.It is calculated from the two-zone combustion model depending on entropybalance as (Zhang 2002; Sezer 2008)
_S comb ZdðmbsbÞ
dqC
dðmusuÞdq
; ð2:40Þ
where mb and mu are the masses and sb and su are the specific entropy values ofthe burned and unburned gases of the cylinder contents, respectively.
Proc. R. Soc. A (2008)

3117Exergy analysis of SI engine operation
on September 17, 2014rspa.royalsocietypublishing.orgDownloaded from
Moreover, the total exergy destruction considered here consists of combustionand heat transfer irreversibilities as follows (Sezer 2008):
_Itot Z _IcombC _IQ: ð2:41ÞEntropy production sourced from the heat transfer process is as in equation
(2.42), and exergy destruction due to heat transfer has already been determinedin equation (2.36),
_S Q Z_Q b
Tb
C_Q u
Tu
; ð2:42Þ
where _Q b and _Q u are the rates of heat loss from the burned and unburned gaszones at temperatures Tb and Tu, respectively.
The efficiency is defined to be able to compare different engine sizeapplications or evaluate various improvement effects from the perspective ofeither the first or second laws (Rakopoulos & Giakoumis 2006). The first law (orenergy-based) efficiency is defined as
hI Zenergy out ðas workÞ
energy inZ
W
m fQLHV
; ð2:43Þ
where W is the indicated work output.Various second law efficiencies (exergetic or availability efficiency, or
effectiveness) have been defined in the literature (Rakopoulos & Giakoumis2006). In this study, the following definition is used for the second law efficiency:
hII Zexergy out ðas workÞ
exergy inZ
AW
m fa f;ch
: ð2:44Þ
3. Numerical applications
(a ) Computer program and solution procedure
A computer code has been written for the presented SI engine cycle model. Inputparameters in the software were r, n, f, Xs, qs, properties of the fuel and ambientpressure and temperature. Once determining the intake conditions, thethermodynamic state of the cylinder charge is predicted by solving the governingdifferential equations. To integrate these differential equations, the DVERKsubroutine is used. The composition and thermodynamic properties of thecylinder content in the simulation are computed using the FORTRAN subroutinesfuel–air–residual gas and equilibrium-combustion-products, which wereoriginally developed by Ferguson (1985). Exergetic calculations are performedsimultaneously, depending on the thermodynamic state of the cylinder content.
Finally, the results obtained have been corrected using error analysis asfollows (Ferguson 1985; Sezer 2008):
31 Z 1K½vm=V � ð3:1Þand
32 Z 1C ½W=DðmuÞCQw�: ð3:2Þ
Proc. R. Soc. A (2008)
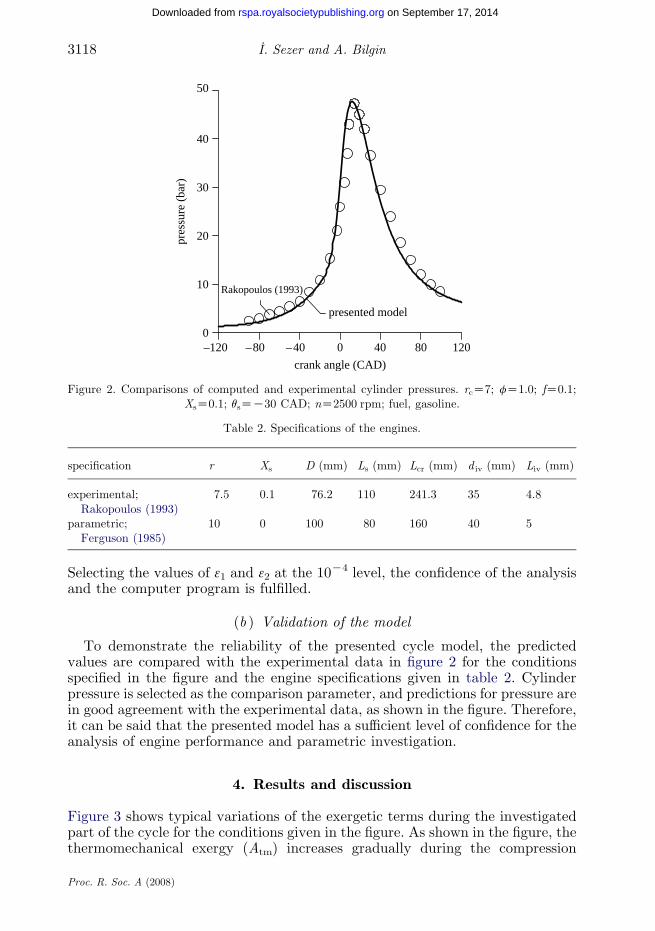
Table 2. Specifications of the engines.
specification r Xs D (mm) Ls (mm) Lcr (mm) d iv (mm) Liv (mm)
experimental;Rakopoulos (1993)
7.5 0.1 76.2 110 241.3 35 4.8
parametric;Ferguson (1985)
10 0 100 80 160 40 5
–120 –80 –40 0 40 80 120
crank angle (CAD)
0
10
20
30
40
50
pres
sure
(ba
r)
Rakopoulos (1993)
presented model
Figure 2. Comparisons of computed and experimental cylinder pressures. rcZ7; fZ1.0; fZ0.1;XsZ0.1; qsZK30 CAD; nZ2500 rpm; fuel, gasoline.
I. Sezer and A. Bilgin3118
on September 17, 2014rspa.royalsocietypublishing.orgDownloaded from
Selecting the values of 31 and 32 at the 10K4 level, the confidence of the analysisand the computer program is fulfilled.
(b ) Validation of the model
To demonstrate the reliability of the presented cycle model, the predictedvalues are compared with the experimental data in figure 2 for the conditionsspecified in the figure and the engine specifications given in table 2. Cylinderpressure is selected as the comparison parameter, and predictions for pressure arein good agreement with the experimental data, as shown in the figure. Therefore,it can be said that the presented model has a sufficient level of confidence for theanalysis of engine performance and parametric investigation.
4. Results and discussion
Figure 3 shows typical variations of the exergetic terms during the investigatedpart of the cycle for the conditions given in the figure. As shown in the figure, thethermomechanical exergy (Atm) increases gradually during the compression
Proc. R. Soc. A (2008)

–180 –150 –120 –90 –60 –30 0 30 60 90 120 150 180crank angle (CAD)
–500
0
500
1000
1500
2000
2500
3000
exer
getic
term
s (J
)
Figure 3. Typical variations of exergetic terms as a function of crank angle. fZ1.05; fZ0.1; rZ10;XsZ0; qsZK30 CAD; nZ3000 rpm; DqbZ64 CAD.
3119Exergy analysis of SI engine operation
on September 17, 2014rspa.royalsocietypublishing.orgDownloaded from
stroke up to the beginning of combustion, while fuel chemical exergy (Af,ch)remains constant. During compression, increase in the thermomechanical exergydirectly depends on the exergy transfer with work (AW) and AW shows asymmetrical variation by thermomechanical exergy with a negative sign. There isno remarkable variation in irreversibilities (I ) due to a negligible exergy transferwith heat (AQ) in this period. The variation in the total exergy (Atot) reflects thebehaviour of the thermomechanical exergy variation. With the start ofcombustion, at the crank angle of –30 CAD before top dead centre, the chemicalexergy of the fuel decreases rapidly due to conversion to heat. As a result of thisconversion, i.e. combustion of fuel, the temperature and pressure increase in thecylinder, which results in a steep increase in thermomechanical exergy and anincrease in exergy transfer from the cylinder contents to the walls by heat transfer.Both heat transfer and, especially, combustion give a rapid increase in theirreversibilities due to entropy generation. Combustion ends at the crank angle of34 CAD after top dead centre and the expansion process continues until the pistonreaches the bottom dead centre. During this part of the cycle, decreases in Atm andAtot continue due to the exergy transfers (both work and heat) from the system,while irreversibilities stand at almost a constant level. The remaining exergy in thecylinder at the end of the expansion emits with exhaust gases, which is calledexergy transfer with exhaust (Aexh). The distributions of the exergetic terms in thefuel exergy, i.e. AQ, AW, Aexh and I are approximately 8, 36.5, 36.9 and 18 percent, respectively, for the conditions given in figure 3.
Proc. R. Soc. A (2008)
–250
–200
–150
–100
–50
0
50(a) (b)
(c) (d )
(e) ( f )
exer
gy tr
ansf
er w
ith h
eat (
J)
1.0
1.1
–180 –120 –60 0 60 120 180crank angle (CAD)
–180 –120 –60 0 60 120 180crank angle (CAD)
–400
0
400
800
1200
exer
gy tr
ansf
er w
ith w
ork
(J)
1.0
1.1
1.0
1.1
1.0
1.11.01.1
1.01.1
0
100
200
300
400
500
irre
vers
ibili
ties
(J)
0
500
1000
1500
2000
2500
ther
mom
echa
nica
l exe
rgy
(J)
0
500
1000
1500
2000
2500
3000
fuel
exe
rgy
(J)
500
1000
1500
2000
2500
3000
tota
l exe
rgy
(J)
= 0.9= 0.9
= 0.9
= 0.9
= 0.9 = 0.9
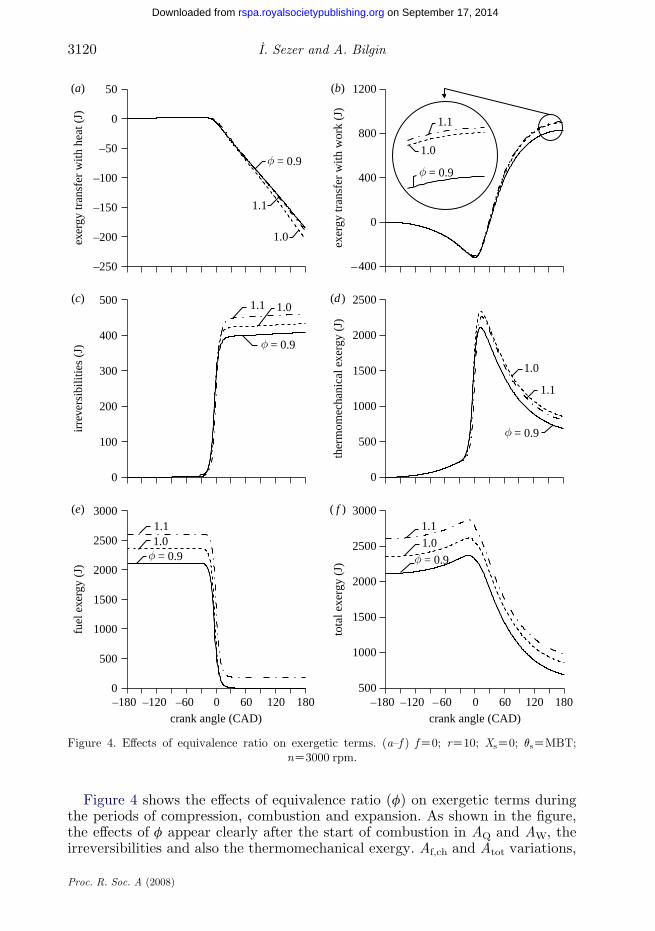
Figure 4. Effects of equivalence ratio on exergetic terms. (a–f ) fZ0; rZ10; XsZ0; qsZMBT;nZ3000 rpm.
I. Sezer and A. Bilgin3120
on September 17, 2014rspa.royalsocietypublishing.orgDownloaded from
Figure 4 shows the effects of equivalence ratio (f) on exergetic terms duringthe periods of compression, combustion and expansion. As shown in the figure,the effects of f appear clearly after the start of combustion in AQ and AW, theirreversibilities and also the thermomechanical exergy. Af,ch and Atot variations,
Proc. R. Soc. A (2008)

Table 3. The values obtained from a parametric study for different conditions.
parameter m f (g) Qf ( J) Af,ch ( J) Tb,max (K) bmep (bar) Dqb (CAD)
f
0.9 4.36!10K2 1957.72 2112.32 2796.91 12.79 701.0 4.86!10K2 2180.55 2352.84 2875.05 13.86 651.1 5.38!10K2 2194.49 2604.59 2877.81 13.98 66
n (rpm)1500 4.86!10K2 2180.82 2353.06 2892.88 13.33 363000 4.86!10K2 2180.55 2352.84 2875.05 13.86 654500 4.87!10K2 2187.43 2359.99 2858.49 13.85 110
SA (CAD)15 4.85!10K2 2179.22 2351.41 2790.36 13.50 7730 4.86!10K2 2180.55 2352.84 2875.05 13.86 6545 4.80!10K2 2155.90 2331.53 2939.42 13.06 67
3121Exergy analysis of SI engine operation
on September 17, 2014rspa.royalsocietypublishing.orgDownloaded from
however, are affected from the beginning of the compression. The values of AQ infigure 4a have the maximum values for a stoichiometric mixture (fZ1.0), whilethey decrease to lower values for both the lean mixture (fZ0.9) and rich mixture(fZ1.1). This can be attributed to the temperature values given in table 3; thestoichiometric and rich mixtures give higher combustion temperatures incomparison with the lean mixture due to more fuel (m f) and fuel energy (Qf).The values of AQ for rich and lean mixtures are less than the value for astoichiometric mixture, approximately 6.9 and 9.2 per cent, respectively.However, the AW values in figure 4b increase with increasing equivalence ratio;thus the maximum values have been obtained with a rich mixture, but it is alsonoted that the rich mixture gives much closer AW values to those of astoichiometric mixture. These variations can be attributed to the bmep valuesgiven in table 3, which are also a direct result of the fixed maximum brake torquetiming. The values of AW for fZ0.9 and 1.0 are less than the value of fZ1.1,approximately 7.6 and 0.8 per cent, respectively. The irreversibilities in figure 4chave their maximum values for fZ1.1 and decrease to lower values withdecreasing equivalence ratios. The variations in the irreversibilities can beexplained by combustion efficiency. Decreases in the equivalence ratio beyondthat of a stoichiometric mixture result in the leaning of the mixture, andcombustion becomes more efficient due to the abundant oxygen in the fuel–airmixture, which results in a decrease in the combustion irreversibilities.Furthermore, increases in the irreversibilities with increasing equivalence ratiocan be explained by the composition and the amounts of combustion products, ascited by Caton (1999b). He stated that the destroyed value of availability, on aper mass of mixture basis, increased with increasing equivalence ratio. Thevalues of the irreversibilities for fZ0.9 and 1.0 are less than the value of fZ1.1,approximately 6.2 and 5.7 per cent, respectively. There are closer variations infigure 4d between the curves of Atm for fZ1.0 and 1.1, while a lean mixture givesconsiderably lower values, especially during expansion. These variations can beexplained by the fact that the increased fuel exergy contribution for the richmixture by excess fuel cannot be converted to work due to insufficient oxygen,
Proc. R. Soc. A (2008)

–400
–300
–200
–100
0
100(a) (b)
(c) (d )
(e) ( f )
exer
gy tr
ansf
er w
ith h
eat (
J)
–180 –120 –60 0 60 120 180crank angle (CAD)
–180 –120 –60 0 60 120 180crank angle (CAD)
–400
0
400
800
1200
exer
gy tr
ansf
er w
ith w
ork
(J)
0
100
200
300
400
500
irre
vers
ibili
ties
(J)
0
500
1000
1500
2000
2500
ther
mom
echa
nica
l exe
rgy
(J)
0
500
1000
1500
2000
2500
fuel
exe
rgy
(J)
0
500
1000
1500
2000
2500
3000
tota
l exe
rgy
(J)
4500 rpm
3000 rpm
1500 rpm
4500 rpm
3000 rpm
4500 rpm
3000 rpm
1500 rpm
4500 rpm
3000 rpm
1500 rpm
4500 rpm
3000 rpm
1500 rpm4500 rpm
3000 rpm
1500 rpm
1500 rpm
Figure 5. Effects of engine speed on exergetic terms. (a–f ) fZ1.0; fZ0; rZ10; XsZ0; qsZMBT.
I. Sezer and A. Bilgin3122
on September 17, 2014rspa.royalsocietypublishing.orgDownloaded from
which presents incomplete combustion. Furthermore, the reduced cylinderpressures and temperatures come out for the lean mixture due to fuel deficiency.Thus, the stoichiometric mixture gives the maximum Atm values due to the lowerirreversibilities than the rich mixture. Enriching of the fuel–air mixture increasesAf,ch in figure 4e, but, as cited above, excess fuel, more than required, cannot be
Proc. R. Soc. A (2008)

3123Exergy analysis of SI engine operation
on September 17, 2014rspa.royalsocietypublishing.orgDownloaded from
converted efficiently to useful work and the remaining fuel is wasted withexhaust, as seen in the figure. The main contribution to variations in Atot givenin figure 4f is supplied by the fuel exergy during compression, while boththermomechanical and fuel exergies donate to it in the rest of the cycle. Aexh
increases by increasing the equivalence ratio so rich mixtures give the maximumexhausted exergy. The values of Aexh for fZ1.0 and 1.1 are higher than that offZ0.9, approximately 24.5 and 42.7 per cent, respectively.
Figure 5 shows the effects of engine speed (n) on exergetic terms during theexamined part of the cycle. As shown in figure 5a, AQ values decrease withincreasing engine speed. This can be explained by the variation of cycle duration,such that the quantity of heat transferred to the cylinder wall increases as theengine runs slowly due to the enlarging of the cycle duration. The combustiontemperatures in table 3 have also affected the AQ values. The values of AQ for3000 rpm and 4500 rpm are less than the value of 1500 rpm, approximately 42.5and 58.7 per cent, respectively. However, AW in figure 5b has the maximumvalues for 3000 rpm during expansion, while 4500 rpm has the maximum AW
during compression. The variations in AW can be explained by the bmep valuesin table 3; the useful work and AW also increase as the bmep increases. Thevalues of AW for 1500 rpm and 4500 rpm are less than that of 3000 rpm,approximately 3 and 1 per cent, respectively. Irreversibilities in figure 5c alsoreach to the minimum for 3000 rpm. The values of the irreversibilities for1500 rpm and 4500 rpm are greater than the value for 3000 rpm, approximately3.5 and 0.3 per cent, respectively. The results for AW and the irreversibilitiesshow that the engine speed of 3000 rpm is an optimum speed among examinedspeeds. Atm in figure 5d is significantly affected by the variation of engine speed,especially during expansion. The increase in engine speed has not varied the peakvalues of Atm, but it causes an increase in Aexh at the end of expansion. The Af,ch
values in figure 5e do not vary with engine speed for the same amount of fuelsupplied to the cylinder, as shown in table 3. The steep variation takes place inAf,ch during combustion and the slopes of the lines decrease with increasingengine speed due to the variation of combustion duration. The variations in Atot
in figure 5f reveal the combination of thermomechanical and fuel exergies. TheAexh increases by increasing the engine speed due to the enlarging of thecombustion duration. The values of Aexh for 1500 rpm and 4500 rpm are greaterthan the value for 3000 rpm, approximately 35 and 47.3 per cent, respectively.
Figure 6 shows the effects of the spark timing (qs) on exergetic terms duringthe compression, combustion and expansion periods. AQ values in figure 6adecrease to lower values with the retarding of the spark timing, thus theminimum AQ values are obtained by K15 CAD. The advances in the beginningof combustion increase AQ due to the extension of the contact duration of hotgases with the cylinder walls. The combustion temperatures in table 3 are theother factor in the variations in AQ; increasing combustion temperature increasesheat transfer naturally. The values of AQ for K15 and K30 CAD are less thanthat of K45 CAD, approximately 3.2 and 6.96 per cent, respectively. In figure 6b,AW has the maximum values for K30 CAD during expansion, while increasingspark timing causes increases in the compression work. Thus, additionalcompression work is required during compression for the advanced spark timing,but the advanced spark timing cannot contribute to the exergy output as usefulwork during expansion. The values of AW for K15 and K45 CAD are less than
Proc. R. Soc. A (2008)

–30 CAD
–45 CAD
–30 CAD
–30 CAD
–30 CAD
–30 CAD
–45 CAD
–45 CAD
–45 CAD
–30 CAD
–45 CAD
–45 CAD
–250
–200
–150
–100
–50
0
50(a) (b)
(c) (d )
(e) ( f )
exer
gy tr
ansf
er w
ith h
eat (
J)
crank angle (CAD)–180 –120 –60 0 60 120 180 –180 –120 –60 0 60 120 180
crank angle (CAD)
–400
0
400
800
1200
exer
gy tr
ansf
er w
ith w
ork
(J)
0
100
200
300
400
500
irre
vers
ibili
ties
(J)
0
500
1000
1500
2000
2500
3000
ther
mom
echa
nica
l exe
rgy
(J)
0
500
1000
1500
2000
2500
fuel
exe
rgy
(J)
500
0
1000
1500
2000
2500
3000
tota
l exe
rgy
(J)
s = –15 CAD
Figure 6. Effects of spark timing on exergetic terms. (a–f ) fZ1.0; fZ0; rZ10; XsZ0; nZ3000 rpm.
I. Sezer and A. Bilgin3124
on September 17, 2014rspa.royalsocietypublishing.orgDownloaded from
the value for K30 CAD in magnitude, approximately 2.5 and 5.4 per cent,respectively. The irreversibilities in figure 6c also attain the minimum values forK30 CAD. The values of the irreversibilities for both K15 and K45 CAD aregreater by 0.6 per cent than that of K30 CAD. The variations indicate that thespark timing of K30 CAD is an optimal condition in the tested spark timings. Itis also noted that there is no significant effect of varying spark timing on the
Proc. R. Soc. A (2008)

0.90
10
20
30
40
50(a) (b)
(c)
0
10
20
30
40
50
firs
t and
sec
ond
law
effi
cien
cies
(%
)
firs
t and
sec
ond
law
effi
cien
cies
(%
)
1.0equivalance ratio
bsfc
(kg
kW
–1 h
–1)
bsfc
(kg
kW
–1 h
–1)
1.1 1500 3000 4500
15 30spark advance (CAD)
450
30
60
90
120
150
180
210
240
0
30
60
90
120
150
180
210
240
0
30
60
90
120
150
180
210
240
engine speed ( )
Figure 7. Effects of (a) equivalence ratio, (b) engine speed and (c) spark timing on the engineperformance parameters. Right-hatched bars, hI; left-hatched bars, hII; horizontal bars, bsfc.
3125Exergy analysis of SI engine operation
on September 17, 2014rspa.royalsocietypublishing.orgDownloaded from
irreversibilities. Therefore, ignition timing has to be optimized to give the leastAQ and to extract maximum exergy as useful work. When the spark timing isfixed earlier, Atm rises in advance, as shown in figure 6d. Conversely, if ignition isdelayed, Atm diminishes due to the decrease in pressure and temperature, asshown in table 3. There is almost no effect on the fuel exergy in figure 6e, butAf,ch varied during combustion due to variations in the combustion durationshown in table 3. Atot variations in figure 6f reflect the combination of Atm andAf,ch, and Aexh reach the minimum for K30 CAD at the end of the expansion.The values of Aexh for K15 and K45 CAD are greater than the value ofK30 CAD, approximately 4.5 and 4.7 per cent, respectively.
Figure 7 shows the variations of hI, hII and bsfc with equivalence ratio, enginespeed and spark advance, respectively. hI and hII decrease, while bsfc increaseswith increasing equivalence ratio, as shown in figure 7a. These variations aresuitable for the definitions of the efficiencies. The leaning of the fuel–air mixtureresults in increases in hI and hII and decreases in bsfc due to the improvement ofcombustion efficiency. However, the enriching of the charge has negative effectson the efficiencies and bsfc due to the increasing fuel supplied to the cylinder, asshown in table 3. The variations in the efficiencies are as cited by Ferguson(1985). The increments obtained with fZ0.9 and 1.0 are approximately 4.9and 3.6 per cent in hI and 4.6 and 3.4 per cent in hII, respectively, when comparedwith fZ1.1. The increments in the bsfc are approximately 4.7 per cent for
Proc. R. Soc. A (2008)

I. Sezer and A. Bilgin3126
on September 17, 2014rspa.royalsocietypublishing.orgDownloaded from
fZ1.0 and 21.6 per cent for fZ1.1 in comparison with fZ0.9. The variations ofperformance parameter with engine speed are given in figure 7b. hI and hIIhave the maximum values for 3000 rpm and the minimum bsfc obtained at thisengine speed. The decrements for 1500 rpm and 4500 rpm are approximately 1.7and 1.3 per cent in hI and 1.5 and 0.5 per cent in hII, when compared with3000 rpm. The increments in the bsfc are also approximately 1.4 per centfor 1500 rpm and 10.4 per cent for 4500 rpm, in comparison with 3000 rpm. Theeffects of spark timing on the engine performance parameters are shown infigure 7c. hI and hII have the maximum values for K30 CAD, and the minimumbsfc values are obtained at that spark timing. The decrements for K15 andK45 CAD are approximately 1 and 1.9 per cent in hI and 0.9 and 1.7 per cent in hII,respectively, when compared with K30 CAD. The increments in the bsfc are alsoapproximately 5 per cent forK15 CAD and 9 per cent forK45 CAD, in comparisonwithK30 CAD.
5. Conclusions
To evaluate SI engine operation from a second law perspective, a QD cycle modelwas used in this study. The effects of fuel–air equivalence ratio, engine speed andspark timing on the exergy transfers, irreversibilities and efficiencies have beeninvestigated theoretically. The following general conclusions can be drawn.
(i) A parametric exergetic analysis provides a better understanding ofinteractions between operating conditions, energy conversions andtransfer processes, which permits the revelation of the magnitudeof work potential lost during the cycle in a more realistic way than thefirst law analysis, and points to several possible ways for improvingengine performance.
(ii) The effects of equivalence ratio, engine speed and spark timing showdifferent trends in manner and magnitude. Exergy transfer with heat is amaximum for the stoichiometric mixture (fZ1.0), while irreversibilities ona per mass of mixture basis increase as the equivalence ratio increases. Theexergy transfer with exhaust and work also increases by increasingthe equivalence ratio due to increasing fuel exergy in the cylinder.However, the increment in exergy transfer with work for a rich mixture(fZ1.1) is very slight. The peak values of the first and second lawefficiencies were obtained with the lean mixture (fZ0.9) and thisequivalence ratio gives the minimum bsfc.
(iii) Exergy transfer with heat and exhaust increases by increasing the enginespeed. However, exergy transfer with work reaches a maximum at theengine speed of 3000 rpm and irreversibilities reach a minimum at thisengine speed. The maximum first and second law efficiencies and theminimum bsfc were obtained for 3000 rpm.
(iv) Exergy transfer with heat increases as the spark timing increases. However,exergy transfer with work reaches a maximum, while the irreversibilitiesand exhausted exergy have minimum values at an optimum spark timing ofK30 CAD. The best first and second law efficiencies and the minimum bsfcvalue were obtained at that spark timing.
Proc. R. Soc. A (2008)

3127Exergy analysis of SI engine operation
on September 17, 2014rspa.royalsocietypublishing.orgDownloaded from
References
Agarwal, A., Filipi, Z. S., Assanis, D. N. & Baker, D. M. 1998 Assessment of single- and two-zone
turbulence formulations for quasi-dimensional modeling of spark-ignition engine combustion.
Combust. Sci. Technol. 136, 13–39. (doi:10.1080/00102209808924163)
Alasfour, F. N. 1997 Butanol—a single-cylinder engine study: availability analysis. Appl. Therm.
Eng. 17, 537–549. (doi:10.1016/S1359-4311(96)00069-5)
Alkidas, A. C. 1988 The application of availability and energy balances to a diesel engine. Trans.
ASME J. Eng. Gas Turbines Power 110, 462–469.
Bayraktar, H. & Durgun, O. 2003 Mathematical modeling of spark-ignition engine cycles. Energ.
Sources 25, 651–666. (doi:10.1080/00908310303404)
Bilgin, A. 2002 Geometric features of the flame propagation process for an SI engine having
dual-ignition system. Int. J. Energy Res. 26, 987–1000. (doi:10.1002/er.832)
Blizard, N. C. & Keck, J. C. 1974 Experimental and theoretical investigation of turbulent burning
model for internal combustion engines. SAE paper no. 740191, pp. 846–864.
Caton, J. A. 1999a Results from the second-law of thermodynamics for a spark-ignition engine
using a cycle simulation. In Proc. ASME-ICED Fall Technical Conf., 10–16 October, Ann
Arbor, MI, pp. 35–49.
Caton, J. A. 1999b On the destruction of availability (exergy) due to the combustion process-with
specific application to the internal combustion engine. Energy 25, 1097–1117. (doi:10.1016/
S0360-5442(00)00034-7)
Caton, J. A. 2000a A review of investigations using the second law of thermodynamics to study
internal-combustion engines. In SAE World Congress, 6–9 March, Detroit, MI, pp. 1–15.
Caton, J. A. 2000b Operation characteristics of a spark-ignition engine using the second law of
thermodynamics: effects of speed and load. In SAE World Congress, 6–9 March, Detroit, MI,
pp. 1–17.
Caton, J. A. 2001 A multiple-zone cycle simulation for spark-ignition engines: thermodynamic details.
In Proc. ASME-ICED Fall Technical Conf., 23–26 September, Argonne, IL, pp. 1–18.
Caton, J. A. 2002 A cycle simulation including the second law of thermodynamics for a spark-
ignition engine: implications of the use of multiple-zones for combustion. In SAE World
Congress, 4–7 March Detroit, MI, pp. 1–19.
Cengel, Y. A. & Boles, M. A. 1994 Thermodynamics, an engineering approach, 2nd edn. New York,
NY: McGraw-Hill.
Dai, W., Newman, C. E. & Davis, G. C. 1996 Predictions of in-cylinder tumble flow and
combustion in SI engines with a quasi-dimensional model. SAE paper no. 961962, pp. 157–168.
Ferguson, C. R. 1985 Internal combustion engine, applied thermosciences. New York, NY: Wiley.
Flynn, P. F., Hoag, K. L., Kamel, M. M. & Primus, R. J. 1984 A new perspective on diesel engine
evaluation based on second law analysis. SAE paper no. 840032, pp. 198–211.
Gallo, W. L. R. & Milanez, L. F. 1992 Exergetic analysis of ethanol and gasoline fueled engines.
SAE paper no. 920809, pp. 907–915.
Georgios, Z. 2005 Mathematical and numerical modeling of flow and combustion processes in a
spark ignition engine. PhD thesis, Department of Applied Mathematics, University of Crete,
Heraklion, Greece.
Gulder, O. 1984 Correlations of laminar combustion data for alternative S.I. engine fuels. SAE
paper no. 841000, pp. 1–23.
Kanoglu, M., Isik, S. K. & Abusoglu, A. 2005 Performance characteristics of a diesel engine power
plant. Energy Convers. Manage. 46, 1692–1702. (doi:10.1016/j.enconman.2004.10.005)
Keck, J. C. 1982 Turbulent flame structure and speed in spark-ignition engines. In 19th Int. Symp.
Combustion, pp. 1451–1466. Haifa, Israel: The Combustion Institute.
Kopac, M. & Kokturk, L. 2005 Determination of optimum speed of an internal combustion engine
by exergy analysis. Int. J. Exergy 2, 40–54. (doi:10.1504/IJEX.2005.006432)
Kotas, T. J. 1995 The exergy method of thermal plant analysis. Malabar, FL: Krieger Publishing.
Proc. R. Soc. A (2008)

I. Sezer and A. Bilgin3128
on September 17, 2014rspa.royalsocietypublishing.orgDownloaded from
Kumar, S. V., Minkowycz, W. J. & Patel, K. S. 1989 Thermodynamic cycle simulation of the dieselcycle: exergy as a second law analysis parameter. Int. Commun. Heat Mass Transf. 16, 335–346.(doi:10.1016/0735-1933(89)90082-1)
Moran, M. J. & Shapiro, H. N. 2000 Fundamentals of engineering thermodynamic, pp. 265–315,3rd edn. New York, NY: Wiley.
Parlak, A., Yasar, H. & Eldogan, O. 2005 The effect of thermal barrier coating on a turbo-chargeddiesel engine performance and exergy potential of the exhaust gas. Energy Convers. Manage. 46,489–499. (doi:10.1016/j.enconman.2004.03.006)
Rakopoulos, C. D. 1993 Evaluation of a spark ignition engine cycle using first and second lawanalysis techniques. Energy Convers. Manage. 34, 1299–1314. (doi:10.1016/0196-8904(93)90126-U)
Rakopoulos, C. D. & Giakoumis, E. G. 1997 Simulation and exergy analysis of transient diesel-engine operation. Energy 22, 875–885. (doi:10.1016/S0360-5442(97)00017-0)
Rakopoulos, C. D. & Giakoumis, E. G. 2006 Second law analyses applied to internal combustionengines operation. Prog. Energy Combust. Sci. 32, 2–47. (doi:10.1016/j.pecs.2005.10.001)
Rezac, P. & Metghalchi, H. 2004 A brief note on the historical evolution and present state ofexergy analysis. Int. J. Exergy 1, 426–437. (doi:10.1504/IJEX.2004.005787)
Sezer, I. 2008 Application of exergy analysis to spark ignition engine cycle. PhD dissertation,Karadeniz Technical University, Trabzon, Turkey.
Shapiro, H. N. & Van Gerpen, J. H. 1989 Two zone combustion models for second law analysis ofinternal combustion engines. SAE paper no. 890823, pp. 1408–1422.
Tabaczynski, R. J., Ferguson, C. R. & Radhakrishnan, K. 1977 A turbulent entrainment model forspark-ignition combustion. SAE paper no. 770647, pp. 2414–2432.
Tabaczynski, R. J., Trinker, F. H. & Sahnnon, B. A. S. 1980 Further refinement of a turbulentflame propagation model for spark-ignition engines. Combust. Flame 39, 111–121. (doi:10.1016/0010-2180(80)90011-5)
Tallio, K. V. 1998 A multifluid turbulent entrainment combustion model. PhD dissertation, DrexelUniversity, Philadelphia, USA.
Van Gerpen, J. H. & Shapiro, H. N. 1990 Second law analysis of diesel engine combustion. Trans.ASME J. Eng. Gas Turbines Power 112, 129–137. (doi:10.1115/1.2906467)
Velasquez, J. A. & Milanez, L. F. 1994 Analysis of the irreversibilities in diesel engines. SAE paperno. 40673, pp. 1060–1068.
Wengang, D. 1995 Quasi-dimensional modeling of spark ignition engine. PhD dissertation,University of Texas, Austin, USA.
Zhang, S. 2002 The second law analysis of a spark ignition engine fueled with compressed naturalgas. MS dissertation, University of Windsor, Ontario, Canada.
Proc. R. Soc. A (2008)