Probability Distribution Analysis of Rainfall Data for Western … · 2017-07-22 · cumulative six...
5
International Journal of Science and Research (IJSR) ISSN (Online): 2319-7064 Index Copernicus Value (2013): 6.14 | Impact Factor (2013): 4.438 Volume 4 Issue 5, May 2015 www.ijsr.net Licensed Under Creative Commons Attribution CC BY Probability Distribution Analysis of Rainfall Data for Western Maharashtra Region Swami Shivprasad T. 1 , Anandrao Deshmukh 2 , Ganesh Patil 3 , Sagar Kahar 4 1 Department Civil Engineering, Rajarshi Shahu College of Engineering, Tathawade, Pune, India 2 Assit.Professor, Department Civil Engineering, Rajarshi Shahu College of Engineering, Tathawade, Pune, India 3 Department Civil Engineering, Rajarshi Shahu College of Engineering, Tathawade, Pune, India 4 Department Civil Engineering, Rajarshi Shahu College of Engineering, Tathawade, Pune, India Abstract: In India rainfall is the major source for the most sought after commodity of water all over the world. India experiences a monsoon season of 4 months making it more precious. Every attempt is therefore made to study and analyse rainfall data in order to understand its distribution, quantity and frequency. The present work is such an attempt where in various probability distributions are be applied to estimate one month and two to seven consecutive cumulative monthly rainfall. As many as 16 different types of continuous probability distributions were tested using goodness of fit tests such as Kolmogorov Smirnov, Anderson Darling and Chi- Square for Western Maharashtra’s districts , India to check which distribution is best. The following analysis of rainfall data is prepared with the help of EASY FIT and MICROSOFT EXCEL software’s. Monthly rainfall data for 35 years (1966-2000) measured by Indian Meteorological Department, Pune was used. It was found that, in Ahmednagar and Solapur district Beta distribution is the best fitted distribution for one month rainfall dataset, Dagum distributions for consecutive cumulative two months rainfall dataset, Dagum and Gen.Extreme distribution for consecutive cumulative three months rainfall dataset, Log Logistic and Gen.Extreme distribution for consecutive cumulative four and five months rainfall dataset, Log Logistic and Nakagami distributions for consecutive cumulative six months rainfall dataset and Log Logistic and Johnson SU distribution for consecutive cumulative seven months rainfall, as per above the best fitted distributions for other districts of western Maharashtra are as follows Keywords: Rainfall, Probability distribution, goodness-of-fit tests 1. Introduction Analysis of rainfall data strongly depends on its distribution pattern. It has long been a topic of interest in the fields of meteorology in establishing a probability distribution that provides a good fit to monthly rainfall. Several studies have been conducted in India and abroad on rainfall analysis and best fit probability distribution functions. Various probability distributions and transformations can be applied to estimate one day and two to five consecutive days annual maximum rainfall of various return periods. Patel and Shete (2008) predicted consecutive days maximum rainfall by probabilistic approach for Sabarkantha district of Gujarat. Patel and Shete (2007) also predicted consecutive days rainfall from one day rainfall using regression models for the same district. Three commonly used probability distributions (viz: Normal, Log Normal and Gamma distributions) were tested comparing the Chi-square value by Bhakar et al. (2006). Gamma distribution was found to be the best fit for Banswara, Rajasthan. Kuller et al. (1999) carried out the goodness of fit of three frequency model distribution models viz. Lognormal 3-parameters, Lognormal 2 parameters and Extreme Value Type 1 and concluded that Lognormal 3- parameters distribution model was the best distribution model for all the three duration of rainfall (viz. Maximum 1- day, maximum 2-day and maximum 3-day) for Punjab. Although hydrological variables are of continuous type, they are discretized and used as a discrete series. It is generally assumed that a hydrological variable has a certain distribution type. Probability distribution arises from the experiments where the outcome is subject to chance. The nature of the experiment dictates which probability distribution may be appropriate for modelling the resulting outcomes. There are two types of probability distribution – continuous and discrete. Using a probability model does not allow one to predict the result of any individual experiment but one can determine the probability that a given outcome Paper ID: SUB154411 1375
Transcript of Probability Distribution Analysis of Rainfall Data for Western … · 2017-07-22 · cumulative six...
International Journal of Science and Research (IJSR) ISSN (Online): 2319-7064
Index Copernicus Value (2013): 6.14 | Impact Factor (2013): 4.438
Volume 4 Issue 5, May 2015
www.ijsr.net Licensed Under Creative Commons Attribution CC BY
Probability Distribution Analysis of Rainfall Data
for Western Maharashtra Region
Swami Shivprasad T.1, Anandrao Deshmukh
2, Ganesh Patil
3, Sagar Kahar
4
1Department Civil Engineering, Rajarshi Shahu College of Engineering, Tathawade, Pune, India
2Assit.Professor, Department Civil Engineering, Rajarshi Shahu College of Engineering, Tathawade, Pune, India
3Department Civil Engineering, Rajarshi Shahu College of Engineering, Tathawade, Pune, India
4Department Civil Engineering, Rajarshi Shahu College of Engineering, Tathawade, Pune, India
Abstract: In India rainfall is the major source for the most sought after commodity of water all over the world. India experiences a
monsoon season of 4 months making it more precious. Every attempt is therefore made to study and analyse rainfall data in order to
understand its distribution, quantity and frequency. The present work is such an attempt where in various probability distributions are
be applied to estimate one month and two to seven consecutive cumulative monthly rainfall. As many as 16 different types of
continuous probability distributions were tested using goodness of fit tests such as Kolmogorov Smirnov, Anderson Darling and Chi-
Square for Western Maharashtra’s districts , India to check which distribution is best. The following analysis of rainfall data is
prepared with the help of EASY FIT and MICROSOFT EXCEL software’s. Monthly rainfall data for 35 years (1966-2000) measured
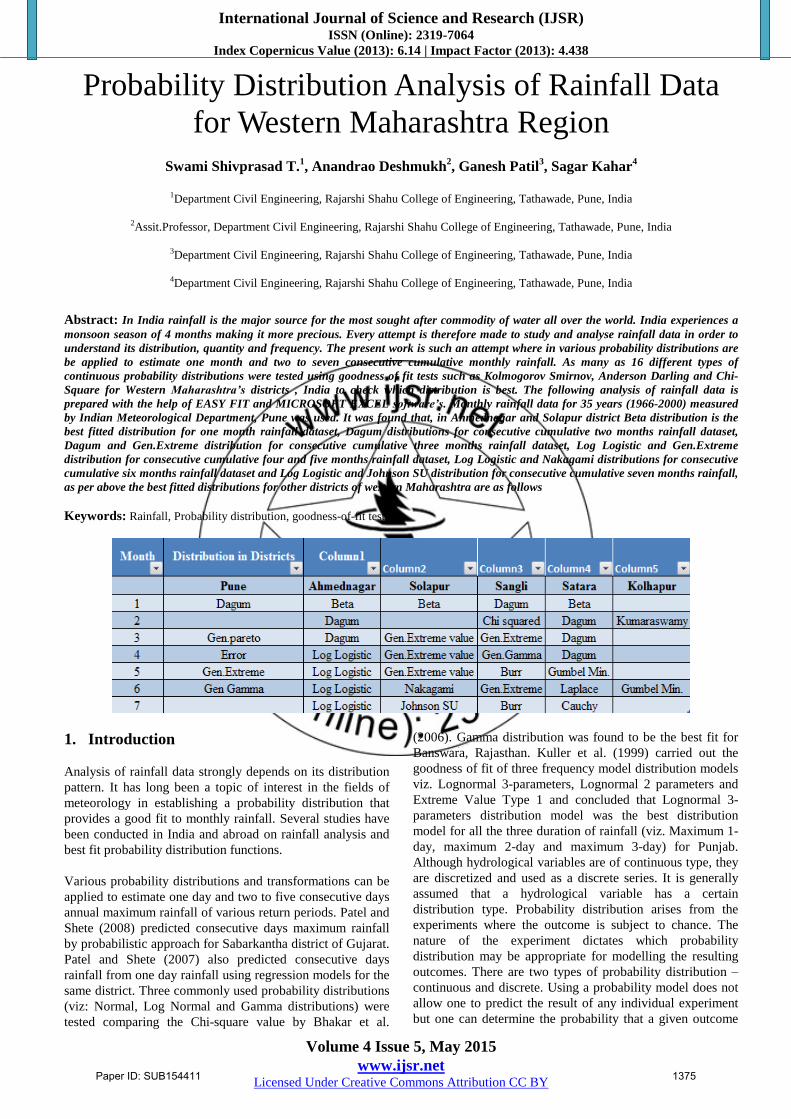
by Indian Meteorological Department, Pune was used. It was found that, in Ahmednagar and Solapur district Beta distribution is the
best fitted distribution for one month rainfall dataset, Dagum distributions for consecutive cumulative two months rainfall dataset,
Dagum and Gen.Extreme distribution for consecutive cumulative three months rainfall dataset, Log Logistic and Gen.Extreme
distribution for consecutive cumulative four and five months rainfall dataset, Log Logistic and Nakagami distributions for consecutive
cumulative six months rainfall dataset and Log Logistic and Johnson SU distribution for consecutive cumulative seven months rainfall,
as per above the best fitted distributions for other districts of western Maharashtra are as follows
Keywords: Rainfall, Probability distribution, goodness-of-fit tests
1. Introduction
Analysis of rainfall data strongly depends on its distribution
pattern. It has long been a topic of interest in the fields of
meteorology in establishing a probability distribution that
provides a good fit to monthly rainfall. Several studies have
been conducted in India and abroad on rainfall analysis and
best fit probability distribution functions.
Various probability distributions and transformations can be
applied to estimate one day and two to five consecutive days
annual maximum rainfall of various return periods. Patel and
Shete (2008) predicted consecutive days maximum rainfall
by probabilistic approach for Sabarkantha district of Gujarat.
Patel and Shete (2007) also predicted consecutive days
rainfall from one day rainfall using regression models for the
same district. Three commonly used probability distributions
(viz: Normal, Log Normal and Gamma distributions) were
tested comparing the Chi-square value by Bhakar et al.
(2006). Gamma distribution was found to be the best fit for
Banswara, Rajasthan. Kuller et al. (1999) carried out the
goodness of fit of three frequency model distribution models
viz. Lognormal 3-parameters, Lognormal 2 parameters and
Extreme Value Type 1 and concluded that Lognormal 3-
parameters distribution model was the best distribution
model for all the three duration of rainfall (viz. Maximum 1-
day, maximum 2-day and maximum 3-day) for Punjab.
Although hydrological variables are of continuous type, they
are discretized and used as a discrete series. It is generally
assumed that a hydrological variable has a certain
distribution type. Probability distribution arises from the
experiments where the outcome is subject to chance. The
nature of the experiment dictates which probability
distribution may be appropriate for modelling the resulting
outcomes. There are two types of probability distribution –
continuous and discrete. Using a probability model does not
allow one to predict the result of any individual experiment
but one can determine the probability that a given outcome
Paper ID: SUB154411 1375
International Journal of Science and Research (IJSR) ISSN (Online): 2319-7064
Index Copernicus Value (2013): 6.14 | Impact Factor (2013): 4.438
Volume 4 Issue 5, May 2015
www.ijsr.net Licensed Under Creative Commons Attribution CC BY
will fall inside a specific range of values. The data for
present analysis is continuous type. Therefore, sixteen
continuous probability distributions are checked for the
rainfall dataset (1966-2000) in districts of Western
Maharashtra.
The present paper is an effort to determine the best fittest
probability distribution for the given rainfall dataset in order
to determine the rainfall characteristic of that region. To
assist the above mentioned objective, Kolmogorov Smirnov,
Anderson Darling, Chi-Square tests are used to measure the
goodness of fit of an estimated statistical distribution
function.
2. Study Area
Satara
The study area comprises of Satara and Kolhapur districts of
Western Maharashtra, India. Satara is one of the districts of
western part of the state of Maharashtra. It is situated
between 17° 05’ and 18° 11’ N latitudes and 73 ° 33’ and
74° 54’ E longitude. The total area of the district is 10,480
sq. km. Satara district. The average annual rainfall is 1282.5
mm considering the rainfall dataset from 1901-2000.
Kolhapur
Kolhapur is also one of the districts of western part of the
state of Maharashtra. It is situated in the western part of the
state and lies between 15° 43’ and 17° 10’ N latitudes and 73
° 40’ and 74° 42’ E longitude. The total area of the district is
7,685 sq. km. The average annual rainfall is 1658.3 mm
considering the rainfall dataset from 1901-2000.
Sangli: It is located in western Maharashtra. Its latitude
and longitude for sagli 16.86®N,74.57®E Total
area=8578km²
Solapur: Solapur is located in 17.10 to 18.32°N latitude,
the district is situated on the south east fringe of Maharashtra
state and lies entirely in the Bhima Seena basin. The
geographical area for solapur is 14895Km².the city receives
an annual rainfall 545mm per year.
Pune:Most of the 722 mm of annual rainfall of city falls
between june and September and July is the wettest month of
the year. The total geographical area of pune district is
15642Km²
Ahmednagar:The average annual rainfall for a.nagar if
578.8 mm.The total geographical area for ahmednagar
district is 17048Km²
3. Distributions
A. Beta distribution
The PDF and CDF of Beta distribution with continuous
shape parameters α1 and α2 (α1, α2 > 0) is given by,
F(x) =
where, z= B is the beta function, Iz is the regularized
incomplete beta function and a ≤ x ≤ b.
B. Cauchy distribution
The PDF and CDF of Cauchy distribution with continuous
scale parameter σ (σ > 0) and continuous location parameter
μ is given by,
f(x)= {πσ[1+( ² ]}¯¹
F x = arctan( ) +0.5
Where, -∞ < x < +∞.
C. Dagum distribution
The PDF and CDF of Dagum distribution (three parameter)
with continuous shape parameter k (k > 0), continuous shape
parameter α (α > 0) and continuous scale parameter β (β > 0)
is given by,
f(x)=
F(x)={1+
where, γ ≤ x < +∞
D. Gumbel Min. distribution
The PDF and CDF of Gumbel Min. distribution with
continuous scale parameter σ (σ > 0) and continuous location
parameter μ is given by,
f(x)= exp{z−exp (z) }
F x =1−exp{−exp (z) }
where, z= and -∞ < x < +∞.
E. Kumaraswamy distribution
The PDF and CDF of Kumaraswamy distribution with
continuous shape parameters α1 and α2 (α1, α2 > 0) is given
by,
f(x)=
F x =1−
where, z= and a ≤ x ≤ b.
F. Laplace distribution
The PDF and CDF of Laplace distribution with continuous
inverse scale parameter λ (λ > 0) and continuous location
parameter μ is given by,
f(x)= exp(−λ|x−μ| )
f(x)= { exp{−λ(μ−x)}, 𝑥<𝜇
f(x) = {1− exp{−λ (x−μ) }, 𝑥>𝜇
where, -∞ < x < +∞.
Three goodness-of-fit tests were conducted at 5% level of
significance. Note that X denotes the random variable and; n,
the sample size. The tests are as follows:
1) Anderson-Darling test:
The Anderson-Darling statistic (A2) is defined as
A²=−n−
The Anderson-Darling procedure is a general test to compare
the fit of an observed cumulative distribution function to an
expected cumulative distribution function. This test gives
more weight to the tails than the Kolmogorov-Smirnov test.
Paper ID: SUB154411 1376
International Journal of Science and Research (IJSR) ISSN (Online): 2319-7064
Index Copernicus Value (2013): 6.14 | Impact Factor (2013): 4.438
Volume 4 Issue 5, May 2015
www.ijsr.net Licensed Under Creative Commons Attribution CC BY
2) Kolmogorov-Smirnov Test
The Kolmogorov-Smirnov statistic (D) is based on the
largest vertical difference between the theoretical and the
empirical cumulative distribution function, D=max1≤i≤n (F(xi)
− )
3) Chi-Square test:
The Chi-Squared statistic is defined as,
χ²=
where; Oi is the observed frequency Ei is the expected
frequency which is calculated by,
Ei=F (x₂) −F (x₁) where, F is CDF of probability distribution being tested and
x1, x2 are the limits.
Although there is no optimal choice for the number k, there
are several formulae which can be used to calculate this
number based on the sample size N.
k=1+log₂N
This test is for continuous sample data only and is used to
determine if a sample comes from a population with a
specific distribution. The three goodness of fit test
mentioned above were fitted to the consecutive cumulative
monthly rainfall data treating different data set. The test
statistic of each test were computed and tested at (α=0.05)
level of significance. Accordingly the ranking of different
probability distributions were marked from 1 to 16 based on
minimum test statistic value. The distribution holding the
first rank was selected for all the three tests independently.
The common highest rank of the entire three tests were
summarized to identify the best fit distribution obtained.
4. Methodology
For the present study, monthly rainfall data from Satara and
Kolhapur districts for 35 years (1966-2000) was obtained
from the Indian Meteorological Department, Pune. The
monthly rainfall is the sum of daily rainfall considering all
the days in a month. If rainfall data of even a single day in
the month is missing, the monthly rainfall data of that whole
month is not considered and is left blank. The monthly
rainfall data is in mm. The monthly rainfall and cumulative
monthly rainfall is used for analysis of probability
distribution. 16 different probability distributions presented
in Table I are applied to the dataset of one, consecutive
cumulative 2, 3, 4, 5, 6 and 7 months rainfall. The goodness
of fit using Kolmogorov Smirnov, Anderson Darling and
Chi-Square are tested.
The formulae for distributions and goodness of fit tests are
taken from the manual of Easy Fit 5.5. It is a data analysis
and simulation application allowing to fit probability
distributions to sample data, select the best model, and apply
the analysis results to make better decisions. It can be used
as a stand-alone Windows application or with Microsoft
Excel and other third party Excel-based simulation tools,
leaving the complex technical details behind the scenes and
enabling you to focus on your business goals. EasyFit 5.5
combines the classical statistical analysis methods and
innovative data analysis techniques, making it a tool of
choice for anyone dealing with probability data. [6]
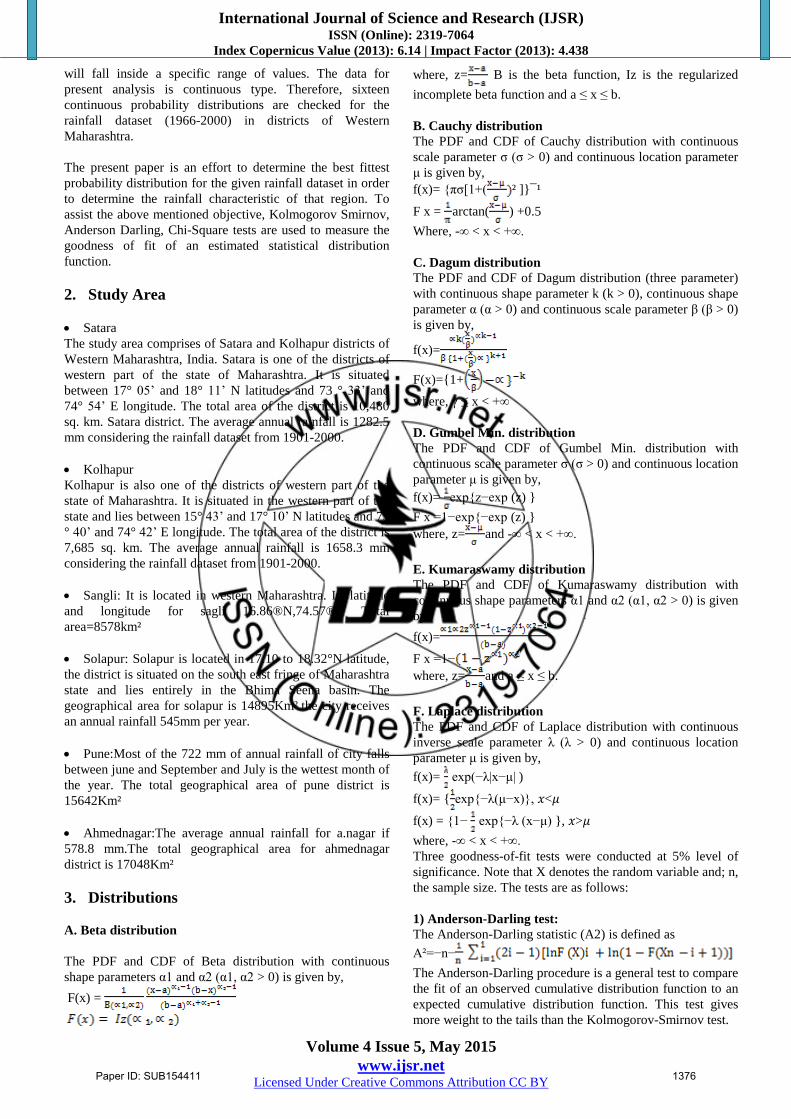
The probability density functions (PDF) and cumulative
distribution functions (CDF) for the six distributions which
are drawn from the results and analysis out of sixteen
distributions are given as follows. The remaining
distributions can be checked from the same manual. Note
that x is the random variable representing the monthly
rainfall intensity.
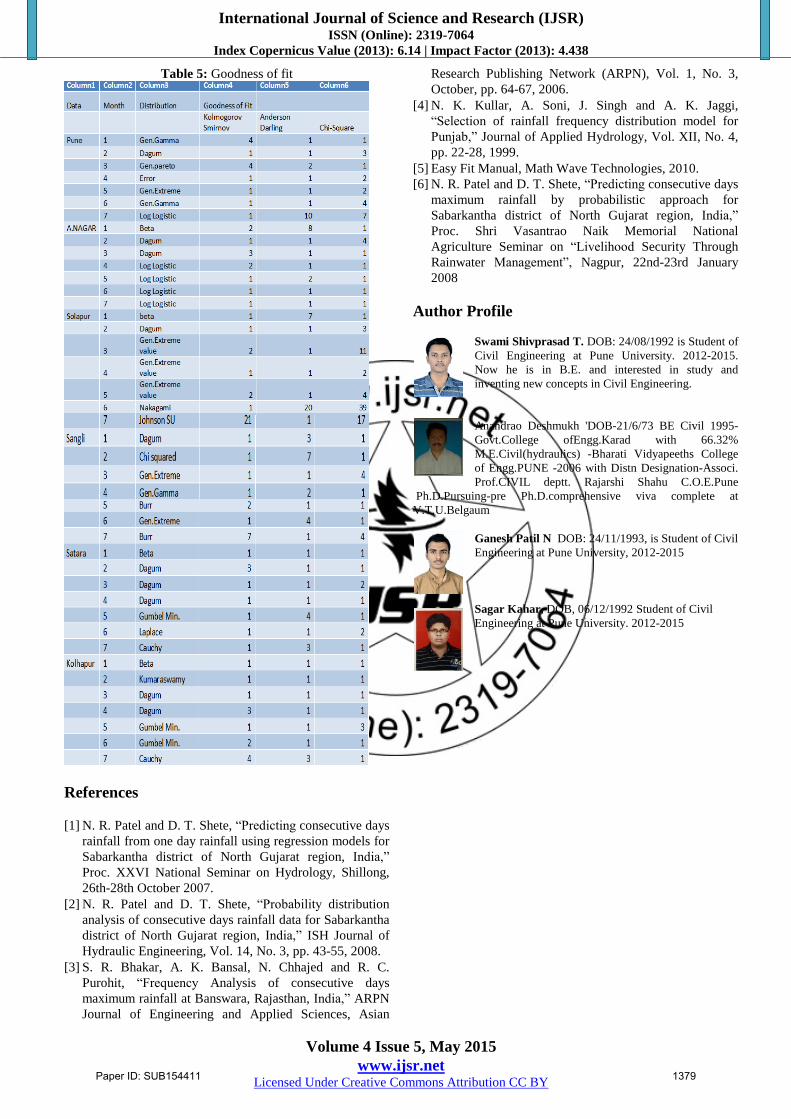
5. Result and Statistics
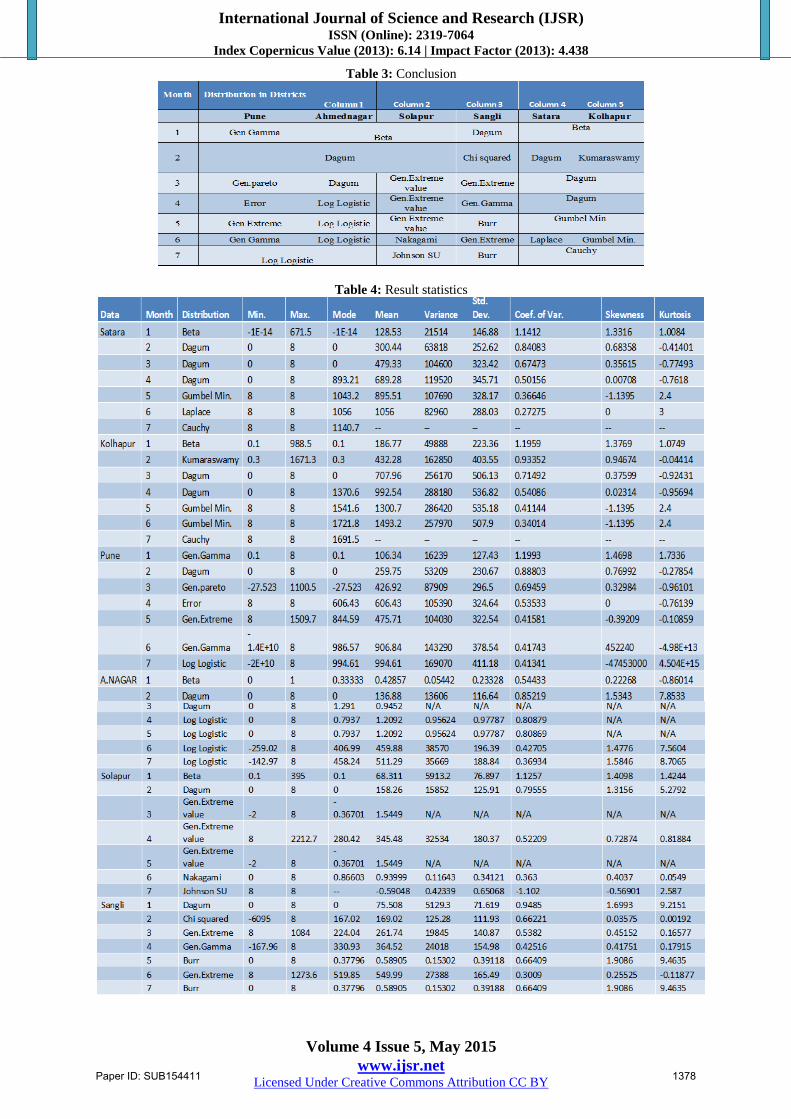
The summary of statistics mean, mode, variance, standard
deviation, skewness coefficient and coefficient of variation
values of consecutive cumulative monthly rainfall is
presented in Table 2. Using the rainfall data of cumulative 1
and cumulative consecutive 2, 3, 4, 5, 6 and 7 months, the
probability distribution with their ranking based on
Kolmogorov Smirnov, Anderson Darling and Chi-Square
tests are given in Table 3.
6. Conclusion
The Kolmogorov Smirnov, Anderson Darling, Chi-Square
tests give the optimum probability function for the given
dataset. It is concluded that Beta distribution is best for
cumulative 1 month rainfall for Satara and Kolhapur
districts; Dagum distribution is best for cummulative
consecutive 2 months rainfall for Satara district and
Kumaraswamy distribution is best for cumulative
consecutive 2 months rainfall for Kolhapur district; Dagum
distribution is best for cumulative consecutive 3 and 4
months rainfall for Satara and Kolhapur districts; Gumbel
Min. distribution is best for cumulative consecutive 5 months
rainfall for Satara and Kolhapur districts; Laplace
distribution is best for cumulative consecutive 6 months
rainfall for Satara district and Gumbel Min. distribution is
best for cummulative consecutive 6 months rainfall for
Kolhapur district and Cauchy distribution is best for
cummulative consecutive 7 months rainfall for Satara and
Kolhapur districts. for other western Maharashtra district’s
are tabulated below.
Paper ID: SUB154411 1377
International Journal of Science and Research (IJSR) ISSN (Online): 2319-7064
Index Copernicus Value (2013): 6.14 | Impact Factor (2013): 4.438
Volume 4 Issue 5, May 2015
www.ijsr.net Licensed Under Creative Commons Attribution CC BY
Table 3: Conclusion
Table 4: Result statistics
Paper ID: SUB154411 1378
International Journal of Science and Research (IJSR) ISSN (Online): 2319-7064
Index Copernicus Value (2013): 6.14 | Impact Factor (2013): 4.438
Volume 4 Issue 5, May 2015
www.ijsr.net Licensed Under Creative Commons Attribution CC BY
Table 5: Goodness of fit
References
[1] N. R. Patel and D. T. Shete, “Predicting consecutive days
rainfall from one day rainfall using regression models for
Sabarkantha district of North Gujarat region, India,”
Proc. XXVI National Seminar on Hydrology, Shillong,
26th-28th October 2007.
[2] N. R. Patel and D. T. Shete, “Probability distribution
analysis of consecutive days rainfall data for Sabarkantha
district of North Gujarat region, India,” ISH Journal of
Hydraulic Engineering, Vol. 14, No. 3, pp. 43-55, 2008.
[3] S. R. Bhakar, A. K. Bansal, N. Chhajed and R. C.
Purohit, “Frequency Analysis of consecutive days
maximum rainfall at Banswara, Rajasthan, India,” ARPN
Journal of Engineering and Applied Sciences, Asian
Research Publishing Network (ARPN), Vol. 1, No. 3,
October, pp. 64-67, 2006.
[4] N. K. Kullar, A. Soni, J. Singh and A. K. Jaggi,
“Selection of rainfall frequency distribution model for
Punjab,” Journal of Applied Hydrology, Vol. XII, No. 4,
pp. 22-28, 1999.
[5] Easy Fit Manual, Math Wave Technologies, 2010.
[6] N. R. Patel and D. T. Shete, “Predicting consecutive days
maximum rainfall by probabilistic approach for
Sabarkantha district of North Gujarat region, India,”
Proc. Shri Vasantrao Naik Memorial National
Agriculture Seminar on “Livelihood Security Through
Rainwater Management”, Nagpur, 22nd-23rd January
2008
Author Profile
Swami Shivprasad T. DOB: 24/08/1992 is Student of
Civil Engineering at Pune University. 2012-2015.
Now he is in B.E. and interested in study and
inventing new concepts in Civil Engineering.
Anandrao Deshmukh 'DOB-21/6/73 BE Civil 1995-
Govt.College ofEngg.Karad with 66.32%
M.E.Civil(hydraulics) -Bharati Vidyapeeths College
of Engg.PUNE -2006 with Distn Designation-Associ.
Prof.CIVIL deptt. Rajarshi Shahu C.O.E.Pune
Ph.D.Pursuing-pre Ph.D.comprehensive viva complete at
V.T.U.Belgaum
Ganesh Patil N DOB: 24/11/1993, is Student of Civil
Engineering at Pune University, 2012-2015
Sagar Kahar, DOB, 06/12/1992 Student of Civil
Engineering at Pune University. 2012-2015
Paper ID: SUB154411 1379