Changes in rainfall distribution patterns over Liguria Region
1
“ Changes in rainfall distribution patterns over Liguria Region” Luca Onorato 1 , Antonio Iengo 1 , Francesco Durante 1 , Luca Rusca 1 , Claudio Monteverde 2 1 Regional Agency for Environmental Protection - Weather, Hydrological and Climate Centre 2 Raffaelli Geological and Agro-Meteorological Observatory Introduction Liguria region is characterized by non-uniform climatic conditions due to a morphologically very complex territory. The region, with its characteristic arched shape open to the south and the mountain ridge behind it, presents a rather complex rain regime. The amount of precipitation increases proceeding from the coast towards the inland of the region and from west to east. In fact, along the western part (from Imperia to west part of Savona coasts), the annual cumulative amount may be less than 800 mm due to the fact that these areas are downwind of the southwestern and southern moist winds. On the other hand in the Eastern part (from Genoa to La Spezia), the annual cumulative amount can exceed 1500 mm. FIGURE 1. Cumulative precipitation [mm]. Annual mean total precipitation 1961-2010 (reference period) and OMIRL rain gauge stations: 1 – Imperia (IM), 2 - Genoa Ponte Carrega (GE) and 3 -Tavarone (SP). FIGURE 3 Winter (DJF) mean precipitation anomaly for the 1981-2010 period compared to 1961-1990 FIGURE 2 Autumn (SON) mean precipitation anomaly for the 1981-2010 period compared to 1961-1990 FIGURE 4 Autumn (SON) number of rain days anomaly for the 1981-2010 period compared to 1961-1990 References: [1] “Climate change projections for the Mediterranean region”. Giorgi F, Lionello P, 2007 [2] “Atlante climatico della Liguria”. Bonati V, Agrillo G 2013 [3] “Gli indicatori del clima in Italia nel 2019”, ISPRA - 94/2020 [4] “Non-parametric tests against trend”, Mann, H.B. 1945 Econometrica 13:163-171. [5] “Rank Correlation Methods”, Kendall, M.G. 1975. 4th edition, M.G. 1975. Charles Griffin, London. [6] “Cambiamenti Climatici”, Cicogna A., Gani M., Micheletti S. 2012, pp 28-53 in Rapporto sullo stato dell’ambiente in Friuli Venezia Giulia 2012, ARPA-FVG FIGURE 5 Winter (DJF) number of rain days anomaly for the 1981-2010 period compred to 1961-1990 Observations The figures from 2 to 5 are based on our previous work (“Atlante climatico della Liguria”, 2013) where some regional anomalies were highlighted, concerning mean rainfall and number of rain days, in two different season (autumn and winter). In particular we analyzed a long period (1961-2010) to show trend difference in rainfall distribution patterns over the region, comparing the historical time series 1961-1990 with 1981-2010. The data was derived from the Ligurian rain gauge network (OMIRL). This is the official network managed by the Civil Protection Agency of Liguria Region and provides rain gauge measurements with a timestep of 5 min, an average density of 1 rain gauge/40 km 2 and a total number of about 150 instruments. Figure 2 and 4 (September, October, November) shows positive anomalies during the last time series (1981-2010) both for mean rainfall and rain days, compared with 1961-1990 period. Negative anomalies are shown by figure 3 e 5 (December, January, February), especially on the eastern part of the region (there are also significant affinity with spring and summer season, which are not shown in this work). Based on the preliminary results, it was decided, for this work, to represent all the years into two periods: the last 4 months (characterized by a maximum seasonal rainfall) because a similar rainfall tendency, and remaining 8 months (all the other seasons characterized by a generally rainfall negative anomaly). STATION AND PERIOD RAIN DAYS THRESHOLD TREND CONFIDENC E IMPER 4 months (>1mm) no trend 0.30 IMPER 8 months (>1mm) decreasing 0.98 GEPCA 4 months (>1mm) no trend 0.84 GEPCA 8 months (>1mm) no trend 0.61 TAVRN 4 months (>1mm) increasing 0.98 TAVRN 8 months (>1mm) no trend 0.12 STATION AND PERIOD RAIN DAYS THRESHOLD TREND CONFIDENCE IMPER 4 months (>30mm) no trend 0.95 IMPER 8 months (>30mm) decreasing 0.96 GEPCA 4 months (>30mm) no trend 0.92 GEPCA 8 months (>30mm) no trend 0.81 TAVRN 4 months (>30mm) no trend 0.88 TAVRN 8 months (>30mm) no trend 0.08 Analysis The non-parametric time series trend test proposed by Mann-Kendall (MANN, 1945; KENDALL, 1975) was used to detect possible trends in the series for a sixty year rainfall period (1961-2019) for different rain-gauge stations. This is a non-parametric method because it makes no distinction as to the form of the distribution/population that the data comes from. The statistical analysis of whole reference time series data highlight that (1) on some stations a decreasing trend occurs for rain fallen during the 8 months-periods (Table 1- 2-4). (2) The aggregated annual rainfall did not show significant variations (Table 3). (3) The quantities (Figure 9-10) and number of rain days (not shown here) in the first 8 months of the year are lower in the 1991-2019 period, compared to the 1961-1990 period. The trend is characterized by a decrease which is also highlighted in the Mann-Kendall test, (4) in the last 4 months of the year, a different rainfall trend seems to be evident in some stations (but with a confidence level 90 < X < 95, in red). The Mann-Kendal test did not show uniform trends on all stations (probably due to the annual and seasonal rainfall variability). Conclusions The analysis suggests the overall annual rainfall amount has not significantly changed over the considered period. Conversely, there are some indications that a redistribution in rainfall intensity and frequency for the different seasons (divided into 4 and 8 months) has occurred. Rain seems to be increasingly concentrated during autumnal season and progressively decreasing during the remaining part of the year. STATION AND PERIOD RAINFALL TREND CONFIDENC E IMPER 12 months aggregate no trend 0.72 GEPCA 12 months aggregate no trend 0.19 TAVRN 12 months aggregate no trend 0.78 FIGURE 6 Annual (4 months orange bins, 8 months blue bins) cumulative rainfall trend (1961-2019) for the Imperia station. The red dashed line represents the 4 months (September-December) cumulative rainfall trend for the reference period, the blue dashed line the 8 months (Jenuary-August) cumulative rainfall trend and the grey dashed line the 12 months cumulative rainfall trend. FIGURE 7 Annual (4 months orange bins, 8 months blue bins) cumulative rainfall trend (1961-2019) for the Genoa Ponte Carega station. FIGURE 8 Annual (4 months orange bins, 8 months blue bins) cumulative rainfall trend (1961-2019) for the Tavarone station. FIGURE 9 Left histogram represents the total cumulative rainfall during 1961- 1990 period for the Imperia station divided by 8 and 4 months rainfall. On the right the same rappresentation for 1991-2019 period. FIGURE 10 Left histogram represents the total cumulative rainfall during 1961- 1990 period for the Genoa Ponte Carega station divided by 8 and 4 months rainfall. On the right the same rappresentation for 1991-2019 period. FIGURE 11 Left histogram represents the total cumulative rainfall during 1961- 1990 period for the Tavarone station divided by 8 and 4 months rainfall. On the right the same rappresentation for 1991-2019 period. STATION AND PERIOD RAINFALL TREND CONFIDENCE IMPER 4 months aggregate no trend 0.79 IMPER 8 months aggregate decreasing 0.98 GEPCA 4 months aggregate no trend 0.69 GEPCA 8 months aggregate decreasing 0.98 TAVRN 4 months aggregate no trend 0.94 TAVRN 8 months aggregate no trend 0.12 TABLE 1 TABLE 2 TABLE 3 TABLE 4 Rain gauge stations 1 2 3 OMIRL - RAIN GAUGE STATIONS 1 -Imperia Osservatorio Meteosismico (IM) 71 s.l.m. - Longitudine 8° 0' 59,472'' Latitudine 43° 52' 46,452'' 2 - Genoa Ponte Carrega (GE) 30 s.l.m. - Longitudine 8° 57' 39,924‘’ Latitudine 44° 26' 03,804'' 3 - Tavarone (SP) 693 s.l.m. - Longitudine 9° 32' 54,924'' Latitudine 44° 18' 45,864'' 1 2 3
Transcript of Changes in rainfall distribution patterns over Liguria Region
“
Changes in rainfall distribution patterns over Liguria Region”Luca Onorato1, Antonio Iengo1, Francesco Durante1, Luca Rusca1, Claudio Monteverde2
1Regional Agency for Environmental Protection - Weather, Hydrological and Climate Centre2Raffaelli Geological and Agro-Meteorological Observatory
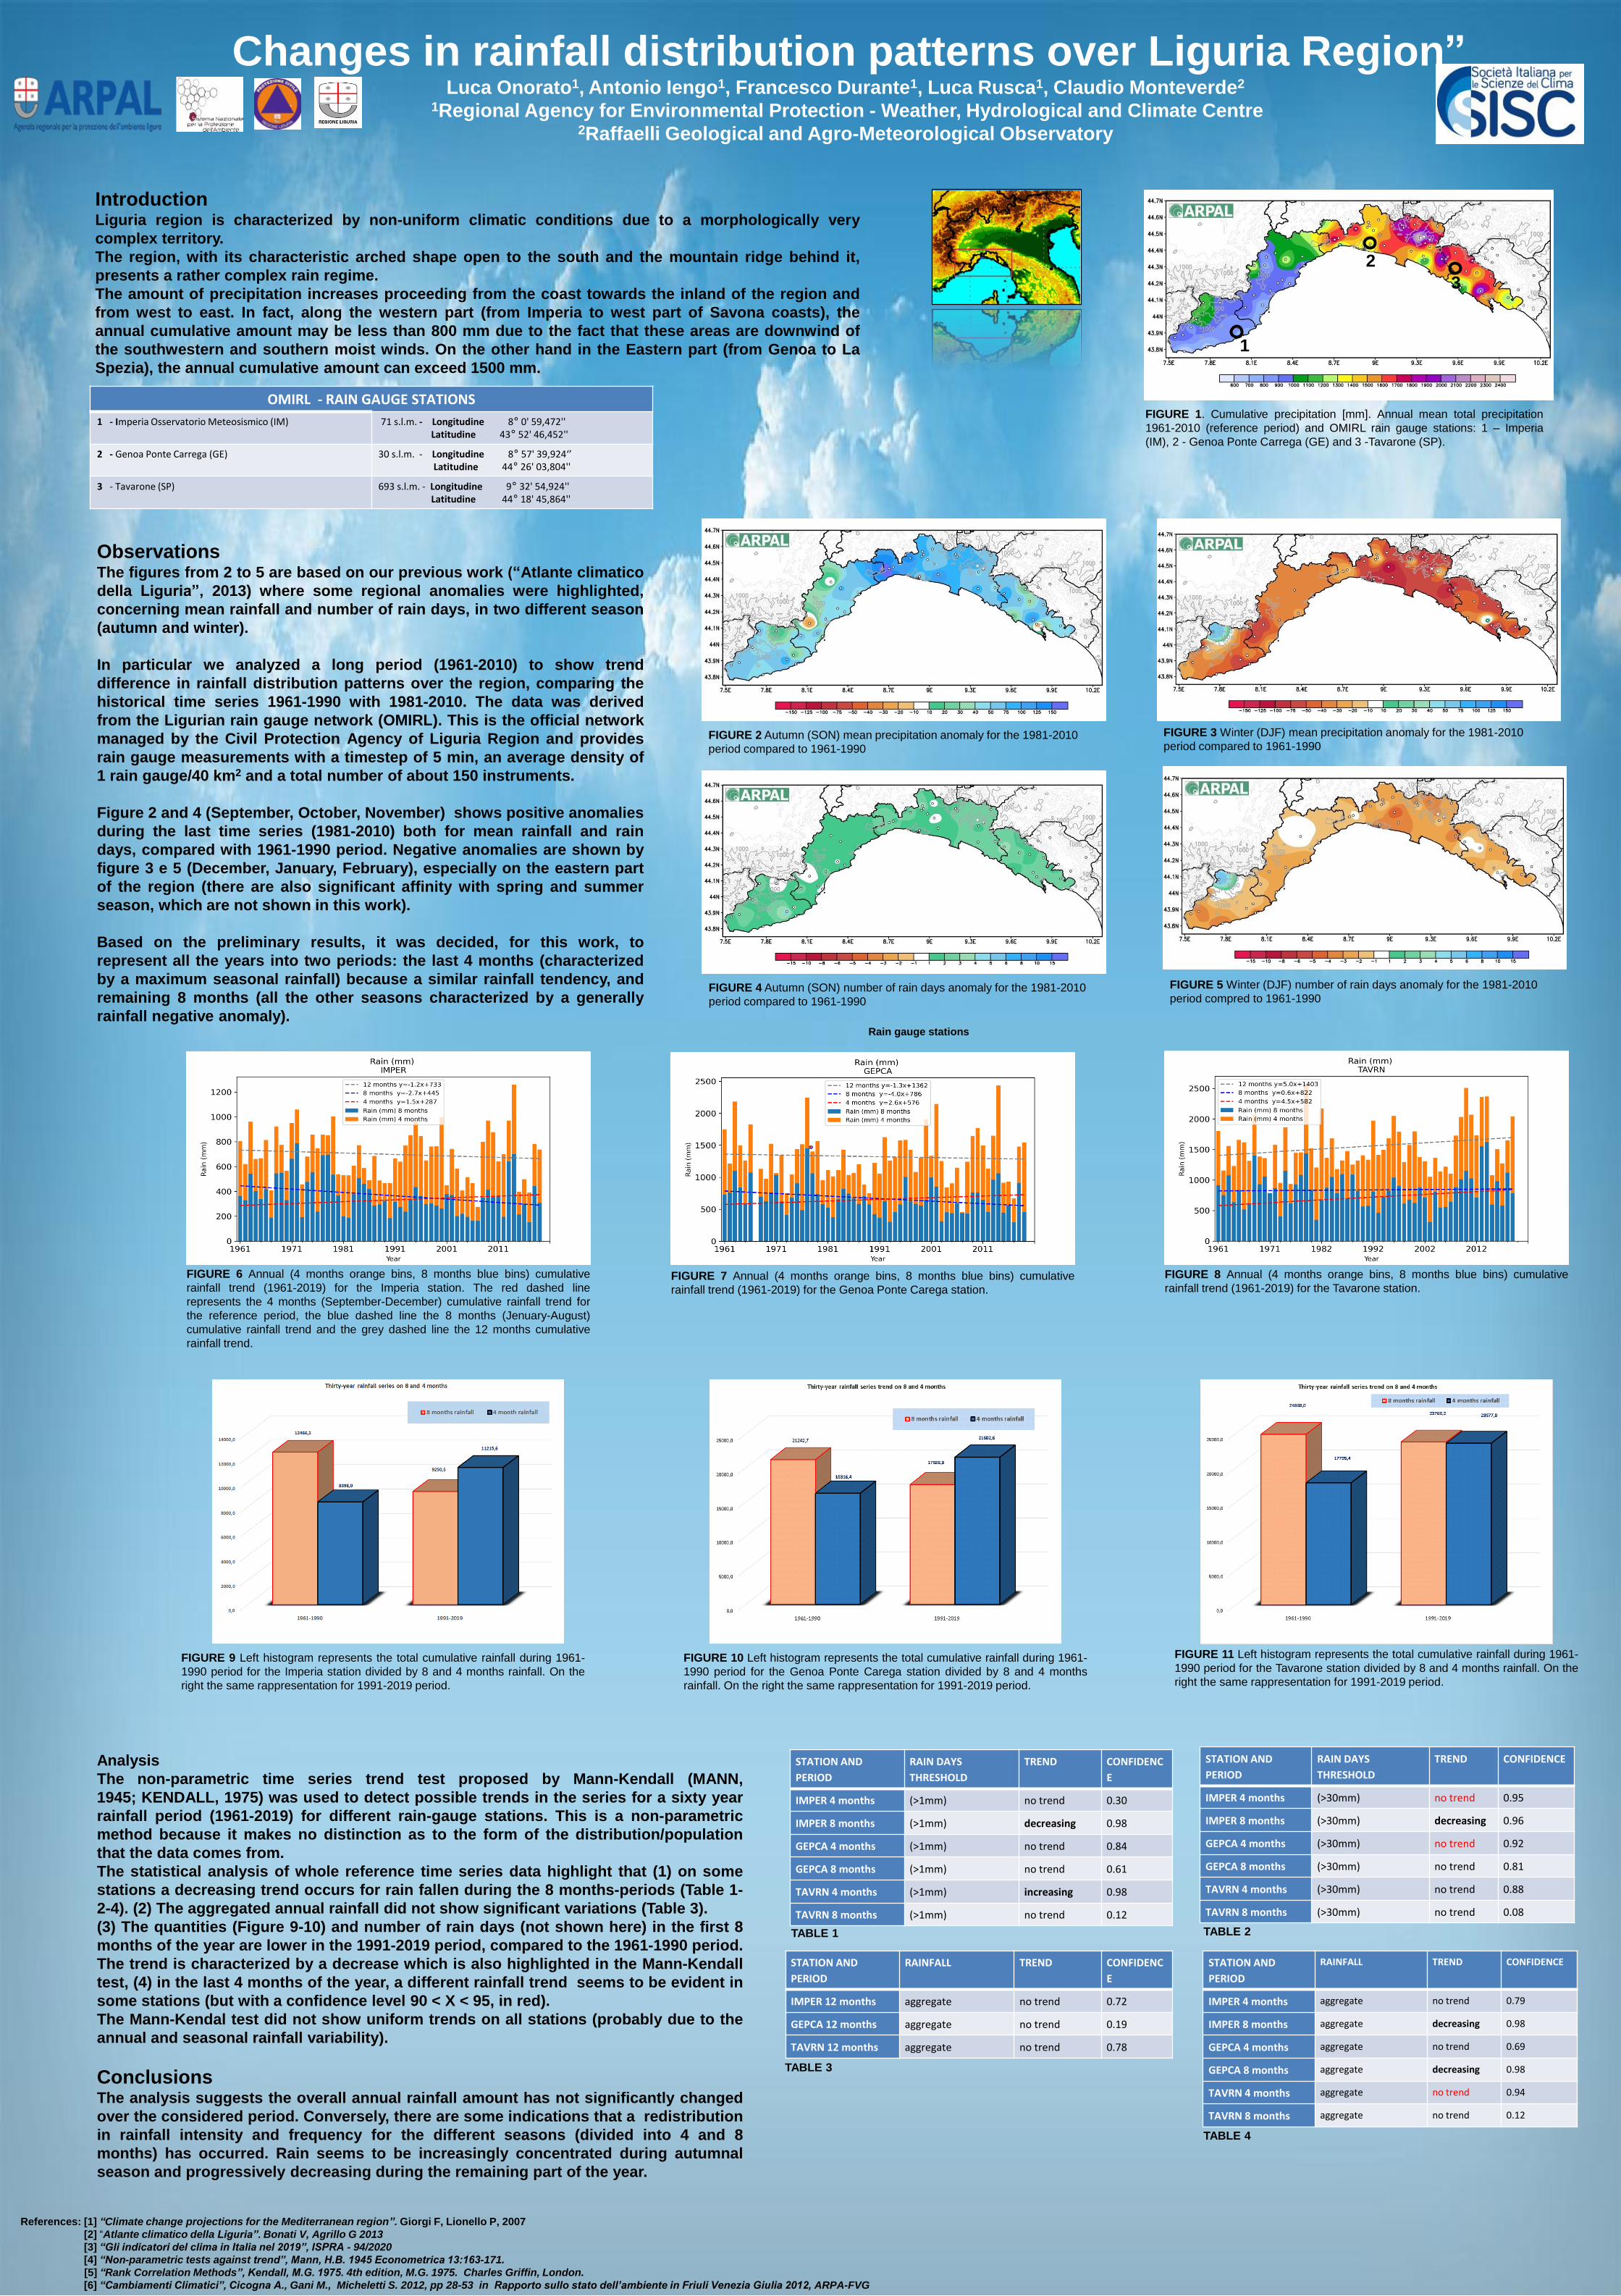
IntroductionLiguria region is characterized by non-uniform climatic conditions due to a morphologically very
complex territory.
The region, with its characteristic arched shape open to the south and the mountain ridge behind it,
presents a rather complex rain regime.
The amount of precipitation increases proceeding from the coast towards the inland of the region and
from west to east. In fact, along the western part (from Imperia to west part of Savona coasts), the
annual cumulative amount may be less than 800 mm due to the fact that these areas are downwind of
the southwestern and southern moist winds. On the other hand in the Eastern part (from Genoa to La
Spezia), the annual cumulative amount can exceed 1500 mm.
FIGURE 1. Cumulative precipitation [mm]. Annual mean total precipitation
1961-2010 (reference period) and OMIRL rain gauge stations: 1 – Imperia
(IM), 2 - Genoa Ponte Carrega (GE) and 3 -Tavarone (SP).
FIGURE 3 Winter (DJF) mean precipitation anomaly for the 1981-2010
period compared to 1961-1990 FIGURE 2 Autumn (SON) mean precipitation anomaly for the 1981-2010
period compared to 1961-1990
FIGURE 4 Autumn (SON) number of rain days anomaly for the 1981-2010
period compared to 1961-1990
References: [1] “Climate change projections for the Mediterranean region”. Giorgi F, Lionello P, 2007
[2] “Atlante climatico della Liguria”. Bonati V, Agrillo G 2013
[3] “Gli indicatori del clima in Italia nel 2019”, ISPRA - 94/2020
[4] “Non-parametric tests against trend”, Mann, H.B. 1945 Econometrica 13:163-171.
[5] “Rank Correlation Methods”, Kendall, M.G. 1975. 4th edition, M.G. 1975. Charles Griffin, London.
[6] “Cambiamenti Climatici”, Cicogna A., Gani M., Micheletti S. 2012, pp 28-53 in Rapporto sullo stato dell’ambiente in Friuli Venezia Giulia 2012, ARPA-FVG
FIGURE 5 Winter (DJF) number of rain days anomaly for the 1981-2010
period compred to 1961-1990
ObservationsThe figures from 2 to 5 are based on our previous work (“Atlante climatico
della Liguria”, 2013) where some regional anomalies were highlighted,
concerning mean rainfall and number of rain days, in two different season
(autumn and winter).
In particular we analyzed a long period (1961-2010) to show trend
difference in rainfall distribution patterns over the region, comparing the
historical time series 1961-1990 with 1981-2010. The data was derived
from the Ligurian rain gauge network (OMIRL). This is the official network
managed by the Civil Protection Agency of Liguria Region and provides
rain gauge measurements with a timestep of 5 min, an average density of
1 rain gauge/40 km2 and a total number of about 150 instruments.
Figure 2 and 4 (September, October, November) shows positive anomalies
during the last time series (1981-2010) both for mean rainfall and rain
days, compared with 1961-1990 period. Negative anomalies are shown by
figure 3 e 5 (December, January, February), especially on the eastern part
of the region (there are also significant affinity with spring and summer
season, which are not shown in this work).
Based on the preliminary results, it was decided, for this work, to
represent all the years into two periods: the last 4 months (characterized
by a maximum seasonal rainfall) because a similar rainfall tendency, and
remaining 8 months (all the other seasons characterized by a generally
rainfall negative anomaly).
STATION AND
PERIOD
RAIN DAYS
THRESHOLD
TREND CONFIDENC
E
IMPER 4 months (>1mm) no trend 0.30
IMPER 8 months (>1mm) decreasing 0.98
GEPCA 4 months (>1mm) no trend 0.84
GEPCA 8 months (>1mm) no trend 0.61
TAVRN 4 months (>1mm) increasing 0.98
TAVRN 8 months (>1mm) no trend 0.12
STATION AND
PERIOD
RAIN DAYS
THRESHOLD
TREND CONFIDENCE
IMPER 4 months (>30mm) no trend 0.95
IMPER 8 months (>30mm) decreasing 0.96
GEPCA 4 months (>30mm) no trend 0.92
GEPCA 8 months (>30mm) no trend 0.81
TAVRN 4 months (>30mm) no trend 0.88
TAVRN 8 months (>30mm) no trend 0.08
Analysis
The non-parametric time series trend test proposed by Mann-Kendall (MANN,
1945; KENDALL, 1975) was used to detect possible trends in the series for a sixty year
rainfall period (1961-2019) for different rain-gauge stations. This is a non-parametric
method because it makes no distinction as to the form of the distribution/population
that the data comes from.
The statistical analysis of whole reference time series data highlight that (1) on some
stations a decreasing trend occurs for rain fallen during the 8 months-periods (Table 1-
2-4). (2) The aggregated annual rainfall did not show significant variations (Table 3).
(3) The quantities (Figure 9-10) and number of rain days (not shown here) in the first 8
months of the year are lower in the 1991-2019 period, compared to the 1961-1990 period.
The trend is characterized by a decrease which is also highlighted in the Mann-Kendall
test, (4) in the last 4 months of the year, a different rainfall trend seems to be evident in
some stations (but with a confidence level 90 < X < 95, in red).
The Mann-Kendal test did not show uniform trends on all stations (probably due to the
annual and seasonal rainfall variability).
ConclusionsThe analysis suggests the overall annual rainfall amount has not significantly changed
over the considered period. Conversely, there are some indications that a redistribution
in rainfall intensity and frequency for the different seasons (divided into 4 and 8
months) has occurred. Rain seems to be increasingly concentrated during autumnal
season and progressively decreasing during the remaining part of the year.
STATION AND
PERIOD
RAINFALL TREND CONFIDENC
E
IMPER 12 months aggregate no trend 0.72
GEPCA 12 months aggregate no trend 0.19
TAVRN 12 months aggregate no trend 0.78
FIGURE 6 Annual (4 months orange bins, 8 months blue bins) cumulative
rainfall trend (1961-2019) for the Imperia station. The red dashed line
represents the 4 months (September-December) cumulative rainfall trend for
the reference period, the blue dashed line the 8 months (Jenuary-August)
cumulative rainfall trend and the grey dashed line the 12 months cumulative
rainfall trend.
FIGURE 7 Annual (4 months orange bins, 8 months blue bins) cumulative
rainfall trend (1961-2019) for the Genoa Ponte Carega station.
FIGURE 8 Annual (4 months orange bins, 8 months blue bins) cumulative
rainfall trend (1961-2019) for the Tavarone station.
FIGURE 9 Left histogram represents the total cumulative rainfall during 1961-
1990 period for the Imperia station divided by 8 and 4 months rainfall. On the
right the same rappresentation for 1991-2019 period.
FIGURE 10 Left histogram represents the total cumulative rainfall during 1961-
1990 period for the Genoa Ponte Carega station divided by 8 and 4 months
rainfall. On the right the same rappresentation for 1991-2019 period.
FIGURE 11 Left histogram represents the total cumulative rainfall during 1961-
1990 period for the Tavarone station divided by 8 and 4 months rainfall. On the
right the same rappresentation for 1991-2019 period.
STATION AND
PERIOD
RAINFALL TREND CONFIDENCE
IMPER 4 months aggregate no trend 0.79
IMPER 8 months aggregate decreasing 0.98
GEPCA 4 months aggregate no trend 0.69
GEPCA 8 months aggregate decreasing 0.98
TAVRN 4 months aggregate no trend 0.94
TAVRN 8 months aggregate no trend 0.12
TABLE 1 TABLE 2
TABLE 3
TABLE 4
Rain gauge stations
1
2
3
OMIRL - RAIN GAUGE STATIONS
1 - Imperia Osservatorio Meteosismico (IM) 71 s.l.m. - Longitudine 8° 0' 59,472''Latitudine 43° 52' 46,452''
2 - Genoa Ponte Carrega (GE) 30 s.l.m. - Longitudine 8° 57' 39,924‘’Latitudine 44° 26' 03,804''
3 - Tavarone (SP) 693 s.l.m. - Longitudine 9° 32' 54,924''Latitudine 44° 18' 45,864''
1
2
3