Pro Medicus Limited Annual Financial Report - 30 June 2021
62
Pro Medicus Limited Annual Financial Report - 30 June 2021 1 Contents to Financial Report Directors’ Report 2 • Remuneration Report 11 Auditor’s Independence Declaration 20 Statement of Comprehensive Income 21 Statement of Financial Position 22 Statement of Changes in Equity 23 Statement of Cash Flows 24 Notes to the Financial Statements 25 Note 1 Corporate Information 25 Note 2 Summary of Significant Accounting Policies 25 Note 3 Significant Accounting Judgements, Estimates and Assumptions 25 Note 4 Operating Segments 27 Note 5 Revenue from contracts with customers 29 Note 6 Income and Expenses 31 Note 7 Income Tax 31 Note 8 Earnings per Share 34 Note 9 Dividends Paid and Proposed 35 Note 10 Cash and Cash Equivalents 35 Note 11 Trade and Other Receivables 36 Note 12 Other Financial Assets 37 Note 13 Plant and Equipment 38 Note 14 Intangible Assets 39 Note 15 Trade and Other Payables 42 Note 16 Deferred Revenue 42 Note 17 Provisions 43 Note 18 Contributed Equity and Reserves 44 Note 19 Share based Payments 45 Note 20 Leases 46 Note 21 Events after the Balance Sheet Date 47 Note 22 Auditors’ Remuneration 48 Note 23 Key Management Personnel 48 Note 24 Related Party Disclosure 48 Note 25 Financial Risk Management Objectives and Policies 49 Note 26 Contingencies 52 Note 27 Parent Entity Information 52 Note 28 Other Accounting Policies 53 Directors’ Declaration 54 Independent Auditor’s Report 55 ASX Additional Information 60 Corporate Information 61
Transcript of Pro Medicus Limited Annual Financial Report - 30 June 2021

Pro Medicus Limited
Annual Financial Report - 30 June 2021
1
Contents to Financial Report
Directors’ Report 2
• Remuneration Report 11
Auditor’s Independence Declaration 20
Statement of Comprehensive Income 21
Statement of Financial Position 22
Statement of Changes in Equity 23
Statement of Cash Flows 24
Notes to the Financial Statements 25
Note 1 Corporate Information 25
Note 2 Summary of Significant Accounting Policies 25
Note 3 Significant Accounting Judgements, Estimates and Assumptions 25 Note 4 Operating Segments 27
Note 5 Revenue from contracts with customers 29 Note 6 Income and Expenses 31
Note 7 Income Tax 31
Note 8 Earnings per Share 34 Note 9 Dividends Paid and Proposed 35
Note 10 Cash and Cash Equivalents
35 Note 11 Trade and Other Receivables 36
Note 12 Other Financial Assets 37 Note 13 Plant and Equipment 38
Note 14 Intangible Assets 39
Note 15 Trade and Other Payables 42 Note 16 Deferred Revenue 42
Note 17 Provisions 43 Note 18 Contributed Equity and Reserves 44
Note 19 Share based Payments 45
Note 20 Leases 46 Note 21 Events after the Balance Sheet Date 47
Note 22 Auditors’ Remuneration 48 Note 23 Key Management Personnel 48
Note 24 Related Party Disclosure 48 Note 25 Financial Risk Management Objectives and Policies 49
Note 26 Contingencies 52
Note 27 Parent Entity Information 52 Note 28 Other Accounting Policies 53
Directors’ Declaration 54
Independent Auditor’s Report 55
ASX Additional Information 60
Corporate Information 61

Directors’ Report
2
The Directors’ Report for the financial year ended 30 June 2021 has been prepared in accordance with the requirements of the Corporations Act 2001. Further information on current Directors, their qualifications, participation in Board sub-committees and attendance at meetings can be found in the Corporate Governance Section below and on our website at http://www.promed.com.au/about/board. This Report consists of the following parts:
• Operating and financial review
• Corporate Structure
• Nature of Operations and Principal Activities
• Pro Medicus at a glance
• Our strategic goals
• How we create value - Our business model
• Review and results of operations
• Review of financial condition
• Risk management
• Corporate Governance
• Outlook
• Remuneration report
OPERATING AND FINANCIAL REVIEW Corporate structure Pro Medicus Limited is an Australian incorporated and domiciled company, listed on the ASX with subsidiaries in Europe and North America (collectively the Group). Nature of Operations and Principal Activities The principal activities of the Group during the year were the development and supply of healthcare imaging software and services to hospitals, diagnostic imaging groups and other related health entities in Australia, North America and Europe.
Pro Medicus at a glance Our key business activities consist of the following:
• Research & Development - Software enhancements, updates, innovation, program extensions, AI, research.
• Sales and customer engagement - Sales/relationships
• Product implementation - System implementation and continual upgrades (as needed)
• Product support and training - Customer support and ongoing training
• Support services – billing, risk management, governance, HR, management. Our key products and services include:
• Visage RIS – Radiology Information Systems (RIS) proprietary medical software for practice management, training, installation and professional services, after sale support and service products, Promedicus.net secure email and Integration products.
• Visage 7.0 – Healthcare imaging software that provides radiologists and clinicians with advanced visualisation capability for rapidly viewing 2-D, 3-D and 4-D medical images, Picture Archive and Communication System (PACS)/Digital Imaging software that is sold directly and to original equipment manufacturers (OEM), training, installation and professional services and support products.
The Group has continued development of both the RIS products and the Visage 7.0 product line throughout the period. The Group undertakes research and development (R&D) in Australia for its Practice Management (RIS) and promedicus.net products including R&D for Visage RIS, its new technology platform. The R&D for the Visage Imaging product set is carried out in Europe. Further information on our products can be found at http://www.promed.com.au/visage-ris/ and https://visageimaging.com/platform/.

Directors’ Report continued
3
Our strategic goals
We have three over-arching strategic business goals which drive our business model and the way we create value. Goal 1: Make a meaningful impact on customer financial and clinical outcomes
Goal 2: Best in class Imaging & RIS through continuous innovation
Goal 3: Sustained revenue and NPAT margin growth
How we create value - Our business model
Some of the key ‘outcomes’ for key stakeholders on value creation are as follows:
- Customers – Our products and services reduce cost of business for our customers, which flows
through to their pricing models and profitability
- Customers and their clients/ patients (community) - Our software reduces access time to images by
clinicians, reducing time taken to diagnose and length of consults with patients, allowing more
patients to be attended to over a given period
- Customers - Our products and services are highly scalable allowing accessibility to a range of
customers
- Customers - Our products are developed to minimise the computer hardware and storage
requirements of our customers by being cloud deployable
- Employees – Our staff are loyal and engaged, with low turnover and increased skills development
- Investors – Although we invest heavily in R&D, our products and services are in demand and attract
strong margins to secure good growth in revenue, profit and shareholder returns.
Review and results of operations Dynamics of the business / Global operations
Australia North America Europe
The Group’s Australian employees undertake the research and development of Pro Medicus products (RIS) as well as sales and service/support functions.
The Group’s Australian revenue increased by 23.4% compared to the previous year, with the main contributors being increased transaction volumes from the Healius contract and additional licence revenue from the extension of its contract with I-MED.
Promedicus.net, the company’s e-health offering, continued to hold its market position.
The North American team fulfil sales, marketing and professional services roles.
Revenue from North America increased by 18.0% compared to the previous year. This was attributable to increases in transaction-based revenue from sales of Visage technology as more contracts came on stream.
The Group’s employees in Berlin office undertake research and development of Visage Imaging products worldwide as well as sales, marketing and service/support functions for the Group’s European operations.
Revenue for software from our European operations increased by 25.7% compared to the previous year. This was attributable to the LMU Klinikum deal announced during the year and implemented in December 2020.
Financial performance Reported profit after tax for the period was $30.85m an increase of 33.7% from the previous year. Full year revenue of the Group increased from $56.82m to $67.88m, an increase of 19.5%. The key drivers of the revenue increase were increases in transaction revenue in North American, LMU Klinikum contract in Europe and as well as increased RIS sales in Australia. The result from the underlying operations for the year was a pre-tax profit of $42.63m compared to an underlying pre-tax profit of $30.24m from the previous corresponding period, an increase of 41.0%. The underlying profit comprises reported profit before tax of $42.87m less the net currency gain of $0.24m. The underlying profit from 2020, comprises reported profit before tax of $30.02m and adding the net currency loss of $0.22m. The currencies of the countries in which the Company has its activities have been volatile during the year. On a constant currency basis, the revenue would have been $73.98m (up 30.2%) and the underlying profit before tax would have been $46.93m (up 56.3%) for the year ended 30 June 2021.

Directors’ Report continued
4
The Company had its most successful year in terms of new sales winning five key contracts in North America and one in Europe. July 2020 - NYU Langone Health (A$25.0m – 7 year deal), a large tier 1 academic hospital system in New York; December 2020 - Medstar Health (A$18.0m – 5 year deal), the largest health system in Maryland and Washington DC; January 2021 Intermountain Healthcare (A$40.0m – 7 year deal) the largest health system in the State of Utah; February 2021 - University of California (A$31.0m – 7 year deal) with all 5 academic campuses of UCLA, UCSD, UCSF, UC Irvine and UC Davis; and May 2021 University of Vermont (A$14.0m – 8 year deal), a large, teaching hospital in Burlington, Vermont. 1
The Company was also successful in winning a key client in Europe with the LMU Klinikum (A$10.0m – 7 year) deal in Munich. During the period the Company signed Research Collaboration Agreements with NYU Langone and Mayo Clinic two of the most prestigious academic institutions in North America. These agreements provide a framework for collaboration to facilitate development and commercialisation in the field of AI, leveraging the Visage AI Accelerator platform. In February, the company received FDA clearance for its Breast Density AI algorithm paving the way for commercialisation of this, the company’s first AI product. The Company also continued to make significant progress with all key implementations being on, or ahead of schedule. This was achieved by a mix of remote and onsite presence. COVID-19 The company was able to continue its R&D and client support activities via a combination of “work from home” and in-office activities with all sales meetings and demonstrations to prospective clients performed remotely via video conferencing. Exam volumes, particularly in the US, recovered steadily throughout the period with the majority of customers now at or above pre-COVID levels resulting in minimal impact on the full year results. Dividends
Dividend declared subsequent to the end of the year
FY21 final dividend (declared 18 August 2021) 8.0 8,337
Dividends declared and paid during the year:
FY21 interim dividend
FY20 final dividend
7.0
6.0
7,295
6,253
Refer to Note 9 for further details about Dividends paid during the year. Significant Changes in the State of Affairs Refer to the Operating and Financial Review section above for information on the significant changes in the state of affairs of the Group. Information on likely developments and future prospects of the Group is discussed below. Review of Financial Condition Capital Structure The Company has a sound capital structure with a strong financial position and is debt free. Treasury Policy The treasury function, co-ordinated within Pro Medicus Limited, is limited to maximising interest return on surplus funds and managing currency risk. The treasury function operates within policies set by the Board, which is responsible for ensuring that management’s actions are in line with Board policy.
1 Contract values represent the total expected fees to be earned over the life of the relevant agreement

Directors’ Report continued
5
With the increase in overseas operations there is an increased currency risk as a consequence of contracts written in and cash being held in foreign currencies. Whilst this is offset to a degree by having operations in North America and Europe, this change in risk profile has been noted by the Board and steps have been taken to manage this risk, including taking out forward currency exchange contracts and currency options. Cash from Operations Net cash flows from operating activities for the current period were a positive $38.84m, with receipts from customers totalling $63.08m compared with payments of $16.94m to suppliers and employees. During the year the Company paid out a total of $13.55m in dividends and investing $19.70m in fixed income securities, the net result being total cash assets of $42.04m; a decrease of 3.2% from last year. During the reporting period the Group made investments in fixed income securities to enhance the return in its available funds. Liquidity and Funding The Group is cash flow positive, has adequate cash reserves and has no overdraft facility. Sufficient funds are held to finance operations. Risk Management
Key risks The Company takes a proactive approach to risk management. The Board is responsible for ensuring that risks, and also opportunities, are identified on a timely basis and that the Group’s objectives and activities are aligned with the risk and opportunities identified by the Board.
The Company has set up a new Audit and Risk Committee to monitor and assess risk management, environmental issues, occupational health and safety and treasury. The Audit and Risk Committee has a number of mechanisms in place to ensure that management’s objectives and activities are aligned with the risks identified by the committees as per the Corporate Governance section below. In the reporting period the Company created a People and Culture Committee as set out on Page 8 below. During the reporting period the Board and management undertook a detailed review of material business risks and the work being undertaken to mitigate them. The material strategic, operational and financial risks being managed by the company are outlined below. Financial Risks Fraud / inappropriate conduct The risk of fraud / inappropriate conduct leading to significant loss or reputational damage is managed and mitigated through periodic financial reconciliations. Delegation of Authority policy and periodic cyber security reviews. An external audit is conducted on the Company’s financials annually. Changes in market competition The threat of new entrants to the market and the impact on revenue base is managed and mitigated through long term contracts, continuous product development and offering additional products to customer to add value. Alignment of customers, products and services to strategic objectives The threat of losing key customers due to non-performance, non-compliance with SLAs or competition is managed and mitigated through weekly reporting on key clients and regular reviews of key indicator metrics, such as SLA performance and quality management. Quality management The risk of poor-quality management and lack of policies, procedures and standard operating procedures (SOPs) is managed and mitigated through internal control measures.
Strategic and operational risks
Cyber security The risk of a direct external cyber-attack on PME IT systems and the risk of a direct external cyber-attack on third party systems (client) using PME relationships has been managed and mitigated through internal control measures. In the event of a breach, the Company is able to shut down, reformat and update key systems in addition to reverting back to system and source code backups. As at the date of this report, there have been no known breaches or penetration to cyber security.

Directors’ Report continued
6
Non-compliance or breach of private data The risk of non-compliance or breach of private data has been managed and mitigated through ISO27001 risk assessments and audit compliance. As at the date of this report, there were no known non-compliance or breaches of private data noted for the financial year ended 2021. Succession planning The risk of succession of key executives has been identified and is currently being managed by an external review of the roles and responsibilities of these executives. The external review will determine future talent needs, source potential recruitment needs for the future, develop a strategic plan to fill identified skills and talent gaps and plan for succession of the key roles identified. Clinical risk The risk of clinical misdiagnosis has been managed and mitigated through the FDA (510k) process undertaken in Berlin and the United States. Technology obsolescence The risk of Pro Medicus technology becoming obsolete and threat of emerging technologies has been managed and mitigated through frequent interaction with customers and leaders across the industry to help identify emerging innovations and disruptions to the market and through our continuous research and development efforts. IP issues The risk of transgressing others IP and the risk of IP being lost due to theft, copying by third party or rogue employee has been managed and mitigated through insurance and the ownership of key patents and agreements. Should the likelihood of an IP breach / transgression arise, the Company is able to change and update product software to avoid any patent breaches. Climate change
An initial review by Board and management has identified climate change as a key risk and the Board accepts the science and responsibility that companies face in responding to climate change. The Board and management have considered from a governance and risk perspective however, whilst a key risk, it would have a lower impact on enterprise value than the top 10 risks outlined above. The Group has no identified risk with regard to environmental regulations currently in force. There have been no known breaches by the Group of any regulations. COVID-19
Examination volumes in Australia and North American have returned to normal levels and it is anticipated, subject to no further major COVID outbreaks, that this trend will continue.
As a result, it is anticipated that the 2022 financial year will show a continuing improvement in operational results, however this is dependent upon many market factors over which the Directors have limited or no control. Corporate Governance Directors The names and details of the Company’s Directors in office during the financial year and until the date of this report are as follows:
Peter Terence Kempen AM
F.C.A, F.A.I.C.D
(Chairman)
Peter Kempen joined Pro Medicus Limited as a Director on 12 March 2008. He is Chairman of Australasian Leukaemia and Lymphoma Group and Chairman of Logie- Smith Lanyon. He is also a Trustee of the Barr Family Foundation and a member of the Board of St Hilda’s College Ltd, University of Melbourne. Peter has previously been Chairman of Patties Food Limited, Chairman of Danks Holdings Limited, Chairman of Ivanhoe Grammar School and Managing Partner of Ernst & Young Corporate Finance Australia. Peter is a Fellow of the Institute of Chartered Accountants in Australia and a Fellow of the Australian Institute of Company Directors. Peter was appointed a Member in the General Division of the Order of Australia (AM) in the 2018 Queen’s Birthday Honours. Peter became Chairman in August 2010 before which he served as a Non-Executive Director of the Company. Peter is also Chair of the Audit and Risk committee.

Directors’ Report continued
7
Dr Sam Aaron Hupert
M.B.B.S. (Managing Director and Chief Executive Officer)
Co-founder of Pro Medicus Limited in 1983, Sam Hupert is a Monash University Medical School graduate who commenced General Practice in 1980. Realising the significant potential for computers in medicine he left general practice in late 1984 to devote himself full time to managing the Group. Sam served as CEO from the time he co-founded the company until October 2007 at which time he stepped down to become an executive director. Sam resumed full time CEO activities in October of 2010.
Anthony Barry Hall
B.Sc. (Hons), M.Sc.
(Executive Director and Technology Director)
Co-founder of Pro Medicus Limited in 1983, Anthony Hall has been principal architect and developer of the core software systems. His current focus is the transition to and development of the Company’s next generation RIS systems. Anthony holds a Bachelor and Master’s degree in Science from La Trobe University.
Anthony James Glenning
B.CS, B.EE, M.EE (Non-Executive Director)
Anthony joined Pro Medicus Limited as a Director on 1 May 2016. He is the fund manager of Skalata Ventures, investing in early stage companies to help them scale and grow into significant and sustainable businesses. He is a Director of Azure Healthcare Limited (ASX:AZV) since September 2018, an international provider of healthcare communication and clinical workflow management solutions. Anthony has previously been Chairman of Cyrise Pty Ltd, an accelerator for early stage cyber security start-ups and Investment Director of Starfish Ventures and was the founder and previously the CEO of Tonic Systems and a founding Non-Executive Director of Cameron Systems. Anthony holds bachelor degrees in Computer Science and Electrical Engineering from University of Melbourne and holds a Master’s degree in Electrical Engineering from Stanford University California. Anthony also serves on the People & Culture committee and Audit and Risk committee.
Dr Leigh Bernard Farrell
PhD, B.Sc. (Hons), FAICD (Non-Executive Director)
Leigh joined Pro Medicus Limited as a Director on 8 September 2017. He is the Head of the Health Security Division of DMTC Ltd, Managing Director of AdNED Pty Ltd, non-executive director of both Ena Respiratory Pty Ltd and Alexia Oncology Pty Ltd, a member of the Walter and Eliza Hall Institute of Medical Research Board Commercialisation Committee and a member of the Independent Advisory Council of Medicines Australia. Leigh was previously Senior Vice President, Commercial of Certara USA, Inc. where he was responsible for Asia Pacific Commercial. Prior to this, he was Chairman and COO of d3 Medicine LLC, which was acquired by Certara USA, Inc. Leigh holds a PhD in Biochemistry and a Bachelor of Science (Honours) from Monash University and is a Fellow of the Australian Institute of Company Directors. Leigh also serves on the People & Culture committee and Audit and Risk committee.
Deena Robyn Shiff
B.Sc (Hons), B.A. Law (Hons), (Non-Executive Director) (appointed 1 August 2020)
Deena joined Pro Medicus Limited as a Director on 1 August 2020. Deena is Chair of the Supervisory Board of Marley Spoon AG (ASX:MMM) since July 2018 and Non-Executive Director of Appen Ltd (ASX:APX) since May 2015. Deena also holds other board positions with Healthcare I.T. Pty Ltd, Infrastructure Australia and Opera Australia and is Chair of the Government’s Australia Broadband Advisory Council. Previous board roles include Chairman of the global board of BAI Communications, Non-Executive Director of the Citadel Group (ASX:CGL), Vice Chairman of the Government’s Export Credit Agency EFIC , and a number of venture capital backed growth stage ICT companies. Deena has served as a Group Managing Director at Telstra, where she led the Wholesale Division Group, established and led Telstra Business and founded Telstra’s corporate venture capital arm, Telstra Ventures. Deena has also held various in house regulatory and legal positions and has been a Partner of the law firm Mallesons Stephen Jacques. Deena holds a degree from the London School of Economics and a Law degree from the University of Cambridge.

Directors’ Report continued
8
Deena is Chair of the People & Culture committee and serves on the Audit and Risk committee.
Company Secretary Clayton James Hatch CPA
Clayton was appointed Company Secretary on 1 July 2009. Clayton has strong experience in financial and management accounting having worked in a Finance role for several years. Clayton joined Pro Medicus in June 2008 and has progressed through the Company to his current position of Chief Financial Officer which he assumed on 1 July 2012. Clayton is currently studying for a Global Executive Masters of Business Administration (GEMBA) at Monash University.
The Board and management team maintain high standards of corporate governance as part of our commitment to create value for our stakeholders through effective strategic planning, risk management, transparency, and corporate responsibility. A description of the role of each committee and its composition is set out in the following table.
Committee Members Composition Role
Audit and Risk Committee
Mr Peter Kempen (Chair)*
Mr Anthony Glenning
Dr Leigh Farrell
Ms Deena Shiff
- At least three members, all of whom must be non-executive directors and a majority of whom are independent directors.
- The chair must be an independent non-executive director, who is not the chairman of the Board*.
- Comprise members who are financially literate and include at least one member who has accounting and/or related financial management expertise and some members who have an understanding of the industries in which the Company operates.
Our Audit and Risk Management Committee assists the Board in carrying out its oversight of the quality and integrity of the accounting, auditing and financial reporting of the Company. The Committee also reviews the adequacy of Pro Medicus’ internal control structure, corporate reporting processes, and risk management framework, monitors the effectiveness, objectivity and independence of the external auditor and reviews reports from the external auditor.
People and Culture Committee
(Established – 23 September 2020)
Ms Deena Shiff (Chair)
Mr Anthony Glenning
Dr Leigh Farrell
- At least three members, all of whom are non-executive and the majority of whom are independent directors.
- The chair should be an independent director.
- All members should have sufficient technical expertise to discharge its mandate effectively.
Our People and Culture Committee assists and advises the Board on remuneration policies for directors and senior executives, induction and continuing professional development programs for directors, succession planning, composition and size of the board, process for evaluating the performance of the board, and overseeing employee engagement and talent programs.
*The Company is currently recruiting an independent Audit & Risk Chair who will not be chairman of the Board. Key areas of governance focus and activities undertaken by the Board, its committees and management during 2020-21 include:
• Strategic and financial performance – a Board and executive strategy session was held during the reporting period to focus on existing and new products and market growth
• People & Culture - established a People & Culture Committee responsible for reviewing executive remuneration benchmarking, succession planning, diversity and board composition
• Governance – reviewed and updated relevant governance polices, charters and practises to reflect the 4th edition of the ASX Corporate Governance Councils Principles and Recommendations
• Board Renewal – appointed an additional independent, non-executive director and re-constituted the Audit & Risk Committee
• Social and environment – initiated an external review by a professional service firm to establish ESG reporting and compliance
Further information on our website will be made available for our 2021 Corporate Governance Statement once released.

Directors’ Report continued
9
Directors’ Meetings
The numbers of meetings of Directors (including meetings of committees of Directors) held during the year and the number of meetings attended by each Director were as follows:
Board Meetings Audit & Risk Committee People & Culture Committee
Eligible to attend
Attended
Eligible to attend
Attended
Eligible to attend
Attended
Peter Kempen 11 11 2 2 - 2
Anthony Glenning 11 10 2 2 2 2
Leigh Farrell 11 11 2 2 2 2
Deena Shiff 10 10 2 2 2 2
Anthony Hall 11 11 2 2 - 2
Sam Hupert 11 11 2 2 - 2
Committee membership As at 30 June 2021, the company had an Audit and Risk Committee comprising the 4 Non-Executive Directors and a People and Culture Committee comprising 3 Non-Executive Directors. Indemnification and Insurance of Directors and Officers
During or since the financial year, the Company has paid premiums in respect of a contract for Directors’ & Officers’/Company Re-Imbursement Liability insurance for directors, officers and Pro Medicus Limited for costs incurred in defending proceedings against them. Disclosure of the amount of insurance and the terms of this cover is prohibited by the insurance policy. Indemnification of Auditors To the extent permitted by law, the Company has agreed to indemnify its auditors, Ernst & Young, as part of the terms of its audit engagement agreement against claims by third parties arising from the audit (for an unspecified amount). No payment has been made to indemnify Ernst & Young during or since the financial year. Non-Audit Services
The Group may decide to employ the auditor on assignments additional to statutory audit duties where the auditor's expertise and experience with the Group is essential and will not compromise auditor independence.
Details of the amounts paid or payable to EY for audit and assurance and non-audit services provided during the year are set out in Note 22 to the financial statements. The Board has considered the non-audit services provided during the year and is satisfied these services are compatible with the general standard of independence for auditors imposed by the Corporations Act 2001 (Cth) for the following reasons;
• All non-audit services have been reviewed by the Audit and Risk Committee to ensure they do not impact the impartiality and objectivity of the auditor; and
• None of the services undermine the general principles relating to auditor independence as set out in APES 110 Code of Ethics for Professional Accountants.
Outlook - Likely Developments and Expected Results
The Directors anticipate that the 2022 financial year will see more opportunities crystallise for the company due to improved prospects in North America for Visage 7.0 (PACS) and the continued commercialisation and roll out of Visage RIS, the company’s new technology RIS platform.
Key factors that are likely to affect the performance of the company are:
• Increased revenue being generated from previously won transaction-based contracts which are scheduled to come on stream in the 2022 financial year.
• Continued strong interest in the Visage 7.0 expanded suite of products in the North American market has resulted in a number of sales opportunities that the Company is actively pursuing.
• The ability of the expanded Visage 7.0 product set to address key market segments such as large Health Systems and Hospitals in addition to the private radiology and teleradiology markets.

Directors’ Report continued
10
• Market dynamics that favour the adoption of Visage 7.0 technology, including the use of artificial intelligence (AI) in the industry, the ease of deployment of Visage 7.0 in public cloud and the explosion in image date size which increases the time to display images by non-streaming technologies.
• Increased revenue from Visage RIS, the company’s new technology RIS platform as the rollout of this
new platform continues.
• Extension of the Visage 7 product to Enterprise Imaging and use beyond the realm of radiology
Investments for Future Performance
The Company will continue to direct resources into the development of new products and is committed to the continued development of its Visage RIS and Visage 7.0 product sets.
It is anticipated that this strategy of ongoing development will continue to position Pro Medicus as a market leader and enable the Group to further leverage its expanded product portfolio and geographical spread.
The Group remains committed to providing staff with access to appropriate training and development programs, together with the resources to complete their duties. Rounding Unless otherwise stated, the amounts contained in this report and in the financial report have been rounded to the nearest $1,000 (where rounding is applicable) under the option available to the Company under ASIC Corporations (Rounding in Financial/Directors Reports) instrument 2016/191. The Company is an entity to which the Class Order applies.

Directors’ Report continued
11
REMUNERATION REPORT (audited)
This remuneration report for the year ended 30 June 2021 outlines the remuneration arrangements of the Group in accordance with the requirements of the Corporations Act 2001 and its Regulations. This information has been audited as required by section 308(3C) of the Act.
2021 OUTCOMES AT A GLANCE
Pro Medicus has experienced significant growth in shareholder value in the past year and has generated significant new business in particular in the United States, with agreements being put in place with leading teaching hospitals. Incentives are linked to our key financial metrics to maintain alignment to financial performance and shareholder value creation.
Short-term incentive metrics Long-term incentive metrics Other financial metrics Underlying EBIT2 ($’000)
Annual Contract Value ($’000)
Underlying EPS3 (cents per share)
Share price at 30 Jun ($) TSR4
Revenue ($’000)
Dividends declared (cents per share)
5
Short-term incentive payments are linked to underlying EBIT and Annual contract value for Key Management Personnel (KMP).
Long-term incentives are linked to underlying EPS and TSR growth.
Value has been created for shareholders through increased revenue targets and dividends.
WHO IS COVERED BY THIS REPORT?
The remuneration report details the remuneration arrangements for key management personnel (KMP) who are defined as those persons having authority and responsibility for planning, directing and controlling the major activities of the Company and the Group, directly or indirectly, including any director (whether executive or otherwise) of the Group.
For the purposes of this report, the term ‘executive’ includes the Chief Executive Officer (CEO), Executive Directors and other Senior Executives whom are considered KMP of the Group. KMP were in appointment for the entire period unless otherwise stated.
2
Underlying EBIT – Earnings before interest and tax and excluding currency gains (losses).
3 EPS – Earnings per share
4
TSR – Total Shareholder returns
5 CAGR – Compound Annual Growth rate
$1
5,3
13
$2
0,6
01
$2
7,5
28
$3
2,0
22
$4
4,7
97
20
17
20
18
20
19
20
20
20
21
$6
,97
9
$7
,17
6
$1
0,5
97
$8
,20
5
$2
3,1
05
20
17
20
18
20
19
20
20
20
21
9.3
7
12
.64
19
.37
23
.67
31
.08
20
17
20
18
20
19
20
20
20
21
$5
.32
$8
.02
$2
5.2
9
$2
6.4
6
$5
8.7
2
20
17
20
18
20
19
20
20
20
21
$3
1,5
97
$3
5,9
61
$5
0,1
05
$5
6,8
21
$6
7,8
84
20
17
20
18
20
19
20
20
20
21
4.0
6.0
10
.0
12
.0
15
.0
20
17
20
18
20
19
20
20
20
21
Directors’ Report continued
12
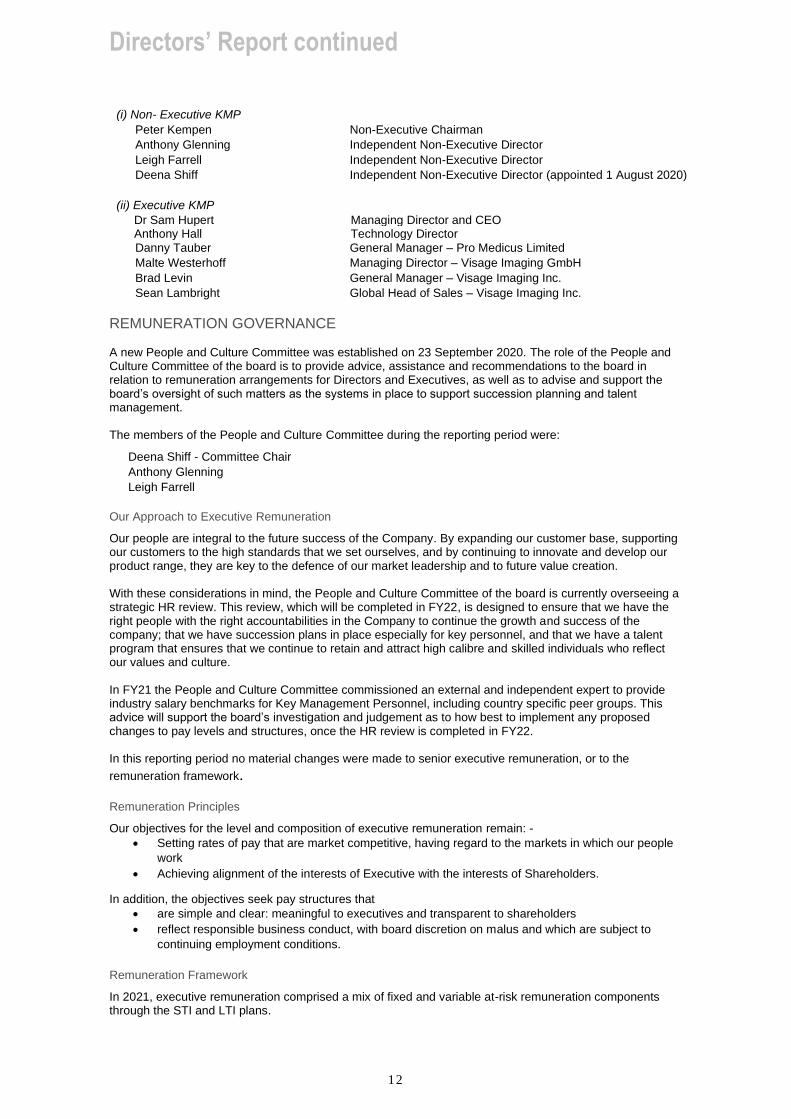
(i) Non- Executive KMP
Peter Kempen Non-Executive Chairman
Anthony Glenning Independent Non-Executive Director
Leigh Farrell Independent Non-Executive Director
Deena Shiff Independent Non-Executive Director (appointed 1 August 2020)
(ii) Executive KMP
Dr Sam Hupert Managing Director and CEO Anthony Hall Technology Director
Danny Tauber General Manager – Pro Medicus Limited
Malte Westerhoff Managing Director – Visage Imaging GmbH
Brad Levin General Manager – Visage Imaging Inc.
Sean Lambright Global Head of Sales – Visage Imaging Inc.
REMUNERATION GOVERNANCE A new People and Culture Committee was established on 23 September 2020. The role of the People and Culture Committee of the board is to provide advice, assistance and recommendations to the board in relation to remuneration arrangements for Directors and Executives, as well as to advise and support the board’s oversight of such matters as the systems in place to support succession planning and talent management. The members of the People and Culture Committee during the reporting period were:
Deena Shiff - Committee Chair
Anthony Glenning
Leigh Farrell
Our Approach to Executive Remuneration
Our people are integral to the future success of the Company. By expanding our customer base, supporting our customers to the high standards that we set ourselves, and by continuing to innovate and develop our product range, they are key to the defence of our market leadership and to future value creation. With these considerations in mind, the People and Culture Committee of the board is currently overseeing a strategic HR review. This review, which will be completed in FY22, is designed to ensure that we have the right people with the right accountabilities in the Company to continue the growth and success of the company; that we have succession plans in place especially for key personnel, and that we have a talent program that ensures that we continue to retain and attract high calibre and skilled individuals who reflect our values and culture. In FY21 the People and Culture Committee commissioned an external and independent expert to provide industry salary benchmarks for Key Management Personnel, including country specific peer groups. This advice will support the board’s investigation and judgement as to how best to implement any proposed changes to pay levels and structures, once the HR review is completed in FY22. In this reporting period no material changes were made to senior executive remuneration, or to the
remuneration framework.
Remuneration Principles
Our objectives for the level and composition of executive remuneration remain: -
• Setting rates of pay that are market competitive, having regard to the markets in which our people
work
• Achieving alignment of the interests of Executive with the interests of Shareholders.
In addition, the objectives seek pay structures that
• are simple and clear: meaningful to executives and transparent to shareholders
• reflect responsible business conduct, with board discretion on malus and which are subject to
continuing employment conditions.
Remuneration Framework
In 2021, executive remuneration comprised a mix of fixed and variable at-risk remuneration components through the STI and LTI plans.
Directors’ Report continued
13
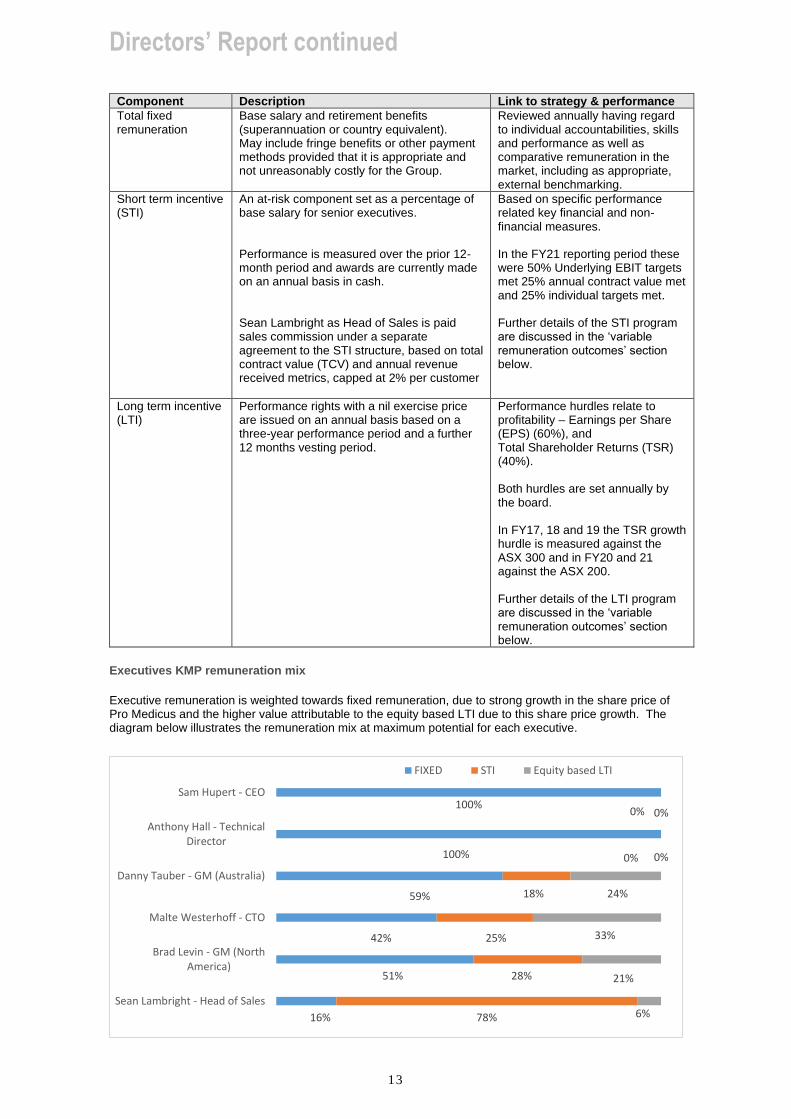
Component Description Link to strategy & performance
Total fixed remuneration
Base salary and retirement benefits (superannuation or country equivalent). May include fringe benefits or other payment methods provided that it is appropriate and not unreasonably costly for the Group.
Reviewed annually having regard to individual accountabilities, skills and performance as well as comparative remuneration in the market, including as appropriate, external benchmarking.
Short term incentive (STI)
An at-risk component set as a percentage of base salary for senior executives. Performance is measured over the prior 12-month period and awards are currently made on an annual basis in cash. Sean Lambright as Head of Sales is paid sales commission under a separate agreement to the STI structure, based on total contract value (TCV) and annual revenue received metrics, capped at 2% per customer
Based on specific performance related key financial and non-financial measures. In the FY21 reporting period these were 50% Underlying EBIT targets met 25% annual contract value met and 25% individual targets met. Further details of the STI program are discussed in the ‘variable remuneration outcomes’ section below.
Long term incentive (LTI)
Performance rights with a nil exercise price are issued on an annual basis based on a three-year performance period and a further 12 months vesting period.
Performance hurdles relate to profitability – Earnings per Share (EPS) (60%), and Total Shareholder Returns (TSR) (40%). Both hurdles are set annually by the board. In FY17, 18 and 19 the TSR growth hurdle is measured against the ASX 300 and in FY20 and 21 against the ASX 200. Further details of the LTI program are discussed in the ‘variable remuneration outcomes’ section below.
Executives KMP remuneration mix
Executive remuneration is weighted towards fixed remuneration, due to strong growth in the share price of Pro Medicus and the higher value attributable to the equity based LTI due to this share price growth. The diagram below illustrates the remuneration mix at maximum potential for each executive.
16%
51%
42%
59%
100%
100%
78%
28%
25%
18%
0%
0%
6%
21%
33%
24%
0%
0%
Sean Lambright - Head of Sales
Brad Levin - GM (NorthAmerica)
Malte Westerhoff - CTO
Danny Tauber - GM (Australia)
Anthony Hall - TechnicalDirector
Sam Hupert - CEO
FIXED STI Equity based LTI

Directors’ Report continued
14
Variable remuneration outcomes
Short Term Incentive (STI)
Short term incentives in the form of cash bonuses were paid to Executives based on a mix of Company based and personal performance targets as set out below.
Performance category and weighting
Reason chosen Performance STI outcome
Underlying EBIT (50%) EBIT is a key measure of performance and income returns generated for shareholders.
EBIT achieved due to significant increase in revenue and a reduction in costs during the period
Above target - 129%
Annual contract value (ACV) (25%)
ACV is a measure of new contract wins through the period and their minimum annual revenue contribution in future reporting periods
ACV achieved due to contracting with a record number of new customers during the period and increase in the annual contribution that these customers will provide once fully implemented
Above target – 177%
Individual targets (25%) Individual targets chosen to measure KMP against metrics that they can control
Individual performance will be measured as a bell curve against each KMP
At target – 100% Accrued in the financial statements at 100% based on best estimates of the Board prior to finalisation
The table below outlines the FY21 STI outcomes for each KMP:
Executive KMP Target STI as % of TFR
Maximum STI as % of TFR
Actual STI awarded ($)
% of target STI opportunity awarded
% of maximum STI opportunity awarded
% of maximum STI forfeited
Danny Tauber 15% 30% $70,184 134% 67% 33%
Malte Westerhoff 30% 60% $232,094 134% 67% 33%
Brad Levin 27.5% 55% $108,373 134% 67% 33%
Sean Lambright6 N/A N/A $1,143,432 N/A N/A N/A
Key Performance Indicators
EBIT hurdles for FY2021 STI have been set at threshold, target and outperformance with target set at 36% increase on the prior year EBIT, with payout at target of 100%. Annual contract value targets were also set within a range of threshold, target and overperformance to encourage budget overachievement, with target limits stretched to align to shareholders interests.
Long Term Incentive (LTI) Performance Rights
Under the LTI plan Senior Executives of the Group are offered performance rights over the ordinary shares of Pro Medicus Limited. The performance rights, issued for nil consideration, are offered on a year to year basis and vest 4 years after grant date on completion of service, with a 3 year performance period. This long term incentive plan includes performance hurdles related to profitability - Earnings per Share (EPS) growth (60%) which is set on an annualised basis by the Board and Total Shareholder Returns (TSR) growth (40%). The Company’s TSR growth performance hurdle is measured relative to the ASX300 Index (FY2018 and FY2019) and measured relative to the ASX200 Index in FY2020 and FY2021 and assessed by the Board at the end of the performance period in accordance with the terms of the plan. These measures have been selected and set to align to Company performance and shareholder value. The fair value of the equity-settled performance rights is estimated using Black Sholes and Monte Carlo Simulation Models at grant date taking into account the terms and conditions upon which the performance
6 Sean Lambright as Head of Sales is paid sales commission under a separate agreement to the STI structure, based on total contract
value (TCV) and annual revenue received metrics, capped at 2% per customer. There is no maximum amount payable within a year under this separate agreement.

Directors’ Report continued
15
rights were granted. For further details of valuation of options, models and assumptions used please refer to Note 19 of the financial statements. Outcomes Performance under the FY19 grant was tested at 30 June 2021 resulting in the following vesting outcomes which remain conditional on continued employment through to 30 June 2022:
Hurdle Target Outcome
EPS 35% CAGR for reporting period (FY19-FY21)
Achieved 35% CAGR and therefore at target – 50% retained. Target set at 50%
TSR 60% growth over the ASX 300 Accumulation index for performance period (FY19-FY21)
Achieved 632% and therefore outperformance – 100%. Target set at 50%.
The FY18 grant, for which performance hurdles were tested at 30 June 2020, vested on 30 June 2021. As previously disclosed the vesting outcomes under the FY18 plan were as follows:
Hurdle Target Outcome
EPS 40% CAGR for reporting period (FY18-FY20)
Achieved 36% CAGR and therefore between lower threshold and target – 22% retained. Target set at 50%
TSR 60% growth over the ASX 300 Accumulation index for performance period (FY18-FY20)
Achieved 397% and therefore outperformance – 100%. Target set at 50%.
FY21 Grants
EPS hurdles for FY2021 LTI have been set at threshold, target and outperformance with target set at 35% compounded annual growth rate for three consecutive performance periods FY21-FY23, with payout at target of 50%. TSR targets were also set within a range of threshold, target and overperformance to encourage growth over and above ASX200 index returns, with target limits set at 60% growth over the ASX 200 index over the three-year performance period (FY21-FY23) to align to shareholders interests. TSR targets are set at 50% payout, with outperformance achieved at 100%. The table below outlines the number and value of performance rights granted to each KMP during the year as part of remuneration. These rights were granted on 17 September 2020 and will vest in four years time on 30 June 2024 subject to the achievement of the performance hurdles outlined above and the KMP remaining employed by the Company:
Name Number of EPS performance
rights (1)
Number of TSR performance rights
Total number of performance
rights
Fair value of rights on grant date (1)
$
Danny Tauber 3,370 2,246 5,616 89,387
Malte Westerhoff 11,293 7,528 18,821 300,797
Brad Levin 2,905 1,936 4,841 77,369
Sean Lambright 2,245 1,496 3,741 59,789
Total 19,813 13,206 33,019 527,342
(1) Calculated based on a fair value per performance right of:
Grant date EPS hurdle $
TSR hurdle $
17 September 2020 24.45 3.28
The fair value per performance right was calculated as at the grant date identified above. The valuation of the TSR performance rights incorporates the probability of achieving market conditions whereas the valuation of EPS performance rights does not. This results in a lower fair value of TSR performance rights than for EPS performance rights. Further details on assumptions used to determine fair value of the performance rights and the accounting expense relation to the performance rights are included in Note 19. The minimum total value of the grant to Executive KMP is nil should none of the applicable performance conditions be met. Share options
Un-issued Shares
As at the date of this report, there were 599,408 un-issued ordinary shares in the form of performance rights. Refer to Note 19 of the financial statements for further details of the performance rights outstanding.
Rights holders do not have any right, by virtue of the right, to participate in any share issue of the Company.

Directors’ Report continued
16
Shares Issued as a Result of the Exercise of Performance Rights During the financial year, 122,904 performance rights were exercised by current employees and 13,543 performance rights expired. A further 141,838 performance rights were exercised by key management personnel in the current year to acquire fully paid ordinary shares in Pro Medicus Limited.
Employment Contracts
Executive Directors
Executive Service Contracts, on similar terms and conditions, have been prepared for all Executive Directors of the Company. These agreements provide the following major terms:
• Each Executive will receive a remuneration package per annum which is to be reviewed annually;
• The agreements protect the Company and Group’s confidential information and provide that any inventions or discoveries of an Executive become the property of the Group;
• Non-competition during employment and for a period of 12 months thereafter; and
• Termination by the Company on six months’ notice or payment of six months remuneration in lieu of notice or a combination of both (or without notice or payment in lieu in the event of misconduct or other specified circumstances). The agreements may be terminated by the Executives on the giving of six months’ notice.
Executives (excluding Executive Directors)
All Executives have rolling contracts. The Group may terminate the Executive’s employment agreement by providing six months written notice or providing payment in lieu of the notice period (based on the fixed component of the Executive’s remuneration). The Group may terminate the contract at any time without notice if serious misconduct has occurred. Where termination with cause occurs the Executive is only entitled to that portion of remuneration that is fixed, and only up to the date of termination. On termination with cause any unvested options will immediately be forfeited.
Table 1: Statutory remuneration for executive KMP
Short-Term Post-
Employment
Long Term Share
Based Payment
Salary and Wages
Cash Bonus
Non-
Monetary benefits
Superannuation
Long Service Leave
Performance rights
Total $ $ $ $ $ $ $
Sam Hupert 2021 475,000 - - 25,000 7,917 - 507,917 2020 475,000 - - 25,000 7,938 - 507,938
Anthony Hall 2021 350,000 - - 25,000 (11,219) - 363,781 2020 350,000 - - 25,000 (60,036) - 314,964
Danny Tauber 2021 329,469 74,122 - 25,000 5,491 47,314 481,396 2020 325,000 13,125 - 25,000 5,506 17,592 386,223
Malte Westerhoff 2021 536,9651 230,396 19,861 2,799 - 152,367 942,388
2020 554,265 81,812 20,500 2,889 - 59,544 719,010
Brad Levin 2021 294,7872 113,439 - - - 41,748 449,974
2020 328,185 19,178 - - - 40,869 388,232
Sean Lambright 2021 227,7903 1,143,432
4 - - - 32,260 1,403,482
2020 253,598 774,047 - - - (6,131) 1,021,514
1 Malte Westerhoff was paid the equivalent fixed remuneration in FY21 as FY20 (€336,120) but the conversion
to AUD was at 0.626 compared to 0.606 in FY20 (using the average FX rates for the period). 2 Brad Levin was paid the equivalent fixed remuneration in FY21 as FY20 (U$220,000) but the conversion to
AUD was at 0.746 compared to 0.670 in FY20 (using the average FX rates for the period). 3 Sean Lambright was paid the equivalent fixed remuneration in FY21 as FY20 (U$170,000) but the conversion
to AUD was at 0.746 compared to 0.670 in FY20 (using the average FX rates for the period). 4 Sean Lambright was paid sales commission under a separate agreement to the STI structure, based on total
contract value (TCV) and annual revenue received metrics, capped at 2% per customer.

Directors’ Report continued
17
Table 2: Shareholdings of Executive Key Management Personnel
Ordinary shares held in Pro Medicus Limited (Number)
Balance at 1 July 2020
On exercise of performance
rights
Net change other Balance at 30 June 2021
30 June 2021 Ordinary Ordinary Ordinary Ordinary
S A Hupert 28,137,660 - (1,000,000) 1 27,137,660
A B Hall 28,109,000 - (1,000,000) 2 27,109,000
D Tauber 380,915 26,800 (128,389) 3 279,326
M Westerhoff 97,681 77,538 (39,000) 4 136,219
B Levin 59,114 37,500 (21,300) 5 75,314
S Lambright 179,910 - (8,530) 6 171,380
Total 56,964,280 141,838 (2,197,219) 54,908,899
1Sam Hupert sold 1,000,000 shares throughout the year at the prevailing market share price.
2Anthony Hall sold 1,000,000 shares throughout the year at the prevailing market share price.
3Danny Tauber sold 128,389 shares throughout the year at the prevailing market share price.
4 Malte Westerhoff sold 39,000 shares throughout the year at the prevailing market share price.
5Brad Levin sold 21,300 shares throughout the year at the prevailing market share price.
6Sean Lambright sold 8,530 shares throughout the year at the prevailing market share price.
Table 3: Performance rights of Executive Key Management Personnel
Performance rights held in Pro Medicus Limited (Number)
Balance at
1 July 2020
Granted as remuneration
Performance rights
exercised1
Performance rights
forfeited*
Balance at 30 June 2021
Not yet vested
Vested and exercisable
at 30
June 2021
30 June 2021
S A Hupert - - - - - - -
A B Hall - - - - - - -
D Tauber 74,609 5,616 (26,800) (12,868) 40,557 (40,557) -
M Westerhoff 216,493 18,821 (77,538) (36,117) 121,659 (121,659) -
B Levin 79,381 4,841 (37,500) (10,974) 35,748 (35,748) -
S Lambright 32,362 3,741 - (8,481) 27,622 (27,622) -
Total 402,845 33,019 (141,838) (68,440) 225,586 (225,586) -
*Performance rights forfeited due to performance hurdles not being met for the period.
1 Performance rights vested on 31 August 2020 at a value of $25.95 per right.
Non-Executive Director Remuneration
Structure
The Constitution and the ASX Listing Rules specify that the aggregate remuneration of Non-Executive Directors shall be determined from time to time by a general meeting. An amount not exceeding the amount determined is then divided between the Non-Executive Directors as agreed. The latest determination was at the Annual General Meeting held on 25 November 2020 when shareholders approved an aggregate remuneration of $1,000,000 per year. The amount of the aggregate remuneration sought to be approved by shareholders and the manner in which it is apportioned amongst Non-Executive Directors is reviewed annually. The Board considers fees paid to Non-Executive Directors of comparable companies when undertaking the annual review process. Each Non-Executive Director receives a fee for being a Director of the Company. No additional fee was paid to the Chair of the People and Culture Committee during the reporting period and no additional fees were paid for time spent on Committees.
Directors’ Report continued
18
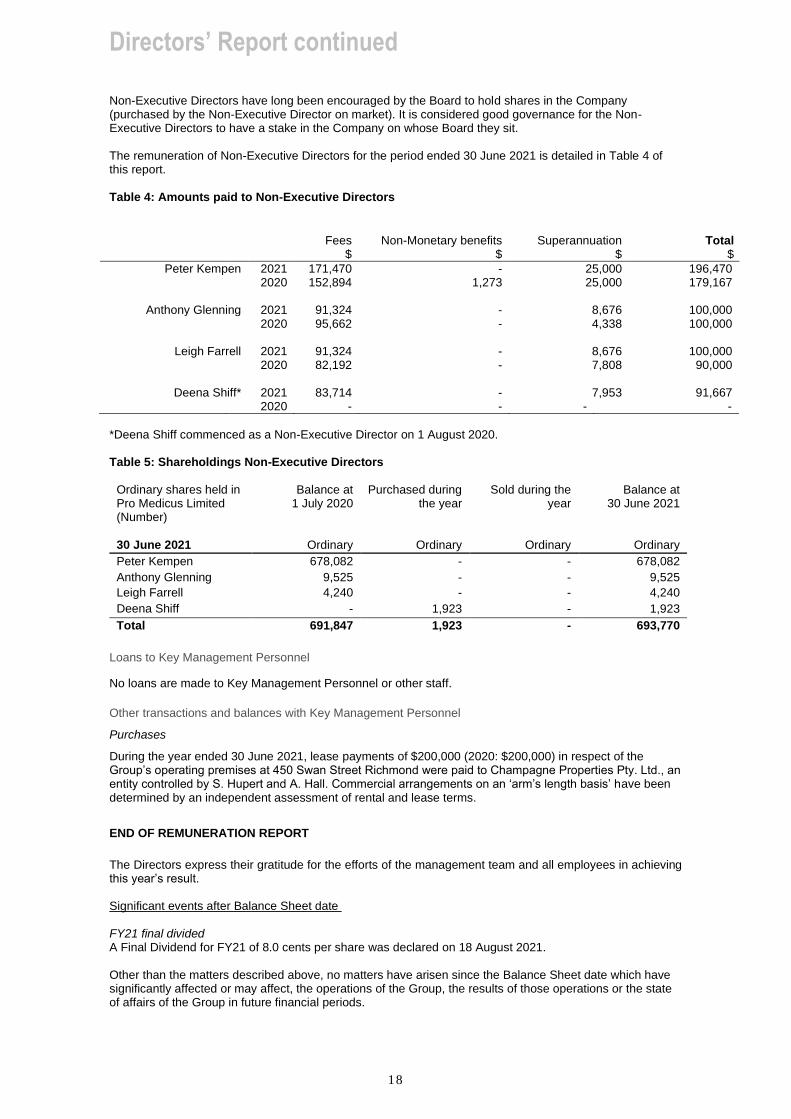
Non-Executive Directors have long been encouraged by the Board to hold shares in the Company (purchased by the Non-Executive Director on market). It is considered good governance for the Non-Executive Directors to have a stake in the Company on whose Board they sit. The remuneration of Non-Executive Directors for the period ended 30 June 2021 is detailed in Table 4 of this report. Table 4: Amounts paid to Non-Executive Directors
Fees Non-Monetary benefits Superannuation Total $ $ $ $
Peter Kempen 2021 171,470 - 25,000 196,470 2020 152,894 1,273 25,000 179,167
Anthony Glenning 2021 91,324 - 8,676 100,000 2020 95,662 - 4,338 100,000
Leigh Farrell 2021 91,324 - 8,676 100,000 2020 82,192 - 7,808 90,000
Deena Shiff* 2021 83,714 - 7,953 91,667 2020 - - - -
*Deena Shiff commenced as a Non-Executive Director on 1 August 2020. Table 5: Shareholdings Non-Executive Directors
Ordinary shares held in Pro Medicus Limited (Number)
Balance at 1 July 2020
Purchased during the year
Sold during the year
Balance at 30 June 2021
30 June 2021 Ordinary Ordinary Ordinary Ordinary
Peter Kempen 678,082 - - 678,082
Anthony Glenning 9,525 - - 9,525
Leigh Farrell 4,240 - - 4,240
Deena Shiff - 1,923 - 1,923
Total 691,847 1,923 - 693,770
Loans to Key Management Personnel
No loans are made to Key Management Personnel or other staff.
Other transactions and balances with Key Management Personnel
Purchases
During the year ended 30 June 2021, lease payments of $200,000 (2020: $200,000) in respect of the Group’s operating premises at 450 Swan Street Richmond were paid to Champagne Properties Pty. Ltd., an entity controlled by S. Hupert and A. Hall. Commercial arrangements on an ‘arm’s length basis’ have been determined by an independent assessment of rental and lease terms.
END OF REMUNERATION REPORT
The Directors express their gratitude for the efforts of the management team and all employees in achieving this year’s result. Significant events after Balance Sheet date FY21 final divided A Final Dividend for FY21 of 8.0 cents per share was declared on 18 August 2021. Other than the matters described above, no matters have arisen since the Balance Sheet date which have significantly affected or may affect, the operations of the Group, the results of those operations or the state of affairs of the Group in future financial periods.

Directors’ Report continued
19
Signed in accordance with a resolution of the Directors.
P T Kempen
Director
Melbourne, 18 August 2021

A member firm of Ernst & Young Global Limited Liability limited by a scheme approved under Professional Standards Legislation
Ernst & Young 8 Exhibition Street Melbourne VIC 3000 Australia GPO Box 67 Melbourne VIC 3001
Tel: +61 3 9288 8000 Fax: +61 3 8650 7777 ey.com/au
Auditor’s independence declaration to the directors of Pro Medicus Limited
As lead auditor for the audit of the financial report of Pro Medicus Limited for the financial year ended 30 June 2021, I declare to the best of my knowledge and belief, there have been:
a. No contraventions of the auditor independence requirements of the Corporations Act 2001 in relation to the audit; and
b. No contraventions of any applicable code of professional conduct in relation to the audit.
This declaration is in respect of Pro Medicus Limited and the entities it controlled during the financial year.
Ernst & Young
Tony Morse Partner 18 August 2021

Consolidated Statement of Comprehensive Income
21
Consolidated
FOR THE YEAR ENDED 30 JUNE 2021 Notes 2021 2020
$’000 $’000
Revenue from contracts with customers 5 67,884 56,821
Interest income 180 172
Total revenue and income 68,064 56,993
Cost of sales (490) (355)
Gross profit 67,574 56,638
Net foreign currency gains/(losses) 6(a) 240 (218)
Fair value movements on other financial assets 73 -
Accounting and secretarial expenses (1,127) (1,069)
Advertising and public relations expenses (321) (1,494)
Depreciation and amortisation 6(b) (7,199) (7,683)
Insurance costs (841) (772)
Legal costs (856) (702)
Other expenses (1,061) (857)
Employee benefits expenses 6(b) (13,534) (12,853)
Travel and accommodation expenses (76) (970)
Profit before income tax 42,872 30,020
Income tax expense 7 (12,022) (6,944)
Profit for the year 18 30,850 23,076
Other comprehensive income
Items that may be reclassified subsequently to profit and loss
Foreign currency translation 1,051 (308)
Other comprehensive income for the year 1,051 (308)
TOTAL COMPREHENSIVE INCOME FOR THE YEAR, NET OF TAX
31,901 22,768
Earnings per share (cents per share) 8
- Basic earnings per share 29.6¢ 22.2¢
- Diluted earnings per share 29.5¢ 22.1¢
This Consolidated Statement of Comprehensive Income should be read in conjunction with the notes to the financial statements.

Consolidated Statement of Financial Position
22
Consolidated
AS AT 30 JUNE 2021 Notes 2021 2020
$’000 $’000
ASSETS
Current Assets
Cash and cash equivalents 10 42,039 43,413
Trade and other receivables 11 22,841 14,500
Accrued revenue 1,193 125
Contract costs 5 375 245
Other financial assets 12 19,777 45
Income tax receivable - 2,139
Inventories 34 35
Prepayments 1,307 981
Total Current Assets 87,566 61,483
Non-Current Assets
Deferred tax assets 7 13,600 11,482
Plant and equipment 13 490 622
Contract costs 5 1,355 756
Right-of-use assets 20 2,524 2,226
Intangible assets 14 20,009 18,839
Prepayments 30 237
Total Non-Current Assets 38,008 34,162
TOTAL ASSETS 125,574 95,645
LIABILITIES
Current Liabilities
Trade and other payables 15 3,725 2,637
Income tax payable 1,696 -
Deferred revenue 16 8,886 7,225
Other current financial liabilities 28 70 -
Lease liabilities 20 574 522
Provisions 17 2,668 2,332
Total Current Liabilities 17,619 12,716
Non-Current Liabilities
Deferred tax liabilities 7 7,162 6,518
Deferred revenue 16 17,011 14,422
Lease liabilities 20 2,044 1,754
Provisions 17 55 52
Total Non-Current Liabilities 26,272 22,746
TOTAL LIABILITIES 43,891 35,462
NET ASSETS 81,683 60,183
EQUITY
Contributed equity 18 1,962 1,962
Share buyback reserve (915) (915)
Share reserve 18 13,322 10,175
Foreign currency translation reserve 18 392 (659)
Retained earnings 18 66,922 49,620
TOTAL EQUITY 81,683 60,183
This Consolidated Statement of Financial Position should be read in conjunction with the notes to the financial statements.

Consolidated Statement of Changes in Equity
23
FOR THE YEAR ENDED 30 JUNE 2021
Consolidated
Issued Capital
Share Buyback Reserve
Share Reserve
Foreign Currency
Translation Reserve
Retained Earnings
Total Equity
$’000 $’000 $’000 $’000 $’000 $’000
At 1 July 2019 1,962 (73) 10,290 (351) 37,460 49,288
Profit for the year - - - - 23,076 23,076
Other comprehensive income - - - (308) - (308)
Total comprehensive income for the period - - - (308) 23,076 22,768
Transaction with owners in their capacity as owners
Share based payment - - 647 - - 647
Tax effect of share based payments - - (762) - - (762)
Share buyback - (842) - - - (842)
Dividends - - - - (10,916) (10,916)
At 30 June 2020 1,962 (915) 10,175 (659) 49,620 60,183
At 1 July 2020
1,962
(915)
10,175
(659)
49,620
60,183
Profit for the year - - - - 30,850 30,850
Other comprehensive income - - - 1,051 - 1,051
Total comprehensive income for the period - - - 1,051 30,850 31,901
Transaction with owners in their capacity as owners
Share based payment - - 677 - - 677
Tax effect of share based payments - - 2,470 - - 2,470
Dividends - - - - (13,548) (13,548)
At 30 June 2021 1,962 (915) 13,322 392 66,922 81,683
This Consolidated Statement of Changes in Equity should be read in conjunction with the notes to the financial statements.

Consolidated Statement of Cash Flows
24
Consolidated
FOR THE YEAR ENDED 30 JUNE 2021 2021 2020
Notes $’000 $’000
Cash flows from operating activities
Receipts from customers 63,080 60,629
Payments to suppliers and employees (16,935) (19,917)
Interest paid (114) (118)
Income tax paid (7,191) (9,174)
Net cash flows from operating activities 10 38,840 31,420
Cash flows from investing activities
Payments for capitalised development costs 14 (7,566) (7,508)
Interest received 180 172
Investments in other financial assets (19,704) -
Payments for plant and equipment 13 (127) (363)
Net cash flows used in investing activities (27,217) (7,699)
Cash flows from financing activities
Payments of dividends on ordinary shares 9 (13,548) (10,916)
Payments for lease liabilities (501) (557)
Payments for share buyback - (842)
Net cash flows used in financing activities (14,049) (12,315)
Net (decrease)/increase in cash and cash equivalents
(2,426) 11,406
Net foreign exchange differences 1,052 (308)
Cash and cash equivalents at beginning of period 43,413 32,315
Cash and cash equivalents at end of period 10 42,039 43,413
This Consolidated Statement of Cash Flows should be read in conjunction with the notes to the financial statements

Notes to the Financial Statements FOR THE YEAR ENDED 30 JUNE 2021
25
1. CORPORATE INFORMATION
The financial report of Pro Medicus Limited (the Company) for the year ended 30 June 2021 was authorised for issue in accordance with a resolution of Directors on 18 August 2021. The Directors have the power to amend and reissue the financial report. Pro Medicus Limited is a for profit company limited by shares incorporated in Australia whose shares are publicly traded on the Australian Securities Exchange. The nature of the operations and principal activities of the Group are described in the Directors’ Report.
2. SUMMARY OF SIGNIFICANT ACCOUNTING POLICIES
(a) Basis of preparation
The financial report is a general-purpose financial report, which has been prepared in accordance with the requirements of the Corporations Act 2001, Australian Accounting Standards and other authoritative pronouncements of the Australian Accounting Standards board. The financial report has also been prepared on a historical cost basis except for certain financial instruments which have been recognised at fair value. The financial report is presented in Australian dollars and all values are rounded to the nearest thousand dollars ($000) unless otherwise stated in accordance with ASIC Legislative Instrument 2016/191. (b) Statement of compliance with IFRS
The financial report complies with Australian Accounting Standards and International Financial Reporting Standards (IFRS) as issued by the International Accounting Standards Board.
(c) Basis of consolidation
The consolidated financial statements comprise the financial statements of Pro Medicus Limited and its subsidiaries (the Group). Control is achieved when the Group is exposed, or has rights, to variable returns from its involvement with the investee and has the ability to affect those returns through its power over the investee. Specifically, the Group controls an investee if and only if the Group has:
• Power over the investee (i.e. existing rights that give it the current ability to direct the relevant activities of the investee)
• Exposure, or rights, to variable returns from its involvement with the investee, and
• The ability to use its power over the investee to affect its returns. When the Group has less than a majority of the voting or similar rights of an investee, the Group considers all relevant facts and circumstances in assessing whether it has power over an investee, including:
• The contractual arrangement with the other vote holders of the investee
• Rights arising from other contractual arrangements
• The Group’s voting rights and potential voting rights The Group re-assesses whether or not it controls an investee if facts and circumstances indicate that there are changes to one or more of the three elements of control. Consolidation of a subsidiary begins when the Group obtains a control over the subsidiary and ceases when the Group loses control of the subsidiary. Assets, liabilities, income and expenses of a subsidiary acquired or disposed of during the year are included in the statement of comprehensive income from the date the Group gains control until the date the Group ceases to control the subsidiary. All intra-group assets and liabilities, equity, income, expenses and cash flows relating to transactions between members of the Group are eliminated in full on consolidation.
(d) New accounting standards and interpretations
New and/or amended standards that were effective for the Group as of 1 July 2020 did not have a material impact on the financial statements of the Group as they are either not relevant to the Group’s activities or require accounting which is consistent with the Group's current accounting policies.
3. SIGNIFICANT ACCOUNTING JUDGEMENTS, ESTIMATES AND ASSUMPTIONS
The preparation of the financial statements requires management to make judgements, estimates and assumptions that affect the reported amounts in the financial statements. Management continually evaluates its judgements and estimates in relation to assets, liabilities, contingent liabilities, revenue and expenses. Management bases its judgements and estimates on historical experience and on other various factors it believes to be reasonable under the circumstances, the result of which form the basis of the carrying values of assets and

Notes to the Financial Statements FOR THE YEAR ENDED 30 JUNE 2021
26
3. SIGNIFICANT ACCOUNTING JUDGEMENTS, ESTIMATES AND ASSUMPTIONS (cont’d) liabilities that are not readily apparent from other sources. Actual results may differ from these estimates under different assumptions and conditions. Management has identified the following critical accounting policies for which significant judgements, estimates and assumptions are made. Actual results may differ from these estimates under different assumptions and conditions and may materially affect financial results or the financial position reported in future periods. Further details of the nature of these assumptions and conditions may be found in the relevant notes to the financial statements.
(i) Significant accounting judgements, estimates and assumptions
Capitalisation of development costs:
Distinguishing between the research and development phases and determining whether the recognition requirements for the capitalisation of development costs as discussed in Note 14 are met requires judgement. After capitalisation, management monitors whether the recognition requirements continue to be met and whether
there are any indicators that capitalised costs may be impaired.
Development costs include employee labour costs and other directly attributable costs including amounts of overhead and administrative expenditure to the extent these amounts are incurred in connection with the related employee labour.
Impairment of non-financial assets:
The Group assesses impairment of all assets at each reporting date by evaluating conditions specific to the Group and to the particular asset that may lead to impairment. If an impairment trigger exists, the recoverable amount of the asset is determined. Additionally, goodwill, indefinite life intangible assets and intangible assets not yet ready for use are tested annually. Management has tested certain assets for impairment in this financial period. Refer to Note 14 of the financial statements for significant assumptions applied in assessing for impairment on non-financial assets.
Deferred tax:
The Group's accounting policy for taxation requires management's judgement as to the types of arrangements considered to be a tax on income in contrast to an operating cost. Judgement is also required in assessing whether deferred tax assets and certain deferred tax liabilities are recognised on the statement of financial position. Deferred tax assets, including those arising from un-recouped tax losses, capital losses and temporary differences, are recognised only where it is considered more likely than not that they will be recovered, which is dependent on the generation of sufficient future taxable profits. Deferred tax liabilities arising from temporary differences in investments in subsidiaries, caused principally by retained earnings held in foreign tax jurisdictions, are recognised unless repatriation of retained earnings can be controlled and are not expected to occur in the foreseeable future. Assumptions about the generation of future taxable profits and repatriation of retained earnings depend on management's estimates of future cash flows. These depend on estimates of future sales volumes, operating costs, capital expenditure, dividends and other capital management transactions. Judgements are also required about the application of income tax legislation. These judgements and assumptions are subject to risk and uncertainty, hence there is a possibility that changes in circumstances will alter expectations, which may impact the amount of deferred tax assets and deferred tax liabilities recognised on the statement of financial position and the amount of other tax losses and temporary differences not yet recognised. In such circumstances, some or all of the carrying amounts of recognised deferred tax assets and liabilities may require adjustment, resulting in a corresponding credit or charge to the statement of comprehensive income. Deferred tax assets are recognised for deductible temporary differences as management considers that it is probable that future taxable profits will be available to utilise those temporary differences.
Income taxes:
The group is subject to income taxes in Australia and jurisdictions where it has foreign operations. Significant judgement is required in determining the worldwide provision for income taxes. There are many transactions and calculations during the ordinary course of business for which the ultimate tax determination is uncertain. The Group recognises liabilities for anticipated tax audit issues based on estimates of whether additional taxes will be due. Where the final tax outcome of these matters is different from the amounts that were initially recorded, such differences will impact the current and deferred tax provisions in the period in which such determination is made.
Net investment in foreign operations:
The Group maintains inter-company loans it assesses to represent a part of its net investment in its foreign operations. The judgements made in assessing these loans to represent net investments are on the basis the loans are neither planned nor likely to be settled within the foreseeable future, the loans do not include trade receivables or trade payable and the loans represent a return of funds from their investment in the respective subsidiaries.

Notes to the Financial Statements FOR THE YEAR ENDED 30 JUNE 2021
27
3. SIGNIFICANT ACCOUNTING JUDGEMENTS, ESTIMATES AND ASSUMPTIONS (cont’d)
Share-based payments:
The Group measures the cost of equity-settled transactions with employees by reference to the fair value of equity instruments at the date at which they are granted. Estimating fair value for share-based payment transactions requires determination of the most appropriate valuation model, which is dependent on the terms and conditions of the grant. This estimate also requires determination of the most appropriate inputs to the valuation model including the expected life of the share option/performance rights, volatility and dividend yield and making assumptions about them. The assumptions and models used for estimating fair value of share-based payment transactions are disclosed in Note 19.
Revenue recognition:
Refer to Note 5 for significant judgements with respect to revenue recognition.
4. OPERATING SEGMENTS
The Group has identified its operating segments based on the internal reports that are reviewed and used by the executive management team (the chief operating decision maker) in assessing performance and in determining the allocation of resources. The operating segments are identified by management based on country of origin. Discrete financial information is reported to the executive management team on at least a monthly basis.
Types of products and services
The Group produces integrated software applications for the health care industry. In addition, the Group provides services in the form of installation and support.
Accounting policies and inter-segment transactions
An operating segment is a component of an entity that engages in business activities from which it may earn revenues and incur expenses (including revenues and expenses relating to transactions with other components of the same entity), whose operating results are regularly reviewed by the entity's chief operating decision maker to make decisions about resources to be allocated to the segment and assess its performance and for which discrete financial information is available. This includes start-up operations which are yet to earn revenues. Management will also consider other factors in determining operating segments such as the existence of a line manager and the level of segment information presented to the Board of Directors. Operating segments have been identified based on the information provided to the chief operating decision makers – being the executive management team.

Notes to the Financial Statements FOR THE YEAR ENDED 30 JUNE 2021
28
4. OPERATING SEGMENTS (cont’d)
The Group aggregates two or more operating segments when they have similar economic characteristics and the segments are similar in each of the following respects:
• Nature of the products and services
• Type or class of customer for the products and services
• Nature of the regulatory environment Operating segments that meet the quantitative criteria as prescribed by AASB 8 are reported separately. However, an operating segment that does not meet the quantitative criteria is still reported separately where information about the segment would be useful to users of the financial statements. Inter-entity sales are recognised based on an internally set transfer price. The price aims to reflect what the business operation could achieve if they sold their output and services to external parties at arm’s length.
Operating segments Australia Europe North America Total Operations
2021 2020 2021 2020 2021 2020 2021 2020 Revenue $’000 $’000 $’000 $’000 $’000 $’000 $’000 $’000
Sales to external customers – software
13,505 10,945 4,155 3,306 50,224 42,570 67,884 56,821
Inter-segment sales 44,592 36,619 9,684 11,003 - - 54,276 47,622
Total segment revenue 58,097 47,564 13,839 14,309 50,224 42,570 122,160 104,443
Inter-segment elimination (54,276) (47,622)
Total consolidated revenue 67,884 56,821
Results Segment result 38,081 28,321 3,302 423 1,309 1,104 42,692 29,848
Interest revenue 180 172 Non-segment expenses Income tax expense (12,022) (6,944)
Net profit 30,850 23,076
Assets Non-current assets 25,944 24,845 173 210 870 266 26,987 25,321 Deferred tax asset 8,786 7,219 - - 4,814 4,263 13,600 11,482 Current assets 72,502 56,008 18,929 16,338 27,213 17,325 118,644 89,671
Segment assets 107,232 88,072 19,102 16,548 32,897 21,854 159,231 126,474
Inter-segment elimination (33,657) (30,829)
Total assets 125,574 95,645
Liabilities Segment liabilities 33,382 30,107 2,933 2,218 42,325 31,914 78,640 64,239
Inter-segment elimination (34,749) (28,777)
Total liabilities 43,891 35,462
Other segment information Capital expenditure 7,594 7,545 53 169 45 157 7,692 7,871 Depreciation and amortisation 6,635 7,080 292 295 272 308 7,199 7,683
Cash flow information
Net cash flow from operating activities 8,434 1,110 (802) (5,274) 31,208 35,461 38,840 31,297 Net cash flow from investing activities (27,118) (7,374) (54) (169) (45) (156) (27,217) (7,699) Net cash flow from financing activities (13,095) (11,811) (42) (167) (912) (214) (14,049) (12,192)

Notes to the Financial Statements FOR THE YEAR ENDED 30 JUNE 2021
29
5. REVENUE FROM CONTRACTS WITH CUSTOMERS
The Group’s contracts with customers comprise multiple goods and services, typically with specific fixed or variable consideration receivable, including:
• Installation and professional services;
• Product licences;
• Transactional services, including image viewing and image archiving;
• Support services, including updates and upgrades to the product licence and
• Archive data migration services The Group’s contracts with customers also comprise of multiple activities in order to provide customers with the specified product. The nature of the Group’s products requires significant integration of various goods and services promised in contracts that represent a combined output – being the offered product. The multiple goods or services in the contract are highly interrelated and are integral in combination to the performance of the product. The Group has determined that within its contracts with customers there is one performance obligation of delivering a specified product given:
• The Group provides a significant service of integrating the goods or services with other goods or services promised in the contract. The combined output – being the offered product – represents a bundle of the Group’s various goods or services;
• Goods or services (i.e. installation, product licence, transaction services and support services) are highly interrelated and integral to the performance of the product. The Group could not fulfil its performance obligation of delivering a specified product by transferring each of the goods or services independently; and
• Only the Group can provide product installation, transactional services and support (including significant updates/upgrades) services to customers of product licences, given the associated intellectual property of the product owned by the Group.
Revenue from multi-element contracts is recognised over the term of the contract, commencing when the product is ready for use following the installation and establishment of the product licence on the basis that:
• Product updates/upgrades received by the customer over the contract period are frequent and significant to the performance and compliance of the products with relevant regulatory authorities;
• Customers have no alternate use for the Group’s products outside of the contract period; and
• The Group has an enforceable right to payment for performance completed to date during the period of the contract.
Revenue is recognised by reference to the satisfaction of the one performance obligation using the input method. The input method is applied based on the elapsed term of the contract in comparison to the length of the total contract term from when the product is ready for use by the customer until the licence and support periods end. The Group receives consideration for certain elements of product contracts that is based on transaction volumes exceeding set minimum activity levels. Such variable consideration is recognised as revenue as the customer activity occurs over the term of the contract and the Group becomes entitled to payment. Directly attributable commissions paid to employees of the Group for obtaining contracts are initially capitalised as a contract cost and amortised within salaries and employee benefits expense over the life of the relevant contract as revenue is recognised. The carrying value of contract costs are assessed for impairment at each reporting date. The Group also provides archive migration services to its customers. These services are considered to be a separate performance obligation and are not highly interrelated with the other goods and services providing by the Group. Accordingly, revenue from archive migration services is recognised over time based on an input method based on the proportion of hours spent on migration services relative to the total expected hours.

Notes to the Financial Statements FOR THE YEAR ENDED 30 JUNE 2021
30
5. REVENUE FROM CONTRACTS WITH CUSTOMERS (cont’d)
Set out below is the disaggregation of the Group's revenue from contracts with customers:
Consolidated
Year ended 30 June 2021 ($’000)
Australia Europe North
America Total
Types of goods and services
Radiology Information System (RIS) 12,525 - - 12,525 Picture Archiving Communications System (Visage 7/Open Archive) 980 4,108 50,224 55,312 Other - 47 - 47
Total revenue per statement of comprehensive income 13,505 4,155 50,224 67,884
Timing of revenue recognition
Point in time - - - - Over time 13,505 4,155 50,224 67,884
Total revenue per statement of comprehensive income 13,505 4,155 50,224 67,884
Consolidated
Year ended 30 June 2020 ($’000)
Australia Europe North
America Total
Types of goods and services
Radiology Information System (RIS) 9,749 - - 9,749 Picture Archiving Communications System (Visage 7/Open Archive) 1,196 3,265 42,570 47,031 Other - 41 - 41
Total revenue per statement of comprehensive income 10,945 3,306 42,570 56,821
Timing of revenue recognition
Point in time - - - - Over time 10,945 3,306 42,570 56,821
Total revenue per statement of comprehensive income 10,945 3,306 42,570 56,821
Payments received in advance of the commencement of the term of the contract are initially deferred as contract liabilities (deferred revenue, refer to Note 16). Set out below is the amount of revenue from contracts with customers recognised from: Consolidated
2021 2020
$’000 $’000
Amounts included in deferred revenue 7,225 7,626 Set out below is the amount of salaries and employee benefits expense recognised from: Consolidated
2021 2020
$’000 $’000
Amounts capitalised as contract costs 245 210 Revenue from major customers Included in the North American segment is a customer that contributed to the total consolidated Group revenue by 10.9% (2020: 14.0%). No other customer contributed 10% or more to the Group’s revenue for the year ended 30 June 2021.
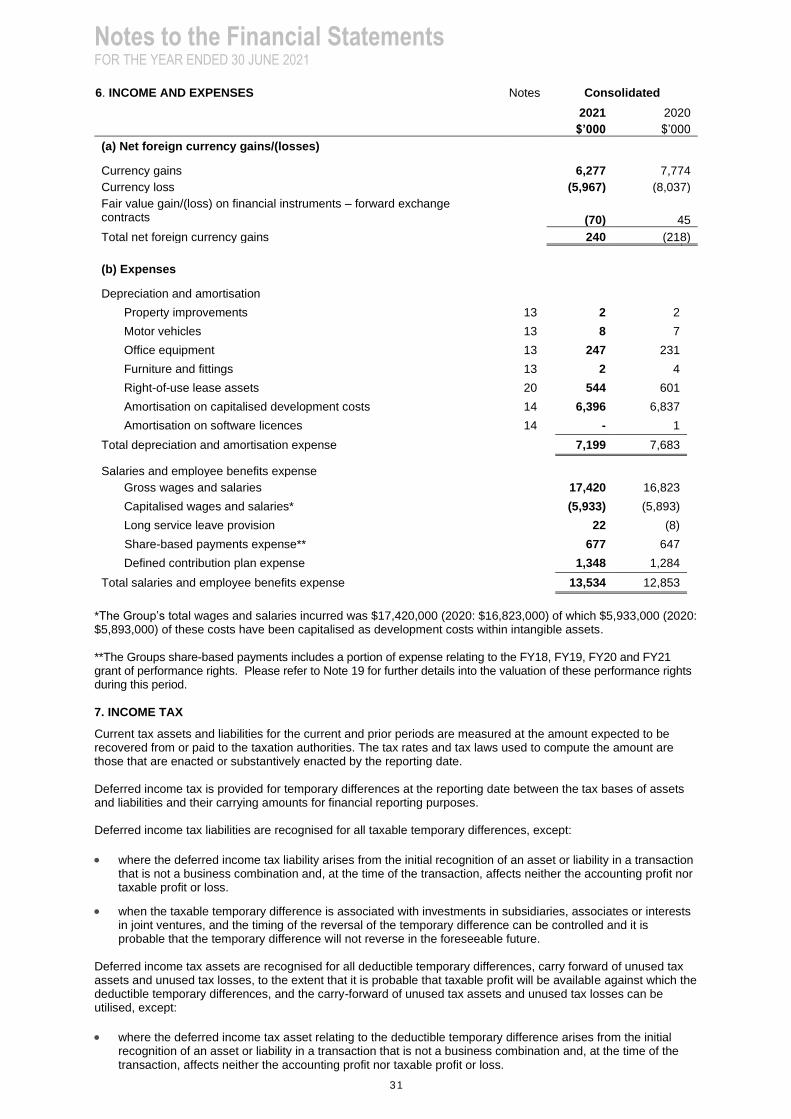
Notes to the Financial Statements FOR THE YEAR ENDED 30 JUNE 2021
31
6. INCOME AND EXPENSES Notes Consolidated
2021 2020
$’000 $’000
(a) Net foreign currency gains/(losses)
Currency gains 6,277 7,774
Currency loss (5,967) (8,037)
Fair value gain/(loss) on financial instruments – forward exchange contracts
(70)
45
Total net foreign currency gains 240 (218)
(b) Expenses
Depreciation and amortisation
Property improvements 13 2 2
Motor vehicles 13 8 7
Office equipment 13 247 231
Furniture and fittings 13 2 4
Right-of-use lease assets 20 544 601
Amortisation on capitalised development costs 14 6,396 6,837
Amortisation on software licences 14 - 1
Total depreciation and amortisation expense 7,199 7,683
Salaries and employee benefits expense
Gross wages and salaries 17,420 16,823
Capitalised wages and salaries* (5,933) (5,893)
Long service leave provision 22 (8)
Share-based payments expense** 677 647
Defined contribution plan expense 1,348 1,284
Total salaries and employee benefits expense 13,534 12,853
*The Group’s total wages and salaries incurred was $17,420,000 (2020: $16,823,000) of which $5,933,000 (2020: $5,893,000) of these costs have been capitalised as development costs within intangible assets. **The Groups share-based payments includes a portion of expense relating to the FY18, FY19, FY20 and FY21 grant of performance rights. Please refer to Note 19 for further details into the valuation of these performance rights during this period. 7. INCOME TAX
Current tax assets and liabilities for the current and prior periods are measured at the amount expected to be recovered from or paid to the taxation authorities. The tax rates and tax laws used to compute the amount are those that are enacted or substantively enacted by the reporting date. Deferred income tax is provided for temporary differences at the reporting date between the tax bases of assets and liabilities and their carrying amounts for financial reporting purposes. Deferred income tax liabilities are recognised for all taxable temporary differences, except:
• where the deferred income tax liability arises from the initial recognition of an asset or liability in a transaction that is not a business combination and, at the time of the transaction, affects neither the accounting profit nor taxable profit or loss.
• when the taxable temporary difference is associated with investments in subsidiaries, associates or interests in joint ventures, and the timing of the reversal of the temporary difference can be controlled and it is probable that the temporary difference will not reverse in the foreseeable future.
Deferred income tax assets are recognised for all deductible temporary differences, carry forward of unused tax assets and unused tax losses, to the extent that it is probable that taxable profit will be available against which the deductible temporary differences, and the carry-forward of unused tax assets and unused tax losses can be utilised, except:
• where the deferred income tax asset relating to the deductible temporary difference arises from the initial recognition of an asset or liability in a transaction that is not a business combination and, at the time of the transaction, affects neither the accounting profit nor taxable profit or loss.

Notes to the Financial Statements FOR THE YEAR ENDED 30 JUNE 2021
32
7. INCOME TAX (cont’d)
• when the deductible temporary difference is associated with investments in subsidiaries, associates or interests in joint ventures, in which case a deferred tax asset is only recognised to the extent that it is probable that the temporary difference will reverse in the foreseeable future and taxable profit will be available against which the temporary difference can be utilised.
The carrying amount of deferred income tax assets is reviewed at each reporting date and reduced to the extent that it is no longer probable that sufficient taxable profit will be available to allow all or part of the deferred income tax asset to be utilised. Unrecognised deferred income tax assets are reassessed at each reporting date and are recognised to the extent that it has become probable that future taxable profit will allow the deferred tax asset to be recovered. Deferred income tax assets and liabilities are measured at the tax rates that are expected to apply to the year when the asset is realised or the liability is settled, based on the tax rates (and tax laws) that have been enacted or substantively enacted at the reporting date. Income taxes relating to items recognised directly in equity are recognised in equity and not in the statement of comprehensive income. Unrecognised temporary differences
At 30 June 2021, the Group has not recognised deferred tax liabilities associated with the Group's investments in subsidiaries being recognised as the parent is able to control the timing of the reversal of any temporary differences and it is not probable any temporary difference will reverse in the foreseeable future (30 June 2020: nil). Tax consolidation legislation
Pro Medicus Limited and its wholly-owned Australian controlled entities implemented the tax consolidation legislation as of 1 July 2009. Members of the tax consolidated group have entered into a tax funding agreement. The head entity, Pro Medicus Limited, and the controlled entities in the tax consolidated group continue to account for their own current and deferred tax amounts under the tax funding agreement. The Group applies the Group allocation approach to determining the appropriate amount of current taxes and deferred taxes to allocate to members of the tax consolidated group. An allocation of income tax liabilities between the entities of the tax consolidated group will be made should the head entity default on its tax payment obligations. No such amounts have been recognised in the financial statements on the basis that the possibility of default is remote. In addition to its own current and deferred tax amounts, Pro Medicus Limited also recognises the current tax liabilities (or assets) and the deferred tax assets arising from unused tax losses and unused tax credits assumed from controlled entities in the tax consolidated group.
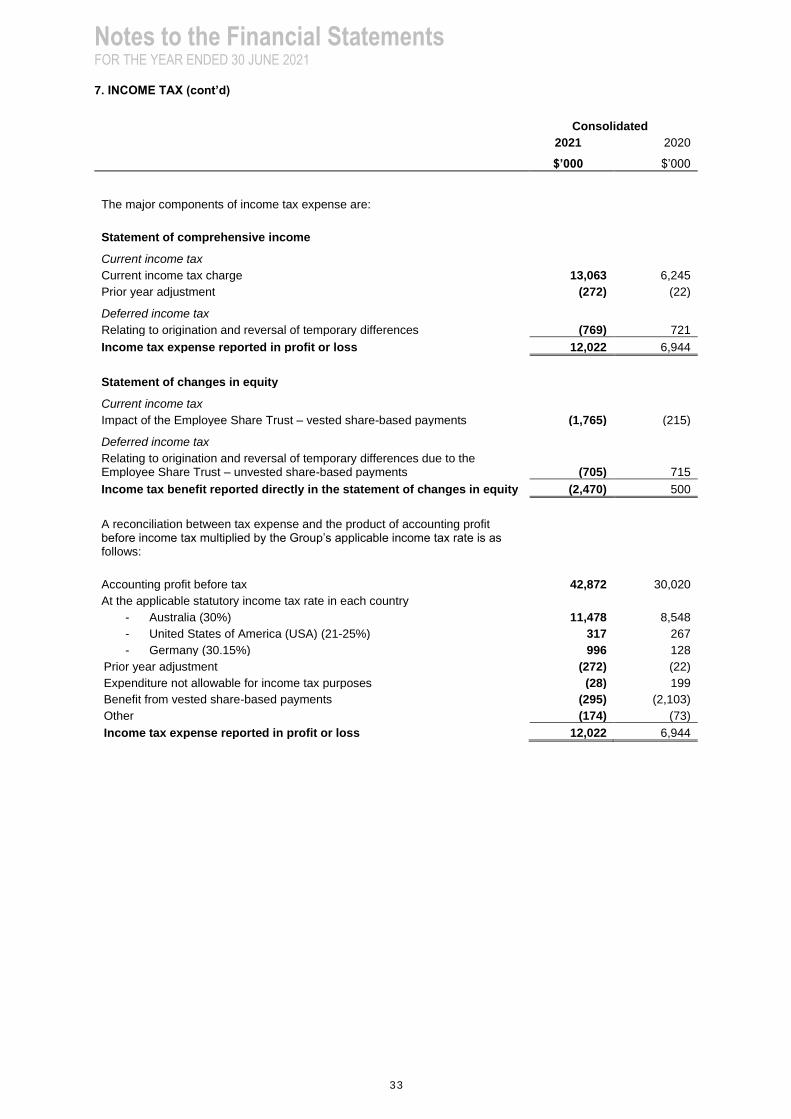
Notes to the Financial Statements FOR THE YEAR ENDED 30 JUNE 2021
33
7. INCOME TAX (cont’d)
Consolidated
2021 2020
$’000 $’000
The major components of income tax expense are:
Statement of comprehensive income
Current income tax
Current income tax charge 13,063 6,245
Prior year adjustment (272) (22)
Deferred income tax
Relating to origination and reversal of temporary differences (769) 721
Income tax expense reported in profit or loss 12,022 6,944
Statement of changes in equity
Current income tax
Impact of the Employee Share Trust – vested share-based payments (1,765) (215)
Deferred income tax
Relating to origination and reversal of temporary differences due to the Employee Share Trust – unvested share-based payments (705) 715
Income tax benefit reported directly in the statement of changes in equity (2,470) 500
A reconciliation between tax expense and the product of accounting profit before income tax multiplied by the Group’s applicable income tax rate is as follows:
Accounting profit before tax 42,872 30,020
At the applicable statutory income tax rate in each country
- Australia (30%) 11,478 8,548
- United States of America (USA) (21-25%) 317 267
- Germany (30.15%) 996 128
Prior year adjustment (272) (22)
Expenditure not allowable for income tax purposes (28) 199
Benefit from vested share-based payments (295) (2,103)
Other (174) (73)
Income tax expense reported in profit or loss 12,022 6,944

Notes to the Financial Statements FOR THE YEAR ENDED 30 JUNE 2021
34
7. INCOME TAX (cont’d)
Deferred income tax
Consolidated Statement of
Financial Position
Consolidated Statement of
Comprehensive Income
Recognised within Equity
Deferred income tax at 30 June relates to the following:
2021 2020 2021 2020 2021 2020
$’000 $’000 $’000 $’000 $’000 $’000
Deferred tax liabilities
Foreign currency exchange gain 7 (65) (72) 116 - -
Intangible assets 6,003 5,652 (351) (213) - -
Depreciation expenses 16 23 7 34 - -
Right-of-use asset 717 666 (51) (666) - -
Contract costs 419 242 (177) (58) - -
Deferred tax liabilities 7,162 6,518 (644) (787) - -
Deferred tax assets
Employee entitlements 818 577 241 (42) - -
Intellectual property expenses 234 252 (18) (19) - -
Accruals 23 22 1 (15) - -
Deferred revenue 6,029 4,914 1,115 (537) - -
Lease liabilities 745 681 64 681 - -
Employee Share Trust – unvested share-based payments
5,742 5,032 5 (717) 705 (715)
Other 9 4 5 - - -
Deferred tax assets 13,600 11,482 1,413 (649) 705 (715)
Deferred tax movement (charged) or credited to profit or loss 769 (1,436) - -
Deferred tax movement (charged) or credited directly to equity
- - 705 (715)
8. EARNINGS PER SHARE
Basic earnings per share is calculated as net profit after tax attributable to members of the Group, adjusted to exclude any costs of servicing equity (other than dividends) divided by the weighted average number of ordinary shares, adjusted for any bonus element. Diluted earnings per share is calculated as net profit after tax attributable to members of the Group adjusted for:
• The after tax effect of dividends and interest associated with dilutive potential ordinary shares that have been recognised as expenses
• Other non-discretionary changes in revenue or expenses during the period that would result from the dilution of potential ordinary shares
• Dilutive potential ordinary shares adjusted for any bonus element and then divided by the weighted average number of ordinary shares.
The following reflects the income and share data used in the basic and diluted earnings per share computations:
Consolidated
2021 2020
$ $
Net profit after tax attributable to ordinary equity holders 30,850,022 23,075,654
Number
Number
Weighted average number of ordinary shares for basic earnings per share 104,166,604 103,896,117
Effect of dilution:
Performance rights 427,381 560,916
Weighted average number of ordinary shares adjusted for the effect of dilution 104,593,985 104,457,033
There have been no other transactions involving ordinary shares or potential ordinary shares between the reporting date and the date of completion of these financial statements.

Notes to the Financial Statements FOR THE YEAR ENDED 30 JUNE 2021
35
9. DIVIDENDS PAID AND PROPOSED
Consolidated
2021 2020
$’000 $’000
Declared and paid during the year:
Dividends on ordinary shares
Final franked dividend for 2020: 6.0 cents (2019: 4.5 cents franked) 6,253 4,679
Interim franked dividend for 2021: 7.0 cents (2020: 6.0 cents franked) 7,295 6,237
13,548 10,916
Declared subsequent to the end of the year (not recognised as a liability as at 30 June):
Dividends on ordinary shares:
Final franked dividend for 2021: 8.0 cents (2020: 6.0 cents franked) 8,337 6,239
Total dividends proposed 8,337 6,239
Franking credit balance
Consolidated
2021 2020
$’000 $’000
– franking account balance as at the end of the financial year at
30% (2020: 30%) 2,326 4,314
– franking credits that will arise from the payment of income tax
payable as at the end of the financial year 1,463 642
– franking debits that will arise from the payment of dividends as at the end of the financial year
- -
– franking credits that the entity may be prevented from distributing in the subsequent financial year
- -
– prior period adjustment - -
3,789 4,956
The amount of franking credits available for future reporting periods:
– impact on the franking account of dividends proposed or declared before the financial report was authorised for issue but not recognised as a distribution to equity holders during the period
(3,573) (2,828)
216 2,128
The tax rate at which paid dividends have been franked is 30% (2020: 30%).
Dividends proposed will be fully franked.
10. CASH AND CASH EQUIVALENTS
Consolidated
2021 2020
$’000 $’000
Cash at bank and in hand* 42,039 29,392 Short-term deposits - 14,021
42,039 43,413
*$200,000 (2020: $2,200,000) of the cash at bank balance is held as a deposit for foreign exchange forward contracts. The deposit matures and becomes available following the settlement of the foreign exchange forward contracts within three months of the reporting date. Cash and cash equivalents in the Statement of Financial Position and Statement of Cash Flow comprise cash at bank and in hand and short term deposits that are readily convertible to known amounts of cash and which are subject to an insignificant risk of changes of value. Cash at bank earns interest at floating rates based on daily bank deposit rates. Short term deposits are made for varying periods, depending on the immediate cash requirements of the Group, and earn interest at the respective short-term deposit rates. The carrying value of cash and cash equivalents approximates their fair value.
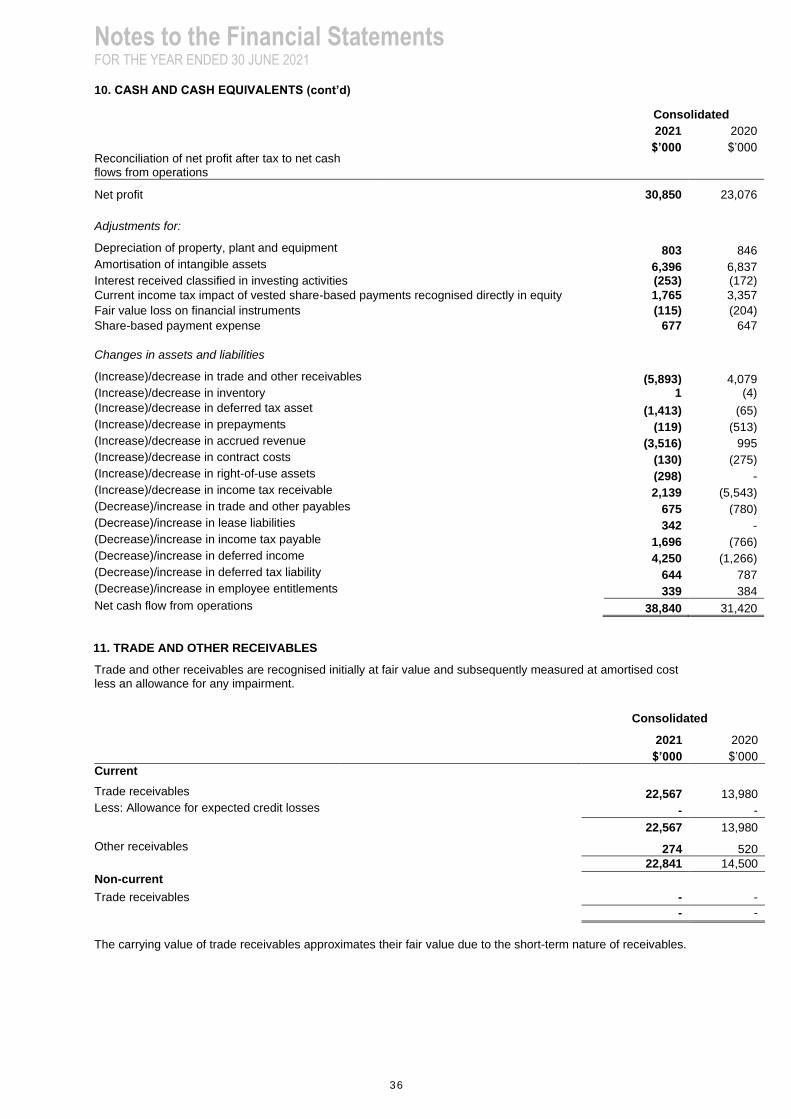
Notes to the Financial Statements FOR THE YEAR ENDED 30 JUNE 2021
36
10. CASH AND CASH EQUIVALENTS (cont’d)
Consolidated 2021 2020 Reconciliation of net profit after tax to net cash flows from operations
$’000 $’000
Net profit 30,850 23,076
Adjustments for:
Depreciation of property, plant and equipment 803 846 Amortisation of intangible assets 6,396 6,837 Interest received classified in investing activities (253) (172)
Current income tax impact of vested share-based payments recognised directly in equity 1,765 3,357
Fair value loss on financial instruments (115) (204)
Share-based payment expense 677 647
Changes in assets and liabilities
(Increase)/decrease in trade and other receivables (5,893) 4,079 (Increase)/decrease in inventory 1 (4)
(Increase)/decrease in deferred tax asset (1,413) (65) (Increase)/decrease in prepayments (119) (513) (Increase)/decrease in accrued revenue (3,516) 995 (Increase)/decrease in contract costs (130) (275) (Increase)/decrease in right-of-use assets (298) - (Increase)/decrease in income tax receivable 2,139 (5,543) (Decrease)/increase in trade and other payables 675 (780) (Decrease)/increase in lease liabilities 342 - (Decrease)/increase in income tax payable 1,696 (766) (Decrease)/increase in deferred income 4,250 (1,266) (Decrease)/increase in deferred tax liability 644 787 (Decrease)/increase in employee entitlements 339 384
Net cash flow from operations 38,840 31,420
11. TRADE AND OTHER RECEIVABLES
Trade and other receivables are recognised initially at fair value and subsequently measured at amortised cost less an allowance for any impairment.
Consolidated
2021 2020 $’000 $’000
Current
Trade receivables 22,567 13,980 Less: Allowance for expected credit losses - -
22,567 13,980
Other receivables 274 520
22,841 14,500
Non-current
Trade receivables - -
- -
The carrying value of trade receivables approximates their fair value due to the short-term nature of receivables.

Notes to the Financial Statements FOR THE YEAR ENDED 30 JUNE 2021
37
11. TRADE AND OTHER RECEIVABLES (cont’d)
A provision for impairment is made based on applying a simplified approach in calculating the expected credit losses (“ECL”) for debtors and other receivables (including accrued revenue). Therefore, the Group does not track changes in credit risk, but instead recognises an ECL allowance based on lifetime ECL at each reporting date. The Group’s provisioning methodology is based on its historical credit loss experience, adjusted for forward-looking factors specific to individual debtors and the economic environment. Debtors and other receivables (including accrued revenue) are written off when there is no reasonable expectation of recovering the contractual cash flows.
Consolidated
2021 2020 $’000 $’000
a) Allowance for expected credit losses
Movements in the allowance for expected credit losses were as follows:
At 1 July - 647
Charge to / (write back of) allowance for the year - (647)
Utilised during the year - -
Foreign exchange translation - -
At 30 June - -
At June 30, the ageing analysis of trade receivables is as follows:
Consolidated Trade receivables Allowance for expected
credit losses 2021 2020 2021 2020 $’000 $’000 $’000 $’000
0 – 30 days 17,545 8,285 - -
31 – 60 days 1,144 1,187 - -
61 – 90 days 595 1,262 - -
91+ days 3,283 3,246 - -
Total trade receivables 22,567 13,980 - -
No allowance for expected credit losses at 30 June 2021 was made as all outstanding debts were expected to be received. The majority of customers are on terms of between 30 to 60 days, however certain customers have terms of up to 90 days. Payment terms for $396,267 (2020: $2,455,658) of trade receivables have pre-contracted extended trading terms and are due within the next 12 months.
12. OTHER FINANCIAL ASSETS
Consolidated
2021 2020
$’000 $’000
Listed debt instruments 5,944 - Unlisted debt instruments 3,745 - Unlisted investments in managed funds 10,088 - Derivative financial instruments Note 28 - 45
19,777 45
Listed debt instruments are classified as Level 1 in the fair value hierarchy as their prices are quoted in an active market. Unlisted debt instruments and managed fund investments are classified as Level 2. Investments in unlisted managed funds are recorded at the redemption value per unit as reported by the investment managers of the fund. Unlisted debt instruments fair values are determined with reference to recent market transactions and discounted cash flow techniques based on market rates at the end of the period for instruments with similar terms and conditions.

Notes to the Financial Statements FOR THE YEAR ENDED 30 JUNE 2021
38
13. PLANT & EQUIPMENT
Plant and equipment is stated at cost less accumulated depreciation and any impairment in value. Depreciation is calculated on a straight-line basis over the estimated useful life of the asset as follows:
2021 2020
Property Improvements 2 to 7 years 2 to 7 years
Motor Vehicles 4 to 5 years 4 to 5 years
Office Equipment 2 to 7 years 2 to 7 years
Furniture and Fittings 5 years 5 years
Research and Development Equipment 3 to 4 years 3 to 4 years
An item of plant and equipment is derecognised upon disposal or when no future economic benefits are expected to arise from the continued use of the asset. Any gain or loss arising on de-recognition of the asset (calculated as the difference between the net disposal proceeds and the carrying amount of the item) is included in the statement of comprehensive income in the period the item is derecognised.
Impairment
As property, plant and equipment is not considered to generate independent cash flows, the carrying amount of these assets is included within the assets of the cash generating unit assessed as part of the Group’s impairment testing process as outlined in Note 14.
Property
Improvements
Motor
Vehicles
Office
Equipment
Furniture
& Fittings
Research &
Development
Equipment
Total
$’000 $’000 $’000 $’000 $’000 $’000
Year ended 30 June 2021
At 1 July 2020 net of accumulated
depreciation
9 13 589 11 - 622
Additions 12 - 135 - - 147
Disposals - - - - - -
Exchange differences - - (20) - - (20)
Depreciation charge for the year (2) (8) (247) (2) - (259)
At 30 June 2021 net of
accumulated depreciation
19 5 457 9 - 490
At 30 June 2021
Cost 345 488 2,891 418 209 4,351
Accumulated depreciation and
impairment
(326) (483) (2,434) (409) (209) (3,861)
Net carrying amount 19 5 457 9 - 490
Consolidated

Notes to the Financial Statements FOR THE YEAR ENDED 30 JUNE 2021
39
13. PLANT & EQUIPMENT (cont’d)
Property
Improvements
Motor
Vehicles
Office
Equipment
Furniture
& Fittings
Research &
Development
Equipment
Total
$’000 $’000 $’000 $’000 $’000 $’000
Year ended 30 June 2020
At 1 July 2019 net of accumulated
depreciation
11 20 461 11 - 503
Additions - - 359 4 - 363
Disposals - - - - - -
Exchange differences - - - - - -
Depreciation charge for the year (2) (7) (231) (4) - (244)
At 30 June 2020 net of
accumulated depreciation
9 13 589 11 - 622
At 30 June 2020
Cost 335 488 3,216 427 209 4,675
Accumulated depreciation and
impairment
(326) (475) (2,627) (416) (209) (4,053)
Net carrying amount 9 13 589 11 - 622
Consolidated
14. INTANGIBLE ASSETS
Intangible assets acquired separately are initially measured at cost. The cost of an intangible asset acquired in a business combination is its fair value as at date of acquisition. Following initial recognition, intangible assets with a finite life are carried at cost less any accumulated amortisation and any accumulated impairment losses. Amortisation is calculated on a straight-line basis over the estimated useful life of the asset. Intangible assets, excluding development costs, created within the business are not capitalised and expenditure is charged against profits in the period in which the expenditure is incurred. Intangible assets are tested for impairment where an indicator of impairment exists, either individually or at the cash generating unit level. In addition, intangible assets which are not yet ready for use are tested for impairment at least annually. The recoverable amount is estimated, and an impairment loss is recognised to the extent that the recoverable amount is lower than the carrying value. The amortisation period and method is renewed at each financial year end and adjustments, where applicable, are made on a prospective basis.
Research and development costs
Research costs are expensed as incurred. An intangible asset arising from development expenditure on an internal project is recognised only when the group can demonstrate the technical feasibility of completing the intangible asset so that it will be available for sale or use, its intention to complete and its ability to use or sell the asset, how the asset will generate future economic benefits, the availability of resources to complete the development and the ability to measure reliably the expenditure attributable to the intangible asset during its development. Following initial recognition of the development expenditure, the cost model is applied requiring the asset be carried at cost less any accumulated amortisation and accumulated impairment losses. Any expenditure so capitalised is amortised on a straight line basis over the period of expected benefit from the related project which the Group has assessed as 5 years. Development expenditure includes costs of materials and services and salaries and wages and other employee related costs arising from the generation of the intangible asset.
Intellectual Property – Software
The group identifies separately identifiable intangible assets, in the form of software intellectual property, for the following products:
• Visage 7.0 PACS
• Visage RIS

Notes to the Financial Statements FOR THE YEAR ENDED 30 JUNE 2021
40
14. INTANGIBLE ASSETS (cont’d)
Development
Costs
i)
Total
$’000 $’000
Year ended 30 June 2021
At 1 July 2020 net of accumulated
amortisation and impairment
18,839 18,839
Additions - internal development 7,566 7,566
Disposals - -
Exchange differences - -
Amortisation charge for the year (6,396) (6,396)
At 30 June 2021 net of
accumulated amortisation and
impairment
20,009 20,009
At 30 June 2021
Cost 61,954 61,954
Accumulated amortisation and
impairment
(41,945) (41,945)
Net carrying amount 20,009 20,009 Intellectual
Property
Development
Costs
i)
Software
Licenses
Total
Year ended 30 June 2020
At 1 July 2019 net of accumulated
amortisation and impairment
- 18,167 1 18,168
Additions - internal development - 7,508 - 7,508
Disposals - - - -
Exchange differences - 1 - 1
Amortisation charge for the year - (6,837) (1) (6,838)
At 30 June 2020 net of accumulated
amortisation and impairment
- 18,839 - 18,839
At 30 June 2020
Cost 1,848 54,388 324 56,560
Accumulated amortisation and
impairment
(1,848) (35,549) (324) (37,721)
Net carrying amount - 18,839 - 18,839
Notes to the Financial Statements FOR THE YEAR ENDED 30 JUNE 2021
41
14. INTANGIBLE ASSETS (cont’d)
i) Development costs have been capitalised. This intangible asset has been assessed as having a finite life and is amortised using the straight-line method over a period of 5 years. As at 30 June 2021 the carrying values of capitalised development costs are Visage PACS ($14,477,167) RIS ($5,532,002) and Visage MagicWeb (Nil), all sit within the Australian operating segment.
Impairment
The Group determines whether its intangible assets are carried above recoverable amount on an annual basis. Intangible assets are allocated to Cash Generating Units (CGU) identified based on the Group’s key software products, being Visage PACS and Radiology Information System (RIS) for the purposes of impairment testing. These CGUs are considered the smallest identifiable group of assets that generate largely independent cash
inflows.
The Group estimates recoverable amount using a value-in-use (VIU) discounted cash flow methodology. Key inputs and assumptions to the VIU calculation include the discount rate, budgeted cash flows and terminal growth
rates.
No impairment loss was recognised during the year ended 30 June 2021 (2020: nil impairment loss) as the results of the impairment test indicated that the recoverable amount of each CGU exceeded the carrying amount. There were also no reasonably possible changes in assumptions identified that would result in recoverable amount being lower than carrying amount

Notes to the Financial Statements FOR THE YEAR ENDED 30 JUNE 2021
42
15. TRADE AND OTHER PAYABLES
Trade payables and other payables are carried at amortised cost and represent liabilities for goods and services provided to the Group prior to the end of the financial year that are unpaid and arise when the Group becomes obliged to make future payments in respect of the purchase of these goods and services.
Consolidated
2021 2020
$’000 $’000
Current
Trade payables 872 835
Other payables and accruals 2,853 1,802
3,725 2,637
(i) Trade payables are non-interest bearing and are normally settled on 30-day terms. (ii) Other payables are non-interest bearing and have an average term of 30 days. Fair value approximates carrying value due to the short-term nature of trade and other payables.
16. DEFERRED REVENUE
Consolidated
2021 $’000
2020 $’000
Current
Deferred revenue from contracts with customers 8,886 7,225
8,886 7,225
Non-current
Deferred revenue from contracts with customers 17,011 14,422
17,011 14,422
Unsatisfied performance obligations
The aggregate amount of the transaction price allocated to the performance obligations that are unsatisfied as at 30 June 2021 was $25,897,000 (2020: $21,647,000) and is expected to be recognised as revenue in future reporting periods as follows:
Consolidated
2021 $’000
2020 $’000
Less than one year 8,886 7,225
Between one year and seven years 17,011 14,422
Revenue to be recognised from unsatisfied performance obligations 25,897 21,647

Notes to the Financial Statements FOR THE YEAR ENDED 30 JUNE 2021
43
17. PROVISIONS
Provisions are recognised when the Group has a present obligation (legal or constructive) as a result of a past event, it is probable that an outflow of resources embodying economic benefits will be required to settle the obligation and a reliable estimate can be made of the amount of the obligation. Provisions are measured at the present value of management’s best estimate of the expenditure required to settle the present obligation at the reporting date. When the Group expects some or all of a provision to be reimbursed, for example under an insurance contract, the reimbursement is recognised as a separate asset but only when the reimbursement is virtually certain. The expense relating to any provision is presented in the statement of comprehensive income net of any reimbursement.
Employee leave benefits
Provision is made for employee entitlement benefits accumulated as a result of employees rendering services up to the reporting date.
(i) Annual leave and sick leave
The liability for annual leave is recognised and measured as the present value of expected future payments to be made in respect of services provided by employees up to the reporting date, using the projected unit credit method. Consideration is given to expected future wage and salary levels, experience of employee departures, and periods of service. Expected future payments are discounted using market yields at the reporting date on high quality corporate bonds with terms to maturity and currencies that match, as closely as possible the estimated future cash outflows. Expenses for non-accumulating sick leave are recognised when the leave is taken and are measured at the current rates paid to employees.
(ii) Long service leave
The liability for long service leave is recognised and measured as the present value of expected future payments to be made in respect of services provided by employees up to the reporting date, using the projected unit credit method. Consideration is given to expected future wage and salary levels, experience of employee departures, and periods of service. Expected future payments are discounted using market yields at the reporting date on high quality corporate bonds with terms to maturity and currencies that match, as closely as possible the estimated future cash outflows.
Consolidated
2021 2020
$’000 $’000
Current
Long service leave 1,000 980
Annual leave 1,668 1,352
2,668 2,332
Non-current
Long service leave 55 52
55 52

Notes to the Financial Statements FOR THE YEAR ENDED 30 JUNE 2021
44
18. CONTRIBUTED EQUITY AND RESERVES
Ordinary shares are classified as equity. Incremental costs directly attributable to the issue of new shares or options are shown in equity as a deduction, net of tax, from the proceeds.
(i) Share reserve
The share reserve is used to record the value of share based payments provided to employees, including KMP, as part of their remuneration. Refer to Note 19 for further details of these plans.
(ii) Foreign currency translation reserve
The foreign currency translation reserve is used to record exchange differences arising from the translation of the financial statements of foreign subsidiaries and for exchange differences arising from long term loan accounts resulting from net investment in subsidiaries.
Consolidated
2021 2020
Contributed Equity $’000 $’000
(i) Ordinary shares 1,962 1,962
Issued and fully paid 1,962 1,962
Fully paid ordinary shares carry one vote per share and carry the right to dividends
(ii) Movements in shares on issue
Number of Shares
2021
$’000
At 1 July 2020 103,946,832 1,962
Vesting of performance rights 264,742 -
At 30 June 2021 104,211,574 1,962
2020
Number of Shares
$’000
At 1 July 2019 103,616,518 1,962
Cancellation of share buyback (34,062) -
Vesting of performance rights 364,376 -
At 30 June 2020 103,946,832 1,962
Consolidated
2021 2020
$’000 $’000
Share reserve (i)
Balance at 1 July 10,175 10,290
Share based payment expense 677 647
Income tax effect of the Employee Share Trust 2,470 (762)
Balance at 30 June 13,322 10,175
Foreign currency translation reserve (ii)
Balance at 1 July (659) (351)
Foreign currency movement 1,051 (308)
Balance at 30 June 392 (659)
Retained earnings
Balance at 1 July 49,620 37,460
Net profit for the year 30,850 23,076
Dividends (13,548) (10,916)
Balance at 30 June 66,922 49,620
Notes to the Financial Statements FOR THE YEAR ENDED 30 JUNE 2021
45
18. CONTRIBUTED EQUITY AND RESERVES (cont’d)
Capital Management
When managing capital, management's objective is to ensure the entity continues as a going concern as well as to maintain optimal returns to shareholders and benefits for other stakeholders. Management also aims to maintain a capital structure that ensures the lowest cost of capital available to the entity. Management review the capital structure to take advantage of favourable costs of capital or high returns on assets. As the market is constantly changing, management may change the amount of dividends to be paid to shareholders, return capital to shareholders, or issue new shares. During the year, the company paid dividends of $13,547,505 (2020: $10,915,959).
19. SHARE BASED PAYMENTS
(i) Equity settled transactions:
The Group provides benefits to its employees (including KMP) in the form of share-based payments, whereby employees render services in exchange for shares or rights over shares (equity-settled transactions). Details of the current share based payment plan, which provides performance rights to employees are outlined below. The cost of these equity-settled transactions with employees is measured by reference to the fair value of the equity instruments at the date at which they are granted. The fair value is determined using either a Black Scholes model or Monte Carlo simulation model. The cost of equity-settled transactions is recognised, together with a corresponding increase in equity, over the period in which the performance and/or service conditions are fulfilled (the vesting period), ending on the date on which the relevant employees become fully entitled to the award (the vesting date). At each subsequent reporting date until vesting, the cumulative charge to the profit or loss is the product of: (i) The grant date fair value of the award;
(ii) For options with non-market vesting conditions, the current best estimate of the number of awards that will vest, taking into account such factors as the likelihood of employee turnover during the vesting period and the likelihood of non-market performance conditions being met; and
(iii) The lapsed portion of the vesting period. The charge to the statement of comprehensive income for the period is the cumulative amount as calculated above less the amounts already charged in previous periods. There is a corresponding entry to equity. Until an award has vested, any amounts recorded are contingent and will be adjusted if more or fewer awards vest than were originally anticipated to do so. Any award subject to a market condition is considered to vest irrespective of whether or not that market condition is fulfilled, provided that all other conditions are satisfied. If the terms of an equity-settled award are modified, as a minimum an expense is recognised as if the terms had not been modified. An additional expense is recognised for any modification that increases the total fair value of the share-based payment arrangement, or is otherwise beneficial to the employee, as measured at the date of modification. The dilutive effect, if any, of outstanding options is reflected as additional share dilution in the computation of diluted earnings per share (see Note 8).
Performance Rights - Long Term Incentive (LTI) Scheme
Senior Executives of the Group are offered performance rights over the ordinary shares of Pro Medicus Limited. The performance rights, which are accounted for as options, are issued with nil exercise price and vest 4 years after grant date subject to an employee remaining in service and certain performance hurdles (which are tested at the end of the third year) being met. The performance rights cannot be transferred and will not be quoted on the ASX. During the current year performance rights granted during the FY21, FY20, FY19 and FY18 years remained on issue.

Notes to the Financial Statements FOR THE YEAR ENDED 30 JUNE 2021
46
19. SHARE BASED PAYMENTS (cont’d)
The table below details movements in the number of performance rights on issue:
30 June 2021 30 June 2020
Number of Performance
Rights
Number of Performance
Rights
Outstanding at the beginning of the year 927,306 1,200,390
- granted 105,671 91,292
- forfeited (155,284) -
- exercised (264,742) (364,376)
- expired (13,543) -
Outstanding at the end of the year 599,408 927,306
Exercisable at end of year - -
Weighted average remaining contractual life 2.2 2.2
Performance hurdles applicable to the performance rights on issue during the year were:
- Earnings per share (EPS) (60% of performance right granted): calculated as the compound annual growth rate (CAGR) of EPS for the 3-year period from the grant date.
- Relative total shareholder return (TSR) (40% of performance right granted): Relative TSR combines the security price movement and distributions (which are assumed to be reinvested) to show the total return to securityholders, relative to that of other companies in the TSR comparator group. For the FY21 and FY20 plans the TSR comparator group was the ASX 200 index. For the FY19 and FY18 plans the comparator group was the ASX 300 index.
Performance rights valuation
The fair value of the equity-settled performance rights granted for the current long term incentive scheme is estimated as at the date of the grant using Black Sholes and Monte Carlo Simulation Models taking into account the terms and conditions upon which the performance rights were granted. The following table lists the inputs to the models used:
2021 2020 2019 2018
Dividend yield 0.48% 0.38% 0.69% 0.82%
Expected volatility 19.5% 17.06% 14.96% 15.56%
Risk-free interest rate 0.90% 0.90% 3.30% 3.30%
Expected life of performance rights 4 years 4 years 4 years 4 years
Performance rights exercise price $0.00 $0.00 $0.00 $0.00
Fair value per right - TSR $3.28 $2.85 $1.10 $0.72
Fair value per right – EPS $24.45 $27.16 $8.48 $4.74 20. LEASES
The table below details movements in the Group’s right-of-use assets and lease liabilities during the year ended 30 June 2021:
Consolidated Right-of-use assets Lease liabilities
Property $’000
Motor vehicles $’000
Total $’000
Total
$’000
As at 1 July 2020 2,176 50 2,226 (2,276)
Additions 843 18 861 (861)
Depreciation expense (505) (39) (544) -
Interest expense - - - (114)
Payments - - - 615
Foreign exchange translation (17) (2) (19) 18
As at 30 June 2021 2,497 27 2,524 (2,618)

Notes to the Financial Statements FOR THE YEAR ENDED 30 JUNE 2021
47
20. LEASES (cont’d)
Consolidated Right-of-use assets Lease liabilities
Property $’000
Motor vehicles $’000
Total $’000
Total
$’000
As at 1 July 2019 2,724 98 2,822 (2,822)
Depreciation expense (552) (49) (601) -
Interest expense - - - (118)
Payments - - - 675
Foreign exchange translation 4 1 5 (11)
As at 30 June 2020 2,176 50 2,226 (2,276)
Set out below are the amounts recognised in profit and loss during the year ended 30 June 2021:
Consolidated 30 Jun 2021
$’000 30 Jun 2020
$’000
Depreciation expense 544 601
Interest expense 114 118
Total amount recognised in profit and loss 658 719
The Group had total cash outflows for leases during the year ended 30 June 2021 of $615,000 (2020: $675,000). Set out below is a maturity analysis of lease liabilities:
Consolidated Leases
commenced at
30 Jun 2021
Leases
commenced at
30 Jun 2020
Less than one year 574 522
One to five years 1,816 1,365
More than five years 600 800
Total undiscounted amount 2,990 2,687
No other matters have arisen since the Balance Sheet date which have significantly affected or may affect, the operations of the Group, the results of those operations or the state of affairs of the Group in future financial periods.
At 30 June 2021 there were no leases that were committed to but not yet commenced.
21. EVENTS AFTER THE BALANCE SHEET DATE
On 18 August 2021, the directors of Pro Medicus Limited declared a fully franked final dividend on ordinary shares in respect of the 2021 financial year of 8.0 cents per share totalling $8,336,926. The dividend has not been provided for in the 30 June 2021 financial statements.

Notes to the Financial Statements FOR THE YEAR ENDED 30 JUNE 2021
48
23. KEY MANAGEMENT PERSONNEL (a) Compensation for key management personnel
Consolidated
2021 2020
Short-term employee benefits 4,233,363 3,526,731 Post-employment benefits 128,103 115,035 Long-term benefits 2,189 (46,592)
Share-based payment 273,690 111,874
Total compensation 4,637,345 3,707,048
Detailed remuneration disclosure are contained in the Remuneration Report section of the Director’s Report.
(b) Loans to Key Management Personnel
No loans are made to Key Management Personnel or staff. (c) Other transactions and balances with Key Management Personnel
During the year lease payments of $200,000 (2020: $200,000) in respect of the Group’s operating premises at 450 Swan Street, Richmond were paid to Champagne Properties Pty. Ltd., an entity controlled by S. Hupert and A. Hall. Commercial arrangements on an ‘arm’s length basis’ have been determined by an independent assessment of rental and lease terms. The current arrangement is on a month to month basis. 24. RELATED PARTY DISCLOSURE (a) Subsidiaries
The consolidated financial statements include the financial statements of Pro Medicus Limited and the subsidiaries listed in the following table.
% Equity interest Investment $’000 Name Country of
incorporation 2021 2020 2021 2020
Promed (USA) Pty Ltd Australia 100 100 - - PME IP Australia Pty Ltd Australia 100 100 - - Visage Imaging (Aust) Pty Ltd Australia 100 100 - - Visage Ventures Pty Ltd Australia 100 100 - - PME Nominees Pty Ltd (ATF Employee Share Trust)
Australia 100 100 - -
Pro Medicus (USA) LLC United States 100 100 - - Visage Ventures Inc United States 100 100 - - Visage Imaging Inc United States 100 100 2,389 2,389 Visage Imaging GmbH Germany 100 100 3,638 3,638
6,027 6,027
(b) Ultimate parent
Pro Medicus Limited is the ultimate Australian parent entity and the ultimate parent of the Group.
22. AUDITOR’S REMUNERATION Consolidated
2021 2020
Amounts received or due and receivable by Ernst & Young
(Australia) for:
– an audit or review of the financial report of the
Company and any other entity in the Group 221,050 217,920
– other services in relation to the Company or Group 46,085 82,865
Amounts received or due and receivable by related
practices of Ernst & Young (Australia):
267,135 300,785
– audit of the financial report of Visage Imaging GmbH
50,363 104,691
– other services in relation to Visage Imaging GmbH 33,930 756
351,428 406,232

Notes to the Financial Statements FOR THE YEAR ENDED 30 JUNE 2021
49
24. RELATED PARTY DISCLOSURE (cont’d) (c) Transactions with related parties
The following table provides the total amount of transactions that were entered into with related parties for the relevant financial year.
Consolidated
Sales to related
parties $’000
Purchases from related parties
$’000
Other transactions with related parties $’000
Related party Champagne Properties Pty Ltd* – Rental lease 2021 - 200 - Champagne Properties Pty Ltd* – Rental lease 2020 - 200 -
* Champagne Properties Pty Ltd is an entity controlled by Directors of the Company, S. Hupert and A. Hall. Terms and conditions of transactions with related parties
Sales to and purchases from related parties are made in arm’s length transactions both at normal market prices and on normal commercial terms. Outstanding balances at year end are unsecured, interest free and payable on demand. 25. FINANCIAL RISK MANAGEMENT OBJECTIVES AND POLICIES The Group’s principal financial instruments are cash, short-term deposits and other financial assets.
The main purpose of these financial instruments is to provide finance for the Group’s operations. The Group has various other financial assets and liabilities such as trade receivables and trade payables, which arise directly from its operations. The main risks arising from the Group’s financial instruments are foreign currency risk, interest risk and credit risk. The Board manages each of these risks as detailed below.
Foreign currency risk
(i) Functional and presentation currency
Both the functional and presentation currency of Pro Medicus Limited and its Australian subsidiaries are Australian dollars ($). The United States subsidiaries’ functional currency is United States Dollars. The subsidiary in Germany has a functional currency of Euro. Foreign subsidiaries are translated to presentation currency for consolidated reporting.
(ii) Transactions and balances
Transactions in foreign currencies are initially recorded in the functional currency by applying the exchange rates ruling at the date of the transaction. Monetary assets and liabilities denominated in foreign currencies are retranslated at the rate of exchange ruling at the reporting date. Non-monetary items that are measured in terms of historical cost in a foreign currency are translated using the exchange rate as at the date of the initial transaction. Non-monetary items measured at fair value in a foreign currency are translated using the exchange rates at the date when the fair value was determined.
(iii) Translation of Group Companies’ functional currency to presentation currency
The results of the United States and German subsidiaries are translated into Australian dollars (presentation currency) using an average exchange rate for the trading period. Assets and liabilities are translated at exchange rates prevailing at reporting date.
Exchange variations resulting from the translation are recognised in the foreign currency translation reserve in equity.
On consolidation, exchange differences arising from the translation of the net investments in foreign subsidiaries are taken to the foreign currency translation reserve. If a foreign subsidiary were sold, the proportionate share of exchange differences would be transferred out of equity and recognised in profit or loss.
The Group has transactional currency exposure, which arise from sales made in currencies other than the Group’s presentational currency.
Approximately 80% (2020: 81%) of the Group’s sales are denominated in currencies other than the presentational currency, and these sales would be predominately offset by currency exposure on costs. Foreign bank accounts have also been established, to create a natural hedge and reduce the need for regular transfers from the presentational currency (AUD) cash holdings.

Notes to the Financial Statements FOR THE YEAR ENDED 30 JUNE 2021
50
25. FINANCIAL RISK MANAGEMENT OBJECTIVES AND POLICIES (cont’d)
At 30 June the Group had the following exposure to US$ foreign currency that is not designated in cash flow hedges or recorded in the functional currency of the subsidiary
Consolidated
2021 2020 $’000 $’000
Financial assets
Cash and cash equivalents 5,532 16,459
5,532 16,459
Financial liabilities
Trade and other payables - -
Net exposure 5,532 16,459
At 30 June the Group had the following exposure to CAD$ foreign currency that is not designated in cash flow hedges or recorded in the functional currency of the subsidiary
Consolidated
2021 2020 $’000 $’000
Financial assets
Cash and cash equivalents 660 667
660 667
Financial liabilities
Trade and other payables - -
Net exposure 660 667
At 30 June the Group had the following exposure to GBP₤ foreign currency that is not designated in cash flow hedges or recorded in the functional currency of the subsidiary
Consolidated
2021 2020 $’000 $’000
Financial assets Cash and cash equivalents 129 125
129 125
Financial liabilities
Trade and other payables - -
Net exposure 129 125
At 30 June the Group had the following exposure to EUR€ foreign currency that is not designated in cash flow hedges or recorded in the functional currency of the subsidiary
Consolidated
2021 2020 $’000 $’000
Financial assets Cash and cash equivalents 2,357 747
2,357 747
Financial liabilities
Trade and other payables - -
Net exposure 2,357 747

Notes to the Financial Statements FOR THE YEAR ENDED 30 JUNE 2021
51
25. FINANCIAL RISK MANAGEMENT OBJECTIVES AND POLICIES (cont’d)
At 30 June, had the Australian Dollar moved, as illustrated in the table below, with all other variables held constant, post-tax profit and equity (excluding retained profits) would have been affected as follows:
Judgements of reasonably possible movements: Post tax profit
higher/(lower) Other comprehensive
income higher/(lower)
2021 2020 2021 2020 $’000 $’000 $’000 $’000
AUD/USD +10% (161) (816) (76) (102)
AUD/USD – 5% 80 408 38 51
AUD/CAD +10% (66) (67) - -
AUD/CAD – 5% 33 33 - -
AUD/GBP +10% (13) (12) - -
AUD/GBP – 5% 6 6 - -
AUD/EUR +10% (236) (75) (219) (254)
AUD/EUR – 5% 118 37 110 127
Management believe the reporting date risk exposures are representative of the risk exposure inherent in the financial instruments.
Credit risk
Credit risk arises from the financial instruments of the Group, which comprise cash and cash equivalents and trade and other receivables. The Group’s exposure to credit risk arises from potential defaults of the counter-party, with a maximum exposure equal to the carrying amount of the financial assets.
The Group trades only with recognised, credit worthy third parties.
It is the Group’s policy that all customers who wish to trade on credit terms are subject to credit assessment.
In addition, receivable balances are monitored on an ongoing basis with the result that the Group’s exposure to bad debts is not significant.
As the Group trades predominantly within the Diagnostic Imaging market there is a concentration of credit risk. Given the underlying Government funding support for Radiology in Hospital settings and the Imaging Centre and
Diagnostic Imaging market, and the commercial successes achieved by the Group to date, credit risk is considered to be minimal.
Cash and cash equivalents are held with several financial institutions, with the majority held with the Westpac Banking Corporation and Wells Fargo Bank N.A., both AA rated banks.
Interest risk
The Group exposure to market interest rates relates primarily to the company’s cash and cash equivalents.
At reporting date, the Group had the following financial assets exposed to Australian Variable interest rate risk that are not designated in cash flow hedges:
Cash and Cash equivalents in the Group ($’000) $42,039 (2020: $43,413). At 30 June 2021, if interest rates had moved, as illustrated in the table below, with all other variables held constant, post-tax profit and equity (excluding retained profits) would have been affected as follows:
Consolidated
Judgements of reasonably possible movements: Post tax profit
higher/(lower)
Other comprehensive
income
higher/(lower)
2021 2020 2021 2020
$’000 $’000 $’000 $’000
+1% (100 basis points) 420 433 - -
– 0.5% (50 basis points) (211) (217) - -

Notes to the Financial Statements FOR THE YEAR ENDED 30 JUNE 2021
52
25. FINANCIAL RISK MANAGEMENT OBJECTIVES AND POLICIES (cont’d)
Liquidity risk
The Group has minimal liquidity risk as it has cash reserves of $42.0m, with no borrowings.
These cash reserves are deemed to be adequate and the Board believes they will underpin the ongoing growth of the business.
The table below reflects all contractually fixed pay-offs for settlement and repayments resulting from recognised financial liabilities. Cash flows for financial liabilities without fixed amount of timing are based on the conditions existing at 30 June 2021.
The remaining contractual maturities of the Group’s financial liabilities are:
Consolidated 2021 2020 $’000 $’000
<30 days 1,100 1,049
31-60 days 265 254
61-90 days 298 299
Over 90 days 2,062 1,035
TOTAL 3,725 2,637
26. CONTINGENCIES Tax related contingencies Amended assessments from the Australian Taxation Office (ATO) As a result of the ATO’s program of routine and regular tax audit, the Group anticipates that ATO audits may occur in the future. The Group is similarly subject to routine tax audits in certain overseas jurisdictions. The ultimate outcome of any future tax audits cannot be determined with an acceptable degree of reliability at this time. Nevertheless, the Group believes that it is making adequate provision for its taxation liabilities (including amounts shown as deferred and current tax liabilities) and is taking reasonable steps to address potentially contentious issues with the ATO. However, there may be an impact to the Group of any of the revenue authority investigations results in an adjustment that increases the Group’s taxation liabilities. Ongoing transactions – transfer pricing The Group has offshore operations in the United States and Germany (Note 24). There are additional Group transactions, between Pro Medicus Limited and its US and German based subsidiaries Visage Imaging Inc. and Visage Imaging GmbH. These transactions are on an arm’s length basis and are conducted at normal market prices and on normal commercial terms. Whilst there are no investigations currently in progress, such transactions are not subject to any statutory limit in Australia. 27. PARENT ENTITY INFORMATION
Information relating to Pro Medicus Limited 2021 $’000
2020 $’000
Current assets 21,400 19,986 Total assets 36,206 34,614 Current liabilities 25,696 18,631 Total liabilities 29,040 26,143 Issued capital 1,962 1,962 Retained earnings 1,412 4,610 Foreign currency translation reserve (2,819) (3,434) Share reserve 7,526 6,248 Share Buyback Reserve (915) (915)
Total shareholders’ equity 7,166 8,471 Profit/(loss) of the parent entity 10,349 9,991
Total comprehensive income of parent entity 10,349 9,991 The parent entity has not entered into any guarantees in relation to the debts of its subsidiaries. There are no contingent liabilities held against the parent entity. The parent entity does not have any contractual commitments for the acquisition of property, plant and equipment.
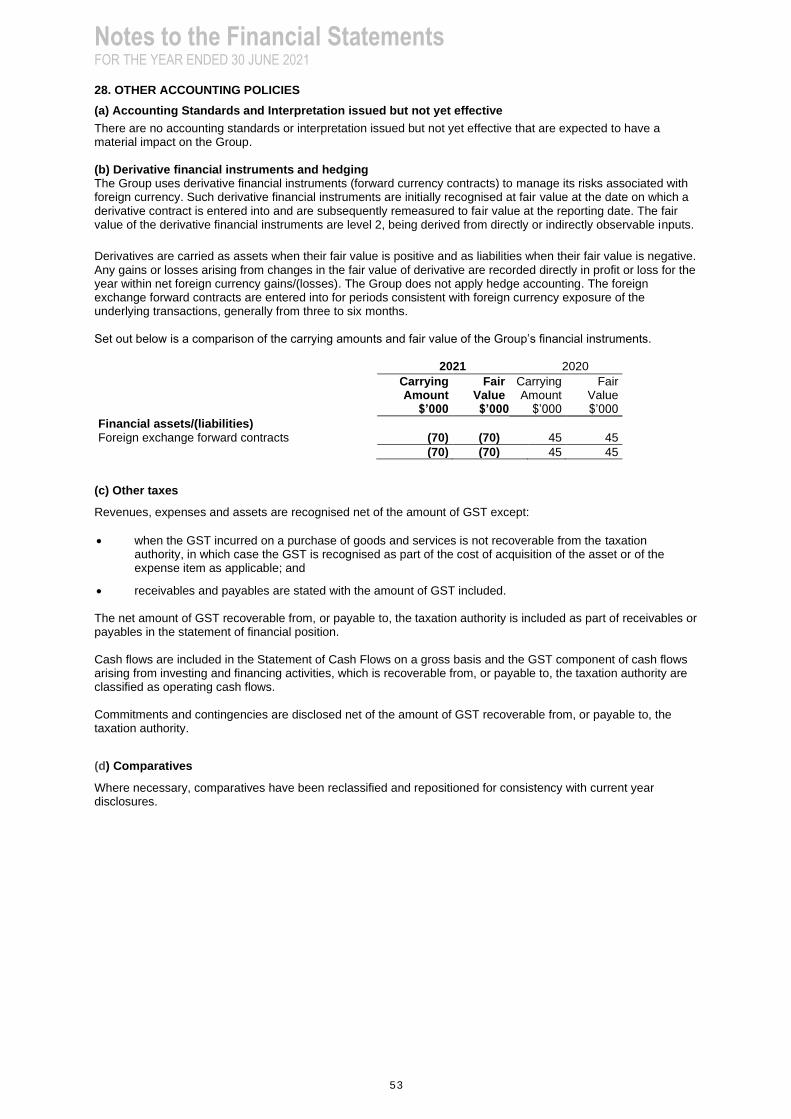
Notes to the Financial Statements FOR THE YEAR ENDED 30 JUNE 2021
53
28. OTHER ACCOUNTING POLICIES
(a) Accounting Standards and Interpretation issued but not yet effective
There are no accounting standards or interpretation issued but not yet effective that are expected to have a material impact on the Group. (b) Derivative financial instruments and hedging The Group uses derivative financial instruments (forward currency contracts) to manage its risks associated with foreign currency. Such derivative financial instruments are initially recognised at fair value at the date on which a derivative contract is entered into and are subsequently remeasured to fair value at the reporting date. The fair value of the derivative financial instruments are level 2, being derived from directly or indirectly observable inputs.
Derivatives are carried as assets when their fair value is positive and as liabilities when their fair value is negative. Any gains or losses arising from changes in the fair value of derivative are recorded directly in profit or loss for the year within net foreign currency gains/(losses). The Group does not apply hedge accounting. The foreign exchange forward contracts are entered into for periods consistent with foreign currency exposure of the underlying transactions, generally from three to six months. Set out below is a comparison of the carrying amounts and fair value of the Group’s financial instruments. 2021 2020
Carrying Amount
Fair Value
Carrying Amount
Fair Value
$’000 $’000 $’000 $’000
Financial assets/(liabilities) Foreign exchange forward contracts (70) (70) 45 45
(70) (70) 45 45
(c) Other taxes
Revenues, expenses and assets are recognised net of the amount of GST except:
• when the GST incurred on a purchase of goods and services is not recoverable from the taxation authority, in which case the GST is recognised as part of the cost of acquisition of the asset or of the expense item as applicable; and
• receivables and payables are stated with the amount of GST included. The net amount of GST recoverable from, or payable to, the taxation authority is included as part of receivables or payables in the statement of financial position. Cash flows are included in the Statement of Cash Flows on a gross basis and the GST component of cash flows arising from investing and financing activities, which is recoverable from, or payable to, the taxation authority are classified as operating cash flows. Commitments and contingencies are disclosed net of the amount of GST recoverable from, or payable to, the taxation authority.
(d) Comparatives
Where necessary, comparatives have been reclassified and repositioned for consistency with current year disclosures.

Directors Declaration
54
In accordance with a resolution of the directors of Pro Medicus Limited, I state that:
(1) In the opinion of the directors:
(a) the financial statements, notes and the additional disclosures included in the directors’ report designated as audited, of the consolidated entity are in accordance with the Corporations Act 2001, including:
(i) giving a true and fair view of the consolidated entity’s financial position as at 30 June 2021 and of the performance for the year ended on that date; and
(ii) complying with Accounting Standards (including the Australian Accounting Interpretations) and the Corporations Regulations 2001; and
(b) there are reasonable grounds to believe that the consolidated entity will be able to pay its debts as and when they become due and payable.
(c) the financial statements and notes comply with International Financial Reporting Standards (IFRS) as disclosed in Note 2(b).
(2) This declaration has been made after receiving the declarations required to be made to the directors in accordance with section 295A of the Corporations Act 2001 for the financial year ended 30 June 2021.
On behalf of the Board
P T Kempen
Chairman
Melbourne, 18 August 2021

A member firm of Ernst & Young Global Limited Liability limited by a scheme approved under Professional Standards Legislation
Ernst & Young 8 Exhibition Street Melbourne VIC 3000 Australia GPO Box 67 Melbourne VIC 3001
Tel: +61 3 9288 8000 Fax: +61 3 8650 7777 ey.com/au
Independent auditor’s report to the members of Pro Medicus Limited
Report on the audit of the financial report
Opinion
We have audited the financial report of Pro Medicus Limited (the Company) and its subsidiaries (collectively the Group), which comprises the consolidated statement of financial position as at 30 June 2021, the consolidated statement of comprehensive income, consolidated statement of changes in equity and consolidated statement of cash flows for the year then ended, notes to the financial statements, including a summary of significant accounting policies, and the directors’ declaration.
In our opinion, the accompanying financial report of the Group is in accordance with the Corporations Act 2001, including:
a. Giving a true and fair view of the consolidated financial position of the Group as at 30 June 2021 and of its consolidated financial performance for the year ended on that date; and
b. Complying with Australian Accounting Standards and the Corporations Regulations 2001.
Basis for opinion
We conducted our audit in accordance with Australian Auditing Standards. Our responsibilities under those standards are further described in the Auditor’s responsibilities for the audit of the financial report section of our report. We are independent of the Group in accordance with the auditor independence requirements of the Corporations Act 2001 and the ethical requirements of the Accounting Professional and Ethical Standards Board’s APES 110 Code of Ethics for Professional Accountants (including Independence Standards) (the Code) that are relevant to our audit of the financial report in Australia. We have also fulfilled our other ethical responsibilities in accordance with the Code.
We believe that the audit evidence we have obtained is sufficient and appropriate to provide a basis for our opinion.
Key audit matters
Key audit matters are those matters that, in our professional judgement, were of most significance in our audit of the financial report of the current year. These matters were addressed in the context of our audit of the financial report as a whole, and in forming our opinion thereon, but we do not provide a separate opinion on these matters. For each matter below, our description of how our audit addressed the matter is provided in that context.
We have fulfilled the responsibilities described in the Auditor’s responsibilities for the audit of the financial report section of our report, including in relation to these matters. Accordingly, our audit included the performance of procedures designed to respond to our assessment of the risks of material misstatement of the financial report. The results of our audit procedures, including the procedures performed to address the matters below, provide the basis for our audit opinion on the accompanying financial report.

A member firm of Ernst & Young Global Limited Liability limited by a scheme approved under Professional Standards Legislation
Capitalisation of development costs
Why significant How our audit addressed the key audit matter
The Group develops medical software related to radiology systems. Development costs are capitalised and presented as intangible assets on the consolidated statement of financial position.
The carrying value of intangible assets as at 30 June 2021 was $20.0 million (16% of total assets).
Capitalised development costs was considered a key audit matter as product development is core to the Group’s operations and it is the key asset on the Group’s consolidated statement of financial position. This involves judgement to determine whether the costs meet the capitalisation criteria in accordance with Australian Accounting Standards.
The measurement of capitalised development costs is based on the time and directly attributable overhead costs associated with individuals employed by the Group for the specific purpose of developing software. Capitalised development costs are amortised once the product is available for use, over a useful life of five years.
Note 14 of the financial report contains disclosure relating to capitalised program development costs.
Our audit procedures included the following:
► Assessed key measurement inputs, including labour and directly attributable overhead costs, used in the Group’s capitalisation model which determines the amount of capitalised development costs.
► Selected a sample of directly attributable overhead costs capitalised to assess whether these costs were appropriately capitalised in accordance with the criteria set out in Australian Accounting Standards.
► Agreed a sample of labour costs recorded within the capitalisation model to employee timesheets and payroll records. We enquired with the Group regarding the development activities that were undertaken relating to these costs and determined whether the sample of employees were directly involved in developing software and not maintenance or other activities that are not eligible for capitalisation.
► Assessed the useful life and amortisation rate allocated to capitalised development costs.
► Assessed the consistency of the capitalisation methodology applied by the Group in comparison to prior reporting periods.
► Assessed the adequacy of the disclosures included in Note 14.
Revenue recognition
Why significant How our audit addressed the key audit matter
The Group generated $67.9 million in revenue from customers across its global operations for the year ended 30 June 2021.
The Group exercises judgement to determine, in particular:
► Performance obligations within customer contracts; and
Our audit procedures included the following:
► Considered the appropriateness of the Group’s revenue recognition accounting policies against the requirements of Australian Accounting Standards, as well as the judgements applied in determining the timing of revenue recognition.

A member firm of Ernst & Young Global Limited Liability limited by a scheme approved under Professional Standards Legislation
Why significant How our audit addressed the key audit matter
► Recognition of revenue associated with multi-element contracts over the term of the contracts.
Accordingly, revenue recognition was considered a key audit matter.
Note 5 of the financial report contains disclosure relating to revenue recognition.
► Reviewed a sample of customer contracts to assess the application of revenue recognition policies to customer arrangements.
► Selected a sample of revenue transactions and assessed revenue recognised with respect to customer contracts.
► Selected a sample of revenue transactions recognised prior to and after year end, to assess whether revenue was recognised in the appropriate period.
► Assessed the adequacy of the disclosures included in Note 5.
Information other than the financial report and auditor’s report thereon
The directors are responsible for the other information. The other information comprises the information included in the Company’s 2021 annual report other than the financial report and our auditor’s report thereon. We obtained the directors’ report that is to be included in the annual report, prior to the date of this auditor’s report, and we expect to obtain the remaining sections of the annual report after the date of this auditor’s report.
Our opinion on the financial report does not cover the other information and we do not and will not express any form of assurance conclusion thereon, with the exception of the Remuneration Report and our related assurance opinion.
In connection with our audit of the financial report, our responsibility is to read the other information and, in doing so, consider whether the other information is materially inconsistent with the financial report or our knowledge obtained in the audit or otherwise appears to be materially misstated.
If, based on the work we have performed on the other information obtained prior to the date of this auditor’s report, we conclude that there is a material misstatement of this other information, we are required to report that fact. We have nothing to report in this regard.
Responsibilities of the directors for the financial report
The directors of the Company are responsible for the preparation of the financial report that gives a true and fair view in accordance with Australian Accounting Standards and the Corporations Act 2001 and for such internal control as the directors determine is necessary to enable the preparation of the financial report that gives a true and fair view and is free from material misstatement, whether due to fraud or error.
In preparing the financial report, the directors are responsible for assessing the Group’s ability to continue as a going concern, disclosing, as applicable, matters relating to going concern and using the going concern basis of accounting unless the directors either intend to liquidate the Group or to cease operations, or have no realistic alternative but to do so.

A member firm of Ernst & Young Global Limited Liability limited by a scheme approved under Professional Standards Legislation
Auditor’s responsibilities for the audit of the financial report
Our objectives are to obtain reasonable assurance about whether the financial report as a whole is free from material misstatement, whether due to fraud or error, and to issue an auditor’s report that includes our opinion. Reasonable assurance is a high level of assurance, but is not a guarantee that an audit conducted in accordance with the Australian Auditing Standards will always detect a material misstatement when it exists. Misstatements can arise from fraud or error and are considered material if, individually or in the aggregate, they could reasonably be expected to influence the economic decisions of users taken on the basis of this financial report.
As part of an audit in accordance with the Australian Auditing Standards, we exercise professional judgement and maintain professional scepticism throughout the audit. We also:
► Identify and assess the risks of material misstatement of the financial report, whether due to fraud or error, design and perform audit procedures responsive to those risks, and obtain audit evidence that is sufficient and appropriate to provide a basis for our opinion. The risk of not detecting a material misstatement resulting from fraud is higher than for one resulting from error, as fraud may involve collusion, forgery, intentional omissions, misrepresentations, or the override of internal control.
► Obtain an understanding of internal control relevant to the audit in order to design audit procedures that are appropriate in the circumstances, but not for the purpose of expressing an opinion on the effectiveness of the Group’s internal control.
► Evaluate the appropriateness of accounting policies used and the reasonableness of accounting estimates and related disclosures made by the directors.
► Conclude on the appropriateness of the directors’ use of the going concern basis of accounting and, based on the audit evidence obtained, whether a material uncertainty exists related to events or conditions that may cast significant doubt on the Group’s ability to continue as a going concern. If we conclude that a material uncertainty exists, we are required to draw attention in our auditor’s report to the related disclosures in the financial report or, if such disclosures are inadequate, to modify our opinion. Our conclusions are based on the audit evidence obtained up to the date of our auditor’s report. However, future events or conditions may cause the Group to cease to continue as a going concern.
► Evaluate the overall presentation, structure and content of the financial report, including the disclosures, and whether the financial report represents the underlying transactions and events in a manner that achieves fair presentation.
► Obtain sufficient appropriate audit evidence regarding the financial information of the entities or business activities within the Group to express an opinion on the financial report. We are responsible for the direction, supervision and performance of the Group audit. We remain solely responsible for our audit opinion.
We communicate with the directors regarding, among other matters, the planned scope and timing of the audit and significant audit findings, including any significant deficiencies in internal control that we identify during our audit.
A member firm of Ernst & Young Global Limited Liability limited by a scheme approved under Professional Standards Legislation
We also provide the directors with a statement that we have complied with relevant ethical requirements regarding independence, and to communicate with them all relationships and other matters that may reasonably be thought to bear on our independence, and where applicable, actions taken to eliminate threats or safeguards applied.
From the matters communicated to the directors, we determine those matters that were of most significance in the audit of the financial report of the current year and are therefore the key audit matters. We describe these matters in our auditor’s report unless law or regulation precludes public disclosure about the matter or when, in extremely rare circumstances, we determine that a matter should not be communicated in our report because the adverse consequences of doing so would reasonably be expected to outweigh the public interest benefits of such communication.
Report on the audit of the Remuneration Report
Opinion on the Remuneration Report
We have audited the Remuneration Report included in pages 11 to 18 of the directors’ report for the year ended 30 June 2021.
In our opinion, the Remuneration Report of Pro Medicus Limited for the year ended 30 June 2021, complies with section 300A of the Corporations Act 2001.
Responsibilities
The directors of the Company are responsible for the preparation and presentation of the Remuneration Report in accordance with section 300A of the Corporations Act 2001. Our responsibility is to express an opinion on the Remuneration Report, based on our audit conducted in accordance with Australian Auditing Standards.
Ernst & Young
Tony Morse Partner Melbourne 18 August 2021

ASX Additional Information
60
Additional information required by the Australian Stock Exchange Ltd and not shown elsewhere in this report is as follows.
(a) Distribution of equity securities
The number of shareholders, by size of holding, in each class of share are:
Performance rights Ordinary shares
Number of
holders
Number
of rights
Number of
holders
Number of
shares
1 – 1,000 1 954 8,483 2,700,783
1,001 – 5,000 13 25,701 1,994 4,430,702
5,001 – 10,000 14 105,688 280 2,049,053
10,001 – 100,000 13 345,406 231 6,106,164
100,001 and Over 1 121,659 38 88,924,872
42 599,408 11,026 104,211,574
The number of shareholders holding less than a marketable parcel are:
112 196
(b) Twenty largest shareholders
The names of the twenty largest holders of quoted shares are:
Listed ordinary shares
Number of shares
Percentage of ordinary shares
1 Dr S Hupert (multiple shareholdings) 27,137,660 26.04%
2 Mr A Hall (multiple shareholdings) 27,109,000 26.01%
3 HSBC Custody Nominees (Australia) Limited 13,423,186 12.88%
4 J P Morgan Nominees Australia Limited 5,695,125 5.46%
5 Citicorp Nominees Pty Ltd 5,338,280 5.12%
6 National Nominees Limited 2,441,254 2.34%
7 BNP Paribas Noms Pty Ltd 702,375 0.67%
8 Mr Peter Terence Kempen & Mrs Elaine Margaret Kempen (multiple shareholdings)
678,082 0.65%
9 Mr Bram Vander Jagt & Mrs Maaike Vander Jagt 650,000 0.62%
10 Grain Exporters (Australia) Pty Ltd 500,000 0.48%
11 Mr Michael Wu 431,244 0.41%
12 Marich Nominees 389,803 0.37%
13 BNP Parabis Nominees Pty Ltd 349,719 0.34%
14 Mr Roderick Lyle (multiple shareholdings) 320,000 0.31%
15 Mr Evan Philip Clucas and Ms Leanne Jane Weston 287,980 0.28%
16 BNP Parabis Nominees Pty Ltd Six Sis Ltd 285,197 0.27%
17 Mr Stephen Geoffrey Wilson & Ms Denise Adele Prandi 285,037 0.27%
18 Mr Danny Tauber 279,326 0.27%
19 Mr Colin Gregory Organ 271,000 0.26%
20 Mr John Charles Plummer 250,000 0.24%
86,824,268 83.32%
(c) Substantial shareholders
The names of substantial shareholders who have notified the Company in accordance with section 671B of the Corporations Law are:
Number of shares S. Hupert 27,137,660 A Hall 27,109,000
(d) Voting rights
All ordinary shares carry one vote per share without restriction.

Corporate Information
61
ABN 25 006 194 752
Directors
The names of the Directors of the Company in office during the year and until the date of this report are:
Peter Terence Kempen Chairman/Non-Executive Director/Chair - Audit & Risk Committee
Dr Sam Aaron Hupert Chief Executive Officer/Managing Director
Anthony Barry Hall Technology Director
Anthony James Glenning
Dr Leigh Bernard Farrell
Deena Robyn Shiff
Non-Executive Director
Non-Executive Director
Non-Executive Director/Chair - People & Culture Committee
Company Secretary
Clayton James Hatch
Registered Office
450 Swan Street
Richmond, VIC, 3121
(03) 9429 8800
Internet Address
www.promedicus.com.au
www.promedicus.com
www.visageimaging.com
Solicitors
Clayton Utz
Sci-Law Strategies
Morrison Foerster
Bankers
Westpac Banking Corporation
Auditors
Ernst & Young
Share Registry
Link Market Services Limited Level 12, 680 George Street Sydney NSW 2000 Australia Mailing address: Link Market Services Limited Locked Bag A14 Sydney South NSW 1235 Australia Telephone +612 8280 7111 Toll free 1300 554 474 Facsimile +612 9287 0303 Facsimile (proxy forms only) +612 9287 0309 E-mail [email protected] Website: www.linkmarketservices.com.au

Corporate Information
62
You can do so much more online Did you know that you can access – and even update – information about your holdings in Pro Medicus Limited via the Internet. Visit Link Market Services’ website www.linkmarketservices.com.au and access a wide variety of holding information, make some changes online or download forms. You can:
• Check your current and previous holding balances
• Choose your preferred annual report delivery option
• Update your address details
• Update your bank details
• Lodge, or confirm lodgement of, your Tax File Number (TFN), Australian Business Number (ABN) or exemption
• Check transaction and dividend history
• Enter your email address
• Check the share prices and graphs
• Download a variety of instruction forms
• Subscribe to email announcements You can access this information via a security login using your Security holder Reference Number (SRN) or Holder Identification Number (HIN) as well as your surname (or company name) and postcode (must be the postcode recorded on your holding record). Don’t miss out on your dividends Dividend cheques that are not banked are required to be handed over to the State Trustee under the Unclaimed Monies Act. You are reminded to bank cheques immediately. Better still, why not have us do your banking for you. Wouldn’t you prefer to have immediate access to your dividend payment? Your dividend payments can be credited directly into any nominated bank, building society or credit union account in Australia as cleared funds on dividend payment date – and we will still mail [(or email if you prefer)] you a dividend advice confirming your payment details. Not only can we do your banking for you, but payment by direct credit eliminates the risk of cheque fraud. Top 5 tips for Pro Medicus Limited investors visiting Link’s (our registry) website 1. Bookmark www.linkmarketservices.com.au – to bookmark, click on ‘Favourites’ on the menu
bar at the top of your browser then select ‘Add to Favourites’ 2. Create a portfolio for your holding or holdings and you don’t have to remember your SRN or
HIN every time you visit 3. Lodge your email via the ‘Communications Options’ and benefit from the online
communications options Pro Medicus Limited offers its investors 4. Check out the ‘FAQs’ page (accessible via the orange menu bar) for answers to frequently
asked questions 5. Use the ‘Client List’ page (accessible via the orange menu bar) to link to Pro Medicus Limited
website and the website of the other Link clients in which you invest. Contact Information You can also contact the Pro Medicus Limited share registry by calling +61 2 8280 7111 or Toll Free 1300 554 474