
Private Landlords Survey 2010 - gov.uk...Private Landlords Survey 2010 | 3Contents Chapter 1...
62
Private Landlords Survey 2010 www.communities.gov.uk
Transcript of Private Landlords Survey 2010 - gov.uk...Private Landlords Survey 2010 | 3Contents Chapter 1...
Private Landlords Survey 2010
www.communities.gov.uk


Private Landlords Survey 2010
October 2011Department for Communities and Local Government

Department for Communities and Local GovernmentEland HouseBressenden PlaceLondon SW1E 5DUTelephone: 030 3444 0000Website: www.communities.gov.uk
© Crown Copyright, 2011
Copyright in the typographical arrangement rests with the Crown.
This publication, excluding logos, may be reproduced free of charge in any format or medium for research, private study or for internal circulation within an organisation. This is subject to it being reproduced accurately and not used in a misleading context. The material must be acknowledged as Crown copyright and the title of the publication specified.
You may re-use this information (not including logos) free of charge in any format or medium, under the terms of the Open Government Licence. To view this licence, visit http://www.nationalarchives.gov.uk/doc/open-government-licence/ or write to the Information Policy Team, The National Archives, Kew, London TW9 4DU, or e-mail: [email protected].
If you require this publication in an alternative format please email [email protected]
DCLG PublicationsTel: 030 0123 1124Fax: 030 0123 1125
Email: [email protected] via the website: www.communities.gov.uk
October 2011
ISBN: 978-1-4098-3188-4

Private Landlords Survey 2010 | 3
Contents
Chapter1Introduction 5
1.1 Purpose of the report 5
1.2 Key Findings 5
1.3 Background 6
1.4 Inclusion of landlords and agents 7
1.5 The “Weighting” of Data 8
Chapter2Theprofileofprivatelandlords 9
2.1 Summary 9
2.2 Landlord Types 9
2.3 Length of time landlords’ have been letting – new and longer term landlords 12
2.4 Landlords’ income from letting and their experience or qualifications 13
2.5 Approaches to private renting – full-time and part-time landlords 14
Chapter3Ownershipandconditionincludingenergyefficiency 17
3.1 Summary 17
3.2 Dwelling types 17
3.3 Property condition 20
3.4 Energy Performance Certificate 23
Chapter4Thedynamicsofownershipintheprivaterentedsector 25
4.1 Summary 25
4.2 How dwellings were acquired 25
4.3 The dynamics of renting out dwellings 29
4.4 Commitment to the sector and rental expectations 31
Chapter5Thelettingandmanagementofprivatelyrenteddwellings 34
5.1 Summary 34
5.2 Letting characteristics 34
5.3 Letting and management practices 38
5.4 Deposits 41
Chapter6Financialinformation 44
6.1 Summary 44
6.2 Financial information 44

4 | Private Landlords Survey 2010
Chapter7Landlordandagentissuesandinformationneeds 48
7.1 Summary 48
7.2 Key issues for landlords and agents 48
7.3 The Housing Health and Safety Rating System (HHSRS) 51
7.4 Information and support for the Private Rented Sector 52
Appendix1Glossaryofterms 54
Appendix2PrivateLandlordsSurveyweightingprocess 57

Private Landlords Survey 2010 | 5
Chapter 1 Introduction
1.1 Purpose of the report
The purpose of this report is to provide some of the key information on the private rented sector that derives from the Private Landlords Survey (PLS) 2010.
1.2 Key Findings
• Eighty-nine per cent of landlords were private individual landlords responsible for 71% of all private rented dwellings, with a further 5% of landlords being company landlords responsible for 15% of dwellings.
• More than three quarters (78%) of all landlords only owned a single dwelling for rent, with only 8% of landlords stating they were full time landlords.
• The majority (54%) of dwellings met the Decent Homes Standard though this rose to nearly three-quarters (74%) for those let by new landlords. Over two-fifths (42%) of all dwellings have had an Energy Performance Certificate.
• Fifty-one per cent of all dwellings were acquired since 2000, 25% in the ten years between 1990 and 1999.
• In terms of formal letting and management practices, nearly all landlords and agents (97%) made use of a written tenancy agreement, with 91% requiring a deposit, and 84% requiring tenants to provide a reference.
• Almost half (47%) of all landlords were happy to rent to tenants on Housing Benefit (HB) or the Local Housing Allowance (LHA), with a further 21% saying they would be encouraged to do so if payments were not made direct to the tenant.
• In terms of issues considered a serious problem, 18% of landlords or agents stated issues related to HB or the LHA, and 10% the level of HB in the area. Issues not considered a problem by landlords were low demand (82%), mortgage payments (76%) and finding reliable builders (73%).
• A third (33%) of landlords and agents, who had heard of the Housing Health and Safety Rating System reported that 58% of the dwellings they were collectively responsible for had received some form of assessment for potential hazards.

6 | Private Landlords Survey 2010
1.3 Background
The Private Landlords Survey 2010 (PLS) is a national survey commissioned by the Department for Communities and Local Government (DCLG) of landlords and managing agents who own and/or manage privately rented properties in England. The aim of the survey is to provide a snap-shot of the composition and experience of landlords and how they (together with any agent) acquire, let, manage and maintain privately rented accommodation. A similar survey of private landlords was carried out by the department in the years 20011, 20032 and 20063. As with previous years, the 2010 survey was based on information collated on DCLG’s main housing survey. Respondents taking part in the 2007-08 English House Condition Survey (EHCS) and the 2008-09 English Housing Survey (EHS) who were recorded as private renters were asked to provide details of their landlord. These details formed the main sample for the 2010 PLS. The 2010 PLS thus consisted of 1,051 face-to-face and telephone interviews with landlords and agents who own and/or manage 1,109 dwellings included in the original EHCS or EHS survey. Interviews were carried out in April and May 2010. Some information, for example the length of current tenancy, age of dwelling, state of repair of the sampled property, were derived direct from the EHCS and EHS data. The combining of two years, one of the EHCS and one of the EHS, is needed because the number of private renters in any one year is small. Combining years enables the PLS to provide a profile of the private rented sector for England. However the sample size is still only sufficient to provide findings at the national level and not below this spatial level.
The private rented sector (PRS) is characterised by its diversity and choice. This is clearly demonstrated by the wide range of characteristics, attitudes, needs, expectations and experiences of those providing rented properties as well as the households who reside there. This report identifies and explores some of the different characteristics of landlords and agents and their varied approaches to letting, managing and maintaining property. It also examines and compares the types of problems and experiences of landlords in the course of letting property and the level of seriousness attributed to these as well as financial information and views on rents and housing benefit.
The sector is characterised by high rates of turnover in terms of both tenants and landlord ownership. Previous research conducted has discussed this in terms of both the positive and negative aspects of ‘churn’.4 This has reported that, for example, ‘churn’ in tenants can impact on management and maintenance of properties while in landlords on their professionalism and commitment.
1 2001 English House Condition Survey: Private Landlords Survey – http://www.communities.gov.uk/documents/corporate/pdf/145147.pdf
2 English House Condition Survey 2003: Private Landlords Survey – http://www.communities.gov.uk/documents/housing/pdf/144530.pdf
3 English House Condition Survey 2006: Private Landlords Survey – http://www.communities.gov.uk/documents/housing/pdf/privatelandlordsurvey.pdf
4 Rugg, J. and Rhodes, D. (2008). The Private Rented Sector: Its contribution and potential. Centre for Housing Policy, The University of York. Crook, A.D.H., and Kemp, P., Barnes, Y. and Ward, J. (2002) Investment Returns in the Private Rented Sector, London: British Property Federation

Private Landlords Survey 2010 | 7
This report examines the differences between new and longer-term landlords and also the differences between newly-let dwellings and those which have been in the sector for much longer. Additionally, the report explores issues involving the Housing Health and Safety Rating System (HHSRS) and energy efficiency, including landlords’ activities and experiences in addressing these.
Information on the Private Landlords Survey can be accessed via this link http//www.communities.gov.uk/housing/housingresearch/housingsurveys/
Information and past reports on the Private Landlords Survey can also be accessed via this link. The dataset will be made available to users via the UK Data Archive, http://www.data-archive.ac.uk/.
Annex tables referred to throughout the report may also be found at the link: http//www.communities.gov.uk/housing/housingresearch/housingsurveys/
If you have any queries about this report or would like any further information please contact [email protected].
This report and accompanying tables are classified as Official Statistics. The responsible statistician is Shane Brownie, Principal Research Officer, DCLG.
1.4 Inclusion of landlords and agents
The survey design has allowed the collection of information from either the landlord directly or, in some cases, from the agent on the landlord’s behalf. This is because landlords frequently delegate the letting and management of properties to agents. In some cases, landlords have elected to respond to the survey even though they use an agent for the actual management of their dwellings. As such, information from both these sources is used to inform the analysis. As a result of these inconsistencies, the role and influence of agents is, in some cases, examined separately within the private rented sector. For example, the letting and management practices between landlords and agents are compared. Where the views of landlords and agents are provided, the term “respondents” is used. Agents cannot always provide information that would be personal or confidential to a landlord (e.g. financial aspects of renting, plans for the future, qualifications and experience etc). However, they are likely to be more knowledgeable than the landlord about how the property is managed. As a result, because of the wider experience they frequently have, the agent can provide valuable insights in their own right of the conditions and issues in the private sector. The inclusion of agents, therefore, means that analysis of some questions may be enhanced, while for others the analysis can be less extensive. The proportion of each in the sample was 57% landlords to 43% agents.
8 | Private Landlords Survey 2010
1.5 The “Weighting” of Data
As a result of the way the sample for the PLS was derived, landlords who own larger portfolios of properties have a greater chance of being included in the sample than ‘smaller’ landlords. Furthermore, landlords with a large portfolio may have had more than one property within that portfolio sampled. To compensate for this, a ‘weight’ for landlords has been derived in addition to one for privately rented dwellings5. When applied these weights provide estimates based on the total number of landlords letting property or the total number of dwellings being let. The distinction is important because landlords with large portfolios of dwellings can have a greater influence on the overall letting and management practices of the sector as a whole than landlords who let one dwelling only. Thus, while 78% of all landlords let only one dwelling (landlord weight) only 40% of all privately rented dwellings were let by those landlords (dwelling weight). What weight is appropriate and used depends on the context and is made clear in the figures and tables provided and in the textual analysis. More detailed information on the development and application of the weighting methodology is provided in Appendix 2.
Direct comparisons between the results of 2003, 2006 and the 2010 PLS have to be treated with great caution due to the different sampling procedures used in the main housing surveys and the change in weighting methodology. However, when broad trends are apparent across the surveys these are noted.
5 A ‘weight’ is a value applied to a case that enables an estimate at a national level to be calculated from the information about that survey case. The sample was derived from the 2007-08 EHCS and the 2008-09 EHS and consequently the report’s estimates of the number of dwellings and landlords reflect the size of the sector at this time. Over the two years the number of dwellings averaged 3.0 million prior to the DCLG July 2011 revision of its methodology for making stock estimates (see Impact of the new methodology for splitting the private tenure into owner occupied and private rental sector at: www.communities.gov.uk/housing/housingresearch/housingstatistics/housingstatisticsby/stockincludingvacants/tenuresplit/). The tables and figures in this report reflect this earlier estimate of the size of the sector. The DCLG revised figures are 3.2 million for 2007 and 3.4 million for 2008, an average of around 3.3 million dwellings at the time the sample was derived.

Private Landlords Survey 2010 | 9
Chapter 2 Theprofileofprivatelandlords This chapter looks at the different types of landlord, their level of
involvement, the number of properties owned, relevant experience and qualifications, as well as how property is viewed and the proportion of landlords’ total income derived from renting.
2.1 Summary
• Eighty-nine per cent of landlords were private individual landlords, 5% were company landlords, and 6% were ‘other organisation’ landlords. These were responsible for 71%, 15% and 14%, respectively, of all dwellings in the sector.
• More than three-quarters (78%) of all landlords only owned a single dwelling for rent, comprising 40% of the total private rented housing stock.
• Twenty-two per cent of landlords had let properties for three years or less with two-thirds (69%) for 10 years or less. Only 5% had let for more than 40 years.
• Almost four-fifths (79%) of all landlords earned less than a quarter of their income from letting properties in the private rented sector with 21% of all landlords earned no income at all.
• Only 8% of all landlords in the private rented sector were full-time landlords with the remainder part-time landlords.
2.2 Landlord Types
Consistent with findings from previous Private Landlords Surveys, it was found that the large majority of landlords were private individuals who owned a single property, had no or little relevant experience or qualifications and that over half had let for 10 years or less.
• As with previous surveys, the PLS 2010 reports that the large majority of landlords were private individuals (Figure 2.1).
10 | Private Landlords Survey 2010
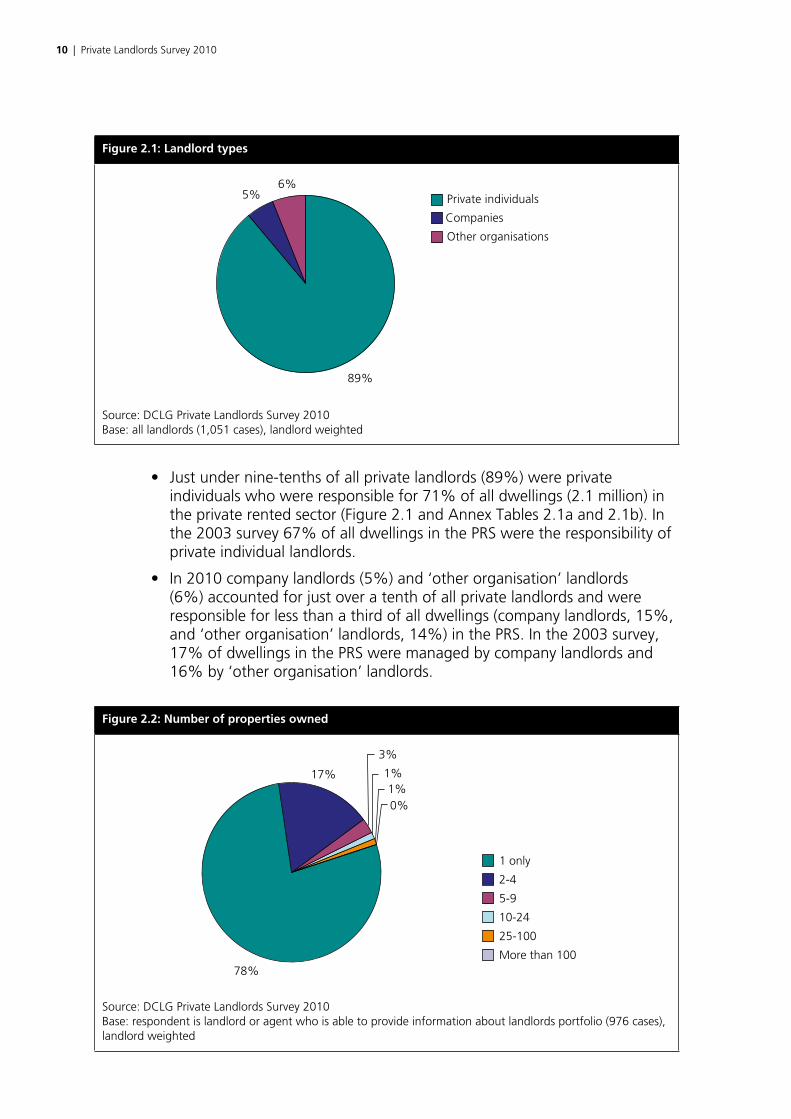
Figure2.1:Landlordtypes
89%
5%6%
Private individuals
Companies
Other organisations
Source: DCLG Private Landlords Survey 2010 Base: all landlords (1,051 cases), landlord weighted
• Just under nine-tenths of all private landlords (89%) were private individuals who were responsible for 71% of all dwellings (2.1 million) in the private rented sector (Figure 2.1 and Annex Tables 2.1a and 2.1b). In the 2003 survey 67% of all dwellings in the PRS were the responsibility of private individual landlords.
• In 2010 company landlords (5%) and ‘other organisation’ landlords (6%) accounted for just over a tenth of all private landlords and were responsible for less than a third of all dwellings (company landlords, 15%, and ‘other organisation’ landlords, 14%) in the PRS. In the 2003 survey, 17% of dwellings in the PRS were managed by company landlords and 16% by ‘other organisation’ landlords.
Figure2.2:Numberofpropertiesowned
78%
17%
3%
1%1%0%
1 only
2-4
5-9
10-24
25-100
More than 100
Source: DCLG Private Landlords Survey 2010 Base: respondent is landlord or agent who is able to provide information about landlords portfolio (976 cases), landlord weighted

Private Landlords Survey 2010 | 11
• More than three-quarters (78%) of all landlords only owned a single dwelling for rent, comprising 40% of the total private rented dwelling stock, while 95% owned less than five dwellings in their property portfolio, accounting for 61% of the entire private rented housing stock (Figure 2.2 and Annex Tables 2.2a and 2.2b). In 2003, landlords owning just one property controlled 33% of the total private rented stock, and those with less than five dwellings, 55%.
• A large majority of private individual landlords (81%) owned just one dwelling and 97% of these had less than five properties in their portfolio (Annex Table 2.2a).
• Only 3% of private individual landlords owned five or more dwellings. These landlords, however, accounted for almost a quarter (22%) of all dwellings owned by private individual landlords (Annex Tables 2.2a and 2.2b).
• Just over one-quarter of company landlords (27%) and a twentieth of ‘other organisations’ landlords (5%) owned 10 or more dwellings, with 2% of company landlords owning more than 100 properties (Annex Table 2.2a).
• Less than 1% of new landlords owned more than 5 dwellings (Annex Table 2.2a) with 95% owning just one property.
• Just 1% of private individual landlords owned 10 or more properties in their portfolio, but these accounted for 13% of all dwellings owned by all private individual landlords. Overall, less than 1% of all landlords owned 100 or more dwellings, but these landlords controlled over a tenth (11%) of all properties in the private rented sector (Figure 2.3 and Annex Tables 2.2a and 2.2b).
Figure2.3:Privatelandlordsandpropertyownershipbyportfoliosize
0
10
20
30
40
50
60
70
80
90
Landlordsowning
one property
Landlordsowning
2-4
Landlordsowning
5-9
Landlordsowning10-24
Landlordsowning25-100
Landlordsowning>100
%
% of landlords% of dwellings
Number of properties in portfolio
Source: DCLG Private Landlords Survey 2010 Base: landlord sample (976 cases), landlord weighted Base: dwelling sample (1,027 cases), dwelling weighted
12 | Private Landlords Survey 2010
2.3 Length of time landlords’ have been letting – new and longer term landlords
New landlords6 are defined here as landlords who have been letting dwellings for three years or less. Longer-term landlords are defined as landlords who have been letting properties for four or more years. This categorisation allows further analysis of trends in ownership, management and maintenance of dwellings which these landlords control.
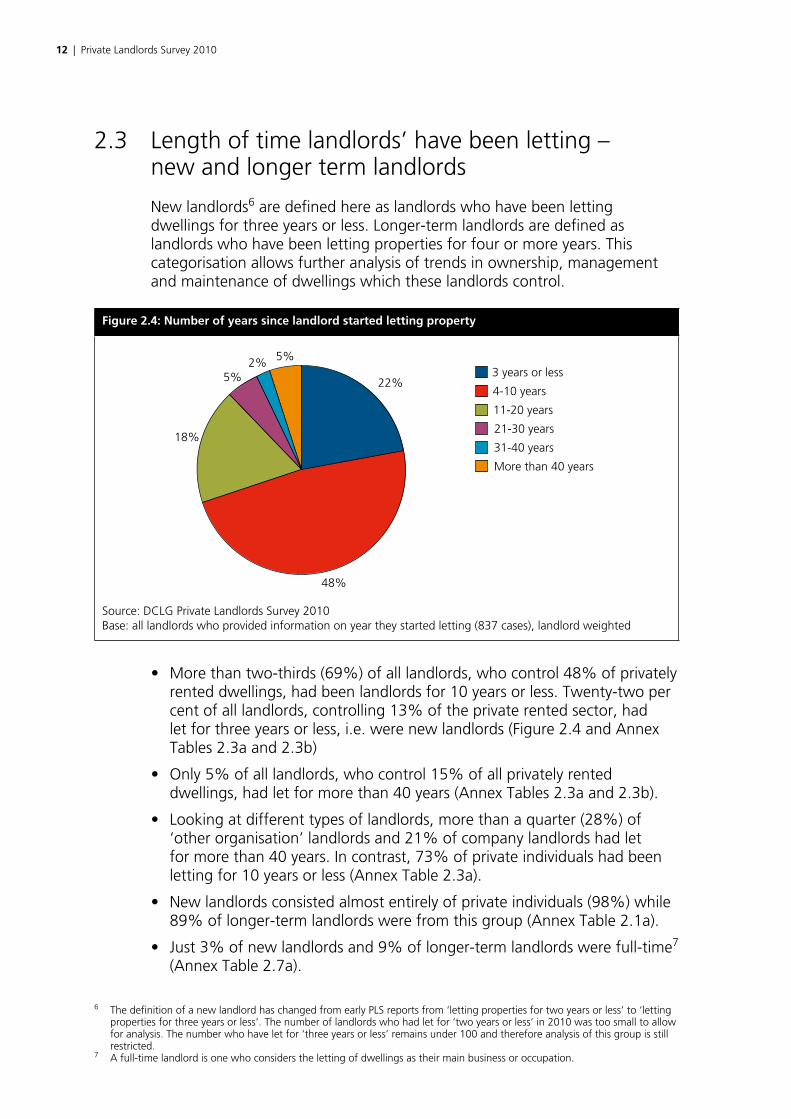
Figure2.4:Numberofyearssincelandlordstartedlettingproperty
22%
48%
18%
3 years or less
4-10 years
11-20 years
21-30 years
31-40 years
More than 40 years
5%2% 5%
Source: DCLG Private Landlords Survey 2010 Base: all landlords who provided information on year they started letting (837 cases), landlord weighted
• More than two-thirds (69%) of all landlords, who control 48% of privately rented dwellings, had been landlords for 10 years or less. Twenty-two per cent of all landlords, controlling 13% of the private rented sector, had let for three years or less, i.e. were new landlords (Figure 2.4 and Annex Tables 2.3a and 2.3b)
• Only 5% of all landlords, who control 15% of all privately rented dwellings, had let for more than 40 years (Annex Tables 2.3a and 2.3b).
• Looking at different types of landlords, more than a quarter (28%) of ‘other organisation’ landlords and 21% of company landlords had let for more than 40 years. In contrast, 73% of private individuals had been letting for 10 years or less (Annex Table 2.3a).
• New landlords consisted almost entirely of private individuals (98%) while 89% of longer-term landlords were from this group (Annex Table 2.1a).
• Just 3% of new landlords and 9% of longer-term landlords were full-time7 (Annex Table 2.7a).
6 The definition of a new landlord has changed from early PLS reports from ‘letting properties for two years or less’ to ‘letting properties for three years or less’. The number of landlords who had let for ‘two years or less’ in 2010 was too small to allow for analysis. The number who have let for ‘three years or less’ remains under 100 and therefore analysis of this group is still restricted.
7 A full-time landlord is one who considers the letting of dwellings as their main business or occupation.

Private Landlords Survey 2010 | 13
• Full-time landlords, for whom letting was their main business, were less likely to be new entrants to the sector. Only 9% had been letting for three years or less compared to 24% of landlords who let dwellings on a part-time basis (Annex Table 2.3a).
2.4 Landlords’ income from letting and their experience or qualifications
Landlord characteristics also have a bearing on the extent of income landlords derive from the sector.
• Almost four-fifths (79%) of all landlords, who control 61% of all privately rented dwellings, earned less than a quarter of their income from rent. This included just over a fifth of all landlords (21%) who received no income from their property rental (Annex Tables 2.5a and 2.5b).
• Landlords who were not generating income from their properties included cases where rent-free accommodation was provided to family or friends.
• There was little difference in the proportion of income derived from letting properties between new and longer-term landlords. Twenty-three per cent of new landlords compared with 20% of longer-term landlords received no income from renting, with 81% and 78% respectively receiving less than a quarter of their total income from this source (Annex Table 2.5a).
The following section looks at the level of qualifications and/or experience among landlords. It focuses on private individual landlords since company and ‘other organisation’ landlords are normally not individuals and therefore will have a range of experience and qualifications across the company or organisation.
• Over three-fifths (63%) of all private individual landlords had no relevant experience or qualifications, although 17% had building trade experience with a further 6% experience of working in a property-related sector. Twenty per cent had a relevant professional qualification (Figure 2.5 and Annex Table 2.4).
• Just under half (47%) of landlords or their managing agents were members of a professional body or organisation related to property or buildings. (Annex Table 2.6).
• Only 6% of landlords were members of a relevant professional body or organisation, compared with 85% of agents (Annex Table 2.6).

14 | Private Landlords Survey 2010
Figure2.5:Privateindividuallandlords’relevantexperienceand/orqualifications
2%
4%
15%
15%
1%
63%
Property experience only
Property experience andqualificationsQualifications only
Building experience only
Building experience andproperty experienceNone of these
Source: DCLG Private Landlords Survey 2010 Base: only private individual landlords (396 cases), landlord weighted
2.5 Approaches to private renting – full-time and part-time landlords8
Full-time landlords gain more of a proportion of their income from the sector than part-time landlords. However, full-time landlords do not necessarily provide dwellings of a higher quality than other landlord types.
Figure2.6:Natureoflandlords’involvementinlettingproperty
8%
92%
Full-time landlords
Part-time landlords
Source: DCLG Private Landlords Survey 2010 Base: landlord sample (998 cases), landlord weighted
8 Data from 2010 are not comparable with earlier PLS. Previous studies contained a group entitled ‘Property sector sideline landlords’. However this group has declined to such an extent, it was not included as a separate answer category in 2010.

Private Landlords Survey 2010 | 15
• Less than a tenth (8%) of all landlords in the private rented sector were full-time landlords but they owned or controlled almost a quarter (24%) of the dwelling stock (Figure 2.6, Figure 2.7 and Annex Tables 2.7a and 2.7b). This proportion of the dwelling stock is unchanged from the 2003 PLS.
• The large majority of landlords (92%) were part-time landlords. These part-time landlords controlled over three-quarters (76%) of all private rented dwellings (Figure 2.7 and Annex Tables 2.7a and 2.7b).
Figure2.7:Natureoflandlords’involvementinlettingproperty
0
10
20
30
40
50
60
70
80
90
100
All landlords All dwellings*
%
Full-time landlords
Part-time landlords
Source: DCLG Private Landlords Survey 2010 Base: landlord sample (998 cases), landlord weighted *Base: dwelling sample (1,049 cases), dwelling weighted
• Almost four-fifths (79%) of full-time landlords were private individuals, while 13% were companies and 8% other organisations. Of the dwellings owned by full-time landlords, 50% were owned by private individuals. The remaining dwellings owned by full-time landlords were owned by companies (35%) or other organisations (16%) (Figure 2.8 and Annex Tables 2.8a and 2.8b).
• Over nine-tenths (91%) of part-time landlords were private individuals, owning over three-quarters (77%) of the properties owned by part-time landlords (Figure 2.8 and Annex Tables 2.8a and 2.8b).
• Most part-time landlords (84%) earned less than 25% of their income from rent. However more than half (57%) of all full-time landlords earned 50% or more of their income from renting out dwellings (Annex Table 2.5a).
• Some 40% of full-time landlords and 30% of companies derived over 75% of their income from renting out properties (Annex Table 2.5a)

16 | Private Landlords Survey 2010
Figure2.8:Landlordtypebyextentofinvolvementinthesector
0% 20% 40% 60% 80% 100%
All landlords
Full-time
Part-time
Private individuals Companies Other organisations
Source: DCLG Private Landlords Survey 2010 Base: full landlord sample (1,051 cases), landlord weighted

Private Landlords Survey 2010 | 17
Chapter 3 Ownershipandconditionincludingenergyefficiency This chapter examines the differences in ownership of dwellings between
new9 and longer-term landlords. It looks particularly at the rates of non-decency of dwellings and how this may be linked to the age and type of dwelling. Some consideration is also given to the extent to which agents are associated with the letting and management of non-decent homes.
3.1 Summary
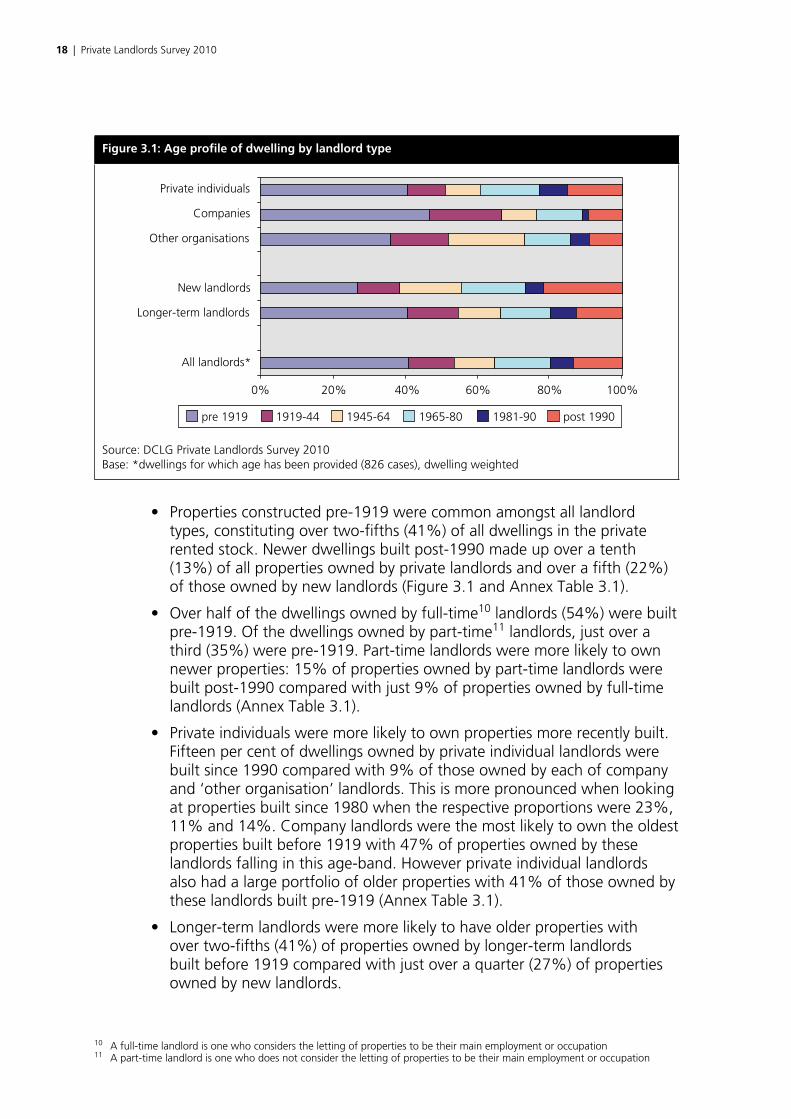
• The 2009-10 EHS reported that over two-fifths (41%) of all dwellings in the private rented stock were built before 1919 with just 13% being built post-1990.
• Fifty-four per cent of dwellings owned by full-time landlords were built before 1919 compared with 35% of those owned by part-time landlords.
• Over two-fifths (41%) of properties owned by longer-term landlords were built before 1919 compared with over a quarter (27%) of dwellings owned by new landlords.
• Three-fifths (60%) of all dwellings in the private rented sector were houses with a further 26% that were purpose built flats and 14% converted flats.
• Over half (54%) of all private rented dwellings met the Decent Home Standard, while over two-fifths (42%) of all dwellings have had an Energy Performance Certificate assessment carried out on them.
3.2 Dwelling types
Data from the PLS 2010 suggests that different landlord types have variations in their property portfolio which reflect their experience in the sector, their preferences and the opportunities available. Longer-term landlords were found to have a more diverse portfolio of stock and a larger stock holding within the sector. Newer landlords tended to own and introduce a more modern dwelling profile to the sector that are, perhaps, easier to manage and maintain.
9 New landlords are landlords who have been letting for three years or less
18 | Private Landlords Survey 2010
Figure3.1:Ageprofileofdwellingbylandlordtype
0%
pre 1919
20% 40% 60% 80% 100%
All landlords*
Longer-term landlords
New landlords
Other organisations
Companies
Private individuals
1919-44 1945-64 1965-80 1981-90 post 1990
Source: DCLG Private Landlords Survey 2010 Base: *dwellings for which age has been provided (826 cases), dwelling weighted
• Properties constructed pre-1919 were common amongst all landlord types, constituting over two-fifths (41%) of all dwellings in the private rented stock. Newer dwellings built post-1990 made up over a tenth (13%) of all properties owned by private landlords and over a fifth (22%) of those owned by new landlords (Figure 3.1 and Annex Table 3.1).
• Over half of the dwellings owned by full-time10 landlords (54%) were built pre-1919. Of the dwellings owned by part-time11 landlords, just over a third (35%) were pre-1919. Part-time landlords were more likely to own newer properties: 15% of properties owned by part-time landlords were built post-1990 compared with just 9% of properties owned by full-time landlords (Annex Table 3.1).
• Private individuals were more likely to own properties more recently built. Fifteen per cent of dwellings owned by private individual landlords were built since 1990 compared with 9% of those owned by each of company and ‘other organisation’ landlords. This is more pronounced when looking at properties built since 1980 when the respective proportions were 23%, 11% and 14%. Company landlords were the most likely to own the oldest properties built before 1919 with 47% of properties owned by these landlords falling in this age-band. However private individual landlords also had a large portfolio of older properties with 41% of those owned by these landlords built pre-1919 (Annex Table 3.1).
• Longer-term landlords were more likely to have older properties with over two-fifths (41%) of properties owned by longer-term landlords built before 1919 compared with just over a quarter (27%) of properties owned by new landlords.
10 A full-time landlord is one who considers the letting of properties to be their main employment or occupation11 A part-time landlord is one who does not consider the letting of properties to be their main employment or occupation

Private Landlords Survey 2010 | 19
• New landlords had the highest proportion of new buildings within their portfolio. More than a fifth (22%) of all dwellings owned by new landlords were built post 199012. This compared with 13% of longer-term landlords who owned properties built at this time (Figure 3.1 and Annex Table 3.1).
• Three-fifths (60%) of dwellings owned by all landlords were houses; over half (31% of all dwellings) of these were terraced houses. A larger proportion of dwellings owned by all landlords were purpose-built flats (26%) than converted flats (14%) (Figure 3.2 and Annex Table 3.2).
Figure3.2:Dwellingtypeprofilebylandlordtype
Terraced house
Semi-detached house
Detached house Converted flat
0% 20% 40% 60% 80% 100%
All landlords*
Longer-term landlords
New landlords
Other organisations
Companies
Private individuals
Purpose-built flat
Source: DCLG Private Landlords Survey 2010 Base: *dwellings for which age has been provided (826 cases), dwelling weighted
• Dwelling type owned by landlords varied considerably by the type of landlord. Just over a third (35%) of properties in the portfolio of private individual landlords were terraced houses. By comparison 32% of dwellings owned by company landlords were purpose-built flats while 28% of dwellings owned by ‘other organisation’ landlords were detached households.
• The dwelling type least likely to be owned by private individual or company landlords was a detached house (10% and 11% of dwellings owned by each group respectively), while for ‘other organisation’ landlords it was converted flats (10% of dwellings owned by other organisations).
• The distribution of types of dwelling differed across the various landlord types. Just under a half (49%) of dwellings owned by company landlords and 41% of those owned by private individual landlords were flats. Just 28% of ‘other organisation’ landlords owned dwellings of this type. (Figure 3.2 and Annex Table 3.2).
12 Please note that sample size for new landlords is less than 100 cases. As such due care should be taken when generalising from the analysis reported above.

20 | Private Landlords Survey 2010
• Although the proportion of flats which were owned by new landlords (36%) and longer-term landlords (35%) were quite similar, over a quarter (28%) of all dwellings owned by new landlords were purpose built flats, compared to less than a quarter (22%) of dwellings owned by longer-term landlords. Longer-term landlords owned a higher proportion of converted flats (13% of dwellings owned by longer-term landlords) when compared to new landlords where less than a tenth (8%) of their portfolio was made up of this dwelling type (Annex Table 3.2).
• Full-time landlords were twice as likely as part-time landlords to own converted flats. Twenty-one per cent of dwellings owned by full-time landlords were converted flats compared with just 11% of those owned by part-time landlords (Annex Table 3.2).
3.3 Property condition
The English Housing Survey (EHS) provides annual assessments of the condition and energy efficiency of the private rented sector.13 The overall findings from the EHS indicate that, from a historically low baseline, above average improvement has occurred in the sector’s condition (for example in the degree or level of disrepair) and energy efficiency (as measured by the Standard Assessment Procedure (SAP) rating14). Nevertheless the private rented sector continues to have a higher incidence of dwellings failing to meet the decent homes standard compared with social housing and the owner occupied sector. At least in part this is related to the older profile of the sector with the EHS reporting some 40% of its stock having been built before 1919, compared to 21% of the housing stock as a whole.
A decent home is defined as a dwelling which meets the following criteria:15
a) It meets the current statutory minimum standard for housing.16
b) It is in a reasonable state of repair
c) It has reasonably modern facilities and services
d) It provides a reasonable degree of thermal comfort.
The previous section demonstrates that new landlords own property portfolios which on average are more modern than those of longer-term landlords and it follows that a higher proportion of new landlords’ lettings are therefore more likely to be able to meet the Decent Homes Standard.
13 The latest findings from the EHS can be found in its headline Report 2009/10 at: http://www.communities.gov.uk/documents/statistics/pdf/1851086.pdf
14 Standard Assessment Procedure (SAP) rating. See glossary for details 15 DCLG Report (2006) A Decent Home: Definition and guidance for implementation16 From April 2006 the Fitness Standard was replaced by the Housing Health & Safety Rating System (HHSRS). Under Decent
Homes a dwelling does not meet the standard if one or more HHSRS Category 1 hazards are present.

Private Landlords Survey 2010 | 21
Figure3.3:Decenthomesbylandlordtype
0% 20% 40% 60% 80% 100%
All landlords*
Longer-term landlords
New landlords
Other organisations
Companies
Private individuals
Dwelling is decent Fails HHSRS, repair or modernisation Fails thermal comfort only
Source: DCLG Private Landlords Survey 2010 Base: *dwellings for which age has been provided (826 cases), dwelling weighted
• Over half (54%) of all private rented dwellings in the PLS met the Decent Home Standard17. Almost two-fifths (39%) of all dwellings did not meet all of the Housing Health and Safety Rating System (HHSRS) (minimum standard), repair or modernisation criteria, while a further 7% failed the thermal comfort only criterion only (Figure 3.3 and Annex Table 3.3).
• Properties owned by new landlords were most likely to meet the Decent Homes Standard, with nearly three-quarters (74%) doing so compared to just over half (52%) of properties owned by longer-term landlords (Figure 3.3 and Annex Table 3.3).
• Only 22% of dwellings owned by new landlords did not meet all of the HHSRS, repair or modernisation criteria and a further 4% did not meet the thermal comfort criterion (4%) (Annex Table 3.3).
• There was little difference between landlords who were private individuals, companies or other organisations in meeting the Decent Homes Standard with just over half of all properties in their respective portfolios meeting the standard.
• There was also little difference in the average condition of dwellings let by full or part-time landlords.
• Dwellings acquired by landlords before 1970 were less likely than dwellings acquired later to meet the Decent Homes Standard (40% compared with over a half acquired post 1970). Generally, the more recent the dwelling had been acquired the less likely it was non-decent (Figure 3.4 and Annex Table 3.4).
17 The estimates of non-decency reported here are from the Private Landlords Survey. The latest and preferred estimate available from the EHS is that 59% of the private rented stock met the Standard in 2009, compared to 54% found in the PLS. The emphasis in this report is on the relative differences between types of landlords rather than the overall incidence of decency itself.

22 | Private Landlords Survey 2010
Figure3.4:Proportionofdwellingsnon-decentbywhenacquired
0
10
20
30
Prop
ortio
n of
dw
ellin
gs n
on-d
ecen
t
40
50
60
70
Before 1970 1970-1989 1990-1999
Period acquired
2000-2004 2005-2009 All dwellings*
Source: DCLG Private Landlords Survey 2010 Base: *dwellings for which age has been provided (826 cases), dwelling weighted
Figure3.5:Proportionofdwellingsnon-decentbylengthofcurrenttenancy
Period acquired
0
10
20
30
Prop
ortio
n of
dw
ellin
gs n
on-d
ecen
t
40
50
60
Vacant attime of landlordinterivew
Less than3 years
3-4 years 5-6 years 7-10 years More than10 years
All dwellings*
Source: DCLG Private Landlords Survey 2010 Base: *dwellings for which age has been provided (826 cases), dwelling weighted
• Over half (56%) of dwellings acquired before 1970 failed to meet all three of the HHSRS, repair or modernisation criteria compared to only a third of dwellings acquired between 2005-2009 (Annex Table 3.4).
• The condition of dwellings was broadly similar for all current tenancies under 10 years in length including those vacant at the time of interview with the landlord. Less than half of dwellings failed to meet the Decent

Private Landlords Survey 2010 | 23
Homes Standard, however over half (55%) of dwellings that had been occupied by the current tenant for more than 10 years were considered non-decent (Figure 3.5 and Annex Table 3.5).
• Non-decent dwellings were found in similar proportions among dwellings managed by agents and those managed by landlords themselves (Annex Table 3.6).18
3.4 Energy Performance Certificate
Energy performance certificates (EPC) give information on how to make a dwelling more energy efficient and reduce carbon dioxide emissions. EPCs provide ratings comparing a properties’ current energy efficiency and carbon dioxide emissions with potential figures that the property could achieve. A key purpose of EPCs is to drive energy awareness and efficiency throughout the domestic housing stock. Since 2008, an EPC has been required whenever a property is constructed, rented or sold. This section examines the extent to which EPCs have been used within the private rented sector.
Figure3.6:WhetheranEnergyPerformanceCertificatehasbeenobtained
42%
38%
20%
Yes
No – and landlord doesn’t plan to
No – but landlord plans to
Source: DCLG Private Landlords Survey 2010 Base: all dwellings, dwelling weighted
• At the time of the survey, an EPC had been obtained for over two-fifths (42%) of all dwellings in the private rented sector, while for a further fifth of dwellings landlords stated that they were intending to obtain one. However, 38% of dwellings did not have an EPC and the landlord had no plans to obtain one (Figure 3.6 and Table 3.7).
• Dwellings owned by a private individual landlord were more likely to have an EPC than those owned by a company or ‘other organisation’ landlord: 46% of private individual landlords’ dwellings had a certificate compared with 30% of dwellings owned by company landlords and 31% by ‘other organisation’ landlords (Annex Table 3.7).
18 Sample numbers for dwellings managed by agent is small for this analysis

24 | Private Landlords Survey 2010
• Fifty-seven per cent of all new landlords’ dwellings had an EPC and for a further 16% the landlord planned to obtain one. A lower proportion of dwellings owned by longer-term landlords had a certificate (37%) with plans to do so for a further 21%. For this group of landlords there was, therefore, neither an EPC nor a plan to obtain one for just over two-fifths (42%) of their dwellings (Annex Table 3.7).
• Minor changes had been made to 10% and substantial changes had been made to a further 11% of all dwellings with an EPC. However no changes were planned for 70% of dwellings with an EPC (Figure 3.7 and Annex Table 3.8).
Figure3.7:Landlord’sactionatdwellingfollowingprovisionofanEnergyPerformanceCertificate
9%
11%
10%
70%
Yes – minor changes made (under £50)
Yes – substantial changes made (over £50)
No – but landlord plans to make some changes
No – do not plan to make any changes
Source: DCLG Private Landlords Survey 2010 Base: dwellings where an EPC has been carried out (424 cases), dwelling weighted
Private Landlords Survey 2010 | 25
Chapter 4 Thedynamicsofownershipintheprivaterentedsector
4.1 Summary
• Over three-quarters (77%) of all dwellings in the PRS were purchased by the landlord, 9% were inherited and 8% were built by the landlord.
• Fifty-one per cent of all dwellings were acquired since 2000, 25% in the ten years between 1990 and 1999 and 24% prior to this date.
• A mortgage was used when acquiring 56% of dwellings in the private rented sector, with personal savings being the next most common means of finance used to acquire 21% of dwellings.
• Seventy-seven per cent of all dwellings were acquired with the intention to let. This applied to 92% of dwellings owned by company landlords, 84% of those owned by ‘other organisation’ landlords and 72% owned by private individual landlords. However just 47% of new landlords stated they acquired the dwelling with the aim of letting it out.
• Over one-fifth (22%) of dwellings in the private rented sector were either once lived in or still lived in by the landlord.
• If the property became vacant tomorrow, 78% of landlords would expect to re-let. Of these, 59% of dwellings were expected to re-let at the same rent, 40% at a higher rent and just 1% at a lower rent.
4.2 How dwellings were acquired
Dwellings are introduced into the private rented sector (PRS) in a number of ways and for a variety of reasons. The diversity of property types and conditions within the PRS reflect the different patterns of acquisition and introduction over time. While most properties are acquired or built specifically for rent, others are purchased for other reasons before being rented out, which may include use as a family home or a business premises. Their introduction into the PRS results from changes in the objectives and circumstances of their owners. The following section examines some of the outcomes of these influences on the patterns of acquisition of different landlord categories.

26 | Private Landlords Survey 2010
Figure4.1:Methodofacquisition
9%
77%
2%
1%
8%3%
Inherited
Bought
Received as a gift
Acquired the organisation that owned it
Built it
Others
Source: DCLG Private Landlords Survey 2010 Base: respondent is landlord or agent and able to answer how property acquired (822 cases), dwelling weighted
• Respondents (landlords or agents able to answer for the landlord) were asked how each dwelling was acquired. Just over three-quarters (77%) of all dwellings in the PRS were purchased by the landlord. Almost a tenth (9%) were inherited while a further 8% were built by the landlord (Figure 4.1 and Annex Table 4.1).
• This is reflected across the different landlord categories with buying being by far the most likely method of acquiring the dwelling: 85% of dwellings owned by private individual landlords and 79% by company landlords, but only 39% by ‘other organisation’ landlords. Just under a third (31%) of dwellings owned by ‘other organisation’ landlords were built specifically for renting. This compared with 13% of all dwellings owned by company landlords and just 2% by private individual landlords (Annex Table 4.1).
• Although the differences were smaller, ‘other organisation’ landlords had a higher proportion of their property portfolio acquired through inheritance (12%) when compared with the remaining landlord categories. Private individual landlords acquired 10% of their portfolio through inheritance while for company landlords it was just 3% (Annex Table 4.1).
• Almost all dwellings owned by new landlords were acquired by being bought (86%) or through inheritance (9%). Similar proportions were seen for longer-term landlords with 77% of dwellings owned by this group acquired by being bought and 9% through inheritance. However longer-term landlords also acquired 8% of their portfolio through building them. (Annex Table 4.1).
• Just over half (51%) of all dwellings in the PRS were acquired in the 10 years since 2000, 26% between 1990 and 1999, and 23% prior to 1990 (Annex Table 4.2).

Private Landlords Survey 2010 | 27
• Almost three-fifths (59%) of dwellings owned by private individual landlords were acquired within the last 10 years (2000-2009) while 46% of properties owned by company landlords were acquired in this period. These landlord types thus have a significant impact on the level of churn of properties introduced into the PRS. By contrast, just 22% of properties owned by ‘other organisation’ landlords were acquired during this period (Annex Table 4.2).
• Dwellings acquired 40 or more years ago constitute over a third (36%) of the properties owned by ‘other organisation’ landlords, but just 17% for company landlords and only 4% for private individual landlords (Annex Table 4.2).
• As one would expect, a large majority of the dwelling stock owned by new landlords was acquired since the beginning of 2005 (87%) (Annex Table 4.2).
• Almost three-fifths (59%) of all dwellings in the PRS were purchased from the existing housing stock. Seven per cent of dwellings in the PRS were bought directly from fellow landlords, 5% purchased new from a developer and 4% were built specifically for the buy-to-let market. The remaining 25% of properties were acquired in some unspecified way (Figure 4.2 and Annex Table 4.3).
Figure4.2:Typeofstockwhenacquired
Purchased fromexisting housing stock
Purchased brand newfrom a developer
Built specifically for thebuy to let market
Bought directly fromfellow landlordsexisting rental stock
None of the above
59%
5%
4%
7%
25%
Source: DCLG Private Landlords Survey 2010 Base: respondent is landlord or agent and able to answer how property acquired (828 cases), dwelling weighted
• Around two-thirds (67%) of private individual landlords’ portfolios were purchased from the existing housing stock. This compared with over a half (51%) of dwellings owned by company landlords and a third (33%) by ‘other organisation’ landlords (Annex Table 4.3).
• Company landlords were the most likely to have bought existing rental stock directly from fellow landlords, with one-fifth (20%) of their property portfolio acquired in this way (Annex Table 4.3).
• Stock built specifically for the buy-to-let market made up almost a tenth of dwellings owned by ‘other organisation’ landlords (9%), 7% by company landlords and just 1% by private individual landlords (Annex Table 4.3).

28 | Private Landlords Survey 2010
Respondents were asked what sources of finance they used when acquiring a dwelling for use in the PRS. All sources were recorded.
While mortgages are an influential factor in the acquisition of dwellings in the PRS, other income streams are relevant. Mortgages were the source of funding the acquisition of dwellings for the PRS that was used the most, although personal savings was also an important source. However, there are variations in how these funding options are utilised by different landlord types and this section looks more closely at these variations.
Figure4.3:Sourcesoffinanceforacquisition
0
Private individual
10 20 30%
40 50 60 70
Other
Rental income
Other loan
Other business income
Commercial loan
Personal savings
Mortgage
Companies Other organisations All dwellings
Source: DCLG Private Landlords Survey 2010 Base: respondent is landlord or agent (who can respond on behalf of landlord) and the property was bought (591 cases), dwelling weighted
• A mortgage was used in the acquisition of 56% of dwellings owned by 69% of landlords in the PRS with 21% of dwellings owned by 22% of landlords using personal savings (Figure 4.3 and Annex Tables 4.4a and 4.4b).
• Almost two-thirds (64%) of dwellings owned by private individual landlords were purchased using a mortgage, while 35% of dwellings owned by company landlords and a quarter (25%) of ‘other organisation’ landlords dwelling stock were financed this way (Annex Table 4.4a).
• Company landlords acquired 34% of their dwelling stock using funding from income derived from other rentals or business. By comparison just over a tenth (12%) of dwellings owned by ‘other organisation’ landlords and 4% by private individual landlords were funded in a similar way (Figure 4.3 and Annex Table 4.4a).
• Personal savings were widely used in financing the purchase of dwellings for the PRS. This applied to 22% of dwellings owned by private individual landlords, 18% by ‘other organisation’ landlords and 14% of company landlord dwellings (Figure 4.3 and Annex Table 4.4a).

Private Landlords Survey 2010 | 29
4.3 The dynamics of renting out dwellings
A variety of factors affect what properties are introduced into the PRS and how these are acquired and maintained in the short, medium and long term. Some of these factors include whether landlords intended to let from the start and what form of return the landlords are expecting from their investment.
• More than three-quarters (77%) of all dwellings were acquired with the intention to let (Annex Table 4.5).
• Almost all dwellings owned by company landlords (92%) and 84% by ‘other organisation’ landlords were acquired with the intention to let. Seventy-two per cent of dwellings owned by private individual landlords were acquired with this intention (Annex Table 4.5).
• In contrast, dwellings owned by new landlords were evenly divided between whether they were acquired with the intention of letting (47%) or not (53%). In comparison four-fifths (80%) of dwellings owned by longer-term landlords were intended for the PRS when they were acquired (Annex Table 4.5).
• Over one-in-five (22%) dwellings in the PRS were once lived in or still lived in by their landlord. The largest portion of this group (62%) was made up of dwellings where the landlord had previously lived in the property and had not originally intended to let it. These were all properties where the landlord was a private individual (Annex Tables 4.6a and 4.6b).
• Over a third (36%) of new landlord dwellings were either occupied by the landlord at sometime or was their current residence. This compares to less than a fifth (19%) of dwellings owned by longer-term landlords (Annex Table 4.6a).
Landlords were asked how, at the time of interview, they best regarded the property in terms of an investment, pension or otherwise. Findings from previous Private Landlords Surveys indicate that a majority of dwellings were considered an investment by their landlords. In 2003 and 2006, some 60% of dwellings were regarded as an investment or pension by their landlords. Though figures from the 2010 survey cannot be compared directly with previous surveys, similar results were found.
• Two-thirds (66%) of all dwellings were regarded as an investment or pension by their owners while 10% were considered a current or future home for relatives or friends. A further 10% of all dwellings were considered housing for employees or for people in need (Figure 4.4 and Annex Table 4.7).
• Over three-quarters (76%) of dwellings owned by a private individual landlord were regarded as an investment or pension. By comparison less than two-thirds (63%) of dwellings owned by company landlords and less than one-third (32%) by ‘other organisation’ landlords were regarded in this way (Figure 4.4 and Annex Table 4.7).

30 | Private Landlords Survey 2010
Figure4.4:Howdwellingiscurrentlyregarded
0 10 20 30 40 50 60 70 80
Other
Incidental to another activity
Housing for people in need
Employee housing
A property I'd like to sell but can't
Current/future home for family/relatives
Investment/pension
%
Private individual Companies Other organisations All landlords
Source: DCLG Private Landlords Survey 2010 Base: respondent is landlord (625 cases), dwelling weighted
• Two-fifths of dwellings owned by ‘other organisation’ landlords were considered either employee housing (31%) or housing for people in need (9%), while just 13% of dwellings owned by company landlords were regarded in this way (Figure 4.4 and Annex Table 4.7).
• Just over half (53%) of dwellings owned by new landlords were considered an investment or pension while a further 27% were considered a current or future home for self, relatives or friends. For longer-term landlords, over two-thirds (69%) regarded the dwelling as an investment or pension while only 8% thought of it as a current or future home for themselves, relatives or friends (Annex Table 4.7).
• Of all the dwellings in the PRS which were viewed as an investment by their landlords, only a third (33%) were considered as a source of rental income alone by their owners. Just under a quarter (24%) of dwellings were considered as a long-term investment through capital appreciation while 43% were regarded as investment opportunities which provide both income and capital appreciation benefits for their landlords (Figure 4.5 and Annex Table 4.8).

Private Landlords Survey 2010 | 31
Figure4.5:Typeofreturnoninvestmentsoughtbylandlordtype
0% 20% 40% 60% 80% 100%
All landlords
Other organisations
Companies
Private individuals
Income only Capital growth only Income and capital growth
Source: DCLG Private Landlords Survey 2010 Base: respondent is landlord and property regarded as an investment (401 cases), dwelling weighted
4.4 Commitment to the sector and rental expectations
The PLS 2010 also seeks to explore landlords long-term commitment to the PRS through an understanding of their future intentions for their property portfolio. The responses enable an analysis of whether different landlord types expect to increase or reduce the number of dwellings to be let or an expectation to quit the sector altogether.
• Seventy-eight per cent of landlords, who own 84% of dwellings in the PRS, expected to re-let their properties if they were to become vacant tomorrow. There was little difference in these proportions across the different landlord categories or between new and longer-term landlords (Annex Tables 4.9a and 4.9b).
• This showed little change from the 2003 survey when 77% of landlords expected to re-let their properties. However looking at the different landlord categories, there was an increase in the proportion of private individual landlords and new landlords who expected to re-let, bringing these two categories more into line with the ‘other landlord’ types in 2010.
• Of the dwellings that landlords expected to re-let if they became vacant, for 59% of dwellings (owned by 52% of landlords) landlords expected to re-let at the same rent. Almost all of the remainder were expected to be re-let at a higher rent (40% of dwellings) with just 1% expecting to re-let at a lower rent (Annex Tables 4.10a and 4.10b).
• Nearly three-quarters of dwellings in the PRS owned by company landlords (71%) or ‘other organisation’ landlords (73%) were expected to be re-let at the same rent. However only 51% of dwellings owned by private individuals were expected to be re-let at the same rent, with an almost

32 | Private Landlords Survey 2010
equivalent number (48%) expected to be re-let at a higher rent (Annex Table 4.10a).
• For those dwellings which were expected not to be immediately re-let once they become vacant, 57% were expected to be sold as is, sold following renovations, or sold following conversion into flats, while 16% were expected to be re-introduced into the PRS following renovations (Annex Table 4.11).
• Over a tenth (13%) of all landlords (who own or control 7% of all dwellings in the PRS) expected to quit the PRS over the next two years. This was consistent across all types of landlord with the exception of new landlords where 24% of new landlords were planning to leave the PRS (Annex Tables 4.12a, 4.12b and 4.13a).
• Twenty-six per cent of landlords expected to leave the PRS over the next five years. Again this was consistent across all types of landlord, but this time with the exception of full-time landlords where only 9% plan to leave the PRS within this period (Annex Table 4.12b).
• Extending the time period further to the next ten years, 52% of all landlords (controlling 66% of all dwellings) expected to still be renting within the PRS at the end of this period. Around two-thirds of company and ‘other organisation’ landlords (67% and 65% respectively) expected to still be renting after this time, although only 50% of private individual landlords did so (Annex Tables 4.12a and 4.12b).
The following analysis excludes those landlords and dwellings that were expected to have left the sector within two years.
Figure4.6:Expectationsoverthenexttwoyears
0 10 20 30 40 50 60 70 80 90
All dwellings
Part-time landlords
Full-time landlords
Longer-term landlords
New landlords
Other organisations
Companies
Private individuals
%
Increase number of dwellings let Stay the same Reduce the number of dwellings let
Source: DCLG Private Landlords Survey 2010 Base: all dwellings where landlord can provide a response (564 cases), dwelling weighted

Private Landlords Survey 2010 | 33
• While 84% of all landlords (controlling 68% of all dwellings in the PRS) expected their portfolio to remain unchanged over the following two years, 12% of landlords (controlling 22% of the dwellings) expected to increase the number of dwellings they let (Figure 4.6 and Annex Tables 4.13a and 4.13b).
• The large majority (89%) of ‘other organisation’ landlords (who control 60% of the other organisation dwelling stock) and 62% of company landlords (who own 43% of the dwellings) indicated that the number of dwellings they let was likely to remain the same. Sixteen per cent of company landlords intended to reduce the number of dwellings they let while 22% intended to increase their portfolio (Figure 4.6 and Annex Tables 4.13a and 4.13b).

34 | Private Landlords Survey 2010
Chapter 5 Thelettingandmanagementofprivatelyrenteddwellings
5.1 Summary
• Eighty-three per cent of dwellings in the private rented sector were let on the open market, with a further 9% being let to employees and 9% to friends or relatives.
• Private individual landlords let 88% of their portfolio on the open market while 85% of those dwellings owned by company landlords were let in this way. Only 58% of dwellings owned by ‘other organisation’ landlords were let on the open market.
• Two-fifths (40%) of dwellings owned by ‘other organisation’ landlords were let to employees compared with just 15% and 2% of those owned by company and private individual landlords respectively.
• Nearly half (49%) of dwellings owned by private individual landlords had been let to the present tenants for less than two years. This compared with around a third of dwellings owned by other landlords (34% of company landlords and 30% of ‘other organisation’ landlords).
• In 19% of dwellings tenants were in receipt of Housing Benefit or Local Housing Allowance.
• In terms of formal letting and management practices, nearly all landlords and agents (97%) made use of a written tenancy agreement, with 91% requiring a deposit, and 84% each requiring tenants provide references and for inspections to take place during a tenancy.
• A variety of references were sought from tenants renting dwellings in the private rented sector: financial references in the case of 55% of dwellings, employment references 53%, previous landlords 45%, and personal references 44%.
5.2 Letting characteristics
Within the private rented sector (PRS), dwellings are let in a variety of ways reflecting the choices and circumstances of the landlord. The letting options also mirror some of the ways in which these dwellings have come into the sector. Private individual landlords sometimes provide accommodation rent-free to friends or relatives, while company and ‘other organisation’ landlords are more likely to provide accommodation to employees either rent-free or

Private Landlords Survey 2010 | 35
with a nominal charge. However the large majority of dwellings are let on the ‘open market’19. This section examines the differences between types of private landlords in the way they let dwellings.
Figure5.1:Lettingtypebylandlord
0%
Open-market
20% 40% 60% 80% 100%
All landlords
Longer-term landlords
New landlords
Other organisations
Companies
Private individuals
Friend or relative rent charged
Employee rent charged Employee rent free
Friend or relative rent free
Source: DCLG Private Landlords Survey 2010 Base: respondent is landlord or agent and able to answer how property is let (1,073 cases), dwelling weighted
• Overall the large majority (83%) of dwellings (which are owned by 84% of landlords) were let to tenants in the open market. Under a tenth (9%) of all dwellings were let to employees and a similar proportion to friends or relatives. Of these, under half were let rent free (Figure 5.1 and Annex Tables 5.1a and 5.1b).
• ‘Open market’ rental was the most likely letting type for all landlord types with 88% of dwellings owned by private individual landlords and 85% of those owned by company landlords being let in this way. However, just 58% of dwellings owned by ‘other organisation’ landlords were let on the open market (Figure 5.1 and Annex Table 5.1a).
• Private individual landlords were more likely to let to friends or relatives than other landlord types. More than a tenth (11%) of dwellings were let to friends or relatives, the greater proportion (7%) were let with a charge to family or relatives while 4% were rent free. Company and ‘other organisation’ landlords let negligible proportions of their dwellings to friends or relatives (Annex Table 5.1a).
• More than a tenth (13%) of dwellings owned by a company landlord and two-fifths (40%) by ‘other organisation’ landlords were let to employees. One-in-ten (10%) of all dwellings owned by company landlords, and one-fifth (20%) of those owned by ‘other organisation’ landlords, were let to employees rent free (Annex Table 5.1a).
19 The ‘open market’ is defined as dwellings that are not tied to employment or restricted to being let to friends or relatives of the landlord and are therefore available to all
36 | Private Landlords Survey 2010
• More than nine-tenths (92%) of dwellings owned by new landlords and four-fifths (80%) of dwellings owned by longer-term landlords were rented in the open market. One-tenth (10%) of dwellings owned by longer-term landlords were let to employees, equally divided between rent charged (5%) and rent free (5%). A similar proportion was let to friends or relatives with 7% rent charged and 3% rent free. (Figure 5.1 and Annex Table 5.1a).
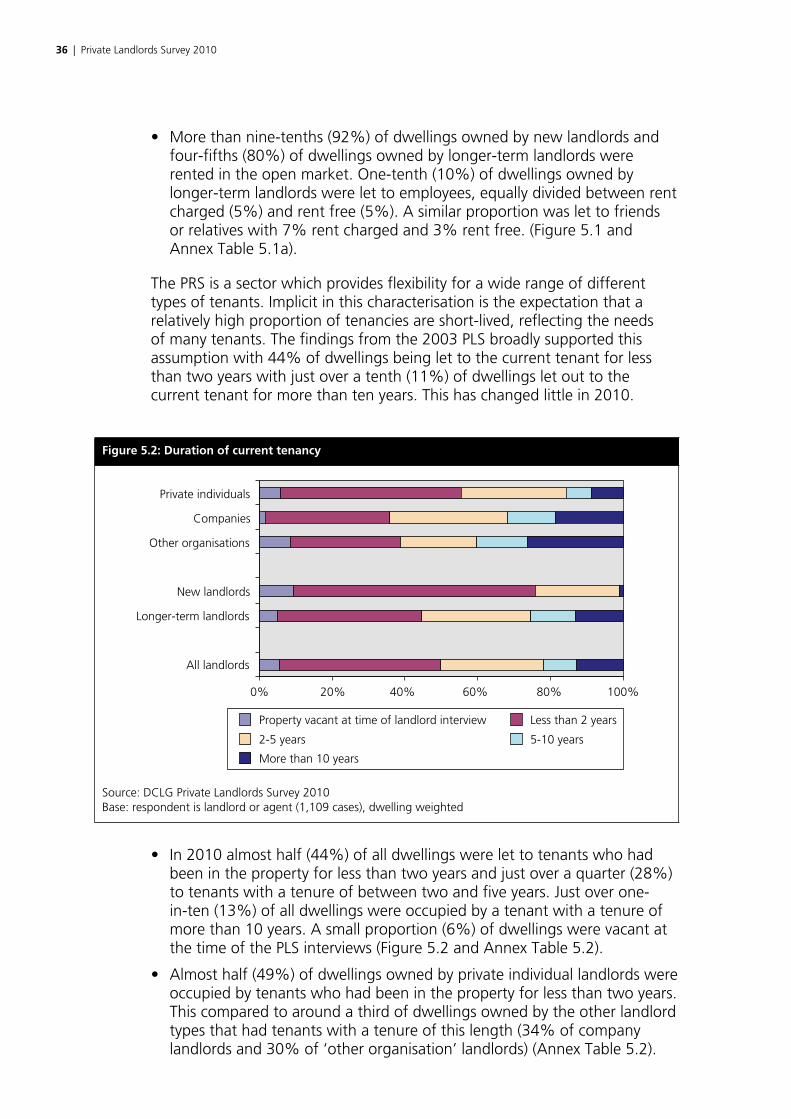
The PRS is a sector which provides flexibility for a wide range of different types of tenants. Implicit in this characterisation is the expectation that a relatively high proportion of tenancies are short-lived, reflecting the needs of many tenants. The findings from the 2003 PLS broadly supported this assumption with 44% of dwellings being let to the current tenant for less than two years with just over a tenth (11%) of dwellings let out to the current tenant for more than ten years. This has changed little in 2010.
Figure5.2:Durationofcurrenttenancy
0%
Property vacant at time of landlord interview
20% 40% 60% 80% 100%
All landlords
Longer-term landlords
New landlords
Other organisations
Companies
Private individuals
Less than 2 years
2-5 years 5-10 years
More than 10 years
Source: DCLG Private Landlords Survey 2010 Base: respondent is landlord or agent (1,109 cases), dwelling weighted
• In 2010 almost half (44%) of all dwellings were let to tenants who had been in the property for less than two years and just over a quarter (28%) to tenants with a tenure of between two and five years. Just over one-in-ten (13%) of all dwellings were occupied by a tenant with a tenure of more than 10 years. A small proportion (6%) of dwellings were vacant at the time of the PLS interviews (Figure 5.2 and Annex Table 5.2).
• Almost half (49%) of dwellings owned by private individual landlords were occupied by tenants who had been in the property for less than two years. This compared to around a third of dwellings owned by the other landlord types that had tenants with a tenure of this length (34% of company landlords and 30% of ‘other organisation’ landlords) (Annex Table 5.2).
Private Landlords Survey 2010 | 37
• Dwellings owned by private individual landlords were less likely than dwellings owned by other landlord types to have tenants in residence for more than 10 years. While just 9% of dwellings owned by private individuals accommodated these long-term tenants, almost a fifth (19%) of dwellings owned by company landlords and over a quarter (26%) by ‘other organisation’ landlords did so (Annex Table 5.2).
• New landlord dwellings, by definition, tended to have a larger proportion of tenants resident in the property for less than two years at the time of the survey than longer-term landlords. Two-thirds (67%) of dwellings owned by new landlords have current tenancies of less than two year compared with two-fifths (40%) of dwellings owned by longer-term landlords (Annex Table 5.2).
• Almost two-thirds of all dwellings were let unfurnished (59%), with more than a quarter (26%) fully-furnished and 15% partly-furnished (Annex Table 5.3).
• A larger proportion of dwellings owned by private individual landlords were rented fully- (28%) or partly-furnished (17%) than for other types of landlord, whereas the largest proportion of those rented unfurnished were owned by ‘other organisation’ landlords (73%) (Annex Table 5.3).
Annex Table 5.4 shows the proportion of dwellings within each of the types of landlord that contain particular types of tenant. These categories can be multi-coded. So, for example, a dwelling can contain both a young single and an older couple, and the older couple could contain at least one retired person. Similarly a dwelling may contain, for example, both white and blue collar workers.
• Overall, dwellings in the PRS were most likely to be let to young couples (37%), families with children (35%) and young singles (32%) (Annex Table 5.4).
• Looking at broad work groupings, overall 24% of tenants were white collar workers, clerical or professional workers, 21% were blue collar or manual workers, and 10% NHS or key workers (Annex Table 5.4).
• There are differences between the different landlord types in the people that dwellings are let to. However the degree of this may be masked by the multi-coding that can occur within a household and then exacerbated by the size of a landlord’s portfolio. Therefore differences between landlords shown in the tables should be treated with a degree of caution.
• About a fifth (19%) of all dwellings were let to tenants in receipt of Housing Benefit or Local Housing Allowance. Companies were slightly more likely (23%) than other landlord types to be letting to this group. New landlords (14%) were less likely to rent to this group than longer-term landlords (Annex Table 5.5).

38 | Private Landlords Survey 2010
5.3 Letting and management practices
Almost half of all landlords (43%), either due to convenience or for professional reasons, have hired agents to undertake the letting and management of their portfolios while other landlords prefer to undertake the letting and management themselves. The 2003 PLS suggested that agents were more likely to deploy a wider range of formal management practices when letting than landlords who let and managed the properties themselves. This section explores the extent of letting and management practices within the PRS.
• A third (33%) of landlords who use agents to let and manage their portfolio consider membership of a professional body to be a proxy for quality and consider this when choosing an agent. A third of landlords (33%) considered this to be a key factor and 29% regarded this as one of several factors to be taken into consideration. A tenth (10%) indicated this is something they were aware of but not a deciding factor, while one-fifth (20%) of the landlord population considered membership not to be important (Annex Table 5.6).
• Most landlords considered a fixed percentage of rent (53%) or a one-off introductory fee for new tenancies (39%) were their preferred options for paying for the property letting and management services provided by agents. (Annex Table 5.6).
• In terms of letting and management practices, almost all dwellings let on the ‘open market’ in the PRS made use of written tenancy agreements (97% of landlords or agents who own or control 98% of all dwellings) and this was followed by the requirement for deposits (91% of landlords or agents or 84% of all dwellings). Of the practices examined in this survey, the preparation of an inventory before the start of tenancy was the one used the least, though still undertaken by a significant 81% of landlords or 72% of all dwellings (Figure 5.3 and Annex Tables 5.7a and 5.7b).
• Over four-fifths (81%) of dwellings owned by private individual landlords and rented on the ‘open market’ required that tenants provide references compared with 71% of dwellings owned by company landlords and 65% by ‘other organisation’ landlords. Similarly, 90% of dwellings owned by private individuals and rented on the ‘open market’ required a deposit from their tenants compared to around two-thirds of dwellings owned by company (68%) and ‘other organisation’ (66%) landlords (Annex Table 5.7a).
• The management practice that had the least uptake among the different landlord types was the preparation of inventories. Even then private individual landlords renting on the ‘open market’ used this practice in over three-quarters of cases with 77% of dwellings they owned being rented out following the preparation of an inventory. This figure declined for properties owned by company landlords (63%) and was lowest for dwellings owned by ‘other organisation’ landlords (48%) (Annex Table 5.7a).

Private Landlords Survey 2010 | 39
Figure5.3:Lettingandmanagementpractices
0
Tenant provide references
20 40 60 80 100
All landlords
Longer-term landlords
New landlords
Other organisations
Companies
Private individuals
%
Deposit required Inspections during tenancy
Inventory prepared Written tenancy agreement
Source: DCLG Private Landlords Survey 2010 Base: respondent is landlord or agent and able to answer how property is let on the ‘open market’ (869 cases), dwelling weighted
• Nearly all dwellings rented on the ‘open market’ and owned by new landlords were let with a written tenancy agreement (99%) with lower proportions for the requirement of a deposit (89%), tenants’ references (80%) and the preparation of an inventory (77%). In comparison the respective figures for longer-term landlords were (97%, 80%, 75% and 67% respectively, all lower. Only in the case of inspection during tenancy did longer-term landlords make more use of the practice than did new landlords, 82% to 78% (Annex Table 5.7a).
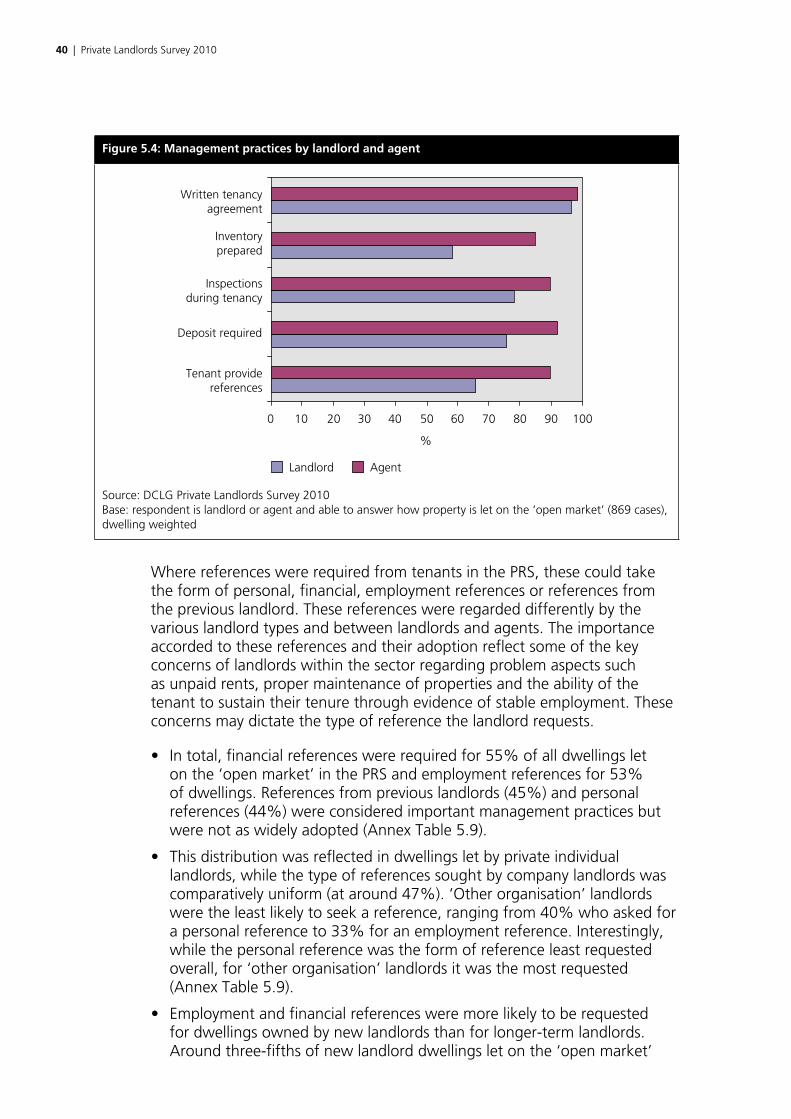
• It was found that agents were more likely to use one of the formal letting or management practices examined in the survey than landlords. Agents required a deposit in 92% of dwellings they let, with 90% of cases requiring both tenant’s references and inspections during tenancy, and 85% preparing an inventory. Landlords used these practices in 76%, 66%, 78% and 58% of cases respectively. Only when requiring a written tenancy agreement were the two close, 99% of agents employing this practice against 97% of landlords (Figure 5.4 and Annex Table 5.8).
40 | Private Landlords Survey 2010
Figure5.4:Managementpracticesbylandlordandagent
0
Landlord
10 20 30 40 50 60 70 90 10080
Tenant providereferences
Deposit required
Inspectionsduring tenancy
Inventoryprepared
Written tenancyagreement
%
Agent
Source: DCLG Private Landlords Survey 2010 Base: respondent is landlord or agent and able to answer how property is let on the ‘open market’ (869 cases), dwelling weighted
Where references were required from tenants in the PRS, these could take the form of personal, financial, employment references or references from the previous landlord. These references were regarded differently by the various landlord types and between landlords and agents. The importance accorded to these references and their adoption reflect some of the key concerns of landlords within the sector regarding problem aspects such as unpaid rents, proper maintenance of properties and the ability of the tenant to sustain their tenure through evidence of stable employment. These concerns may dictate the type of reference the landlord requests.
• In total, financial references were required for 55% of all dwellings let on the ‘open market’ in the PRS and employment references for 53% of dwellings. References from previous landlords (45%) and personal references (44%) were considered important management practices but were not as widely adopted (Annex Table 5.9).
• This distribution was reflected in dwellings let by private individual landlords, while the type of references sought by company landlords was comparatively uniform (at around 47%). ‘Other organisation’ landlords were the least likely to seek a reference, ranging from 40% who asked for a personal reference to 33% for an employment reference. Interestingly, while the personal reference was the form of reference least requested overall, for ‘other organisation’ landlords it was the most requested (Annex Table 5.9).
• Employment and financial references were more likely to be requested for dwellings owned by new landlords than for longer-term landlords. Around three-fifths of new landlord dwellings let on the ‘open market’

Private Landlords Survey 2010 | 41
requested these references compared to about half of the dwellings owned by longer-term landlords. At a lower level, new landlords were also more likely to request a reference from a previous landlord when letting a dwelling on the ‘open market’ (45%) compared with longer-term landlords (39%). However longer-term landlords were more likely to request a personal reference than new landlords, although the difference is not so great, 43% to 40% (Annex Table 5.9).
• Agent managed dwellings let on the ‘open market’ were, in general, twice as likely as landlord managed properties to obtain references from their tenants. Financial references (73%), employment references (71%) and references from a previous landlord (61%) were provided to agents letting dwellings on the ‘open market’. By comparison, the equivalent proportions for dwellings managed by landlords were 37%, 35%, and 28% respectively (Annex Table 5.9).
5.4 Deposits
As mentioned earlier, the requirement for deposits was the second most common management and letting practice after written tenancy agreements. Over nine-tenths (91%) of all landlords (controlling 84% of all dwellings) in the PRS required a deposit before letting. This section explores in some detail the extent of this practice within the private rented sector. Furthermore, it examines the level of awareness and usage of the deposit protection scheme which was introduced in April 2007 as a policy initiative to provide a fairer system for settling tenancy disputes.
• In more than two-fifths (43%) of all dwellings where a deposit was required, agents were responsible for holding the deposit compared with 24% of deposits held in tenancy deposit schemes, and 21% by landlords. Under one-tenth (8%) of deposits were held in deposit guarantee schemes. This was a change from 2006 where deposits held in a tenancy deposit scheme were pretty much non-existent (only two cases reported) (Annex Table 5.10).
• In over two-fifths of dwellings owned by company landlords (45%) and private individual landlords (44%) the agent was responsible for holding the deposit. This compared to over one-third (34%) of dwellings owned by ‘other organisation’ landlords where the agent held the deposit (Annex Table 5.10).
• In just over half (51%) of all dwellings where a deposit was required, the deposit amount was equal to four weeks/one calendar months rent, while for two-fifths (39%) of dwellings it was more than four weeks rents. Under a tenth (9%) of dwellings required deposits which amounted to less than one calendar months rent (Annex Table 5.11a).
• There was little variation in the extent of deposit required by landlord type. More than half (51%) of new landlords requested deposit amounts in excess of four weeks rent compared to a third (33%) of longer-term landlords (Annex Table 5.11a).

42 | Private Landlords Survey 2010
• Almost two-thirds (64%) of dwellings managed by landlords required a deposit amount equivalent to one calendar months rent when compared to agent managed dwellings (41%). Of the agent managed dwellings, more than half (52%) requested deposits equal to more than four weeks rent compared to just over one-fifth (23%) of landlord dwellings (Annex Table 5.11b).
• In dwellings where a deposit was required, it was uncommon (18%) to also require a guarantor (Annex Table 5.12).
• A large majority of all landlords/agents (84%) were aware of the authorised deposit scheme. Just over two-thirds (67%) of landlords made use of the scheme, with a further 17% were aware of the scheme but did not use it. Sixteen per cent of landlords were not aware of the scheme (Figure 5.5 and Annex Table 5.13a).
• Private individual landlords (70%) were more likely to use the scheme than company landlords (52%) and ‘other organisation’ landlords (41%).
Figure5.5:Awarenessofdepositprotectionschemebylandlordtype
0 10 20 30 40 50 60 70 80
All landlords
Longer-term landlords
New landlords
Other organisations
Companies
Private individuals
%
Yes - currently use one Yes - but don’t use one No - not aware of the scheme
Source: DCLG Private Landlords Survey 2010 Base: all landlords (1,032 cases), landlord weighted
• Over two-fifths (41%) of company landlords and over a third (37%) of ‘other organisation’ landlords were aware of the scheme but did not use one compared to just over a tenth (14%) of private individuals (Figure 5.5 and Annex Table 5.13a).
• Almost three-quarters (74%) of new landlords used the authorised deposit protection scheme while a further 12% were aware of the scheme but did not use it. However, though more than three-quarters (78%) of longer-term landlords are aware of the scheme, just under two-thirds

Private Landlords Survey 2010 | 43
(57%) longer-term landlords used it. More than one-fifth (22%) of longer-term landlords were not aware of the scheme (Figure 5.5 and Annex Table 5.13a).
• Almost all (99%) of agents were aware of the authorised deposit scheme and over nine-tenths (93%) used one. This compared with 67% of landlords with under two-fifths (39%) who used the scheme. A third (33%) of landlords were not aware of the scheme (Annex Table 5.13b).
• Where an authorised deposit scheme was in use, the custodial scheme was used by more than half (53%) of the landlords in the PRS, while one-third (34%) of landlords used an insurance based scheme. Just over a tenth (14%) used both schemes (Annex Table 5.14).
• In cases where the landlord/agent did not use a deposit protection scheme, over two-fifths (41%) did not charge a deposit (35%) or did not rent on an assured shorthold tenancy (6%). Over one-fifth (23%) had tenancies from before April 2007 when the scheme was introduced and almost one-third (30%) indicated they had ‘other’ reasons for not using the scheme (Annex Table 5.15).
• More than a third of private individual landlords (37%) and ‘other organisation’ landlords (36%) did not use the scheme as they did not charge deposits. Almost one-fifth (19%) of ‘other organisation’ landlords did not use the scheme for this reason (Annex Table 5.15).
• Almost two-thirds (60%) of company landlords, one-fifth (21%) of private individuals and more than a tenth (12%) of ‘other organisation’ landlords had tenancies prior to April 2007 so deposits were held elsewhere (Annex Table 5.15).

44 | Private Landlords Survey 2010
Chapter 6 Financialinformation
6.1 Summary
• Almost half (47%) of all landlords in the private rented sector were happy to rent to tenants receiving Housing Benefit (HB) or Local Housing Allowance (LHA).
• This consisted of 80% of company landlords, 55% of ‘other organisations’ and 44% of private individual landlords.
• The most cited reasons for not letting to HB or LHA recipients were disturbance or anti-social behaviour (19%), expected delays in payment (17%), unpaid rent and damage to property or furnishings (both 16%).
• Twenty-one per cent of those landlords who would not be happy to let to HB or LHA recipients would be encouraged to do so if the payments were not made directly to the tenants, and a further 12% if there was better processing of benefit claims by local authorities. However, more than half (55%), stated they could never be encouraged to let to these tenants.
• HB or LHA was believed by landlords to cover all of the rent in around 50% of cases. Where this wasn’t the case, it was believed that in 69% of cases tenants paid £25 or less a week to make up the difference.
• In terms of rent arrears, only 10% of landlords stated that they had tenants who had fallen into arrears in the previous 12 months. In almost half of these cases (46%), landlords stated they had lost money as a result.
6.2 Financial information
Chapter 5 reported that almost a fifth (19%) of all dwellings were let to tenants in receipt of Housing Benefit20 (HB) or Local Housing Allowance (LHA). This included 16% of dwellings owned by ‘other organisation’ landlords, 19% by private individual landlords and 23% by company landlords. This section examines some of the financial and social considerations landlords make with regards to letting dwellings to recipients of HB or LHA. It also explores landlords’ intentions regarding letting dwellings to recipients of HB or LHA.
20 Housing Benefit is a government “means tested” in-work benefit available to low income tenants to assist them in paying their rent. Since April 2008 the Local Housing Allowance has replaced Housing Benefit for some private tenants.

Private Landlords Survey 2010 | 45
Figure6.1:WhetherlandlordishappytolettopeopleonHB/LHA
0% 20% 40% 60% 80% 100%
Happy to let to HB/LHANot happy to let to HB/LHA
All landlords
Longer-term landlords
New landlords
Other organisations
Companies
Private individuals
Source: DCLG Private Landlords Survey 2010 Base: respondent is landlord or agent and able to answer how property is let (869 cases), dwelling weighted
• Almost half (47%) of all landlords (responsible for 54% of dwellings in the PRS) stated they were happy to let to persons on HB or LHA (Figure 6.1 and Annex Tables 6.1a and 6.1b).
• As many as 80% of company landlords, 55% of ‘other organisation’ landlords and 44% of private individual landlords stated they were happy to let to tenants on HB/LHA (Figure 6.1 and Annex Table 6.1a).
• There was little difference in the proportions of new landlords and longer-term landlords who were happy to let to HB/LHA tenants; 44% and 48% respectively (Figure 6.1 and Annex Table 6.1).
For those landlords within the PRS who were not happy to let to tenants in receipt of HB/LHA, the most common reasons included those that had a direct impact on income revenue such as delays in payment, unpaid rent or HB not covering the rent. Other reasons were those that had a longer-term impact on the value of the dwelling as an asset, such as disturbance or anti-social behaviour, or damage to the property, or were related to the landlords’ experiences of letting, for example bad experiences from the past or a lack of knowledge of how benefits are administered.
• Landlords were asked to list all reasons why they would not be happy to let to tenants in receipt of HB/LHA. Almost a fifth (19%) of all landlords cited disturbance or anti-social behaviour as a reason for not letting to recipients of HB/LHA. Other reasons most frequently cited include expected delays in payment (17%), unpaid rent and damage to property or furnishings (both 16%) (Figure 6.2 and Annex Table 6.2).
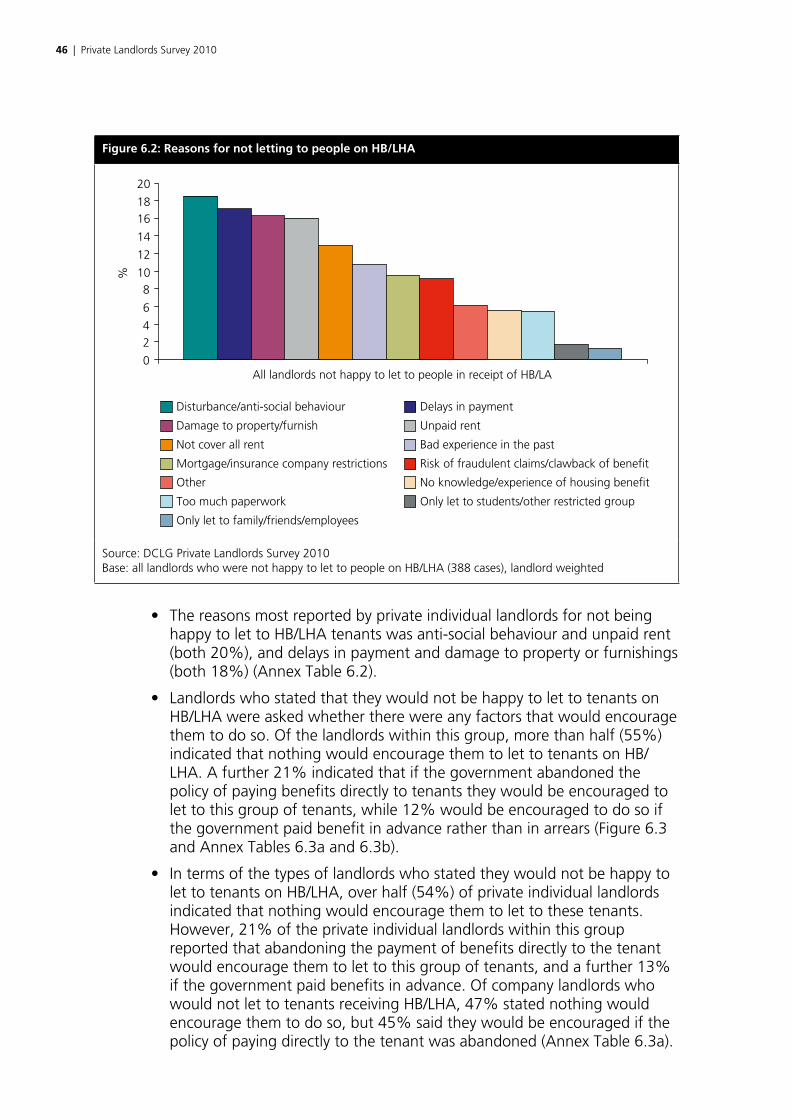
46 | Private Landlords Survey 2010
Figure6.2:ReasonsfornotlettingtopeopleonHB/LHA
0
24
6
810
12
14
1618
20
All landlords not happy to let to people in receipt of HB/LA
%
Disturbance/anti-social behaviour Delays in payment
Damage to property/furnish Unpaid rent
Not cover all rent Bad experience in the past
Mortgage/insurance company restrictions Risk of fraudulent claims/clawback of benefit
Other No knowledge/experience of housing benefit
Too much paperwork Only let to students/other restricted group
Only let to family/friends/employees
Source: DCLG Private Landlords Survey 2010 Base: all landlords who were not happy to let to people on HB/LHA (388 cases), landlord weighted
• The reasons most reported by private individual landlords for not being happy to let to HB/LHA tenants was anti-social behaviour and unpaid rent (both 20%), and delays in payment and damage to property or furnishings (both 18%) (Annex Table 6.2).
• Landlords who stated that they would not be happy to let to tenants on HB/LHA were asked whether there were any factors that would encourage them to do so. Of the landlords within this group, more than half (55%) indicated that nothing would encourage them to let to tenants on HB/LHA. A further 21% indicated that if the government abandoned the policy of paying benefits directly to tenants they would be encouraged to let to this group of tenants, while 12% would be encouraged to do so if the government paid benefit in advance rather than in arrears (Figure 6.3 and Annex Tables 6.3a and 6.3b).
• In terms of the types of landlords who stated they would not be happy to let to tenants on HB/LHA, over half (54%) of private individual landlords indicated that nothing would encourage them to let to these tenants. However, 21% of the private individual landlords within this group reported that abandoning the payment of benefits directly to the tenant would encourage them to let to this group of tenants, and a further 13% if the government paid benefits in advance. Of company landlords who would not let to tenants receiving HB/LHA, 47% stated nothing would encourage them to do so, but 45% said they would be encouraged if the policy of paying directly to the tenant was abandoned (Annex Table 6.3a).

Private Landlords Survey 2010 | 47
Figure6.3:FactorsthatwouldencouragelettingtoHB/LHAtenant
0
10
20
30
40
50
60
All landlords not happy to let to people in receipt of HB/LHA
%
Nothing would encourage me to take HB/LHA tenantsAbandoning policy of paying benefit directly to tenantGovernment paying benefit in advanceIf rent payment falls into one month’s arrears, HB/LHA paid directly to landlordsAbility to claw back unpaid rent in instalments from tenants' benefitsBetter processing of benefit claims by local authoritiesEasier referencing and credit checking of HB/LHA
Source: DCLG Private Landlords Survey 2010 Base: all landlords who were not happy to let to people on HB/LHA (373 cases), landlord weighted
• In over half (51%) of cases where dwellings were let to tenants in receipt of HB/LHA, the benefit was paid directly to the landlord or agent (Annex Table 6.4).
• Similarly in half of dwellings where the tenants were in receipt of HB/LHA, the landlord or agent believed the HB/LHA covered all the rent. Private individual landlords believed the benefit fully covered the rent in 53% of cases compared to just 42% of cases for company landlords (Annex Table 6.5).
• In dwellings where the landlord believed that the HB/LHA did not fully cover all the rent, it was believed that over two-thirds (69%) of tenants paid £25 or less a week to make up the difference, 25% paid between £25 and £50 a week, and 6% more than £50 per week (Annex Table 6.6)21.
• Landlords were asked whether the tenants of any of their properties had fallen into arrears with rent payments during the previous 12 months. It was reported that only 10% of tenants had done so. This was fairly even across different types of landlords. In almost half (46%) of all dwellings where tenants had fallen into arrears with rent payments during the previous 12 months the landlord stated they had lost money (Annex Tables 6.7 and 6.8).
21 Only 58 respondents replied giving information on how much they paid to make up the difference between HB/LHA. This analysis should therefore be treated with an element of caution because of the small sample size.
48 | Private Landlords Survey 2010
Chapter 7 Landlordandagentissuesandinformationneeds
7.1 Summary
• When presented with a list of potential problems in the PRS, 18% of landlords or agents considered issues relating to Housing Benefit or Local Housing Allowance administration to be a serious problem with a further 10% considering the level of these benefits in the area as also a serious problem.
• Other serious problems identified by landlords and agents were tenant debt or arrears (13% of landlords or agents), finding good tenants and damage caused by tenants (both 10%).
• The converse was that landlords and agents did not consider the overall low rental demand a problem in 82% of cases, nor mortgage payments (76%) and finding reliable builders (73%).
• A third (33%) of landlords and agents who had heard of the Housing Health and Safety Rating System reported that 58% of the dwellings they were collectively responsible for had received some form of assessment for potential hazards. Ten per cent of dwellings assessed had been assessed by a local Environmental Health Officer.
• Nearly two-fifths of landlords and agents (38%) wanted more information on tenancy law with 34% of respondents wanting information on electricity regulations.
7.2 Key issues for landlords and agents
Private renting raises a range of issues and challenges for landlords and agents within the private rented sector (PRS). These issues could be legal or regulatory, financial, or linked directly to the letting and management of private dwellings. The PLS 2010 provides an insight into these issues and to what extent they are perceived as problems by landlords and agents.
Landlords and agents were asked to state whether each of the issues presented to them on a show card were perceived as “a serious problem”, “a small problem” or “not a problem at all”.
• Housing Benefit (HB) or Local Housing Allowance (LHA) administration was seen by far as the most frequently cited serious problem by landlords and agents in almost a fifth (18%) of cases. In addition 10% of all respondents

Private Landlords Survey 2010 | 49
stated that the level of HB or LHA in the area was a serious problem. This is despite the fact that only 19% of dwellings in the PLS were let to HB or LHA recipients. Of the remaining problems listed, those perceived to be serious the most were tenant debt or arrears (13%), finding good tenants and damage caused by tenants (both 10%) (Figure 7.1 and Annex Table 7.1).
Figure7.1:Issuesconsideredaseriousproblem
0 5 10 15 20 25 30
Low rental demand in area
Reliable builders/tradesmen
Finding agent
Mortgage/loan repayments cost
Deposit disputes
Tenants anti-social behaviour
Repairs cost
Damage by tenants
Housing benefit /LHA levels in area
Finding good tenants
Size of agents’ fees
Tenants’ debts/arrears
Housing benefit/LHA admin in area
% of respondents
Landlord Agent All
Source: DCLG Private Landlords Survey 2010 Base: all landlords/agents who provided a response (1,033 cases), landlord weighted
• When comparing issues between landlords and agents, agents were much more likely to consider HB or LHA administration (28%) and HB or LHA levels in the area (14%) to be serious problems than landlords (both just 6%). Landlords found finding good tenants a more serious problem (16%) than agents (just 5%) (Annex Table 7.1).
• Perhaps surprisingly, only a tenth (10%) of landlords and 9% of agents considered the cost of repairs to be a serious problem and finding reliable builders or tradesmen (4% and 2% respectively) (Figure 7.1 and Annex Table 7.1).
• For landlords alone, the size of agents’ fees was seen as a significant issue with 12% of landlords perceiving this as a serious problem (Figure 7.1 and Annex Table 7.1).
• There has been a considerable change in the proportion of some of the issues seen as serious problems between the 2003 and 2010 surveys. In the 2003 PLS, HB administration was also cited most as a serious problem, however at a higher level. Overall 30% of landlords and agents perceived this as a serious problem: 25% of landlords and 39% of agents. The problem seen as the next most serious was finding reliable builders (overall

50 | Private Landlords Survey 2010
17%, 18% of agents and 16% of landlords). This has now dwindled to just 3% overall, 2% of agents and 4% of landlords in 2010.
• When asked for issues that were “not perceived as a problem”, overall low rental demand was the issue least considered a problem with over four-fifths (82%) of all respondents indicating this was not a concern. The other issues that were not perceived as a problem most included mortgage repayments (76%), and finding reliable builders (73%). Interestingly, 71% of respondents stated HB or LHA levels in the area not to be a problem. Unlike the other issues listed, views on HB or LHA were quite polarised, i.e. either perceived as ‘a serious problem’ or ‘not a serious problem’, rarely ‘a small problem’ (Figure 7.2 and Annex Table 7.1).
Figure7.2:Issuesconsiderednotaproblem
0 10 20 30 40 50 60 70 80 90 100
Damage by tenants
Tenants debts/arrears
Repairs cost
Finding good tenants
Housing benefit/LHA admin in area
Tenants anti-social behaviour
Deposit disputes
Size of agents’ fees
Housing benefit/LHA levels in area
Reliable builders/tradesmen
Mortgage/loan repayments cost
Finding agent
Low rental demand in area
% of respondents
Landlord Agent All
Source: DCLG Private Landlords Survey 2010 Base: all landlords/agents who provided a response (1,033 cases), landlord weighted
• Landlords were more likely to perceive deposit disputes (86%), mortgage/loan repayments and HB/LHA levels (both 83%) not to be a problem, while agents viewed low rental demand in the area (83%), reliable builders or tradesmen (72%) and mortgage or loan repayments cost (68%) as not a problem. For landlords alone, finding an agent was not seen as an issue with almost four-fifths (79%) of respondent landlords not perceiving this as a problem (Annex Table 7.1).

Private Landlords Survey 2010 | 51
7.3 The Housing Health and Safety Rating System (HHSRS)
The Housing Health and Safety Rating System (HHSRS) is a risk based assessment tool for determining the presence of any potential hazards to health and safety posed by a dwelling. The HHSRS came into effect in 2006, replacing the Fitness Standard as the means by which local authorities make their assessment and determine any action required for a dwelling. Guidance for landlords and property managers was issued in 2006 by DCLG to explain the HHSRS, how it is used by local authorities and what they themselves can do to identify problems in their own lettings in respect of potential hazards22. Only Local Authorities, through their Environmental Health Officers (EHOs), can conduct a formal HHSRS assessment. However landlords and agents are also strongly encouraged to carry out or organise their own checks to ensure that lettings, in their views, are meeting health and safety requirements. The PLS seeks to examine the level of awareness of the HHSRS within the PRS and the extent to which health and safety assessments, by local authorities or others, are being made to identify any potential hazards as defined under the HHSRS.
• A third (33%) of all landlords and agents had heard of the HHSRS. Half of the agents managing dwellings within the PRS had heard of the HHSRS, although this applied to only 15% of landlords (Annex Table 7.2a).
• Of all the dwellings owned by landlords or agents who had heard of the HHSRS, 58% were reported to have been assessed by someone for potential hazards: 54% of dwellings managed by agents and 64% of those by landlords (Annex Table 7.2b).23
• Across all dwellings where some form of assessment had been carried out, almost half (48%) of these assessments were a carried out by agents and over a quarter (28%) by the landlord themselves. One-tenth (10%) of the assessments were carried out by the local EHO (Annex Table 7.2c).
• Agents were more likely than landlords to have carried out the assessment themselves. Over three-quarters (76%) of agents conducted an assessment on the properties they managed compared with 57% of landlords. Landlords were more likely to indicate that the assessment was carried out by the EHO (13%) or a maintenance expert (11%) (Annex Table 7.2c).
• Dwellings owned by ‘other organisation’ landlords were more likely than dwellings owned by the remaining landlord types to have had some form of assessment for potential hazards. Almost three-quarters (72%) of dwellings where the ‘other organisation’ landlord had heard of the HHSRS had been assessed compared to around two-thirds (67%) of those run
22 Housing Health and Safety Rating System – Guidance for Landlords and Property Related Professional – http://www.communities.gov.uk/publications/housing/housinghealth
23 Note that landlords and agents who were not aware of the HHSRS may nevertheless have undertaken some form of assessment of the condition and safety of the properties they let. However this section considers only assessments carried out in those dwellings whose owners or managers had heard of the HHSRS.

52 | Private Landlords Survey 2010
by company landlords and over half (53%) of dwellings run by private individual landlords (Annex Table 7.3).
7.4 Information and support for the Private Rented Sector
Due to the dynamic nature of the PRS, with a majority of landlords engaged in the part-time letting of small portfolios with little or no relevant qualifications, there is always a demand for more information on regulations and property management issues which guide participation within the sector.
Landlords and agents who belong to professional associations or groups have access to information relating to developments in property management and regulations. However, there is also an expectation that government should provide more support and information to improve the quality and accessibility of private rented dwellings.
There are therefore differences in the information requirements of landlords and agents and between the various landlord types. This section highlights some of these variations.
• The information most sought after by all landlords and agents was tenancy law with almost two-fifths (38%) of all respondents asking for more information in this area. This was followed by electrical regulations (34% of respondents), fire alarms/safety (29%) and property management (28%). The patterns between the information required by landlords and that by agents for these areas were not too dissimilar and close to that overall. However for some of the other aspects there were considerable differences. For example 29% of landlords required information on gas regulations compared with 16% of agents, and 27% of landlords would like more information on fire regulations compared with 16% of agents (Annex Table 7.4).
• While the highest proportion of private individual landlord respondents sought more information and support on tenancy law (39%), 39% of company landlords and 33% of ‘other organisation’ landlords indicated that the government needed to provide more information on electrical regulations (Annex Table 7.5)
• Not surprisingly, new landlords generally displayed more interest than longer-term landlords for the provision of more information. Almost a third (31%) of new landlords sought additional information on gas regulations, a quarter (25%) on fire regulations and 38% on electrical regulations compared with 20%, 20% and 32%, respectively, of longer-term landlords. Thirty-eight per cent of both new and longer-term landlords wanted more information on tenancy law (Annex Table 7.5).

Private Landlords Survey 2010 | 53
• A third (33%) of all respondents indicated that the support and information they sought was not on the list of options provided in the survey. These respondents selected the “none of these” category in the questionnaire. However this category may also include respondents who required no further information. The percentage of landlords selecting this category varied over the different landlord types with 31% of private individual landlords, 44% of company landlords, and 46% of ‘other individual’ landlords indicating “none of these”.

54 | Private Landlords Survey 2010
Appendix 1 Glossaryofterms
Decent homes
A Decent Home is one that meets all of the following four criteria:
a) meets the statutory minimum standard for housing. From April 2006 the Fitness Standard was replaced by the Housing Health and Safety Rating System (HHSRS).
b) it is in a reasonable state of repair (assessed from the age and condition of a range of building components including walls, roofs, windows, doors, chimneys, electrics and heating systems).
c) it has reasonably modern facilities and services (assessed according to the age, size and layout/location of the kitchen, bathroom and WC and any common areas for blocks of flats, and to noise insulation).
d) it provides a reasonable degree of thermal comfort (adequate heating and effective thermal insulation).
The detailed definition for each of these criteria is included in A Decent Home: Definition and guidance for implementation, Communities and Local Government, June 2006: http://www.communities.gov.uk/publications/housing/decenthome
Dwelling
A dwelling is a self-contained unit of accommodation (normally a house or flat) where all the rooms and amenities (i.e. kitchen, bath/shower room and WC) are for the exclusive use of the household(s) occupying them. In rare cases, amenities may be located outside the front door but provided they are for the exclusive use of the occupants, the accommodation is still classed as a dwelling.
For the most part a dwelling will be occupied by one household. However, it may contain none (vacant dwelling) or may contain more than one (House in Multiple occupation or HMO).
Energy Performance Certificate
The Energy Performance Certificate (EPC) provides a range of indicators based on current performance, whether the property would benefit in terms of improved performance from a range of low cost and higher cost measures, and the likely performance arising from the application of those measures. The EPC assessment is based on a simplified form of the energy efficiency Standard Assessment Procedure (SAP) known as Reduced Data SAP (RDSAP).

Private Landlords Survey 2010 | 55
Energy efficiency rating
The measure of energy efficiency used is the energy cost rating as determined by the Government’s Standard Assessment Procedure (SAP), used to monitor the energy efficiency of dwellings. This is based on a dwelling’s energy costs per m2 of floor area for standard occupancy of a dwelling and a standard heating regime. The energy costs take into account the costs of space and water heating, ventilation and lighting, less cost savings from energy generation technologies. They do not take into account variation in geographical location. The rating is expressed on a scale of 1–100 where a dwelling with a rating of 1 has poor energy efficiency (high costs) and a dwelling with a rating of 100 represents zero net energy cost per year.
Household
A household is defined as one person living alone or a group of people, who may or may not be related, living in the same dwelling who share at least one living or sitting room and/or have a regular arrangement to share at least one meal a day. Shared houses where the occupants have a joint tenancy or where they came together as a group to rent the house and would themselves fill any vacancies rather than expecting the landlord to do this are also classed as a single household; even though they may not share a sitting room or a meal per day.
Housing Health and Safety Rating System (HHSRS)
The Housing Health and Safety Rating System (HHSRS) is a risk assessment tool used to assess potential risks to the health and safety of occupants, visitors, neighbours and passers-by in residential properties in England and Wales. It replaced the Fitness Standard as the statutory means of assessing housing conditions in April 2006.
The purpose of the HHSRS assessment is not to set a standard but to generate objective information in order to determine and inform enforcement decisions. There are 29 categories of hazard, each of which is separately rated, based on the risk to the potential occupant who is most vulnerable to that hazard. For example, for falls on stairs and falls on the level, the most vulnerable group is persons over 60 years, and for falls between levels it is children under five year old. Scores for individual hazards are based on the likelihood of an occurrence (accident etc.) that causes harm and its likely health outcome. Scores of 1000 or more are considered to pose Category 1 hazards. Local authorities have a duty to act where Category 1 hazards are present and may take into account the vulnerability of the actual occupant in determining the best course of action. A dwelling posing a Category 1 hazard is considered to fail the Decent Home criterion that it must meet the statutory minimum standard and is therefore non-decent.
‘Openmarket’ rent – the best rent a property would command within a market environment where no subsidies apply.
SAP
See Energy efficiency rating

56 | Private Landlords Survey 2010
Types of landlords
• Privateindividuallandlords – are landlords who have indicated they are either an individual or a couple.
• Companies – are landlords who indicate they are a company
• Otherorganisations – are landlords who have responded they are either a group of individuals or some other organisation.
• Newlandlords24 – are landlords who have been letting private dwellings for three years or less.
• Longer-termlandlords – are any landlords who have been letting private dwellings for more than three years.
• Full-timelandlords – are respondents who consider the letting of dwellings to be their main business or occupation.
• Part-timelandlords – are respondents who do not consider the letting of dwellings to be their main business or occupation.
24 Please note that for PLS 2010 the definition of new landlords has been extended from two years to three years due to small case numbers.

Private Landlords Survey 2010 | 57
Appendix 2 PrivateLandlordsSurveyweightingprocessThe Private Landlords Survey (PLS) seeks to collect and summarise information about the ownership, occupation, management and condition of privately rented dwellings in England. As there is no available list of names and addresses of private landlords from which to conduct a survey, a sampling frame had to be created for the PLS. This sample frame was created through identifying landlords from the sample of dwellings used for the 2008-09 English Housing Survey (EHS) and the 2007-08 English House Condition Survey (EHCS). Therefore, PLS weighting needed to take account of both the EHS/EHCS and the PLS selection and their response probabilities.
As with previous years, the 2010 survey was based on information collated on the DCLG’s main housing survey. Respondents taking part in the 2007-08 English House Condition Survey (EHCS) and the 2008-09 English Housing Survey (EHS) who were recorded as private renters were asked to provide details of their landlord. These details formed the main sample for the 2010 PLS. The 2010 PLS thus consisted of 1,051 face-to-face and telephone interviews with landlords and agents who own and/or manage 1,109 dwellings included in the original EHCS or EHS survey.
During the EHS and EHCS interviews, tenants were asked to provide contact details of the landlords and agents of the dwelling. These details were used to create the frame for selecting landlords. As not all tenants provided relevant landlord details, a weight was created to adjust for non-response of the tenant to provide landlord contact details. The weight was constructed using a logistic regression model to predict the probability of each dwelling on the EHS and EHCS providing landlord or agent contact details. In particular, London showed lower response than other regions.
Bias in the PLS could be introduced at two stages:
• Stage 1: When tenants with certain characteristics are more likely to provide landlord contact details than others.
• Stage 2: When landlords/agents with certain characteristics are more likely to take part in the survey.
As the base for the PLS is landlords, and selecting landlords from a list of tenants leads to a sampling scheme akin to selection proportionate to size of portfolio, this needed to be corrected to enable an unbiased landlord level estimation procedure. Weight sharing was used to adjust for differential probabilities of selection for landlords with larger and smaller portfolios.
A survey weighted logistic regression was conducted to model the likelihood of each dwelling on the EHCS/EHS private renters sample file providing landlord/agent contact details. The following variables were considered as predictors in this analysis:

58 | Private Landlords Survey 2010
1) Region
2) Ethnicity of the household reference person
3) Property type
4) Satisfaction with the service provided by the landlord
5) If dwelling was furnished or unfurnished
6) Employment status of household reference person
7) Age of household reference person
8) If the household reference person was in receipt of housing benefits at the time of the interview
9) De facto marital status.
The following variables were identified as being significant in predicting the probability of each dwelling providing landlord/agent contact details:
1) Region
2) Satisfaction with the service provided by the landlord
3) Age of household reference person
4) Housing benefits of household reference person at time of the interview
5) De facto marital status
Two weights were developed. The first was applied to weight the PLS sample of 1,051 landlords to the estimated number of landlords in England (1,464,078 landlords). The second weight aimed to weight the sample of 1,109 dwellings from the PLS to dwelling totals within the PRS. This has been calculated as 3,001,000 dwellings. Throughout the report we have made it clear which weight has been applied to the data.


ISBN 978-1-4098-3188-4 9 7 8 1 4 0 9 8 3 1 8 8 4
ISBN 978-1-4098-3188-4